
Statistics & Data Visualizations
June 6, 2025
The staff of the Securities and Exchange Commission makes publicly available various statistics, updated on a regular basis. The statistics currently available provide information on capital formation, market participants, market activity, and investors. Each statistics set linked below provides access to the following:
- Data Visualizations: interactive graphics based on statistics
- Statistics Table: fundamental statistics updated with the most recently available data
- Statistics Guide: description, calculation method, and data source for each metric
- Statistics Download: all available statistics in the table and data visualizations
- Related Materials: research and reports, regulatory background, investor bulletin, or additional resources
Contact: stats@sec.gov
Discover SEC Statistics and Data Visualizations (1-minute Introduction Video)
Recent Data Visualizations
For all interactive data visualizations, visit Data Visualization Gallery
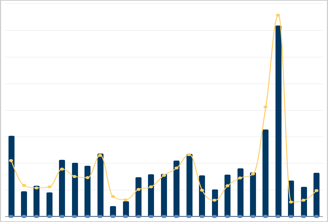
Number and Proceeds
(2000 - 2025 and 2000:Q1 - 2026:Q1)

Total Amount Raised by Issuer Type
(2025 and 2026:Q1)
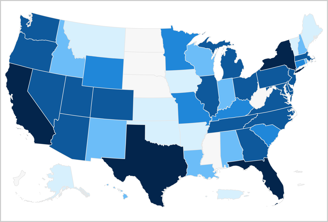
Number of Offerings by Issuer Location
(May 16, 2016-Dec. 31, 2025)

by Filer Status and Reporting Status
(2025 and 2025:Q2-2026:Q1)


Median and Mean
(1989 - 2022)
Browse the Statistics
Capital Formation
| Name | Update Frequency | Last Updated |
| Initial Public Offerings (IPOs) | Quarterly | Jun. 30, 2026 |
| Follow-on Registered Offerings (FROs) | Quarterly | Jun. 30, 2026 |
| Corporate Bond Offerings | Quarterly | Jun. 30, 2026 |
| Asset-Backed Securities (ABS) Issuances | Quarterly | Jun. 30, 2026 |
| Commercial Mortgage-Backed Securities (CMBS) Issuances | Quarterly | Jun. 30, 2026 |
| Regulation A Offerings | Semi-annual | Mar. 17, 2026 |
| Regulation Crowdfunding Offerings | Semi-annual | Mar. 17, 2026 |
| Regulation D Offerings | Quarterly | Jun. 30, 2026 |
Market Participants
| Name | Update Frequency | Last Updated |
| Reporting Issuers | Quarterly | Jun. 30, 2026 |
| Municipal Advisors | Quarterly | Jun. 30, 2026 |
| Transfer Agents | Quarterly | Jun. 30, 2026 |
| Security-Based Swap Dealers | Quarterly | Jun. 30, 2026 |
| Credit Rating Agencies (NRSROs) | Annual | Jun. 30, 2026 |
| Registered Investment Companies | Annual | May 2026 |
| Money Market Funds | Monthly | Jun. 2026 |
| Investment Advisers | Annual | Aug. 2025 |
| Registered Funds | Quarterly | May 2026 |
| Private Funds | Quarterly | Apr. 2026 |
Market Activity
| Name | Update Frequency | Last Updated |
| Market Activity Overview | Quarterly | Dec. 31, 2025 |
| Metrics by Exchange | Quarterly | Dec. 31, 2025 |
| Corporate Stocks | Quarterly | Dec. 31, 2025 |
| Exchange Traded Products | Quarterly | Dec. 31, 2025 |
| Quote Life Data Series - Conditional Frequency | Quarterly | Dec. 31, 2025 |
| Quote Life Data Series - Hazard and Survivor | Quarterly | Dec. 31, 2025 |
Investors
| Name | Update Frequency | Last Updated |
| Qualifying Households under Accredited Investor Financial Criteria | Triennial | Aug. 12, 2025 |
| U.S. Households’ Participation in Capital Markets | Triennial | Aug. 12, 2025 |
The statistics are produced by the staff of the U.S. Securities and Exchange Commission and the Commission expresses no view regarding the statistics. The statistics are produced from filings on EDGAR, Inline XBRL, or commercial data sets provided by third parties. Staff cannot guarantee the accuracy of information provided in EDGAR filings or Inline XBRL, or the accuracy of third-party data. The statistics may change based on updated or revised data and methodology. The statistics are intended to assist the public in analyzing data contained in EDGAR filings; however, they are not a substitute for such filings. Investors should review the relevant filings before making any investment decision.
Citation
URL: https://www.sec.gov/data-research/statistics-data-visualizations
Author: U.S. Securities and Exchange Commission Staff
Name: SEC Statistics & Data Visualizations
Publication Date: Jun. 30, 2026
Last Reviewed or Updated: June 30, 2026