
Statistics & Data Visualizations
Asset-Backed Securities (ABS) Issuances
March 16, 2026
Asset-backed securities (ABS) are securities that are primarily serviced by the cash flow of financial assets such as residential and commercial mortgage loans, auto leases, or credit card receivables. Regulation AB (§§ 229.1100 through 229.1125) sets out the registration, disclosure, and reporting requirements for publicly registered ABS under the Securities Act of 1933 and the Securities Exchange Act of 1934. The ABS issuance statistics presented here provide aggregate information about the volume of all registered ABS offerings, as well as Rule 144A, and traditional private placements offered under U.S. securities laws and sold in the United States. ABS issuers include both the issuers of ABS deals and CMBS deals. ABS issuance statistics are based on ABS deals only.
Data Visualizations
Click on the link below each image to access interactive features of the graph.
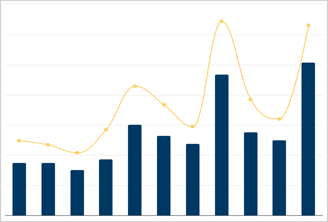
Number and Volume of ABS Issuances
(2000 - 2025 and 2000:Q1 - 2026:Q1)

ABS Deal Volume by Offering Type
(2000 - 2025 and 2000:Q1 - 2026:Q1)

ABS Median Deal Size by Deal Type
(2000 - 2025)

Number and Volume of Non-Agency RMBS Deals Registered and 144A (2000 - 2025)

ABS Number and Deal Volume by Offering Type and Asset Class (2026:Q1)

ABS Deal Volume by Offering Type and Asset Class
(2000:Q1 - 2026:Q1)
Statistics
Below are the most recent quarterly statistics for 2026:Q1 and 2025, and annual statistics for 2025. ABS issuance statistics are updated quarterly. For all available ABS issuance statistics from 2000:Q1 to 2026:Q1, view Statistics Download.
Metric | 2025 | 2025:Q1 | 2025:Q2 | 2025:Q3 | 2025:Q4 | 2026:Q1 |
| Number of ABS Issuances | 2,325 | 580 | 511 | 650 | 584 | 552 |
| Number of ABS Issuances by Offering Type* | - | - | - | - | - | - |
| 144A | 2,182 | 545 | 475 | 608 | 554 | 518 |
| Private | 26 | 4 | 9 | 7 | 6 | 9 |
| Registered | 117 | 31 | 27 | 35 | 24 | 25 |
| Total ABS Deal Volume (US $Billions) | 1,082.5 | 280.4 | 229.6 | 305.2 | 267.3 | 277.3 |
| ABS Deal Volume by Offering Type* (US$ Billions) | - | - | - | - | - | - |
| 144A | 942.8 | 242.9 | 194.7 | 266.4 | 238.8 | 242.9 |
| Private | 12.7 | 1.7 | 4.6 | 4.8 | 1.7 | 3.9 |
| Registered | 127.1 | 35.8 | 30.4 | 34.0 | 26.8 | 30.5 |
* Certain ABS, such as CLOs and CDOs, are not eligible for registration pursuant to Regulation AB and therefore are primarily offered and sold pursuant to Rule 144A or in traditional private placements.
Statistics Guide
The Guide below provides a description of each metric, calculation method, and data source. To download ABS Issuance Statistics Guide: ABS Issuance Statistics Guide
Description
The number of ABS issuances is the number of ABS deals in each time period.
Calculation Method
The estimate is produced by counting the issuances of ABS in each time period. The estimates include non-agency residential mortgage-backed securities (RMBS), collateralized loan obligations (CLO), collateralized debt obligations (CDO), and other ABS that are 1) collateralized by assets of some kind; 2) have a trustee; and 3) have at least one tranche rated by a nationally recognized statistical rating organization (NRSRO). The estimates exclude deals that are "Outside U.S." The time of offering is based on the pricing date, which is the date on which pricing terms are struck for all or most of the securities that pay principal and interest.
Data Source
AB Alert by Green Street Advisors
Description
The number of ABS issuances by offering type is the number of ABS deals by offering type in each time period.
Calculation Method
The estimate is produced by counting the issuances of ABS by offering type in each time period. The offering types are asset-backed securities that are exempt from registration pursuant to Rule 144A of the Securities Act of 1933 (144A), asset-backed securities registered with the U.S. Securities and Exchange Commission (Registered), and asset-backed securities that are exempt from registration pursuant to Section 4(a)(2) of the Securities Act of 1933 (Private). The estimates include non-agency residential mortgage-backed securities (RMBS), collateralized loan obligations (CLO), collateralized debt obligations (CDO), and other ABS that are 1) collateralized by assets of some kind; 2) have a trustee; and 3) have at least one tranche rated by a nationally recognized statistical rating organization (NRSRO). The estimates exclude deals that are "Outside U.S.” The time of offering is based on the pricing date, which is the date on which pricing terms are struck for all or most of the securities that pay principal and interest.
Data Source
AB Alert by Green Street Advisors
Description
Total ABS deal volume is the total dollar amount of ABS deals in each time period.
Calculation Method
The estimate is produced by aggregating deal volume from ABS issuances in each time period. The estimates include non-agency residential mortgage-backed securities (RMBS), collateralized loan obligations (CLO), collateralized debt obligations (CDO), and other ABS that are 1) collateralized by assets of some kind; 2) have a trustee; and 3) have at least one tranche rated by a nationally recognized statistical rating organization (NRSRO). The estimates exclude deals that are "Outside U.S." The time of offering is based on the pricing date, which is the date on which pricing terms are struck for all or most of the securities that pay principal and interest.
Data Source
AB Alert by Green Street Advisors
Description
The ABS deal volume by offering type is the total dollar amount of ABS deals by offering type in each time period.
Calculation Method
The estimate is produced by aggregating deal volume from ABS issuances by offering type in each time period. The offering types are asset-backed securities that are exempt from registration pursuant to Rule 144A of the Securities Act of 1933 (144A), asset-backed securities registered with the U.S. Securities and Exchange Commission (Registered), and asset-backed securities that are exempt from registration pursuant to Section 4(a)(2) of the Securities Act of 1933 (Private). The estimates include non-agency residential mortgage-backed securities (RMBS), collateralized loan obligations (CLO), collateralized debt obligations (CDO), and other ABS that are 1) collateralized by assets of some kind; 2) have a trustee; and 3) have at least one tranche rated by a nationally recognized statistical rating organization (NRSRO). The estimates exclude deals that are "Outside U.S." The time of offering is based on the pricing date, which is the date on which pricing terms are struck for all or most of the securities that pay principal and interest.
Data Source
AB Alert by Green Street Advisors
Description
Median deal size by deal type is the median deal size for non-agency RMBS deals, CLO/CDO deals, and other ABS deals in each time period.
Calculation Method
The estimate represents the size of the deal at the 50th %-ile when sorted by deal volume in each time period. The estimates are calculated for (1) non-agency residential mortgage-backed securities (RMBS), (2) collateralized loan obligations (CLO) and collateralized debt obligations (CDO) combined, and (3) other ABS deals. The other ABS deals include 1) collateralized by assets of some kind; 2) have a trustee; and 3) have at least one tranche rated by a nationally recognized statistical rating organization (NRSRO). The estimates exclude deals that are "Outside U.S." The time of offering is based on the pricing date, which is the date on which pricing terms are struck for all or most of the securities that pay principal and interest.
Data Source
AB Alert by Green Street Advisors
Statistics Download
The file below contains all available ABS issuance statistics from 2000:Q1 to 2026:Q1.
| File | Format | Size |
| ABS Issuance Statistics | xlsx | 109KB |
Related Materials
- Research and Reports:
- Regulatory Background:
These statistics are produced by the staff of the U.S. Securities and Exchange Commission and the Commission expresses no view regarding the statistics. The statistics are produced from commercial data sets provided by third parties. Staff cannot guarantee the accuracy of third-party data. The statistics may change based on updated or revised data and methodology.
Citation
Author: U.S. Securities and Exchange Commission Staff
Name: SEC Statistics & Data Visualizations: Asset-Backed Securities (ABS) Issuances
Publication Date: Jun. 30, 2026
Last Reviewed or Updated: June 30, 2026