

Statistics & Data Visualizations
Regulation A Offerings
June 30, 2025
Regulation A is an exemption from registration for public offerings. The Regulation A offering statistics provide aggregate information on all filed offerings, offerings qualified by Commission staff, and capital reported raised.
Data Visualizations
Click on the link below each image to access interactive features of the graph.
Trends in Financing under Regulation A Over Time
Jun. 19, 2015 - Dec. 31, 2025

Number of Qualified Offerings by Industry
Jun. 19, 2015 - Dec. 31, 2025
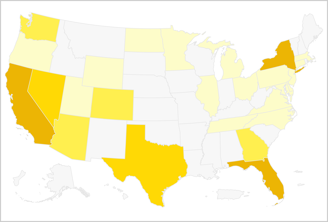
Number of Qualified Offerings by Issuer Location
Jun. 19, 2015 - Dec. 31, 2025
Statistics
Below are the most recent statistics. Regulation A offering statistics are updated semi-annually. For all available Regulation A offering statistics from Jun. 19, 2015 to Dec. 31, 2025, view Statistics Download.
| Metric | Jun. 19, 2015 - Dec. 31, 2024 | Jun. 19, 2015 - Jun. 30, 2025 | Jun. 19, 2015 - Dec. 31, 2025 |
|---|---|---|---|
| Offerings Qualified by Commission Staff | - | - | - |
| Number of offerings-Tiers 1 & 2 | 1,426 | 1,480 | 1,531 |
| Number of offerings-Tier 1 | 273 | 281 | 291 |
| Number of offerings-Tier 2 | 1,153 | 1,199 | 1,240 |
| Aggregate dollar amount sought-Tiers 1 & 2 (US$ Millions) | 28,253.1 | 29,915 | 31,668 |
| Aggregate dollar amount sought-Tier 1 (US$ Millions) | 2,002.8 | 1,994 | 2,087 |
| Aggregate dollar amount sought-Tier 2 (US$ Millions) | 26,250.3 | 27,921 | 29,581 |
| Average dollar amount sought-Tiers 1 & 2 (US$ Millions) | 19.8 | 20.2 | 20.7 |
| Average dollar amount sought-Tier 1 (US$ Millions) | 7.3 | 7.1 | 7.2 |
| Average dollar amount sought-Tier 2 (US$ Millions) | 22.8 | 23.3 | 23.9 |
| Capital Reported Raised | - | - | - |
| Number of issuers reporting proceeds-Tiers 1 & 2 | 817 | 844 | 868 |
| Number of issuers reporting proceeds-Tier 1 | 91 | 92 | 93 |
| Number of issuers reporting proceeds-Tier 2 | 726 | 752 | 775 |
| Aggregate dollar amount reported raised-Tiers 1 & 2 (US$ Millions) | 9,410.2 | 10,118 | 10,463 |
| Aggregate dollar amount reported raised-Tiers 1 (US$ Millions) | 354.9 | 357 | 358 |
| Aggregate dollar amount reported raised-Tiers 2 (US$ Millions) | 9,055.2 | 9,761 | 10,105 |
| Average dollar amount reported raised-Tiers 1 & 2 (US$ Millions) | 11.5 | 12.0 | 12.1 |
| Average dollar amount reported raised-Tiers 1 (US$ Millions) | 3.9 | 3.9 | 3.8 |
| Average dollar amount reported raised-Tiers 2 (US$ Millions) | 12.5 | 13.0 | 13.0 |
Statistics Guide
The Guide below provides a description of each metric, calculation method, and data source. To download Regulation A Offering Statistics Guide: Regulation A Offering Statistics Guide
Description
The total number of unique offerings filed under Regulation A that have been qualified by a notice of qualification, excluding any post-qualification amendments to those offerings. Post-qualification amendments are not included in this estimate due to heterogeneity in the reporting of offering amounts in such amendments, which complicates their classification for purposes of estimating offer amounts sought. The exclusion of post-qualification amendments may result in a lower-bound estimate of the amount of capital sought.
Calculation Method
Unique qualified offerings are identified on the basis of CIK and file number. Post-qualification amendments are excluded. The statistics also exclude offerings identified as withdrawn after qualification. A qualified offering may be withdrawn in a subsequent year, thus the cumulative total of qualified offerings (excluding offerings withdrawn as of the end of the reporting period) is lower than the sum of the annual counts from individual years (excluding offerings withdrawn as of the end of the respective year). The statistics for “Tiers 1 & 2”, “Tier 1”, and “Tier 2” are based on all qualified Regulation A offerings, Tier 1 offerings only, and Tier 2 offerings only, respectively.
Data Source
EDGAR filings, Form 1-A (Offering Statement) and Form 1-A-W (Withdrawal of Offering Statement).
Description
The aggregate dollar amount sought in all offerings filed under Regulation A that have been qualified by a notice of qualification, excluding any post-qualification amendments to those offerings.
Calculation Method
Sum of dollar amounts sought in qualified offering statements on Form 1-A. The dollar amounts sought are based on the maximum offering amounts sought in the qualified offering statement or the latest pre-qualification amendment to it. Post-qualification amendments are excluded. The statistics also exclude offerings identified as withdrawn after qualification. The statistics for “Tiers 1 & 2”, “Tier 1”, and “Tier 2” are based on all qualified Regulation A offerings, Tier 1 offerings only, and Tier 2 offerings only, respectively. Amounts raised may be lower than the amounts sought. The exclusion of post-qualification amendments may result in a lower-bound estimate of the amount of capital sought.
Data Source
EDGAR filings, Form 1-A (Offering Statement) and Form 1-A-W (Withdrawal of Offering Statement).
Description
The average dollar amount sought in all offerings filed under Regulation A that have been qualified by a notice of qualification, excluding any post-qualification amendments to those offerings.
Calculation Method
Average of dollar amounts sought in qualified offering statements on Form 1-A. The dollar amounts sought are based on the maximum offering amounts sought in the qualified offering statement or the latest pre-qualification amendment to it. Post-qualification amendments are excluded. The statistics also exclude offerings identified as withdrawn after qualification. The statistics for “Tiers 1 & 2”, “Tier 1”, and “Tier 2” are based on all qualified Regulation A offerings, Tier 1 offerings only, and Tier 2 offerings only, respectively. The exclusion of post-qualification amendments may result in a lower-bound estimate of the amount of capital sought.
Data Source
EDGAR filings, Form 1-A (Offering Statement) and Form 1-A-W (Withdrawal of Offering Statement).
Description
The number of issuers reporting proceeds in offerings under Regulation A.
Calculation Method
The number of issuers reporting proceeds under Regulation A is based on information in exit reports on Form 1-Z, annual reports on Form 1-K, semiannual reports on Form 1-SA, current reports on Form 1-U, amendments to those reports, offering circular supplements and post-qualification amendments filed under Regulation A, and other public sources. Estimates represent a lower bound on the number of issuers that have raised capital, given the time frames for reporting proceeds following completed or terminated offerings and that offerings qualified during the report period may be ongoing. The statistics exclude issuers reporting proceeds of zero. The statistics for “Tiers 1 & 2”, “Tier 1”, and “Tier 2” are based on all closed and ongoing Regulation A offerings, Tier 1 offerings only, and Tier 2 offerings only, respectively.
Data Source
EDGAR filings, Forms 1-Z (Exit Report), 1-K (Annual Report), 1-SA (Semiannual Report), 1-U (Current Report), amendments to them, offering circular supplements, post-qualification amendments, and other public sources.
Description
The aggregate amount of proceeds reported raised by issuers in offerings under Regulation A.
Calculation Method
The aggregate amount of proceeds reported raised by issuers in exit reports on Form 1-Z, annual reports on Form 1-K, semiannual reports on Form 1-SA, current reports on Form 1-U, amendments to those reports, offering circular supplements and post-qualification amendments filed under Regulation A. Estimates represent a lower bound on the amounts raised, given the time frames for reporting proceeds following completed or terminated offerings and that offerings qualified during the report period may be ongoing. The statistics for “Tiers 1 & 2”, “Tier 1”, and “Tier 2” are based on proceeds as reported by issuers in all Regulation A offerings, Tier 1 offerings only, and Tier 2 offerings only, respectively.
Data Source
EDGAR filings, Forms 1-Z (Exit Report), 1-K (Annual Report), 1-SA (Semiannual Report), 1-U (Current Report), amendments to them, offering circular supplements, post-qualification amendments, and other public sources.
Description
The average amount of proceeds reported raised by issuers in offerings under Regulation A.
Calculation Method
The average amount of proceeds reported raised by issuers in exit reports on Form 1-Z, annual reports on Form 1-K, semiannual reports on Form 1-SA, current reports on Form 1-U, amendments to those reports, offering circular supplements and post-qualification amendments filed under Regulation A, and other public sources. Estimates represent a lower bound on the amounts raised, given the time frames for reporting proceeds following completed or terminated offerings and that offerings qualified during the report period may be ongoing. The statistics exclude issuers reporting proceeds of zero. The statistics for “Tiers 1 & 2”, “Tier 1”, and “Tier 2” are based on all closed and ongoing Regulation A offerings, Tier 1 offerings only, and Tier 2 offerings only, respectively.
Data Source
EDGAR filings, Forms 1-Z (Exit Report), 1-K (Annual Report), 1-SA (Semiannual Report), 1-U (Current Report), amendments to them, offering circular supplements, post-qualification amendments, and other public sources.
Statistics Download
The file below contains all available Regulation A offering statistics from Jun. 19, 2015 to Dec. 31, 2025.
| File | Format | Size |
|---|---|---|
| Regulation A Offering Statistics | xlsx | 26.4KB |
Related Materials
- Research and Reports:
- Regulatory Background:
- Investor Bulletin:
- Data:
These statistics are produced by the staff of the U.S. Securities and Exchange Commission and the Commission expresses no view regarding the statistics. The statistics are produced from filings on EDGAR. Staff cannot guarantee the accuracy of information provided in these filings. The statistics may change based on updated or revised data and methodology. The statistics are intended to assist the public in analyzing data contained in filings; however, they are not a substitute for such filings. Investors should review the relevant filings before making any investment decision.
Citation
URL: https://www.sec.gov/data-research/statistics-data-visualizations/regulation-a-offerings
Author: U.S. Securities and Exchange Commission Staff
Name: SEC Statistics & Data Visualizations: Regulation A Offerings
Publication Date: Mar. 17, 2026
Last Reviewed or Updated: March 17, 2026