

Statistics & Data Visualizations
Follow-on Registered Offerings (FROs)
Dec. 22, 2025
A Follow-on Registered Offering (FRO) is a registered offering of securities by a public company whose securities already trade in the secondary market (e.g., to raise capital for various corporate purposes, such as capital expenditures, operations, or acquisitions). The FRO may also involve an offering of securities by the issuer’s insiders or other existing shareholders.
Data Visualizations
Click on the link below each image to access interactive features of the graph.
Number and Proceeds
(2000 - 2025 and 2000:Q1 - 2026:Q1)
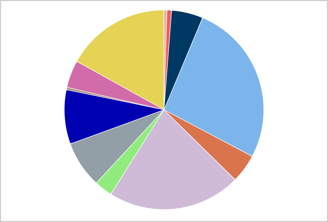
Number and Proceeds by Major Industry Group
(2025 and 2026:Q1)
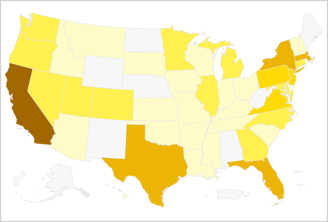
Number of Offerings by Issuer Location
(2025)
Statistics
Below are the most recent quarterly statistics for 2026:Q1 and 2025, and annual statistics for 2025. FRO statistics are updated quarterly. For all available FRO statistics from 2000:Q1 to 2026:Q1, view Statistics Download.
Metric | 2025 | 2025:Q1 | 2025:Q2 | 2025:Q3 | 2025:Q4 | 2026:Q1 |
| Total number of FROs | 1,083 | 250 | 255 | 287 | 291 | 264 |
| Number of FROs by U.S. and non-U.S. issuers | - | - | - | - | - | - |
| U.S. issuers | 772 | 183 | 173 | 210 | 206 | 191 |
| Non-U.S. issuers | 311 | 67 | 82 | 77 | 85 | 73 |
| Number of FROs by corporate and fund issuers | - | - | - | - | - | - |
| Corporates | 1,072 | 249 | 252 | 283 | 288 | 262 |
| Funds | 11 | 1 | 3 | 4 | 3 | 2 |
| FRO total proceeds (US$ Millions) | 175,506.2 | 40,410.1 | 43,277.2 | 38,862.7 | 52,956.2 | 44,253.2 |
| FRO total proceeds by U.S. and non-U.S. issuers | - | - | - | - | - | - |
| U.S. issuers (US$ Millions) | 151,681.2 | 37,451.7 | 35,768.4 | 31,525.5 | 46,935.7 | 38,829.2 |
| Non-U.S. issuers (US$ Millions) | 23,825.0 | 2,958.4 | 7,508.8 | 7,337.3 | 6,020.5 | 5,424.0 |
| FRO total proceeds by corporate and fund issuers | - | - | - | - | - | - |
| Corporates (US$ Millions) | 172,725.9 | 40,358.4 | 41,600.9 | 38,040.3 | 52,726.2 | 44,192.3 |
| Funds (US$ Millions) | 2,780.3 | 51.6 | 1,676.3 | 822.4 | 230.0 | 60.9 |
| FRO average proceeds (US$ Millions) | 162.1 | 161.6 | 169.7 | 135.4 | 182.0 | 167.6 |
| FRO average proceeds by U.S. and non-U.S. issuers | - | - | - | - | - | - |
| U.S. issuers (US$ Millions) | 196.5 | 204.7 | 206.8 | 150.1 | 227.8 | 203.3 |
| Non-U.S. issuers (US$ Millions) | 76.6 | 44.2 | 91.6 | 95.3 | 70.8 | 74.3 |
| FRO average proceeds by corporate and fund issuers | - | - | - | - | - | - |
| Corporates (US$ Millions) | 161.1 | 162.1 | 165.1 | 134.4 | 183.1 | 168.7 |
| Funds (US$ Millions) | 252.8 | 51.6 | 558.8 | 205.6 | 76.7 | 30.5 |
| FRO median proceeds (US$ Millions) | 13.9 | 7.0 | 10.7 | 24.0 | 26.3 | 20.0 |
| FRO median proceeds by U.S. and non-U.S. issuers | - | - | - | - | - | - |
| U.S. issuers (US$ Millions) | 20.5 | 7.4 | 18.9 | 34.0 | 60.0 | 36.0 |
| Non-U.S. issuers (US$ Millions) | 7.5 | 6.0 | 5.1 | 7.5 | 12.5 | 7.6 |
| FRO median proceeds by corporate and fund issuers | - | - | - | - | - | - |
| Corporates (US$ Millions) | 13.5 | 7.0 | 10.3 | 22.1 | 25.0 | 20.0 |
| Funds (US$ Millions) | 65.2 | 51.6 | 107.1 | 156.3 | 65.2 | 30.5 |
Statistics Guide
The Guide below provides a description of each metric, calculation method, and data source. To download FRO Statistics Guide: FRO Statistics Guide
Description
The number of follow-on registered offerings (FROs) in the U.S. market based on pricing date.
Calculation Method
The estimate is produced by counting priced FROs in each time period.
Data Source
LSEG SDC Platinum
Description
The number of FROs based on pricing date in the U.S. market by U.S. and non-U.S. issuers in each time period.
Calculation Method
For purposes of this estimate, the U.S. and non-U.S. issuer classifications are based on the location of the primary offices at the time of the offerings.
Data Source
LSEG SDC Platinum
Description
The number of FROs based on pricing date in the U.S. market by corporate and fund issuers in each time period.
Calculation Method
For purposes of this estimate, funds include closed-end funds (registered under the Investment Company Act of 1940) and business development companies (closed-end investment funds exempt under the Investment Company Act of 1940). Corporate issuers are all other FRO issuers except funds, as defined above at the time of offerings.
Data Source
LSEG SDC Platinum
Description
Total proceeds from FROs based on pricing date in the U.S. market in each time period.
Calculation Method
The estimate is produced by aggregating the proceeds from FROs based on pricing date in the U.S. market in each time period.
Data Source
LSEG SDC Platinum
Description
Total proceeds from FROs based on pricing date in the U.S. market by U.S. and non-U.S. issuers in each time period.
Calculation Method
For purposes of this estimate, the U.S. and non-U.S. issuer classifications are based on the location of the primary offices at the time of the offerings.
Data Source
LSEG SDC Platinum
Description
Total proceeds from FROs based on pricing date in the U.S. market by corporate and fund issuers for in each time period.
Calculation Method
For purposes of this estimate, funds include closed-end funds (registered under the Investment Company Act of 1940) and business development companies (closed-end investment funds exempt under the Investment Company Act of 1940). Corporate issuers are all other FRO issuers except funds, as defined above at the time of offerings.
Data Source
LSEG SDC Platinum
Description
Average of proceeds from FROs based on pricing date in the U.S. market in each time period.
Calculation Method
The estimate is produced by averaging the proceeds from priced FROs in the U.S. market in each time period.
Data Source
LSEG SDC Platinum
Description
Average of proceeds from FROs based on pricing date in the U.S. market by US and non-U.S. issuers in each time period.
Calculation Method
For purposes of this estimate, the U.S. and non-U.S. issuer classifications are based on the location of the primary offices at the time of the offerings.
Data Source
LSEG SDC Platinum
Description
Average of proceeds from FROs based on pricing date in the U.S. market by corporate and fund issuers in each time period.
Calculation Method
For purposes of this estimate, funds include closed-end funds (registered under the Investment Company Act of 1940) and business development companies (closed-end investment funds exempt under the Investment Company Act of 1940). Corporate issuers are all other FRO issuers except funds, as defined above at the time of offerings.
Data Source
LSEG SDC Platinum
Description
Median proceeds from FROs based on pricing date in the U.S. market in each time period.
Calculation Method
The estimate is produced by locating the issuer with the middle value of the proceeds (or average of two middle values for even number of observations) from sorted priced FRO proceeds in each time period.
Data Source
LSEG SDC Platinum
Description
Median of proceeds from FROs based on pricing date in the U.S. market by U.S. and non-U.S. issuers in each time period.
Calculation Method
For purposes of this estimate, the U.S. and non-U.S. issuer classifications are based on the location of the primary offices at the time of the offerings.
Data Source
LSEG SDC Platinum
Description
Median of proceeds from FROs based on pricing date in the U.S. market by corporate and fund issuers in each time period.
Calculation Method
For purposes of this estimate, funds include closed-end funds (registered under the Investment Company Act of 1940) and business development companies (closed-end investment funds exempt under the Investment Company Act of 1940). Corporate issuers are all other FRO issuers except funds, as defined above at the time of offerings.
Data Source
LSEG SDC Platinum
Description
The number of FROs based on pricing date in the U.S. market by major industry groups in each time period.
Calculation Method
The industry classification is based on 4-digit primary SIC codes of FRO issuers, which are grouped to form 11 major industries at the time of offerings. All other 4-digit SIC codes that are not among the 11 major industry groups are classified as Other.
Data Source
LSEG SDC Platinum
Description
Total proceeds from FROs based on pricing date in the U.S. market by major industry group in each time period.
Calculation Method
The industry classification is based on 4-digit primary SIC codes of FRO issuers, which are grouped to form 11 major industries at the time of offerings. All other 4-digit SIC codes that are not among the 11 major industry groups are classified as Other.
Data Source
LSEG SDC Platinum
Statistics Download
The file below contains all available FRO statistics from 2000:Q1 to 2026:Q1.
| File | Format | Size |
| FRO Statistics | xlsx | 39KB |
Related Materials
- Research and Reports:
- Report to Congress: Access to Capital and Market Liquidity
- Regulatory Background:
These statistics are produced by the staff of the U.S. Securities and Exchange Commission and the Commission expresses no view regarding the statistics. The statistics are produced from commercial data sets provided by third parties. Staff cannot guarantee the accuracy of third-party data. The statistics may change based on updated or revised data and methodology.
Citation
URL: https://www.sec.gov/data-research/statistics-data-visualizations/follow-on-registered-offerings-fros
Author: U.S. Securities and Exchange Commission Staff
Name: SEC Statistics & Data Visualizations: Follow-on Registered Offerings (FROs)
Publication Date: Jun. 30, 2026
Last Reviewed or Updated: June 30, 2026