

Statistics & Data Visualizations
Reporting Issuers
June 12, 2025
The reporting issuer statistics provide aggregate counts by calendar year and various compositions of the number of reporting issuers that filed Forms 10-K, 10-KT, 20-F, or 40-F and were either registered under the Exchange Act of 1934 or had a registered offering under the Securities Act of 1933.
Data Visualizations
Click on the link below each image to access interactive features of the graph.
by Calendar Year
(2004 - 2025)
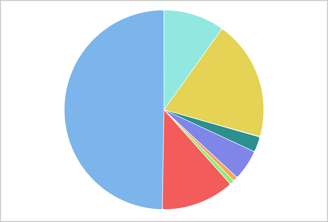
Shell vs. Non-shell
(2025 and 2025:Q2-2026:Q1)

by Filer Status and Reporting Status
(2025 and 2025:Q2-2026:Q1)
Statistics
Below are the statistics for the most recent four-quarter period from 2025:Q2 to 2026:Q1, and the last calendar year of 2025. Reporting issuer statistics are updated quarterly in a rolling four-quarter period since 2025:Q1. For all available reporting issuer statistics since 2004, view Statistics Download.
| Metric | 2025 | 2025:Q2-2026:Q1 |
| Total number of reporting issuers | 7,750 | 7,754 |
| Number of U.S. domiciled exchange listed companies | 3,714 | 3,600 |
| Number of foreign domiciled exchange listed companies | 1,020 | 1,139 |
| Number of ADRs | 387 | 367 |
| Number of REITs | 198 | 185 |
| Number of units, certificates, and shares of beneficial interest (excl REITs) | 58 | 56 |
| Number of closed end funds | 50 | 52 |
| Number of inactive issuers | 3 | 18 |
| Number of OTC and other | 1,494 | 1,465 |
| Number of ABS | 826 | 872 |
Statistics Guide
The Guide below provides a description of each metric, calculation method, and data source for reporting issuer statistics since 2025:Q1. To download Reporting Issuer Statistics Guide: Reporting Issuer Statistics Guide. To download the guide of historical statistics: Reporting Issuer Statistics Guide (2004-2024).
Description
The total number of reporting issuers includes all entities that filed an annual report (10-K, 10-K/A, 10-KT, 10-KT/A, 20-F, 20-F/A, 40-F, or 40-F/A) in a rolling four-quarter period.
Calculation Method
We count the number of unique reporting issuers that filed an annual report (10-K, 10-K/A, 10-KT, 10-KT/A, 20-F, 20-F/A, 40-F, 40-F/A) in a rolling four-quarter period. Annual reports are identified using EDGAR. Reporting issuers are identified based on their Central Index Key (CIK), which is a unique number assigned by the U.S. Securities and Exchange Commission (SEC). The final dataset on reporting issuers contains only the most recently filed annual report for the most recent fiscal period for each CIK in each period. In cases where multiple CIKs file on the same form, each CIK is treated as a unique reporting issuer unless the filing pertains to an asset-backed security (ABS). A Form 10-K filing that pertains to an ABS may contain separate CIKs for the issuing entity, the depositor, the sponsor, and other entities. For these filings, we only count one reporting issuer to reflect the issuing entity with reporting obligations.
Data Source
Electronic Data Gathering, Analysis, and Retrieval (EDGAR).
Description
The number of reporting issuers (see “Total number of reporting issuers”) with securities identified as ordinary common shares from companies incorporated in the U.S. according to CRSP data.
Calculation Method
The number of U.S. domiciled exchange listed companies is the number of issuers with CRSP security type as ordinary common shares from companies incorporated in the U.S. in a rolling four-quarter period. In cases where reporting issuers had multiple security types, ordinary common shares were prioritized.
Data Source
Electronic Data Gathering, Analysis, and Retrieval (EDGAR); Inline XBRL (eXtensible Business Reporting Language); CRSP Stock File, Center for Research in Security Prices, University of Chicago Booth School of Business (2026) (CRSP).
Description
The number of reporting issuers (see “Total number of reporting issuers”) with securities identified as ordinary common shares from companies incorporated outside the U.S. according to CRSP data.
Calculation Method
The number of foreign domiciled exchanged listed companies is the number of issuers with CRSP security type as ordinary common shares from companies incorporated outside of the U.S. in a rolling four-quarter period. In cases where reporting issuers had multiple security types, ordinary common shares were prioritized.
Data Source
Electronic Data Gathering, Analysis, and Retrieval (EDGAR); Inline XBRL (eXtensible Business Reporting Language); CRSP Stock File, Center for Research in Security Prices, University of Chicago Booth School of Business (2026) (CRSP).
Description
The number of reporting issuers (see “Total number of reporting issuers”) with securities identified as American depositary receipts (ADRs) according to CRSP data.
Calculation Method
The number of ADRs is the number of reporting issuers with CRSP security type as equity and share type as ADR from companies incorporated outside of the U.S. in a rolling four-quarter period. In cases where reporting issuers had multiple security types, ordinary common shares were prioritized.
Data Source
Electronic Data Gathering, Analysis, and Retrieval (EDGAR); Inline XBRL (eXtensible Business Reporting Language); CRSP Stock File, Center for Research in Security Prices, University of Chicago Booth School of Business (2026) (CRSP).
Description
The number of reporting issuers (see “Total number of reporting issuers”) with securities identified as real estate investment trusts (REITs) according to CRSP data.
Calculation Method
The number of REITs is the number of issuers with CRSP security type as ordinary common shares from REITs incorporated in the U.S. in a rolling four-quarter period. In cases where reporting issuers had multiple security types, ordinary common shares were prioritized.
Data Source
Electronic Data Gathering, Analysis, and Retrieval (EDGAR); Inline XBRL (eXtensible Business Reporting Language); CRSP Stock File, Center for Research in Security Prices, University of Chicago Booth School of Business (2026) (CRSP).
Description
The number of reporting issuers (see “Total number of reporting issuers”) with securities identified as shares of beneficial interest (SBIs), units, or exchange traded funds according to CRSP data, other than real estate investment trusts (REITs) (categorized separately).
Calculation Method
The number of units, certificates, and shares of beneficial interest (excl REITs) is the number of issuers with CRSP security type as shares of beneficial interest (SBIs), units, or exchange traded funds in a rolling four-quarter period. In cases where reporting issuers had multiple security types, ordinary common shares were prioritized.
Data Source
Electronic Data Gathering, Analysis, and Retrieval (EDGAR); Inline XBRL (eXtensible Business Reporting Language); CRSP Stock File, Center for Research in Security Prices, University of Chicago Booth School of Business (2026) (CRSP).
Description
The number of reporting issuers (see “Total number of reporting issuers”) with securities identified as closed-end funds according to CRSP data.
Calculation Method
The number of closed end funds is the number of issuers with CRSP security type as closed end fund in a rolling four-quarter period. In cases where reporting issuers had multiple security types, ordinary common shares were prioritized.
Data Source
Electronic Data Gathering, Analysis, and Retrieval (EDGAR); Inline XBRL (eXtensible Business Reporting Language); CRSP Stock File, Center for Research in Security Prices, University of Chicago Booth School of Business (2026) (CRSP).
Description
The number of inactive issuers is the number of CRSP matches to reporting issuers (see “Total number of reporting issuers”) with no market capitalization.
Calculation Method
The number of reporting issuers that matched with CRSP data but were missing data on either price or shares outstanding in a rolling four-quarter period.
Data Source
Electronic Data Gathering, Analysis, and Retrieval (EDGAR); Inline XBRL (eXtensible Business Reporting Language); CRSP Stock File, Center for Research in Security Prices, University of Chicago Booth School of Business (2026) (CRSP).
Description
This category includes reporting issuers (see “Total number of reporting issuers”) that are not asset-backed securities whose shares trade on the over-the-counter (OTC) market, who do not have traded shares, or who have registered debt only. It may also include issuers not matched between the registrant universe and CRSP due to timing differences or the matching methodology.
Calculation Method
This number includes all reporting issuers that did not match with CRSP and were not classified as asset-backed securities in a rolling four-quarter period. Reporting issuers that do not match with CRSP could have equity shares traded on the OTC market, have registered debt only, or not have traded shares at all. It is possible some reporting issuers did not match with CRSP due to timing issues driven by delistings, bankruptcies, mergers, name changes, or late filings. It is also possible that some reporting issuers that should have been matched with CRSP were missed by the matching methodology.
Electronic Data Gathering, Analysis, and Retrieval (EDGAR); Inline XBRL (eXtensible Business Reporting Language); CRSP Stock File, Center for Research in Security Prices, University of Chicago Booth School of Business (2026) (CRSP).
Description
The asset-backed securities (ABS) count is the number of ABS issuing entities subject to Exchange Act reporting requirements.
Calculation Method
The number of ABS is based on the number of filings in which the reporting issuer reports standard industrial classification (SIC) code 6189 or if an ABS class is reported in the EDGAR filing header file in a rolling four-quarter period.
Data Source
Electronic Data Gathering, Analysis, and Retrieval (EDGAR).
Description
The number of reporting issuers identified as shell companies as indicated in EDGAR filings. Shell issuers are aggregated by the following categories: U.S. domiciled exchange listed companies, foreign domiciled exchange listed companies, ADRs, REITs, units, certificates, and shares of beneficial interest (excl REITs), closed end funds, inactive issuers, OTC and other, and ABS.
Calculation Method
Shell company status is determined from the most recently filed annual report for the most recent fiscal period for each reporting issuer in a rolling four-quarter period by searching the relevant checkbox. To the extent possible, this process is automated with Inline XBRL tagged data.
Data Source
Electronic Data Gathering, Analysis, and Retrieval (EDGAR); Inline XBRL (eXtensible Business Reporting Language).
Description
The number of reporting issuers that are identified as large accelerated filers (LAFs), accelerated filers (AFs), or non-accelerated filers (NAFs) as indicated in EDGAR filings. Reporting issuers for which filer status was not determined were classified “Not identified.”
Calculation Method
LAF status, AF status, and NAF status are determined from the most recently filed annual report for the most recent fiscal period for each reporting issuer in a rolling four-quarter period by searching the relevant checkbox. To the extent possible, this process is automated with Inline XBRL tagged data. Any issuer that is not identified as LAF, AF, or NAF is classified as “Not identified.”
Data Source
Electronic Data Gathering, Analysis, and Retrieval (EDGAR); Inline XBRL (eXtensible Business Reporting Language).
Description
The number of reporting issuers identified as emerging growth companies (EGCs) as indicated in EDGAR filings. EGCs are aggregated by filer status (i.e., LAF, AF, NAF, and Not identified).
Calculation Method
EGC status is determined from the most recently filed annual report for the most recent fiscal period for each reporting issuer in a rolling four-quarter period by searching the relevant checkbox. To the extent possible, this process is automated with XBRL tagged data .
Data Source
Electronic Data Gathering, Analysis, and Retrieval (EDGAR); Inline XBRL (eXtensible Business Reporting Language).
Description
The number of reporting issuers identified as smaller reporting companies (SRCs) as indicated in EDGAR filings. SRCs are aggregated by filer status (i.e., LAF, AF, NAF, and Not identified).
Calculation Method
SRC status is determined from the most recently filed annual report for the most recent fiscal period for each reporting issuer in a rolling four-quarter period by searching the relevant checkbox. To the extent possible, this process is automated with Inline XBRL tagged data.
Data Source
Electronic Data Gathering, Analysis, and Retrieval (EDGAR); Inline XBRL (eXtensible Business Reporting Language).
Statistics Download
The file below contains all available reporting issuer statistics since 2004.
| File | Format | Size |
| Reporting Issuer Statistics | xlsx | 16KB |
Related Materials
- Research and Reports:
- Regulatory Background:
These statistics are produced by the staff of the U.S. Securities and Exchange Commission and the Commission expresses no view regarding the statistics. The statistics are produced from filings on EDGAR, Inline XBRL, and commercial data sets provided by third parties. Staff cannot guarantee the accuracy of information provided in EDGAR filings or Inline XBRL, or the accuracy of third-party data. The statistics may change based on updated or revised data and methodology. The statistics are intended to assist the public in analyzing data contained in EDGAR filings; however, they are not a substitute for such filings. Investors should review the relevant filings before making any investment decision.
Citation
URL: https://www.sec.gov/data-research/statistics-data-visualizations/reporting-issuers
Author: U.S. Securities and Exchange Commission Staff
Name: SEC Statistics & Data Visualizations: Reporting Issuers
Publication Date: Jun. 30, 2026
Last Reviewed or Updated: June 30, 2026