
Odd Lot Rates in a Post-Transparency World
DATA HIGHLIGHT 2014-01
January 9, 2014
Print or Download
Odd Lot Rates in a Post-Transparency World (PDF, 311KB)
Data Downloads
Visit the Market Activity Data Downloads page
Methodology
Learn how the SEC constructs quote lifetime distributions and other metrics.
Background
In the equities market, odd lot trades are generally defined to be trade executions of less than 100 shares.[1] Prior to December 9, 2013, odd lot trades were not reported to any of the consolidated public tapes, and were therefore not readily visible to the public. However, such trade executions are typically reported on the publicly-available proprietary (direct) feeds offered by most exchanges that are purchased primarily by sophisticated market participants.[2]
Utilizing data from these proprietary feeds we previously reported that in nine months ending June 30, 2013, the daily odd lot rate for corporate stocks ranged from approximately 18% to 24% of trades, and the daily odd lot rate for exchange-traded products ranged from 11% to 12% of trades. The data also revealed that higher-priced stocks tended to have higher odd lot trade rates, with the top price decile averaging over 30%.[3] A recent update of these data through the end of September 30, 2013, show average odd lot rates for each price decile to be consistent with observed levels from prior quarters.[4]
Though odd lot trades, especially in high-priced stocks, may be the result of small retail orders, various industry participants and academics have put forth alternative hypotheses to explain the presence of high odd lot rates, including the purposeful splitting of round-lot orders into odd lot sizes to avoid reporting trades to the public tape.[5]
Recent changes in the reporting requirements of odd lot trades provide us with an opportunity to begin to explore this hypothesis. Beginning December 9, 2013, odd lot transactions in all NMS stocks are now reported to the public tape.[6] By comparing odd lot rates for the periods before and after the reporting requirement went into effect, we can observe the extent to which this additional transparency may have impacted odd lot trade rates. For both time periods our analysis employs the same methodologies and data feeds used to produce the odd lot rate metrics described above.[7] As a result, our analysis of odd lot rates only reflects on-exchange trading, because off-exchange odd lot trades were not observable prior to December 9, 2013.[8]
What the Results Show
Figure 1 presents a full 18-month history of daily odd lot rates for corporate stocks and ETPs from the beginning of June 2012 through the end of December 2013.[9] Figure 2 focuses on the week before and the three weeks after odd lots began to be reported to the public tape.
Figure 1: Odd Lot Rate for US Corporate Stocks and ETPs, July 2012 to December 2013
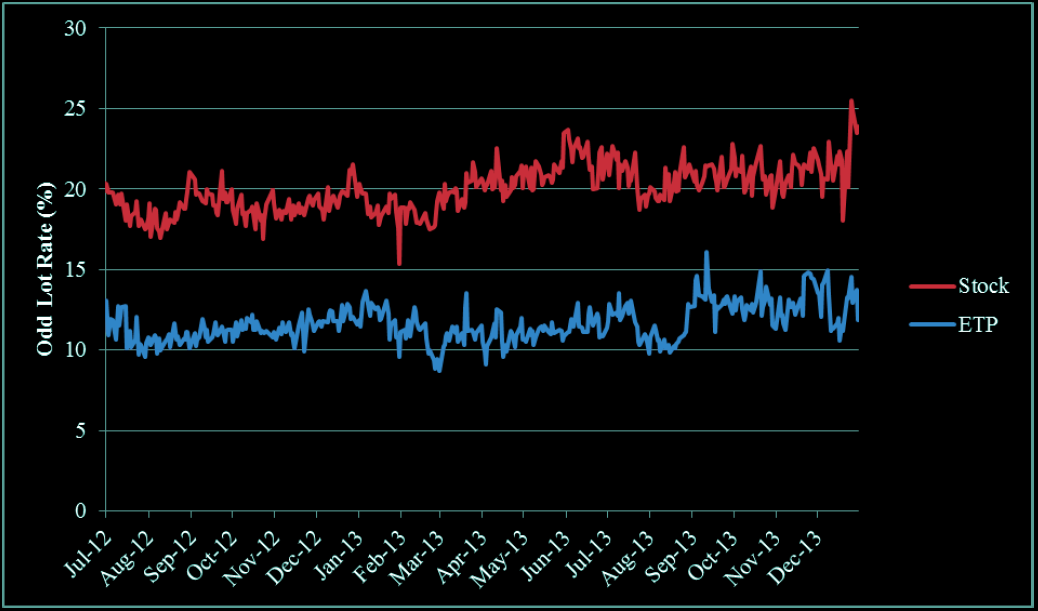
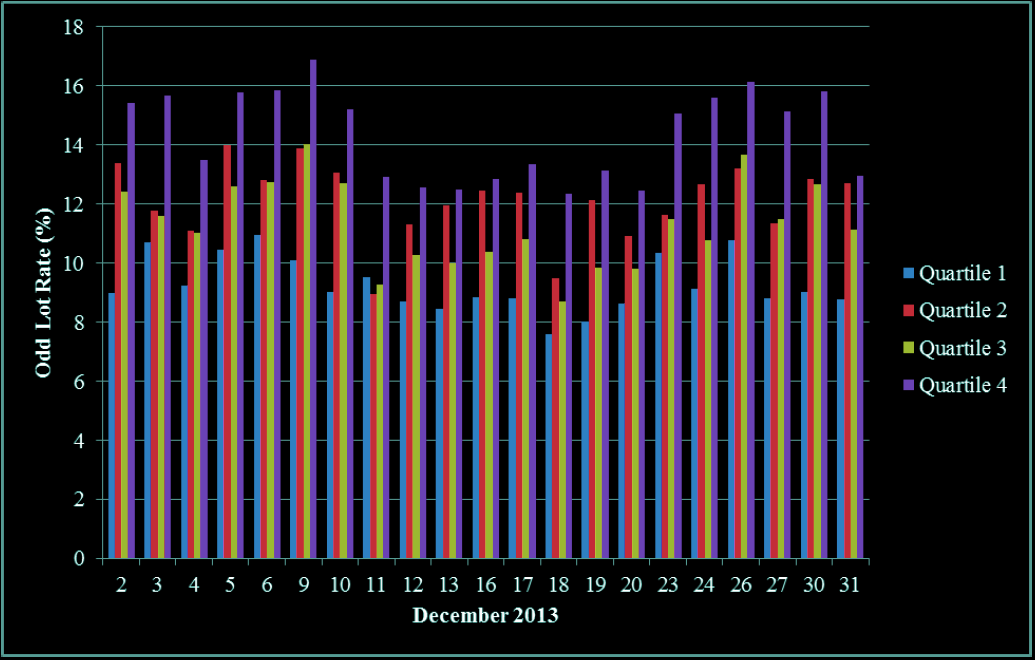
Figure 2: Odd Lot Rate for US Corporate Stocks and ETPs, December 2013
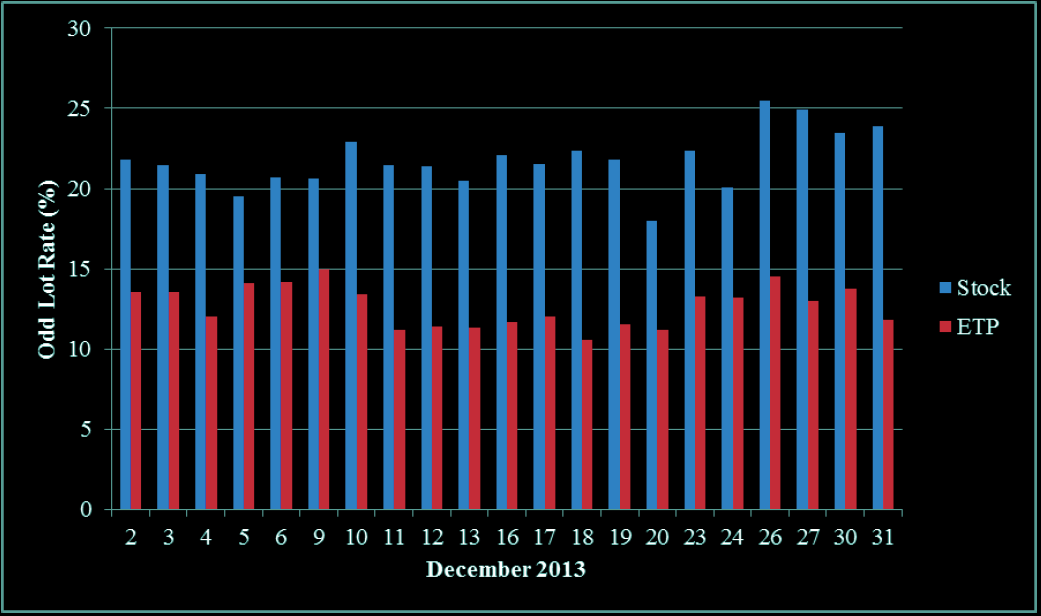
For corporate stocks the charts show no visible decline in the pooled daily odd lot rate immediately after the first week of December 2013 when the new reporting regime came into effect. In contrast to the US corporate stock odd lot rate behavior, there is a small visible decline in the pooled daily odd lot rates for ETPs during the second week of December. However, the decline does not begin until two days after the switch to odd lot reporting to the tape. In fact, odd lot rates are highest on December 9, the first day of the new reporting regime.
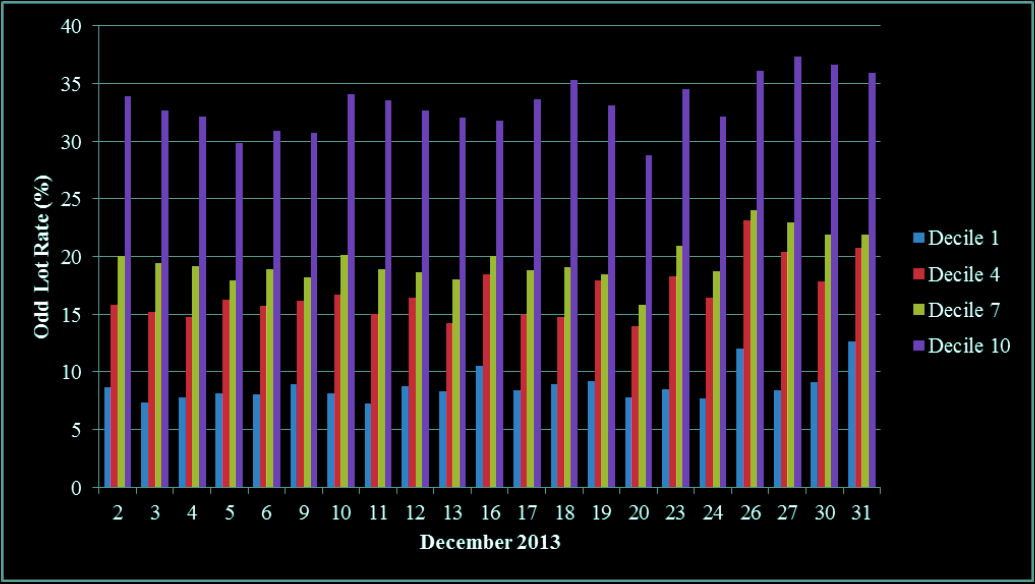
Figures 3 and 4 show no visible decline in pooled daily odd lot rates across four particular US stock price deciles in December 2013. However, the odd lot rate for low price (decile 1) stocks ranges from 7.2% to 12.6%, which is much lower than the 15% or greater range previously observed in Q2 through Q3 of 2013. As shown in the 18-month chart, this decline occurred suddenly on October 25, 2013, and may be unrelated to the December 9, 2013 change in odd lot reporting requirements.[10]
Figure 3: Odd Lot Rate by Price Decile for US Corporate Stocks, July 2012 to December 2013
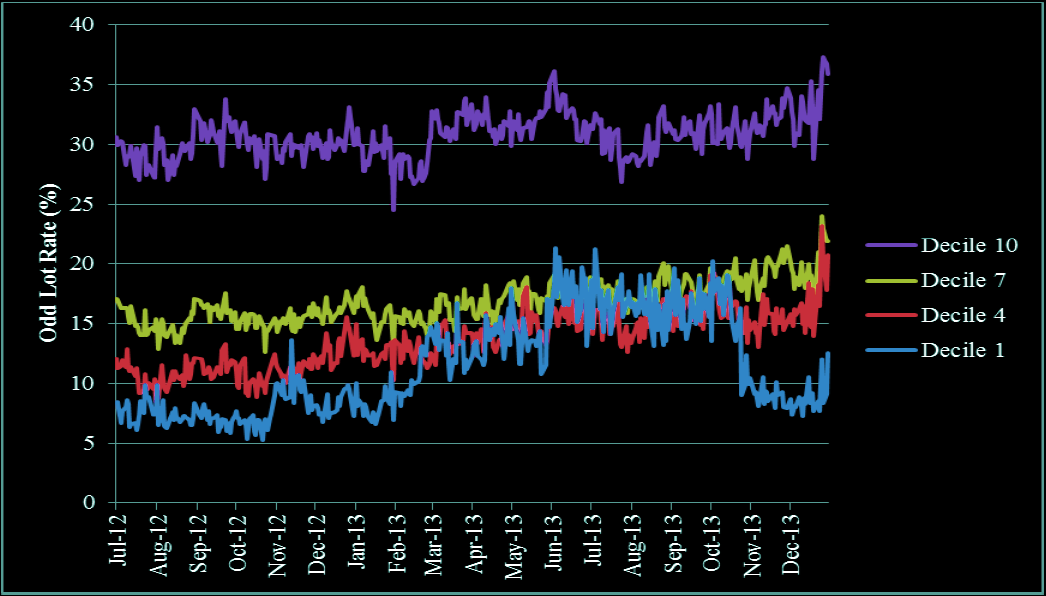
Figure 4: Odd Lot Rate by Price Decile for US Corporate Stocks, December 2013
Figures 5 and 6 show the variation in pooled daily odd lot rates across ETP price quartiles. The decline in odd lot rates on the Wednesday following the switch in reporting is apparent in all four price quartiles. By the end of December, odd lot rates are as high as they were during the first week of December.
Figure 5: Odd Lot Rate by Price Quartile for US ETPs, July 2012 to December 2013
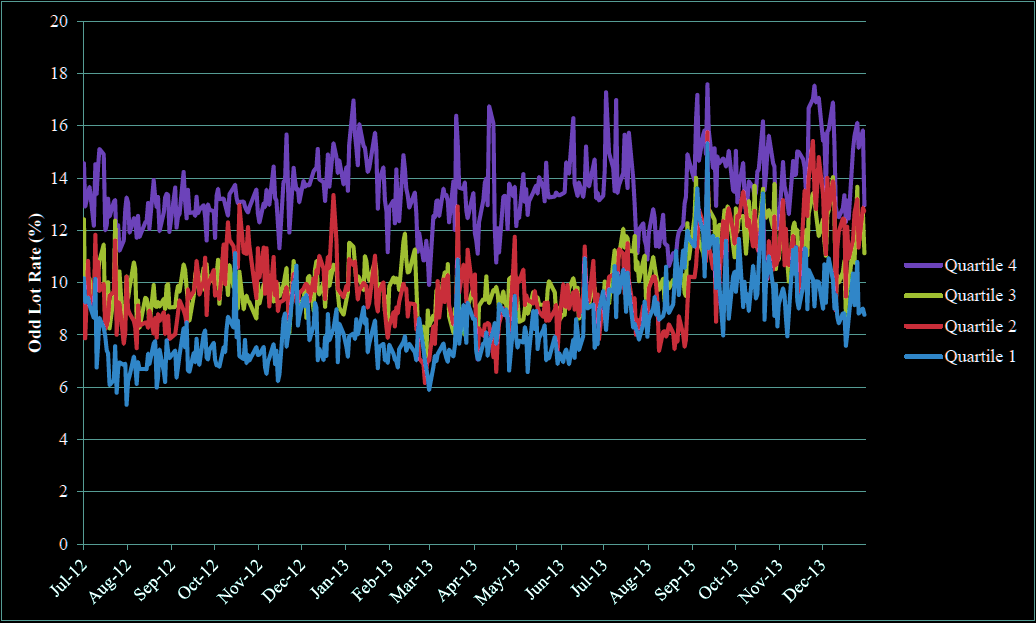
Figure 6: Odd Lot Rate by Price Quartile for US ETPs, December 2013
Conclusion
Overall, this preliminary exploration reveals no evidence of a decline in odd lot rates for US corporate stocks after the switch to reporting odd lot trades to the tape. This suggests that the prior lack of transparency of odd lot trades on the public tape may not have been one of the drivers of odd lot trading. However, we do note that odd lot rates for the lowest priced stocks experience a sharp decline on October 25, 2013, and continue at a lower level through the end of December. Though the initial decline occurs before the reporting regime switch, our data is not determinative, in and of itself, of whether this decline in odd lot rates for low priced stocks might have been in anticipation of the December 9, 2013 reporting requirements.
For ETPs, though odd lot rates do appear to decline during the first week of the new reporting regime, they did not begin to decline until two days after the switch and appear to have returned to early-December levels by the end of the month.
Additional analyses will follow as the sample of post-odd lot reporting days increases.
End Note
In any analyses of the size of reported trade executions it is important to recognize that execution sizes for on-exchange trades do not necessarily reflect the actual size of an incoming marketable order, nor the original size of any existing resting order. For example, a marketable odd lot order for 1 share may interact with a resting order for 100 shares. This results in a 1-share odd lot execution reported to the public tape as expected. However, in this instance a subsequent marketable order for a full 100 shares would first lift the remaining 99 shares from the existing resting order and then lift 1 share for the next resting order in the queue. As such, the execution of this original round lot would be reported as one odd lot trade of 99 shares, and one odd lot trade for 1 share. Though the second and third executions are of odd lot size, the marketable and resting orders that generated those executions were not. Different combinations of marketable order sizes and resting order sizes can yield similar results.
[1] This 100-share definition includes all but three equities: BRK.A, BH, and SEB.
[2] These individual exchange feeds are typically used by only the most sophisticated of market participants such as market makers and high-frequency traders. Most institutional investors, retail investors, and academics, generally do not consume this data.
[3] See Data Highlight 2013-03, Odd Lot rates, October 9, 2013
[4] See Data Visualization for Odd Lot Rates
[5] See, for example, the Commission’s 2010 Concept Release on Equity Market Structure. See also the End Note for a description of an alternative source of odd lot trades.
[6] See orders approving amendments to the UTP Plan (Release No. 34-70793) and CTA Plan (Release No. 34-70794) , October 31, 2013.
[7] See MIDAS Market Data Methodology
[8] At present, data is sufficiently detailed for 12 of 13 equity exchange feeds to compute this metric. For each of these exchanges we only include trades that are executed during the continuous market (i.e. volume resulting from the opening and closing crosses are excluded).
[9] Complete stock-by-stock odd lot data for Q4 2013, as presented in the chart, will be added to the existing 15 months of odd lot data already published on the SEC’s market structure web site as part of the next scheduled quarterly data series update (expected mid-February).
[10] Decile 1 stock prices on October 25, 2013 range from to $0.15 to $2.67.
This analysis was prepared by the Staff of the U.S. Securities and Exchange Commission. The Commission has expressed no view regarding such analysis or any statement contained therein.
Last Reviewed or Updated: Aug. 16, 2022