
Data Highlight
Hidden Volume Ratios
June 30, 2022
DATA HIGHLIGHT 2013-02
October 9, 2013
Data Downloads
Market Activity Overview Metrics Oct. 2012 - June 2013 (csv, 33 kb)
U.S. Stocks Hidden Volume by Decile Oct. 2012 - June 2013 (csv, 91 kb)
U.S. ETPs Hidden Volume by Quartile Oct. 2012 - June 2013 (csv, 37 kb)
Methodology
Learn how the SEC constructs trade-to-order ratios and other metrics.
Analysis
This chart introduces a data series that measures the percentage of exchange-based trading volume that results from executions against hidden (undisplayed) orders. At present, data is sufficiently detailed for 8 of 13 equity exchange feeds to compute this metric. For each of these exchanges we only include trades that are executed during the continuous market, which is when market participants can choose to have their limit orders either displayed or hidden (i.e. volume resulting from the opening and closing crosses are excluded).
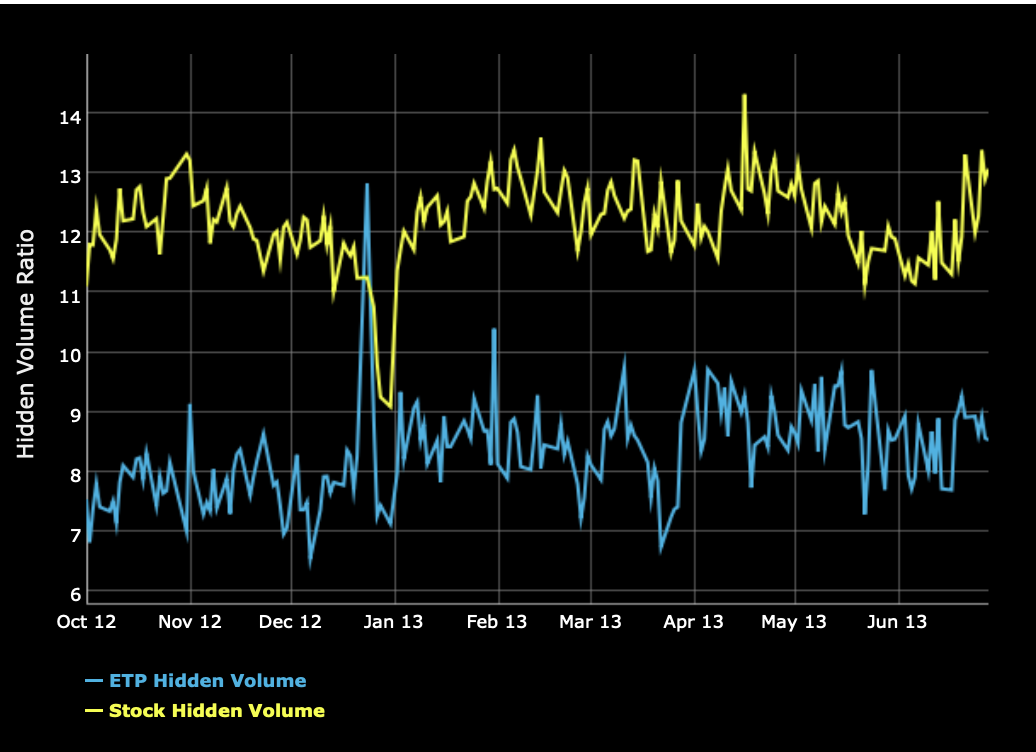
The chart above separately plots daily hidden volume ratios for corporate stocks (stocks – upper line) and exchange-trade products (ETPs – lower line) over three calendar quarters ending June 30, 2013.
What the Chart Reveals
The chart shows that the hidden volume ratio for stocks is typically between 11% and 14%, with an average of 11.9% in Q4 2012, 12.5% in Q1 2013 and 12.3% in Q2 2013. The hidden volume ratio for ETPs is less than the ratio for stocks, averaging 7.8% in Q4 2012, 8.4% in Q1 2013 and 8.7% in Q2 2013. The lower hidden volume ratio for ETPs could be related to structural differences in the way they trade (see Trade-to-Order Ratio Data Highlight 2013-01).
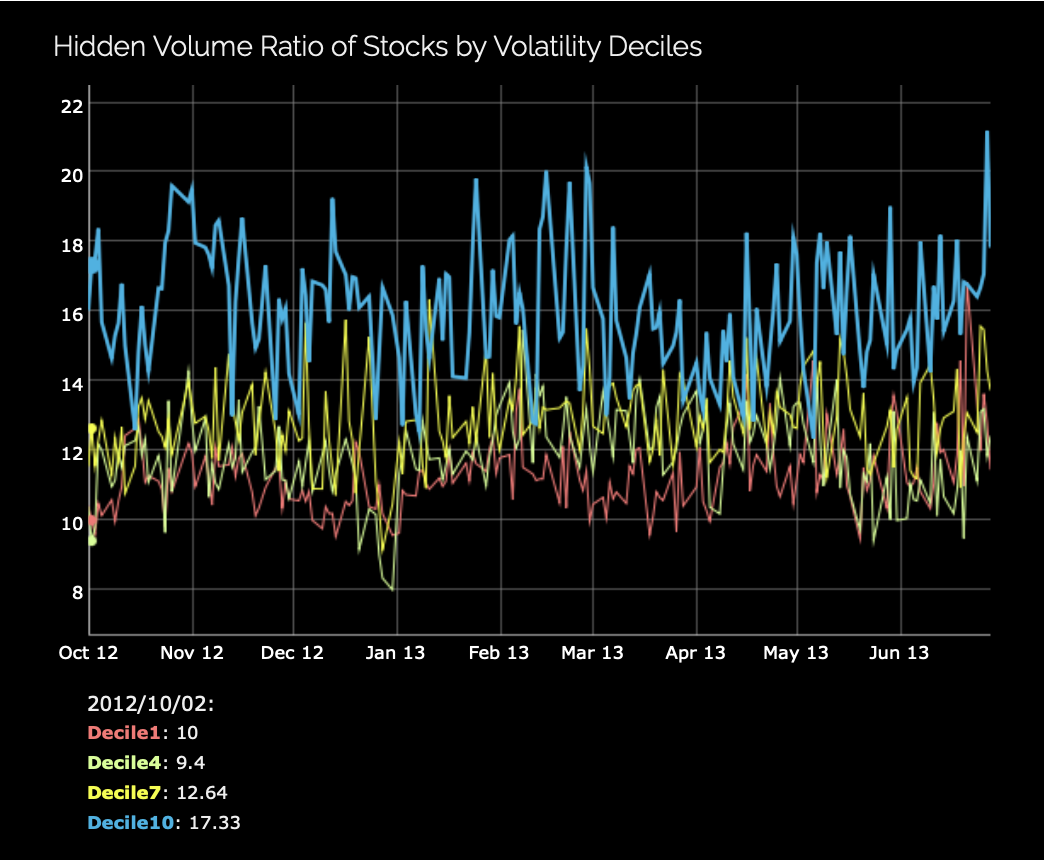
To further explore these differences two additional charts partition the hidden volume ratios by intra-day volatility (standard deviation of one-minute quote midpoint returns) according to quartile (for ETPs) and decile (for stocks).
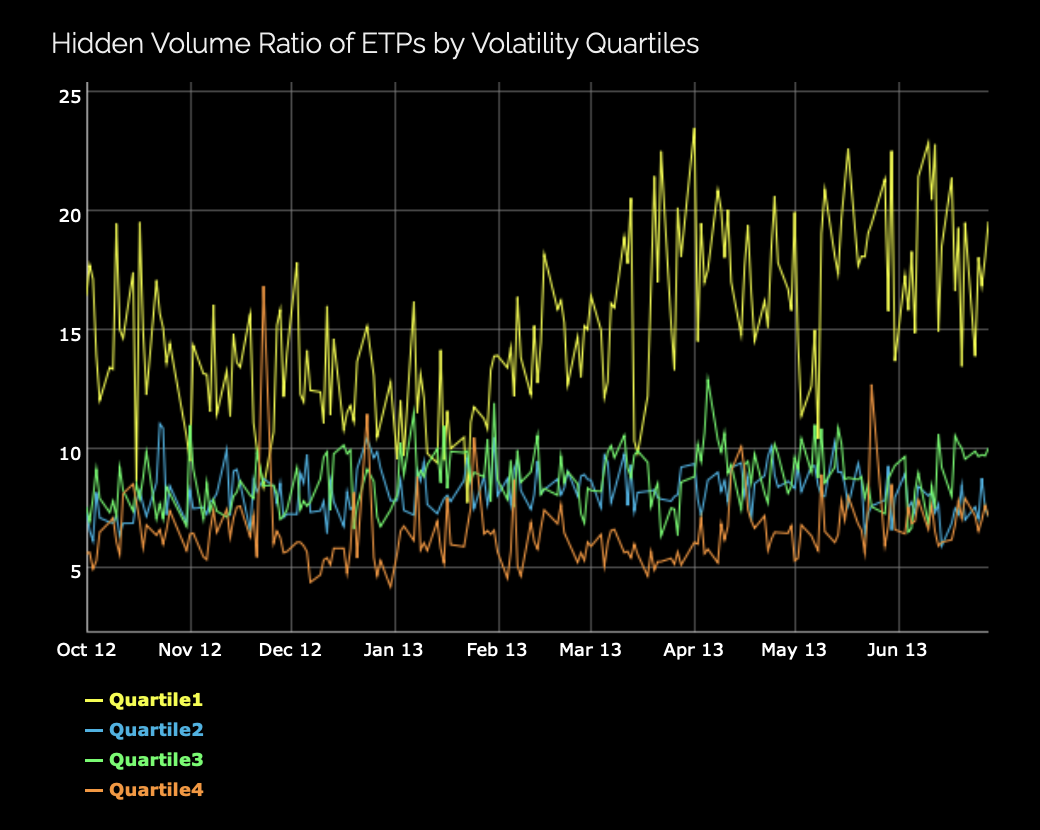
As shown in the chart for ETPs , the hidden volume ratio for the least volatile ETPs appears to be much larger than for the remaining higher volatility quartiles, and the hidden volume ratio for the most volatile ETPs tends to be a little lower than the middle quartiles.
As shown in the chart for stocks, this relation is reversed: more volatile stocks tend to have higher hidden volume ratios. These results suggest that the rationale for hidden order use in stock markets may not be the same as for ETPs. One other possible explanation for the differences might be that the least volatile quartile of ETPs trade very infrequently and some of these results could be driven by the least frequently traded ETPs.
Why This is of Interest
A significant fraction of trading (estimates range as high as 30-40% by trade volume) is currently executed off-exchange on venues that do not typically display resting orders and quotes (e.g. “dark venues”, over-the-counter market makers). Though the use of hidden orders on public exchanges is not the same as trading off exchange, hidden orders nonetheless are less transparent to other market participants on the exchange.
The hidden order ratio reveals the extent to which on-exchange trade executions occur in a less than fully transparent fashion due to the participant’s preferential use of hidden orders. As market dynamics continue to evolve, changes (or lack thereof) in the hidden order ratio can signal changes in the level of pre-trade transparency on exchanges.
This example of the differential impact of security type on hidden order use further highlights the potential differences between the market structure for corporate stocks and the market structure for ETPs.
Related Data Series
The hidden order rate data series is similar to the hidden order volume data series except it is based a simple count of events rather than share volume. Users can plot both of these data series on the Data Visualizations page and download daily stock-by-stock data from the Data Download page (currently released on a quarterly basis).
This analysis was prepared by the Staff of the U.S. Securities and Exchange Commission. The Commission has expressed no view regarding such analysis or any statement contained therein.
Last Reviewed or Updated: April 25, 2024