
Data Highlight
Quote Lifetime Distributions
Oct. 9, 2013
DATA HIGHLIGHT 2013-04
October 9, 2013
Data Download
Conditional Frequency, Large Stocks 1-10 milliseconds Oct. 2012 - June 2013 (csv, 133 kb)
Conditional Frequency, Large Stocks 1-10 seconds Oct. 2012 - June 2013 (csv, 133 kb)
Visit the Quote Life Data Downloads page for more in this series.
Methodology
Learn how the SEC constructs quote lifetime distributions and other metrics.
These charts introduce two specific sets of distributions designed to shed more light on the speed at which orders are placed and then subsequently canceled, modified, or traded against. At present, data is sufficiently detailed for 10 of 13 equity exchange feeds to compute this metric. For each of these exchanges we track the life cycle of every posted order, at every price level available, and determine how long the order was in force before either by being canceled, modified, or filled by an incoming marketable order (resulting in a trade).
A 9:30 AM to 4:00 PM trading day contains 23,400 seconds, during which one billion or more quote and trade messages may be analyzed. Since we can measure the lifetime of quotes with up to microsecond granularity, our distributions could in theory comprise 23.4 billion discrete bins. However, this level of granularity provides no useful information when comparing quote lifetimes on the order of a second or more. To form a more useful set of distributions we use microsecond granularity to measure quotes with lifetimes on the order of microseconds and milliseconds, but expand to ever-larger increments as we measure quotes with lifetimes on the order of seconds, minutes, and hours. The resulting distributions contain approximately 24,000 discrete bins, which, for presentation purposes, are displayed separately according to different time horizons.
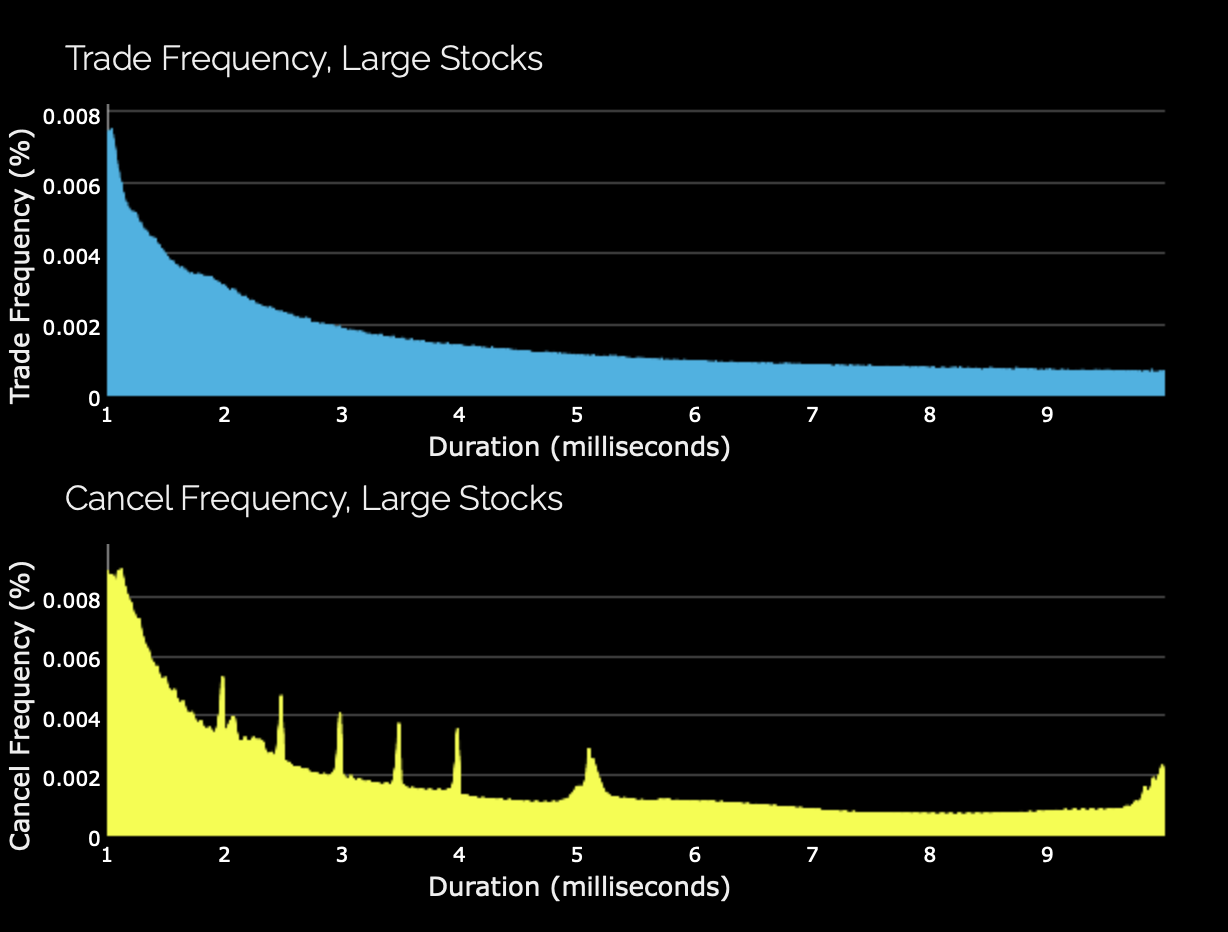
The two charts above present a slice of the quote lifetime distributions in the range of 1 through 10 milliseconds for the 100 largest corporate stocks. Data includes all trading days from the second quarter of 2013.
What the Charts Reveal
The top panel shows that order cancellations cluster at 2, 2.5, 3, 4 and 5 milliseconds. The bottom panel, in which the lifetime of quotes that result in a trade execution are presented, show a very similar distribution, but without the spike clusters.
The fact that the distributions have similar shapes suggests that at the millisecond level, liquidity takers (i.e. those who send marketable orders to an exchange that are filled by an existing quote) proportionally follow the same speeds as do liquidity providers (i.e. those that post quotes or limit orders). However, the fact that there are observable spikes in the cancellation distributions, but not in the trade distributions, suggest that there are at least some participants who use algorithms that cancel (and presumably replace) quotes at a pre-defined, periodic rate, and not just in response to rapid changes in market conditions.
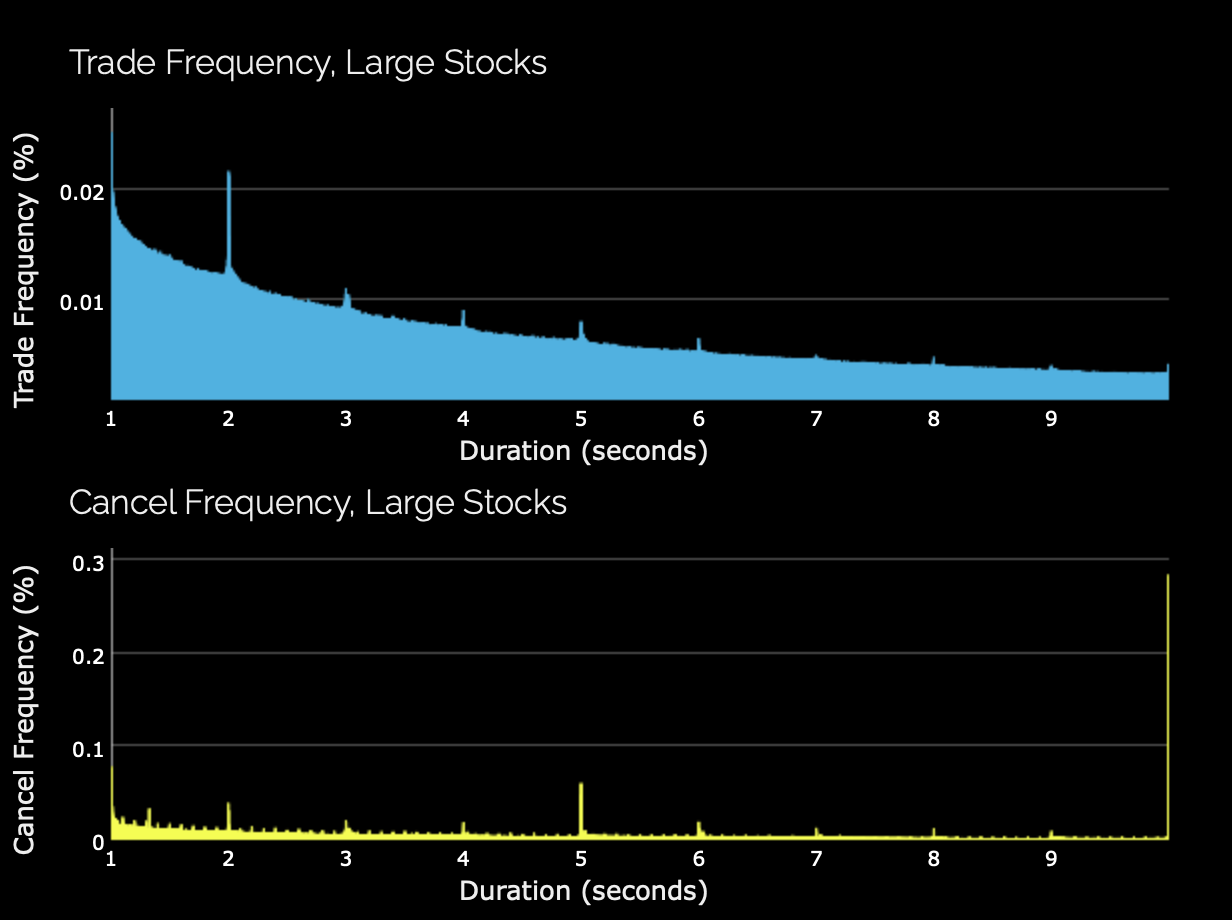
In contrast, as shown in the two panels below, quote life distributions over the range of 1 to 10 second reveal clustering at one second intervals for the lifetime of quotes that are canceled as well as traded against.
Follow-up by staff on the specific nature of the trades that result in these spikes reveal that they are formed by a relatively rare interaction of commonly-used time-based execution algorithms (e.g., TWAP, or time-weighted average price algorithmic orders) with automated liquidity-providing algorithms that post new orders only in response to existing orders being executed. In circumstances where the only liquidity taking for a given stock over a certain period of time is being done by a TWAP algorithm, this type of pattern can emerge.
Why This is of Interest
An accurate assessment of the lifetime of quotes posted by market participants on public equity exchanges is important for both measuring the speed of the market as well for tracking how this speed may change over time in response to new products, new technologies, new market practices, and/or new regulations. Patterns revealed in these distributions over different time horizons provide further information on the nature of some forms of algorithmic trading, and the circumstances under which algorithms can interact with one another.
Related Data
The charts presented above plot two subsets of the full quote life distributions for a subset of the 100 largest corporate stocks. Users can explore full quarterly distributions for this and other subsets of equities on the Data Visualizations page and download the underlying data for these distributions from the Data Download page. See also The Speed of the Equity Markets (Data Highlight 2013-05) for a broader discussion of these metrics.
This analysis was prepared by the Staff of the U.S. Securities and Exchange Commission. The Commission has expressed no view regarding such analysis or any statement contained therein.
Last Reviewed or Updated: Aug. 16, 2022