
UNITED STATES
SECURITIES AND EXCHANGE COMMISSION
Washington, D.C. 20549
Form
(Mark One)
|
|
QUARTERLY REPORT PURSUANT TO SECTION 13 OR 15(d) OF THE SECURITIES EXCHANGE ACT OF 1934 |
For the quarterly period ended
or
|
|
TRANSITION REPORT PURSUANT TO SECTION 13 OR 15(d) OF THE SECURITIES EXCHANGE ACT OF 1934 |
Commission File Number
DEVON ENERGY CORPORATION
(Exact name of registrant as specified in its charter)
|
|
|
|
|
(State or other jurisdiction of incorporation or organization) |
|
(I.R.S. Employer identification No.) |
|
|
|
|
|
|
|
|
|
(Address of principal executive offices) |
|
(Zip code) |
Registrant’s telephone number, including area code: (
Former name, address and former fiscal year, if changed from last report: Not applicable
Securities registered pursuant to Section 12(b) of the Act:
|
Title of each class |
Trading Symbol |
Name of each exchange on which registered |
|
|
|
|
Indicate by check mark whether the registrant (1) has filed all reports required to be filed by Section 13 or 15(d) of the Securities Exchange Act of 1934 during the preceding 12 months (or for such shorter period that the registrant was required to file such reports), and (2) has been subject to such filing requirements for the past 90 days.
Indicate by check mark whether the registrant has submitted electronically every Interactive Data File required to be submitted pursuant to Rule 405 of Regulation S-T (§232.405 of this chapter) during the preceding 12 months (or for such shorter period that the registrant was required to submit such files).
Indicate by check mark whether the registrant is a large accelerated filer, an accelerated filer, a non-accelerated filer, smaller reporting company or an emerging growth company. See the definitions of “large accelerated filer,” “accelerated filer,” “smaller reporting company,” and “emerging growth company” in Rule 12b-2 of the Exchange Act.
|
Large accelerated filer |
|
☑ |
Accelerated filer |
|
☐ |
Non-accelerated filer |
|
☐ |
|
Smaller reporting company |
|
|
Emerging growth company |
|
|
|
|
|
If an emerging growth company, indicate by check mark if the registrant has elected not to use the extended transition period for complying with any new or revised financial accounting standards provided pursuant to Section 13(a) of the Exchange Act. ☐
Indicate by check mark whether the registrant is a shell company (as defined in Rule 12b-2 of the Act). Yes
On April 22, 2020,
DEVON ENERGY CORPORATION
FORM 10-Q
TABLE OF CONTENTS
|
Part I. Financial Information |
|
||
|
Item 1. |
|
6 |
|
|
|
|
6 |
|
|
|
|
7 |
|
|
|
|
8 |
|
|
|
|
9 |
|
|
|
|
10 |
|
|
|
|
10 |
|
|
|
|
11 |
|
|
|
|
11 |
|
|
|
|
14 |
|
|
|
|
15 |
|
|
|
|
15 |
|
|
|
|
16 |
|
|
|
|
Note 8 – Net Earnings (Loss) Per Share From Continuing Operations |
17 |
|
|
|
17 |
|
|
|
|
Note 10 – Supplemental Information to Statements of Cash Flows |
18 |
|
|
|
18 |
|
|
|
|
18 |
|
|
|
|
19 |
|
|
|
|
19 |
|
|
|
|
20 |
|
|
|
|
20 |
|
|
|
|
21 |
|
|
|
|
23 |
|
|
|
|
24 |
|
|
Item 2. |
|
Management’s Discussion and Analysis of Financial Condition and Results of Operations |
25 |
|
Item 3. |
|
42 |
|
|
Item 4. |
|
42 |
|
|
|
|
|
|
|
Part II. Other Information |
|
||
|
Item 1. |
|
43 |
|
|
Item 1A. |
|
43 |
|
|
Item 2. |
|
44 |
|
|
Item 3. |
|
44 |
|
|
Item 4. |
|
44 |
|
|
Item 5. |
|
44 |
|
|
Item 6. |
|
45 |
|
|
|
|
|
|
|
|
|
46 |
|
2
DEFINITIONS
Unless the context otherwise indicates, references to “us,” “we,” “our,” “ours,” “Devon,” the “Company” and “Registrant” refer to Devon Energy Corporation and its consolidated subsidiaries. All monetary values, other than per unit and per share amounts, are stated in millions of U.S. dollars unless otherwise specified. In addition, the following are other abbreviations and definitions of certain terms used within this Quarterly Report on Form 10-Q:
“ASC” means Accounting Standards Codification.
“ASR” means an accelerated share-repurchase transaction with a financial institution to repurchase Devon’s common stock.
“ASU” means Accounting Standards Update.
“Bbl” or “Bbls” means barrel or barrels.
“BKV” means Banpu Kalnin Ventures.
“Boe” means barrel of oil equivalent. Gas proved reserves and production are converted to Boe, at the pressure and temperature base standard of each respective state in which the gas is produced, at the rate of six Mcf of gas per Bbl of oil, based upon the approximate relative energy content of gas and oil. NGL proved reserves and production are converted to Boe on a one-to-one basis with oil.
“Btu” means British thermal units, a measure of heating value.
“Canada” means the division of Devon encompassing oil and gas properties located in Canada. On June 27, 2019, all of Devon’s Canadian operating assets and operations were divested. All dollar amounts associated with Canada are in U.S. dollars, unless stated otherwise.
“DD&A” means depreciation, depletion and amortization expenses.
“Devon Plan” means Devon Energy Corporation Incentive Savings Plan.
“E&P” means exploration and production activities.
“FASB” means Financial Accounting Standards Board.
“G&A” means general and administrative expenses.
“GAAP” means U.S. generally accepted accounting principles.
“Inside FERC” refers to the publication Inside FERC’s Gas Market Report.
“LOE” means lease operating expenses.
“MBbls” means thousand barrels.
“MBoe” means thousand Boe.
“Mcf” means thousand cubic feet.
“MMBoe” means million Boe.
“MMBtu” means million Btu.
“MMcf” means million cubic feet.
3
“N/M” means not meaningful.
“NGL” or “NGLs” means natural gas liquids.
“NYMEX” means New York Mercantile Exchange.
“OPEC” means Organization of the Petroleum Exporting Countries.
“OPIS” means Oil Price Information Service.
“SEC” means United States Securities and Exchange Commission.
“Senior Credit Facility” means Devon’s syndicated unsecured revolving line of credit, effective as of October 5, 2018.
“TSR” means total shareholder return.
“U.S.” means United States of America.
“VIE” means variable interest entity.
“WTI” means West Texas Intermediate.
“/Bbl” means per barrel.
“/d” means per day.
“/MMBtu” means per MMBtu.
4
INFORMATION REGARDING FORWARD-LOOKING STATEMENTS
This report includes “forward-looking statements” as defined by the SEC. Such statements include those concerning strategic plans, our expectations and objectives for future operations, as well as other future events or conditions, and are often identified by use of the words and phrases “expects,” “believes,” “will,” “would,” “could,” “continue,” “may,” “aims,” “likely to be,” “intends,” “forecasts,” “projections,” “estimates,” “plans,” “expectations,” “targets,” “opportunities,” “potential,” “anticipates,” “outlook” and other similar terminology. All statements, other than statements of historical facts, included in this report that address activities, events or developments that Devon expects, believes or anticipates will or may occur in the future are forward-looking statements. Such statements are subject to a number of assumptions, risks and uncertainties, many of which are beyond our control. Consequently, actual future results could differ materially from our expectations due to a number of factors, including, but not limited to those, identified below.
The COVID-19 pandemic and its related repercussions have created significant volatility, uncertainty and turmoil in the global economy and our industry. This turmoil has included an unprecedented supply-and-demand imbalance for oil and other commodities, resulting in a swift and material decline in commodity prices in early 2020. Our future actual results could differ materially from the forward-looking statements in this report due to the COVID-19 pandemic and related impacts, including, among other things: contributing to a sustained or further deterioration in commodity prices; causing takeaway capacity constraints for production, resulting in production shut-ins and additional downward pressure on impacted regional pricing differentials; limiting our ability to access sources of capital due to disruptions in financial markets; increasing the risk of a downgrade from credit rating agencies; exacerbating counterparty credit risks and the risk of supply chain interruptions; and increasing the risk of operational disruptions due to social distancing measures and other changes to business practices.
In addition to the risks associated with the COVID-19 pandemic and its related impacts, our actual future results could differ materially from our expectations due to other factors, including, among other things:
|
|
• |
the volatility of oil, gas and NGL prices; |
|
|
• |
uncertainties inherent in estimating oil, gas and NGL reserves; |
|
|
• |
the extent to which we are successful in acquiring and discovering additional reserves; |
|
|
• |
the uncertainties, costs and risks involved in our operations, including as a result of employee misconduct; |
|
|
• |
regulatory restrictions, compliance costs and other risks relating to governmental regulation, including with respect to environmental matters; |
|
|
• |
risks related to regulatory, social and market efforts to address climate change; |
|
|
• |
risks related to our hedging activities; |
|
|
• |
counterparty credit risks; |
|
|
• |
risks relating to our indebtedness; |
|
|
• |
cyberattack risks; |
|
|
• |
our limited control over third parties who operate some of our oil and gas properties; |
|
|
• |
midstream capacity constraints and potential interruptions in production; |
|
|
• |
the extent to which insurance covers any losses we may experience; |
|
|
• |
competition for assets, materials, people and capital; |
|
|
• |
risks related to investors attempting to effect change; |
|
|
• |
our ability to successfully complete mergers, acquisitions and divestitures; and |
|
|
• |
any of the other risks and uncertainties discussed in this report, our 2019 Annual Report on Form 10-K and our other filings with the SEC. |
All subsequent written and oral forward-looking statements attributable to Devon, or persons acting on its behalf, are expressly qualified in their entirety by the cautionary statements above. We assume no duty to update or revise our forward-looking statements based on new information, future events or otherwise.
5
Part I. Financial Information
Item 1. Financial Statements
DEVON ENERGY CORPORATION AND SUBSIDIARIES
CONSOLIDATED STATEMENTS OF COMPREHENSIVE EARNINGS
|
|
|
Three Months Ended March 31, |
|
|||||
|
|
|
2020 |
|
|
2019 |
|
||
|
|
|
(Unaudited) |
|
|||||
|
Upstream revenues |
|
$ |
|
|
|
$ |
|
|
|
Marketing and midstream revenues |
|
|
|
|
|
|
|
|
|
Total revenues |
|
|
|
|
|
|
|
|
|
Production expenses |
|
|
|
|
|
|
|
|
|
Exploration expenses |
|
|
|
|
|
|
|
|
|
Marketing and midstream expenses |
|
|
|
|
|
|
|
|
|
Depreciation, depletion and amortization |
|
|
|
|
|
|
|
|
|
Asset impairments |
|
|
|
|
|
|
— |
|
|
Asset dispositions |
|
|
— |
|
|
|
( |
) |
|
General and administrative expenses |
|
|
|
|
|
|
|
|
|
Financing costs, net |
|
|
|
|
|
|
|
|
|
Restructuring and transaction costs |
|
|
— |
|
|
|
|
|
|
Other expenses |
|
|
( |
) |
|
|
( |
) |
|
Total expenses |
|
|
|
|
|
|
|
|
|
Loss from continuing operations before income taxes |
|
|
( |
) |
|
|
( |
) |
|
Income tax benefit |
|
|
( |
) |
|
|
( |
) |
|
Net loss from continuing operations |
|
|
( |
) |
|
|
( |
) |
|
Net earnings (loss) from discontinued operations, net of income taxes |
|
|
( |
) |
|
|
|
|
|
Net loss |
|
|
( |
) |
|
|
( |
) |
|
Net earnings attributable to noncontrolling interests |
|
|
|
|
|
|
— |
|
|
Net loss attributable to Devon |
|
$ |
( |
) |
|
$ |
( |
) |
|
Basic net earnings (loss) per share: |
|
|
|
|
|
|
|
|
|
Basic loss from continuing operations per share |
|
$ |
( |
) |
|
$ |
( |
) |
|
Basic earnings (loss) from discontinued operations per share |
|
|
( |
) |
|
|
|
|
|
Basic net loss per share |
|
$ |
( |
) |
|
$ |
( |
) |
|
Diluted net earnings (loss) per share: |
|
|
|
|
|
|
|
|
|
Diluted loss from continuing operations per share |
|
$ |
( |
) |
|
$ |
( |
) |
|
Diluted earnings (loss) from discontinued operations per share |
|
|
( |
) |
|
|
|
|
|
Diluted net loss per share |
|
$ |
( |
) |
|
$ |
( |
) |
|
Comprehensive earnings (loss): |
|
|
|
|
|
|
|
|
|
Net loss |
|
$ |
( |
) |
|
$ |
( |
) |
|
Other comprehensive earnings, net of tax: |
|
|
|
|
|
|
|
|
|
Foreign currency translation, discontinued operations |
|
|
— |
|
|
|
|
|
|
Pension and postretirement plans |
|
|
|
|
|
|
|
|
|
Other comprehensive earnings, net of tax |
|
|
|
|
|
|
|
|
|
Comprehensive loss: |
|
|
( |
) |
|
|
( |
) |
|
Comprehensive earnings attributable to noncontrolling interests |
|
|
|
|
|
|
— |
|
|
Comprehensive loss attributable to Devon |
|
$ |
( |
) |
|
$ |
( |
) |
See accompanying notes to consolidated financial statements
6
DEVON ENERGY CORPORATION AND SUBSIDIARIES
CONSOLIDATED STATEMENTS OF CASH FLOWS
|
|
|
Three Months Ended March 31, |
|
|||||
|
|
|
2020 |
|
|
2019 |
|
||
|
|
|
(Unaudited) |
|
|||||
|
Cash flows from operating activities: |
|
|
|
|
|
|
|
|
|
Net loss |
|
$ |
( |
) |
|
$ |
( |
) |
|
Adjustments to reconcile net loss to net cash from operating activities: |
|
|
|
|
|
|
|
|
|
Net (earnings) loss from discontinued operations, net of income taxes |
|
|
|
|
|
|
( |
) |
|
Depreciation, depletion and amortization |
|
|
|
|
|
|
|
|
|
Asset impairments |
|
|
|
|
|
|
— |
|
|
Leasehold impairments |
|
|
|
|
|
|
|
|
|
Accretion on discounted liabilities |
|
|
|
|
|
|
|
|
|
Total (gains) losses on commodity derivatives |
|
|
( |
) |
|
|
|
|
|
Cash settlements on commodity derivatives |
|
|
|
|
|
|
|
|
|
Gains on asset dispositions |
|
|
— |
|
|
|
( |
) |
|
Deferred income tax benefit |
|
|
( |
) |
|
|
( |
) |
|
Share-based compensation |
|
|
|
|
|
|
|
|
|
Other |
|
|
— |
|
|
|
( |
) |
|
Changes in assets and liabilities, net |
|
|
( |
) |
|
|
( |
) |
|
Net cash from operating activities - continuing operations |
|
|
|
|
|
|
|
|
|
Cash flows from investing activities: |
|
|
|
|
|
|
|
|
|
Capital expenditures |
|
|
( |
) |
|
|
( |
) |
|
Acquisitions of property and equipment |
|
|
( |
) |
|
|
( |
) |
|
Divestitures of property and equipment |
|
|
|
|
|
|
|
|
|
Net cash from investing activities - continuing operations |
|
|
( |
) |
|
|
( |
) |
|
Cash flows from financing activities: |
|
|
|
|
|
|
|
|
|
Repayments of long-term debt |
|
|
— |
|
|
|
( |
) |
|
Repurchases of common stock |
|
|
( |
) |
|
|
( |
) |
|
Dividends paid on common stock |
|
|
( |
) |
|
|
( |
) |
|
Contributions from noncontrolling interests |
|
|
|
|
|
|
— |
|
|
Distributions to noncontrolling interests |
|
|
( |
) |
|
|
— |
|
|
Shares exchanged for tax withholdings |
|
|
( |
) |
|
|
( |
) |
|
Net cash from financing activities - continuing operations |
|
|
( |
) |
|
|
( |
) |
|
Net change in cash, cash equivalents and restricted cash of continuing operations |
|
|
|
|
|
|
( |
) |
|
Cash flows from discontinued operations: |
|
|
|
|
|
|
|
|
|
Operating activities |
|
|
( |
) |
|
|
( |
) |
|
Investing activities |
|
|
( |
) |
|
|
( |
) |
|
Financing activities |
|
|
|
|
|
|
( |
) |
|
Effect of exchange rate changes on cash |
|
|
( |
) |
|
|
|
|
|
Net change in cash, cash equivalents and restricted cash of discontinued operations |
|
|
( |
) |
|
|
( |
) |
|
Net change in cash, cash equivalents and restricted cash |
|
|
( |
) |
|
|
( |
) |
|
Cash, cash equivalents and restricted cash at beginning of period |
|
|
|
|
|
|
|
|
|
Cash, cash equivalents and restricted cash at end of period |
|
$ |
|
|
|
$ |
|
|
|
|
|
|
|
|
|
|
|
|
|
Reconciliation of cash, cash equivalents and restricted cash: |
|
|
|
|
|
|
|
|
|
Cash and cash equivalents |
|
$ |
|
|
|
$ |
|
|
|
Cash restricted for discontinued operations |
|
|
|
|
|
|
— |
|
|
Restricted cash included in other current assets |
|
|
— |
|
|
|
|
|
|
Total cash, cash equivalents and restricted cash |
|
$ |
|
|
|
$ |
|
|
See accompanying notes to consolidated financial statements
7
DEVON ENERGY CORPORATION AND SUBSIDIARIES
CONSOLIDATED BALANCE SHEETS
|
|
|
March 31, 2020 |
|
|
December 31, 2019 |
|
||
|
|
|
(Unaudited) |
|
|
|
|
|
|
|
ASSETS |
|
|
|
|
|
|
|
|
|
Current assets: |
|
|
|
|
|
|
|
|
|
Cash and cash equivalents |
|
$ |
|
|
|
$ |
|
|
|
Cash restricted for discontinued operations |
|
|
|
|
|
|
|
|
|
Accounts receivable |
|
|
|
|
|
|
|
|
|
Current assets associated with discontinued operations |
|
|
|
|
|
|
|
|
|
Other current assets |
|
|
|
|
|
|
|
|
|
Total current assets |
|
|
|
|
|
|
|
|
|
Oil and gas property and equipment, based on successful efforts accounting, net |
|
|
|
|
|
|
|
|
|
Other property and equipment, net ($ |
|
|
|
|
|
|
|
|
|
Total property and equipment, net |
|
|
|
|
|
|
|
|
|
Goodwill |
|
|
|
|
|
|
|
|
|
Right-of-use assets |
|
|
|
|
|
|
|
|
|
Other long-term assets |
|
|
|
|
|
|
|
|
|
Long-term assets associated with discontinued operations |
|
|
|
|
|
|
|
|
|
Total assets |
|
$ |
|
|
|
$ |
|
|
|
LIABILITIES AND EQUITY |
|
|
|
|
|
|
|
|
|
Current liabilities: |
|
|
|
|
|
|
|
|
|
Accounts payable |
|
$ |
|
|
|
$ |
|
|
|
Revenues and royalties payable |
|
|
|
|
|
|
|
|
|
Current liabilities associated with discontinued operations |
|
|
|
|
|
|
|
|
|
Other current liabilities |
|
|
|
|
|
|
|
|
|
Total current liabilities |
|
|
|
|
|
|
|
|
|
Long-term debt |
|
|
|
|
|
|
|
|
|
Lease liabilities |
|
|
|
|
|
|
|
|
|
Asset retirement obligations |
|
|
|
|
|
|
|
|
|
Other long-term liabilities |
|
|
|
|
|
|
|
|
|
Long-term liabilities associated with discontinued operations |
|
|
|
|
|
|
|
|
|
Deferred income taxes |
|
|
— |
|
|
|
|
|
|
Stockholders' equity: |
|
|
|
|
|
|
|
|
|
Common stock, $ |
|
|
|
|
|
|
|
|
|
Additional paid-in capital |
|
|
|
|
|
|
|
|
|
Retained earnings |
|
|
|
|
|
|
|
|
|
Accumulated other comprehensive loss |
|
|
( |
) |
|
|
( |
) |
|
Total stockholders’ equity attributable to Devon |
|
|
|
|
|
|
|
|
|
Noncontrolling interests |
|
|
|
|
|
|
|
|
|
Total equity |
|
|
|
|
|
|
|
|
|
Total liabilities and equity |
|
$ |
|
|
|
$ |
|
|
See accompanying notes to consolidated financial statements
8
DEVON ENERGY CORPORATION AND SUBSIDIARIES
CONSOLIDATED STATEMENTS OF EQUITY
|
|
|
|
|
|
|
|
|
|
|
|
|
|
|
Retained |
|
|
Other |
|
|
|
|
|
|
|
|
|
|
|
|
|
||
|
|
|
|
|
|
|
|
|
|
|
Additional |
|
|
Earnings |
|
|
Comprehensive |
|
|
|
|
|
|
|
|
|
|
|
|
|
|||
|
|
|
Common Stock |
|
|
Paid-In |
|
|
(Accumulated |
|
|
Earnings |
|
|
Treasury |
|
|
Noncontrolling |
|
|
Total |
|
|||||||||||
|
|
|
Shares |
|
|
Amount |
|
|
Capital |
|
|
Deficit) |
|
|
(Loss) |
|
|
Stock |
|
|
Interests |
|
|
Equity |
|
||||||||
|
|
|
(Unaudited) |
|
|||||||||||||||||||||||||||||
|
Three Months Ended March 31, 2020 |
|
|
|
|
|
|
|
|
|
|
|
|
|
|
|
|
|
|
|
|
|
|
|
|
|
|
|
|
|
|
|
|
|
Balance as of December 31, 2019 |
|
|
|
|
|
$ |
|
|
|
$ |
|
|
|
$ |
|
|
|
$ |
( |
) |
|
$ |
— |
|
|
$ |
|
|
|
$ |
|
|
|
Net earnings (loss) |
|
|
— |
|
|
|
— |
|
|
|
— |
|
|
|
( |
) |
|
|
— |
|
|
|
— |
|
|
|
|
|
|
|
( |
) |
|
Other comprehensive earnings, net of tax |
|
|
— |
|
|
|
— |
|
|
|
— |
|
|
|
— |
|
|
|
|
|
|
|
— |
|
|
|
— |
|
|
|
|
|
|
Restricted stock grants, net of cancellations |
|
|
|
|
|
|
— |
|
|
|
— |
|
|
|
— |
|
|
|
— |
|
|
|
— |
|
|
|
— |
|
|
|
— |
|
|
Common stock repurchased |
|
|
— |
|
|
|
— |
|
|
|
— |
|
|
|
— |
|
|
|
— |
|
|
|
( |
) |
|
|
— |
|
|
|
( |
) |
|
Common stock retired |
|
|
( |
) |
|
|
— |
|
|
|
( |
) |
|
|
— |
|
|
|
— |
|
|
|
|
|
|
|
— |
|
|
|
— |
|
|
Common stock dividends |
|
|
— |
|
|
|
— |
|
|
|
— |
|
|
|
( |
) |
|
|
— |
|
|
|
— |
|
|
|
— |
|
|
|
( |
) |
|
Share-based compensation |
|
|
|
|
|
|
— |
|
|
|
|
|
|
|
— |
|
|
|
— |
|
|
|
— |
|
|
|
— |
|
|
|
|
|
|
Contributions from noncontrolling interests |
|
|
— |
|
|
|
— |
|
|
|
— |
|
|
|
— |
|
|
|
— |
|
|
|
— |
|
|
|
|
|
|
|
|
|
|
Distributions to noncontrolling interests |
|
|
— |
|
|
|
— |
|
|
|
— |
|
|
|
— |
|
|
|
— |
|
|
|
— |
|
|
|
( |
) |
|
|
( |
) |
|
Balance as of March 31, 2020 |
|
|
|
|
|
$ |
|
|
|
$ |
|
|
|
$ |
|
|
|
$ |
( |
) |
|
$ |
— |
|
|
$ |
|
|
|
$ |
|
|
|
Three Months Ended March 31, 2019 |
|
|
|
|
|
|
|
|
|
|
|
|
|
|
|
|
|
|
|
|
|
|
|
|
|
|
|
|
|
|
|
|
|
Balance as of December 31, 2018 |
|
|
|
|
|
$ |
|
|
|
$ |
|
|
|
$ |
|
|
|
$ |
|
|
|
$ |
( |
) |
|
$ |
— |
|
|
$ |
|
|
|
Effect of adoption of lease accounting |
|
|
— |
|
|
|
— |
|
|
|
— |
|
|
|
( |
) |
|
|
— |
|
|
|
— |
|
|
|
— |
|
|
|
( |
) |
|
Net loss |
|
|
— |
|
|
|
— |
|
|
|
— |
|
|
|
( |
) |
|
|
— |
|
|
|
— |
|
|
|
— |
|
|
|
( |
) |
|
Other comprehensive earnings, net of tax |
|
|
— |
|
|
|
— |
|
|
|
— |
|
|
|
— |
|
|
|
|
|
|
|
— |
|
|
|
— |
|
|
|
|
|
|
Restricted stock grants, net of cancellations |
|
|
|
|
|
|
— |
|
|
|
— |
|
|
|
— |
|
|
|
— |
|
|
|
— |
|
|
|
— |
|
|
|
— |
|
|
Common stock repurchased |
|
|
— |
|
|
|
— |
|
|
|
— |
|
|
|
— |
|
|
|
— |
|
|
|
( |
) |
|
|
— |
|
|
|
( |
) |
|
Common stock retired |
|
|
( |
) |
|
|
( |
) |
|
|
( |
) |
|
|
— |
|
|
|
— |
|
|
|
|
|
|
|
— |
|
|
|
— |
|
|
Common stock dividends |
|
|
— |
|
|
|
— |
|
|
|
— |
|
|
|
( |
) |
|
|
— |
|
|
|
— |
|
|
|
— |
|
|
|
( |
) |
|
Share-based compensation |
|
|
— |
|
|
|
— |
|
|
|
|
|
|
|
— |
|
|
|
— |
|
|
|
— |
|
|
|
— |
|
|
|
|
|
|
Balance as of March 31, 2019 |
|
|
|
|
|
$ |
|
|
|
$ |
|
|
|
$ |
|
|
|
$ |
|
|
|
$ |
( |
) |
|
$ |
— |
|
|
$ |
|
|
See accompanying notes to consolidated financial statements
9
DEVON ENERGY CORPORATION AND SUBSIDIARIES
NOTES TO CONSOLIDATED FINANCIAL STATEMENTS
(Unaudited)
|
1. |
Summary of Significant Accounting Policies |
The accompanying unaudited interim financial statements and notes of Devon have been prepared pursuant to the rules and regulations of the SEC. Pursuant to such rules and regulations, certain disclosures normally included in financial statements prepared in accordance with U.S. GAAP have been omitted. The accompanying unaudited interim financial statements and notes should be read in conjunction with the financial statements and notes included in Devon’s 2019 Annual Report on Form 10-K.
The accompanying unaudited interim financial statements in this report reflect all adjustments that are, in the opinion of management, necessary for a fair statement of Devon’s results of operations and cash flows for the three-month periods ended March 31, 2020 and 2019 and Devon’s financial position as of March 31, 2020. As further discussed in Note 17, Devon reached an agreement to sell its Barnett Shale assets in December 2019, which was amended in April 2020, and sold its Canadian operations on June 27, 2019. Activity relating to Devon’s Barnett Shale assets, inclusive of properties divested as partial sales of the Barnett Shale common operating field in previous reporting periods located primarily in Johnson and Wise counties, Texas, and its Canadian operations are classified as discontinued operations within Devon’s consolidated statements of comprehensive earnings and consolidated statements of cash flows. The associated assets and liabilities of Devon’s Barnett Shale assets and Canadian operations are presented as assets and liabilities associated with discontinued operations on the consolidated balance sheets.
During the fourth quarter of 2019, Devon entered into an agreement to form Cotton Draw Midstream, L.L.C. (“CDM”), a joint-venture entity in the Delaware Basin with an affiliate of QL Capital Partners, LP (“QLCP”). Devon holds a controlling interest in CDM and the portions of CDM’s net earnings and equity not attributable to Devon’s controlling interest are shown separately as noncontrolling interests in the accompanying consolidated statements of comprehensive earnings and consolidated balance sheets. CDM is considered a VIE to Devon. The assets of CDM cannot be used by Devon for general corporate purposes and are included in and disclosed parenthetically on Devon's consolidated balance sheets. The carrying amount of liabilities related to CDM for which the creditors do not have recourse to Devon's assets are also included in, and disclosed parenthetically, on Devon's consolidated balance sheets if material.
Disaggregation of Revenue
The following table presents revenue from contracts with customers that are disaggregated based on the type of good or service.
|
|
|
Three Months Ended March 31, |
|
|||||
|
|
|
2020 |
|
|
2019 |
|
||
|
Oil |
|
$ |
|
|
|
$ |
|
|
|
Gas |
|
|
|
|
|
|
|
|
|
NGL |
|
|
|
|
|
|
|
|
|
Oil, gas and NGL revenues from contracts with customers |
|
|
|
|
|
|
|
|
|
Oil, gas and NGL derivatives |
|
|
|
|
|
|
( |
) |
|
Upstream revenues |
|
|
|
|
|
|
|
|
|
|
|
|
|
|
|
|
|
|
|
Oil |
|
|
|
|
|
|
|
|
|
Gas |
|
|
|
|
|
|
|
|
|
NGL |
|
|
|
|
|
|
|
|
|
Total marketing revenues |
|
|
|
|
|
|
|
|
|
Midstream revenues |
|
|
|
|
|
|
— |
|
|
Total marketing and midstream revenues from contracts with customers |
|
|
|
|
|
|
|
|
|
Total revenues |
|
$ |
|
|
|
$ |
|
|
10
DEVON ENERGY CORPORATION AND SUBSIDIARIES
NOTES TO CONSOLIDATED FINANCIAL STATEMENTS – (Continued)
(Unaudited)
Recently Adopted Accounting Standards
In 2016, the FASB issued ASU 2016-13, Financial Instruments-Credit Losses. This ASU changes the impairment model for trade receivables, held-to-maturity debt securities, net investments in leases, loans and other financial assets measured at amortized cost from the current “incurred loss” model to a new forward-looking “expected loss” model. Devon adopted this ASU in the first quarter of 2020 using the modified retrospective approach. Devon assesses credit risk by class of account type which includes cash equivalents and oil and gas, marketing and midstream, joint interest and other accounts receivable. These classes are then further evaluated using a probability weighted scenario assessment based on historical losses and a probability of future default. This evaluation is supported by an assessment of risk factors such as the age of receivable, current macro-economic conditions, credit rating of the counterparty and our historical loss rate. This adoption did not have a material impact on Devon’s consolidated financial statements.
2.Divestitures
Discontinued Operations – Upstream Assets
In June 2019, Devon completed the sale of substantially all of its oil and gas assets and operations in Canada to Canadian Natural Resources Limited for proceeds, net of purchase price adjustments, of $
Devon announced the sale of its Barnett Shale assets to BKV in December 2019 and subsequently amended the agreement in April 2020. Under the amended terms, Devon has agreed to sell its Barnett Shale assets for $
Continuing Operations – Upstream Assets
During the first quarter of 2020, Devon entered into a farmout agreement in which the third-party to the agreement can participate in the development of certain Devon-owned non-operated interests in the Delaware Basin. Under the agreement, Devon will periodically transfer working interests to the third party, who will then fund its share of operating and development costs. Once certain investment hurdles are met, a portion of the working interest held by the third party will revert back to Devon. No material activity occurred during the first quarter of 2020.
In the first quarter of 2019, Devon received proceeds of approximately $
3.Derivative Financial Instruments
Objectives and Strategies
Devon enters into derivative financial instruments with respect to a portion of its oil, gas and NGL production to hedge future prices received. Additionally, Devon periodically enters into derivative financial instruments with respect to a portion of its oil, gas and NGL marketing activities. These commodity derivative financial instruments include financial price swaps, basis swaps and costless price collars. Devon periodically enters into interest rate swaps to manage its exposure to interest rate volatility. As of March 31, 2020, Devon did not have any open interest rate swap contracts.
Devon does not intend to hold or issue derivative financial instruments for speculative trading purposes and has elected not to designate any of its derivative instruments for hedge accounting treatment.
Counterparty Credit Risk
By using derivative financial instruments, Devon is exposed to credit risk. Credit risk is the failure of the counterparty to perform under the terms of the derivative contract. To mitigate this risk, the hedging instruments are placed with a number of
11
DEVON ENERGY CORPORATION AND SUBSIDIARIES
NOTES TO CONSOLIDATED FINANCIAL STATEMENTS – (Continued)
(Unaudited)
counterparties whom Devon believes are acceptable credit risks. It is Devon’s policy to enter into derivative contracts only with investment-grade rated counterparties deemed by management to be competent and competitive market makers. Additionally, Devon’s derivative contracts generally contain provisions that provide for collateral payments if Devon’s or its counterparty’s credit rating falls below certain credit rating levels. As of March 31, 2020, Devon neither held cash collateral of its counterparties
Commodity Derivatives
As of March 31, 2020, Devon had the following open oil derivative positions. The first table presents Devon’s oil derivatives that settle against the average of the prompt month NYMEX WTI futures price. The second table presents Devon’s oil derivatives that settle against the respective indices noted within the table.
|
|
|
Price Swaps |
|
|
Price Collars |
|
||||||||||||||
|
Period |
|
Volume (Bbls/d) |
|
|
Weighted Average Price ($/Bbl) |
|
|
Volume (Bbls/d) |
|
|
Weighted Average Floor Price ($/Bbl) |
|
|
Weighted Average Ceiling Price ($/Bbl) |
|
|||||
|
Q2-Q4 2020 |
|
|
|
|
|
$ |
|
|
|
|
|
|
|
$ |
|
|
|
$ |
|
|
|
Q1-Q4 2021 |
|
|
|
|
|
$ |
|
|
|
|
|
|
|
$ |
|
|
|
$ |
|
|
|
|
|
Oil Basis Swaps |
|
|||||||
|
Period |
|
Index |
|
Volume (Bbls/d) |
|
|
Weighted Average Differential to WTI ($/Bbl) |
|
||
|
Q2-Q4 2020 |
|
Argus MEH |
|
|
|
|
|
$ |
|
|
|
Q2-Q4 2020 |
|
Midland Sweet |
|
|
|
|
|
$ |
( |
) |
|
Q2-Q4 2020 |
|
NYMEX Roll |
|
|
|
|
|
$ |
|
|
|
Q1-Q4 2021 |
|
Midland Sweet |
|
|
|
|
|
$ |
|
|
|
|
As of March 31, 2020, Devon had the following open natural gas derivative positions. The first table presents Devon’s natural gas derivatives that settle against the Inside FERC first of the month Henry Hub index. The second table presents Devon’s natural gas derivatives that settle against the respective indices noted within the table.
|
|
|
Price Swaps |
|
|
Price Collars |
|
||||||||||||||
|
Period |
|
Volume (MMBtu/d) |
|
|
Weighted Average Price ($/MMBtu) |
|
|
Volume (MMBtu/d) |
|
|
Weighted Average Floor Price ($/MMBtu) |
|
|
Weighted Average Ceiling Price ($/MMBtu) |
|
|||||
|
Q2-Q4 2020 |
|
|
|
|
|
$ |
|
|
|
|
|
|
|
$ |
|
|
|
$ |
|
|
|
Q1-Q4 2021 |
|
|
— |
|
|
$ |
— |
|
|
|
|
|
|
$ |
|
|
|
$ |
|
|
|
|
|
Natural Gas Basis Swaps |
|
|||||||
|
Period |
|
Index |
|
Volume (MMBtu/d) |
|
|
Weighted Average Differential to Henry Hub ($/MMBtu) |
|
||
|
Q2-Q4 2020 |
|
Panhandle Eastern Pipe Line |
|
|
|
|
|
$ |
( |
) |
|
Q2-Q4 2020 |
|
El Paso Natural Gas |
|
|
|
|
|
$ |
( |
) |
|
Q2-Q4 2020 |
|
Houston Ship Channel |
|
|
|
|
|
$ |
( |
) |
|
Q1-Q4 2021 |
|
El Paso Natural Gas |
|
|
|
|
|
$ |
( |
) |
12
DEVON ENERGY CORPORATION AND SUBSIDIARIES
NOTES TO CONSOLIDATED FINANCIAL STATEMENTS – (Continued)
(Unaudited)
As of March 31, 2020, Devon had the following open NGL derivative positions. Devon’s NGL positions settle against the average of the prompt month OPIS Mont Belvieu, Texas index.
|
|
|
|
|
Price Swaps |
|
|||||
|
Period |
|
Product |
|
Volume (Bbls/d) |
|
|
Weighted Average Price ($/Bbl) |
|
||
|
Q2-Q4 2020 |
|
Ethane |
|
|
|
|
|
$ |
|
|
|
Q2-Q4 2020 |
|
Natural Gasoline |
|
|
|
|
|
$ |
|
|
|
Q2-Q4 2020 |
|
Normal Butane |
|
|
|
|
|
$ |
|
|
|
Q2-Q4 2020 |
|
Propane |
|
|
|
|
|
$ |
|
|
Financial Statement Presentation
The following table presents the net gains and losses by derivative financial instrument type followed by the corresponding individual consolidated statements of comprehensive earnings caption.
|
|
|
Three Months Ended March 31, |
|
|
|||||
|
|
|
2020 |
|
|
2019 |
|
|
||
|
Commodity derivatives: |
|
|
|
|
|
|
|
|
|
|
Upstream revenues |
|
$ |
|
|
|
$ |
( |
) |
|
|
Marketing and midstream revenues |
|
|
— |
|
|
|
|
|
|
|
Net gains (losses) recognized |
|
$ |
|
|
|
$ |
( |
) |
|
The following table presents the derivative fair values by derivative financial instrument type followed by the corresponding individual consolidated balance sheets caption.
|
|
|
March 31, 2020 |
|
|
December 31, 2019 |
|
||
|
Commodity derivative assets: |
|
|
|
|
|
|
|
|
|
Other current assets |
|
$ |
|
|
|
$ |
|
|
|
Other long-term assets |
|
|
|
|
|
|
|
|
|
Total derivative assets |
|
$ |
|
|
|
$ |
|
|
|
Commodity derivative liabilities: |
|
|
|
|
|
|
|
|
|
Other current liabilities |
|
$ |
— |
|
|
$ |
|
|
|
Other long-term liabilities |
|
|
|
|
|
|
|
|
|
Total derivative liabilities |
|
$ |
|
|
|
$ |
|
|
13
DEVON ENERGY CORPORATION AND SUBSIDIARIES
NOTES TO CONSOLIDATED FINANCIAL STATEMENTS – (Continued)
(Unaudited)
4.Share-Based Compensation
The table below presents the share-based compensation expense included in Devon’s accompanying consolidated statements of comprehensive earnings. The vesting for certain share-based awards was accelerated in conjunction with the reduction of workforce described in Note 6 and is included in restructuring and transaction costs in the accompanying consolidated statements of comprehensive earnings.
|
|
|
Three Months Ended March 31st, |
|
|||||
|
|
|
2020 |
|
|
2019 |
|
||
|
G&A |
|
$ |
|
|
|
$ |
|
|
|
Restructuring and transaction costs |
|
|
— |
|
|
|
|
|
|
Total |
|
$ |
|
|
|
$ |
|
|
|
Related income tax benefit |
|
$ |
— |
|
|
$ |
|
|
Under its approved long-term incentive plan, Devon granted share-based awards to certain employees in the first three months of 2020. The following table presents a summary of Devon’s unvested restricted stock awards, performance-based restricted stock awards and performance share units granted under the plan.
|
|
|
|
|
|
Performance-Based |
|
|
Performance |
|
||||||||||||||||||
|
|
|
Restricted Stock Awards |
|
|
Restricted Stock Awards |
|
|
Share Units |
|
||||||||||||||||||
|
|
|
Awards |
|
|
Weighted Average Grant-Date Fair Value |
|
|
Awards |
|
|
Weighted Average Grant-Date Fair Value |
|
|
Units |
|
|
|
|
|
Weighted Average Grant-Date Fair Value |
|
||||||
|
|
|
(Thousands, except fair value data) |
|
||||||||||||||||||||||||
|
Unvested at 12/31/19 |
|
|
|
|
|
$ |
|
|
|
|
|
|
|
$ |
|
|
|
|
|
|
|
|
|
|
$ |
|
|
|
Granted |
|
|
|
|
|
$ |
|
|
|
|
— |
|
|
$ |
— |
|
|
|
|
|
|
|
|
|
$ |
|
|
|
Vested |
|
|
( |
) |
|
$ |
|
|
|
|
( |
) |
|
$ |
|
|
|
|
( |
) |
|
|
|
|
$ |
|
|
|
Forfeited |
|
|
( |
) |
|
$ |
|
|
|
|
— |
|
|
$ |
— |
|
|
|
( |
) |
|
|
|
|
$ |
|
|
|
Unvested at 3/31/20 |
|
|
|
|
|
$ |
|
|
|
|
|
|
|
$ |
|
|
|
|
|
|
|
(1 |
) |
|
$ |
|
|
|
(1) |
|
The following table presents the assumptions related to the performance share units granted in 2020, as indicated in the previous summary table.
|
|
|
2020 |
|
|
|
Grant-date fair value |
|
$ |
|
|
|
Risk-free interest rate |
|
|
|
|
|
Volatility factor |
|
|
|
|
|
Contractual term (years) |
|
|
|
|
The following table presents a summary of the unrecognized compensation cost and the related weighted average recognition period associated with unvested awards and units as of March 31, 2020.
|
|
|
|
|
|
|
Performance-Based |
|
|
|
|
|
|
|
|
|
Restricted Stock |
|
|
Restricted Stock |
|
|
Performance |
|
|||
|
|
|
Awards |
|
|
Awards |
|
|
Share Units |
|
|||
|
Unrecognized compensation cost |
|
$ |
|
|
|
$ |
— |
|
|
$ |
|
|
|
Weighted average period for recognition (years) |
|
|
|
|
|
|
|
|
|
|
|
|
14
DEVON ENERGY CORPORATION AND SUBSIDIARIES
NOTES TO CONSOLIDATED FINANCIAL STATEMENTS – (Continued)
(Unaudited)
5.Asset Impairments
|
|
|
Three Months Ended March 31, |
|
|||||
|
|
|
2020 |
|
|
2019 |
|
||
|
Proved oil and gas assets |
|
$ |
|
|
|
$ |
— |
|
|
Other assets |
|
|
|
|
|
|
— |
|
|
Total asset impairments |
|
$ |
|
|
|
$ |
— |
|
|
|
|
|
|
|
|
|
|
|
|
Unproved impairments |
|
$ |
|
|
|
$ |
|
|
Proved Oil and Gas and Other Asset Impairments
Reduced demand from the COVID-19 pandemic caused an unprecedented downturn in the price of oil. As a result, Devon reduced planned 2020 capital investment by
Devon recognized approximately $
Unproved Impairments
Due to the recent downturn in the commodity price environment and reduced near-term investment as discussed above, Devon also recognized $
6.Restructuring and Transaction Costs
During the first quarter of 2019, Devon announced workforce reductions and other initiatives designed to enhance its operational focus and cost structure in conjunction with the portfolio transformation announcement further discussed in Note 2. As a result, Devon recognized $
15
DEVON ENERGY CORPORATION AND SUBSIDIARIES
NOTES TO CONSOLIDATED FINANCIAL STATEMENTS – (Continued)
(Unaudited)
The following table summarizes Devon’s restructuring liabilities.
|
|
|
Other |
|
|
Other |
|
|
|
|
|
||
|
|
|
Current |
|
|
Long-term |
|
|
|
|
|
||
|
|
|
Liabilities |
|
|
Liabilities |
|
|
Total |
|
|||
|
|
|
(Millions) |
|
|||||||||
|
Balance as of December 31, 2019 |
|
$ |
|
|
|
$ |
|
|
|
$ |
|
|
|
Changes related to prior years' restructurings |
|
|
( |
) |
|
|
— |
|
|
|
( |
) |
|
Balance as of March 31, 2020 |
|
$ |
|
|
|
$ |
|
|
|
$ |
|
|
|
|
|
|
|
|
|
|
|
|
|
|
|
|
|
Balance as of December 31, 2018 |
|
$ |
|
|
|
$ |
|
|
|
$ |
|
|
|
Changes related to prior years' restructurings |
|
|
|
|
|
|
( |
) |
|
|
|
|
|
Balance as of March 31, 2019 |
|
$ |
|
|
|
$ |
|
|
|
$ |
|
|
7.Income Taxes
The following table presents Devon’s total income tax expense (benefit) and a reconciliation of its effective income tax rate to the U.S. statutory income tax rate.
|
|
|
Three Months Ended March 31, |
|
|||||
|
|
|
2020 |
|
|
2019 |
|
||
|
Loss from continuing operations before income taxes |
|
$ |
( |
) |
|
$ |
( |
) |
|
|
|
|
|
|
|
|
|
|
|
Current income tax benefit |
|
$ |
( |
) |
|
$ |
( |
) |
|
Deferred income tax benefit |
|
|
( |
) |
|
|
( |
) |
|
Total income tax benefit |
|
$ |
( |
) |
|
$ |
( |
) |
|
|
|
|
|
|
|
|
|
|
|
U.S. statutory income tax rate |
|
|
|
% |
|
|
|
% |
|
State income taxes |
|
|
|
% |
|
|
|
% |
|
Change in tax legislation |
|
|
|
% |
|
|
|
% |
|
Other |
|
|
( |
%) |
|
|
( |
%) |
|
Deferred tax asset valuation allowance |
|
|
( |
%) |
|
|
|
% |
|
Effective income tax rate |
|
|
|
% |
|
|
|
% |
Devon estimates its annual effective income tax rate to record its quarterly provision for income taxes in the various jurisdictions in which it operates. Statutory tax rate changes and other significant or unusual items are recognized as discrete items in the quarter in which they occur.
The Coronavirus Aid, Relief, and Economic Security Act (“CARES Act”) became law on March 27, 2020. The CARES Act allows net operating losses generated in taxable years beginning after December 31, 2017 and before January 1, 2021 to be carried back five years to offset taxable income and generate a refund. Devon intends to carry net operating losses generated in 2019 and 2020 back to 2014 and 2015, respectively. As a result, Devon recorded a $
Throughout 2019, Devon maintained a valuation allowance against certain deferred tax assets, including certain tax credits and state net operating losses. Since then, reduced demand from the COVID-19 pandemic has caused an unprecedented downturn in the commodity price environment. As a result, Devon recorded significant impairments during the first quarter of 2020 and is now in a net deferred tax asset position. Devon reassessed its position and recorded a
Included in “other” in the table above is the impact of increasing Devon’s unrecognized tax benefits by approximately $
16
DEVON ENERGY CORPORATION AND SUBSIDIARIES
NOTES TO CONSOLIDATED FINANCIAL STATEMENTS – (Continued)
(Unaudited)
|
8. |
Net Earnings (Loss) Per Share from Continuing Operations |
The following table reconciles net earnings (loss) from continuing operations and weighted-average common shares outstanding used in the calculations of basic and diluted net earnings (loss) per share from continuing operations.
|
|
|
Three Months Ended March 31, |
|
|||||
|
|
|
2020 |
|
|
2019 |
|
||
|
Net loss from continuing operations: |
|
|
|
|
|
|
|
|
|
Net loss from continuing operations |
|
$ |
( |
) |
|
$ |
( |
) |
|
Attributable to participating securities |
|
|
( |
) |
|
|
— |
|
|
Basic and diluted loss from continuing operations |
|
$ |
( |
) |
|
$ |
( |
) |
|
Common shares: |
|
|
|
|
|
|
|
|
|
Common shares outstanding - total |
|
|
|
|
|
|
|
|
|
Attributable to participating securities |
|
|
( |
) |
|
|
( |
) |
|
Common shares outstanding - basic and diluted |
|
|
|
|
|
|
|
|
|
Net loss per share from continuing operations: |
|
|
|
|
|
|
|
|
|
Basic |
|
$ |
( |
) |
|
$ |
( |
) |
|
Diluted |
|
$ |
( |
) |
|
$ |
( |
) |
|
Antidilutive options (1) |
|
|
— |
|
|
|
|
|
|
(1) |
|
|
9. |
Other Comprehensive Earnings (Loss) |
Components of other comprehensive earnings (loss) consist of the following:
|
|
|
Three Months Ended March 31, |
|
|||||
|
|
|
2020 |
|
|
2019 |
|
||
|
Foreign currency translation: |
|
|
|
|
|
|
|
|
|
Beginning accumulated foreign currency translation and other |
|
$ |
— |
|
|
$ |
|
|
|
Change in cumulative translation adjustment |
|
|
— |
|
|
|
|
|
|
Ending accumulated foreign currency translation and other |
|
|
— |
|
|
|
|
|
|
Pension and postretirement benefit plans: |
|
|
|
|
|
|
|
|
|
Beginning accumulated pension and postretirement benefits |
|
|
( |
) |
|
|
( |
) |
|
Recognition of net actuarial loss and prior service cost in earnings (1) |
|
|
|
|
|
|
|
|
|
Income tax expense |
|
|
( |
) |
|
|
( |
) |
|
Ending accumulated pension and postretirement benefits |
|
|
( |
) |
|
|
( |
) |
|
Accumulated other comprehensive earnings (loss), net of tax |
|
$ |
( |
) |
|
$ |
|
|
|
(1) |
|
17
DEVON ENERGY CORPORATION AND SUBSIDIARIES
NOTES TO CONSOLIDATED FINANCIAL STATEMENTS – (Continued)
(Unaudited)
|
10. |
Supplemental Information to Statements of Cash Flows |
|
|
|
Three Months Ended March 31, |
|
|||||
|
|
|
2020 |
|
|
2019 |
|
||
|
Changes in assets and liabilities, net: |
|
|
|
|
|
|
|
|
|
Accounts receivable |
|
$ |
|
|
|
$ |
( |
) |
|
Income tax receivable |
|
|
( |
) |
|
|
— |
|
|
Other current assets |
|
|
( |
) |
|
|
|
|
|
Other long-term assets |
|
|
( |
) |
|
|
( |
) |
|
Accounts payable |
|
|
|
|
|
|
( |
) |
|
Revenues and royalties payable |
|
|
( |
) |
|
|
|
|
|
Other current liabilities |
|
|
( |
) |
|
|
( |
) |
|
Other long-term liabilities |
|
|
|
|
|
|
( |
) |
|
Total |
|
$ |
( |
) |
|
$ |
( |
) |
|
Supplementary cash flow data - total operations: |
|
|
|
|
|
|
|
|
|
Interest paid (net of capitalized interest) |
|
$ |
|
|
|
$ |
|
|
|
Income taxes paid |
|
$ |
|
|
|
$ |
|
|
|
11. |
Accounts Receivable |
Components of accounts receivable include the following:
|
|
|
March 31, 2020 |
|
|
December 31, 2019 |
|
||
|
Oil, gas and NGL sales |
|
$ |
|
|
|
$ |
|
|
|
Joint interest billings |
|
|
|
|
|
|
|
|
|
Marketing and midstream revenues |
|
|
|
|
|
|
|
|
|
Other |
|
|
|
|
|
|
|
|
|
Gross accounts receivable |
|
|
|
|
|
|
|
|
|
Allowance for doubtful accounts |
|
|
( |
) |
|
|
( |
) |
|
Net accounts receivable |
|
$ |
|
|
|
$ |
|
|
12.Property, Plant and Equipment
The following table presents the aggregate capitalized costs related to Devon’s oil and gas and non-oil and gas activities.
|
|
|
March 31, 2020 |
|
|
December 31, 2019 |
|
||
|
Property and equipment: |
|
|
|
|
|
|
|
|
|
Proved |
|
$ |
|
|
|
$ |
|
|
|
Unproved and properties under development |
|
|
|
|
|
|
|
|
|
Total oil and gas |
|
|
|
|
|
|
|
|
|
Less accumulated DD&A |
|
|
( |
) |
|
|
( |
) |
|
Oil and gas property and equipment, net |
|
|
|
|
|
|
|
|
|
Other property and equipment |
|
|
|
|
|
|
|
|
|
Less accumulated DD&A |
|
|
( |
) |
|
|
( |
) |
|
Other property and equipment, net (1) |
|
|
|
|
|
|
|
|
|
Property and equipment, net |
|
$ |
|
|
|
$ |
|
|
|
|
(1) |
|
During the first quarter of 2020, Devon recognized asset impairments of $
18
DEVON ENERGY CORPORATION AND SUBSIDIARIES
NOTES TO CONSOLIDATED FINANCIAL STATEMENTS – (Continued)
(Unaudited)
|
13. |
Debt and Related Expenses |
See below for a summary of debt instruments and balances. The notes and debentures are senior, unsecured obligations of Devon.
|
|
|
March 31, 2020 |
|
|
December 31, 2019 |
|
||
|
|
|
|
|
|
|
|
|
|
|
|
|
$ |
|
|
|
$ |
|
|
|
|
|
|
|
|
|
|
|
|
|
|
|
|
|
|
|
|
|
|
|
|
|
|
|
|
|
|
|
|
|
|
|
|
|
|
|
|
|
|
|
|
|
|
|
|
|
|
|
|
|
|
|
|
|
|
|
|
|
|
|
Net discount on debentures and notes |
|
|
( |
) |
|
|
( |
) |
|
Debt issuance costs |
|
|
( |
) |
|
|
( |
) |
|
Total long-term debt |
|
$ |
|
|
|
$ |
|
|
Devon has a $
Retirement of Senior Notes
In January 2019, Devon repaid the $
Net Financing Costs
The following schedule includes the components of net financing costs.
|
|
|
Three Months Ended March 31, |
|
|||||
|
|
|
2020 |
|
|
2019 |
|
||
|
Interest based on debt outstanding |
|
$ |
|
|
|
$ |
|
|
|
Interest income |
|
|
( |
) |
|
|
( |
) |
|
Other |
|
|
|
|
|
|
|
|
|
Total net financing costs |
|
$ |
|
|
|
$ |
|
|
14.Leases
The following table presents Devon’s right-of-use assets and lease liabilities as of March 31, 2020 and December 31, 2019.
|
|
|
March 31, 2020 |
|
|
December 31, 2019 |
|
||||||||||||||||||
|
|
|
Finance |
|
|
Operating |
|
|
Total |
|
|
Finance |
|
|
Operating |
|
|
Total |
|
||||||
|
Right-of-use assets |
|
$ |
|
|
|
$ |
|
|
|
$ |
|
|
|
$ |
|
|
|
$ |
|
|
|
$ |
|
|
|
Lease liabilities: |
|
|
|
|
|
|
|
|
|
|
|
|
|
|
|
|
|
|
|
|
|
|
|
|
|
Current lease liabilities (1) |
|
$ |
|
|
|
$ |
|
|
|
$ |
|
|
|
$ |
|
|
|
$ |
|
|
|
$ |
|
|
|
Long-term lease liabilities |
|
|
|
|
|
|
|
|
|
|
|
|
|
|
|
|
|
|
|
|
|
|
|
|
|
Total lease liabilities |
|
$ |
|
|
|
$ |
|
|
|
$ |
|
|
|
$ |
|
|
|
$ |
|
|
|
$ |
|
|
|
|
(1) |
|
Devon’s right-of-use operating lease assets are for certain leases related to real estate, drilling rigs and other equipment related to the exploration, development and production of oil and gas. Devon’s right-of-use financing lease assets are related to real estate.
19
DEVON ENERGY CORPORATION AND SUBSIDIARIES
NOTES TO CONSOLIDATED FINANCIAL STATEMENTS – (Continued)
(Unaudited)
|
15. |
Asset Retirement Obligations |
The following table presents the changes in Devon’s asset retirement obligations.
|
|
|
Three Months Ended March 31, |
|
|||||
|
|
|
2020 |
|
|
2019 |
|
||
|
Asset retirement obligations as of beginning of period |
|
$ |
|
|
|
$ |
|
|
|
Liabilities incurred |
|
|
|
|
|
|
|
|
|
Liabilities settled and divested |
|
|
( |
) |
|
|
( |
) |
|
Revision of estimated obligation |
|
|
|
|
|
|
( |
) |
|
Accretion expense on discounted obligation |
|
|
|
|
|
|
|
|
|
Asset retirement obligations as of end of period |
|
|
|
|
|
|
|
|
|
Less current portion |
|
|
|
|
|
|
|
|
|
Asset retirement obligations, long-term |
|
$ |
|
|
|
$ |
|
|
During the first three months of 2019, Devon reduced its asset retirement obligations by $
|
16. |
Stockholders’ Equity |
Share Repurchase Programs
In March 2018, Devon announced a $
The table below provides information regarding purchases of Devon’s common stock that were made under the respective share repurchase programs (shares in thousands).
|
|
|
Total Number of Shares Purchased |
|
|
Dollar Value of Shares Purchased |
|
|
Average Price Paid per Share |
|
|||
|
$5.0 Billion Plan |
|
|
|
|
|
|
|
|
|
|
|
|
|
Full year 2018 |
|
|
|
|
|
$ |
|
|
|
$ |
|
|
|
First quarter 2019 |
|
|
|
|
|
|
|
|
|
|
|
|
|
Second quarter 2019 |
|
|
|
|
|
|
|
|
|
|
|
|
|
Third quarter 2019 |
|
|
|
|
|
|
|
|
|
|
|
|
|
Fourth quarter 2019 |
|
|
|
|
|
|
|
|
|
|
|
|
|
Total inception-to-date |
|
|
|
|
|
$ |
|
|
|
$ |
|
|
|
|
|
|
|
|
|
|
|
|
|
|
|
|
|
$1.0 Billion Plan |
|
|
|
|
|
|
|
|
|
|
|
|
|
First quarter 2020 |
|
|
|
|
|
$ |
|
|
|
$ |
|
|
|
Total inception-to-date |
|
|
|
|
|
$ |
|
|
|
$ |
|
|
Dividends
Devon paid common stock dividends of $
20
DEVON ENERGY CORPORATION AND SUBSIDIARIES
NOTES TO CONSOLIDATED FINANCIAL STATEMENTS – (Continued)
(Unaudited)
share, beginning in the second quarter of 2020. In the second quarter of 2019, Devon raised its quarterly dividend from $
|
17. |
Discontinued Operations and Assets Held For Sale |
Barnett Shale
In 2019, Devon announced that it had entered into an agreement to sell its Barnett Shale assets to BKV and subsequently amended the agreement in April 2020. Under the amended terms, Devon has agreed to sell its Barnett Shale assets for $
In connection with the announced sale of its Barnett Shale assets, approximately $
As of March 31, 2020, Devon has restricted approximately $
Canada
On
During the third quarter of 2019, Devon utilized a portion of the sales proceeds to early retire its $
As of March 31, 2020, $
21
DEVON ENERGY CORPORATION AND SUBSIDIARIES
NOTES TO CONSOLIDATED FINANCIAL STATEMENTS – (Continued)
(Unaudited)
The following table presents the amounts reported in the consolidated statements of comprehensive earnings as discontinued operations.
|
Three Months Ended March 31, |
|
Barnett Shale |
|
|
Canada |
|
|
Total |
|
|||
|
2020 |
|
|
|
|
|
|
|
|
|
|
|
|
|
Upstream revenues |
|
$ |
|
|
|
$ |
— |
|
|
$ |
|
|
|
Total revenues |
|
|
|
|
|
|
— |
|
|
|
|
|
|
Production expenses |
|
|
|
|
|
|
— |
|
|
|
|
|
|
Asset impairments |
|
|
|
|
|
|
— |
|
|
|
|
|
|
General and administrative expenses |
|
|
— |
|
|
|
|
|
|
|
|
|
|
Financing costs, net |
|
|
— |
|
|
|
( |
) |
|
|
( |
) |
|
Other expenses |
|
|
( |
) |
|
|
|
|
|
|
( |
) |
|
Total expenses |
|
|
|
|
|
|
|
|
|
|
|
|
|
Loss from discontinued operations before income taxes |
|
|
( |
) |
|
|
( |
) |
|
|
( |
) |
|
Income tax benefit |
|
|
( |
) |
|
|
— |
|
|
|
( |
) |
|
Net loss from discontinued operations, net of tax |
|
$ |
( |
) |
|
$ |
( |
) |
|
$ |
( |
) |
|
2019 |
|
|
|
|
|
|
|
|
|
|
|
|
|
Upstream revenues |
|
$ |
|
|
|
$ |
|
|
|
$ |
|
|
|
Marketing and midstream revenues |
|
|
— |
|
|
|
|
|
|
|
|
|
|
Total revenues |
|
|
|
|
|
|
|
|
|
|
|
|
|
Production expenses |
|
|
|
|
|
|
|
|
|
|
|
|
|
Exploration expenses |
|
|
— |
|
|
|
|
|
|
|
|
|
|
Marketing and midstream expenses |
|
|
— |
|
|
|
|
|
|
|
|
|
|
Depreciation, depletion and amortization |
|
|
|
|
|
|
|
|
|
|
|
|
|
Asset dispositions |
|
|
|
|
|
|
— |
|
|
|
|
|
|
General and administrative expenses |
|
|
— |
|
|
|
|
|
|
|
|
|
|
Financing costs, net |
|
|
— |
|
|
|
|
|
|
|
|
|
|
Restructuring and transaction costs |
|
|
— |
|
|
|
|
|
|
|
|
|
|
Other expenses |
|
|
|
|
|
|
( |
) |
|
|
( |
) |
|
Total expenses |
|
|
|
|
|
|
|
|
|
|
|
|
|
Earnings from discontinued operations before income taxes |
|
|
|
|
|
|
|
|
|
|
|
|
|
Income tax expense |
|
|
|
|
|
|
— |
|
|
|
|
|
|
Net earnings from discontinued operations, net of tax |
|
$ |
|
|
|
$ |
|
|
|
$ |
|
|
The following table presents the carrying amounts of the assets and liabilities associated with discontinued operations on the consolidated balance sheets.
|
|
|
As of March 31, 2020 |
|
|
As of December 31, 2019 |
|
||||||||||||||||||
|
|
|
Barnett Shale |
|
|
Canada |
|
|
Total |
|
|
Barnett Shale |
|
|
Canada |
|
|
Total |
|
||||||
|
Cash restricted for discontinued operations |
|
$ |
|
|
|
$ |
|
|
|
$ |
|
|
|
$ |
|
|
|
$ |
|
|
|
$ |
|
|
|
|
|
|
|
|
|
|
|
|
|
|
|
|
|
|
|
|
|
|
|
|
|
|
|
|
|
Accounts receivable |
|
$ |
|
|
|
$ |
|
|
|
$ |
|
|
|
$ |
|
|
|
$ |
|
|
|
$ |
|
|
|
Other current assets |
|
|
|
|
|
|
|
|
|
|
|
|
|
|
|
|
|
|
|
|
|
|
|
|
|
Oil and gas property and equipment, based on successful efforts accounting, net |
|
|
|
|
|
|
— |
|
|
|
|
|
|
|
|
|
|
|
— |
|
|
|
|
|
|
Other property and equipment, net |
|
|
|
|
|
|
— |
|
|
|
|
|
|
|
|
|
|
|
— |
|
|
|
|
|
|
Goodwill |
|
|
|
|
|
|
— |
|
|
|
|
|
|
|
|
|
|
|
— |
|
|
|
|
|
|
Other long-term assets |
|
|
— |
|
|
|
|
|
|
|
|
|
|
|
— |
|
|
|
|
|
|
|
|
|
|
Total assets associated with discontinued operations |
|
$ |
|
|
|
$ |
|
|
|
$ |
|
|
|
$ |
|
|
|
$ |
|
|
|
$ |
|
|
|
|
|
|
|
|
|
|
|
|
|
|
|
|
|
|
|
|
|
|
|
|
|
|
|
|
|
Accounts payable |
|
$ |
|
|
|
$ |
|
|
|
$ |
|
|
|
$ |
|
|
|
$ |
|
|
|
$ |
|
|
|
Revenues and royalties payable |
|
|
|
|
|
|
|
|
|
|
|
|
|
|
|
|
|
|
|
|
|
|
|
|
|
Other current liabilities |
|
|
|
|
|
|
|
|
|
|
|
|
|
|
|
|
|
|
|
|
|
|
|
|
|
Asset retirement obligations |
|
|
|
|
|
|
— |
|
|
|
|
|
|
|
|
|
|
|
— |
|
|
|
|
|
|
Other long-term liabilities |
|
|
|
|
|
|
|
|
|
|
|
|
|
|
|
|
|
|
|
|
|
|
|
|
|
Total liabilities associated with discontinued operations |
|
$ |
|
|
|
$ |
|
|
|
$ |
|
|
|
$ |
|
|
|
$ |
|
|
|
$ |
|
|
22
DEVON ENERGY CORPORATION AND SUBSIDIARIES
NOTES TO CONSOLIDATED FINANCIAL STATEMENTS – (Continued)
(Unaudited)
|
18. |
Commitments and Contingencies |
Devon is party to various legal actions arising in the normal course of business. Matters that are probable of an unfavorable outcome to Devon and which can be reasonably estimated are accrued. Such accruals are based on information known about the matters, Devon’s estimates of the outcomes of such matters and its experience in contesting, litigating and settling similar matters. None of the actions are believed by management to likely involve future amounts that would be material to Devon’s financial position or results of operations after consideration of recorded accruals. Actual amounts could differ materially from management’s estimates.
Royalty Matters
Numerous oil and natural gas producers and related parties, including Devon, have been named in various lawsuits alleging royalty underpayments. Devon is currently named as a defendant in a number of such lawsuits, including some lawsuits in which the plaintiffs seek to certify classes of similarly situated plaintiffs. Among the allegations typically asserted in these suits are claims that Devon used below-market prices, made improper deductions, used improper measurement techniques and entered into gas purchase and processing arrangements with affiliates that resulted in underpayment of royalties in connection with oil, natural gas and NGLs produced and sold. Devon is also involved in governmental agency proceedings and royalty audits and is subject to related contracts and regulatory controls in the ordinary course of business, some that may lead to additional royalty claims. Devon does not currently believe that it is subject to material exposure with respect to such royalty matters.
Environmental and Other Matters
Devon is subject to certain laws and regulations relating to environmental remediation activities associated with past operations, such as the Comprehensive Environmental Response, Compensation, and Liability Act and similar state statutes. In response to liabilities associated with these activities, loss accruals primarily consist of estimated uninsured remediation costs. Devon’s monetary exposure for environmental matters is not expected to be material.
Beginning in 2013, various parishes in Louisiana filed suit against more than
Various municipalities and other governmental and private parties in California have filed legal proceedings against certain oil and gas companies, including Devon, seeking relief to abate alleged impacts of climate change. These proceedings include far-reaching claims for monetary damages and injunctions against the production of all fossil fuels. Although Devon cannot predict the ultimate outcome of these matters, Devon believes these claims to be baseless and intends to vigorously defend against the proceedings.
23
DEVON ENERGY CORPORATION AND SUBSIDIARIES
NOTES TO CONSOLIDATED FINANCIAL STATEMENTS – (Continued)
(Unaudited)
|
19. |
Fair Value Measurements |
The following table provides carrying value and fair value measurement information for certain of Devon’s financial assets and liabilities. The carrying values of cash, cash restricted for discontinued operations, accounts receivable, other current receivables, accounts payable, other current payables, accrued expenses and lease liabilities included in the accompanying consolidated balance sheets approximated fair value at March 31, 2020 and December 31, 2019, as applicable. Therefore, such financial assets and liabilities are not presented in the following table.
|
|
|
|
|
|
|
|
|
|
|
Fair Value Measurements Using: |
|
|||||
|
|
|
Carrying |
|
|
Total Fair |
|
|
Level 1 |
|
|
Level 2 |
|
||||
|
|
|
Amount |
|
|
Value |
|
|
Inputs |
|
|
Inputs |
|
||||
|
March 31, 2020 assets (liabilities): |
|
|
|
|
|
|
|
|
|
|
|
|
|
|
|
|
|
Cash equivalents |
|
$ |
|
|
|
$ |
|
|
|
$ |
|
|
|
$ |
— |
|
|
Commodity derivatives |
|
$ |
|
|
|
$ |
|
|
|
$ |
— |
|
|
$ |
|
|
|
Commodity derivatives |
|
$ |
( |
) |
|
$ |
( |
) |
|
$ |
— |
|
|
$ |
( |
) |
|
Debt |
|
$ |
( |
) |
|
$ |
( |
) |
|
$ |
— |
|
|
$ |
( |
) |
|
December 31, 2019 assets (liabilities): |
|
|
|
|
|
|
|
|
|
|
|
|
|
|
|
|
|
Cash equivalents |
|
$ |
|
|
|
$ |
|
|
|
$ |
|
|
|
$ |
— |
|
|
Commodity derivatives |
|
$ |
|
|
|
$ |
|
|
|
$ |
— |
|
|
$ |
|
|
|
Commodity derivatives |
|
$ |
( |
) |
|
$ |
( |
) |
|
$ |
— |
|
|
$ |
( |
) |
|
Debt |
|
$ |
( |
) |
|
$ |
( |
) |
|
$ |
— |
|
|
$ |
( |
) |
The following methods and assumptions were used to estimate the fair values in the table above.
Level 1 Fair Value Measurements
Cash equivalents – Amounts consist primarily of money market investments and the fair value approximates the carrying value.
Level 2 Fair Value Measurements
Commodity derivatives – The fair value of commodity derivatives is estimated using internal discounted cash flow calculations based upon forward curves and data obtained from independent third parties for contracts with similar terms or data obtained from counterparties to the agreements.
Debt – Devon’s debt instruments do not actively trade in an established market. The fair values of its debt are estimated based on rates available for debt with similar terms and maturity.
24
Item 2. Management’s Discussion and Analysis of Financial Condition and Results of Operations
The following discussion and analysis addresses material changes in our results of operations for the three-month period ended March 31, 2020 compared to previous periods and in our financial condition and liquidity since December 31, 2019. For information regarding our critical accounting policies and estimates, see our 2019 Annual Report on Form 10-K under “Item 7. Management’s Discussion and Analysis of Financial Condition and Results of Operations.”
COVID – 19
A novel strain of coronavirus, SARS-CoV-2, causing a disease referred to as COVID-19, was reported to have surfaced in China in late 2019 and has subsequently spread to multiple countries worldwide, resulting in a global pandemic and health crisis. Devon began actively monitoring COVID-19 in January 2020 and formally established a COVID-19 cross-functional planning team at the beginning of March. The COVID-19 team is focused on two key priorities: the health and safety of our employees and contractors and the uninterrupted operation of our business.
|
|
• |
Health and safety – The COVID-19 team has developed and implemented a number of safety measures, which have successfully kept our workforce healthy and safe. The COVID-19 team has established an informational campaign to provide employees an understanding of the virus risk factors and safety measures, as well as timely updates from governmental stay-at-home regulations. Expectations have also been set for employees to communicate immediately if they, or someone they have been in contact with, has tested positive for COVID-19. Other measures included closing all of Devon’s office buildings and locations to the public, implementing social distancing and encouraging employees to work from home. Beginning in late March, more than 90% of the workforce assigned to Devon’s Oklahoma City Headquarters office were primarily working from home. The COVID-19 team has also implemented targeted and routine intensive and deep cleaning of all Devon office locations. |
|
|
• |
Uninterrupted operation of our business – Beyond workforce safety measures, the COVID-19 team has worked with government officials to ensure our business continues to be deemed an essential business or infrastructure. The COVID-19 team has ensured technology and resources are available for employees to execute their job duties while working from home and implemented further social distancing and contactless initiatives in our oil and gas field operations. The collective efforts of our COVID-19 team and our entire workforce have enabled us to avoid the need to implement COVID-19 containment or mitigation measures, which would require closure or suspension of any of our operations. |
This outbreak and the related responses of governmental authorities and others to limit the spread of the virus have significantly reduced global economic activity, resulting in an unprecedented decline in the demand for oil and other commodities. This supply-and-demand imbalance has been exacerbated by uncertainty regarding the future global supply of oil due to disputes between Russia and the members of OPEC, particularly Saudi Arabia, in March 2020. These factors caused a swift and material deterioration in commodity prices in early 2020, with NYMEX WTI oil prices falling from over $60/Bbl at the beginning of year to below $20/Bbl in April 2020. The current supply-and-demand imbalance has also imposed constraints on Devon’s and other operators’ ability to store and move production to downstream markets, which has resulted in the delay or curtailment of development activity, as well as the shutting-in of producing wells.
In response to the current macro-economic environment, we are protecting our financial strength and liquidity as evidenced by the following items:
|
|
• |
Maintained significant liquidity with $1.7 billion of cash, inclusive of $200 million restricted for discontinued operations, $3.0 billion of available credit under our Senior Credit Facility and no outstanding debt maturities occurring until the end of 2025. |
|
|
• |
Reduced 2020 capital expenditures outlook by approximately $800 million, or 45% compared to original capital budget, and expect to fund 2020 capital program within operating cash flows even at current depressed commodity prices. |
|
|
• |
Amended the sale of our Barnett Shale assets for $570 million in cash at closing and contingent payments of up to $260 million, with a close date of December 31, 2020. |
|
|
• |
Temporarily suspended our share repurchase program to preserve liquidity. |
|
|
• |
Hedged approximately 90% and 45% of our remaining 2020 oil and gas production at an average floor price of $42/Bbl and $2.15/Mcf, respectively. Additionally, we are currently building our 2021 hedge positions at market prices. |
|
|
• |
Evaluating and shutting-in wells based on a variable cost analysis and other factors. |
Overview of 2020 Results
We operate under a disciplined returns-driven strategy focused on delivering strong operational results, financial strength and value to our shareholders and continuing our commitment to environmental, social and governance excellence, which provides us with
25
a strong foundation to grow returns, margin and profitability. We continue to execute on our strategy and navigate through the challenged economic environment by protecting our financial strength, tailoring our capital investment to market conditions, improving our cash cost structure and preserving operational continuity.
Trends of our quarterly earnings, operating cash flow, EBITDAX and capital expenditures are shown below. The quarterly earnings chart presents amounts pertaining to both Devon’s continuing and discontinuing operations. The quarterly cash flow chart presents amounts pertaining to Devon’s continuing operations. “Core earnings” and “EBITDAX” are financial measures not prepared in accordance with GAAP. For a description of these measures, including reconciliations to the comparable GAAP measures, see “Non-GAAP Measures” in this Item 2.

Our net earnings in recent quarters have been significantly impacted by divestiture transactions, asset impairments and temporary, noncash adjustments to the value of our commodity hedges. Net earnings in the first quarter of 2020 included $2.3 billion of asset impairments on our proved and unproved properties and a $0.5 billion hedge valuation gain, both net of taxes. Net earnings in the fourth quarter of 2019 included $0.6 billion of asset impairments and a $0.1 billion hedge valuation loss, both net of taxes. Net earnings in the second quarter of 2019 included $0.3 billion for net after-tax gains and charges related to our Canadian disposition. Net earnings in the first quarter of 2019 included a $0.5 billion after-tax hedge valuation loss. Excluding these amounts, our core earnings have been more stable over recent quarters but continue to be heavily influenced by commodity prices.
Despite our portfolio enhancements, aggressive cost reductions and operational advancements, our financial results continue to be challenged by commodity prices and deterioration of the macro-economic environment resulting from the unprecedented COVID-19 pandemic. Our earnings declined from the fourth quarter of 2019 to the first quarter of 2020 due to a decrease in overall commodity prices. Led by a 19% decrease in the WTI from the fourth quarter of 2019 to the first quarter of 2020, our unhedged combined realized price dropped 23%. Despite these price drops, we were able to maintain production volumes while simultaneously reducing production and administrative costs 4% compared to 2019.

Like earnings, our operating cash flow is sensitive to volatile commodity prices. EBITDAX, which excludes financial amounts related to discontinued operations, has been more stable over the past five quarters as our production growth and cost reductions
26
countered price declines experienced over the same time period. Regardless of cash flow fluctuations, we remain focused on managing our capital investment to generate free cash flow. As operating cash flow has declined, we have adjusted our capital development plans accordingly.
We exited the first quarter of 2020 with $4.7 billion of liquidity comprised of $1.7 billion of cash, inclusive of $200 million of cash restricted for discontinued operations, and $3.0 billion of available credit under our Senior Credit Facility. We have $4.3 billion of debt outstanding with no maturities until the end of 2025. We currently have approximately 90% of our expected oil production and approximately 45% of our expected gas production protected with hedges for the remainder of 2020. These contracts consist of collars and swaps based off the WTI oil benchmark and the Henry Hub natural gas index. Additionally, we have entered into regional basis swaps in an effort to protect price realizations across our portfolio.
Results of Operations
The following graphs, discussion and analysis are intended to provide an understanding of our results of operations and current financial condition. To facilitate the review, these numbers are being presented before consideration of earnings attributable to noncontrolling interests. Analysis of the change in net earnings from continuing operations is shown below and analysis of the change in net earnings from discontinued operations is shown on page 33.
|
Continuing Operations |
Q1 2020 vs. Q4 2019
Our first quarter 2020 net loss from continuing operations was $1.7 billion. The graph below shows the change in net earnings (loss) from the fourth quarter of 2019 to the first quarter of 2020. The material changes are further discussed by category on the following pages. To facilitate the review, these numbers are being presented before consideration of earnings attributable to noncontrolling interests.

Production Volumes
|
|
|
Q1 2020 |
|
|
% of Total |
|
|
Q4 2019 |
|
|
Change |
|
||||
|
Oil (MBbls/d) |
|
|
|
|
|
|
|
|
|
|
|
|
|
|
|
|
|
Delaware Basin |
|
|
84 |
|
|
|
51 |
% |
|
|
84 |
|
|
|
+0 |
% |
|
Anadarko Basin |
|
|
24 |
|
|
|
15 |
% |
|
|
27 |
|
|
|
- 14 |
% |
|
Powder River Basin |
|
|
21 |
|
|
|
13 |
% |
|
|
20 |
|
|
|
+7 |
% |
|
Eagle Ford |
|
|
26 |
|
|
|
16 |
% |
|
|
23 |
|
|
|
+13 |
% |
|
Other |
|
|
8 |
|
|
|
5 |
% |
|
|
9 |
|
|
|
- 6 |
% |
|
Total |
|
|
163 |
|
|
|
100 |
% |
|
|
163 |
|
|
|
+0 |
% |
|
|
|
Q1 2020 |
|
|
% of Total |
|
|
Q4 2019 |
|
|
Change |
|
||||
|
Gas (MMcf/d) |
|
|
|
|
|
|
|
|
|
|
|
|
|
|
|
|
|
Delaware Basin |
|
|
244 |
|
|
|
38 |
% |
|
|
234 |
|
|
|
+4 |
% |
|
Anadarko Basin |
|
|
272 |
|
|
|
43 |
% |
|
|
295 |
|
|
|
- 8 |
% |
|
Powder River Basin |
|
|
29 |
|
|
|
4 |
% |
|
|
28 |
|
|
|
+1 |
% |
|
Eagle Ford |
|
|
86 |
|
|
|
14 |
% |
|
|
76 |
|
|
|
+12 |
% |
|
Other |
|
|
3 |
|
|
|
1 |
% |
|
|
4 |
|
|
|
- 15 |
% |
|
Total |
|
|
634 |
|
|
|
100 |
% |
|
|
637 |
|
|
|
- 1 |
% |
|
|
|
Q1 2020 |
|
|
% of Total |
|
|
Q4 2019 |
|
|
Change |
|
||||
|
NGLs (MBbls/d) |
|
|
|
|
|
|
|
|
|
|
|
|
|
|
|
|
|
Delaware Basin |
|
|
37 |
|
|
|
47 |
% |
|
|
32 |
|
|
|
+18 |
% |
|
Anadarko Basin |
|
|
30 |
|
|
|
37 |
% |
|
|
30 |
|
|
|
- 2 |
% |
|
Powder River Basin |
|
|
3 |
|
|
|
4 |
% |
|
|
2 |
|
|
|
+13 |
% |
|
Eagle Ford |
|
|
9 |
|
|
|
11 |
% |
|
|
9 |
|
|
|
+3 |
% |
|
Other |
|
|
1 |
|
|
|
1 |
% |
|
|
1 |
|
|
|
- 17 |
% |
|
Total |
|
|
80 |
|
|
|
100 |
% |
|
|
74 |
|
|
|
+8 |
% |
|
|
|
Q1 2020 |
|
|
% of Total |
|
|
Q4 2019 |
|
|
Change |
|
||||
|
Combined (MBoe/d) |
|
|
|
|
|
|
|
|
|
|
|
|
|
|
|
|
|
Delaware Basin |
|
|
162 |
|
|
|
47 |
% |
|
|
154 |
|
|
|
+5 |
% |
|
Anadarko Basin |
|
|
98 |
|
|
|
28 |
% |
|
|
107 |
|
|
|
- 8 |
% |
|
Powder River Basin |
|
|
29 |
|
|
|
8 |
% |
|
|
27 |
|
|
|
+6 |
% |
|
Eagle Ford |
|
|
50 |
|
|
|
14 |
% |
|
|
45 |
|
|
|
+11 |
% |
|
Other |
|
|
9 |
|
|
|
3 |
% |
|
|
10 |
|
|
|
- 7 |
% |
|
Total |
|
|
348 |
|
|
|
100 |
% |
|
|
343 |
|
|
|
+2 |
% |
27
Continued development in the Delaware Basin and Powder River Basin drove production increases. Additionally, a well-control event curtailed production volumes in the Eagle Ford during the fourth quarter of 2019. These were partially offset by lower activity in the Anadarko Basin.
In response to the current macro-economic environment, we have reduced planned 2020 capital expenditures by 45% and shut in certain marginal wells. As a result, we anticipate total production to decrease in the second quarter of 2020 to a range of 302 to 328 MBoe/d and continue to decrease for the second half of 2020.
Field Prices
|
|
|
Q1 2020 |
|
|
Realization |
|
|
Q4 2019 |
|
|
Change |
|
||||
|
Oil (per Bbl) |
|
|
|
|
|
|
|
|
|
|
|
|
|
|
|
|
|
WTI index |
|
$ |
46.44 |
|
|
|
|
|
|
$ |
57.02 |
|
|
|
- 19 |
% |
|
Realized price, unhedged |
|
$ |
44.59 |
|
|
|
96% |
|
|
$ |
55.41 |
|
|
|
- 20 |
% |
|
Cash settlements |
|
$ |
5.14 |
|
|
|
|
|
|
$ |
1.48 |
|
|
|
|
|
|
Realized price, with hedges |
|
$ |
49.73 |
|
|
|
107% |
|
|
$ |
56.89 |
|
|
|
- 13 |
% |
|
|
|
Q1 2020 |
|
|
Realization |
|
|
Q4 2019 |
|
|
Change |
|
||||
|
Gas (per Mcf) |
|
|
|
|
|
|
|
|
|
|
|
|
|
|
|
|
|
Henry Hub index |
|
$ |
1.95 |
|
|
|
|
|
|
$ |
2.50 |
|
|
|
- 22 |
% |
|
Realized price, unhedged |
|
$ |
1.21 |
|
|
|
62% |
|
|
$ |
1.70 |
|
|
|
- 29 |
% |
|
Cash settlements |
|
$ |
0.36 |
|
|
|
|
|
|
$ |
0.13 |
|
|
|
|
|
|
Realized price, with hedges |
|
$ |
1.57 |
|
|
|
81% |
|
|
$ |
1.83 |
|
|
|
- 14 |
% |
|
|
|
Q1 2020 |
|
|
Realization |
|
|
Q4 2019 |
|
|
Change |
|
||||
|
NGLs (per Bbl) |
|
|
|
|
|
|
|
|
|
|
|
|
|
|
|
|
|
Mont Belvieu blended index (1) |
|
$ |
14.39 |
|
|
|
|
|
|
$ |
18.69 |
|
|
|
- 23 |
% |
|
Realized price, unhedged |
|
$ |
10.40 |
|
|
|
72% |
|
|
$ |
15.79 |
|
|
|
- 34 |
% |
|
Cash settlements |
|
$ |
0.61 |
|
|
|
|
|
|
$ |
1.75 |
|
|
|
|
|
|
Realized price, with hedges |
|
$ |
11.01 |
|
|
|
77% |
|
|
$ |
17.54 |
|
|
|
- 37 |
% |
(1)Based upon composition of our NGL barrel.
|
|
|
Q1 2020 |
|
|
Q4 2019 |
|
|
Change |
|
|||
|
Combined (per Boe) |
|
|
|
|
|
|
|
|
|
|
|
|
|
Realized price, unhedged |
|
$ |
25.43 |
|
|
$ |
32.82 |
|
|
|
- 23 |
% |
|
Cash settlements |
|
$ |
3.20 |
|
|
$ |
1.32 |
|
|
|
|
|
|
Realized price, with hedges |
|
$ |
28.63 |
|
|
$ |
34.14 |
|
|
|
- 16 |
% |
From the fourth quarter of 2019 to the first quarter of 2020, field prices contributed to a $227 million decrease in earnings. Unhedged realized oil, gas and NGL prices decreased primarily due to lower WTI, Henry Hub and Mont Belvieu index prices. These decreases were partially offset by favorable hedge cash settlements across each of our products.
As prices further deteriorated towards the end of the first quarter from the COVID-19 pandemic, we added additional oil and gas hedges for the remaining quarters of 2020 and the year 2021. We currently have approximately 90% of our remaining 2020 oil production hedged with an average floor price of $42/Bbl and approximately 45% of our remaining 2020 gas production hedged with an average floor price of $2.15/Mcf. Additionally, we are currently building our 2021 hedge positions at market prices.
Hedge Settlements
|
|
|
Q1 2020 |
|
|
Q4 2019 |
|
|
Change |
|
|||
|
|
|
Q |
|
|
|
|
|
|
|
|
|
|
|
Oil |
|
$ |
76 |
|
|
$ |
22 |
|
|
|
+245 |
% |
|
Natural gas |
|
|
21 |
|
|
|
8 |
|
|
|
+163 |
% |
|
NGL |
|
|
4 |
|
|
|
12 |
|
|
|
- 67 |
% |
|
Total cash settlements |
|
$ |
101 |
|
|
$ |
42 |
|
|
|
+140 |
% |
Cash settlements as presented in the tables above represent realized gains or losses related to the instruments described in Note 3 in “Part I. Financial Information – Item 1. Financial Statements” in this report.
Production Expenses
|
|
|
Q1 2020 |
|
|
Q4 2019 |
|
|
Change |
|
|||
|
LOE |
|
$ |
126 |
|
|
$ |
120 |
|
|
|
+5 |
% |
|
Gathering, processing & transportation |
|
|
130 |
|
|
|
131 |
|
|
|
- 1 |
% |
|
Production taxes |
|
|
56 |
|
|
|
69 |
|
|
|
- 19 |
% |
|
Property taxes |
|
|
6 |
|
|
|
4 |
|
|
|
+50 |
% |
|
Total |
|
$ |
318 |
|
|
$ |
324 |
|
|
|
- 2 |
% |
|
Per Boe: |
|
|
|
|
|
|
|
|
|
|
|
|
|
LOE |
|
$ |
3.96 |
|
|
$ |
3.79 |
|
|
|
+5 |
% |
|
Gathering, processing & transportation |
|
$ |
4.11 |
|
|
$ |
4.16 |
|
|
|
- 1 |
% |
|
Percent of oil, gas and NGL sales: |
|
|
|
|
|
|
|
|
|
|
|
|
|
Production taxes |
|
|
6.9 |
% |
|
|
6.7 |
% |
|
|
+3 |
% |
In response to the current macro-economic environment, reduced planned 2020 capital expenditures and shutting in certain marginal wells, we anticipate decreases in LOE and gathering, processing and transportation of approximately 10% during the remainder of 2020. Additionally, we expect lower production taxes as a result of lower oil, gas and NGL revenues.
Field-Level Cash Margin
The table below presents the field-level cash margin for each of our operating areas. Field-level cash margin is computed as oil, gas and NGL revenues less production expenses and is not prepared in accordance with GAAP. A reconciliation to the comparable GAAP measures is found in “Non-GAAP Measures” in this Item 2. The changes in production volumes, field prices and production expenses, shown above, had the following impact on our field-level cash margins by asset.
|
|
|
Q1 2020 |
|
|
$ per BOE |
|
|
Q4 2019 |
|
|
$ per BOE |
|
||||
|
Field-level cash margin (non-GAAP) |
|
|
|
|
|
|
|
|
|
|
|
|
|
|
|
|
|
Delaware Basin |
|
$ |
260 |
|
|
$ |
17.72 |
|
|
$ |
372 |
|
|
$ |
26.30 |
|
|
Anadarko Basin |
|
|
74 |
|
|
$ |
8.22 |
|
|
|
147 |
|
|
$ |
15.06 |
|
|
Powder River Basin |
|
|
54 |
|
|
$ |
20.48 |
|
|
|
73 |
|
|
$ |
28.86 |
|
|
Eagle Ford |
|
|
87 |
|
|
$ |
19.20 |
|
|
|
98 |
|
|
$ |
23.72 |
|
|
Other |
|
|
14 |
|
|
$ |
15.55 |
|
|
|
21 |
|
|
$ |
22.33 |
|
|
Total |
|
$ |
489 |
|
|
$ |
15.41 |
|
|
$ |
711 |
|
|
$ |
22.55 |
|
28
DD&A and Asset Impairments
|
|
|
Q1 2020 |
|
|
Q4 2019 |
|
|
Change |
|
|||
|
Oil and gas per Boe |
|
$ |
11.90 |
|
|
$ |
11.71 |
|
|
|
+2 |
% |
|
|
|
|
|
|
|
|
|
|
|
|
|
|
|
Oil and gas |
|
$ |
377 |
|
|
$ |
370 |
|
|
|
+2 |
% |
|
Other property and equipment |
|
|
24 |
|
|
|
12 |
|
|
|
+93 |
% |
|
Total |
|
$ |
401 |
|
|
$ |
382 |
|
|
|
+5 |
% |
|
|
|
|
|
|
|
|
|
|
|
|
|
|
|
Asset impairments |
|
$ |
2,666 |
|
|
$ |
— |
|
|
N/M |
|
|
Asset impairments were $2.7 billion in the first quarter of 2020 due to significant decreases in commodity prices since the end of 2019 resulting primarily from the COVID-19 pandemic. For additional information, see Note 5 in “Part I. Financial Information – Item 1. Financial Statements” in this report.
As a result of the asset impairments of $2.7 billion during the first quarter of 2020 and the lower production resulting from decreased capital expenditures, DD&A will decrease approximately 25% for the remainder of 2020.
General and Administrative Expenses
|
|
|
Q1 2020 |
|
|
Q4 2019 |
|
|
Change |
|
|||
|
Labor and benefits (net of reimbursements) |
|
$ |
66 |
|
|
$ |
80 |
|
|
|
- 18 |
% |
|
Non-labor |
|
|
36 |
|
|
|
39 |
|
|
|
- 8 |
% |
|
Total Devon |
|
$ |
102 |
|
|
$ |
119 |
|
|
|
- 14 |
% |
G&A decreased primarily as a result of lower employee costs and benefits.
Other Items
|
|
|
Q1 2020 |
|
|
Q4 2019 |
|
|
Change in earnings |
|
|||
|
Commodity hedge valuation changes (1) |
|
$ |
619 |
|
|
$ |
(158 |
) |
|
$ |
777 |
|
|
Marketing and midstream operations |
|
|
(18 |
) |
|
|
5 |
|
|
|
(23 |
) |
|
Exploration expenses |
|
|
112 |
|
|
|
29 |
|
|
|
(83 |
) |
|
Net financing costs |
|
|
65 |
|
|
|
64 |
|
|
|
(1 |
) |
|
Restructuring and transaction costs |
|
|
— |
|
|
|
11 |
|
|
|
11 |
|
|
Other expenses |
|
|
(48 |
) |
|
|
16 |
|
|
|
64 |
|
|
|
|
|
|
|
|
|
|
|
|
$ |
745 |
|
|
|
(1) |
Included as a component of upstream revenues on the consolidated statements of comprehensive earnings. |
We recognize fair value changes on our oil, gas and NGL derivative instruments in each reporting period. The changes in fair value resulted from new positions and settlements that occurred during each period, as well as the relationship between contract prices and the associated forward curves. For additional information, see Note 3 in “Part I. Financial Information – Item 1. Financial Statements” in this report.
Marketing operations decreased approximately $23 million primarily from downstream product inventory impairments of $17 million recognized in the first quarter of 2020.
Exploration expenses increased in 2020 due to $110 million in unproved asset impairments. For additional information, see Note 5 in “Part I. Financial Information – Item 1. Financial Statements” in this report.
Other expenses decreased due to a severance tax refund received in 2020 related to prior periods.
Income Taxes
|
|
|
Q1 2020 |
|
|
Q4 2019 |
|
||
|
Current benefit |
|
$ |
(106 |
) |
|
$ |
(5 |
) |
|
Deferred benefit |
|
|
(311 |
) |
|
|
(28 |
) |
|
Total benefit |
|
$ |
(417 |
) |
|
$ |
(33 |
) |
|
Effective income tax rate |
|
|
20 |
% |
|
|
155 |
% |
For discussion on income taxes, see Note 7 in “Part I. Financial Information – Item 1. Financial Statements” in this report.
29
Q1 2020 vs. Q1 2019
Our first quarter 2020 net loss from continuing operations was $1.7 billion. The graph below shows the change in net loss from the first quarter of 2019 to the first quarter of 2020. The material changes are further discussed on the following pages. To facilitate the review, these numbers are being presented before consideration of earnings attributable to noncontrolling interests.
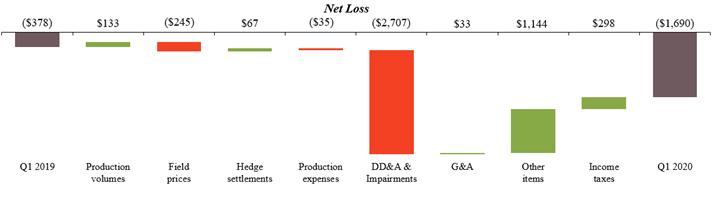
30
Production Volumes
|
|
|
Q1 2020 |
|
|
% of Total |
|
|
Q1 2019 |
|
|
Change |
|
||||
|
Oil (MBbls/d) |
|
|
|
|
|
|
|
|
|
|
|
|
|
|
|
|
|
Delaware Basin |
|
|
84 |
|
|
|
51 |
% |
|
|
60 |
|
|
|
+40 |
% |
|
Anadarko Basin |
|
|
24 |
|
|
|
15 |
% |
|
|
32 |
|
|
|
- 27 |
% |
|
Powder River Basin |
|
|
21 |
|
|
|
13 |
% |
|
|
15 |
|
|
|
+39 |
% |
|
Eagle Ford |
|
|
26 |
|
|
|
16 |
% |
|
|
25 |
|
|
|
+6 |
% |
|
Other |
|
|
8 |
|
|
|
5 |
% |
|
|
9 |
|
|
|
- 13 |
% |
|
Total |
|
|
163 |
|
|
|
100 |
% |
|
|
141 |
|
|
|
+15 |
% |
|
|
|
Q1 2020 |
|
|
% of Total |
|
|
Q1 2019 |
|
|
Change |
|
||||
|
Gas (MMcf/d) |
|
|
|
|
|
|
|
|
|
|
|
|
|
|
|
|
|
Delaware Basin |
|
|
244 |
|
|
|
38 |
% |
|
|
146 |
|
|
|
+68 |
% |
|
Anadarko Basin |
|
|
272 |
|
|
|
43 |
% |
|
|
333 |
|
|
|
- 18 |
% |
|
Powder River Basin |
|
|
29 |
|
|
|
4 |
% |
|
|
18 |
|
|
|
+56 |
% |
|
Eagle Ford |
|
|
86 |
|
|
|
14 |
% |
|
|
83 |
|
|
|
+3 |
% |
|
Other |
|
|
3 |
|
|
|
1 |
% |
|
|
8 |
|
|
|
- 58 |
% |
|
Total |
|
|
634 |
|
|
|
100 |
% |
|
|
588 |
|
|
|
+8 |
% |
|
|
|
Q1 2020 |
|
|
% of Total |
|
|
Q1 2019 |
|
|
Change |
|
||||
|
NGLs (MBbls/d) |
|
|
|
|
|
|
|
|
|
|
|
|
|
|
|
|
|
Delaware Basin |
|
|
37 |
|
|
|
47 |
% |
|
|
23 |
|
|
|
+62 |
% |
|
Anadarko Basin |
|
|
30 |
|
|
|
37 |
% |
|
|
35 |
|
|
|
- 17 |
% |
|
Powder River Basin |
|
|
3 |
|
|
|
4 |
% |
|
|
2 |
|
|
|
+44 |
% |
|
Eagle Ford |
|
|
9 |
|
|
|
11 |
% |
|
|
12 |
|
|
|
- 21 |
% |
|
Other |
|
|
1 |
|
|
|
1 |
% |
|
|
2 |
|
|
|
- 32 |
% |
|
Total |
|
|
80 |
|
|
|
100 |
% |
|
|
74 |
|
|
|
+9 |
% |
|
|
|
Q1 2020 |
|
|
% of Total |
|
|
Q1 2019 |
|
|
Change |
|
||||
|
Combined (MBoe/d) |
|
|
|
|
|
|
|
|
|
|
|
|
|
|
|
|
|
Delaware Basin |
|
|
162 |
|
|
|
47 |
% |
|
|
107 |
|
|
|
+51 |
% |
|
Anadarko Basin |
|
|
98 |
|
|
|
28 |
% |
|
|
123 |
|
|
|
- 20 |
% |
|
Powder River Basin |
|
|
29 |
|
|
|
8 |
% |
|
|
21 |
|
|
|
+41 |
% |
|
Eagle Ford |
|
|
50 |
|
|
|
14 |
% |
|
|
50 |
|
|
|
- 1 |
% |
|
Other |
|
|
9 |
|
|
|
3 |
% |
|
|
12 |
|
|
|
- 22 |
% |
|
Total |
|
|
348 |
|
|
|
100 |
% |
|
|
313 |
|
|
|
+11 |
% |
An increase in production volumes from the first quarter of 2019 to the first quarter of 2020 contributed to a $133 million increase in earnings. Continued development in the Delaware Basin and Powder River Basin drove production increases, which were slightly offset by decreased activity in the Anadarko Basin.
Field Prices
|
|
|
Q1 2020 |
|
|
Realization |
|
|
Q1 2019 |
|
|
Change |
|
||||
|
Oil (per Bbl) |
|
|
|
|
|
|
|
|
|
|
|
|
|
|
|
|
|
WTI index |
|
$ |
46.44 |
|
|
|
|
|
|
$ |
54.88 |
|
|
|
- 15 |
% |
|
Realized price, unhedged |
|
$ |
44.59 |
|
|
|
96% |
|
|
$ |
51.83 |
|
|
|
- 14 |
% |
|
Cash settlements |
|
$ |
5.14 |
|
|
|
|
|
|
$ |
3.65 |
|
|
|
|
|
|
Realized price, with hedges |
|
$ |
49.73 |
|
|
|
107% |
|
|
$ |
55.48 |
|
|
|
- 10 |
% |
|
|
|
Q1 2020 |
|
|
Realization |
|
|
Q1 2019 |
|
|
Change |
|
||||
|
Gas (per Mcf) |
|
|
|
|
|
|
|
|
|
|
|
|
|
|
|
|
|
Henry Hub index |
|
$ |
1.95 |
|
|
|
|
|
|
$ |
3.15 |
|
|
|
- 38 |
% |
|
Realized price, unhedged |
|
$ |
1.21 |
|
|
|
62% |
|
|
$ |
2.62 |
|
|
|
- 54 |
% |
|
Cash settlements |
|
$ |
0.36 |
|
|
|
|
|
|
$ |
(0.31 |
) |
|
|
|
|
|
Realized price, with hedges |
|
$ |
1.57 |
|
|
|
81% |
|
|
$ |
2.31 |
|
|
|
- 32 |
% |
|
|
|
Q1 2020 |
|
|
Realization |
|
|
Q1 2019 |
|
|
Change |
|
||||
|
NGLs (per Bbl) |
|
|
|
|
|
|
|
|
|
|
|
|
|
|
|
|
|
Mont Belvieu blended index (1) |
|
$ |
14.39 |
|
|
|
|
|
|
$ |
22.94 |
|
|
|
- 37 |
% |
|
Realized price, unhedged |
|
$ |
10.40 |
|
|
|
72% |
|
|
$ |
18.36 |
|
|
|
- 43 |
% |
|
Cash settlements |
|
$ |
0.61 |
|
|
|
|
|
|
$ |
0.67 |
|
|
|
|
|
|
Realized price, with hedges |
|
$ |
11.01 |
|
|
|
77% |
|
|
$ |
19.03 |
|
|
|
- 42 |
% |
|
|
(1) |
Based upon composition of our NGL barrel. |
|
|
|
Q1 2020 |
|
|
Q1 2019 |
|
|
Change |
|
|||
|
Combined (per Boe) |
|
|
|
|
|
|
|
|
|
|
|
|
|
Realized price, unhedged |
|
$ |
25.43 |
|
|
$ |
32.65 |
|
|
|
- 22 |
% |
|
Cash settlements |
|
$ |
3.20 |
|
|
$ |
1.22 |
|
|
|
|
|
|
Realized price, with hedges |
|
$ |
28.63 |
|
|
$ |
33.87 |
|
|
|
- 15 |
% |
From the first quarter of 2019 to the first quarter of 2020, field prices contributed to a $245 million decrease in earnings. Unhedged realized oil, gas and NGL prices decreased primarily due to lower WTI, Henry Hub and Mont Belvieu index prices. These decreases were partially offset by favorable hedge cash settlements across each of our products.
Hedge Settlements
|
|
|
Q1 2020 |
|
|
Q1 2019 |
|
|
Change |
|
|||
|
|
|
Q |
|
|
|
|
|
|
|
|
|
|
|
Oil |
|
$ |
76 |
|
|
$ |
46 |
|
|
|
+65 |
% |
|
Natural gas |
|
|
21 |
|
|
|
(16 |
) |
|
|
+231 |
% |
|
NGL |
|
|
4 |
|
|
|
4 |
|
|
|
+0 |
% |
|
Total cash settlements |
|
$ |
101 |
|
|
$ |
34 |
|
|
|
+197 |
% |
Cash settlements as presented in the tables above represent realized gains or losses related to the instruments described in Note 3 in “Part I. Financial Information – Item 1. Financial Statements” in this report.
Production Expenses
|
|
|
Q1 2020 |
|
|
Q1 2019 |
|
|
Change |
|
|||
|
LOE |
|
$ |
126 |
|
|
$ |
110 |
|
|
|
+15 |
% |
|
Gathering, processing & transportation |
|
|
130 |
|
|
|
109 |
|
|
|
+19 |
% |
|
Production taxes |
|
|
56 |
|
|
|
60 |
|
|
|
- 7 |
% |
|
Property taxes |
|
|
6 |
|
|
|
4 |
|
|
|
+50 |
% |
|
Total |
|
$ |
318 |
|
|
$ |
283 |
|
|
|
+12 |
% |
|
Per Boe: |
|
|
|
|
|
|
|
|
|
|
|
|
|
LOE |
|
$ |
3.96 |
|
|
$ |
3.95 |
|
|
|
+0 |
% |
|
Gathering, processing & transportation |
|
$ |
4.11 |
|
|
$ |
3.86 |
|
|
|
+6 |
% |
|
Percent of oil, gas and NGL sales: |
|
|
|
|
|
|
|
|
|
|
|
|
|
Production taxes |
|
|
6.9 |
% |
|
|
6.5 |
% |
|
|
+6 |
% |
31
LOE and gathering, processing and transportation increased primarily due to continued development and increased activity in the Delaware Basin.
Field-Level Cash Margin
The table below presents the field-level cash margin for each of our operating areas. Field-level cash margin is computed as oil, gas and NGL revenues less production expenses and is not prepared in accordance with GAAP. A reconciliation to the comparable GAAP measures is found in “Non-GAAP Measures” in this Item 2. The changes in production volumes, field prices and production expenses, shown above, had the following impact on our field-level cash margins by asset.
|
|
|
Q1 2020 |
|
|
$ per BOE |
|
|
Q1 2019 |
|
|
$ per BOE |
|
||||
|
Field-level cash margin (non-GAAP) |
|
|
|
|
|
|
|
|
|
|
|
|
|
|
|
|
|
Delaware Basin |
|
$ |
260 |
|
|
$ |
17.72 |
|
|
$ |
235 |
|
|
$ |
24.39 |
|
|
Anadarko Basin |
|
|
74 |
|
|
$ |
8.22 |
|
|
|
203 |
|
|
$ |
18.27 |
|
|
Powder River Basin |
|
|
54 |
|
|
$ |
20.48 |
|
|
|
50 |
|
|
$ |
27.02 |
|
|
Eagle Ford |
|
|
87 |
|
|
$ |
19.20 |
|
|
|
128 |
|
|
$ |
28.53 |
|
|
Other |
|
|
14 |
|
|
$ |
15.55 |
|
|
|
19 |
|
|
$ |
17.57 |
|
|
Total |
|
$ |
489 |
|
|
$ |
15.41 |
|
|
$ |
635 |
|
|
$ |
22.54 |
|
DD&A and Asset Impairments
|
|
|
Q1 2020 |
|
|
Q1 2019 |
|
|
Change |
|
|||
|
Oil and gas per Boe |
|
$ |
11.90 |
|
|
$ |
11.73 |
|
|
|
+1 |
% |
|
|
|
|
|
|
|
|
|
|
|
|
|
|
|
Oil and gas |
|
$ |
377 |
|
|
$ |
331 |
|
|
|
+14 |
% |
|
Other property and equipment |
|
|
24 |
|
|
|
29 |
|
|
|
- 19 |
% |
|
Total |
|
$ |
401 |
|
|
$ |
360 |
|
|
|
+11 |
% |
|
|
|
|
|
|
|
|
|
|
|
|
|
|
|
Asset impairments |
|
$ |
2,666 |
|
|
$ |
— |
|
|
N/M |
|
|
Our oil and gas DD&A increased primarily due to continued development in the Delaware Basin and Powder River Basin properties.
Asset impairments were $2.7 billion in the first quarter of 2020 due to significant decreases in commodity prices since the end of 2019 resulting primarily from the COVID-19 pandemic. For additional information, see Note 5 in “Part I. Financial Information – Item 1. Financial Statements” in this report.
General and Administrative Expenses
|
|
|
Q1 2020 |
|
|
Q1 2019 |
|
|
Change |
|
|||
|
Labor and benefits (net of reimbursements) |
|
$ |
66 |
|
|
$ |
86 |
|
|
|
- 23 |
% |
|
Non-labor |
|
|
36 |
|
|
|
49 |
|
|
|
- 27 |
% |
|
Total Devon |
|
$ |
102 |
|
|
$ |
135 |
|
|
|
- 24 |
% |
Labor and benefits and non-labor expenses decreased primarily as a result of continued workforce reduction and cost savings initiatives.
Other Items
|
|
|
Q1 2020 |
|
|
Q1 2019 |
|
|
Change in earnings |
|
|||
|
Commodity hedge valuation changes (1) |
|
$ |
619 |
|
|
$ |
(639 |
) |
|
$ |
1,258 |
|
|
Marketing and midstream operations |
|
|
(18 |
) |
|
|
15 |
|
|
|
(33 |
) |
|
Exploration expenses |
|
|
112 |
|
|
|
4 |
|
|
|
(108 |
) |
|
Asset dispositions |
|
|
— |
|
|
|
(45 |
) |
|
|
(45 |
) |
|
Net financing costs |
|
|
65 |
|
|
|
60 |
|
|
|
(5 |
) |
|
Restructuring and transaction costs |
|
|
— |
|
|
|
51 |
|
|
|
51 |
|
|
Other expenses |
|
|
(48 |
) |
|
|
(22 |
) |
|
|
26 |
|
|
|
|
|
|
|
|
|
|
|
|
$ |
1,144 |
|
|
|
(1) |
Included as a component of upstream revenues on the consolidated statements of comprehensive earnings. |
We recognize fair value changes on our oil, gas and NGL derivative instruments in each reporting period. The changes in fair value resulted from new positions and settlements that occurred during each period, as well as the relationship between contract prices and the associated forward curves. For additional information, see Note 3 in “Part I. Financial Information – Item 1. Financial Statements” in this report.
Marketing operations decreased approximately $33 million primarily from downstream product inventory impairments of $17 million recognized in the first quarter of 2020.
Exploration expenses increased in 2020 due to $110 million in unproved asset impairments. For additional information, see Note 5 in “Part I. Financial Information – Item 1. Financial Statements” in this report.
Income Taxes
|
|
|
Q1 2020 |
|
|
Q1 2019 |
|
||
|
Current benefit |
|
$ |
(106 |
) |
|
$ |
(4 |
) |
|
Deferred benefit |
|
|
(311 |
) |
|
|
(115 |
) |
|
Total benefit |
|
$ |
(417 |
) |
|
$ |
(119 |
) |
|
Effective income tax rate |
|
|
20 |
% |
|
|
24 |
% |
For discussion on income taxes, see Note 7 in “Part I. Financial Information – Item 1. Financial Statements” in this report.
32
|
Discontinued Operations |
Results of Operations – Discontinued Operations
The table below presents key components from discontinued operations for the time periods presented. Discontinued operations include the Canadian business that Devon sold in June 2019 and the Barnett Shale assets that Devon has contracted to sell and which is expected to close on December 31, 2020. For additional information on discontinued operations, see Note 17 in “Part I. Financial Information – Item 1. Financial Statements” in this report.
|
|
|
Q1 2020 |
|
|
Q4 2019 |
|
|
Q1 2019 |
|
|||
|
Upstream revenues |
|
$ |
92 |
|
|
$ |
121 |
|
|
$ |
396 |
|
|
Production expenses |
|
$ |
74 |
|
|
$ |
75 |
|
|
$ |
222 |
|
|
Marketing margin |
|
$ |
— |
|
|
$ |
— |
|
|
$ |
17 |
|
|
Asset impairments |
|
$ |
179 |
|
|
$ |
748 |
|
|
$ |
— |
|
|
Restructuring and transaction costs |
|
$ |
— |
|
|
$ |
4 |
|
|
$ |
3 |
|
|
Earnings (loss) from discontinued operations before income taxes |
|
$ |
(157 |
) |
|
$ |
(724 |
) |
|
$ |
70 |
|
|
Income tax expense (benefit) |
|
$ |
(32 |
) |
|
$ |
(72 |
) |
|
$ |
9 |
|
|
Net earnings (loss) from discontinued operations, net of tax |
|
$ |
(125 |
) |
|
$ |
(652 |
) |
|
$ |
61 |
|
|
|
|
|
|
|
|
|
|
|
|
|
|
|
|
Production (MMBoe): |
|
|
|
|
|
|
|
|
|
|
|
|
|
Barnett Shale |
|
|
9 |
|
|
|
9 |
|
|
|
9 |
|
|
Canada |
|
|
— |
|
|
|
— |
|
|
|
10 |
|
|
Total production |
|
|
9 |
|
|
|
9 |
|
|
|
19 |
|
|
Realized price, unhedged (per Boe) - Barnett Shale |
|
$ |
10.16 |
|
|
$ |
13.45 |
|
|
$ |
16.18 |
|
|
Realized price, unhedged (per Boe) - Canada |
|
N/A |
|
|
N/A |
|
|
$ |
34.42 |
|
||
Q1 2020 vs. Q4 2019
Net loss from discontinued operations, net of tax decreased $527 million due to a decrease in asset impairments from the fourth quarter of 2019 to the first quarter of 2020. During the first quarter of 2020, we recognized $179 million in asset impairments on our Barnett Shale assets due to the amended terms of the Barnett sales agreement. During the fourth quarter of 2019, we recognized a $748 million asset impairment to our Barnett Shale assets.
Q1 2020 vs. Q1 2019
Net earnings (loss) from discontinued operations, net of tax decreased $186 million due to $179 million in incremental asset impairments to our Barnett Shale assets related to the amended terms of the Barnett sales agreement during the first quarter of 2020. Upstream revenues and production expenses decreased from the first quarter of 2019 to the first quarter of 2020 due to Devon’s divestment of its Canadian business in the second quarter of 2019.
33
Capital Resources, Uses and Liquidity
Sources and Uses of Cash
The following table presents the major changes in cash and cash equivalents for the three months ended March 31, 2020 and 2019.
|
|
|
Three Months Ended March 31st, |
|
|||||
|
|
|
2020 |
|
|
2019 |
|
||
|
Operating cash flow from continuing operations |
|
$ |
529 |
|
|
$ |
437 |
|
|
Divestitures of property and equipment |
|
|
25 |
|
|
|
310 |
|
|
Capital expenditures |
|
|
(425 |
) |
|
|
(490 |
) |
|
Acquisitions of property and equipment |
|
|
(4 |
) |
|
|
(10 |
) |
|
Debt activity, net |
|
|
— |
|
|
|
(162 |
) |
|
Repurchases of common stock |
|
|
(38 |
) |
|
|
(999 |
) |
|
Common stock dividends |
|
|
(34 |
) |
|
|
(34 |
) |
|
Contributions from noncontrolling interests |
|
|
5 |
|
|
|
— |
|
|
Distributions to noncontrolling interests |
|
|
(3 |
) |
|
|
— |
|
|
Other |
|
|
(17 |
) |
|
|
(19 |
) |
|
Net change in cash, cash equivalents and restricted cash from discontinued operations |
|
|
(155 |
) |
|
|
(124 |
) |
|
Net change in cash, cash equivalents and restricted cash |
|
$ |
(117 |
) |
|
$ |
(1,091 |
) |
|
Cash, cash equivalents and restricted cash at end of period |
|
$ |
1,727 |
|
|
$ |
1,355 |
|
Operating Cash Flow
As presented in the table above, net cash provided by operating activities continued to be a significant source of capital and liquidity. During the three months ended March 31, 2020, our operating cash flow funded all our capital expenditures and dividends, allowing us to use available cash balances to fund other capital uses.
Divestitures of Property and Equipment
During the first three months of 2019, we sold non-core U.S. assets for approximately $300 million, net of customary purchase price adjustments. For additional information, please see Note 2 in “Part I. Financial Information – Item 1. Financial Statements” in this report.
Capital Expenditures and Acquisitions of Property and Equipment
The amounts in the table below reflect cash payments for capital expenditures, including cash paid for capital expenditures incurred in prior periods.
|
|
|
Three Months Ended March 31st, |
|
|||||
|
|
|
2020 |
|
|
2019 |
|
||
|
Delaware Basin |
|
$ |
221 |
|
|
$ |
225 |
|
|
Powder River Basin |
|
|
85 |
|
|
|
56 |
|
|
Eagle Ford |
|
|
94 |
|
|
|
55 |
|
|
Anadarko Basin |
|
|
8 |
|
|
|
136 |
|
|
Other |
|
|
3 |
|
|
|
11 |
|
|
Total oil and gas |
|
|
411 |
|
|
|
483 |
|
|
Midstream |
|
|
8 |
|
|
|
— |
|
|
Other |
|
|
6 |
|
|
|
7 |
|
|
Total capital expenditures |
|
$ |
425 |
|
|
$ |
490 |
|
|
Acquisitions |
|
$ |
4 |
|
|
$ |
10 |
|
Capital expenditures consist primarily of amounts related to our oil and gas exploration and development operations, midstream operations and other corporate activities. Our capital program is designed to operate within or near operating cash flow. This is evidenced by our operating cash flow fully funding capital expenditures for the three months ended March 31, 2020 and 89% of
34
capital expenditures for the three months ended March 31, 2019. Our capital investment program is driven by a disciplined allocation process focused on returns. Our capital expenditures are lower in 2020 primarily due to our decreased spending in the Anadarko Basin, partially offset by increased capital investment in the Powder River Basin and Eagle Ford. In response to the current macro-economic environment, we reduced our 2020 capital expenditures outlook by approximately $800 million, or 45% compared to the original capital budget, and expect to fund our 2020 capital program within operating cash flows even at current depressed commodity prices.
Debt Activity
During the first quarter of 2019, our debt decreased $162 million due to the repayment of our 6.30% senior notes at maturity.
Shareholder Distributions and Stock Activity
We paid common stock dividends of $34 million ($0.09 per share) and $34 million ($0.08 per share) during the first three months of 2020 and 2019, respectively. In February 2020, we announced a 22% increase to our quarterly dividend, to $0.11 per share, beginning in the second quarter of 2020. Beginning with the second quarter of 2019, we increased our quarterly dividend to $0.09 per share.
We repurchased 2.2 million shares of common stock for $38 million in the first three months of 2020 and 36.1 million shares of common stock for $1.0 billion in the first three months of 2019 under share repurchase programs authorized by our Board of Directors. For additional information, see Note 16 in “Part I. Financial Information – Item 1. Financial Statements” in this report.
Noncontrolling Interest Contributions and Distributions
During the first quarter of 2020, we received $5 million in contributions from our noncontrolling interests in CDM and distributed $3 million to our noncontrolling interests in CDM.
Cash Flows from Discontinued Operations
All cash flows in the following table relate to activities of our Canadian business that Devon sold in June 2019 and the Barnett Shale assets that Devon has contracted to sell and is expected to close in the fourth quarter of 2020.
|
|
|
Three Months Ended March 31st, |
|
|||||
|
|
|
2020 |
|
|
2019 |
|
||
|
Canadian tax payments |
|
$ |
(153 |
) |
|
$ |
— |
|
|
Other |
|
|
22 |
|
|
|
(59 |
) |
|
Operating activities |
|
|
(131 |
) |
|
|
(59 |
) |
|
Investing activities |
|
|
(1 |
) |
|
|
(59 |
) |
|
Financing activities |
|
|
— |
|
|
|
(7 |
) |
|
Effect of exchange rate changes on cash |
|
|
(23 |
) |
|
|
1 |
|
|
Net change in cash, cash equivalents and restricted cash of discontinued operations |
|
$ |
(155 |
) |
|
$ |
(124 |
) |
Operating cash flows in the first quarter of 2020 include $153 million of cash income tax payments in Canada related to divestitures. Additionally, operating cash flow was negatively affected in the first quarter of 2019 primarily due to realization impacts associated with the widening Canadian differentials in the fourth quarter of 2018. See Note 2 and Note 17 in “Part I. Financial Information – Item 1. Financial Statements” in this report for additional details on these divestitures.
Liquidity
The business of exploring for, developing and producing oil and natural gas is capital intensive. Because oil, natural gas and NGL reserves are a depleting resource, we, like all upstream operators, must continually make capital investments to grow and even sustain production. Generally, our capital investments are focused on drilling and completing new wells and maintaining production from existing wells. At opportunistic times, we also acquire operations and properties from other operators or land owners to enhance our existing portfolio of assets.
Historically, our primary sources of capital funding and liquidity have been our operating cash flow, cash on hand and asset divestiture proceeds. Additionally, we maintain a commercial paper program, supported by our revolving line of credit, which can be
35
accessed as needed to supplement operating cash flow and cash balances. If needed, we can also issue debt and equity securities, including through transactions under our shelf registration statement filed with the SEC. We estimate the combination of our sources of capital will continue to be adequate to fund our planned capital requirements as discussed in this section.
Beginning in the first quarter of 2020, the macro-economic environment has deteriorated significantly and has created extreme volatility primarily due to concerns arising from the COVID-19 pandemic. In response to this environment, we will continue to maintain flexibility within our capital program as we continue to focus on protecting our financial strength and maintaining operational continuity.
Operating Cash Flow
Key inputs into determining our planned capital investment are the amounts of cash we hold and operating cash flow we expect to generate over the next one to three or more years. At the end of the first quarter of 2020, we held approximately $1.7 billion of cash, inclusive of $200 million of cash restricted for discontinued operations. Our operating cash flow forecasts are sensitive to many variables and include a measure of uncertainty as the actual results of these variables may differ from our expectations.
Commodity Prices – The most uncertain and volatile variables for our operating cash flow are the prices of the oil, gas and NGLs we produce and sell. Prices are determined primarily by prevailing market conditions. Regional and worldwide economic activity, weather and other substantially variable factors influence market conditions for these products. These factors, which are difficult to predict, create volatility in prices and are beyond our control.
Actions taken by governments around the world in response to the COVID-19 pandemic have led to an unprecedented decline in global oil demand. Oil prices, which had already been trending down on concerns about oversupply, subsequently collapsed in March. Benchmark WTI spot oil prices fell from over $60/Bbl in early January to less than $20/Bbl in April.
To mitigate some of the risk inherent in prices, we utilize various derivative financial instruments to protect a portion of our production against downside price risk. We hedge our production in a manner that systematically places hedges for several quarters in advance, allowing us to maintain a disciplined risk management program as it relates to commodity price volatility. We supplement the systematic hedging program with discretionary hedges that take advantage of favorable market conditions. For the remainder of 2020, we have approximately 90% of our oil production hedged with an average floor price of $42/Bbl and approximately 45% of our gas production hedged with an average floor price of $2.15/Mcf. Additionally, we are currently building our 2021 hedge positions at market prices. The key terms to our oil, gas and NGL derivative financial instruments as of March 31, 2020 are presented in Note 3 in “Part I. Financial Information – Item 1. Financial Statements” of this report.
Operating Expenses – Commodity prices can also affect our operating cash flow through an indirect effect on operating expenses. Significant commodity price decreases can lead to a decrease in drilling and development activities. As a result, the demand and cost for people, services, equipment and materials may also decrease, causing a positive impact on our cash flow as the prices paid for services and equipment decline. However, the inverse is also generally true during periods of rising commodity prices.
Credit Losses – Our operating cash flow is also exposed to credit risk in a variety of ways. This includes the credit risk related to customers who purchase our oil, gas and NGL production, the collection of receivables from our joint-interest partners for their proportionate share of expenditures made on projects we operate and counterparties to our derivative financial contracts. We utilize a variety of mechanisms to limit our exposure to the credit risks of our customers, partners and counterparties. Such mechanisms include, under certain conditions, requiring letters of credit, prepayments or collateral postings and other protections allowed per our agreements.
Divestitures of Property and Equipment
In April 2020, we amended the terms on the sale of our Barnett Shale assets with an expected close date of December 31, 2020. Under the terms of the agreement, we received the deposit funds of $170 million in April 2020. The deposit is being held by us pursuant to the terms of the sale agreement, which only requires us to return such funds to BKV in the event the transaction does not close as a result of our breach of our closing obligations.
Capital Expenditures
In response to the current macro-economic environment, we reduced our 2020 capital expenditures outlook by approximately $800 million, or 45% compared to the original capital budget, and expect to fund our 2020 capital program within operating cash flows, even at current depressed commodity prices. Our exploration and development budget for the remainder of 2020 is expected to range from $0.6 billion to $0.7 billion. As economic factors change, we will continue to be flexible with our capital program.
36
Credit Availability
As of March 31, 2020, we had approximately $3.0 billion of available borrowing capacity under our Senior Credit Facility. This credit facility supports our $3.0 billion of short-term credit under our commercial paper program. At March 31, 2020, there were no borrowings under our commercial paper program, and we were in compliance with the Senior Credit Facility’s financial covenant.
Debt Ratings
We receive debt ratings from the major ratings agencies in the U.S. In determining our debt ratings, the agencies consider a number of qualitative and quantitative items including, but not limited to, commodity pricing levels, our liquidity, asset quality, reserve mix, debt levels, cost structure, planned asset sales and production growth opportunities. Our credit rating from Standard and Poor’s Financial Services is BBB- with a negative outlook. Our credit rating from Fitch is BBB with a stable outlook. Our credit rating from Moody’s Investor Service is Ba1 with a stable outlook. Any rating downgrades may result in additional letters of credit or cash collateral being posted under certain contractual arrangements.
Share Repurchase Program
In December 2019, our Board of Directors approved a $1.0 billion share repurchase program that expires on December 31, 2020. Through March 31, 2020, we had executed $38 million of the authorized program. However, as the pricing and economic environment has deteriorated due to the COVID-19 pandemic and demand challenges for commodities, we have temporarily suspended our share repurchase program to preserve liquidity. Additionally, due to the amended terms of our Barnett Shale divestiture, we do not anticipate being able to purchase more than $200 million of the $1.0 billion authorization by the program expiration date. We will monitor economic conditions as they develop and may resume share repurchases of the remaining $162 million, subject to the commodity price environment, the Company’s liquidity and capital resources and other factors.
Critical Accounting Estimates
Income Taxes
The amount of income taxes recorded requires interpretations of complex rules and regulations of federal, state, provincial and foreign tax jurisdictions. We recognize current tax expense based on estimated taxable income for the current period and the applicable statutory tax rates. We routinely assess potential uncertain tax positions and, if required, estimate and establish accruals for such amounts. We have recognized deferred tax assets and liabilities for temporary differences, operating losses and other tax carryforwards. We routinely assess our deferred tax assets and reduce such assets by a valuation allowance if we deem it is more likely than not that some portion or all of the deferred tax assets will not be realized. Due to an unprecedented downturn in the commodity price environment and the resulting asset impairments, Devon had significant deferred tax assets at March 31, 2020. Accordingly, we have reassessed the realizability of our deferred tax assets in future periods and have recorded a 100% valuation allowance against our net deferred tax assets.
Valuation of Long-Lived Assets
Long-lived assets used in operations, including proved and unproved oil and gas properties, are depreciated and assessed for impairment annually or whenever changes in facts and circumstances indicate a possible significant deterioration in future cash flows is expected to be generated by an asset group. For DD&A calculations and impairment assessments, management groups individual assets based on a judgmental assessment of the lowest level (“common operating field”) for which there are identifiable cash flows that are largely independent of the cash flows of other groups of assets.
Management evaluates assets for impairment through an established process in which changes to significant assumptions such as prices, volumes and future development plans are reviewed. If, upon review, the sum of the undiscounted pre-tax cash flows is less than the carrying value of the asset group, the carrying value is written down to estimated fair value. Because there usually is a lack of quoted market prices for long-lived assets, the fair value of impaired assets is typically determined based on the present values of expected future cash flows using discount rates believed to be consistent with those used by principal market participants. The expected future cash flows used for impairment reviews and related fair value calculations are typically based on judgmental assessments of future production volumes, commodity prices, operating costs and capital investment plans, considering all available information at the date of review. The expected future cash flows used for impairment reviews include future production volumes associated with proved producing and risk-adjusted proved undeveloped, probable and possible reserves.
Besides the risk-adjusted estimates of reserves and future production volumes, future commodity prices are the largest driver in the variability of undiscounted pre-tax cash flows. For our impairment determinations, we historically have utilized NYMEX forward
37
strip prices for the first five years and applied internally generated price forecasts for subsequent years. In response to the COVID-19 pandemic, the NYMEX forward market became highly illiquid as evidenced by materially reduced trading volumes for periods beyond 2021. Therefore, we altered our price forecast assumptions to perform our March 31, 2020 impairment computations. Specifically, we supplemented the NYMEX forward strip prices with price forecasts published by reputable investment banks and reservoir engineering firms to estimate our future revenues as of March 31, 2020.
We also estimate and escalate or de-escalate future capital and operating costs by using a method that correlates cost movements to price movements similar to recent history. To measure indicated impairments, we use a market-based weighted-average cost of capital to discount the future net cash flows. Changes to any of the reserves or market-based assumptions can significantly effect estimates of undiscounted and discounted pre-tax cash flows and impact the recognition and amount of impairments.
Reduced demand from the COVID-19 pandemic and management of production levels from Saudi Arabia and Russia caused WTI to decrease more than 60% during the first quarter of 2020. As a result, we reduced our planned 2020 capital investment 45%. With materially lower commodity prices and reduced near-term investment, we assessed all our oil and gas fields for impairment as of March 31, 2020 and recognized proved and unproved impairments totaling $2.8 billion. The impairments relate to our Anadarko Basin and Rockies fields in which our basis included acquisitions completed in 2016 and 2015, respectively, when commodity prices were much higher than they are today.
Based on our March 31, 2020 impairment evaluations, our Eagle Ford asset’s sum of undiscounted pre-tax cash flows exceeds the carrying value by less than 10%. This cushion narrowed significantly since the end of 2019 due to lower benchmark pricing and wider differentials used to estimate future commodity pricing. If prices deteriorate further and/or management significantly reduces planned capital investment in the Eagle Ford field, our Eagle Ford asset could be subject to a material impairment of capitalized costs.
Goodwill
We test goodwill for impairment annually at October 31, or more frequently if events or changes in circumstances dictate that the carrying value of goodwill may not be recoverable. We perform a qualitative assessment to determine whether it is more likely than not that the fair value of goodwill is less than its carrying amount. As part of our qualitative assessment, we considered the general macro-economic, industry and market conditions, changes in cost factors, actual and expected financial performance, significant changes in management, strategy or customers and stock performance. If the qualitative assessment determines that a quantitative goodwill impairment test is required, then the fair value is compared to the carrying value. If the fair value is less than the carrying value, an impairment charge will be recognized for the amount by which the carrying amount exceeds the fair value. Because quoted market prices are not available, the fair value is estimated based upon a valuation analyses including comparable companies and transactions and premiums paid.
Because the trading price of our common stock decreased 73% during the first quarter of 2020 in response to the COVID-19 pandemic, we performed a goodwill impairment test as of March 31, 2020. While the cushion narrowed significantly since our last impairment evaluation, we concluded an impairment was not required as of March 31, 2020. The two most critical judgements included in the March 31, 2020, test were the period utilized to determine Devon’s market capitalization and the control premium. For the test performed as of March 31, 2020, we derived our market capitalization by using our average common stock price from the latter two thirds of March 2020, to align with the time in the quarter subsequent to a key OPEC+ meeting and the date COVID-19 was officially classified as a pandemic. We applied a control premium based on recent comparable market transactions.
Subsequent to the end of the first quarter of 2020, Devon’s common stock price increased approximately 80% during the month of April but remains significantly less than our average trading price before the events experienced in the first quarter of 2020. Although our common stock price and commodity prices are in a period of high volatility, a sustained period of depressed commodity prices would adversely affect our estimates of future operating results, which could result in future goodwill impairments due to the potential impact on the cash flows of our operations. The impairment of goodwill has no effect on liquidity or capital resources. However, it would adversely affect our results of operations in the period recognized.
For additional information regarding our critical accounting policies and estimates, see our 2019 Annual Report on Form 10-K.
38
Non-GAAP Measures
We make reference to “core earnings (loss) attributable to Devon” and “core earnings (loss) per share attributable to Devon” in “Overview of 2020 Results” in this Item 2 that are not required by or presented in accordance with GAAP. These non-GAAP measures are not alternatives to GAAP measures and should not be considered in isolation or as a substitute for analysis of our results reported under GAAP. Core earnings (loss) attributable to Devon, as well as the per share amount, represent net earnings excluding certain noncash and other items that are typically excluded by securities analysts in their published estimates of our financial results. For more information on the results of discontinued operations for our Barnett Shale asset and Canadian operations, see Note 17 in “Part I. Financial Information – Item 1. Financial Statements” in this report. Our non-GAAP measures are typically used as a quarterly performance measure. Amounts excluded relate to asset dispositions, noncash asset impairments (including noncash unproved asset impairments), deferred tax asset valuation allowance, fair value changes in derivative financial instruments and foreign currency, changes in tax legislation and restructuring and transaction costs associated with the workforce reductions in 2019.
We believe these non-GAAP measures facilitate comparisons of our performance to earnings estimates published by securities analysts. We also believe these non-GAAP measures can facilitate comparisons of our performance between periods and to the performance of our peers.
Below are reconciliations of our core earnings and core earnings per share attributable to Devon to their comparable GAAP measures.
39
|
|
Three Months Ended March 31, |
|
|||||||||||||
|
|
Before tax |
|
|
After tax |
|
|
After Noncontrolling Interests |
|
|
Per Diluted Share |
|
||||
|
2020 |
|
|
|
|
|
|
|
|
|
|
|
|
|
|
|
|
Continuing Operations |
|
|
|
|
|
|
|
|
|
|
|
|
|
|
|
|
Loss attributable to Devon (GAAP) |
$ |
(2,107 |
) |
|
$ |
(1,690 |
) |
|
$ |
(1,691 |
) |
|
$ |
(4.48 |
) |
|
Adjustments: |
|
|
|
|
|
|
|
|
|
|
|
|
|
|
|
|
Asset and exploration impairments |
|
2,776 |
|
|
|
2,146 |
|
|
|
2,146 |
|
|
|
5.66 |
|
|
Deferred tax asset valuation allowance |
|
— |
|
|
|
108 |
|
|
|
108 |
|
|
|
0.28 |
|
|
Fair value changes in financial instruments |
|
(619 |
) |
|
|
(479 |
) |
|
|
(479 |
) |
|
|
(1.24 |
) |
|
Change in tax legislation |
|
— |
|
|
|
(62 |
) |
|
|
(62 |
) |
|
|
(0.16 |
) |
|
Core earnings attributable to Devon (Non-GAAP) |
$ |
50 |
|
|
$ |
23 |
|
|
$ |
22 |
|
|
$ |
0.06 |
|
|
Discontinued Operations |
|
|
|
|
|
|
|
|
|
|
|
|
|
|
|
|
Loss attributable to Devon (GAAP) |
$ |
(157 |
) |
|
$ |
(125 |
) |
|
$ |
(125 |
) |
|
$ |
(0.34 |
) |
|
Adjustments: |
|
|
|
|
|
|
|
|
|
|
|
|
|
|
|
|
Asset impairments |
|
179 |
|
|
|
141 |
|
|
|
141 |
|
|
|
0.38 |
|
|
Fair value changes in foreign currency and other |
|
10 |
|
|
|
10 |
|
|
|
10 |
|
|
|
0.03 |
|
|
Core earnings attributable to Devon (Non-GAAP) |
$ |
32 |
|
|
$ |
26 |
|
|
$ |
26 |
|
|
$ |
0.07 |
|
|
Total |
|
|
|
|
|
|
|
|
|
|
|
|
|
|
|
|
Loss attributable to Devon (GAAP) |
$ |
(2,264 |
) |
|
$ |
(1,815 |
) |
|
$ |
(1,816 |
) |
|
$ |
(4.82 |
) |
|
Adjustments: |
|
|
|
|
|
|
|
|
|
|
|
|
|
|
|
|
Continuing Operations |
|
2,157 |
|
|
|
1,713 |
|
|
|
1,713 |
|
|
|
4.54 |
|
|
Discontinued Operations |
|
189 |
|
|
|
151 |
|
|
|
151 |
|
|
|
0.41 |
|
|
Core earnings attributable to Devon (Non-GAAP) |
$ |
82 |
|
|
$ |
49 |
|
|
$ |
48 |
|
|
$ |
0.13 |
|
|
2019 |
|
|
|
|
|
|
|
|
|
|
|
|
|
|
|
|
Continuing Operations |
|
|
|
|
|
|
|
|
|
|
|
|
|
|
|
|
Loss attributable to Devon (GAAP) |
$ |
(497 |
) |
|
$ |
(378 |
) |
|
$ |
(378 |
) |
|
$ |
(0.89 |
) |
|
Adjustments: |
|
|
|
|
|
|
|
|
|
|
|
|
|
|
|
|
Asset dispositions |
|
(45 |
) |
|
|
(35 |
) |
|
|
(35 |
) |
|
|
(0.08 |
) |
|
Asset and exploration impairments |
|
1 |
|
|
|
1 |
|
|
|
1 |
|
|
|
0.00 |
|
|
Deferred tax asset valuation allowance |
|
— |
|
|
|
(13 |
) |
|
|
(13 |
) |
|
|
(0.03 |
) |
|
Fair value changes in financial instruments |
|
638 |
|
|
|
492 |
|
|
|
492 |
|
|
|
1.15 |
|
|
Restructuring and transaction costs |
|
51 |
|
|
|
39 |
|
|
|
39 |
|
|
|
0.09 |
|
|
Core earnings attributable to Devon (Non-GAAP) |
$ |
148 |
|
|
$ |
106 |
|
|
$ |
106 |
|
|
$ |
0.24 |
|
|
Discontinued Operations |
|
|
|
|
|
|
|
|
|
|
|
|
|
|
|
|
Loss attributable to Devon (GAAP) |
$ |
70 |
|
|
$ |
61 |
|
|
$ |
61 |
|
|
$ |
0.15 |
|
|
Adjustments: |
|
|
|
|
|
|
|
|
|
|
|
|
|
|
|
|
Asset dispositions |
|
1 |
|
|
|
1 |
|
|
|
1 |
|
|
|
0.00 |
|
|
Deferred tax asset valuation allowance |
|
— |
|
|
|
(5 |
) |
|
|
(5 |
) |
|
|
(0.01 |
) |
|
Fair value changes in financial instruments and foreign currency and other |
|
(3 |
) |
|
|
(8 |
) |
|
|
(8 |
) |
|
|
(0.03 |
) |
|
Restructuring and transaction costs |
|
3 |
|
|
|
3 |
|
|
|
3 |
|
|
|
0.01 |
|
|
Core earnings attributable to Devon (Non-GAAP) |
$ |
71 |
|
|
$ |
52 |
|
|
$ |
52 |
|
|
$ |
0.12 |
|
|
Total |
|
|
|
|
|
|
|
|
|
|
|
|
|
|
|
|
Loss attributable to Devon (GAAP) |
$ |
(427 |
) |
|
$ |
(317 |
) |
|
$ |
(317 |
) |
|
$ |
(0.74 |
) |
|
Adjustments: |
|
|
|
|
|
|
|
|
|
|
|
|
|
|
|
|
Continuing Operations |
|
645 |
|
|
|
484 |
|
|
|
484 |
|
|
|
1.13 |
|
|
Discontinued Operations |
|
1 |
|
|
|
(9 |
) |
|
|
(9 |
) |
|
|
(0.03 |
) |
|
Core earnings attributable to Devon (Non-GAAP) |
$ |
219 |
|
|
$ |
158 |
|
|
$ |
158 |
|
|
$ |
0.36 |
|
40
EBITDAX and Field-Level Cash Margin
To assess the performance of our assets, we use EBITDAX and Field-Level Cash Margin. We compute EBITDAX as net earnings from continuing operations before income tax expense; financing costs, net; exploration expenses; DD&A; asset impairments; asset disposition gains and losses; non-cash share-based compensation; non-cash valuation changes for derivatives and financial instruments; restructuring and transaction costs; accretion on discounted liabilities; and other items not related to our normal operations. Field-Level Cash Margin is computed as oil, gas and NGL revenues less production expenses. Production expenses consist of lease operating, gathering, processing and transportation expenses, as well as production and property taxes.
We exclude financing costs from EBITDAX to assess our operating results without regard to our financing methods or capital structure. Exploration expenses and asset disposition gains and losses are excluded from EBITDAX because they generally are not indicators of operating efficiency for a given reporting period. DD&A and impairments are excluded from EBITDAX because capital expenditures are evaluated at the time capital costs are incurred. We exclude share-based compensation, valuation changes, restructuring and transaction costs, accretion on discounted liabilities and other items from EBITDAX because they are not considered a measure of asset operating performance.
We believe EBITDAX and Field-Level Cash Margin provide information useful in assessing our operating and financial performance across periods. EBITDAX and Field-Level Cash Margin as defined by Devon may not be comparable to similarly titled measures used by other companies and should be considered in conjunction with net earnings from continuing operations.
Below are reconciliations of net earnings to EBITDAX and a further reconciliation to Field-Level Cash Margin.
|
|
Three Months Ended March 31, |
|
|||||
|
|
2020 |
|
|
2019 |
|
||
|
Net loss (GAAP) |
$ |
(1,815 |
) |
|
$ |
(317 |
) |
|
Net (earnings) loss from discontinued operations, net of tax |
|
125 |
|
|
|
(61 |
) |
|
Financing costs, net |
|
65 |
|
|
|
60 |
|
|
Income tax benefit |
|
(417 |
) |
|
|
(119 |
) |
|
Exploration expenses |
|
112 |
|
|
|
4 |
|
|
Depreciation, depletion and amortization |
|
401 |
|
|
|
360 |
|
|
Asset impairments |
|
2,666 |
|
|
|
— |
|
|
Asset dispositions |
|
— |
|
|
|
(45 |
) |
|
Share-based compensation |
|
20 |
|
|
|
23 |
|
|
Derivative and financial instrument non-cash valuation changes |
|
(619 |
) |
|
|
638 |
|
|
Restructuring and transaction costs |
|
— |
|
|
|
51 |
|
|
Accretion on discounted liabilities and other |
|
(48 |
) |
|
|
(22 |
) |
|
EBITDAX (non-GAAP) |
|
490 |
|
|
|
572 |
|
|
Marketing and midstream revenues and expenses, net |
|
18 |
|
|
|
(15 |
) |
|
Commodity derivative cash settlements |
|
(101 |
) |
|
|
(34 |
) |
|
General and administration expenses, cash-based |
|
82 |
|
|
|
112 |
|
|
Field-level cash margin (non-GAAP) |
$ |
489 |
|
|
$ |
635 |
|
41
Item 3. Quantitative and Qualitative Disclosures About Market Risk
Commodity Price Risk
As of March 31, 2020, we have commodity derivatives that pertain to a portion of our estimated production for the last nine months of 2020, as well as for 2021. The key terms to our open oil, gas and NGL derivative financial instruments are presented in Note 3 in “Part I. Financial Information – Item 1. Financial Statements” in this report.
The fair values of our commodity derivatives are largely determined by the forward curves of the relevant price indices. At March 31, 2020, a 10% change in the forward curves associated with our commodity derivative instruments would have changed our net positions by approximately $140 million.
Interest Rate Risk
As of March 31, 2020, we had total debt of $4.3 billion. All of our debt is based on fixed interest rates averaging 6.0%.
Foreign Currency Risk
Devon has certain Canadian dollar obligations associated with its divested Canadian operations which are to be paid with the cash restricted for discontinued operations. These balances are remeasured using the applicable exchange rate as of the end of the reporting period. A 10% unfavorable change in the Canadian-to-U.S. dollar exchange rate would not have materially impacted our March 31, 2020 balance sheet for these items. See Note 17 in “Part I. Financial Information – Item 1. Financial Statements” in this report for additional information.
Item 4. Controls and Procedures
Disclosure Controls and Procedures
We have established disclosure controls and procedures to ensure that material information relating to Devon, including its consolidated subsidiaries, is made known to the officers who certify Devon’s financial reports and to other members of senior management and the Board of Directors.
Based on their evaluation, our principal executive and principal financial officers have concluded that our disclosure controls and procedures (as defined in Rules 13a-15(e) and 15d-15(e) under the Securities Exchange Act of 1934) were effective as of March 31, 2020 to ensure that the information required to be disclosed by Devon in the reports that it files or submits under the Securities Exchange Act of 1934 is recorded, processed, summarized and reported within the time periods specified in the SEC rules and forms.
Changes in Internal Control Over Financial Reporting
There were no changes in our internal control over financial reporting that occurred during our most recent fiscal quarter that have materially affected, or are reasonably likely to materially affect, our internal control over financial reporting.
42
PART II. Other Information
Item 1. Legal Proceedings
We are involved in various legal proceedings incidental to our business. However, to our knowledge as of the date of this report, there were no material pending legal proceedings to which we are a party or to which any of our property is subject.
Please see our 2019 Annual Report on Form 10-K and other SEC filings for additional information.
Item 1A. Risk Factors
Except for the addition of the pandemic risk factor discussed below, there have been no material changes to the information included in Item 1A. “Risk Factors” in our 2019 Annual Report on Form 10-K.
Our Business Has Been Adversely Impacted by the COVID-19 Pandemic, and We May Experience Continuing or Worsening Adverse Effects From This or Other Pandemics
Commodity Price Impacts – The COVID-19 pandemic and related economic repercussions have created significant volatility, uncertainty and turmoil in the oil and gas industry. This outbreak and the related responses of governmental authorities and others to limit the spread of the virus have significantly reduced global economic activity, resulting in an unprecedented decline in the demand for oil and other commodities. This supply-and-demand imbalance has been exacerbated by uncertainty regarding the future global supply of oil due to disputes between Russia and the members of OPEC, particularly Saudi Arabia. These factors caused a swift and material deterioration in commodity prices in early 2020, with NYMEX WTI oil prices falling from over $60/Bbl at the beginning of the year to lower than $20/Bbl as of April 2020. While OPEC and other oil producing nations agreed in April 2020 to cut production, downward pressure on commodity prices has remained and could continue for the foreseeable future. This decline in commodity prices has already adversely impacted our results of operations for the first quarter of 2020 and contributed to our recognition of a material asset impairment to our oil and gas assets during the same period. As further described in the “Risk Factors” section of our 2019 Annual Report on Form 10-K, any sustained weakness or further deterioration in commodity prices could further adversely impact our results of operations, the value of our properties and our financial condition.
The current supply-and-demand imbalance has also imposed constraints on Devon’s and other operators’ ability to store and move production to downstream markets, which has resulted in the delay or curtailment of development activity, as well as the shutting-in of producing wells. Moreover, certain regional prices have disproportionally declined relative to broader market indices in areas that have experienced acute takeaway capacity constraints, thereby potentially further reducing our realized pricing in such impacted areas. If we are forced to shut in additional production, we will likely incur greater costs to bring the associated production back online, and such costs may be significant enough that such wells may become non-economic at low commodity price levels, which may lead to decreases in our proved reserve estimates and potential impairments and associated charges to our earnings. If we are able to bring wells back online, there is no assurance that such wells will be as productive following recommencement as they were prior to being shut in.
General Financial and Economic Impacts - The negative effects of COVID-19 on economic prospects across the world have contributed to concerns for the potential of a prolonged economic slowdown and recession. Any such downturn, or a protracted period of depressed commodity prices, could have significant adverse consequences for our financial condition and liquidity, by, among other things: (i) limiting our ability to access sources of capital due to disruptions in financial markets or otherwise; and (ii) increasing the risk of a downgrade from credit rating agencies, which could trigger new credit support obligations and further adversely affect our ability to access financing or trade credit. Moreover, any such downturn could also result in similar financial constraints for our non-operating partners, purchasers of our production and other counterparties, thereby increasing the risk that such counterparties default on their obligations to us. Such defaults or more general supply chain disruptions due to the pandemic may also jeopardize the supply of materials, equipment or services for our operations. For additional information regarding liquidity and counterparty credit risks, please see the “Risk Factors” section of the 2019 Annual Report on Form 10-K.
Other Impacts - The COVID-19 pandemic and related restrictions aimed at mitigating its spread have caused us to modify certain of our business practices, including limiting employee travel, encouraging work-from-home practices and other social distancing measures. Such measures may cause disruptions to our business and operational plans, which may include shortages of employees, contractors and subcontractors. There is no certainty that these or any other future measures will be sufficient to mitigate the risks posed by the disease, including the risk of infection of key employees, and our ability to perform certain functions could be impaired by these new business practices. For example, our reliance on technology has necessarily increased due to our encouragement of remote communications and other work-from-home practices, which could make us more vulnerable to cyber attacks. See the “Risk Factors” section of the 2019 Annual Report on Form 10-K for additional information regarding cyber attack risks.
43
The COVID-19 pandemic and its related effects continue to rapidly evolve. The ultimate extent of the impact of the COVID-19 pandemic and any other future pandemic on our business will depend on future developments, including, but not limited to, the nature, duration and spread of the disease, the responsive actions to contain its spread or address its effects and the duration, timing and severity of the related consequences on commodity prices and the economy more generally, including any recession resulting from the pandemic. Any extended period of depressed commodity prices or general economic disruption as a result of the pandemic would adversely affect our business, financial condition and results of operations. In addition, the COVID-19 pandemic has heightened, and any future pandemic could heighten, the other risks and uncertainties discussed in the “Risk Factors” section of the 2019 Annual Report on Form 10-K.
Item 2. Unregistered Sales of Equity Securities and Use of Proceeds
The following table provides information regarding purchases of our common stock that were made by us during the first quarter of 2020 (shares in thousands).
|
Period |
|
Total Number of Shares Purchased (1) |
|
|
Average Price Paid per Share |
|
|
Total Number of Shares Purchased As Part of Publicly Announced Plans or Programs (2) |
|
|
Maximum Dollar Value of Shares that May Yet Be Purchased Under the Plans or Programs (2) |
|
||||
|
January 1 - January 31 |
|
|
18 |
|
|
$ |
24.99 |
|
|
|
— |
|
|
$ |
1,000 |
|
|
February 1 - February 29 |
|
|
2,175 |
|
|
$ |
18.71 |
|
|
|
1,568 |
|
|
$ |
973 |
|
|
March 1 - March 31 |
|
|
830 |
|
|
$ |
16.01 |
|
|
|
675 |
|
|
$ |
962 |
|
|
Total |
|
|
3,023 |
|
|
$ |
18.00 |
|
|
|
2,243 |
|
|
|
|
|
|
|
(1) |
In addition to shares purchased under the share repurchase program described below, these amounts also included 780,000 shares received by us from employees for the payment of personal income tax withholding on vesting transactions. |
|
|
(2) |
On December 17, 2019, we announced a $1.0 billion share repurchase program that has a December 31, 2020 expiration date. As of March 31, 2020, we had repurchased 2.2 million common shares for $38 million, or $16.85 per share, under our share repurchases program. Due to the amended terms of the Barnett Shale divestiture with BKV, we do not anticipate being able to repurchase more than $200 million of the $1.0 billion authorization by the program expiration date. As a result of the COVID-19 pandemic and related economic impacts, Devon has temporarily suspended its share repurchase program to preserve liquidity. Devon will monitor economic conditions as they develop and may resume share repurchases, subject to the commodity price environment, the Company’s liquidity and capital resources and other factors. Any such repurchases under the program may be made in open-market or private transactions or through the use of ASR programs. For additional information, see Note 16 in “Part I. Financial Information – Item 1. Financial Statements” of this report. |
Under the Devon Plan, eligible employees made purchases of shares of our common stock through an investment in the Devon Stock Fund, which is administered by an independent trustee. Eligible employees purchased approximately 5,800 shares of our common stock in the first quarter of 2020, at then-prevailing stock prices, that they held through their ownership in the Stock Fund. We acquired the shares of our common stock sold under the Devon Plan through open-market purchases.
Item 3. Defaults Upon Senior Securities
Not applicable.
Item 4. Mine Safety Disclosures
Not applicable.
Item 5. Other Information
Not applicable.
44
Item 6. Exhibits
|
Exhibit Number |
|
Description |
|
|
|
|
|
|
|
|
|
10.1* |
|
|
|
|
|
|
|
10.2* |
|
|
|
|
|
|
|
10.3* |
|
|
|
|
|
|
|
10.4* |
|
|
|
|
|
|
|
31.1 |
|
|
|
|
|
|
|
31.2 |
|
|
|
|
|
|
|
32.1 |
|
|
|
|
|
|
|
32.2 |
|
|
|
|
|
|
|
101.INS |
|
Inline XBRL Instance Document – the XBRL Instance Document does not appear in the Interactive Data File because its XBRL tags are embedded within the Inline XBRL document. |
|
|
|
|
|
101.SCH |
|
Inline XBRL Taxonomy Extension Schema Document. |
|
|
|
|
|
101.CAL |
|
Inline XBRL Taxonomy Extension Calculation Linkbase Document. |
|
|
|
|
|
101.DEF |
|
Inline XBRL Taxonomy Extension Definition Linkbase Document. |
|
|
|
|
|
101.LAB |
|
Inline XBRL Taxonomy Extension Labels Linkbase Document. |
|
|
|
|
|
101.PRE |
|
Inline XBRL Taxonomy Extension Presentation Linkbase Document. |
|
|
|
|
|
104 |
|
Cover Page Interactive Data File (formatted as Inline XBRL and contained in Exhibit 101). |
_______________
*Indicates management contract or compensatory plan or arrangement.
45
SIGNATURES
Pursuant to the requirements of the Securities Exchange Act of 1934, the registrant has duly caused this report to be signed on its behalf by the undersigned thereunto duly authorized.
|
|
|
|
|
DEVON ENERGY CORPORATION |
|
|
|
|
||
|
Date: May 6, 2020 |
|
|
|
/s/ Jeremy D. Humphers |
|
|
|
|
|
Jeremy D. Humphers |
|
|
|
|
|
Senior Vice President and Chief Accounting Officer |
46