UNITED STATES
SECURITIES AND EXCHANGE COMMISSION
Washington, D.C. 20549
Form
(Mark One)
|
|
ANNUAL REPORT PURSUANT TO SECTION 13 OR 15(d) OF THE SECURITIES EXCHANGE ACT OF 1934 |
For the fiscal year ended
or
|
|
TRANSITION REPORT PURSUANT TO SECTION 13 OR 15(d) OF THE SECURITIES EXCHANGE ACT OF 1934 |
Commission File Number
DEVON ENERGY CORPORATION
(Exact name of registrant as specified in its charter)
|
|
|
|
|
(State or other jurisdiction of incorporation or organization) |
|
(I.R.S. Employer identification No.) |
|
|
|
|
|
|
|
|
|
(Address of principal executive offices) |
|
(Zip code) |
Registrant’s telephone number, including area code: (
Securities registered pursuant to Section 12(b) of the Act:
|
|
Title of each class |
|
Trading Symbol |
|
Name of each exchange on which registered |
|
|
|
|
|
|
|
|
|
Securities registered pursuant to Section 12(g) of the Act: None
Indicate by check mark if the registrant is a well-known seasoned issuer, as defined in Rule 405 of the Securities Act.
Indicate by check mark if the registrant is not required to file reports pursuant to Section 13 or Section 15(d) of the Act. Yes ☐
Indicate by check mark whether the registrant (1) has filed all reports required to be filed by Section 13 or 15(d) of the Securities Exchange Act of 1934 during the preceding 12 months (or for such shorter period that the registrant was required to file such reports), and (2) has been subject to such filing requirements for the past 90 days.
Indicate by check mark whether the registrant has submitted electronically every Interactive Data File required to be submitted pursuant to Rule 405 of Regulation S-T (§232.405 of this chapter) during the preceding 12 months (or for such shorter period that the registrant was required to submit such files).
Indicate by check mark whether the registrant is a large accelerated filer, an accelerated filer, a non-accelerated filer, a smaller reporting company or an emerging growth company. See the definitions of “large accelerated filer,” “accelerated filer,” “smaller reporting company,” and “emerging growth company” in Rule 12b-2 of the Exchange Act.
|
Large accelerated filer |
|
☑ |
Accelerated filer |
|
☐ |
Non-accelerated filer |
|
☐ |
|
Smaller reporting company |
|
|
Emerging growth company |
|
|
|
|
|
If an emerging growth company, indicate by check mark if the registrant has elected not to use the extended transition period for complying with any new or revised financial accounting standards provided pursuant to Section 13(a) of the Exchange Act. ☐
Indicate by check mark whether the registrant is a shell company (as defined in Rule 12b-2 of the Act). Yes
The aggregate market value of the voting common stock held by non-affiliates of the registrant as of June 28, 2019 was approximately $
DOCUMENTS INCORPORATED BY REFERENCE
DEVON ENERGY CORPORATION
FORM 10-K
TABLE OF CONTENTS
2
DEFINITIONS
Unless the context otherwise indicates, references to “us,” “we,” “our,” “ours,” “Devon,” the “Company” and “Registrant” refer to Devon Energy Corporation and its consolidated subsidiaries. All monetary values, other than per unit and per share amounts, are stated in millions of U.S. dollars unless otherwise specified. In addition, the following are other abbreviations and definitions of certain terms used within this Annual Report on Form 10-K:
“2015 Plan” means the Devon Energy Corporation 2015 Long-Term Incentive Plan.
“2017 Plan” means the Devon Energy Corporation 2017 Long-Term Incentive Plan.
“ASC” means Accounting Standards Codification.
“ASR” means an accelerated share-repurchase transaction with a financial institution to repurchase Devon’s common stock.
“ASU” means Accounting Standards Update.
“Bbl” or “Bbls” means barrel or barrels.
“Bcf” means billion cubic feet.
“BKV” means Banpu Kalnin Ventures.
“BLM” means the United States Bureau of Land Management.
“Boe” means barrel of oil equivalent. Gas proved reserves and production are converted to Boe, at the pressure and temperature base standard of each respective state in which the gas is produced, at the rate of six Mcf of gas per Bbl of oil, based upon the approximate relative energy content of gas and oil. Bitumen and NGL proved reserves and production are converted to Boe on a one-to-one basis with oil.
“Btu” means British thermal units, a measure of heating value.
“Canada” means the division of Devon encompassing oil and gas properties located in Canada. All dollar amounts associated with Canada are in U.S. dollars, unless stated otherwise.
“CDM” means Cotton Draw Midstream, L.L.C.
“DD&A” means depreciation, depletion and amortization expenses.
“Devon Financing” means Devon Financing Company, L.L.C.
“Devon Plan” means Devon Energy Corporation Incentive Savings Plan.
“EnLink” means EnLink Midstream Partners, LP, a master limited partnership.
“EPA” means the United States Environmental Protection Agency.
“FASB” means Financial Accounting Standards Board.
“Federal Funds Rate” means the interest rate at which depository institutions lend balances at the Federal Reserve to other depository institutions overnight.
“G&A” means general and administrative expenses.
“GAAP” means U.S. generally accepted accounting principles.
“General Partner” means EnLink Midstream, LLC, the indirect general partner entity of EnLink, and, unless the context otherwise indicates, EnLink Midstream Manager, LLC, the managing member of EnLink Midstream, LLC.
“Inside FERC” refers to the publication Inside F.E.R.C.’s Gas Market Report.
“LIBOR” means London Interbank Offered Rate.
“LOE” means lease operating expenses.
“MBbls” means thousand barrels.
“MBoe” means thousand Boe.
“Mcf” means thousand cubic feet.
“MMBbls” means million barrels.
3
“MMBoe” means million Boe.
“MMBtu” means million Btu.
“MMcf” means million cubic feet.
“N/M” means not meaningful.
“NGL” or “NGLs” means natural gas liquids.
“NYMEX” means New York Mercantile Exchange.
“NYSE” means New York Stock Exchange.
“OPEC” means Organization of the Petroleum Exporting Countries.
“OPIS” means Oil Price Information Service.
“SEC” means United States Securities and Exchange Commission.
“Senior Credit Facility” means Devon’s syndicated unsecured revolving line of credit, effective as of October 5, 2018.
“Standardized measure” means the present value of after-tax future net revenues discounted at 10% per annum.
“S&P 500 Index” means Standard and Poor’s 500 index.
“Tax Reform Legislation” means Tax Cuts and Jobs Act.
“TSR” means total shareholder return.
“U.S.” means United States of America.
“VIE” means variable interest entity.
“WTI” means West Texas Intermediate.
“/Bbl” means per barrel.
“/d” means per day.
“/MMBtu” means per MMBtu.
4
INFORMATION REGARDING FORWARD-LOOKING STATEMENTS
This report includes “forward-looking statements” as defined by the SEC. Such statements include those concerning strategic plans, our expectations and objectives for future operations, as well as other future events or conditions, and are often identified by use of the words and phrases “expects,” “believes,” “will,” “would,” “could,” “continue,” “may,” “aims,” “likely to be,” “intends,” “forecasts,” “projections,” “estimates,” “plans,” “expectations,” “targets,” “opportunities,” “potential,” “anticipates,” “outlook” and other similar terminology. All statements, other than statements of historical facts, included in this report that address activities, events or developments that Devon expects, believes or anticipates will or may occur in the future are forward-looking statements. Such statements are subject to a number of assumptions, risks and uncertainties, many of which are beyond our control. Consequently, actual future results could differ materially from our expectations due to a number of factors, including, but not limited to:
|
|
• |
the volatility of oil, gas and NGL prices; |
|
|
• |
uncertainties inherent in estimating oil, gas and NGL reserves; |
|
|
• |
the extent to which we are successful in acquiring and discovering additional reserves; |
|
|
• |
the uncertainties, costs and risks involved in our operations, including as a result of employee misconduct; |
|
|
• |
regulatory restrictions, compliance costs and other risks relating to governmental regulation, including with respect to environmental matters; |
|
|
• |
risks related to regulatory, social and market efforts to address climate change; |
|
|
• |
risks related to our hedging activities; |
|
|
• |
counterparty credit risks; |
|
|
• |
risks relating to our indebtedness; |
|
|
• |
risks related to environmental regulations; |
|
|
• |
cyberattack risks; |
|
|
• |
our limited control over third parties who operate some of our oil and gas properties; |
|
|
• |
midstream capacity constraints and potential interruptions in production; |
|
|
• |
the extent to which insurance covers any losses we may experience; |
|
|
• |
competition for assets, materials, people and capital; |
|
|
• |
risks related to investors attempting to effect change; |
|
|
• |
our ability to successfully complete mergers, acquisitions and divestitures; and |
|
|
• |
any of the other risks and uncertainties discussed in this report. |
All subsequent written and oral forward-looking statements attributable to Devon, or persons acting on its behalf, are expressly qualified in their entirety by the cautionary statements above. We assume no duty to update or revise our forward-looking statements based on new information, future events or otherwise.
5
PART I
Items 1 and 2. Business and Properties
General
A Delaware corporation formed in 1971 and publicly held since 1988, Devon (NYSE: DVN) is an independent energy company engaged primarily in the exploration, development and production of oil, natural gas and NGLs. Our operations are concentrated in various onshore areas in the U.S. In June 2019, we completed the sale of substantially all of our oil and gas assets and operations in Canada. In December 2019, we announced the sale of our Barnett Shale assets.
Our principal and administrative offices are located at 333 West Sheridan, Oklahoma City, OK 73102-5015 (telephone 405-235-3611). As of December 31, 2019, Devon and its consolidated subsidiaries had approximately 1,800 employees.
Devon files or furnishes annual reports on Form 10-K, quarterly reports on Form 10-Q and current reports on Form 8-K, as well as any amendments to these reports, with the SEC. Through our website, www.devonenergy.com, we make available electronic copies of the documents we file or furnish to the SEC, the charters of the committees of our Board of Directors and other documents related to our corporate governance. The corporate governance documents available on our website include our Code of Ethics for Chief Executive Officer, Chief Financial Officer and Chief Accounting Officer, and any amendments to and waivers from any provision of that Code will also be posted on our website. Access to these electronic filings is available free of charge as soon as reasonably practicable after filing or furnishing them to the SEC. Printed copies of our committee charters or other governance documents and filings can be requested by writing to our corporate secretary at the address on the cover of this report. Reports filed with the SEC are also made available on its website at www.sec.gov.
Our Strategy
Our business strategy is focused on delivering a consistently competitive shareholder return among our peer group. Because the business of exploring for, developing and producing oil and natural gas is capital intensive, delivering sustainable, capital efficient cash flow growth is a key tenant to our success. While our cash flow is highly dependent on volatile and uncertain commodity prices, we pursue our strategy throughout all commodity price cycles with four fundamental principles.
Proven and responsible operator – We operate our business with the interests of our stakeholders and our environmental, social and governance progress in mind. With our vision to be a premier independent oil and natural gas exploration and production company, the work our employees do every day contributes to the local, national and global economies. We produce a valuable commodity that is fundamental to society, and we endeavor to do so in a safe, environmentally responsible and ethical way, while striving to deliver strong returns to our shareholders. We have an ongoing commitment to transparency in reporting our environmental, social and governance performance. See our Sustainability Report published on our company website for performance highlights and additional information. Information contained in our Sustainability Report is not incorporated by reference into, and does not constitute a part of, this Annual Report on Form 10-K.
A premier, sustainable portfolio of assets – As discussed in the next section of this Annual Report, we own a portfolio of assets located in the United States. We strive to own premier assets capable of generating cash flows in excess of our capital and operating requirements, as well as competitive rates of return. We also desire to own a portfolio of assets that can provide a production growth platform extending many years into the future. Due to the strength of oil prices relative to natural gas, we have been positioning our portfolio to be more heavily weighted to U.S. oil assets in recent years.
During 2019, we completed our transition to a U.S. oil company. We sold our Canadian business, generating $2.6 billion in proceeds, and announced the sale of our Barnett Shale assets for approximately $770 million, before purchase price adjustments. As a result of these divestitures, we expect our oil production growth, price realizations and field-level margins will all improve, as we sharpen our focus on four U.S. oil plays located in the Delaware Basin, STACK, Powder River Basin and Eagle Ford.
Superior execution – As we pursue cash flow growth, we continually work to optimize the efficiency of our capital programs and production operations, with an underlying objective of reducing absolute and per unit costs and enhancing our returns. We also strive to leverage our culture of health, safety and environmental stewardship in all aspects of our business.
Throughout 2019, we continued to achieve efficiency gains in various aspects of our business. Our initial production rates from new wells continued to improve in our four U.S. oil plays and have exceeded the average of the top 40 U.S. producers since 2015 by more than 40%. We continued to improve cycle times, incorporate production optimization strategies and other cost reduction initiatives, driving down breakeven costs across our portfolio of assets.
As we focus on a more streamlined portfolio of U.S. oil assets, we are aggressively pursuing an improved cost structure to further expand margins. We have realized annualized cost savings by reducing well costs, production expense, financing costs and G&A costs.
6
Financial strength and flexibility – Commodity prices are uncertain and volatile, so we strive to maintain a strong balance sheet, as well as adequate liquidity and financial flexibility, in order to operate competitively in all commodity price cycles. Our capital allocation decisions are made with attention to these financial stewardship principles, as well as the priorities of funding our core operations, protecting our investment-grade credit ratings, and paying and growing our shareholder dividend.
During 2019, we reduced our consolidated debt by $1.7 billion, primarily from proceeds from our divestitures. We also raised our quarterly dividend 12.5% and repurchased 69 million shares of common stock under our share repurchase program.
Oil and Gas Properties
Canadian Business and Barnett Shale Assets – Discontinued Operations
As a result of our divestment of substantially all of our oil and gas assets and operations in Canada, as well as the recently announced divestiture of our Barnett Shale assets, amounts associated with these assets are presented as discontinued operations. Therefore, financial and operational data, such as reserves, production, wells and acreage, provided in this document exclude amounts related to our Canadian and Barnett Shale assets unless otherwise noted. Included within the amounts presented as discontinued operations associated with the Barnett Shale are properties divested in previous reporting periods located primarily in Johnson and Wise counties, Texas. For additional information, please see Note 2 in “Item 8. Financial Statements and Supplementary Data” of this report.
Property Profiles
Key summary data from each of our areas of operation as of and for the year ended December 31, 2019 are detailed in the map below.

7
Delaware Basin – The Delaware Basin is Devon’s most active program in the portfolio. Through capital-efficient growth, it offers exploration and low-risk development opportunities from many geologic reservoirs and play types, including the oil-rich Bone Spring, Wolfcamp and Leonard formations. With a significant inventory of oil and liquids-rich drilling opportunities that have multi-zone development potential, Devon has a robust platform to deliver high-margin growth for many years to come. At December 31, 2019, we had eight operated rigs developing this asset. In 2020, we plan to invest approximately $1.0 billion of capital in the Delaware Basin, making it the top-funded asset in the portfolio.
STACK – The STACK development, located primarily in Oklahoma’s Canadian, Kingfisher and Blaine counties, provides long-term optionality through its significant inventory. Our STACK position is one of the largest in the industry, providing visible long-term production. In December 2019, we announced an agreement with Dow to jointly develop a portion of our STACK acreage. Dow will fund approximately 65% of the partnership capital requirements through a drilling carry of $100 million over the next four years. In 2020, we plan approximately $75 million of capital investment.
Powder River Basin – This asset is focused on emerging oil opportunities in the Powder River Basin. Recent drilling success in this basin has expanded our drilling inventory, and we expect further growth as we accelerate activity and continue to de-risk this emerging light-oil opportunity. As of December 31, 2019, we had three operated rigs targeting the Turner, Parkman, Teapot and Niobrara formations in northern Converse County, Wyoming of the Powder River Basin. In 2020, we plan approximately $350 million of capital investment.
Eagle Ford – We acquired our position in the Eagle Ford in 2014. Since acquiring these assets, we have delivered tremendous results driven by our development in DeWitt County, Texas located in the economic core of the play. Our Eagle Ford production is leveraged to oil and has low-cost access to premium Gulf Coast pricing, providing for solid operating margins. Our Eagle Ford assets generated substantial cash flow in 2019. In 2020, we plan approximately $300 million of capital investment.
Proved Reserves
Proved oil and gas reserves are those quantities of oil, gas and NGLs which can be estimated with reasonable certainty to be economically producible from known reservoirs under existing economic conditions, operating methods and government regulations. To be considered proved, oil and gas reserves must be economically producible before contracts providing the right to operate expire, unless evidence indicates that renewal is reasonably certain. Also, the project to extract the hydrocarbons must have commenced or the operator must be reasonably certain that it will commence the project within a reasonable time. For estimates of our proved developed and proved undeveloped reserves and the discussion of the contribution by each property, see Note 21 in “Item 8. Financial Statements and Supplementary Data” of this report.
The process of estimating oil, gas and NGL reserves is complex and requires significant judgment, as discussed in “Item 1A. Risk Factors” of this report. As a result, we have developed internal policies for estimating and recording reserves in compliance with applicable SEC definitions and guidance. Our policies assign responsibilities for compliance in reserves bookings to our Reserve Evaluation Group (the “Group”). The Group, which is led by Devon’s Director of Reserves and Economics, is responsible for the internal review and certification of reserves estimates. We ensure the Director and key members of the Group have appropriate technical qualifications to oversee the preparation of reserves estimates and are independent of the operating groups. The Director of the Group has over 30 years of industry experience, a degree in engineering and is a registered professional engineer. The Group also oversees audits and reserves estimates performed by qualified third-party petroleum consulting firms. During 2019, we engaged LaRoche Petroleum Consultants, Ltd. to audit approximately 85% of our proved reserves. Additionally, we have a Reserves Committee that provides additional oversight of our reserves process. The committee consists of five independent members of our Board of Directors with education or business backgrounds relevant to the reserves estimation process.
8
The following tables present production, price and cost information for each significant field.
|
|
|
Production |
|
|||||||||||||
|
Year Ended December 31, |
|
Oil (MMBbls) |
|
|
Gas (Bcf) |
|
|
NGLs (MMBbls) |
|
|
Total (MMBoe) |
|
||||
|
2019 |
|
|
|
|
|
|
|
|
|
|
|
|
|
|
|
|
|
STACK |
|
|
11 |
|
|
|
114 |
|
|
|
13 |
|
|
|
43 |
|
|
Delaware Basin |
|
|
26 |
|
|
|
65 |
|
|
|
10 |
|
|
|
46 |
|
|
U.S. |
|
|
55 |
|
|
|
219 |
|
|
|
28 |
|
|
|
119 |
|
|
2018 |
|
|
|
|
|
|
|
|
|
|
|
|
|
|
|
|
|
STACK |
|
|
12 |
|
|
|
121 |
|
|
|
14 |
|
|
|
45 |
|
|
Delaware Basin |
|
|
16 |
|
|
|
42 |
|
|
|
6 |
|
|
|
30 |
|
|
U.S. |
|
|
47 |
|
|
|
206 |
|
|
|
26 |
|
|
|
108 |
|
|
2017 |
|
|
|
|
|
|
|
|
|
|
|
|
|
|
|
|
|
STACK |
|
|
9 |
|
|
|
107 |
|
|
|
11 |
|
|
|
38 |
|
|
Delaware Basin |
|
|
12 |
|
|
|
37 |
|
|
|
4 |
|
|
|
23 |
|
|
U.S. |
|
|
42 |
|
|
|
189 |
|
|
|
21 |
|
|
|
95 |
|
|
|
|
Average Sales Price (1) |
|
|
|
|
|
|||||||||
|
Year Ended December 31, |
|
Oil (Per Bbl) |
|
|
Gas (Per Mcf) |
|
|
NGLs (Per Bbl) |
|
|
Production Cost (Per Boe) (1)(2) |
|
||||
|
2019 (1) |
|
|
|
|
|
|
|
|
|
|
|
|
|
|
|
|
|
STACK |
|
$ |
55.13 |
|
|
$ |
1.97 |
|
|
$ |
15.90 |
|
|
$ |
7.36 |
|
|
Delaware Basin |
|
$ |
54.01 |
|
|
$ |
0.99 |
|
|
$ |
13.54 |
|
|
$ |
6.43 |
|
|
U.S. |
|
$ |
54.73 |
|
|
$ |
1.79 |
|
|
$ |
15.21 |
|
|
$ |
7.75 |
|
|
2018 (1) |
|
|
|
|
|
|
|
|
|
|
|
|
|
|
|
|
|
STACK |
|
$ |
63.81 |
|
|
$ |
2.29 |
|
|
$ |
25.53 |
|
|
$ |
7.16 |
|
|
Delaware Basin |
|
$ |
57.24 |
|
|
$ |
1.80 |
|
|
$ |
24.05 |
|
|
$ |
8.15 |
|
|
U.S. |
|
$ |
61.96 |
|
|
$ |
2.34 |
|
|
$ |
25.47 |
|
|
$ |
8.22 |
|
|
2017 |
|
|
|
|
|
|
|
|
|
|
|
|
|
|
|
|
|
STACK |
|
$ |
48.43 |
|
|
$ |
2.40 |
|
|
$ |
17.78 |
|
|
$ |
4.72 |
|
|
Delaware Basin |
|
$ |
48.38 |
|
|
$ |
2.43 |
|
|
$ |
16.44 |
|
|
$ |
8.19 |
|
|
U.S. |
|
$ |
49.41 |
|
|
$ |
2.57 |
|
|
$ |
16.74 |
|
|
$ |
6.49 |
|
|
|
(1) |
As further discussed in Note 1 in “Item 8. Financial Statements and Supplementary Data” of this report, starting in 2018 the presentation of certain processing arrangements changed from a net to a gross presentation, which resulted in an increase to our upstream revenues and production expenses with no impact to net earnings. These changes primarily related to our STACK properties. |
|
|
(2) |
Represents production expense per Boe excluding production and property taxes. |
Drilling Statistics
The following table summarizes our development and exploratory drilling results in the U.S.
|
|
|
Development Wells (1) |
|
|
Exploratory Wells (1) |
|
|
Total Wells (1) |
|
|||||||||||||||||||
|
Year Ended December 31, |
|
Productive |
|
|
Dry |
|
|
Productive |
|
|
Dry |
|
|
Productive |
|
|
Dry |
|
|
Total |
|
|||||||
|
2019 |
|
|
161.7 |
|
|
|
— |
|
|
|
27.2 |
|
|
|
— |
|
|
|
188.9 |
|
|
|
— |
|
|
|
188.9 |
|
|
2018 |
|
|
154.9 |
|
|
|
3.1 |
|
|
|
69.4 |
|
|
|
— |
|
|
|
224.3 |
|
|
|
3.1 |
|
|
|
227.4 |
|
|
2017 |
|
|
145.8 |
|
|
|
— |
|
|
|
44.0 |
|
|
|
— |
|
|
|
189.8 |
|
|
|
— |
|
|
|
189.8 |
|
|
(1) |
Well counts represent net wells completed during each year. Net wells are gross wells multiplied by our fractional working interests. |
9
As of December 31, 2019, there were 132 gross and 95.3 net wells that have been spud and are in the process of drilling, completing or waiting on completion. Gross wells are the sum of all wells in which we own a working interest. Net wells are gross wells multiplied by our fractional working interests in each well.
Productive Wells
The following table sets forth our producing wells as of December 31, 2019.
|
|
|
Oil Wells |
|
|
Natural Gas Wells |
|
|
Total Wells |
|
|||||||||||||||
|
|
|
Gross (1)(3) |
|
|
Net (2) |
|
|
Gross (1)(3) |
|
|
Net (2) |
|
|
Gross (1)(3) |
|
|
Net (2) |
|
||||||
|
U.S. |
|
|
7,739 |
|
|
|
2,376 |
|
|
|
3,138 |
|
|
|
1,281 |
|
|
|
10,877 |
|
|
|
3,657 |
|
|
(1) |
Gross wells are the sum of all wells in which we own a working interest. |
|
(2) |
Net wells are gross wells multiplied by our fractional working interests in each well. |
|
(3) |
Includes 63 and 85 gross oil and gas wells, respectively, which had multiple completions. |
The day-to-day operations of oil and gas properties are the responsibility of an operator designated under pooling or operating agreements. The operator supervises production, maintains production records, employs field personnel and performs other functions. We are the operator of approximately 3,955 gross wells. As operator, we receive reimbursement for direct expenses incurred to perform our duties, as well as monthly per-well producing, drilling, and construction overhead reimbursement at rates customarily charged in the respective areas. In presenting our financial data, we record the monthly overhead reimbursements as a reduction of G&A, which is a common industry practice.
Acreage Statistics
The following table sets forth our developed and undeveloped lease and mineral acreage as of December 31, 2019. Of our 1.8 million net acres, approximately 1.1 million acres are held by production and approximately 20% are located on federal lands. The acreage in the table includes approximately 0.1 million net acres subject to leases that are scheduled to expire during 2020, 2021 and 2022. As of December 31, 2019, there were no proved undeveloped reserves associated with our expiring acreage. Of the 0.1 million net acres set to expire by December 31, 2022, we anticipate performing operational and administrative actions to continue the lease terms for portions of the acreage that we intend to further assess. However, we do expect to allow a portion of the acreage to expire in the normal course of business. In 2019, we allowed approximately 0.1 million acres to expire.
|
|
|
Developed |
|
|
Undeveloped |
|
|
Total |
|
|||||||||||||||
|
|
|
Gross (1) |
|
|
Net (2) |
|
|
Gross (1) |
|
|
Net (2) |
|
|
Gross (1) |
|
|
Net (2) |
|
||||||
|
|
|
(Thousands) |
|
|||||||||||||||||||||
|
U.S. |
|
|
1,055 |
|
|
|
576 |
|
|
|
2,956 |
|
|
|
1,272 |
|
|
|
4,011 |
|
|
|
1,848 |
|
|
(1) |
Gross acres are the sum of all acres in which we own a working interest. |
|
(2) |
Net acres are gross acres multiplied by our fractional working interests in the acreage. |
Title to Properties
Title to properties is subject to contractual arrangements customary in the oil and gas industry, liens for taxes not yet due and, in some instances, other encumbrances. We believe that such burdens do not materially detract from the value of properties or from the respective interests therein or materially interfere with their use in the operation of the business.
As is customary in the industry, a preliminary title investigation, typically consisting of a review of local title records, is made at the time of acquisitions of undeveloped properties. More thorough title investigations, which generally include a review of title records and the preparation of title opinions by outside legal counsel, are made prior to the consummation of an acquisition of producing properties and before commencement of drilling operations on undeveloped properties.
10
Marketing Activities
Oil, Gas and NGL Marketing
The spot markets for oil, gas and NGLs are subject to volatility as supply and demand factors fluctuate. As detailed below, we sell our production under both long-term (one year or more) and short-term (less than one year) agreements at prices negotiated with third parties. Regardless of the term of the contract, the vast majority of our production is sold at variable, or market-sensitive, prices.
Additionally, we may enter into financial hedging arrangements or fixed-price contracts associated with a portion of our oil, gas and NGL production. These activities are intended to support targeted price levels and to manage our exposure to price fluctuations. See Note 3 in “Item 8. Financial Statements and Supplementary Data” of this report for further information.
As of January 2020, our production was sold under the following contract terms.
|
|
|
|
|
|
|
|
|
|
|
|
|
|
|
|
|
|
|
|
|
Short-Term |
|
|
Long-Term |
|
||||||||||
|
|
|
Variable |
|
|
Fixed |
|
|
Variable |
|
|
Fixed |
|
||||
|
Oil |
|
|
64 |
% |
|
|
— |
|
|
|
36 |
% |
|
|
— |
|
|
Natural gas |
|
|
64 |
% |
|
|
3 |
% |
|
|
33 |
% |
|
|
— |
|
|
NGLs |
|
|
38 |
% |
|
|
28 |
% |
|
|
34 |
% |
|
|
— |
|
Delivery Commitments
A portion of our production is sold under certain contractual arrangements that specify the delivery of a fixed and determinable quantity. As of December 31, 2019, we were committed to deliver the following fixed quantities of production.
|
|
|
Total |
|
|
Less Than 1 Year |
|
|
1-3 Years |
|
|
3-5 Years |
|
|
More Than 5 Years |
|
|||||
|
Natural gas (Bcf) |
|
|
273 |
|
|
|
128 |
|
|
|
94 |
|
|
|
37 |
|
|
|
14 |
|
|
NGLs (MMBbls) |
|
|
8 |
|
|
|
8 |
|
|
|
— |
|
|
|
— |
|
|
|
— |
|
|
Total (MMBoe) |
|
|
53 |
|
|
|
29 |
|
|
|
16 |
|
|
|
6 |
|
|
|
2 |
|
We expect to fulfill our delivery commitments primarily with production from our proved developed reserves. Moreover, our proved reserves have generally been sufficient to satisfy our delivery commitments during the three most recent years, and we expect such reserves will continue to be the primary means of fulfilling our future commitments. However, where our proved reserves are not sufficient to satisfy our delivery commitments, we can and may use spot market purchases to satisfy the commitments.
Customers
During 2019 and 2017, no purchaser accounted for over 10% of our consolidated sales revenue.
During 2018, we had one purchaser that accounted for approximately 11% of our consolidated sales revenue.
Competition
See “Item 1A. Risk Factors.”
11
Public Policy and Government Regulation
Our industry is subject to a wide range of regulations. Laws, rules, regulations, taxes, fees and other policy implementation actions affecting our industry have been pervasive and are under constant review for amendment or expansion. Numerous government agencies have issued extensive regulations which are binding on our industry and its individual members, some of which carry substantial penalties for failure to comply. These laws and regulations increase the cost of doing business and consequently affect profitability. Because public policy changes are commonplace, and existing laws and regulations are frequently amended, we are unable to predict the future cost or impact of compliance. However, we do not expect that any of these laws and regulations will affect our operations materially differently than they would affect other companies with similar operations, size and financial strength. The following are significant areas of government control and regulation affecting our operations.
Exploration and Production Regulation
Our operations are subject to federal, state and local laws and regulations. These laws and regulations relate to matters that include:
|
|
• |
acquisition of seismic data; |
|
|
• |
location, drilling and casing of wells; |
|
|
• |
well design; |
|
|
• |
hydraulic fracturing; |
|
|
• |
well production; |
|
|
• |
spill prevention plans; |
|
|
• |
emissions and discharge permitting; |
|
|
• |
use, transportation, storage and disposal of fluids and materials incidental to oil and gas operations; |
|
|
• |
surface usage and the restoration of properties upon which wells have been drilled; |
|
|
• |
calculation and disbursement of royalty payments and production taxes; |
|
|
• |
plugging and abandoning of wells; |
|
|
• |
transportation of production; and |
|
|
• |
endangered species and habitat. |
Our operations also are subject to conservation regulations, including the regulation of the size of drilling and spacing units or proration units; the number of wells that may be drilled in a unit; the rate of production allowable from oil and gas wells; and the unitization or pooling of oil and gas properties. In the U.S., some states allow the forced pooling or unitization of tracts to facilitate exploration, while other states rely on voluntary pooling of lands and leases, which may make it more difficult to develop oil and gas properties. In addition, federal and state conservation laws generally limit the venting or flaring of natural gas, and state conservation laws impose certain requirements regarding the ratable purchase of production. These regulations limit the amounts of oil and gas we can produce from our wells and the number of wells or the locations at which we can drill.
Certain of our U.S. natural gas and oil leases are granted or approved by the federal government and administered by the BLM or Bureau of Indian Affairs of the Department of the Interior. Such leases require compliance with detailed federal regulations and orders that regulate, among other matters, drilling and operations on lands covered by these leases and calculation and disbursement of royalty payments to the federal government, tribes or tribal members. The federal government has, from time to time, evaluated and, in some cases, promulgated new rules and regulations regarding competitive lease bidding, venting and flaring, oil and gas measurement and royalty payment obligations for production from federal lands. In addition, permitting activities on federal lands can sometimes be subject to delays.
12
Environmental, Pipeline Safety and Occupational Regulations
We strive to conduct our operations in a socially and environmentally responsible manner, which includes compliance with applicable law. We are subject to many federal, state, and local laws and regulations concerning occupational safety and health as well as the discharge of materials into, and the protection of, the environment and natural resources. Environmental laws and regulations relate to:
|
|
• |
the discharge of pollutants into federal and state waters; |
|
|
• |
assessing the environmental impact of seismic acquisition, drilling or construction activities; |
|
|
• |
the generation, storage, transportation and disposal of waste materials, including hazardous substances; |
|
|
• |
the emission of certain gases into the atmosphere; |
|
|
• |
the monitoring, abandonment, reclamation and remediation of well and other sites, including sites of former operations; |
|
|
• |
the development of emergency response and spill contingency plans; |
|
|
• |
the monitoring, repair and design of pipelines used for the transportation of oil and natural gas; |
|
|
• |
the protection of threatened and endangered species; and |
|
|
• |
worker protection. |
Failure to comply with these laws and regulations can lead to the imposition of remedial liabilities, administrative, civil or criminal fines or penalties or injunctions limiting our operations in affected areas. Moreover, multiple environmental laws provide for citizen suits, which can allow environmental organizations to sue operators for alleged violations of environmental law. Environmental organizations also can assert legal and administrative challenges to certain actions of oil and gas regulators, such as the BLM, for allegedly failing to comply with environmental laws, which can result in delays in obtaining permits or other necessary authorizations. Environmental protection and health and safety compliance are necessary, manageable parts of our business. We have been able to plan for and comply with environmental, safety and health initiatives without materially altering our operating strategy or incurring significant unreimbursed expenditures. However, based on regulatory trends and increasingly stringent laws, our capital expenditures and operating expenses related to the protection of the environment and safety and health compliance have increased over the years and may continue to increase.
Item 1A. Risk Factors
Our business and operations, and our industry in general, are subject to a variety of risks. The risks described below may not be the only risks we face, as our business and operations may also be subject to risks that we do not yet know of, or that we currently believe are immaterial. If any of the following risks should occur, our business, financial condition, results of operations and liquidity could be materially and adversely impacted. As a result, holders of our securities could lose part or all of their investment in Devon.
Volatile Oil, Gas and NGL Prices Significantly Impact Our Business
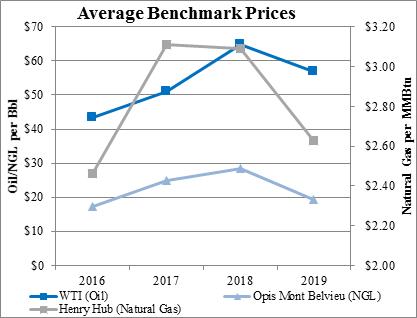
Our financial condition, results of operations and the value of our properties are highly dependent on the general supply and demand for oil, gas and NGLs, which impact the prices we ultimately realize on our sales of these commodities. Historically, market prices and our realized prices have been volatile. For example, over the last five years, NYMEX WTI oil and NYMEX Henry Hub prices ranged from highs of over $75 per Bbl and $4.80 per MMBtu, respectively, to lows of under $27 per Bbl and $1.70 per MMBtu, respectively. Such volatility is likely to continue in the future due to numerous factors beyond our control, including, but not limited to:
|
|
• |
the domestic and worldwide supply of and demand for oil, gas and NGLs; |
|
|
• |
volatility and trading patterns in the commodity-futures markets; |
|
|
• |
conservation and environmental protection efforts; |
|
|
• |
production levels of members of OPEC, Russia, the U.S. or other producing countries; |
|
|
• |
geopolitical risks, including political and civil unrest in the Middle East, Africa and South America; |
13
|
|
• |
adverse weather conditions, natural disasters, public health crises and other catastrophic events, such as tornadoes, earthquakes, hurricanes and epidemics of infectious diseases; |
|
|
• |
regional pricing differentials, including in the Delaware Basin and other areas of our operations; |
|
|
• |
differing quality of production, including NGL content of gas produced; |
|
|
• |
the level of imports and exports of oil, gas and NGLs and the level of global oil, gas and NGL inventories; |
|
|
• |
the price and availability of alternative energy sources; |
|
|
• |
technological advances affecting energy consumption and production, including with respect to electric vehicles; |
|
|
• |
stockholder activism or activities by non-governmental organizations to restrict the exploration and production of oil and natural gas in order to reduce greenhouse gas emissions; |
|
|
• |
the overall economic environment; |
|
|
• |
changes in trade relations and policies, including the imposition of tariffs by the U.S. or China; and |
|
|
• |
other governmental regulations and taxes. |
Estimates of Oil, Gas and NGL Reserves Are Uncertain and May Be Subject to Revision
The process of estimating oil, gas and NGL reserves is complex and requires significant judgment in the evaluation of available geological, engineering and economic data for each reservoir, particularly for new discoveries. Because of the high degree of judgment involved, different reserve engineers may develop different estimates of reserve quantities and related revenue based on the same data. In addition, the reserve estimates for a given reservoir may change substantially over time as a result of several factors, including additional development and appraisal activity, the viability of production under varying economic conditions, including commodity price declines, and variations in production levels and associated costs. Consequently, material revisions to existing reserves estimates may occur as a result of changes in any of these factors. Such revisions to proved reserves could have an adverse effect on our financial condition and the value of our properties, as well as the estimates of our future net revenue and profitability. Our policies and internal controls related to estimating and recording reserves are included in “Items 1 and 2. Business and Properties” of this report.
Discoveries or Acquisitions of Reserves Are Needed to Avoid a Material Decline in Reserves and Production
The production rates from oil and gas properties generally decline as reserves are depleted, while related per unit production costs generally increase due to decreasing reservoir pressures and other factors. Moreover, our current development activity is focused on unconventional oil and gas assets, which generally have significantly higher decline rates as compared to conventional assets. Therefore, our estimated proved reserves and future oil, gas and NGL production will decline materially as reserves are produced unless we conduct successful exploration and development activities, such as identifying additional producing zones in existing wells, utilizing secondary or tertiary recovery techniques or acquiring additional properties containing proved reserves. Consequently, our future oil, gas and NGL production and related per unit production costs are highly dependent upon our level of success in finding or acquiring additional reserves.
14
Our Operations Are Uncertain and Involve Substantial Costs and Risks
Our operating activities are subject to numerous costs and risks, including the risk that we will not encounter commercially productive oil or gas reservoirs. Drilling for oil, gas and NGLs can be unprofitable, not only from dry holes, but from productive wells that do not return a profit because of insufficient revenue from production or high costs. Substantial costs are required to locate, acquire and develop oil and gas properties, and we are often uncertain as to the amount and timing of those costs. Our cost of drilling, completing, equipping and operating wells is often uncertain before drilling commences. Declines in commodity prices and overruns in budgeted expenditures are common risks that can make a particular project uneconomic or less economic than forecasted. While both exploratory and developmental drilling activities involve these risks, exploratory drilling involves greater risks of dry holes or failure to find commercial quantities of hydrocarbons. In addition, our oil and gas properties can become damaged, our operations may be curtailed, delayed or canceled and the costs of such operations may increase as a result of a variety of factors, including, but not limited to:
|
|
• |
unexpected drilling conditions, pressure conditions or irregularities in reservoir formations; |
|
|
• |
equipment failures or accidents; |
|
|
• |
fires, explosions, blowouts, cratering or loss of well control, as well as the mishandling or underground migration of fluids and chemicals; |
|
|
• |
adverse weather conditions and natural disasters, such as tornadoes, earthquakes, hurricanes and extreme temperatures; |
|
|
• |
issues with title or in receiving governmental permits or approvals; |
|
|
• |
restricted takeaway capacity for our production, including due to inadequate midstream infrastructure or constrained downstream markets; |
|
|
• |
environmental hazards or liabilities; |
|
|
• |
restrictions in access to, or disposal of, water used or produced in drilling and completion operations; and |
|
|
• |
shortages or delays in the availability of services or delivery of equipment. |
The occurrence of one or more of these factors could result in a partial or total loss of our investment in a particular property, as well as significant liabilities. Moreover, certain of these events could result in environmental pollution and impact to third parties, including persons living in proximity to our operations, our employees and employees of our contractors, leading to possible injuries, death or significant damage to property and natural resources. For example, we have from time to time experienced well-control events that have resulted in various remediation and clean-up costs and certain of the other impacts described above.
In addition, we rely on our employees, consultants and sub-contractors to conduct our operations in compliance with applicable laws and standards. Any violation of such laws or standards by these individuals, whether through negligence, harassment, discrimination or other misconduct, could result in significant liability for us and adversely affect our business. For example, negligent operations by employees could result in serious injury, death or property damage, and sexual harassment or racial and gender discrimination could result in legal claims and reputational harm.
We Are Subject to Extensive Governmental Regulation, Which Can Change and Could Adversely Impact Our Business
Our operations are subject to extensive federal, state, local and other laws, rules and regulations, including with respect to environmental matters, worker health and safety, wildlife conservation, the gathering and transportation of oil, gas and NGLs, conservation policies, reporting obligations, royalty payments, unclaimed property and the imposition of taxes. Such regulations include requirements for permits to drill and to conduct other operations and for provision of financial assurances (such as bonds) covering drilling, completion and well operations and decommissioning obligations. If permits are not issued, or if unfavorable restrictions or conditions are imposed on our drilling or completion activities, we may not be able to conduct our operations as planned. In addition, we may be required to make large expenditures to comply with applicable governmental laws, rules, regulations, permits or orders. For example, certain regulations require the plugging and abandonment of wells and removal of production facilities by current and former operators, including corporate successors of former operators. These requirements may result in significant costs associated with the removal of tangible equipment and other restorative actions.
In addition, changes in public policy have affected, and in the future could further affect, our operations. Regulatory and public policy developments could, among other things, restrict production levels, impose price controls, change environmental protection requirements and increase taxes, royalties and other amounts payable to governments or governmental agencies. Our operating and
15
other compliance costs could increase further if existing laws and regulations are revised or reinterpreted, or if new laws and regulations become applicable to our operations. In addition, changes in public policy may indirectly impact our operations by, among other things, increasing the cost of supplies and equipment and fostering general economic uncertainty. For example, changes in U.S. trade relations, particularly the imposition of tariffs by the U.S. and China, may increase the cost of materials we or our vendors use, thereby increasing our operating expense. Although we are unable to predict changes to existing laws and regulations, such changes could significantly impact our profitability, financial condition and liquidity, particularly changes related to hydraulic fracturing, environmental matters more generally, seismic activity and income taxes, as discussed below.
Hydraulic Fracturing – In recent years, various federal agencies have asserted regulatory authority over certain aspects of the hydraulic fracturing process. For example, the EPA has issued regulations under the federal Clean Air Act establishing performance standards for oil and gas activities, including standards for the capture of air emissions released during hydraulic fracturing, and it finalized in 2016 regulations that prohibit the discharge of wastewater from hydraulic fracturing operations to publicly owned wastewater treatment plants. The EPA also released a report in 2016 finding that certain aspects of hydraulic fracturing, such as water withdrawals and wastewater management practices, could result in impacts to water resources. The BLM previously finalized regulations to regulate hydraulic fracturing on federal lands but subsequently issued a repeal of those regulations in 2017. Moreover, several states in which we operate have adopted, or stated intentions to adopt, laws or regulations that mandate further restrictions on hydraulic fracturing, such as requiring disclosure of chemicals used in hydraulic fracturing, imposing more stringent permitting, disclosure and well-construction requirements on hydraulic fracturing operations and establishing standards for the capture of air emissions released during hydraulic fracturing. In addition to state laws, local land use restrictions, such as city ordinances, may restrict drilling in general or hydraulic fracturing in particular.
Beyond these regulatory efforts, various policy makers, regulatory agencies and political candidates at the federal, state and local levels have proposed implementing even further restrictions on hydraulic fracturing, including prohibiting the technology outright. For example, certain candidates running to be elected President of the United States in 2020 have pledged to impose a ban on hydraulic fracturing. It is possible that any such restrictions may particularly target industry activity on federal lands, which could adversely impact our operations in the Delaware and Powder River Basins, as well as other areas where we operate under federal leases. As of December 31, 2019, approximately 20% of our total leasehold resides on federal lands, and approximately 40% and 60% of our leasehold in the Delaware and Powder River Basins, respectively, resides on federal lands. Although it is not possible at this time to predict the outcome of these or other proposals, any new restrictions on hydraulic fracturing that may be imposed in areas in which we conduct business could potentially result in increased compliance costs, delays or cessation in development or other restrictions on our operations.
Environmental Laws Generally – In addition to regulatory efforts focused on hydraulic fracturing, we are subject to various other federal, state and local laws and regulations relating to discharge of materials into, and protection of, the environment. These laws and regulations may, among other things, impose liability on us for the cost of remediating pollution that results from our operations. Environmental laws may impose strict, joint and several liability, and failure to comply with environmental laws and regulations can result in the imposition of administrative, civil or criminal fines and penalties, as well as injunctions limiting operations in affected areas. Any future environmental costs of fulfilling our commitments to the environment are uncertain and will be governed by several factors, including future changes to regulatory requirements. Any such changes could have a significant impact on our operations and profitability.
Seismic Activity – Earthquakes in northern and central Oklahoma and elsewhere have prompted concerns about seismic activity and possible relationships with the oil and gas industry. Legislative and regulatory initiatives intended to address these concerns may result in additional levels of regulation or other requirements that could lead to operational delays, increase our operating and compliance costs or otherwise adversely affect our operations. In addition, we are currently defending against certain third-party lawsuits and could be subject to additional claims, seeking alleged property damages or other remedies as a result of alleged induced seismic activity in our areas of operation.
Changes to Tax Laws – We are subject to U.S. federal income tax as well as income or capital taxes in various state and foreign jurisdictions, and our operating cash flow is sensitive to the amount of income taxes we must pay. In the jurisdictions in which we operate, income taxes are assessed on our earnings after consideration of all allowable deductions and credits. Changes in the types of earnings that are subject to income tax, the types of costs that are considered allowable deductions or the rates assessed on our taxable earnings would all impact our income taxes and resulting operating cash flow.
16
Concerns About Climate Change and Related Regulatory, Social and Market Actions May Adversely Affect Our Business
Continuing and increasing political and social attention to the issue of climate change has resulted in legislative, regulatory and other initiatives, including international agreements, to reduce greenhouse gas emissions, such as carbon dioxide and methane. Policy makers at both the U.S. federal and state levels have introduced legislation and proposed new regulations designed to quantify and limit the emission of greenhouse gases. For example, both the EPA and the BLM have issued regulations for the control of methane emissions, which also include leak detection and repair requirements, for the oil and gas industry. Following the change in presidential administrations, however, the agencies have attempted to revise or rescind their previously issued methane standards. Litigation concerning these methane regulations and subsequent attempts to revise or rescind them is ongoing. Nevertheless, several states where we operate, including Wyoming and New Mexico, have already imposed, or stated intentions to impose, laws or regulations designed to reduce methane emissions from oil and gas exploration and production activities. With respect to more comprehensive regulation, policy makers and political candidates have made, or expressed support for, a variety of proposals, such as the development of cap-and-trade or carbon tax programs, as well as the more sweeping “green new deal” resolutions introduced in Congress in early 2019. As generally proposed, a cap-and-trade program would cap overall greenhouse gas emissions on an economy-wide basis and require major sources of greenhouse gas emissions or major fuel producers to acquire and surrender emission allowances, while a carbon tax could impose taxes based on emissions from our operations and downstream uses of our products. The “green new deal” resolutions call for a 10-year national mobilization effort to, among other things, transition 100% of power demand in the U.S. to zero-emission sources and overhaul transportation systems in the U.S. to remove greenhouse gas emissions as much as is technologically feasible.
In addition to regulatory risk, other market and social initiatives resulting from the changing perception of climate change present risks for our business. For example, in an effort to promote a lower-carbon economy, there are various public and private initiatives subsidizing the development and adoption of alternative energy sources and technologies, including by mandating the use of specific fuels or technologies. These initiatives may reduce the competitiveness of carbon-based fuels, such as oil and gas. Moreover, certain financial institutions, funds and other sources of capital have begun restricting or eliminating their investment in oil and natural gas activities due to their concern regarding climate change. Such restrictions in capital could decrease the value of our business and make it more difficult to fund our operations. Finally, governmental entities and other plaintiffs have brought, and may continue to bring, claims against us and other oil and gas companies for purported damages caused by the alleged effects of climate change. These and the other regulatory, social and market risks relating to climate change described above could result in unexpected costs, increase our operating expense and reduce the demand for our products, which in turn could lower the value of our reserves and have an adverse effect on our profitability, financial condition and liquidity.
Our Hedging Activities Limit Participation in Commodity Price Increases and Involve Other Risks
We enter into financial derivative instruments with respect to a portion of our production to manage our exposure to oil, gas and NGL price volatility. To the extent that we engage in price risk management activities to protect ourselves from commodity price declines, we will be prevented from fully realizing the benefits of commodity price increases above the prices established by our hedging contracts. In addition, our hedging arrangements may expose us to the risk of financial loss in certain circumstances, including instances in which the contract counterparties fail to perform under the contracts. Moreover, as a result of the Dodd-Frank Wall Street Reform and Consumer Protection Act and other legislation and regulation, hedging transactions and many of our contract counterparties have become subject to increased governmental oversight and regulations in recent years. Although we cannot predict the ultimate impact of these laws and the related rulemaking, some of which is ongoing, existing or future regulations may adversely affect the cost and availability of our hedging arrangements.
The Credit Risk of Our Counterparties Could Adversely Affect Us
We enter into a variety of transactions that expose us to counterparty credit risk. For example, we have exposure to financial institutions and insurance companies through our hedging arrangements, our syndicated revolving credit facility and our insurance policies. Disruptions in the financial markets or otherwise may impact these counterparties and affect their ability to fulfill their existing obligations and their willingness to enter into future transactions with us.
In addition, we are exposed to the risk of financial loss from trade, joint interest billing and other receivables. We sell our oil, gas and NGLs to a variety of purchasers, and, as an operator, we pay expenses and bill our non-operating partners for their respective share of costs. We also frequently look to buyers of oil and gas properties from us or our predecessors to perform certain obligations associated with the disposed assets, including the removal of production facilities and plugging and abandonment of wells. Certain of these counterparties or their successors may experience insolvency, liquidity problems or other issues and may not be able to meet their obligations and liabilities (including contingent liabilities) owed to, and assumed from, us, particularly during a depressed or volatile commodity price environment. Any such default may result in us being forced to cover the costs of those obligations and liabilities, which could adversely impact our financial results and condition.
17
Our Debt May Limit Our Liquidity and Financial Flexibility, and Any Downgrade of Our Credit Rating Could Adversely Impact Us
As of December 31, 2019, we had total indebtedness of $4.3 billion. Our indebtedness and other financial commitments have important consequences to our business, including, but not limited to:
|
|
• |
requiring us to dedicate a portion of our cash flows from operations to debt service payments, thereby limiting our ability to fund working capital, capital expenditures, investments or acquisitions and other general corporate purposes; |
|
|
• |
increasing our vulnerability to general adverse economic and industry conditions, including low commodity price environments; and |
|
|
• |
limiting our ability to obtain additional financing due to higher costs and more restrictive covenants. |
In addition, we receive credit ratings from rating agencies in the U.S. with respect to our debt. Factors that may impact our credit ratings include, among others, debt levels, planned asset sales and purchases, liquidity, forecasted production growth and commodity prices. We are currently required to provide letters of credit or other assurances under certain of our contractual arrangements. Any credit downgrades could adversely impact our ability to access financing and trade credit, require us to provide additional letters of credit or other assurances under contractual arrangements and increase our interest rate under any credit facility borrowing as well as the cost of any other future debt.
Cyber Attacks May Adversely Impact Our Operations
Our business has become increasingly dependent on digital technologies, and we anticipate expanding the use of technology in our operations, including through artificial intelligence, process automation and data analytics. Concurrent with this growing dependence on technology is greater sensitivity to cyber attack related activities, which have frequently targeted our industry. Cyber attackers often attempt to gain unauthorized access to digital systems for purposes of misappropriating sensitive information, intellectual property or financial assets, corrupting data or causing operational disruptions as well as to prevent users from accessing systems or information and demand payment in order to regain access. These attacks may be perpetrated by third parties or insiders. Techniques used in these attacks often range from highly sophisticated efforts to electronically circumvent network security to more traditional intelligence gathering and social engineering aimed at obtaining information necessary to gain access. Cyber attacks may also be performed in a manner that does not require gaining unauthorized access, such as by causing denial-of-service attacks. In addition, our vendors, midstream providers and other business partners may separately suffer disruptions or breaches from cyber attacks, which, in turn, could adversely impact our operations and compromise our information. Although we have not suffered material losses related to cyber attacks to date, if we were successfully attacked, we could incur substantial remediation and other costs or suffer other negative consequences, including litigation risks. Moreover, as the sophistication of cyber attacks continues to evolve, we may be required to expend significant additional resources to further enhance our digital security or to remediate vulnerabilities.
We Have Limited Control Over Properties Operated by Others
Certain of the properties in which we have an interest are operated by other companies and involve third-party working interest owners. We have limited influence and control over the operation or future development of such properties, including compliance with environmental, health and safety regulations or the amount and timing of required future capital expenditures. These limitations and our dependence on the operator and other working interest owners for these properties could result in unexpected future costs and delays, curtailments or cancellations of operations or future development, which could adversely affect our financial condition and results of operations.
18
Midstream Capacity Constraints and Interruptions Impact Commodity Sales
We rely on midstream facilities and systems owned and operated by others to process our gas production and to transport our oil, gas and NGL production to downstream markets. All or a portion of our production in one or more regions may be interrupted or shut in from time to time due to losing access to plants, pipelines or gathering systems. Such access could be lost due to a number of factors, including, but not limited to, weather conditions and natural disasters, accidents, field labor issues or strikes. Additionally, the midstream operators may be subject to constraints that limit their ability to construct, maintain or repair midstream facilities needed to process and transport our production. Such interruptions or constraints could negatively impact our production and associated profitability.
Insurance Does Not Cover All Risks
As discussed above, our business is hazardous and is subject to all of the operating risks normally associated with the exploration, development and production of oil, gas and NGLs. To mitigate financial losses resulting from these operational hazards, we maintain comprehensive general liability insurance, as well as insurance coverage against certain losses resulting from physical damages, loss of well control, business interruption and pollution events that are considered sudden and accidental. We also maintain workers’ compensation and employer’s liability insurance. However, our insurance coverage does not provide 100% reimbursement of potential losses resulting from these operational hazards. Additionally, we have limited or no insurance coverage for a variety of other risks, including pollution events that are considered gradual, war and political risks and fines or penalties assessed by governmental authorities. The occurrence of a significant event against which we are not fully insured could have an adverse effect on our profitability, financial condition and liquidity.
Competition for Assets, Materials, People and Capital Can Be Significant
Strong competition exists in all sectors of the oil and gas industry. We compete with major integrated and independent oil and gas companies for the acquisition of oil and gas leases and properties. We also compete for the equipment and personnel required to explore, develop and operate properties. Typically, during times of rising commodity prices, drilling and operating costs will also increase. During these periods, there is often a shortage of drilling rigs and other oilfield services, which could adversely affect our ability to execute our development plans on a timely basis and within budget. Competition is also prevalent in the marketing of oil, gas and NGLs. Certain of our competitors have financial and other resources substantially greater than ours and may have established superior strategic long-term positions and relationships, including with respect to midstream take-away capacity. As a consequence, we may be at a competitive disadvantage in bidding for assets or services and accessing capital and downstream markets. In addition, many of our larger competitors may have a competitive advantage when responding to factors that affect demand for oil and gas production, such as changing worldwide price and production levels, the cost and availability of alternative energy sources and the application of government regulations.
Our Business Could Be Adversely Impacted by Investors Attempting to Effect Change
Stockholder activism has been increasing in our industry, and investors may from time to time attempt to effect changes to our business or governance, whether by stockholder proposals, public campaigns, proxy solicitations or otherwise. Such actions could adversely impact our business by distracting our board of directors and employees from core business operations, requiring us to incur increased advisory fees and related costs, interfering with our ability to successfully execute on strategic transactions and plans and provoking perceived uncertainty about the future direction of our business. Such perceived uncertainty may, in turn, make it more difficult to retain employees and could result in significant fluctuation in the market price of our common stock.
Our Acquisition and Divestiture Activities Involve Substantial Risks
Our business depends, in part, on making acquisitions that complement or expand our current business and successfully integrating any acquired assets or businesses. If we are unable to make attractive acquisitions, our future growth could be limited. Furthermore, even if we do make acquisitions, they may not result in an increase in our cash flow from operations or otherwise result in the benefits anticipated due to various risks, including, but not limited to:
|
|
• |
mistaken estimates or assumptions about reserves, potential drilling locations, revenues and costs, including synergies and the overall costs of equity or debt; |
|
|
• |
difficulties in integrating the operations, technologies, products and personnel of the acquired assets or business; and |
19
|
|
• |
unknown and unforeseen liabilities or other issues related to any acquisition for which contractual protections prove inadequate, including environmental liabilities and title defects. |
In addition, from time to time, we may sell or otherwise dispose of certain of our properties or businesses as a result of an evaluation of our asset portfolio and to help enhance our liquidity. These transactions also have inherent risks, including possible delays in closing, the risk of lower-than-expected sales proceeds for the disposed assets or business and potential post-closing claims for indemnification. Moreover, volatility in commodity prices may result in fewer potential bidders, unsuccessful sales efforts and a higher risk that buyers may seek to terminate a transaction prior to closing.
Item 1B. Unresolved Staff Comments
Not applicable.
Item 3. Legal Proceedings
We are involved in various legal proceedings incidental to our business. However, to our knowledge as of the date of this report, there were no material pending legal proceedings to which we are a party or to which any of our property is subject.
On April 4, 2019, Devon Energy Production Company, L.P., a wholly-owned subsidiary of the Company (“DEPCO”), agreed to settle its previously disclosed negotiations with the EPA relating to certain alleged Clean Air Act violations at its Beaver Creek Gas Plant located near Riverton, Wyoming by executing an agreed order with the EPA. The order included a penalty of $150,000 and was approved by the regional EPA judicial officer on June 12, 2019. Moreover, in connection with the resolution of this matter with the EPA, DEPCO entered into a consent decree on May 9, 2019 with respect to the same matter with the Wyoming Department of Environmental Quality, which also included a separate penalty of $150,000.
Item 4. Mine Safety Disclosures
Not applicable.
20
PART II
Item 5. Market for Common Equity, Related Stockholder Matters and Issuer Purchases of Equity Securities
Our common stock is traded on the NYSE under the “DVN” ticker symbol. On February 5, 2020, there were 6,771 holders of record of our common stock. We began paying regular quarterly cash dividends in the second quarter of 1993. The declaration of future dividends is a business decision made by our Board of Directors, and will depend on Devon’s financial condition and other relevant factors. Additional information on our dividends can be found in Note 17 in “Item 8. Financial Statements and Supplementary Data” of this report.
Performance Graph
The following graph compares the cumulative TSR over a five-year period on Devon’s common stock with the cumulative total returns of the S&P 500 Index and a peer group of companies to which we compare our performance. The peer group includes Apache Corporation, Chesapeake Energy Corporation, Concho Resources, Inc., ConocoPhillips, Continental Resources, Inc., Encana Corporation, EOG Resources, Inc., Hess Corporation, Marathon Oil Corporation, Murphy Oil Corporation, Noble Energy, Inc., Occidental Petroleum Corporation and Pioneer Natural Resources Company. Anadarko Petroleum Corporation was a part of this peer group prior to being acquired by Occidental Petroleum Corporation in 2019. The graph was prepared assuming $100 was invested on December 31, 2014 in Devon’s common stock, the peer group and the S&P 500 Index, and dividends have been reinvested subsequent to the initial investment. Commencing in 2020, Devon will use a recalibrated peer group for performance and compensation purposes. This new peer group was selected to better align with Devon’s go-forward size and operations in light of our strategic transformation in 2019.
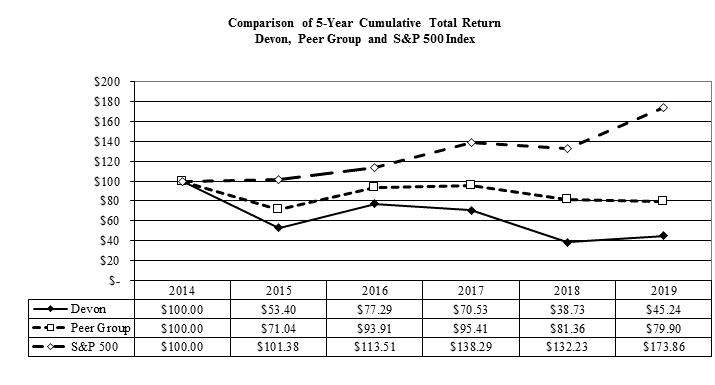
The graph and related information should not be deemed “soliciting material” or to be “filed” with the SEC, nor should such information be incorporated by reference into any future filing under the Securities Act of 1933, as amended, or the Securities Exchange Act of 1934, as amended, except to the extent that we specifically incorporate such information by reference into such a filing. The graph and information is included for historical comparative purposes only and should not be considered indicative of future stock performance.
21
Issuer Purchases of Equity Securities
The following table provides information regarding purchases of our common stock that were made by us during the fourth quarter of 2019 (shares in thousands).
|
Period |
|
Total Number of Shares Purchased (1) |
|
|
Average Price Paid per Share |
|
|
Total Number of Shares Purchased As Part of Publicly Announced Plans or Programs (2) |
|
|
Maximum Dollar Value of Shares that May Yet Be Purchased Under the Plans or Programs (2) |
|
||||
|
October 1 - October 31 |
|
|
4,285 |
|
|
$ |
21.27 |
|
|
|
4,244 |
|
|
$ |
199 |
|
|
November 1 - November 30 |
|
|
218 |
|
|
$ |
22.33 |
|
|
|
192 |
|
|
$ |
195 |
|
|
December 1 - December 31 |
|
|
9 |
|
|
$ |
22.58 |
|
|
|
— |
|
|
$ |
1,000 |
|
|
Total |
|
|
4,512 |
|
|
$ |
21.32 |
|
|
|
4,436 |
|
|
|
|
|
|
|
(1) |
In addition to shares purchased under the share repurchase program described below, these amounts also included approximately 76,000 shares received by us from employees for the payment of personal income tax withholding on vesting transactions. |
|
|
(2) |
On March 7, 2018, we announced a $1.0 billion share repurchase program. On June 6, 2018, we announced the expansion of this program to $4.0 billion. On February 19, 2019, we announced a further expansion to $5.0 billion with a December 31, 2019 expiration date. Of the $5.0 billion authorized amount, $4.8 billion was repurchased when the program expired on December 31, 2019. On December 17, 2019, we announced a new $1.0 billion share repurchase program with a December 31, 2020 expiration date. Under the new program, $800 million of the $1.0 billion authorization is conditioned upon the closing of the pending Barnett Shale divestiture. During 2019, we repurchased 68.6 million shares of common stock for $1.8 billion, or $26.62 per share. Future purchases under the program will be made in the open market, private transactions or through the use of ASR programs. |
Under the Devon Plan, eligible employees previously had the option to purchase shares of our common stock through an investment in the Devon Stock Fund, which is administered by an independent trustee. Eligible employees purchased approximately 27,000 shares of our common stock in 2019, at then-prevailing stock prices, that they held through their ownership in the Devon Stock Fund. We acquired the shares of our common stock sold under this plan through open-market purchases.
22
Item 6. Selected Financial Data
The financial information below should be read in conjunction with “Item 7. Management’s Discussion and Analysis of Financial Condition and Results of Operations” and “Item 8. Financial Statements and Supplementary Data” of this report.
|
|
|
2019 |
|
|
2018 |
|
|
2017 |
|
|
2016 |
|
|
2015 |
|
|||||
|
Statement of Earnings data: |
|
|
|
|
|
|
|
|
|
|
|
|
|
|
|
|
|
|
|
|
|
Upstream revenues (1) |
|
$ |
3,355 |
|
|
$ |
4,542 |
|
|
$ |
2,988 |
|
|
$ |
2,325 |
|
|
$ |
4,082 |
|
|
Total revenues (1) |
|
$ |
6,220 |
|
|
$ |
8,896 |
|
|
$ |
6,501 |
|
|
$ |
5,054 |
|
|
$ |
7,547 |
|
|
Net earnings (loss) from continuing operations (2) |
|
$ |
(79 |
) |
|
$ |
714 |
|
|
$ |
33 |
|
|
$ |
(871 |
) |
|
$ |
(7,989 |
) |
|
Net earnings (loss) from continuing operations per share: |
|
|
|
|
|
|
|
|
|
|
|
|
|
|
|
|
|
|
|
|
|
Basic (2) |
|
$ |
(0.21 |
) |
|
$ |
1.43 |
|
|
$ |
0.06 |
|
|
$ |
(1.72 |
) |
|
$ |
(19.66 |
) |
|
Diluted (2) |
|
$ |
(0.21 |
) |
|
$ |
1.42 |
|
|
$ |
0.06 |
|
|
$ |
(1.72 |
) |
|
$ |
(19.66 |
) |
|
Cash dividends per common share |
|
$ |
0.35 |
|
|
$ |
0.30 |
|
|
$ |
0.24 |
|
|
$ |
0.42 |
|
|
$ |
0.96 |
|
|
Balance Sheet data: |
|
|
|
|
|
|
|
|
|
|
|
|
|
|
|
|
|
|
|
|
|
Total assets (3) |
|
$ |
13,717 |
|
|
$ |
19,566 |
|
|
$ |
30,241 |
|
|
$ |
28,675 |
|
|
$ |
29,673 |
|
|
Long-term debt (4) |
|
$ |
4,294 |
|
|
$ |
4,292 |
|
|
$ |
5,258 |
|
|
$ |
5,359 |
|
|
$ |
7,488 |
|
|
Stockholders' equity |
|
$ |
5,920 |
|
|
$ |
9,186 |
|
|
$ |
14,104 |
|
|
$ |
12,722 |
|
|
$ |
11,111 |
|
|
Common shares outstanding |
|
|
382 |
|
|
|
450 |
|
|
|
525 |
|
|
|
523 |
|
|
|
418 |
|
|
|
(1) |
In January 2018, Devon adopted ASC 606 – Revenue from Contracts with Customers using the modified retrospective method and has applied the standard to all existing contracts. The impact of adoption is further discussed in Note 1 of “Item 8. Financial Statements and Supplementary Data” of this report. Prior periods have not been restated. |
|
|
(2) |
Material asset impairments and acquisition and divestiture activity had significant impacts on operating results and the carrying value of our oil and gas assets. Specifically, there were asset impairments of $0.3 billion, $0.2 billion, $0.5 billion and $10.3 billion in 2018, 2017, 2016 and 2015, respectively. More discussion on these items can be found in “Item 7. Management’s Discussion and Analysis of Financial Condition and Results of Operations” and in Note 2 and Note 5 of “Item 8. Financial Statements and Supplementary Data” of this report. |
|
|
(3) |
Amounts include assets related to our divested Canadian business and aggregate ownership interest in EnLink and the General Partner as well as our recently announced Barnett Shale assets that will be divested in 2020. For additional information, see Note 18 of “Item 8. Financial Statements and Supplementary Data” of this report. These divestitures resulted in the reclassification of the respective assets to assets associated with discontinued operations, which are included within this amount. |
|
|
(4) |
Long-term debt balance excludes amounts that were classified as liabilities associated with discontinued operations in the respective periods related to the sale of Devon’s Canadian business and ownership interests in EnLink and the General Partner. See Note 18 of “Item 8. Financial Statements and Supplementary Data” of this report for additional details. |
23
Item 7. Management’s Discussion and Analysis of Financial Condition and Results of Operations
Introduction
The following discussion and analysis presents management’s perspective of our business, financial condition and overall performance. This information is intended to provide investors with an understanding of our past performance, current financial condition and outlook for the future and should be read in conjunction with “Item 8. Financial Statements and Supplementary Data” of this report.
Overview of 2019 Results
During 2019, we completed our transformation to a U.S. oil growth company with our exit from Canada and pending sale of the Barnett Shale. These transactions accelerate efforts to focus exclusively on our resource-rich U.S. oil portfolio, which provides us with a strong foundation to grow returns, margin and profitability. By operating under a disciplined returns-driven strategy focused on delivering strong operational results, financial strength and value to our shareholders and continuing our commitment to environmental, social and governance excellence, we completed our transformation to “New Devon” and made significant progress toward our cost reduction objectives as evidenced by these 2019 highlights:
|
|
• |
Closed on the sale of our Canadian business for $2.6 billion ($3.4 billion Canadian dollars) in June 2019. |
|
|
• |
Announced the sale of our Barnett Shale assets for $770 million (expected closing in the second quarter of 2020). |
|
|
• |
Completed workforce reduction and other cost reduction initiatives, reaching approximately $240 million of annualized G&A savings. |
|
|
• |
Improved capital efficiency by reducing capital expenditures approximately 10% and increasing oil production 21% compared to 2018. |
|
|
• |
Retired $1.7 billion of senior notes, reducing annualized financing costs by $60 million. |
|
|
• |
Repurchased $4.8 billion of our total $5.8 billion share repurchase authorizations, representing an outstanding share count reduction of nearly 30% since the program’s inception. |
|
|
• |
Increased our quarterly common stock dividend 12.5% to $0.09 per share beginning in the second quarter of 2019. |
|
|
• |
Increased Delaware Basin and Powder River Basin production over 60% in 2019 compared to 2018. |
|
|
• |
Reduced methane emissions by nearly 20% over the last three years and established a target to further reduce methane intensity rates by 2025. |
|
|
• |
Exited 2019 with $1.8 billion of cash, inclusive of $380 million restricted for discontinued operations, $3.0 billion of available credit under our Senior Credit Facility and have no debt maturities until 2025. |
|
|
|
As presented in the graph at the left, our operating achievements are subject to the volatility of commodity prices. Over the last four years, NYMEX WTI oil and NYMEX Henry Hub prices ranged from average highs of $64.79 per Bbl and $3.11 per MMBtu, respectively, to average lows of $43.36 per Bbl and $2.46 per MMBtu, respectively. |
|
|
|
24
Trends of our annual earnings, operating cash flow, EBITDAX and capital expenditures are shown below. The annual earnings chart presents amounts pertaining to both Devon’s continuing and discontinued operations. The annual cash flow chart presents amounts pertaining to Devon’s continuing operations. “Core earnings” and “EBITDAX” are financial measures not prepared in accordance with GAAP. For a description of these measures, including reconciliations to the comparable GAAP measures, see “Non-GAAP Measures” in this Item 7.

Our net earnings in recent years have been significantly impacted by divestiture transactions and temporary, noncash adjustments to the value of our commodity hedges. Net earnings in 2017 included a $0.1 billion gain on asset dispositions from continuing operations and a $0.2 billion hedge valuation gain, both net of taxes. Net earnings in 2018 included a $2.2 billion gain on our EnLink disposition, a $0.5 billion hedge valuation gain and a $0.2 billion gain on asset dispositions from continuing operations, all net of taxes. Net earnings in 2019 included a $0.4 billion hedge valuation loss, $0.2 billion net gains and charges related to our Canadian disposition and a $0.6 billion asset impairment related to our Barnett Shale disposition, all net of taxes. Excluding these amounts, our core earnings have been more stable over recent years but continue to be heavily influenced by commodity prices.
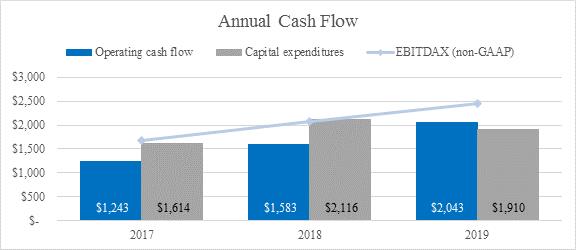
Like earnings, our operating cash flow is sensitive to volatile commodity prices. EBITDAX, which excludes financial amounts related to discontinued operations, has been increasing over the past three years as a result of our New Devon production growth and cost reductions. Regardless of cash flow fluctuations, we remain focused on managing our capital investment to generate free cash flow. As operating cash flow has declined, we have adjusted our capital development plans accordingly.
25
Business and Industry Outlook
Devon marked its 48th anniversary in the oil and gas business and its 31st year as a public company during 2019. As an established company with a strong leadership team, we have experience operating through periods of volatile commodity prices. With our focused strategy and portfolio of quality assets, we are committed to navigating the current environment while safeguarding our long-term financial strength.
Market prices for crude oil and natural gas are inherently volatile. In 2019, WTI oil prices averaged approximately $57.02/Bbl versus $64.79/Bbl in 2018. Despite price support in the first half of 2019 driven by supply tightness and geopolitical tensions, 2019 WTI oil prices overall were negatively impacted by trade concerns and economic slowdown fears, even with strong supply and demand fundamentals. Looking ahead, crude oil has experienced near term downward pressure as a result of softer demand from the growing impact of the coronavirus related crisis. Positive factors that could reduce these recent negative factors and create more demand for crude oil are the extension of OPEC cuts through 2020, as well as the International Maritime Organization 2020 regulations.
Henry Hub gas prices averaged approximately $2.63/MMBtu in 2019 versus $3.09/MMBtu in 2018. Mt. Belvieu Blended Index NGL prices averaged approximately $19.22/Bbl in 2019 versus $28.31/Bbl in 2018. Natural gas and NGL prices faced strong headwinds in 2019 due to U.S. supply growth far outpacing demand for both commodities domestically and internationally. These factors continue to weigh on current natural gas and NGL prices.
As discussed in our Critical Accounting Estimates, our STACK assets are susceptible to a material asset impairment should prices decrease from current levels. While such an impairment would materially impact our reported net earnings, it would not impact our operating cash flow or our current near-term drilling plans.
To mitigate our exposure to commodity price volatility and ensure our financial strength, we continue to execute a disciplined, risk-management hedging program. Our hedging program incorporates both systematic hedges added on a regular basis and discretionary hedges layered in on an opportunistic basis to take advantage of favorable market conditions. We are adding 2020 positions at desirable prices, and we currently have approximately 40% of our anticipated oil volumes and 25% of our anticipated gas volumes hedged. Additionally, we are actively adding attractive hedges for 2021. Further insulating our cash flow, we continue to examine and, when appropriate, execute attractive regional basis swap hedges in an effort to protect price realizations across our portfolio.
Throughout 2019, our operational efficiencies continued to accelerate. Our improved cost structure expanded margins, and we ended the year ahead of our multi-year cost savings initiative plan. As we carry our 2019 momentum into 2020, we will maintain our capital-efficiency focus and intensify our steadfast commitment to capital discipline. Our returns-driven strategy will be underpinned by our continued efforts to improve our cost structure and grow higher-margin oil production. As such, our 2020 capital program has been optimized for strong returns, high single-digit oil growth, free cash flow and enhanced per-share cash flow growth.
To achieve our 2020 capital program objectives, our capital allocation priorities are four-fold: maintain base production, fund dividends, invest in high-return growth projects and return excess cash to shareholders. Accordingly, over half of the 2020 spend will be focused in on our highest margin U.S. oil play, the Delaware Basin. As the most active program in Devon’s portfolio, capital activity in the Delaware Basin will be diversified across five core areas. Also accretive to our 2020 returns-focused capital program is our 2020 Rockies activity, where spend will be prioritized to our top-tier Powder River Basin development activity. In total, our 2020 operating plan is expected to deliver U.S. oil growth of approximately 7.5% to 9.0% on a retained asset basis.
26
Results of Operations
The following graphs, discussion and analysis are intended to provide an understanding of our results of operations and current financial condition. To facilitate the review, these numbers are being presented before consideration of earnings attributable to noncontrolling interests. Analysis of the change in net earnings from continuing operations is shown below and analysis of the change in net earnings from discontinued operations is shown on page 33.
|
Continuing Operations |
2019 vs. 2018
Our 2019 net loss from continuing operations was $79 million and decreased $793 million compared to 2018. The graph below shows the change in net earnings from 2018 to 2019. The material changes are further discussed by category on the following pages. To facilitate the review, these numbers are being presented before consideration of earnings attributable to noncontrolling interests.

27
Production Volumes
|
|
|
2019 |
|
|
% of Total |
|
|
2018 |
|
|
Change |
|
||||
|
Oil (MBbls/d) |
|
|
|
|
|
|
|
|
|
|
|
|
|
|
|
|
|
Delaware Basin |
|
|
70 |
|
|
|
47 |
% |
|
|
42 |
|
|
|
+67 |
% |
|
STACK |
|
|
31 |
|
|
|
20 |
% |
|
|
32 |
|
|
|
- 4 |
% |
|
Powder River Basin |
|
|
17 |
|
|
|
11 |
% |
|
|
14 |
|
|
|
+26 |
% |
|
Eagle Ford |
|
|
23 |
|
|
|
16 |
% |
|
|
28 |
|
|
|
- 17 |
% |
|
Other |
|
|
6 |
|
|
|
4 |
% |
|
|
5 |
|
|
|
+4 |
% |
|
New Devon |
|
|
147 |
|
|
|
98 |
% |
|
|
121 |
|
|
|
+21 |
% |
|
U.S. divest assets |
|
|
3 |
|
|
|
2 |
% |
|
|
9 |
|
|
|
- 70 |
% |
|
Total |
|
|
150 |
|
|
|
100 |
% |
|
|
130 |
|
|
|
+15 |
% |
|
|
|
2019 |
|
|
% of Total |
|
|
2018 |
|
|
Change |
|
||||
|
Gas (MMcf/d) |
|
|
|
|
|
|
|
|
|
|
|
|
|
|
|
|
|
Delaware Basin |
|
|
177 |
|
|
|
29 |
% |
|
|
105 |
|
|
|
+68 |
% |
|
STACK |
|
|
314 |
|
|
|
53 |
% |
|
|
334 |
|
|
|
- 6 |
% |
|
Powder River Basin |
|
|
24 |
|
|
|
4 |
% |
|
|
16 |
|
|
|
+55 |
% |
|
Eagle Ford |
|
|
79 |
|
|
|
13 |
% |
|
|
79 |
|
|
|
- 0 |
% |
|
Other |
|
|
1 |
|
|
|
0 |
% |
|
|
1 |
|
|
|
- 18 |
% |
|
New Devon |
|
|
595 |
|
|
|
99 |
% |
|
|
535 |
|
|
|
+11 |
% |
|
U.S. divest assets |
|
|
4 |
|
|
|
1 |
% |
|
|
31 |
|
|
|
- 87 |
% |
|
Total |
|
|
599 |
|
|
|
100 |
% |
|
|
566 |
|
|
|
+6 |
% |
|
|
|
2019 |
|
|
% of Total |
|
|
2018 |
|
|
Change |
|
||||
|
NGLs (MBbls/d) |
|
|
|
|
|
|
|
|
|
|
|
|
|
|
|
|
|
Delaware Basin |
|
|
27 |
|
|
|
36 |
% |
|
|
16 |
|
|
|
+74 |
% |
|
STACK |
|
|
36 |
|
|
|
46 |
% |
|
|
37 |
|
|
|
- 5 |
% |
|
Powder River Basin |
|
|
2 |
|
|
|
3 |
% |
|
|
1 |
|
|
|
+53 |
% |
|
Eagle Ford |
|
|
11 |
|
|
|
14 |
% |
|
|
13 |
|
|
|
- 15 |
% |
|
Other |
|
|
1 |
|
|
|
1 |
% |
|
|
1 |
|
|
|
+12 |
% |
|
New Devon |
|
|
77 |
|
|
|
100 |
% |
|
|
68 |
|
|
|
+13 |
% |
|
U.S. divest assets |
|
|
— |
|
|
|
0 |
% |
|
|
3 |
|
|
|
N/M |
|
|
Total |
|
|
77 |
|
|
|
100 |
% |
|
|
71 |
|
|
|
+9 |
% |
|
|
|
2019 |
|
|
% of Total |
|
|
2018 |
|
|
Change |
|
||||
|
Combined (MBoe/d) |
|
|
|
|
|
|
|
|
|
|
|
|
|
|
|
|
|
Delaware Basin |
|
|
127 |
|
|
|
39 |
% |
|
|
75 |
|
|
|
+69 |
% |
|
STACK |
|
|
119 |
|
|
|
36 |
% |
|
|
125 |
|
|
|
- 5 |
% |
|
Powder River Basin |
|
|
23 |
|
|
|
7 |
% |
|
|
17 |
|
|
|
+34 |
% |
|
Eagle Ford |
|
|
47 |
|
|
|
15 |
% |
|
|
54 |
|
|
|
- 12 |
% |
|
Other |
|
|
7 |
|
|
|
2 |
% |
|
|
7 |
|
|
|
+5 |
% |
|
New Devon |
|
|
323 |
|
|
|
99 |
% |
|
|
278 |
|
|
|
+16 |
% |
|
U.S. divest assets |
|
|
4 |
|
|
|
1 |
% |
|
|
18 |
|
|
|
- 80 |
% |
|
Total |
|
|
327 |
|
|
|
100 |
% |
|
|
296 |
|
|
|
+11 |
% |
From 2018 to 2019, an 11% increase in production volumes contributed to a $410 million increase in earnings. Continued development in the Delaware Basin and Powder River Basin drove a 16% production increase for New Devon which was slightly offset by decreased production associated with divested assets.
Field Prices
|
|
|
2019 |
|
|
Realization |
|
|
2018 |
|
|
Change |
|
||||
|
Oil (per Bbl) |
|
|
|
|
|
|
|
|
|
|
|
|
|
|
|
|
|
WTI index |
|
$ |
57.02 |
|
|
|
|
|
|
$ |
64.79 |
|
|
|
- 12 |
% |
|
Realized price, unhedged |
|
$ |
54.73 |
|
|
|
96% |
|
|
$ |
61.96 |
|
|
|
- 12 |
% |
|
Cash settlements |
|
$ |
1.71 |
|
|
|
|
|
|
$ |
(8.01 |
) |
|
|
|
|
|
Realized price, with hedges |
|
$ |
56.44 |
|
|
|
99% |
|
|
$ |
53.95 |
|
|
|
+5 |
% |
|
|
|
2019 |
|
|
Realization |
|
|
2018 |
|
|
Change |
|
||||
|
Gas (per Mcf) |
|
|
|
|
|
|
|
|
|
|
|
|
|
|
|
|
|
Henry Hub index |
|
$ |
2.63 |
|
|
|
|
|
|
$ |
3.09 |
|
|
|
- 15 |
% |
|
Realized price, unhedged |
|
$ |
1.79 |
|
|
|
68% |
|
|
$ |
2.34 |
|
|
|
- 23 |
% |
|
Cash settlements |
|
$ |
0.14 |
|
|
|
|
|
|
$ |
0.02 |
|
|
|
|
|
|
Realized price, with hedges |
|
$ |
1.93 |
|
|
|
73% |
|
|
$ |
2.36 |
|
|
|
- 18 |
% |
|
|
|
2019 |
|
|
Realization |
|
|
2018 |
|
|
Change |
|
||||
|
NGLs (per Bbl) |
|
|
|
|
|
|
|
|
|
|
|
|
|
|
|
|
|
Mont Belvieu blended index (1) |
|
$ |
19.22 |
|
|
|
|
|
|
$ |
28.31 |
|
|
|
- 32 |
% |
|
Realized price, unhedged |
|
$ |
15.21 |
|
|
|
79% |
|
|
$ |
25.47 |
|
|
|
- 40 |
% |
|
Cash settlements |
|
$ |
1.61 |
|
|
|
|
|
|
$ |
(1.75 |
) |
|
|
|
|
|
Realized price, with hedges |
|
$ |
16.82 |
|
|
|
88% |
|
|
$ |
23.72 |
|
|
|
- 29 |
% |
|
|
(1) |
Based upon composition of our NGL barrel. |
|
|
|
2019 |
|
|
2018 |
|
|
Change |
|
|||
|
Combined (per Boe) |
|
|
|
|
|
|
|
|
|
|
|
|
|
Realized price, unhedged |
|
$ |
31.93 |
|
|
$ |
37.87 |
|
|
|
- 16 |
% |
|
Cash settlements |
|
$ |
1.43 |
|
|
$ |
(3.89 |
) |
|
|
|
|
|
Realized price, with hedges |
|
$ |
33.36 |
|
|
$ |
33.98 |
|
|
|
- 2 |
% |
From 2018 to 2019, field prices contributed to a $686 million decrease in earnings. Unhedged realized oil, gas and NGL prices decreased primarily due to lower WTI, Henry Hub and Mont Belvieu index prices. These decreases were partially offset by favorable hedge cash settlements across each of our products.
28
Hedge Settlements
|
|
|
2019 |
|
|
2018 |
|
|
Change |
|
|||
|
|
|
Q |
|
|
|
|
|
|
|
|
|
|
|
Oil |
|
$ |
93 |
|
|
$ |
(380 |
) |
|
|
N/M |
|
|
Natural gas |
|
|
31 |
|
|
|
5 |
|
|
|
N/M |
|
|
NGL |
|
|
46 |
|
|
|
(45 |
) |
|
|
N/M |
|
|
Total cash settlements |
|
$ |
170 |
|
|
$ |
(420 |
) |
|
|
N/M |
|
Cash settlements as presented in the tables above represent realized gains or losses related to the instruments described in Note 3 in “Item 8. Financial Statements and Supplementary Data” of this report.
Production Expenses
|
|
|
2019 |
|
|
2018 |
|
|
Change |
|
|||
|
LOE |
|
$ |
462 |
|
|
$ |
480 |
|
|
|
- 4 |
% |
|
Gathering, processing & transportation |
|
|
463 |
|
|
|
407 |
|
|
|
+14 |
% |
|
Production taxes |
|
|
251 |
|
|
|
248 |
|
|
|
+1 |
% |
|
Property taxes |
|
|
21 |
|
|
|
18 |
|
|
|
+17 |
% |
|
Total |
|
$ |
1,197 |
|
|
$ |
1,153 |
|
|
|
+4 |
% |
|
Per Boe: |
|
|
|
|
|
|
|
|
|
|
|
|
|
LOE |
|
$ |
3.87 |
|
|
$ |
4.45 |
|
|
|
- 13 |
% |
|
Gathering, processing & transportation |
|
$ |
3.88 |
|
|
$ |
3.77 |
|
|
|
+3 |
% |
|
Percent of oil, gas and NGL sales: |
|
|
|
|
|
|
|
|
|
|
|
|
|
Production taxes |
|
|
6.6 |
% |
|
|
6.1 |
% |
|
|
+8 |
% |
LOE per Boe decreased in 2019 compared to 2018 due to the impact of our cost reduction initiatives. Gathering, processing and transportation increased primarily due to increased activity in the Delaware Basin.
Field-Level Cash Margin
The table below presents the field-level cash margin for each of our operating areas. Field-level cash margin is computed as oil, gas and NGL revenues less production expenses and is not prepared in accordance with GAAP. A reconciliation to the comparable GAAP measures is found in “Non-GAAP Measures” in this Item 7. The changes in production volumes, field prices and production expenses, shown above, had the following impacts on our field-level cash margins by asset.
|
|
|
2019 |
|
|
$ per BOE |
|
|
2018 |
|
|
$ per BOE |
|
||||
|
Field-level cash margin (non-GAAP) |
|
|
|
|
|
|
|
|
|
|
|
|
|
|
|
|
|
Delaware Basin |
|
$ |
1,157 |
|
|
$ |
25.00 |
|
|
$ |
786 |
|
|
$ |
28.65 |
|
|
STACK |
|
|
685 |
|
|
$ |
15.81 |
|
|
|
992 |
|
|
$ |
21.75 |
|
|
Powder River Basin |
|
|
246 |
|
|
$ |
28.64 |
|
|
|
249 |
|
|
$ |
38.50 |
|
|
Eagle Ford |
|
|
446 |
|
|
$ |
25.80 |
|
|
|
717 |
|
|
$ |
36.30 |
|
|
Other |
|
|
65 |
|
|
$ |
25.37 |
|
|
|
72 |
|
|
$ |
28.59 |
|
|
New Devon |
|
|
2,599 |
|
|
$ |
22.02 |
|
|
|
2,816 |
|
|
$ |
27.67 |
|
|
U.S. divest assets |
|
|
13 |
|
|
$ |
11.01 |
|
|
|
116 |
|
|
$ |
19.15 |
|
|
Total |
|
$ |
2,612 |
|
|
$ |
21.90 |
|
|
$ |
2,932 |
|
|
$ |
27.19 |
|
Depreciation, Depletion and Amortization
|
|
|
2019 |
|
|
2018 |
|
|
Change |
|
|||
|
Oil and gas per Boe |
|
$ |
11.72 |
|
|
$ |
10.51 |
|
|
|
+11 |
% |
|
|
|
|
|
|
|
|
|
|
|
|
|
|
|
Oil and gas |
|
$ |
1,398 |
|
|
$ |
1,134 |
|
|
|
+23 |
% |
|
Other property and equipment |
|
|
99 |
|
|
|
94 |
|
|
|
+5 |
% |
|
Total |
|
$ |
1,497 |
|
|
|
1,228 |
|
|
|
+22 |
% |
Our oil and gas DD&A increased due to continued development in the Delaware Basin and Powder River Basin.
General and Administrative Expense
|
|
|
2019 |
|
|
2018 |
|
|
Change |
|
|||
|
Labor and benefits (net of reimbursements) |
|
$ |
307 |
|
|
$ |
365 |
|
|
|
- 16 |
% |
|
Non-labor |
|
|
168 |
|
|
|
209 |
|
|
|
- 20 |
% |
|
Total Devon |
|
$ |
475 |
|
|
$ |
574 |
|
|
|
- 17 |
% |
From 2018 to 2019, G&A decreased $99 million primarily as a result of the workforce reduction and other cost-saving initiatives that occurred during 2019 as discussed in Note 6 in “Item 8. Financial Statements and Supplementary Data” of this report.
Other Items
|
|
|
2019 |
|
|
2018 |
|
|
Change in earnings |
|
|||
|
Commodity hedge valuation changes (1) |
|
$ |
(624 |
) |
|
$ |
877 |
|
|
$ |
(1,501 |
) |
|
Marketing operations |
|
|
53 |
|
|
|
33 |
|
|
|
20 |
|
|
Exploration expenses |
|
|
58 |
|
|
|
128 |
|
|
|
70 |
|
|
Asset impairments |
|
|
— |
|
|
|
156 |
|
|
|
156 |
|
|
Asset dispositions |
|
|
(48 |
) |
|
|
(278 |
) |
|
|
(230 |
) |
|
Net financing costs |
|
|
250 |
|
|
|
580 |
|
|
|
330 |
|
|
Restructuring and transaction costs |
|
|
84 |
|
|
|
97 |
|
|
|
13 |
|
|
Other expenses |
|
|
4 |
|
|
|
(7 |
) |
|
|
(11 |
) |
|
|
|
|
|
|
|
|
|
|
|
$ |
(1,153 |
) |
|
|
(1) |
Included as a component of upstream revenues on the consolidated statements of comprehensive earnings. |
We recognize fair value changes on our oil, gas and NGL derivative instruments in each reporting period. The changes in fair value resulted from new positions and settlements that occurred during each period, as well as the relationship between contract prices and the associated forward curves.
Exploration expense decreased primarily due to recognizing $95 million in unproved impairments related to certain non-core acreage in the U.S during 2018 compared to $18 million in 2019.
Asset impairments decreased due to recognizing $109 million of proved asset impairments and $47 million of non-oil and gas asset impairments during 2018 as discussed in Note 5 in “Item 8. Financial Statements and Supplementary Data” of this report.
29
Asset dispositions decreased primarily due to gains recognized in conjunction with certain of our U.S. asset dispositions in 2018. For additional information see Note 2 in “Item 8. Financial Statements and Supplementary Data” of this report.
Net financing costs decreased primarily due to $312 million of early retirement charges associated with our debt retirement in 2018 as discussed in Note 13 in “Item 8. Financial Statements and Supplementary Data” of this report.
Income Taxes
|
|
|
2019 |
|
|
2018 |
|
||
|
Current benefit |
|
$ |
(5) |
|
|
$ |
(17) |
|
|
Deferred expense (benefit) |
|
|
(25) |
|
|
|
247 |
|
|
Total expense (benefit) |
|
$ |
(30) |
|
|
$ |
230 |
|
|
Effective income tax rate |
|
|
28 |
% |
|
|
24 |
% |
For discussion on income taxes, see Note 7 in “Item 8. Financial Statements and Supplementary Data” of this report.
Results of Operations – 2018 vs. 2017
Our 2018 net earnings from continuing operations were $714 million and increased $681 million compared to 2017. The graph below shows the change in net earnings from 2017 to 2018. The material changes are further discussed by category on the following pages. To facilitate the review, these numbers are being presented before consideration of earnings attributable to noncontrolling interests.
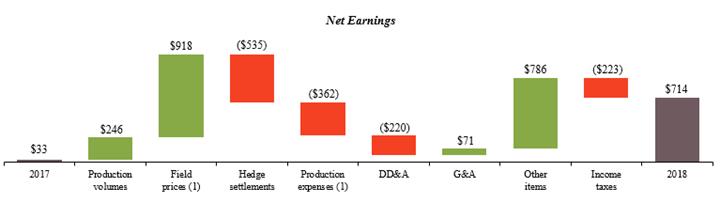
|
|
(1) |
As further discussed in Note 1 in “Item 8. Financial Statements and Supplementary Data” of this report, the presentation of certain processing arrangements changed from a net to a gross presentation in 2018. The change resulted in an increase to our upstream revenues and production expenses by $191 million during 2018 with no impact to net earnings. |
30
Production Volumes
|
|
|
2018 |
|
|
% of Total |
|
|
2017 |
|
|
Change |
|
||||
|
Oil (MBbls/d) |
|
|
|
|
|
|
|
|
|
|
|
|
|
|
|
|
|
Delaware Basin |
|
|
42 |
|
|
|
32 |
% |
|
|
29 |
|
|
|
+42 |
% |
|
STACK |
|
|
32 |
|
|
|
25 |
% |
|
|
25 |
|
|
|
+28 |
% |
|
Powder River Basin |
|
|
14 |
|
|
|
10 |
% |
|
|
10 |
|
|
|
+37 |
% |
|
Eagle Ford |
|
|
28 |
|
|
|
22 |
% |
|
|
34 |
|
|
|
- 17 |
% |
|
Other |
|
|
5 |
|
|
|
4 |
% |
|
|
6 |
|
|
|
- 6 |
% |
|
New Devon |
|
|
121 |
|
|
|
93 |
% |
|
|
104 |
|
|
|
+17 |
% |
|
U.S. divest assets |
|
|
9 |
|
|
|
7 |
% |
|
|
11 |
|
|
|
- 24 |
% |
|
Total |
|
|
130 |
|
|
|
100 |
% |
|
|
115 |
|
|
|
+13 |
% |
|
|
|
2018 |
|
|
% of Total |
|
|
2017 |
|
|
Change |
|
||||
|
Gas (MMcf/d) |
|
|
|
|
|
|
|
|
|
|
|
|
|
|
|
|
|
Delaware Basin |
|
|
105 |
|
|
|
19 |
% |
|
|
86 |
|
|
|
+22 |
% |
|
STACK |
|
|
334 |
|
|
|
59 |
% |
|
|
294 |
|
|
|
+13 |
% |
|
Powder River Basin |
|
|
16 |
|
|
|
3 |
% |
|
|
8 |
|
|
|
+85 |
% |
|
Eagle Ford |
|
|
79 |
|
|
|
14 |
% |
|
|
95 |
|
|
|
- 17 |
% |
|
Other |
|
|
1 |
|
|
|
0 |
% |
|
|
1 |
|
|
|
+6 |
% |
|
New Devon |
|
|
535 |
|
|
|
95 |
% |
|
|
484 |
|
|
|
+10 |
% |
|
U.S. divest assets |
|
|
31 |
|
|
|
5 |
% |
|
|
35 |
|
|
|
- 10 |
% |
|
Total |
|
|
566 |
|
|
|
100 |
% |
|
|
519 |
|
|
|
+9 |
% |
|
|
|
2018 |
|
|
% of Total |
|
|
2017 |
|
|
Change |
|
||||
|
NGLs (MBbls/d) |
|
|
|
|
|
|
|
|
|
|
|
|
|
|
|
|
|
Delaware Basin |
|
|
16 |
|
|
|
22 |
% |
|
|
10 |
|
|
|
+53 |
% |
|
STACK |
|
|
37 |
|
|
|
53 |
% |
|
|
30 |
|
|
|
+24 |
% |
|
Powder River Basin |
|
|
1 |
|
|
|
2 |
% |
|
|
1 |
|
|
|
+75 |
% |
|
Eagle Ford |
|
|
13 |
|
|
|
18 |
% |
|
|
13 |
|
|
|
+2 |
% |
|
Other |
|
|
1 |
|
|
|
1 |
% |
|
|
1 |
|
|
|
- 4 |
% |
|
New Devon |
|
|
68 |
|
|
|
96 |
% |
|
|
55 |
|
|
|
+25 |
% |
|
U.S. divest assets |
|
|
3 |
|
|
|
4 |
% |
|
|
3 |
|
|
|
- 10 |
% |
|
Total |
|
|
71 |
|
|
|
100 |
% |
|
|
58 |
|
|
|
+23 |
% |
|
|
|
2018 |
|
|
% of Total |
|
|
2017 |
|
|
Change |
|
||||
|
Combined (MBoe/d) |
|
|
|
|
|
|
|
|
|
|
|
|
|
|
|
|
|
Delaware Basin |
|
|
75 |
|
|
|
26 |
% |
|
|
54 |
|
|
|
+39 |
% |
|
STACK |
|
|
125 |
|
|
|
42 |
% |
|
|
104 |
|
|
|
+20 |
% |
|
Powder River Basin |
|
|
17 |
|
|
|
6 |
% |
|
|
12 |
|
|
|
+43 |
% |
|
Eagle Ford |
|
|
54 |
|
|
|
18 |
% |
|
|
62 |
|
|
|
- 13 |
% |
|
Other |
|
|
7 |
|
|
|
2 |
% |
|
|
7 |
|
|
|
- 3 |
% |
|
New Devon |
|
|
278 |
|
|
|
94 |
% |
|
|
239 |
|
|
|
+16 |
% |
|
U.S. divest assets |
|
|
18 |
|
|
|
6 |
% |
|
|
21 |
|
|
|
- 14 |
% |
|
Total |
|
|
296 |
|
|
|
100 |
% |
|
|
260 |
|
|
|
+14 |
% |
From 2017 to 2018, an increase in production volumes contributed to a $246 million increase in earnings. Focused development activities in the Delaware Basin, STACK and Powder River Basin drove production increases for New Devon and were partially offset by decreased activity in the Eagle Ford and lower production volumes associated with our U.S. divested assets.
Oil, Gas and NGL Prices
|
|
|
2018 |
|
|
Realization |
|
|
2017 |
|
|
Change |
|
||||
|
Oil (per Bbl) |
|
|
|
|
|
|
|
|
|
|
|
|
|
|
|
|
|
WTI index |
|
$ |
64.79 |
|
|
|
|
|
|
$ |
50.99 |
|
|
|
+27 |
% |
|
Realized price, unhedged |
|
$ |
61.96 |
|
|
|
96% |
|
|
$ |
49.41 |
|
|
|
+25 |
% |
|
Cash settlements |
|
$ |
(8.01 |
) |
|
|
|
|
|
$ |
1.98 |
|
|
|
|
|
|
Realized price, with hedges |
|
$ |
53.95 |
|
|
|
83% |
|
|
$ |
51.39 |
|
|
|
+5 |
% |
|
|
|
2018 |
|
|
Realization |
|
|
2017 |
|
|
Change |
|
||||
|
Gas (per Mcf) |
|
|
|
|
|
|
|
|
|
|
|
|
|
|
|
|
|
Henry Hub index |
|
$ |
3.09 |
|
|
|
|
|
|
$ |
3.11 |
|
|
|
- 1 |
% |
|
Realized price, unhedged |
|
$ |
2.34 |
|
|
|
76% |
|
|
$ |
2.57 |
|
|
|
- 9 |
% |
|
Cash settlements |
|
$ |
0.02 |
|
|
|
|
|
|
$ |
0.18 |
|
|
|
|
|
|
Realized price, with hedges |
|
$ |
2.36 |
|
|
|
76% |
|
|
$ |
2.75 |
|
|
|
- 14 |
% |
|
|
|
2018 |
|
|
Realization |
|
|
2017 |
|
|
Change |
|
||||
|
NGLs (per Bbl) |
|
|
|
|
|
|
|
|
|
|
|
|
|
|
|
|
|
Mont Belvieu blended index (1) |
|
$ |
28.31 |
|
|
|
|
|
|
$ |
24.77 |
|
|
|
+14 |
% |
|
Realized price, unhedged |
|
$ |
25.47 |
|
|
|
90% |
|
|
$ |
16.74 |
|
|
|
+52 |
% |
|
Cash settlements |
|
$ |
(1.75 |
) |
|
|
|
|
|
$ |
(0.16 |
) |
|
|
|
|
|
Realized price, with hedges |
|
$ |
23.72 |
|
|
|
84% |
|
|
$ |
16.58 |
|
|
|
+43 |
% |
|
(1) |
Based upon composition of average Devon NGL barrel. |
|
|
|
2018 |
|
|
2017 |
|
|
Change |
|
|||
|
Combined (per Boe) |
|
|
|
|
|
|
|
|
|
|
|
|
|
Realized price, unhedged |
|
$ |
37.87 |
|
|
$ |
30.80 |
|
|
|
+23 |
% |
|
Cash settlements |
|
$ |
(3.89 |
) |
|
$ |
1.21 |
|
|
|
|
|
|
Realized price, with hedges |
|
$ |
33.98 |
|
|
$ |
32.01 |
|
|
|
+6 |
% |
Upstream revenues increased $918 million as a result of higher unhedged, realized prices for oil and NGLs. The increase in oil sales primarily resulted from higher average WTI crude index prices, which were 27% higher in 2018, resulting in an increase of approximately $600 million.
NGL sales increased $282 million as a result of 14% higher NGL prices at the Mont Belvieu, Texas hub, as well as improved realizations in our NGL price. These increases were partially offset by unfavorable hedge cash settlements for our oil and NGL hedges.
In 2018, the presentation of certain processing arrangements changed from a net to a gross presentation. The change resulted in an increase to our upstream revenues and production expenses by approximately $191 million with no impact to net earnings.
Hedge Settlements
|
|
|
2018 |
|
|
2017 |
|
|
Change |
|
|||
|
|
|
Q |
|
|
|
|
|
|
|
|
|
|
|
Oil |
|
$ |
(380 |
) |
|
$ |
83 |
|
|
|
N/M |
|
|
Natural gas |
|
|
5 |
|
|
|
35 |
|
|
|
N/M |
|
|
NGL |
|
|
(45 |
) |
|
|
(3 |
) |
|
|
N/M |
|
|
Total cash settlements |
|
$ |
(420 |
) |
|
$ |
115 |
|
|
|
N/M |
|
31
Production Expenses
|
|
|
2018 |
|
|
2017 |
|
|
Change |
|
|||
|
LOE |
|
$ |
480 |
|
|
$ |
411 |
|
|
|
+17 |
% |
|
Gathering, processing & transportation |
|
|
407 |
|
|
|
205 |
|
|
|
+99 |
% |
|
Production taxes |
|
|
248 |
|
|
|
161 |
|
|
|
+54 |
% |
|
Property taxes |
|
|
18 |
|
|
|
14 |
|
|
|
+29 |
% |
|
Total |
|
$ |
1,153 |
|
|
$ |
791 |
|
|
|
+46 |
% |
|
Per Boe: |
|
|
|
|
|
|
|
|
|
|
|
|
|
LOE |
|
$ |
4.45 |
|
|
$ |
4.33 |
|
|
|
+3 |
% |
|
Gathering, processing & transportation |
|
$ |
3.77 |
|
|
$ |
2.16 |
|
|
|
+74 |
% |
|
Percent of oil, gas and NGL sales: |
|
|
|
|
|
|
|
|
|
|
|
|
|
Production taxes |
|
|
6.1 |
% |
|
|
5.5 |
% |
|
|
+10 |
% |
LOE increased $69 million primarily due to continued focus on growing our liquids-rich assets within the STACK and Delaware Basin, partially offset by our U.S. non-core divestitures.
In 2018, the presentation of certain processing arrangements changed from a net to a gross presentation. The change resulted in an increase to our upstream revenues and production expenses by approximately $191 million with no impact to net earnings.
Production taxes increased on an absolute dollar basis primarily due to the increase in our upstream revenues. Additionally, the increase in Oklahoma severance tax rates that became effective during the third quarter of 2018 also contributed to the increase on an absolute dollar basis and as a percentage of oil, gas and NGL sales.
Field-Level Cash Margin
The changes in production volumes, field prices and production expenses, shown above, had the following impact on our field-level cash margins by asset.
|
|
|
2018 |
|
|
$ per BOE |
|
|
2017 |
|
|
$ per BOE |
|
||||
|
Field-level cash margin (non-GAAP) |
|
|
|
|
|
|
|
|
|
|
|
|
|
|
|
|
|
Delaware Basin |
|
$ |
786 |
|
|
$ |
28.65 |
|
|
$ |
455 |
|
|
$ |
23.04 |
|
|
STACK |
|
|
992 |
|
|
$ |
21.75 |
|
|
|
683 |
|
|
$ |
17.99 |
|
|
Powder River Basin |
|
|
249 |
|
|
$ |
38.50 |
|
|
|
128 |
|
|
$ |
28.67 |
|
|
Eagle Ford |
|
|
717 |
|
|
$ |
36.30 |
|
|
|
667 |
|
|
$ |
29.41 |
|
|
Other |
|
|
72 |
|
|
$ |
28.59 |
|
|
|
68 |
|
|
$ |
26.21 |
|
|
New Devon |
|
|
2,816 |
|
|
$ |
27.67 |
|
|
|
2,001 |
|
|
$ |
22.88 |
|
|
U.S. divest assets |
|
|
116 |
|
|
$ |
19.15 |
|
|
|
129 |
|
|
$ |
17.47 |
|
|
Total |
|
$ |
2,932 |
|
|
$ |
27.19 |
|
|
$ |
2,130 |
|
|
$ |
22.46 |
|
Depreciation, Depletion and Amortization
|
|
|
2018 |
|
|
2017 |
|
|
Change |
|
|||
|
Oil and gas per Boe |
|
$ |
10.51 |
|
|
$ |
9.58 |
|
|
|
+10 |
% |
|
|
|
|
|
|
|
|
|
|
|
|
|
|
|
Oil and gas |
|
$ |
1,134 |
|
|
$ |
908 |
|
|
|
+25 |
% |
|
Other property and equipment |
|
|
94 |
|
|
|
100 |
|
|
|
- 5 |
% |
|
Total |
|
$ |
1,228 |
|
|
$ |
1,008 |
|
|
|
+22 |
% |
Our oil and gas DD&A increased primarily due to continued development in the STACK, Delaware Basin and Powder River Basin properties.
General and Administrative Expense
|
|
|
2018 |
|
|
2017 |
|
|
Change |
|
|||
|
Labor and benefits (net of reimbursements) |
|
$ |
365 |
|
|
$ |
445 |
|
|
|
- 18 |
% |
|
Non-labor |
|
|
209 |
|
|
|
200 |
|
|
|
+ 5 |
% |
|
Total Devon |
|
$ |
574 |
|
|
$ |
645 |
|
|
|
- 11 |
% |
From 2017 to 2018, G&A decreased $71 million primarily as a result of the workforce reductions that occurred during 2018 as discussed in Note 6 in “Item 8. Financial Statements and Supplementary Data” of this report.
Other Items
|
|
|
2018 |
|
|
2017 |
|
|
Change in earnings |
|
|||
|
Commodity hedge valuation changes (1) |
|
$ |
877 |
|
|
$ |
(48 |
) |
|
$ |
925 |
|
|
Marketing operations |
|
|
33 |
|
|
|
(46 |
) |
|
|
79 |
|
|
Exploration expenses |
|
|
128 |
|
|
|
346 |
|
|
|
218 |
|
|
Asset impairments |
|
|
156 |
|
|
|
— |
|
|
|
(156 |
) |
|
Asset dispositions |
|
|
(278 |
) |
|
|
(219 |
) |
|
|
59 |
|
|
Net financing costs |
|
|
580 |
|
|
|
321 |
|
|
|
(259 |
) |
|
Restructuring and transaction costs |
|
|
97 |
|
|
|
— |
|
|
|
(97 |
) |
|
Other expenses |
|
|
(7 |
) |
|
|
10 |
|
|
|
17 |
|
|
|
|
|
|
|
|
|
|
|
|
$ |
786 |
|
|
|
(1) |
Included as a component of upstream revenues on the consolidated statements of comprehensive earnings. |
Marketing operations increased primarily due to improved commodity prices, which were partially offset by the impact of our downstream marketing commitments.
Exploration expense decreased due to recognizing $95 million in unproved impairments related to certain non-core acreage in the U.S during 2018 compared to $217 million in 2017. Additionally, geological and geophysical costs decreased $86 million primarily in the STACK and Delaware Basin.
Asset impairments increased due to recognizing $109 million of proved asset impairments and $47 million of non-oil and gas asset impairments during 2018. For additional information, see Note 5 in “Item 8. Financial Statements and Supplementary Data” of this report.
Asset dispositions increased primarily due to gains recognized in conjunction with certain of our U.S. asset dispositions in 2018. For additional information, see Note 2 in “Item 8. Financial Statements and Supplementary Data” of this report.
Net financing costs increased primarily due to $312 million of early retirement charges associated with our debt retirement in 2018 as discussed in Note 13 in “Item 8. Financial Statements and Supplementary Data” of this report.
32
Restructuring and transaction costs increased primarily as a result of our workforce reductions in 2018. See Note 6 in “Item 8. Financial Statements and Supplementary Data” of this report for additional information.
Income Taxes
|
|
|
2018 |
|
|
2017 |
|
||
|
Current expense (benefit) |
|
$ |
(17 |
) |
|
$ |
9 |
|
|
Deferred expense (benefit) |
|
|
247 |
|
|
|
(2 |
) |
|
Total expense |
|
$ |
230 |
|
|
$ |
7 |
|
|
Effective income tax rate |
|
|
24 |
% |
|
|
18 |
% |
For discussion on income taxes, see Note 7 in “Item 8. Financial Statements and Supplementary Data” of this report.
|
Discontinued Operations |
The table below presents key components from discontinued operations for the time periods presented. Discontinued operations include our aggregate ownership interests in EnLink and the General Partner that Devon divested in July 2018 and the Canadian business that Devon sold in June 2019. Discontinued operations also include the Barnett Shale assets that Devon has contracted to sell and which is expected to close during the second quarter of 2020, as well as previously divested Barnett Shale properties located primarily in Johnson and Wise counties, Texas. For additional information on discontinued operations, see Note 18 in “Part I. Financial Information – Item 1. Financial Statements” of this report.
|
|
|
2019 |
|
|
2018 |
|
|
2017 |
|
|||
|
Upstream revenues |
|
$ |
1,114 |
|
|
$ |
1,742 |
|
|
$ |
2,319 |
|
|
Production expenses |
|
$ |
599 |
|
|
$ |
1,072 |
|
|
$ |
1,031 |
|
|
Marketing margin |
|
$ |
20 |
|
|
$ |
708 |
|
|
$ |
958 |
|
|
Gain on sale of Canadian operations |
|
$ |
(223 |
) |
|
$ |
— |
|
|
$ |
— |
|
|
Gain on sale of EnLink and General Partner interests |
|
$ |
— |
|
|
$ |
(2,607 |
) |
|
$ |
— |
|
|
Asset impairments |
|
$ |
785 |
|
|
$ |
— |
|
|
$ |
17 |
|
|
Financing costs, net |
|
$ |
87 |
|
|
$ |
112 |
|
|
$ |
177 |
|
|
Restructuring and transaction costs |
|
$ |
248 |
|
|
$ |
17 |
|
|
$ |
— |
|
|
Earnings (loss) from discontinued operations before income taxes |
|
$ |
(632 |
) |
|
$ |
2,839 |
|
|
$ |
856 |
|
|
Income tax expense (benefit) |
|
$ |
(358 |
) |
|
$ |
329 |
|
|
$ |
(189 |
) |
|
Net earnings (loss) from discontinued operations, net of tax |
|
$ |
(274 |
) |
|
$ |
2,510 |
|
|
$ |
1,045 |
|
|
|
|
|
|
|
|
|
|
|
|
|
|
|
|
Production (MMBoe): |
|
|
|
|
|
|
|
|
|
|
|
|
|
Barnett Shale |
|
|
37 |
|
|
|
45 |
|
|
|
56 |
|
|
Canada |
|
|
19 |
|
|
|
42 |
|
|
|
48 |
|
|
Total production |
|
|
56 |
|
|
|
87 |
|
|
|
104 |
|
|
Realized price, unhedged (per Boe) - Barnett Shale |
|
$ |
13.30 |
|
|
$ |
17.36 |
|
|
$ |
14.79 |
|
|
Realized price, unhedged (per Boe) - Canada |
|
$ |
38.98 |
|
|
$ |
19.12 |
|
|
$ |
29.39 |
|
2019 vs 2018
Net earnings from discontinued operations, net of tax decreased $2.8 billion as we recognized a $2.6 billion ($2.2 billion after-tax) gain on the sale of our aggregate ownership interests in EnLink and the General Partner during 2018. Net earnings from discontinued operations also decreased due to a $748 million asset impairment to our Barnett Shale assets in the fourth quarter of 2019.
2018 vs 2017
Net earnings from discontinued operations, net of tax increased $1.5 billion as we recognized a $2.6 billion ($2.2 billion after-tax) gain on the sale of our aggregate ownership interests in EnLink and the General Partner during 2018. The gain was partially offset by a decrease in upstream revenues, which was primarily driven by widening differentials for bitumen sales in Canada to the WTI index during the fourth quarter of 2018. Market forces widened Canadian heavy oil differentials beyond historical norms and negatively impacted the price we realized on our Canadian production. We had basis swaps for approximately half of our fourth quarter production to mitigate the effect of the lower market price. To further mitigate the effects of the lower price, we reduced our Jackfish production in November 2018 which impacted our fourth quarter production by approximately 8 MBbls/d. For discussion on discontinued operations, see Note 18 in “Item 8. Financial Statements and Supplementary Data” of this report.
33
Capital Resources, Uses and Liquidity
Sources and Uses of Cash
The following table presents the major changes in cash and cash equivalents for the time periods presented below.
|
|
|
Year ended December 31, |
|
|||||||||
|
|
|
2019 |
|
|
2018 |
|
|
2017 |
|
|||
|
Operating cash flow from continuing operations |
|
$ |
2,043 |
|
|
$ |
1,583 |
|
|
$ |
1,243 |
|
|
Divestitures of property and equipment |
|
|
390 |
|
|
|
500 |
|
|
|
425 |
|
|
Capital expenditures |
|
|
(1,910 |
) |
|
|
(2,116 |
) |
|
|
(1,614 |
) |
|
Acquisitions of property and equipment |
|
|
(31 |
) |
|
|
(55 |
) |
|
|
(44 |
) |
|
Debt activity, net |
|
|
(162 |
) |
|
|
(1,226 |
) |
|
|
— |
|
|
Repurchases of common stock |
|
|
(1,849 |
) |
|
|
(2,956 |
) |
|
|
— |
|
|
Common stock dividends |
|
|
(140 |
) |
|
|
(149 |
) |
|
|
(127 |
) |
|
Contributions from noncontrolling interests |
|
|
116 |
|
|
|
— |
|
|
|
— |
|
|
Other |
|
|
(26 |
) |
|
|
(46 |
) |
|
|
(46 |
) |
|
Net change in cash, cash equivalents and restricted cash from discontinued operations |
|
|
967 |
|
|
|
4,227 |
|
|
|
888 |
|
|
Net change in cash, cash equivalents and restricted cash |
|
$ |
(602 |
) |
|
$ |
(238 |
) |
|
$ |
725 |
|
|
Cash, cash equivalents and restricted cash at end of period |
|
$ |
1,844 |
|
|
$ |
2,446 |
|
|
$ |
2,684 |
|
Operating Cash Flow – Continuing Operations
Net cash provided by operating activities continued to be a significant source of capital and liquidity in 2019. Our operating cash flow increased $460 million, or 29%, to $2.0 billion year over year. In 2019, our operating cash flow nearly funded the entirety of our capital expenditures program and dividends, allowing us to use available cash balances and net divestiture proceeds to fund other capital uses.
Our operating cash flow increased $340 million, or 27%, from 2017 to 2018. Our operating cash flow funded approximately 70% of our capital expenditures program and dividends in 2018 and 2017, respectively. As a result, we utilized available cash balances and divestiture proceeds to supplement our operating cash flows.
Divestitures of Property and Investments – Continuing Operations
During 2019, 2018 and 2017, as part of our announced divestiture programs, we sold non-core U.S. upstream assets for $390 million, $500 million and $425 million, respectively. For further discussion, see Note 2 in “Item 8. Financial Statements and Supplementary Data” of this report.
Capital Expenditures
The following table summarizes our capital expenditures and property acquisitions.
|
|
|
Year ended December 31, |
|
|||||||||
|
|
|
2019 |
|
|
2018 |
|
|
2017 |
|
|||
|
Delaware Basin |
|
$ |
912 |
|
|
$ |
768 |
|
|
$ |
394 |
|
|
STACK |
|
|
396 |
|
|
|
827 |
|
|
|
742 |
|
|
Powder River Basin |
|
|
308 |
|
|
|
157 |
|
|
|
121 |
|
|
Eagle Ford |
|
|
194 |
|
|
|
215 |
|
|
|
115 |
|
|
Other |
|
|
36 |
|
|
|
110 |
|
|
|
155 |
|
|
Total oil and gas |
|
|
1,846 |
|
|
|
2,077 |
|
|
|
1,527 |
|
|
Midstream |
|
|
42 |
|
|
|
16 |
|
|
|
50 |
|
|
Other |
|
|
22 |
|
|
|
23 |
|
|
|
37 |
|
|
Total capital expenditures |
|
$ |
1,910 |
|
|
$ |
2,116 |
|
|
$ |
1,614 |
|
|
Acquisitions |
|
$ |
31 |
|
|
$ |
55 |
|
|
$ |
44 |
|
34
Capital expenditures consist primarily of amounts related to our oil and gas exploration and development operations and other corporate activities. The vast majority of our capital expenditures are for the acquisition, drilling and development of oil and gas properties. Our capital program is designed to operate within or near operating cash flow and may fluctuate with changes to commodity prices and other factors impacting cash flow. This is evidenced by our operating cash flow fully funding capital expenditures in 2019 and funding approximately 75% and 77% of capital expenditures in 2018 and 2017, respectively. Our capital expenditures are lower in 2019 primarily due to our decreased spending in the STACK, partially offset by increased capital investment in higher margin assets in the Delaware and Powder River Basins.
Debt Activity, Net
During 2019, our debt decreased $162 million due to the repayment of our 6.30% senior notes at maturity.
During 2018, our debt decreased $922 million due to completed tender offers of certain long-term debt as well as the maturity of certain senior notes. In conjunction with the tender offers, we recognized a $312 million loss on the early retirement of debt, including $304 million of cash retirement costs and fees. For additional information, see Note 13 in “Item 8. Financial Statements and Supplementary Data” of this report.
Repurchases of Common Stock and Shareholder Distributions
We repurchased 68.6 million shares of common stock for $1.8 billion in 2019 and 78.1 million shares of common stock for $3.0 billion in 2018 under a share repurchase program authorized by our Board of Directors. For additional information, see Note 17 in “Item 8. Financial Statements and Supplementary Data” in this report.
Devon paid common stock dividends of $140 million, $149 million and $127 million during 2019, 2018 and 2017, respectively. During the second quarter of 2018, we increased our quarterly dividend 33% from $0.06 to $0.08 per share as part of our focus on returning cash to shareholders. In February 2019, we further increased our quarterly dividend 12.5% to $0.09 per share, beginning in the second quarter of 2019. For additional information, see Note 17 in “Item 8. Financial Statements and Supplementary Data” of this report.
Contributions from Noncontrolling Interests
During 2019, we received approximately $116 million in cash contributions from our partner in CDM.
35
Cash Flows from Discontinued Operations
All cash flows in the following table relate to activities from discontinued operations for the time periods presented. Discontinued operations include our aggregate ownership interests in EnLink and the General Partner that Devon divested in July 2018 and the Canadian business that Devon sold in June 2019. Discontinued operations also include the Barnett Shale assets that Devon has contracted to sell and which is expected to close during the second quarter of 2020, as well as previously divested Barnett Shale properties located primarily in Johnson and Wise counties, Texas.
|
|
|
Year ended December 31, |
|
|||||||||
|
|
|
2019 |
|
|
2018 |
|
|
2017 |
|
|||
|
Settlements of intercompany foreign denominated assets/liabilities |
|
$ |
(32 |
) |
|
$ |
(241 |
) |
|
$ |
9 |
|
|
Other |
|
|
60 |
|
|
|
1,362 |
|
|
|
1,657 |
|
|
Operating activities |
|
|
28 |
|
|
|
1,121 |
|
|
|
1,666 |
|
|
Divestitures of property and equipment - Canadian operations |
|
|
2,608 |
|
|
|
— |
|
|
|
— |
|
|
Divestitures of investments - EnLink and General Partner |
|
|
— |
|
|
|
3,104 |
|
|
|
190 |
|
|
Divestitures of property and equipment - Barnett Shale assets |
|
|
— |
|
|
|
513 |
|
|
|
— |
|
|
Capital expenditures and other |
|
|
(136 |
) |
|
|
(891 |
) |
|
|
(1,156 |
) |
|
Investing activities |
|
|
2,472 |
|
|
|
2,726 |
|
|
|
(966 |
) |
|
Debt activity, net |
|
|
(1,552 |
) |
|
|
347 |
|
|
|
2 |
|
|
Issuance of subsidiary units |
|
|
— |
|
|
|
1 |
|
|
|
501 |
|
|
Distributions to noncontrolling interests |
|
|
— |
|
|
|
(217 |
) |
|
|
(354 |
) |
|
Other |
|
|
(26 |
) |
|
|
43 |
|
|
|
33 |
|
|
Financing activities |
|
|
(1,578 |
) |
|
|
174 |
|
|
|
182 |
|
|
Settlements of intercompany foreign denominated assets/liabilities |
|
|
32 |
|
|
|
241 |
|
|
|
(9 |
) |
|
Other |
|
|
13 |
|
|
|
(35 |
) |
|
|
15 |
|
|
Effect of exchange rate changes on cash |
|
|
45 |
|
|
|
206 |
|
|
|
6 |
|
|
Net change in cash, cash equivalents and restricted cash of discontinued operations |
|
$ |
967 |
|
|
$ |
4,227 |
|
|
$ |
888 |
|
Operating cash flow in 2019 decreased $1.1 billion and $1.6 billion from 2018 and 2017, respectively, as a result of the divestitures referenced above. Additionally, operating cash flow was negatively affected in the first quarter of 2019 primarily due to realization impacts associated with the widening Canadian differentials in the fourth quarter of 2018. Foreign currency denominated intercompany loan activity resulted in a realized loss of $32 million and $241 million in 2019 and 2018, respectively, as a result of the strengthening of the U.S. dollar in relation to the Canadian dollar. Foreign currency denominated intercompany loan activity resulted in a realized gain of $9 million in 2017, as a result of the weakening of the U.S. dollar in relation to the Canadian dollar. There was an offset in the effect of exchange rate changes on cash line in the above table, resulting in no impact to the net change in cash, cash equivalents and restricted cash.
On June 27, 2019, Devon completed the sale of substantially all its oil and gas assets and operations in Canada for proceeds of $2.6 billion. In the second and fourth quarter of 2018, Devon completed the sale of a portion of its Barnett Shale assets, located primarily in Johnson and Wise counties, Texas for approximately $500 million in combined proceeds. On July 18, 2018, Devon completed the sale of its aggregate ownership interests in EnLink and the General Partner for $3.125 billion. During 2017, EnLink divested its ownership interest in Howard Energy Partners for approximately $190 million.
Cash flows from financing activities includes the $1.5 billion of senior notes retired prior to maturity in July 2019 and common and preferred units EnLink issued and sold during 2017 generating net proceeds of $501 million. Distributions to noncontrolling interests in the table above exclude the distributions EnLink and the General Partner paid to Devon, which have been eliminated in consolidation. Distributions EnLink and the General Partner paid to Devon were $134 million and $265 million during 2018 and 2017, respectively.
Liquidity
The business of exploring for, developing and producing oil and natural gas is capital intensive. Because oil, natural gas and NGL reserves are a depleting resource, we, like all upstream operators, must continually make capital investments to grow and even sustain production. Generally, our capital investments are focused on drilling and completing new wells and maintaining production
36
from existing wells. At opportunistic times, we also acquire operations and properties from other operators or land owners to enhance our existing portfolio of assets.
Historically, our primary sources of capital funding and liquidity have been our operating cash flow, cash on hand and asset divestiture proceeds. Additionally, we maintain a commercial paper program, supported by our revolving line of credit, which can be accessed as needed to supplement operating cash flow and cash balances. If needed, we can also issue debt and equity securities, including through transactions under our shelf registration statement filed with the SEC. We estimate the combination of our sources of capital will continue to be adequate to fund our planned capital requirements as discussed in this section.
Operating Cash Flow
Key inputs into determining our planned capital investment is the amount of cash we hold and operating cash flow we expect to generate over the next one to three or more years. At the end of 2019, we held approximately $1.8 billion of cash, inclusive of $380 million of cash restricted for discontinued operations. Our operating cash flow forecasts are sensitive to many variables and include a measure of uncertainty as these variables differ from our expectations.
Commodity Prices – The most uncertain and volatile variables for our operating cash flow are the prices of the oil, gas and NGLs we produce and sell. Prices are determined primarily by prevailing market conditions. Regional and worldwide economic activity, weather and other substantially variable factors influence market conditions for these products. These factors, which are difficult to predict, create volatility in prices and are beyond our control.
To mitigate some of the risk inherent in prices, we utilize various derivative financial instruments to protect a portion of our production against downside price risk. We hedge our production in a manner that systematically places hedges for several quarters in advance, allowing us to maintain a disciplined risk management program as it relates to commodity price volatility. We supplement the systematic hedging program with discretionary hedges that take advantage of favorable market conditions. The key terms to our oil, gas and NGL derivative financial instruments as of December 31, 2019 are presented in Note 3 in “Item 8. Financial Statements and Supplementary Data” of this report.
Further, when considering the current commodity price environment and our current hedge position, we expect to achieve our capital investment priorities. Should WTI drop closer to $45/Bbl for an extended period, we would shift our focus to preserving our financial strength and operational continuity. However, as WTI/Bbl rises above $50, our free cash flow will accelerate, providing additional capital allocation opportunities.
Operating Expenses – Commodity prices can also affect our operating cash flow through an indirect effect on operating expenses. Significant commodity price decreases can lead to a decrease in drilling and development activities. As a result, the demand and cost for people, services, equipment and materials may also decrease, causing a positive impact on our cash flow as the prices paid for services and equipment decline. However, the inverse is also generally true during periods of rising commodity prices.
In 2019, we aggressively optimized our cost structure in conjunction with our Canadian and Barnett Shale asset divestitures, as we focus on our remaining four U.S. oil plays, align our workforce with the retained business and reduce outstanding debt. These optimizations include cost reductions and efficiencies related to our capital programs, G&A, financing costs and production expenses.
Credit Losses – Our operating cash flow is also exposed to credit risk in a variety of ways. This includes the credit risk related to customers who purchase our oil, gas and NGL production, the collection of receivables from our joint interest partners for their proportionate share of expenditures made on projects we operate and counterparties to our derivative financial contracts. We utilize a variety of mechanisms to limit our exposure to the credit risks of our customers, partners and counterparties. Such mechanisms include, under certain conditions, requiring letters of credit, prepayments or collateral postings.
37
Divestitures of Property and Equipment
In December 2019, we announced the sale of our Barnett Shale assets for approximately $770 million. We expect this transaction to close in the second quarter of 2020.
Credit Availability
We have $3.0 billion of available borrowing capacity under our Senior Credit Facility at December 31, 2019. On December 13, 2019, we entered into an amendment and extension agreement to, among other things, (i) effect the extension of the maturity date of the Senior Credit Facility from October 5, 2023 to October 5, 2024 with respect to the consenting lenders and (ii) modify the maximum number of maturity extension requests during the term of the Senior Credit Facility from two to three. As a result of this amendment, the Senior Credit Facility matures on October 5, 2024, with the option to extend the maturity date by two additional one-year periods subject to lender consent. Subsequent to October 5, 2023, the borrowing capacity decreases to $2.8 billion. The Senior Credit Facility supports our $3.0 billion of short-term credit under our commercial paper program. As of December 31, 2019, there were no borrowings under our commercial paper program. See Note 13 in “Item 8. Financial Statements and Supplementary Data” of this report for further discussion.
The Senior Credit Facility contains only one material financial covenant. This covenant requires us to maintain a ratio of total funded debt to total capitalization, as defined in the credit agreement, of no more than 65%. As of December 31, 2019, we were in compliance with this covenant with a 19.1% debt-to-capitalization ratio.
Our access to funds from the Senior Credit Facility is not restricted under any “material adverse effect” clauses. It is not uncommon for credit agreements to include such clauses. These clauses can remove the obligation of the banks to fund the credit line if any condition or event would reasonably be expected to have a material and adverse effect on the borrower’s financial condition, operations, properties or business considered as a whole, the borrower’s ability to make timely debt payments or the enforceability of material terms of the credit agreement. While our credit facility includes covenants that require us to report a condition or event having a material adverse effect, the obligation of the banks to fund the credit facility is not conditioned on the absence of a material adverse effect.
As market conditions warrant and subject to our contractual restrictions, liquidity position and other factors, we may from time to time seek to repurchase or retire our outstanding debt through cash purchases and/or exchanges for other debt or equity securities in open market transactions, privately negotiated transactions, by tender offer or otherwise. Any such cash repurchases by us may be funded by cash on hand or incurring new debt. The amounts involved in any such transactions, individually or in the aggregate, may be material. Furthermore, any such repurchases or exchanges may result in our acquiring and retiring a substantial amount of such indebtedness, which would impact the trading liquidity of such indebtedness.
Debt Ratings
We receive debt ratings from the major ratings agencies in the U.S. In determining our debt ratings, the agencies consider a number of qualitative and quantitative items including, but not limited to, commodity pricing levels, our liquidity, asset quality, reserve mix, debt levels, cost structure, planned asset sales and production growth opportunities. Our credit rating from Standard and Poor’s Financial Services is BBB- with a stable outlook. Our credit rating from Fitch is BBB with a stable outlook. Our credit rating from Moody’s Investor Service is Ba1 with a positive outlook. Any rating downgrades may result in additional letters of credit or cash collateral being posted under certain contractual arrangements.
There are no “rating triggers” in any of our contractual debt obligations that would accelerate scheduled maturities should our debt rating fall below a specified level. However, a downgrade could adversely impact our interest rate on any credit facility borrowings and the ability to economically access debt markets in the future.
Share Repurchase Program
In December 2019, our Board of Directors approved a $1.0 billion share repurchase program that expires on December 31, 2020. This repurchase program was approved in conjunction with the announced divestiture of Devon’s assets in the Barnett Shale. Under this new program, $800 million of the $1.0 billion authorization is conditioned upon the closing of the pending Barnett Shale divestiture.
38
Capital Expenditures
Our 2020 exploration and development budget is expected to be approximately $1.7 billion to $1.85 billion.
In December 2019, we announced a partnership under which we will monetize half our working interest across 133 undrilled locations in the STACK for an approximate $100 million drilling carry spread over the next four years. Drilling operations under this agreement are expected to commence in mid-2020.
Contractual Obligations
The following table presents a summary of our contractual obligations as of December 31, 2019.
|
|
|
Payments Due by Period |
|
|||||||||||||||||
|
|
|
Total |
|
|
Less Than 1 Year |
|
|
1-3 Years |
|
|
3-5 Years |
|
|
More Than 5 Years |
|
|||||
|
Continuing Operations |
|
|
|
|
|
|
|
|
|
|
|
|
|
|
|
|
|
|
|
|
|
Debt (1) |
|
$ |
4,349 |
|
|
$ |
— |
|
|
$ |
— |
|
|
$ |
— |
|
|
$ |
4,349 |
|
|
Interest expense (2) |
|
|
4,513 |
|
|
|
259 |
|
|
|
518 |
|
|
|
518 |
|
|
|
3,218 |
|
|
Operational agreements (3) |
|
|
1,468 |
|
|
|
320 |
|
|
|
431 |
|
|
|
301 |
|
|
|
416 |
|
|
Asset retirement obligations (4) |
|
|
398 |
|
|
|
18 |
|
|
|
13 |
|
|
|
25 |
|
|
|
342 |
|
|
Drilling and facility obligations (5) |
|
|
262 |
|
|
|
131 |
|
|
|
61 |
|
|
|
38 |
|
|
|
32 |
|
|
Lease obligations (6) |
|
|
426 |
|
|
|
51 |
|
|
|
53 |
|
|
|
24 |
|
|
|
298 |
|
|
Other (7) |
|
|
223 |
|
|
|
11 |
|
|
|
75 |
|
|
|
32 |
|
|
|
105 |
|
|
Total |
|
|
11,639 |
|
|
|
790 |
|
|
|
1,151 |
|
|
|
938 |
|
|
|
8,760 |
|
|
Discontinued Operations |
|
|
|
|
|
|
|
|
|
|
|
|
|
|
|
|
|
|
|
|
|
Barnett Shale obligations (8) |
|
|
271 |
|
|
|
35 |
|
|
|
63 |
|
|
|
46 |
|
|
|
127 |
|
|
Canadian obligations (9) |
|
|
347 |
|
|
|
55 |
|
|
|
69 |
|
|
|
55 |
|
|
|
168 |
|
|
Total |
|
|
618 |
|
|
|
90 |
|
|
|
132 |
|
|
|
101 |
|
|
|
295 |
|
|
Total obligations |
|
$ |
12,257 |
|
|
$ |
880 |
|
|
$ |
1,283 |
|
|
$ |
1,039 |
|
|
$ |
9,055 |
|
|
(1) |
Debt amounts represent scheduled maturities of debt obligations at December 31, 2019, excluding net discounts and debt issue costs included in the carrying value of debt. |
|
(2) |
Interest expense represents the scheduled cash payments on long-term fixed-rate debt. |
|
(3) |
Operational agreements represent commitments to transport or process certain volumes of oil, gas and NGLs for a fixed fee. We have entered into these agreements to aid the movement of our production to downstream markets. |
|
(4) |
Asset retirement obligations represent estimated discounted costs for future dismantlement, abandonment and rehabilitation costs. These obligations are recorded as liabilities on our December 31, 2019 balance sheet. |
|
(5) |
Drilling and facility obligations represent gross contractual agreements with third-party service providers to procure drilling rigs and other related services for developmental and exploratory drilling and facilities construction. |
|
(6) |
Lease obligations consist primarily of non-cancelable leases for office space and equipment. For additional information, see Note 14 in “Item 8. Financial Statements and Supplementary Data” of this report. |
|
(7) |
Other obligations primarily relate to various tax obligations. |
|
(8) |
Barnett Shale obligations primarily represent approximately $240 million of asset retirement obligations and firm transportation agreements which will be transferred to BKV when the divestiture of those assets close. The remainder of the Barnett Shale obligations relate to abandoned gas processing contracts which Devon retained in connection with the 2018 Barnett Shale divestitures. For additional information, see Note 18 in “Item 8. Financial Statements and Supplementary Data” of this report. |
|
(9) |
Canadian obligations are related to a firm transportation agreement and office lease abandonments that were retained after Devon’s sale of substantially all of its oil and gas assets and operations in Canada. For additional information, see Note 18 in “Item 8. Financial Statements and Supplementary Data” of this report. |
Contingencies and Legal Matters
For a detailed discussion of contingencies and legal matters, see Note 19 in “Item 8. Financial Statements and Supplementary Data” of this report.
39
Critical Accounting Estimates
The preparation of financial statements in conformity with accounting principles generally accepted in the U.S. requires us to make estimates, judgments and assumptions that affect the reported amounts of assets and liabilities and disclosure of contingent assets and liabilities at the date of the financial statements and the reported amounts of revenues and expenses during the reporting period. Actual amounts could differ from these estimates, and changes in these estimates are recorded when known. We consider the following to be our most critical accounting estimates that involve judgment and have reviewed these critical accounting estimates with the Audit Committee of our Board of Directors.
Oil and Gas Assets Accounting, Classification, Reserves & Valuation
Successful Efforts Method of Accounting and Classification
We utilize the successful efforts method of accounting for our oil and natural gas exploration and development activities which requires management’s assessment of the proper designation of wells and associated costs as developmental or exploratory. This classification assessment is dependent on the determination and existence of proved reserves, which is a critical estimate discussed in the section below. The classification of developmental and exploratory costs has a direct impact on the amount of costs we initially recognize as exploration expense or capitalize, then subject to DD&A calculations and impairment assessments and valuations.
Once a well is drilled, the determination that proved reserves have been discovered may take considerable time and requires both judgment and application of industry experience. Development wells are always capitalized. Costs associated with drilling an exploratory well are initially capitalized, or suspended, pending a determination as to whether proved reserves have been found. At the end of each quarter, management reviews the status of all suspended exploratory drilling costs to determine whether the costs should continue to remain capitalized or shall be expensed. When making this determination, management considers current activities, near-term plans for additional exploratory or appraisal drilling and the likelihood of reaching a development program. If management determines future development activities and the determination of proved reserves are unlikely to occur, the associated suspended exploratory well costs are recorded as dry hole expense and reported in exploration expense in the consolidated statements of comprehensive earnings. Otherwise, the costs of exploratory wells remain capitalized. At December 31, 2019, all suspended well costs have been suspended for less than one year.
Similar to the evaluation of suspended exploratory well costs, costs for undeveloped leasehold, for which reserves have not been proven, must also be evaluated for continued capitalization or impairment. At the end of each quarter, management assesses undeveloped leasehold costs for impairment by considering future drilling plans, drilling activity results, commodity price outlooks, planned future sales or expiration of all or a portion of such projects. At December 31, 2019, Devon had approximately $250 million of undeveloped leasehold. Of the remaining undeveloped leasehold costs at December 31, 2019, approximately $6 million is scheduled to expire in 2020. The leasehold expiring in 2020 relates to areas in which Devon is actively drilling. If our drilling is not successful, this leasehold could become partially or entirely impaired.
Reserves
Our estimates of proved and proved developed reserves are a major component of DD&A calculations. Additionally, our proved reserves represent the element of these calculations that require the most subjective judgments. Estimates of reserves are forecasts based on engineering data, projected future rates of production and the timing of future expenditures. The process of estimating oil, gas and NGL reserves requires substantial judgment, resulting in imprecise determinations, particularly for new discoveries. Different reserve engineers may make different estimates of reserve quantities based on the same data. Our engineers prepare our reserve estimates. We then subject certain of our reserve estimates to audits performed by a third-party petroleum consulting firm. In 2019, 85% of our reserves were subjected to such audits.
The passage of time provides more qualitative information regarding estimates of reserves, when revisions are made to prior estimates to reflect updated information. In the past five years, annual performance revisions to our reserve estimates, which have been both increases and decreases in individual years, have averaged less than 5% of the previous year’s estimate. However, there can be no assurance that more significant revisions will not be necessary in the future. The data for a given reservoir may also change substantially over time as a result of numerous factors, including, but not limited to, additional development activity, evolving production history and continual reassessment of the viability of production under varying economic conditions.
40
Valuation of Long-Lived Assets
Long-lived assets used in operations, including proved and unproved oil and gas properties, are depreciated and assessed for impairment annually or whenever changes in facts and circumstances indicate a possible significant deterioration in future cash flows is expected to be generated by an asset group. For DD&A calculations and impairment assessments, management groups individual assets based on a judgmental assessment of the lowest level (“common operating field”) for which there are identifiable cash flows that are largely independent of the cash flows of other groups of assets. The determination of common operating fields is largely based on geological structural features or stratigraphic condition, which requires judgment. Management also considers the nature of production, common infrastructure, common sales points, common processing plants, common regulation and management oversight to make common operating field determinations. These determinations impact the amount of DD&A recognized each period and could impact the determination and measurement of a potential asset impairment.
Management evaluates assets for impairment through an established process in which changes to significant assumptions such as prices, volumes and future development plans are reviewed. If, upon review, the sum of the undiscounted pre-tax cash flows is less than the carrying value of the asset group, the carrying value is written down to estimated fair value. Because there usually is a lack of quoted market prices for long-lived assets, the fair value of impaired assets is typically determined based on the present values of expected future cash flows using discount rates believed to be consistent with those used by principal market participants. The expected future cash flows used for impairment reviews and related fair value calculations are typically based on judgmental assessments of future production volumes, commodity prices, operating costs and capital investment plans, considering all available information at the date of review. The expected future cash flows used for impairment reviews include future production volumes associated with proved producing and risk-adjusted proved undeveloped, probable and possible reserves. Besides the estimates of reserves and future production volumes, future commodity prices are the largest driver in the variability of undiscounted pre-tax cash flows. For our impairment determinations, we utilize the forward strip prices for the first five years and apply internally generated price forecasts for subsequent years. We estimate and escalate or de-escalate future capital and operating costs by using a method that correlates cost movements to price movements similar to recent history. Changes to any of these assumptions could result in lower undiscounted pre-tax cash flows and impact both the recognition and timing of impairments. Should management materially reduce planned capital investment and commodity prices remain depressed, recognition of material asset impairments could become more likely for certain of our assets.
As commodity prices decreased throughout 2019 and at year-end approximated the prices Devon used to determine and compute material asset impairments in 2019, management conducted a robust review of its assets for impairment as of December 31, 2019. Based on our recent impairment evaluations, our STACK asset’s sum of undiscounted pre-tax cash flows exceeds the carrying value by less than 10%. This cushion has narrowed significantly since the end of 2018 due primarily to approximately 30% and 5% declines in forward NGL and natural gas pricing, respectively, and negative non-price reserve revisions of approximately 40 MMBoe as discussed in Note 21 in “Item 8. Financial Statements and Supplementary Data” of this report. As of December 31, 2019, the difference between the STACK’s undiscounted pre-tax cash flows, which is used to determine whether an impairment exists, and the discounted pre-tax cash flows, which is used to measure an impairment, is approximately $2.0 billion. Therefore, if commodity prices deteriorate or we materially reduce future development plans, causing the capitalized costs to exceed the undiscounted pre-tax cash flows, our STACK asset would be subject to a material impairment of capitalized costs.
Income Taxes
The amount of income taxes recorded requires interpretations of complex rules and regulations of federal, state, provincial and foreign tax jurisdictions. We recognize current tax expense based on estimated taxable income for the current period and the applicable statutory tax rates. We routinely assess potential uncertain tax positions and, if required, estimate and establish accruals for such amounts. We have recognized deferred tax assets and liabilities for temporary differences, operating losses and other tax carryforwards. We routinely assess our deferred tax assets and reduce such assets by a valuation allowance if we deem it is more likely than not that some portion or all of the deferred tax assets will not be realized. Within continuing operations, Devon maintains only a valuation allowance against a portion of its deferred tax assets, including certain tax credits and state net operating losses. Devon also has recorded a valuation allowance in discontinued operations against certain Canadian deferred tax assets.
The accruals for deferred tax assets and liabilities are often based on assumptions that are subject to a significant amount of judgment by management. These assumptions and judgments are reviewed and adjusted as facts and circumstances change. Material changes to our income tax accruals may occur in the future based on the progress of ongoing audits, changes in legislation or resolution of pending matters.
41
Non-GAAP Measures
Core Earnings
We make reference to “core earnings (loss) attributable to Devon” and “core earnings (loss) per share attributable to Devon” in “Overview of 2019 Results” in this Item 7 that are not required by or presented in accordance with GAAP. These non-GAAP measures are not alternatives to GAAP measures and should not be considered in isolation or as a substitute for analysis of our results reported under GAAP. Core earnings (loss) attributable to Devon, as well as the per share amount, represent net earnings excluding certain noncash and other items that are typically excluded by securities analysts in their published estimates of our financial results. For more information on the results of discontinued operations for our Barnett Shale assets, Canadian operations and for EnLink and the General Partner, see Note 18 in “Item 8. Financial Statements and Supplementary Data” in this report. Our non-GAAP measures are typically used as a quarterly performance measure. Amounts excluded for 2019 relate to asset dispositions, the gain on the sale of Canadian operations, noncash asset impairments (including noncash Barnett Shale and unproved asset impairments), deferred tax asset valuation allowance, costs associated with early retirement of debt, fair value changes in derivative financial instruments and foreign currency, restructuring and transaction costs associated with the workforce reductions in 2019 and restructuring and transaction costs associated with the divestment of our Canadian operations in 2019.
Amounts excluded for 2018 relate to asset dispositions, the gain on the sale of Devon’s aggregate ownership interests in EnLink and the General Partner, noncash asset impairments (including noncash unproved asset impairments), deferred tax asset valuation allowance, costs associated with early retirement of debt, fair value changes in derivative financial instruments and foreign currency, restructuring and transaction costs associated with the workforce reductions in 2018.
Amounts excluded for 2017 relate to asset dispositions, noncash asset impairments (including noncash unproved asset impairments), U.S. tax reform changes, deferred tax asset valuation allowance, derivatives and financial instrument fair value changes, legal entity restructuring and costs associated with early retirement of debt.
We believe these non-GAAP measures facilitate comparisons of our performance to earnings estimates published by securities analysts. We also believe these non-GAAP measures can facilitate comparisons of our performance between periods and to the performance of our peers.
Below are reconciliations of our core earnings and earnings per share to their comparable GAAP measures.
42
|
|
Before tax |
|
|
After tax |
|
|
After Noncontrolling Interests |
|
|
Per Diluted Share |
|
||||
|
2019 |
|
|
|
|
|
|
|
|
|
|
|
|
|
|
|
|
Continuing Operations |
|
|
|
|
|
|
|
|
|
|
|
|
|
|
|
|
Loss attributable to Devon (GAAP) |
$ |
(109 |
) |
|
$ |
(79 |
) |
|
$ |
(81 |
) |
|
$ |
(0.21 |
) |
|
Adjustments: |
|
|
|
|
|
|
|
|
|
|
|
|
|
|
|
|
Asset dispositions |
|
(48 |
) |
|
|
(37 |
) |
|
|
(37 |
) |
|
|
(0.09 |
) |
|
Asset and exploration impairments |
|
20 |
|
|
|
15 |
|
|
|
15 |
|
|
|
0.04 |
|
|
Fair value changes in financial instruments |
|
623 |
|
|
|
480 |
|
|
|
480 |
|
|
|
1.19 |
|
|
Restructuring and transaction costs |
|
84 |
|
|
|
64 |
|
|
|
64 |
|
|
|
0.15 |
|
|
Core earnings attributable to Devon (Non-GAAP) |
$ |
570 |
|
|
$ |
443 |
|
|
$ |
441 |
|
|
$ |
1.08 |
|
|
Discontinued Operations |
|
|
|
|
|
|
|
|
|
|
|
|
|
|
|
|
Loss attributable to Devon (GAAP) |
$ |
(632 |
) |
|
$ |
(274 |
) |
|
$ |
(274 |
) |
|
$ |
(0.68 |
) |
|
Adjustments: |
|
|
|
|
|
|
|
|
|
|
|
|
|
|
|
|
Gain on sale of Canadian operations |
|
(223 |
) |
|
|
(425 |
) |
|
|
(425 |
) |
|
|
(1.05 |
) |
|
Asset and exploration impairments |
|
785 |
|
|
|
613 |
|
|
|
613 |
|
|
|
1.52 |
|
|
Deferred tax asset valuation allowance |
|
— |
|
|
|
24 |
|
|
|
24 |
|
|
|
0.06 |
|
|
Early retirement of debt |
|
58 |
|
|
|
45 |
|
|
|
45 |
|
|
|
0.11 |
|
|
Fair value changes in financial instruments and foreign currency and other |
|
(33 |
) |
|
|
(37 |
) |
|
|
(37 |
) |
|
|
(0.10 |
) |
|
Restructuring and transaction costs |
|
248 |
|
|
|
183 |
|
|
|
183 |
|
|
|
0.45 |
|
|
Core earnings attributable to Devon (Non-GAAP) |
$ |
203 |
|
|
$ |
129 |
|
|
$ |
129 |
|
|
$ |
0.31 |
|
|
Total |
|
|
|
|
|
|
|
|
|
|
|
|
|
|
|
|
Loss attributable to Devon (GAAP) |
$ |
(741 |
) |
|
$ |
(353 |
) |
|
$ |
(355 |
) |
|
$ |
(0.89 |
) |
|
Adjustments: |
|
|
|
|
|
|
|
|
|
|
|
|
|
|
|
|
Continuing Operations |
|
679 |
|
|
|
522 |
|
|
|
522 |
|
|
|
1.29 |
|
|
Discontinued Operations |
|
835 |
|
|
|
403 |
|
|
|
403 |
|
|
|
0.99 |
|
|
Core earnings attributable to Devon (Non-GAAP) |
$ |
773 |
|
|
$ |
572 |
|
|
$ |
570 |
|
|
$ |
1.39 |
|
|
2018 |
|
|
|
|
|
|
|
|
|
|
|
|
|
|
|
|
Continuing Operations |
|
|
|
|
|
|
|
|
|
|
|
|
|
|
|
|
Earnings attributable to Devon (GAAP) |
$ |
944 |
|
|
$ |
714 |
|
|
$ |
714 |
|
|
$ |
1.42 |
|
|
Adjustments: |
|
|
|
|
|
|
|
|
|
|
|
|
|
|
|
|
Asset dispositions |
|
(278 |
) |
|
|
(214 |
) |
|
|
(214 |
) |
|
|
(0.42 |
) |
|
Asset and exploration impairments |
|
257 |
|
|
|
198 |
|
|
|
198 |
|
|
|
0.40 |
|
|
Deferred tax asset valuation allowance |
|
— |
|
|
|
(4 |
) |
|
|
(4 |
) |
|
|
(0.01 |
) |
|
Early retirement of debt |
|
312 |
|
|
|
240 |
|
|
|
240 |
|
|
|
0.48 |
|
|
Fair value changes in financial instruments |
|
(938 |
) |
|
|
(723 |
) |
|
|
(723 |
) |
|
|
(1.45 |
) |
|
Restructuring and transaction costs |
|
97 |
|
|
|
76 |
|
|
|
76 |
|
|
|
0.15 |
|
|
Core earnings attributable to Devon (Non-GAAP) |
$ |
394 |
|
|
$ |
287 |
|
|
$ |
287 |
|
|
$ |
0.57 |
|
|
Discontinued Operations |
|
|
|
|
|
|
|
|
|
|
|
|
|
|
|
|
Earnings attributable to Devon (GAAP) |
$ |
2,839 |
|
|
$ |
2,510 |
|
|
$ |
2,350 |
|
|
$ |
4.68 |
|
|
Adjustments: |
|
|
|
|
|
|
|
|
|
|
|
|
|
|
|
|
Asset dispositions |
|
(2,593 |
) |
|
|
(2,250 |
) |
|
|
(2,250 |
) |
|
|
(4.49 |
) |
|
Fair value changes in financial instruments and foreign currency |
|
339 |
|
|
|
277 |
|
|
|
270 |
|
|
|
0.54 |
|
|
Minimum volume commitment and restructuring and transaction costs |
|
(31 |
) |
|
|
(27 |
) |
|
|
(2 |
) |
|
|
(0.00 |
) |
|
Core earnings attributable to Devon (Non-GAAP) |
$ |
554 |
|
|
$ |
510 |
|
|
$ |
368 |
|
|
$ |
0.73 |
|
|
Total |
|
|
|
|
|
|
|
|
|
|
|
|
|
|
|
|
Earnings attributable to Devon (GAAP) |
$ |
3,783 |
|
|
$ |
3,224 |
|
|
$ |
3,064 |
|
|
$ |
6.10 |
|
|
Adjustments: |
|
|
|
|
|
|
|
|
|
|
|
|
|
|
|
|
Continuing Operations |
|
(550 |
) |
|
|
(427 |
) |
|
|
(427 |
) |
|
|
(0.85 |
) |
|
Discontinued Operations |
|
(2,285 |
) |
|
|
(2,000 |
) |
|
|
(1,982 |
) |
|
|
(3.95 |
) |
|
Core earnings attributable to Devon (Non-GAAP) |
$ |
948 |
|
|
$ |
797 |
|
|
$ |
655 |
|
|
$ |
1.30 |
|
43
|
|
Before tax |
|
|
After tax |
|
|
After Noncontrolling Interests |
|
|
Per Diluted Share |
|
||||
|
2017 |
|
|
|
|
|
|
|
|
|
|
|
|
|
|
|
|
Continuing Operations |
|
|
|
|
|
|
|
|
|
|
|
|
|
|
|
|
Earnings attributable to Devon (GAAP) |
$ |
40 |
|
|
$ |
33 |
|
|
$ |
33 |
|
|
$ |
0.06 |
|
|
Adjustments: |
|
|
|
|
|
|
|
|
|
|
|
|
|
|
|
|
Asset dispositions |
|
(219 |
) |
|
|
(140 |
) |
|
|
(140 |
) |
|
|
(0.27 |
) |
|
Asset and exploration impairments |
|
217 |
|
|
|
138 |
|
|
|
138 |
|
|
|
0.26 |
|
|
Deferred tax asset valuation allowance |
|
— |
|
|
|
(4 |
) |
|
|
(4 |
) |
|
|
(0.01 |
) |
|
Fair value changes in financial instruments |
|
70 |
|
|
|
45 |
|
|
|
45 |
|
|
|
0.09 |
|
|
Core earnings attributable to Devon (Non-GAAP) |
$ |
108 |
|
|
$ |
72 |
|
|
$ |
72 |
|
|
$ |
0.13 |
|
|
Discontinued Operations |
|
|
|
|
|
|
|
|
|
|
|
|
|
|
|
|
Earnings attributable to Devon (GAAP) |
$ |
856 |
|
|
$ |
1,045 |
|
|
$ |
865 |
|
|
$ |
1.64 |
|
|
Adjustments: |
|
|
|
|
|
|
|
|
|
|
|
|
|
|
|
|
U.S. tax reform |
|
— |
|
|
|
(211 |
) |
|
|
(112 |
) |
|
|
(0.21 |
) |
|
Fair value changes in financial instruments and foreign currency |
|
(289 |
) |
|
|
(248 |
) |
|
|
(248 |
) |
|
|
(0.47 |
) |
|
Asset dispositions, impairments and early retirement of debt |
|
11 |
|
|
|
9 |
|
|
|
7 |
|
|
|
0.01 |
|
|
Legal entity restructuring and deferred tax asset valuation allowance |
|
— |
|
|
|
(157 |
) |
|
|
(157 |
) |
|
|
(0.29 |
) |
|
Core earnings attributable to Devon (Non-GAAP) |
$ |
578 |
|
|
$ |
438 |
|
|
$ |
355 |
|
|
$ |
0.68 |
|
|
Total |
|
|
|
|
|
|
|
|
|
|
|
|
|
|
|
|
Earnings attributable to Devon (GAAP) |
$ |
896 |
|
|
$ |
1,078 |
|
|
$ |
898 |
|
|
$ |
1.70 |
|
|
Adjustments: |
|
|
|
|
|
|
|
|
|
|
|
|
|
|
|
|
Continuing Operations |
|
68 |
|
|
|
39 |
|
|
|
39 |
|
|
|
0.07 |
|
|
Discontinued Operations |
|
(278 |
) |
|
|
(607 |
) |
|
|
(510 |
) |
|
|
(0.96 |
) |
|
Core earnings attributable to Devon (Non-GAAP) |
$ |
686 |
|
|
$ |
510 |
|
|
$ |
427 |
|
|
$ |
0.81 |
|
44
EBITDAX and Field-Level Cash Margin
To assess the performance of our assets, we use EBITDAX and Field-Level Cash Margin. We compute EBITDAX as net earnings from continuing operations before income tax expense; financing costs, net; exploration expenses; DD&A; asset impairments; asset disposition gains and losses; non-cash share-based compensation; non-cash valuation changes for derivatives and financial instruments; restructuring and transaction costs; accretion on discounted liabilities; and other items not related to our normal operations. Field-Level Cash Margin is computed as oil, gas and NGL revenues less production expenses. Production expenses consist of lease operating, gathering, processing and transportation expenses, as well as production and property taxes.
We exclude financing costs from EBITDAX to assess our operating results without regard to our financing methods or capital structure. Exploration expenses and asset disposition gains and losses are excluded from EBITDAX because they generally are not indicators of operating efficiency for a given reporting period. DD&A and impairments are excluded from EBITDAX because capital expenditures are evaluated at the time capital costs are incurred. We exclude share-based compensation, valuation changes, restructuring and transaction costs, accretion on discounted liabilities and other items from EBITDAX because they are not considered a measure of asset operating performance.
We believe EBITDAX and Field-Level Cash Margin provide information useful in assessing our operating and financial performance across periods. EBITDAX and Field-Level Cash Margin as defined by Devon may not be comparable to similarly titled measures used by other companies and should be considered in conjunction with net earnings from continuing operations.
Below are reconciliations of net earnings to EBITDAX and a further reconciliation to Field-Level Cash Margin.
|
|
2019 |
|
|
2018 |
|
|
2017 |
|
|||
|
Net earnings (loss) (GAAP) |
$ |
(353 |
) |
|
$ |
3,224 |
|
|
$ |
1,078 |
|
|
Net (earnings) loss from discontinued operations, net of tax |
|
274 |
|
|
|
(2,510 |
) |
|
|
(1,045 |
) |
|
Financing costs, net |
|
250 |
|
|
|
580 |
|
|
|
321 |
|
|
Income tax expense (benefit) |
|
(30 |
) |
|
|
230 |
|
|
|
7 |
|
|
Exploration expenses |
|
58 |
|
|
|
128 |
|
|
|
346 |
|
|
Depreciation, depletion and amortization |
|
1,497 |
|
|
|
1,228 |
|
|
|
1,008 |
|
|
Asset impairments |
|
— |
|
|
|
156 |
|
|
|
— |
|
|
Asset dispositions |
|
(48 |
) |
|
|
(278 |
) |
|
|
(219 |
) |
|
Share-based compensation |
|
83 |
|
|
|
104 |
|
|
|
121 |
|
|
Derivative and financial instrument non-cash valuation changes |
|
623 |
|
|
|
(938 |
) |
|
|
70 |
|
|
Restructuring and transaction costs |
|
84 |
|
|
|
97 |
|
|
|
— |
|
|
Accretion on discounted liabilities and other |
|
5 |
|
|
|
54 |
|
|
|
(12 |
) |
|
EBITDAX (non-GAAP) |
|
2,443 |
|
|
|
2,075 |
|
|
|
1,675 |
|
|
Marketing revenues and expenses, net |
|
(53 |
) |
|
|
(33 |
) |
|
|
46 |
|
|
Commodity derivative cash settlements |
|
(170 |
) |
|
|
420 |
|
|
|
(115 |
) |
|
General and administration expenses, cash-based |
|
392 |
|
|
|
470 |
|
|
|
524 |
|
|
Field-level cash margin (non-GAAP) |
$ |
2,612 |
|
|
$ |
2,932 |
|
|
$ |
2,130 |
|
45
Item 7A. Quantitative and Qualitative Disclosures about Market Risk
The primary objective of the following information is to provide forward-looking quantitative and qualitative information about our potential exposure to market risks. The term “market risk” refers to our risk of loss arising from adverse changes in oil, gas and NGL prices, interest rates and foreign currency exchange rates. The following disclosures are not meant to be precise indicators of expected future losses but rather indicators of reasonably possible losses. This forward-looking information provides indicators of how we view and manage our ongoing market risk exposures. All of our market risk sensitive instruments were entered into for purposes other than speculative trading.
Commodity Price Risk
Our major market risk exposure is the pricing applicable to our oil, gas and NGL production. Realized pricing is primarily driven by the prevailing worldwide price for crude oil and spot market prices applicable to our gas and NGL production. Pricing for oil and gas production has been volatile and unpredictable as discussed in “Item 1A. Risk Factors” of this report. Consequently, we systematically hedge a portion of our production through various financial transactions. The key terms to our oil and gas derivative financial instruments as of December 31, 2019 are presented in Note 3 in “Item 8. Financial Statements and Supplementary Data” of this report.
The fair values of our commodity derivatives are largely determined by estimates of the forward curves of the relevant price indices. At December 31, 2019, a 10% change in the forward curves associated with our commodity derivative instruments would have changed our net asset positions by approximately $115 million.
Interest Rate Risk
At December 31, 2019, we had total debt of $4.3 billion. All of our debt is based on fixed interest rates averaging 6.0%.
Foreign Currency Risk
Devon has certain Canadian dollar obligations associated with its divested Canadian operations which are to be paid with the cash restricted for discontinued operations. These balances are remeasured using the applicable exchange rate as of the end of the reporting period. A 10% unfavorable change in the Canadian-to-U.S. dollar exchange rate would not have materially impacted our December 31, 2019 balance sheet for these items. See Note 18 in “Item 8. Financial Statements and Supplementary Data” in this report for additional information.
46
Item 8. Financial Statements and Supplementary Data
INDEX TO CONSOLIDATED FINANCIAL STATEMENTS
AND CONSOLIDATED FINANCIAL STATEMENT SCHEDULES
|
|
48 |
|
|
|
|
|
|
Consolidated Financial Statements |
|
|
|
|
51 |
|
|
|
52 |
|
|
|
53 |
|
|
|
54 |
|
|
|
55 |
|
|
|
55 |
|
|
|
65 |
|
|
|
66 |
|
|
|
67 |
|
|
|
70 |
|
|
|
70 |
|
|
|
71 |
|
|
Note 8 – Net Earnings (Loss) Per Share From Continuing Operations |
|
74 |
|
|
75 |
|
|
Note 10 – Supplemental Information to Statements of Cash Flows |
|
75 |
|
|
76 |
|
|
|
76 |
|
|
|
77 |
|
|
|
79 |
|
|
|
81 |
|
|
|
82 |
|
|
|
85 |
|
|
|
87 |
|
|
|
91 |
|
|
|
93 |
|
|
Note 21 – Supplemental Information on Oil and Gas Operations (Unaudited) |
|
94 |
|
Note 22 – Supplemental Quarterly Financial Information (Unaudited) |
|
99 |
All financial statement schedules are omitted as they are inapplicable or the required information has been included in the consolidated financial statements or notes thereto.
47
Report of Independent Registered Public Accounting Firm
To the Stockholders and Board of Directors
Devon Energy Corporation:
Opinions on the Consolidated Financial Statements and Internal Control Over Financial Reporting
We have audited the accompanying consolidated balance sheets of Devon Energy Corporation and subsidiaries (the Company) as of December 31, 2019 and 2018, the related consolidated statements of comprehensive earnings, equity, and cash flows for each of the years in the three-year period ended December 31, 2019, and the related notes (collectively, the consolidated financial statements). We also have audited the Company’s internal control over financial reporting as of December 31, 2019, based on criteria established in Internal Control – Integrated Framework (2013) issued by the Committee of Sponsoring Organizations of the Treadway Commission.
In our opinion, the consolidated financial statements referred to above present fairly, in all material respects, the financial position of the Company as of December 31, 2019 and 2018, and the results of its operations and its cash flows for each of the years in the three-year period ended December 31, 2019, in conformity with U.S. generally accepted accounting principles. Also in our opinion, the Company maintained, in all material respects, effective internal control over financial reporting as of December 31, 2019 based on criteria established in Internal Control – Integrated Framework (2013) issued by the Committee of Sponsoring Organizations of the Treadway Commission.
Changes in Accounting Principles
As discussed in Note 14 to the consolidated financial statements, the Company has changed its method of accounting for leases in 2019 due to the adoption of Accounting Standards Update 2016-02, Leases (Topic 842).
As discussed in Note 1 to the consolidated financial statements, the Company has changed its method of accounting for revenue in 2018 due to the adoption of Accounting Standards Codification 606, Revenue from Contracts with Customers (ASC 606).
Basis for Opinions
The Company’s management is responsible for these consolidated financial statements, for maintaining effective internal control over financial reporting, and for its assessment of the effectiveness of internal control over financial reporting, included in the accompanying Management’s Annual Report on Internal Control Over Financial Reporting contained in “Item 9A. Controls and Procedures.” Our responsibility is to express an opinion on the Company’s consolidated financial statements and an opinion on the Company’s internal control over financial reporting based on our audits. We are a public accounting firm registered with the Public Company Accounting Oversight Board (United States) (PCAOB) and are required to be independent with respect to the Company in accordance with the U.S. federal securities laws and the applicable rules and regulations of the Securities and Exchange Commission and the PCAOB.
We conducted our audits in accordance with the standards of the PCAOB. Those standards require that we plan and perform the audits to obtain reasonable assurance about whether the consolidated financial statements are free of material misstatement, whether due to error or fraud, and whether effective internal control over financial reporting was maintained in all material respects.
Our audits of the consolidated financial statements included performing procedures to assess the risks of material misstatement of the consolidated financial statements, whether due to error or fraud, and performing procedures that respond to those risks. Such procedures included examining, on a test basis, evidence regarding the amounts and disclosures in the consolidated financial statements. Our audits also included evaluating the accounting principles used and significant estimates made by management, as well as evaluating the overall presentation of the consolidated financial statements. Our audit of internal control over financial reporting included obtaining an understanding of internal control over financial reporting, assessing the risk that a material weakness exists, and testing and evaluating the design and operating effectiveness of internal control based on the assessed risk. Our audits also included performing such other procedures as we considered necessary in the circumstances. We believe that our audits provide a reasonable basis for our opinions.
Definition and Limitations of Internal Control Over Financial Reporting
A company’s internal control over financial reporting is a process designed to provide reasonable assurance regarding the reliability of financial reporting and the preparation of financial statements for external purposes in accordance with generally accepted accounting principles. A company’s internal control over financial reporting includes those policies and procedures that (1) pertain to the
48
maintenance of records that, in reasonable detail, accurately and fairly reflect the transactions and dispositions of the assets of the company; (2) provide reasonable assurance that transactions are recorded as necessary to permit preparation of financial statements in accordance with generally accepted accounting principles, and that receipts and expenditures of the company are being made only in accordance with authorizations of management and directors of the company; and (3) provide reasonable assurance regarding prevention or timely detection of unauthorized acquisition, use, or disposition of the company’s assets that could have a material effect on the financial statements.
Because of its inherent limitations, internal control over financial reporting may not prevent or detect misstatements. Also, projections of any evaluation of effectiveness to future periods are subject to the risk that controls may become inadequate because of changes in conditions, or that the degree of compliance with the policies or procedures may deteriorate.
Critical Audit Matters
The critical audit matters communicated below are matters arising from the current period audit of the consolidated financial statements that were communicated or required to be communicated to the audit committee and that: (1) relate to accounts or disclosures that are material to the consolidated financial statements and (2) involved our especially challenging, subjective, or complex judgments. The communication of critical audit matters does not alter in any way our opinion on the consolidated financial statements, taken as a whole, and we are not, by communicating the critical audit matters below, providing separate opinions on the critical audit matters or on the accounts or disclosures to which they relate.
Evaluation of the estimate of proved and unproved oil and gas reserves used to assess the recoverability of the carrying value of oil and gas properties in the STACK common operating field
As discussed in Notes 1, 5, and 12 to the consolidated financial statements, the Company performs recoverability tests for the carrying value of its proved oil and gas properties subject to amortization. The recoverability tests are performed on an annual basis or more often if events and circumstances indicate that the carrying value of such properties may not be recoverable. The determination of the undiscounted cash flows is driven by the underlying estimate of proved and unproved oil and gas reserves for oil and gas properties as determined by the Company’s internal reservoir engineers. Estimating common operating fields’ future cash flows requires the expertise of reservoir engineers who take into consideration the estimate of future production quantities, future operating and capital cost assumptions, and projected oil and gas prices inclusive of market differentials. The STACK common operating field had a carrying value of $3.7 billion as of December 31, 2019.
We identified the evaluation of the estimate of proved and unproved oil and gas reserves used to assess the recoverability of the carrying value of the STACK common operating field’s oil and gas properties as a critical audit matter. Based on current and forecasted commodity prices and costs, production volumes and drilling plans, and the risk adjustment factors associated with the unproved reserve volumes, the STACK common operating field required more judgment to evaluate the estimate of both proved and unproved oil and gas reserves used in determining undiscounted future net cash flows for the asset group.
The primary procedures we performed to address this critical audit matter included the following. We tested certain internal controls over the Company’s processes to develop and monitor the estimate of proved and unproved oil and gas reserves used to determine future cash flows. We assessed compliance of the methodology used by the Company’s internal reservoir engineers and external reservoir engineers to estimate proved and unproved oil and gas reserves with industry and regulatory standards. To assess the Company’s ability to accurately estimate future proved and unproved production quantities, we compared the future production quantity assumptions used by the Company in prior periods to the actual production amounts in the current year and the year-end forecasted future production quantities. We compared the estimated future proved and unproved production quantities used by the Company in the current period to historical production trends and investigated differences. In addition, we assessed the competence, objectivity, and capabilities of the Company’s internal reservoir engineers and third-party reservoir engineers. We read and considered the report of the Company’s external reservoir engineers in connection with our evaluation of the Company’s reserve estimates. We also tested the processes and methodologies used by internal reservoir engineers to estimate unproved future production quantities. We have compared the risk adjustment factors for unproved reserves selected by the Company by prospect to the guideline risk adjustment factor ranges by reserve class in published industry surveys. We have also evaluated the Company’s selected risk adjustment factors by evaluation of the proximity of the unproved reserves to proved producing reserves. We evaluated the future operating and capital cost assumptions used by the internal reservoir engineers to estimate future cash flows by comparing them to historical costs. We also tested the projected oil and gas prices used by the internal reservoir engineers to estimate future cash flows by comparing those prices to publicly available prices and tested the relevant market differentials based on past results and any contractual changes in marketing and/or transportation and processing agreements that would impact future cash flows to be received.
49
Assessment of the estimate of proved oil and gas reserves used in the depletion of proved oil and gas properties
As discussed in Notes 1 and 12 to the consolidated financial statements, the Company calculates depletion for its proved oil and gas properties subject to amortization using a units-of-production method. The rates used to deplete the balance of oil and gas properties subject to amortization are set using the estimate of proved oil and gas reserves by common operating field. Under the units-of-production method, a rate is set annually using the beginning of year balance of oil and gas properties subject to amortization and estimated proved oil and gas reserves for each common operating field. That rate is then applied to production throughout the year to determine the amount of depletion expense to be recorded by common operating field. The Company’s internal reservoir engineers estimate proved oil and gas reserves, and the Company engages external reservoir engineers to perform an independent evaluation of a portion of the estimates of proved oil and gas reserves. These common operating fields had depletion expense of $1.4 billion for the year ended December 31, 2019.
We identified the assessment of the estimate of proved oil and gas reserves used in the depletion of proved oil and gas properties as a critical audit matter. There was a high degree of subjectivity in evaluating the Company’s estimate of the proved oil and gas reserves used as an input to determine depletion for each common operating field.
The primary procedures we performed to address this critical audit matter including the following. We tested certain internal controls over the Company’s depletion expense calculation process, including controls related to the determination and monitoring of the estimate of proved oil and gas reserves. We analyzed the grouping of costs and proved oil and gas reserves by common operating field. We analyzed and assessed the determination of depletion expense for compliance with industry and regulatory standards. To assess the Company’s ability to accurately estimate proved oil and gas reserves, we compared the estimated future production quantities assumptions used by the Company in prior periods to the actual production amounts received and the year-end future production quantities forecasted. We compared the estimated future production quantities used by the Company in the current period to historical production trends and investigated differences. In addition, we assessed the competence, objectivity, and capabilities of the Company’s internal reservoir engineers and the Company’s external reservoir engineers. We read and considered the report of the Company’s third-party reservoir engineers in connection with our evaluation of the Company’s reserve estimates.
/s/ KPMG LLP
We have served as the Company’s auditor since 1980.
Oklahoma City, Oklahoma
February 19, 2020
50
DEVON ENERGY CORPORATION AND SUBSIDIARIES
CONSOLIDATED STATEMENTS OF COMPREHENSIVE EARNINGS
|
|
|
Year Ended December 31, |
|
|||||||||
|
|
|
2019 |
|
|
2018 |
|
|
2017 |
|
|||
|
|
|
(Millions, except per share amounts) |
|
|||||||||
|
Upstream revenues |
|
$ |
|
|
|
$ |
|
|
|
$ |
|
|
|
Marketing and midstream revenues |
|
|
|
|
|
|
|
|
|
|
|
|
|
Total revenues |
|
|
|
|
|
|
|
|
|
|
|
|
|
Production expenses |
|
|
|
|
|
|
|
|
|
|
|
|
|
Exploration expenses |
|
|
|
|
|
|
|
|
|
|
|
|
|
Marketing and midstream expenses |
|
|
|
|
|
|
|
|
|
|
|
|
|
Depreciation, depletion and amortization |
|
|
|
|
|
|
|
|
|
|
|
|
|
Asset impairments |
|
|
— |
|
|
|
|
|
|
|
— |
|
|
Asset dispositions |
|
|
( |
) |
|
|
( |
) |
|
|
( |
) |
|
General and administrative expenses |
|
|
|
|
|
|
|
|
|
|
|
|
|
Financing costs, net |
|
|
|
|
|
|
|
|
|
|
|
|
|
Restructuring and transaction costs |
|
|
|
|
|
|
|
|
|
|
— |
|
|
Other expenses |
|
|
|
|
|
|
( |
) |
|
|
|
|
|
Total expenses |
|
|
|
|
|
|
|
|
|
|
|
|
|
Earnings (loss) from continuing operations before income taxes |
|
|
( |
) |
|
|
|
|
|
|
|
|
|
Income tax expense (benefit) |
|
|
( |
) |
|
|
|
|
|
|
|
|
|
Net earnings (loss) from continuing operations |
|
|
( |
) |
|
|
|
|
|
|
|
|
|
Net earnings (loss) from discontinued operations, net of income taxes |
|
|
( |
) |
|
|
|
|
|
|
|
|
|
Net earnings (loss) |
|
|
( |
) |
|
|
|
|
|
|
|
|
|
Net earnings attributable to noncontrolling interests |
|
|
|
|
|
|
|
|
|
|
|
|
|
Net earnings (loss) attributable to Devon |
|
$ |
( |
) |
|
$ |
|
|
|
$ |
|
|
|
Basic net earnings (loss) per share: |
|
|
|
|
|
|
|
|
|
|
|
|
|
Basic earnings (loss) from continuing operations per share |
|
$ |
( |
) |
|
$ |
|
|
|
$ |
|
|
|
Basic earnings (loss) from discontinued operations per share |
|
|
( |
) |
|
|
|
|
|
|
|
|
|
Basic net earnings (loss) per share |
|
$ |
( |
) |
|
$ |
|
|
|
$ |
|
|
|
Diluted net earnings (loss) per share: |
|
|
|
|
|
|
|
|
|
|
|
|
|
Diluted earnings (loss) from continuing operations per share |
|
$ |
( |
) |
|
$ |
|
|
|
$ |
|
|
|
Diluted earnings (loss) from discontinued operations per share |
|
|
( |
) |
|
|
|
|
|
|
|
|
|
Diluted net earnings (loss) per share |
|
$ |
( |
) |
|
$ |
|
|
|
$ |
|
|
|
Comprehensive earnings (loss): |
|
|
|
|
|
|
|
|
|
|
|
|
|
Net earnings (loss) |
|
$ |
( |
) |
|
$ |
|
|
|
$ |
|
|
|
Other comprehensive earnings (loss), net of tax: |
|
|
|
|
|
|
|
|
|
|
|
|
|
Foreign currency translation, discontinued operations |
|
|
|
|
|
|
( |
) |
|
|
|
|
|
Release of Canadian cumulative translation adjustment, discontinued operations |
|
|
( |
) |
|
|
— |
|
|
|
— |
|
|
Pension and postretirement plans |
|
|
|
|
|
|
|
|
|
|
|
|
|
Other comprehensive earnings (loss), net of tax |
|
|
( |
) |
|
|
( |
) |
|
|
|
|
|
Comprehensive earnings (loss): |
|
|
( |
) |
|
|
|
|
|
|
|
|
|
Comprehensive earnings attributable to noncontrolling interests |
|
|
|
|
|
|
|
|
|
|
|
|
|
Comprehensive earnings (loss) attributable to Devon |
|
$ |
( |
) |
|
$ |
|
|
|
$ |
|
|
See accompanying notes to consolidated financial statements.
51
DEVON ENERGY CORPORATION AND SUBSIDIARIES
CONSOLIDATED STATEMENTS OF CASH FLOWS
|
|
|
Year Ended December 31, |
|
|||||||||
|
|
|
2019 |
|
|
2018 |
|
|
2017 |
|
|||
|
Cash flows from operating activities: |
|
|
|
|
|
|
|
|
|
|
|
|
|
Net earnings (loss) |
|
$ |
( |
) |
|
$ |
|
|
|
$ |
|
|
|
Adjustments to reconcile net earnings (loss) to net cash from operating activities: |
|
|
|
|
|
|
|
|
|
|
|
|
|
Net (earnings) loss from discontinued operations, net of income taxes |
|
|
|
|
|
|
( |
) |
|
|
( |
) |
|
Depreciation, depletion and amortization |
|
|
|
|
|
|
|
|
|
|
|
|
|
Asset impairments |
|
|
— |
|
|
|
|
|
|
|
— |
|
|
Leasehold impairments |
|
|
|
|
|
|
|
|
|
|
|
|
|
Accretion on discounted liabilities |
|
|
|
|
|
|
|
|
|
|
|
|
|
Total (gains) losses on commodity derivatives |
|
|
|
|
|
|
( |
) |
|
|
( |
) |
|
Cash settlements on commodity derivatives |
|
|
|
|
|
|
( |
) |
|
|
|
|
|
Gains on asset dispositions |
|
|
( |
) |
|
|
( |
) |
|
|
( |
) |
|
Deferred income tax expense (benefit) |
|
|
( |
) |
|
|
|
|
|
|
( |
) |
|
Share-based compensation |
|
|
|
|
|
|
|
|
|
|
|
|
|
Early retirement of debt |
|
|
— |
|
|
|
|
|
|
|
— |
|
|
Other |
|
|
( |
) |
|
|
( |
) |
|
|
( |
) |
|
Changes in assets and liabilities, net |
|
|
( |
) |
|
|
( |
) |
|
|
|
|
|
Net cash from operating activities - continuing operations |
|
|
|
|
|
|
|
|
|
|
|
|
|
Cash flows from investing activities: |
|
|
|
|
|
|
|
|
|
|
|
|
|
Capital expenditures |
|
|
( |
) |
|
|
( |
) |
|
|
( |
) |
|
Acquisitions of property and equipment |
|
|
( |
) |
|
|
( |
) |
|
|
( |
) |
|
Divestitures of property and equipment |
|
|
|
|
|
|
|
|
|
|
|
|
|
Net cash from investing activities - continuing operations |
|
|
( |
) |
|
|
( |
) |
|
|
( |
) |
|
Cash flows from financing activities: |
|
|
|
|
|
|
|
|
|
|
|
|
|
Repayments of long-term debt |
|
|
( |
) |
|
|
( |
) |
|
|
— |
|
|
Early retirement of debt |
|
|
— |
|
|
|
( |
) |
|
|
— |
|
|
Repurchases of common stock |
|
|
( |
) |
|
|
( |
) |
|
|
— |
|
|
Dividends paid on common stock |
|
|
( |
) |
|
|
( |
) |
|
|
( |
) |
|
Contributions from noncontrolling interests |
|
|
|
|
|
|
— |
|
|
|
— |
|
|
Shares exchanged for tax withholdings |
|
|
( |
) |
|
|
( |
) |
|
|
( |
) |
|
Other |
|
|
( |
) |
|
|
( |
) |
|
|
— |
|
|
Net cash from financing activities - continuing operations |
|
|
( |
) |
|
|
( |
) |
|
|
( |
) |
|
Net change in cash, cash equivalents and restricted cash of continuing operations |
|
|
( |
) |
|
|
( |
) |
|
|
( |
) |
|
Cash flows from discontinued operations: |
|
|
|
|
|
|
|
|
|
|
|
|
|
Operating activities |
|
|
|
|
|
|
|
|
|
|
|
|
|
Investing activities |
|
|
|
|
|
|
|
|
|
|
( |
) |
|
Financing activities |
|
|
( |
) |
|
|
|
|
|
|
|
|
|
Effect of exchange rate changes on cash |
|
|
|
|
|
|
|
|
|
|
|
|
|
Net change in cash, cash equivalents and restricted cash of discontinued operations |
|
|
|
|
|
|
|
|
|
|
|
|
|
Net change in cash, cash equivalents and restricted cash |
|
|
( |
) |
|
|
( |
) |
|
|
|
|
|
Cash, cash equivalents and restricted cash at beginning of period |
|
|
|
|
|
|
|
|
|
|
|
|
|
Cash, cash equivalents and restricted cash at end of period |
|
$ |
|
|
|
$ |
|
|
|
$ |
|
|
|
|
|
|
|
|
|
|
|
|
|
|
|
|
|
Reconciliation of cash, cash equivalents and restricted cash: |
|
|
|
|
|
|
|
|
|
|
|
|
|
Cash and cash equivalents |
|
$ |
|
|
|
$ |
|
|
|
$ |
|
|
|
Cash restricted for discontinued operations |
|
|
|
|
|
|
— |
|
|
|
— |
|
|
Restricted cash included in other current assets |
|
|
— |
|
|
|
|
|
|
|
|
|
|
Cash and cash equivalents included in current assets associated with discontinued operations |
|
|
— |
|
|
|
— |
|
|
|
|
|
|
Total cash, cash equivalents and restricted cash |
|
$ |
|
|
|
$ |
|
|
|
$ |
|
|
See accompanying notes to consolidated financial statements.
52
DEVON ENERGY CORPORATION AND SUBSIDIARIES
CONSOLIDATED BALANCE SHEETS
|
|
|
December 31, 2019 |
|
|
December 31, 2018 |
|
||
|
|
|
|
|
|
|
|
||
|
ASSETS |
|
|
|
|
|
|
|
|
|
Current assets: |
|
|
|
|
|
|
|
|
|
Cash and cash equivalents |
|
$ |
|
|
|
$ |
|
|
|
Cash restricted for discontinued operations |
|
|
|
|
|
|
— |
|
|
Accounts receivable |
|
|
|
|
|
|
|
|
|
Current assets associated with discontinued operations |
|
|
|
|
|
|
|
|
|
Other current assets |
|
|
|
|
|
|
|
|
|
Total current assets |
|
|
|
|
|
|
|
|
|
Oil and gas property and equipment, based on successful efforts accounting, net |
|
|
|
|
|
|
|
|
|
Other property and equipment, net ($ |
|
|
|
|
|
|
|
|
|
Total property and equipment, net |
|
|
|
|
|
|
|
|
|
Goodwill |
|
|
|
|
|
|
|
|
|
Right-of-use assets |
|
|
|
|
|
|
— |
|
|
Other long-term assets |
|
|
|
|
|
|
|
|
|
Long-term assets associated with discontinued operations |
|
|
|
|
|
|
|
|
|
Total assets |
|
$ |
|
|
|
$ |
|
|
|
LIABILITIES AND EQUITY |
|
|
|
|
|
|
|
|
|
Current liabilities: |
|
|
|
|
|
|
|
|
|
Accounts payable |
|
$ |
|
|
|
$ |
|
|
|
Revenues and royalties payable |
|
|
|
|
|
|
|
|
|
Short-term debt |
|
|
— |
|
|
|
|
|
|
Current liabilities associated with discontinued operations |
|
|
|
|
|
|
|
|
|
Other current liabilities |
|
|
|
|
|
|
|
|
|
Total current liabilities |
|
|
|
|
|
|
|
|
|
Long-term debt |
|
|
|
|
|
|
|
|
|
Lease liabilities |
|
|
|
|
|
|
— |
|
|
Asset retirement obligations |
|
|
|
|
|
|
|
|
|
Other long-term liabilities |
|
|
|
|
|
|
|
|
|
Long-term liabilities associated with discontinued operations |
|
|
|
|
|
|
|
|
|
Deferred income taxes |
|
|
|
|
|
|
|
|
|
Stockholders' equity: |
|
|
|
|
|
|
|
|
|
Common stock, $ |
|
|
|
|
|
|
|
|
|
Additional paid-in capital |
|
|
|
|
|
|
|
|
|
Retained earnings |
|
|
|
|
|
|
|
|
|
Accumulated other comprehensive earnings (loss) |
|
|
( |
) |
|
|
|
|
|
Treasury stock, at cost, |
|
|
— |
|
|
|
( |
) |
|
Total stockholders’ equity attributable to Devon |
|
|
|
|
|
|
|
|
|
Noncontrolling interests |
|
|
|
|
|
|
— |
|
|
Total equity |
|
|
|
|
|
|
|
|
|
Total liabilities and equity |
|
$ |
|
|
|
$ |
|
|
See accompanying notes to consolidated financial statements.
53
DEVON ENERGY CORPORATION AND SUBSIDIARIES
CONSOLIDATED STATEMENTS OF EQUITY
|
|
|
|
|
|
|
|
|
|
|
|
|
|
|
Retained |
|
|
Other |
|
|
|
|
|
|
|
|
|
|
|
|
|
||
|
|
|
|
|
|
|
|
|
|
|
Additional |
|
|
Earnings |
|
|
Comprehensive |
|
|
|
|
|
|
|
|
|
|
|
|
|
|||
|
|
|
Common Stock |
|
|
Paid-In |
|
|
(Accumulated |
|
|
Earnings |
|
|
Treasury |
|
|
Noncontrolling |
|
|
Total |
|
|||||||||||
|
|
|
Shares |
|
|
Amount |
|
|
Capital |
|
|
Deficit) |
|
|
(Loss) |
|
|
Stock |
|
|
Interests |
|
|
Equity |
|
||||||||
|
Balance as of December 31, 2016 |
|
|
|
|
|
$ |
|
|
|
$ |
|
|
|
$ |
( |
) |
|
$ |
|
|
|
$ |
— |
|
|
$ |
|
|
|
$ |
|
|
|
Net earnings |
|
|
— |
|
|
|
— |
|
|
|
— |
|
|
|
|
|
|
|
— |
|
|
|
— |
|
|
|
|
|
|
|
|
|
|
Other comprehensive earnings, net of tax |
|
|
— |
|
|
|
— |
|
|
|
— |
|
|
|
— |
|
|
|
|
|
|
|
— |
|
|
|
— |
|
|
|
|
|
|
Restricted stock grants, net of cancellations |
|
|
|
|
|
|
|
|
|
|
— |
|
|
|
— |
|
|
|
— |
|
|
|
— |
|
|
|
— |
|
|
|
|
|
|
Common stock repurchased |
|
|
— |
|
|
|
— |
|
|
|
— |
|
|
|
— |
|
|
|
— |
|
|
|
( |
) |
|
|
— |
|
|
|
( |
) |
|
Common stock retired |
|
|
— |
|
|
|
— |
|
|
|
( |
) |
|
|
— |
|
|
|
— |
|
|
|
|
|
|
|
— |
|
|
|
— |
|
|
Common stock dividends |
|
|
— |
|
|
|
— |
|
|
|
— |
|
|
|
( |
) |
|
|
— |
|
|
|
— |
|
|
|
— |
|
|
|
( |
) |
|
Share-based compensation |
|
|
|
|
|
|
— |
|
|
|
|
|
|
|
— |
|
|
|
— |
|
|
|
— |
|
|
|
— |
|
|
|
|
|
|
Subsidiary equity transactions |
|
|
— |
|
|
|
— |
|
|
|
|
|
|
|
— |
|
|
|
— |
|
|
|
— |
|
|
|
|
|
|
|
|
|
|
Distributions to noncontrolling interests |
|
|
— |
|
|
|
— |
|
|
|
— |
|
|
|
— |
|
|
|
— |
|
|
|
— |
|
|
|
( |
) |
|
|
( |
) |
|
Balance as of December 31, 2017 |
|
|
|
|
|
$ |
|
|
|
$ |
|
|
|
$ |
|
|
|
$ |
|
|
|
$ |
— |
|
|
$ |
|
|
|
$ |
|
|
|
Net earnings |
|
|
— |
|
|
|
— |
|
|
|
— |
|
|
|
|
|
|
|
— |
|
|
|
— |
|
|
|
|
|
|
|
|
|
|
Other comprehensive loss, net of tax |
|
|
— |
|
|
|
— |
|
|
|
— |
|
|
|
— |
|
|
|
( |
) |
|
|
— |
|
|
|
— |
|
|
|
( |
) |
|
Restricted stock grants, net of cancellations |
|
|
|
|
|
|
— |
|
|
|
— |
|
|
|
— |
|
|
|
— |
|
|
|
— |
|
|
|
— |
|
|
|
— |
|
|
Common stock repurchased |
|
|
— |
|
|
|
— |
|
|
|
— |
|
|
|
— |
|
|
|
— |
|
|
|
( |
) |
|
|
— |
|
|
|
( |
) |
|
Common stock retired |
|
|
( |
) |
|
|
( |
) |
|
|
( |
) |
|
|
— |
|
|
|
— |
|
|
|
|
|
|
|
— |
|
|
|
— |
|
|
Common stock dividends |
|
|
— |
|
|
|
— |
|
|
|
— |
|
|
|
( |
) |
|
|
— |
|
|
|
— |
|
|
|
— |
|
|
|
( |
) |
|
Share-based compensation |
|
|
|
|
|
|
— |
|
|
|
|
|
|
|
— |
|
|
|
— |
|
|
|
— |
|
|
|
— |
|
|
|
|
|
|
Divestment of subsidiary equity investment |
|
|
— |
|
|
|
— |
|
|
|
— |
|
|
|
— |
|
|
|
|
|
|
|
— |
|
|
|
( |
) |
|
|
( |
) |
|
Subsidiary equity transactions |
|
|
— |
|
|
|
— |
|
|
|
— |
|
|
|
— |
|
|
|
— |
|
|
|
— |
|
|
|
|
|
|
|
|
|
|
Distributions to noncontrolling interests |
|
|
— |
|
|
|
— |
|
|
|
— |
|
|
|
— |
|
|
|
— |
|
|
|
— |
|
|
|
( |
) |
|
|
( |
) |
|
Other |
|
|
— |
|
|
|
— |
|
|
|
— |
|
|
|
|
|
|
|
( |
) |
|
|
— |
|
|
|
— |
|
|
|
— |
|
|
Balance as of December 31, 2018 |
|
|
|
|
|
$ |
|
|
|
$ |
|
|
|
$ |
|
|
|
$ |
|
|
|
$ |
( |
) |
|
$ |
— |
|
|
$ |
|
|
|
Effect of adoption of lease accounting |
|
|
— |
|
|
|
— |
|
|
|
— |
|
|
|
( |
) |
|
|
— |
|
|
|
— |
|
|
|
— |
|
|
|
( |
) |
|
Net earnings (loss) |
|
|
— |
|
|
|
— |
|
|
|
— |
|
|
|
( |
) |
|
|
— |
|
|
|
— |
|
|
|
|
|
|
|
( |
) |
|
Other comprehensive loss, net of tax |
|
|
— |
|
|
|
— |
|
|
|
— |
|
|
|
— |
|
|
|
( |
) |
|
|
— |
|
|
|
— |
|
|
|
( |
) |
|
Restricted stock grants, net of cancellations |
|
|
|
|
|
|
— |
|
|
|
— |
|
|
|
— |
|
|
|
— |
|
|
|
— |
|
|
|
— |
|
|
|
— |
|
|
Common stock repurchased |
|
|
— |
|
|
|
— |
|
|
|
— |
|
|
|
— |
|
|
|
— |
|
|
|
( |
) |
|
|
— |
|
|
|
( |
) |
|
Common stock retired |
|
|
( |
) |
|
|
( |
) |
|
|
( |
) |
|
|
— |
|
|
|
— |
|
|
|
|
|
|
|
— |
|
|
|
— |
|
|
Common stock dividends |
|
|
— |
|
|
|
— |
|
|
|
— |
|
|
|
( |
) |
|
|
— |
|
|
|
— |
|
|
|
— |
|
|
|
( |
) |
|
Share-based compensation |
|
|
— |
|
|
|
— |
|
|
|
|
|
|
|
— |
|
|
|
— |
|
|
|
— |
|
|
|
— |
|
|
|
|
|
|
Contributions from noncontrolling interests |
|
|
— |
|
|
|
— |
|
|
|
— |
|
|
|
— |
|
|
|
— |
|
|
|
— |
|
|
|
|
|
|
|
|
|
|
Balance as of December 31, 2019 |
|
|
|
|
|
$ |
|
|
|
$ |
|
|
|
$ |
|
|
|
$ |
( |
) |
|
$ |
— |
|
|
$ |
|
|
|
$ |
|
|
See accompanying notes to consolidated financial statements.
54
DEVON ENERGY CORPORATION AND SUBSIDIARIES
NOTES TO CONSOLIDATED FINANCIAL STATEMENTS
|
1. |
Summary of Significant Accounting Policies |
Devon is a leading independent energy company engaged primarily in the exploration, development and production of oil, natural gas and NGLs. Devon’s operations are concentrated in various onshore areas in the U.S.
As further discussed in Note 18, Devon reached an agreement to sell its Barnett Shale assets in December 2019, sold its Canadian operations on June 27, 2019 and sold its ownership interests in EnLink and the General Partner on July 18, 2018. Activity relating to Devon’s Barnett Shale assets, inclusive of properties divested as partial sales of the Barnett Shale common operating field in previous reporting periods located primarily in Johnson and Wise counties, Texas, Canadian operations and EnLink and the General Partner are classified as discontinued operations within Devon’s consolidated statements of comprehensive earnings and consolidated statements of cash flows. The associated assets and liabilities of Devon’s Barnett Shale assets and Canadian operations are presented as assets and liabilities associated with discontinued operations on the consolidated balance sheets.
Accounting policies used by Devon and its subsidiaries conform to accounting principles generally accepted in the U.S. and reflect industry practices. The more significant of such policies are discussed below.
Principles of Consolidation
The accompanying consolidated financial statements include the accounts of Devon, entities in which it holds a controlling interest and VIEs for which Devon is the primary beneficiary. All intercompany transactions have been eliminated. Undivided interests in oil and natural gas exploration and production joint ventures are consolidated on a proportionate basis. Investments in non-controlled entities, over which Devon has the ability to exercise significant influence over operating and financial policies, are accounted for using the equity method. In applying the equity method of accounting, the investments are initially recognized at cost and subsequently adjusted for Devon’s proportionate share of earnings, losses, contributions and distributions. Investments accounted for using the equity method and cost method are reported as a component of other long-term assets.
Devon entered into an agreement in the fourth quarter of 2019 to form Cotton Draw Midstream, L.L.C. or, “CDM”, a partnership in the Delaware Basin with an affiliate of QL Capital Partners, LP (“QLCP”). As part of this transaction, Devon contributed gathering system and compression assets in the Cotton Draw area to CDM in exchange for a $
Devon, through its controlling interest in CDM, has the power to direct the activities that significantly affect the economic performance of CDM and the obligation to absorb losses or the right to receive benefits that could be significant to CDM; therefore, Devon is considered the primary beneficiary and consolidates CDM. CDM maintains its own capital structure that is separate from Devon.
The assets of CDM cannot be used by Devon for general corporate purposes and are included in and disclosed parenthetically on Devon's consolidated balance sheets. The carrying amount of liabilities related to CDM for which the creditors do not have recourse to Devon's assets are also included in and disclosed parenthetically on Devon's consolidated balance sheets, if material.
Segment Information
Subsequent to the sale of Devon’s Canadian business in 2019 discussed in Note 18, Devon’s oil and gas exploration and production activities are solely focused in the U.S. For financial reporting purposes, Devon
55
DEVON ENERGY CORPORATION AND SUBSIDIARIES
NOTES TO CONSOLIDATED FINANCIAL STATEMENTS – (Continued)
aggregates its U.S. operating segments into one reporting segment due to the similar nature of its business. With the reclassification of Devon’s Canadian operations to discontinued operations and assets and liabilities associated with discontinued operations, Devon now has one reporting segment, which is reflected in the consolidated financial statements.
Use of Estimates
The preparation of financial statements requires management to make estimates and assumptions that affect the reported amounts of assets and liabilities and disclosure of contingent assets and liabilities at the date of the financial statements and the reported amounts of revenues and expenses during the reporting period. Actual amounts could differ from these estimates, and changes in these estimates are recorded when known. Significant items subject to such estimates and assumptions include the following:
|
|
• |
proved reserves and related present value of future net revenues; |
|
|
• |
evaluation of suspended well costs; |
|
|
• |
the carrying and fair values of oil and gas properties, other property and equipment and product and equipment inventories; |
|
|
• |
derivative financial instruments; |
|
|
• |
the fair value of reporting units and related assessment of goodwill for impairment; |
|
|
• |
income taxes; |
|
|
• |
asset retirement obligations; |
|
|
• |
obligations related to employee pension and postretirement benefits; |
|
|
• |
legal and environmental risks and exposures; and |
|
|
• |
general credit risk associated with receivables and other assets. |
Revenue Recognition
Impact of ASC 606 Adoption
In January 2018, Devon adopted ASC 606 – Revenue from Contracts with Customers (ASC 606) using the modified retrospective method and applied the standard to all existing contracts at adoption. ASC 606 supersedes previous revenue recognition requirements in ASC 605 and includes a five-step revenue recognition model to depict the transfer of goods or services to customers in an amount that reflects the consideration in exchange for those goods or services.
The changes to upstream revenues and production expenses were due to the conclusion that Devon represents the principal and controls a promised product before transferring it to the ultimate third party customer in accordance with the control model in ASC 606. This was a change from previous conclusions reached for these agreements utilizing the principal versus agent indicators under ASC 605 where the assessment was focused on Devon passing title and not control to the processing entity and Devon ultimately receiving a net price from the third-party end customer. As a result, Devon changed the presentation of revenues and expenses for these agreements. Revenues related to these agreements are presented on a gross basis for amounts expected to be received from third-party customers through the marketing process. Gathering, processing and transportation expenses related to these agreements, incurred prior to the transfer of control to the customer at the tailgate of the natural gas processing facilities, are presented as production expenses. During 2018, these changes resulted in a $
56
DEVON ENERGY CORPORATION AND SUBSIDIARIES
NOTES TO CONSOLIDATED FINANCIAL STATEMENTS – (Continued)
the adoption of ASC 606, Devon’s marketing and midstream revenues and marketing and midstream expenses were not impacted.
Upstream Revenues
Upstream revenues include the sale of oil, gas and NGL production. Oil, gas and NGL sales are recognized when production is sold to a purchaser at a fixed or determinable price, delivery has occurred, control has transferred and collectability of the revenue is probable. Devon’s performance obligations are satisfied at a point in time. This occurs when control is transferred to the purchaser upon delivery of contract specified production volumes at a specified point. The transaction price used to recognize revenue is a function of the contract billing terms. Revenue is invoiced, if required, by calendar month based on volumes at contractually based rates with payment typically received within
Oil sales
Devon’s oil sales contracts are generally structured in one of two ways. First, production is sold at the wellhead at an agreed-upon index price, net of pricing differentials. In this scenario, revenue is recognized when control transfers to the purchaser at the wellhead at the net price received. Alternatively, production is delivered to the purchaser at a contractually agreed-upon delivery point at which the purchaser takes custody, title and risk of loss of the product. Under this arrangement, a third party is paid to transport the product and Devon receives a specified index price from the purchaser with no transportation deduction. In this scenario, revenue is recognized when control transfers to the purchaser at the delivery point based on the price received from the purchaser. The third-party costs are recorded as gathering, processing and transportation expense as a component of production expenses in the consolidated statements of comprehensive earnings.
Natural gas and NGL sales
Under Devon’s natural gas processing contracts, natural gas is delivered to a midstream processing entity at the wellhead or the inlet of the midstream processing entity’s system. The midstream processing entity gathers and processes the natural gas and remits proceeds for the resulting sales of NGLs and residue gas. In these scenarios, Devon evaluates whether it is the principal or the agent in the transaction. Devon has concluded it is the principal under these contracts and the ultimate third party is the customer. Revenue is recognized on a gross basis, with gathering, processing and transportation fees presented as a component of production expenses in the consolidated statements of comprehensive earnings.
In certain natural gas processing agreements, Devon may elect to take residue gas and/or NGLs in-kind at the tailgate of the midstream entity’s processing plant and subsequently market the product. Through the marketing process, the product is delivered to the ultimate third-party purchaser at a contractually agreed-upon delivery point, and Devon receives a specified index price from the purchaser. In this scenario, revenue is recognized when control transfers to the purchaser at the delivery point based on the index price received from the purchaser. The gathering, processing and compression fees attributable to the gas processing contract, as well as any transportation fees incurred to deliver the product to the purchaser, are presented as gathering, processing and transportation expense as a component of production expenses in the consolidated statements of comprehensive earnings.
Marketing Revenues
Marketing revenues are generated primarily as a result of Devon selling commodities purchased from third parties. Marketing revenues are recognized when performance obligations are satisfied. This occurs at the time contract-specified products are sold to third parties at a contractually fixed or determinable price, delivery occurs at
57
DEVON ENERGY CORPORATION AND SUBSIDIARIES
NOTES TO CONSOLIDATED FINANCIAL STATEMENTS – (Continued)
a specified point or performance has occurred, control has transferred and collectability of the revenue is probable. The transaction price used to recognize revenue and invoice customers is based on a contractually stated fee or on a third party published index price plus or minus a known differential. Devon typically receives payment for invoiced amounts within
Satisfaction of Performance Obligations and Revenue Recognitions
Because Devon has a right to consideration from its customers in amounts that correspond directly to the value that the customer receives from the performance completed on each contract, Devon recognizes revenue for sales at the time the crude oil, natural gas or NGLs are delivered at a fixed or determinable price.
Transaction Price Allocated to Remaining Performance Obligations
Most of Devon’s contracts are short-term in nature with a contract term of one year or less. Devon applies the practical expedient in ASC 606 exempting the disclosure of the transaction price allocated to remaining performance obligations if the performance obligation is part of a contract that has an original expected duration of one year or less. For contracts with terms greater than one year, Devon applies the practical expedient in ASC 606 exempting the disclosure of the transaction price allocated to remaining performance obligations if the variable consideration is allocated entirely to a wholly unsatisfied performance obligation. Under Devon’s contracts, each unit of product typically represents a separate performance obligation; therefore, future volumes are wholly unsatisfied and disclosure of the transaction price allocated to remaining performance obligations is not required.
Contract Balances
Cash received relating to future performance obligations is deferred and recognized when all revenue recognition criteria are met. Contract liabilities generated from such deferred revenue are not considered material as of December 31, 2019. Devon’s product sales and marketing contracts do not give rise to contract assets.
Disaggregation of Revenue
The following table presents revenue from contracts with customers that are disaggregated based on the type of good.
|
|
|
Year Ended December 31, |
|
|||||
|
|
|
2019 |
|
|
2018 |
|
||
|
Oil |
|
$ |
|
|
|
$ |
|
|
|
Gas |
|
|
|
|
|
|
|
|
|
NGL |
|
|
|
|
|
|
|
|
|
Oil, gas and NGL revenues from contracts with customers |
|
|
|
|
|
|
|
|
|
Oil, gas and NGL derivatives |
|
|
( |
) |
|
|
|
|
|
Upstream revenues |
|
|
|
|
|
|
|
|
|
|
|
|
|
|
|
|
|
|
|
Oil |
|
|
|
|
|
|
|
|
|
Gas |
|
|
|
|
|
|
|
|
|
NGL |
|
|
|
|
|
|
|
|
|
Total marketing revenues from contracts with customers |
|
|
|
|
|
|
|
|
|
|
|
|
|
|
|
|
|
|
|
Total revenues |
|
$ |
|
|
|
$ |
|
|
58
DEVON ENERGY CORPORATION AND SUBSIDIARIES
NOTES TO CONSOLIDATED FINANCIAL STATEMENTS – (Continued)
Customers
During 2019 and 2017,
During 2018, Devon had
Derivative Financial Instruments
Devon is exposed to certain risks relating to its ongoing business operations, including risks related to commodity prices and interest rates. As discussed more fully below, Devon uses derivative instruments primarily to manage commodity price risk and interest rate risk. Devon does not intend to issue or hold derivative financial instruments for speculative trading purposes.
Devon enters into derivative financial instruments with respect to a portion of its oil, gas and NGL production to hedge future prices received. These instruments are used to manage the inherent uncertainty of future revenues resulting from commodity price volatility. Devon’s derivative financial instruments typically include financial price swaps, basis swaps and costless price collars. Under the terms of the price swaps, Devon receives a fixed price for its production and pays a variable market price to the contract counterparty. For the basis swaps, Devon receives a fixed differential between two regional index prices and pays a variable differential on the same two index prices to the contract counterparty. For price collars, Devon utilizes two-way price collars. The two-way price collars set a floor and ceiling price for the hedged production. If the applicable monthly price indices are outside of the ranges set by the floor and ceiling prices in the various collars, Devon will cash-settle the difference with the counterparty.
Devon periodically enters into interest rate swaps to manage its exposure to interest rate volatility. As of December 31, 2019, Devon did not have any open interest rate swap contracts.
All derivative financial instruments are recognized at their current fair value as either assets or liabilities in the balance sheet. Changes in the fair value of these derivative financial instruments are recorded in earnings unless specific hedge accounting criteria are met. For derivative financial instruments held during the three-year period ended December 31, 2019, Devon chose not to meet the necessary criteria to qualify its derivative financial instruments for hedge accounting treatment. Cash settlements with counterparties on Devon’s derivative financial instruments are also recorded in earnings.
By using derivative financial instruments to hedge exposures to changes in commodity prices and interest rates, Devon is exposed to credit risk. Credit risk is the failure of the counterparty to perform under the terms of the derivative contract. To mitigate this risk, the hedging instruments are placed with a number of counterparties whom Devon believes are acceptable credit risks. It is Devon’s policy to enter into derivative contracts only with investment-grade rated counterparties deemed by management to be competent and competitive market makers. Additionally, Devon’s derivative contracts generally require cash collateral to be posted if either its or the counterparty’s credit rating falls below certain credit rating levels. As of December 31, 2019, Devon held
General and Administrative Expenses
G&A is reported net of amounts reimbursed by working interest owners of the oil and gas properties operated by Devon.
59
DEVON ENERGY CORPORATION AND SUBSIDIARIES
NOTES TO CONSOLIDATED FINANCIAL STATEMENTS – (Continued)
Share-Based Compensation
Devon grants share-based awards to members of its Board of Directors, management and employees. All such awards are measured at fair value on the date of grant and are generally recognized as a component of G&A in the accompanying consolidated statements of comprehensive earnings over the applicable requisite service periods. As a result of Devon’s restructuring activity discussed in Note 6, certain share-based awards were accelerated and recognized as a component of restructuring and transaction costs in the accompanying consolidated statements of comprehensive earnings.
Generally, Devon uses new shares from approved incentive programs to grant share-based awards and to issue shares upon stock option exercises. Shares repurchased under approved programs are generally available to be issued as part of Devon’s share-based awards. However, Devon has historically canceled these shares upon repurchase.
Income Taxes
Devon is subject to current income taxes assessed by the federal and various state jurisdictions in the U.S. and by other foreign jurisdictions. In addition, Devon accounts for deferred income taxes related to these jurisdictions using the asset and liability method. Under this method, deferred tax assets and liabilities are recognized for the future tax consequences attributable to differences between the financial statement carrying amounts of assets and liabilities and their respective tax basis. Deferred tax assets and liabilities are measured using enacted tax rates expected to apply to taxable income in the years in which those temporary differences and carryforwards are expected to be recovered or settled. The effect on deferred tax assets and liabilities of a change in tax rates is recognized in income in the period that includes the enactment date.
Deferred tax assets are also recognized for the future tax benefits attributable to the expected utilization of existing tax net operating loss carryforwards and other types of carryforwards. If the future utilization of some portion of the deferred tax assets is determined to be unlikely, a valuation allowance is provided to reduce the recorded tax benefits from such assets. Devon periodically weighs the positive and negative evidence to determine if it is more likely than not that some or all of the deferred tax assets will be realized. Forming a conclusion that a valuation allowance is not required is difficult when there is negative evidence, such as cumulative losses in recent years. See Note 7 for further discussion.
Devon recognizes the financial statement effects of tax positions when it is more likely than not, based on the technical merits, that the position will be sustained upon examination by a taxing authority. Recognized tax positions are initially and subsequently measured as the largest amount of tax benefit that is more likely than not of being realized upon ultimate settlement with a taxing authority. Liabilities for unrecognized tax benefits related to such tax positions are included in other long-term liabilities unless the tax position is expected to be settled within the upcoming year, in which case the liabilities are included in other current liabilities. Interest and penalties related to unrecognized tax benefits are included in current income tax expense.
Devon estimates its annual effective income tax rate in recording its provision for income taxes in the various jurisdictions in which it operates. Statutory tax rate changes and other significant or unusual items are recognized as discrete items in the period in which they occur.
Net Earnings (Loss) Per Share Attributable to Devon
Devon’s basic earnings per share amounts have been computed based on the average number of shares of common stock outstanding for the period. Basic earnings per share includes the effect of participating securities, which primarily consist of Devon’s outstanding restricted stock awards, as well as performance-based restricted stock awards that have met the requisite performance targets. Diluted earnings per share is calculated using the
60
DEVON ENERGY CORPORATION AND SUBSIDIARIES
NOTES TO CONSOLIDATED FINANCIAL STATEMENTS – (Continued)
treasury stock method to reflect the assumed issuance of common shares for all potentially dilutive securities. Such securities primarily consist of unvested performance share units.
Cash and Cash Equivalents
Devon considers all highly liquid investments with original contractual maturities of three months or less to be cash equivalents.
Cash Restricted for Discontinued Operations
In conjunction primarily with the sale of its Canadian operations in June 2019, approximately $
Accounts Receivable
Devon’s accounts receivable balance primarily consists of oil and gas sales receivables, marketing and midstream revenue receivables and joint interest receivables for which Devon does not require collateral security. Devon has established an allowance for bad debts equal to the estimable portions of accounts receivable, including joint interest receivables, for which failure to collect is considered probable. When a portion of the receivable is deemed uncollectible, the write-off is made against the allowance.
Property and Equipment
Oil and Gas Property and Equipment
Devon follows the successful efforts method of accounting for its oil and gas properties. Exploration costs, such as exploratory geological and geophysical costs, and costs associated with nonproductive exploratory wells, delay rentals and exploration overhead are charged against earnings as incurred. Costs of drilling successful exploratory wells along with acquisition costs and the costs of drilling development wells, including those that are unsuccessful, are capitalized. Devon groups its oil and gas properties with a common geological structure or stratigraphic condition (“common operating field”) for purposes of computing DD&A, assessing proved property impairments and accounting for asset dispositions.
Exploratory drilling costs and exploratory-type stratigraphic test wells are initially capitalized, or suspended, pending the determination of proved reserves. If proved reserves are found, drilling costs remain capitalized as proved properties. Costs of unsuccessful wells are charged to exploration expense. For exploratory wells that find reserves that cannot be classified as proved when drilling is completed, costs continue to be capitalized as suspended exploratory well costs if there have been sufficient reserves found to justify completion as a producing well and sufficient progress is being made in assessing the reserves and the economic and operating viability of the project. If management determines that future appraisal drilling or development activities are unlikely to occur, associated suspended exploratory well costs are expensed. In some instances, this determination may take longer than one year. Devon reviews the status of all suspended exploratory drilling costs quarterly.
Capitalized costs of proved oil and gas properties are depleted by an equivalent unit-of-production method, converting gas to oil at the ratio of six Mcf of gas to one Bbl of oil. Proved leasehold acquisition costs, less accumulated amortization, are depleted over total proved reserves, which includes proved undeveloped reserves.
61
DEVON ENERGY CORPORATION AND SUBSIDIARIES
NOTES TO CONSOLIDATED FINANCIAL STATEMENTS – (Continued)
Capitalized costs of wells and related equipment and facilities, including estimated asset retirement costs, net of estimated salvage values and less accumulated amortization are depreciated over proved developed reserves associated with those capitalized costs. Depletion is calculated by applying the DD&A rate (amortizable base divided by beginning of period proved reserves) to current period production.
Costs associated with unproved properties are excluded from the depletion calculation until it is determined whether or not proved reserves can be assigned to such properties. Devon assesses its unproved properties for impairment annually, or more frequently if events or changes in circumstances dictate that the carrying value of those assets may not be recoverable. Significant unproved properties are assessed individually.
Proved properties are assessed for impairment annually, or more frequently if events or changes in circumstances dictate that the carrying value of those assets may not be recoverable. Individual assets are grouped for impairment purposes based on a common operating field. If there is an indication the carrying amount of an asset may not be recovered, the asset is assessed for potential impairment by management through an established process. If, upon review, the sum of the undiscounted pre-tax cash flows is less than the carrying value of the asset, the carrying value is written down to estimated fair value. Because there is usually a lack of quoted market prices for long-lived assets, the fair value of impaired assets is typically determined based on the present values of expected future cash flows using discount rates believed to be consistent with those used by principal market participants or by comparable transactions. The expected future cash flows used for impairment reviews and related fair value calculations are typically based on judgmental assessments of future production volumes, commodity prices, operating costs, and capital investment plans, considering all available information at the date of review.
Gains or losses are recorded for sales or dispositions of oil and gas properties which constitute an entire common operating field or which result in a significant alteration of the common operating field’s DD&A rate. These gains and losses are classified as asset dispositions in the accompanying consolidated statements of earnings. Partial common operating field sales or dispositions deemed not to significantly alter the DD&A rates are generally accounted for as adjustments to capitalized costs with no gain or loss recognized.
Devon capitalizes interest costs incurred that are attributable to material unproved oil and gas properties and major development projects of oil and gas properties.
62
DEVON ENERGY CORPORATION AND SUBSIDIARIES
NOTES TO CONSOLIDATED FINANCIAL STATEMENTS – (Continued)
Other Property and Equipment
Costs for midstream assets that are in use are depreciated over the assets’ estimated useful lives, using the straight-line method. Depreciation and amortization of other property and equipment, including corporate and leasehold improvements, are provided using the straight-line method based on estimated useful lives ranging from
Asset Retirement Obligations
Devon recognizes liabilities for retirement obligations associated with tangible long-lived assets, such as producing well sites when there is a legal obligation associated with the retirement of such assets and the amount can be reasonably estimated. The initial measurement of an asset retirement obligation is recorded as a liability at its fair value, with an offsetting asset retirement cost recorded as an increase to the associated property and equipment on the consolidated balance sheet. When the assumptions used to estimate a recorded asset retirement obligation change, a revision is recorded to both the asset retirement obligation and the asset retirement cost. Devon’s asset retirement obligations also include estimated environmental remediation costs which arise from normal operations and are associated with the retirement of such long-lived assets. The asset retirement cost is depreciated using a systematic and rational method similar to that used for the associated property and equipment.
Goodwill
Goodwill represents the excess of the purchase price of business combinations over the fair value of the net assets acquired and is tested for impairment annually, or more frequently if events or changes in circumstances dictate that the carrying value of goodwill may not be recoverable. Such test includes a qualitative assessment to determine whether it is more likely than not that the fair value of a reporting unit is less than its carrying amount. If the qualitative assessment determines that it is more likely than not that the fair value of a reporting unit is less than its carrying amount, including goodwill, then a quantitative goodwill impairment test is performed. The quantitative goodwill impairment test requires the fair value of each reporting unit be compared to the carrying value of the reporting unit. If the fair value of the reporting unit is less than the carrying value, an impairment charge will be recognized for the amount by which the carrying amount exceeds the fair value. Because quoted market prices are not available for Devon’s reporting unit, the fair value of the reporting unit is estimated based upon several valuation analyses, including comparable companies, comparable transactions and premiums paid.
Devon performed impairment tests of goodwill in the fourth quarters of 2019, 2018 and 2017. No impairment was required as a result of the annual tests in these time periods.
Commitments and Contingencies
Liabilities for loss contingencies arising from claims, assessments, litigation or other sources are recorded when it is probable that a liability has been incurred and the amount can be reasonably estimated. Liabilities for environmental remediation or restoration claims resulting from allegations of improper operation of assets are recorded when it is probable that obligations have been incurred and the amounts can be reasonably estimated. Expenditures related to such environmental matters are expensed or capitalized in accordance with Devon’s accounting policy for property and equipment.
63
DEVON ENERGY CORPORATION AND SUBSIDIARIES
NOTES TO CONSOLIDATED FINANCIAL STATEMENTS – (Continued)
Fair Value Measurements
Certain of Devon’s assets and liabilities are measured at fair value at each reporting date. Fair value represents the price that would be received to sell the asset or paid to transfer the liability in an orderly transaction between market participants. This price is commonly referred to as the “exit price.” Fair value measurements are classified according to a hierarchy that prioritizes the inputs underlying the valuation techniques. This hierarchy consists of three broad levels:
|
|
• |
Level 1 – Inputs consist of unadjusted quoted prices in active markets for identical assets and liabilities and have the highest priority. When available, Devon measures fair value using Level 1 inputs because they generally provide the most reliable evidence of fair value. |
|
|
• |
Level 2 – Inputs consist of quoted prices that are generally observable for the asset or liability. Common examples of Level 2 inputs include quoted prices for similar assets and liabilities in active markets or quoted prices for identical assets and liabilities in markets not considered to be active. |
|
|
• |
Level 3 – Inputs are not observable from objective sources and have the lowest priority. The most common Level 3 fair value measurement is an internally developed cash flow model. |
Foreign Currency Translation Adjustments
The U.S. dollar is the functional currency for Devon’s consolidated operations. Devon’s recently divested Canadian operations used the Canadian dollar as the functional currency. Assets and liabilities of the Canadian operations were translated to U.S. dollars using the applicable exchange rate as of the end of a reporting period. Revenues, expenses and cash flow were translated using an average exchange rate during the reporting period.
The disposition of substantially all of Devon’s Canadian oil and gas assets and operations resulted in Devon releasing its historical cumulative foreign currency translation adjustment of $
Noncontrolling Interests
Noncontrolling interests represent third-party ownership in the net assets of Devon’s consolidated subsidiaries and are presented as a component of equity. Changes in Devon’s ownership interests in subsidiaries that do not result in deconsolidation are recognized in equity.
Recently Adopted Accounting Standards
In January 2019, Devon adopted ASU 2016-02, Leases (Topic 842), using the modified retrospective method. See Note 14 for further discussion regarding Devon’s adoption of the leases standard.
The SEC released Final Rule Release No. 33-10618, FAST Act Modernization and Simplification of Regulation S-K, which amends Regulation S-K to modernize and simplify certain disclosure requirements in a manner that reduces costs and burdens on registrants while continuing to provide all material information to investors. The rule became effective May 2, 2019. The rule amended numerous SEC rules, items and forms covering a diverse group of topics, primarily focusing on reducing or eliminating disclosures. Other than presentation, this adoption did not have a material impact on Devon’s consolidated financial statements.
64
DEVON ENERGY CORPORATION AND SUBSIDIARIES
NOTES TO CONSOLIDATED FINANCIAL STATEMENTS – (Continued)
|
2. |
Divestitures |
Discontinued Operations – Upstream Assets
In February 2019, Devon announced its intent to separate its Canadian business and Barnett Shale assets from the Company, based on authorizations provided by its Board of Directors. On
In December 2019, Devon announced the sale of its Barnett Shale assets to BKV for approximately $
During 2018, Devon received proceeds of approximately $
Discontinued Operations – EnLink and General Partner
During the third quarter of 2018, Devon completed the sale of its aggregate ownership interests in EnLink and the General Partner for $
Continuing Operations
During 2019, Devon received proceeds of approximately $
During 2018, Devon received proceeds totaling approximately $
During 2017, Devon received proceeds totaling approximately $
65
DEVON ENERGY CORPORATION AND SUBSIDIARIES
NOTES TO CONSOLIDATED FINANCIAL STATEMENTS – (Continued)
|
3. |
Derivative Financial Instruments |
Commodity Derivatives
As of December 31, 2019, Devon had the following open oil derivative positions. The first table presents Devon’s oil derivatives that settle against the average of the prompt month NYMEX WTI futures price. The second table presents Devon’s oil derivatives that settle against the respective indices noted within the table.
|
|
|
Price Swaps |
|
|
Price Collars |
|
||||||||||||||
|
Period |
|
Volume (Bbls/d) |
|
|
Weighted Average Price ($/Bbl) |
|
|
Volume (Bbls/d) |
|
|
Weighted Average Floor Price ($/Bbl) |
|
|
Weighted Average Ceiling Price ($/Bbl) |
|
|||||
|
Q1-Q4 2020 |
|
|
|
|
|
$ |
|
|
|
|
|
|
|
$ |
|
|
|
$ |
|
|
|
Q1-Q4 2021 |
|
|
|
|
|
$ |
|
|
|
|
|
|
|
$ |
|
|
|
$ |
|
|
|
|
|
Oil Basis Swaps |
|
|||||||
|
Period |
|
Index |
|
Volume (Bbls/d) |
|
|
Weighted Average Differential to WTI ($/Bbl) |
|
||
|
Q1-Q4 2020 |
|
Argus MEH |
|
|
|
|
|
$ |
|
|
|
Q1-Q4 2020 |
|
NYMEX Roll |
|
|
|
|
|
$ |
|
|
As of December 31, 2019, Devon had the following open natural gas derivative positions. The first table presents Devon’s natural gas derivatives that settle against the Inside FERC first of the month Henry Hub index. The second table presents Devon’s natural gas derivatives that settle against the respective indices noted within the table.
|
|
|
Price Swaps |
|
|
Price Collars |
|
||||||||||||||
|
Period |
|
Volume (MMBtu/d) |
|
|
Weighted Average Price ($/MMBtu) |
|
|
Volume (MMBtu/d) |
|
|
Weighted Average Floor Price ($/MMBtu) |
|
|
Weighted Average Ceiling Price ($/MMBtu) |
|
|||||
|
Q1-Q4 2020 |
|
|
|
|
|
$ |
|
|
|
|
|
|
|
$ |
|
|
|
$ |
|
|
|
|
|
Natural Gas Basis Swaps |
|
|||||||
|
Period |
|
Index |
|
Volume (MMBtu/d) |
|
|
Weighted Average Differential to Henry Hub ($/MMBtu) |
|
||
|
Q1-Q4 2020 |
|
Panhandle Eastern Pipe Line |
|
|
|
|
|
$ |
( |
) |
|
Q1-Q4 2020 |
|
El Paso Natural Gas |
|
|
|
|
|
$ |
( |
) |
|
Q1-Q4 2020 |
|
Houston Ship Channel |
|
|
|
|
|
$ |
|
|
As of December 31, 2019, Devon had the following open NGL derivative positions. Devon’s NGL positions settle against the average of the prompt month OPIS Mont Belvieu, Texas index.
|
|
|
|
|
Price Swaps |
|
|||||
|
Period |
|
Product |
|
Volume (Bbls/d) |
|
|
Weighted Average Price ($/Bbl) |
|
||
|
Q1-Q4 2020 |
|
Natural Gasoline |
|
|
|
|
|
$ |
|
|
|
Q1-Q4 2020 |
|
Normal Butane |
|
|
|
|
|
$ |
|
|
|
Q1-Q4 2020 |
|
Propane |
|
|
|
|
|
$ |
|
|
66
DEVON ENERGY CORPORATION AND SUBSIDIARIES
NOTES TO CONSOLIDATED FINANCIAL STATEMENTS – (Continued)
Financial Statement Presentation
The following table presents the net gains and losses by derivative financial instrument type followed by the corresponding individual consolidated statements of comprehensive earnings caption.
|
|
|
Year Ended December 31, |
|
|||||||||
|
|
|
2019 |
|
|
2018 |
|
|
2017 |
|
|||
|
Commodity derivatives: |
|
|
|
|
|
|
|
|
|
|
|
|
|
Upstream revenues |
|
$ |
( |
) |
|
$ |
|
|
|
$ |
|
|
|
Marketing and midstream revenues |
|
|
|
|
|
|
( |
) |
|
|
|
|
|
Interest rate derivatives: |
|
|
|
|
|
|
|
|
|
|
|
|
|
Other expenses |
|
|
— |
|
|
|
|
|
|
|
( |
) |
|
Net gains (losses) recognized |
|
$ |
( |
) |
|
$ |
|
|
|
$ |
|
|
The following table presents the derivative fair values by derivative financial instrument type followed by the corresponding individual consolidated balance sheet caption.
|
|
|
December 31, 2019 |
|
|
December 31, 2018 |
|
||
|
Commodity derivative assets: |
|
|
|
|
|
|
|
|
|
Other current assets |
|
$ |
|
|
|
$ |
|
|
|
Other long-term assets |
|
|
|
|
|
|
|
|
|
Total derivative assets |
|
$ |
|
|
|
$ |
|
|
|
Commodity derivative liabilities: |
|
|
|
|
|
|
|
|
|
Other current liabilities |
|
$ |
|
|
|
$ |
|
|
|
Other long-term liabilities |
|
|
|
|
|
|
|
|
|
Total derivative liabilities |
|
$ |
|
|
|
$ |
|
|
|
4. |
In 2017, Devon’s stockholders approved the 2017 Plan. The 2017 Plan replaces the 2015 Plan. From the effective date of the 2017 Plan, no further awards may be made under the 2015 Plan, and awards previously granted will continue to be governed by the terms of the respective award documents. Subject to the terms of the 2017 Plan, awards may be made for a total of
67
DEVON ENERGY CORPORATION AND SUBSIDIARIES
NOTES TO CONSOLIDATED FINANCIAL STATEMENTS – (Continued)
The vesting for certain share-based awards was accelerated in 2019 and 2018 in conjunction with the reduction of workforce activities described in Note 6 and is included in restructuring and transaction costs in the accompanying consolidated statements of comprehensive earnings.
The table below presents the share-based compensation expense included in Devon’s accompanying consolidated statements of comprehensive earnings.
|
|
|
Year Ended December 31, |
|
|||||||||
|
|
|
2019 |
|
|
2018 |
|
|
2017 |
|
|||
|
G&A |
|
$ |
|
|
|
$ |
|
|
|
$ |
|
|
|
Exploration expenses |
|
|
|
|
|
|
|
|
|
|
|
|
|
Restructuring and transaction costs |
|
|
|
|
|
|
|
|
|
|
— |
|
|
Total |
|
$ |
|
|
|
$ |
|
|
|
$ |
|
|
|
Related income tax benefit |
|
$ |
|
|
|
$ |
|
|
|
$ |
— |
|
The following table presents a summary of Devon’s unvested restricted stock awards and units, performance-based restricted stock awards and performance share units granted under the plans.
|
|
|
Restricted Stock |
|
|
Performance-Based |
|
|
Performance |
|
||||||||||||||||||
|
|
|
Awards and Units |
|
|
Restricted Stock Awards |
|
|
Share Units |
|
||||||||||||||||||
|
|
|
Awards and Units |
|
|
Weighted Average Grant-Date Fair Value |
|
|
Awards |
|
|
Weighted Average Grant-Date Fair Value |
|
|
Units |
|
|
|
|
|
Weighted Average Grant-Date Fair Value |
|
||||||
|
|
|
(Thousands, except fair value data) |
|
||||||||||||||||||||||||
|
Unvested at 12/31/18 |
|
|
|
|
|
$ |
|
|
|
|
|
|
|
$ |
|
|
|
|
|
|
|
|
|
|
$ |
|
|
|
Granted |
|
|
|
|
|
$ |
|
|
|
|
— |
|
|
$ |
— |
|
|
|
|
|
|
|
|
|
$ |
|
|
|
Vested |
|
|
( |
) |
|
$ |
|
|
|
|
( |
) |
|
$ |
|
|
|
|
( |
) |
|
|
|
|
$ |
|
|
|
Forfeited |
|
|
( |
) |
|
$ |
|
|
|
|
— |
|
|
$ |
— |
|
|
|
( |
) |
|
|
|
|
$ |
|
|
|
Unvested at 12/31/19 |
|
|
|
|
|
$ |
|
|
|
|
|
|
|
$ |
|
|
|
|
|
|
|
(1 |
) |
|
$ |
|
|
|
(1) |
|
The following table presents the aggregate fair value of awards and units that vested during the indicated period.
|
|
|
2019 |
|
|
2018 |
|
|
2017 |
|
|||
|
Restricted Stock Awards and Units |
|
$ |
|
|
|
$ |
|
|
|
$ |
|
|
|
Performance-Based Restricted Stock Awards |
|
$ |
|
|
|
$ |
|
|
|
$ |
|
|
|
Performance Share Units |
|
$ |
|
|
|
$ |
|
|
|
$ |
|
|
The following table presents the unrecognized compensation cost and the related weighted average recognition period associated with unvested awards and units as of December 31, 2019.
|
|
|
|
|
|
|
Performance-Based |
|
|
|
|
|
|
|
|
|
Restricted Stock |
|
|
Restricted Stock |
|
|
Performance |
|
|||
|
|
|
Awards and Units |
|
|
Awards |
|
|
Share Units |
|
|||
|
Unrecognized compensation cost |
|
$ |
|
|
|
$ |
— |
|
|
$ |
|
|
|
Weighted average period for recognition (years) |
|
|
|
|
|
|
|
|
|
|
|
|
68
DEVON ENERGY CORPORATION AND SUBSIDIARIES
NOTES TO CONSOLIDATED FINANCIAL STATEMENTS – (Continued)
Restricted Stock Awards and Units
Restricted stock awards and units are subject to the terms, conditions, restrictions and limitations, if any, that the Compensation Committee deems appropriate, including restrictions on continued employment. Generally, the service requirement for vesting ranges from one to
Performance-Based Restricted Stock Awards
Performance-based restricted stock awards were granted to certain members of Devon’s senior management. Vesting of the awards is dependent on Devon meeting certain internal performance targets and the recipient meeting certain service requirements. Generally, the service requirement for vesting ranges from one to
Performance Share Units
Performance share units are granted to certain members of Devon’s management and employees. Each unit that vests entitles the recipient to one share of Devon common stock. The vesting of these units is based on comparing Devon’s TSR to the TSR of a predetermined group of
At the end of the vesting period, recipients receive dividend equivalents with respect to the number of units vested. The fair value of each performance share unit is estimated as of the date of grant using a Monte Carlo simulation with the following assumptions used for all grants made under the plan: (i) a risk-free interest rate based on U.S. Treasury rates as of the grant date; (ii) a volatility assumption based on the historical realized price volatility of Devon and the designated peer group; and (iii) an estimated ranking of Devon among the designated peer group. The fair value of the unit on the date of grant is expensed over the applicable vesting period. The following table presents the assumptions related to performance share units granted.
|
|
|
2019 |
|
|
2018 |
|
|
2017 |
|
|||||||||||||||||||||
|
Grant-date fair value |
|
$ |
|
|
|
— |
|
$ |
|
|
|
$ |
|
|
|
— |
|
$ |
|
|
|
$ |
|
|
|
— |
|
$ |
|
|
|
Risk-free interest rate |
|
|
|
|
|
|
|
|
|
|||||||||||||||||||||
|
Volatility factor |
|
|
|
|
|
|
|
|
|
|||||||||||||||||||||
|
Contractual term (years) |
|
|
|
|
|
|
|
|
|
|||||||||||||||||||||
69
DEVON ENERGY CORPORATION AND SUBSIDIARIES
NOTES TO CONSOLIDATED FINANCIAL STATEMENTS – (Continued)
|
5. |
Asset Impairments |
The following table presents a summary of Devon’s asset impairments. Unproved impairments shown below are included in exploration expenses in the consolidated statements of comprehensive earnings.
|
|
|
Year Ended December 31, |
|
|||||||||
|
|
|
2019 |
|
|
2018 |
|
|
2017 |
|
|||
|
Proved oil and gas assets |
|
$ |
— |
|
|
$ |
|
|
|
$ |
— |
|
|
Other assets |
|
|
— |
|
|
|
|
|
|
|
— |
|
|
Total asset impairments |
|
$ |
— |
|
|
$ |
|
|
|
$ |
— |
|
|
|
|
|
|
|
|
|
|
|
|
|
|
|
|
Unproved impairments |
|
$ |
|
|
|
$ |
|
|
|
$ |
|
|
Proved Oil and Gas and Other Asset Impairments
In 2018, Devon recognized $
Unproved Impairments
In 2019, 2018 and 2017, Devon allowed certain non-core acreage to expire without plans for development resulting in unproved impairments.
|
6. |
Restructuring and Transaction Costs |
2019 Workforce Reductions
During the first quarter of 2019, Devon announced workforce reductions and other initiatives designed to enhance its operational focus and cost structure in conjunction with the portfolio transformation announcement further discussed in Note 2. As a result, Devon recognized $
Prior Years’ Restructurings
During 2018, Devon recognized $
The following table summarizes Devon’s restructuring liabilities presented in the accompanying consolidated balance sheets.
70
DEVON ENERGY CORPORATION AND SUBSIDIARIES
NOTES TO CONSOLIDATED FINANCIAL STATEMENTS – (Continued)
|
|
|
Other |
|
|
Other |
|
|
|
|
|
||
|
|
|
Current |
|
|
Long-term |
|
|
|
|
|
||
|
|
|
Liabilities |
|
|
Liabilities |
|
|
Total |
|
|||
|
Balance as of December 31, 2017 |
|
$ |
|
|
|
$ |
|
|
|
$ |
|
|
|
Changes related to prior years' restructurings |
|
|
|
|
|
|
( |
) |
|
|
|
|
|
Balance as of December 31, 2018 |
|
$ |
|
|
|
$ |
|
|
|
$ |
|
|
|
Changes due to 2019 workforce reductions |
|
|
|
|
|
|
— |
|
|
|
|
|
|
Changes related to prior years' restructurings |
|
|
( |
) |
|
|
( |
) |
|
|
( |
) |
|
Balance as of December 31, 2019 |
|
$ |
|
|
|
$ |
|
|
|
$ |
|
|
|
7. |
Income Taxes |
Income Tax Expense (Benefit)
The following table presents Devon’s income tax components.
|
|
|
Year Ended December 31, |
|
|||||||||
|
|
|
2019 |
|
|
2018 |
|
|
2017 |
|
|||
|
Current income tax expense (benefit): |
|
|
|
|
|
|
|
|
|
|
|
|
|
U.S. federal |
|
$ |
( |
) |
|
$ |
( |
) |
|
$ |
|
|
|
Various states |
|
|
( |
) |
|
|
( |
) |
|
|
|
|
|
Total current income tax expense (benefit) |
|
|
( |
) |
|
|
( |
) |
|
|
|
|
|
Deferred income tax expense (benefit): |
|
|
|
|
|
|
|
|
|
|
|
|
|
U.S. federal |
|
|
|
|
|
|
|
|
|
|
( |
) |
|
Various states |
|
|
( |
) |
|
|
|
|
|
|
— |
|
|
Total deferred income tax expense (benefit) |
|
|
( |
) |
|
|
|
|
|
|
( |
) |
|
Total income tax expense (benefit) |
|
$ |
( |
) |
|
$ |
|
|
|
$ |
|
|
Total income tax expense differed from the amounts computed by applying the U.S. federal income tax rate to earnings (loss) from continuing operations before income taxes as a result of the following:
|
|
|
Year Ended December 31, |
|
|||||||||
|
|
|
2019 |
|
|
2018 |
|
|
2017 |
|
|||
|
Earnings (loss) from continuing operations before income taxes |
|
$ |
( |
) |
|
$ |
|
|
|
$ |
|
|
|
|
|
|
|
|
|
|
|
|
|
|
|
|
|
U.S. statutory income tax rate |
|
|
|
% |
|
|
|
% |
|
|
|
% |
|
U.S. Tax Reform |
|
|
|
% |
|
|
|
% |
|
|
|
% |
|
State income taxes |
|
|
|
% |
|
|
|
% |
|
|
( |
%) |
|
Change in unrecognized tax benefits |
|
|
( |
%) |
|
|
( |
%) |
|
|
( |
%) |
|
Audit settlements |
|
|
|
% |
|
|
( |
%) |
|
|
|
% |
|
Other |
|
|
( |
%) |
|
|
|
% |
|
|
|
% |
|
Deferred tax asset valuation allowance |
|
|
|
% |
|
|
|
% |
|
|
( |
%) |
|
Effective income tax rate |
|
|
|
% |
|
|
|
% |
|
|
|
% |
71
DEVON ENERGY CORPORATION AND SUBSIDIARIES
NOTES TO CONSOLIDATED FINANCIAL STATEMENTS – (Continued)
Devon and its subsidiaries are subject to U.S. federal income tax as well as income or capital taxes in various state and foreign jurisdictions. Devon’s tax reserves are related to tax years that may be subject to examinations by the relevant taxing authority. Devon is under audit in the U.S. and various foreign jurisdictions as part of its normal course of business.
Devon assesses the realizability of its deferred tax assets. If Devon concludes that it is more likely than not that some portion or all of the deferred tax assets will not be realized, the asset is reduced by a valuation allowance. Numerous judgments and assumptions are inherent in the determination of future taxable income, including factors such as future operating conditions (particularly as related to prevailing oil and gas prices) and changing tax laws.
2019
In December 2019, Devon announced the sale of its Barnett Shale assets. This transaction is expected to close in the second quarter of 2020. Devon expects no incremental cash taxes associated with the divestiture of these assets.
On
Devon has recorded materially all tax impacts related to the Barnett Shale and Canadian assets in discontinued operations. Additional information on these discontinued operations can be found in Note 18.
During 2019, Devon recorded a tax expense of $
In the fourth quarter of 2019, Devon entered into an audit agreement with the Canada Revenue Agency. The Canadian income tax expense resulting from this agreement is reflected in discontinued operations. However, the agreement also resulted in a $
The “other” effect is composed of permanent differences, including stock compensation, for which the dollar amounts do not increase or decrease in relation to the change in pre-tax earnings. Generally, permanent adjustments, as well as the state income tax, have an insignificant impact on Devon’s effective income tax rate. However, these items had a more noticeable impact to the rate in 2019 due to the low relative net loss in the period.
2018
Through the first six months of 2018, Devon maintained a
72
DEVON ENERGY CORPORATION AND SUBSIDIARIES
NOTES TO CONSOLIDATED FINANCIAL STATEMENTS – (Continued)
$
2017
The Tax Reform Legislation, enacted on December 22, 2017, contained several key tax provisions that affected Devon, including a one-time mandatory transition tax on accumulated foreign earnings and a reduction of the corporate income tax rate to
During 2017, Devon recorded a tax benefit of $
Devon maintained a
Deferred Tax Assets and Liabilities
The following table presents the tax effects of temporary differences that gave rise to Devon’s deferred tax assets and liabilities.
|
|
|
December 31, |
|
|||||
|
|
|
2019 |
|
|
2018 |
|
||
|
Deferred tax assets: |
|
|
|
|
|
|
|
|
|
Asset retirement obligations |
|
$ |
|
|
|
$ |
|
|
|
Accrued liabilities |
|
|
|
|
|
|
|
|
|
Net operating loss carryforwards |
|
|
|
|
|
|
|
|
|
Pension benefit obligations |
|
|
|
|
|
|
|
|
|
Tax credits and other |
|
|
|
|
|
|
|
|
|
Total deferred tax assets before valuation allowance |
|
|
|
|
|
|
|
|
|
Less: valuation allowance |
|
|
( |
) |
|
|
( |
) |
|
Net deferred tax assets |
|
|
|
|
|
|
|
|
|
Deferred tax liabilities: |
|
|
|
|
|
|
|
|
|
Property and equipment |
|
|
( |
) |
|
|
( |
) |
|
Other |
|
|
( |
) |
|
|
( |
) |
|
Total deferred tax liabilities |
|
|
( |
) |
|
|
( |
) |
|
Net deferred tax liability |
|
$ |
( |
) |
|
$ |
( |
) |
At December 31, 2019, Devon has recognized $
73
DEVON ENERGY CORPORATION AND SUBSIDIARIES
NOTES TO CONSOLIDATED FINANCIAL STATEMENTS – (Continued)
Unrecognized Tax Benefits
The following table presents changes in Devon’s unrecognized tax benefits.
|
|
|
December 31, |
|
|||||
|
|
|
2019 |
|
|
2018 |
|
||
|
Balance at beginning of year |
|
$ |
|
|
|
$ |
|
|
|
Tax positions taken in prior periods |
|
|
|
|
|
|
( |
) |
|
Balance at end of year |
|
$ |
|
|
|
$ |
|
|
Devon recognized a net interest benefit of $
|
Jurisdiction |
|
Tax Years Open |
|
U.S. Federal |
|
|
|
Various U.S. states |
|
|
Certain statute of limitation expirations are scheduled to occur in the next twelve months. However, Devon is currently in various stages of the administrative review process for certain open tax years. In addition, Devon is currently subject to various income tax audits that have not reached the administrative review process.
|
8. |
Net Earnings (Loss) Per Share from Continuing Operations |
The following table reconciles net earnings (loss) from continuing operations and weighted-average common shares outstanding used in the calculations of basic and diluted net earnings (loss) per share from continuing operations.
|
|
|
Year Ended December 31, |
|
|||||||||
|
|
|
2019 |
|
|
2018 |
|
|
2017 |
|
|||
|
Net earnings (loss) from continuing operations: |
|
|
|
|
|
|
|
|
|
|
|
|
|
Net earnings (loss) from continuing operations |
|
$ |
( |
) |
|
$ |
|
|
|
$ |
|
|
|
Attributable to participating securities |
|
|
( |
) |
|
|
( |
) |
|
|
( |
) |
|
Basic and diluted earnings (loss) from continuing operations |
|
$ |
( |
) |
|
$ |
|
|
|
$ |
|
|
|
Common shares: |
|
|
|
|
|
|
|
|
|
|
|
|
|
Common shares outstanding - total |
|
|
|
|
|
|
|
|
|
|
|
|
|
Attributable to participating securities |
|
|
( |
) |
|
|
( |
) |
|
|
( |
) |
|
Common shares outstanding - basic |
|
|
|
|
|
|
|
|
|
|
|
|
|
Dilutive effect of potential common shares issuable |
|
|
— |
|
|
|
|
|
|
|
— |
|
|
Common shares outstanding - diluted |
|
|
|
|
|
|
|
|
|
|
|
|
|
Net earnings (loss) per share from continuing operations: |
|
|
|
|
|
|
|
|
|
|
|
|
|
Basic |
|
$ |
( |
) |
|
$ |
|
|
|
$ |
|
|
|
Diluted |
|
$ |
( |
) |
|
$ |
|
|
|
$ |
|
|
|
Antidilutive options (1) |
|
|
|
|
|
|
|
|
|
|
|
|
|
(1) |
|
74
DEVON ENERGY CORPORATION AND SUBSIDIARIES
NOTES TO CONSOLIDATED FINANCIAL STATEMENTS – (Continued)
|
9. |
Other Comprehensive Earnings |
Components of other comprehensive earnings consist of the following:
|
|
|
Year Ended December 31, |
|
|||||||||
|
|
|
2019 |
|
|
2018 |
|
|
2017 |
|
|||
|
Foreign currency translation: |
|
|
|
|
|
|
|
|
|
|
|
|
|
Beginning accumulated foreign currency translation and other |
|
$ |
|
|
|
$ |
|
|
|
$ |
|
|
|
Change in cumulative translation adjustment |
|
|
|
|
|
|
( |
) |
|
|
|
|
|
Release of Canadian cumulative translation adjustment (1) |
|
|
( |
) |
|
|
— |
|
|
|
— |
|
|
Income tax benefit (expense) |
|
|
— |
|
|
|
|
|
|
|
( |
) |
|
Other |
|
|
— |
|
|
|
|
|
|
|
— |
|
|
Ending accumulated foreign currency translation and other |
|
|
— |
|
|
|
|
|
|
|
|
|
|
Pension and postretirement benefit plans: |
|
|
|
|
|
|
|
|
|
|
|
|
|
Beginning accumulated pension and postretirement benefits |
|
|
( |
) |
|
|
( |
) |
|
|
( |
) |
|
Net actuarial loss (gain) and prior service cost arising in current year |
|
|
( |
) |
|
|
( |
) |
|
|
|
|
|
Recognition of net actuarial loss and prior service cost in earnings (2) |
|
|
|
|
|
|
|
|
|
|
|
|
|
Curtailment and settlement of pension benefits |
|
|
|
|
|
|
|
|
|
|
— |
|
|
Income tax expense |
|
|
( |
) |
|
|
( |
) |
|
|
— |
|
|
Other (3) |
|
|
— |
|
|
|
( |
) |
|
|
— |
|
|
Ending accumulated pension and postretirement benefits |
|
|
( |
) |
|
|
( |
) |
|
|
( |
) |
|
Accumulated other comprehensive earnings (loss), net of tax |
|
$ |
( |
) |
|
$ |
|
|
|
$ |
|
|
|
(1) |
|
|
(2) |
|
|
(3) |
|
|
10. |
Supplemental Information to Statements of Cash Flows |
|
|
|
Year Ended December 31, |
|
|||||||||
|
|
|
2019 |
|
|
2018 |
|
|
2017 |
|
|||
|
Changes in assets and liabilities, net: |
|
|
|
|
|
|
|
|
|
|
|
|
|
Accounts receivable |
|
$ |
( |
) |
|
$ |
( |
) |
|
$ |
( |
) |
|
Other current assets |
|
|
( |
) |
|
|
( |
) |
|
|
|
|
|
Other long-term assets |
|
|
|
|
|
|
( |
) |
|
|
( |
) |
|
Accounts payable |
|
|
( |
) |
|
|
( |
) |
|
|
|
|
|
Revenues and royalties payable |
|
|
|
|
|
|
|
|
|
|
|
|
|
Other current liabilities |
|
|
( |
) |
|
|
|
|
|
|
( |
) |
|
Other long-term liabilities |
|
|
|
|
|
|
( |
) |
|
|
( |
) |
|
Total |
|
$ |
( |
) |
|
$ |
( |
) |
|
$ |
|
|
|
Supplementary cash flow data - total operations: |
|
|
|
|
|
|
|
|
|
|
|
|
|
Interest paid (net of capitalized interest) |
|
$ |
|
|
|
$ |
|
|
|
$ |
|
|
|
Income taxes paid |
|
$ |
|
|
|
$ |
|
|
|
$ |
|
|
75
DEVON ENERGY CORPORATION AND SUBSIDIARIES
NOTES TO CONSOLIDATED FINANCIAL STATEMENTS – (Continued)
|
11. |
Accounts Receivable |
Components of accounts receivable include the following:
|
|
|
December 31, 2019 |
|
|
December 31, 2018 |
|
||
|
Oil, gas and NGL sales |
|
$ |
|
|
|
$ |
|
|
|
Joint interest billings |
|
|
|
|
|
|
|
|
|
Marketing and midstream revenues |
|
|
|
|
|
|
|
|
|
Other |
|
|
|
|
|
|
|
|
|
Gross accounts receivable |
|
|
|
|
|
|
|
|
|
Allowance for doubtful accounts |
|
|
( |
) |
|
|
( |
) |
|
Net accounts receivable |
|
$ |
|
|
|
$ |
|
|
12.Property, Plant and Equipment
Capitalized Costs
The following table reflects the aggregate capitalized costs related to Devon’s oil and gas and non-oil and gas activities.
|
|
|
December 31, 2019 |
|
|
December 31, 2018 |
|
||
|
Property and equipment: |
|
|
|
|
|
|
|
|
|
Proved |
|
$ |
|
|
|
$ |
|
|
|
Unproved and properties under development |
|
|
|
|
|
|
|
|
|
Total oil and gas |
|
|
|
|
|
|
|
|
|
Less accumulated DD&A |
|
|
( |
) |
|
|
( |
) |
|
Oil and gas property and equipment, net |
|
|
|
|
|
|
|
|
|
Other property and equipment |
|
|
|
|
|
|
|
|
|
Less accumulated DD&A |
|
|
( |
) |
|
|
( |
) |
|
Other property and equipment, net (1) |
|
|
|
|
|
|
|
|
|
Property and equipment, net |
|
$ |
|
|
|
$ |
|
|
|
(1) |
$ |
Suspended Exploratory Well Costs
The following summarizes the changes in suspended exploratory well costs for the three years ended December 31, 2019.
|
|
|
Year Ended December 31, |
|
|||||||||
|
|
|
2019 |
|
|
2018 |
|
|
2017 |
|
|||
|
Beginning balance |
|
$ |
|
|
|
$ |
|
|
|
$ |
|
|
|
Additions pending determination of proved reserves |
|
|
|
|
|
|
|
|
|
|
|
|
|
Reclassifications to proved properties |
|
|
( |
) |
|
|
( |
) |
|
|
( |
) |
|
Ending balance |
|
$ |
|
|
|
$ |
|
|
|
$ |
|
|
Devon had no projects with suspended exploratory well costs capitalized for a period greater than one year since the completion of drilling as of December 31, 2019, 2018 and 2017, respectively.
76
DEVON ENERGY CORPORATION AND SUBSIDIARIES
NOTES TO CONSOLIDATED FINANCIAL STATEMENTS – (Continued)
|
13. |
Debt and Related Expenses |
|
|
|
December 31, 2019 |
|
|
December 31, 2018 |
|
||
|
|
|
|
|
|
|
|
|
|
|
|
|
$ |
— |
|
|
$ |
|
|
|
|
|
|
|
|
|
|
|
|
|
|
|
|
|
|
|
|
|
|
|
|
|
|
|
|
|
|
|
|
|
|
|
|
|
|
|
|
|
|
|
|
|
|
|
|
|
|
|
|
|
|
|
|
|
|
|
|
|
|
|
|
|
|
|
|
|
|
|
|
|
Net discount on debentures and notes |
|
|
( |
) |
|
|
( |
) |
|
Debt issuance costs |
|
|
( |
) |
|
|
( |
) |
|
Total debt |
|
|
|
|
|
|
|
|
|
Less amount classified as short-term debt |
|
|
— |
|
|
|
|
|
|
Total long-term debt (4) |
|
$ |
|
|
|
$ |
|
|
|
(1) |
|
|
(2) |
|
|
(3) |
|
|
(4) |
|
As noted in the table above, as of December 31, 2019, Devon does not have any outstanding debt maturities due within the next five years.
77
DEVON ENERGY CORPORATION AND SUBSIDIARIES
NOTES TO CONSOLIDATED FINANCIAL STATEMENTS – (Continued)
Credit Lines
Devon has a $
In connection with the closing of the sale of its Canadian business, Devon reallocated and terminated all Canadian commitments under the Senior Credit Facility in accordance with the terms of the credit agreement governing the Senior Credit Facility. The termination of the Canadian subfacility was effective as of June 27, 2019, and such termination did not decrease the $
The Senior Credit Facility contains only one material financial covenant. This covenant requires Devon’s ratio of total funded debt to total capitalization, as defined in the credit agreement, to be no greater than
Commercial Paper
Devon’s Senior Credit Facility supports its $
Retirement of Senior Notes
In January 2019, Devon repaid the $
During 2018, Devon completed tender offers to repurchase $
78
DEVON ENERGY CORPORATION AND SUBSIDIARIES
NOTES TO CONSOLIDATED FINANCIAL STATEMENTS – (Continued)
Financing Costs, Net
The following schedule includes the components of net financing costs.
|
|
|
Year Ended December 31, |
|
|||||||||
|
|
|
2019 |
|
|
2018 |
|
|
2017 |
|
|||
|
Interest based on debt outstanding |
|
$ |
|
|
|
$ |
|
|
|
$ |
|
|
|
Early retirement of debt |
|
|
— |
|
|
|
|
|
|
|
— |
|
|
Other |
|
|
( |
) |
|
|
( |
) |
|
|
( |
) |
|
Total net financing costs |
|
$ |
|
|
|
$ |
|
|
|
$ |
|
|
|
14. |
Leases |
Devon adopted ASU No. 2016-02, Leases (Topic 842), as of January 1, 2019, using the modified retrospective transition approach. ASC 842 supersedes the previous lease accounting requirements in ASC 840 and requires lessees to recognize leases on-balance sheet and disclose key information about leasing arrangements. ASC 842 establishes a right-of-use model that requires a lessee to recognize a right-of-use asset and lease liability on the balance sheet for all leases with a term longer than 12 months. At adoption, using the modified retrospective transition approach, Devon recorded right-of-use lease assets of $
Devon made certain significant assumptions and judgments in determining its right-of-use asset and lease liability balances. First is the determination of whether a contract contains a lease. Devon considered the presence of an identified asset that is physically distinct, and for which the supplier does not have substantive substitution rights and whether Devon has the right to control the underlying asset. Second, Devon assessed lease terms and considered whether Devon is reasonably certain to extend leases or exercise purchase options. Certain of Devon’s leases include one or more options to renew, with renewal terms that can extend the lease term for additional years. Certain leases also include options to purchase the leased property. For options to renew or purchase that Devon is reasonably certain to exercise, these costs are recognized as part of the right-of-use assets and lease liabilities. Third, significant judgments have been made in determining discount rates. Devon estimates discount rates using market rates that approximate collateralized borrowings over the remaining term of Devon’s lease payments.
Devon’s right-of-use operating lease assets are for certain leases related to real estate, drilling rigs and other equipment related to the exploration, development and production of oil and gas. Devon’s right-of-use financing lease assets are related to real estate. Certain of Devon’s lease agreements include variable payments based on usage or rental payments adjusted periodically for inflation. Devon’s lease agreements do not contain any material residual value guarantees or restrictive covenants.
79
DEVON ENERGY CORPORATION AND SUBSIDIARIES
NOTES TO CONSOLIDATED FINANCIAL STATEMENTS – (Continued)
The following table presents Devon’s right-of-use assets and lease liabilities as of December 31, 2019.
|
|
|
Finance |
|
|
Operating |
|
|
Total |
|
|||
|
Right-of-use assets |
|
$ |
|
|
|
$ |
|
|
|
$ |
|
|
|
Lease liabilities: |
|
|
|
|
|
|
|
|
|
|
|
|
|
Current lease liabilities (1) |
|
$ |
|
|
|
$ |
|
|
|
$ |
|
|
|
Long-term lease liabilities |
|
|
|
|
|
|
|
|
|
|
|
|
|
Total lease liabilities |
|
$ |
|
|
|
$ |
|
|
|
$ |
|
|
|
(1) |
|
The following table presents Devon’s total lease cost.
|
|
|
|
Year Ended |
|
|
|
|
|
|
December 31, 2019 |
|
|
|
Operating lease cost |
Property, plant and equipment; G&A |
|
$ |
|
|
|
Short-term lease cost (1) |
Property, plant and equipment; G&A |
|
|
|
|
|
Financing lease cost: |
|
|
|
|
|
|
Amortization of right-of-use assets |
DD&A |
|
|
|
|
|
Interest on lease liabilities |
Net financing costs |
|
|
|
|
|
Variable lease cost |
G&A |
|
|
|
|
|
Lease income |
G&A |
|
|
( |
) |
|
Net lease cost |
|
|
$ |
|
|
|
(1) |
|
The following table presents Devon’s additional lease information for the year ended December 31, 2019.
|
|
|
Year Ended December 31, 2019 |
|
|||||
|
|
|
Finance |
|
|
Operating |
|
||
|
Cash outflows for lease liabilities: |
|
|
|
|
|
|
|
|
|
Operating cash flows |
|
$ |
|
|
|
$ |
|
|
|
Investing cash flows |
|
$ |
— |
|
|
$ |
|
|
|
Right-of-use assets obtained in exchange for new lease liabilities |
|
$ |
— |
|
|
$ |
|
|
|
Weighted average remaining lease term (years) |
|
|
|
|
|
|
|
|
|
Weighted average discount rate |
|
|
|
% |
|
|
|
% |
80
DEVON ENERGY CORPORATION AND SUBSIDIARIES
NOTES TO CONSOLIDATED FINANCIAL STATEMENTS – (Continued)
The following table presents Devon’s maturity analysis as of December 31, 2019 for leases expiring in each of the next 5 years and thereafter.
|
|
|
Finance |
|
|
Operating |
|
|
Total (1) |
|
|||
|
2020 |
|
$ |
|
|
|
$ |
|
|
|
$ |
|
|
|
2021 |
|
|
|
|
|
|
|
|
|
|
|
|
|
2022 |
|
|
|
|
|
|
|
|
|
|
|
|
|
2023 |
|
|
|
|
|
|
|
|
|
|
|
|
|
2024 |
|
|
|
|
|
|
|
|
|
|
|
|
|
Thereafter |
|
|
|
|
|
|
|
|
|
|
|
|
|
Total lease payments |
|
|
|
|
|
|
|
|
|
|
|
|
|
Less: interest |
|
|
( |
) |
|
|
( |
) |
|
|
( |
) |
|
Present value of lease liabilities |
|
$ |
|
|
|
$ |
|
|
|
$ |
|
|
|
(1) |
|
Devon rents or subleases certain real estate to third parties. The following table presents Devon’s expected lease income as of December 31, 2019 for each of the next 5 years and thereafter.
|
|
|
Operating |
|
|
|
|
|
Lease Income |
|
|
|
2020 |
|
$ |
|
|
|
2021 |
|
|
|
|
|
2022 |
|
|
|
|
|
2023 |
|
|
|
|
|
2024 |
|
|
|
|
|
Thereafter |
|
|
|
|
|
Total |
|
$ |
|
|
|
15. |
Asset Retirement Obligations |
The following table presents the changes in asset retirement obligations.
|
|
|
Year Ended December 31, |
|
|||||
|
|
|
2019 |
|
|
2018 |
|
||
|
Asset retirement obligations as of beginning of period |
|
$ |
|
|
|
$ |
|
|
|
Liabilities incurred |
|
|
|
|
|
|
|
|
|
Liabilities settled and divested |
|
|
( |
) |
|
|
( |
) |
|
Revision of estimated obligation |
|
|
( |
) |
|
|
( |
) |
|
Accretion expense on discounted obligation |
|
|
|
|
|
|
|
|
|
Asset retirement obligations as of end of period |
|
|
|
|
|
|
|
|
|
Less current portion |
|
|
|
|
|
|
|
|
|
Asset retirement obligations, long-term |
|
$ |
|
|
|
$ |
|
|
During 2019, Devon reduced its asset retirement obligations by $
81
DEVON ENERGY CORPORATION AND SUBSIDIARIES
NOTES TO CONSOLIDATED FINANCIAL STATEMENTS – (Continued)
retirement obligations by $
During 2018, Devon reduced its asset retirement obligations by $
|
16. |
Retirement Plans |
Defined Contribution Plans
Devon sponsors defined contribution plans covering its employees. Such plans include its 401(k) plan and enhanced contribution plan. Contributions are primarily based upon percentages of annual compensation and years of service. In addition, each plan is subject to regulatory limitations by the U.S. government. Devon contributed $
Defined Benefit Plans
Devon has various non-contributory defined benefit pension plans, including qualified plans and nonqualified plans covering eligible employees and former employees meeting certain age and service requirements. Benefits under the defined benefit plans have been closed to new employees; however, eligible employees continue to accrue benefits based upon years of service and compensation. Benefits are primarily funded from assets held in the plans’ trusts.
Devon’s investment objective for its plans’ assets is to achieve stability of the funded status while providing long-term growth of invested capital and income to ensure benefit payments can be funded when required. Devon has established certain investment strategies, including target allocation percentages and permitted and prohibited investments, designed to mitigate risks inherent with investing. Devon’s target allocations for its plan assets are
Fixed-income – Devon’s fixed-income securities consist of U.S. Treasury obligations, bonds issued by investment-grade companies from diverse industries and asset-backed securities. These fixed-income securities are actively traded securities that can be redeemed upon demand. The fair values of these Level 1 securities are based upon quoted market prices and were $
Equity – Devon’s equity securities include commingled global equity funds that invest in large, mid and small capitalization stocks across the world’s developed and emerging markets and international large cap equity securities. These equity securities can be sold on demand but are not actively traded. The fair values of these securities are based upon the net asset values provided by the investment managers and were $
Other – Devon’s other securities include short-term investment funds and a hedge fund that invest both long and short term using a variety of investment strategies. The fair value of these securities is based upon the net asset values provided by investment managers and were $
82
DEVON ENERGY CORPORATION AND SUBSIDIARIES
NOTES TO CONSOLIDATED FINANCIAL STATEMENTS – (Continued)
Defined Postretirement Plans
Devon also has defined benefit postretirement plans that provide benefits for substantially all qualifying retirees. Benefit obligations for such plans are estimated based on Devon’s future cost-sharing intentions. Devon’s funding policy for the plans is to fund the benefits as they become payable with available cash and cash equivalents.
Benefit Obligations and Funded Status
The following table summarizes the benefit obligations, assets, funded status and balance sheet impacts associated with its defined pension and postretirement plans. Devon’s benefit obligations and plan assets are measured each year as of December 31. The accumulated benefit obligation for pension plans approximated the projected benefit obligation at December 31, 2019 and 2018.
|
|
|
Pension Benefits |
|
|
Postretirement Benefits |
|
||||||||||
|
|
|
2019 |
|
|
2018 |
|
|
2019 |
|
|
2018 |
|
||||
|
Change in benefit obligation: |
|
|
|
|
|
|
|
|
|
|
|
|
|
|
|
|
|
Benefit obligation at beginning of year |
|
$ |
|
|
|
$ |
|
|
|
$ |
|
|
|
$ |
|
|
|
Service cost |
|
|
|
|
|
|
|
|
|
|
— |
|
|
|
— |
|
|
Interest cost |
|
|
|
|
|
|
|
|
|
|
— |
|
|
|
— |
|
|
Actuarial loss (gain) |
|
|
|
|
|
|
( |
) |
|
|
( |
) |
|
|
( |
) |
|
Plan amendments |
|
|
|
|
|
|
— |
|
|
|
— |
|
|
|
— |
|
|
Plan curtailments |
|
|
( |
) |
|
|
|
|
|
|
|
|
|
|
|
|
|
Plan settlements |
|
|
( |
) |
|
|
( |
) |
|
|
— |
|
|
|
— |
|
|
Participant contributions |
|
|
— |
|
|
|
— |
|
|
|
|
|
|
|
|
|
|
Benefits paid |
|
|
( |
) |
|
|
( |
) |
|
|
( |
) |
|
|
( |
) |
|
Benefit obligation at end of year |
|
|
|
|
|
|
|
|
|
|
|
|
|
|
|
|
|
Change in plan assets: |
|
|
|
|
|
|
|
|
|
|
|
|
|
|
|
|
|
Fair value of plan assets at beginning of year |
|
|
|
|
|
|
|
|
|
|
— |
|
|
|
— |
|
|
Actual return on plan assets |
|
|
|
|
|
|
( |
) |
|
|
— |
|
|
|
— |
|
|
Employer contributions |
|
|
|
|
|
|
|
|
|
|
|
|
|
|
|
|
|
Participant contributions |
|
|
— |
|
|
|
— |
|
|
|
|
|
|
|
|
|
|
Plan settlements |
|
|
( |
) |
|
|
( |
) |
|
|
— |
|
|
|
— |
|
|
Benefits paid |
|
|
( |
) |
|
|
( |
) |
|
|
( |
) |
|
|
( |
) |
|
Fair value of plan assets at end of year |
|
|
|
|
|
|
|
|
|
|
— |
|
|
|
— |
|
|
Funded status at end of year |
|
$ |
( |
) |
|
$ |
( |
) |
|
$ |
( |
) |
|
$ |
( |
) |
|
Amounts recognized in balance sheet: |
|
|
|
|
|
|
|
|
|
|
|
|
|
|
|
|
|
Other current liabilities |
|
$ |
( |
) |
|
$ |
( |
) |
|
$ |
( |
) |
|
$ |
( |
) |
|
Other long-term liabilities |
|
|
( |
) |
|
|
( |
) |
|
|
( |
) |
|
|
( |
) |
|
Net amount |
|
$ |
( |
) |
|
$ |
( |
) |
|
$ |
( |
) |
|
$ |
( |
) |
|
Amounts recognized in accumulated other comprehensive earnings: |
|
|
|
|
|
|
|
|
|
|
|
|
|
|
|
|
|
Net actuarial loss (gain) |
|
$ |
|
|
|
$ |
|
|
|
$ |
( |
) |
|
$ |
( |
) |
|
Prior service cost (credit) |
|
|
|
|
|
|
|
|
|
|
( |
) |
|
|
( |
) |
|
Total |
|
$ |
|
|
|
$ |
|
|
|
$ |
( |
) |
|
$ |
( |
) |
During the third quarter of 2018, Devon entered into a group annuity contract, under which a third party has permanently assumed certain of Devon’s defined benefit pension obligations. The purchase of this group annuity contract reduced Devon’s pension assets and liabilities and is the primary component of the $
83
DEVON ENERGY CORPORATION AND SUBSIDIARIES
NOTES TO CONSOLIDATED FINANCIAL STATEMENTS – (Continued)
settlements within the preceding table. In connection with the group annuity contract transaction, Devon recorded a settlement expense of approximately $
Certain of Devon’s pension plans have a combined projected benefit obligation or accumulated benefit obligation in excess of plan assets at December 31, 2019 and December 31, 2018, as presented in the table below.
|
|
|
December 31, |
|
|||||
|
|
|
2019 |
|
|
2018 |
|
||
|
Projected benefit obligation |
|
$ |
|
|
|
$ |
|
|
|
Accumulated benefit obligation (1) |
|
$ |
|
|
|
$ |
|
|
|
Fair value of plan assets |
|
$ |
|
|
|
$ |
|
|
|
(1) |
|
The following table presents the components of net periodic benefit cost and other comprehensive earnings.
|
|
|
Pension Benefits |
|
|
Postretirement Benefits |
|
||||||||||||||||||
|
|
|
2019 |
|
|
2018 |
|
|
2017 |
|
|
2019 |
|
|
2018 |
|
|
2017 |
|
||||||
|
Net periodic benefit cost: |
|
|
|
|
|
|
|
|
|
|
|
|
|
|
|
|
|
|
|
|
|
|
|
|
|
Service cost |
|
$ |
|
|
|
$ |
|
|
|
$ |
|
|
|
$ |
— |
|
|
$ |
— |
|
|
$ |
— |
|
|
Interest cost |
|
|
|
|
|
|
|
|
|
|
|
|
|
|
— |
|
|
|
— |
|
|
|
— |
|
|
Expected return on plan assets |
|
|
( |
) |
|
|
( |
) |
|
|
( |
) |
|
|
— |
|
|
|
— |
|
|
|
— |
|
|
Recognition of net actuarial loss (gain) (1) |
|
|
|
|
|
|
|
|
|
|
|
|
|
|
( |
) |
|
|
( |
) |
|
|
( |
) |
|
Recognition of prior service cost (1) |
|
|
|
|
|
|
|
|
|
|
|
|
|
|
( |
) |
|
|
( |
) |
|
|
( |
) |
|
Total net periodic benefit cost (2) |
|
|
|
|
|
|
|
|
|
|
|
|
|
|
( |
) |
|
|
( |
) |
|
|
( |
) |
|
Other comprehensive loss (earnings): |
|
|
|
|
|
|
|
|
|
|
|
|
|
|
|
|
|
|
|
|
|
|
|
|
|
Actuarial loss (gain) arising in current year |
|
|
|
|
|
|
|
|
|
|
( |
) |
|
|
( |
) |
|
|
( |
) |
|
|
( |
) |
|
Prior service cost arising in current year |
|
|
|
|
|
|
— |
|
|
|
— |
|
|
|
— |
|
|
|
— |
|
|
|
— |
|
|
Recognition of net actuarial gain (loss), including settlement expense, in net periodic benefit cost (3) |
|
|
( |
) |
|
|
( |
) |
|
|
( |
) |
|
|
|
|
|
|
|
|
|
|
|
|
|
Recognition of prior service cost, including curtailment, in net periodic benefit cost (3) |
|
|
( |
) |
|
|
( |
) |
|
|
( |
) |
|
|
|
|
|
|
|
|
|
|
|
|
|
Total other comprehensive loss (earnings) |
|
|
( |
) |
|
|
( |
) |
|
|
( |
) |
|
|
— |
|
|
|
|
|
|
|
|
|
|
Total recognized |
|
$ |
( |
) |
|
$ |
( |
) |
|
$ |
( |
) |
|
$ |
( |
) |
|
$ |
( |
) |
|
$ |
( |
) |
|
(1) |
|
|
(2) |
|
|
(3) |
|
84
DEVON ENERGY CORPORATION AND SUBSIDIARIES
NOTES TO CONSOLIDATED FINANCIAL STATEMENTS – (Continued)
Assumptions
|
|
|
Pension Benefits |
|
|
Postretirement Benefits |
|
||||||||||||||||||
|
|
|
2019 |
|
|
2018 |
|
|
2017 |
|
|
2019 |
|
|
2018 |
|
|
2017 |
|
||||||
|
Assumptions to determine benefit obligations: |
|
|
|
|
|
|
|
|
|
|
|
|
|
|
|
|
|
|
|
|
|
|
|
|
|
Discount rate |
|
|
|
|
|
|
|
|
|
|
|
|
|
|
|
|
|
|
||||||
|
Rate of compensation increase |
|
|
|
|
|
|
|
|
|
|
N/A |
|
|
N/A |
|
|
N/A |
|
||||||
|
Assumptions to determine net periodic benefit cost: |
|
|
|
|
|
|
|
|
|
|
|
|
|
|
|
|
|
|
|
|
|
|
|
|
|
Discount rate - service cost |
|
|
|
|
|
|
|
|
|
|
|
|
|
|
|
|
|
|
||||||
|
Discount rate - interest cost |
|
|
|
|
|
|
|
|
|
|
|
|
|
|
|
|
|
|
||||||
|
Rate of compensation increase |
|
|
|
|
|
|
|
|
|
|
N/A |
|
|
N/A |
|
|
N/A |
|
||||||
|
Expected return on plan assets |
|
|
|
|
|
|
|
|
|
|
N/A |
|
|
N/A |
|
|
N/A |
|
||||||
Discount Rate - Future pension and post-retirement obligations are discounted based on the rate at which obligations could be effectively settled, considering the timing of expected future cash flows related to the plans. This rate is based on high-quality bond yields, after allowing for call and default risk.
Expected return on plan assets – This was determined by evaluating input from external consultants and economists, as well as long-term inflation assumptions and consideration of target allocation of investment types.
Mortality rate – Devon utilized the Society of Actuaries produced mortality tables.
Other assumptions – For measurement of the 2019 benefit obligation for the other postretirement medical plans, a
Expected Cash Flows
Devon expects benefit plan payments to average approximately $
|
17. |
Stockholders’ Equity |
The authorized capital stock of Devon consists of
Share Repurchase Program
On March 7, 2018, Devon announced a $
85
DEVON ENERGY CORPORATION AND SUBSIDIARIES
NOTES TO CONSOLIDATED FINANCIAL STATEMENTS – (Continued)
The table below provides information regarding purchases of Devon’s common stock that were made during 2018 and 2019 (shares in thousands).
|
|
|
Total Number of Shares Purchased |
|
|
Dollar Value of Shares Purchased |
|
|
Average Price Paid per Share |
|
|||
|
First quarter 2018: |
|
|
|
|
|
|
|
|
|
|
|
|
|
Open-Market |
|
|
|
|
|
$ |
|
|
|
$ |
|
|
|
Second quarter 2018: |
|
|
|
|
|
|
|
|
|
|
|
|
|
Open-Market |
|
|
|
|
|
|
|
|
|
|
|
|
|
Third quarter 2018: |
|
|
|
|
|
|
|
|
|
|
|
|
|
Open-Market |
|
|
|
|
|
|
|
|
|
|
|
|
|
ASR |
|
|
|
|
|
|
|
|
|
|
|
|
|
Total |
|
|
|
|
|
|
|
|
|
|
|
|
|
Fourth quarter 2018: |
|
|
|
|
|
|
|
|
|
|
|
|
|
Open-Market |
|
|
|
|
|
|
|
|
|
|
|
|
|
First quarter 2019: |
|
|
|
|
|
|
|
|
|
|
|
|
|
Open-Market |
|
|
|
|
|
|
|
|
|
|
|
|
|
Second quarter 2019: |
|
|
|
|
|
|
|
|
|
|
|
|
|
Open-Market |
|
|
|
|
|
|
|
|
|
|
|
|
|
Third quarter 2019: |
|
|
|
|
|
|
|
|
|
|
|
|
|
Open-Market |
|
|
|
|
|
|
|
|
|
|
|
|
|
Fourth quarter 2019: |
|
|
|
|
|
|
|
|
|
|
|
|
|
Open-Market |
|
|
|
|
|
|
|
|
|
|
|
|
|
Total inception-to-date |
|
|
|
|
|
$ |
|
|
|
$ |
|
|
Dividends
The table below summarizes the dividends Devon paid on its common stock.
|
|
Amounts |
|
|
Rate Per Share |
|
||
|
Year Ended 2019: |
|
|
|
|
|
|
|
|
First quarter |
$ |
|
|
|
$ |
|
|
|
Second quarter |
|
|
|
|
$ |
|
|
|
Third quarter |
|
|
|
|
$ |
|
|
|
Fourth quarter |
|
|
|
|
$ |
|
|
|
Total year-to-date |
$ |
|
|
|
|
|
|
|
Year Ended 2018: |
|
|
|
|
|
|
|
|
First quarter |
$ |
|
|
|
$ |
|
|
|
Second quarter |
|
|
|
|
$ |
|
|
|
Third quarter |
|
|
|
|
$ |
|
|
|
Fourth quarter |
|
|
|
|
$ |
|
|
|
Total year-to-date |
$ |
|
|
|
|
|
|
|
Year Ended 2017: |
|
|
|
|
|
|
|
|
First quarter |
$ |
|
|
|
$ |
|
|
|
Second quarter |
|
|
|
|
$ |
|
|
|
Third quarter |
|
|
|
|
$ |
|
|
|
Fourth quarter |
|
|
|
|
$ |
|
|
|
Total year-to-date |
$ |
|
|
|
|
|
|
86
DEVON ENERGY CORPORATION AND SUBSIDIARIES
NOTES TO CONSOLIDATED FINANCIAL STATEMENTS – (Continued)
Devon raised its quarterly dividend by
Noncontrolling Interests
As discussed in Note 1, the noncontrolling interests’ share of CDM’s net earnings and the contributions from the noncontrolling interests are presented as components of equity for 2019. The noncontrolling interests’ equity balances and activities for 2017 and 2018 are related to EnLink and the divestment of Devon’s aggregate ownership interests in EnLink and the General Partner, as further discussed in Note 18.
|
18. |
Discontinued Operations and Assets Held For Sale |
Barnett Shale
On December 17, 2019, Devon announced that it had entered into an agreement to sell its Barnett Shale assets to BKV for approximately $
In connection with the announced sale of its Barnett Shale assets, Devon recognized a $
Canada
On May 29, 2019, Devon announced it had entered into an agreement to sell substantially all of its oil and gas assets and operations in Canada to Canadian Natural Resources Limited. Devon concluded that the transaction was a strategic shift and met the requirements of assets held for sale and discontinued operations upon the authorization to enter the agreement by Devon’s Board of Directors. As part of its assessment, Devon considered the following: 1) Devon is exiting its entire heavy oil and Canadian operations; 2) Devon’s Canadian operations is a separate reportable segment and is a component of Devon’s business; and 3) the transaction resulted in a material reduction in total assets, revenues, net earnings and total proved reserves. As a result, Devon has classified the results of operations and cash flows related to its Canadian operations as discontinued operations on its consolidated financial statements. Additionally, Devon ceased depreciation for all plant, property and equipment classified as assets held for sale on the date the sales agreement was approved by the Board of Directors.
87
DEVON ENERGY CORPORATION AND SUBSIDIARIES
NOTES TO CONSOLIDATED FINANCIAL STATEMENTS – (Continued)
On
In conjunction with the sale of Devon’s Canadian business, Devon recognized approximately $
Prior to the second quarter of 2019, Devon’s Canadian business maintained a valuation allowance against certain capital loss carryforwards and net operating losses. As a result of the sale of substantially all of Devon’s Canadian oil and gas assets and operations and the lack of future forecasted income, all but approximately $
In July 2019, Devon utilized a portion of the sales proceeds to early retire $
EnLink
On June 6, 2018, Devon announced that it had entered into an agreement to sell its aggregate ownership interests in EnLink and the General Partner for $
On
88
DEVON ENERGY CORPORATION AND SUBSIDIARIES
NOTES TO CONSOLIDATED FINANCIAL STATEMENTS – (Continued)
As part of the sale agreement, Devon extended its fixed-fee gathering and processing contracts with respect to the Bridgeport and Cana plants with EnLink through 2029. Although the agreements were extended to 2029, the minimum volume commitments for the Bridgeport and Cana plants expired at the end of 2018. Devon has minimum volume commitments for gathering and processing of
Prior to the divestment of Devon’s aggregate ownership of EnLink and the General Partner, certain activity between Devon and EnLink were eliminated in consolidation. Subsequent to the divestment, all activity related to EnLink represent third-party transactions and are no longer eliminated in consolidation.
During 2019 and from the period of July 19, 2018 through December 31, 2018, Devon had net outflows of approximately $
The following table presents the amounts reported in the consolidated statements of comprehensive earnings as discontinued operations.
89
DEVON ENERGY CORPORATION AND SUBSIDIARIES
NOTES TO CONSOLIDATED FINANCIAL STATEMENTS – (Continued)
|
Year ended December 31, |
|
Barnett Shale |
|
|
Canada |
|
|
EnLink |
|
|
Total |
|
||||
|
2019 |
|
|
|
|
|
|
|
|
|
|
|
|
|
|
|
|
|
Upstream revenues |
|
$ |
|
|
|
$ |
|
|
|
$ |
— |
|
|
$ |
|
|
|
Marketing and midstream revenues |
|
|
— |
|
|
|
|
|
|
|
— |
|
|
|
|
|
|
Total revenues |
|
|
|
|
|
|
|
|
|
|
— |
|
|
|
|
|
|
Production expenses |
|
|
|
|
|
|
|
|
|
|
— |
|
|
|
|
|
|
Exploration expenses |
|
|
— |
|
|
|
|
|
|
|
— |
|
|
|
|
|
|
Marketing and midstream expenses |
|
|
— |
|
|
|
|
|
|
|
— |
|
|
|
|
|
|
Depreciation, depletion and amortization |
|
|
|
|
|
|
|
|
|
|
— |
|
|
|
|
|
|
Asset impairments |
|
|
|
|
|
|
|
|
|
|
— |
|
|
|
|
|
|
Asset dispositions |
|
|
|
|
|
|
( |
) |
|
|
— |
|
|
|
( |
) |
|
General and administrative expenses |
|
|
— |
|
|
|
|
|
|
|
— |
|
|
|
|
|
|
Financing costs, net |
|
|
— |
|
|
|
|
|
|
|
— |
|
|
|
|
|
|
Restructuring and transaction costs |
|
|
— |
|
|
|
|
|
|
|
— |
|
|
|
|
|
|
Other expenses |
|
|
|
|
|
|
|
|
|
|
— |
|
|
|
|
|
|
Total expenses |
|
|
|
|
|
|
|
|
|
|
— |
|
|
|
|
|
|
Earnings (loss) from discontinued operations before income taxes |
|
|
( |
) |
|
|
|
|
|
|
— |
|
|
|
( |
) |
|
Income tax benefit |
|
|
( |
) |
|
|
( |
) |
|
|
— |
|
|
|
( |
) |
|
Net earnings (loss) from discontinued operations, net of tax |
|
$ |
( |
) |
|
$ |
|
|
|
$ |
— |
|
|
$ |
( |
) |
|
2018 |
|
|
|
|
|
|
|
|
|
|
|
|
|
|
|
|
|
Upstream revenues |
|
$ |
|
|
|
$ |
|
|
|
$ |
— |
|
|
$ |
|
|
|
Marketing and midstream revenues |
|
|
— |
|
|
|
|
|
|
|
|
|
|
|
|
|
|
Total revenues |
|
|
|
|
|
|
|
|
|
|
|
|
|
|
|
|
|
Production expenses |
|
|
|
|
|
|
|
|
|
|
— |
|
|
|
|
|
|
Exploration expenses |
|
|
— |
|
|
|
|
|
|
|
— |
|
|
|
|
|
|
Marketing and midstream expenses |
|
|
— |
|
|
|
|
|
|
|
|
|
|
|
|
|
|
Depreciation, depletion and amortization |
|
|
|
|
|
|
|
|
|
|
|
|
|
|
|
|
|
Asset dispositions |
|
|
|
|
|
|
— |
|
|
|
( |
) |
|
|
( |
) |
|
General and administrative expenses |
|
|
— |
|
|
|
|
|
|
|
|
|
|
|
|
|
|
Financing costs, net |
|
|
— |
|
|
|
|
|
|
|
|
|
|
|
|
|
|
Restructuring and transaction costs |
|
|
— |
|
|
|
|
|
|
|
— |
|
|
|
|
|
|
Other expenses |
|
|
( |
) |
|
|
|
|
|
|
( |
) |
|
|
|
|
|
Total expenses |
|
|
|
|
|
|
|
|
|
|
|
|
|
|
|
|
|
Earnings (loss) from discontinued operations before income taxes |
|
|
|
|
|
|
( |
) |
|
|
|
|
|
|
|
|
|
Income tax expense (benefit) |
|
|
|
|
|
|
( |
) |
|
|
|
|
|
|
|
|
|
Net earnings (loss) from discontinued operations, net of tax |
|
|
|
|
|
|
( |
) |
|
|
|
|
|
|
|
|
|
Net earnings attributable to noncontrolling interests |
|
|
— |
|
|
|
— |
|
|
|
|
|
|
|
|
|
|
Net earnings (loss) from discontinued operations, attributable to Devon |
|
$ |
|
|
|
$ |
( |
) |
|
$ |
|
|
|
$ |
|
|
|
2017 |
|
|
|
|
|
|
|
|
|
|
|
|
|
|
|
|
|
Upstream revenues |
|
$ |
|
|
|
$ |
|
|
|
$ |
— |
|
|
$ |
|
|
|
Marketing and midstream revenues |
|
|
— |
|
|
|
|
|
|
|
|
|
|
|
|
|
|
Total revenues |
|
|
|
|
|
|
|
|
|
|
|
|
|
|
|
|
|
Production expenses |
|
|
|
|
|
|
|
|
|
|
— |
|
|
|
|
|
|
Exploration expenses |
|
|
— |
|
|
|
|
|
|
|
— |
|
|
|
|
|
|
Marketing and midstream expenses |
|
|
— |
|
|
|
|
|
|
|
|
|
|
|
|
|
|
Depreciation, depletion and amortization |
|
|
|
|
|
|
|
|
|
|
|
|
|
|
|
|
|
Asset impairments |
|
|
— |
|
|
|
— |
|
|
|
|
|
|
|
|
|
|
Asset dispositions |
|
|
|
|
|
|
|
|
|
|
— |
|
|
|
|
|
|
General and administrative expenses |
|
|
— |
|
|
|
|
|
|
|
|
|
|
|
|
|
|
Financing costs, net |
|
|
— |
|
|
|
( |
) |
|
|
|
|
|
|
|
|
|
Other expenses |
|
|
|
|
|
|
( |
) |
|
|
( |
) |
|
|
( |
) |
|
Total expenses |
|
|
|
|
|
|
|
|
|
|
|
|
|
|
|
|
|
Earnings from discontinued operations before income taxes |
|
|
|
|
|
|
|
|
|
|
|
|
|
|
|
|
|
Income tax expense (benefit) |
|
|
— |
|
|
|
|
|
|
|
( |
) |
|
|
( |
) |
|
Net earnings from discontinued operations, net of tax |
|
|
|
|
|
|
|
|
|
|
|
|
|
|
|
|
|
Net earnings attributable to noncontrolling interests |
|
|
— |
|
|
|
— |
|
|
|
|
|
|
|
|
|
|
Net earnings from discontinued operations, attributable to Devon |
|
$ |
|
|
|
$ |
|
|
|
$ |
|
|
|
$ |
|
|
90
DEVON ENERGY CORPORATION AND SUBSIDIARIES
NOTES TO CONSOLIDATED FINANCIAL STATEMENTS – (Continued)
The following table presents the carrying amounts of the assets and liabilities associated with discontinued operations on the consolidated balance sheets. The U.S. Other amounts in the table below relate to the divestiture of non-core upstream Permian Basin assets which closed in January 2019 as further discussed in Note 2.
|
|
|
As of December 31, 2019 |
|
|
As of December 31, 2018 |
|
||||||||||||||||||||||
|
|
|
Barnett Shale (1) |
|
|
Canada |
|
|
Total |
|
|
Barnett Shale |
|
|
Canada |
|
|
U.S. Other |
|
|
Total |
|
|||||||
|
Cash restricted for discontinued operations |
|
$ |
|
|
|
$ |
|
|
|
$ |
|
|
|
$ |
— |
|
|
$ |
— |
|
|
$ |
— |
|
|
$ |
— |
|
|
|
|
|
|
|
|
|
|
|
|
|
|
|
|
|
|
|
|
|
|
|
|
|
|
|
|
|
|
|
|
Accounts receivable |
|
$ |
|
|
|
$ |
|
|
|
$ |
|
|
|
$ |
|
|
|
$ |
|
|
|
$ |
|
|
|
$ |
|
|
|
Other current assets |
|
|
|
|
|
|
|
|
|
|
|
|
|
|
|
|
|
|
|
|
|
|
— |
|
|
|
|
|
|
Oil and gas property and equipment, based on successful efforts accounting, net |
|
|
|
|
|
|
— |
|
|
|
|
|
|
|
|
|
|
|
|
|
|
|
|
|
|
|
|
|
|
Other property and equipment, net |
|
|
|
|
|
|
— |
|
|
|
|
|
|
|
|
|
|
|
|
|
|
|
— |
|
|
|
|
|
|
Goodwill |
|
|
|
|
|
|
— |
|
|
|
|
|
|
|
|
|
|
|
— |
|
|
|
— |
|
|
|
|
|
|
Other long-term assets |
|
|
— |
|
|
|
|
|
|
|
|
|
|
|
— |
|
|
|
|
|
|
|
— |
|
|
|
|
|
|
Total assets associated with discontinued operations |
|
$ |
|
|
|
$ |
|
|
|
$ |
|
|
|
$ |
|
|
|
$ |
|
|
|
$ |
|
|
|
$ |
|
|
|
|
|
|
|
|
|
|
|
|
|
|
|
|
|
|
|
|
|
|
|
|
|
|
|
|
|
|
|
|
|
Accounts payable |
|
$ |
|
|
|
$ |
|
|
|
$ |
|
|
|
$ |
|
|
|
$ |
|
|
|
$ |
|
|
|
$ |
|
|
|
Revenues and royalties payable |
|
|
|
|
|
|
|
|
|
|
|
|
|
|
|
|
|
|
|
|
|
|
— |
|
|
|
|
|
|
Other current liabilities |
|
|
|
|
|
|
|
|
|
|
|
|
|
|
|
|
|
|
|
|
|
|
|
|
|
|
|
|
|
Long-term debt (2) |
|
|
— |
|
|
|
— |
|
|
|
— |
|
|
|
— |
|
|
|
|
|
|
|
— |
|
|
|
|
|
|
Asset retirement obligations |
|
|
|
|
|
|
— |
|
|
|
|
|
|
|
|
|
|
|
|
|
|
|
|
|
|
|
|
|
|
Deferred income taxes |
|
|
— |
|
|
|
— |
|
|
|
— |
|
|
|
— |
|
|
|
|
|
|
|
— |
|
|
|
|
|
|
Other long-term liabilities |
|
|
|
|
|
|
|
|
|
|
|
|
|
|
|
|
|
|
|
|
|
|
— |
|
|
|
|
|
|
Total liabilities associated with discontinued operations |
|
$ |
|
|
|
$ |
|
|
|
$ |
|
|
|
$ |
|
|
|
$ |
|
|
|
$ |
|
|
|
$ |
|
|
|
|
(1) |
|
|
|
(2) |
|
|
19. |
Commitments and Contingencies |
Devon is party to various legal actions arising in connection with its business. Matters that are probable of unfavorable outcome to Devon and which can be reasonably estimated are accrued. Such accruals are based on information known about the matters, Devon’s estimates of the outcomes of such matters and its experience in contesting, litigating and settling similar matters. None of the actions are believed by management to likely involve future amounts that would be material to Devon’s financial position or results of operations after consideration of recorded accruals. Actual amounts could differ materially from management’s estimates.
Royalty Matters
Numerous oil and natural gas producers and related parties, including Devon, have been named in various lawsuits alleging royalty underpayments. Devon is currently named as a defendant in a number of such lawsuits, including some lawsuits in which the plaintiffs seek to certify classes of similarly situated plaintiffs. Among the
91
DEVON ENERGY CORPORATION AND SUBSIDIARIES
NOTES TO CONSOLIDATED FINANCIAL STATEMENTS – (Continued)
allegations typically asserted in these suits are claims that Devon used below-market prices, made improper deductions, used improper measurement techniques and entered into gas purchase and processing arrangements with affiliates that resulted in underpayment of royalties in connection with oil, natural gas and NGLs produced and sold. Devon is also involved in governmental agency proceedings and royalty audits and is subject to related contracts and regulatory controls in the ordinary course of business, some that may lead to additional royalty claims. Devon does not currently believe that it is subject to material exposure with respect to such royalty matters.
Environmental and Other Matters
Devon is subject to certain laws and regulations relating to environmental remediation activities associated with past operations, such as the Comprehensive Environmental Response, Compensation, and Liability Act and similar state statutes. In response to liabilities associated with these activities, loss accruals primarily consist of estimated uninsured remediation costs. Devon’s monetary exposure for environmental matters is not expected to be material.
Beginning in 2013, various parishes in Louisiana filed suit against more than
Various municipalities and other governmental and private parties in California have filed legal proceedings against certain oil and gas companies, including Devon, seeking relief to abate alleged impacts of climate change. These proceedings include far-reaching claims for monetary damages and injunctions against the production of all fossil fuels. Although Devon cannot predict the ultimate outcome of these matters, Devon believes these claims to be baseless and intends to vigorously defend against the proceedings.
Commitments
The following table presents Devon’s commitments that have initial or remaining noncancelable terms in excess of one year as of December 31, 2019.
|
Year Ending December 31, |
|
Drilling and Facility Obligations |
|
|
Operational Agreements |
|
|
Office and Equipment Leases |
|
|||
|
2020 |
|
$ |
|
|
|
$ |
|
|
|
$ |
|
|
|
2021 |
|
|
|
|
|
|
|
|
|
|
|
|
|
2022 |
|
|
|
|
|
|
|
|
|
|
|
|
|
2023 |
|
|
|
|
|
|
|
|
|
|
|
|
|
2024 |
|
|
|
|
|
|
|
|
|
|
|
|
|
Thereafter |
|
|
|
|
|
|
|
|
|
|
|
|
|
Total |
|
$ |
|
|
|
$ |
|
|
|
$ |
|
|
Devon has certain drilling and facility obligations under contractual agreements with third-party service providers to procure drilling rigs and other related services for developmental and exploratory drilling and facilities construction. The value of the drilling obligations reported is based on gross contractual value.
92
DEVON ENERGY CORPORATION AND SUBSIDIARIES
NOTES TO CONSOLIDATED FINANCIAL STATEMENTS – (Continued)
Devon has certain operational agreements whereby Devon has committed to transport or process certain volumes of oil, gas and NGLs for a fixed fee. Devon has entered into these agreements to aid the movement of its production to downstream markets.
Devon leases certain office space and equipment under financing and operating lease arrangements.
|
20. |
Fair Value Measurements |
The following table provides carrying value and fair value measurement information for certain of Devon’s financial assets and liabilities. The carrying values of cash, cash restricted for discontinued operations, accounts receivable, other current receivables, accounts payable, other current payables, accrued expenses and lease liabilities included in the accompanying consolidated balance sheets approximated fair value at December 31, 2019 and December 31, 2018, as applicable. Therefore, such financial assets and liabilities are not presented in the following table.
|
|
|
|
|
|
|
|
|
|
|
Fair Value Measurements Using: |
|
|||||
|
|
|
Carrying |
|
|
Total Fair |
|
|
Level 1 |
|
|
Level 2 |
|
||||
|
|
|
Amount |
|
|
Value |
|
|
Inputs |
|
|
Inputs |
|
||||
|
December 31, 2019 assets (liabilities): |
|
|
|
|
|
|
|
|
|
|
|
|
|
|
|
|
|
Cash equivalents |
|
$ |
|
|
|
$ |
|
|
|
$ |
|
|
|
$ |
— |
|
|
Commodity derivatives |
|
$ |
|
|
|
$ |
|
|
|
$ |
— |
|
|
$ |
|
|
|
Commodity derivatives |
|
$ |
( |
) |
|
$ |
( |
) |
|
$ |
— |
|
|
$ |
( |
) |
|
Debt |
|
$ |
( |
) |
|
$ |
( |
) |
|
$ |
— |
|
|
$ |
( |
) |
|
December 31, 2018 assets (liabilities): |
|
|
|
|
|
|
|
|
|
|
|
|
|
|
|
|
|
Cash equivalents |
|
$ |
|
|
|
$ |
|
|
|
$ |
|
|
|
$ |
|
|
|
Commodity derivatives |
|
$ |
|
|
|
$ |
|
|
|
$ |
— |
|
|
$ |
|
|
|
Commodity derivatives |
|
$ |
( |
) |
|
$ |
( |
) |
|
$ |
— |
|
|
$ |
( |
) |
|
Debt |
|
$ |
( |
) |
|
$ |
( |
) |
|
$ |
— |
|
|
$ |
( |
) |
The following methods and assumptions were used to estimate the fair values in the tables above.
Level 1 Fair Value Measurements
Cash equivalents – Amounts consist primarily of money market investments and the fair value approximates the carrying value.
Level 2 Fair Value Measurements
Cash equivalents – Amounts primarily consist of Canadian agency and provincial securities investments. The fair value approximates the carrying value.
Commodity derivatives – The fair value of commodity derivatives is estimated using internal discounted cash flow calculations based upon forward curves and data obtained from independent third parties for contracts with similar terms or data obtained from counterparties to the agreements.
Debt – Devon’s debt instruments do not actively trade in an established market. The fair values of its debt are estimated based on rates available for debt with similar terms and maturity.
93
DEVON ENERGY CORPORATION AND SUBSIDIARIES
NOTES TO CONSOLIDATED FINANCIAL STATEMENTS – (Continued)
|
21. |
Supplemental Information on Oil and Gas Operations (Unaudited) |
Supplemental unaudited information regarding Devon’s oil and gas activities is presented in this note. With the sale of substantially all of its Canadian assets and operations, all of Devon’s reserves are located within the U.S.
The supplemental information in the tables below exclude amounts for all periods presented related to Devon’s discontinued operations, which consist of Devon’s Canadian operations that were sold in 2019 and its Barnett Shale assets, inclusive of properties divested in previous reporting periods located primarily in Johnson and Wise counties, Texas, which is expected to close in 2020.
Costs Incurred
The following tables reflect the costs incurred in oil and gas property acquisition, exploration and development activities.
|
|
|
Year Ended December 31, |
|
|||||||||
|
|
|
2019 |
|
|
2018 |
|
|
2017 |
|
|||
|
Property acquisition costs: |
|
|
|
|
|
|
|
|
|
|
|
|
|
Proved properties |
|
$ |
— |
|
|
$ |
|
|
|
$ |
|
|
|
Unproved properties |
|
|
|
|
|
|
|
|
|
|
|
|
|
Exploration costs |
|
|
|
|
|
|
|
|
|
|
|
|
|
Development costs |
|
|
|
|
|
|
|
|
|
|
|
|
|
Costs incurred |
|
$ |
|
|
|
$ |
|
|
|
$ |
|
|
Development costs in the tables above include additions and revisions to Devon’s asset retirement obligations.
94
DEVON ENERGY CORPORATION AND SUBSIDIARIES
NOTES TO CONSOLIDATED FINANCIAL STATEMENTS – (Continued)
Results of Operations
The following tables include revenues and expenses associated with Devon’s oil and gas producing activities. They do not include any allocation of Devon’s interest costs or general corporate overhead and, therefore, are not necessarily indicative of the contribution to net earnings of Devon’s oil and gas operations. Income tax expense has been calculated by applying statutory income tax rates to oil, gas and NGL sales after deducting costs, including DD&A and after giving effect to permanent differences.
|
|
|
Year Ended December 31, |
|
|||||||||
|
|
|
2019 |
|
|
2018 |
|
|
2017 |
|
|||
|
Oil, gas and NGL sales |
|
$ |
|
|
|
$ |
|
|
|
$ |
|
|
|
Production expenses |
|
|
( |
) |
|
|
( |
) |
|
|
( |
) |
|
Exploration expenses |
|
|
( |
) |
|
|
( |
) |
|
|
( |
) |
|
Depreciation, depletion and amortization |
|
|
( |
) |
|
|
( |
) |
|
|
( |
) |
|
Asset dispositions |
|
|
|
|
|
|
|
|
|
|
|
|
|
Asset impairments |
|
|
— |
|
|
|
( |
) |
|
|
— |
|
|
Accretion of asset retirement obligations |
|
|
( |
) |
|
|
( |
) |
|
|
( |
) |
|
Income tax expense |
|
|
( |
) |
|
|
( |
) |
|
|
— |
|
|
Results of operations |
|
$ |
|
|
|
$ |
|
|
|
$ |
|
|
|
Depreciation, depletion and amortization per Boe |
|
$ |
|
|
|
$ |
|
|
|
$ |
|
|
95
DEVON ENERGY CORPORATION AND SUBSIDIARIES
NOTES TO CONSOLIDATED FINANCIAL STATEMENTS – (Continued)
Proved Reserves
The following table presents Devon’s estimated proved reserves by product.
|
|
|
|
|
|
|
|
|
|
|
|
|
|
|
|
|
|
|
|
|
Oil (MMBbls) |
|
|
Gas (Bcf) |
|
|
NGL (MMBbls) |
|
|
Combined (MMBoe) |
|
||||
|
Proved developed and undeveloped reserves: |
|
|
|
|
|
|
|
|
|
|
|
|
|
|
|
|
|
December 31, 2016 |
|
|
|
|
|
|
|
|
|
|
|
|
|
|
|
|
|
Revisions due to prices |
|
|
|
|
|
|
|
|
|
|
|
|
|
|
|
|
|
Revisions other than price |
|
|
|
|
|
|
( |
) |
|
|
( |
) |
|
|
( |
) |
|
Extensions and discoveries |
|
|
|
|
|
|
|
|
|
|
|
|
|
|
|
|
|
Production |
|
|
( |
) |
|
|
( |
) |
|
|
( |
) |
|
|
( |
) |
|
Sale of reserves |
|
|
( |
) |
|
|
( |
) |
|
|
( |
) |
|
|
( |
) |
|
December 31, 2017 |
|
|
|
|
|
|
|
|
|
|
|
|
|
|
|
|
|
Revisions due to prices |
|
|
|
|
|
|
|
|
|
|
|
|
|
|
|
|
|
Revisions other than price |
|
|
( |
) |
|
|
( |
) |
|
|
( |
) |
|
|
( |
) |
|
Extensions and discoveries |
|
|
|
|
|
|
|
|
|
|
|
|
|
|
|
|
|
Production |
|
|
( |
) |
|
|
( |
) |
|
|
( |
) |
|
|
( |
) |
|
Sale of reserves |
|
|
( |
) |
|
|
( |
) |
|
|
( |
) |
|
|
( |
) |
|
December 31, 2018 |
|
|
|
|
|
|
|
|
|
|
|
|
|
|
|
|
|
Revisions due to prices |
|
|
( |
) |
|
|
( |
) |
|
|
( |
) |
|
|
( |
) |
|
Revisions other than price |
|
|
( |
) |
|
|
( |
) |
|
|
( |
) |
|
|
( |
) |
|
Extensions and discoveries |
|
|
|
|
|
|
|
|
|
|
|
|
|
|
|
|
|
Purchase of reserves |
|
|
|
|
|
|
|
|
|
|
|
|
|
|
|
|
|
Production |
|
|
( |
) |
|
|
( |
) |
|
|
( |
) |
|
|
( |
) |
|
Sale of reserves |
|
|
( |
) |
|
|
( |
) |
|
|
( |
) |
|
|
( |
) |
|
December 31, 2019 |
|
|
|
|
|
|
|
|
|
|
|
|
|
|
|
|
|
|
|
|
|
|
|
|
|
|
|
|
|
|
|
|
|
|
|
Proved developed reserves: |
|
|
|
|
|
|
|
|
|
|
|
|
|
|
|
|
|
December 31, 2016 |
|
|
|
|
|
|
|
|
|
|
|
|
|
|
|
|
|
December 31, 2017 |
|
|
|
|
|
|
|
|
|
|
|
|
|
|
|
|
|
December 31, 2018 |
|
|
|
|
|
|
|
|
|
|
|
|
|
|
|
|
|
December 31, 2019 |
|
|
|
|
|
|
|
|
|
|
|
|
|
|
|
|
|
Proved developed-producing reserves: |
|
|
|
|
|
|
|
|
|
|
|
|
|
|
|
|
|
December 31, 2016 |
|
|
|
|
|
|
|
|
|
|
|
|
|
|
|
|
|
December 31, 2017 |
|
|
|
|
|
|
|
|
|
|
|
|
|
|
|
|
|
December 31, 2018 |
|
|
|
|
|
|
|
|
|
|
|
|
|
|
|
|
|
December 31, 2019 |
|
|
|
|
|
|
|
|
|
|
|
|
|
|
|
|
|
Proved undeveloped reserves: |
|
|
|
|
|
|
|
|
|
|
|
|
|
|
|
|
|
December 31, 2016 |
|
|
|
|
|
|
|
|
|
|
|
|
|
|
|
|
|
December 31, 2017 |
|
|
|
|
|
|
|
|
|
|
|
|
|
|
|
|
|
December 31, 2018 |
|
|
|
|
|
|
|
|
|
|
|
|
|
|
|
|
|
December 31, 2019 |
|
|
|
|
|
|
|
|
|
|
|
|
|
|
|
|
|
(1) |
|
96
DEVON ENERGY CORPORATION AND SUBSIDIARIES
NOTES TO CONSOLIDATED FINANCIAL STATEMENTS – (Continued)
Proved Undeveloped Reserves
The following table presents the changes in Devon’s total proved undeveloped reserves during 2019 (MMBoe).
|
|
|
U.S. |
|
|
|
Proved undeveloped reserves as of December 31, 2018 |
|
|
|
|
|
Extensions and discoveries |
|
|
|
|
|
Revisions due to prices |
|
|
— |
|
|
Revisions other than price |
|
|
( |
) |
|
Sale of reserves |
|
|
( |
) |
|
Conversion to proved developed reserves |
|
|
( |
) |
|
Proved undeveloped reserves as of December 31, 2019 |
|
|
|
|
Total proved undeveloped reserves decreased
Price Revisions
Reserves decreased
Reserves increased
Revisions Other Than Price
Total revisions other than price in 2019 and 2018 primarily related to Devon’s development programs evaluation of certain oil and dry gas regions, with the largest revisions being made in the STACK.
Extensions and Discoveries
2019 – Of the
2018 – Approximately
The 2018 extensions and discoveries included
2017 – Over
97
DEVON ENERGY CORPORATION AND SUBSIDIARIES
NOTES TO CONSOLIDATED FINANCIAL STATEMENTS – (Continued)
The 2017 extensions and discoveries included
Sale of Reserves
During 2019, 2018 and 2017, Devon had U.S. non-core asset divestitures. For additional information on these divestitures, see Note 2.
Standardized Measure
The following tables reflect Devon’s standardized measure of discounted future net cash flows from its proved reserves.
|
|
|
Year Ended December 31, |
|
|||||||||
|
|
|
2019 |
|
|
2018 |
|
|
2017 |
|
|||
|
Future cash inflows |
|
$ |
|
|
|
$ |
|
|
|
$ |
|
|
|
Future costs: |
|
|
|
|
|
|
|
|
|
|
|
|
|
Development |
|
|
( |
) |
|
|
( |
) |
|
|
( |
) |
|
Production |
|
|
( |
) |
|
|
( |
) |
|
|
( |
) |
|
Future income tax expense |
|
|
( |
) |
|
|
( |
) |
|
|
— |
|
|
Future net cash flow |
|
|
|
|
|
|
|
|
|
|
|
|
|
10% discount to reflect timing of cash flows |
|
|
( |
) |
|
|
( |
) |
|
|
( |
) |
|
Standardized measure of discounted future net cash flows |
|
$ |
|
|
|
$ |
|
|
|
$ |
|
|
Future cash inflows, development costs and production costs were computed using the same assumptions for prices and costs that were used to estimate Devon’s proved oil and gas reserves at the end of each year. For 2019 estimates, Devon’s future realized prices were assumed to be $
Future development costs include not only development costs but also future asset retirement costs. Included as part of the $
The principal changes in Devon’s standardized measure of discounted future net cash flows are as follows:
|
|
|
Year Ended December 31, |
|
|||||||||
|
|
|
2019 |
|
|
2018 |
|
|
2017 |
|
|||
|
Beginning balance |
|
$ |
|
|
|
$ |
|
|
|
$ |
|
|
|
Net changes in prices and production costs |
|
|
( |
) |
|
|
|
|
|
|
|
|
|
Oil, gas and NGL sales, net of production costs |
|
|
( |
) |
|
|
( |
) |
|
|
( |
) |
|
Changes in estimated future development costs |
|
|
|
|
|
|
( |
) |
|
|
( |
) |
|
Extensions and discoveries, net of future development costs |
|
|
|
|
|
|
|
|
|
|
|
|
|
Purchase of reserves |
|
|
|
|
|
|
— |
|
|
|
|
|
|
Sales of reserves in place |
|
|
( |
) |
|
|
( |
) |
|
|
( |
) |
|
Revisions of quantity estimates |
|
|
( |
) |
|
|
( |
) |
|
|
( |
) |
|
Previously estimated development costs incurred during the period |
|
|
|
|
|
|
|
|
|
|
|
|
|
Accretion of discount |
|
|
|
|
|
|
|
|
|
|
|
|
|
Net change in income taxes and other |
|
|
|
|
|
|
( |
) |
|
|
( |
) |
|
Ending balance |
|
$ |
|
|
|
$ |
|
|
|
$ |
|
|
98
DEVON ENERGY CORPORATION AND SUBSIDIARIES
NOTES TO CONSOLIDATED FINANCIAL STATEMENTS – (Continued)
|
22. |
Supplemental Quarterly Financial Information (Unaudited) |
The following tables present a summary of Devon’s unaudited interim results of operations.
|
|
|
2019 |
|
|||||||||||||||||
|
|
|
First Quarter |
|
|
Second Quarter |
|
|
Third Quarter |
|
|
Fourth Quarter |
|
|
Full Year |
|
|||||
|
Total revenues (1) |
|
$ |
|
|
|
$ |
|
|
|
$ |
|
|
|
$ |
|
|
|
$ |
|
|
|
Asset dispositions (2) |
|
$ |
( |
) |
|
$ |
( |
) |
|
$ |
( |
) |
|
$ |
— |
|
|
$ |
( |
) |
|
Earnings (loss) from continuing operations before income taxes |
|
$ |
( |
) |
|
$ |
|
|
|
$ |
|
|
|
$ |
( |
) |
|
$ |
( |
) |
|
Net earnings (loss) from continuing operations |
|
$ |
( |
) |
|
$ |
|
|
|
$ |
|
|
|
$ |
|
|
|
$ |
( |
) |
|
Net earnings (loss) from discontinued operations, net of income tax expense (benefit) (4) |
|
$ |
|
|
|
$ |
|
|
|
$ |
( |
) |
|
$ |
( |
) |
|
$ |
( |
) |
|
Net earnings (loss) attributable to Devon |
|
$ |
( |
) |
|
$ |
|
|
|
$ |
|
|
|
$ |
( |
) |
|
$ |
( |
) |
|
Basic net earnings (loss) per share attributable to Devon |
|
$ |
( |
) |
|
$ |
|
|
|
$ |
|
|
|
$ |
( |
) |
|
$ |
( |
) |
|
Diluted net earnings (loss) per share attributable to Devon |
|
$ |
( |
) |
|
$ |
|
|
|
$ |
|
|
|
$ |
( |
) |
|
$ |
( |
) |
|
|
|
2018 |
|
|||||||||||||||||
|
|
|
First Quarter |
|
|
Second Quarter |
|
|
Third Quarter |
|
|
Fourth Quarter |
|
|
Full Year |
|
|||||
|
Total revenues (1) |
|
$ |
|
|
|
$ |
|
|
|
$ |
|
|
|
$ |
|
|
|
$ |
|
|
|
Asset dispositions (2) |
|
$ |
( |
) |
|
$ |
( |
) |
|
$ |
( |
) |
|
$ |
( |
) |
|
$ |
( |
) |
|
Earnings (loss) from continuing operations before income taxes (3) |
|
$ |
( |
) |
|
$ |
( |
) |
|
$ |
( |
) |
|
$ |
|
|
|
$ |
|
|
|
Net earnings (loss) from continuing operations |
|
$ |
( |
) |
|
$ |
( |
) |
|
$ |
|
|
|
$ |
|
|
|
$ |
|
|
|
Net earnings (loss) from discontinued operations, net of income tax expense (benefit) (4) |
|
$ |
|
|
|
$ |
|
|
|
$ |
|
|
|
$ |
( |
) |
|
$ |
|
|
|
Net earnings (loss) attributable to Devon |
|
$ |
( |
) |
|
$ |
( |
) |
|
$ |
|
|
|
$ |
|
|
|
$ |
|
|
|
Basic net earnings (loss) per share attributable to Devon |
|
$ |
( |
) |
|
$ |
( |
) |
|
$ |
|
|
|
$ |
|
|
|
$ |
|
|
|
Diluted net earnings (loss) per share attributable to Devon |
|
$ |
( |
) |
|
$ |
( |
) |
|
$ |
|
|
|
$ |
|
|
|
$ |
|
|
|
(1) |
|
|
(2) |
|
|
(3) |
|
|
(4) |
|
99
Item 9. Changes in and Disagreements with Accountants on Accounting and Financial Disclosure
Not applicable.
Item 9A. Controls and Procedures
Disclosure Controls and Procedures
We have established disclosure controls and procedures to ensure that material information relating to Devon, including its consolidated subsidiaries, is made known to the officers who certify Devon’s financial reports and to other members of senior management and the Board of Directors.
Based on their evaluation, our principal executive and principal financial officers have concluded that our disclosure controls and procedures (as defined in Rules 13a-15(e) and 15d-15(e) under the Securities Exchange Act of 1934) were effective as of December 31, 2019 to ensure that the information required to be disclosed by Devon in the reports that it files or submits under the Securities Exchange Act of 1934 is recorded, processed, summarized and reported within the time periods specified in the SEC rules and forms.
Management’s Annual Report on Internal Control Over Financial Reporting
Our management is responsible for establishing and maintaining adequate internal control over financial reporting for Devon, as such term is defined in Rules 13a-15(f) and 15d-15(f) under the Securities Exchange Act of 1934. Under the supervision and with the participation of Devon’s management, including our principal executive and principal financial officers, we conducted an evaluation of the effectiveness of our internal control over financial reporting based on the framework in Internal Control – Integrated Framework issued in 2013 by the Committee of Sponsoring Organizations of the Treadway Commission (the “2013 COSO Framework”). Based on this evaluation under the 2013 COSO Framework, which was completed on February 19, 2020, management concluded that its internal control over financial reporting was effective as of December 31, 2019.
The effectiveness of our internal control over financial reporting as of December 31, 2019 has been audited by KPMG LLP, an independent registered public accounting firm who audited our consolidated financial statements as of and for the year ended December 31, 2019, as stated in their report, which is included under “Item 8. Financial Statements and Supplementary Data” of this report.
Changes in Internal Control Over Financial Reporting
There was no change in our internal control over financial reporting during the fourth quarter of 2019 that has materially affected, or is reasonably likely to materially affect, our internal control over financial reporting.
Item 9B. Other Information
On February 18, 2020, we entered into indemnification agreements with each of our directors. Subject to various terms and conditions, the indemnification agreements provide for, among other things, (i) indemnification rights for the directors with respect to certain claims and liabilities to the fullest extent permitted by Delaware law, (ii) the right to advancement of expenses for the directors with respect to certain claims and liabilities, (iii) clarification for the processes used to determine whether a director is entitled to indemnification and (iv) the maintenance of directors and officers liability insurance coverage for the directors. The foregoing description of the indemnification agreements is not complete and is subject to and qualified in its entirety by reference to a form of the indemnification agreement, a copy of which is attached hereto as Exhibit 10.40 and the terms of which are incorporated herein by reference.
100
PART III
Item 10. Directors, Executive Officers and Corporate Governance
The information called for by this Item 10 is incorporated herein by reference to the definitive Proxy Statement to be filed by Devon pursuant to Regulation 14A of the General Rules and Regulations under the Securities Exchange Act of 1934 no later than 120 days following the fiscal year ended December 31, 2019.
Item 11. Executive Compensation
The information called for by this Item 11 is incorporated herein by reference to the definitive Proxy Statement to be filed by Devon pursuant to Regulation 14A of the General Rules and Regulations under the Securities Exchange Act of 1934 no later than 120 days following the fiscal year ended December 31, 2019.
Item 12. Security Ownership of Certain Beneficial Owners and Management and Related Stockholder Matters
The information called for by this Item 12 is incorporated herein by reference to the definitive Proxy Statement to be filed by Devon pursuant to Regulation 14A of the General Rules and Regulations under the Securities Exchange Act of 1934 no later than 120 days following the fiscal year ended December 31, 2019.
Item 13. Certain Relationships and Related Transactions, and Director Independence
The information called for by this Item 13 is incorporated herein by reference to the definitive Proxy Statement to be filed by Devon pursuant to Regulation 14A of the General Rules and Regulations under the Securities Exchange Act of 1934 no later than 120 days following the fiscal year ended December 31, 2019.
Item 14. Principal Accountant Fees and Services
The information called for by this Item 14 is incorporated herein by reference to the definitive Proxy Statement to be filed by Devon pursuant to Regulation 14A of the General Rules and Regulations under the Securities Exchange Act of 1934 no later than 120 days following the fiscal year ended December 31, 2019.
101
PART IV
Item 15. Exhibits and Financial Statement Schedules
(a) The following documents are included as part of this report:
1. Consolidated Financial Statements
Reference is made to the Index to Consolidated Financial Statements and Consolidated Financial Statement Schedules appearing at “Item 8. Financial Statements and Supplementary Data” in this report.
2. Consolidated Financial Statement Schedules
All financial statement schedules are omitted as they are inapplicable, or the required information has been included in the consolidated financial statements or notes thereto.
3. Exhibits
|
Exhibit No. |
|
Description |
|
|
|
|
|
2.1 |
|
Purchase Agreement, dated June 5, 2018, by and among Devon Gas Services, L.P. and Southwestern Gas Pipeline, L.L.C., as sellers, and Enlink Midstream Manager, LLC, Registrant, and GIP III Stetson I, L.P. and GIP III Stetson II, L.P., as acquirors (incorporated by reference to Exhibit 2.1 to Registrant’s Form 8-K filed June 7, 2018; File No. 001-32318). |
|
|
|
|
|
2.2 |
|
Agreement of Purchase and Sale, dated as of May 28, 2019, among Devon Canada Corporation, Devon Canada Crude Marketing Corporation and Canadian Natural Resources Limited (incorporated by reference to Exhibit 2.1 to the Company’s Form 8-K filed May 31, 2019; File No. 001-32318). |
|
|
|
|
|
2.3 |
|
Purchase and Sale Agreement, dated December 17, 2019, by and between Devon Energy Production Company, L.P. and BKV Barnett, LLC (incorporated by reference to Exhibit 2.1 to the Company’s Form 8-K filed December 18, 2019; File No. 001-32318).* |
|
|
|
|
|
3.1 |
|
Registrant’s Restated Certificate of Incorporation (incorporated by reference to Exhibit 3.1 of Registrant’s Form 10-K filed February 21, 2013; File No. 001-32318). |
|
|
|
|
|
3.2 |
|
Registrant’s Bylaws (incorporated by reference to Exhibit 3.1 of Registrant’s Form 8-K filed January 27, 2016; File No. 001-32318). |
|
|
|
|
|
4.1 |
|
Indenture, dated as of July 12, 2011, between Registrant and UMB Bank, National Association, as Trustee (incorporated by reference to Exhibit 4.1 to Registrant’s Form 8-K filed July 12, 2011; File No. 001-32318). |
|
|
|
|
|
4.2 |
|
Supplemental Indenture No. 1, dated as of July 12, 2011, to Indenture dated as of July 12, 2011, between Registrant and UMB Bank, National Association, as Trustee, relating to the 5.60% Senior Notes due 2041 (incorporated by reference to Exhibit 4.2 to Registrant’s Form 8-K filed July 12, 2011; File No. 001-32318). |
|
|
|
|
|
4.3 |
|
Supplemental Indenture No. 2, dated as of May 14, 2012, to Indenture dated as of July 12, 2011, between Registrant and UMB Bank, National Association, as Trustee, relating to the 4.750% Senior Notes due 2042 (incorporated by reference to Exhibit 4.1 to Registrant’s Form 8-K filed May 14, 2012; File No. 001-32318). |
|
|
|
|
|
4.4 |
|
Supplemental Indenture No. 4, dated as of June 16, 2015, to Indenture dated as of July 12, 2011, between Registrant and UMB Bank, National Association, as Trustee, relating to the 5.000% Senior Notes due 2045 (incorporated by reference to Exhibit 4.1 to Registrant’s Form 8-K filed June 16, 2015; File No. 001-32318). |
102
|
Exhibit No. |
|
Description |
|
|
|
|
|
4.5 |
|
Supplemental Indenture No. 5, dated as of December 15, 2015, to Indenture dated as of July 12, 2011, between Registrant and UMB Bank, National Association, as Trustee, relating to the 5.850% Senior Notes due 2025 (incorporated by reference to Exhibit 4.1 to Registrant’s Form 8-K filed December 15, 2015; File No. 001-32318). |
|
|
|
|
|
4.6 |
|
Indenture, dated as of March 1, 2002, between Registrant and The Bank of New York Mellon Trust Company, N.A. (as successor to The Bank of New York), as Trustee (incorporated by reference to Exhibit 4.1 of Registrant’s Form 8-K filed April 9, 2002; File No. 000-30176). |
|
|
|
|
|
4.7 |
|
Supplemental Indenture No. 1, dated as of March 25, 2002, to Indenture dated as of March 1, 2002, between Registrant and The Bank of New York Mellon Trust Company, N.A., as Trustee, relating to the 7.95% Senior Debentures due 2032 (incorporated by reference to Exhibit 4.2 to Registrant’s Form 8-K filed April 9, 2002; File No. 000-30176). |
|
|
|
|
|
4.8 |
|
Supplemental Indenture No. 4, dated as of March 22, 2018, to Indenture dated as of March 1, 2002, between Registrant and The Bank of New York Mellon Trust Company, N.A., as Trustee, relating to the 7.95% Senior Notes due 2032 (incorporated by reference to Exhibit 4.1 to Registrant’s Form 8-K filed March 22, 2018; File No. 000-32318). |
|
|
|
|
|
4.9 |
|
Indenture, dated as of October 3, 2001, among Devon Financing Company, L.L.C. (f/k/a Devon Financing Corporation, U.L.C.), as Issuer, Registrant, as Guarantor, and The Bank of New York Mellon Trust Company, N.A., originally The Chase Manhattan Bank, as Trustee, relating to the 7.875% Debentures due 2031 (incorporated by reference to Exhibit 4.7 to Registrant’s Registration Statement on Form S-4 filed October 31, 2001; File No. 333-68694). |
|
|
|
|
|
4.10 |
|
Assignment and Assumption Agreement, dated as of June 19, 2019, by and between Devon Financing Company, L.L.C. and Registrant, relating to that certain Indenture, dated as of October 3, 2001, by and among Devon Financing Company, L.L.C. (f/k/a Devon Financing Company, U.L.C.), as Issuer, Devon Energy Corporation, as Guarantor, and The Bank of New York Mellon Trust Company, N.A., as successor to The Chase Manhattan Bank, as Trustee, and the 7.875% Debentures due 2031 issued thereunder (incorporated by reference to Exhibit 4.1 to the Company’s Form 10-Q filed August 7, 2019; File No. 001-32318). |
|
|
|
|
|
4.11 |
|
Senior Indenture, dated as of September 1, 1997, between Devon OEI Operating, L.L.C. (as successor to Seagull Energy Corporation) and The Bank of New York Mellon Trust Company, N.A. (as successor to The Bank of New York), as Trustee, and related Specimen of 7.50% Senior Notes due 2027 (incorporated by reference to Exhibit 4.4 to Ocean Energy Inc.’s Form 10-K filed March 23, 1998; File No. 001-08094). |
|
|
|
|
|
4.12 |
|
First Supplemental Indenture, dated as of March 30, 1999, to Senior Indenture dated as of September 1, 1997, by and among Devon OEI Operating, L.L.C., its Subsidiary Guarantor, and The Bank of New York Mellon Trust Company, N.A., as Trustee, relating to the 7.50% Senior Notes due 2027 (incorporated by reference to Exhibit 4.10 to Ocean Energy, Inc.’s Form 10-Q filed May 17, 1999; File No. 001-08094). |
|
|
|
|
|
4.13 |
|
Second Supplemental Indenture, dated as of May 9, 2001, to Senior Indenture dated as of September 1, 1997, by and among Devon OEI Operating, L.L.C., its Subsidiary Guarantor, and The Bank of New York Mellon Trust Company, N.A., as Trustee, relating to the 7.50% Senior Notes due 2027 (incorporated by reference to Exhibit 99.4 to Ocean Energy, Inc.’s Form 8-K filed May 14, 2001; File No. 033-06444). |
|
|
|
|
|
4.14 |
|
Third Supplemental Indenture, dated as of December 31, 2005, to Senior Indenture dated as of September 1, 1997, by and among Devon OEI Operating, L.L.C., as Issuer, Devon Energy Production Company, L.P., as Successor Guarantor, and The Bank of New York Mellon Trust Company, N.A., as Trustee, relating to the 7.50% Senior Notes due 2027 (incorporated by reference to Exhibit 4.27 of Registrant’s Form 10-K filed March 3, 2006; File No. 001-32318). |
|
|
|
|
|
4.15 |
|
Description of Securities Registered under Section 12 of the Securities Exchange Act of 1934. |
103
|
Exhibit No. |
|
Description |
|
|
|
|
|
10.1 |
|
Credit Agreement, dated as of October 5, 2018, among Registrant, as U.S. Borrower, Devon Canada Corporation, as Canadian Borrower, Bank of America, N.A., as Administrative Agent, Swing Line Lender and an L/C Issuer, and each Lender and L/C Issuer from time to time party thereto (incorporated by reference to Exhibit 10.1 of Registrant’s Form 8-K filed October 9, 2018; File No. 001-32318). |
|
|
|
|
|
10.2 |
|
|
|
|
|
|
|
10.3 |
|
Devon Energy Corporation 2009 Long-Term Incentive Plan (as amended and restated effective June 6, 2012) (incorporated by reference to Exhibit 10.2 to the Registrant’s Form 8-K filed June 8, 2012; File No. 001-32318).** |
|
|
|
|
|
10.4 |
|
Devon Energy Corporation 2015 Long-Term Incentive Plan (incorporated by reference to Exhibit 99.1 to Registrant’s Form S-8 filed June 3, 2015; File No. 333-204666).** |
|
|
|
|
|
10.5
|
|
Devon Energy Corporation 2017 Long-Term Incentive Plan (incorporated by reference to Exhibit 99.1 to Registrant’s Form S-8 filed June 7, 2017; File No. 333-218561).** |
|
|
|
|
|
10.6 |
|
2013 Amendment (effective as of March 6, 2013) to the Devon Energy Corporation 2009 Long-Term Incentive Plan (as amended and restated effective June 6, 2012) (incorporated by reference to Exhibit 10.1 to Registrant’s Form 10-Q filed May 1, 2013; File No. 001-32318).** |
|
|
|
|
|
10.7 |
|
Devon Energy Corporation Annual Incentive Compensation Plan (amended and restated effective as of January 1, 2017) (incorporated by reference to Exhibit 10.1 to Registrant’s Form 8-K filed June 12, 2017; File No. 001-32318).** |
|
|
|
|
|
10.8 |
|
Devon Energy Corporation Non-Qualified Deferred Compensation Plan (amended and restated effective as of April 15, 2014) (incorporated by reference to Exhibit 10.1 to Registrant’s Form 10-Q filed August 6, 2014; File No. 001-32318).** |
|
|
|
|
|
10.9 |
|
Amendment 2014-2, executed May 9, 2014, to the Devon Energy Corporation Non-Qualified Deferred Compensation Plan (amended and restated effective April 15, 2014) (incorporated by reference to Exhibit 10.11 to Registrant’s Form 10-K filed February 20, 2015; File No. 001-32318).** |
|
|
|
|
|
10.10 |
|
Amendment 2016-1, executed October 20, 2016, to the Devon Energy Corporation Non-Qualified Deferred Compensation Plan (amended and restated effective April 15, 2014) (incorporated by reference to Exhibit 10.13 to Registrant’s Form 10-K filed February 15, 2017; File No. 001-32318).** |
|
|
|
|
|
10.11
|
|
Amendment 2018-1, executed August 21, 2018, to the Devon Energy Corporation Non-Qualified Deferred Compensation Plan (amended and restated effective April 15, 2014) (incorporated by reference to Exhibit 10.10 to Registrant’s Form 10-K filed February 20, 2019; File No. 001-32318).** |
|
|
|
|
|
10.12 |
|
Devon Energy Corporation Benefit Restoration Plan (amended and restated effective January 1, 2012) (incorporated by reference to Exhibit 10.15 to Registrant’s Form 10-K filed February 24, 2012; File No. 001-32318).** |
|
|
|
|
|
10.13 |
|
Amendment 2014-1, executed March 7, 2014, to the Devon Energy Corporation Benefit Restoration Plan (amended and restated effective January 1, 2012) (incorporated by reference to Exhibit 10.6 to Registrant’s Form 10-Q filed May 9, 2014; File No. 001-32318).** |
|
|
|
|
|
10.14 |
|
Amendment 2015-1, executed April 15, 2015, to the Devon Energy Corporation Benefit Restoration Plan (amended and restated effective January 1, 2012) (incorporated by reference to Exhibit 10.1 to Registrant’s Form 10-Q filed May 6, 2015; File No. 001-32318).** |
|
|
|
|
|
10.15 |
|
Amendment 2016-1, executed October 20, 2016, to the Devon Energy Corporation Benefit Restoration Plan (amended and restated effective January 1, 2012) (incorporated by reference to Exhibit 10.17 to Registrant’s Form 10-K filed February 15, 2017; File No. 001-32318).** |
104
|
Exhibit No. |
|
Description |
|
|
|
|
|
10.16 |
|
Devon Energy Corporation Defined Contribution Restoration Plan (amended and restated effective January 1, 2012) (incorporated by reference to Exhibit 10.16 to Registrant’s Form 10-K filed February 24, 2012; File No. 001-32318).** |
|
|
|
|
|
10.17 |
|
Amendment 2014-1, executed March 7, 2014, to the Devon Energy Corporation Defined Contribution Restoration Plan (amended and restated effective January 1, 2012) (incorporated by reference to Exhibit 10.7 to Registrant’s Form 10-Q filed May 9, 2014; File No. 001-32318).** |
|
|
|
|
|
10.18 |
|
Amendment 2016-1, executed October 20, 2016, to the Devon Energy Corporation Defined Contribution Restoration Plan (amended and restated effective January 1, 2012) (incorporated by reference to Exhibit 10.20 to Registrant’s Form 10-K filed February 15, 2017; File No. 001-32318).** |
|
|
|
|
|
10.19 |
|
Amendment 2018-1, executed August 21, 2018, to the Devon Energy Corporation Defined Contribution Restoration Plan (amended and restated effective January 1, 2012) (incorporated by reference to Exhibit 10.18 to Registrant’s Form 10-K filed February 20, 2019; File No. 001-32318).** |
|
|
|
|
|
10.20 |
|
Amendment 2019-1, executed June 19, 2019, to the Devon Energy Corporation Defined Contribution Restoration Plan (as amended and restated effective January 1, 2012) (incorporated by reference to Exhibit 10.1 to Registrant’s Form 10-Q filed August 7, 2019; File No. 001-32318).** |
|
|
|
|
|
10.21 |
|
Devon Energy Corporation Supplemental Contribution Plan (amended and restated effective January 1, 2012) (incorporated by reference to Exhibit 10.17 to Registrant’s Form 10-K filed February 24, 2012; File No. 001-32318).** |
|
|
|
|
|
10.22 |
|
Amendment 2014-1, executed March 7, 2014, to the Devon Energy Corporation Supplemental Contribution Plan (amended and restated effective January 1, 2012) (incorporated by reference to Exhibit 10.8 to Registrant’s Form 10-Q filed May 9, 2014; File No. 001-32318).** |
|
|
|
|
|
10.23 |
|
Amendment 2016-1, executed October 20, 2016, to the Devon Energy Corporation Supplemental Contribution Plan (amended and restated effective January 1, 2012) (incorporated by reference to Exhibit 10.23 to Registrant’s Form 10-K filed February 15, 2017; File No. 001-32318).** |
|
|
|
|
|
10.24 |
|
Amendment 2019-1, executed June 19, 2019, to the Devon Energy Corporation Supplemental Contribution Plan (as amended and restated effective January 1, 2012) (incorporated by reference to Exhibit 10.2 to Registrant’s Form 10-Q filed August 7, 2019; File No. 001-32318).** |
|
|
|
|
|
10.25 |
|
Devon Energy Corporation Supplemental Executive Retirement Plan (amended and restated effective January 1, 2012) (incorporated by reference to Exhibit 10.18 to Registrant’s Form 10-K filed February 24, 2012; File No. 001-32318).** |
|
|
|
|
|
10.26 |
|
Amendment 2016-1, executed October 20, 2016, to the Devon Energy Corporation Supplemental Executive Retirement Plan (amended and restated effective January 1, 2012) (incorporated by reference to Exhibit 10.25 to Registrant’s Form 10-K filed February 15, 2017; File No. 001-32318).** |
|
|
|
|
|
10.27 |
|
Amendment 2019-1, executed June 19, 2019, to the Devon Energy Corporation Supplemental Executive Retirement Plan (as amended and restated effective January 1, 2012) (incorporated by reference to Exhibit 10.3 to Registrant’s Form 10-Q filed August 7, 2019; File No. 001-32318).** |
|
|
|
|
|
10.28 |
|
Devon Energy Corporation Supplemental Retirement Income Plan (amended and restated effective January 1, 2012) (incorporated by reference to Exhibit 10.19 to Registrant’s Form 10-K filed February 24, 2012; File No. 001-32318).** |
|
|
|
|
|
10.29 |
|
Amendment 2014-1, executed March 7, 2014, to the Devon Energy Corporation Supplemental Retirement Income Plan (amended and restated effective January 1, 2012) (incorporated by reference to Exhibit 10.9 to Registrant’s Form 10-Q filed May 9, 2014; File No. 001-32318).** |
|
|
|
|
|
10.30 |
|
Amendment 2016-1, executed October 20, 2016, to the Devon Energy Corporation Supplemental Retirement Income Plan (amended and restated effective January 1, 2012) (incorporated by reference to Exhibit 10.28 to Registrant’s Form 10-K filed February 15, 2017; File No. 001-32318).** |
105
|
Exhibit No. |
|
Description |
|
|
|
|
|
10.31 |
|
Amendment 2019-1, effective September 10, 2019, to the Devon Energy Corporation Supplemental Retirement Income Plan (amended and restated effective January 1, 2012) (incorporated by reference to Exhibit 10.2 to Registrant’s Form 10-Q filed November 6, 2019; File No. 001-32318).** |
|
|
|
|
|
10.32 |
|
Devon Energy Corporation Incentive Savings Plan (amended and restated effective January 1, 2018) (incorporated by reference to Exhibit 10.28 to Registrant’s Form 10-K filed February 21, 2018; File No. 001-32318).** |
|
|
|
|
|
10.33 |
|
Amendment 2018-1, executed December 14, 2018, to the Devon Energy Corporation Incentive Savings Plan (amended and restated effective January 1, 2018) (incorporated by reference to Exhibit 10.28 to Registrant’s Form 10-K filed February 20, 2019; File No. 001-32318).** |
|
|
|
|
|
10.34 |
|
Amendment 2019-1, executed June 19, 2019, to the Devon Energy Corporation Incentive Savings Plan (as amended and restated effective January 1, 2018) (incorporated by reference to Exhibit 10.4 to Registrant’s Form 10-Q filed August 7, 2019; File No. 001-32318).** |
|
|
|
|
|
10.35 |
|
Amended and Restated Form of Employment Agreement between Registrant and certain executive officers (incorporated by reference to Exhibit 10.19 to Registrant’s Form 10-K filed February 27, 2009; File No. 001-32318).** |
|
|
|
|
|
10.36 |
|
Form of Amendment No. 1 to the Amended and Restated Employment Agreement between Registrant and certain executive officers (incorporated by reference to Exhibit 10.1 to Registrant’s Form 8-K filed April 25, 2011; File No. 001-32318).** |
|
|
|
|
|
10.37 |
|
Form of Employment Agreement between Registrant and certain executive officers (incorporated by reference to Exhibit 10.22 to Registrant’s Form 10-K filed February 28, 2014; File No. 001-32318).** |
|
|
|
|
|
10.38 |
|
Employment Agreement, dated April 19, 2017, by and between Registrant and Mr. Jeffrey L. Ritenour (incorporated by reference to Exhibit 10.1 to Registrant’s Form 8-K, filed on April 20, 2017; File No. 001-32318).** |
|
|
|
|
|
10.39 |
|
Employment Agreement, dated effective September 13, 2019, by and between Registrant and Mr. David G. Harris (incorporated by reference to Exhibit 10.1 to Registrant’s Form 8-K filed September 16, 2019; File No. 001-32318).** |
|
|
|
|
|
10.40 |
|
Form of Indemnity Agreement between Registrant and non-management directors.** |
|
|
|
|
|
10.41 |
|
Form of Notice of Grant of Performance Restricted Stock Award and Award Agreement under the 2015 Long-Term Incentive Plan between Registrant and David A. Hager for performance based restricted stock awarded (incorporated by reference to Exhibit 10.1 to Registrant’s Form 10-Q filed November 4, 2015; File No. 001-32318).** |
|
|
|
|
|
10.42 |
|
Form of Notice of Grant of Performance Restricted Stock Award and Award Agreement under the 2015 Long-Term Incentive Plan between Registrant and executive officers for performance based restricted stock awarded (incorporated by reference to Exhibit 10.2 to Registrant’s Form 10-Q filed May 4, 2016; File No. 001-32318).** |
|
|
|
|
|
10.43 |
|
2017 Form of Notice of Grant of Performance Restricted Stock Award and Award Agreement under the 2015 Long-Term Incentive Plan between Registrant and executive officers for performance based restricted stock awarded (incorporated by reference to Exhibit 10.1 to Registrant’s Form 10-Q filed May 3, 2017; File No. 001-32318).** |
|
|
|
|
|
10.44 |
|
2018 Form of Notice of Grant of Restricted Stock Award and Award Agreement under the 2017 Long-Term Incentive Plan between Registrant and executive officers for restricted stock awarded (incorporated by reference to Exhibit 10.1 to Registrant’s Form 10-Q filed on May 2, 2018; File No. 001-32318).** |
|
|
|
|
106
|
Exhibit No. |
|
Description |
|
10.45 |
|
2019 Form of Notice of Grant of Restricted Stock Award and Award Agreement under the 2017 Long-Term Incentive Plan between Registrant and executive officers for restricted stock awarded |
|
|
|
|
|
10.46 |
|
2017 Form of Notice of Grant of Performance Share Unit Award and Award Agreement under the 2015 Long-Term Incentive Plan between Registrant and executive officers for performance based restricted share units awarded (incorporated by reference to Exhibit 10.2 to Registrant’s Form 10-Q filed May 3, 2017; File No. 001-32318).** |
|
|
|
|
|
10.47 |
|
2018 Form of Notice of Grant of Performance Share Unit Award and Award Agreement under the 2017 Long-Term Incentive Plan between Registrant and executive officers for performance based restricted share units awarded (incorporated by reference to Exhibit 10.2 to Registrant’s Form 10-Q filed May 2, 2018; File No. 001-32318).** |
|
|
|
|
|
10.48 |
|
2019 Form of Notice of Grant of Performance Share Unit Award and Award Agreement under the 2017 Long-Term Incentive Plan between Devon Energy Corporation and executive officers for performance based restricted share units awarded (incorporated by reference to Exhibit 10.2 to Registrant’s Form 10-Q filed May 1, 2019; File No. 001-32318).** |
|
|
|
|
|
10.49 |
|
Form of Notice of Grant of Nonqualified Stock Options and Award Agreement under the 2009 Long-Term Incentive Plan between Registrant and certain employees and executive officers for nonqualified stock options granted (incorporated by reference to Exhibit 10.16 to Registrant’s Form 10-K filed February 25, 2011; File No. 001-32318).** |
|
|
|
|
|
10.50 |
|
|
|
|
|
|
|
21 |
|
|
|
|
|
|
|
23.1 |
|
|
|
|
|
|
|
23.2 |
|
|
|
|
|
|
|
31.1 |
|
|
|
|
|
|
|
31.2 |
|
|
|
|
|
|
|
32.1 |
|
|
|
|
|
|
|
32.2 |
|
|
|
|
|
|
|
99 |
|
|
|
|
|
|
|
101.INS |
|
Inline XBRL Instance Document – the XBRL Instance Document does not appear in the Interactive Data File because its XBRL tags are embedded within the Inline XBRL document. |
|
|
|
|
|
101.SCH |
|
Inline XBRL Taxonomy Extension Schema Document. |
|
|
|
|
|
101.CAL |
|
Inline XBRL Taxonomy Extension Calculation Linkbase Document. |
|
|
|
|
|
101.DEF |
|
Inline XBRL Taxonomy Extension Definition Linkbase Document. |
|
|
|
|
|
101.LAB |
|
Inline XBRL Taxonomy Extension Labels Linkbase Document. |
|
|
|
|
|
101.PRE |
|
Inline XBRL Taxonomy Extension Presentation Linkbase Document. |
|
|
|
|
|
104 |
|
Cover Page Interactive Data File (formatted as Inline XBRL and contained in Exhibit 101). |
|
* |
Portions of this exhibit have been omitted in accordance with Item 601(b)(2)(ii) of Regulation S-K. |
**Indicates management contract or compensatory plan or arrangement.
Item 16. Form 10-K Summary
Not applicable.
107
SIGNATURES
Pursuant to the requirements of Section 13 or 15(d) of the Securities Exchange Act of 1934, the Registrant has duly caused this report to be signed on its behalf by the undersigned, thereunto duly authorized.
|
|
|
DEVON ENERGY CORPORATION |
|
|
|
|
|
|
By: |
/s/ JEFFREY L. RITENOUR |
|
|
|
Jeffrey L. Ritenour |
|
|
|
Executive Vice President and |
February 19, 2020
Pursuant to the requirements of the Securities Exchange Act of 1934, this report has been signed below by the following persons on behalf of the Registrant and in the capacities and on the dates indicated.
|
/s/ DAVID A. HAGER |
|
President, Chief Executive Officer and |
February 19, 2020 |
|
David A. Hager |
|
Director (Principal executive officer) |
|
|
|
|
|
|
|
/s/ JEFFREY L. RITENOUR |
|
Executive Vice President |
February 19, 2020 |
|
Jeffrey L. Ritenour |
|
and Chief Financial Officer (Principal financial officer) |
|
|
|
|
|
|
|
/s/ JEREMY D. HUMPHERS |
|
Senior Vice President |
February 19, 2020 |
|
Jeremy D. Humphers |
|
and Chief Accounting Officer (Principal accounting officer) |
|
|
|
|
|
|
|
/s/ DUANE C. RADTKE |
|
Chairman of the Board |
February 19, 2020 |
|
Duane C. Radtke |
|
|
|
|
|
|
|
|
|
/s/ BARBARA M. BAUMANN |
|
Director |
February 19, 2020 |
|
Barbara M. Baumann |
|
|
|
|
|
|
|
|
|
/s/ JOHN E. BETHANCOURT |
|
Director |
February 19, 2020 |
|
John E. Bethancourt |
|
|
|
|
|
|
|
|
|
/s/ ANN G. FOX |
|
Director |
February 19, 2020 |
|
Ann G. Fox |
|
|
|
|
|
|
|
|
|
/s/ ROBERT H. HENRY |
|
Director |
February 19, 2020 |
|
Robert H. Henry |
|
|
|
|
|
|
|
|
|
/s/ MICHAEL M. KANOVSKY |
|
Director |
February 19, 2020 |
|
Michael M. Kanovsky |
|
|
|
|
|
|
|
|
|
/s/ JOHN KRENICKI JR. |
|
Director |
February 19, 2020 |
|
John Krenicki Jr. |
|
|
|
|
|
|
|
|
|
/s/ ROBERT A. MOSBACHER, JR. |
|
Director |
February 19, 2020 |
|
Robert A. Mosbacher, Jr. |
|
|
|
|
|
|
|
|
|
/s/ KEITH O. RATTIE |
|
Director |
February 19, 2020 |
|
Keith O. Rattie |
|
|
|
|
|
|
|
|
|
/s/ MARY P. RICCIARDELLO |
|
Director |
February 19, 2020 |
|
Mary P. Ricciardello |
|
|
|
108