UNITED STATES
SECURITIES AND EXCHANGE COMMISSION
WASHINGTON, D.C. 20549
FORM
CURRENT REPORT
Pursuant to Section 13 or 15(d) of the Securities Exchange Act of 1934
Date of Report (Date of earliest event reported)
(Exact name of registrant as specified in its charter)
(State or other jurisdiction | (Commission | (IRS Employer |
(Address of principal executive offices) |
|
(
(Registrant's telephone number,
including area code)
Check the appropriate box below if the Form 8-K filing is intended to simultaneously satisfy the filing obligation of the registrant under any of the following provisions:
Indicate by check mark whether the registrant is an emerging growth company as defined in Rule 405 of the Securities Act of 1933 (§230.405 of this chapter) or Rule 12b-2 of the Securities Exchange Act of 1934 (§240.12b-2 of this chapter). Emerging growth company
If an emerging growth company, indicate by check mark if the registrant has elected not to use the extended transition period for complying with any new or revised financial accounting standards provided pursuant to Section 13(a) of the Exchange Act. ◻
CITIGROUP INC.
Current Report on Form 8-K
Item 2.02 Results of Operations and Financial Condition.
On January 14, 2020, Citigroup Inc. announced its results for the quarter and year ended December 31, 2019. A copy of the related press release, filed as Exhibit 99.1 to this Form 8-K, is incorporated herein by reference in its entirety and shall be deemed to be “filed” for purposes of the Securities Exchange Act of 1934, as amended (the Act).
In addition, a copy of the Citigroup Inc. Quarterly Financial Data Supplement for the quarter and year ended December 31, 2019 is being furnished as Exhibit 99.2 to this Form 8-K and shall not be deemed to be “filed” for purposes of Section 18 of the Act or otherwise subject to the liabilities of that section.
Item 9.01 Financial Statements and Exhibits.
(d) Exhibits.
Exhibit Number | ||
99.1 | ||
99.2 | Citigroup Inc. Quarterly Financial Data Supplement for the quarter and year ended December 31, 2019. | |
99.3 | ||
104.1 | See the cover page of this Current Report on Form 8-K, formatted in Inline XBRL. |
SIGNATURE
Pursuant to the requirements of the Securities Exchange Act of 1934, the registrant has duly caused this report to be signed on its behalf by the undersigned hereunto duly authorized.
CITIGROUP INC. | ||
Dated: January 14, 2020 | ||
By: | /s/ Raja J. Akram | |
Raja J. Akram | ||
Controller and Chief Accounting Officer |
Exhibit 99.1
For Immediate Release Citigroup Inc. (NYSE: C) January 14, 2020 |
||
FOURTH QUARTER AND FULL YEAR 2019 ReSULTS AND KEY METRICS |
CEO COMMENTARY |
|
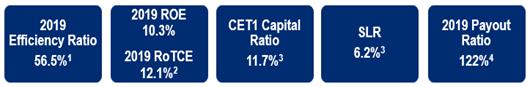
FOURTH QUARTER 2019: NET INCOME OF $5.0 BILLION ($2.15 PER SHARE) REVENUES OF $18.4 BILLION RETURNED $6.2 BILLION OF CAPITAL TO COMMON SHAREHOLDERS ($22.3 BILLION IN FULL YEAR 2019) REPURCHASED 69 MILLION COMMON SHARES (264 MILLION IN FULL YEAR 2019) BOOK VALUE PER SHARE OF $82.90 TANGIBLE BOOK VALUE PER SHARE OF $70.395
New York, January 14, 2020 – Citigroup Inc. today reported net income for the fourth quarter 2019 of $5.0 billion, or $2.15 per diluted share, on revenues of $18.4 billion. This compared to net income of $4.3 billion, or $1.64 per diluted share, on revenues of $17.1 billion for the fourth quarter 2018.
Revenues increased 7% from the prior-year period, with strong results across both the Institutional Clients Group (ICG) and Global Consumer Banking (GCB). Net income increased 15% from the prior-year period, driven by the higher revenues and a lower effective tax rate, partially offset by higher expenses and cost of credit. Earnings per share of $2.15 increased 31% from the prior-year period, primarily driven by a 10% reduction in average diluted shares outstanding and the growth in net income. These results include a net benefit of approximately $0.25 per share in the current quarter related to discrete tax items, recorded in Corporate / Other 6.
For the full year 2019, Citigroup reported net income of $19.4 billion on revenues of $74.3 billion, compared to net income of $18.0 billion on revenues of $72.9 billion for the full year 2018.
Percentage comparisons throughout this press release are calculated for the fourth quarter 2019 versus the fourth quarter 2018, unless otherwise specified. |
|
Citi CEO Michael Corbat said, “Our earnings of $5 billion for the fourth quarter marked a strong finish to 2019. Our full year Return on Tangible Common Equity of over 12% exceeded our target. Due to good client engagement, we drove balanced growth across our products and geographies, closing the year with 16 consecutive quarters of loan and deposit growth. The U.S. consumer franchise saw continued strong growth in Branded Cards and sustained its momentum in attracting digital deposits. Investment Banking continued to gain share and, despite a lower rate environment, Treasury and Trade Solutions grew revenue as we work to ensure our global network remains indispensable to our clients. With increased revenues and disciplined expense management, we had positive operating leverage, even as we continued to make significant investments in the franchise.
“We ended 2019 with a Common Equity Tier One ratio of 11.7% and we are on track to deliver our commitment of returning over $60 billion of capital to our shareholders over a three-year period. We enter 2020 in a strong competitive position, from capital and liquidity to talent and technology. We continue to invest in areas where we see opportunities for client-led growth and in our infrastructure, in light of the enduring need to be an indisputably strong and stable institution,” Mr. Corbat concluded.
|
1
Citigroup |
|
4Q'19 |
|
3Q'19 |
|
4Q'18 |
|
QoQ% |
|
YoY% |
|
|
2019 |
|
2018 |
|
|
||||||||||||||||||||||
Global Consumer Banking |
|
8,459 |
|
8,289 |
|
8,081 |
|
2% |
|
5% |
|
|
32,971 |
|
32,339 |
|
2% | ||||||||||||||||||||||
Institutional Clients Group |
|
9,377 |
|
9,851 |
|
8,543 |
|
(5)% |
|
10% |
|
|
39,301 |
|
38,325 |
|
3% | ||||||||||||||||||||||
Corporate / Other |
|
542 |
|
434 |
|
500 |
|
25% |
|
8% |
|
|
2,014 |
|
2,190 |
|
(8)% |
||||||||||||||||||||||
Total Revenues |
|
$ |
18,378 |
|
$ |
18,574 |
|
$ |
17,124 |
|
(1)% |
|
7% |
|
|
$ |
74,286 |
|
$ |
72,854 |
|
2% | |||||||||||||||||
|
|
|
|
|
|
|
|
|
|
|
|
|
|
|
|
|
|
||||||||||||||||||||||
Expenses |
|
$ |
10,454 |
|
$ |
10,464 |
|
$ |
9,893 |
|
- |
|
6% |
|
|
$ |
42,002 |
|
$ |
41,841 |
|
- |
|||||||||||||||||
|
|
|
|
|
|
|
|
|
|
|
|
|
|
|
|
|
|
||||||||||||||||||||||
Net Credit Losses |
|
1,944 |
|
1,913 |
|
1,786 |
|
2% |
|
9% |
|
|
7,768 |
|
7,113 |
|
9% | ||||||||||||||||||||||
Credit Reserve Build / (Release)(a) |
|
253 |
|
158 |
|
111 |
|
60% |
|
NM |
|
|
542 |
|
354 |
|
53% | ||||||||||||||||||||||
Provision for Benefits and Claims |
|
25 |
|
17 |
|
28 |
|
47% |
|
(11)% |
|
|
73 |
|
101 |
|
(28)% |
||||||||||||||||||||||
Total Cost of Credit |
|
$ |
2,222 |
|
$ |
2,088 |
|
$ |
1,925 |
|
6% |
|
15% |
|
|
$ |
8,383 |
|
$ |
7,568 |
|
11% | |||||||||||||||||
|
|
|
|
|
|
|
|
|
|
|
|
|
|
|
|
|
|
||||||||||||||||||||||
Income from Continuing Operations Before Taxes |
|
$ |
5,702 |
|
$ |
6,022 |
|
$ |
5,306 |
|
(5)% |
|
7% |
|
|
$ |
23,901 |
|
$ |
23,445 |
|
2% | |||||||||||||||||
Provision for Income Taxes |
|
703 |
|
1,079 |
|
1,001 |
|
(35)% |
|
(30)% |
|
|
4,430 |
|
5,357 |
|
(17)% |
||||||||||||||||||||||
Income from Continuing Operations |
|
$ |
4,999 |
|
$ |
4,943 |
|
$ |
4,305 |
|
1% |
|
16% |
|
|
$ |
19,471 |
|
$ |
18,088 |
|
8% | |||||||||||||||||
Net Income (Loss) from Discontinued Operations |
|
(4) |
|
(15) |
|
(8) |
|
73% |
|
50% |
|
|
(4) |
|
(8) |
|
50% | ||||||||||||||||||||||
Non-Controlling Interest |
|
16 |
|
15 |
|
(16) |
|
7% |
|
NM |
|
|
66 |
|
35 |
|
89% | ||||||||||||||||||||||
Citigroup Net Income |
|
$ |
4,979 |
|
$ |
4,913 |
|
$ |
4,313 |
|
1% |
|
15% |
|
|
$ |
19,401 |
|
$ |
18,045 |
|
8% | |||||||||||||||||
|
|
|
|
|
|
|
|
|
|
|
|
|
|
|
|
|
|
||||||||||||||||||||||
|
|
|
|
|
|
|
|
|
|
|
|
|
|
|
|
|
|
||||||||||||||||||||||
Revenues |
|
|
|
|
|
|
|
|
|
|
|
|
|
|
|
|
|
||||||||||||||||||||||
North America |
|
8,567 |
|
8,423 |
|
8,033 |
|
2% |
|
7% |
|
|
33,857 |
|
33,351 |
|
2% | ||||||||||||||||||||||
EMEA |
|
2,738 |
|
3,138 |
|
2,633 |
|
(13)% |
|
4% |
|
|
12,006 |
|
11,770 |
|
2% | ||||||||||||||||||||||
Latin America |
|
2,674 |
|
2,563 |
|
2,439 |
|
4% |
|
10% |
|
|
10,404 |
|
10,263 |
|
1% | ||||||||||||||||||||||
Asia |
|
3,857 |
|
4,016 |
|
3,519 |
|
(4)% |
|
10% |
|
|
16,005 |
|
15,280 |
|
5% | ||||||||||||||||||||||
Corporate / Other |
|
542 |
|
434 |
|
500 |
|
25% |
|
8% |
|
|
2,014 |
|
2,190 |
|
(8)% |
||||||||||||||||||||||
|
|
|
|
|
|
|
|
|
|
|
|
|
|
|
|
|
|
||||||||||||||||||||||
|
|
|
|
|
|
|
|
|
|
|
|
|
|
|
|
|
|
||||||||||||||||||||||
EOP Assets ($B) |
|
1,951 |
|
2,015 |
|
1,917 |
|
(3)% |
|
2% |
|
|
1,951 |
|
1,917 |
|
2% | ||||||||||||||||||||||
EOP Loans ($B) |
|
699 |
|
692 |
|
684 |
|
1% |
|
2% |
|
|
699 |
|
684 |
|
2% | ||||||||||||||||||||||
EOP Deposits ($B) |
|
1,071 |
|
1,088 |
|
1,013 |
|
(2)% |
|
6% |
|
|
1,071 |
|
1,013 |
|
6% | ||||||||||||||||||||||
|
|
|
|
|
|
|
|
|
|
|
|
|
|
|
|
|
|
||||||||||||||||||||||
|
|
|
|
|
|
|
|
|
|
|
|
|
|
|
|
|
|
||||||||||||||||||||||
Common Equity Tier 1 Capital Ratio(3) |
|
11.7% |
|
11.6% |
|
11.9% |
|
|
|
|
|
|
|
|
|
|
|
||||||||||||||||||||||
Supplementary Leverage Ratio(3) |
|
6.2% |
|
6.3% |
|
6.4% |
|
|
|
|
|
|
|
|
|
|
|
||||||||||||||||||||||
Return on Average Common Equity |
|
10.6% |
|
10.4% |
|
9.0% |
|
|
|
|
|
|
10.3% |
|
9.4% |
|
|
||||||||||||||||||||||
Book Value per Share |
|
$ |
82.90 |
|
$ |
81.02 |
|
$ |
75.05 |
|
2% |
|
10% |
|
|
|
|
|
|
|
|||||||||||||||||||
Tangible Book Value per Share |
|
$ |
70.39 |
|
$ |
69.03 |
|
$ |
63.79 |
|
2% |
|
10% |
|
|
|
|
|
|
|
Note: Please refer to the Appendices and Footnotes at the end of this press release for additional information.
(a) Includes provision for unfunded lending commitments.
Citigroup
Citigroup revenues of $18.4 billion in the fourth quarter 2019 increased 7%, reflecting the higher revenues across both GCB and ICG, in addition to growth in Corporate / Other.
Citigroup operating expenses of $10.5 billion in the fourth quarter 2019 increased 6%, reflecting higher compensation and volume-related expenses, along with continued investments in the franchise, partially offset by efficiency savings and the wind-down of legacy assets.
Citigroup cost of credit of $2.2 billion in the fourth quarter 2019 increased 15%, primarily driven by volume growth and seasoning in North America GCB, along with volume growth and several episodic downgrades in ICG, while overall credit quality remained stable.
Citigroup net income of $5.0 billion in the fourth quarter 2019 increased 15%, driven by the higher revenues and the lower effective tax rate, partially offset by the growth in expenses and cost of credit. Citigroup’s effective tax rate was 12% in the
2
current quarter compared to 19% in the fourth quarter 2018. Excluding the previously mentioned discrete tax items in the quarter, the tax rate would have been approximately 22%.
Citigroup’s allowance for loan losses was $12.8 billion at quarter end, or 1.84% of total loans, compared to $12.3 billion, or 1.81% of total loans, at the end of the prior-year period. Total non-accrual assets grew 12% from the prior-year period to $4.1 billion. Consumer non-accrual loans declined 10% to $1.8 billion and corporate non-accrual loans grew 45% to $2.2 billion.
Citigroup’s end-of-period loans were $699 billion as of quarter end, up 2% from the prior-year period. Excluding the impact of foreign exchange translation7, end-of-period loans also grew 2%, driven by 3% aggregate growth in ICG and GCB, partially offset by the continued wind-down of legacy assets in Corporate / Other.
3
Citigroup’s end-of-period deposits were $1.1 trillion as of quarter end, an increase of 6% from the prior-year period. In constant dollars, Citigroup’s end-of-period deposits also increased 6%, driven by 7% growth in GCB and 6% growth in ICG.
Citigroup’s book value per share of $82.90 and tangible book value per share of $70.39 each increased 10% versus the prior-year period, driven by net income and a reduced share count. At quarter end, Citigroup’s CET1 Capital ratio was 11.7%, up from the prior quarter, driven by a reduction in risk-weighted assets. Citigroup’s SLR for the fourth quarter 2019 was 6.2%, a decrease from the prior quarter. During the quarter, Citigroup repurchased 69 million common shares and returned a total of $6.2 billion to common shareholders in the form of common share repurchases and dividends.
Global Consumer Banking ($ in millions, except as otherwise noted) |
|
4Q'19 |
|
3Q'19 |
|
4Q'18 |
|
QoQ% |
|
YoY% |
|
|
2019 |
|
2018 |
|
|
|||||
North America(a) |
|
5,253 |
|
5,179 |
|
5,073 |
|
1% |
|
4% |
|
|
20,398 |
|
19,829 |
|
3% | |||||
Latin America(b) |
|
|
1,377 |
|
|
1,269 |
|
|
1,250 |
|
9% |
|
10% |
|
|
|
5,238 |
|
|
5,309 |
|
(1)% |
Asia(c) |
|
|
1,829 |
|
|
1,841 |
|
|
1,758 |
|
(1)% |
|
4% |
|
|
|
7,335 |
|
|
7,201 |
|
2% |
Total Revenues |
|
$ |
8,459 |
|
$ |
8,289 |
|
$ |
8,081 |
|
2% |
|
5% |
|
|
$ |
32,971 |
|
$ |
32,339 |
|
2% |
|
|
|
|
|
|
|
|
|
|
|
|
|
|
|
|
|
|
|
|
|
|
|
Expenses |
|
$ |
4,373 |
|
$ |
4,368 |
|
$ |
4,379 |
|
- |
|
- |
|
|
$ |
17,628 |
|
$ |
17,786 |
|
(1)% |
|
|
|
|
|
|
|
|
|
|
|
|
|
|
|
|
|
|
|
|
|
|
|
Net Credit Losses |
|
|
1,842 |
|
|
1,802 |
|
|
1,733 |
|
2% |
|
6% |
|
|
|
7,382 |
|
|
6,884 |
|
7% |
Credit Reserve Build / (Release)(d) |
|
|
122 |
|
|
131 |
|
|
85 |
|
(7)% |
|
44% |
|
|
|
440 |
|
|
568 |
|
(23)% |
Provision for Benefits and Claims |
|
|
25 |
|
|
17 |
|
|
28 |
|
47% |
|
(11)% |
|
|
|
73 |
|
|
103 |
|
(29)% |
Total Cost of Credit |
|
$ |
1,989 |
|
$ |
1,950 |
|
$ |
1,846 |
|
2% |
|
8% |
|
|
$ |
7,895 |
|
$ |
7,555 |
|
5% |
|
|
|
|
|
|
|
|
|
|
|
|
|
|
|
|
|
|
|
|
|
|
|
Net Income |
|
$ |
1,575 |
|
$ |
1,501 |
|
$ |
1,407 |
|
5% |
|
12% |
|
|
$ |
5,696 |
|
$ |
5,302 |
|
7% |
|
|
|
|
|
|
|
|
|
|
|
|
|
|
|
|
|
|
|
|
|
|
|
|
|
|
|
|
|
|
|
|
|
|
|
|
|
|
|
|
|
|
|
|
|
|
Retail Banking |
|
|
3,124 |
|
|
3,117 |
|
|
3,029 |
|
- |
|
3% |
|
|
|
12,549 |
|
|
12,627 |
|
(1)% |
Cards |
|
|
5,335 |
|
|
5,172 |
|
|
5,052 |
|
3% |
|
6% |
|
|
|
20,422 |
|
|
19,712 |
|
4% |
Total Revenues |
|
$ |
8,459 |
|
$ |
8,289 |
|
$ |
8,081 |
|
2% |
|
5% |
|
|
$ |
32,971 |
|
$ |
32,339 |
|
2% |
|
|
|
|
|
|
|
|
|
|
|
|
|
|
|
|
|
|
|
|
|
|
|
|
|
|
|
|
|
|
|
|
|
|
|
|
|
|
|
|
|
|
|
|
|
|
Key Indicators ($B) |
|
|
|
|
|
|
|
|
|
|
|
|
|
|
|
|
|
|
|
|
|
|
Retail Banking Average Loans |
|
|
123 |
|
|
120 |
|
|
117 |
|
3% |
|
5% |
|
|
|
120 |
|
|
118 |
|
2% |
Retail Banking Average Deposits |
|
|
283 |
|
|
277 |
|
|
267 |
|
2% |
|
6% |
|
|
|
277 |
|
|
269 |
|
3% |
Investment AUMs |
|
|
176 |
|
|
167 |
|
|
148 |
|
6% |
|
19% |
|
|
|
176 |
|
|
148 |
|
19% |
Cards Average Loans |
|
|
168 |
|
|
165 |
|
|
163 |
|
2% |
|
3% |
|
|
|
164 |
|
|
160 |
|
2% |
Cards Purchase Sales |
|
|
152 |
|
|
142 |
|
|
144 |
|
7% |
|
5% |
|
|
|
564 |
|
|
534 |
|
6% |
Note: Please refer to the Appendices and Footnotes at the end of this press release for additional information.
(a) Includes gain of approximately $150 million related to the sale of the Hilton portfolio in 1Q'18.
(b) Includes gain of approximately $250 million related to the sale of an asset management business in 3Q'18.
(c) Asia GCB includes the results of operations of GCB activities in certain EMEA countries for all periods presented.
(d) Includes provision for unfunded lending commitments.
Global Consumer Banking
GCB revenues of $8.5 billion increased 5% on a reported basis and 4% in constant dollars, reflecting growth in each of the three regions.
North America GCB revenues of $5.3 billion increased 4%. Citi-Branded Cards revenues of $2.4 billion increased 10%, reflecting volume growth and spread expansion. Retail Banking revenues of $1.1 billion decreased 4%, as deposit growth in both traditional and digital channels was more than offset by lower deposit spreads. Citi Retail Services revenues of $1.7 billion increased 1%, reflecting continued growth in loans and purchase sales across the majority of the portfolio.
Latin America GCB revenues of $1.4 billion increased 10% on a reported basis and 6% in constant dollars including several small, episodic gains, as well as higher deposit spreads and growth in cards revenues.
Asia GCB revenues of $1.8 billion increased 4% on both a reported basis and in constant dollars, driven by higher investment revenues.
GCB operating expenses of $4.4 billion were largely unchanged versus the prior year. In constant dollars, expenses decreased 1%, as efficiency savings more than offset continued investments in the franchise and volume-driven growth.
4
GCB cost of credit of $2.0 billion increased 8% on a reported basis and 7% in constant dollars. The increase was largely driven by higher net credit losses, primarily reflecting volume growth and seasoning in Citi-Branded Cards and Citi Retail Services in North America GCB.
GCB net income of $1.6 billion increased 12% on a reported basis and 11% in constant dollars, driven by the higher revenues and the lower expenses, partially offset by the higher cost of credit.
Institutional Clients Group |
|
4Q'19 |
|
3Q'19 |
|
4Q'18 |
|
QoQ% |
|
YoY% |
|
2019 |
|
2018 |
|
|
||||||
Treasury & Trade Solutions |
|
|
2,608 |
|
|
2,559 |
|
|
2,552 |
|
2% |
|
2% |
|
|
|
10,293 |
|
|
9,914 |
|
4% |
Investment Banking |
|
|
1,351 |
|
|
1,228 |
|
|
1,278 |
|
10% |
|
6% |
|
|
|
5,216 |
|
|
5,011 |
|
4% |
Private Bank |
|
|
847 |
|
|
865 |
|
|
797 |
|
(2)% |
|
6% |
|
|
|
3,458 |
|
|
3,398 |
|
2% |
Corporate Lending(a) |
|
|
732 |
|
|
715 |
|
|
732 |
|
2% |
|
- |
|
|
|
2,921 |
|
|
2,913 |
|
- |
Total Banking |
|
|
5,538 |
|
|
5,367 |
|
|
5,359 |
|
3% |
|
3% |
|
|
|
21,888 |
|
|
21,236 |
|
3% |
Fixed Income Markets(b) |
|
|
2,898 |
|
|
3,211 |
|
|
1,948 |
|
(10)% |
|
49% |
|
|
|
12,884 |
|
|
11,661 |
|
10% |
Equity Markets |
|
|
516 |
|
|
760 |
|
|
668 |
|
(32)% |
|
(23)% |
|
|
|
2,908 |
|
|
3,427 |
|
(15)% |
Securities Services |
|
|
647 |
|
|
664 |
|
|
653 |
|
(3)% |
|
(1)% |
|
|
|
2,631 |
|
|
2,631 |
|
- |
Other |
|
|
(129) |
|
|
(118) |
|
|
(190) |
|
(9)% |
|
32% |
|
|
|
(578) |
|
|
(675) |
|
14% |
Total Markets & Securities Services |
|
|
3,932 |
|
|
4,517 |
|
|
3,079 |
|
(13)% |
|
28% |
|
|
|
17,845 |
|
|
17,044 |
|
5% |
Product Revenues(a) |
|
$ |
9,470 |
|
$ |
9,884 |
|
$ |
8,438 |
|
(4)% |
|
12% |
|
|
$ |
39,733 |
|
$ |
38,280 |
|
4% |
Gain / (Loss) on Loan Hedges |
|
|
(93) |
|
|
(33) |
|
|
105 |
|
NM |
|
NM |
|
|
|
(432) |
|
|
45 |
|
NM |
Total Revenues |
|
$ |
9,377 |
|
$ |
9,851 |
|
$ |
8,543 |
|
(5)% |
|
10% |
|
|
$ |
39,301 |
|
$ |
38,325 |
|
3% |
|
|
|
|
|
|
|
|
|
|
|
|
|
|
|
|
|
|
|
|
|
|
|
Expenses |
|
$ |
5,446 |
|
$ |
5,611 |
|
$ |
5,040 |
|
(3)% |
|
8% |
|
|
$ |
22,224 |
|
$ |
21,780 |
|
2% |
|
|
|
|
|
|
|
|
|
|
|
|
|
|
|
|
|
|
|
|
|
|
|
Net Credit Losses |
|
|
115 |
|
|
110 |
|
|
56 |
|
5% |
|
NM |
|
|
|
394 |
|
|
208 |
|
89% |
Credit Reserve Build / (Release)(c) |
|
|
131 |
|
|
43 |
|
|
70 |
|
NM |
|
87% |
|
|
|
169 |
|
|
7 |
|
NM |
Total Cost of Credit |
|
$ |
246 |
|
$ |
153 |
|
$ |
126 |
|
61% |
|
95% |
|
|
$ |
563 |
|
$ |
215 |
|
NM |
|
|
|
|
|
|
|
|
|
|
|
|
|
|
|
|
|
|
|
|
|
|
|
Net Income |
|
$ |
2,867 |
|
$ |
3,221 |
|
$ |
2,610 |
|
(11)% |
|
10% |
|
|
$ |
12,904 |
|
$ |
12,557 |
|
3% |
|
|
|
|
|
|
|
|
|
|
|
|
|
|
|
|
|
|
|
|
|
|
|
|
|
|
|
|
|
|
|
|
|
|
|
|
|
|
|
|
|
|
|
|
|
|
Revenues |
|
|
|
|
|
|
|
|
|
|
|
|
|
|
|
|
|
|
|
|
|
|
North America |
|
|
3,314 |
|
|
3,244 |
|
|
2,960 |
|
2% |
|
12% |
|
|
|
13,459 |
|
|
13,522 |
|
- |
EMEA |
|
|
2,738 |
|
|
3,138 |
|
|
2,633 |
|
(13)% |
|
4% |
|
|
|
12,006 |
|
|
11,770 |
|
2% |
Latin America |
|
|
1,297 |
|
|
1,294 |
|
|
1,189 |
|
- |
|
9% |
|
|
|
5,166 |
|
|
4,954 |
|
4% |
Asia |
|
|
2,028 |
|
|
2,175 |
|
|
1,761 |
|
(7)% |
|
15% |
|
|
|
8,670 |
|
|
8,079 |
|
7% |
Note: Please refer to the Appendices and Footnotes at the end of this press release for additional information.
(a) Excludes gain / (loss) on credit derivatives as well as the mark-to-market on loans at fair value. For additional information, please refer to Footnote 8.
(b) Includes gain of approximately $350 million related to Citi's investment in Tradeweb in 2Q'19.
(c) Includes provision for unfunded lending commitments.
Institutional Clients Group
ICG revenues of $9.4 billion increased 10%, reflecting strong performance in Fixed Income Markets and Investment Banking, continued momentum in Treasury and Trade Solutions and the Private Bank, partially offset by softness in Equity Markets.
Banking revenues of $5.4 billion were largely unchanged versus the prior year (including gain / (loss) on loan hedges)8. Treasury and Trade Solutions revenues of $2.6 billion increased 2% on a reported basis and 3% in constant dollars, reflecting strong client engagement and solid growth in deposits and transaction volumes, partially offset by the impact of lower interest rates. Investment Banking revenues of $1.4 billion increased 6%, primarily reflecting strong performance in equity and debt underwriting, particularly investment grade underwriting. Advisory revenues declined 19% to $373 million, equity underwriting revenues increased 33% to $240 million and debt underwriting revenues increased 16% to $738 million. Private Bank revenues of $847 million increased 6%, driven by higher lending and investment activity, with both new and existing clients, partially offset by spread compression. Corporate Lending revenues of $732 million were largely unchanged (excluding gain / (loss) on loan hedges), as growth in the commercial portfolio was offset by lower volumes in the rest of the portfolio.
Markets and Securities Services revenues of $3.9 billion increased 28%. Fixed Income Markets revenues of $2.9 billion increased 49%, largely reflecting a recovery from the prior-year period in addition to strong performance, particularly in rates and spread products. Equity Markets revenues of $516 million decreased 23%, reflecting a more challenging environment in derivatives. Securities Services revenues of $647 million decreased 1% on a reported basis, but were largely unchanged in constant dollars, as higher volumes were offset by lower spreads.
ICG net income of $2.9 billion increased 10%, as the revenue growth was partially offset by higher expenses and cost of credit. ICG operating expenses increased 8% to $5.4 billion, driven primarily by higher compensation-related
5
expenses and legal costs. ICG cost of credit included net credit losses of $115 million, compared to $56 million in the prior-year period, and a net loan loss reserve build of $131 million compared to $70 million in the prior-year period, reflecting overall volume growth as well as several episodic downgrades.
Corporate / Other |
|
4Q'19 |
|
3Q'19 |
|
4Q'18 |
|
QoQ% |
|
YoY% |
|
2019 |
|
2018 |
|
|
||||||
Revenues |
|
$ |
542 |
|
$ |
434 |
|
$ |
500 |
|
25% |
|
8% |
|
|
$ |
2,014 |
|
$ |
2,190 |
|
(8)% |
|
|
|
|
|
|
|
|
|
|
|
|
|
|
|
|
|
|
|
|
|
|
|
Expenses |
|
$ |
635 |
|
$ |
485 |
|
$ |
474 |
|
31% |
|
34% |
|
|
$ |
2,150 |
|
$ |
2,275 |
|
(5)% |
|
|
|
|
|
|
|
|
|
|
|
|
|
|
|
|
|
|
|
|
|
|
|
Net Credit Losses |
|
|
- |
|
|
(16) |
|
|
(44) |
|
100% |
|
100% |
|
|
|
(67) |
|
|
(221) |
|
70% |
Credit Reserve Build / (Release)(a) |
|
|
(13) |
|
|
1 |
|
|
(3) |
|
NM |
|
NM |
|
|
|
(8) |
|
|
21 |
|
NM |
Provision for Benefits and Claims |
|
|
- |
|
|
- |
|
|
- |
|
- |
|
- |
|
|
|
- |
|
|
(2) |
|
100% |
Total Cost of Credit |
|
$ |
(13) |
|
$ |
(15) |
|
$ |
(47) |
|
13% |
|
72% |
|
|
$ |
(75) |
|
$ |
(202) |
|
63% |
|
|
|
|
|
|
|
|
|
|
|
|
|
|
|
|
|
|
|
|
|
|
|
Income (Loss) from Continuing Operations before Taxes |
|
$ |
(80) |
|
$ |
(36) |
|
$ |
73 |
|
NM |
|
NM |
|
|
$ |
(61) |
|
$ |
117 |
|
NM |
|
|
|
|
|
|
|
|
|
|
|
|
|
|
|
|
|
|
|
|
|
|
|
Income Taxes (Benefits) |
|
|
(623) |
|
|
(247) |
|
|
(216) |
|
NM |
|
NM |
|
|
|
(886) |
|
|
(88) |
|
NM |
|
|
|
|
|
|
|
|
|
|
|
|
|
|
|
|
|
|
|
|
|
|
|
Net Income |
|
$ |
537 |
|
$ |
191 |
|
$ |
296 |
|
NM |
|
81% |
|
|
$ |
801 |
|
$ |
186 |
|
NM |
(a) Includes provision for unfunded lending commitments.
Corporate / Other
Corporate / Other revenues of $542 million increased 8%, reflecting gains on investments, partially offset by the wind-down of legacy assets.
Corporate / Other expenses of $635 million increased 34%, primarily reflecting higher infrastructure costs, partially offset by the wind-down of legacy assets.
Corporate / Other loss from continuing operations before taxes of $80 million compared to income of $73 million in the prior-year period as the higher revenues were offset by the increase in expenses.
Corporate / Other income tax benefit of $623 million compared to a benefit of $216 million in the prior-year period, primarily reflecting the benefit of discrete tax items and a pre-tax loss in the current period.
6
Citigroup will host a conference call today at 11:30 AM (ET). A live webcast of the presentation, as well as financial results and presentation materials, will be available at https://www.citigroup.com/citi/investor. Dial-in numbers for the conference call are as follows: (866) 516-9582 in the U.S. and Canada; (973) 409-9210 outside of the U.S. and Canada. The conference code for both numbers is 1516368.
Additional financial, statistical and business-related information, as well as business and segment trends, is included in a Quarterly Financial Data Supplement. Both this earnings release and Citigroup’s Fourth Quarter 2019 Quarterly Financial Data Supplement are available on Citigroup’s website at www.citigroup.com.
Citigroup, the leading global bank, has approximately 200 million customer accounts and does business in more than 160 countries and jurisdictions. Citigroup provides consumers, corporations, governments and institutions with a broad range of financial products and services, including consumer banking and credit, corporate and investment banking, securities brokerage, transaction services, and wealth management.
Additional information may be found at www.citigroup.com | Twitter: @Citi | YouTube: www.youtube.com/citi | Blog: http://blog.citigroup.com | Facebook: www.facebook.com/citi | LinkedIn: www.linkedin.com/company/citi
Certain statements in this release are “forward-looking statements” within the meaning of the rules and regulations of the U.S. Securities and Exchange Commission (SEC). These statements are based on management’s current expectations and are subject to uncertainty and changes in circumstances. These statements are not guarantees of future results or occurrences. Actual results and capital and other financial condition may differ materially from those included in these statements due to a variety of factors, These factors include, among others, the efficacy of Citi’s business strategies and execution of those strategies, such as those relating to its key investment, efficiency, client engagement and capital optimization initiatives, various geopolitical and macroeconomic uncertainties, challenges and conditions, for example, changes in economic conditions, interest rates and other monetary policies and trade policies, governmental and regulatory actions or approvals, and the precautionary statements included in this release. These factors also consist of those contained in Citigroup’s filings with the SEC, including without limitation the “Risk Factors” section of Citigroup’s 2018 Form 10-K. Any forward-looking statements made by or on behalf of Citigroup speak only as to the date they are made, and Citi does not undertake to update forward-looking statements to reflect the impact of circumstances or events that arise after the date the forward-looking statements were made.
Contacts: |
|
|
|
|
|
Press: |
Mark Costiglio |
(212) 559-4114 |
Investors: |
Elizabeth Lynn |
(212) 559-2718 |
|
|
|
Fixed Income Investors: |
Thomas Rogers |
(212) 559-5091 |
7
Appendix A
Citigroup |
|
2019 |
|
|
Net Income |
|
$ |
19,401 |
|
Less: Preferred Dividends |
|
|
1,109 |
|
Net Income to Common Shareholders |
|
$ |
18,292 |
|
|
|
|
|
|
Common Share Repurchases |
|
|
17,875 |
|
Common Dividends |
|
|
4,403 |
|
Total Capital Returned to Common Shareholders |
|
$ |
22,278 |
|
|
|
|
|
|
Payout Ratio |
|
|
122% |
|
|
|
|
|
|
Average TCE |
|
$ |
150,994 |
|
|
|
|
|
|
RoTCE |
|
|
12.1% |
|
8
Appendix B
Citigroup |
|
4Q'19 |
|
4Q'18 |
||
Reported EOP Loans |
|
$ |
699 |
|
$ |
684 |
Impact of FX Translation |
|
|
- |
|
|
1 |
EOP Loans in Constant Dollars |
|
$ |
699 |
|
$ |
685 |
|
|
|
|
|
|
|
Reported EOP Deposits |
|
$ |
1,071 |
|
$ |
1,013 |
Impact of FX Translation |
|
|
- |
|
|
1 |
EOP Deposits in Constant Dollars |
|
$ |
1,071 |
|
$ |
1,015 |
Note: Totals may not sum due to rounding. |
|
|
|
|
|
|
|
|
|
|
|
|
|
Global Consumer Banking |
|
|
4Q'19 |
|
|
4Q'18 |
Reported Revenues |
|
$ |
8,459 |
|
$ |
8,081 |
Impact of FX Translation |
|
|
- |
|
|
60 |
Revenues in Constant Dollars |
|
$ |
8,459 |
|
$ |
8,141 |
|
|
|
|
|
|
|
Reported Expenses |
|
$ |
4,373 |
|
$ |
4,379 |
Impact of FX Translation |
|
|
- |
|
|
30 |
Expenses in Constant Dollars |
|
$ |
4,373 |
|
$ |
4,409 |
|
|
|
|
|
|
|
Reported Cost of Credit |
|
$ |
1,989 |
|
$ |
1,846 |
Impact of FX Translation |
|
|
- |
|
|
14 |
Cost of Credit in Constant Dollars |
|
$ |
1,989 |
|
$ |
1,860 |
|
|
|
|
|
|
|
Reported Net Income |
|
$ |
1,575 |
|
$ |
1,407 |
Impact of FX Translation |
|
|
- |
|
|
10 |
Net Income in Constant Dollars |
|
$ |
1,575 |
|
$ |
1,417 |
Note: Totals may not sum due to rounding. |
|
|
|
|
|
|
|
|
|
|
|
|
|
|
|
|
|
|
|
|
Latin America Consumer Banking ($in millions) |
|
|
4Q'19 |
|
|
4Q'18 |
Reported Revenues |
|
$ |
1,377 |
|
$ |
1,250 |
Impact of FX Translation |
|
|
- |
|
|
54 |
Revenues in Constant Dollars |
|
$ |
1,377 |
|
$ |
1,304 |
Note: Totals may not sum due to rounding. |
|
|
|
|
|
|
|
|
|
|
|
|
|
Asia Consumer Banking(1) ($in millions) |
|
|
4Q'19 |
|
|
4Q'18 |
Reported Revenues |
|
$ |
1,829 |
|
$ |
1,758 |
Impact of FX Translation |
|
|
- |
|
|
6 |
Revenues in Constant Dollars |
|
$ |
1,829 |
|
$ |
1,764 |
Note: Totals may not sum due to rounding. |
|
|
|
|
|
|
(1) Asia GCB includes the results of operations in EMEA GCB for all periods presented. |
|
|
|
|
|
|
|
|
|
|
|
|
|
Treasury and Trade Solutions ($in millions) |
|
|
4Q'19 |
|
|
4Q'18 |
Reported Revenues |
|
$ |
2,608 |
|
$ |
2,552 |
Impact of FX Translation |
|
|
- |
|
|
(24) |
Revenues in Constant Dollars |
|
$ |
2,608 |
|
$ |
2,528 |
Note: Totals may not sum due to rounding. |
|
|
|
|
|
|
|
|
|
|
|
|
|
Securities Services ($in millions) |
|
|
4Q'19 |
|
|
4Q'18 |
Reported Revenues |
|
$ |
647 |
|
$ |
653 |
Impact of FX Translation |
|
|
- |
|
|
(5) |
Revenues in Constant Dollars |
|
$ |
647 |
|
$ |
648 |
Note: Totals may not sum due to rounding. |
|
|
|
|
|
|
9
Appendix C
($in millions) |
|
4Q'19(1) |
|
3Q'19 |
|
4Q'18 |
|||
|
|
|
|
|
|
|
|||
Citigroup Common Stockholders' Equity(2) |
|
$ |
175,414 |
|
$ |
177,052 |
|
$ |
177,928 |
Add: Qualifying noncontrolling interests |
|
|
154 |
|
|
145 |
|
|
147 |
Regulatory Capital Adjustments and Deductions: |
|
|
|
|
|
|
|
|
|
Less: |
|
|
|
|
|
|
|
|
|
Accumulated net unrealized gains (losses) on cash flow hedges, net of tax(3) |
|
|
123 |
|
|
328 |
|
|
(728) |
Cumulative unrealized net gain (loss) related to changes in fair value of financial liabilities attributable to own creditworthiness, net of tax(4) |
|
|
(679) |
|
|
181 |
|
|
580 |
Intangible Assets: |
|
|
|
|
|
|
|
|
|
Goodwill, net of related deferred tax liabilities (DTLs)(5) |
|
|
21,017 |
|
|
21,498 |
|
|
21,778 |
Identifiable intangible assets other than mortgage servicing rights (MSRs), net of related DTLs |
|
|
4,087 |
|
|
4,132 |
|
|
4,402 |
Defined benefit pension plan net assets |
|
|
803 |
|
|
990 |
|
|
806 |
Deferred tax assets (DTAs) arising from net operating loss, foreign tax credit and general business credit carry-forwards |
|
|
12,335 |
|
|
11,487 |
|
|
11,985 |
Common Equity Tier 1 Capital (CET1) |
|
$ |
137,882 |
|
$ |
138,581 |
|
$ |
139,252 |
|
|
|
|
|
|
|
|
|
|
Risk-Weighted Assets (RWA) |
|
$ |
1,175,366 |
|
$ |
1,197,050 |
|
$ |
1,174,448 |
|
|
|
|
|
|
|
|
|
|
Common Equity Tier 1 Capital Ratio (CET1 / RWA) |
|
|
11.7% |
|
|
11.6% |
|
|
11.9% |
Note: Citigroup's reportable CET1 Capital ratios were derived under the U.S. Basel III Standardized Approach framework for all periods presented. This reflects the lower of the CET1 Capital ratios under both the Standardized Approach and the Advanced Approaches under the Collins Amendment.
(1) |
Preliminary. |
(2) |
Excludes issuance costs related to outstanding preferred stock in accordance with Federal Reserve Board regulatory reporting requirements. |
(3) |
Common Equity Tier 1 Capital is adjusted for accumulated net unrealized gains (losses) on cash flow hedges included in accumulated other comprehensive income that relate to the hedging of items not recognized at fair value on the balance sheet. |
(4) |
The cumulative impact of changes in Citigroup’s own creditworthiness in valuing liabilities for which the fair value option has been elected, and own-credit valuation adjustments on derivatives, are excluded from Common Equity Tier 1 Capital, in accordance with the U.S. Basel III rules. |
(5) |
Includes goodwill “embedded” in the valuation of significant common stock investments in unconsolidated financial institutions. |
Appendix D
($ in millions) |
|
4Q'19(1) |
|
3Q'19 |
|
4Q'18 |
|
|||
|
|
|
|
|
|
|
|
|||
Common Equity Tier 1 Capital (CET1) |
|
$ |
137,882 |
|
$ |
138,581 |
|
$ |
139,252 |
|
|
|
|
|
|
|
|
|
|
|
|
Additional Tier 1 Capital (AT1)(2) |
|
|
18,010 |
|
|
19,452 |
|
|
18,870 |
|
|
|
|
|
|
|
|
|
|
|
|
Total Tier 1 Capital (T1C) (CET1 + AT1) |
|
$ |
155,892 |
|
$ |
158,033 |
|
$ |
158,122 |
|
|
|
|
|
|
|
|
|
|
|
|
Total Leverage Exposure (TLE) |
|
$ |
2,507,977 |
|
$ |
2,520,352 |
|
$ |
2,465,641 |
|
|
|
|
|
|
|
|
|
|
|
|
Supplementary Leverage Ratio (T1C / TLE) |
|
|
6.2% |
|
|
6.3% |
|
|
6.4% |
|
(1) Preliminary.
(2) Additional Tier 1 Capital primarily includes qualifying noncumulative perpetual preferred stock and qualifying trust preferred securities.
Appendix E
($ and shares in millions, except per share amounts) |
|
4Q'19(1) |
|
3Q'19 |
|
4Q'18 |
|
|||
|
|
|
|
|
|
|
|
|||
Common Stockholders' Equity |
|
$ |
175,262 |
|
$ |
176,893 |
|
$ |
177,760 |
|
Less: |
|
|
|
|
|
|
|
|
|
|
Goodwill |
|
|
22,126 |
|
|
21,822 |
|
|
22,046 |
|
Intangible Assets (other than MSRs) |
|
|
4,327 |
|
|
4,372 |
|
|
4,636 |
|
Tangible Common Equity (TCE) |
|
$ |
148,809 |
|
$ |
150,699 |
|
$ |
151,078 |
|
|
|
|
|
|
|
|
|
|
|
|
Common Shares Outstanding (CSO) |
|
|
2,114 |
|
|
2,183 |
|
|
2,369 |
|
|
|
|
|
|
|
|
|
|
|
|
Tangible Book Value Per Share (TCE / CSO) |
|
$ |
70.39 |
|
$ |
69.03 |
|
$ |
63.79 |
|
(1) Preliminary.
10
1 Citigroup’s total expenses divided by total revenues.
2 Preliminary. Citigroup’s return on average tangible common equity (RoTCE) is a non-GAAP financial measure. RoTCE represents full year net income available to common shareholders as a percentage of average tangible common equity (TCE). For the components of the calculation, see Appendix A.
3 Ratios as of December 31, 2019 are preliminary. For the composition of Citigroup’s Common Equity Tier 1 (CET1) Capital and ratio, see Appendix C. For the composition of Citigroup’s Supplementary Leverage Ratio (SLR), see Appendix D.
4 Citigroup’s payout ratio is the sum of common dividends and common share repurchases divided by net income available to common shareholders. For the components of the calculation, see Appendix A.
5 Citigroup’s tangible book value per share is a non-GAAP financial measure. For a reconciliation of this measure to reported results, see Appendix E.
6 The discrete tax items of approximately $540 million largely relate to an approximately $430 million release of Citi’s valuation allowance related to its Deferred Tax Assets (DTAs).
7 Results of operations excluding the impact of foreign exchange translation (constant dollar basis) are non-GAAP financial measures. For a reconciliation of these measures to reported results, see Appendix B.
8 Credit derivatives are used to economically hedge a portion of the corporate loan portfolio that includes both accrual loans and loans at fair value. Gains / (losses) on loan hedges includes the mark-to-market on the credit derivatives and the mark-to-market on the loans in the portfolio that are at fair value. The fixed premium costs of these hedges are netted against the corporate lending revenues to reflect the cost of credit protection. Citigroup’s results of operations excluding the impact of gains / (losses) on loan hedges are non-GAAP financial measures.
11
Exhibit 99.2
CITIGROUP - QUARTERLY FINANCIAL DATA SUPPLEMENT |
|
4Q19 |
|
|
|
|
|
|
|
|
|
|
|
Page |
|
Citigroup Consolidated |
|
|
|
Financial Summary |
|
1 |
|
Consolidated Statement of Income |
|
2 |
|
Consolidated Balance Sheet |
|
3 |
|
Segment Detail |
|
|
|
Net Revenues |
|
4 |
|
Income and Regional Average Assets and ROA |
|
5 |
|
|
|
|
|
Global Consumer Banking (GCB) |
|
6 |
|
Retail Banking and Cards Key Indicators |
|
7 |
|
North America |
|
8 - 10 |
|
Latin America(1) |
|
11 - 12 |
|
Asia(2) |
|
13 - 14 |
|
Institutional Clients Group (ICG) |
|
15 |
|
Revenues by Business |
|
16 |
|
|
|
|
|
Corporate / Other |
|
17 |
|
|
|
|
|
Citigroup Supplemental Detail |
|
|
|
Average Balances and Interest Rates |
|
18 |
|
Deposits |
|
19 |
|
Loans (EOP) |
|
20 |
|
Consumer Loan Delinquency Amounts and Ratios |
|
|
|
90+ Days |
|
21 |
|
30-89 Days |
|
22 |
|
Allowance for Credit Losses |
|
23 - 24 |
|
Components of Provision for Loan Losses |
|
25 |
|
Non-Accrual Assets |
|
26 |
|
|
|
|
|
CET1 Capital and Supplementary Leverage Ratios, Tangible Common Equity, |
|
27 |
|
Book Value Per Share and Tangible Book Value Per Share |
|
|
|
|
|
|
|
|
|
|
|
(1) |
Latin America GCB consists of Citi's consumer banking operations in Mexico. |
(2) |
Asia GCB includes the results of operations of GCB activities in certain EMEA countries for all periods presented. |
CITIGROUP -- FINANCIAL SUMMARY
(In millions of dollars, except per share amounts, and as otherwise noted)
|
|
4Q |
|
1Q |
|
2Q |
|
3Q |
|
4Q |
|
4Q19 Increase/ |
|
Full |
|
Full |
|
FY 2019 vs. |
|||||||||
|
|
2018 |
|
2019 |
|
2019 |
|
2019 |
|
2019 |
|
3Q19 |
|
4Q18 |
|
2018 |
|
2019 |
|
(Decrease) |
|||||||
|
|
|
|
|
|
|
|
|
|
|
|
|
|
|
|
|
|
|
|
|
|||||||
Total Revenues, Net of Interest Expense |
|
$ |
17,124 |
|
$ |
18,576 |
|
$ |
18,758 |
|
$ |
18,574 |
|
$ |
18,378 |
|
(1%) |
|
7% |
|
$ |
72,854 |
|
$ |
74,286 |
|
2% |
Total Operating Expenses |
|
|
9,893 |
|
|
10,584 |
|
|
10,500 |
|
|
10,464 |
|
|
10,454 |
|
- |
|
6% |
|
|
41,841 |
|
|
42,002 |
|
- |
Net Credit Losses (NCLs) |
|
|
1,786 |
|
|
1,948 |
|
|
1,963 |
|
|
1,913 |
|
|
1,944 |
|
2% |
|
9% |
|
|
7,113 |
|
|
7,768 |
|
9% |
Credit Reserve Build / (Release) |
|
|
64 |
|
|
(4) |
|
|
126 |
|
|
149 |
|
|
179 |
|
20% |
|
NM |
|
|
241 |
|
|
450 |
|
87% |
Provision / (Release) for Unfunded Lending Commitments |
|
|
47 |
|
|
24 |
|
|
(15) |
|
|
9 |
|
|
74 |
|
NM |
|
57% |
|
|
113 |
|
|
92 |
|
(19%) |
Provision for Benefits and Claims |
|
|
28 |
|
|
12 |
|
|
19 |
|
|
17 |
|
|
25 |
|
47% |
|
(11%) |
|
|
101 |
|
|
73 |
|
(28%) |
Provisions for Credit Losses and for Benefits and Claims |
|
$ |
1,925 |
|
$ |
1,980 |
|
$ |
2,093 |
|
$ |
2,088 |
|
$ |
2,222 |
|
6% |
|
15% |
|
$ |
7,568 |
|
$ |
8,383 |
|
11% |
Income from Continuing Operations before Income Taxes |
|
$ |
5,306 |
|
$ |
6,012 |
|
$ |
6,165 |
|
$ |
6,022 |
|
$ |
5,702 |
|
(5%) |
|
7% |
|
$ |
23,445 |
|
$ |
23,901 |
|
2% |
Income Taxes (1)(2)(3) |
|
|
1,001 |
|
|
1,275 |
|
|
1,373 |
|
|
1,079 |
|
|
703 |
|
(35%) |
|
(30%) |
|
|
5,357 |
|
|
4,430 |
|
(17%) |
Income from Continuing Operations |
|
$ |
4,305 |
|
$ |
4,737 |
|
$ |
4,792 |
|
$ |
4,943 |
|
$ |
4,999 |
|
1% |
|
16% |
|
$ |
18,088 |
|
$ |
19,471 |
|
8% |
Income (Loss) from Discontinued Operations, net of Taxes |
|
|
(8) |
|
|
(2) |
|
|
17 |
|
|
(15) |
|
|
(4) |
|
73% |
|
50% |
|
|
(8) |
|
|
(4) |
|
50% |
Net Income before Noncontrolling Interests |
|
$ |
4,297 |
|
$ |
4,735 |
|
$ |
4,809 |
|
$ |
4,928 |
|
$ |
4,995 |
|
1% |
|
16% |
|
$ |
18,080 |
|
$ |
19,467 |
|
8% |
Net Income (Loss) Attributable to Noncontrolling Interests |
|
|
(16) |
|
|
25 |
|
|
10 |
|
|
15 |
|
|
16 |
|
7% |
|
NM |
|
|
35 |
|
|
66 |
|
89% |
Citigroup's Net Income |
|
$ |
4,313 |
|
$ |
4,710 |
|
$ |
4,799 |
|
$ |
4,913 |
|
$ |
4,979 |
|
1% |
|
15% |
|
$ |
18,045 |
|
$ |
19,401 |
|
8% |
|
|
|
|
|
|
|
|
|
|
|
|
|
|
|
|
|
|
|
|
|
|
|
|
|
|
|
|
Diluted Earnings Per Share: |
|
|
|
|
|
|
|
|
|
|
|
|
|
|
|
|
|
|
|
|
|
|
|
|
|
|
|
Income from Continuing Operations |
|
$ |
1.65 |
|
$ |
1.87 |
|
$ |
1.94 |
|
$ |
2.08 |
|
$ |
2.15 |
|
3% |
|
30% |
|
$ |
6.69 |
|
$ |
8.04 |
|
20% |
Citigroup's Net Income |
|
$ |
1.64 |
|
$ |
1.87 |
|
$ |
1.95 |
|
$ |
2.07 |
|
$ |
2.15 |
|
4% |
|
31% |
|
$ |
6.68 |
|
$ |
8.04 |
|
20% |
Shares (in millions): |
|
|
|
|
|
|
|
|
|
|
|
|
|
|
|
|
|
|
|
|
|
|
|
|
|
|
|
Average Basic |
|
|
2,401.1 |
|
|
2,340.4 |
|
|
2,286.1 |
|
|
2,220.8 |
|
|
2,149.4 |
|
(3%) |
|
(10%) |
|
|
2,493.3 |
|
|
2,249.2 |
|
(10%) |
Average Diluted |
|
|
2,402.7 |
|
|
2,342.4 |
|
|
2,289.0 |
|
|
2,237.1 |
|
|
2,166.8 |
|
(3%) |
|
(10%) |
|
|
2,494.8 |
|
|
2,265.3 |
|
(9%) |
Common Shares Outstanding, at period end |
|
|
2,368.5 |
|
|
2,312.5 |
|
|
2,259.1 |
|
|
2,183.2 |
|
|
2,114.1 |
|
(3%) |
|
(11%) |
|
|
|
|
|
|
|
|
|
|
|
|
|
|
|
|
|
|
|
|
|
|
|
|
|
|
|
|
|
|
|
|
|
|
|
|
Preferred Dividends |
|
$ |
313 |
|
$ |
262 |
|
$ |
296 |
|
$ |
254 |
|
$ |
296 |
|
17% |
|
(5%) |
|
$ |
1,174 |
|
$ |
1,109 |
|
(6%) |
|
|
|
|
|
|
|
|
|
|
|
|
|
|
|
|
|
|
|
|
|
|
|
|
|
|
|
|
Income Allocated to Unrestricted Common Shareholders - Basic |
|
|
|
|
|
|
|
|
|
|
|
|
|
|
|
|
|
|
|
|
|
|
|
|
|
|
|
Income from Continuing Operations |
|
$ |
3,960 |
|
$ |
4,391 |
|
$ |
4,436 |
|
$ |
4,647 |
|
$ |
4,653 |
|
- |
|
18% |
|
$ |
16,680 |
|
$ |
18,174 |
|
9% |
Citigroup's Net Income |
|
$ |
3,952 |
|
$ |
4,389 |
|
$ |
4,453 |
|
$ |
4,632 |
|
$ |
4,649 |
|
- |
|
18% |
|
$ |
16,672 |
|
$ |
18,171 |
|
9% |
|
|
|
|
|
|
|
|
|
|
|
|
|
|
|
|
|
|
|
|
|
|
|
|
|
|
|
|
Income Allocated to Unrestricted Common Shareholders - Diluted |
|
|
|
|
|
|
|
|
|
|
|
|
|
|
|
|
|
|
|
|
|
|
|
|
|
|
|
Income from Continuing Operations |
|
$ |
3,960 |
|
$ |
4,391 |
|
$ |
4,436 |
|
$ |
4,656 |
|
$ |
4,661 |
|
- |
|
18% |
|
$ |
16,680 |
|
$ |
18,207 |
|
9% |
Citigroup's Net Income |
|
$ |
3,952 |
|
$ |
4,389 |
|
$ |
4,453 |
|
$ |
4,641 |
|
$ |
4,657 |
|
- |
|
18% |
|
$ |
16,672 |
|
$ |
18,204 |
|
9% |
|
|
|
|
|
|
|
|
|
|
|
|
|
|
|
|
|
|
|
|
|
|
|
|
|
|
|
|
Regulatory Capital Ratios and Performance Metrics: |
|
|
|
|
|
|
|
|
|
|
|
|
|
|
|
|
|
|
|
|
|
|
|
|
|
|
|
Common Equity Tier 1 (CET1) Capital Ratio (4)(5) |
|
|
11.86% |
|
|
11.91% |
|
|
11.89% |
|
|
11.58% |
|
|
11.7% |
|
|
|
|
|
|
|
|
|
|
|
|
Tier 1 Capital Ratio (4)(5) |
|
|
13.46% |
|
|
13.47% |
|
|
13.43% |
|
|
13.20% |
|
|
13.3% |
|
|
|
|
|
|
|
|
|
|
|
|
Total Capital Ratio (4)(5) |
|
|
16.18% |
|
|
16.44% |
|
|
16.36% |
|
|
16.07% |
|
|
15.7% |
|
|
|
|
|
|
|
|
|
|
|
|
Supplementary Leverage Ratio (SLR)(5)(6) |
|
|
6.41% |
|
|
6.44% |
|
|
6.38% |
|
|
6.27% |
|
|
6.2% |
|
|
|
|
|
|
|
|
|
|
|
|
Return on Average Assets |
|
|
0.88% |
|
|
0.98% |
|
|
0.97% |
|
|
0.97% |
|
|
0.99% |
|
|
|
|
|
|
0.94% |
|
|
0.98% |
|
|
Return on Average Common Equity |
|
|
9.0% |
|
|
10.2% |
|
|
10.1% |
|
|
10.4% |
|
|
10.6% |
|
|
|
|
|
|
9.4% |
|
|
10.3% |
|
|
Efficiency Ratio (Total Operating Expenses/Total Revenues, net) |
|
|
57.8% |
|
|
57.0% |
|
|
56.0% |
|
|
56.3% |
|
|
56.9% |
|
|
|
|
|
|
57.4% |
|
|
56.5% |
|
|
|
|
|
|
|
|
|
|
|
|
|
|
|
|
|
|
|
|
|
|
|
|
|
|
|
|
|
|
Balance Sheet Data (in billions of dollars, except per share amounts)(5): |
|
|
|
|
|
|
|
|
|
|
|
|
|
|
|
|
|
|
|
|
|
|
|
|
|
|
|
Total Assets |
|
$ |
1,917.4 |
|
$ |
1,958.4 |
|
$ |
1,988.2 |
|
$ |
2,014.8 |
|
$ |
1,951.2 |
|
(3%) |
|
2% |
|
|
|
|
|
|
|
|
Total Average Assets |
|
|
1,936.8 |
|
|
1,939.4 |
|
|
1,979.1 |
|
|
2,000.1 |
|
|
1,996.6 |
|
- |
|
3% |
|
$ |
1,920.2 |
|
$ |
1,978.8 |
|
3% |
Total Deposits |
|
|
1,013.2 |
|
|
1,030.4 |
|
|
1,045.6 |
|
|
1,087.8 |
|
|
1,070.6 |
|
(2%) |
|
6% |
|
|
|
|
|
|
|
|
Citigroup's Stockholders' Equity |
|
|
196.2 |
|
|
196.3 |
|
|
197.4 |
|
|
196.4 |
|
|
193.2 |
|
(2%) |
|
(2%) |
|
|
|
|
|
|
|
|
Book Value Per Share |
|
|
75.05 |
|
|
77.09 |
|
|
79.40 |
|
|
81.02 |
|
|
82.90 |
|
2% |
|
10% |
|
|
|
|
|
|
|
|
Tangible Book Value Per Share (7) |
|
|
63.79 |
|
|
65.55 |
|
|
67.64 |
|
|
69.03 |
|
|
70.39 |
|
2% |
|
10% |
|
|
|
|
|
|
|
|
|
|
|
|
|
|
|
|
|
|
|
|
|
|
|
|
|
|
|
|
|
|
|
|
|
|
|
|
Direct Staff (in thousands) |
|
|
204 |
|
|
203 |
|
|
200 |
|
|
199 |
|
|
200 |
|
1% |
|
(2%) |
|
|
|
|
|
|
|
|
|
|
|
|
|
|
|
|
|
|
|
|
|
|
|
|
|
|
|
|
|
|
|
|
|
|
|
|
(1) 4Q19 includes discrete tax items of roughly $540 million, including an approximate $430 million benefit of a reduction in Citi’s valuation allowance related to its Deferred Tax Assets (DTAs). (2) 3Q19 includes discrete tax items of roughly $230 million, including an approximate $180 million benefit of a reduction in Citi’s valuation allowance related to its DTAs. (3) 4Q18 includes a one-time benefit of $94 million, recorded in the tax line in Corporate/Other, due to the finalization of the provisional component of the impact based on Citi’s analysis, as well as additional guidance received from the U.S. Treasury Department related to the enactment of the Tax Cuts and Jobs Act. (4) For all periods presented, Citi's reportable CET1 Capital and Tier 1 Capital ratios were derived under the U.S. Basel III Standardized Approach, whereas Citi's reportable Total Capital ratios were derived under the U.S. Basel III Advanced Approaches framework. The reportable ratios represent the lower of each of the three risk-based capital ratios (CET1 Capital, Tier 1 Capital and Total Capital) under both the Standardized Approach and the Advanced Approaches under the Collins Amendment. For the composition of Citi's CET1 Capital and ratio, see page 27. (5) December 31, 2019 is preliminary. (6) For the composition of Citi's SLR, see page 27. (7) Tangible book value per share is a non-GAAP financial measure. For a reconciliation of this measure to reported results, see page 27.
Note: Ratios and variance percentages are calculated based on the displayed amounts. Due to averaging and roundings, quarterly earnings per share may not sum to the YTD totals. NM Not meaningful. Reclassified to conform to the current period's presentation. |
|
|
|
|
|
|
|
Page 1
CITIGROUP CONSOLIDATED STATEMENT OF INCOME
(In millions of dollars)
|
|
4Q |
|
1Q |
|
2Q |
|
3Q |
|
4Q |
|
4Q19 Increase/ |
|
Full |
|
Full |
|
FY 2019 vs. |
|||||||||
|
|
2018 |
|
2019 |
|
2019 |
|
2019 |
|
2019 |
|
3Q19 |
|
4Q18 |
|
2018 |
|
2019 |
|
(Decrease) |
|||||||
|
|
|
|
|
|
|
|
|
|
|
|
|
|
|
|
|
|
|
|
|
|
||||||
Revenues |
|
|
|
|
|
|
|
|
|
|
|
|
|
|
|
|
|
|
|
|
|
|
|
|
|
|
|
Interest revenue |
|
$ |
18,776 |
|
$ |
19,076 |
|
$ |
19,712 |
|
$ |
19,177 |
|
$ |
18,545 |
|
(3%) |
|
(1%) |
|
$ |
70,828 |
|
$ |
76,510 |
|
8% |
Interest expense |
|
|
6,853 |
|
|
7,317 |
|
|
7,762 |
|
|
7,536 |
|
|
6,548 |
|
(13%) |
|
(4%) |
|
|
24,266 |
|
|
29,163 |
|
20% |
Net interest revenue |
|
|
11,923 |
|
|
11,759 |
|
|
11,950 |
|
|
11,641 |
|
|
11,997 |
|
3% |
|
1% |
|
|
46,562 |
|
|
47,347 |
|
2% |
|
|
|
|
|
|
|
|
|
|
|
|
|
|
|
|
|
|
|
|
|
|
|
|
|
|
|
|
Commissions and fees |
|
|
2,913 |
|
|
2,926 |
|
|
2,881 |
|
|
2,906 |
|
|
3,033 |
|
4% |
|
4% |
|
|
11,857 |
|
|
11,746 |
|
(1%) |
Principal transactions |
|
|
1,173 |
|
|
2,804 |
|
|
1,874 |
|
|
2,802 |
|
|
1,412 |
|
(50%) |
|
20% |
|
|
8,905 |
|
|
8,892 |
|
- |
Administrative and other fiduciary fees |
|
|
830 |
|
|
839 |
|
|
869 |
|
|
880 |
|
|
823 |
|
(6%) |
|
(1%) |
|
|
3,580 |
|
|
3,411 |
|
(5%) |
Realized gains (losses) on investments |
|
|
80 |
|
|
130 |
|
|
468 |
|
|
361 |
|
|
515 |
|
43% |
|
NM |
|
|
421 |
|
|
1,474 |
|
NM |
Other-than-temporary impairment losses on investments and other assets |
|
|
(19) |
|
|
(8) |
|
|
(5) |
|
|
(14) |
|
|
(5) |
|
64% |
|
74% |
|
|
(132) |
|
|
(32) |
|
76% |
Other revenue |
|
|
224 |
|
|
126 |
|
|
721 |
|
|
(2) |
|
|
603 |
|
NM |
|
NM |
|
|
1,661 |
|
|
1,448 |
|
(13%) |
Total non-interest revenues |
|
|
5,201 |
|
|
6,817 |
|
|
6,808 |
|
|
6,933 |
|
|
6,381 |
|
(8%) |
|
23% |
|
|
26,292 |
|
|
26,939 |
|
2% |
Total revenues, net of interest expense |
|
|
17,124 |
|
|
18,576 |
|
|
18,758 |
|
|
18,574 |
|
|
18,378 |
|
(1%) |
|
7% |
|
|
72,854 |
|
|
74,286 |
|
2% |
|
|
|
|
|
|
|
|
|
|
|
|
|
|
|
|
|
|
|
|
|
|
|
|
|
|
|
|
|
|
|
|
|
|
|
|
|
|
|
|
|
|
|
|
|
|
|
|
|
|
|
|
|
|
|
|
Provisions for Credit Losses and for Benefits and Claims |
|
|
|
|
|
|
|
|
|
|
|
|
|
|
|
|
|
|
|
|
|
|
|
|
|
|
|
|
|
|
|
|
|
|
|
|
|
|
|
|
|
|
|
|
|
|
|
|
|
|
|
|
|
|
|
Net credit losses |
|
|
1,786 |
|
|
1,948 |
|
|
1,963 |
|
|
1,913 |
|
|
1,944 |
|
2% |
|
9% |
|
|
7,113 |
|
|
7,768 |
|
9% |
Credit reserve build / (release) |
|
|
64 |
|
|
(4) |
|
|
126 |
|
|
149 |
|
|
179 |
|
20% |
|
NM |
|
|
241 |
|
|
450 |
|
87% |
Provision for loan losses |
|
|
1,850 |
|
|
1,944 |
|
|
2,089 |
|
|
2,062 |
|
|
2,123 |
|
3% |
|
15% |
|
|
7,354 |
|
|
8,218 |
|
12% |
Provision for policyholder benefits and claims |
|
|
28 |
|
|
12 |
|
|
19 |
|
|
17 |
|
|
25 |
|
47% |
|
(11%) |
|
|
101 |
|
|
73 |
|
(28%) |
Provision for unfunded lending commitments |
|
|
47 |
|
|
24 |
|
|
(15) |
|
|
9 |
|
|
74 |
|
NM |
|
57% |
|
|
113 |
|
|
92 |
|
(19%) |
Total provisions for credit losses and for benefits and claims |
|
|
1,925 |
|
|
1,980 |
|
|
2,093 |
|
|
2,088 |
|
|
2,222 |
|
6% |
|
15% |
|
|
7,568 |
|
|
8,383 |
|
11% |
|
|
|
|
|
|
|
|
|
|
|
|
|
|
|
|
|
|
|
|
|
|
|
|
|
|
|
|
Operating Expenses |
|
|
|
|
|
|
|
|
|
|
|
|
|
|
|
|
|
|
|
|
|
|
|
|
|
|
|
Compensation and benefits |
|
|
4,576 |
|
|
5,658 |
|
|
5,381 |
|
|
5,329 |
|
|
5,065 |
|
(5%) |
|
11% |
|
|
21,154 |
|
|
21,433 |
|
1% |
Premises and equipment |
|
|
596 |
|
|
564 |
|
|
569 |
|
|
580 |
|
|
615 |
|
6% |
|
3% |
|
|
2,324 |
|
|
2,328 |
|
- |
Technology / communication expense |
|
|
1,832 |
|
|
1,720 |
|
|
1,724 |
|
|
1,783 |
|
|
1,850 |
|
4% |
|
1% |
|
|
7,193 |
|
|
7,077 |
|
(2%) |
Advertising and marketing expense |
|
|
375 |
|
|
359 |
|
|
434 |
|
|
378 |
|
|
345 |
|
(9%) |
|
(8%) |
|
|
1,545 |
|
|
1,516 |
|
(2%) |
Other operating |
|
|
2,514 |
|
|
2,283 |
|
|
2,392 |
|
|
2,394 |
|
|
2,579 |
|
8% |
|
3% |
|
|
9,625 |
|
|
9,648 |
|
- |
Total operating expenses |
|
|
9,893 |
|
|
10,584 |
|
|
10,500 |
|
|
10,464 |
|
|
10,454 |
|
- |
|
6% |
|
|
41,841 |
|
|
42,002 |
|
- |
|
|
|
|
|
|
|
|
|
|
|
|
|
|
|
|
|
|
|
|
|
|
|
|
|
|
|
|
Income from Continuing Operations before |
|
|
|
|
|
|
|
|
|
|
|
|
|
|
|
|
|
|
|
|
|
|
|
|
|
|
|
Income Taxes |
|
|
5,306 |
|
|
6,012 |
|
|
6,165 |
|
|
6,022 |
|
|
5,702 |
|
(5%) |
|
7% |
|
|
23,445 |
|
|
23,901 |
|
2% |
Provision for income taxes (1)(2) |
|
|
1,001 |
|
|
1,275 |
|
|
1,373 |
|
|
1,079 |
|
|
703 |
|
(35%) |
|
(30%) |
|
|
5,357 |
|
|
4,430 |
|
(17%) |
|
|
|
|
|
|
|
|
|
|
|
|
|
|
|
|
|
|
|
|
|
|
|
|
|
|
|
|
Income (Loss) from Continuing Operations |
|
|
4,305 |
|
|
4,737 |
|
|
4,792 |
|
|
4,943 |
|
|
4,999 |
|
1% |
|
16% |
|
|
18,088 |
|
|
19,471 |
|
8% |
Discontinued Operations |
|
|
|
|
|
|
|
|
|
|
|
|
|
|
|
|
|
|
|
|
|
|
|
|
|
|
|
Income (Loss) from Discontinued Operations |
|
|
(9) |
|
|
(2) |
|
|
(10) |
|
|
(15) |
|
|
(4) |
|
73% |
|
56% |
|
|
(26) |
|
|
(31) |
|
(19%) |
Provision (benefits) for income taxes |
|
|
(1) |
|
|
- |
|
|
(27) |
|
|
- |
|
|
- |
|
- |
|
100% |
|
|
(18) |
|
|
(27) |
|
(50%) |
Income (Loss) from Discontinued Operations, net of taxes |
|
|
(8) |
|
|
(2) |
|
|
17 |
|
|
(15) |
|
|
(4) |
|
73% |
|
50% |
|
|
(8) |
|
|
(4) |
|
50% |
|
|
|
|
|
|
|
|
|
|
|
|
|
|
|
|
|
|
|
|
|
|
|
|
|
|
|
|
Net Income before Noncontrolling Interests |
|
|
4,297 |
|
|
4,735 |
|
|
4,809 |
|
|
4,928 |
|
|
4,995 |
|
1% |
|
16% |
|
|
18,080 |
|
|
19,467 |
|
8% |
|
|
|
|
|
|
|
|
|
|
|
|
|
|
|
|
|
|
|
|
|
|
|
|
|
|
|
|
Net Income (Loss) attributable to noncontrolling interests |
|
|
(16) |
|
|
25 |
|
|
10 |
|
|
15 |
|
|
16 |
|
7% |
|
NM |
|
|
35 |
|
|
66 |
|
89% |
Citigroup's Net Income |
|
$ |
4,313 |
|
$ |
4,710 |
|
$ |
4,799 |
|
$ |
4,913 |
|
$ |
4,979 |
|
1% |
|
15% |
|
$ |
18,045 |
|
$ |
19,401 |
|
8% |
(1) |
4Q19 includes discrete tax items of roughly $540 million, including an approximate $430 million benefit of a reduction in Citi’s valuation allowance related to its Deferred Tax Assets (DTAs). |
(2) |
3Q19 includes discrete tax items of roughly $230 million, including an approximate $180 million benefit of a reduction in Citi’s valuation allowance related to its DTAs. |
NM Not meaningful.
Reclassified to conform to the current period's presentation.
Page 2
CITIGROUP CONSOLIDATED BALANCE SHEET
(In millions of dollars)
|
|
|
|
|
|
|
|
|
|
|
|
|
4Q19 Increase/ |
|
|||||||||
|
|
December 31, |
|
March 31, |
|
June 30, |
|
September 30, |
December 31, |
|
(Decrease) from |
||||||||||||
|
|
2018 |
|
2019 |
|
2019 |
|
2019 |
|
2019 (1) |
|
3Q19 |
|
4Q18 |
|
||||||||
Assets |
|||||||||||||||||||||||
Cash and due from banks (including segregated cash and other deposits) |
|
$ |
23,645 |
|
$ |
24,448 |
|
$ |
24,997 |
|
$ |
24,086 |
|
$ |
23,967 |
|
- |
|
1% |
|
|||
Deposits with banks |
|
|
164,460 |
|
|
181,445 |
|
|
178,246 |
|
|
196,357 |
|
|
169,952 |
|
(13%) |
|
3% |
|
|||
Securities borrowed and purchased under agreements to resell |
|
|
270,684 |
|
|
264,495 |
|
|
259,769 |
|
|
261,125 |
|
|
251,322 |
|
(4%) |
|
(7%) |
|
|||
Brokerage receivables |
|
|
35,450 |
|
|
44,500 |
|
|
50,027 |
|
|
54,215 |
|
|
39,857 |
|
(26%) |
|
12% |
|
|||
Trading account assets |
|
|
256,117 |
|
|
286,511 |
|
|
306,831 |
|
|
306,824 |
|
|
276,140 |
|
(10%) |
|
8% |
|
|||
Investments |
|
|
|
|
|
|
|
|
|
|
|
|
|
|
|
|
|
|
|
|
|||
Available-for-sale and non-marketable equity securities |
|
|
288,038 |
|
|
275,132 |
|
|
273,435 |
|
|
275,425 |
|
|
280,265 |
|
2% |
|
(3%) |
|
|||
Held-to-maturity debt securities |
|
|
63,357 |
|
|
66,842 |
|
|
68,693 |
|
|
75,841 |
|
|
80,775 |
|
7% |
|
27% |
|
|||
Equity securities |
|
|
7,212 |
|
|
7,307 |
|
|
7,574 |
|
|
7,117 |
|
|
7,523 |
|
6% |
|
4% |
|
|||
Total investments |
|
|
358,607 |
|
|
349,281 |
|
|
349,702 |
|
|
358,383 |
|
|
368,563 |
|
3% |
|
3% |
|
|||
Loans, net of unearned income |
|
|
|
|
|
|
|
|
|
|
|
|
|
|
|
|
|
|
|
|
|||
Consumer |
|
|
302,360 |
|
|
290,968 |
|
|
296,505 |
|
|
297,400 |
|
|
309,548 |
|
4% |
|
2% |
|
|||
Corporate |
|
|
381,836 |
|
|
391,378 |
|
|
392,165 |
|
|
394,343 |
|
|
389,935 |
|
(1%) |
|
2% |
|
|||
Loans, net of unearned income |
|
|
684,196 |
|
|
682,346 |
|
|
688,670 |
|
|
691,743 |
|
|
699,483 |
|
1% |
|
2% |
|
|||
Allowance for loan losses |
|
|
(12,315) |
|
|
(12,329) |
|
|
(12,466) |
|
|
(12,530) |
|
|
(12,783) |
|
(2%) |
|
(4%) |
|
|||
Total loans, net |
|
|
671,881 |
|
|
670,017 |
|
|
676,204 |
|
|
679,213 |
|
|
686,700 |
|
1% |
|
2% |
|
|||
Goodwill |
|
|
22,046 |
|
|
22,037 |
|
|
22,065 |
|
|
21,822 |
|
|
22,126 |
|
1% |
|
- |
|
|||
Intangible assets (including MSRs) |
|
|
5,220 |
|
|
5,196 |
|
|
5,026 |
|
|
4,844 |
|
|
4,822 |
|
- |
|
(8%) |
|
|||
Other assets |
|
|
109,273 |
|
|
110,483 |
|
|
115,359 |
|
|
107,933 |
|
|
107,709 |
|
- |
|
(1%) |
|
|||
Total assets |
|
$ |
1,917,383 |
|
$ |
1,958,413 |
|
$ |
1,988,226 |
|
$ |
2,014,802 |
|
$ |
1,951,158 |
|
(3%) |
|
2% |
|
|||
|
|
|
|
|
|
|
|
|
|
|
|
|
|
|
|
|
|
|
|
|
|||
Liabilities |
|
|
|
|
|
|
|
|
|
|
|
|
|
|
|
|
|
|
|
|
|||
Non-interest-bearing deposits in U.S. offices |
|
$ |
105,836 |
|
$ |
101,354 |
|
$ |
95,659 |
|
$ |
99,731 |
|
$ |
98,811 |
|
(1%) |
|
(7%) |
|
|||
Interest-bearing deposits in U.S. offices |
|
|
361,573 |
|
|
373,339 |
|
|
382,738 |
|
|
407,872 |
|
|
401,418 |
|
(2%) |
|
11% |
|
|||
Total U.S. deposits |
|
|
467,409 |
|
|
474,693 |
|
|
478,397 |
|
|
507,603 |
|
|
500,229 |
|
(1%) |
|
7% |
|
|||
Non-interest-bearing deposits in offices outside the U.S. |
|
|
80,648 |
|
|
80,594 |
|
|
82,750 |
|
|
82,723 |
|
|
85,692 |
|
4% |
|
6% |
|
|||
Interest-bearing deposits in offices outside the U.S. |
|
|
465,113 |
|
|
475,068 |
|
|
484,460 |
|
|
497,443 |
|
|
484,669 |
|
(3%) |
|
4% |
|
|||
Total international deposits |
|
|
545,761 |
|
|
555,662 |
|
|
567,210 |
|
|
580,166 |
|
|
570,361 |
|
(2%) |
|
5% |
|
|||
|
|
|
|
|
|
|
|
|
|
|
|
|
|
|
|
|
|
|
|
|
|||
Total deposits |
|
|
1,013,170 |
|
|
1,030,355 |
|
|
1,045,607 |
|
|
1,087,769 |
|
|
1,070,590 |
|
(2%) |
|
6% |
|
|||
Securities loaned and sold under agreements to resell |
|
|
177,768 |
|
|
190,372 |
|
|
181,133 |
|
|
195,047 |
|
|
166,339 |
|
(15%) |
|
(6%) |
|
|||
Brokerage payables |
|
|
64,571 |
|
|
62,656 |
|
|
69,839 |
|
|
63,342 |
|
|
48,601 |
|
(23%) |
|
(25%) |
|
|||
Trading account liabilities |
|
|
144,305 |
|
|
136,392 |
|
|
136,294 |
|
|
135,596 |
|
|
119,894 |
|
(12%) |
|
(17%) |
|
|||
Short-term borrowings |
|
|
32,346 |
|
|
39,322 |
|
|
42,442 |
|
|
35,230 |
|
|
45,049 |
|
28% |
|
39% |
|
|||
Long-term debt |
|
|
231,999 |
|
|
243,566 |
|
|
252,189 |
|
|
242,238 |
|
|
248,760 |
|
3% |
|
7% |
|
|||
Other liabilities(2) |
|
|
56,150 |
|
|
58,735 |
|
|
62,612 |
|
|
58,510 |
|
|
57,979 |
|
(1%) |
|
3% |
|
|||
Total liabilities |
|
$ |
1,720,309 |
|
$ |
1,761,398 |
|
$ |
1,790,116 |
|
$ |
1,817,732 |
|
$ |
1,757,212 |
|
(3%) |
|
2% |
|
|||
|
|
|
|
|
|
|
|
|
|
|
|
|
|
|
|
|
|
|
|
|
|||
Equity |
|
|
|
|
|
|
|
|
|
|
|
|
|
|
|
|
|
|
|
|
|||
Stockholders' equity |
|||||||||||||||||||||||
Preferred stock |
|
$ |
18,460 |
|
$ |
17,980 |
|
$ |
17,980 |
|
$ |
19,480 |
|
$ |
17,980 |
|
(8%) |
|
(3%) |
|
|||
Common stock |
|
|
31 |
|
|
31 |
|
|
31 |
|
|
31 |
|
|
31 |
|
- |
|
- |
|
|||
Additional paid-in capital |
|
|
107,922 |
|
|
107,551 |
|
|
107,657 |
|
|
107,741 |
|
|
107,840 |
|
- |
|
- |
|
|||
Retained earnings |
|
|
151,347 |
|
|
154,859 |
|
|
158,321 |
|
|
161,797 |
|
|
165,369 |
|
2% |
|
9% |
|
|||
Treasury stock |
|
|
(44,370) |
|
|
(47,861) |
|
|
(51,427) |
|
|
(56,541) |
|
|
(61,660) |
|
(9%) |
|
(39%) |
|
|||
Accumulated other comprehensive income (loss) |
|
|
(37,170) |
|
|
(36,308) |
|
|
(35,203) |
|
|
(36,135) |
|
|
(36,318) |
|
(1%) |
|
2% |
|
|||
Total common equity |
|
$ |
177,760 |
|
$ |
178,272 |
|
$ |
179,379 |
|
$ |
176,893 |
|
$ |
175,262 |
|
(1%) |
|
(1%) |
|
|||
|
|
|
|
|
|
|
|
|
|
|
|
|
|
|
|
|
|
|
|
|
|||
Total Citigroup stockholders' equity |
|
$ |
196,220 |
|
$ |
196,252 |
|
$ |
197,359 |
|
$ |
196,373 |
|
$ |
193,242 |
|
(2%) |
|
(2%) |
|
|||
Noncontrolling interests |
|
|
854 |
|
|
763 |
|
|
751 |
|
|
697 |
|
|
704 |
|
1% |
|
(18%) |
|
|||
Total equity |
|
|
197,074 |
|
|
197,015 |
|
|
198,110 |
|
|
197,070 |
|
|
193,946 |
|
(2%) |
|
(2%) |
|
|||
Total liabilities and equity |
|
$ |
1,917,383 |
|
$ |
1,958,413 |
|
$ |
1,988,226 |
|
$ |
2,014,802 |
|
$ |
1,951,158 |
|
(3%) |
|
2% |
|
(1) |
Preliminary. |
(2) |
Includes allowance for credit losses for unfunded lending commitments. See page 23 for amounts by period. |
NM Not meaningful.
Reclassified to conform to the current period's presentation.
Page 3
SEGMENT DETAIL
NET REVENUES
(In millions of dollars)
|
|
|
|
|
|
|
|
|
|
|
|
4Q19 Increase/ |
|
Full |
|
Full |
|
FY 2019 vs. |
|||||||||
|
|
4Q |
|
1Q |
|
2Q |
|
3Q |
|
4Q |
|
(Decrease) from |
|
Year |
|
Year |
|
FY 2018 Increase/ |
|||||||||
|
|
2018 |
|
2019 |
|
2019 |
|
2019 |
|
2019 |
|
3Q19 |
|
4Q18 |
|
2018 |
|
2019 |
|
(Decrease) |
|||||||
Global Consumer Banking |
|||||||||||||||||||||||||||
North America |
|
$ |
5,073 |
|
$ |
5,000 |
|
$ |
4,966 |
|
$ |
5,179 |
|
$ |
5,253 |
|
1% |
|
4% |
|
$ |
19,829 |
|
$ |
20,398 |
|
3% |
Latin America |
|
|
1,250 |
|
|
1,272 |
|
|
1,320 |
|
|
1,269 |
|
|
1,377 |
|
9% |
|
10% |
|
|
5,309 |
|
|
5,238 |
|
(1%) |
Asia(1) |
|
|
1,758 |
|
|
1,818 |
|
|
1,847 |
|
|
1,841 |
|
|
1,829 |
|
(1%) |
|
4% |
|
|
7,201 |
|
|
7,335 |
|
2% |
Total |
|
|
8,081 |
|
|
8,090 |
|
|
8,133 |
|
|
8,289 |
|
|
8,459 |
|
2% |
|
5% |
|
|
32,339 |
|
|
32,971 |
|
2% |
|
|
|
|
|
|
|
|
|
|
|
|
|
|
|
|
|
|
|
|
|
|
|
|
|
|
|
|
Institutional Clients Group |
|
|
|
|
|
|
|
|
|
|
|
|
|
|
|
|
|
|
|
|
|
|
|
|
|
|
|
North America |
|
|
2,960 |
|
|
3,269 |
|
|
3,632 |
|
|
3,244 |
|
|
3,314 |
|
2% |
|
12% |
|
|
13,522 |
|
|
13,459 |
|
- |
EMEA |
|
|
2,633 |
|
|
3,170 |
|
|
2,960 |
|
|
3,138 |
|
|
2,738 |
|
(13%) |
|
4% |
|
|
11,770 |
|
|
12,006 |
|
2% |
Latin America |
|
|
1,189 |
|
|
1,268 |
|
|
1,307 |
|
|
1,294 |
|
|
1,297 |
|
- |
|
9% |
|
|
4,954 |
|
|
5,166 |
|
4% |
Asia |
|
|
1,761 |
|
|
2,311 |
|
|
2,156 |
|
|
2,175 |
|
|
2,028 |
|
(7%) |
|
15% |
|
|
8,079 |
|
|
8,670 |
|
7% |
Total |
|
|
8,543 |
|
|
10,018 |
|
|
10,055 |
|
|
9,851 |
|
|
9,377 |
|
(5%) |
|
10% |
|
|
38,325 |
|
|
39,301 |
|
3% |
|
|
|
|
|
|
|
|
|
|
|
|
|
|
|
|
|
|
|
|
|
|
|
|
|
|
|
|
Corporate / Other |
|
|
500 |
|
|
468 |
|
|
570 |
|
|
434 |
|
|
542 |
|
25% |
|
8% |
|
|
2,190 |
|
|
2,014 |
|
(8%) |
|
|
|
|
|
|
|
|
|
|
|
|
|
|
|
|
|
|
|
|
|
|
|
|
|
|
|
|
Total Citigroup - Net Revenues |
|
$ |
17,124 |
|
$ |
18,576 |
|
$ |
18,758 |
|
$ |
18,574 |
|
$ |
18,378 |
|
(1%) |
|
7% |
|
$ |
72,854 |
|
$ |
74,286 |
|
2% |
(1) |
Asia GCB includes the results of operations of GCB activities in certain EMEA countries for all periods presented. |
NM Not meaningful.
Reclassified to conform to the current period's presentation, including a change in the reporting of the commercial banking businesses from GCB to ICG.
Page 4
SEGMENT DETAIL
INCOME
(In millions of dollars)
|
|
|
|
|
|
|
|
|
|
|
|
4Q19 Increase/ |
|
Full |
|
Full |
|
FY 2019 vs. |
|||||||||
|
|
4Q |
|
1Q |
|
2Q |
|
3Q |
|
4Q |
|
(Decrease) from |
|
Year |
|
Year |
|
FY 2018 Increase/ |
|||||||||
|
|
2018 |
|
2019 |
|
2019 |
|
2019 |
|
2019 |
|
3Q19 |
|
4Q18 |
|
2018 |
|
2019 |
|
(Decrease) |
|||||||
Income (Loss) from Continuing Operations |
|
|
|
|
|
|
|
|
|
|
|
|
|
|
|
|
|
|
|
|
|
|
|
|
|
|
|
|
|
|
|
|
|
|
|
|
|
|
|
|
|
|
|
|
|
|
|
|
|
|
|
|
|
|
|
Global Consumer Banking |
|
|
|
|
|
|
|
|
|
|
|
|
|
|
|
|
|
|
|
|
|
|
|
|
|
|
|
North America |
|
$ |
876 |
|
$ |
707 |
|
$ |
663 |
|
$ |
884 |
|
$ |
970 |
|
10% |
|
11% |
|
$ |
3,087 |
|
$ |
3,224 |
|
4% |
Latin America |
|
|
170 |
|
|
216 |
|
|
234 |
|
|
217 |
|
|
234 |
|
8% |
|
38% |
|
|
802 |
|
|
901 |
|
12% |
Asia (1) |
|
|
364 |
|
|
397 |
|
|
404 |
|
|
402 |
|
|
374 |
|
(7%) |
|
3% |
|
|
1,420 |
|
|
1,577 |
|
11% |
Total |
|
|
1,410 |
|
|
1,320 |
|
|
1,301 |
|
|
1,503 |
|
|
1,578 |
|
5% |
|
12% |
|
|
5,309 |
|
|
5,702 |
|
7% |
|
|
|
|
|
|
|
|
|
|
|
|
|
|
|
|
|
|
|
|
|
|
|
|
|
|
|
|
Institutional Clients Group |
|
|
|
|
|
|
|
|
|
|
|
|
|
|
|
|
|
|
|
|
|
|
|
|
|
|
|
North America |
|
|
779 |
|
|
748 |
|
|
1,050 |
|
|
818 |
|
|
895 |
|
9% |
|
15% |
|
|
3,675 |
|
|
3,511 |
|
(4%) |
EMEA |
|
|
819 |
|
|
1,125 |
|
|
1,005 |
|
|
1,060 |
|
|
677 |
|
(36%) |
|
(17%) |
|
|
3,889 |
|
|
3,867 |
|
(1%) |
Latin America |
|
|
383 |
|
|
540 |
|
|
519 |
|
|
487 |
|
|
565 |
|
16% |
|
48% |
|
|
2,013 |
|
|
2,111 |
|
5% |
Asia |
|
|
625 |
|
|
999 |
|
|
851 |
|
|
864 |
|
|
741 |
|
(14%) |
|
19% |
|
|
2,997 |
|
|
3,455 |
|
15% |
Total |
|
|
2,606 |
|
|
3,412 |
|
|
3,425 |
|
|
3,229 |
|
|
2,878 |
|
(11%) |
|
10% |
|
|
12,574 |
|
|
12,944 |
|
3% |
|
|
|
|
|
|
|
|
|
|
|
|
|
|
|
|
|
|
|
|
|
|
|
|
|
|
|
|
Corporate / Other |
|
|
289 |
|
|
5 |
|
|
66 |
|
|
211 |
|
|
543 |
|
NM |
|
88% |
|
|
205 |
|
|
825 |
|
NM |
|
|
|
|
|
|
|
|
|
|
|
|
|
|
|
|
|
|
|
|
|
|
|
|
|
|
|
|
Income From Continuing Operations |
|
$ |
4,305 |
|
$ |
4,737 |
|
$ |
4,792 |
|
$ |
4,943 |
|
$ |
4,999 |
|
1% |
|
16% |
|
$ |
18,088 |
|
$ |
19,471 |
|
8% |
|
|
|
|
|
|
|
|
|
|
|
|
|
|
|
|
|
|
|
|
|
|
|
|
|
|
|
|
Discontinued Operations |
|
|
(8) |
|
|
(2) |
|
|
17 |
|
|
(15) |
|
|
(4) |
|
73% |
|
50% |
|
|
(8) |
|
|
(4) |
|
50% |
|
|
|
|
|
|
|
|
|
|
|
|
|
|
|
|
|
|
|
|
|
|
|
|
|
|
|
|
Net Income Attributable to Noncontrolling Interests |
|
|
(16) |
|
|
25 |
|
|
10 |
|
|
15 |
|
|
16 |
|
7% |
|
NM |
|
|
35 |
|
|
66 |
|
89% |
|
|
|
|
|
|
|
|
|
|
|
|
|
|
|
|
|
|
|
|
|
|
|
|
|
|
|
|
Total Citigroup - Net Income |
|
$ |
4,313 |
|
$ |
4,710 |
|
$ |
4,799 |
|
$ |
4,913 |
|
$ |
4,979 |
|
1% |
|
15% |
|
$ |
18,045 |
|
$ |
19,401 |
|
8% |
|
|
|
|
|
|
|
|
|
|
|
|
|
|
|
|
|
|
|
|
|
|
|
|
|
|
|
|
Average Assets (in billions) |
|
|
|
|
|
|
|
|
|
|
|
|
|
|
|
|
|
|
|
|
|
|
|
|
|
|
|
North America |
|
$ |
1,010 |
|
$ |
999 |
|
$ |
1,028 |
|
$ |
1,054 |
|
$ |
1,053 |
|
- |
|
4% |
|
$ |
990 |
|
$ |
1,034 |
|
4% |
EMEA(1) |
|
|
368 |
|
|
363 |
|
|
370 |
|
|
363 |
|
|
357 |
|
(2%) |
|
(3%) |
|
|
366 |
|
|
363 |
|
(1%) |
Latin America |
|
|
123 |
|
|
126 |
|
|
128 |
|
|
130 |
|
|
133 |
|
2% |
|
8% |
|
|
126 |
|
|
129 |
|
2% |
Asia(1) |
|
|
347 |
|
|
352 |
|
|
355 |
|
|
356 |
|
|
359 |
|
1% |
|
3% |
|
|
345 |
|
|
356 |
|
3% |
Corporate / Other |
|
|
89 |
|
|
99 |
|
|
98 |
|
|
97 |
|
|
95 |
|
(2%) |
|
7% |
|
|
93 |
|
|
97 |
|
4% |
Total |
|
$ |
1,937 |
|
$ |
1,939 |
|
$ |
1,979 |
|
$ |
2,000 |
|
$ |
1,997 |
|
- |
|
3% |
|
$ |
1,920 |
|
$ |
1,979 |
|
3% |
|
|
|
|
|
|
|
|
|
|
|
|
|
|
|
|
|
|
|
|
|
|
|
|
|
|
|
|
Return on Average Assets (ROA) on Net Income (Loss) |
|
|
|
|
|
|
|
|
|
|
|
|
|
|
|
|
|
|
|
|
|
|
|
|
|
|
|
North America |
|
|
0.66% |
|
|
0.59% |
|
|
0.67% |
|
|
0.64% |
|
|
0.70% |
|
|
|
|
|
|
0.69% |
|
|
0.65% |
|
|
EMEA(1) |
|
|
0.87% |
|
|
1.24% |
|
|
1.08% |
|
|
1.14% |
|
|
0.74% |
|
|
|
|
|
|
1.05% |
|
|
1.05% |
|
|
Latin America |
|
|
1.78% |
|
|
2.43% |
|
|
2.36% |
|
|
2.15% |
|
|
2.38% |
|
|
|
|
|
|
2.23% |
|
|
2.33% |
|
|
Asia(1) |
|
|
1.13% |
|
|
1.61% |
|
|
1.42% |
|
|
1.41% |
|
|
1.22% |
|
|
|
|
|
|
1.28% |
|
|
1.41% |
|
|
Corporate / Other |
|
|
1.32% |
|
|
(0.05%) |
|
|
0.34% |
|
|
0.78% |
|
|
2.24% |
|
|
|
|
|
|
0.20% |
|
|
0.83% |
|
|
Total |
|
|
0.88% |
|
|
0.98% |
|
|
0.97% |
|
|
0.97% |
|
|
0.99% |
|
|
|
|
|
|
0.94% |
|
|
0.98% |
|
|
(1) |
Asia GCB includes the results of operations of GCB activities in certain EMEA countries for all periods presented. |
NM Not meaningful.
Reclassified to conform to the current period's presentation, including a change in the reporting of the commercial banking businesses from GCB to ICG.
Page 5
GLOBAL CONSUMER BANKING
Page 1
(In millions of dollars, except as otherwise noted)
|
|
|
|
|
|
|
|
|
|
|
|
4Q19 Increase/ |
|
Full |
|
Full |
|
FY 2019 vs. |
|||||||||
|
|
4Q |
|
1Q |
|
2Q |
|
3Q |
|
4Q |
|
(Decrease) from |
|
Year |
|
Year |
|
FY 2018 Increase/ |
|||||||||
|
|
2018 |
|
2019 |
|
2019 |
|
2019 |
|
2019 |
|
3Q19 |
|
4Q18 |
|
2018 |
|
2019 |
|
(Decrease) |
|||||||
Net Interest Revenue |
|
$ |
7,045 |
|
$ |
6,940 |
|
$ |
6,957 |
|
$ |
7,127 |
|
$ |
7,181 |
|
1% |
|
2% |
|
$ |
27,374 |
|
$ |
28,205 |
|
3% |
Non-Interest Revenue |
|
|
1,036 |
|
|
1,150 |
|
|
1,176 |
|
|
1,162 |
|
|
1,278 |
|
10% |
|
23% |
|
|
4,965 |
|
|
4,766 |
|
(4%) |
Total Revenues, Net of Interest Expense |
|
|
8,081 |
|
|
8,090 |
|
|
8,133 |
|
|
8,289 |
|
|
8,459 |
|
2% |
|
5% |
|
|
32,339 |
|
|
32,971 |
|
2% |
Total Operating Expenses |
|
|
4,379 |
|
|
4,416 |
|
|
4,471 |
|
|
4,368 |
|
|
4,373 |
|
- |
|
- |
|
|
17,786 |
|
|
17,628 |
|
(1%) |
Net Credit Losses |
|
|
1,733 |
|
|
1,868 |
|
|
1,870 |
|
|
1,802 |
|
|
1,842 |
|
2% |
|
6% |
|
|
6,884 |
|
|
7,382 |
|
7% |
Credit Reserve Build / (Release) |
|
|
85 |
|
|
96 |
|
|
94 |
|
|
129 |
|
|
120 |
|
(7%) |
|
41% |
|
|
568 |
|
|
439 |
|
(23%) |
Provision for Unfunded Lending Commitments |
|
|
- |
|
|
(3) |
|
|
- |
|
|
2 |
|
|
2 |
|
- |
|
NM |
|
|
- |
|
|
1 |
|
100% |
Provision for Benefits and Claims |
|
|
28 |
|
|
12 |
|
|
19 |
|
|
17 |
|
|
25 |
|
47% |
|
(11%) |
|
|
103 |
|
|
73 |
|
(29%) |
Provisions for Credit Losses and for Benefits and Claims (LLR & PBC) |
|
|
1,846 |
|
|
1,973 |
|
|
1,983 |
|
|
1,950 |
|
|
1,989 |
|
2% |
|
8% |
|
|
7,555 |
|
|
7,895 |
|
5% |
Income from Continuing Operations before Taxes |
|
|
1,856 |
|
|
1,701 |
|
|
1,679 |
|
|
1,971 |
|
|
2,097 |
|
6% |
|
13% |
|
|
6,998 |
|
|
7,448 |
|
6% |
Income Taxes |
|
|
446 |
|
|
381 |
|
|
378 |
|
|
468 |
|
|
519 |
|
11% |
|
16% |
|
|
1,689 |
|
|
1,746 |
|
3% |
Income from Continuing Operations |
|
|
1,410 |
|
|
1,320 |
|
|
1,301 |
|
|
1,503 |
|
|
1,578 |
|
5% |
|
12% |
|
|
5,309 |
|
|
5,702 |
|
7% |
Noncontrolling Interests |
|
|
3 |
|
|
- |
|
|
1 |
|
|
2 |
|
|
3 |
|
50% |
|
- |
|
|
7 |
|
|
6 |
|
(14%) |
Net Income |
|
$ |
1,407 |
|
$ |
1,320 |
|
$ |
1,300 |
|
$ |
1,501 |
|
$ |
1,575 |
|
5% |
|
12% |
|
$ |
5,302 |
|
$ |
5,696 |
|
7% |
EOP Assets (in billions) |
|
$ |
388 |
|
$ |
379 |
|
$ |
390 |
|
$ |
394 |
|
$ |
407 |
|
3% |
|
5% |
|
|
|
|
|
|
|
|
Average Assets (in billions) |
|
$ |
382 |
|
$ |
380 |
|
$ |
384 |
|
$ |
392 |
|
$ |
399 |
|
2% |
|
4% |
|
$ |
378 |
|
$ |
389 |
|
3% |
Return on Average Assets (ROA) |
|
|
1.46% |
|
|
1.41% |
|
|
1.36% |
|
|
1.52% |
|
|
1.57% |
|
|
|
|
|
|
1.40% |
|
|
1.46% |
|
|
Efficiency Ratio |
|
|
54% |
|
|
55% |
|
|
55% |
|
|
53% |
|
|
52% |
|
|
|
|
|
|
55% |
|
|
53% |
|
|
|
|
|
|
|
|
|
|
|
|
|
|
|
|
|
|
|
|
|
|
|
|
|
|
|
|
|
|
Net Credit Losses as a % of Average Loans |
|
|
2.45% |
|
|
2.70% |
|
|
2.68% |
|
|
2.52% |
|
|
2.51% |
|
|
|
|
|
|
2.48% |
|
|
2.60% |
|
|
|
|
|
|
|
|
|
|
|
|
|
|
|
|
|
|
|
|
|
|
|
|
|
|
|
|
|
|
Revenue by Business |
|
|
|
|
|
|
|
|
|
|
|
|
|
|
|
|
|
|
|
|
|
|
|
|
|
|
|
Retail Banking |
|
$ |
3,029 |
|
$ |
3,106 |
|
$ |
3,202 |
|
$ |
3,117 |
|
$ |
3,124 |
|
- |
|
3% |
|
$ |
12,627 |
|
$ |
12,549 |
|
(1%) |
Cards (1) |
|
|
5,052 |
|
|
4,984 |
|
|
4,931 |
|
|
5,172 |
|
|
5,335 |
|
3% |
|
6% |
|
|
19,712 |
|
|
20,422 |
|
4% |
Total |
|
$ |
8,081 |
|
$ |
8,090 |
|
$ |
8,133 |
|
$ |
8,289 |
|
$ |
8,459 |
|
2% |
|
5% |
|
$ |
32,339 |
|
$ |
32,971 |
|
2% |
|
|
|
|
|
|
|
|
|
|
|
|
|
|
|
|
|
|
|
|
|
|
|
|
|
|
|
|
Net Credit Losses by Business |
|
|
|
|
|
|
|
|
|
|
|
|
|
|
|
|
|
|
|
|
|
|
|
|
|
|
|
Retail Banking |
|
$ |
235 |
|
$ |
233 |
|
$ |
225 |
|
$ |
225 |
|
$ |
227 |
|
1% |
|
(3%) |
|
$ |
913 |
|
$ |
910 |
|
- |
Cards (1) |
|
|
1,498 |
|
|
1,635 |
|
|
1,645 |
|
|
1,577 |
|
|
1,615 |
|
2% |
|
8% |
|
|
5,971 |
|
|
6,472 |
|
8% |
Total |
|
$ |
1,733 |
|
$ |
1,868 |
|
$ |
1,870 |
|
$ |
1,802 |
|
$ |
1,842 |
|
2% |
|
6% |
|
$ |
6,884 |
|
$ |
7,382 |
|
7% |
|
|
|
|
|
|
|
|
|
|
|
|
|
|
|
|
|
|
|
|
|
|
|
|
|
|
|
|
Income from Continuing Operations by Business |
|
|
|
|
|
|
|
|
|
|
|
|
|
|
|
|
|
|
|
|
|
|
|
|
|
|
|
Retail Banking |
|
$ |
422 |
|
$ |
409 |
|
$ |
517 |
|
$ |
492 |
|
$ |
424 |
|
(14%) |
|
- |
|
$ |
1,851 |
|
$ |
1,842 |
|
- |
Cards (1) |
|
|
988 |
|
|
911 |
|
|
784 |
|
|
1,011 |
|
|
1,154 |
|
14% |
|
17% |
|
|
3,458 |
|
|
3,860 |
|
12% |
Total |
|
$ |
1,410 |
|
$ |
1,320 |
|
$ |
1,301 |
|
$ |
1,503 |
|
$ |
1,578 |
|
5% |
|
12% |
|
$ |
5,309 |
|
$ |
5,702 |
|
7% |
|
|
|
|
|
|
|
|
|
|
|
|
|
|
|
|
|
|
|
|
|
|
|
|
|
|
|
|
Foreign Currency (FX) Translation Impact |
|
|
|
|
|
|
|
|
|
|
|
|
|
|
|
|
|
|
|
|
|
|
|
|
|
|
|
Total Revenue - as Reported |
|
$ |
8,081 |
|
$ |
8,090 |
|
$ |
8,133 |
|
$ |
8,289 |
|
$ |
8,459 |
|
2% |
|
5% |
|
$ |
32,339 |
|
$ |
32,971 |
|
2% |
Impact of FX Translation (2) |
|
|
60 |
|
|
(7) |
|
|
10 |
|
|
40 |
|
|
- |
|
|
|
|
|
|
(146) |
|
|
- |
|
|
Total Revenues - Ex-FX (2) |
|
$ |
8,141 |
|
$ |
8,083 |
|
$ |
8,143 |
|
$ |
8,329 |
|
$ |
8,459 |
|
2% |
|
4% |
|
$ |
32,193 |
|
$ |
32,971 |
|
2% |
|
|
|
|
|
|
|
|
|
|
|
|
|
|
|
|
|
|
|
|
|
|
|
|
|
|
|
|
Total Operating Expenses – as Reported |
|
$ |
4,379 |
|
$ |
4,416 |
|
$ |
4,471 |
|
$ |
4,368 |
|
$ |
4,373 |
|
- |
|
- |
|
$ |
17,786 |
|
$ |
17,628 |
|
(1%) |
Impact of FX Translation (2) |
|
|
30 |
|
|
(7) |
|
|
6 |
|
|
25 |
|
|
- |
|
|
|
|
|
|
(100) |
|
|
- |
|
|
Total Operating Expenses - Ex-FX (2) |
|
$ |
4,409 |
|
$ |
4,409 |
|
$ |
4,477 |
|
$ |
4,393 |
|
$ |
4,373 |
|
- |
|
(1%) |
|
$ |
17,686 |
|
$ |
17,628 |
|
- |
|
|
|
|
|
|
|
|
|
|
|
|
|
|
|
|
|
|
|
|
|
|
|
|
|
|
|
|
Total Provisions for LLR & PBC - as Reported |
|
$ |
1,846 |
|
$ |
1,973 |
|
$ |
1,983 |
|
$ |
1,950 |
|
$ |
1,989 |
|
2% |
|
8% |
|
$ |
7,555 |
|
$ |
7,895 |
|
5% |
Impact of FX Translation (2) |
|
|
14 |
|
|
(1) |
|
|
2 |
|
|
7 |
|
|
- |
|
|
|
|
|
|
(24) |
|
|
- |
|
|
Total Provisions for LLR & PBC - Ex-FX (2) |
$ |
1,860 |
$ |
1,972 |
$ |
1,985 |
$ |
1,957 |
$ |
1,989 |
2% |
7% |
$ |
7,531 |
$ |
7,895 |
5% |
||||||||||
|
|
|
|
|
|
|
|
|
|
|
|
|
|
|
|
|
|
|
|
|
|
|
|
|
|
|
|
Net Income – as Reported |
|
$ |
1,407 |
|
$ |
1,320 |
|
$ |
1,300 |
|
$ |
1,501 |
|
$ |
1,575 |
|
5% |
|
12% |
|
$ |
5,302 |
|
$ |
5,696 |
|
7% |
Impact of FX Translation (2) |
|
|
10 |
|
|
2 |
|
|
3 |
|
|
6 |
|
|
- |
|
|
|
|
|
|
(16) |
|
|
- |
|
|
Net Income - Ex-FX (2) |
|
$ |
1,417 |
|
$ |
1,322 |
|
$ |
1,303 |
|
$ |
1,507 |
|
$ |
1,575 |
|
5% |
|
11% |
|
$ |
5,286 |
|
$ |
5,696 |
|
8% |
(1) |
Includes both Citi-Branded Cards and Citi Retail Services. |
(2) |
Reflects the impact of foreign currency (FX) translation into U.S. dollars at the 4Q19 and full-year 2019 average exchange rates for all periods presented. |
Citigroup's results of operations excluding the impact of FX translation are non-GAAP financial measures.
NM Not meaningful.
Reclassified to conform to the current period's presentation, including a change in the reporting of the commercial banking businesses from GCB to ICG.
Page 6
GLOBAL CONSUMER BANKING
Page 2
|
|
|
|
|
|
|
|
|
|
|
|
4Q19 Increase/ |
|||||||
|
|
4Q |
|
1Q |
|
2Q |
|
3Q |
|
4Q |
|
(Decrease) from |
|||||||
|
|
2018 |
|
2019 |
|
2019 |
|
2019 |
|
2019 |
|
3Q19 |
|
4Q18 |
|||||
Retail Banking Key Indicators (in billions of dollars, except as otherwise noted) |
|
|
|
|
|
|
|
|
|
|
|
|
|
|
|
|
|
|
|
Branches (actual) |
|
|
2,410 |
|
|
2,404 |
|
|
2,399 |
|
|
2,394 |
|
|
2,348 |
|
(2%) |
|
(3%) |
Accounts (in millions) |
|
|
54.4 |
|
|
54.9 |
|
|
55.5 |
|
|
55.8 |
|
|
55.9 |
|
- |
|
3% |
Average Deposits |
|
$ |
266.5 |
|
$ |
271.7 |
|
$ |
275.2 |
|
$ |
276.8 |
|
$ |
282.6 |
|
2% |
|
6% |
Investment Sales |
|
$ |
17.5 |
|
$ |
21.2 |
|
$ |
22.9 |
|
$ |
24.0 |
|
$ |
22.8 |
|
(5%) |
|
30% |
Investment Assets under Management (AUMs) |
|
$ |
148.3 |
|
$ |
161.1 |
|
$ |
165.3 |
|
$ |
166.5 |
|
$ |
175.9 |
|
6% |
|
19% |
Average Loans |
|
$ |
117.0 |
|
$ |
117.9 |
|
$ |
118.1 |
|
$ |
119.5 |
|
$ |
123.0 |
|
3% |
|
5% |
EOP Loans: |
|
|
|
|
|
|
|
|
|
|
|
|
|
|
|
|
|
|
|
Mortgages |
|
$ |
80.6 |
|
$ |
80.8 |
|
$ |
81.9 |
|
$ |
83.0 |
|
$ |
85.1 |
|
3% |
|
6% |
Personal, Small Business and Other |
|
|
37.0 |
|
|
37.3 |
|
|
37.8 |
|
|
37.6 |
|
|
39.7 |
|
6% |
|
7% |
EOP Loans |
|
$ |
117.6 |
|
$ |
118.1 |
|
$ |
119.7 |
|
$ |
120.6 |
|
$ |
124.8 |
|
3% |
|
6% |
|
|
|
|
|
|
|
|
|
|
|
|
|
|
|
|
|
|
|
|
Total Net Interest Revenue (in millions) (1) |
|
$ |
2,120 |
|
$ |
2,097 |
|
$ |
2,119 |
|
$ |
2,069 |
|
$ |
2,048 |
|
(1%) |
|
(3%) |
As a % of Average Loans |
|
|
7.19% |
|
|
7.21% |
|
|
7.20% |
|
|
6.87% |
|
|
6.61% |
|
|
|
|
|
|
|
|
|
|
|
|
|
|
|
|
|
|
|
|
|
|
|
|
Net Credit Losses (in millions) |
|
$ |
235 |
|
$ |
233 |
|
$ |
225 |
|
$ |
225 |
|
$ |
227 |
|
1% |
|
(3%) |
As a % of Average Loans |
|
|
0.80% |
|
|
0.80% |
|
|
0.76% |
|
|
0.75% |
|
|
0.73% |
|
|
|
|
Loans 90+ Days Past Due (in millions) (2) |
|
$ |
416 |
|
$ |
394 |
|
$ |
416 |
|
$ |
392 |
|
$ |
438 |
|
12% |
|
5% |
As a % of EOP Loans |
|
|
0.36% |
|
|
0.34% |
|
|
0.35% |
|
|
0.33% |
|
|
0.35% |
|
|
|
|
Loans 30-89 Days Past Due (in millions) (2) |
|
$ |
752 |
|
$ |
744 |
|
$ |
831 |
|
$ |
803 |
|
$ |
816 |
|
2% |
|
9% |
As a % of EOP Loans |
|
|
0.64% |
|
|
0.63% |
|
|
0.70% |
|
|
0.67% |
|
|
0.66% |
|
|
|
|
|
|
|
|
|
|
|
|
|
|
|
|
|
|
|
|
|
|
|
|
Cards Key Indicators (in millions of dollars, except as otherwise noted) |
|
|
|
|
|
|
|
|
|
|
|
|
|
|
|
|
|
|
|
EOP Open Accounts (in millions) |
|
|
141.8 |
|
|
140.1 |
|
|
139.5 |
|
|
138.2 |
|
|
138.3 |
|
- |
|
(2%) |
Purchase Sales (in billions) |
|
$ |
144.1 |
|
$ |
128.0 |
|
$ |
142.0 |
|
$ |
141.8 |
|
$ |
152.0 |
|
7% |
|
5% |
|
|
|
|
|
|
|
|
|
|
|
|
|
|
|
|
|
|
|
|
Average Loans (in billions) (3) |
|
$ |
163.4 |
|
$ |
162.7 |
|
$ |
162.0 |
|
$ |
164.6 |
|
$ |
168.0 |
|
2% |
|
3% |
EOP Loans (in billions) (3) |
|
$ |
169.5 |
|
$ |
160.3 |
|
$ |
165.1 |
|
$ |
165.8 |
|
$ |
175.1 |
|
6% |
|
3% |
Average Yield (4) |
|
|
13.60% |
|
|
13.95% |
|
|
13.87% |
|
|
13.87% |
|
|
13.62% |
|
|
|
|
Total Net Interest Revenue (5) |
|
$ |
4,925 |
|
$ |
4,843 |
|
$ |
4,838 |
|
$ |
5,058 |
|
$ |
5,133 |
|
1% |
|
4% |
As a % of Average Loans (5) |
|
|
11.96% |
|
|
12.07% |
|
|
11.98% |
|
|
12.19% |
|
|
12.12% |
|
|
|
|
Net Credit Losses |
|
$ |
1,498 |
|
$ |
1,635 |
|
$ |
1,645 |
|
$ |
1,577 |
|
$ |
1,615 |
|
2% |
|
8% |
As a % of Average Loans |
|
|
3.64% |
|
|
4.08% |
|
|
4.07% |
|
|
3.80% |
|
|
3.81% |
|
|
|
|
Net Credit Margin (6) |
|
$ |
3,554 |
|
$ |
3,350 |
|
$ |
3,286 |
|
$ |
3,598 |
|
$ |
3,722 |
|
3% |
|
5% |
As a % of Average Loans (6) |
|
|
8.63% |
|
|
8.35% |
|
|
8.14% |
|
|
8.67% |
|
|
8.79% |
|
|
|
|
Loans 90+ Days Past Due |
|
$ |
2,134 |
|
$ |
2,111 |
|
$ |
2,010 |
|
$ |
2,078 |
|
$ |
2,299 |
|
11% |
|
8% |
As a % of EOP Loans |
|
|
1.26% |
|
|
1.32% |
|
|
1.22% |
|
|
1.25% |
|
|
1.31% |
|
|
|
|
Loans 30-89 Days Past Due |
|
$ |
2,112 |
|
$ |
2,007 |
|
$ |
1,952 |
|
$ |
2,153 |
|
$ |
2,185 |
|
1% |
|
3% |
As a % of EOP Loans |
|
|
1.25% |
|
|
1.25% |
|
|
1.18% |
|
|
1.30% |
|
|
1.25% |
|
|
|
|
(1) |
Also includes net interest revenue related to the average deposit balances in excess of the average loan portfolio. |
(2) |
The Loans 90+ Days Past Due and 30-89 Days Past Due and related ratios exclude U.S. mortgage loans that are guaranteed by U.S. government-sponsored agencies. See footnote 2 on page 9. |
(3) |
Average loans, EOP loans and the related consumer delinquency amounts and ratios include interest and fees receivables balances. |
(4) |
Average yield is gross interest revenue earned on loans divided by average loans. |
(5) |
Net interest revenue includes certain fees that are recorded as interest revenue. |
(6) |
Net credit margin is total revenues, net of interest expense, less net credit losses and policy benefits and claims. |
Reclassified to conform to the current period's presentation, including a change in the reporting of the commercial banking businesses from GCB to ICG.
Page 7
GLOBAL CONSUMER BANKING
NORTH AMERICA
Page 1
(In millions of dollars, except as otherwise noted)
|
|
|
|
|
|
|
|
|
|
|
|
4Q19 Increase/ |
|
Full |
|
Full |
|
FY 2019 vs. |
|||||||||
|
|
4Q |
|
1Q |
|
2Q |
|
3Q |
|
4Q |
|
(Decrease) from |
|
Year |
|
Year |
|
FY 2018 Increase/ |
|||||||||
|
|
2018 |
|
2019 |
|
2019 |
|
2019 |
|
2019 |
|
3Q19 |
|
4Q18 |
|
2018 |
|
2019 |
|
(Decrease) |
|||||||
|
|
|
|
|
|
|
|
|
|
|
|
|
|
|
|
|
|
|
|
|
|
|
|
|
|
|
|
Net Interest Revenue |
|
$ |
4,951 |
|
$ |
4,897 |
|
$ |
4,869 |
|
$ |
5,041 |
|
$ |
5,062 |
|
- |
|
2% |
|
$ |
19,006 |
|
$ |
19,869 |
|
5% |
Non-Interest Revenue |
|
|
122 |
|
|
103 |
|
|
97 |
|
|
138 |
|
|
191 |
|
38% |
|
57% |
|
|
823 |
|
|
529 |
|
(36%) |
Total Revenues, Net of Interest Expense (1) |
|
|
5,073 |
|
|
5,000 |
|
|
4,966 |
|
|
5,179 |
|
|
5,253 |
|
1% |
|
4% |
|
|
19,829 |
|
|
20,398 |
|
3% |
Total Operating Expenses |
|
|
2,546 |
|
|
2,572 |
|
|
2,621 |
|
|
2,511 |
|
|
2,450 |
|
(2%) |
|
(4%) |
|
|
10,230 |
|
|
10,154 |
|
(1%) |
Net Credit Losses |
|
|
1,281 |
|
|
1,408 |
|
|
1,417 |
|
|
1,350 |
|
|
1,408 |
|
4% |
|
10% |
|
|
5,085 |
|
|
5,583 |
|
10% |
Credit Reserve Build / (Release) |
|
|
78 |
|
|
118 |
|
|
81 |
|
|
161 |
|
|
109 |
|
(32%) |
|
40% |
|
|
460 |
|
|
469 |
|
2% |
Provision for Unfunded Lending Commitments |
|
|
- |
|
|
(3) |
|
|
- |
|
|
2 |
|
|
2 |
|
- |
|
NM |
|
|
- |
|
|
1 |
|
100% |
Provision for Benefits and Claims |
|
|
6 |
|
|
6 |
|
|
6 |
|
|
4 |
|
|
3 |
|
(25%) |
|
(50%) |
|
|
22 |
|
|
19 |
|
(14%) |
Provisions for Loan Losses and for Benefits and Claims |
|
|
1,365 |
|
|
1,529 |
|
|
1,504 |
|
|
1,517 |
|
|
1,522 |
|
- |
|
12% |
|
|
5,567 |
|
|
6,072 |
|
9% |
Income from Continuing Operations before Taxes |
|
|
1,162 |
|
|
899 |
|
|
841 |
|
|
1,151 |
|
|
1,281 |
|
11% |
|
10% |
|
|
4,032 |
|
|
4,172 |
|
3% |
Income Taxes |
|
|
286 |
|
|
192 |
|
|
178 |
|
|
267 |
|
|
311 |
|
16% |
|
9% |
|
|
945 |
|
|
948 |
|
- |
Income from Continuing Operations |
|
|
876 |
|
|
707 |
|
|
663 |
|
|
884 |
|
|
970 |
|
10% |
|
11% |
|
|
3,087 |
|
|
3,224 |
|
4% |
Noncontrolling Interests |
|
|
- |
|
|
- |
|
|
- |
|
|
- |
|
|
- |
|
- |
|
- |
|
|
- |
|
|
- |
|
- |
Net Income |
|
$ |
876 |
|
$ |
707 |
|
$ |
663 |
|
$ |
884 |
|
$ |
970 |
|
10% |
|
11% |
|
$ |
3,087 |
|
$ |
3,224 |
|
4% |
Average Assets (in billions) |
|
$ |
231 |
|
$ |
226 |
|
$ |
229 |
|
$ |
235 |
|
$ |
237 |
|
1% |
|
3% |
|
$ |
227 |
|
$ |
232 |
|
2% |
Return on Average Assets |
|
|
1.50% |
|
|
1.27% |
|
|
1.16% |
|
|
1.49% |
|
|
1.62% |
|
|
|
|
|
|
1.36% |
|
|
1.39% |
|
|
Efficiency Ratio |
|
|
50% |
|
|
51% |
|
|
53% |
|
|
48% |
|
|
47% |
|
|
|
|
|
|
52% |
|
|
50% |
|
|
|
|
|
|
|
|
|
|
|
|
|
|
|
|
|
|
|
|
|
|
|
|
|
|
|
|
|
|
Net Credit Losses as a % of Average Loans |
|
|
2.72% |
|
|
3.08% |
|
|
3.07% |
|
|
2.84% |
|
|
2.90% |
|
|
|
|
|
|
2.78% |
|
|
2.97% |
|
|
|
|
|
|
|
|
|
|
|
|
|
|
|
|
|
|
|
|
|
|
|
|
|
|
|
|
|
|
Revenue by Business |
|
|
|
|
|
|
|
|
|
|
|
|
|
|
|
|
|
|
|
|
|
|
|
|
|
|
|
Retail Banking |
|
$ |
1,150 |
|
$ |
1,131 |
|
$ |
1,159 |
|
$ |
1,131 |
|
$ |
1,108 |
|
(2%) |
|
(4%) |
|
$ |
4,600 |
|
$ |
4,529 |
|
(2%) |
Citi-Branded Cards |
|
|
2,226 |
|
|
2,195 |
|
|
2,197 |
|
|
2,334 |
|
|
2,439 |
|
4% |
|
10% |
|
|
8,628 |
|
|
9,165 |
|
6% |
Citi Retail Services |
|
|
1,697 |
|
|
1,674 |
|
|
1,610 |
|
|
1,714 |
|
|
1,706 |
|
- |
|
1% |
|
|
6,601 |
|
|
6,704 |
|
2% |
Total |
|
$ |
5,073 |
|
$ |
5,000 |
|
$ |
4,966 |
|
$ |
5,179 |
|
$ |
5,253 |
|
1% |
|
4% |
|
$ |
19,829 |
|
$ |
20,398 |
|
3% |
|
|
|
|
|
|
|
|
|
|
|
|
|
|
|
|
|
|
|
|
|
|
|
|
|
|
|
|
Net Credit Losses by Business |
|
|
|
|
|
|
|
|
|
|
|
|
|
|
|
|
|
|
|
|
|
|
|
|
|
|
|
Retail Banking |
|
$ |
31 |
|
$ |
39 |
|
$ |
40 |
|
$ |
40 |
|
$ |
42 |
|
5% |
|
35% |
|
$ |
126 |
|
$ |
161 |
|
28% |
Citi-Branded Cards |
|
|
650 |
|
|
706 |
|
|
723 |
|
|
712 |
|
|
723 |
|
2% |
|
11% |
|
|
2,602 |
|
|
2,864 |
|
10% |
Citi Retail Services |
|
|
600 |
|
|
663 |
|
|
654 |
|
|
598 |
|
|
643 |
|
8% |
|
7% |
|
|
2,357 |
|
|
2,558 |
|
9% |
Total |
|
$ |
1,281 |
|
$ |
1,408 |
|
$ |
1,417 |
|
$ |
1,350 |
|
$ |
1,408 |
|
4% |
|
10% |
|
$ |
5,085 |
|
$ |
5,583 |
|
10% |
|
|
|
|
|
|
|
|
|
|
|
|
|
|
|
|
|
|
|
|
|
|
|
|
|
|
|
|
Income from Continuing Operations by Business |
|
|
|
|
|
|
|
|
|
|
|
|
|
|
|
|
|
|
|
|
|
|
|
|
|
|
|
Retail Banking |
|
$ |
76 |
|
$ |
21 |
|
$ |
56 |
|
$ |
67 |
|
$ |
52 |
|
(22%) |
|
(32%) |
|
$ |
312 |
|
$ |
196 |
|
(37%) |
Citi-Branded Cards |
|
|
472 |
|
|
382 |
|
|
364 |
|
|
441 |
|
|
555 |
|
26% |
|
18% |
|
|
1,581 |
|
|
1,742 |
|
10% |
Citi Retail Services |
|
|
328 |
|
|
304 |
|
|
243 |
|
|
376 |
|
|
363 |
|
(3%) |
|
11% |
|
|
1,194 |
|
|
1,286 |
|
8% |
Total |
|
$ |
876 |
|
$ |
707 |
|
$ |
663 |
|
$ |
884 |
|
$ |
970 |
|
10% |
|
11% |
|
$ |
3,087 |
|
$ |
3,224 |
|
4% |
(1) |
1Q18 includes an approximate $150 million gain on the sale of the Hilton Card portfolio. |
NM Not meaningful.
Reclassified to conform to the current period's presentation.
Page 8
GLOBAL CONSUMER BANKING
NORTH AMERICA
Page 2
|
|
|
|
|
|
|
|
|
|
|
|
4Q19 Increase/ |
|||||||
|
|
4Q |
|
1Q |
|
2Q |
|
3Q |
|
4Q |
|
(Decrease) from |
|||||||
|
|
2018 |
|
2019 |
|
2019 |
|
2019 |
|
2019 |
|
3Q19 |
|
4Q18 |
|||||
|
|
|
|
|
|
|
|
|
|
|
|
|
|
|
|||||
Retail Banking Key Indicators (in billions of dollars, except as otherwise noted) |
|
|
|
|
|
|
|
|
|
|
|
|
|
|
|
|
|
|
|
|
|
|
|
|
|
|
|
|
|
|
|
|
|
|
|
|
|
|
|
Branches (actual) |
|
|
689 |
|
|
689 |
|
|
688 |
|
|
687 |
|
|
687 |
|
- |
|
- |
Accounts (in millions) |
|
|
9.0 |
|
|
9.0 |
|
|
9.1 |
|
|
9.1 |
|
|
9.1 |
|
- |
|
1% |
Average Deposits |
|
$ |
146.5 |
|
$ |
149.6 |
|
$ |
151.6 |
|
$ |
153.6 |
|
$ |
156.2 |
|
2% |
|
7% |
Investment Sales |
|
$ |
8.1 |
|
$ |
8.8 |
|
$ |
9.6 |
|
$ |
9.6 |
|
$ |
9.8 |
|
2% |
|
21% |
Investment AUMs |
|
$ |
60.1 |
|
$ |
65.9 |
|
$ |
68.2 |
|
$ |
68.5 |
|
$ |
72.2 |
|
5% |
|
20% |
|
|
|
|
|
|
|
|
|
|
|
|
|
|
|
|
|
|
|
|
Average Loans |
|
$ |
47.6 |
|
$ |
47.6 |
|
$ |
47.8 |
|
$ |
48.6 |
|
$ |
49.8 |
|
2% |
|
5% |
|
|
|
|
|
|
|
|
|
|
|
|
|
|
|
|
|
|
|
|
EOP Loans: |
|
|
|
|
|
|
|
|
|
|
|
|
|
|
|
|
|
|
|
Mortgages |
|
$ |
44.7 |
|
$ |
44.7 |
|
$ |
45.3 |
|
$ |
46.3 |
|
$ |
47.5 |
|
3% |
|
6% |
Personal, Small Business and Other |
|
|
3.0 |
|
|
3.0 |
|
|
2.9 |
|
|
2.8 |
|
|
2.8 |
|
- |
|
(7%) |
Total EOP Loans |
|
$ |
47.7 |
|
$ |
47.7 |
|
$ |
48.2 |
|
$ |
49.1 |
|
$ |
50.3 |
|
2% |
|
5% |
|
|
|
|
|
|
|
|
|
|
|
|
|
|
|
|
|
|
|
|
Mortgage Originations (1) |
|
$ |
2.3 |
|
$ |
2.0 |
|
$ |
3.9 |
|
$ |
5.0 |
|
$ |
6.0 |
|
20% |
|
NM |
|
|
|
|
|
|
|
|
|
|
|
|
|
|
|
|
|
|
|
|
Third Party Mortgage Servicing Portfolio (EOP) |
|
$ |
45.2 |
|
$ |
44.9 |
|
$ |
44.5 |
|
$ |
44.2 |
|
$ |
43.8 |
|
(1%) |
|
(3%) |
|
|
|
|
|
|
|
|
|
|
|
|
|
|
|
|
|
|
|
|
Net Servicing and Gain/(Loss) on Sale (in millions) |
|
$ |
25.6 |
|
$ |
31.8 |
|
$ |
31.3 |
|
$ |
32.9 |
|
$ |
38.2 |
|
16% |
|
49% |
|
|
|
|
|
|
|
|
|
|
|
|
|
|
|
|
|
|
|
|
Saleable Mortgage Rate Locks |
|
$ |
0.9 |
|
$ |
1.1 |
|
$ |
1.5 |
|
$ |
1.9 |
|
$ |
2.0 |
|
5% |
|
NM |
|
|
|
|
|
|
|
|
|
|
|
|
|
|
|
|
|
|
|
|
Net Interest Revenue on Loans (in millions) |
|
$ |
179 |
|
$ |
180 |
|
$ |
175 |
|
$ |
171 |
|
$ |
182 |
|
6% |
|
2% |
As a % of Avg. Loans |
|
|
1.49% |
|
|
1.53% |
|
|
1.47% |
|
|
1.40% |
|
|
1.45% |
|
|
|
|
|
|
|
|
|
|
|
|
|
|
|
|
|
|
|
|
|
|
|
|
Net Credit Losses (in millions) |
|
$ |
31 |
|
$ |
39 |
|
$ |
40 |
|
$ |
40 |
|
$ |
42 |
|
5% |
|
35% |
As a % of Avg. Loans |
|
|
0.26% |
|
|
0.33% |
|
|
0.34% |
|
|
0.33% |
|
|
0.33% |
|
|
|
|
|
|
|
|
|
|
|
|
|
|
|
|
|
|
|
|
|
|
|
|
Loans 90+ Days Past Due (in millions) (2) |
|
$ |
135 |
|
$ |
132 |
|
$ |
133 |
|
$ |
125 |
|
$ |
146 |
|
17% |
|
8% |
As a % of EOP Loans |
|
|
0.29% |
|
|
0.28% |
|
|
0.28% |
|
|
0.26% |
|
|
0.29% |
|
|
|
|
Loans 30-89 Days Past Due (in millions) (2) |
|
$ |
265 |
|
$ |
263 |
|
$ |
341 |
|
$ |
313 |
|
$ |
334 |
|
7% |
|
26% |
As a % of EOP Loans |
|
|
0.56% |
|
|
0.56% |
|
|
0.72% |
|
|
0.65% |
|
|
0.67% |
|
|
|
|
(1) |
Originations of residential first mortgages. |
(2) |
The Loans 90+ Days Past Due and 30-89 Days Past Due and related ratios exclude U.S. mortgage loans that are guaranteed by U.S. government-sponsored agencies since the potential loss predominantly resides with the U.S. agencies. |
The amounts excluded for Loans 90+ Days Past Due and (EOP Loans) were $211 million and ($0.7 billion), $173 million and ($0.6 billion), $162 million and ($0.6 billion), and $150 million and ($0.6 billion), and $135 million and ($0.5 billion) as of December 31, 2018, March 31, 2019, June 30, 2019, September 30, 2019 and December 31, 2019, respectively.
The amounts excluded for Loans 30-89 Days Past Due and (EOP Loans) were $86 million and ($0.7 billion), $78 million and ($0.6 billion), $89 million and ($0.6 billion), $78 million and ($0.6 billion), and $72 million and ($0.5 billion) as of December 31, 2018, March 31, 2019, June 30, 2019, September 30, 2019 and December 31, 2019, respectively.
NM Not meaningful.
Reclassified to conform to the current period's presentation, including a change in the reporting of the commercial banking businesses from GCB to ICG.
Page 9
GLOBAL CONSUMER BANKING
NORTH AMERICA
Page 3
|
|
|
|
|
|
|
|
|
|
|
|
4Q19 Increase/ |
|||||||
|
|
4Q |
|
1Q |
|
2Q |
|
3Q |
|
4Q |
|
(Decrease) from |
|||||||
|
|
2018 |
|
2019 |
|
2019 |
|
2019 |
|
2019 |
|
3Q19 |
|
4Q18 |
|||||
|
|
|
|
|
|
|
|
|
|
|
|
|
|
|
|
||||
Citi-Branded Cards Key Indicators (in millions of dollars, except as otherwise noted) (1) |
|
|
|
|
|
|
|
|
|
|
|
|
|
|
|
|
|
|
|
EOP Open Accounts (in millions) |
|
|
34.6 |
|
|
34.8 |
|
|
34.8 |
|
|
34.7 |
|
|
34.9 |
|
1% |
|
1% |
Purchase Sales (in billions) |
|
$ |
91.6 |
|
$ |
83.6 |
|
$ |
93.2 |
|
$ |
93.5 |
|
$ |
98.1 |
|
5% |
|
7% |
Average Loans (in billions) (1) |
|
$ |
88.8 |
|
$ |
87.7 |
|
$ |
88.4 |
|
$ |
90.5 |
|
$ |
92.4 |
|
2% |
|
4% |
EOP Loans (in billions) (1) |
|
$ |
91.8 |
|
$ |
87.0 |
|
$ |
90.6 |
|
$ |
91.5 |
|
$ |
96.3 |
|
5% |
|
5% |
Average Yield (2) |
|
|
10.74% |
|
|
11.24% |
|
|
11.13% |
|
|
11.19% |
|
|
10.96% |
|
(2%) |
|
2% |
|
|
|
|
|
|
|
|
|
|
|
|
|
|
|
|
|
|
|
|
Total Net Interest Revenue (3) |
|
$ |
1,968 |
|
$ |
1,972 |
|
$ |
1,974 |
|
$ |
2,084 |
|
$ |
2,144 |
|
3% |
|
9% |
As a % of Avg. Loans (3) |
|
|
8.79% |
|
|
9.12% |
|
|
8.96% |
|
|
9.14% |
|
|
9.21% |
|
|
|
|
Net Credit Losses |
|
$ |
650 |
|
$ |
706 |
|
$ |
723 |
|
$ |
712 |
|
$ |
723 |
|
2% |
|
11% |
As a % of Average Loans |
|
|
2.90% |
|
|
3.26% |
|
|
3.28% |
|
|
3.12% |
|
|
3.10% |
|
|
|
|
Net Credit Margin (4) |
|
$ |
1,574 |
|
$ |
1,487 |
|
$ |
1,470 |
|
$ |
1,621 |
|
$ |
1,715 |
|
6% |
|
9% |
As a % of Avg. Loans (4) |
|
|
7.03% |
|
|
6.88% |
|
|
6.67% |
|
|
7.11% |
|
|
7.36% |
|
|
|
|
Loans 90+ Days Past Due |
|
$ |
812 |
|
$ |
828 |
|
$ |
799 |
|
$ |
807 |
|
$ |
915 |
|
13% |
|
13% |
As a % of EOP Loans |
|
|
0.88% |
|
|
0.95% |
|
|
0.88% |
|
|
0.88% |
|
|
0.95% |
|
|
|
|
Loans 30-89 Days Past Due |
|
$ |
755 |
|
$ |
731 |
|
$ |
705 |
|
$ |
800 |
|
$ |
814 |
|
2% |
|
8% |
As a % of EOP Loans |
|
|
0.82% |
|
|
0.84% |
|
|
0.78% |
|
|
0.87% |
|
|
0.85% |
|
|
|
|
|
|
|
|
|
|
|
|
|
|
|
|
|
|
|
|
|
|
|
|
|
|
|
|
|
|
|
|
|
|
|
|
|
|
|
|
|
|
|
|
Citi Retail Services Key Indicators (in millions of dollars, except as otherwise noted) (1) |
|
|
|
|
|
|
|
|
|
|
|
|
|
|
|
|
|
|
|
EOP Open Accounts |
|
|
86.3 |
|
|
84.6 |
|
|
84.1 |
|
|
83.0 |
|
|
82.9 |
|
- |
|
(4%) |
Purchase Sales (in billions) |
|
$ |
25.5 |
|
$ |
18.6 |
|
$ |
22.5 |
|
$ |
21.7 |
|
$ |
25.1 |
|
16% |
|
(2%) |
Average Loans (in billions) (1) |
|
$ |
50.4 |
|
$ |
50.2 |
|
$ |
49.1 |
|
$ |
49.7 |
|
$ |
50.5 |
|
2% |
|
- |
EOP Loans (in billions) (1) |
|
$ |
52.7 |
|
$ |
48.9 |
|
$ |
49.6 |
|
$ |
50.0 |
|
$ |
52.9 |
|
6% |
|
- |
Average Yield (2) |
|
|
17.78% |
|
|
18.17% |
|
|
18.10% |
|
|
18.08% |
|
|
17.66% |
|
(2%) |
|
(1%) |
|
|
|
|
|
|
|
|
|
|
|
|
|
|
|
|
|
|
|
|
Total Net Interest Revenue (3) |
|
$ |
2,128 |
|
$ |
2,078 |
|
$ |
2,036 |
|
$ |
2,136 |
|
$ |
2,121 |
|
(1%) |
|
- |
As a % of Avg. Loans (3) |
|
|
16.75% |
|
|
16.79% |
|
|
16.63% |
|
|
17.05% |
|
|
16.66% |
|
|
|
|
Net Credit Losses |
|
$ |
600 |
|
$ |
663 |
|
$ |
654 |
|
$ |
598 |
|
$ |
643 |
|
8% |
|
7% |
As a % of Average Loans |
|
|
4.72% |
|
|
5.36% |
|
|
5.34% |
|
|
4.77% |
|
|
5.05% |
|
|
|
|
Net Credit Margin (4) |
|
$ |
1,094 |
|
$ |
1,007 |
|
$ |
953 |
|
$ |
1,113 |
|
$ |
1,061 |
|
(5%) |
|
(3%) |
As a % of Avg. Loans (4) |
|
|
8.61% |
|
|
8.14% |
|
|
7.79% |
|
|
8.88% |
|
|
8.34% |
|
|
|
|
Loans 90+ Days Past Due |
|
$ |
952 |
|
$ |
918 |
|
$ |
840 |
|
$ |
923 |
|
$ |
1,012 |
|
10% |
|
6% |
As a % of EOP Loans |
|
|
1.81% |
|
|
1.88% |
|
|
1.69% |
|
|
1.85% |
|
|
1.91% |
|
|
|
|
Loans 30-89 Days Past Due |
|
$ |
932 |
|
$ |
859 |
|
$ |
831 |
|
$ |
943 |
|
$ |
945 |
|
- |
|
1% |
As a % of EOP Loans |
|
|
1.77% |
|
|
1.76% |
|
|
1.68% |
|
|
1.89% |
|
|
1.79% |
|
|
|
|
(1) |
Average loans, EOP loans and the related consumer delinquency amounts and ratios include interest and fees receivables balances. |
(2) |
Average yield is calculated as gross interest revenue earned on loans divided by average loans. |
(3) |
Net interest revenue includes certain fees that are recorded as interest revenue. |
(4) |
Net credit margin represents total revenues, net of interest expense, less net credit losses and policy benefits and claims. |
Reclassified to conform to the current period's presentation.
Page 10
GLOBAL CONSUMER BANKING
LATIN AMERICA (1) - PAGE 1
(In millions of dollars, except as otherwise noted)
|
|
|
|
|
|
|
|
|
|
|
|
4Q19 Increase/ |
|
Full |
|
Full |
|
FY 2019 vs. |
|
|||||||||
|
|
4Q |
|
1Q |
|
2Q |
|
3Q |
|
4Q |
|
(Decrease) from |
|
Year |
|
Year |
|
FY 2018 Increase/ |
|
|||||||||
|
|
2018 |
|
2019 |
|
2019 |
|
2019 |
|
2019 |
|
3Q19 |
|
4Q18 |
|
2018 |
|
2019 |
|
(Decrease) |
|
|||||||
|
|
|
|
|
|
|
|
|
|
|
|
|
|
|
|
|
|
|
|
|
|
|
|
|
||||
Net Interest Revenue |
|
$ |
912 |
|
$ |
877 |
|
$ |
918 |
|
$ |
913 |
|
$ |
931 |
|
2% |
|
2% |
|
$ |
3,681 |
|
$ |
3,639 |
|
(1%) |
|
Non-Interest Revenue (2) |
|
|
338 |
|
|
395 |
|
|
402 |
|
|
356 |
|
|
446 |
|
25% |
|
32% |
|
|
1,628 |
|
|
1,599 |
|
(2%) |
|
Total Revenues, Net of Interest Expense |
|
|
1,250 |
|
|
1,272 |
|
|
1,320 |
|
|
1,269 |
|
|
1,377 |
|
9% |
|
10% |
|
|
5,309 |
|
|
5,238 |
|
(1%) |
|
Total Operating Expenses |
|
|
716 |
|
|
673 |
|
|
704 |
|
|
724 |
|
|
782 |
|
8% |
|
9% |
|
|
2,900 |
|
|
2,883 |
|
(1%) |
|
Net Credit Losses |
|
|
289 |
|
|
296 |
|
|
279 |
|
|
275 |
|
|
259 |
|
(6%) |
|
(10%) |
|
|
1,131 |
|
|
1,109 |
|
(2%) |
|
Credit Reserve Build / (Release) |
|
|
(8) |
|
|
(2) |
|
|
3 |
|
|
(34) |
|
|
(5) |
|
85% |
|
38% |
|
|
84 |
|
|
(38) |
|
NM |
|
Provision for Unfunded Lending Commitments |
|
|
- |
|
|
- |
|
|
- |
|
|
- |
|
|
- |
|
- |
|
- |
|
|
- |
|
|
- |
|
- |
|
Provision for Benefits and Claims |
|
|
22 |
|
|
6 |
|
|
13 |
|
|
13 |
|
|
22 |
|
69% |
|
- |
|
|
81 |
|
|
54 |
|
(33%) |
|
Provisions for Credit Losses and for Benefits and Claims (LLR & PBC) |
|
|
303 |
|
|
300 |
|
|
295 |
|
|
254 |
|
|
276 |
|
9% |
|
(9%) |
|
|
1,296 |
|
|
1,125 |
|
(13%) |
|
Income from Continuing Operations before Taxes |
|
|
231 |
|
|
299 |
|
|
321 |
|
|
291 |
|
|
319 |
|
10% |
|
38% |
|
|
1,113 |
|
|
1,230 |
|
11% |
|
Income Taxes |
|
|
61 |
|
|
83 |
|
|
87 |
|
|
74 |
|
|
85 |
|
15% |
|
39% |
|
|
311 |
|
|
329 |
|
6% |
|
Income from Continuing Operations |
|
|
170 |
|
|
216 |
|
|
234 |
|
|
217 |
|
|
234 |
|
8% |
|
38% |
|
|
802 |
|
|
901 |
|
12% |
|
Noncontrolling Interests |
|
|
- |
|
|
- |
|
|
- |
|
|
- |
|
|
- |
|
- |
|
- |
|
|
- |
|
|
- |
|
- |
|
Net Income |
|
$ |
170 |
|
$ |
216 |
|
$ |
234 |
|
$ |
217 |
|
$ |
234 |
|
8% |
|
38% |
|
$ |
802 |
|
$ |
901 |
|
12% |
|
Average Assets (in billions) |
|
$ |
32 |
|
$ |
33 |
|
$ |
34 |
|
$ |
35 |
|
$ |
37 |
|
6% |
|
16% |
|
$ |
33 |
|
$ |
35 |
|
6% |
|
Return on Average Assets |
|
|
2.11% |
|
|
2.65% |
|
|
2.76% |
|
|
2.46% |
|
|
2.51% |
|
|
|
|
|
|
2.43% |
|
|
2.57% |
|
|
|
Efficiency Ratio |
|
|
57% |
|
|
53% |
|
|
53% |
|
|
57% |
|
|
57% |
|
|
|
|
|
|
55% |
|
|
55% |
|
|
|
|
|
|
|
|
|
|
|
|
|
|
|
|
|
|
|
|
|
|
|
|
|
|
|
|
|
|
|
|
Net Credit Losses as a % of Average Loans |
|
|
6.78% |
|
|
6.98% |
|
|
6.54% |
|
|
6.42% |
|
|
5.91% |
|
|
|
|
|
|
6.50% |
|
|
6.45% |
|
|
|
|
|
|
|
|
|
|
|
|
|
|
|
|
|
|
|
|
|
|
|
|
|
|
|
|
|
|
|
|
Revenue by Business |
|
|
|
|
|
|
|
|
|
|
|
|
|
|
|
|
|
|
|
|
|
|
|
|
|
|
|
|
Retail Banking |
|
$ |
853 |
|
$ |
899 |
|
$ |
903 |
|
$ |
851 |
|
$ |
932 |
|
10% |
|
9% |
|
$ |
3,744 |
|
$ |
3,585 |
|
(4%) |
|
Citi-Branded Cards |
|
|
397 |
|
|
373 |
|
|
417 |
|
|
418 |
|
|
445 |
|
6% |
|
12% |
|
|
1,565 |
|
|
1,653 |
|
6% |
|
Total |
|
$ |
1,250 |
|
$ |
1,272 |
|
$ |
1,320 |
|
$ |
1,269 |
|
$ |
1,377 |
|
9% |
|
10% |
|
$ |
5,309 |
|
$ |
5,238 |
|
(1%) |
|
|
|
|
|
|
|
|
|
|
|
|
|
|
|
|
|
|
|
|
|
|
|
|
|
|
|
|
|
|
Net Credit Losses by Business |
|
|
|
|
|
|
|
|
|
|
|
|
|
|
|
|
|
|
|
|
|
|
|
|
|
|
|
|
Retail Banking |
|
$ |
143 |
|
$ |
136 |
|
$ |
123 |
|
$ |
119 |
|
$ |
116 |
|
(3%) |
|
(19%) |
|
$ |
545 |
|
$ |
494 |
|
(9%) |
|
Citi-Branded Cards |
|
|
146 |
|
|
160 |
|
|
156 |
|
|
156 |
|
|
143 |
|
(8%) |
|
(2%) |
|
|
586 |
|
|
615 |
|
5% |
|
Total |
|
$ |
289 |
|
$ |
296 |
|
$ |
279 |
|
$ |
275 |
|
$ |
259 |
|
(6%) |
|
(10%) |
|
$ |
1,131 |
|
$ |
1,109 |
|
(2%) |
|
|
|
|
|
|
|
|
|
|
|
|
|
|
|
|
|
|
|
|
|
|
|
|
|
|
|
|
|
|
Income from Continuing Operations by Business |
|
|
|
|
|
|
|
|
|
|
|
|
|
|
|
|
|
|
|
|
|
|
|
|
|
|
|
|
Retail Banking |
|
$ |
109 |
|
$ |
161 |
|
$ |
164 |
|
$ |
134 |
|
$ |
141 |
|
5% |
|
29% |
|
$ |
596 |
|
$ |
600 |
|
1% |
|
Citi-Branded Cards |
|
|
61 |
|
|
55 |
|
|
70 |
|
|
83 |
|
|
93 |
|
12% |
|
52% |
|
|
206 |
|
|
301 |
|
46% |
|
Total |
|
$ |
170 |
|
$ |
216 |
|
$ |
234 |
|
$ |
217 |
|
$ |
234 |
|
8% |
|
38% |
|
$ |
802 |
|
$ |
901 |
|
12% |
|
|
|
|
|
|
|
|
|
|
|
|
|
|
|
|
|
|
|
|
|
|
|
|
|
|
|
|
|
|
FX Translation Impact |
|
|
|
|
|
|
|
|
|
|
|
|
|
|
|
|
|
|
|
|
|
|
|
|
|
|
|
|
Total Revenue - as Reported |
|
$ |
1,250 |
|
$ |
1,272 |
|
$ |
1,320 |
|
$ |
1,269 |
|
$ |
1,377 |
|
9% |
|
10% |
|
$ |
5,309 |
|
$ |
5,238 |
|
(1%) |
|
Impact of FX Translation (3) |
|
|
54 |
|
|
2 |
|
|
6 |
|
|
23 |
|
|
- |
|
|
|
|
|
|
(23) |
|
|
- |
|
|
|
Total Revenues - Ex-FX (3) |
|
$ |
1,304 |
|
$ |
1,274 |
|
$ |
1,326 |
|
$ |
1,292 |
|
$ |
1,377 |
|
7% |
|
6% |
|
$ |
5,286 |
|
$ |
5,238 |
|
(1%) |
|
|
|
|
|
|
|
|
|
|
|
|
|
|
|
|
|
|
|
|
|
|
|
|
|
|
|
|
|
|
Total Operating Expenses - as Reported |
|
$ |
716 |
|
$ |
673 |
|
$ |
704 |
|
$ |
724 |
|
$ |
782 |
|
8% |
|
9% |
|
$ |
2,900 |
|
$ |
2,883 |
|
(1%) |
|
Impact of FX Translation (3) |
|
|
28 |
|
|
1 |
|
|
3 |
|
|
12 |
|
|
- |
|
|
|
|
|
|
(13) |
|
|
- |
|
|
|
Total Operating Expenses - Ex-FX (3) |
|
$ |
744 |
|
$ |
674 |
|
$ |
707 |
|
$ |
736 |
|
$ |
782 |
|
6% |
|
5% |
|
$ |
2,887 |
|
$ |
2,883 |
|
- |
|
|
|
|
|
|
|
|
|
|
|
|
|
|
|
|
|
|
|
|
|
|
|
|
|
|
|
|
|
|
Provisions for LLR & PBC - as Reported |
|
$ |
303 |
|
$ |
300 |
|
$ |
295 |
|
$ |
254 |
|
$ |
276 |
|
9% |
|
(9%) |
|
$ |
1,296 |
|
$ |
1,125 |
|
(13%) |
|
Impact of FX Translation (3) |
|
|
14 |
|
|
1 |
|
|
1 |
|
|
6 |
|
|
- |
|
|
|
|
|
|
(6) |
|
|
- |
|
|
|
Provisions for LLR & PBC - Ex-FX (3) |
|
$ |
317 |
|
$ |
301 |
|
$ |
296 |
|
$ |
260 |
|
$ |
276 |
|
6% |
|
(13%) |
|
$ |
1,290 |
|
$ |
1,125 |
|
(13%) |
|
|
|
|
|
|
|
|
|
|
|
|
|
|
|
|
|
|
|
|
|
|
|
|
|
|
|
|
|
|
Net Income - as Reported |
|
$ |
170 |
|
$ |
216 |
|
$ |
234 |
|
$ |
217 |
|
$ |
234 |
|
8% |
|
38% |
|
$ |
802 |
|
$ |
901 |
|
12% |
|
Impact of FX Translation (3) |
|
|
8 |
|
|
1 |
|
|
1 |
|
|
|
|
- |
|
|
|
|
|
|
(3) |
|
|
- |
|
|
|
|
Net Income - Ex-FX (3) |
|
$ |
178 |
|
$ |
217 |
|
$ |
235 |
|
$ |
221 |
|
$ |
234 |
|
6% |
|
31% |
|
$ |
799 |
|
$ |
901 |
|
13% |
|
(1)Latin America GCB consists of Citi's consumer banking operations in Mexico.
(2)3Q18 includes an approximate $250 million gain on the sale of an asset management business.
(3)Reflects the impact of foreign currency (FX) translation into U.S. dollars at the 4Q19 and full-year 2019 average exchange rates for all periods presented.
Citigroup's results of operations excluding the impact of FX translation are non-GAAP financial measures.
NM Not meaningful.
Reclassified to conform to the current period's presentation, including a change in the reporting of the commercial banking businesses from GCB to ICG.
Page 11
GLOBAL CONSUMER BANKING
LATIN AMERICA - PAGE 2
|
|
|
|
|
|
|
|
|
|
|
|
|
|
|
|
4Q19 Increase/ |
||||
|
|
4Q |
|
1Q |
|
2Q |
|
3Q |
|
4Q |
|
(Decrease) from |
||||||||
|
|
2018 |
|
2019 |
|
2019 |
|
2019 |
|
2019 |
|
3Q19 |
|
4Q18 |
||||||
|
|
|
|
|
|
|
|
|
|
|
|
|
|
|
|
|
|
|
|
|
Retail Banking Key Indicators (in billions of dollars, except as otherwise noted) |
|
|
|
|
|
|
|
|
|
|
|
|
|
|
|
|
|
|
|
|
Branches (actual) |
|
|
1,463 |
|
|
1,464 |
|
|
1,459 |
|
|
1,458 |
|
|
1,419 |
|
(3%) |
|
(3%) |
|
Accounts (in millions) |
|
|
29.4 |
|
|
30.0 |
|
|
30.3 |
|
|
30.3 |
|
|
30.1 |
|
(1%) |
|
2% |
|
Average Deposits |
|
$ |
22.3 |
|
$ |
22.7 |
|
$ |
22.8 |
|
$ |
22.5 |
|
$ |
23.0 |
|
2% |
|
3% |
|
Investment Sales |
|
$ |
2.9 |
|
$ |
3.4 |
|
$ |
3.4 |
|
$ |
3.4 |
|
$ |
3.7 |
|
9% |
|
28% |
|
Investment AUMs |
|
$ |
28.6 |
|
$ |
30.2 |
|
$ |
30.7 |
|
$ |
31.7 |
|
$ |
33.7 |
|
6% |
|
18% |
|
Average Loans |
|
$ |
11.4 |
|
$ |
11.5 |
|
$ |
11.5 |
|
$ |
11.4 |
|
$ |
11.6 |
|
2% |
|
2% |
|
EOP Loans: |
|
|
|
|
|
|
|
|
|
|
|
|
|
|
|
|
|
|
|
|
Mortgages |
|
$ |
4.0 |
|
$ |
4.1 |
|
$ |
4.2 |
|
$ |
4.2 |
|
$ |
4.4 |
|
5% |
|
10% |
|
Personal, Small Business and Other |
|
|
7.4 |
|
|
7.2 |
|
|
7.2 |
|
|
7.0 |
|
|
7.3 |
|
4% |
|
(1%) |
|
Total EOP Loans |
|
$ |
11.4 |
|
$ |
11.3 |
|
$ |
11.4 |
|
$ |
11.2 |
|
$ |
11.7 |
|
4% |
|
3% |
|
|
|
|
|
|
|
|
|
|
|
|
|
|
|
|
|
|
|
|
|
|
Total Net Interest Revenue (in millions) (1) |
|
$ |
588 |
|
$ |
574 |
|
$ |
578 |
|
$ |
572 |
|
$ |
578 |
|
1% |
|
(2%) |
|
As a % of Average Loans (1) |
|
|
20.46% |
|
|
20.24% |
|
|
20.16% |
|
|
19.91% |
|
|
19.77% |
|
|
|
|
|
Net Credit Losses (in millions) |
|
$ |
143 |
|
$ |
136 |
|
$ |
123 |
|
$ |
119 |
|
$ |
116 |
|
(3%) |
|
(19%) |
|
As a % of Average Loans |
|
|
4.98% |
|
|
4.80% |
|
|
4.29% |
|
|
4.14% |
|
|
3.97% |
|
|
|
|
|
Loans 90+ Days Past Due (in millions) |
|
$ |
108 |
|
$ |
95 |
|
$ |
108 |
|
$ |
97 |
|
$ |
106 |
|
9% |
|
(2%) |
|
As a % of EOP Loans |
|
|
0.95% |
|
|
0.84% |
|
|
0.95% |
|
|
0.87% |
|
|
0.91% |
|
|
|
|
|
Loans 30-89 Days Past Due (in millions) |
|
$ |
185 |
|
$ |
185 |
|
$ |
191 |
|
$ |
191 |
|
$ |
180 |
|
(6%) |
|
(3%) |
|
As a % of EOP Loans |
|
|
1.62% |
|
|
1.64% |
|
|
1.68% |
|
|
1.71% |
|
|
1.54% |
|
|
|
|
|
|
|
|
|
|
|
|
|
|
|
|
|
|
|
|
|
|
|
|
|
|
Citi-Branded Cards Key Indicators (in billions of dollars, except as otherwise noted) |
|
|
|
|
|
|
|
|
|
|
|
|
|
|
|
|
|
|
|
|
EOP Open Accounts (in millions) |
|
|
5.6 |
|
|
5.5 |
|
|
5.4 |
|
|
5.3 |
|
|
5.3 |
|
- |
|
(5%) |
|
Purchase Sales |
|
$ |
4.8 |
|
$ |
4.4 |
|
$ |
4.7 |
|
$ |
4.7 |
|
$ |
5.4 |
|
15% |
|
13% |
|
Average Loans (2) |
|
$ |
5.5 |
|
$ |
5.7 |
|
$ |
5.6 |
|
$ |
5.6 |
|
$ |
5.8 |
|
4% |
|
5% |
|
EOP Loans (2) |
|
$ |
5.7 |
|
$ |
5.6 |
|
$ |
5.7 |
|
$ |
5.5 |
|
$ |
6.0 |
|
9% |
|
5% |
|
Average Yield (3) |
|
|
24.61% |
|
|
23.68% |
|
|
25.21% |
|
|
24.97% |
|
|
24.91% |
|
- |
|
1% |
|
|
|
|
|
|
|
|
|
|
|
|
|
|
|
|
|
|
|
|
|
|
Total Net Interest Revenue (in millions) (4) |
|
$ |
324 |
|
$ |
303 |
|
$ |
340 |
|
$ |
341 |
|
$ |
353 |
|
4% |
|
9% |
|
As a % of Average Loans (4) |
|
|
23.37% |
|
|
21.56% |
|
|
24.35% |
|
|
24.16% |
|
|
24.15% |
|
|
|
|
|
Net Credit Losses (in millions) |
|
$ |
146 |
|
$ |
160 |
|
$ |
156 |
|
$ |
156 |
|
$ |
143 |
|
(8%) |
|
(2%) |
|
As a % of Average Loans |
|
|
10.53% |
|
|
11.38% |
|
|
11.17% |
|
|
11.05% |
|
|
9.78% |
|
|
|
|
|
Net Credit Margin (in millions) (5) |
|
$ |
256 |
|
$ |
220 |
|
$ |
268 |
|
$ |
269 |
|
$ |
307 |
|
14% |
|
20% |
|
As a % of Average Loans (5) |
|
|
18.47% |
|
|
15.65% |
|
|
19.20% |
|
|
19.06% |
|
|
21.00% |
|
|
|
|
|
Loans 90+ Days Past Due (in millions) |
|
$ |
171 |
|
$ |
165 |
|
$ |
169 |
|
$ |
152 |
|
$ |
165 |
|
9% |
|
(4%) |
|
As a % of EOP Loans |
|
|
3.00% |
|
|
2.95% |
|
|
2.96% |
|
|
2.76% |
|
|
2.75% |
|
|
|
|
|
Loans 30-89 Days Past Due (in millions) |
|
$ |
170 |
|
$ |
161 |
|
$ |
159 |
|
$ |
161 |
|
$ |
159 |
|
(1%) |
|
(6%) |
|
As a % of EOP Loans |
|
|
2.98% |
|
|
2.88% |
|
|
2.79% |
|
|
2.93% |
|
|
2.65% |
|
|
|
|
(1) |
Also includes net interest revenue related to the region's average deposit balances in excess of the average loan portfolio. |
(2) |
Average loans, EOP loans and the related consumer delinquency amounts and ratios include interest and fees receivables balances. |
(3) |
Average yield is gross interest revenue earned on loans divided by average loans. |
(4) |
Net interest revenue includes certain fees that are recorded as interest revenue. |
(5) |
Net credit margin is total revenues, net of interest expense, less net credit losses and policy benefits and claims. |
NM Not meaningful.
Reclassified to conform to the current period's presentation, including a change in the reporting of the commercial banking businesses from GCB to ICG.
Page 12
GLOBAL CONSUMER BANKING
ASIA (1) - PAGE 1
(In millions of dollars, except as otherwise noted)
|
|
|
|
|
|
|
|
|
|
|
|
4Q19 Increase/ |
|
|
Full |
|
Full |
|
FY 2019 vs. |
|||||||||
|
|
4Q |
|
1Q |
|
2Q |
|
3Q |
|
4Q |
|
(Decrease) from |
|
|
Year |
|
Year |
|
FY 2018 Increase/ |
|||||||||
|
|
2018 |
|
2019 |
|
2019 |
|
2019 |
|
2019 |
|
3Q19 |
|
4Q18 |
|
|
2018 |
|
2019 |
|
(Decrease) |
|||||||
|
|
|
|
|
|
|
|
|
|
|
|
|
|
|
|
|
|
|
|
|
|
|
|
|||||
Net Interest Revenue |
|
$ |
1,182 |
|
$ |
1,166 |
|
$ |
1,170 |
|
$ |
1,173 |
|
$ |
1,188 |
|
1% |
|
1% |
|
|
$ |
4,687 |
|
$ |
4,697 |
|
- |
Non-Interest Revenue |
|
|
576 |
|
|
652 |
|
|
677 |
|
|
668 |
|
|
641 |
|
(4%) |
|
11% |
|
|
|
2,514 |
|
|
2,638 |
|
5% |
Total Revenues, Net of Interest Expense |
|
|
1,758 |
|
|
1,818 |
|
|
1,847 |
|
|
1,841 |
|
|
1,829 |
|
(1%) |
|
4% |
|
|
|
7,201 |
|
|
7,335 |
|
2% |
Total Operating Expenses |
|
|
1,117 |
|
|
1,171 |
|
|
1,146 |
|
|
1,133 |
|
|
1,141 |
|
1% |
|
2% |
|
|
|
4,656 |
|
|
4,591 |
|
(1%) |
Net Credit Losses |
|
|
163 |
|
|
164 |
|
|
174 |
|
|
177 |
|
|
175 |
|
(1%) |
|
7% |
|
|
|
668 |
|
|
690 |
|
3% |
Credit Reserve Build / (Release) |
|
|
15 |
|
|
(20) |
|
|
10 |
|
|
2 |
|
|
16 |
|
NM |
|
7% |
|
|
|
24 |
|
|
8 |
|
(67%) |
Provision for Unfunded Lending Commitments |
|
|
- |
|
|
- |
|
|
- |
|
|
- |
|
|
- |
|
- |
|
- |
|
|
|
- |
|
|
- |
|
- |
Provision for Benefits and Claims |
|
|
- |
|
|
- |
|
|
- |
|
|
- |
|
|
- |
|
- |
|
- |
|
|
|
- |
|
|
- |
|
- |
Provisions for Credit Losses and for Benefits and Claims (LLR & PBC) |
|
|
178 |
|
|
144 |
|
|
184 |
|
|
179 |
|
|
191 |
|
7% |
|
7% |
|
|
|
692 |
|
|
698 |
|
1% |
Income from Continuing Operations before Taxes |
|
|
463 |
|
|
503 |
|
|
517 |
|
|
529 |
|
|
497 |
|
(6%) |
|
7% |
|
|
|
1,853 |
|
|
2,046 |
|
10% |
Income Taxes |
|
|
99 |
|
|
106 |
|
|
113 |
|
|
127 |
|
|
123 |
|
(3%) |
|
24% |
|
|
|
433 |
|
|
469 |
|
8% |
Income from Continuing Operations |
|
|
364 |
|
|
397 |
|
|
404 |
|
|
402 |
|
|
374 |
|
(7%) |
|
3% |
|
|
|
1,420 |
|
|
1,577 |
|
11% |
Noncontrolling Interests |
|
|
3 |
|
|
- |
|
|
1 |
|
|
2 |
|
|
3 |
|
50% |
|
- |
|
|
|
7 |
|
|
6 |
|
(14%) |
Net Income |
|
$ |
361 |
|
$ |
397 |
|
$ |
403 |
|
$ |
400 |
|
$ |
371 |
|
(7%) |
|
3% |
|
|
$ |
1,413 |
|
$ |
1,571 |
|
11% |
Average Assets (in billions) |
|
$ |
119 |
|
$ |
121 |
|
$ |
121 |
|
$ |
122 |
|
$ |
125 |
|
2% |
|
5% |
|
|
$ |
119 |
|
$ |
122 |
|
3% |
Return on Average Assets |
|
|
1.20% |
|
|
1.33% |
|
|
1.34% |
|
|
1.30% |
|
|
1.18% |
|
|
|
|
|
|
|
1.19% |
|
|
1.29% |
|
|
Efficiency Ratio |
|
|
64% |
|
|
64% |
|
|
62% |
|
|
62% |
|
|
62% |
|
|
|
|
|
|
|
65% |
|
|
63% |
|
|
|
|
|
|
|
|
|
|
|
|
|
|
|
|
|
|
|
|
|
|
|
|
|
|
|
|
|
|
|
Net Credit Losses as a % of Average Loans |
|
|
0.84% |
|
|
0.85% |
|
|
0.90% |
|
|
0.90% |
|
|
0.86% |
|
|
|
|
|
|
|
0.86% |
|
|
0.88% |
|
|
|
|
|
|
|
|
|
|
|
|
|
|
|
|
|
|
|
|
|
|
|
|
|
|
|
|
|
|
|
Revenue by Business |
|
|
|
|
|
|
|
|
|
|
|
|
|
|
|
|
|
|
|
|
|
|
|
|
|
|
|
|
Retail Banking |
|
$ |
1,026 |
|
$ |
1,076 |
|
$ |
1,140 |
|
$ |
1,135 |
|
$ |
1,084 |
|
(4%) |
|
6% |
|
|
$ |
4,283 |
|
$ |
4,435 |
|
4% |
Citi-Branded Cards |
|
|
732 |
|
|
742 |
|
|
707 |
|
|
706 |
|
|
745 |
|
6% |
|
2% |
|
|
|
2,918 |
|
|
2,900 |
|
(1%) |
Total |
|
$ |
1,758 |
|
$ |
1,818 |
|
$ |
1,847 |
|
$ |
1,841 |
|
$ |
1,829 |
|
(1%) |
|
4% |
|
|
$ |
7,201 |
|
$ |
7,335 |
|
2% |
|
|
|
|
|
|
|
|
|
|
|
|
|
|
|
|
|
|
|
|
|
|
|
|
|
|
|
|
|
Net Credit Losses by Business |
|
|
|
|
|
|
|
|
|
|
|
|
|
|
|
|
|
|
|
|
|
|
|
|
|
|
|
|
Retail Banking |
|
$ |
61 |
|
$ |
58 |
|
$ |
62 |
|
$ |
66 |
|
$ |
69 |
|
5% |
|
13% |
|
|
$ |
242 |
|
$ |
255 |
|
5% |
Citi-Branded Cards |
|
|
102 |
|
|
106 |
|
|
112 |
|
|
111 |
|
|
106 |
|
(5%) |
|
4% |
|
|
|
426 |
|
|
435 |
|
2% |
Total |
|
$ |
163 |
|
$ |
164 |
|
$ |
174 |
|
$ |
177 |
|
$ |
175 |
|
(1%) |
|
7% |
|
|
$ |
668 |
|
$ |
690 |
|
3% |
|
|
|
|
|
|
|
|
|
|
|
|
|
|
|
|
|
|
|
|
|
|
|
|
|
|
|
|
|
Income from Continuing Operations by Business |
|
|
|
|
|
|
|
|
|
|
|
|
|
|
|
|
|
|
|
|
|
|
|
|
|
|
|
|
Retail Banking |
|
$ |
237 |
|
$ |
227 |
|
$ |
297 |
|
$ |
291 |
|
$ |
231 |
|
(21%) |
|
(3)% |
|
|
$ |
943 |
|
$ |
1,046 |
|
11% |
Citi-Branded Cards |
|
|
127 |
|
|
170 |
|
|
107 |
|
|
111 |
|
|
143 |
|
29% |
|
13% |
|
|
|
477 |
|
|
531 |
|
11% |
Total |
|
$ |
364 |
|
$ |
397 |
|
$ |
404 |
|
$ |
402 |
|
$ |
374 |
|
(7%) |
|
3% |
|
|
$ |
1,420 |
|
$ |
1,577 |
|
11% |
|
|
|
|
|
|
|
|
|
|
|
|
|
|
|
|
|
|
|
|
|
|
|
|
|
|
|
|
|
FX Translation Impact |
|
|
|
|
|
|
|
|
|
|
|
|
|
|
|
|
|
|
|
|
|
|
|
|
|
|
|
|
Total Revenue - as Reported |
|
$ |
1,758 |
|
$ |
1,818 |
|
$ |
1,847 |
|
$ |
1,841 |
|
$ |
1,829 |
|
(1%) |
|
4% |
|
|
$ |
7,201 |
|
$ |
7,335 |
|
2% |
Impact of FX Translation (2) |
|
|
6 |
|
|
(9) |
|
|
4 |
|
|
17 |
|
|
- |
|
|
|
|
|
|
|
(123) |
|
|
- |
|
|
Total Revenues - Ex-FX (2) |
|
$ |
1,764 |
|
$ |
1,809 |
|
$ |
1,851 |
|
$ |
1,858 |
|
$ |
1,829 |
|
(2%) |
|
4% |
|
|
$ |
7,078 |
|
$ |
7,335 |
|
4% |
|
|
|
|
|
|
|
|
|
|
|
|
|
|
|
|
|
|
|
|
|
|
|
|
|
|
|
|
|
Total Operating Expenses - as Reported |
|
$ |
1,117 |
|
$ |
1,171 |
|
$ |
1,146 |
|
$ |
1,133 |
|
$ |
1,141 |
|
1% |
|
2% |
|
|
$ |
4,656 |
|
$ |
4,591 |
|
(1%) |
Impact of FX Translation (2) |
|
|
2 |
|
|
(8) |
|
|
3 |
|
|
13 |
|
|
- |
|
|
|
|
|
|
|
(87) |
|
|
- |
|
|
Total Operating Expenses - Ex-FX (2) |
|
$ |
1,119 |
|
$ |
1,163 |
|
$ |
1,149 |
|
$ |
1,146 |
|
$ |
1,141 |
|
- |
|
2% |
|
|
$ |
4,569 |
|
$ |
4,591 |
|
- |
|
|
|
|
|
|
|
|
|
|
|
|
|
|
|
|
|
|
|
|
|
|
|
|
|
|
|
|
|
Provisions for LLR & PBC - as Reported |
|
$ |
178 |
|
$ |
144 |
|
$ |
184 |
|
$ |
179 |
|
$ |
191 |
|
7% |
|
7% |
|
|
$ |
692 |
|
$ |
698 |
|
1% |
Impact of FX Translation (2) |
|
|
- |
|
|
(2) |
|
|
1 |
|
|
1 |
|
|
- |
|
|
|
|
|
|
|
(18) |
|
|
- |
|
|
Provisions for LLR & PBC - Ex-FX (2) |
|
$ |
178 |
|
$ |
142 |
|
$ |
185 |
|
$ |
180 |
|
$ |
191 |
|
6% |
|
7% |
|
|
$ |
674 |
|
$ |
698 |
|
4% |
|
|
|
|
|
|
|
|
|
|
|
|
|
|
|
|
|
|
|
|
|
|
|
|
|
|
|
|
|
Net Income - as Reported |
|
$ |
361 |
|
$ |
397 |
|
$ |
403 |
|
$ |
400 |
|
$ |
371 |
|
(7%) |
|
3% |
|
|
$ |
1,413 |
|
$ |
1,571 |
|
11% |
Impact of FX Translation (2) |
|
|
2 |
|
|
1 |
|
|
2 |
|
|
2 |
|
|
- |
|
|
|
|
|
|
|
(13) |
|
|
- |
|
|
Net Income - Ex-FX (2) |
|
$ |
363 |
|
$ |
398 |
|
$ |
405 |
|
$ |
402 |
|
$ |
371 |
|
(8%) |
|
2% |
|
|
$ |
1,400 |
|
$ |
1,571 |
|
12% |
(1)Asia GCB includes the results of operations of GCB activities in certain EMEA countries for all periods presented.
(2)Reflects the impact of foreign currency (FX) translation into U.S. dollars at the 4Q19 and full-year 2019 average exchange rates for all periods presented.
Citigroup's results of operations excluding the impact of FX translation are non-GAAP financial measures.
NM Not meaningful.
Reclassified to conform to the current period's presentation, including a change in the reporting of the commercial banking businesses from GCB to ICG.
Page 13
GLOBAL CONSUMER BANKING
ASIA (1) - PAGE 2
|
|
|
|
|
|
|
|
|
|
|
|
|
|
|
|
|
4Q19 Increase/ |
||
|
|
4Q |
|
1Q |
|
2Q |
|
3Q |
|
4Q |
|
(Decrease) from |
|||||||
|
|
2018 |
|
2019 |
|
2019 |
|
2019 |
|
2019 |
|
3Q19 |
|
4Q18 |
|||||
|
|
|
|
|
|
|
|
|
|
|
|
|
|
|
|
|
|
|
|
Retail Banking Key Indicators (in billions of dollars, except as otherwise noted) |
|
|
|
|
|
|
|
|
|
|
|
|
|
|
|
|
|
|
|
Branches (actual) |
|
|
258 |
|
|
251 |
|
|
252 |
|
|
249 |
|
|
242 |
|
(3%) |
|
(6%) |
Accounts (in millions) |
|
|
16.0 |
|
|
15.9 |
|
|
16.1 |
|
|
16.4 |
|
|
16.7 |
|
2% |
|
4% |
Average Deposits |
|
$ |
97.7 |
|
$ |
99.4 |
|
$ |
100.8 |
|
$ |
100.7 |
|
$ |
103.4 |
|
3% |
|
6% |
Investment Sales |
|
$ |
6.5 |
|
$ |
9.0 |
|
$ |
9.9 |
|
$ |
11.0 |
|
$ |
9.3 |
|
(15%) |
|
43% |
Investment AUMs |
|
$ |
59.6 |
|
$ |
65.0 |
|
$ |
66.4 |
|
$ |
66.3 |
|
$ |
70.0 |
|
6% |
|
17% |
Average Loans |
|
$ |
58.0 |
|
$ |
58.8 |
|
$ |
58.8 |
|
$ |
59.5 |
|
$ |
61.6 |
|
4% |
|
6% |
EOP Loans: |
|
|
|
|
|
|
|
|
|
|
|
|
|
|
|
|
|
|
|
Mortgages |
|
$ |
31.9 |
|
$ |
32.0 |
|
$ |
32.4 |
|
$ |
32.5 |
|
$ |
33.2 |
|
2% |
|
4% |
Personal, Small Business and Other |
|
|
26.6 |
|
|
27.1 |
|
|
27.7 |
|
|
27.8 |
|
|
29.6 |
|
6% |
|
11% |
Total EOP Loans |
|
$ |
58.5 |
|
$ |
59.1 |
|
$ |
60.1 |
|
$ |
60.3 |
|
$ |
62.8 |
|
4% |
|
7% |
|
|
|
|
|
|
|
|
|
|
|
|
|
|
|
|
|
|
|
|
Total Net Interest Revenue (in millions) (2) |
|
$ |
677 |
|
$ |
676 |
|
$ |
682 |
|
$ |
676 |
|
$ |
673 |
|
- |
|
(1%) |
As a % of Average Loans (2) |
|
|
4.63% |
|
|
4.66% |
|
|
4.65% |
|
|
4.51% |
|
|
4.33% |
|
|
|
|
Net Credit Losses (in millions) |
|
$ |
61 |
|
$ |
58 |
|
$ |
62 |
|
$ |
66 |
|
$ |
69 |
|
5% |
|
13% |
As a % of Average Loans |
|
|
0.42% |
|
|
0.40% |
|
|
0.42% |
|
|
0.44% |
|
|
0.44% |
|
|
|
|
Loans 90+ Days Past Due (in millions) |
|
$ |
173 |
|
$ |
167 |
|
$ |
175 |
|
$ |
170 |
|
$ |
186 |
|
9% |
|
8% |
As a % of EOP Loans |
|
|
0.30% |
|
|
0.28% |
|
|
0.29% |
|
|
0.28% |
|
|
0.30% |
|
|
|
|
Loans 30-89 Days Past Due (in millions) |
|
$ |
302 |
|
$ |
296 |
|
$ |
299 |
|
$ |
299 |
|
$ |
302 |
|
1% |
|
- |
As a % of EOP Loans |
|
|
0.52% |
|
|
0.50% |
|
|
0.50% |
|
|
0.50% |
|
|
0.48% |
|
|
|
|
|
|
|
|
|
|
|
|
|
|
|
|
|
|
|
|
|
|
|
|
Citi-Branded Cards Key Indicators (in billions of dollars, except as otherwise noted) |
|
|
|
|
|
|
|
|
|
|
|
|
|
|
|
|
|
|
|
EOP Open Accounts (in millions) |
|
|
15.3 |
|
|
15.2 |
|
|
15.2 |
|
|
15.2 |
|
|
15.2 |
|
- |
|
(1%) |
Purchase Sales |
|
$ |
22.2 |
|
$ |
21.4 |
|
$ |
21.6 |
|
$ |
21.9 |
|
$ |
23.4 |
|
7% |
|
5% |
Average Loans (3) |
|
$ |
18.7 |
|
$ |
19.1 |
|
$ |
18.9 |
|
$ |
18.8 |
|
$ |
19.3 |
|
3% |
|
3% |
EOP Loans (3) |
|
$ |
19.3 |
|
$ |
18.8 |
|
$ |
19.2 |
|
$ |
18.8 |
|
$ |
19.9 |
|
6% |
|
3% |
Average Yield (4) |
|
|
12.58% |
|
|
12.42% |
|
|
12.33% |
|
|
12.39% |
|
|
12.42% |
|
- |
|
(1%) |
|
|
|
|
|
|
|
|
|
|
|
|
|
|
|
|
|
|
|
|
Total Net Interest Revenue (in millions) (5) |
|
$ |
505 |
|
$ |
490 |
|
$ |
488 |
|
$ |
497 |
|
$ |
515 |
|
4% |
|
2% |
As a % of Average Loans (6) |
|
|
10.71% |
|
|
10.40% |
|
|
10.36% |
|
|
10.49% |
|
|
10.59% |
|
|
|
|
Net Credit Losses (in millions) |
|
$ |
102 |
|
$ |
106 |
|
$ |
112 |
|
$ |
111 |
|
$ |
106 |
|
(5%) |
|
4% |
As a % of Average Loans |
|
|
2.16% |
|
|
2.25% |
|
|
2.38% |
|
|
2.34% |
|
|
2.18% |
|
|
|
|
Net Credit Margin (in millions) (6) |
|
$ |
630 |
|
$ |
636 |
|
$ |
595 |
|
$ |
595 |
|
$ |
639 |
|
7% |
|
1% |
As a % of Average Loans (6) |
|
|
13.37% |
|
|
13.50% |
|
|
12.63% |
|
|
12.56% |
|
|
13.14% |
|
|
|
|
Loans 90+ Days Past Due |
|
$ |
199 |
|
$ |
200 |
|
$ |
202 |
|
$ |
196 |
|
$ |
207 |
|
6% |
|
4% |
As a % of EOP Loans |
|
|
1.03% |
|
|
1.06% |
|
|
1.05% |
|
|
1.04% |
|
|
1.04% |
|
|
|
|
Loans 30-89 Days Past Due |
|
$ |
255 |
|
$ |
256 |
|
$ |
257 |
|
$ |
249 |
|
$ |
267 |
|
7% |
|
5% |
As a % of EOP Loans |
|
|
1.32% |
|
|
1.36% |
|
|
1.34% |
|
|
1.32% |
|
|
1.34% |
|
|
|
|
(1)Asia GCB includes the results of operations of GCB activities in certain EMEA countries for all periods presented.
(2)Also includes net interest revenue related to the region's average deposit balances in excess of the average loan portfolio.
(3)Average loans, EOP loans and the related consumer delinquency amounts and ratios include interest and fees receivables balances.
(4)Average yield is gross interest revenue earned on loans divided by average loans.
(5)Net interest revenue includes certain fees that are recorded as interest revenue.
(6)Net credit margin is total revenues, net of interest expense, less net credit losses and policy benefits and claims.
Reclassified to conform to the current period's presentation, including a change in the reporting of the commercial banking businesses from GCB to ICG.
Page 14
INSTITUTIONAL CLIENTS GROUP
(In millions of dollars, except as otherwise noted)
|
|
|
|
|
|
|
|
|
|
|
|
4Q19 Increase/ |
|
|
Full |
|
Full |
|
FY 2019 vs. |
|||||||||
|
|
4Q |
|
1Q |
|
2Q |
|
3Q |
|
4Q |
|
(Decrease) from |
|
|
Year |
|
Year |
|
FY 2018 Increase/ |
|||||||||
|
|
2018 |
|
2019 |
|
2019 |
|
2019 |
|
2019 |
|
3Q19 |
|
4Q18 |
|
|
2018 |
|
2019 |
|
(Decrease) |
|||||||
|
|
|
|
|
|
|
|
|
|
|
|
|
|
|
|
|
|
|
|
|
|
|||||||
Commissions and Fees |
|
$ |
1,125 |
|
$ |
1,154 |
|
$ |
1,079 |
|
$ |
1,126 |
|
$ |
1,103 |
|
(2%) |
|
(2%) |
|
|
$ |
4,651 |
|
$ |
4,462 |
|
(4%) |
Administration and Other Fiduciary Fees |
|
|
675 |
|
|
683 |
|
|
709 |
|
|
707 |
|
|
657 |
|
(7%) |
|
(3%) |
|
|
|
2,806 |
|
|
2,756 |
|
(2%) |
Investment Banking |
|
|
1,093 |
|
|
1,113 |
|
|
1,101 |
|
|
1,045 |
|
|
1,181 |
|
13% |
|
8% |
|
|
|
4,358 |
|
|
4,440 |
|
2% |
Principal Transactions |
|
|
1,292 |
|
|
2,638 |
|
|
1,936 |
|
|
2,583 |
|
|
1,405 |
|
(46%) |
|
9% |
|
|
|
8,742 |
|
|
8,562 |
|
(2%) |
Other (1) |
|
|
119 |
|
|
280 |
|
|
721 |
|
|
319 |
|
|
509 |
|
60% |
|
NM |
|
|
|
941 |
|
|
1,829 |
|
94% |
Total Non-Interest Revenue |
|
|
4,304 |
|
|
5,868 |
|
|
5,546 |
|
|
5,780 |
|
|
4,855 |
|
(16%) |
|
13% |
|
|
|
21,498 |
|
|
22,049 |
|
3% |
Net Interest Revenue (including Dividends) |
|
|
4,239 |
|
|
4,150 |
|
|
4,509 |
|
|
4,071 |
|
|
4,522 |
|
11% |
|
7% |
|
|
|
16,827 |
|
|
17,252 |
|
3% |
Total Revenues, Net of Interest Expense |
|
|
8,543 |
|
|
10,018 |
|
|
10,055 |
|
|
9,851 |
|
|
9,377 |
|
(5%) |
|
10% |
|
|
|
38,325 |
|
|
39,301 |
|
3% |
Total Operating Expenses |
|
|
5,040 |
|
|
5,619 |
|
|
5,548 |
|
|
5,611 |
|
|
5,446 |
|
(3%) |
|
8% |
|
|
|
21,780 |
|
|
22,224 |
|
2% |
Net Credit Losses |
|
|
56 |
|
|
78 |
|
|
91 |
|
|
110 |
|
|
115 |
|
5% |
|
NM |
|
|
|
208 |
|
|
394 |
|
89% |
Credit Reserve Build / (Release) |
|
|
26 |
|
|
(74) |
|
|
52 |
|
|
36 |
|
|
57 |
|
58% |
|
NM |
|
|
|
(109) |
|
|
71 |
|
NM |
Provision for Unfunded Lending Commitments |
|
|
44 |
|
|
28 |
|
|
(11) |
|
|
7 |
|
|
74 |
|
NM |
|
68% |
|
|
|
116 |
|
|
98 |
|
(16%) |
Provision for Benefits and Claims |
|
|
- |
|
|
- |
|
|
- |
|
|
- |
|
|
- |
|
- |
|
- |
|
|
|
- |
|
|
- |
|
- |
Provisions for Credit Losses and for Benefits and Claims |
|
|
126 |
|
|
32 |
|
|
132 |
|
|
153 |
|
|
246 |
|
61% |
|
95% |
|
|
|
215 |
|
|
563 |
|
NM |
Income from Continuing Operations before Taxes |
|
|
3,377 |
|
|
4,367 |
|
|
4,375 |
|
|
4,087 |
|
|
3,685 |
|
(10%) |
|
9% |
|
|
|
16,330 |
|
|
16,514 |
|
1% |
Income Taxes |
|
|
771 |
|
|
955 |
|
|
950 |
|
|
858 |
|
|
807 |
|
(6%) |
|
5% |
|
|
|
3,756 |
|
|
3,570 |
|
(5%) |
Income from Continuing Operations |
|
|
2,606 |
|
|
3,412 |
|
|
3,425 |
|
|
3,229 |
|
|
2,878 |
|
(11%) |
|
10% |
|
|
|
12,574 |
|
|
12,944 |
|
3% |
Noncontrolling Interests |
|
|
(4) |
|
|
11 |
|
|
10 |
|
|
8 |
|
|
11 |
|
38% |
|
NM |
|
|
|
17 |
|
|
40 |
|
NM |
Net Income |
|
$ |
2,610 |
|
$ |
3,401 |
|
$ |
3,415 |
|
$ |
3,221 |
|
$ |
2,867 |
|
(11%) |
|
10% |
|
|
$ |
12,557 |
|
$ |
12,904 |
|
3% |
EOP Assets (in billions) |
|
$ |
1,438 |
|
$ |
1,472 |
|
$ |
1,501 |
|
$ |
1,525 |
|
$ |
1,447 |
|
(5%) |
|
1% |
|
|
|
|
|
|
|
|
|
Average Assets (in billions) |
|
$ |
1,466 |
|
$ |
1,460 |
|
$ |
1,497 |
|
$ |
1,511 |
|
$ |
1,503 |
|
(1%) |
|
3% |
|
|
$ |
1,449 |
|
$ |
1,493 |
|
3% |
Return on Average Assets (ROA) |
|
|
0.71% |
|
|
0.94% |
|
|
0.91% |
|
|
0.85% |
|
|
0.76% |
|
|
|
|
|
|
|
0.87% |
|
|
0.86% |
|
|
Efficiency Ratio |
|
|
59% |
|
|
56% |
|
|
55% |
|
|
57% |
|
|
58% |
|
|
|
|
|
|
|
57% |
|
|
57% |
|
|
|
|
|
|
|
|
|
|
|
|
|
|
|
|
|
|
|
|
|
|
|
|
|
|
|
|
|
|
|
Revenue by Region |
|
|
|
|
|
|
|
|
|
|
|
|
|
|
|
|
|
|
|
|
|
|
|
|
|
|
|
|
North America |
|
$ |
2,960 |
|
$ |
3,269 |
|
$ |
3,632 |
|
$ |
3,244 |
|
$ |
3,314 |
|
2% |
|
12% |
|
|
$ |
13,522 |
|
$ |
13,459 |
|
- |
EMEA |
|
|
2,633 |
|
|
3,170 |
|
|
2,960 |
|
|
3,138 |
|
|
2,738 |
|
(13%) |
|
4% |
|
|
|
11,770 |
|
|
12,006 |
|
2% |
Latin America |
|
|
1,189 |
|
|
1,268 |
|
|
1,307 |
|
|
1,294 |
|
|
1,297 |
|
- |
|
9% |
|
|
|
4,954 |
|
|
5,166 |
|
4% |
Asia |
|
|
1,761 |
|
|
2,311 |
|
|
2,156 |
|
|
2,175 |
|
|
2,028 |
|
(7%) |
|
15% |
|
|
|
8,079 |
|
|
8,670 |
|
7% |
Total Revenues, net of Interest Expense |
|
$ |
8,543 |
|
$ |
10,018 |
|
$ |
10,055 |
|
$ |
9,851 |
|
$ |
9,377 |
|
(5%) |
|
10% |
|
|
$ |
38,325 |
|
$ |
39,301 |
|
3% |
|
|
|
|
|
|
|
|
|
|
|
|
|
|
|
|
|
|
|
|
|
|
|
|
|
|
|
|
|
Income (loss) from Continuing Operations by Region |
|
|
|
|
|
|
|
|
|
|
|
|
|
|
|
|
|
|
|
|
|
|
|
|
|
|
|
|
North America |
|
$ |
779 |
|
$ |
748 |
|
$ |
1,050 |
|
$ |
818 |
|
$ |
895 |
|
9% |
|
15% |
|
|
$ |
3,675 |
|
$ |
3,511 |
|
(4%) |
EMEA |
|
|
819 |
|
|
1,125 |
|
|
1,005 |
|
|
1,060 |
|
|
677 |
|
(36%) |
|
(17%) |
|
|
|
3,889 |
|
|
3,867 |
|
(1%) |
Latin America |
|
|
383 |
|
|
540 |
|
|
519 |
|
|
487 |
|
|
565 |
|
16% |
|
48% |
|
|
|
2,013 |
|
|
2,111 |
|
5% |
Asia |
|
|
625 |
|
|
999 |
|
|
851 |
|
|
864 |
|
|
741 |
|
(14%) |
|
19% |
|
|
|
2,997 |
|
|
3,455 |
|
15% |
Income from Continuing Operations |
|
$ |
2,606 |
|
$ |
3,412 |
|
$ |
3,425 |
|
$ |
3,229 |
|
$ |
2,878 |
|
(11%) |
|
10% |
|
|
$ |
12,574 |
|
$ |
12,944 |
|
3% |
|
|
|
|
|
|
|
|
|
|
|
|
|
|
|
|
|
|
|
|
|
|
|
|
|
|
|
|
|
Average Loans by Region (in billions) |
|
|
|
|
|
|
|
|
|
|
|
|
|
|
|
|
|
|
|
|
|
|
|
|
|
|
|
|
North America |
|
|
180 |
|
$ |
185 |
|
$ |
188 |
|
$ |
189 |
|
|
191 |
|
1% |
|
6% |
|
|
$ |
174 |
|
$ |
188 |
|
8% |
EMEA |
|
|
83 |
|
|
84 |
|
|
85 |
|
|
88 |
|
|
89 |
|
1% |
|
7% |
|
|
|
81 |
|
|
87 |
|
7% |
Latin America |
|
|
42 |
|
|
42 |
|
|
41 |
|
|
39 |
|
|
38 |
|
(3%) |
|
(10%) |
|
|
|
42 |
|
|
40 |
|
(5%) |
Asia |
|
|
74 |
|
|
74 |
|
|
73 |
|
|
73 |
|
|
73 |
|
- |
|
(1%) |
|
|
|
77 |
|
|
73 |
|
(5%) |
Total |
|
$ |
379 |
|
$ |
385 |
|
$ |
387 |
|
$ |
389 |
|
$ |
391 |
|
1% |
|
3% |
|
|
$ |
374 |
|
$ |
388 |
|
4% |
|
|
|
|
|
|
|
|
|
|
|
|
|
|
|
|
|
|
|
|
|
|
|
|
|
|
|
|
|
EOP Deposits by Region (in billions) |
|
|
|
|
|
|
|
|
|
|
|
|
|
|
|
|
|
|
|
|
|
|
|
|
|
|
|
|
North America |
|
$ |
355 |
|
$ |
349 |
|
$ |
356 |
|
$ |
393 |
|
$ |
375 |
|
(5%) |
|
5% |
|
|
|
|
|
|
|
|
|
EMEA |
|
|
184 |
|
|
197 |
|
|
196 |
|
|
195 |
|
|
190 |
|
(2%) |
|
3% |
|
|
|
|
|
|
|
|
|
Latin America |
|
|
32 |
|
|
34 |
|
|
34 |
|
|
34 |
|
|
36 |
|
6% |
|
12% |
|
|
|
|
|
|
|
|
|
Asia |
|
|
156 |
|
|
159 |
|
|
166 |
|
|
173 |
|
|
167 |
|
(3%) |
|
7% |
|
|
|
|
|
|
|
|
|
Total |
|
$ |
727 |
|
$ |
739 |
|
$ |
752 |
|
$ |
795 |
|
$ |
768 |
|
(3%) |
|
6% |
|
|
|
|
|
|
|
|
|
|
|
|
|
|
|
|
|
|
|
|
|
|
|
|
|
|
|
|
|
|
|
|
|
|
|
|
|
|
EOP Deposits by Business (in billions) |
|
|
|
|
|
|
|
|
|
|
|
|
|
|
|
|
|
|
|
|
|
|
|
|
|
|
|
|
Treasury and Trade Solutions |
|
$ |
509 |
|
$ |
512 |
|
$ |
525 |
|
$ |
548 |
|
$ |
536 |
|
(2%) |
|
5% |
|
|
|
|
|
|
|
|
|
All Other ICG Businesses |
|
|
218 |
|
|
227 |
|
|
227 |
|
|
247 |
|
|
232 |
|
(6%) |
|
6% |
|
|
|
|
|
|
|
|
|
Total |
|
$ |
727 |
|
$ |
739 |
|
$ |
752 |
|
$ |
795 |
|
$ |
768 |
|
(3%) |
|
6% |
|
|
|
|
|
|
|
|
|
(1) |
2Q19 includes a $355 million gain on Citi's investment in Tradeweb. |
NM Not meaningful.
Reclassified to conform to the current period's presentation, including a change in the reporting of the commercial banking businesses from GCB to ICG.
Page 15
INSTITUTIONAL CLIENTS GROUP
REVENUES BY BUSINESS
(In millions of dollars, except as otherwise noted)
|
|
|
|
|
|
|
|
|
|
|
|
4Q19 Increase/ |
|
|
Full |
|
Full |
|
FY 2019 vs. |
|||||||||
|
|
4Q |
|
1Q |
|
2Q |
|
3Q |
|
4Q |
|
(Decrease) from |
|
|
Year |
|
Year |
|
FY 2018 Increase/ |
|||||||||
|
|
2018 |
|
2019 |
|
2019 |
|
2019 |
|
2019 |
|
3Q19 |
|
4Q18 |
|
|
2018 |
|
2019 |
|
(Decrease) |
|||||||
Revenue Details |
|
|
|
|
|
|
|
|
|
|
|
|
|
|
|
|
|
|
|
|
|
|||||||
Investment Banking |
|
|
|
|
|
|
|
|
|
|
|
|
|
|
|
|
|
|
|
|
|
|||||||
Advisory |
|
$ |
463 |
|
$ |
378 |
|
$ |
232 |
|
$ |
276 |
|
$ |
373 |
|
35% |
|
(19%) |
|
|
$ |
1,301 |
|
$ |
1,259 |
|
(3%) |
Equity Underwriting |
|
|
181 |
|
|
172 |
|
|
314 |
|
|
247 |
|
|
240 |
|
(3%) |
|
33% |
|
|
|
991 |
|
|
973 |
|
(2%) |
Debt Underwriting |
|
|
634 |
|
|
804 |
|
|
737 |
|
|
705 |
|
|
738 |
|
5% |
|
16% |
|
|
|
2,719 |
|
|
2,984 |
|
10% |
Total Investment Banking |
|
|
1,278 |
|
|
1,354 |
|
|
1,283 |
|
|
1,228 |
|
|
1,351 |
|
10% |
|
6% |
|
|
|
5,011 |
|
|
5,216 |
|
4% |
Treasury and Trade Solutions |
|
|
2,552 |
|
|
2,539 |
|
|
2,587 |
|
|
2,559 |
|
|
2,608 |
|
2% |
|
2% |
|
|
|
9,914 |
|
|
10,293 |
|
4% |
Corporate Lending - Excluding Gain/(Loss) on Loan Hedges |
|
|
732 |
|
|
749 |
|
|
725 |
|
|
715 |
|
|
732 |
|
2% |
|
- |
|
|
|
2,913 |
|
|
2,921 |
|
- |
Private Bank |
|
|
797 |
|
|
880 |
|
|
866 |
|
|
865 |
|
|
847 |
|
(2%) |
|
6% |
|
|
|
3,398 |
|
|
3,458 |
|
2% |
Total Banking Revenues (Ex-Gain/(Loss) on Loan Hedges) (1) |
|
$ |
5,359 |
|
$ |
5,522 |
|
$ |
5,461 |
|
$ |
5,367 |
|
$ |
5,538 |
|
3% |
|
3% |
|
|
$ |
21,236 |
|
$ |
21,888 |
|
3% |
|
|
|
|
|
|
|
|
|
|
|
|
|
|
|
|
|
|
|
|
|
|
|
|
|
|
|
|
|
Corporate Lending - Gain/(Loss) on Loan Hedges (1) |
|
|
105 |
|
|
(231) |
|
|
(75) |
|
|
(33) |
|
|
(93) |
|
NM |
|
NM |
|
|
|
45 |
|
|
(432) |
|
NM |
Total Banking Revenues including G/(L) on Loan Hedges (1) |
|
$ |
5,464 |
|
$ |
5,291 |
|
$ |
5,386 |
|
$ |
5,334 |
|
$ |
5,445 |
|
2% |
|
- |
|
|
$ |
21,281 |
|
$ |
21,456 |
|
1% |
|
|
|
|
|
|
|
|
|
|
|
|
|
|
|
|
|
|
|
|
|
|
|
|
|
|
|
|
|
Fixed Income Markets |
|
$ |
1,948 |
|
$ |
3,452 |
|
$ |
3,323 |
|
$ |
3,211 |
|
$ |
2,898 |
|
(10%) |
|
49% |
|
|
$ |
11,661 |
|
$ |
12,884 |
|
10% |
Equity Markets |
|
|
668 |
|
|
842 |
|
|
790 |
|
|
760 |
|
|
516 |
|
(32%) |
|
(23%) |
|
|
|
3,427 |
|
|
2,908 |
|
(15%) |
Securities Services |
|
|
653 |
|
|
638 |
|
|
682 |
|
|
664 |
|
|
647 |
|
(3%) |
|
(1%) |
|
|
|
2,631 |
|
|
2,631 |
|
- |
Other |
|
|
(190) |
|
|
(205) |
|
|
(126) |
|
|
(118) |
|
|
(129) |
|
(9%) |
|
32% |
|
|
|
(675) |
|
|
(578) |
|
14% |
Total Markets and Securities Services |
|
$ |
3,079 |
|
$ |
4,727 |
|
$ |
4,669 |
|
$ |
4,517 |
|
$ |
3,932 |
|
(13%) |
|
28% |
|
|
$ |
17,044 |
|
$ |
17,845 |
|
5% |
|
|
|
|
|
|
|
|
|
|
|
|
|
|
|
|
|
|
|
|
|
|
|
|
|
|
|
|
|
Total ICG (Ex-CVA/DVA) (2) |
|
$ |
8,543 |
|
$ |
10,018 |
|
$ |
10,055 |
|
$ |
9,851 |
|
$ |
9,377 |
|
(5%) |
|
10% |
|
|
$ |
38,325 |
|
$ |
39,301 |
|
3% |
|
|
|
|
|
|
|
|
|
|
|
|
|
|
|
|
|
|
|
|
|
|
|
|
|
|
|
|
|
CVA/DVA for Periods Prior to 1Q16 {excluded as applicable in lines above} (4) |
|
|
- |
|
|
- |
|
|
- |
|
|
- |
|
|
- |
|
- |
|
- |
|
|
|
- |
|
|
- |
|
- |
|
|
|
|
|
|
|
|
|
|
|
|
|
|
|
|
|
|
|
|
|
|
|
|
|
|
|
|
|
Total Revenues, net of Interest Expense |
|
$ |
8,543 |
|
$ |
10,018 |
|
$ |
10,055 |
|
$ |
9,851 |
|
$ |
9,377 |
|
(5%) |
|
10% |
|
|
$ |
38,325 |
|
$ |
39,301 |
|
3% |
|
|
|
|
|
|
|
|
|
|
|
|
|
|
|
|
|
|
|
|
|
|
|
|
|
|
|
|
|
Taxable-equivalent adjustments (2) |
|
$ |
126 |
|
$ |
104 |
|
$ |
105 |
|
$ |
122 |
|
$ |
117 |
|
(4%) |
|
(7%) |
|
|
$ |
416 |
|
$ |
448 |
|
8% |
|
|
|
|
|
|
|
|
|
|
|
|
|
|
|
|
|
|
|
|
|
|
|
|
|
|
|
|
|
Total ICG Revenues including taxable-equivalent adjustments (2) |
|
$ |
8,669 |
|
$ |
10,122 |
|
$ |
10,160 |
|
$ |
9,973 |
|
$ |
9,494 |
|
(5%) |
|
10% |
|
|
$ |
38,741 |
|
$ |
39,749 |
|
3% |
|
|
|
|
|
|
|
|
|
|
|
|
|
|
|
|
|
|
|
|
|
|
|
|
|
|
|
|
|
Commissions and Fees |
|
$ |
184 |
|
$ |
174 |
|
$ |
198 |
|
$ |
194 |
|
$ |
216 |
|
11% |
|
17% |
|
|
$ |
705 |
|
$ |
782 |
|
11% |
Principal Transactions (3) |
|
|
802 |
|
|
2,377 |
|
|
1,870 |
|
|
2,080 |
|
|
1,334 |
|
(36%) |
|
66% |
|
|
|
7,134 |
|
|
7,661 |
|
7% |
Other (4) |
|
|
(9) |
|
|
150 |
|
|
533 |
|
|
183 |
|
|
251 |
|
37% |
|
NM |
|
|
|
380 |
|
|
1,117 |
|
NM |
Total Non-Interest Revenue |
|
$ |
977 |
|
$ |
2,701 |
|
$ |
2,601 |
|
$ |
2,457 |
|
$ |
1,801 |
|
(27%) |
|
84% |
|
|
$ |
8,219 |
|
$ |
9,560 |
|
16% |
Net Interest Revenue |
|
|
971 |
|
|
751 |
|
|
722 |
|
|
754 |
|
|
1,097 |
|
45% |
|
13% |
|
|
|
3,442 |
|
|
3,324 |
|
(3%) |
Total Fixed Income Markets |
|
$ |
1,948 |
|
$ |
3,452 |
|
$ |
3,323 |
|
$ |
3,211 |
|
$ |
2,898 |
|
(10%) |
|
49% |
|
|
$ |
11,661 |
|
$ |
12,884 |
|
10% |
|
|
|
|
|
|
|
|
|
|
|
|
|
|
|
|
|
|
|
|
|
|
|
|
|
|
|
|
|
Rates and Currencies |
|
$ |
1,415 |
|
$ |
2,402 |
|
$ |
2,118 |
|
$ |
2,491 |
|
$ |
2,214 |
|
(11%) |
|
56% |
|
|
$ |
8,486 |
|
$ |
9,225 |
|
9% |
Spread Products / Other Fixed Income |
|
|
533 |
|
|
1,050 |
|
|
1,205 |
|
|
720 |
|
|
684 |
|
(5%) |
|
28% |
|
|
|
3,175 |
|
|
3,659 |
|
15% |
Total Fixed Income Markets |
|
$ |
1,948 |
|
$ |
3,452 |
|
$ |
3,323 |
|
$ |
3,211 |
|
$ |
2,898 |
|
(10%) |
|
49% |
|
|
$ |
11,661 |
|
$ |
12,884 |
|
10% |
|
|
|
|
|
|
|
|
|
|
|
|
|
|
|
|
|
|
|
|
|
|
|
|
|
|
|
|
|
Commissions and Fees |
|
$ |
313 |
|
$ |
293 |
|
$ |
274 |
|
$ |
287 |
|
$ |
267 |
|
(7%) |
|
(15%) |
|
|
$ |
1,267 |
|
$ |
1,121 |
|
(12%) |
Principal Transactions (3) |
|
|
318 |
|
|
396 |
|
|
7 |
|
|
388 |
|
|
(16) |
|
NM |
|
NM |
|
|
|
1,240 |
|
|
775 |
|
(38%) |
Other |
|
|
14 |
|
|
7 |
|
|
10 |
|
|
2 |
|
|
153 |
|
NM |
|
NM |
|
|
|
110 |
|
|
172 |
|
56% |
Total Non-Interest Revenue |
|
$ |
645 |
|
$ |
696 |
|
$ |
291 |
|
$ |
677 |
|
$ |
404 |
|
(40%) |
|
(37%) |
|
|
$ |
2,617 |
|
$ |
2,068 |
|
(21%) |
Net Interest Revenue |
|
|
23 |
|
|
146 |
|
|
499 |
|
|
83 |
|
|
112 |
|
35% |
|
NM |
|
|
|
810 |
|
|
840 |
|
4% |
Total Equity Markets |
|
$ |
668 |
|
$ |
842 |
|
$ |
790 |
|
$ |
760 |
|
$ |
516 |
|
(32%) |
|
(23%) |
|
|
$ |
3,427 |
|
$ |
2,908 |
|
(15%) |
(1)Credit derivatives are used to economically hedge a portion of the corporate loan portfolio that includes both accrual loans and loans at fair value. Gain/(loss) on loan hedges includes the mark-to-market on the credit derivatives partially offset by the mark-to-market on the loans in the portfolio that are at fair value. Hedges on accrual loans reflect the mark-to-market on credit derivatives used to economically hedge the corporate loan accrual portfolio. The fixed premium costs of these hedges are netted against the corporate lending revenues to reflect the cost of credit protection. Citigroup’s results of operations excluding the impact of gain/(loss) on loan hedges are non-GAAP financial measures.
(2)Primarily relates to income tax credits related to affordable housing and alternative energy investments as well as tax exempt income from municipal bond investments.
(3)Excludes principal transactions revenues of ICG businesses other than Markets, primarily treasury and trade solutions and the private bank.
(4)2Q19 includes a $355 million gain on Citi's investment in Tradeweb.
NM Not meaningful.
Reclassified to conform to the current period's presentation, including a change in the reporting of the commercial banking businesses from GCB to ICG.
Page 16
CORPORATE / OTHER (1)
(In millions of dollars, except as otherwise noted)
|
|
|
|
|
|
|
|
|
|
|
|
4Q19 Increase/ |
|
|
Full |
|
|
Full |
|
FY 2019 vs. |
|
|||||||||
|
|
4Q |
|
1Q |
|
2Q |
|
3Q |
|
4Q |
|
(Decrease) from |
|
|
Year |
|
|
Year |
|
FY 2018 Increase/ |
|
|||||||||
|
|
2018 |
|
2019 |
|
2019 |
|
2019 |
|
2019 |
|
3Q19 |
|
4Q18 |
|
|
2018 |
|
|
2019 |
|
(Decrease) |
|
|||||||
Net Interest Revenue |
|
$ |
639 |
|
$ |
669 |
|
$ |
484 |
|
$ |
443 |
|
$ |
294 |
|
(34%) |
|
(54%) |
|
|
$ |
2,361 |
|
|
$ |
1,890 |
|
(20%) |
|
Non-interest revenue |
|
|
(139) |
|
|
(201) |
|
|
86 |
|
|
(9) |
|
|
248 |
|
NM |
|
NM |
|
|
|
(171) |
|
|
|
124 |
|
NM |
|
Total Revenues, Net of Interest Expense |
|
|
500 |
|
|
468 |
|
|
570 |
|
|
434 |
|
|
542 |
|
25% |
|
8% |
|
|
|
2,190 |
|
|
|
2,014 |
|
(8%) |
|
Total Operating Expenses |
|
|
474 |
|
|
549 |
|
|
481 |
|
|
485 |
|
|
635 |
|
31% |
|
34% |
|
|
|
2,275 |
|
|
|
2,150 |
|
(5%) |
|
Net Credit Losses |
|
|
(3) |
|
|
2 |
|
|
2 |
|
|
1 |
|
|
(13) |
|
NM |
|
NM |
|
|
|
21 |
|
|
|
(8) |
|
NM |
|
Credit Reserve Build / (Release) |
|
|
(47) |
|
|
(26) |
|
|
(20) |
|
|
(16) |
|
|
2 |
|
NM |
|
NM |
|
|
|
(218) |
|
|
|
(60) |
|
72% |
|
Provision for Benefits and Claims |
|
|
- |
|
|
- |
|
|
- |
|
|
- |
|
|
- |
|
- |
|
- |
|
|
|
(2) |
|
|
|
- |
|
100% |
|
Provision for Unfunded Lending Commitments |
|
|
3 |
|
|
(1) |
|
|
(4) |
|
|
- |
|
|
(2) |
|
NM |
|
NM |
|
|
|
(3) |
|
|
|
(7) |
|
NM |
|
Total provisions for credit losses and for benefits and claims |
|
|
(47) |
|
|
(25) |
|
|
(22) |
|
|
(15) |
|
|
(13) |
|
13% |
|
72% |
|
|
|
(202) |
|
|
|
(75) |
|
63% |
|
Income from Continuing Operations before Taxes |
|
|
73 |
|
|
(56) |
|
|
111 |
|
|
(36) |
|
|
(80) |
|
NM |
|
NM |
|
|
|
117 |
|
|
|
(61) |
|
NM |
|
Income Taxes (Benefits) (2)(3)(4) |
|
|
(216) |
|
|
(61) |
|
|
45 |
|
|
(247) |
|
|
(623) |
|
NM |
|
NM |
|
|
|
(88) |
|
|
|
(886) |
|
NM |
|
Income (Loss) from Continuing Operations |
|
|
289 |
|
|
5 |
|
|
66 |
|
|
211 |
|
|
543 |
|
NM |
|
88% |
|
|
|
205 |
|
|
|
825 |
|
NM |
|
Income (Loss) from Discontinued Operations, net of taxes |
|
|
(8) |
|
|
(2) |
|
|
17 |
|
|
(15) |
|
|
(4) |
|
73% |
|
50% |
|
|
|
(8) |
|
|
|
(4) |
|
50% |
|
Noncontrolling Interests |
|
|
(15) |
|
|
14 |
|
|
(1) |
|
|
5 |
|
|
2 |
|
(60%) |
|
NM |
|
|
|
11 |
|
|
|
20 |
|
82% |
|
Net Income (Loss) |
|
$ |
296 |
|
$ |
(11) |
|
$ |
84 |
|
$ |
191 |
|
$ |
537 |
|
NM |
|
81% |
|
|
$ |
186 |
|
|
$ |
801 |
|
NM |
|
EOP Assets (in billions) |
|
$ |
91 |
|
$ |
107 |
|
$ |
97 |
|
$ |
96 |
|
$ |
97 |
|
1% |
|
7% |
|
|
|
|
|
|
|
|
|
|
|
Average Assets (in billions) |
|
$ |
89 |
|
$ |
99 |
|
$ |
98 |
|
$ |
97 |
|
$ |
95 |
|
(2%) |
|
7% |
|
|
$ |
93 |
|
|
$ |
97 |
|
4% |
|
Return on Average Assets |
|
|
1.32% |
|
|
(0.05%) |
|
|
0.34% |
|
|
0.78% |
|
|
2.24% |
|
|
|
|
|
|
|
0.20% |
|
|
|
0.83% |
|
|
|
Efficiency Ratio |
|
|
95% |
|
|
117% |
|
|
84% |
|
|
112% |
|
|
117% |
|
|
|
|
|
|
|
104% |
|
|
|
107% |
|
|
|
|
|
|
|
|
|
|
|
|
|
|
|
|
|
|
|
|
|
|
|
|
|
|
|
|
|
|
|
|
|
|
|
|
|
|
|
|
|
|
|
|
|
|
|
|
|
|
|
|
|
|
|
|
|
|
|
|
|
|
|
|
|
Consumer - North America - Key Indicators |
|
|
|
|
|
|
|
|
|
|
|
|
|
|
|
|
|
|
|
|
|
|
|
|
|
|
|
|
|
|
|
|
|
|
|
|
|
|
|
|
|
|
|
|
|
|
|
|
|
|
|
|
|
|
|
|
|
|
|
|
|
Average Loans (in billions of dollars) |
|
$ |
15.9 |
|
$ |
13.6 |
|
$ |
12.3 |
|
$ |
11.2 |
|
$ |
10.4 |
|
(7%) |
|
(35%) |
|
|
$ |
18.0 |
|
|
$ |
11.9 |
|
|
|
EOP Loans (in billions of dollars) |
|
$ |
15.3 |
|
$ |
12.6 |
|
$ |
11.6 |
|
$ |
10.8 |
|
$ |
9.6 |
|
(11%) |
|
(37%) |
|
|
|
|
|
|
|
|
|
|
|
Net Interest Revenue |
|
$ |
137 |
|
$ |
104 |
|
$ |
81 |
|
$ |
75 |
|
$ |
77 |
|
3% |
|
(44%) |
|
|
|
|
|
|
|
|
|
|
|
As a % of Average Loans |
|
|
3.42% |
|
|
3.10% |
|
|
2.64% |
|
|
2.66% |
|
|
2.94% |
|
|
|
|
|
|
|
|
|
|
|
|
|
|
|
Net Credit Losses (Recoveries) |
|
$ |
- |
|
$ |
1 |
|
$ |
4 |
|
$ |
1 |
|
$ |
(12) |
|
NM |
|
NM |
|
|
$ |
(15) |
|
|
$ |
(6) |
|
|
|
As a % of Average Loans |
|
|
0.00% |
|
|
0.03% |
|
|
0.13% |
|
|
0.04% |
|
|
(0.46%) |
|
|
|
|
|
|
|
-0.08% |
|
|
|
-0.05% |
|
|
|
Loans 90+ Days Past Due (5) |
|
$ |
382 |
|
$ |
354 |
|
$ |
327 |
|
$ |
293 |
|
$ |
278 |
|
(5%) |
|
(27%) |
|
|
|
|
|
|
|
|
|
|
|
As a % of EOP Loans |
|
|
2.62% |
|
|
2.97% |
|
|
3.00% |
|
|
2.87% |
|
|
3.02% |
|
|
|
|
|
|
|
|
|
|
|
|
|
|
|
Loans 30-89 Days Past Due (5) |
|
$ |
362 |
|
$ |
348 |
|
$ |
334 |
|
$ |
288 |
|
$ |
295 |
|
2% |
|
(19%) |
|
|
|
|
|
|
|
|
|
|
|
As a % of EOP Loans |
|
|
2.48% |
|
|
2.92% |
|
|
3.06% |
|
|
2.82% |
|
|
3.21% |
|
|
|
|
|
|
|
|
|
|
|
|
|
|
|
(1) |
Includes certain unallocated costs of global staff functions (including finance, risk, human resources, legal and compliance), other corporate expenses and unallocated global operations and technology expenses and income taxes, as well as Corporate Treasury, certain North America legacy consumer loan portfolios, other legacy assets and discontinued operations. |
(2) |
4Q19 includes discrete tax items of roughly $540 million, including an approximate $430 million benefit of a reduction in Citi’s valuation allowance related to its Deferred Tax Assets (DTAs). |
(3) |
3Q19 includes discrete tax items of roughly $230 million, including an approximate $180 million benefit of a reduction in Citi’s valuation allowance related to its DTAs. |
(4) |
4Q18 includes a one-time benefit of $94 million, due to the finalization of the provisional component of the impact based on Citi’s analysis, as well as additional guidance received from the U.S. Treasury Department related to the enactment of the Tax Cuts and Jobs Act. |
(5) |
The Loans 90+ Days Past Due and 30-89 Days Past Due and related ratios exclude U.S. mortgage loans that are guaranteed by U.S. government-sponsored agencies since the potential loss predominantly resides with the U.S. agencies. |
The amounts excluded for Loans 90+ Days Past Due and (EOP Loans) for each period were $367 million and ($0.8 billion), $309 million and ($0.7 billion), $273 million and ($0.7 billion), $249 million and ($0.6 billion), and $172 million and ($0.4 billion) as of December 31, 2018, March 31, 2019, June 30, 2019, September 30, 2019 and December 31, 2019, respectively.
The amounts excluded for Loans 30-89 Days Past Due and (EOP Loans) for each period were $122 million and ($0.8 billion), $118 million and ($0.7 billion), $124 million and ($0.7 billion), and $110 million and ($0.6 billion), and $55 million and ($0.4 billion) as of of December 31, 2018, March 31, 2019, June 30, 2019, September 30, 2019 and December 31, 2019, respectively.
NM Not meaningful.
Reclassified to conform to the current period's presentation.
Page 17
AVERAGE BALANCES AND INTEREST RATES (1)(2)(3)(4)(5)
Taxable Equivalent Basis
|
|
Average Volumes |
|
Interest |
|
% Average Rate (4) |
|
|
||||||||||||||||||
|
|
Fourth |
|
Third |
|
Fourth |
|
Fourth |
|
Third |
|
Fourth |
|
Fourth |
|
Third |
|
Fourth |
|
|
||||||
|
|
Quarter |
|
Quarter |
|
Quarter |
|
Quarter |
|
Quarter |
|
Quarter |
|
Quarter |
|
Quarter |
|
Quarter |
|
|
||||||
In millions of dollars, except as otherwise noted |
|
2018 |
|
2019 |
|
2019(5) |
|
2018 |
|
2019 |
|
2019(5) |
|
2018 |
|
2019 |
|
2019(5) |
|
|
||||||
Assets |
||||||||||||||||||||||||||
Deposits with Banks |
|
$ |
175,251 |
|
$ |
194,972 |
|
$ |
195,268 |
|
$ |
649 |
|
$ |
736 |
|
$ |
603 |
|
1.47 |
% |
1.50 |
% |
1.23 |
% |
|
Securities Borrowed and Purchased under Resale Agreements (6) |
|
|
276,132 |
|
|
264,008 |
|
|
256,022 |
|
|
1,692 |
|
|
1,747 |
|
|
1,451 |
|
2.43 |
% |
2.63 |
% |
2.25 |
% |
|
Trading Account Assets (7) |
|
|
206,860 |
|
|
251,225 |
|
|
243,597 |
|
|
1,505 |
|
|
1,896 |
|
|
1,957 |
|
2.89 |
% |
2.99 |
% |
3.19 |
% |
|
Investments |
|
|
352,151 |
|
|
352,463 |
|
|
367,733 |
|
|
2,537 |
|
|
2,433 |
|
|
2,421 |
|
2.86 |
% |
2.74 |
% |
2.61 |
% |
|
Total Loans (net of Unearned Income) (8) |
|
|
675,474 |
|
|
684,980 |
|
|
692,631 |
|
|
11,981 |
|
|
12,012 |
|
|
11,828 |
|
7.04 |
% |
6.96 |
% |
6.78 |
% |
|
Other Interest-Earning Assets |
|
|
69,243 |
|
|
63,869 |
|
|
58,609 |
|
|
481 |
|
|
400 |
|
|
333 |
|
2.76 |
% |
2.48 |
% |
2.25 |
% |
|
Total Average Interest-Earning Assets |
|
$ |
1,755,111 |
|
$ |
1,811,517 |
|
$ |
1,813,860 |
|
$ |
18,845 |
|
$ |
19,224 |
|
$ |
18,593 |
|
4.26 |
% |
4.21 |
% |
4.07 |
% |
|
|
|
|
|
|
|
|
|
|
|
|
|
|
|
|
|
|
|
|
|
|
|
|
|
|
|
|
Liabilities: |
|
|
|
|
|
|
|
|
|
|
|
|
|
|
|
|
|
|
|
|
|
|
|
|
|
|
Deposits (excluding deposit insurance and FDIC Assessment) |
|
$ |
818,146 |
|
$ |
891,917 |
|
$ |
911,039 |
|
$ |
2,619 |
|
$ |
3,170 |
|
$ |
2,753 |
|
1.27 |
% |
1.41 |
% |
1.20 |
% |
|
Deposit Insurance and FDIC Assessment |
|
|
- |
|
|
- |
|
|
- |
|
|
176 |
|
|
199 |
|
|
200 |
|
|
|
|
|
|
|
|
Total Deposits |
|
|
818,146 |
|
|
891,917 |
|
|
911,039 |
|
|
2,795 |
|
|
3,369 |
|
|
2,953 |
|
1.36 |
% |
1.50 |
% |
1.29 |
% |
|
Securities Loaned and Sold under Repurchase Agreements (6) |
|
|
177,058 |
|
|
199,500 |
|
|
188,153 |
|
|
1,466 |
|
|
1,630 |
|
|
1,320 |
|
3.28 |
% |
3.24 |
% |
2.78 |
% |
|
Trading Account Liabilities (7) |
|
|
99,892 |
|
|
86,450 |
|
|
78,920 |
|
|
277 |
|
|
345 |
|
|
316 |
|
1.10 |
% |
1.58 |
% |
1.59 |
% |
|
Short-Term Borrowings |
|
|
104,596 |
|
|
92,755 |
|
|
97,079 |
|
|
637 |
|
|
609 |
|
|
489 |
|
2.42 |
% |
2.60 |
% |
2.00 |
% |
|
Long-Term Debt (9) |
|
|
198,174 |
|
|
197,641 |
|
|
197,972 |
|
|
1,678 |
|
|
1,583 |
|
|
1,470 |
|
3.36 |
% |
3.18 |
% |
2.95 |
% |
|
Total Average Interest-Bearing Liabilities |
|
$ |
1,397,866 |
|
$ |
1,468,263 |
|
$ |
1,473,163 |
|
$ |
6,853 |
|
$ |
7,536 |
|
$ |
6,548 |
|
1.95 |
% |
2.04 |
% |
1.76 |
% |
|
|
|
|
|
|
|
|
|
|
|
|
|
|
|
|
|
|
|
|
|
|
|
|
|
|
|
|
Total Average Interest-Bearing Liabilities (excluding deposit insurance and FDIC Assessment) |
|
$ |
1,397,866 |
|
$ |
1,468,263 |
|
$ |
1,473,163 |
|
$ |
6,677 |
|
$ |
7,337 |
|
$ |
6,348 |
|
1.90 |
% |
1.98 |
% |
1.71 |
% |
|
|
|
|
|
|
|
|
|
|
|
|
|
|
|
|
|
|
|
|
|
|
|
|
|
|
|
|
Net Interest Revenue as a % of Average Interest-Earning Assets (NIM) |
|
|
|
|
|
|
|
|
|
|
$ |
11,992 |
|
$ |
11,688 |
|
$ |
12,045 |
|
2.71 |
% |
2.56 |
% |
2.63 |
% |
|
|
|
|
|
|
|
|
|
|
|
|
|
|
|
|
|
|
|
|
|
|
|
|
|
|
|
|
NIR as a % of Average Interest-Earning Assets (NIM) (excluding deposit insurance and FDIC Assessment) |
|
|
|
|
|
|
|
|
|
|
$ |
12,168 |
|
$ |
11,887 |
|
$ |
12,245 |
|
2.75 |
% |
2.60 |
% |
2.68 |
% |
|
|
|
|
|
|
|
|
|
|
|
|
|
|
|
|
|
|
|
|
|
|
|
|
|
|
|
|
4Q19 Increase (Decrease) From |
|
|
|
|
|
|
|
|
|
|
|
|
|
|
|
|
|
|
|
(8) |
bps |
7 |
bps |
|
|
|
|
|
|
|
|
|
|
|
|
|
|
|
|
|
|
|
|
|
|
|
|
|
|
|
|
|
|
4Q19 Increase (Decrease) (excluding deposit insurance and FDIC Assessment) From: |
|
|
|
|
|
|
|
|
|
|
|
|
|
|
|
|
|
|
|
(7) |
bps |
8 |
bps |
|
|
|
(1)Interest Revenue includes the taxable equivalent adjustments (based on the U.S. federal statutory tax rate of 21%) of $69 million for 4Q18, $47 million for 3Q19 and $48 million for 4Q19.
(2)Citigroup average balances and interest rates include both domestic and international operations.
(3)Monthly averages have been used by certain subsidiaries where daily averages are unavailable.
(4)Average rate % is calculated as annualized interest over average volumes.
(5)Fourth quarter of 2019 is preliminary.
(6)Average volumes of securities borrowed or purchased under agreements to resell and securities loaned or sold under agreements to repurchase are reported net pursuant to FIN 41; the related interest excludes the impact of ASU 2013-01 (Topic 210).
(7)Interest expense on trading account liabilities of ICG is reported as a reduction of interest revenue. Interest revenue and interest expense on cash collateral positions are reported in trading account assets and trading account liabilities, respectively.
(8)Nonperforming loans are included in the average loan balances.
(9)Excludes hybrid financial instruments with changes in fair value recorded in Principal Transactions.
Reclassified to conform to the current period's presentation.
Page 18
DEPOSITS
(In billions of dollars)
|
|
|
|
|
|
|
|
|
|
|
|
4Q19 Increase/ |
|||||||
|
|
4Q |
|
1Q |
|
2Q |
|
3Q |
|
4Q |
|
(Decrease) from |
|||||||
|
|
2018 |
|
2019 |
|
2019 |
|
2019 |
|
2019 |
|
3Q19 |
|
4Q18 |
|||||
Global Consumer Banking |
|
|
|
|
|
|
|
|
|
|
|
|
|
|
|||||
North America |
|
$ |
149.5 |
|
$ |
154.1 |
|
$ |
153.0 |
|
$ |
155.8 |
|
$ |
160.5 |
|
3% |
|
7% |
Latin America |
|
|
22.5 |
|
|
22.5 |
|
|
22.9 |
|
|
21.8 |
|
|
23.8 |
|
9% |
|
6% |
Asia (1) |
|
|
99.3 |
|
|
101.8 |
|
|
102.7 |
|
|
102.3 |
|
|
106.7 |
|
4% |
|
7% |
Total |
|
$ |
271.3 |
|
$ |
278.4 |
|
$ |
278.6 |
|
$ |
279.9 |
|
$ |
291.0 |
|
4% |
|
7% |
|
|
|
|
|
|
|
|
|
|
|
|
|
|
|
|
|
|
|
|
ICG |
|
|
|
|
|
|
|
|
|
|
|
|
|
|
|
|
|
|
|
North America |
|
$ |
354.8 |
|
$ |
348.5 |
|
$ |
355.9 |
|
$ |
393.2 |
|
$ |
374.2 |
|
(5%) |
|
5% |
EMEA |
|
|
183.6 |
|
|
196.7 |
|
|
195.9 |
|
|
194.7 |
|
|
189.9 |
|
(2%) |
|
3% |
Latin America |
|
|
32.3 |
|
|
34.1 |
|
|
34.0 |
|
|
34.3 |
|
|
36.2 |
|
6% |
|
12% |
Asia |
|
|
156.0 |
|
|
159.3 |
|
|
166.2 |
|
|
172.7 |
|
|
167.4 |
|
(3%) |
|
7% |
Total |
|
$ |
726.7 |
|
$ |
738.6 |
|
$ |
752.0 |
|
$ |
794.9 |
|
$ |
767.7 |
|
(3%) |
|
6% |
|
|
|
|
|
|
|
|
|
|
|
|
|
|
|
|
|
|
|
|
Corporate/Other |
|
$ |
15.2 |
|
$ |
13.4 |
|
$ |
15.0 |
|
$ |
13.0 |
|
$ |
11.9 |
|
(8%) |
|
(22%) |
|
|
|
|
|
|
|
|
|
|
|
|
|
|
|
|
|
|
|
|
Total Deposits - EOP |
|
$ |
1,013.2 |
|
$ |
1,030.4 |
|
$ |
1,045.6 |
|
$ |
1,087.8 |
|
$ |
1,070.6 |
|
(2%) |
|
6% |
|
|
|
|
|
|
|
|
|
|
|
|
|
|
|
|
|
|
|
|
Total Deposits - Average |
|
$ |
1,005.7 |
|
$ |
1,017.1 |
|
$ |
1,039.9 |
|
$ |
1,066.3 |
|
$ |
1,089.5 |
|
2% |
|
8% |
|
|
|
|
|
|
|
|
|
|
|
|
|
|
|
|
|
|
|
|
Foreign Currency (FX) Translation Impact |
|
|
|
|
|
|
|
|
|
|
|
|
|
|
|
|
|
|
|
Total EOP Deposits - as Reported |
|
$ |
1,013.2 |
|
$ |
1,030.4 |
|
$ |
1,045.6 |
|
$ |
1,087.8 |
|
$ |
1,070.6 |
|
(2%) |
|
6% |
Impact of FX Translation (2) |
|
|
1.4 |
|
|
0.9 |
|
|
0.1 |
|
|
9.9 |
|
|
- |
|
|
|
|
Total EOP Deposits - Ex-FX (2) |
|
$ |
1,014.6 |
|
$ |
1,031.3 |
|
$ |
1,045.7 |
|
$ |
1,097.7 |
|
$ |
1,070.6 |
|
(2%) |
|
6% |
(1) |
Asia GCB includes deposits of certain EMEA countries for all periods presented. |
(2) |
Reflects the impact of FX translation into U.S. dollars at the fourth quarter of 2019 exchange rates for all periods presented. |
Citigroup's results of operations excluding the impact of FX translation are non-GAAP financial measures.
Reclassified to conform to the current period's presentation, including a change in the reporting of the commercial banking businesses from GCB to ICG.
Page 19
EOP LOANS
(In billions of dollars)
|
|
|
|
|
|
|
|
|
|
|
|
|
|
|
|
|
4Q19 Increase/ |
||
|
|
4Q |
|
1Q |
|
2Q |
|
3Q |
|
4Q |
|
(Decrease) from |
|||||||
|
|
2018 |
|
2019 |
|
2019 |
|
2019 |
|
2019 |
|
3Q19 |
|
4Q18 |
|||||
Global Consumer Banking |
|
|
|
|
|
|
|
|
|
|
|
|
|
|
|
|
|
|
|
|
|
|
|
|
|
|
|
|
|
|
|
|
|
|
|
|
|
|
|
North America |
|
|
|
|
|
|
|
|
|
|
|
|
|
|
|
|
|
|
|
Credit Cards |
|
$ |
144.5 |
|
$ |
135.9 |
|
$ |
140.2 |
|
$ |
141.5 |
|
$ |
149.2 |
|
5% |
|
3% |
Retail Banking |
|
|
47.7 |
|
|
47.7 |
|
|
48.2 |
|
|
49.1 |
|
|
50.3 |
|
2% |
|
5% |
Total |
|
$ |
192.2 |
|
$ |
183.6 |
|
$ |
188.4 |
|
$ |
190.6 |
|
$ |
199.5 |
|
5% |
|
4% |
|
|
|
|
|
|
|
|
|
|
|
|
|
|
|
|
|
|
|
|
Latin America |
|
|
|
|
|
|
|
|
|
|
|
|
|
|
|
|
|
|
|
Credit Cards |
|
$ |
5.7 |
|
$ |
5.6 |
|
$ |
5.7 |
|
$ |
5.5 |
|
$ |
6.0 |
|
9% |
|
5% |
Retail Banking |
|
|
11.4 |
|
|
11.3 |
|
|
11.4 |
|
|
11.2 |
|
|
11.7 |
|
4% |
|
3% |
Total |
|
$ |
17.1 |
|
$ |
16.9 |
|
$ |
17.1 |
|
$ |
16.7 |
|
$ |
17.7 |
|
6% |
|
4% |
|
|
|
|
|
|
|
|
|
|
|
|
|
|
|
|
|
|
|
|
Asia (1) |
|
|
|
|
|
|
|
|
|
|
|
|
|
|
|
|
|
|
|
Credit Cards |
|
$ |
19.3 |
|
$ |
18.8 |
|
$ |
19.2 |
|
$ |
18.8 |
|
$ |
19.9 |
|
6% |
|
3% |
Retail Banking |
|
|
58.5 |
|
|
59.1 |
|
|
60.1 |
|
|
60.3 |
|
|
62.8 |
|
4% |
|
7% |
Total |
|
$ |
77.8 |
|
$ |
77.9 |
|
$ |
79.3 |
|
$ |
79.1 |
|
$ |
82.7 |
|
5% |
|
6% |
|
|
|
|
|
|
|
|
|
|
|
|
|
|
|
|
|
|
|
|
Total GCB Consumer Loans |
|
|
|
|
|
|
|
|
|
|
|
|
|
|
|
|
|
|
|
Credit Cards |
|
$ |
169.5 |
|
$ |
160.3 |
|
$ |
165.1 |
|
$ |
165.8 |
|
$ |
175.1 |
|
6% |
|
3% |
Retail Banking |
|
|
117.6 |
|
|
118.1 |
|
|
119.7 |
|
|
120.6 |
|
|
124.8 |
|
3% |
|
6% |
Total GCB |
|
$ |
287.1 |
|
$ |
278.4 |
|
$ |
284.8 |
|
$ |
286.4 |
|
$ |
299.9 |
|
5% |
|
4% |
|
|
|
|
|
|
|
|
|
|
|
|
|
|
|
|
|
|
|
|
|
|
|
|
|
|
|
|
|
|
|
|
|
|
|
|
|
|
|
|
Total Corporate/Other - Consumer |
|
$ |
15.3 |
|
$ |
12.6 |
|
$ |
11.7 |
|
$ |
11.0 |
|
$ |
9.6 |
|
(13%) |
|
(37%) |
Total Consumer Loans |
|
$ |
302.4 |
|
$ |
291.0 |
|
$ |
296.5 |
|
$ |
297.4 |
|
$ |
309.5 |
|
4% |
|
2% |
|
|
|
|
|
|
|
|
|
|
|
|
|
|
|
|
|
|
|
|
Corporate Loans - By Region |
|
|
|
|
|
|
|
|
|
|
|
|
|
|
|
|
|
|
|
North America |
|
$ |
183.9 |
|
$ |
190.5 |
|
$ |
191.4 |
|
$ |
190.9 |
|
$ |
190.9 |
|
- |
|
4% |
EMEA |
|
|
84.3 |
|
|
86.0 |
|
|
87.8 |
|
|
91.9 |
|
|
87.4 |
|
(5%) |
|
4% |
Latin America |
|
|
41.8 |
|
|
41.2 |
|
|
40.2 |
|
|
38.1 |
|
|
39.1 |
|
3% |
|
(6%) |
Asia |
|
|
71.8 |
|
|
73.7 |
|
|
72.8 |
|
|
73.4 |
|
|
72.5 |
|
(1%) |
|
1% |
Total Corporate Loans |
|
$ |
381.8 |
|
$ |
391.4 |
|
$ |
392.2 |
|
$ |
394.3 |
|
$ |
389.9 |
|
(1%) |
|
2% |
|
|
|
|
|
|
|
|
|
|
|
|
|
|
|
|
|
|
|
|
Corporate Loans - By Product |
|
|
|
|
|
|
|
|
|
|
|
|
|
|
|
|
|
|
|
Corporate Lending |
|
$ |
157.4 |
|
$ |
162.0 |
|
$ |
159.6 |
|
$ |
156.9 |
|
$ |
152.6 |
|
(3%) |
|
(3%) |
Private Bank |
|
|
95.7 |
|
|
99.6 |
|
|
102.6 |
|
|
105.3 |
|
|
109.0 |
|
4% |
|
14% |
Treasury and Trade Solutions |
|
|
78.2 |
|
|
77.5 |
|
|
77.2 |
|
|
76.7 |
|
|
74.7 |
|
(3%) |
|
(4%) |
Markets and Securities Services |
|
|
50.5 |
|
|
52.3 |
|
|
52.8 |
|
|
55.4 |
|
|
53.6 |
|
(3%) |
|
6% |
Total Corporate Loans |
|
$ |
381.8 |
|
$ |
391.4 |
|
$ |
392.2 |
|
$ |
394.3 |
|
$ |
389.9 |
|
(1%) |
|
2% |
|
|
|
|
|
|
|
|
|
|
|
|
|
|
|
|
|
|
|
|
Total Loans |
|
$ |
684.2 |
|
$ |
682.3 |
|
$ |
688.7 |
|
$ |
691.7 |
|
$ |
699.5 |
|
1% |
|
2% |
|
|
|
|
|
|
|
|
|
|
|
|
|
|
|
|
|
|
|
|
Foreign Currency (FX) Translation Impact |
|
|
|
|
|
|
|
|
|
|
|
|
|
|
|
|
|
|
|
Total EOP Loans - as Reported |
|
$ |
684.2 |
|
$ |
682.3 |
|
$ |
688.7 |
|
$ |
691.7 |
|
$ |
699.5 |
|
1% |
|
2% |
Impact of FX Translation (2) |
|
|
1.0 |
|
|
0.6 |
|
|
0.5 |
|
|
6.6 |
|
|
- |
|
|
|
|
Total EOP Loans - Ex-FX (2) |
|
$ |
685.2 |
|
$ |
682.9 |
|
$ |
689.2 |
|
$ |
698.3 |
|
$ |
699.5 |
|
- |
|
2% |
(1) |
Asia GCB includes loans of certain EMEA countries for all periods presented. |
(2) |
Reflects the impact of FX translation into U.S. dollars at the fourth quarter of 2019 exchange rates for all periods presented. |
Citigroup's results of operations excluding the impact of FX translation are non-GAAP financial measures.
Reclassified to conform to the current period's presentation, including a change in the reporting of the commercial banking businesses from GCB to ICG.
Page 20
SUPPLEMENTAL DETAIL
CONSUMER LOANS 90+ DAYS DELINQUENCY AMOUNTS AND RATIOS
BUSINESS VIEW
(In millions of dollars, except EOP loan amounts in billions of dollars)
|
|
Loans 90+ Days Past Due (1) |
|
EOP Loans |
||||||||||||||
|
|
|
4Q |
|
|
1Q |
|
|
2Q |
|
|
3Q |
|
|
4Q |
|
4Q |
|
|
|
|
2018 |
|
|
2019 |
|
|
2019 |
|
|
2019 |
|
|
2019 |
|
2019 |
|
GCB (2) |
|
|
|
|
|
|
|
|
|
|
|
|
|
|
|
|
|
|
Total |
|
$ |
2,550 |
|
$ |
2,505 |
|
$ |
2,426 |
|
$ |
2,470 |
|
$ |
2,737 |
|
$ |
299.9 |
Ratio |
|
|
0.89% |
|
|
0.90% |
|
|
0.85% |
|
|
0.86% |
|
|
0.91% |
|
|
|
|
|
|
|
|
|
|
|
|
|
|
|
|
|
|
|
|
|
|
Retail Bank (2) |
|
|
|
|
|
|
|
|
|
|
|
|
|
|
|
|
|
|
Total |
|
$ |
416 |
|
$ |
394 |
|
$ |
416 |
|
$ |
392 |
|
$ |
438 |
|
$ |
124.8 |
Ratio |
|
|
0.36% |
|
|
0.34% |
|
|
0.35% |
|
|
0.33% |
|
|
0.35% |
|
|
|
North America (2) |
|
$ |
135 |
|
$ |
132 |
|
$ |
133 |
|
$ |
125 |
|
$ |
146 |
|
$ |
50.3 |
Ratio |
|
|
0.29% |
|
|
0.28% |
|
|
0.28% |
|
|
0.26% |
|
|
0.29% |
|
|
|
Latin America |
|
$ |
108 |
|
$ |
95 |
|
$ |
108 |
|
$ |
97 |
|
$ |
106 |
|
$ |
11.7 |
Ratio |
|
|
0.95% |
|
|
0.84% |
|
|
0.95% |
|
|
0.87% |
|
|
0.91% |
|
|
|
Asia (3) |
|
$ |
173 |
|
$ |
167 |
|
$ |
175 |
|
$ |
170 |
|
$ |
186 |
|
$ |
62.8 |
Ratio |
|
|
0.30% |
|
|
0.28% |
|
|
0.29% |
|
|
0.28% |
|
|
0.30% |
|
|
|
|
|
|
|
|
|
|
|
|
|
|
|
|
|
|
|
|
|
|
Cards |
|
|
|
|
|
|
|
|
|
|
|
|
|
|
|
|
|
|
Total |
|
$ |
2,134 |
|
$ |
2,111 |
|
$ |
2,010 |
|
$ |
2,078 |
|
$ |
2,299 |
|
$ |
175.1 |
Ratio |
|
|
1.26% |
|
|
1.32% |
|
|
1.22% |
|
|
1.25% |
|
|
1.31% |
|
|
|
North America - Citi-Branded |
|
$ |
812 |
|
$ |
828 |
|
$ |
799 |
|
$ |
807 |
|
$ |
915 |
|
$ |
96.3 |
Ratio |
|
|
0.88% |
|
|
0.95% |
|
|
0.88% |
|
|
0.88% |
|
|
0.95% |
|
|
|
North America - Retail Services |
|
$ |
952 |
|
$ |
918 |
|
$ |
840 |
|
$ |
923 |
|
$ |
1,012 |
|
$ |
52.9 |
Ratio |
|
|
1.81% |
|
|
1.88% |
|
|
1.69% |
|
|
1.85% |
|
|
1.91% |
|
|
|
Latin America |
|
$ |
171 |
|
$ |
165 |
|
$ |
169 |
|
$ |
152 |
|
$ |
165 |
|
$ |
6.0 |
Ratio |
|
|
3.00% |
|
|
2.95% |
|
|
2.96% |
|
|
2.76% |
|
|
2.75% |
|
|
|
Asia (3) |
|
$ |
199 |
|
$ |
200 |
|
$ |
202 |
|
$ |
196 |
|
$ |
207 |
|
$ |
19.9 |
Ratio |
|
|
1.03% |
|
|
1.06% |
|
|
1.05% |
|
|
1.04% |
|
|
1.04% |
|
|
|
|
|
|
|
|
|
|
|
|
|
|
|
|
|
|
|
|
|
|
Corporate/Other - Consumer (2) |
|
$ |
382 |
|
$ |
354 |
|
$ |
327 |
|
$ |
293 |
|
$ |
278 |
|
$ |
9.6 |
Ratio |
|
|
2.63% |
|
|
2.97% |
|
|
2.97% |
|
|
2.82% |
|
|
3.02% |
|
|
|
|
|
|
|
|
|
|
|
|
|
|
|
|
|
|
|
|
|
|
Total Citigroup (2) |
|
$ |
2,932 |
|
$ |
2,859 |
|
$ |
2,753 |
|
$ |
2,763 |
|
$ |
3,015 |
|
$ |
309.5 |
Ratio |
|
|
0.97% |
|
|
0.99% |
|
|
0.93% |
|
|
0.93% |
|
|
0.98% |
|
|
|
(1) |
The ratio of 90+ Days Past Due is calculated based on end-of-period loans, net of unearned income. |
(2) |
The 90+ Days Past Due and related ratios for North America Retail Banking and Corporate/Other North America exclude U.S. mortgage loans that are guaranteed by U.S. government-sponsored agencies since the potential loss predominantly resides with the U.S. agencies. See footnote 2 on page 9 and footnote 1 on page 17. |
(3) |
Asia includes delinquency amounts, ratios and loans of certain EMEA countries for all periods presented. |
Reclassified to conform to the current period's presentation, including a change in the reporting of the commercial banking businesses from GCB to ICG.
Page 21
SUPPLEMENTAL DETAIL
CONSUMER LOANS 30-89 DAYS DELINQUENCY AMOUNTS AND RATIOS
BUSINESS VIEW
(In millions of dollars, except EOP loan amounts in billions of dollars)
|
|
Loans 30-89 Days Past Due (1) |
|
EOP Loans |
|
||||||||||||||
|
|
4Q |
|
1Q |
|
2Q |
|
3Q |
|
4Q |
|
4Q |
|
||||||
|
|
2018 |
|
2019 |
|
2019 |
|
2019 |
|
2019 |
|
2019 |
|
||||||
|
|
|
|
|
|
|
|
|
|
|
|
|
|
||||||
GCB (2) |
|
|
|
|
|
|
|
|
|
|
|
|
|
|
|
|
|
|
|
Total |
|
$ |
2,864 |
|
$ |
2,751 |
|
$ |
2,783 |
|
$ |
2,956 |
|
$ |
3,001 |
|
$ |
299.9 |
|
Ratio |
|
|
1.00% |
|
|
0.99% |
|
|
0.98% |
|
|
1.03% |
|
|
1.00% |
|
|
|
|
|
|
|
|
|
|
|
|
|
|
|
|
|
|
|
|
|
|
|
|
Retail Bank (2) |
|
|
|
|
|
|
|
|
|
|
|
|
|
|
|
|
|
|
|
Total |
|
$ |
752 |
|
$ |
744 |
|
$ |
831 |
|
$ |
803 |
|
$ |
816 |
|
$ |
124.8 |
|
Ratio |
|
|
0.64% |
|
|
0.63% |
|
|
0.70% |
|
|
0.67% |
|
|
0.66% |
|
|
|
|
North America (2) |
|
$ |
265 |
|
$ |
263 |
|
$ |
341 |
|
$ |
313 |
|
$ |
334 |
|
$ |
50.3 |
|
Ratio |
|
|
0.56% |
|
|
0.56% |
|
|
0.72% |
|
|
0.65% |
|
|
0.67% |
|
|
|
|
Latin America |
|
$ |
185 |
|
$ |
185 |
|
$ |
191 |
|
$ |
191 |
|
$ |
180 |
|
$ |
11.7 |
|
Ratio |
|
|
1.62% |
|
|
1.64% |
|
|
1.68% |
|
|
1.71% |
|
|
1.54% |
|
|
|
|
Asia (3) |
|
$ |
302 |
|
$ |
296 |
|
$ |
299 |
|
$ |
299 |
|
$ |
302 |
|
$ |
62.8 |
|
Ratio |
|
|
0.52% |
|
|
0.50% |
|
|
0.50% |
|
|
0.50% |
|
|
0.48% |
|
|
|
|
|
|
|
|
|
|
|
|
|
|
|
|
|
|
|
|
|
|
|
|
Cards |
|
|
|
|
|
|
|
|
|
|
|
|
|
|
|
|
|
|
|
Total |
|
$ |
2,112 |
|
$ |
2,007 |
|
$ |
1,952 |
|
$ |
2,153 |
|
$ |
2,185 |
|
$ |
175.1 |
|
Ratio |
|
|
1.25% |
|
|
1.25% |
|
|
1.18% |
|
|
1.30% |
|
|
1.25% |
|
|
|
|
North America - Citi-Branded |
|
$ |
755 |
|
$ |
731 |
|
$ |
705 |
|
$ |
800 |
|
$ |
814 |
|
$ |
96.3 |
|
Ratio |
|
|
0.82% |
|
|
0.84% |
|
|
0.78% |
|
|
0.87% |
|
|
0.85% |
|
|
|
|
North America - Retail Services |
|
$ |
932 |
|
$ |
859 |
|
$ |
831 |
|
$ |
943 |
|
$ |
945 |
|
$ |
52.9 |
|
Ratio |
|
|
1.77% |
|
|
1.76% |
|
|
1.68% |
|
|
1.89% |
|
|
1.79% |
|
|
|
|
Latin America |
|
$ |
170 |
|
$ |
161 |
|
$ |
159 |
|
$ |
161 |
|
$ |
159 |
|
$ |
6.0 |
|
Ratio |
|
|
2.98% |
|
|
2.88% |
|
|
2.79% |
|
|
2.93% |
|
|
2.65% |
|
|
|
|
Asia (3) |
|
$ |
255 |
|
$ |
256 |
|
$ |
257 |
|
$ |
249 |
|
$ |
267 |
|
$ |
19.9 |
|
Ratio |
|
|
1.32% |
|
|
1.36% |
|
|
1.34% |
|
|
1.32% |
|
|
1.34% |
|
|
|
|
|
|
|
|
|
|
|
|
|
|
|
|
|
|
|
|
|
|
|
|
Corporate/Other - Consumer (2) |
|
$ |
362 |
|
$ |
348 |
|
$ |
334 |
|
$ |
288 |
|
$ |
295 |
|
$ |
9.6 |
|
Ratio |
|
|
2.50% |
|
|
2.92% |
|
|
3.04% |
|
|
2.77% |
|
|
3.21% |
|
|
|
|
|
|
|
|
|
|
|
|
|
|
|
|
|
|
|
|
|
|
|
|
Total Citigroup (2) |
|
$ |
3,226 |
|
$ |
3,099 |
|
$ |
3,117 |
|
$ |
3,244 |
|
$ |
3,296 |
|
$ |
309.5 |
|
Ratio |
|
|
1.07% |
|
|
1.07% |
|
|
1.06% |
|
|
1.10% |
|
|
1.07% |
|
|
|
|
(1) |
The ratio of 30-89 Days Past Due is calculated based on end-of-period loans, net of unearned income. |
(2) |
The 30-89 Days Past Due and related ratios for North America Retail Banking and Corporate/Other North America exclude U.S. mortgage loans that are guaranteed by U.S. government-sponsored agencies since the potential loss predominantly resides with the U.S. agencies. See footnote 2 on page 9 and footnote 1 on page 17. |
(3) |
Asia includes delinquency amounts, ratios and loans of certain EMEA countries for all periods presented. |
Reclassified to conform to the current period's presentation, including a change in the reporting of the commercial banking businesses from GCB to ICG.
Page 22
ALLOWANCE FOR CREDIT LOSSES - PAGE 1
(In millions of dollars)
|
|
|
|
|
|
|
|
|
|
|
|
4Q19 Increase/ |
|
|
Full |
|
Full |
|
FY 2019 vs. |
|
|||||||||
|
|
4Q |
|
1Q |
|
2Q |
|
3Q |
|
4Q |
|
(Decrease) from |
|
|
Year |
|
Year |
|
FY 2018 Increase/ |
|
|||||||||
|
|
2018 |
|
2019 |
|
2019 |
|
2019 |
|
2019 |
|
3Q19 |
|
4Q18 |
|
|
2018 |
|
2019 |
|
(Decrease) |
|
|||||||
|
|
|
|
|
|
|
|
|
|
|
|
|
|
|
|
|
|
|
|
|
|
|
|||||||
Total Citigroup |
|
|
|
|
|
|
|
|
|
|
|
|
|
|
|
|
|
|
|
|
|
|
|
|
|
|
|
|
|
Allowance for Loan Losses at Beginning of Period (1) |
|
$ |
12,336 |
|
$ |
12,315 |
|
$ |
12,329 |
|
$ |
12,466 |
|
$ |
12,530 |
|
|
|
|
|
|
$ |
12,355 |
|
$ |
12,315 |
|
|
|
|
|
|
|
|
|
|
|
|
|
|
|
|
|
|
|
|
|
|
|
|
|
|
|
|
|
|
|
|
|
Gross Credit (Losses) |
|
|
(2,166) |
|
|
(2,345) |
|
|
(2,354) |
|
|
(2,281) |
|
|
(2,361) |
|
(4%) |
|
(9%) |
|
|
|
(8,665) |
|
|
(9,341) |
|
(8%) |
|
Gross Recoveries |
|
|
380 |
|
|
397 |
|
|
391 |
|
|
368 |
|
|
417 |
|
13% |
|
10% |
|
|
|
1,552 |
|
|
1,573 |
|
1% |
|
Net Credit (Losses) / Recoveries (NCLs) |
|
|
(1,786) |
|
|
(1,948) |
|
|
(1,963) |
|
|
(1,913) |
|
|
(1,944) |
|
2% |
|
9% |
|
|
|
(7,113) |
|
|
(7,768) |
|
9% |
|
NCLs |
|
|
1,786 |
|
|
1,948 |
|
|
1,963 |
|
|
1,913 |
|
|
1,944 |
|
2% |
|
9% |
|
|
|
7,113 |
|
|
7,768 |
|
9% |
|
Net Reserve Builds / (Releases) |
|
|
92 |
|
|
67 |
|
|
53 |
|
|
132 |
|
|
112 |
|
(15%) |
|
22% |
|
|
|
394 |
|
|
364 |
|
(8%) |
|
Net Specific Reserve Builds / (Releases) |
|
|
(28) |
|
|
(71) |
|
|
73 |
|
|
17 |
|
|
67 |
|
NM |
|
NM |
|
|
|
(153) |
|
|
86 |
|
NM |
|
Provision for Loan Losses |
|
|
1,850 |
|
|
1,944 |
|
|
2,089 |
|
|
2,062 |
|
|
2,123 |
|
3% |
|
15% |
|
|
|
7,354 |
|
|
8,218 |
|
12% |
|
Other (2) (3) (4) (5) (6) (7) |
|
|
(85) |
|
|
18 |
|
|
11 |
|
|
(85) |
|
|
74 |
|
NM |
|
NM |
|
|
|
(281) |
|
|
18 |
|
|
|
Allowance for Loan Losses at End of Period (1) (a) |
|
$ |
12,315 |
|
$ |
12,329 |
|
$ |
12,466 |
|
$ |
12,530 |
|
$ |
12,783 |
|
|
|
|
|
|
$ |
12,315 |
|
$ |
12,783 |
|
|
|
|
|
|
|
|
|
|
|
|
|
|
|
|
|
|
|
|
|
|
|
|
|
|
|
|
|
|
|
|
|
Allowance for Unfunded Lending Commitments (8) (a) |
|
$ |
1,367 |
|
$ |
1,391 |
|
$ |
1,376 |
|
$ |
1,385 |
|
$ |
1,456 |
|
|
|
|
|
|
$ |
1,367 |
|
$ |
1,456 |
|
|
|
|
|
|
|
|
|
|
|
|
|
|
|
|
|
|
|
|
|
|
|
|
|
|
|
|
|
|
|
|
|
Provision (Release) for Unfunded Lending Commitments |
|
$ |
47 |
|
$ |
24 |
|
$ |
(15) |
|
$ |
9 |
|
$ |
74 |
|
|
|
|
|
|
$ |
113 |
|
$ |
92 |
|
|
|
|
|
|
|
|
|
|
|
|
|
|
|
|
|
|
|
|
|
|
|
|
|
|
|
|
|
|
|
|
|
Total Allowance for Loans, Leases and Unfunded Lending Commitments [Sum of (a)] |
|
$ |
13,682 |
|
$ |
13,720 |
|
$ |
13,842 |
|
$ |
13,915 |
|
$ |
14,239 |
|
|
|
|
|
|
$ |
13,682 |
|
$ |
14,239 |
|
|
|
|
|
|
|
|
|
|
|
|
|
|
|
|
|
|
|
|
|
|
|
|
|
|
|
|
|
|
|
|
|
Total Allowance for Loan Losses as a Percentage of Total Loans (9) |
|
|
1.81 |
% |
|
1.82 |
% |
|
1.82 |
% |
|
1.82 |
% |
|
1.84 |
% |
|
|
|
|
|
|
|
|
|
|
|
|
|
|
|
|
|
|
|
|
|
|
|
|
|
|
|
|
|
|
|
|
|
|
|
|
|
|
|
|
|
|
|
Consumer: |
|
|
|
|
|
|
|
|
|
|
|
|
|
|
|
|
|
|
|
|
|
|
|
|
|
|
|
|
|
Allowance for Loan Losses at Beginning of Period (1) |
|
$ |
9,537 |
|
$ |
9,504 |
|
$ |
9,598 |
|
$ |
9,679 |
|
$ |
9,727 |
|
|
|
|
|
|
$ |
9,412 |
|
$ |
9,504 |
|
|
|
|
|
|
|
|
|
|
|
|
|
|
|
|
|
|
|
|
|
|
|
|
|
|
|
|
|
|
|
|
|
Net Credit Losses (NCLs) |
|
|
(1,730) |
|
|
(1,869) |
|
|
(1,874) |
|
|
(1,803) |
|
|
(1,830) |
|
1% |
|
6% |
|
|
|
(6,908) |
|
|
(7,376) |
|
7% |
|
NCLs |
|
|
1,730 |
|
|
1,869 |
|
|
1,874 |
|
|
1,803 |
|
|
1,830 |
|
1% |
|
6% |
|
|
|
6,908 |
|
|
7,376 |
|
7% |
|
Net Reserve Builds / (Releases) |
|
|
34 |
|
|
63 |
|
|
3 |
|
|
95 |
|
|
107 |
|
13% |
|
NM |
|
|
|
352 |
|
|
268 |
|
(24%) |
|
Net Specific Reserve Builds / (Releases) |
|
|
5 |
|
|
8 |
|
|
70 |
|
|
18 |
|
|
11 |
|
(39%) |
|
NM |
|
|
|
(2) |
|
|
107 |
|
NM |
|
Provision for Loan Losses |
|
|
1,769 |
|
|
1,940 |
|
|
1,947 |
|
|
1,916 |
|
|
1,948 |
|
2% |
|
10% |
|
|
|
7,258 |
|
|
7,751 |
|
7% |
|
Other (2) (3) (4) (5) (6) (7) |
|
|
(72) |
|
|
23 |
|
|
8 |
|
|
(65) |
|
|
52 |
|
NM |
|
NM |
|
|
|
(258) |
|
|
18 |
|
NM |
|
Allowance for Loan Losses at End of Period (1) (b) |
|
$ |
9,504 |
|
$ |
9,598 |
|
$ |
9,679 |
|
$ |
9,727 |
|
$ |
9,897 |
|
|
|
|
|
|
$ |
9,504 |
|
$ |
9,897 |
|
|
|
|
|
|
|
|
|
|
|
|
|
|
|
|
|
|
|
|
|
|
|
|
|
|
|
|
|
|
|
|
|
Consumer Allowance for Unfunded Lending Commitments (8) (b) |
|
$ |
2 |
|
$ |
- |
|
$ |
- |
|
$ |
2 |
|
$ |
4 |
|
|
|
|
|
|
$ |
2 |
|
$ |
4 |
|
|
|
|
|
|
|
|
|
|
|
|
|
|
|
|
|
|
|
|
|
|
|
|
|
|
|
|
|
|
|
|
|
Provision (Release) for Unfunded Lending Commitments |
|
$ |
- |
|
$ |
(3) |
|
$ |
- |
|
$ |
2 |
|
$ |
2 |
|
|
|
|
|
|
$ |
- |
|
$ |
1 |
|
|
|
|
|
|
|
|
|
|
|
|
|
|
|
|
|
|
|
|
|
|
|
|
|
|
|
|
|
|
|
|
|
Total Allowance for Loans, Leases and Unfunded Lending Commitments [Sum of (b)] |
|
$ |
9,506 |
|
$ |
9,598 |
|
$ |
9,679 |
|
$ |
9,729 |
|
$ |
9,901 |
|
|
|
|
|
|
$ |
9,506 |
|
$ |
9,901 |
|
|
|
|
|
|
|
|
|
|
|
|
|
|
|
|
|
|
|
|
|
|
|
|
|
|
|
|
|
|
|
|
|
Consumer Allowance for Loan Losses as a Percentage of Total Consumer Loans |
|
|
3.14 |
% |
|
3.30 |
% |
|
3.26 |
% |
|
3.27 |
% |
|
3.20 |
% |
|
|
|
|
|
|
|
|
|
|
|
|
|
|
|
|
|
|
|
|
|
|
|
|
|
|
|
|
|
|
|
|
|
|
|
|
|
|
|
|
|
|
|
Corporate |
|
|
|
|
|
|
|
|
|
|
|
|
|
|
|
|
|
|
|
|
|
|
|
|
|
|
|
|
|
Allowance for Loan Losses at Beginning of Period (1) |
|
$ |
2,799 |
|
$ |
2,811 |
|
$ |
2,731 |
|
$ |
2,787 |
|
$ |
2,803 |
|
|
|
|
|
|
$ |
2,943 |
|
$ |
2,811 |
|
|
|
|
|
|
|
|
|
|
|
|
|
|
|
|
|
|
|
|
|
|
|
|
|
|
|
|
|
|
|
|
|
Net Credit (Losses) / Recoveries (NCLs) |
|
|
(56) |
|
|
(79) |
|
|
(89) |
|
|
(110) |
|
|
(114) |
|
4% |
|
NM |
|
|
|
(205) |
|
|
(392) |
|
91% |
|
NCLs |
|
|
56 |
|
|
79 |
|
|
89 |
|
|
110 |
|
|
114 |
|
4% |
|
NM |
|
|
|
205 |
|
|
392 |
|
91% |
|
Net Reserve Builds / (Releases) |
|
|
58 |
|
|
4 |
|
|
50 |
|
|
37 |
|
|
5 |
|
(86%) |
|
(91%) |
|
|
|
42 |
|
|
96 |
|
NM |
|
Net Specific Reserve Builds / (Releases) |
|
|
(33) |
|
|
(79) |
|
|
3 |
|
|
(1) |
|
|
56 |
|
NM |
|
NM |
|
|
|
(151) |
|
|
(21) |
|
86% |
|
Provision for Loan Losses |
|
|
81 |
|
|
4 |
|
|
142 |
|
|
146 |
|
|
175 |
|
20% |
|
NM |
|
|
|
96 |
|
|
467 |
|
NM |
|
Other (2) |
|
|
(13) |
|
|
(5) |
|
|
3 |
|
|
(20) |
|
|
22 |
|
|
|
|
|
|
|
(23) |
|
|
- |
|
|
|
Allowance for Loan Losses at End of Period (1) (c) |
|
$ |
2,811 |
|
$ |
2,731 |
|
$ |
2,787 |
|
$ |
2,803 |
|
$ |
2,886 |
|
|
|
|
|
|
$ |
2,811 |
|
$ |
2,886 |
|
|
|
|
|
|
|
|
|
|
|
|
|
|
|
|
|
|
|
|
|
|
|
|
|
|
|
|
|
|
|
|
|
Corporate Allowance for Unfunded Lending Commitments (8) (c) |
|
$ |
1,365 |
|
$ |
1,391 |
|
$ |
1,376 |
|
$ |
1,383 |
|
$ |
1,452 |
|
|
|
|
|
|
$ |
1,365 |
|
$ |
1,452 |
|
|
|
|
|
|
|
|
|
|
|
|
|
|
|
|
|
|
|
|
|
|
|
|
|
|
|
|
|
|
|
|
|
Provision (Release) for Unfunded Lending Commitments |
|
$ |
47 |
|
$ |
27 |
|
$ |
(15) |
|
$ |
7 |
|
$ |
72 |
|
|
|
|
|
|
$ |
113 |
|
$ |
91 |
|
|
|
|
|
|
|
|
|
|
|
|
|
|
|
|
|
|
|
|
|
|
|
|
|
|
|
|
|
|
|
|
|
Total Allowance for Loans, Leases and Unfunded Lending Commitments [Sum of (c)] |
|
$ |
4,176 |
|
$ |
4,122 |
|
$ |
4,163 |
|
$ |
4,186 |
|
$ |
4,338 |
|
|
|
|
|
|
$ |
4,176 |
|
$ |
4,338 |
|
|
|
|
|
|
|
|
|
|
|
|
|
|
|
|
|
|
|
|
|
|
|
|
|
|
|
|
|
|
|
|
|
Corporate Allowance for Loan Losses as a Percentage of Total Corporate Loans (9) |
|
|
0.74 |
% |
|
0.70 |
% |
|
0.72 |
% |
|
0.72 |
% |
|
0.75 |
% |
|
|
|
|
|
|
|
|
|
|
|
|
|
|
|
|
|
|
|
|
|
|
|
|
|
|
|
|
|
|
|
|
|
|
|
|
|
|
|
|
|
|
|
Footnotes to these tables are on the following page (page 24). |
|
|
|
|
|
|
|
|
|
|
|
|
|
|
|
|
|
|
|
|
|
|
|
|
|
|
|
|
|
Page 23
ALLOWANCE FOR CREDIT LOSSES - PAGE 2
The following footnotes relate to the tables on the prior page (page 23).
(1) |
Allowance for credit losses represents management's estimate of probable losses inherent in the portfolio. Attribution of the allowance is made for analytical purposes only, and the entire allowance is available to absorb probable credit losses inherent in the portfolio. |
(2) |
Includes all adjustments to the allowance for credit losses, such as changes in the allowance from acquisitions, dispositions, securitizations, foreign currency translation (FX translation), purchase accounting adjustments, etc. |
(3) |
4Q18 Consumer includes a decrease of approximately $76 million related to FX translation. |
(4) |
1Q19 Consumer includes an increase of approximately $26 million related to FX translation. |
(5) |
2Q19 Consumer includes an increase of approximately $13 million related to FX translation. |
(6) |
3Q19 Consumer includes a decrease of approximately $65 million related to FX translation. |
(7) |
4Q19 Consumer includes a reduction of approximately $33 million related to the sale or transfers to HFS of various loan portfolios. Additionally, the fourth quarter includes an increase of approximately $86 million related to FX translation. |
(8) |
Represents additional credit reserves recorded as other liabilities on the Consolidated Balance Sheet. |
(9) |
December 31, 2018, March 31, 2019, June 30, 2019, September 30, 2019 and December 31, 2019 exclude $3.2 billion, $3.9 billion, $3.8 billion, $3.8 billion and $4.1 billion, respectively, of loans which are carried at fair value. |
NM Not meaningful.
Reclassified to conform to the current period's presentation, including a change in the reporting of the commercial banking businesses from GCB to ICG.
Page 24
COMPONENTS OF PROVISION FOR LOAN LOSSES
(In millions of dollars)
|
|
|
|
|
|
|
|
|
|
|
|
4Q19 Increase/ |
|
Full |
|
Full |
|
FY 2019 vs. |
|||||||||
|
|
4Q |
|
1Q |
|
2Q |
|
3Q |
|
4Q |
|
(Decrease) from |
|
Year |
|
Year |
|
FY 2018 Increase/ |
|||||||||
|
|
2018 |
|
2019 |
|
2019 |
|
2019 |
|
2019 |
|
3Q19 |
|
4Q18 |
|
2018 |
|
2019 |
|
(Decrease) |
|||||||
|
|
|
|
|
|
|
|
|
|
|
|
|
|
|
|
|
|
|
|
|
|||||||
Global Consumer Banking |
|
|
|
|
|
|
|
|
|
|
|
|
|
|
|
|
|
|
|
|
|
|
|
|
|
|
|
Net Credit Losses |
|
$ |
1,733 |
|
$ |
1,868 |
|
$ |
1,870 |
|
$ |
1,802 |
|
$ |
1,842 |
|
2% |
|
6% |
|
$ |
6,884 |
|
$ |
7,382 |
|
7% |
Credit Reserve Build / (Release) |
|
|
85 |
|
|
96 |
|
|
94 |
|
|
129 |
|
|
120 |
|
(7%) |
|
41% |
|
|
568 |
|
|
439 |
|
(23%) |
North America |
|
|
|
|
|
|
|
|
|
|
|
|
|
|
|
|
|
|
|
|
|
|
|
|
|
|
|
Net Credit Losses |
|
|
1,281 |
|
|
1,408 |
|
|
1,417 |
|
|
1,350 |
|
|
1,408 |
|
4% |
|
10% |
|
|
5,085 |
|
|
5,583 |
|
10% |
Credit Reserve Build / (Release) |
|
|
78 |
|
|
118 |
|
|
81 |
|
|
161 |
|
|
109 |
|
(32%) |
|
40% |
|
|
460 |
|
|
469 |
|
2% |
Retail Banking |
|
|
|
|
|
|
|
|
|
|
|
|
|
|
|
|
|
|
|
|
|
|
|
|
|
|
|
Net Credit Losses |
|
|
31 |
|
|
39 |
|
|
40 |
|
|
40 |
|
|
42 |
|
5% |
|
35% |
|
|
126 |
|
|
161 |
|
28% |
Credit Reserve Build / (Release) |
|
|
5 |
|
|
(3) |
|
|
(4) |
|
|
(1) |
|
|
(2) |
|
(100%) |
|
NM |
|
|
8 |
|
|
(10) |
|
NM |
Citi-Branded Cards |
|
|
|
|
|
|
|
|
|
|
|
|
|
|
|
|
|
|
|
|
|
|
|
|
|
|
|
Net Credit Losses |
|
|
650 |
|
|
706 |
|
|
723 |
|
|
712 |
|
|
723 |
|
2% |
|
11% |
|
|
2,602 |
|
|
2,864 |
|
10% |
Credit Reserve Build / (Release) |
|
|
41 |
|
|
76 |
|
|
64 |
|
|
141 |
|
|
115 |
|
(18%) |
|
NM |
|
|
226 |
|
|
396 |
|
75% |
Citi Retail Services |
|
|
|
|
|
|
|
|
|
|
|
|
|
|
|
|
|
|
|
|
|
|
|
|
|
|
|
Net Credit Losses |
|
|
600 |
|
|
663 |
|
|
654 |
|
|
598 |
|
|
643 |
|
8% |
|
7% |
|
|
2,357 |
|
|
2,558 |
|
9% |
Credit Reserve Build / (Release) |
|
|
32 |
|
|
45 |
|
|
21 |
|
|
21 |
|
|
(4) |
|
NM |
|
NM |
|
|
226 |
|
|
83 |
|
(63%) |
Latin America |
|
|
|
|
|
|
|
|
|
|
|
|
|
|
|
|
|
|
|
|
|
|
|
|
|
|
|
Net Credit Losses |
|
|
289 |
|
|
296 |
|
|
279 |
|
|
275 |
|
|
259 |
|
(6%) |
|
(10%) |
|
|
1,131 |
|
|
1,109 |
|
(2%) |
Credit Reserve Build / (Release) |
|
|
(8) |
|
|
(2) |
|
|
3 |
|
|
(34) |
|
|
(5) |
|
85% |
|
38% |
|
|
84 |
|
|
(38) |
|
NM |
Retail Banking |
|
|
|
|
|
|
|
|
|
|
|
|
|
|
|
|
|
|
|
|
|
|
|
|
|
|
|
Net Credit Losses |
|
|
143 |
|
|
136 |
|
|
123 |
|
|
119 |
|
|
116 |
|
(3%) |
|
(19%) |
|
|
545 |
|
|
494 |
|
(9%) |
Credit Reserve Build / (Release) |
|
|
(19) |
|
|
1 |
|
|
(14) |
|
|
(28) |
|
|
(22) |
|
21% |
|
(16%) |
|
|
(5) |
|
|
(63) |
|
NM |
Citi-Branded Cards |
|
|
|
|
|
|
|
|
|
|
|
|
|
|
|
|
|
|
|
|
|
|
|
|
|
|
|
Net Credit Losses |
|
|
146 |
|
|
160 |
|
|
156 |
|
|
156 |
|
|
143 |
|
(8%) |
|
(2%) |
|
|
586 |
|
|
615 |
|
5% |
Credit Reserve Build / (Release) |
|
|
11 |
|
|
(3) |
|
|
17 |
|
|
(6) |
|
|
17 |
|
- |
|
55% |
|
|
89 |
|
|
25 |
|
(72%) |
Asia (1) |
|
|
|
|
|
|
|
|
|
|
|
|
|
|
|
|
|
|
|
|
|
|
|
|
|
|
|
Net Credit Losses |
|
|
163 |
|
|
164 |
|
|
174 |
|
|
177 |
|
|
175 |
|
(1%) |
|
7% |
|
|
668 |
|
|
690 |
|
3% |
Credit Reserve Build / (Release) |
|
|
15 |
|
|
(20) |
|
|
10 |
|
|
2 |
|
|
16 |
|
NM |
|
7% |
|
|
24 |
|
|
8 |
|
(67%) |
Retail Banking |
|
|
|
|
|
|
|
|
|
|
|
|
|
|
|
|
|
|
|
|
|
|
|
|
|
|
|
Net Credit Losses |
|
|
61 |
|
|
58 |
|
|
62 |
|
|
66 |
|
|
69 |
|
5% |
|
13% |
|
|
242 |
|
|
255 |
|
5% |
Credit Reserve Build / (Release) |
|
|
(3) |
|
|
4 |
|
|
3 |
|
|
5 |
|
|
7 |
|
40% |
|
NM |
|
|
(13) |
|
|
19 |
|
NM |
Citi-Branded Cards |
|
|
|
|
|
|
|
|
|
|
|
|
|
|
|
|
|
|
|
|
|
|
|
|
|
|
|
Net Credit Losses |
|
|
102 |
|
|
106 |
|
|
112 |
|
|
111 |
|
|
106 |
|
(5%) |
|
4% |
|
|
426 |
|
|
435 |
|
2% |
Credit Reserve Build / (Release) |
|
|
18 |
|
|
(24) |
|
|
7 |
|
|
(3) |
|
|
9 |
|
NM |
|
(50%) |
|
|
37 |
|
|
(11) |
|
NM |
|
|
|
|
|
|
|
|
|
|
|
|
|
|
|
|
|
|
|
|
|
|
|
|
|
|
|
|
Institutional Clients Group (ICG) |
|
|
|
|
|
|
|
|
|
|
|
|
|
|
|
|
|
|
|
|
|
|
|
|
|
|
|
Net Credit Losses |
|
|
56 |
|
|
78 |
|
|
91 |
|
|
110 |
|
|
115 |
|
5% |
|
NM |
|
|
208 |
|
|
394 |
|
89% |
Credit Reserve Build / (Release) |
|
|
26 |
|
|
(74) |
|
|
52 |
|
|
36 |
|
|
57 |
|
58% |
|
NM |
|
|
(109) |
|
|
71 |
|
NM |
|
|
|
|
|
|
|
|
|
|
|
|
|
|
|
|
|
|
|
|
|
|
|
|
|
|
|
|
Corporate / Other |
|
|
|
|
|
|
|
|
|
|
|
|
|
|
|
|
|
|
|
|
|
|
|
|
|
|
|
Net Credit Losses |
|
|
(3) |
|
|
2 |
|
|
2 |
|
|
1 |
|
|
(13) |
|
NM |
|
NM |
|
|
21 |
|
|
(8) |
|
NM |
Credit Reserve Build / (Release) |
|
|
(47) |
|
|
(26) |
|
|
(20) |
|
|
(16) |
|
|
2 |
|
NM |
|
NM |
|
|
(218) |
|
|
(60) |
|
72% |
|
|
|
|
|
|
|
|
|
|
|
|
|
|
|
|
|
|
|
|
|
|
|
|
|
|
|
|
Total Provision for Loan Losses |
|
$ |
1,850 |
|
$ |
1,944 |
|
$ |
2,089 |
|
$ |
2,062 |
|
$ |
2,123 |
|
3% |
|
15% |
|
$ |
7,354 |
|
$ |
8,218 |
|
12% |
(1) |
Asia GCB includes NCLs and credit reserve builds (releases) for certain EMEA countries for all periods presented. |
NM Not meaningful.
Reclassified to conform to the current period's presentation, including a change in the reporting of the commercial banking businesses from GCB to ICG.
Page 25
NON-ACCRUAL ASSETS
(In millions of dollars)
|
|
|
|
|
|
|
|
|
|
|
|
4Q19 Increase/ |
|||||||
|
|
4Q |
|
1Q |
|
2Q |
|
3Q |
|
4Q |
|
(Decrease) from |
|||||||
|
|
2018 |
|
2019 |
|
2019 |
|
2019 |
|
2019 |
|
3Q19 |
|
4Q18 |
|||||
Non-Accrual Loans (1) |
|
|
|
|
|
|
|
|
|
|
|
|
|
|
|
|
|
|
|
Corporate Non-Accrual Loans by Region |
|
|
|
|
|
|
|
|
|
|
|
|
|
|
|
|
|
|
|
North America |
|
$ |
586 |
|
$ |
1,061 |
|
$ |
913 |
|
$ |
1,056 |
|
$ |
1,214 |
|
15% |
|
NM |
EMEA |
|
|
375 |
|
|
317 |
|
|
321 |
|
|
307 |
|
|
430 |
|
40% |
|
15% |
Latin America |
|
|
307 |
|
|
305 |
|
|
353 |
|
|
399 |
|
|
473 |
|
19% |
|
54% |
Asia |
|
|
243 |
|
|
49 |
|
|
80 |
|
|
84 |
|
|
71 |
|
(15%) |
|
(71%) |
Total |
|
$ |
1,511 |
|
$ |
1,732 |
|
$ |
1,667 |
|
$ |
1,846 |
|
$ |
2,188 |
|
19% |
|
45% |
|
|
|
|
|
|
|
|
|
|
|
|
|
|
|
|
|
|
|
|
Consumer Non-Accrual Loans by Region (2) |
|
|
|
|
|
|
|
|
|
|
|
|
|
|
|
|
|
|
|
North America |
|
$ |
1,138 |
|
$ |
1,090 |
|
$ |
1,082 |
|
$ |
1,013 |
|
$ |
905 |
|
(11%) |
|
(20%) |
Latin America |
|
|
638 |
|
|
614 |
|
|
629 |
|
|
595 |
|
|
632 |
|
6% |
|
(1%) |
Asia (3) |
|
|
250 |
|
|
251 |
|
|
260 |
|
|
258 |
|
|
279 |
|
8% |
|
12% |
Total |
|
$ |
2,026 |
|
$ |
1,955 |
|
$ |
1,971 |
|
$ |
1,866 |
|
$ |
1,816 |
|
(3%) |
|
(10%) |
|
|
|
|
|
|
|
|
|
|
|
|
|
|
|
|
|
|
|
|
OTHER REAL ESTATE OWNED AND OTHER REPOSSESSED ASSETS |
|
|
|
|
|
|
|
|
|
|
|
|
|
|
|
|
|
|
|
Institutional Clients Group |
|
$ |
31 |
|
$ |
31 |
|
$ |
34 |
|
$ |
20 |
|
$ |
18 |
|
(10%) |
|
(42%) |
Global Consumer Banking |
|
|
18 |
|
|
18 |
|
|
11 |
|
|
10 |
|
|
6 |
|
(40%) |
|
(67%) |
Corporate/Other |
|
|
50 |
|
|
49 |
|
|
37 |
|
|
42 |
|
|
37 |
|
(12%) |
|
(26%) |
TOTAL OTHER REAL ESTATE OWNED (OREO) (4) |
|
$ |
99 |
|
$ |
98 |
|
$ |
82 |
|
$ |
72 |
|
$ |
61 |
|
(15%) |
|
(38%) |
|
|
|
|
|
|
|
|
|
|
|
|
|
|
|
|
|
|
|
|
OREO By Region |
|
|
|
|
|
|
|
|
|
|
|
|
|
|
|
|
|
|
|
North America |
|
$ |
64 |
|
$ |
63 |
|
$ |
47 |
|
$ |
51 |
|
$ |
39 |
|
(24%) |
|
(39%) |
EMEA |
|
|
1 |
|
|
1 |
|
|
1 |
|
|
1 |
|
|
1 |
|
- |
|
- |
Latin America |
|
|
12 |
|
|
13 |
|
|
14 |
|
|
14 |
|
|
14 |
|
- |
|
17% |
Asia |
|
|
22 |
|
|
21 |
|
|
20 |
|
|
6 |
|
|
7 |
|
17% |
|
(68%) |
Total |
|
$ |
99 |
|
$ |
98 |
|
$ |
82 |
|
$ |
72 |
|
$ |
61 |
|
(15%) |
|
(38%) |
|
|
|
|
|
|
|
|
|
|
|
|
|
|
|
|
|
|
|
|
Non-Accrual Assets (NAA) (5) |
|
|
|
|
|
|
|
|
|
|
|
|
|
|
|
|
|
|
|
Corporate Non-Accrual Loans |
|
$ |
1,511 |
|
$ |
1,732 |
|
$ |
1,667 |
|
$ |
1,846 |
|
$ |
2,188 |
|
19% |
|
45% |
Consumer Non-Accrual Loans |
|
|
2,026 |
|
|
1,955 |
|
|
1,971 |
|
|
1,866 |
|
|
1,816 |
|
(3%) |
|
(10%) |
Non-Accrual Loans (NAL) |
|
|
3,537 |
|
|
3,687 |
|
|
3,638 |
|
|
3,712 |
|
|
4,004 |
|
8% |
|
13% |
OREO |
|
|
99 |
|
|
98 |
|
|
82 |
|
|
72 |
|
|
61 |
|
(15%) |
|
(38%) |
Non-Accrual Assets (NAA) |
|
$ |
3,636 |
|
$ |
3,785 |
|
$ |
3,720 |
|
$ |
3,784 |
|
$ |
4,065 |
|
7% |
|
12% |
|
|
|
|
|
|
|
|
|
|
|
|
|
|
|
|
|
|
|
|
NAL as a % of Total Loans |
|
|
0.52% |
|
|
0.54% |
|
|
0.53% |
|
|
0.54% |
|
|
0.57% |
|
|
|
|
NAA as a % of Total Assets |
|
|
0.19% |
|
|
0.19% |
|
|
0.19% |
|
|
0.19% |
|
|
0.21% |
|
|
|
|
|
|
|
|
|
|
|
|
|
|
|
|
|
|
|
|
|
|
|
|
Allowance for Loan Losses as a % of NAL |
|
|
348% |
|
|
334% |
|
|
343% |
|
|
338% |
|
|
319% |
|
|
|
|
(1) |
Corporate loans are placed on non-accrual status based upon a review by Citigroup's risk officers. Corporate non-accrual loans may still be current on interest payments. With limited exceptions, the following practices are applied for Consumer loans: Consumer loans, excluding credit cards and mortgages, are placed on non-accrual status at 90 days past due, and are charged off at 120 days past due; residential mortgage loans are placed on non-accrual status at 90 days past due and written down to net realizable value at 180 days past due. Consistent with industry conventions, Citigroup generally accrues interest on credit card loans until such loans are charged off, which typically occurs at 180 days contractual delinquency. As such, the non-accrual loan disclosures do not include credit card loans. |
(2) |
Excludes Statement of Position (SOP) 03-3 purchased distressed loans. |
(3) |
Asia GCB includes balances for certain EMEA countries for all periods presented. |
(4) |
Represents the carrying value of all property acquired by foreclosure or other legal proceedings when Citigroup has taken possession of the collateral. Also includes former premises and property for use that is no longer contemplated. |
(5) |
There is no industry-wide definition of non-accrual assets. As such, analysis against the industry is not always comparable. |
NM Not meaningful.
Reclassified to conform to the current period's presentation, including a change in the reporting of the commercial banking businesses from GCB to ICG.
Page 26
CET1 CAPITAL AND SUPPLEMENTARY LEVERAGE RATIOS, TANGIBLE COMMON EQUITY, BOOK VALUE PER
SHARE AND TANGIBLE BOOK VALUE PER SHARE
(In millions of dollars or shares, except per share amounts and ratios)
|
|
December 31, |
|
March 31, |
|
June 30, |
|
September 30, |
|
December 31, |
|||||
Common Equity Tier 1 Capital Ratio and Components(1) |
|
2018 |
|
2019 |
|
2019 |
|
2019 |
|
2019(2) |
|||||
Citigroup Common Stockholders' Equity(3) |
|
$ |
177,928 |
|
$ |
178,427 |
|
$ |
179,534 |
|
$ |
177,052 |
|
$ |
175,414 |
Add: Qualifying noncontrolling interests |
|
|
147 |
|
|
144 |
|
|
154 |
|
|
145 |
|
|
154 |
Regulatory Capital Adjustments and Deductions: |
|
|
|
|
|
|
|
|
|
|
|
|
|
|
|
Less: |
|
|
|
|
|
|
|
|
|
|
|
|
|
|
|
Accumulated net unrealized gains (losses) on cash flow hedges, net of tax(4) |
|
|
(728) |
|
|
(442) |
|
|
75 |
|
|
328 |
|
|
123 |
Cumulative unrealized net gain (loss) related to changes in fair value of financial |
|
|
|
|
|
|
|
|
|
|
|
|
|
|
|
liabilities attributable to own creditworthiness, net of tax(5) |
|
|
580 |
|
|
(67) |
|
|
(85) |
|
|
181 |
|
|
(679) |
Intangible Assets: |
|
|
|
|
|
|
|
|
|
|
|
|
|
|
|
Goodwill, net of related deferred tax liabilities (DTLs)(6) |
|
|
21,778 |
|
|
21,768 |
|
|
21,793 |
|
|
21,498 |
|
|
21,017 |
Identifiable intangible assets other than mortgage servicing rights |
|
|
|
|
|
|
|
|
|
|
|
|
|
|
|
(MSRs), net of related DTLs |
|
|
4,402 |
|
|
4,390 |
|
|
4,264 |
|
|
4,132 |
|
|
4,087 |
Defined benefit pension plan net assets |
|
|
806 |
|
|
811 |
|
|
969 |
|
|
990 |
|
|
803 |
Deferred tax assets (DTAs) arising from net operating loss, foreign tax credit |
|
|
|
|
|
|
|
|
|
|
|
|
|
|
|
and general business credit carry-forwards |
|
|
11,985 |
|
|
11,756 |
|
|
11,547 |
|
|
11,487 |
|
|
12,335 |
Common Equity Tier 1 Capital (CET1) |
|
$ |
139,252 |
|
$ |
140,355 |
|
$ |
141,125 |
|
$ |
138,581 |
|
$ |
137,882 |
Risk-Weighted Assets (RWA) |
|
$ |
1,174,448 |
|
$ |
1,178,628 |
|
$ |
1,187,328 |
|
$ |
1,197,050 |
|
$ |
1,175,366 |
Common Equity Tier 1 Capital Ratio (CET1/RWA) |
|
|
11.86% |
|
|
11.91% |
|
|
11.89% |
|
|
11.58% |
|
|
11.7% |
|
|
|
|
|
|
|
|
|
|
|
|
|
|
|
|
Supplementary Leverage Ratio and Components |
|
|
|
|
|
|
|
|
|
|
|
|
|
|
|
Common Equity Tier 1 Capital (CET1) |
|
$ |
139,252 |
|
$ |
140,355 |
|
$ |
141,125 |
|
$ |
138,581 |
|
$ |
137,882 |
Additional Tier 1 Capital (AT1)(7) |
|
|
18,870 |
|
|
18,357 |
|
|
18,322 |
|
|
19,452 |
|
|
18,010 |
Total Tier 1 Capital (T1C) (CET1 + AT1) |
|
$ |
158,122 |
|
$ |
158,712 |
|
$ |
159,447 |
|
$ |
158,033 |
|
$ |
155,892 |
Total Leverage Exposure (TLE) |
|
$ |
2,465,641 |
|
$ |
2,463,958 |
|
$ |
2,500,128 |
|
$ |
2,520,352 |
|
$ |
2,507,977 |
Supplementary Leverage Ratio (T1C/TLE) |
|
|
6.41% |
|
|
6.44% |
|
|
6.38% |
|
|
6.27% |
|
|
6.2% |
|
|
|
|
|
|
|
|
|
|
|
|
|
|
|
|
Tangible Common Equity, Book Value Per Share and Tangible Book Value Per Share |
|
|
|
|
|
|
|
|
|
|
|
|
|
|
|
Common Stockholders' Equity |
|
$ |
177,760 |
|
$ |
178,272 |
|
$ |
179,379 |
|
$ |
176,893 |
|
$ |
175,262 |
Less: |
|
|
|
|
|
|
|
|
|
|
|
|
|
|
|
Goodwill |
|
|
22,046 |
|
|
22,037 |
|
|
22,065 |
|
|
21,822 |
|
|
22,126 |
Intangible assets (other than MSRs) |
|
|
4,636 |
|
|
4,645 |
|
|
4,518 |
|
|
4,372 |
|
|
4,327 |
Tangible Common Equity (TCE) |
|
$ |
151,078 |
|
$ |
151,590 |
|
$ |
152,796 |
|
$ |
150,699 |
|
$ |
148,809 |
Common Shares Outstanding (CSO) |
|
|
2,368.5 |
|
|
2,312.5 |
|
|
2,259.1 |
|
|
2,183.2 |
|
|
2,114.1 |
Book Value Per Share (Common Equity/CSO) |
|
$ |
75.05 |
|
$ |
77.09 |
|
$ |
79.40 |
|
$ |
81.02 |
|
$ |
82.90 |
Tangible Book Value Per Share (TCE/CSO) |
|
$ |
63.79 |
|
$ |
65.55 |
|
$ |
67.64 |
|
$ |
69.03 |
|
$ |
70.39 |
(1) |
See footnote 4 on page 1. |
(2) |
Preliminary. |
(3) |
Excludes issuance costs related to outstanding preferred stock in accordance with Federal Reserve Board regulatory reporting requirements. |
(4) |
Common Equity Tier 1 Capital is adjusted for accumulated net unrealized gains (losses) on cash flow hedges included in accumulated other comprehensive income that relate to the hedging of items not recognized at fair value on the balance sheet. |
(5) |
The cumulative impact of changes in Citigroup’s own creditworthiness in valuing liabilities for which the fair value option has been elected, and own-credit valuation adjustments on derivatives, are excluded from Common Equity Tier 1 Capital, in accordance with the U.S. Basel III rules. |
(6) |
Includes goodwill “embedded” in the valuation of significant common stock investments in unconsolidated financial institutions. |
(7) |
Additional Tier 1 Capital primarily includes qualifying noncumulative perpetual preferred stock and qualifying trust preferred securities. |
Reclassified to conform to the current period's presentation.
Page 27
Exhibit 99.3
Citi Securities registered pursuant to Section 12(b) of the Securities Exchange Act of 1934:
Title of each class | Ticker Symbol(s) | Title for iXBRL | Name of each exchange on |
|
|
| |
Common Stock, par value $.01 per share | |||
|
| ||
|
| ||
Depositary Shares, each representing 1/1,000th interest in a share of 6.875% Fixed/Floating Rate Noncumulative Preferred Stock, Series K | |||
|
| ||
Depositary Shares, each representing 1/1,000th interest in a share of 6.300% Noncumulative Preferred Stock, Series S | |||
|
| ||
7.625% Trust Preferred Securities of Citigroup Capital III (and registrant’s guaranty with respect thereto) | |||
|
| ||
7.875% Fixed Rate / Floating Rate Trust Preferred Securities (TruPS®) of Citigroup Capital XIII (and registrant’s guaranty with respect thereto) | |||
|
| ||
6.829% Fixed Rate / Floating Rate Enhanced Trust Preferred Securities (Enhanced TruPS®) of Citigroup Capital XVIII (and registrant’s guaranty with respect thereto) | |||
|
| ||
C-Tracks Exchange-Traded Notes Based on the Performance of the Miller/Howard MLP Fundamental Index Due September 28, 2023 | |||
|
| ||
C-Tracks Exchange-Traded Notes Miller/Howard Strategic Dividend Reinvestor Due September 16, 2024 | |||
|
| ||
C-Tracks Exchange-Traded Notes on the Miller/Howard MLP Fundamental Index, Series B, Due July 13, 2026 of Citigroup Global Markets Holdings Inc. (“CGMHI”) (and registrant’s guaranty with respect thereto) | |||
|
| ||
Exchange-Traded Notes Based on the Performance of the VelocityShares® Daily 4X Long USD vs. JPY Index due December 15, 2032 of CGMHI (and registrant’s guaranty with respect thereto) | |||
Exchange-Traded Notes Based on the Performance of the VelocityShares® Daily 4X Long USD vs. GBP Index due December 15, 2032 of CGMHI (and registrant’s guaranty with respect thereto) | |||
|
|
Exchange-Traded Notes Based on the Performance of the VelocityShares® Daily 4X Long USD vs. EUR Index due December 15, 2032 of CGMHI (and registrant’s guaranty with respect thereto) | |||
|
| ||
Exchange-Traded Notes Based on the Performance of the VelocityShares® Daily 4X Long USD vs. CHF Index due December 15, 2032 of CGMHI (and registrant’s guaranty with respect thereto) | |||
|
| ||
Exchange-Traded Notes Based on the Performance of the VelocityShares® Daily 4X Long USD vs. AUD Index due December 15, 2032 of CGMHI (and registrant’s guaranty with respect thereto) | |||
|
| ||
Exchange-Traded Notes Based on the Performance of the VelocityShares® Daily 4X Long JPY vs. USD Index due December 15, 2032 of CGMHI (and registrant’s guaranty with respect thereto) | |||
|
| ||
Exchange-Traded Notes Based on the Performance of the VelocityShares® Daily 4X Long EUR vs. USD Index due December 15, 2032 of CGMHI (and registrant’s guaranty with respect thereto)
| |||
Exchange-Traded Notes Based on the Performance of the VelocityShares® Daily 4X Long GBP vs. USD Index due December 15, 2032 of CGMHI (and registrant’s guaranty with respect thereto)
| |||
Exchange-Traded Notes Based on the Performance of the VelocityShares® Daily 4X Long CHF vs. USD Index due December 15, 2032 of CGMHI (and registrant’s guaranty with respect thereto) | |||
|
| ||
Exchange-Traded Notes Based on the Performance of the VelocityShares® Daily 4X Long AUD vs. USD Index due December 15, 2032 of CGMHI (and registrant’s guaranty with respect thereto) | |||
|
| ||
VelocityShares® Long LIBOR ETNs due August 16, 2032 of CGMHI (and registrant’s guaranty with respect thereto) | |||
|
| ||
VelocityShares® Short LIBOR ETNs due August 16, 2032 of CGMHI (and registrant’s guaranty with respect thereto) | |||
VelocityShares® 3x Long Crude Oil ETNs linked to the S&P GSCI® Crude Oil Index ER due December 15, 2031 of CGMHI (and registrant’s guaranty with respect thereto) | |||
|
|
VelocityShares® 3x Inverse Crude Oil ETNs linked to the S&P GSCI® Crude Oil Index ER due December 15, 2031 of CGMHI (and registrant’s guaranty with respect thereto) | |||
|
| ||
Medium-Term Senior Notes, Series N, Callable Step-Up Coupon Notes Due March 31, 2036 of CGMHI (and registrant’s guaranty with respect thereto) | |||
|
| ||
Medium-Term Senior Notes, Series G, Callable Fixed Rate Notes Due January 13, 2027 |
X(J2OG?P?X[O_ M,L)S<:RNI+:ZA>&>-MKQN,%34-<1].FFKH****!A
M1110 4444 %:WA[Q'?\ AK4EO+&3&<"6)ONR+Z$?U[5DT4XR<7=&=6E"K!TZ
MBNGNCZ7\,^*M.\4V)GLWQ+&!YT#?>C)'ZCW]JW*^6M)U:]T34HK^PF,4\9Z]
MF'<$=P:^@?!_C"S\5Z=O3$5[$!Y]OGE?]H>JFO9PV*57W9;GYMGF0RP+]M1U
MI_BO7R\_Z?24445V'S84444 %%%% !1110 4444 %%%% !1110 4444 %%%%
M !1110 4444 %%%% !1110 4444 %%%% !1110 4444 %%%% !1110 4444
M%%%% !1110 4444 %%%% !1110 4444 %%%% !1110 4444 %%%% !1110 4
M444 %%%% !1110 4444 %%%% !1110 4444 %%%% !1110 4444 %%%% !11
M10 4444 %%%% !1110 4444 %-=TCC:21@J*"69C@ #N:=7B_P 2?'CW\\NA
MZ7+BS0[;B9&_UQ_NC_9'?U/MUQK5HTH\S/1RS+:N85U2I[=7V7];%?X@_$%M
M;=]*TJ0KIJG$D@X,Y_\ B?YUYY117A5*DJDN:1^JX+!4<'15&BK)?CYL****
M@ZPHHHH **** "BBNS\(?#O4?$A2ZN"UGIIY\XCYI!GD(/ZGCZU<*
LZ3SUVYS+0:'"#+D+!P7'.87I47Q,&=11@]BM#@++4*/N+,(
M<;ZY"FCI@5!1=(E?G-L4D>>MQY]0[$(;,KFSS*R +)%AW-@F\&(&7](]47E3^#BX]"=D
MQ5#X=HGY'&Y07SA[L19=MEPA&GPN^T9[26E#52F]%IZ0XN%!IC]O* ;K'Y>&:;&Z2E6$1./1?,M^3&[[>&;K0IUS9'00LB
MR>0?Q'@5V.#8JH\-\ *14THD_>Q^@3V1M[_'V;<<2U,_H^GS$S]+ MD8AM0&
MG?;!4>!O>6\ZYV6SJ[.R&F1UL_^FN;>O3Q&OXZ8O\)!)X\V6@[0MXS^Z]D
M=DCLNZ'U-D*<^3S,1V#RYZ)J$*Q!ID(ZK4GO*#XC=/"9-TVS,)&'-'=6;GEN
M,;(/'N->2),^C6U!;YW6G+J]KRX33GB58N:I'\GK5H%Y.=?Y/6*1]-ZSZ3
M?KWSD,*0LKT8)K*5:JU6P%-R:S=!C'B^2N7O>>*=\-NT=%T!_#6F2!)C[]!?
M_ORVB$?K<@U0^20AXI$X\^C,I\,PO.7DY^)_(V^TSWH;@4O/!?.$?Q9!V?V,
M\C[:ZO-&6S5*Q4JVV:H7]H$U+]C_\$'_7KC+@T.9O\"\;BS)$_&XF@-# Q4[
M/(;6M6K>X?5^#((%LH87IA?XTB%]K'=Y3 S/R-T!XR?@T3*. =^XV6''[IL,
M6J_MUW)WO98;BT72B?T2V,Z7&N,1Z4\NY_XM,,?2D=2>SK^#\X8+7R_:C]]J
MIA0XU,'%'YLC?$E_/TDS7]2?/]'.9Z+J?V_%=K?$W:!M_.=TM,S*TL1[Y.GG
M9>9N6O8Q*?G1K.<&NG8\R_P>_=XP [W:$_#@ICXB4W$K+BMJ5U63$0W%Z'Z?W<7I_%8:*
MT_M+8( ?I/>;-8$3)MIVCW_*_1.%X+O 6&(D'>7XJ[DTJ&/8:GU257![Z'
ME6T#F<*#]<@WV%_K'0#YS_E2O5Q9?RA\_CN^C>.7!?=H(N\'$W=K7^>@HY&?
M21HY>1/;V]E[W>J"Z,4AP EQ8YEU//1P]:H]EJS08=.SMAY>[QQ>03<&[;2.VI
M^2(U2P:?FB!;9.>X?M+M79S'K@HDW:W)TE7Z0C[Y#!9Q!V#M";I"T :=7IK4
ML NTU[>;$[-"#7))8$@&0TLZ)5H=/CW132C)Z/'K@M'G]:;GN#D-AV4_6_237)-O5$][AFN5K'C^<:0V"
M:E>$^2K7\&I+5:3.OEN\ !L>RXYK!,I104(5FR,YU^1Q?6E6";\?-$JSH(VP
M\A9[G9 X>=SE@V2WY;HMT[V4X/[&L%BN?%0('Q0R[*14HU8Y@1":>H,P
&G?NLPOC3/U=W7TT
M5;<2
J7U^4]OG7);&]\
M8'E^