EX-99.1
Exhibit 99.1

WOORI BANK AND SUBSIDIARIES
CONSOLIDATED INTERIM FINANCIAL STATEMENTS
AS OF JUNE 30,
2017 AND FOR THE THREE AND SIX MONTHS ENDED JUNE 30, 2017 AND 2016
ATTACHMENT: INDEPENDENT ACCOUNTANTS’ REVIEW REPORT
WOORI BANK
|
|
|

|
|
|
|
|
Deloitte Anjin LLC |
|
|
9F., One IFC, 10, Gukjegeumyung-ro Youngdeungpo-gu, Seoul
07326, Korea |
|
|
Tel: +82 (2) 6676 1000 |
|
|
Fax: +82 (2) 6674 2114 |
|
|
www.deloitteanjin.co.kr |
INDEPENDENT ACCOUNTANTS’ REVIEW REPORT
English Translation of a Report Originally Issued in Korean on August 11, 2017
To the Shareholders and the Board of Directors of
Woori Bank
Report on the Consolidated Financial
Statements
We have reviewed the accompanying consolidated interim financial statements of Woori Bank and subsidiaries (the “Group”). The
financial statements consist of the consolidated interim statements of financial position as of June 30, 2017 and the consolidated interim statements of comprehensive income for the three and six months ended June 30, 2017 and 2016,
consolidated interim statements of changes in shareholders’ equity and consolidated interim statements of cash flows, all expressed in Korean Won, for the six months ended June 30, 2017 and 2016, respectively, and a summary of significant
accounting policies and other explanatory information.
Management’s Responsibility for the Consolidated Interim Financial Statements
The Group’s management is responsible for the preparation and fair presentation of these consolidated interim financial statements in accordance with
Korean International Financial Reporting Standards (“K-IFRS”) and for such internal control as management determines is necessary to enable the preparation of consolidated interim financial
statements that are free from material misstatement, whether due to fraud or error.
Independent Accountants’ Responsibility
Our responsibility is to express a conclusion on the accompanying consolidated interim financial statements based on our reviews.
We conducted our reviews in accordance with standards for review of consolidated interim financial statements in the Republic of Korea. A review is limited
primarily to inquiries of company personnel and analytical procedures applied to financial data, and this provides less assurance than an audit. We have not performed an audit and, accordingly, we do not express an audit opinion.
Review conclusion
Based on our reviews, nothing has come
to our attention that causes us to believe that the accompanying consolidated interim financial statements of the Group are not presented fairly, in all material respects, in accordance with K-IFRS 1034,
Interim Financial Reporting.
Deloitte refers to one or more of Deloitte Touche Tohmatsu Limited, a UK private company limited by guarantee
(“DTTL”), its network of member firms, and their related entities. DTTL and each of its member firms are legally separate and independent entities. DTTL (also referred to as “Deloitte Global”) does not provide services to
clients. Please see www.deloitte.com/kr/about to learn more about our global network of member firms.
© 2017. For information, contact Deloitte Anjin
LLC

Others
We audited the
consolidated interim statement of financial position as of December 31, 2016, and the related consolidated interim statements of comprehensive income, changes in shareholders’ equity and cash flows for the year ended December 31, 2016
(not presented in the accompanying consolidated financial statements, all expressed in Korean Won), in accordance with auditing standards generally accepted in the Republic of Korea. We expressed an unqualified opinion in our independent
auditors’ report dated on March 3, 2017. The consolidated statement of financial position as of December 31, 2016 presented as a comparative purpose in the accompanying financial statements does not differ, in all material respects, from
the audited consolidated statement of financial position as of December 31, 2016.
Accounting principles and review standards and their application
in practice vary among countries. The accompanying consolidated financial statements are not intended to present the financial position, results of operations and cash flows in accordance with accounting principles and practices generally accepted
in countries other than the Republic of Korea. In addition, the procedures and practices utilized in the Republic of Korea to review such financial statements may differ from those generally accepted and applied in other countries. Accordingly, this
report and the accompanying consolidated financial statements are for use by those knowledgeable about Korean accounting procedures and review standards and their application in practice.

August 11, 2017
Notice to Readers
This report is
effective as of August 11, 2017, the accountants’ review report date. Certain subsequent events or circumstances may have occurred between the accountants’ review report date and the time the accountants’ review report is read.
Such events or circumstances could significantly affect the consolidated financial statements and may result in modifications to the accountants’ review report.
WOORI BANK AND SUBSIDIARIES
CONSOLIDATED INTERIM FINANCIAL STATEMENTS
AS OF JUNE 30,
2017 AND FOR THE THREE AND SIX MONTHS ENDED JUNE 30, 2017 AND 2016
The accompanying consolidated interim financial statements including all footnote
disclosures were prepared by and are the responsibility of the Group.
Kwang Goo Lee
President and Chief Executive Officer
|
|
|
|
|
| Main Office Address: |
|
(Road Name Address) 51, Sogong-ro, Jung-gu, Seoul |
|
|
|
|
(Phone Number) 02-2002-3000 |
|
|
WOORI BANK AND SUBSIDIARIES
CONSOLIDATED INTERIM STATEMENTS OF FINANCIAL POSITION
AS OF JUNE 30, 2017 AND DECEMBER 31, 2016
|
|
|
|
|
|
|
|
|
| |
|
June 30,
2017 |
|
|
December 31,
2016 |
|
| |
|
(Korean Won in millions) |
|
| ASSETS |
|
|
|
|
|
|
|
|
| Cash and cash equivalents (Note 6) |
|
|
7,377,124 |
|
|
|
7,591,324 |
|
| Financial assets at fair value through profit or loss (Notes 4,7,11,12,18 and 26) |
|
|
4,554,375 |
|
|
|
5,650,724 |
|
| Available-for-sale
financial assets (Notes 4,8,11,12 and 18) |
|
|
19,623,170 |
|
|
|
20,817,583 |
|
| Held-to-maturity
financial assets (Notes 4,9,11,12 and 18) |
|
|
15,144,766 |
|
|
|
13,910,251 |
|
| Loans and receivables (Notes 4,10,11,12,18 and 45) |
|
|
265,148,624 |
|
|
|
258,392,633 |
|
| Investments in joint ventures and associates (Note 13) |
|
|
370,799 |
|
|
|
439,012 |
|
| Investment properties (Note 14) |
|
|
359,937 |
|
|
|
358,497 |
|
| Premises and equipment (Notes 15 and 18) |
|
|
2,459,176 |
|
|
|
2,458,025 |
|
| Intangible assets and goodwill (Note 16) |
|
|
506,882 |
|
|
|
483,739 |
|
| Assets held for sale (Note 17) |
|
|
16,439 |
|
|
|
2,342 |
|
| Current tax assets |
|
|
3,179 |
|
|
|
6,229 |
|
| Deferred tax assets |
|
|
225,330 |
|
|
|
232,007 |
|
| Derivative assets (Notes 4,11,12 and 26) |
|
|
140,176 |
|
|
|
140,577 |
|
| Net defined benefit assets (Note 24) |
|
|
9,469 |
|
|
|
70,938 |
|
| Other assets (Notes 19 and 45) |
|
|
125,814 |
|
|
|
128,846 |
|
|
|
|
|
|
|
|
|
|
| Total assets |
|
|
316,065,260 |
|
|
|
310,682,727 |
|
|
|
|
|
|
|
|
|
|
| LIABILITIES |
|
|
|
|
|
|
|
|
| Financial liabilities at fair value through profit or loss (Notes 4,11,12,20 and 26) |
|
|
2,518,897 |
|
|
|
3,803,358 |
|
| Deposits due to customers (Notes 4,11,21 and 45) |
|
|
226,200,577 |
|
|
|
221,020,411 |
|
| Borrowings (Notes 4,11,12 and 22) |
|
|
15,679,945 |
|
|
|
18,769,515 |
|
| Debentures (Notes 4,11 and 22) |
|
|
25,649,132 |
|
|
|
23,565,449 |
|
| Provisions (Notes 23 and 44) |
|
|
381,030 |
|
|
|
428,477 |
|
| Net defined benefit liability (Note 24) |
|
|
24,886 |
|
|
|
64,666 |
|
| Current tax liabilities |
|
|
207,509 |
|
|
|
171,192 |
|
| Deferred tax liabilities |
|
|
29,235 |
|
|
|
22,023 |
|
| Derivative liabilities (Notes 4,11,12 and 26) |
|
|
29,229 |
|
|
|
7,221 |
|
| Other financial liabilities (Notes 4,11,12, 25 and 45) |
|
|
24,650,846 |
|
|
|
21,985,086 |
|
| Other liabilities (Notes 25 and 45) |
|
|
273,506 |
|
|
|
299,376 |
|
|
|
|
|
|
|
|
|
|
| Total liabilities |
|
|
295,644,792 |
|
|
|
290,136,774 |
|
|
|
|
|
|
|
|
|
|
(Continued)
WOORI BANK AND SUBSIDIARIES
CONSOLIDATED INTERIM STATEMENTS OF FINANCIAL POSITION
AS OF JUNE 30, 2017 AND DECEMBER 31, 2016 (CONTINUED)
|
|
|
|
|
|
|
|
|
| |
|
June 30,
2017 |
|
|
December 31,
2016 |
|
| |
|
(Korean Won in millions) |
|
| EQUITY |
|
|
|
|
|
|
|
|
| Owners’ equity: |
|
|
20,256,349 |
|
|
|
20,386,160 |
|
| Capital stock (Note 28) |
|
|
3,381,392 |
|
|
|
3,381,392 |
|
| Hybrid securities (Note 29) |
|
|
3,017,888 |
|
|
|
3,574,896 |
|
| Capital surplus (Note 28) |
|
|
286,074 |
|
|
|
286,331 |
|
| Other equity (Note 30) |
|
|
(1,778,801 |
) |
|
|
(1,468,025 |
) |
| Retained earnings (Notes 31 and 32) |
|
|
|
|
|
|
|
|
| (Regulatory reserve for credit loss as of June 30, 2017 and December 31, 2016 is
2,438,191 million Won and 2,255,252 million Won, respectively |
|
|
|
|
|
|
|
|
| Regulatory reserve for credit loss to be reserved as of June 30, 2017 and December 31,
2016 is 49,961 million Won and 182,939 million Won, respectively |
|
|
|
|
|
|
|
|
| Planned provision of regulatory reserve for credit loss as of June 30, 2017 and
December 31, 2016 is 49,961 million Won and 182,939 million Won, respectively) |
|
|
15,349,796 |
|
|
|
14,611,566 |
|
| Non-controlling interests |
|
|
164,119 |
|
|
|
159,793 |
|
|
|
|
|
|
|
|
|
|
| Total equity |
|
|
20,420,468 |
|
|
|
20,545,953 |
|
|
|
|
|
|
|
|
|
|
| Total liabilities and equity |
|
|
316,065,260 |
|
|
|
310,682,727 |
|
|
|
|
|
|
|
|
|
|
See accompanying notes
WOORI BANK AND SUBSIDIARIES
CONSOLIDATED INTERIM STATEMENTS OF COMPREHENSIVE INCOME
FOR THE THREE MONTHS AND SIX MONTHS ENDED JUNE 30, 2017 AND 2016
|
|
|
|
|
|
|
|
|
|
|
|
|
|
|
|
|
| |
|
2017 |
|
|
2016 |
|
| |
|
Three months
ended June 30 |
|
|
Six months
ended June 30 |
|
|
Three months
ended June 30 |
|
|
Six months
ended June 30 |
|
| |
|
(Korean Won in millions, except per share data) |
|
| Interest income |
|
|
2,105,808 |
|
|
|
4,189,584 |
|
|
|
2,142,054 |
|
|
|
4,293,562 |
|
| Interest expense |
|
|
818,232 |
|
|
|
1,639,264 |
|
|
|
896,957 |
|
|
|
1,804,804 |
|
|
|
|
|
|
|
|
|
|
|
|
|
|
|
|
|
|
| Net interest income (Notes 34 and 45) |
|
|
1,287,576 |
|
|
|
2,550,320 |
|
|
|
1,245,097 |
|
|
|
2,488,758 |
|
| Fees and commissions income |
|
|
506,281 |
|
|
|
1,013,893 |
|
|
|
457,189 |
|
|
|
906,830 |
|
| Fees and commissions expense |
|
|
243,533 |
|
|
|
476,193 |
|
|
|
220,918 |
|
|
|
438,824 |
|
|
|
|
|
|
|
|
|
|
|
|
|
|
|
|
|
|
| Net fees and commissions income (Notes 35 and 45) |
|
|
262,748 |
|
|
|
537,700 |
|
|
|
236,271 |
|
|
|
468,006 |
|
| Dividend Income (Note 36) |
|
|
19,617 |
|
|
|
59,445 |
|
|
|
53,081 |
|
|
|
120,399 |
|
| Net gain (loss) on financial instruments at fair value through profit or loss (Note 37) |
|
|
12,066 |
|
|
|
(146,409 |
) |
|
|
116,863 |
|
|
|
58,596 |
|
| Net gain on
available-for-sale financial assets (Note 38) |
|
|
88,387 |
|
|
|
104,172 |
|
|
|
19,596 |
|
|
|
28,883 |
|
| Impairment losses due to credit loss (Notes 39 and 45) |
|
|
(204,486 |
) |
|
|
(283,763 |
) |
|
|
(250,534 |
) |
|
|
(430,744 |
) |
| General and administrative expenses (Notes 40 and 45) |
|
|
(784,157 |
) |
|
|
(1,538,427 |
) |
|
|
(872,109 |
) |
|
|
(1,644,552 |
) |
| Other net operating income (expenses) (Notes 40 and 45) |
|
|
(77,267 |
) |
|
|
201,190 |
|
|
|
(155,416 |
) |
|
|
(140,243 |
) |
|
|
|
|
|
|
|
|
|
|
|
|
|
|
|
|
|
| Operating income |
|
|
604,484 |
|
|
|
1,484,228 |
|
|
|
392,849 |
|
|
|
949,103 |
|
| Share of losses of joint ventures and associates (Note 13) |
|
|
(14,863 |
) |
|
|
(64,278 |
) |
|
|
(11,594 |
) |
|
|
(11,644 |
) |
| Net other non-operating income (loss) |
|
|
11,697 |
|
|
|
9,998 |
|
|
|
(35,495 |
) |
|
|
(26,338 |
) |
|
|
|
|
|
|
|
|
|
|
|
|
|
|
|
|
|
| Non-operating loss (Note 41) |
|
|
(3,166 |
) |
|
|
(54,280 |
) |
|
|
(47,089 |
) |
|
|
(37,982 |
) |
|
|
|
|
|
|
|
|
|
|
|
|
|
|
|
|
|
| Net income before income tax expense |
|
|
601,318 |
|
|
|
1,429,948 |
|
|
|
345,760 |
|
|
|
911,121 |
|
| Income tax expense (Note 42) |
|
|
135,034 |
|
|
|
320,933 |
|
|
|
34,477 |
|
|
|
153,334 |
|
|
|
|
|
|
|
|
|
|
|
|
|
|
|
|
|
|
| Net income |
|
|
|
|
|
|
|
|
|
|
|
|
|
|
|
|
| (Net income after the provision of regulatory reserve for credit loss for the six months ended
June 30, 2017 and 2016 are 1,059,054 million Won and 744,961 million Won, respectively, and net income after the provision of regulatory reserve for credit loss for the three months ended June 30, 2017 and 2016 are
417,872 million Won and 316,489 million Won, respectively) (Note 32) |
|
|
466,284 |
|
|
|
1,109,015 |
|
|
|
311,283 |
|
|
|
757,787 |
|
|
|
|
|
|
|
|
|
|
|
|
|
|
|
|
|
|
| Remeasurement gain (loss) related to defined benefit plan |
|
|
16,840 |
|
|
|
(9,677 |
) |
|
|
(11,504 |
) |
|
|
(44,667 |
) |
|
|
|
|
|
|
|
|
|
|
|
|
|
|
|
|
|
| Items that will not be reclassified to profit or loss |
|
|
16,840 |
|
|
|
(9,677 |
) |
|
|
(11,504 |
) |
|
|
(44,667 |
) |
| Gain (loss) on
available-for-sale financial assets |
|
|
(41,680 |
) |
|
|
(28,706 |
) |
|
|
(17,811 |
) |
|
|
80,223 |
|
| Share of other comprehensive gain (loss) of joint ventures and associates |
|
|
(197 |
) |
|
|
1,507 |
|
|
|
3,145 |
|
|
|
(233 |
) |
| Gain (loss) on foreign currency translation for foreign operations |
|
|
31,450 |
|
|
|
(69,010 |
) |
|
|
8,768 |
|
|
|
(2,649 |
) |
| Gain (loss) on valuation of cash flow hedge |
|
|
(673 |
) |
|
|
(1,526 |
) |
|
|
253 |
|
|
|
10,371 |
|
|
|
|
|
|
|
|
|
|
|
|
|
|
|
|
|
|
| Items that may be reclassified to profit or loss |
|
|
(11,100 |
) |
|
|
(97,735 |
) |
|
|
(5,645 |
) |
|
|
87,712 |
|
| Other comprehensive income (loss), net of tax |
|
|
5,740 |
|
|
|
(107,412 |
) |
|
|
(17,149 |
) |
|
|
43,045 |
|
|
|
|
|
|
|
|
|
|
|
|
|
|
|
|
|
|
| Total comprehensive income |
|
|
472,024 |
|
|
|
1,001,603 |
|
|
|
294,134 |
|
|
|
800,832 |
|
|
|
|
|
|
|
|
|
|
|
|
|
|
|
|
|
|
| Net income attributable to: |
|
|
|
|
|
|
|
|
|
|
|
|
|
|
|
|
| Net income attributable to owners |
|
|
460,888 |
|
|
|
1,098,361 |
|
|
|
306,974 |
|
|
|
750,266 |
|
| Net income attributable to non-controlling
interests |
|
|
5,396 |
|
|
|
10,654 |
|
|
|
4,309 |
|
|
|
7,521 |
|
| Total comprehensive income attributable to: |
|
|
|
|
|
|
|
|
|
|
|
|
|
|
|
|
| Comprehensive income attributable to owners |
|
|
464,129 |
|
|
|
995,742 |
|
|
|
287,740 |
|
|
|
788,668 |
|
| Comprehensive income attributable to non-controlling
interests |
|
|
7,895 |
|
|
|
5,861 |
|
|
|
6,394 |
|
|
|
12,164 |
|
| Basic and diluted earnings per share (In Korean Won) (Note 43) |
|
|
623 |
|
|
|
1,497 |
|
|
|
382 |
|
|
|
966 |
|
See accompanying notes
WOORI BANK AND SUBSIDIARIES
CONSOLIDATED INTERIM STATEMENTS OF CHANGES IN EQUITY
FOR THE SIX MONTHS ENDED JUNE 30, 2017 AND 2016
|
|
|
|
|
|
|
|
|
|
|
|
|
|
|
|
|
|
|
|
|
|
|
|
|
|
|
|
|
|
|
|
|
| |
|
Capital
Stock |
|
|
Hybrid
securities |
|
|
Capital
surplus |
|
|
Other
Equity |
|
|
Retained
earnings |
|
|
Controlling
interests |
|
|
Non-
controlling
interests |
|
|
Total
equity |
|
| |
|
(Korean Won in millions) |
|
| January 1, 2016 |
|
|
3,381,392 |
|
|
|
3,334,002 |
|
|
|
294,259 |
|
|
|
(1,547,303 |
) |
|
|
13,726,122 |
|
|
|
19,188,472 |
|
|
|
121,443 |
|
|
|
19,309,915 |
|
| Net income |
|
|
— |
|
|
|
— |
|
|
|
— |
|
|
|
— |
|
|
|
750,266 |
|
|
|
750,266 |
|
|
|
7,521 |
|
|
|
757,787 |
|
| Dividends to common stocks |
|
|
— |
|
|
|
— |
|
|
|
— |
|
|
|
— |
|
|
|
(168,317 |
) |
|
|
(168,317 |
) |
|
|
(1,265 |
) |
|
|
(169,582 |
) |
| Gain on valuation of
available-for-sale financial assets |
|
|
— |
|
|
|
— |
|
|
|
— |
|
|
|
79,651 |
|
|
|
— |
|
|
|
79,651 |
|
|
|
572 |
|
|
|
80,223 |
|
| Changes in equity of joint ventures and associates |
|
|
— |
|
|
|
— |
|
|
|
— |
|
|
|
(233 |
) |
|
|
— |
|
|
|
(233 |
) |
|
|
— |
|
|
|
(233 |
) |
| Gain (loss) on foreign currency translation of foreign operations |
|
|
— |
|
|
|
— |
|
|
|
— |
|
|
|
(6,723 |
) |
|
|
— |
|
|
|
(6,723 |
) |
|
|
4,074 |
|
|
|
(2,649 |
) |
| Gain on valuation of cash flow hedge |
|
|
— |
|
|
|
— |
|
|
|
— |
|
|
|
10,371 |
|
|
|
— |
|
|
|
10,371 |
|
|
|
— |
|
|
|
10,371 |
|
| Remeasurement loss related to defined benefit plan |
|
|
— |
|
|
|
— |
|
|
|
— |
|
|
|
(44,664 |
) |
|
|
— |
|
|
|
(44,664 |
) |
|
|
(3 |
) |
|
|
(44,667 |
) |
| Dividends to hybrid securities |
|
|
— |
|
|
|
— |
|
|
|
— |
|
|
|
— |
|
|
|
(100,236 |
) |
|
|
(100,236 |
) |
|
|
— |
|
|
|
(100,236 |
) |
|
|
|
|
|
|
|
|
|
|
|
|
|
|
|
|
|
|
|
|
|
|
|
|
|
|
|
|
|
|
|
|
|
| June 30, 2016 |
|
|
3,381,392 |
|
|
|
3,334,002 |
|
|
|
294,259 |
|
|
|
(1,508,901 |
) |
|
|
14,207,835 |
|
|
|
19,708,587 |
|
|
|
132,342 |
|
|
|
19,840,929 |
|
|
|
|
|
|
|
|
|
|
|
|
|
|
|
|
|
|
|
|
|
|
|
|
|
|
|
|
|
|
|
|
|
|
| January 1, 2017 |
|
|
3,381,392 |
|
|
|
3,574,896 |
|
|
|
286,331 |
|
|
|
(1,468,025 |
) |
|
|
14,611,566 |
|
|
|
20,386,160 |
|
|
|
159,793 |
|
|
|
20,545,953 |
|
| Net income |
|
|
— |
|
|
|
— |
|
|
|
— |
|
|
|
— |
|
|
|
1,098,361 |
|
|
|
1,098,361 |
|
|
|
10,654 |
|
|
|
1,109,015 |
|
| Dividends to common stocks |
|
|
— |
|
|
|
— |
|
|
|
— |
|
|
|
— |
|
|
|
(269,308 |
) |
|
|
(269,308 |
) |
|
|
(1,534 |
) |
|
|
(270,842 |
) |
| Capital increase of subsidiaries |
|
|
— |
|
|
|
— |
|
|
|
(257 |
) |
|
|
— |
|
|
|
— |
|
|
|
(257 |
) |
|
|
— |
|
|
|
(257 |
) |
| Gain (loss) on valuation of
available-for-sale financial assets |
|
|
— |
|
|
|
— |
|
|
|
— |
|
|
|
(29,033 |
) |
|
|
— |
|
|
|
(29,033 |
) |
|
|
327 |
|
|
|
(28,706 |
) |
| Changes in equity of joint ventures and associates |
|
|
— |
|
|
|
— |
|
|
|
— |
|
|
|
1,507 |
|
|
|
— |
|
|
|
1,507 |
|
|
|
— |
|
|
|
1,507 |
|
| Loss on foreign currency translation of foreign operations |
|
|
— |
|
|
|
— |
|
|
|
— |
|
|
|
(63,944 |
) |
|
|
— |
|
|
|
(63,944 |
) |
|
|
(5,066 |
) |
|
|
(69,010 |
) |
| Loss on valuation of cash flow hedge |
|
|
— |
|
|
|
— |
|
|
|
— |
|
|
|
(1,526 |
) |
|
|
— |
|
|
|
(1,526 |
) |
|
|
— |
|
|
|
(1,526 |
) |
| Remeasurement loss related to defined benefit plan |
|
|
— |
|
|
|
— |
|
|
|
— |
|
|
|
(9,622 |
) |
|
|
— |
|
|
|
(9,622 |
) |
|
|
(55 |
) |
|
|
(9,677 |
) |
| Dividends to hybrid securities |
|
|
— |
|
|
|
— |
|
|
|
— |
|
|
|
— |
|
|
|
(90,823 |
) |
|
|
(90,823 |
) |
|
|
— |
|
|
|
(90,823 |
) |
| Issuance of hybrid securities |
|
|
— |
|
|
|
559,565 |
|
|
|
— |
|
|
|
— |
|
|
|
— |
|
|
|
559,565 |
|
|
|
— |
|
|
|
559,565 |
|
| Redemption of hybrid securities |
|
|
— |
|
|
|
(1,116,573 |
) |
|
|
— |
|
|
|
(208,158 |
) |
|
|
— |
|
|
|
(1,324,731 |
) |
|
|
— |
|
|
|
(1,324,731 |
) |
|
|
|
|
|
|
|
|
|
|
|
|
|
|
|
|
|
|
|
|
|
|
|
|
|
|
|
|
|
|
|
|
|
| June 30, 2017 |
|
|
3,381,392 |
|
|
|
3,017,888 |
|
|
|
286,074 |
|
|
|
(1,778,801 |
) |
|
|
15,349,796 |
|
|
|
20,256,349 |
|
|
|
164,119 |
|
|
|
20,420,468 |
|
|
|
|
|
|
|
|
|
|
|
|
|
|
|
|
|
|
|
|
|
|
|
|
|
|
|
|
|
|
|
|
|
|
See accompanying notes
WOORI BANK AND SUBSIDIARIES
CONSOLIDATED INTERIM STATEMENTS OF CASH FLOWS
FOR THE SIX MONTHS ENDED JUNE 30, 2017 AND 2016
|
|
|
|
|
|
|
|
|
| |
|
For the six months ended June 30 |
|
| |
|
2017 |
|
|
2016 |
|
| |
|
(Korean Won in millions) |
|
| Cash flows from operating activities: |
|
|
|
|
|
|
|
|
| Net income |
|
|
1,109,015 |
|
|
|
757,787 |
|
| Adjustments: |
|
|
|
|
|
|
|
|
| Income tax expense |
|
|
320,933 |
|
|
|
153,334 |
|
| Interest income |
|
|
(4,189,584 |
) |
|
|
(4,293,562 |
) |
| Interest expense |
|
|
1,639,264 |
|
|
|
1,804,804 |
|
| Dividend income |
|
|
(59,445 |
) |
|
|
(120,399 |
) |
|
|
|
|
|
|
|
|
|
|
|
|
(2,288,832 |
) |
|
|
(2,455,823 |
) |
|
|
|
|
|
|
|
|
|
| Additions of expenses not involving cash outflows: |
|
|
|
|
|
|
|
|
| Impairment losses due to credit loss |
|
|
283,763 |
|
|
|
430,744 |
|
| Share of losses of investments in joint ventures and associates |
|
|
67,594 |
|
|
|
19,916 |
|
| Loss on transaction of derivatives / valuation of derivatives (hedging) |
|
|
31,131 |
|
|
|
19,014 |
|
| Loss on fair value hedged items |
|
|
15,846 |
|
|
|
118,700 |
|
| Provision for guarantee and loan commitment and others |
|
|
35,665 |
|
|
|
12,209 |
|
| Retirement benefits |
|
|
71,902 |
|
|
|
75,822 |
|
| Depreciation and amortization of premises and equipment, intangible assets and investment
properties |
|
|
121,361 |
|
|
|
131,451 |
|
| Loss on disposal of investments in joint ventures and associates |
|
|
27,730 |
|
|
|
15,060 |
|
| Loss on disposal of premises and equipment and other assets |
|
|
608 |
|
|
|
5,887 |
|
| Impairment loss on premises and equipment and other assets |
|
|
160 |
|
|
|
343 |
|
|
|
|
|
|
|
|
|
|
|
|
|
655,760 |
|
|
|
829,146 |
|
|
|
|
|
|
|
|
|
|
| Deduction of revenues not involving cash inflows: |
|
|
|
|
|
|
|
|
| Gain on valuation of financial instruments at fair value through profit or loss |
|
|
7,859 |
|
|
|
198,962 |
|
| Gain on
available-for-sale financial assets |
|
|
104,172 |
|
|
|
28,883 |
|
| Gain on valuation of investments in subsidiaries and associates |
|
|
3,316 |
|
|
|
8,272 |
|
| Gain on transaction / valuation of derivative instruments (hedging) |
|
|
11,656 |
|
|
|
111,505 |
|
| Gain on fair value hedged items |
|
|
11,860 |
|
|
|
18,113 |
|
| Reversal of provisions and others |
|
|
1,285 |
|
|
|
619 |
|
| Gain on disposal of investments in joint ventures and associates |
|
|
32,886 |
|
|
|
1,199 |
|
| Gain on disposal of premises and equipment and other assets |
|
|
1,675 |
|
|
|
347 |
|
| Reversal of impairment loss on premises and equipment and other assets |
|
|
32 |
|
|
|
2,585 |
|
|
|
|
|
|
|
|
|
|
|
|
|
174,741 |
|
|
|
370,485 |
|
|
|
|
|
|
|
|
|
|
| Changes in operating assets and liabilities: |
|
|
|
|
|
|
|
|
| Financial instruments at fair value through profit or loss |
|
|
(187,086 |
) |
|
|
28,810 |
|
| Loans and receivables |
|
|
(7,908,486 |
) |
|
|
(16,208,315 |
) |
| Other assets |
|
|
(995 |
) |
|
|
(81,412 |
) |
| Deposits due to customers |
|
|
5,182,735 |
|
|
|
9,351,825 |
|
| Provision for guarantee and loan commitment and others |
|
|
(98,114 |
) |
|
|
(49,221 |
) |
| Net defined benefit liability |
|
|
(19,799 |
) |
|
|
(192,222 |
) |
| Other financial liabilities |
|
|
2,790,480 |
|
|
|
6,502,752 |
|
| Other liabilities |
|
|
(29,837 |
) |
|
|
2,090 |
|
|
|
|
|
|
|
|
|
|
|
|
|
(271,102 |
) |
|
|
(645,693 |
) |
|
|
|
|
|
|
|
|
|
(Continued)
WOORI BANK AND SUBSIDIARIES
CONSOLIDATED INTERIM STATEMENTS OF CASH FLOWS
FOR THE SIX MONTHS ENDED JUNE 30, 2017 AND 2016 (CONTINUED)
|
|
|
|
|
|
|
|
|
| |
|
For the six months ended June 30 |
|
| |
|
2017 |
|
|
2016 |
|
| |
|
(Korean Won in millions) |
|
| Cash received from (paid for) operating activities: |
|
|
|
|
|
|
|
|
| Interest income received |
|
|
4,281,385 |
|
|
|
4,293,461 |
|
| Interest expense paid |
|
|
(1,749,917 |
) |
|
|
(1,821,466 |
) |
| Dividends received |
|
|
62,014 |
|
|
|
120,716 |
|
| Income tax paid |
|
|
(236,246 |
) |
|
|
(153,852 |
) |
|
|
|
|
|
|
|
|
|
| Net cash provided by operating activities |
|
|
1,387,336 |
|
|
|
553,791 |
|
|
|
|
|
|
|
|
|
|
| Cash flows from investing activities: |
|
|
|
|
|
|
|
|
| Cash in-flows from investing activities: |
|
|
|
|
|
|
|
|
| Disposal of
available-for-sale financial assets |
|
|
13,312,489 |
|
|
|
9,918,185 |
|
| Redemption of
held-to-maturity financial assets |
|
|
4,665,209 |
|
|
|
3,863,816 |
|
| Decrease in investments in joint ventures and associates |
|
|
62,974 |
|
|
|
51,355 |
|
| Disposal of Investment Properties |
|
|
162 |
|
|
|
— |
|
| Disposal of premises and equipment |
|
|
1,042 |
|
|
|
1 |
|
| Disposal of intangible assets |
|
|
933 |
|
|
|
2,869 |
|
| Disposal of assets held for sale |
|
|
6,488 |
|
|
|
8,082 |
|
|
|
|
|
|
|
|
|
|
|
|
|
18,049,297 |
|
|
|
13,844,308 |
|
|
|
|
|
|
|
|
|
|
| Cash out-flows from investing activities: |
|
|
|
|
|
|
|
|
| Acquisition of
available-for-sale financial assets |
|
|
11,268,756 |
|
|
|
12,020,787 |
|
| Acquisition of
held-to-maturity financial assets |
|
|
5,945,147 |
|
|
|
4,084,288 |
|
| Increase in investments in joint ventures and associates |
|
|
13,485 |
|
|
|
800 |
|
| Acquisition of investment properties |
|
|
1,221 |
|
|
|
3,133 |
|
| Acquisition of premises and equipment |
|
|
68,596 |
|
|
|
47,473 |
|
| Acquisition of intangible assets |
|
|
97,977 |
|
|
|
50,228 |
|
|
|
|
|
|
|
|
|
|
|
|
|
17,395,182 |
|
|
|
16,206,709 |
|
|
|
|
|
|
|
|
|
|
| Net cash provided by (used in) investing activities |
|
|
654,115 |
|
|
|
(2,362,401 |
) |
|
|
|
|
|
|
|
|
|
| Cash flows from financing activities: |
|
|
|
|
|
|
|
|
| Cash in-flows from financing activities: |
|
|
|
|
|
|
|
|
| Increase in borrowings |
|
|
4,349,952 |
|
|
|
4,698,171 |
|
| Issuance of debentures |
|
|
10,299,507 |
|
|
|
9,185,999 |
|
| Issuance of hybrid securities |
|
|
559,565 |
|
|
|
— |
|
|
|
|
|
|
|
|
|
|
|
|
|
15,209,024 |
|
|
|
13,884,170 |
|
|
|
|
|
|
|
|
|
|
| Cash out-flows from financing activities: |
|
|
|
|
|
|
|
|
| Repayment of borrowings |
|
|
7,432,992 |
|
|
|
5,389,067 |
|
| Repayment of debentures |
|
|
8,223,263 |
|
|
|
7,586,208 |
|
| Payment of dividends |
|
|
269,308 |
|
|
|
168,317 |
|
| Dividends paid on hybrid securities |
|
|
100,627 |
|
|
|
100,583 |
|
| Redemption of hybrid securities |
|
|
1,323,400 |
|
|
|
— |
|
| Dividends paid on non-controlling interests |
|
|
1,534 |
|
|
|
1,265 |
|
|
|
|
|
|
|
|
|
|
|
|
|
17,351,124 |
|
|
|
13,245,440 |
|
|
|
|
|
|
|
|
|
|
| Net cash provided by (used in) financing activities |
|
|
(2,142,100 |
) |
|
|
638,730 |
|
|
|
|
|
|
|
|
|
|
| Net decrease in cash and cash equivalents |
|
|
(100,649 |
) |
|
|
(1,169,880 |
) |
| Cash and cash equivalents, beginning of the period |
|
|
7,591,324 |
|
|
|
6,644,055 |
|
| Effects of exchange rate changes on cash and cash equivalents |
|
|
(113,551 |
) |
|
|
(101,082 |
) |
|
|
|
|
|
|
|
|
|
| Cash and cash equivalents, end of the period (Note 6) |
|
|
7,377,124 |
|
|
|
5,373,093 |
|
|
|
|
|
|
|
|
|
|
See accompanying notes
WOORI BANK AND SUBSIDIARIES
NOTES TO CONSOLIDATED INTERIM FINANCIAL STATEMENTS
AS OF JUNE 30, 2017 AND FOR THE THREE MONTHS AND THE SIX MONTHS ENDED
JUNE 30, 2017 AND 2016
| (1) |
Summary of the parent company |
Woori Bank (hereinafter referred to the “Bank”), which is a
controlling entity in accordance with Korean International Financial Reporting Standards (“K-IFRS”) 1110 – Consolidated Financial Statements, was established in 1899 and is engaged in the
commercial banking business under the Banking Law, trust business under the Financial Investment Services and Capital Market Act, and foreign currencies exchange business with approval from The Bank of Korea (“BOK”) and the Ministry of
Finance and Economy (“MOFE”).
Previously, Woori Finance Holdings Co., Ltd., the former holding company of Woori Financial Group, established on
March 27, 2001 held a 100% ownership of the Bank. Effective November 1, 2014, Woori Finance Holdings Co., Ltd. completed its merger with and into Woori Bank, its wholly-owned subsidiary, as contemplated by the merger agreement dated
July 28, 2014, by and between Woori Finance Holdings Co., Ltd. and Woori Bank. Accordingly, the shares of the Bank, 597 million shares, prior to the merger, were reduced to nil in accordance with capital reduction procedure, and then, in
accordance with the merger ratio, the Bank newly issued 676 million shares. As a result, as of June 30, 2017, the common stock of the Bank amounts, expressed in Korean Won (the “KRW” or “Won”), to 3,381,392 million
Won.
During the year ended December 31, 2016, the Korea Deposit Insurance Corporation (“KDIC”), the majority shareholder of the Bank, sold
its 187 million shares in the Bank in accordance with the contract of “Disposal of Woori Bank’s shares to Oligopolistic Shareholders”. In addition to the sale, during the three months ended June 30, 2017, KDIC sold
additional 30 million shares. As of June 30, 2017 and December 31, 2016, KDIC held 128 million shares and 158 million shares (18.96% and 23.37% ownership interest) respectively, of the Bank’s shares issued.
On June 24, 2002, Woori Finance Holdings Co., Ltd. listed its common shares on the Korea Exchange through public offering. In addition, on
September 29, 2003, the holding company registered with the Securities and Exchange Commission in the United States of America and, on the same day, listed its American Depositary Shares on the New York Stock Exchange. As a result of such
merger, the Bank incorporated Woori Card Co., Ltd., Woori Investment Bank Co., Ltd., Woori FIS Co., Ltd., Woori Private Equity Asset Management Co., Ltd., and Woori Finance Research Institute Co., Ltd. as its subsidiaries.
The head office of the Bank is located in 51, Sogong-ro, Jung Gu, Seoul, Korea. The Bank has 887 branches and offices
in Korea, and 22 branches and offices overseas as of June 30, 2017.
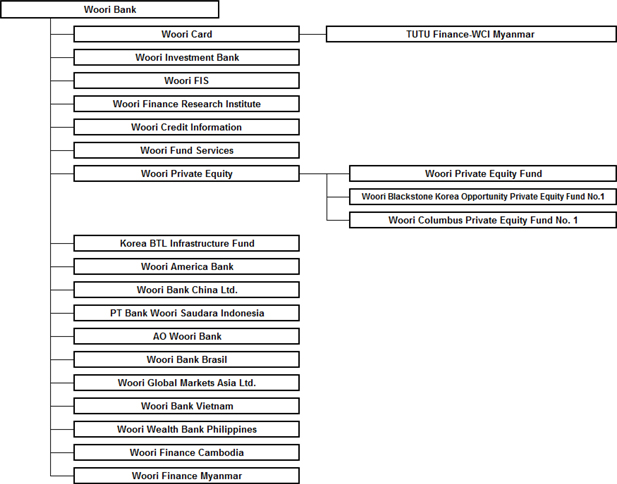
| (2) |
The consolidated financial statements for Woori Bank and its subsidiaries (the “Group”) include the following subsidiaries: |
|
|
|
|
|
|
|
|
|
|
|
|
|
|
|
|
|
|
|
|
|
| |
|
|
|
|
Percentage of ownership
(%) |
|
|
Location |
|
|
Financial
statements
as of |
|
| Subsidiaries |
|
Main business |
|
|
June 30,
2017 |
|
|
December 31,
2016 |
|
|
|
| Woori Bank: |
|
|
|
|
|
|
|
|
|
|
|
|
|
|
|
|
|
|
|
|
| Woori FIS Co., Ltd. |
|
|
System software development &
maintenance |
|
|
|
100.0 |
|
|
|
100.0 |
|
|
|
Korea |
|
|
|
June 30 |
|
| Woori Private Equity Asset Management Co., Ltd., |
|
|
Finance |
|
|
|
100.0 |
|
|
|
100.0 |
|
|
|
Korea |
|
|
|
June 30 |
|
| Woori Finance Research Institute Co., Ltd. |
|
|
Other service business |
|
|
|
100.0 |
|
|
|
100.0 |
|
|
|
Korea |
|
|
|
June 30 |
|
| Woori Card Co., Ltd. |
|
|
Finance |
|
|
|
100.0 |
|
|
|
100.0 |
|
|
|
Korea |
|
|
|
June 30 |
|
| Woori Investment Bank Co., Ltd. |
|
|
Other credit finance business |
|
|
|
58.2 |
|
|
|
58.2 |
|
|
|
Korea |
|
|
|
June 30 |
|
| Woori Credit Information Co., Ltd. |
|
|
Credit information |
|
|
|
100.0 |
|
|
|
100.0 |
|
|
|
Korea |
|
|
|
June 30 |
|
| Woori America Bank |
|
|
Finance |
|
|
|
100.0 |
|
|
|
100.0 |
|
|
|
U.S.A |
|
|
|
June 30 |
|
| Woori Global Markets Asia Limited |
|
|
” |
|
|
|
100.0 |
|
|
|
100.0 |
|
|
|
Hong Kong |
|
|
|
June 30 |
|
|
|
|
|
|
|
|
|
|
|
|
|
|
|
|
|
|
| |
|
|
|
Percentage of ownership
(%) |
|
|
Location |
|
Financial
statements
as of |
|
| Subsidiaries |
|
Main business |
|
June 30,
2017 |
|
|
December 31,
2016 |
|
|
|
| Woori Bank (China) Limited |
|
Finance |
|
|
100.0 |
|
|
|
100.0 |
|
|
China |
|
|
June 30 |
|
| AO Woori Bank |
|
” |
|
|
100.0 |
|
|
|
100.0 |
|
|
Russia |
|
|
June 30 |
|
| PT Bank Woori Saudara Indonesia 1906 Tbk |
|
” |
|
|
74.0 |
|
|
|
74.0 |
|
|
Indonesia |
|
|
June 30 |
|
| Woori Brazil Bank |
|
” |
|
|
100.0 |
|
|
|
100.0 |
|
|
Brazil |
|
|
June 30 |
|
| Korea BTL Infrastructure Fund |
|
” |
|
|
99.9 |
|
|
|
99.9 |
|
|
Korea |
|
|
June 30 |
|
| Woori Fund Service Co., Ltd. |
|
” |
|
|
100.0 |
|
|
|
100.0 |
|
|
Korea |
|
|
June 30 |
|
| Woori Finance Cambodia |
|
” |
|
|
100.0 |
|
|
|
100.0 |
|
|
Cambodia |
|
|
June 30 |
|
| Woori Finance Myanmar |
|
” |
|
|
100.0 |
|
|
|
100.0 |
|
|
Myanmar |
|
|
June 30 |
|
| Wealth Development Bank |
|
” |
|
|
51.0 |
|
|
|
51.0 |
|
|
Philippines |
|
|
June 30 |
|
| Woori Bank Vietnam Limited |
|
” |
|
|
100.0 |
|
|
|
100.0 |
|
|
Vietnam |
|
|
June 30 |
|
| Kumho Trust First Co., Ltd. (*1) |
|
Asset securitization |
|
|
0.0 |
|
|
|
0.0 |
|
|
Korea |
|
|
June 30 |
|
| Asiana Saigon Inc. (*1) |
|
” |
|
|
0.0 |
|
|
|
0.0 |
|
|
Korea |
|
|
June 30 |
|
| An-Dong Raja First Co., Ltd. (*5) |
|
” |
|
|
— |
|
|
|
0.0 |
|
|
Korea |
|
|
June 30 |
|
| Consus Eighth Co., LLC (*1) |
|
” |
|
|
0.0 |
|
|
|
0.0 |
|
|
Korea |
|
|
June 30 |
|
| KAMCO Value Recreation First Securitization Specialty Co., Ltd. (*1) |
|
” |
|
|
15.0 |
|
|
|
15.0 |
|
|
Korea |
|
|
June 30 |
|
| Hermes STX Co., Ltd. (*1) |
|
” |
|
|
0.0 |
|
|
|
0.0 |
|
|
Korea |
|
|
June 30 |
|
| BWL First Co., LLC (*1) |
|
” |
|
|
0.0 |
|
|
|
0.0 |
|
|
Korea |
|
|
June 30 |
|
| Woori Poongsan Co., Ltd. (*1) |
|
” |
|
|
0.0 |
|
|
|
0.0 |
|
|
Korea |
|
|
June 30 |
|
| Deogi Dream Fourth Co., Ltd. (*1) |
|
” |
|
|
0.0 |
|
|
|
0.0 |
|
|
Korea |
|
|
June 30 |
|
| Jeonju Iwon Ltd. (*1) |
|
” |
|
|
0.0 |
|
|
|
0.0 |
|
|
Korea |
|
|
June 30 |
|
| Wonju I one Inc. (*1) |
|
” |
|
|
0.0 |
|
|
|
0.0 |
|
|
Korea |
|
|
June 30 |
|
| Heitz Third Co., Ltd. (*1) |
|
” |
|
|
0.0 |
|
|
|
0.0 |
|
|
Korea |
|
|
June 30 |
|
| Woorihansoop 1st Co., Ltd. (*1) |
|
” |
|
|
0.0 |
|
|
|
0.0 |
|
|
Korea |
|
|
June 30 |
|
| Electric Cable First Co., Ltd (*1) |
|
” |
|
|
0.0 |
|
|
|
0.0 |
|
|
Korea |
|
|
June 30 |
|
| Woori International First Co., Ltd. (*1) |
|
” |
|
|
0.0 |
|
|
|
0.0 |
|
|
Korea |
|
|
June 30 |
|
| Woori HJ First Co., Ltd. (*1) |
|
” |
|
|
0.0 |
|
|
|
0.0 |
|
|
Korea |
|
|
June 30 |
|
| Woori WEBST 1st Co., Ltd. (*1) |
|
” |
|
|
0.0 |
|
|
|
— |
|
|
Korea |
|
|
June 30 |
|
| Wibihansoop 1st Co., Ltd. (*1) |
|
” |
|
|
0.0 |
|
|
|
— |
|
|
Korea |
|
|
June 30 |
|
| Uri QS 1st Co., Ltd (*1) |
|
” |
|
|
0.0 |
|
|
|
— |
|
|
Korea |
|
|
June 30 |
|
| Samsung Plus Private Equity Investment Trust 36th and 23 beneficiary certificates for the rest
(*2) |
|
Securities investment and others |
|
|
— |
|
|
|
— |
|
|
Korea |
|
|
June 30 |
|
| Principle Guaranteed Trust (*3) |
|
Trust |
|
|
0.0 |
|
|
|
0.0 |
|
|
Korea |
|
|
June 30 |
|
| Principle and Interest Guaranteed Trust (*3) |
|
” |
|
|
0.0 |
|
|
|
0.0 |
|
|
Korea |
|
|
June 30 |
|
| Woori Bank and Woori Private Equity Asset Management Co., Ltd.: |
|
|
|
|
|
|
|
|
|
|
|
|
|
|
|
|
| Woori Private Equity Fund (*4) |
|
Other financial business |
|
|
31.9 |
|
|
|
31.9 |
|
|
Korea |
|
|
June 30 |
|
| Woori Private Equity Fund: |
|
|
|
|
|
|
|
|
|
|
|
|
|
|
|
|
| Woori EL Co., Ltd. |
|
Other financial business |
|
|
100.0 |
|
|
|
100.0 |
|
|
Korea |
|
|
June 30 |
|
| Woori Investment Bank: |
|
|
|
|
|
|
|
|
|
|
|
|
|
|
|
|
| Dongwoo First Securitization Specialty Co., Ltd. (*1) |
|
Asset securitization |
|
|
5.0 |
|
|
|
5.0 |
|
|
Korea |
|
|
June 30 |
|
| Seari First Securitization Specialty Co., Ltd. (*1) |
|
” |
|
|
5.0 |
|
|
|
— |
|
|
Korea |
|
|
June 30 |
|
| Namjong 1st Securitization Specialty Co., Ltd. (*1) |
|
” |
|
|
5.0 |
|
|
|
— |
|
|
Korea |
|
|
June 30 |
|
| Woori Card Co., Ltd. |
|
|
|
|
|
|
|
|
|
|
|
|
|
|
|
|
| TUTU Finance-WCI Myanmar Co.,Ltd |
|
Finance |
|
|
100.0 |
|
|
|
100.0 |
|
|
Myanmar |
|
|
June 30 |
|
| Woori Card one of 2017-1 Securitization Specialty Co.,
Ltd. (*1) |
|
Asset securitization |
|
|
0.0 |
|
|
|
— |
|
|
Korea |
|
|
June 30 |
|
- 2 -
| (*1) |
The entity was a structured entity for the purpose of asset securitization and was in scope for consolidation. Although the Group is not a majority shareholder, the Group 1) had the power over the investee, 2) was
exposed, or had rights, to variable returns from its involvement with the investee, and 3) had the ability to use its power to affect its returns. |
| (*2) |
The entity was a structured entity for the purpose of investment in securities and was in scope for consolidation, considering that the Group 1) had the power over the investee, 2) was exposed, or has rights, to
variable returns from its involvement with the investee, and 3) had the ability to use its power to affect its returns. |
| (*3) |
The entity was a money trust under the Financial Investment Services and Capital Markets Act and was in scope for consolidation. Although the Group was not a majority shareholder, the Group 1) had the power over the
investee, 2) was exposed, or had rights, to variable returns from its involvement with the investee, and 3) had the ability to use its power to affect its returns. |
| (*4) |
Due to return of capital invested occurred during the six months ended June 30, 2017, both capital stock and the number of shares became nil. Residual net assets will be distributed in proportion to ownership
interests. |
| (*5) |
Due to liquidation for the six months ended as of June 30, 2017, the entity was excluded from the scope for consolidation. |
| (3) |
As of June 30, 2017, and December 31, 2016, despite having more than a 50% ownership interest, the Group has not consolidated the following companies as the Group does not have the ability to control following
subsidiaries: |
|
|
|
|
|
|
|
|
|
| |
|
As of June 30, 2017 |
|
| Subsidiaries |
|
Location |
|
Main
business |
|
Percentage of
ownership (%) |
|
| Golden Bridge NHN Online Private Equity Investment (*) |
|
Korea |
|
Securities Investment |
|
|
60.0 |
|
| Mirae Asset Maps Clean Water Private Equity Investment Trust 7th (*) |
|
Korea |
|
Securities Investment |
|
|
59.7 |
|
| Kiwoom Yonsei Private Equity Investment Trust (*) |
|
Korea |
|
Securities Investment |
|
|
88.9 |
|
| (*) |
The Group owns the majority ownership interest in these structured entities, but has no power on the investees’ relevant activities. As results, it is deemed that the Group has no power or control on the structured
entities. |
|
|
|
|
|
|
|
|
|
| |
|
As of December 31, 2016 |
|
| Subsidiaries |
|
Location |
|
Main
business |
|
Percentage of
ownership (%) |
|
| Golden Bridge NHN Online Private Equity Investment (*) |
|
Korea |
|
Securities Investment |
|
|
60.0 |
|
| Mirae Asset Maps Clean Water Private Equity Investment Trust 7th (*) |
|
Korea |
|
Securities Investment |
|
|
59.7 |
|
| Kiwoom Yonsei Private Equity Investment Trust (*) |
|
Korea |
|
Securities Investment |
|
|
88.9 |
|
| Kiwoom Frontier Professional Investment Private Fund 6(Bond) (*) |
|
Korea |
|
Securities Investment |
|
|
50.0 |
|
| (*) |
The Group owns the majority ownership interest in these structured entities, but has no power on the investees’ relevant activities. As results, it is deemed that the Group has no power or control on the structured
entities. |
| (4) |
The summarized financial information before the elimination of intercompany transactions of the subsidiaries whose financial information was prepared under K-IFRS for the
Group’s consolidated financial statements is as follows (Unit: Korean Won in millions): |
|
|
|
|
|
|
|
|
|
|
|
|
|
|
|
|
|
|
|
|
|
| |
|
As of and for the six months ended June 30, 2017 |
|
| |
|
Assets |
|
|
Liabilities |
|
|
Operating
revenue |
|
|
Net income
(loss)
attributable to
owners |
|
|
Comprehensive
income (loss)
attributable to
owners |
|
| Woori FIS Co., Ltd. |
|
|
107,878 |
|
|
|
71,169 |
|
|
|
120,932 |
|
|
|
1,201 |
|
|
|
1,201 |
|
| Woori Private Equity Asset Management Co., Ltd. |
|
|
39,627 |
|
|
|
1,114 |
|
|
|
295 |
|
|
|
(5,551 |
) |
|
|
(5,581 |
) |
| Woori Finance Research Institute Co., Ltd. |
|
|
4,359 |
|
|
|
624 |
|
|
|
2,840 |
|
|
|
366 |
|
|
|
358 |
|
| Woori Card Co., Ltd. |
|
|
8,050,927 |
|
|
|
6,463,953 |
|
|
|
861,379 |
|
|
|
61,864 |
|
|
|
62,008 |
|
| Woori Investment Bank Co., Ltd. |
|
|
1,637,534 |
|
|
|
1,452,659 |
|
|
|
104,593 |
|
|
|
12,119 |
|
|
|
12,814 |
|
| Woori Credit Information Co., Ltd. |
|
|
31,436 |
|
|
|
4,516 |
|
|
|
15,153 |
|
|
|
548 |
|
|
|
548 |
|
| Woori America Bank |
|
|
1,924,805 |
|
|
|
1,716,542 |
|
|
|
40,442 |
|
|
|
7,173 |
|
|
|
(4,523 |
) |
| Woori Global Markets Asia Limited |
|
|
275,270 |
|
|
|
157,145 |
|
|
|
3,970 |
|
|
|
811 |
|
|
|
(6,303 |
) |
| Woori Bank (China) Limited |
|
|
5,004,878 |
|
|
|
4,497,985 |
|
|
|
167,916 |
|
|
|
5,949 |
|
|
|
(10,312 |
) |
| AO Woori Bank |
|
|
208,891 |
|
|
|
157,486 |
|
|
|
7,976 |
|
|
|
2,214 |
|
|
|
19 |
|
- 3 -
|
|
|
|
|
|
|
|
|
|
|
|
|
|
|
|
|
|
|
|
|
| |
|
As of and for the six months ended June 30, 2017 |
|
| |
|
Assets |
|
|
Liabilities |
|
|
Operating
revenue |
|
|
Net income
(loss)
attributable to
owners |
|
|
Comprehensive
income (loss)
attributable to
owners |
|
| PT Bank Woori Saudara Indonesia 1906 Tbk |
|
|
2,095,286 |
|
|
|
1,703,599 |
|
|
|
99,016 |
|
|
|
19,431 |
|
|
|
800 |
|
| Woori Brazil Bank |
|
|
183,329 |
|
|
|
149,437 |
|
|
|
11,137 |
|
|
|
1,257 |
|
|
|
(1,294 |
) |
| Korea BTL Infrastructure Fund |
|
|
786,584 |
|
|
|
300 |
|
|
|
15,257 |
|
|
|
13,415 |
|
|
|
13,415 |
|
| Woori Fund Service Co., Ltd. |
|
|
11,743 |
|
|
|
937 |
|
|
|
4,410 |
|
|
|
792 |
|
|
|
792 |
|
| Woori Finance Cambodia |
|
|
42,841 |
|
|
|
23,657 |
|
|
|
2,569 |
|
|
|
571 |
|
|
|
279 |
|
| Woori Finance Myanmar |
|
|
18,198 |
|
|
|
5,098 |
|
|
|
860 |
|
|
|
144 |
|
|
|
186 |
|
| Wealth Development Bank |
|
|
181,254 |
|
|
|
145,369 |
|
|
|
6,681 |
|
|
|
1,051 |
|
|
|
552 |
|
| Woori Bank Vietnam Limited |
|
|
593,941 |
|
|
|
440,594 |
|
|
|
15,563 |
|
|
|
3,388 |
|
|
|
(5,598 |
) |
| Money trust under the FISCM Act(*) |
|
|
1,552,996 |
|
|
|
1,523,843 |
|
|
|
20,893 |
|
|
|
(177 |
) |
|
|
(177 |
) |
| Structured entity for the securitization of financial assets |
|
|
591,463 |
|
|
|
1,000,954 |
|
|
|
10,436 |
|
|
|
742 |
|
|
|
(740 |
) |
| Structured entity for the investments in securities |
|
|
2,228,682 |
|
|
|
514,843 |
|
|
|
38,156 |
|
|
|
14,752 |
|
|
|
3,387 |
|
| (*) |
FISCM Act: Financial Investment Services and Capital Markets Act |
|
|
|
|
|
|
|
|
|
|
|
|
|
|
|
|
|
|
|
|
|
| |
|
As of and for the year ended December 31, 2016 |
|
| |
|
Assets |
|
|
Liabilities |
|
|
Operating
revenue |
|
|
Net income
(loss)
attributable to
owners |
|
|
Comprehensive
income (loss)
attributable to
owners |
|
| Woori FIS Co., Ltd. |
|
|
141,329 |
|
|
|
105,821 |
|
|
|
244,783 |
|
|
|
1,048 |
|
|
|
1,432 |
|
| Woori Private Equity Asset Management Co., Ltd. |
|
|
97,338 |
|
|
|
53,244 |
|
|
|
2,154 |
|
|
|
312 |
|
|
|
219 |
|
| Woori Finance Research Institute Co., Ltd. |
|
|
3,710 |
|
|
|
334 |
|
|
|
4,445 |
|
|
|
108 |
|
|
|
100 |
|
| Woori Card Co., Ltd. |
|
|
7,606,108 |
|
|
|
6,180,893 |
|
|
|
1,555,373 |
|
|
|
109,393 |
|
|
|
116,381 |
|
| Woori Investment Bank Co., Ltd. |
|
|
1,576,627 |
|
|
|
1,404,566 |
|
|
|
178,572 |
|
|
|
23,872 |
|
|
|
23,897 |
|
| Woori Credit Information |
|
|
31,292 |
|
|
|
4,416 |
|
|
|
27,884 |
|
|
|
543 |
|
|
|
618 |
|
| Woori America Bank |
|
|
2,186,049 |
|
|
|
1,973,263 |
|
|
|
73,909 |
|
|
|
15,266 |
|
|
|
20,899 |
|
| Woori Global Markets Asia Limited |
|
|
272,008 |
|
|
|
147,581 |
|
|
|
7,255 |
|
|
|
1,863 |
|
|
|
5,582 |
|
| Woori Bank (China) Limited |
|
|
4,984,017 |
|
|
|
4,466,812 |
|
|
|
475,174 |
|
|
|
32,025 |
|
|
|
11,505 |
|
| AO Woori Bank |
|
|
239,860 |
|
|
|
188,474 |
|
|
|
16,221 |
|
|
|
5,650 |
|
|
|
15,553 |
|
| PT Bank Woori Saudara Indonesia 1906 Tbk |
|
|
2,089,822 |
|
|
|
1,693,111 |
|
|
|
179,014 |
|
|
|
24,573 |
|
|
|
48,542 |
|
| Woori Brazil Bank |
|
|
241,229 |
|
|
|
206,043 |
|
|
|
17,059 |
|
|
|
2,786 |
|
|
|
9,600 |
|
| Korea BTL Infrastructure Fund |
|
|
784,770 |
|
|
|
299 |
|
|
|
33,476 |
|
|
|
29,617 |
|
|
|
29,617 |
|
| Woori Fund Service Co., Ltd. |
|
|
11,386 |
|
|
|
1,372 |
|
|
|
7,787 |
|
|
|
1,011 |
|
|
|
1,011 |
|
| Woori Finance Cambodia |
|
|
32,405 |
|
|
|
24,751 |
|
|
|
4,545 |
|
|
|
1,250 |
|
|
|
1,494 |
|
| Woori Finance Myanmar |
|
|
4,305 |
|
|
|
2,651 |
|
|
|
380 |
|
|
|
(613 |
) |
|
|
(569 |
) |
| Wealth Development Bank |
|
|
209,779 |
|
|
|
174,446 |
|
|
|
12,519 |
|
|
|
1,248 |
|
|
|
1,876 |
|
| Woori Bank Vietnam Limited |
|
|
159,223 |
|
|
|
278 |
|
|
|
— |
|
|
|
(346 |
) |
|
|
3,545 |
|
| Money trust under the Trust Business Act |
|
|
1,525,145 |
|
|
|
1,495,815 |
|
|
|
55,540 |
|
|
|
697 |
|
|
|
697 |
|
| Structured entity for the securitization of financial assets |
|
|
487,431 |
|
|
|
895,824 |
|
|
|
29,480 |
|
|
|
6,912 |
|
|
|
7,138 |
|
| Structured entity for the investments in securities |
|
|
4,397,163 |
|
|
|
1,898,977 |
|
|
|
137,896 |
|
|
|
56,605 |
|
|
|
61,535 |
|
| (5) |
The financial support that the Group provides to consolidated structured entities is as follows: |
| |
• |
|
Structured entity for the securitization of financial assets |
The structured entity is
established for the purpose of securitization of project financing loans, corporate bonds, and other financial assets. The Group is involved with the structured entity through providing with credit facility over asset-backed commercial papers issued
by the entity, originating loans directly to the structured entity, or purchasing 100% of the subordinated debts issued by the structured entity.
| |
• |
|
Structured entity for the investments in securities |
The structured entity is established for
the purpose of investments in securities. The Group acquires beneficiary certificates through its contribution of fund to the structured entity, and it is exposed to the risk that it may not be able to recover its fund depending on the result of
investment performance of asset managers of the structured entity.
- 4 -
| |
• |
|
Money trust under the Financial Investment Services and Capital Markets Act |
The Group provides
with financial guarantee of principal and interest or principal only to some of its trust products. Due to the financial guarantees, the Group may be obliged to supplement when the principal and interest or principal of the trust product sold is
short of the guaranteed amount depending on the result of investment performance of the trust product.
| (6) |
The details of the limitations with regard to the transfer of assets or the redemption of liabilities within the Group are provided below. |
Some subsidiaries are regulated by the rules of the jurisdictions, in which they were incorporated, with regard to funding or management of
deposits. Also, there is the limitation that they must have pre-approval from their regulators in case of remittance of earnings to the Bank.
| (7) |
The Group has entered into various agreements with structured entities such as asset securitization vehicles, structured finance and investment funds, and monetary funds. Where it is determined in accordance with K-IFRS 1110 that the Group has no controlling power over such structured entities, the entities are not consolidated. The nature of interests, which the Group retains, and the risks, to which the Group is exposed,
of the unconsolidated structured entities are as follows: |
The interests to unconsolidated structured entities, which the
Group retains, are classified to asset securitization vehicles, structured finance and investment fund, based on the nature and the purpose of the structured entities.
Asset securitization vehicle issues asset-backed securities and redeems the principal and interest or distributes dividends on asset-backed
securities with profits from collecting cash flows or sale of securitized assets. The Group, as a secondary guarantor, provides purchase commitments for its asset-backed securities or guarantees to such asset securitization vehicle and recognizes
commission income or interest income related to the commitment or guarantees. Therefore, the Group would be exposed to risks to purchases or pays back asset-backed securities issued by the vehicles when a primary guarantor fails to provide the
financing asset securitization vehicles.
Structured finance includes investments in project financing on real estates, social overhead
capital (“SOC”), infrastructure and shipping finance. They are formed as special purpose entity by funding through equity investments and loans from various investors. Investment decisions are made by the Group based on business outlook of
such projects. In relation to such investments, the Group recognizes interest income on loans, gains or losses on valuation of equity investments or dividend income. The structured finance is secured by additional funding agreement, guarantee or
credit facilities. However, the structured financing project would fail to return the capital of equity investments or principal of loans to the Group if it is discontinued or did not achieve business outcome.
Investment funds include trusts and private equity funds. A trust is formed by contributions from various investors, operated by a manager
engaged to the trust and distributed proceeds from sales of investments to the investors. A private equity fund is established in order to acquire ownership interests in a portfolio company with exit strategy after implementing financial and
operational restructuring of the company. The Group recognizes unrealized gains or losses on change in value of investments in proposition of ownership interests in investments. The Group would be exposed to risks of loss when the value of portfolio
investment is decreased.
Total assets of the unconsolidated structured entities, the carrying value of the related items recorded, the
maximum exposure to risks, and the loss recognized in conjunction with the unconsolidated structured entities as of June 30, 2017 and December 31, 2016 are as follows (Unit: Korean Won in millions):
|
|
|
|
|
|
|
|
|
|
|
|
|
| |
|
June 30, 2017 |
|
| |
|
Asset
securitization
vehicle |
|
|
Structured
finance |
|
|
Investment
funds |
|
| Total asset of the unconsolidated structured entities |
|
|
7,177,502 |
|
|
|
62,945,606 |
|
|
|
8,093,819 |
|
| Assets recognized in the consolidated financial statements related to the unconsolidated
structured entities |
|
|
3,515,343 |
|
|
|
2,414,906 |
|
|
|
1,247,303 |
|
| Loans and receivables |
|
|
42,905 |
|
|
|
2,125,426 |
|
|
|
— |
|
| Financial assets at fair value through profit or loss |
|
|
— |
|
|
|
174,805 |
|
|
|
13,203 |
|
| Available-for-sale
financial assets |
|
|
1,152,928 |
|
|
|
109,317 |
|
|
|
1,192,955 |
|
| Held-to-maturity
financial assets |
|
|
2,319,279 |
|
|
|
— |
|
|
|
— |
|
| Investments in joint ventures and associates |
|
|
— |
|
|
|
— |
|
|
|
41,145 |
|
| Derivative assets |
|
|
231 |
|
|
|
5,358 |
|
|
|
— |
|
- 5 -
|
|
|
|
|
|
|
|
|
|
|
|
|
| |
|
June 30, 2017 |
|
| |
|
Asset
securitization
vehicle |
|
|
Structured
finance |
|
|
Investment
funds |
|
| Liabilities recognized in the consolidated financial statements related to the unconsolidated
structured entities |
|
|
1,407 |
|
|
|
1,327 |
|
|
|
— |
|
| Derivative liabilities |
|
|
254 |
|
|
|
412 |
|
|
|
— |
|
| Other liabilities (including provisions) |
|
|
1,153 |
|
|
|
915 |
|
|
|
— |
|
| The maximum exposure to risks |
|
|
4,284,886 |
|
|
|
3,306,334 |
|
|
|
1,247,303 |
|
| Investments |
|
|
3,515,343 |
|
|
|
2,414,906 |
|
|
|
1,247,303 |
|
| Purchase agreements |
|
|
6,000 |
|
|
|
— |
|
|
|
— |
|
| Credit facilities |
|
|
763,543 |
|
|
|
891,428 |
|
|
|
— |
|
| Loss recognized on unconsolidated structured entities |
|
|
302 |
|
|
|
5,967 |
|
|
|
1,893 |
|
|
|
| |
|
December 31, 2016 |
|
| |
|
Asset
securitization
vehicle |
|
|
Structured
finance |
|
|
Investment
funds |
|
| Total asset of the unconsolidated structured entities |
|
|
8,426,713 |
|
|
|
61,324,862 |
|
|
|
9,131,362 |
|
| Assets recognized in the consolidated financial statements related to the unconsolidated
structured entities |
|
|
3,361,910 |
|
|
|
2,790,215 |
|
|
|
1,749,494 |
|
| Loans and receivables |
|
|
65,470 |
|
|
|
2,414,044 |
|
|
|
— |
|
| Financial assets at fair value through profit or loss |
|
|
— |
|
|
|
254,150 |
|
|
|
— |
|
| Available-for-sale
financial assets |
|
|
1,216,446 |
|
|
|
115,843 |
|
|
|
1,664,865 |
|
| Held-to-maturity
financial assets |
|
|
2,079,648 |
|
|
|
— |
|
|
|
— |
|
| Investments in joint ventures and associates |
|
|
— |
|
|
|
— |
|
|
|
84,629 |
|
| Derivative assets |
|
|
346 |
|
|
|
6,178 |
|
|
|
— |
|
| Liabilities recognized in the consolidated financial statements related to the unconsolidated
structured entities |
|
|
1,363 |
|
|
|
1,224 |
|
|
|
— |
|
| Derivative liabilities |
|
|
201 |
|
|
|
362 |
|
|
|
— |
|
| Other liabilities (including provisions) |
|
|
1,162 |
|
|
|
862 |
|
|
|
— |
|
| The maximum exposure to risks |
|
|
4,263,993 |
|
|
|
3,802,210 |
|
|
|
1,749,494 |
|
| Investments |
|
|
3,361,910 |
|
|
|
2,790,215 |
|
|
|
1,749,494 |
|
| Purchase agreements |
|
|
28,000 |
|
|
|
— |
|
|
|
— |
|
| Credit facilities |
|
|
834,083 |
|
|
|
970,195 |
|
|
|
— |
|
| Other commitments |
|
|
40,000 |
|
|
|
41,800 |
|
|
|
— |
|
| Loss recognized on unconsolidated structured entities |
|
|
6,353 |
|
|
|
71,185 |
|
|
|
683 |
|
| (8) |
Subsidiaries of which non-controlling interests are significant to the Group’s consolidated financial statements are as follows (Unit: Korean Won in millions):
|
| |
1) |
Accumulated non-controlling interests at the end of the reporting period |
|
|
|
|
|
|
|
|
|
| |
|
June 30, 2017 |
|
|
December 31, 2016 |
|
| Woori Investment Bank |
|
|
79,350 |
|
|
|
73,986 |
|
| PT Bank Woori Saudara Indonesia 1906 Tbk |
|
|
68,946 |
|
|
|
70,249 |
|
| Wealth Development Bank |
|
|
17,584 |
|
|
|
16,983 |
|
| |
2) |
Net income attributable to non-controlling interests |
|
|
|
|
|
|
|
|
|
| |
|
For the six months
ended June 30, 2017 |
|
|
For the six months
ended June 30, 2016 |
|
| Woori Investment Bank |
|
|
5,072 |
|
|
|
4,806 |
|
| PT Bank Woori Saudara Indonesia 1906 Tbk |
|
|
5,048 |
|
|
|
2,692 |
|
| Wealth Development Bank |
|
|
515 |
|
|
|
— |
|
- 6 -
| |
3) |
Dividends to non-controlling interests |
|
|
|
|
|
|
|
|
|
| |
|
For the six months
ended June 30, 2017 |
|
|
For the six months
ended June 30, 2016 |
|
| PT Bank Woori Saudara Indonesia 1906 Tbk |
|
|
1,513 |
|
|
|
1,242 |
|
| 2. |
SIGNIFICANT BASIS OF PREPARATION AND ACCOUNTING POLICIES |
The Group’s consolidated financial
statements are prepared in accordance with Korean International Financial Reporting Standards (“K-IFRS”) 1034, Interim Financial Reporting. It is necessary to use the annual financial
statements for the year ended December 31, 2016 for understanding of the accompanying interim financial statements.
The significant accounting
policies that have been applied for the preparation of the consolidated financial statements as of and for the six months ended June 30, 2017 are described below, and the significant accounting policies are the same as the accounting policies
applied for the preparation of the previous year’s consolidated financial statements, except the impacts from the adoptions of accounting standards or interpretations which are explained below.
| (1) |
The Group has newly adopted the following amendment to K-IFRS that affected the Group’s accounting policies. |
Amendments to K-IFRS 1007 – Statement of Cash Flows
The amendments require that changes in liabilities arising from financial activities are disclosed. The adoption of the amendments has no
material impact on the Group’s consolidated financial statements.
Amendments to K-IFRS 1012
– Income Taxes
The amendments clarify that unrealized losses on fixed-rate debt instruments measured at fair value and
measured at cost for tax purposes give rise to a deductible temporary difference regardless of whether the holder expects to recover the carrying amount of the debt instrument by sale or by use and that the estimate of probable future taxable profit
may include the recovery of some of assets for more than their carrying amount. When the Group assesses whether there will be sufficient taxable profit, the Group should compare the deductible temporary differences with future taxable profit that
excludes tax deductions resulting from the reversal of those deductible temporary differences. The adoption of the amendments has no material impact on the Group’s consolidated financial statements.
| (2) |
The Group has not applied the following K-IFRSs that have been issued but are not yet effective: |
Enactments to K-IFRS 1109 – Financial Instruments
The enactments to K-IFRS 1109 contain the requirements for the classification and measurement of
financial assets and financial liabilities based on a business model whose objective is achieved both by collecting contractual cash flows and selling financial assets and based on the contractual terms that give rise on specified dates to cash
flows, impairment methodology based on the expected credit losses, and broadened types of instruments that qualify as hedging instruments and the types of risk components of non-financial items that are
eligible for hedge accounting and the change of the hedge effectiveness test. K-IFRS 1109 – Financial Instruments which was enacted on September 25, 2015will be applied for annual periods
beginning on or after 1 January 2018 or may be applied earlier. This standard will supersede K-IFRS 1039- Recognition and Measurement of Financial Instruments. By the way, the Group will apply K-IFRS 1109 for annual periods beginning on or after 1 January 2018.
In addition, K-IFRS 1109 includes certain exceptions to the classification and measurement of financial assets and the retroactive restatement for classification and measurement of financial assets, impairment of financial
assets; and hedge accounting.
The Group evaluated the potential effect to the financial statement as of December 31, 2016 based on
the present situation as of June 30, 2017 and the available information for evaluating the financial effect by initial adoption of K-IFRS 1109 preliminarily. The effect to the financial statement for the
initial adopted fiscal year depends on not only the selection and decision of the accounting policies by this standard but also the financial instrument which the Group holds for the period and economic situation and so on.
- 7 -
Meanwhile, the typical financial impacts per each major requirements under the Standard that are
expected to be applicable are as follows:
Phase 1: Classification and measurement of financial assets and financial liabilities
All recognized financial assets that are currently within the scope of K-IFRS 1109 will be subsequently
measured either at amortized cost, fair value through other comprehensive income (FVOCI), or fair value through profit or loss (FVTPL) under K-IFRS 1109 based on the business model and the nature of the
contractual cash flows. And if the hybrid contracts contains the financial assets as the host contract, embedded derivative will not be separated, they will be classified as a whole. Specifically:
|
|
|
|
|
|
|
| |
|
The business model |
| The nature of contractual cash flows |
|
Objective is to
collect the
contractual cash
flows |
|
Objective is achieved both
by collecting the
contractual cash flows and
selling financial assets |
|
Objective is to
sell financial
assets and so on |
| Contractual cash flows that are solely payment of principal and interest |
|
Measured at
amortized cost(*1) |
|
Measure at
FVOCI(*1) |
|
Measure at
FVTPL |
|
|
|
|
| Other than the above |
|
Measure at
FVTPL(*2) |
|
Measure at FVTPL(*2) |
|
Measure at
FVTPL(*2) |
| (*1) |
For eliminating or reducing accounting discrepancies, an irrevocable election can be made at initial recognition to measure the investment at FVTPL. |
| (*2) |
For the equity securities which are traded for the purpose other than short-term trading, an irrevocable election can be made at initial recognition to measure the investment at FVOCI. |
Under K-IFRS 1109, as it is more strictly required to classify to the financial assets measured at
amortized cost or fair value through OCI compared to under current K-IFRS 1039, when adopting the K-IFRS 1109, the volatility of net income can be expanded by the
increasing portion of the financial asset measured at FVTPL. In accordance with K-IFRS 1109, the debt instruments only which occur the cash flow that is compose of solely the principal and the interest on the
remaining principal at specified dates by the contract, whose purpose is to receive the cash flow under the contract can be measured at amortized cost. In accordance with K-IFRS 1039, the Group shall measure
loans and receivables amounting to 258,392,633 million Won and held-to-maturity financial assets amounting to 13,910,251 million Won as of December 31,
2016 as amortized cost, and among theses, 21,305 million Won of debt instruments, whose host contracts are debt securities and which separated the embedded derivatives from the hybrid contracts is included.
Based on the result of the preliminary effect evaluation, if K-IFRS 1109 adopt to the above financial
assets as of December 31, 2016, as they almost occur the cash flow that is compose of solely the principal and the interest on the remaining principal at specified dates by the contract, whose purpose is to receive the cash flow under the
contract, so they can be measure at amortized cost and there is no material effect to the financial statement. However, for debt securities as the host contract of hybrid contract amounting to 21,305 million Won, as the cash flow under the
contract is not composed of solely the principal and the interest on the remaining principal, it will be classified to the financial asset measured at FVTPL.
In accordance with K-IFRS 1109, the debt instruments only which occur the cash flow that is composed of
solely the principal and the interest on the remaining principal at specified dates by the contract, whose purpose is to receive the cash flow under the contract and sell itself can be measure at FVOCI. In accordance with K-IFRS 1039, the Group hold debt instruments as available-for-sale assets amounting to 16,541,888 million Won as of
December 31, 2016.
Based on the result of the preliminary effect evaluation, if K-IFRS 1109
adopt to the above AFS financial assets as of December 31, 2016, they almost can be classified to financial asset measured at FVOCI. However, for beneficiary certificates amounting to 2,822,082 million Won, other equity investment
amounting to 262,175 million Won and debt securities amounting to 111,706 million Won, as the cash flows of those are not composed of solely the principal and the interest on the remaining principal, they may be classified to financial
assets measured at FVTPL. As a result, the volatility of net income can be expanded.
- 8 -
In accordance with K-IFRS 1109, an entity may make an
irrevocable election at initial recognition for particular investments in equity instruments that would otherwise be measured at fair value through profit or loss to present subsequent changes in fair value in other comprehensive income, and the
amounts should not be recycled to profit or loss. In accordance with K-IFRS 1039, the Group holds equity investments that are classified as
available-for-sale financial assets amounting to 1,161,375 million Won as of December 31, 2016.
The Group are reviewing the designation of the financial asset measured at FVOCI among the available for sale equity securities.
One major change from K-IFRS 1039 relates to the presentation of changes in the fair value of a
financial liability designated as at FVTPL attributable to changes in the credit risk of that liability. Under K-IFRS 1109, such changes are presented in other comprehensive income, unless the presentation of
the effect of the change in the liability’s credit risk in other comprehensive income would create or enlarge an accounting mismatch in profit or loss. Changes in fair value attributable to a financial liability’s credit risk are not
subsequently reclassified to profit or loss. In accordance with K-IFRS 1039, the Group holds financial liabilities designated as at FVTPL 766,880 million Won as of December 31, 2016.
Based on the result of the preliminary effect evaluation, the variance amount due to the effect of accumulated credit risk variance among the
total variance of financial liabilities designated as at FVPTL is 15,790 million Won.
Phase 2: Impairment methodology
The impairment model under K-IFRS 1109 reflects expected credit losses. Under the impairment approach
in K-IFRS 1109, it is no longer necessary for a credit event to have occurred before credit losses are recognized. Instead, an entity always accounts for expected credit losses and changes in those expected
credit losses. The amount of expected credit losses should be updated at each reporting date to reflect changes in credit risk since initial recognition.
In accordance with K-IFRS 1109, the allowance for doubtful receivables is measured at the amount
equivalent to the expected 12-month credit loss or the lifetime expected credit loss, depending on the degree of deterioration of the credit risk after the initial recognition of the financial asset. As a
result, the credit loss can be earlier than under occurred loss model of current K-IFRS 1039.
|
|
|
|
|
|
|
| |
|
Stage 1 |
|
Stage 2 |
|
Stage 3 |
| Stage |
|
In case the exposure’s
credit risk has not
increased significantlysince initial recognition(*) |
|
In case the exposure
has suffered a
significant increase
in credit risk |
|
In case the exposure
meets the accounting
definition of credit
impaired |
|
|
|
| Allowance recognition |
|
The Group recognizes
only 12-month expected
credit losses as a loss
allowance |
|
The Group recognizes a loss allowance equal to lifetime expected credit losses |
| (*) |
It can be considered that the credit risk dose not increase significantly when the credit risk is low at the year-end. |
Meanwhile, K-IFRS 1109 requires that, an entity shall only recognize the cumulative changes in lifetime
expected credit losses since initial recognition as a loss allowance for purchased or originated credit-impaired financial assets.
Based
on the result of the preliminary effect evaluation, the allowance for credit losses amounting to 2,353,122 as of December 31, 2016 will increase by 11% approximately. However, there will be no material change in the BIS Total Equity ratio
compared to 15.29% as of December 31, 2016. The result of preliminary effect evaluation can be changed according to the additional available information for the future and the relevant decision making.
- 9 -
Phase 3: Hedge accounting
The general hedge accounting requirements of K-IFRS 1109 is relaxed compared to under hedge accounting
mechanisms in K-IFRS 1039. Greater flexibility has been introduced to the types of transactions eligible for hedge accounting, specifically broadening the types of instruments that qualify as hedging
instruments and hedged items that are eligible for hedge accounting. In addition, the quantitative criteria (80~125%) for the highly hedge effectiveness is abolished and retrospective assessment of hedge effectiveness is no longer required. So it
enable the company to focus on the risk management activities.
Enactments to K-IFRS 1115 –
Revenue from Contracts with Customers
The core principle under K-IFRS 1115 is that an
entity should recognize revenue to depict the transfer of promised goods or services to customers in an amount that reflects the consideration to which the entity expects to be entitled in exchange for those goods or services. The amendments
introduces a 5-step approach to revenue recognition and measurement: 1) Identify the contract with a customer, 2) Identify the performance obligations in the contract, 3) Determine the transaction price, 4)
Allocate the transaction price to the performance obligations in the contract, 5) Recognize revenue when (or as) the entity satisfies a performance obligation. This standard will supersede K-IFRS 1011 -
Construction Contracts, K-IFRS 1018- Revenue, K-IFRS 2113 - Customer Loyalty Programmes, K-IFRS 2115-Agreements for the
Construction of Real Estate, K-IFRS 2118 - Transfers of Assets from Customers, and K-IFRS 2031-Revenue-Barter Transactions Involving Advertising Services. The amendments
are effective for annual periods beginning on or after 1 January 2018.
Enactments to K-IFRS
2122 – Foreign Currency Transactions and Advance Consideration
The amendments clarify that the date of the transaction for the
purpose of determining the exchange rate to use on initial recognition of the related asset, expense or income (or part of it) is the date on which an entity initially recognizes the non-monetary asset or non-monetary liability arising from the payment or receipt of advance consideration. The amendments are effective for annual periods beginning on or after 1 January 2018.
Annual Improvements to K-IFRS 2014-2016 Cycle
The amendments clarify that in applying the equity method of accounting to an associate or a joint venture in accordance with K-IFRS 1028, an investor, such as venture capital investment vehicle, may apply fair value measurement selectively to each of its associate or joint venture, as well as certain amendments for K-IFRS 1101. The amendments are effective for annual periods beginning on or after 1 January 2018.
The Group is in the process of evaluating the impact on the consolidated financial statements upon the adoption of amendments of K-IFRSs that
have been issued but are not yet effective.
| 3. |
SIGNIFICANT ACCOUNTING ESTIMATES AND ASSUMPTIONS |
In the application of the Group’s accounting
policies to the interim financial statements, management is required to make judgments, estimates and assumptions about the carrying amounts of assets and liabilities that are not readily apparent from other sources. Actual results can differ from
those estimates based on such definitions.
The significant judgments which management has made about the application of the Group’s accounting
policies and key sources of uncertainty in estimate do not differ from those used in preparing the consolidated financial statements for the year ended December 31, 2016.
- 10 -
The Group’s operating activity is exposed to various financial risks. The Group is
required to analyze and assess the level of complex risks, and determine the permissible level of risks and manage such risks. The Group’s risk management procedures have been established to improve the quality of assets for holding or
investment purposes by making decisions as how to avoid or mitigate risks through the identification of the source of the potential risks and their impact.
The Group has established an approach to manage the acceptable level of risks and reduce the excessive risks in financial instruments in order to maximize the
profit given risks present, for which the Group has implemented processes for risk identification, assessment, control, and monitoring and reporting.
The
risk is managed by the risk management department in accordance with the Group’s risk management policy. The Risk Management Committee makes decisions on the risk strategies such as the avoidance of concentration on capital at risk and the
establishment of acceptable level of risk.
Credit risk represents the possibility of financial losses incurred when the counterparty fails to
fulfill its contractual obligations. The goals of credit risk management are to maintain the Group’s credit risk exposure to a permissible degree and to optimize its rate of return considering such credit risk.
| |
1) |
Credit risk management |
The Group considers the probability of failure in performing the
obligation of its counterparties, credit exposure to the counterparty, the related default risk and the rate of default loss. The Group uses the credit rating model to assess the possibility of counterparty’s default risk; and when assessing
the obligor’s credit grade, the Group utilizes credit grades derived using statistical methods.
In order to manage credit risk limit,
the Group establishes the appropriate credit line per obligor, company or industry. It monitors obligor’s credit line, total exposures and loan portfolios when approving the loan.
The Group mitigates credit risk resulting from the obligor’s credit condition by using financial and physical collateral, guarantees,
netting agreements and credit derivatives. The Group has adopted the entrapment method to mitigate its credit risk. Credit risk mitigation is reflected in qualifying financial collateral, trade receivables, guarantees, residential and commercial
real estate and other collaterals. The Group regularly performs a revaluation of collateral reflecting such credit risk mitigation.
- 11 -
| |
2) |
Maximum exposure to credit risk |
The Group’s maximum exposure to credit risk refers to net
book value of financial assets net of allowances, which shows the uncertainties of maximum changes of net value of financial assets attributable to a particular risk without considering collateral and other credit enhancements obtained. However, the
maximum exposure is the fair value amount (recorded on the books) for derivatives, maximum contractual obligation for payment guarantees and loan commitment for loan contracts.
The maximum exposure to credit risk is as follows (Unit: Korean Won in millions):
|
|
|
|
|
|
|
|
|
| |
|
June 30, 2017 |
|
|
December 31, 2016 |
|
| Loans and receivables: |
|
|
|
|
|
|
|
|
| Korean treasury and government agencies |
|
|
12,654,438 |
|
|
|
16,058,305 |
|
| Banks |
|
|
26,983,344 |
|
|
|
20,242,260 |
|
| Corporates |
|
|
89,208,930 |
|
|
|
88,985,566 |
|
| Consumers |
|
|
136,301,912 |
|
|
|
133,106,502 |
|
|
|
|
|
|
|
|
|
|
| Sub-total |
|
|
265,148,624 |
|
|
|
258,392,633 |
|
|
|
|
|
|
|
|
|
|
| Financial assets at fair value through profit or loss (“FVTPL”): |
|
|
|
|
|
|
|
|
| Gold banking assets |
|
|
31,169 |
|
|
|
26,180 |
|
| Debt securities held for trading |
|
|
2,809,780 |
|
|
|
2,644,916 |
|
| Financial assets designated at FVTPL |
|
|
6,539 |
|
|
|
4,348 |
|
| Derivative assets for trading |
|
|
1,644,068 |
|
|
|
2,898,295 |
|
|
|
|
|
|
|
|
|
|
| Sub-total |
|
|
4,491,556 |
|
|
|
5,573,739 |
|
|
|
|
|
|
|
|
|
|
|
Available-for-sale (“AFS”)
debt securities |
|
|
15,123,734 |
|
|
|
16,541,888 |
|
|
Held-to-maturity (“HTM”)
securities |
|
|
15,144,766 |
|
|
|
13,910,251 |
|
| Derivative assets for hedging |
|
|
140,176 |
|
|
|
140,577 |
|
| Off-balance accounts: |
|
|
|
|
|
|
|
|
| Guarantees |
|
|
13,160,410 |
|
|
|
14,761,784 |
|
| Loan commitments |
|
|
81,601,017 |
|
|
|
83,795,496 |
|
|
|
|
|
|
|
|
|
|
| Sub-total |
|
|
94,761,427 |
|
|
|
98,557,280 |
|
|
|
|
|
|
|
|
|
|
| Total |
|
|
394,810,283 |
|
|
|
393,116,368 |
|
|
|
|
|
|
|
|
|
|
- 12 -
| |
a) |
Credit risk exposure by geographical areas |
The following tables analyze credit risk exposure
by geographical areas (Unit: Korean Won in millions):
|
|
|
|
|
|
|
|
|
|
|
|
|
|
|
|
|
|
|
|
|
|
|
|
|
|
|
|
|
| |
|
June 30, 2017 |
|
| |
|
Korea |
|
|
China |
|
|
USA |
|
|
UK |
|
|
Japan |
|
|
Others (*) |
|
|
Total |
|
| Loans and receivables |
|
|
249,567,066 |
|
|
|
4,403,226 |
|
|
|
2,684,388 |
|
|
|
1,057,722 |
|
|
|
315,158 |
|
|
|
7,121,064 |
|
|
|
265,148,624 |
|
| Financial assets at FVTPL |
|
|
4,309,559 |
|
|
|
1,156 |
|
|
|
— |
|
|
|
136,922 |
|
|
|
— |
|
|
|
43,919 |
|
|
|
4,491,556 |
|
| AFS debt securities |
|
|
14,555,949 |
|
|
|
— |
|
|
|
97,613 |
|
|
|
— |
|
|
|
— |
|
|
|
470,172 |
|
|
|
15,123,734 |
|
| HTM securities |
|
|
15,026,481 |
|
|
|
— |
|
|
|
53,236 |
|
|
|
— |
|
|
|
— |
|
|
|
65,049 |
|
|
|
15,144,766 |
|
| Derivative assets |
|
|
70,495 |
|
|
|
— |
|
|
|
— |
|
|
|
69,648 |
|
|
|
33 |
|
|
|
— |
|
|
|
140,176 |
|
| Off-balance accounts |
|
|
92,668,381 |
|
|
|
784,103 |
|
|
|
114,222 |
|
|
|
80,312 |
|
|
|
36,582 |
|
|
|
1,077,827 |
|
|
|
94,761,427 |
|
|
|
|
|
|
|
|
|
|
|
|
|
|
|
|
|
|
|
|
|
|
|
|
|
|
|
|
|
|
| Total |
|
|
376,197,931 |
|
|
|
5,188,485 |
|
|
|
2,949,459 |
|
|
|
1,344,604 |
|
|
|
351,773 |
|
|
|
8,778,031 |
|
|
|
394,810,283 |
|
|
|
|
|
|
|
|
|
|
|
|
|
|
|
|
|
|
|
|
|
|
|
|
|
|
|
|
|
|
|
|
| |
|
December 31, 2016 |
|
| |
|
Korea |
|
|
China |
|
|
USA |
|
|
UK |
|
|
Japan |
|
|
Others (*) |
|
|
Total |
|
| Loans and receivables |
|
|
241,380,250 |
|
|
|
4,286,018 |
|
|
|
2,792,088 |
|
|
|
895,874 |
|
|
|
323,470 |
|
|
|
8,714,933 |
|
|
|
258,392,633 |
|
| Financial assets at FVTPL |
|
|
5,205,849 |
|
|
|
6,525 |
|
|
|
— |
|
|
|
261,547 |
|
|
|
81 |
|
|
|
99,737 |
|
|
|
5,573,739 |
|
| AFS debt securities |
|
|
16,155,290 |
|
|
|
13,845 |
|
|
|
137,861 |
|
|
|
— |
|
|
|
— |
|
|
|
234,892 |
|
|
|
16,541,888 |
|
| HTM securities |
|
|
13,758,863 |
|
|
|
— |
|
|
|
20,336 |
|
|
|
— |
|
|
|
— |
|
|
|
131,052 |
|
|
|
13,910,251 |
|
| Derivative assets |
|
|
74,166 |
|
|
|
— |
|
|
|
— |
|
|
|
66,342 |
|
|
|
— |
|
|
|
69 |
|
|
|
140,577 |
|
| Off-balance accounts |
|
|
96,245,092 |
|
|
|
737,513 |
|
|
|
103,130 |
|
|
|
80,831 |
|
|
|
23,250 |
|
|
|
1,367,464 |
|
|
|
98,557,280 |
|
|
|
|
|
|
|
|
|
|
|
|
|
|
|
|
|
|
|
|
|
|
|
|
|
|
|
|
|
|
| Total |
|
|
372,819,510 |
|
|
|
5,043,901 |
|
|
|
3,053,415 |
|
|
|
1,304,594 |
|
|
|
346,801 |
|
|
|
10,548,147 |
|
|
|
393,116,368 |
|
|
|
|
|
|
|
|
|
|
|
|
|
|
|
|
|
|
|
|
|
|
|
|
|
|
|
|
|
|
| (*) |
Others consist of financial assets in Indonesia, Vietnam, Panama, European countries and others. |
| |
b) |
Credit risk exposure by industries |
The following tables analyze credit risk exposure by
industries, which are service, manufacturing, finance and insurance, construction, individuals and others in accordance with the Korea Standard Industrial Classification Code (Unit: Korean Won in millions):
|
|
|
|
|
|
|
|
|
|
|
|
|
|
|
|
|
|
|
|
|
|
|
|
|
|
|
|
|
| |
|
June 30, 2017 |
|
| |
|
Service |
|
|
Manufacturing |
|
|
Finance and
insurance |
|
|
Construction |
|
|
Individuals |
|
|
Others |
|
|
Total |
|
| Loans and receivables |
|
|
46,324,552 |
|
|
|
34,668,461 |
|
|
|
41,409,536 |
|
|
|
3,853,079 |
|
|
|
128,752,554 |
|
|
|
10,140,442 |
|
|
|
265,148,624 |
|
| Financial assets at FVTPL |
|
|
70,056 |
|
|
|
109,773 |
|
|
|
3,360,962 |
|
|
|
17,366 |
|
|
|
3,066 |
|
|
|
930,333 |
|
|
|
4,491,556 |
|
| AFS debt securities |
|
|
895,946 |
|
|
|
35,749 |
|
|
|
7,652,764 |
|
|
|
103,361 |
|
|
|
— |
|
|
|
6,435,914 |
|
|
|
15,123,734 |
|
| HTM securities |
|
|
1,142,854 |
|
|
|
— |
|
|
|
9,680,637 |
|
|
|
242,968 |
|
|
|
— |
|
|
|
4,078,307 |
|
|
|
15,144,766 |
|
| Derivative assets |
|
|
— |
|
|
|
— |
|
|
|
140,176 |
|
|
|
— |
|
|
|
— |
|
|
|
— |
|
|
|
140,176 |
|
| Off-balance accounts |
|
|
17,715,516 |
|
|
|
23,225,989 |
|
|
|
9,473,004 |
|
|
|
3,798,431 |
|
|
|
35,517,442 |
|
|
|
5,031,045 |
|
|
|
94,761,427 |
|
|
|
|
|
|
|
|
|
|
|
|
|
|
|
|
|
|
|
|
|
|
|
|
|
|
|
|
|
|
| Total |
|
|
66,148,924 |
|
|
|
58,039,972 |
|
|
|
71,717,079 |
|
|
|
8,015,205 |
|
|
|
164,273,062 |
|
|
|
26,616,041 |
|
|
|
394,810,283 |
|
|
|
|
|
|
|
|
|
|
|
|
|
|
|
|
|
|
|
|
|
|
|
|
|
|
|
|
|
|
|
|
| |
|
December 31, 2016 |
|
| |
|
Service |
|
|
Manufacturing |
|
|
Finance and
insurance |
|
|
Construction |
|
|
Individuals |
|
|
Others |
|
|
Total |
|
| Loans and receivables |
|
|
46,040,278 |
|
|
|
35,652,974 |
|
|
|
37,711,983 |
|
|
|
3,789,670 |
|
|
|
125,558,637 |
|
|
|
9,639,091 |
|
|
|
258,392,633 |
|
| Financial assets at FVTPL |
|
|
77,198 |
|
|
|
360,881 |
|
|
|
4,093,567 |
|
|
|
24,140 |
|
|
|
993 |
|
|
|
1,016,960 |
|
|
|
5,573,739 |
|
| AFS debt securities |
|
|
1,092,279 |
|
|
|
57,781 |
|
|
|
9,568,151 |
|
|
|
63,166 |
|
|
|
— |
|
|
|
5,760,511 |
|
|
|
16,541,888 |
|
| HTM securities |
|
|
1,673,971 |
|
|
|
— |
|
|
|
8,290,451 |
|
|
|
251,599 |
|
|
|
— |
|
|
|
3,694,230 |
|
|
|
13,910,251 |
|
| Derivative assets |
|
|
— |
|
|
|
— |
|
|
|
140,577 |
|
|
|
— |
|
|
|
— |
|
|
|
— |
|
|
|
140,577 |
|
| Off-balance accounts |
|
|
18,423,611 |
|
|
|
26,878,320 |
|
|
|
9,927,574 |
|
|
|
4,621,971 |
|
|
|
33,603,651 |
|
|
|
5,102,153 |
|
|
|
98,557,280 |
|
|
|
|
|
|
|
|
|
|
|
|
|
|
|
|
|
|
|
|
|
|
|
|
|
|
|
|
|
|
| Total |
|
|
67,307,337 |
|
|
|
62,949,956 |
|
|
|
69,732,303 |
|
|
|
8,750,546 |
|
|
|
159,163,281 |
|
|
|
25,212,945 |
|
|
|
393,116,368 |
|
|
|
|
|
|
|
|
|
|
|
|
|
|
|
|
|
|
|
|
|
|
|
|
|
|
|
|
|
|
- 13 -
| |
3) |
Credit risk of loans and receivables |
The credit exposure of loans and receivables by customer
and loan condition is as follows (Unit: Korean Won in millions):
|
|
|
|
|
|
|
|
|
|
|
|
|
|
|
|
|
|
|
|
|
|
|
|
|
|
|
|
|
|
|
|
|
| |
|
June 30, 2017 |
|
| |
Korean
treasury and
government
agencies |
|
|
|
|
|
Corporates |
|
|
|
|
|
|
|
| |
|
Banks |
|
|
General
business |
|
|
Small &
medium sized
enterprise |
|
|
Project
financing
and others |
|
|
Sub-total |
|
|
Consumers |
|
|
Total |
|
| Loans and receivables neither overdue nor impaired |
|
|
12,657,346 |
|
|
|
27,001,307 |
|
|
|
49,843,626 |
|
|
|
32,633,174 |
|
|
|
6,250,349 |
|
|
|
88,727,149 |
|
|
|
135,376,614 |
|
|
|
263,762,416 |
|
| Loans and receivables overdue but not impaired |
|
|
339 |
|
|
|
— |
|
|
|
61,757 |
|
|
|
42,780 |
|
|
|
— |
|
|
|
104,537 |
|
|
|
791,637 |
|
|
|
896,513 |
|
| Impaired loans and receivables |
|
|
— |
|
|
|
— |
|
|
|
1,187,525 |
|
|
|
352,363 |
|
|
|
140,846 |
|
|
|
1,680,734 |
|
|
|
536,133 |
|
|
|
2,216,867 |
|
|
|
|
|
|
|
|
|
|
|
|
|
|
|
|
|
|
|
|
|
|
|
|
|
|
|
|
|
|
|
|
|
|
| Gross loans and receivables |
|
|
12,,657,685 |
|
|
|
27,001,307 |
|
|
|
51,092,908 |
|
|
|
33,028,317 |
|
|
|
6,391,195 |
|
|
|
90,512,420 |
|
|
|
136,704,384 |
|
|
|
266,875,796 |
|
|
|
|
|
|
|
|
|
|
|
|
|
|
|
|
|
|
|
|
|
|
|
|
|
|
|
|
|
|
|
|
|
|
| Allowance for credit losses |
|
|
3,247 |
|
|
|
17,963 |
|
|
|
891,356 |
|
|
|
370,916 |
|
|
|
41,218 |
|
|
|
1,303,490 |
|
|
|
402,472 |
|
|
|
1,727,172 |
|
|
|
|
|
|
|
|
|
|
|
|
|
|
|
|
|
|
|
|
|
|
|
|
|
|
|
|
|
|
|
|
|
|
| Total, net |
|
|
12,654,438 |
|
|
|
26,983,344 |
|
|
|
50,201,552 |
|
|
|
32,657,401 |
|
|
|
6,349,977 |
|
|
|
89,208,930 |
|
|
|
136,301,912 |
|
|
|
265,148,624 |
|
|
|
|
|
|
|
|
|
|
|
|
|
|
|
|
|
|
|
|
|
|
|
|
|
|
|
|
|
|
|
|
|
|
|
|
| |
|
December 31, 2016 |
|
| |
Korean
treasury and
government
agencies |
|
|
|
|
|
Corporates |
|
|
|
|
|
|
|
| |
|
Banks |
|
|
General
business |
|
|
Small &
medium sized
enterprise |
|
|
Project
financing
and others |
|
|
Sub-total |
|
|
Consumers |
|
|
Total |
|
| Loans and receivables neither overdue nor impaired |
|
|
16,062,399 |
|
|
|
20,258,860 |
|
|
|
49,815,352 |
|
|
|
31,520,617 |
|
|
|
7,142,440 |
|
|
|
88,478,409 |
|
|
|
132,195,005 |
|
|
|
256,994,673 |
|
| Loans and receivables overdue but not impaired |
|
|
— |
|
|
|
— |
|
|
|
48,294 |
|
|
|
57,245 |
|
|
|
— |
|
|
|
105,539 |
|
|
|
765,829 |
|
|
|
871,368 |
|
| Impaired loans and receivables |
|
|
— |
|
|
|
— |
|
|
|
1,404,568 |
|
|
|
429,955 |
|
|
|
208,372 |
|
|
|
2,042,895 |
|
|
|
510,793 |
|
|
|
2,553,688 |
|
|
|
|
|
|
|
|
|
|
|
|
|
|
|
|
|
|
|
|
|
|
|
|
|
|
|
|
|
|
|
|
|
|
| Gross loans and receivables |
|
|
16,062,399 |
|
|
|
20,258,860 |
|
|
|
51,268,214 |
|
|
|
32,007,817 |
|
|
|
7,350,812 |
|
|
|
90,626,843 |
|
|
|
133,471,627 |
|
|
|
260,419,729 |
|
|
|
|
|
|
|
|
|
|
|
|
|
|
|
|
|
|
|
|
|
|
|
|
|
|
|
|
|
|
|
|
|
|
| Allowance for credit losses |
|
|
4,094 |
|
|
|
16,600 |
|
|
|
1,156,000 |
|
|
|
424,142 |
|
|
|
61,135 |
|
|
|
1,641,277 |
|
|
|
365,125 |
|
|
|
2,027,096 |
|
|
|
|
|
|
|
|
|
|
|
|
|
|
|
|
|
|
|
|
|
|
|
|
|
|
|
|
|
|
|
|
|
|
| Total, net |
|
|
16,058,305 |
|
|
|
20,242,260 |
|
|
|
50,112,214 |
|
|
|
31,583,675 |
|
|
|
7,289,677 |
|
|
|
88,985,566 |
|
|
|
133,106,502 |
|
|
|
258,392,633 |
|
|
|
|
|
|
|
|
|
|
|
|
|
|
|
|
|
|
|
|
|
|
|
|
|
|
|
|
|
|
|
|
|
|
- 14 -
| |
a) |
Credit quality of loans and receivables |
The Group manages credit quality of its loans and
receivables, (neither overdue nor impaired, net of allowance) through an internal rating system. Segregation of credit quality is as follows (Unit: Korean Won in millions):
|
|
|
|
|
|
|
|
|
|
|
|
|
|
|
|
|
|
|
|
|
|
|
|
|
|
|
|
|
|
|
|
|
| |
|
June 30, 2017 |
|
| |
Korean
treasury and
government
agencies |
|
|
|
|
|
Corporates |
|
|
|
|
|
|
|
| |
|
Banks |
|
|
General
business |
|
|
Small &
medium
sized
enterprise |
|
|
Project
financing
and others |
|
|
Sub-total |
|
|
Consumers |
|
|
Total |
|
| Upper grade (*1) |
|
|
12,654,075 |
|
|
|
26,983,344 |
|
|
|
42,088,774 |
|
|
|
20,857,697 |
|
|
|
5,226,763 |
|
|
|
68,173,234 |
|
|
|
131,870,084 |
|
|
|
239,680,737 |
|
| Lower grade (*2) |
|
|
24 |
|
|
|
— |
|
|
|
7,407,841 |
|
|
|
11,582,548 |
|
|
|
994,105 |
|
|
|
19,984,494 |
|
|
|
3,358,233 |
|
|
|
23,342,751 |
|
|
|
|
|
|
|
|
|
|
|
|
|
|
|
|
|
|
|
|
|
|
|
|
|
|
|
|
|
|
|
|
|
|
| Total |
|
|
12,654,099 |
|
|
|
26,983,344 |
|
|
|
49,496,615 |
|
|
|
32,440,245 |
|
|
|
6,220,868 |
|
|
|
88,157,728 |
|
|
|
135,228,317 |
|
|
|
263,023,488 |
|
|
|
|
|
|
|
|
|
|
|
|
|
|
|
|
|
|
|
|
|
|
|
|
|
|
|
|
|
|
|
|
|
|
| Value of collateral(*3) |
|
|
— |
|
|
|
416,873 |
|
|
|
19,138,772 |
|
|
|
26,256,124 |
|
|
|
3,257,476 |
|
|
|
48,652,372 |
|
|
|
111,872,000 |
|
|
|
160,941,245 |
|
|
|
|
|
|
|
|
|
|
|
|
|
|
|
|
|
|
|
|
|
|
|
|
|
|
|
|
|
|
|
|
|
|
|
|
| |
|
December 31, 2016 |
|
| |
Korean
treasury and
government
agencies |
|
|
|
|
|
Corporates |
|
|
|
|
|
|
|
| |
|
Banks |
|
|
General
business |
|
|
Small &
medium
sized
enterprise |
|
|
Project
financing
and others |
|
|
Sub-total |
|
|
Consumers |
|
|
Total |
|
| Upper grade (*1) |
|
|
16,058,288 |
|
|
|
20,242,260 |
|
|
|
41,461,420 |
|
|
|
18,755,963 |
|
|
|
5,337,033 |
|
|
|
65,554,416 |
|
|
|
128,374,017 |
|
|
|
230,228,981 |
|
| Lower grade (*2) |
|
|
17 |
|
|
|
— |
|
|
|
7,941,871 |
|
|
|
12,550,282 |
|
|
|
1,763,658 |
|
|
|
22,255,811 |
|
|
|
3,680,920 |
|
|
|
25,936,748 |
|
|
|
|
|
|
|
|
|
|
|
|
|
|
|
|
|
|
|
|
|
|
|
|
|
|
|
|
|
|
|
|
|
|
| Total |
|
|
16,058,305 |
|
|
|
20,242,260 |
|
|
|
49,403,291 |
|
|
|
31,306,245 |
|
|
|
7,100,691 |
|
|
|
87,810,227 |
|
|
|
132,054,937 |
|
|
|
256,165,729 |
|
|
|
|
|
|
|
|
|
|
|
|
|
|
|
|
|
|
|
|
|
|
|
|
|
|
|
|
|
|
|
|
|
|
| Value of collateral(*3) |
|
|
— |
|
|
|
358,456 |
|
|
|
18,003,674 |
|
|
|
25,493,006 |
|
|
|
3,996,162 |
|
|
|
47,492,842 |
|
|
|
111,054,910 |
|
|
|
158,906,208 |
|
|
|
|
|
|
|
|
|
|
|
|
|
|
|
|
|
|
|
|
|
|
|
|
|
|
|
|
|
|
|
|
|
|
| (*1) |
AAA~BBB for corporates, and 1~6 level for consumers |
| (*2) |
BBB- ~C for corporates, and 7~10 level for consumers |
| (*3) |
The value of collateral held is the recoverable amount used when calculating allowance for credit losses. |
Allowances for credit losses, for loans and receivables neither overdue nor impaired, amounting to 738,928 million Won and
828,944 million Won as of June 30, 2017 and as of December 31, 2016, respectively, which are deducted from the loans and receivables above.
| |
b) |
Aging analysis of loans and receivables |
Aging analysis of loans and receivables (overdue but
not impaired, net of allowance) is as follows (Unit: Korean Won in millions):
|
|
|
|
|
|
|
|
|
|
|
|
|
|
|
|
|
|
|
|
|
|
|
|
|
|
|
|
|
|
|
|
|
| |
|
June 30, 2017 |
|
| Past due |
|
Korean
treasury and
government
agencies |
|
|
Banks |
|
|
Corporates |
|
|
Consumers |
|
|
Total |
|
| |
|
|
General
business |
|
|
Small &
medium sized
enterprise |
|
|
Project
financing
and others |
|
|
Sub-total |
|
|
|
| Less than 30 days |
|
|
339 |
|
|
|
— |
|
|
|
43,678 |
|
|
|
30,007 |
|
|
|
— |
|
|
|
73,685 |
|
|
|
617,611 |
|
|
|
691,635 |
|
| 30~59 days |
|
|
— |
|
|
|
— |
|
|
|
4,482 |
|
|
|
6,948 |
|
|
|
— |
|
|
|
11,430 |
|
|
|
86,620 |
|
|
|
98,050 |
|
| 60~89 days |
|
|
— |
|
|
|
— |
|
|
|
8,721 |
|
|
|
2,580 |
|
|
|
— |
|
|
|
11,301 |
|
|
|
44,025 |
|
|
|
55,326 |
|
|
|
|
|
|
|
|
|
|
|
|
|
|
|
|
|
|
|
|
|
|
|
|
|
|
|
|
|
|
|
|
|
|
| Total |
|
|
339 |
|
|
|
— |
|
|
|
56,881 |
|
|
|
39,535 |
|
|
|
— |
|
|
|
96,416 |
|
|
|
748,256 |
|
|
|
845,011 |
|
|
|
|
|
|
|
|
|
|
|
|
|
|
|
|
|
|
|
|
|
|
|
|
|
|
|
|
|
|
|
|
|
|
| Value of collateral (*) |
|
|
— |
|
|
|
— |
|
|
|
7,782 |
|
|
|
27,518 |
|
|
|
— |
|
|
|
35,300 |
|
|
|
559,652 |
|
|
|
594,952 |
|
|
|
|
|
|
|
|
|
|
|
|
|
|
|
|
|
|
|
|
|
|
|
|
|
|
|
|
|
|
|
|
|
|
|
|
| |
|
December 31, 2016 |
|
| Past due |
|
Korean
treasury and
government
agencies |
|
|
Banks |
|
|
Corporates |
|
|
Consumers |
|
|
Total |
|
| |
|
|
General
business |
|
|
Small &
medium sized
enterprise |
|
|
Project
financing
and others |
|
|
Sub-total |
|
|
|
| Less than 30 days |
|
|
— |
|
|
|
— |
|
|
|
45,255 |
|
|
|
41,329 |
|
|
|
— |
|
|
|
86,584 |
|
|
|
584,995 |
|
|
|
671,579 |
|
| 30~59 days |
|
|
— |
|
|
|
— |
|
|
|
1,553 |
|
|
|
8,933 |
|
|
|
— |
|
|
|
10,486 |
|
|
|
90,296 |
|
|
|
100,782 |
|
| 60~89 days |
|
|
— |
|
|
|
— |
|
|
|
337 |
|
|
|
2,123 |
|
|
|
— |
|
|
|
2,460 |
|
|
|
49,151 |
|
|
|
51,611 |
|
|
|
|
|
|
|
|
|
|
|
|
|
|
|
|
|
|
|
|
|
|
|
|
|
|
|
|
|
|
|
|
|
|
| Total |
|
|
— |
|
|
|
— |
|
|
|
47,145 |
|
|
|
52,385 |
|
|
|
— |
|
|
|
99,530 |
|
|
|
724,442 |
|
|
|
823,972 |
|
|
|
|
|
|
|
|
|
|
|
|
|
|
|
|
|
|
|
|
|
|
|
|
|
|
|
|
|
|
|
|
|
|
| Value of collateral (*) |
|
|
— |
|
|
|
— |
|
|
|
7,021 |
|
|
|
45,304 |
|
|
|
— |
|
|
|
52,325 |
|
|
|
546,164 |
|
|
|
598,489 |
|
|
|
|
|
|
|
|
|
|
|
|
|
|
|
|
|
|
|
|
|
|
|
|
|
|
|
|
|
|
|
|
|
|
| (*) |
The value of collateral held is the recoverable amount used when calculating allowance for credit losses. |
- 15 -
Allowances for credit losses, for loans and receivables that are overdue but not impaired,
amounting to 51,502 million Won and 47,396 million Won as of June 30, 2017 and December 31, 2016, respectively, which are deducted from the loans and receivables above.
| |
c) |
Impaired loans and receivables |
Impaired loans and receivables, net of allowance are as
follows (Unit: Korean Won in millions):
|
|
|
|
|
|
|
|
|
|
|
|
|
|
|
|
|
|
|
|
|
|
|
|
|
|
|
|
|
|
|
|
|
| |
|
June 30, 2017 |
|
| |
|
Korean
treasury and
government
agencies |
|
|
Banks |
|
|
Corporates |
|
|
Consumers |
|
|
Total |
|
| |
|
|
General
business |
|
|
Small &
medium sized
enterprise |
|
|
Project
financing
and others |
|
|
Sub-total |
|
|
|
| Impaired loans |
|
|
— |
|
|
|
— |
|
|
|
648,056 |
|
|
|
177,621 |
|
|
|
129,109 |
|
|
|
954,786 |
|
|
|
325,339 |
|
|
|
1,280,125 |
|
| Value of collateral (*) |
|
|
— |
|
|
|
— |
|
|
|
534,481 |
|
|
|
199,004 |
|
|
|
42,761 |
|
|
|
776,246 |
|
|
|
243,600 |
|
|
|
1,019,846 |
|
|
|
| |
|
December 31, 2016 |
|
| |
|
Korean
treasury and
government
agencies |
|
|
Banks |
|
|
Corporates |
|
|
Consumers |
|
|
Total |
|
| |
|
|
General
business |
|
|
Small &
medium sized
enterprise |
|
|
Project
financing
and others |
|
|
Sub-total |
|
|
|
| Impaired loans |
|
|
— |
|
|
|
— |
|
|
|
661,778 |
|
|
|
225,045 |
|
|
|
188,986 |
|
|
|
1,075,809 |
|
|
|
327,123 |
|
|
|
1,402,932 |
|
| Value of collateral (*) |
|
|
— |
|
|
|
— |
|
|
|
482,680 |
|
|
|
236,954 |
|
|
|
42,166 |
|
|
|
761,800 |
|
|
|
250,583 |
|
|
|
1,012,383 |
|
| (*) |
The value of collateral held is recoverable amount used when calculating allowance for credit losses. |
Allowances for credit losses, for impaired loans and receivables amounting to 936,742 million Won and 1,150,756 million Won as of
June 30, 2017 and December 31, 2016, respectively, are deducted from the impaired loans and receivables above.
| |
4) |
Credit quality of debt securities |
The Group manages debt securities based on the external
credit rating. Credit soundness of debt securities on the basis of External Credit Assessment Institution (ECAI)’s rating is as follows (Unit: Korean Won in millions):
|
|
|
|
|
|
|
|
|
|
|
|
|
|
|
|
|
| |
|
June 30, 2017 |
|
| |
|
Financial assets at
FVTPL (*) |
|
|
AFS debt
securities |
|
|
HTM securities |
|
|
Total |
|
| AAA |
|
|
1,784,374 |
|
|
|
11,403,174 |
|
|
|
14,435,935 |
|
|
|
27,623,483 |
|
| AA- ~ AA+ |
|
|
803,146 |
|
|
|
2,873,585 |
|
|
|
685,184 |
|
|
|
4,360,915 |
|
| BBB- ~ A+ |
|
|
222,260 |
|
|
|
787,938 |
|
|
|
22,261 |
|
|
|
1,032,459 |
|
| Below BBB- |
|
|
6,539 |
|
|
|
59,037 |
|
|
|
2,386 |
|
|
|
67,962 |
|
|
|
|
|
|
|
|
|
|
|
|
|
|
|
|
|
|
| Total |
|
|
2,816,319 |
|
|
|
15,123,734 |
|
|
|
15,144,766 |
|
|
|
33,084,819 |
|
|
|
|
|
|
|
|
|
|
|
|
|
|
|
|
|
|
|
|
| |
|
December 31, 2016 |
|
| |
|
Financial assets at
FVTPL (*) |
|
|
AFS debt
securities |
|
|
HTM securities |
|
|
Total |
|
| AAA |
|
|
1,658,332 |
|
|
|
12,490,934 |
|
|
|
13,342,384 |
|
|
|
27,491,650 |
|
| AA- ~ AA+ |
|
|
720,535 |
|
|
|
3,372,310 |
|
|
|
466,401 |
|
|
|
4,559,246 |
|
| BBB- ~ A+ |
|
|
266,049 |
|
|
|
618,736 |
|
|
|
101,466 |
|
|
|
986,251 |
|
| Below BBB- |
|
|
4,348 |
|
|
|
59,908 |
|
|
|
— |
|
|
|
64,256 |
|
|
|
|
|
|
|
|
|
|
|
|
|
|
|
|
|
|
| Total |
|
|
2,649,264 |
|
|
|
16,541,888 |
|
|
|
13,910,251 |
|
|
|
33,101,403 |
|
|
|
|
|
|
|
|
|
|
|
|
|
|
|
|
|
|
| (*) |
Financial assets at FVTPL comprise debt securities held for trading and financial assets designated at FVTPL. |
- 16 -
Market risk is the possible risk of loss arising from trading activities and non-trading activities in the volatility of market factors such as interest rates, stock prices and foreign exchange rates. Market risk occurs as a result of changes in the interest rates and foreign exchange rates
for financial instruments that are not yet settled, and all contracts are exposed to a certain level of volatility according to changes in the interest rates, credit spreads, foreign exchange rates and the price of equity securities.
| |
1) |
Market risk management |
For trading activities and
non-trading activities, the Group avoids, bears, or mitigates risks by identifying the underlying source of the risks, measuring parameters and evaluating their appropriateness.
On a yearly basis, the Risk Management Committee establishes a Value at Risk (“VaR”, maximum losses) limit, loss limit and risk
capital limit by subsidiaries for its management purposes. The limit by investment desk/dealer is independently managed to the extent of the limit given to subsidiaries and the limit by investment and loss cut is managed by the risk management
personnel within the department.
The Group uses both a standard-based and an internal model-based approach to measure market risk. The
standard-based approach is used to calculate individual market risk of owned capital while the internal model-based approach is used to calculate general capital market risk and it is used to measure internal risk management measure. For the trading
activities, the Risk Management department measures the VaR limit by department, risk factor and loss limit on a daily basis and reports regularly to the Risk Management Committee.
| |
2) |
Sensitivity analysis of market risk |
The Group performs the sensitivity analyses both for
trading and for non-trading activities.
For trading activities, the Group uses a VaR model that
uses certain assumptions of possible fluctuations in market condition and, by conducting simulations of gains and losses, under which the model estimates the maximum losses that may occur. A VaR model predicts based on statistics of possible losses
on the portfolio at a certain period currently or in the future. It indicates the maximum expected loss with at least 99% credibility. In short, there exists a one percent possibility that the actual loss might exceed the predicted loss generated
from the VaR calculation. The actual results are periodically monitored to examine the validity of the assumptions, variables, and factors that are used in VaR calculations. However, this approach cannot prevent the loss when the market fluctuation
exceeds expectation.
For the non-trading activities, interest rate Earning at Risk
(“EaR”) and interest rate VaR, which is based on the simulations of the Net Interest Income (“NII”) and Net Present Value (“NPV”), are calculated for the Bank, and the risks for all other subsidiaries are measured and
managed by the interest rate EaR and the interest rate VaR calculations based on the Bank for International Settlements (“BIS”) Framework.
NII is a profit-based indicator for displaying the profit changes in short term due to the short-term interest changes. It will be estimated as
subtracting interest expenses of liabilities from the interest income of assets. NPV is an indicator for displaying risks in economic view according to unfavorable changes related to interest rate. It will be estimated as subtracting the present
value of liabilities from the present value of assets.
EaR shows the maximum profit-loss amount, which indicates the maximum deduction
amount caused by the unfavorable changes related to the interest rate of a certain period (i.e. 1 year). Interest rate VaR shows the potential maximum loss generated by the unfavorable changes during a certain period of time in the present or
future.
- 17 -
The minimum, maximum and average VaR for the six months ended June 30,
2017 and the year ended December 31, 2016, respectively, and the VaR as of June 30, 2017 and December 31, 2016, respectively, are as follows (Unit: Korean Won in millions):
|
|
|
|
|
|
|
|
|
|
|
|
|
|
|
|
|
|
|
|
|
|
|
|
|
|
|
|
|
|
|
|
|
| |
|
As of
June 30,
2017 |
|
|
For the six months ended
June 30, 2017 |
|
|
As of
December 31,
2016 |
|
|
For the year ended
December 31, 2016 |
|
| Risk factor |
|
|
Average |
|
|
Maximum |
|
|
Minimum |
|
|
|
Average |
|
|
Maximum |
|
|
Minimum |
|
| Interest rate |
|
|
3,454 |
|
|
|
3,909 |
|
|
|
4,918 |
|
|
|
3,121 |
|
|
|
3,250 |
|
|
|
2,844 |
|
|
|
6,430 |
|
|
|
1,367 |
|
| Stock price |
|
|
2,954 |
|
|
|
3,124 |
|
|
|
4,419 |
|
|
|
1,523 |
|
|
|
4,191 |
|
|
|
3,456 |
|
|
|
5,063 |
|
|
|
2,304 |
|
| Foreign currencies |
|
|
5,452 |
|
|
|
4,648 |
|
|
|
5,452 |
|
|
|
4,061 |
|
|
|
4,396 |
|
|
|
4,914 |
|
|
|
7,686 |
|
|
|
3,967 |
|
| Commodity price |
|
|
33 |
|
|
|
47 |
|
|
|
188 |
|
|
|
8 |
|
|
|
152 |
|
|
|
113 |
|
|
|
325 |
|
|
|
21 |
|
| Diversification |
|
|
(5,406 |
) |
|
|
(4,546 |
) |
|
|
(5,614 |
) |
|
|
(2,805 |
) |
|
|
(5,630 |
) |
|
|
(5,355 |
) |
|
|
(10,385 |
) |
|
|
(4,034 |
) |
|
|
|
|
|
|
|
|
|
|
|
|
|
|
|
|
|
|
|
|
|
|
|
|
|
|
|
|
|
|
|
|
|
| Total VaR |
|
|
6,487 |
|
|
|
7,182 |
|
|
|
9,363 |
|
|
|
5,908 |
|
|
|
6,359 |
|
|
|
5,972 |
|
|
|
9,119 |
|
|
|
3,625 |
|
|
|
|
|
|
|
|
|
|
|
|
|
|
|
|
|
|
|
|
|
|
|
|
|
|
|
|
|
|
|
|
|
|
| |
b) |
Non-trading activities |
The NII and NPV are calculated
for the assets and liabilities owned by the Bank and consolidated trusts, respectively, by using the simulation method. The scenario responding to interest rate (“IR”) changes are as follows (Unit: Korean Won in millions):
|
|
|
|
|
|
|
|
|
|
|
|
|
|
|
|
|
| |
|
June 30, 2017 |
|
|
December 31, 2016 |
|
| |
NII |
|
|
NPV |
|
|
NII |
|
|
NPV |
|
| Base case |
|
|
4,446,673 |
|
|
|
21,179,172 |
|
|
|
4,367,411 |
|
|
|
21,556,632 |
|
| Base case (Prepay) |
|
|
4,452,332 |
|
|
|
20,415,445 |
|
|
|
4,384,783 |
|
|
|
20,666,425 |
|
| IR 100bp up |
|
|
4,864,061 |
|
|
|
20,730,950 |
|
|
|
4,802,118 |
|
|
|
20,893,490 |
|
| IR 100bp down |
|
|
3,970,489 |
|
|
|
21,681,563 |
|
|
|
3,903,129 |
|
|
|
22,279,204 |
|
| IR 200bp up |
|
|
5,281,457 |
|
|
|
20,331,553 |
|
|
|
5,236,879 |
|
|
|
20,289,742 |
|
| IR 200bp down |
|
|
3,043,264 |
|
|
|
22,237,912 |
|
|
|
2,975,351 |
|
|
|
23,052,848 |
|
| IR 300bp up |
|
|
5,698,851 |
|
|
|
19,975,861 |
|
|
|
5,671,639 |
|
|
|
19,742,627 |
|
| IR 300bp down |
|
|
2,001,336 |
|
|
|
24,157,018 |
|
|
|
1,968,273 |
|
|
|
25,096,193 |
|
The interest EaR and VaR calculated based on the BIS Framework of subsidiaries other than the Bank and
consolidated trusts are as follows (Unit: Korean Won in millions):
|
|
|
|
|
|
|
|
|
|
|
|
|
|
|
| June 30, 2017 |
|
|
December 31, 2016 |
|
| EaR |
|
|
VaR |
|
|
EaR |
|
|
VaR |
|
| |
225,370 |
|
|
|
136,770 |
|
|
|
188,381 |
|
|
|
110,335 |
|
- 18 -
The Group estimates and manages risks related to changes in interest rate due to the difference
in the maturities of interest-bearing assets and liabilities and discrepancies in the terms of interest rates. Cash flows of principal amounts and interests from interest bearing assets and liabilities by
re-pricing date are as follows (Unit: Korean Won in millions):
|
|
|
|
|
|
|
|
|
|
|
|
|
|
|
|
|
|
|
|
|
|
|
|
|
|
|
|
|
| |
|
June 30, 2017 |
|
| |
|
Within 3
months |
|
|
4 to 6
months |
|
|
7 to 9
months |
|
|
10 to 12
months |
|
|
1 to 5
years |
|
|
Over 5 years |
|
|
Total |
|
| Asset: |
|
|
|
|
|
|
|
|
|
|
|
|
|
|
|
|
|
|
|
|
|
|
|
|
|
|
|
|
| Loans and receivables |
|
|
149,355,501 |
|
|
|
39,968,822 |
|
|
|
10,448,444 |
|
|
|
9,820,744 |
|
|
|
57,287,227 |
|
|
|
39,668,797 |
|
|
|
306,549,535 |
|
| AFS financial assets |
|
|
3,161,393 |
|
|
|
3,637,054 |
|
|
|
1,891,492 |
|
|
|
2,892,768 |
|
|
|
5,280,696 |
|
|
|
672,372 |
|
|
|
17,535,775 |
|
| HTM financial assets |
|
|
2,291,614 |
|
|
|
1,482,250 |
|
|
|
1,272,929 |
|
|
|
1,869,681 |
|
|
|
8,514,246 |
|
|
|
385,218 |
|
|
|
15,815,938 |
|
|
|
|
|
|
|
|
|
|
|
|
|
|
|
|
|
|
|
|
|
|
|
|
|
|
|
|
|
|
| Total |
|
|
154,808,508 |
|
|
|
45,088,126 |
|
|
|
13,612,865 |
|
|
|
14,583,193 |
|
|
|
71,082,169 |
|
|
|
40,726,387 |
|
|
|
339,901,248 |
|
|
|
|
|
|
|
|
|
|
|
|
|
|
|
|
|
|
|
|
|
|
|
|
|
|
|
|
|
|
| Liability: |
|
|
|
|
|
|
|
|
|
|
|
|
|
|
|
|
|
|
|
|
|
|
|
|
|
|
|
|
| Deposits due to customers |
|
|
96,202,309 |
|
|
|
40,528,239 |
|
|
|
28,639,228 |
|
|
|
23,643,820 |
|
|
|
37,355,584 |
|
|
|
24,958 |
|
|
|
226,394,138 |
|
| Borrowings |
|
|
11,013,414 |
|
|
|
651,775 |
|
|
|
686,099 |
|
|
|
385,342 |
|
|
|
2,687,313 |
|
|
|
428,381 |
|
|
|
15,852,324 |
|
| Debentures |
|
|
912,953 |
|
|
|
1,585,338 |
|
|
|
1,884,910 |
|
|
|
2,429,387 |
|
|
|
17,325,774 |
|
|
|
3,387,722 |
|
|
|
27,526,084 |
|
|
|
|
|
|
|
|
|
|
|
|
|
|
|
|
|
|
|
|
|
|
|
|
|
|
|
|
|
|
| Total |
|
|
108,128,676 |
|
|
|
42,765,352 |
|
|
|
31,210,237 |
|
|
|
26,458,549 |
|
|
|
57,368,671 |
|
|
|
3,841,061 |
|
|
|
269,772,546 |
|
|
|
|
|
|
|
|
|
|
|
|
|
|
|
|
|
|
|
|
|
|
|
|
|
|
|
|
|
|
|
|
| |
|
December 31, 2016 |
|
| |
|
Within 3
months |
|
|
4 to 6
months |
|
|
7 to 9
months |
|
|
10 to 12
months |
|
|
1 to 5
years |
|
|
Over 5 years |
|
|
Total |
|
| Asset: |
|
|
|
|
|
|
|
|
|
|
|
|
|
|
|
|
|
|
|
|
|
|
|
|
|
|
|
|
| Loans and receivables |
|
|
148,237,350 |
|
|
|
42,032,667 |
|
|
|
8,064,502 |
|
|
|
7,757,087 |
|
|
|
55,838,192 |
|
|
|
35,245,734 |
|
|
|
297,175,532 |
|
| AFS financial assets |
|
|
3,165,094 |
|
|
|
2,946,992 |
|
|
|
2,854,514 |
|
|
|
2,915,226 |
|
|
|
5,029,918 |
|
|
|
713,596 |
|
|
|
17,625,340 |
|
| HTM financial assets |
|
|
2,770,079 |
|
|
|
1,515,213 |
|
|
|
1,246,503 |
|
|
|
1,143,170 |
|
|
|
6,853,951 |
|
|
|
892,030 |
|
|
|
14,420,946 |
|
|
|
|
|
|
|
|
|
|
|
|
|
|
|
|
|
|
|
|
|
|
|
|
|
|
|
|
|
|
| Total |
|
|
154,172,523 |
|
|
|
46,494,872 |
|
|
|
12,165,519 |
|
|
|
11,815,483 |
|
|
|
67,722,061 |
|
|
|
36,851,360 |
|
|
|
329,221,818 |
|
|
|
|
|
|
|
|
|
|
|
|
|
|
|
|
|
|
|
|
|
|
|
|
|
|
|
|
|
|
| Liability: |
|
|
|
|
|
|
|
|
|
|
|
|
|
|
|
|
|
|
|
|
|
|
|
|
|
|
|
|
| Deposits due to customers |
|
|
100,051,821 |
|
|
|
36,614,529 |
|
|
|
25,028,378 |
|
|
|
25,017,836 |
|
|
|
34,513,004 |
|
|
|
40,737 |
|
|
|
221,266,305 |
|
| Borrowings |
|
|
13,772,710 |
|
|
|
1,044,748 |
|
|
|
491,330 |
|
|
|
368,431 |
|
|
|
2,816,565 |
|
|
|
421,677 |
|
|
|
18,915,461 |
|
| Debentures |
|
|
2,109,235 |
|
|
|
2,077,681 |
|
|
|
860,455 |
|
|
|
1,545,943 |
|
|
|
14,613,799 |
|
|
|
4,143,773 |
|
|
|
25,350,886 |
|
|
|
|
|
|
|
|
|
|
|
|
|
|
|
|
|
|
|
|
|
|
|
|
|
|
|
|
|
|
| Total |
|
|
115,933,766 |
|
|
|
39,736,958 |
|
|
|
26,380,163 |
|
|
|
26,932,210 |
|
|
|
51,943,368 |
|
|
|
4,606,187 |
|
|
|
265,532,652 |
|
|
|
|
|
|
|
|
|
|
|
|
|
|
|
|
|
|
|
|
|
|
|
|
|
|
|
|
|
|
- 19 -
Currency risk arises from monetary financial instruments denominated in foreign
currencies other than the functional currency. Therefore, no currency risk arises from non-monetary items or financial instruments denominated in the functional currency.
Financial instruments in foreign currencies exposed to currency risk are as follows (Unit: USD in millions, JPY in millions, CNY in millions,
EUR in millions, and Korean Won in millions):
|
|
|
|
|
|
|
|
|
|
|
|
|
|
|
|
|
|
|
|
|
|
|
|
|
|
|
|
|
|
|
|
|
|
|
|
|
|
|
|
|
| |
|
June 30, 2017 |
|
| |
|
USD |
|
|
JPY |
|
|
CNY |
|
|
EUR |
|
|
Others |
|
|
Total |
|
| |
|
Foreign
currency |
|
|
Won
equivalent |
|
|
Foreign
currency |
|
|
Won
equivalent |
|
|
Foreign
currency |
|
|
Won
equivalent |
|
|
Foreign
currency |
|
|
Won
equivalent |
|
|
Won
equivalent |
|
|
Won
equivalent |
|
| Asset: |
|
|
|
|
|
|
|
|
|
|
|
|
|
|
|
|
|
|
|
|
|
|
|
|
|
|
|
|
|
|
|
|
|
|
|
|
|
|
|
|
| Loans and receivables |
|
|
24,062 |
|
|
|
27,420,596 |
|
|
|
147,944 |
|
|
|
1,505,401 |
|
|
|
25,851 |
|
|
|
4,337,547 |
|
|
|
1,527 |
|
|
|
1,990,673 |
|
|
|
3,742,654 |
|
|
|
38,996,871 |
|
| Financial assets at FVTPL |
|
|
37 |
|
|
|
42,056 |
|
|
|
39 |
|
|
|
398 |
|
|
|
— |
|
|
|
— |
|
|
|
44 |
|
|
|
57,341 |
|
|
|
52,223 |
|
|
|
152,018 |
|
| AFS financial assets |
|
|
1,374 |
|
|
|
1,566,165 |
|
|
|
— |
|
|
|
— |
|
|
|
— |
|
|
|
— |
|
|
|
— |
|
|
|
586 |
|
|
|
243,740 |
|
|
|
1,810,491 |
|
| HTM financial assets |
|
|
95 |
|
|
|
108,829 |
|
|
|
— |
|
|
|
— |
|
|
|
— |
|
|
|
— |
|
|
|
— |
|
|
|
— |
|
|
|
64,308 |
|
|
|
173,137 |
|
|
|
|
|
|
|
|
|
|
|
|
|
|
|
|
|
|
|
|
|
|
|
|
|
|
|
|
|
|
|
|
|
|
|
|
|
|
|
|
|
|
| Total |
|
|
25,568 |
|
|
|
29,137,646 |
|
|
|
147,983 |
|
|
|
1,505,799 |
|
|
|
25,851 |
|
|
|
4,337,547 |
|
|
|
1,571 |
|
|
|
2,048,600 |
|
|
|
4,102,925 |
|
|
|
41,132,517 |
|
|
|
|
|
|
|
|
|
|
|
|
|
|
|
|
|
|
|
|
|
|
|
|
|
|
|
|
|
|
|
|
|
|
|
|
|
|
|
|
|
|
|
|
|
|
|
|
|
|
|
|
|
|
|
|
|
|
|
|
|
|
|
|
|
|
|
|
|
|
|
|
|
|
|
|
|
|
|
|
|
|
|
| |
|
June 30, 2017 |
|
| |
|
USD |
|
|
JPY |
|
|
CNY |
|
|
EUR |
|
|
Others |
|
|
Total |
|
| |
|
Foreign
currency |
|
|
Won
equivalent |
|
|
Foreign
currency |
|
|
Won
equivalent |
|
|
Foreign
currency |
|
|
Won
equivalent |
|
|
Foreign
currency |
|
|
Won
equivalent |
|
|
Won
equivalent |
|
|
Won
equivalent |
|
| Liability: |
|
|
|
|
|
|
|
|
|
|
|
|
|
|
|
|
|
|
|
|
|
|
|
|
|
|
|
|
|
|
|
|
|
|
|
|
|
|
|
|
| Financial liabilities at FVTPL |
|
|
54 |
|
|
|
61,677 |
|
|
|
130 |
|
|
|
1,323 |
|
|
|
— |
|
|
|
— |
|
|
|
104 |
|
|
|
135,955 |
|
|
|
133,954 |
|
|
|
332,909 |
|
| Deposits due to customers |
|
|
10,878 |
|
|
|
12,396,481 |
|
|
|
153,066 |
|
|
|
1,557,527 |
|
|
|
22,178 |
|
|
|
3,721,286 |
|
|
|
631 |
|
|
|
822,348 |
|
|
|
2,145,895 |
|
|
|
20,643,537 |
|
| Borrowings |
|
|
6,715 |
|
|
|
7,657,836 |
|
|
|
3,845 |
|
|
|
39,130 |
|
|
|
833 |
|
|
|
139,711 |
|
|
|
231 |
|
|
|
301,799 |
|
|
|
155,939 |
|
|
|
8,294,415 |
|
| Debentures |
|
|
3,292 |
|
|
|
3,751,346 |
|
|
|
— |
|
|
|
— |
|
|
|
700 |
|
|
|
117,453 |
|
|
|
— |
|
|
|
— |
|
|
|
226,770 |
|
|
|
4,095,569 |
|
| Other financial liabilities |
|
|
4,150 |
|
|
|
4,729,604 |
|
|
|
53,132 |
|
|
|
540,648 |
|
|
|
6,049 |
|
|
|
1,014,909 |
|
|
|
312 |
|
|
|
406,868 |
|
|
|
727,169 |
|
|
|
7,419,198 |
|
|
|
|
|
|
|
|
|
|
|
|
|
|
|
|
|
|
|
|
|
|
|
|
|
|
|
|
|
|
|
|
|
|
|
|
|
|
|
|
|
|
| Total |
|
|
25,089 |
|
|
|
28,596,944 |
|
|
|
210,173 |
|
|
|
2,138,628 |
|
|
|
29,760 |
|
|
|
4,993,359 |
|
|
|
1,278 |
|
|
|
1,666,970 |
|
|
|
3,389,727 |
|
|
|
40,785,628 |
|
|
|
|
|
|
|
|
|
|
|
|
|
|
|
|
|
|
|
|
|
|
|
|
|
|
|
|
|
|
|
|
|
|
|
|
|
|
|
|
|
|
| Off-balance accounts |
|
|
7,868 |
|
|
|
8,966,835 |
|
|
|
31,874 |
|
|
|
324,345 |
|
|
|
1,071 |
|
|
|
179,681 |
|
|
|
317 |
|
|
|
413,908 |
|
|
|
485,638 |
|
|
|
10,370,407 |
|
|
|
|
|
|
|
|
|
|
|
|
|
|
|
|
|
|
|
|
|
|
|
|
|
|
|
|
|
|
|
|
|
|
|
|
|
|
|
|
|
|
|
|
|
|
|
|
|
|
|
|
|
|
|
|
|
|
|
|
|
|
|
|
|
|
|
|
|
|
|
|
|
|
|
|
|
|
|
|
|
|
|
| |
|
December 31, 2016 |
|
| |
|
USD |
|
|
JPY |
|
|
CNY |
|
|
EUR |
|
|
Others |
|
|
Total |
|
| |
|
Foreign
currency |
|
|
Won
equivalent |
|
|
Foreign
currency |
|
|
Won
equivalent |
|
|
Foreign
currency |
|
|
Won
equivalent |
|
|
Foreign
currency |
|
|
Won
equivalent |
|
|
Won
equivalent |
|
|
Won
equivalent |
|
| Asset: |
|
|
|
|
|
|
|
|
|
|
|
|
|
|
|
|
|
|
|
|
|
|
|
|
|
|
|
|
|
|
|
|
|
|
|
|
|
|
|
|
| Loans and receivables |
|
|
22,868 |
|
|
|
27,635,970 |
|
|
|
108,944 |
|
|
|
1,129,539 |
|
|
|
23,194 |
|
|
|
4,018,678 |
|
|
|
1,548 |
|
|
|
1,962,856 |
|
|
|
4,382,990 |
|
|
|
39,130,033 |
|
| Financial assets at FVTPL |
|
|
66 |
|
|
|
79,386 |
|
|
|
57 |
|
|
|
589 |
|
|
|
— |
|
|
|
— |
|
|
|
30 |
|
|
|
37,562 |
|
|
|
34,124 |
|
|
|
151,661 |
|
| AFS financial assets |
|
|
898 |
|
|
|
1,085,108 |
|
|
|
— |
|
|
|
— |
|
|
|
80 |
|
|
|
13,844 |
|
|
|
— |
|
|
|
570 |
|
|
|
144,799 |
|
|
|
1,244,321 |
|
| HTM financial assets |
|
|
17 |
|
|
|
20,517 |
|
|
|
— |
|
|
|
— |
|
|
|
— |
|
|
|
— |
|
|
|
— |
|
|
|
— |
|
|
|
143,535 |
|
|
|
164,052 |
|
|
|
|
|
|
|
|
|
|
|
|
|
|
|
|
|
|
|
|
|
|
|
|
|
|
|
|
|
|
|
|
|
|
|
|
|
|
|
|
|
|
| Total |
|
|
23,849 |
|
|
|
28,820,981 |
|
|
|
109,001 |
|
|
|
1,130,128 |
|
|
|
23,274 |
|
|
|
4,032,522 |
|
|
|
1,578 |
|
|
|
2,000,988 |
|
|
|
4,705,448 |
|
|
|
40,690,067 |
|
|
|
|
|
|
|
|
|
|
|
|
|
|
|
|
|
|
|
|
|
|
|
|
|
|
|
|
|
|
|
|
|
|
|
|
|
|
|
|
|
|
|
|
|
|
|
|
|
|
|
|
|
|
|
|
|
|
|
|
|
|
|
|
|
|
|
|
|
|
|
|
|
|
|
|
|
|
|
|
|
|
|
| |
|
December 31, 2016 |
|
| |
|
USD |
|
|
JPY |
|
|
CNY |
|
|
EUR |
|
|
Others |
|
|
Total |
|
| |
|
Foreign
currency |
|
|
Won
equivalent |
|
|
Foreign
currency |
|
|
Won
equivalent |
|
|
Foreign
currency |
|
|
Won
equivalent |
|
|
Foreign
currency |
|
|
Won
equivalent |
|
|
Won
equivalent |
|
|
Won
equivalent |
|
| Liability: |
|
|
|
|
|
|
|
|
|
|
|
|
|
|
|
|
|
|
|
|
|
|
|
|
|
|
|
|
|
|
|
|
|
|
|
|
|
|
|
|
| Financial liabilities at FVTPL |
|
|
75 |
|
|
|
90,908 |
|
|
|
253 |
|
|
|
2,621 |
|
|
|
— |
|
|
|
— |
|
|
|
88 |
|
|
|
111,098 |
|
|
|
115,980 |
|
|
|
320,607 |
|
| Deposits due to customers |
|
|
11,294 |
|
|
|
13,648,729 |
|
|
|
124,790 |
|
|
|
1,293,835 |
|
|
|
18,950 |
|
|
|
3,283,291 |
|
|
|
651 |
|
|
|
825,165 |
|
|
|
2,402,076 |
|
|
|
21,453,096 |
|
| Borrowings |
|
|
7,193 |
|
|
|
8,692,792 |
|
|
|
3,243 |
|
|
|
33,625 |
|
|
|
— |
|
|
|
— |
|
|
|
222 |
|
|
|
280,894 |
|
|
|
115,332 |
|
|
|
9,122,643 |
|
| Debentures |
|
|
2,931 |
|
|
|
3,541,769 |
|
|
|
— |
|
|
|
— |
|
|
|
700 |
|
|
|
121,282 |
|
|
|
— |
|
|
|
— |
|
|
|
228,720 |
|
|
|
3,891,771 |
|
| Other financial liabilities |
|
|
2,235 |
|
|
|
2,700,703 |
|
|
|
12,390 |
|
|
|
128,464 |
|
|
|
1,508 |
|
|
|
261,278 |
|
|
|
245 |
|
|
|
310,396 |
|
|
|
846,990 |
|
|
|
4,247,831 |
|
|
|
|
|
|
|
|
|
|
|
|
|
|
|
|
|
|
|
|
|
|
|
|
|
|
|
|
|
|
|
|
|
|
|
|
|
|
|
|
|
|
| Total |
|
|
23,728 |
|
|
|
28,674,901 |
|
|
|
140,676 |
|
|
|
1,458,545 |
|
|
|
21,158 |
|
|
|
3,665,851 |
|
|
|
1,206 |
|
|
|
1,527,553 |
|
|
|
3,709,098 |
|
|
|
39,035,948 |
|
|
|
|
|
|
|
|
|
|
|
|
|
|
|
|
|
|
|
|
|
|
|
|
|
|
|
|
|
|
|
|
|
|
|
|
|
|
|
|
|
|
| Off-balance accounts |
|
|
8,593 |
|
|
|
10,384,163 |
|
|
|
28,675 |
|
|
|
297,304 |
|
|
|
1,061 |
|
|
|
183,883 |
|
|
|
374 |
|
|
|
473,845 |
|
|
|
312,187 |
|
|
|
11,651,382 |
|
|
|
|
|
|
|
|
|
|
|
|
|
|
|
|
|
|
|
|
|
|
|
|
|
|
|
|
|
|
|
|
|
|
|
|
|
|
|
|
|
|
- 20 -
Liquidity risk refers to the risk that the Group may encounter difficulties in meeting
obligations from its financial liabilities.
| |
1) |
Liquidity risk management |
Liquidity risk management is to prevent potential cash shortages as
a result of mismatching the use of funds (assets) and sources of funds (liabilities) or unexpected cash outflows. The financial liabilities that are relevant to liquidity risk are incorporated within the scope of risk management. Derivatives
instruments are excluded from those financial liabilities as they reflect expected cash flows for a pre-determined period.
Assets and liabilities are grouped by account under Asset Liability Management (“ALM”) in accordance with the characteristics of the
account. The Group manages liquidity risk by identifying the maturity gap and such gap ratio through various cash flows analysis (i.e. based on remaining maturity and contract period, etc.), while maintaining the gap ratio at or below the target
limit.
| |
2) |
Maturity analysis of non-derivative financial liabilities |
| |
a) |
Cash flows of principals and interests by remaining contractual maturities of non-derivative financial liabilities are as follows (Unit: Korean Won in millions):
|
|
|
|
|
|
|
|
|
|
|
|
|
|
|
|
|
|
|
|
|
|
|
|
|
|
|
|
|
|
| |
|
June 30, 2017 |
|
| |
|
Within 3
months |
|
|
4 to 6
months |
|
|
7 to 9
months |
|
|
10 to 12
months |
|
|
1 to 5
years |
|
|
Over
5 years |
|
|
Total |
|
| Financial liabilities at FVTPL |
|
|
534,702 |
|
|
|
599 |
|
|
|
1,106 |
|
|
|
167,087 |
|
|
|
192 |
|
|
|
— |
|
|
|
703,686 |
|
| Deposits due to customers |
|
|
133,623,445 |
|
|
|
32,545,247 |
|
|
|
24,614,630 |
|
|
|
28,330,544 |
|
|
|
7,775,596 |
|
|
|
2,832,997 |
|
|
|
229,722,459 |
|
| Borrowings |
|
|
6,297,696 |
|
|
|
2,073,546 |
|
|
|
1,690,211 |
|
|
|
1,134,740 |
|
|
|
4,335,285 |
|
|
|
428,241 |
|
|
|
15,959,719 |
|
| Debentures |
|
|
913,180 |
|
|
|
1,585,368 |
|
|
|
1,884,684 |
|
|
|
2,425,226 |
|
|
|
17,325,950 |
|
|
|
3,387,807 |
|
|
|
27,522,215 |
|
| Other financial liabilities |
|
|
16,952,774 |
|
|
|
42,187 |
|
|
|
2,309 |
|
|
|
122,603 |
|
|
|
80,066 |
|
|
|
2,282,515 |
|
|
|
19,482,454 |
|
|
|
|
|
|
|
|
|
|
|
|
|
|
|
|
|
|
|
|
|
|
|
|
|
|
|
|
|
|
| Total |
|
|
158,321,797 |
|
|
|
36,246,947 |
|
|
|
28,192,940 |
|
|
|
32,180,200 |
|
|
|
29,517,089 |
|
|
|
8,931,560 |
|
|
|
293,390,533 |
|
|
|
|
|
|
|
|
|
|
|
|
|
|
|
|
|
|
|
|
|
|
|
|
|
|
|
|
|
|
|
|
| |
|
December 31, 2016 |
|
| |
|
Within 3
months |
|
|
4 to 6
months |
|
|
7 to 9
months |
|
|
10 to 12
months |
|
|
1 to 5
years |
|
|
Over
5 years |
|
|
Total |
|
| Financial liabilities at FVTPL |
|
|
678,813 |
|
|
|
1,529 |
|
|
|
94 |
|
|
|
47 |
|
|
|
154,325 |
|
|
|
— |
|
|
|
834,808 |
|
| Deposits due to customers |
|
|
136,835,315 |
|
|
|
28,685,473 |
|
|
|
19,254,108 |
|
|
|
30,875,962 |
|
|
|
6,284,092 |
|
|
|
2,732,019 |
|
|
|
224,666,969 |
|
| Borrowings |
|
|
9,146,895 |
|
|
|
2,355,336 |
|
|
|
876,836 |
|
|
|
1,486,710 |
|
|
|
4,711,273 |
|
|
|
420,720 |
|
|
|
18,997,770 |
|
| Debentures |
|
|
2,108,780 |
|
|
|
2,077,387 |
|
|
|
860,596 |
|
|
|
1,518,524 |
|
|
|
14,641,016 |
|
|
|
4,116,768 |
|
|
|
25,323,071 |
|
| Other financial liabilities |
|
|
14,813,948 |
|
|
|
27,544 |
|
|
|
5,480 |
|
|
|
1,433 |
|
|
|
84,792 |
|
|
|
2,751,825 |
|
|
|
17,685,022 |
|
|
|
|
|
|
|
|
|
|
|
|
|
|
|
|
|
|
|
|
|
|
|
|
|
|
|
|
|
|
| Total |
|
|
163,583,751 |
|
|
|
33,147,269 |
|
|
|
20,997,114 |
|
|
|
33,882,676 |
|
|
|
25,875,498 |
|
|
|
10,021,332 |
|
|
|
287,507,640 |
|
|
|
|
|
|
|
|
|
|
|
|
|
|
|
|
|
|
|
|
|
|
|
|
|
|
|
|
|
|
- 21 -
| |
b) |
Cash flows of principals and interests by expected maturities of non-derivative financial liabilities are as follows (Unit: Korean Won in millions): |
|
|
|
|
|
|
|
|
|
|
|
|
|
|
|
|
|
|
|
|
|
|
|
|
|
|
|
|
|
| |
|
June 30, 2017 |
|
| |
|
Within 3
months |
|
|
4 to 6
months |
|
|
7 to 9
months |
|
|
10 to 12
months |
|
|
1 to 5
years |
|
|
Over 5
years |
|
|
Total |
|
| Financial liabilities at FVTPL |
|
|
534,702 |
|
|
|
599 |
|
|
|
1,106 |
|
|
|
167,087 |
|
|
|
192 |
|
|
|
— |
|
|
|
703,686 |
|
| Deposits due to customers |
|
|
146,802,385 |
|
|
|
34,136,726 |
|
|
|
20,751,089 |
|
|
|
18,521,808 |
|
|
|
6,674,918 |
|
|
|
2,421,207 |
|
|
|
229,308,133 |
|
| Borrowings |
|
|
6,297,696 |
|
|
|
2,073,546 |
|
|
|
1,690,211 |
|
|
|
1,134,740 |
|
|
|
4,335,285 |
|
|
|
428,241 |
|
|
|
15,959,719 |
|
| Debentures |
|
|
913,180 |
|
|
|
1,585,368 |
|
|
|
1,884,684 |
|
|
|
2,425,226 |
|
|
|
17,325,950 |
|
|
|
3,387,807 |
|
|
|
27,522,215 |
|
| Other financial liabilities |
|
|
16,952,774 |
|
|
|
42,187 |
|
|
|
2,309 |
|
|
|
122,603 |
|
|
|
80,066 |
|
|
|
2,282,515 |
|
|
|
19,482,454 |
|
|
|
|
|
|
|
|
|
|
|
|
|
|
|
|
|
|
|
|
|
|
|
|
|
|
|
|
|
|
| Total |
|
|
171,500,737 |
|
|
|
37,838,426 |
|
|
|
24,329,399 |
|
|
|
22,371,464 |
|
|
|
28,416,411 |
|
|
|
8,519,770 |
|
|
|
292,976,207 |
|
|
|
|
|
|
|
|
|
|
|
|
|
|
|
|
|
|
|
|
|
|
|
|
|
|
|
|
|
|
|
|
| |
|
December 31, 2016 |
|
| |
|
Within 3
months |
|
|
4 to 6
months |
|
|
7 to 9
months |
|
|
10 to 12
months |
|
|
1 to 5
years |
|
|
Over 5
years |
|
|
Total |
|
| Financial liabilities at FVTPL |
|
|
678,813 |
|
|
|
1,529 |
|
|
|
94 |
|
|
|
47 |
|
|
|
154,325 |
|
|
|
— |
|
|
|
834,808 |
|
| Deposits due to customers |
|
|
148,089,355 |
|
|
|
30,163,971 |
|
|
|
17,600,803 |
|
|
|
20,947,335 |
|
|
|
5,128,387 |
|
|
|
2,331,993 |
|
|
|
224,261,844 |
|
| Borrowings |
|
|
9,146,901 |
|
|
|
2,355,332 |
|
|
|
876,835 |
|
|
|
1,486,710 |
|
|
|
4,711,273 |
|
|
|
420,719 |
|
|
|
18,997,770 |
|
| Debentures |
|
|
2,108,780 |
|
|
|
2,077,387 |
|
|
|
860,596 |
|
|
|
1,518,524 |
|
|
|
14,641,016 |
|
|
|
4,116,768 |
|
|
|
25,323,071 |
|
| Other financial liabilities |
|
|
14,813,948 |
|
|
|
27,544 |
|
|
|
5,480 |
|
|
|
1,433 |
|
|
|
84,792 |
|
|
|
2,751,825 |
|
|
|
17,685,022 |
|
|
|
|
|
|
|
|
|
|
|
|
|
|
|
|
|
|
|
|
|
|
|
|
|
|
|
|
|
|
| Total |
|
|
174,837,797 |
|
|
|
34,625,763 |
|
|
|
19,343,808 |
|
|
|
23,954,049 |
|
|
|
24,719,793 |
|
|
|
9,621,305 |
|
|
|
287,102,515 |
|
|
|
|
|
|
|
|
|
|
|
|
|
|
|
|
|
|
|
|
|
|
|
|
|
|
|
|
|
|
| |
3) |
Maturity analysis of derivative financial liabilities is as follows (Unit: Korean Won in millions): |
Derivatives held for trading purpose are not managed in accordance with their contractual maturity, as the Group holds such financial
instruments with the purpose of disposing or redemption before their maturity. As such, those derivatives are incorporated as “within 3 months” in the table below. The cash flow from derivatives held for hedge purpose is estimated at the
amount after the offset of the cash inflow and outflow.
The cash flow by the maturity of derivative financial liabilities as of
June 30, 2017 and December 31, 2016 as follows:
|
|
|
|
|
|
|
|
|
|
|
|
|
|
|
|
|
|
|
|
|
|
|
|
|
|
|
|
|
| |
|
Remaining maturity |
|
| |
|
Within 3
months |
|
|
4 to 6
months |
|
|
7 to 9
months |
|
|
10 to 12
months |
|
|
1 to 5
years |
|
|
Over 5
years |
|
|
Total |
|
| June 30, 2017 |
|
|
1,864,704 |
|
|
|
6,239 |
|
|
|
— |
|
|
|
— |
|
|
|
22,990 |
|
|
|
— |
|
|
|
1,893,933 |
|
| December 31, 2016 |
|
|
3,009,977 |
|
|
|
— |
|
|
|
— |
|
|
|
208 |
|
|
|
7,013 |
|
|
|
— |
|
|
|
3,017,198 |
|
| |
4) |
Maturity analysis of off-balance accounts |
The Group
provides guarantees on behalf of customers. A financial guarantee represents an irrevocable undertaking that the Group should meet a customer’s obligations to third parties if the customer fails to do so. Under a loan commitment, the Group
agrees to make funds available to a customer in the future. Loan commitments that are usually for a specified term may be unconditionally cancellable or may persist, provided all conditions in the loan facility are satisfied or waived. Commitments
to lend include commercial standby facilities and credit lines, liquidity facilities to commercial paper conduits and utilized overdraft facilities. The maximum limit to be paid by the Group in accordance with guarantees and loan commitment only
applies to principal amounts. There are contractual maturities for financial guarantees, such as guarantees for debentures issued or loans, loan commitments, and other guarantees, however, under the terms of the guarantees and loan commitments,
funds should be paid upon demand from the counterparty. Details of off-balance accounts are as follows (Unit: Korean Won in millions):
|
|
|
|
|
|
|
|
|
| |
|
June 30, 2017 |
|
|
December 31, 2016 |
|
| Guarantees |
|
|
13,160,410 |
|
|
|
14,761,784 |
|
| Loan commitments |
|
|
81,601,017 |
|
|
|
83,795,496 |
|
- 22 -
The Group defines the operational risk that could cause a negative effect on capital
resulting from inadequate internal process, labor work and systematic problem or external factors.
| |
1) |
Operational risk management |
The Group has been running the operational risk management system
under Basel II. The Bank developed advanced measurement approaches to quantify required capital for operational risk. This system is used for reinforcement in foreign competitions, reducing the amount of risk capitals, managing the risk, and
precaution for any unexpected occasions. This system has been tested by an independent third party, and this system approved by the Financial Supervisory Service.
| |
2) |
Operational risk measurement |
To quantify required capital for operational risk, the Group
applies Advanced Measurement Approaches (AMA) using of internal and external loss data, business environment and internal control factors (BEICFs), and scenario analysis (SBA). For the operational risk management for its subsidiaries, the Group
adopted the Basic Indicator Approach.
The Group complies with the standard of capital adequacy provided by financial regulatory
authorities. The capital adequacy ratio is based on Basel III of Basel Committee on Banking Supervision and Basel III was applied from the end of December, 2013. The capital adequacy ratio is calculated by dividing own capital by asset (weighted
with a risk premium – risk weighted assets) based on the consolidated financial statements of the Group.
According to the above regulations, the
Group is required to meet the following new minimum requirements: 6.25% and 5.38% Common Equity Tier 1 ratio, 7.75% and 6.88% Tier 1 capital ratio, and 9.75% and 8.88% total capital ratio as of June 30, 2017 and December 31, 2016,
respectively.
Provided the subsidiaries included in the scope of consolidation due to the merger with Woori Finance Holdings (i.e., Woori Card Co., Ltd.,
Woori Investment Bank Co., Ltd., Woori FIS Co., Ltd., Woori Private Equity Asset Management Co., Ltd., and Woori Finance Research Institute Co., Ltd.) are ruled out, Common Equity Tier 1 ratio, Tier 1 capital ratio and Total capital ratio as of
June 30, 2017 are adjusted to 11.86 %, 14.12% and 16.62%, respectively.
The details are as follows (Unit: Korean won in millions):
|
|
|
|
|
|
|
|
|
| |
|
June 30, 2017 |
|
|
December 31, 2016 |
|
| Tier 1 capital |
|
|
16,177,612 |
|
|
|
15,714,480 |
|
| Other Tier 1 capital |
|
|
3,046,056 |
|
|
|
3,275,496 |
|
| Tier 2 capital |
|
|
3,414,839 |
|
|
|
3,910,513 |
|
|
|
|
|
|
|
|
|
|
| Total risk-adjusted capital |
|
|
22,638,507 |
|
|
|
22,900,489 |
|
|
|
|
|
|
|
|
|
|
| Risk-weighted assets for credit risk |
|
|
135,889,833 |
|
|
|
138,018,500 |
|
| Risk-weighted assets for market risk |
|
|
2,610,883 |
|
|
|
2,277,809 |
|
| Risk-weighted assets for operational risk |
|
|
9,601,831 |
|
|
|
9,431,814 |
|
|
|
|
|
|
|
|
|
|
| Total risk-weighted assets |
|
|
148,102,547 |
|
|
|
149,728,123 |
|
|
|
|
|
|
|
|
|
|
| Common Equity Tier 1 ratio |
|
|
10.92 |
% |
|
|
10.50 |
% |
|
|
|
|
|
|
|
|
|
| Tier 1 capital ratio |
|
|
12.98 |
% |
|
|
12.68 |
% |
|
|
|
|
|
|
|
|
|
| Total capital ratio |
|
|
15.29 |
% |
|
|
15.29 |
% |
|
|
|
|
|
|
|
|
|
- 23 -
In evaluating the results of the Group and allocating resources, the Group’s
Chief Operation Decision Maker (the “CODM”) utilizes the information per type of customers. This financial information of the segments is regularly reviewed by the CODM to make decisions about resources to be allocated to each segment and
evaluate its performance.
| (1) |
Segment by type of customers |
The Group’s reporting segments comprise the following customers: consumer
banking, corporate banking, investment banking, capital market, credit card market and headquarters and others. The reportable segments are classified based on the target customers for whom the service is being provided.
| |
• |
|
Consumer banking: Loans/deposits and financial services for consumer, etc. |
| |
• |
|
Corporate banking: Loans/deposits and export/import, financial services for corporations, etc. |
| |
• |
|
Investment banking: Domestic/foreign investment, structured finance, M&A, Equity & fund investment related business, venture advisory related tasks, real estate SOC development practices, etc.
|
| |
• |
|
Capital market: Fund management, investment in securities and derivatives, etc. |
| |
• |
|
Credit card: Credit card, cash service and card loan, etc. ; and |
| |
• |
|
Headquarter and others: Segments that do not belong to above operating segments |
| |
1) |
The details of assets and liabilities by each segment are as follows (Unit: Korean Won in millions): |
|
|
|
|
|
|
|
|
|
|
|
|
|
|
|
|
|
|
|
|
|
|
|
|
|
|
|
|
|
|
|
|
|
|
|
|
|
| |
|
June 30, 2017 |
|
| |
|
Consumer
banking |
|
|
Corporate
banking |
|
|
Investment
banking |
|
|
Capital
market |
|
|
Credit
card |
|
|
Headquarters
and others |
|
|
Sub-total |
|
|
Adjustment |
|
|
Total |
|
| Assets |
|
|
107,802,948 |
|
|
|
103,717,080 |
|
|
|
6,061,096 |
|
|
|
12,566,223 |
|
|
|
8,050,927 |
|
|
|
83,775,115 |
|
|
|
321,973,389 |
|
|
|
(5,908,129 |
) |
|
|
316,065,260 |
|
| Liabilities |
|
|
73,415,093 |
|
|
|
154,137,327 |
|
|
|
50,269 |
|
|
|
11,520,839 |
|
|
|
6,463,953 |
|
|
|
50,046,525 |
|
|
|
295,634,006 |
|
|
|
10,786 |
|
|
|
295,644,792 |
|
|
|
| |
|
December 31, 2016 |
|
| |
|
Consumer
banking |
|
|
Corporate
banking |
|
|
Investment
banking |
|
|
Capital
market |
|
|
Credit
card |
|
|
Headquarters
and others |
|
|
Sub-total |
|
|
Adjustment |
|
|
Total |
|
| Assets |
|
|
105,931,025 |
|
|
|
104,937,198 |
|
|
|
6,337,634 |
|
|
|
8,111,230 |
|
|
|
7,606,108 |
|
|
|
82,840,235 |
|
|
|
315,763,430 |
|
|
|
(5,080,703 |
) |
|
|
310,682,727 |
|
| Liabilities |
|
|
62,294,922 |
|
|
|
162,937,921 |
|
|
|
55,785 |
|
|
|
7,287,850 |
|
|
|
6,180,893 |
|
|
|
51,137,220 |
|
|
|
289,894,591 |
|
|
|
242,183 |
|
|
|
290,136,774 |
|
- 24 -
| |
2) |
The details of operating income by each segment are as follows (Unit: Korean Won in millions): |
|
|
|
|
|
|
|
|
|
|
|
|
|
|
|
|
|
|
|
|
|
|
|
|
|
|
|
|
|
|
|
|
|
|
|
|
|
| |
|
For the six months ended June 30, 2017 |
|
| |
|
Consumer
banking |
|
|
Corporate
banking |
|
|
Investment
banking |
|
|
Capital
market |
|
|
Credit
card |
|
|
Headquarters
and others |
|
|
Sub-total |
|
|
Adjustment |
|
|
Total |
|
| Net Interest income |
|
|
810,799 |
|
|
|
866,805 |
|
|
|
5,413 |
|
|
|
17,262 |
|
|
|
223,048 |
|
|
|
334,651 |
|
|
|
2,257,978 |
|
|
|
292,342 |
|
|
|
2,550,320 |
|
| Interest income |
|
|
1,539,729 |
|
|
|
1,456,198 |
|
|
|
72,232 |
|
|
|
8,938 |
|
|
|
288,648 |
|
|
|
668,644 |
|
|
|
4,034,389 |
|
|
|
155,195 |
|
|
|
4,189,584 |
|
| Interest expense |
|
|
(480,814 |
) |
|
|
(818,422 |
) |
|
|
(126 |
) |
|
|
— |
|
|
|
(65,600 |
) |
|
|
(411,449 |
) |
|
|
(1,776,411 |
) |
|
|
137,147 |
|
|
|
(1,639,264 |
) |
| Inter-segment |
|
|
(248,116 |
) |
|
|
229,029 |
|
|
|
(66,693 |
) |
|
|
8,324 |
|
|
|
— |
|
|
|
77,456 |
|
|
|
— |
|
|
|
— |
|
|
|
— |
|
| Net non-interest income |
|
|
322,986 |
|
|
|
281,065 |
|
|
|
90,869 |
|
|
|
22,758 |
|
|
|
45,638 |
|
|
|
192,043 |
|
|
|
955,359 |
|
|
|
(367,231 |
) |
|
|
588,128 |
|
| Non-interest income |
|
|
424,214 |
|
|
|
333,646 |
|
|
|
212,107 |
|
|
|
4,991,598 |
|
|
|
566,107 |
|
|
|
1,129,696 |
|
|
|
7,657,368 |
|
|
|
(126,727 |
) |
|
|
7,530,641 |
|
| Non-interest expense |
|
|
(146,630 |
) |
|
|
(82,261 |
) |
|
|
(121,238 |
) |
|
|
(4,968,840 |
) |
|
|
(520,469 |
) |
|
|
(862,571 |
) |
|
|
(6,702,009 |
) |
|
|
(240,504 |
) |
|
|
(6,942,513 |
) |
| Inter-segment |
|
|
45,402 |
|
|
|
29,680 |
|
|
|
— |
|
|
|
— |
|
|
|
— |
|
|
|
(75,082 |
) |
|
|
— |
|
|
|
— |
|
|
|
— |
|
| Other income and expense |
|
|
(915,696 |
) |
|
|
(531,346 |
) |
|
|
25,615 |
|
|
|
14,414 |
|
|
|
(184,607 |
) |
|
|
(145,742 |
) |
|
|
(1,737,362 |
) |
|
|
83,142 |
|
|
|
(1,654,220 |
) |
| Administrative expense |
|
|
(869,732 |
) |
|
|
(402,661 |
) |
|
|
(5,696 |
) |
|
|
(7,721 |
) |
|
|
(77,909 |
) |
|
|
(298,578 |
) |
|
|
(1,662,297 |
) |
|
|
123,870 |
|
|
|
(1,538,427 |
) |
| Reversal of allowance for credit loss and impairment losses due to credit loss |
|
|
(45,964 |
) |
|
|
(128,685 |
) |
|
|
31,311 |
|
|
|
22,135 |
|
|
|
(106,698 |
) |
|
|
152,836 |
|
|
|
(75,065 |
) |
|
|
(40,728 |
) |
|
|
(115,793 |
) |
|
|
|
|
|
|
|
|
|
|
|
|
|
|
|
|
|
|
|
|
|
|
|
|
|
|
|
|
|
|
|
|
|
|
|
|
|
| Operating income |
|
|
218,089 |
|
|
|
616,524 |
|
|
|
121,897 |
|
|
|
54,434 |
|
|
|
84,079 |
|
|
|
380,952 |
|
|
|
1,475,975 |
|
|
|
8,253 |
|
|
|
1,484,228 |
|
| Non-operating income (loss) |
|
|
8,862 |
|
|
|
(3,122 |
) |
|
|
22,581 |
|
|
|
— |
|
|
|
(2,399 |
) |
|
|
(26,180 |
) |
|
|
(258 |
) |
|
|
(54,022 |
) |
|
|
(54,280 |
) |
|
|
|
|
|
|
|
|
|
|
|
|
|
|
|
|
|
|
|
|
|
|
|
|
|
|
|
|
|
|
|
|
|
|
|
|
|
| Net income before income tax expense |
|
|
226,951 |
|
|
|
613,402 |
|
|
|
144,478 |
|
|
|
54,434 |
|
|
|
81,680 |
|
|
|
354,772 |
|
|
|
1,475,717 |
|
|
|
(45,769 |
) |
|
|
1,429,948 |
|
| Income tax expense |
|
|
(54,923 |
) |
|
|
(139,138 |
) |
|
|
(34,964 |
) |
|
|
(13,173 |
) |
|
|
(19,816 |
) |
|
|
(50,841 |
) |
|
|
(312,855 |
) |
|
|
(8,078 |
) |
|
|
(320,933 |
) |
|
|
|
|
|
|
|
|
|
|
|
|
|
|
|
|
|
|
|
|
|
|
|
|
|
|
|
|
|
|
|
|
|
|
|
|
|
| Net income |
|
|
172,028 |
|
|
|
474,264 |
|
|
|
109,514 |
|
|
|
41,261 |
|
|
|
61,864 |
|
|
|
303,931 |
|
|
|
1,162,862 |
|
|
|
(53,847 |
) |
|
|
1,109,015 |
|
|
|
|
|
|
|
|
|
|
|
|
|
|
|
|
|
|
|
|
|
|
|
|
|
|
|
|
|
|
|
|
|
|
|
|
|
|
|
|
| |
|
For the six months ended June 30, 2016 |
|
| |
|
Consumer
banking |
|
|
Corporate
banking |
|
|
Investment
banking |
|
|
Capital
market |
|
|
Credit
card |
|
|
Headquarters
and others |
|
|
Sub-total |
|
|
Inter-
segment
transaction |
|
|
Total |
|
| Net Interest income |
|
|
730,180 |
|
|
|
865,252 |
|
|
|
7,118 |
|
|
|
30,068 |
|
|
|
209,246 |
|
|
|
298,198 |
|
|
|
2,140,062 |
|
|
|
348,696 |
|
|
|
2,488,758 |
|
| Interest income |
|
|
1,477,402 |
|
|
|
1,547,508 |
|
|
|
79,065 |
|
|
|
9,971 |
|
|
|
272,729 |
|
|
|
671,903 |
|
|
|
4,058,578 |
|
|
|
234,984 |
|
|
|
4,293,562 |
|
| Interest expense |
|
|
(517,960 |
) |
|
|
(915,304 |
) |
|
|
(85 |
) |
|
|
(117 |
) |
|
|
(63,483 |
) |
|
|
(421,567 |
) |
|
|
(1,918,516 |
) |
|
|
113,712 |
|
|
|
(1,804,804 |
) |
| Inter-segment |
|
|
(229,262 |
) |
|
|
233,048 |
|
|
|
(71,862 |
) |
|
|
20,214 |
|
|
|
— |
|
|
|
47,862 |
|
|
|
— |
|
|
|
— |
|
|
|
— |
|
| Net non-interest income |
|
|
271,854 |
|
|
|
273,016 |
|
|
|
72,457 |
|
|
|
9,720 |
|
|
|
47,094 |
|
|
|
173,523 |
|
|
|
847,664 |
|
|
|
(474,695 |
) |
|
|
372,969 |
|
| Non-interest income |
|
|
471,714 |
|
|
|
268,261 |
|
|
|
291,061 |
|
|
|
3,725,729 |
|
|
|
474,217 |
|
|
|
2,546,058 |
|
|
|
7,777,040 |
|
|
|
(91,447 |
) |
|
|
7,685,593 |
|
| Non-interest expense |
|
|
(213,453 |
) |
|
|
(16,616 |
) |
|
|
(218,604 |
) |
|
|
(3,716,009 |
) |
|
|
(427,123 |
) |
|
|
(2,337,571 |
) |
|
|
(6,929,376 |
) |
|
|
(383,248 |
) |
|
|
(7,312,624 |
) |
| Inter-segment |
|
|
13,593 |
|
|
|
21,371 |
|
|
|
— |
|
|
|
— |
|
|
|
— |
|
|
|
(34,964 |
) |
|
|
— |
|
|
|
— |
|
|
|
— |
|
| Other income and expense |
|
|
(906,599 |
) |
|
|
(703,531 |
) |
|
|
(69,239 |
) |
|
|
(14,592 |
) |
|
|
(175,413 |
) |
|
|
(136,583 |
) |
|
|
(2,005,957 |
) |
|
|
93,333 |
|
|
|
(1,912,624 |
) |
| Administrative expense |
|
|
(876,032 |
) |
|
|
(464,081 |
) |
|
|
(6,329 |
) |
|
|
(8,163 |
) |
|
|
(68,642 |
) |
|
|
(303,766 |
) |
|
|
(1,727,013 |
) |
|
|
82,461 |
|
|
|
(1,644,552 |
) |
| Reversal of allowance for credit loss and impairment losses due to credit loss |
|
|
(30,567 |
) |
|
|
(239,450 |
) |
|
|
(62,910 |
) |
|
|
(6,429 |
) |
|
|
(106,771 |
) |
|
|
167,183 |
|
|
|
(278,944 |
) |
|
|
10,872 |
|
|
|
(268,072 |
) |
|
|
|
|
|
|
|
|
|
|
|
|
|
|
|
|
|
|
|
|
|
|
|
|
|
|
|
|
|
|
|
|
|
|
|
|
|
| Operating income |
|
|
95,435 |
|
|
|
434,737 |
|
|
|
10,336 |
|
|
|
25,196 |
|
|
|
80,927 |
|
|
|
335,138 |
|
|
|
981,769 |
|
|
|
(32,666 |
) |
|
|
949,103 |
|
| Non-operating income(loss) |
|
|
(34,886 |
) |
|
|
(2,663 |
) |
|
|
22,977 |
|
|
|
— |
|
|
|
(1,778 |
) |
|
|
29,696 |
|
|
|
13,346 |
|
|
|
(51,328 |
) |
|
|
(37,982 |
) |
|
|
|
|
|
|
|
|
|
|
|
|
|
|
|
|
|
|
|
|
|
|
|
|
|
|
|
|
|
|
|
|
|
|
|
|
|
| Net income before income tax expense |
|
|
60,549 |
|
|
|
432,074 |
|
|
|
33,313 |
|
|
|
25,196 |
|
|
|
79,149 |
|
|
|
364,834 |
|
|
|
995,115 |
|
|
|
(83,994 |
) |
|
|
911,121 |
|
| Income tax benefit (expense) |
|
|
(14,653 |
) |
|
|
(108,574 |
) |
|
|
(8,062 |
) |
|
|
(6,097 |
) |
|
|
(18,228 |
) |
|
|
1,219 |
|
|
|
(154,395 |
) |
|
|
1,061 |
|
|
|
(153,334 |
) |
|
|
|
|
|
|
|
|
|
|
|
|
|
|
|
|
|
|
|
|
|
|
|
|
|
|
|
|
|
|
|
|
|
|
|
|
|
| Net income |
|
|
45,896 |
|
|
|
323,500 |
|
|
|
25,251 |
|
|
|
19,099 |
|
|
|
60,921 |
|
|
|
366,053 |
|
|
|
840,720 |
|
|
|
(82,933 |
) |
|
|
757,787 |
|
|
|
|
|
|
|
|
|
|
|
|
|
|
|
|
|
|
|
|
|
|
|
|
|
|
|
|
|
|
|
|
|
|
|
|
|
|
| (2) |
Information on products and services |
The products of the Group are classified as interest-bearing products
such as loans, deposits and debt securities and non-interest bearing products such as loan commitment, credit commitment, equity securities, and credit card service. This classification of products has been
reflected in the segment information presenting interest income and non-interest income.
- 25 -
| (3) |
Information on geographical areas |
Among the Group’s revenue (interest income and non-interest income) from services, revenue from the domestic customers for the six months ended June 30, 2017 and 2016 amounted to 11,185,991 million Won and 11,595,475 million Won, respectively, and
revenue from the foreign customers amounted to 534,234 million Won and 383,680 million Won, respectively. Among the Group’s non-current assets (investments in joint ventures and associates,
investment properties, premises and equipment and intangible assets), non-current assets attributed to domestic subsidiaries as of June 30, 2017 and December 31, 2016 are 3,449,341 million Won
and 3,498,327 million Won, respectively, and foreign subsidiaries are 247,453 million Won and 240,946 million Won, respectively.
| 6. |
CASH AND CASH EQUIVALENTS |
| (1) |
Details of cash and cash equivalents are as follows (Unit: Korean Won in millions): |
|
|
|
|
|
|
|
|
|
| |
|
June 30, 2017 |
|
|
December 31, 2016 |
|
| Cash |
|
|
2,198,170 |
|
|
|
2,113,739 |
|
| Foreign currencies |
|
|
691,181 |
|
|
|
742,340 |
|
| Demand deposits |
|
|
3,679,698 |
|
|
|
4,238,956 |
|
| Fixed deposits |
|
|
808,075 |
|
|
|
496,289 |
|
|
|
|
|
|
|
|
|
|
| Total |
|
|
7,377,124 |
|
|
|
7,591,324 |
|
|
|
|
|
|
|
|
|
|
| (2) |
Significant transactions not involving cash inflows and outflows are as follows (Unit: Korean Won in millions): |
|
|
|
|
|
|
|
|
|
| |
|
For the
six months
ended June 30, 2017 |
|
|
For the
six months
ended June 30, 2016 |
|
| Changes in other comprehensive income (loss) due to valuation of AFS financial assets |
|
|
(28,706 |
) |
|
|
80,223 |
|
| Changes in other comprehensive income (loss) of investment in associates |
|
|
1,507 |
|
|
|
(233 |
) |
| Changes in other comprehensive loss from
overseas business translation |
|
|
(69,010 |
) |
|
|
(2,649 |
) |
| Changes in other comprehensive income due to valuation of cash flow hedge |
|
|
(1,526 |
) |
|
|
10,371 |
|
| Changes in other comprehensive loss due to
remeasurement of the defined benefit plans |
|
|
(9,677 |
) |
|
|
(44,667 |
) |
| Changes in investments in associates due to debt-equity swap |
|
|
51,405 |
|
|
|
— |
|
| Changes in investments in associates
due to accounts transfer |
|
|
(16,354 |
) |
|
|
(145,748 |
) |
| Changes in unpaid dividends of hybrid equity securities |
|
|
(9,804 |
) |
|
|
(347 |
) |
- 26 -
| 7. |
FINANCIAL ASSETS AT FVTPL |
| (1) |
Financial assets at FVTPL consist of as follows (Unit: Korean Won in millions): |
|
|
|
|
|
|
|
|
|
| |
|
June 30, 2017 |
|
|
December 31, 2016 |
|
| Financial assets held for trading |
|
|
4,535,391 |
|
|
|
5,633,724 |
|
| Financial assets designated at FVTPL |
|
|
18,984 |
|
|
|
17,000 |
|
|
|
|
|
|
|
|
|
|
| Total |
|
|
4,554,375 |
|
|
|
5,650,724 |
|
|
|
|
|
|
|
|
|
|
| (2) |
Financial assets held for trading are as follows (Unit: Korean Won in millions): |
|
|
|
|
|
|
|
|
|
| |
|
June 30, 2017 |
|
|
December 31, 2016 |
|
| Deposits: |
|
|
|
|
|
|
|
|
| Deposits indexed to gold prices |
|
|
31,169 |
|
|
|
26,180 |
|
| Securities: |
|
|
|
|
|
|
|
|
| Debt securities |
|
|
|
|
|
|
|
|
| Korean treasury and government agencies |
|
|
518,516 |
|
|
|
519,337 |
|
| Financial institutions |
|
|
1,714,687 |
|
|
|
1,444,459 |
|
| Corporates |
|
|
576,577 |
|
|
|
681,120 |
|
| Equity securities |
|
|
26,686 |
|
|
|
35,983 |
|
| Beneficiary certificates |
|
|
23,688 |
|
|
|
23,891 |
|
| Securities loaned |
|
|
— |
|
|
|
4,459 |
|
|
|
|
|
|
|
|
|
|
| Sub-total |
|
|
2,860,154 |
|
|
|
2,709,249 |
|
|
|
|
|
|
|
|
|
|
| Derivatives assets |
|
|
1,644,068 |
|
|
|
2,898,295 |
|
|
|
|
|
|
|
|
|
|
| Total |
|
|
4,535,391 |
|
|
|
5,633,724 |
|
|
|
|
|
|
|
|
|
|
| (3) |
Financial assets designated at FVTPL are as follows (Unit: Korean Won in millions): |
|
|
|
|
|
|
|
|
|
| |
|
June 30, 2017 |
|
|
December 31, 2016 |
|
| Debt securities |
|
|
6,539 |
|
|
|
4,348 |
|
| Equity securities |
|
|
12,445 |
|
|
|
12,652 |
|
|
|
|
|
|
|
|
|
|
| Total |
|
|
18,984 |
|
|
|
17,000 |
|
|
|
|
|
|
|
|
|
|
- 27 -
| 8. |
AVAILABLE FOR SALE FINANCIAL ASSETS |
Details of AFS financial assets are as follows (Unit: Korean Won in
millions):
|
|
|
|
|
|
|
|
|
| |
|
June 30, 2017 |
|
|
December 31, 2016 |
|
| Debt securities: |
|
|
|
|
|
|
|
|
| Korean treasury and government agencies |
|
|
3,219,938 |
|
|
|
3,788,630 |
|
| Financial institutions |
|
|
5,674,015 |
|
|
|
6,314,198 |
|
| Corporates |
|
|
3,896,156 |
|
|
|
4,409,186 |
|
| Asset-backed securities |
|
|
313,636 |
|
|
|
249,203 |
|
| Bonds in foreign currencies |
|
|
1,784,189 |
|
|
|
1,211,864 |
|
| Others |
|
|
64,112 |
|
|
|
75,228 |
|
|
|
|
|
|
|
|
|
|
| Sub-total |
|
|
14,952,046 |
|
|
|
16,048,309 |
|
|
|
|
|
|
|
|
|
|
| Equity securities |
|
|
1,454,030 |
|
|
|
1,453,613 |
|
| Beneficiary certificates |
|
|
3,045,406 |
|
|
|
2,822,082 |
|
| Securities loaned |
|
|
171,688 |
|
|
|
493,579 |
|
|
|
|
|
|
|
|
|
|
| Total |
|
|
19,623,170 |
|
|
|
20,817,583 |
|
|
|
|
|
|
|
|
|
|
| 9. |
HELD TO MATURITY FINANCIAL ASSETS |
Details of HTM financial assets are as follows (Unit: Korean Won in
millions):
|
|
|
|
|
|
|
|
|
| |
|
June 30, 2017 |
|
|
December 31, 2016 |
|
| Korean treasury and government agencies |
|
|
3,964,762 |
|
|
|
3,754,356 |
|
| Financial institutions |
|
|
6,069,613 |
|
|
|
5,168,487 |
|
| Corporates |
|
|
4,937,254 |
|
|
|
4,823,356 |
|
| Bonds in foreign currencies |
|
|
173,137 |
|
|
|
164,052 |
|
|
|
|
|
|
|
|
|
|
| Total |
|
|
15,144,766 |
|
|
|
13,910,251 |
|
|
|
|
|
|
|
|
|
|
| 10. |
LOANS AND RECEIVABLES |
| (1) |
Details of loans and receivables are as follows (Unit: Korean Won in millions): |
|
|
|
|
|
|
|
|
|
| |
|
June 30, 2017 |
|
|
December 31, 2016 |
|
| Due from banks |
|
|
11,331,473 |
|
|
|
14,815,476 |
|
| Loans |
|
|
239,772,555 |
|
|
|
235,400,585 |
|
| Other receivables |
|
|
14,044,596 |
|
|
|
8,176,572 |
|
|
|
|
|
|
|
|
|
|
| Total |
|
|
265,148,624 |
|
|
|
258,392,633 |
|
|
|
|
|
|
|
|
|
|
| (2) |
Details of due from banks are as follows (Unit: Korean Won in millions): |
|
|
|
|
|
|
|
|
|
| |
|
June 30, 2017 |
|
|
December 31, 2016 |
|
| Due from banks in local currency: |
|
|
|
|
|
|
|
|
| Due from The Bank of Korea (“BOK”) |
|
|
8,090,443 |
|
|
|
11,395,162 |
|
| Due from depository banks |
|
|
3 |
|
|
|
3 |
|
| Due from non-depository institutions |
|
|
5,284 |
|
|
|
9,811 |
|
| Due from the Korea Exchange |
|
|
573 |
|
|
|
1,625 |
|
| Others |
|
|
57,475 |
|
|
|
73,283 |
|
| Allowance for credit losses |
|
|
(1,987 |
) |
|
|
(2,798 |
) |
|
|
|
|
|
|
|
|
|
| Sub-total |
|
|
8,151,791 |
|
|
|
11,477,086 |
|
|
|
|
|
|
|
|
|
|
| Due from banks in foreign currencies: |
|
|
|
|
|
|
|
|
| Due from banks on demand |
|
|
856,030 |
|
|
|
877,636 |
|
| Due from banks on time |
|
|
1,602,383 |
|
|
|
1,684,631 |
|
| Others |
|
|
723,268 |
|
|
|
778,418 |
|
| Allowance for credit losses |
|
|
(1,999 |
) |
|
|
(2,295 |
) |
|
|
|
|
|
|
|
|
|
| Sub-total |
|
|
3,179,682 |
|
|
|
3,338,390 |
|
|
|
|
|
|
|
|
|
|
| Total |
|
|
11,331,473 |
|
|
|
14,815,476 |
|
|
|
|
|
|
|
|
|
|
- 28 -
| (3) |
Details of restricted due from banks are as follows (Unit: Korean Won in millions): |
|
|
|
|
|
|
|
|
|
| Financial institution |
|
Counterparty |
|
June 30, 2017 |
|
|
Reason of restriction |
| Due from banks in local currency: |
|
|
|
|
|
|
|
|
| Due from The BOK |
|
The BOK |
|
|
8,090,443 |
|
|
Reserve deposits under The BOK Act |
| Others |
|
The Korea Exchange and others |
|
|
53,690 |
|
|
Central counter party KRW margin and others |
|
|
|
|
|
|
|
|
|
|
|
Sub-total |
|
|
8,144,133 |
|
|
|
|
|
|
|
|
|
|
|
|
| Due from banks in foreign currencies: |
|
|
|
|
|
|
|
|
| Due from banks on demand |
|
The BOK and others |
|
|
1,014,153 |
|
|
Reserve deposits under The BOK Act and others |
| Others |
|
The People’s Bank of China and others |
|
|
723,268 |
|
|
Reserve deposits for Capital and others |
|
|
|
|
|
|
|
|
|
|
|
Sub-total |
|
|
1,737,421 |
|
|
|
|
|
|
|
|
|
|
|
|
|
|
|
|
|
9,881,554 |
|
|
|
|
|
|
|
|
|
|
|
|
|
|
|
|
|
|
|
|
|
| Financial institution |
|
Counterparty |
|
December 31, 2016 |
|
|
Reason of restriction |
| Due from banks in local currency: |
|
|
|
|
|
|
|
|
| Due from The BOK |
|
The BOK |
|
|
11,395,162 |
|
|
Reserve deposits under The BOK Act |
| Others |
|
The Korea Exchange and others |
|
|
70,304 |
|
|
Central counter party KRW margin and others |
|
|
|
|
|
|
|
|
|
|
|
Sub-total |
|
|
11,465,466 |
|
|
|
|
|
|
|
|
|
|
|
|
| Due from banks in foreign currencies: |
|
|
|
|
|
|
|
|
| Due from banks on demand |
|
The BOK and others |
|
|
854,612 |
|
|
Reserve deposits under The BOK Act and others |
| Others |
|
The People’s Bank of China and others |
|
|
778,418 |
|
|
Reserve deposits and others |
|
|
|
|
|
|
|
|
|
|
|
Sub-total |
|
|
1,633,030 |
|
|
|
|
|
|
|
|
|
|
|
|
|
|
|
|
|
13,098,496 |
|
|
|
|
|
|
|
|
|
|
|
|
| (4) |
Details of loans are as follows (Unit: Korean Won in millions): |
|
|
|
|
|
|
|
|
|
| |
|
June 30, 2017 |
|
|
December 31, 2016 |
|
| Loans in local currency |
|
|
194,331,428 |
|
|
|
191,309,481 |
|
| Loans in foreign currencies |
|
|
13,743,070 |
|
|
|
14,101,839 |
|
| Domestic banker’s letter of credit |
|
|
2,981,980 |
|
|
|
3,754,030 |
|
| Credit card accounts |
|
|
6,753,101 |
|
|
|
6,673,765 |
|
| Bills bought in foreign currencies |
|
|
7,597,041 |
|
|
|
7,758,575 |
|
| Bills bought in local currency |
|
|
234,371 |
|
|
|
414,451 |
|
| Factoring receivables |
|
|
45,553 |
|
|
|
96,763 |
|
| Advances for customers on guarantees |
|
|
25,760 |
|
|
|
25,197 |
|
| Privately placed bonds |
|
|
330,310 |
|
|
|
328,405 |
|
| Securitized loans |
|
|
289,450 |
|
|
|
252,690 |
|
| Call loans |
|
|
3,137,783 |
|
|
|
2,985,077 |
|
| Bonds purchased under resale agreements |
|
|
11,102,133 |
|
|
|
8,854,753 |
|
| Loan origination costs and fees |
|
|
475,942 |
|
|
|
458,639 |
|
| Others |
|
|
393,373 |
|
|
|
251,635 |
|
| Present value discount |
|
|
(12,951 |
) |
|
|
(13,827 |
) |
| Allowance for credit losses |
|
|
(1,655,789 |
) |
|
|
(1,850,888 |
) |
|
|
|
|
|
|
|
|
|
| Total |
|
|
239,772,555 |
|
|
|
235,400,585 |
|
|
|
|
|
|
|
|
|
|
- 29 -
| (5) |
Details of other loan and receivables are as follows (Unit: Korean Won in millions): |
|
|
|
|
|
|
|
|
|
| |
|
June 30, 2017 |
|
|
December 31, 2016 |
|
| CMA accounts |
|
|
189,800 |
|
|
|
190,000 |
|
| Receivables |
|
|
11,567,108 |
|
|
|
5,417,676 |
|
| Accrued income |
|
|
966,278 |
|
|
|
1,080,489 |
|
| Telex and telephone subscription rights and refundable deposits |
|
|
998,251 |
|
|
|
1,019,577 |
|
| Other debtors |
|
|
390,556 |
|
|
|
639,945 |
|
| Allowance for credit losses |
|
|
(67,397 |
) |
|
|
(171,115 |
) |
|
|
|
|
|
|
|
|
|
| Total |
|
|
14,044,596 |
|
|
|
8,176,572 |
|
|
|
|
|
|
|
|
|
|
| (6) |
Changes in allowance for credit losses on loans and receivables are as follows (Unit: Korean Won in millions): |
|
|
|
|
|
|
|
|
|
|
|
|
|
|
|
|
|
|
|
|
|
| |
|
For the six months ended June 30, 2017 |
|
| |
|
Consumers |
|
|
Corporates |
|
|
Credit card |
|
|
Others |
|
|
Total |
|
| Beginning balance |
|
|
(163,858 |
) |
|
|
(1,498,842 |
) |
|
|
(155,372 |
) |
|
|
(209,024 |
) |
|
|
(2,027,096 |
) |
| Net reversal of provision (net provision) |
|
|
(65,582 |
) |
|
|
(191,263 |
) |
|
|
(91,022 |
) |
|
|
13,891 |
|
|
|
(333,976 |
) |
| Recoveries of loans previously charged off |
|
|
(21,659 |
) |
|
|
(55,319 |
) |
|
|
(24,808 |
) |
|
|
(3 |
) |
|
|
(101,789 |
) |
| Charge-offs |
|
|
67,593 |
|
|
|
220,598 |
|
|
|
104,195 |
|
|
|
51,260 |
|
|
|
443,646 |
|
| Sales of loans and receivables |
|
|
830 |
|
|
|
58,431 |
|
|
|
— |
|
|
|
29,264 |
|
|
|
88,525 |
|
| Unwinding effect |
|
|
4,620 |
|
|
|
20,047 |
|
|
|
— |
|
|
|
— |
|
|
|
24,667 |
|
| Others(*) |
|
|
416 |
|
|
|
179,068 |
|
|
|
— |
|
|
|
(633 |
) |
|
|
178,851 |
|
|
|
|
|
|
|
|
|
|
|
|
|
|
|
|
|
|
|
|
|
|
| Ending balance |
|
|
(177,640 |
) |
|
|
(1,267,280 |
) |
|
|
(167,007 |
) |
|
|
(115,245 |
) |
|
|
(1,727,172 |
) |
|
|
|
|
|
|
|
|
|
|
|
|
|
|
|
|
|
|
|
|
|
|
| (*) Others are due to debt-equity swap, fluctuation of foreign
currencies exchange rates, etc. |
|
|
|
| |
|
For the six months ended June 30, 2016 |
|
| |
|
Consumers |
|
|
Corporates |
|
|
Credit card |
|
|
Others |
|
|
Total |
|
| Beginning balance |
|
|
(203,433 |
) |
|
|
(1,686,194 |
) |
|
|
(145,810 |
) |
|
|
(442,620 |
) |
|
|
(2,478,057 |
) |
| Net reversal of provision (net provision) |
|
|
(43,409 |
) |
|
|
(429,470 |
) |
|
|
(96,328 |
) |
|
|
64,649 |
|
|
|
(504,558 |
) |
| Recoveries of loans previously charged off |
|
|
(24,388 |
) |
|
|
(130,430 |
) |
|
|
(20,604 |
) |
|
|
— |
|
|
|
(175,422 |
) |
| Charge-offs |
|
|
71,614 |
|
|
|
198,049 |
|
|
|
134,184 |
|
|
|
397 |
|
|
|
404,244 |
|
| Sales of loans and receivables |
|
|
1,640 |
|
|
|
179,513 |
|
|
|
— |
|
|
|
648 |
|
|
|
181,801 |
|
| Unwinding effect |
|
|
5,294 |
|
|
|
40,036 |
|
|
|
— |
|
|
|
— |
|
|
|
45,330 |
|
| Others(*) |
|
|
(299 |
) |
|
|
14,025 |
|
|
|
— |
|
|
|
3,760 |
|
|
|
17,486 |
|
|
|
|
|
|
|
|
|
|
|
|
|
|
|
|
|
|
|
|
|
|
| Ending balance |
|
|
(192,981 |
) |
|
|
(1,814,471 |
) |
|
|
(128,558 |
) |
|
|
(373,166 |
) |
|
|
(2,509,176 |
) |
|
|
|
|
|
|
|
|
|
|
|
|
|
|
|
|
|
|
|
|
|
| (*) |
Others are due to debt-equity swap, fluctuation of foreign currencies exchange rates, etc. |
- 30 -
| 11. |
THE FAIR VALUE OF FINANCIAL ASSETS AND LIABILITIES |
| (1) |
The fair value hierarchy |
The fair value hierarchy is determined by the levels of judgment involved in
estimating fair values of financial assets and liabilities. The specific financial instruments characteristics and market condition such as volume of transactions and transparency are reflected to the market observable inputs. The fair value
hierarchy gives the highest priority to quoted prices (unadjusted) in active markets for identical assets or liabilities. The Group maximizes the use of observable inputs and minimizes the use of unobservable inputs when measuring fair value of its
financial assets and financial liabilities. Fair value is measured based on the perspective of a market participant. As such, even when market assumptions are not readily available, the Group’s own assumptions reflect those that market
participants would use for measuring the assets or liabilities at the measurement date.
The fair value measurement is described in the one of the
following three levels used to classify fair value measurements:
| |
• |
|
Level 1—fair value measurements are those derived from quoted prices (unadjusted) in active markets for identical assets or liabilities. The types of financial assets or liabilities generally included in
Level 1 are publicly traded equity securities, derivatives, and debt securities issued by governmental bodies. |
| |
• |
|
Level 2— fair value measurements are those derived from inputs other than quoted prices included within Level 1 that are observable for the asset or liability, either directly (i.e. prices) or indirectly
(i.e. derived from prices). The types of financial assets or liabilities generally included in Level 2 are debt securities not traded in active markets and derivatives traded in OTC but not required significant judgment. |
| |
• |
|
Level 3— fair value measurements are those derived from valuation technique that include inputs for the asset or liability that are not based on observable market data (unobservable inputs). The types of
financial assets or liabilities generally included in Level 3 are non-public securities and derivatives and debt securities of which valuation techniques require significant judgments and subjectivity.
|
The inputs used to measure fair value may fall into different levels of the fair value hierarchy. In such cases, the level within the fair
value hierarchy is based on the lowest level of input that is significant to the fair value measurement. The Group’s assessment of the significance of a particular input to a fair value measurement in its entirety requires judgment and
consideration of inherent factors of the asset or liability.
- 31 -
| (2) |
Fair value hierarchy of financial assets and liabilities measured at fair value are as follows (Unit: Korean Won in millions): |
|
|
|
|
|
|
|
|
|
|
|
|
|
|
|
|
|
| |
|
June 30, 2017 |
|
| |
|
Level 1 (*1) |
|
|
Level 2 (*1) |
|
|
Level 3 (*2) |
|
|
Total |
|
| Financial assets: |
|
|
|
|
|
|
|
|
|
|
|
|
|
|
|
|
| Financial assets held for trading |
|
|
|
|
|
|
|
|
|
|
|
|
|
|
|
|
| Deposits |
|
|
31,169 |
|
|
|
— |
|
|
|
— |
|
|
|
31,169 |
|
| Debt securities |
|
|
366,641 |
|
|
|
2,443,139 |
|
|
|
— |
|
|
|
2,809,780 |
|
| Equity securities |
|
|
26,686 |
|
|
|
— |
|
|
|
— |
|
|
|
26,686 |
|
| Beneficiary certificates |
|
|
— |
|
|
|
23,688 |
|
|
|
— |
|
|
|
23,688 |
|
| Derivative assets |
|
|
1,160 |
|
|
|
1,615,486 |
|
|
|
27,422 |
|
|
|
1,644,068 |
|
|
|
|
|
|
|
|
|
|
|
|
|
|
|
|
|
|
| Sub-total |
|
|
425,656 |
|
|
|
4,082,313 |
|
|
|
27,422 |
|
|
|
4,535,391 |
|
|
|
|
|
|
|
|
|
|
|
|
|
|
|
|
|
|
| Financial assets designed at FVTPL |
|
|
|
|
|
|
|
|
|
|
|
|
|
|
|
|
| Debt securities |
|
|
— |
|
|
|
— |
|
|
|
6,539 |
|
|
|
6,539 |
|
| Equity securities |
|
|
— |
|
|
|
— |
|
|
|
12,445 |
|
|
|
12,445 |
|
|
|
|
|
|
|
|
|
|
|
|
|
|
|
|
|
|
| Sub-total |
|
|
— |
|
|
|
— |
|
|
|
18,984 |
|
|
|
18,984 |
|
|
|
|
|
|
|
|
|
|
|
|
|
|
|
|
|
|
| AFS financial assets |
|
|
|
|
|
|
|
|
|
|
|
|
|
|
|
|
| Debt securities |
|
|
2,588,702 |
|
|
|
12,363,344 |
|
|
|
— |
|
|
|
14,952,046 |
|
| Equity securities |
|
|
404,082 |
|
|
|
— |
|
|
|
1,049,948 |
|
|
|
1,454,030 |
|
| Beneficiary certificates |
|
|
— |
|
|
|
2,457,094 |
|
|
|
588,312 |
|
|
|
3,045,406 |
|
| Securities loaned |
|
|
90,325 |
|
|
|
81,363 |
|
|
|
— |
|
|
|
171,688 |
|
|
|
|
|
|
|
|
|
|
|
|
|
|
|
|
|
|
| Sub-total |
|
|
3,083,109 |
|
|
|
14,901,801 |
|
|
|
1,638,260 |
|
|
|
19,623,170 |
|
|
|
|
|
|
|
|
|
|
|
|
|
|
|
|
|
|
| Derivative assets |
|
|
— |
|
|
|
140,176 |
|
|
|
— |
|
|
|
140,176 |
|
|
|
|
|
|
|
|
|
|
|
|
|
|
|
|
|
|
| Total |
|
|
3,508,765 |
|
|
|
19,124,290 |
|
|
|
1,684,666 |
|
|
|
24,317,721 |
|
|
|
|
|
|
|
|
|
|
|
|
|
|
|
|
|
|
| Financial liabilities: |
|
|
|
|
|
|
|
|
|
|
|
|
|
|
|
|
| Financial liabilities held for trading |
|
|
|
|
|
|
|
|
|
|
|
|
|
|
|
|
| Deposits |
|
|
31,184 |
|
|
|
— |
|
|
|
— |
|
|
|
31,184 |
|
| Derivative liabilities |
|
|
1,036 |
|
|
|
1,830,516 |
|
|
|
33,152 |
|
|
|
1,864,704 |
|
| Securities sold |
|
|
6,832 |
|
|
|
— |
|
|
|
— |
|
|
|
6,832 |
|
|
|
|
|
|
|
|
|
|
|
|
|
|
|
|
|
|
| Sub-total |
|
|
39,052 |
|
|
|
1,830,516 |
|
|
|
33,152 |
|
|
|
1,902,720 |
|
|
|
|
|
|
|
|
|
|
|
|
|
|
|
|
|
|
| Financial liabilities designated at FVTPL |
|
|
|
|
|
|
|
|
|
|
|
|
|
|
|
|
| Equity-linked securities |
|
|
— |
|
|
|
212 |
|
|
|
522,375 |
|
|
|
522,587 |
|
| Debentures |
|
|
— |
|
|
|
93,590 |
|
|
|
— |
|
|
|
93,590 |
|
|
|
|
|
|
|
|
|
|
|
|
|
|
|
|
|
|
| Sub-total |
|
|
— |
|
|
|
93,802 |
|
|
|
522,375 |
|
|
|
616,177 |
|
|
|
|
|
|
|
|
|
|
|
|
|
|
|
|
|
|
| Derivative liabilities |
|
|
— |
|
|
|
29,229 |
|
|
|
— |
|
|
|
29,229 |
|
|
|
|
|
|
|
|
|
|
|
|
|
|
|
|
|
|
| Total |
|
|
39,052 |
|
|
|
1,953,547 |
|
|
|
555,527 |
|
|
|
2,548,126 |
|
|
|
|
|
|
|
|
|
|
|
|
|
|
|
|
|
|
- 32 -
|
|
|
|
|
|
|
|
|
|
|
|
|
|
|
|
|
| |
|
December 31, 2016 |
|
| |
|
Level 1 (*1) |
|
|
Level 2 (*1) |
|
|
Level 3 (*2) |
|
|
Total |
|
| Financial assets: |
|
|
|
|
|
|
|
|
|
|
|
|
|
|
|
|
| Financial assets held for trading |
|
|
|
|
|
|
|
|
|
|
|
|
|
|
|
|
| Deposits |
|
|
26,180 |
|
|
|
— |
|
|
|
— |
|
|
|
26,180 |
|
| Debt securities |
|
|
370,636 |
|
|
|
2,274,280 |
|
|
|
— |
|
|
|
2,644,916 |
|
| Equity securities |
|
|
35,983 |
|
|
|
— |
|
|
|
— |
|
|
|
35,983 |
|
| Beneficiary certificates |
|
|
— |
|
|
|
23,891 |
|
|
|
— |
|
|
|
23,891 |
|
| Securities loaned |
|
|
4,459 |
|
|
|
— |
|
|
|
— |
|
|
|
4,459 |
|
| Derivative assets |
|
|
3,233 |
|
|
|
2,871,909 |
|
|
|
23,153 |
|
|
|
2,898,295 |
|
|
|
|
|
|
|
|
|
|
|
|
|
|
|
|
|
|
| Sub-total |
|
|
440,491 |
|
|
|
5,170,080 |
|
|
|
23,153 |
|
|
|
5,633,724 |
|
|
|
|
|
|
|
|
|
|
|
|
|
|
|
|
|
|
| Financial assets designed at FVTPL |
|
|
|
|
|
|
|
|
|
|
|
|
|
|
|
|
| Debt securities |
|
|
— |
|
|
|
— |
|
|
|
4,348 |
|
|
|
4,348 |
|
| Equity securities |
|
|
— |
|
|
|
— |
|
|
|
12,652 |
|
|
|
12,652 |
|
|
|
|
|
|
|
|
|
|
|
|
|
|
|
|
|
|
| Sub-total |
|
|
— |
|
|
|
— |
|
|
|
17,000 |
|
|
|
17,000 |
|
|
|
|
|
|
|
|
|
|
|
|
|
|
|
|
|
|
| AFS financial assets |
|
|
|
|
|
|
|
|
|
|
|
|
|
|
|
|
| Debt securities |
|
|
2,288,917 |
|
|
|
13,759,392 |
|
|
|
— |
|
|
|
16,048,309 |
|
| Equity securities |
|
|
428,678 |
|
|
|
— |
|
|
|
1,024,935 |
|
|
|
1,453,613 |
|
| Beneficiary certificates |
|
|
— |
|
|
|
2,291,571 |
|
|
|
530,511 |
|
|
|
2,822,082 |
|
| Securities loaned |
|
|
391,279 |
|
|
|
102,300 |
|
|
|
— |
|
|
|
493,579 |
|
|
|
|
|
|
|
|
|
|
|
|
|
|
|
|
|
|
| Sub-total |
|
|
3,108,874 |
|
|
|
16,153,263 |
|
|
|
1,555,446 |
|
|
|
20,817,583 |
|
|
|
|
|
|
|
|
|
|
|
|
|
|
|
|
|
|
| Derivative assets |
|
|
— |
|
|
|
140,478 |
|
|
|
99 |
|
|
|
140,577 |
|
|
|
|
|
|
|
|
|
|
|
|
|
|
|
|
|
|
| Total |
|
|
3,549,365 |
|
|
|
21,463,821 |
|
|
|
1,595,698 |
|
|
|
26,608,884 |
|
|
|
|
|
|
|
|
|
|
|
|
|
|
|
|
|
|
| Financial liabilities: |
|
|
|
|
|
|
|
|
|
|
|
|
|
|
|
|
| Financial liabilities held for trading |
|
|
|
|
|
|
|
|
|
|
|
|
|
|
|
|
| Deposits |
|
|
26,501 |
|
|
|
— |
|
|
|
— |
|
|
|
26,501 |
|
| Derivative liabilities |
|
|
1,750 |
|
|
|
2,974,703 |
|
|
|
33,524 |
|
|
|
3,009,977 |
|
|
|
|
|
|
|
|
|
|
|
|
|
|
|
|
|
|
| Sub-total |
|
|
28,251 |
|
|
|
2,974,703 |
|
|
|
33,524 |
|
|
|
3,036,478 |
|
|
|
|
|
|
|
|
|
|
|
|
|
|
|
|
|
|
| Financial liabilities designated at FVTPL |
|
|
|
|
|
|
|
|
|
|
|
|
|
|
|
|
| Equity-linked securities |
|
|
— |
|
|
|
197 |
|
|
|
673,709 |
|
|
|
673,906 |
|
| Debentures |
|
|
— |
|
|
|
92,974 |
|
|
|
— |
|
|
|
92,974 |
|
|
|
|
|
|
|
|
|
|
|
|
|
|
|
|
|
|
| Sub-total |
|
|
— |
|
|
|
93,171 |
|
|
|
673,709 |
|
|
|
766,880 |
|
|
|
|
|
|
|
|
|
|
|
|
|
|
|
|
|
|
| Derivative liabilities |
|
|
— |
|
|
|
7,221 |
|
|
|
— |
|
|
|
7,221 |
|
|
|
|
|
|
|
|
|
|
|
|
|
|
|
|
|
|
| Total |
|
|
28,251 |
|
|
|
3,075,095 |
|
|
|
707,233 |
|
|
|
3,810,579 |
|
|
|
|
|
|
|
|
|
|
|
|
|
|
|
|
|
|
| (*1) |
There is no transfer between level 1 and level 2 of financial assets and liabilities measured at fair value. The Group recognizes transfers between the levels at the end of reporting period within which events or
conditions change. |
| (*2) |
Certain AFS unquoted equity securities were measured at cost as of June 30, 2017 and December 31, 2016, that are amounting to 50,945 million Won and 43,202 million Won, respectively. These unquoted
equity instruments mostly represent minority investments in special purposed entity vehicles such as asset securitization structures. They are measured at cost because (a) observable inputs of financial information to measure fair value was not
available to obtain, or (b) there is a significant variance in likely estimated cash flows or (c) the probabilities for the various estimated cash flows could not be measured reliably. In addition, the Group has no intention to dispose
these investments in the foreseeable future. |
Financial assets and liabilities designated at FVTPL, held-for-trading financial assets and liabilities, AFS financial assets, and derivative assets and liabilities are recognized at fair value. Fair value is the amount that would be received to sell an asset,
or paid to transfer a liability, in an orderly transaction between market participants at the measurement date.
- 33 -
Financial instruments are measured at fair value using a quoted market price in active markets. If there is no
active market for a financial instrument, the Group determines the fair value using alternative assumptions and developing fair value measurement methods. Alternative assumptions and fair value measurement methods for each type of financial
instruments are as follows:
|
|
|
|
|
| |
|
Fair value measurement methods |
|
Alternative assumptions |
|
|
|
| Debt securities |
|
The fair value is measured by discounting the projected cash flows of debt securities by applying
the market discount rate that has been applied to a proxy company that has similar credit rating to the issuers of the securities. |
|
Risk-free market rate, credit spread |
|
|
|
| Equity securities |
|
Among DCF (Discounted Cash Flow) Model, FCFE (Free Cash Flow to Equity) Model, Comparable Company
Analysis, Dividend Discount Model, Risk-adjusted Rate of Return Method, and Net Asset Value Method, more than one method is used given the characteristic of the subject of fair value measurement. |
|
Risk-free market rate, market risk premium, Beta |
|
|
|
| Derivatives |
|
The in-house developed model which is based on the models
that are used by market participants in the valuation of general OTC derivative products, such as options, interest rate swaps, currency swap and currency forward that are based on inputs observable in the market.
However, for some complicated financial
instruments of which valuation should be based on some assumptions since some significant or all inputs to be used in the model are not observable in the market, the in-house derived model which is developed
from the general valuation models, such as Finite Difference Method (“FDM”) or Monte Carlo Simulation. |
|
Risk-free market rate, forward rate, volatility, foreign exchange rate, stock prices,
etc. |
|
|
|
| Equity-linked securities |
|
The fair value of security linked to stock prices or derivatives is measured by the models such as
DCF model, FDM, or Monte Carlo Simulation given the natures of the securities or underlying assets. |
|
Values of underlying assets, risk-free market rate, market
rate, dividend and convenience yield, volatility, correlation coefficient, credit spread, and foreign exchange rate |
|
|
|
| Debentures |
|
The fair value is measured by discounting the projected cash flows of a debenture by applying the
market discount rate that is reflecting credit rating of the Group. |
|
Risk-free market rate, forward rate |
- 34 -
Valuation methods of financial assets and liabilities measured at fair value and classified into Level 3 and
significant but unobservable inputs are as follows:
|
|
|
|
|
|
|
|
|
|
|
| |
|
Fair value
measurement
technique |
|
|
Input variable |
|
Range |
|
Impact of changes in significant
unobservable inputs on fair value
measurement |
| Derivative assets |
|
|
Option valuation
model and
others |
|
|
Correlation
coefficient |
|
0.700~0.980 |
|
Variation of fair value increases as correlation coefficient increases |
|
|
|
|
|
|
Volatility of
underlying
asset |
|
17.1%~34.2% |
|
Variation of fair value increases as volatility increases |
|
|
|
|
|
| Derivative liabilities |
|
|
Option valuation
model and
others |
|
|
Correlation
coefficient |
|
0.700~0.980 |
|
Variation of fair value increases as correlation coefficient increases |
|
|
|
|
|
|
Volatility of
underlying
asset |
|
17.1%~34.2% |
|
Variation of fair value increases as volatility increases |
|
|
|
|
|
| Equity linked securities |
|
|
Monte Carlo
Simulation and
others |
|
|
Correlation
coefficient |
|
0.047~0.706 |
|
Equity linked securities’ fair value increases if both volatility and correlation coefficient
increase |
|
|
|
|
|
|
Volatility of
underlying
asset |
|
10.6%~43.6% |
|
However when correlation coefficient decreases, despite the increase in volatility, the fair value
of equity linked securities may decrease |
|
|
|
|
|
| Equity securities |
|
|
External
appraisal
value and
others |
|
|
Expected
growth
rate |
|
0.0%~1.0% |
|
Fair value increases as expected growth rate increases |
Fair value of financial assets and liabilities classified into level 3 is measured by the Group using its own valuation
techniques or using external specialists. Unobservable inputs used in the fair value measurements are produced by the internal system of the Group and the appropriateness of inputs is reviewed regularly.
- 35 -
| (3) |
Changes in financial assets and liabilities classified into level 3 are as follows (Unit: Korean Won in millions): |
|
|
|
|
|
|
|
|
|
|
|
|
|
|
|
|
|
|
|
|
|
|
|
|
|
|
|
|
|
| |
|
For the six months ended June 30, 2017 |
|
| |
|
January 1,
2017 |
|
|
Net
Income (loss)
(*1) |
|
|
Other
comprehensive
income (loss) |
|
|
Purchases/
Issuances |
|
|
Disposals/
Settlements |
|
|
Transfer to or
out of level 3
(*2) |
|
|
June 30,
2017 |
|
| Financial assets: |
|
|
|
|
|
|
|
|
|
|
|
|
|
|
|
|
|
|
|
|
|
|
|
|
|
|
|
|
| Financial assets held for trading |
|
|
|
|
|
|
|
|
|
|
|
|
|
|
|
|
|
|
|
|
|
|
|
|
|
|
|
|
| Derivative assets |
|
|
23,153 |
|
|
|
21,217 |
|
|
|
— |
|
|
|
472 |
|
|
|
(17,420 |
) |
|
|
— |
|
|
|
27,422 |
|
| Financial assets designed at FVTPL |
|
|
|
|
|
|
|
|
|
|
|
|
|
|
|
|
|
|
|
|
|
|
|
|
|
|
|
|
| Debt securities |
|
|
4,348 |
|
|
|
191 |
|
|
|
— |
|
|
|
2,000 |
|
|
|
— |
|
|
|
— |
|
|
|
6,539 |
|
| Equity securities |
|
|
12,652 |
|
|
|
(207 |
) |
|
|
— |
|
|
|
— |
|
|
|
— |
|
|
|
— |
|
|
|
12,445 |
|
|
|
|
|
|
|
|
|
|
|
|
|
|
|
|
|
|
|
|
|
|
|
|
|
|
|
|
|
|
| Sub-total |
|
|
17,000 |
|
|
|
(16 |
) |
|
|
— |
|
|
|
2,000 |
|
|
|
— |
|
|
|
— |
|
|
|
18,984 |
|
|
|
|
|
|
|
|
|
|
|
|
|
|
|
|
|
|
|
|
|
|
|
|
|
|
|
|
|
|
| AFS financial assets |
|
|
|
|
|
|
|
|
|
|
|
|
|
|
|
|
|
|
|
|
|
|
|
|
|
|
|
|
| Equity securities (*3) |
|
|
1,024,935 |
|
|
|
19,241 |
|
|
|
10,175 |
|
|
|
27,289 |
|
|
|
(31,692 |
) |
|
|
— |
|
|
|
1,049,948 |
|
| Beneficiary certificates |
|
|
530,511 |
|
|
|
3,442 |
|
|
|
(2,188 |
) |
|
|
127,147 |
|
|
|
(70,600 |
) |
|
|
— |
|
|
|
588,312 |
|
|
|
|
|
|
|
|
|
|
|
|
|
|
|
|
|
|
|
|
|
|
|
|
|
|
|
|
|
|
| Sub-total |
|
|
1,555,446 |
|
|
|
22,683 |
|
|
|
7,987 |
|
|
|
154,436 |
|
|
|
(102,292 |
) |
|
|
— |
|
|
|
1,638,260 |
|
|
|
|
|
|
|
|
|
|
|
|
|
|
|
|
|
|
|
|
|
|
|
|
|
|
|
|
|
|
| Derivative assets |
|
|
99 |
|
|
|
185 |
|
|
|
— |
|
|
|
— |
|
|
|
(284 |
) |
|
|
— |
|
|
|
— |
|
|
|
|
|
|
|
|
|
|
|
|
|
|
|
|
|
|
|
|
|
|
|
|
|
|
|
|
|
|
| Total |
|
|
1,595,698 |
|
|
|
44,069 |
|
|
|
7,987 |
|
|
|
156,908 |
|
|
|
(119,996 |
) |
|
|
— |
|
|
|
1,684,666 |
|
|
|
|
|
|
|
|
|
|
|
|
|
|
|
|
|
|
|
|
|
|
|
|
|
|
|
|
|
|
| Financial liabilities: |
|
|
|
|
|
|
|
|
|
|
|
|
|
|
|
|
|
|
|
|
|
|
|
|
|
|
|
|
| Financial liabilities held for trading |
|
|
|
|
|
|
|
|
|
|
|
|
|
|
|
|
|
|
|
|
|
|
|
|
|
|
|
|
| Derivative liabilities |
|
|
33,524 |
|
|
|
14,142 |
|
|
|
— |
|
|
|
501 |
|
|
|
(15,015 |
) |
|
|
— |
|
|
|
33,152 |
|
| Financial liabilities designated at FVTPL |
|
|
|
|
|
|
|
|
|
|
|
|
|
|
|
|
|
|
|
|
|
|
|
|
|
|
|
|
| Equity-linked securities |
|
|
673,709 |
|
|
|
83,962 |
|
|
|
— |
|
|
|
— |
|
|
|
(235,296 |
) |
|
|
— |
|
|
|
522,375 |
|
|
|
|
|
|
|
|
|
|
|
|
|
|
|
|
|
|
|
|
|
|
|
|
|
|
|
|
|
|
| Total |
|
|
707,233 |
|
|
|
98,104 |
|
|
|
— |
|
|
|
501 |
|
|
|
(250,311 |
) |
|
|
— |
|
|
|
555,527 |
|
|
|
|
|
|
|
|
|
|
|
|
|
|
|
|
|
|
|
|
|
|
|
|
|
|
|
|
|
|
| (*1) |
The loss amounting to 61,518 million Won for the six months ended June 30, 2017, which is from financial assets and liabilities that the Group holds, has been recognized in net gain (loss) on financial
instruments at FVTPL and net gain (loss) on AFS financial assets in the statement of comprehensive income. |
| (*2) |
The Group recognizes transfers between levels at the end of reporting period within which events have occurred or conditions have changed. |
- 36 -
|
|
|
|
|
|
|
|
|
|
|
|
|
|
|
|
|
|
|
|
|
|
|
|
|
|
|
|
|
| |
|
For the six months ended June 30, 2016 |
|
| |
|
January 1,
2016 |
|
|
Net
Income (loss)
(*1) |
|
|
Other
comprehensive
income (loss) |
|
|
Purchases/
Issuances |
|
|
Disposals/
Settlements |
|
|
Transfer to or
out of level 3
(*2) |
|
|
June 30,
2016 |
|
| Financial assets: |
|
|
|
|
|
|
|
|
|
|
|
|
|
|
|
|
|
|
|
|
|
|
|
|
|
|
|
|
| Financial assets held for trading |
|
|
78,676 |
|
|
|
33,250 |
|
|
|
— |
|
|
|
(1,075 |
) |
|
|
(22,827 |
) |
|
|
— |
|
|
|
88,024 |
|
| Derivative assets |
|
|
78,676 |
|
|
|
33,250 |
|
|
|
— |
|
|
|
(1,075 |
) |
|
|
(22,827 |
) |
|
|
— |
|
|
|
88,024 |
|
| Financial assets designed at FVTPL |
|
|
|
|
|
|
|
|
|
|
|
|
|
|
|
|
|
|
|
|
|
|
|
|
|
|
|
|
| Debt securities |
|
|
986 |
|
|
|
(18 |
) |
|
|
— |
|
|
|
— |
|
|
|
— |
|
|
|
— |
|
|
|
968 |
|
| Equity securities |
|
|
11,609 |
|
|
|
408 |
|
|
|
— |
|
|
|
— |
|
|
|
— |
|
|
|
— |
|
|
|
12,017 |
|
|
|
|
|
|
|
|
|
|
|
|
|
|
|
|
|
|
|
|
|
|
|
|
|
|
|
|
|
|
| Sub-total |
|
|
12,595 |
|
|
|
390 |
|
|
|
— |
|
|
|
— |
|
|
|
— |
|
|
|
— |
|
|
|
12,985 |
|
|
|
|
|
|
|
|
|
|
|
|
|
|
|
|
|
|
|
|
|
|
|
|
|
|
|
|
|
|
| AFS financial assets |
|
|
|
|
|
|
|
|
|
|
|
|
|
|
|
|
|
|
|
|
|
|
|
|
|
|
|
|
| Equity securities (*3) |
|
|
993,368 |
|
|
|
(2,613 |
) |
|
|
51,058 |
|
|
|
188,676 |
|
|
|
(103,944 |
) |
|
|
(17,455 |
) |
|
|
1,109,090 |
|
| Beneficiary certificates |
|
|
377,070 |
|
|
|
1,733 |
|
|
|
(2,414 |
) |
|
|
90,939 |
|
|
|
(11,920 |
) |
|
|
— |
|
|
|
455,408 |
|
| Others |
|
|
5,308 |
|
|
|
594 |
|
|
|
(642 |
) |
|
|
— |
|
|
|
(5,260 |
) |
|
|
— |
|
|
|
— |
|
|
|
|
|
|
|
|
|
|
|
|
|
|
|
|
|
|
|
|
|
|
|
|
|
|
|
|
|
|
| Sub-total |
|
|
1,375,746 |
|
|
|
(286 |
) |
|
|
48,002 |
|
|
|
279,615 |
|
|
|
(121,124 |
) |
|
|
(17,455 |
) |
|
|
1,564,498 |
|
|
|
|
|
|
|
|
|
|
|
|
|
|
|
|
|
|
|
|
|
|
|
|
|
|
|
|
|
|
| Derivative assets |
|
|
5,973 |
|
|
|
3,619 |
|
|
|
— |
|
|
|
— |
|
|
|
(9,490 |
) |
|
|
— |
|
|
|
102 |
|
|
|
|
|
|
|
|
|
|
|
|
|
|
|
|
|
|
|
|
|
|
|
|
|
|
|
|
|
|
| Total |
|
|
1,472,990 |
|
|
|
36,973 |
|
|
|
48,002 |
|
|
|
278,540 |
|
|
|
(153,441 |
) |
|
|
(17,455 |
) |
|
|
1,665,609 |
|
|
|
|
|
|
|
|
|
|
|
|
|
|
|
|
|
|
|
|
|
|
|
|
|
|
|
|
|
|
| Financial liabilities: |
|
|
|
|
|
|
|
|
|
|
|
|
|
|
|
|
|
|
|
|
|
|
|
|
|
|
|
|
| Financial liabilities held for trading |
|
|
|
|
|
|
|
|
|
|
|
|
|
|
|
|
|
|
|
|
|
|
|
|
|
|
|
|
| Derivative liabilities |
|
|
78,607 |
|
|
|
32,323 |
|
|
|
— |
|
|
|
— |
|
|
|
(22,336 |
) |
|
|
— |
|
|
|
88,594 |
|
| Financial liabilities designated at FVTPL |
|
|
|
|
|
|
|
|
|
|
|
|
|
|
|
|
|
|
|
|
|
|
|
|
|
|
|
|
| Equity-linked securities |
|
|
747,351 |
|
|
|
(47,721 |
) |
|
|
— |
|
|
|
983 |
|
|
|
(23,075 |
) |
|
|
— |
|
|
|
677,538 |
|
|
|
|
|
|
|
|
|
|
|
|
|
|
|
|
|
|
|
|
|
|
|
|
|
|
|
|
|
|
| Total |
|
|
825,958 |
|
|
|
(15,398 |
) |
|
|
— |
|
|
|
983 |
|
|
|
(45,411 |
) |
|
|
— |
|
|
|
766,132 |
|
|
|
|
|
|
|
|
|
|
|
|
|
|
|
|
|
|
|
|
|
|
|
|
|
|
|
|
|
|
| (*1) |
The gain amounting to 47,643 million Won for the six months ended June 30, 2016, which is from financial assets and liabilities that the Group holds, has been recognized in net gain (loss) on financial
instruments at FVTPL and net gain (loss) on AFS financial assets in the consolidated statement of comprehensive income. |
| (*2) |
The Group recognizes transfers between levels at the end of reporting period within which events have occurred or conditions have changed. |
| (*3) |
AFS financial assets were transferred out of level 1 to level 3 upon the change of the fair value measurement method of the assets by using quoted prices in the active market from previously using the external valuation
specialists. |
- 37 -
| (4) |
Sensitivity analysis on the unobservable inputs used for measuring level 3 financial instruments |
The
sensitivity analysis of the financial instruments has been performed by classifying with favorable and unfavorable changes based on how changes in unobservable assumptions would have effects on the fluctuations of financial instruments’ value.
When the fair value of a financial instrument is affected by more than one unobservable assumption, the below table reflects the most favorable or the most unfavorable changes which resulted from varying the assumptions individually. The sensitivity
analysis was performed for two types of level 3 financial instruments: (1) interest rate related derivatives, currency related derivatives, equity related derivatives, and equity-linked securities of which fair value changes are recognized as
net income; (2) equity securities and beneficiary certificates of which fair value changes are recognized as other comprehensive income. Equity securities classified as level 3 but measured at costs are excluded from sensitivity analysis.
The following table presents the sensitivity analysis to disclose the effect of reasonably possible volatility on the fair value of a level 3 financial
instruments as of June 30, 2017 and December 31, 2016. (Unit: Korean Won in millions):
|
|
|
|
|
|
|
|
|
|
|
|
|
|
|
|
|
|
|
|
|
|
|
|
|
|
|
|
|
|
|
|
|
| |
|
As of June 30, 2017 |
|
|
As of December 31, 2016 |
|
| |
|
Net income
(loss) |
|
|
Other comprehensive
income (loss) |
|
|
Net income
(loss) |
|
|
Other comprehensive
income (loss) |
|
| |
|
Favorable |
|
|
Unfavorable |
|
|
Favorable |
|
|
Unfavorable |
|
|
Favorable |
|
|
Unfavorable |
|
|
Favorable |
|
|
Unfavorable |
|
| Financial assets: |
|
|
|
|
|
|
|
|
|
|
|
|
|
|
|
|
|
|
|
|
|
|
|
|
|
|
|
|
|
|
|
|
| Financial assets held for trading |
|
|
|
|
|
|
|
|
|
|
|
|
|
|
|
|
|
|
|
|
|
|
|
|
|
|
|
|
|
|
|
|
| Derivatives instruments assets (*1)(*2) |
|
|
5,212 |
|
|
|
(6,345 |
) |
|
|
— |
|
|
|
— |
|
|
|
861 |
|
|
|
(2,248 |
) |
|
|
— |
|
|
|
— |
|
| Financial assets designed at FVTPL |
|
|
|
|
|
|
|
|
|
|
|
|
|
|
|
|
|
|
|
|
|
|
|
|
|
|
|
|
|
|
|
|
| Equity securities (*5) |
|
|
730 |
|
|
|
(681 |
) |
|
|
— |
|
|
|
— |
|
|
|
707 |
|
|
|
(657 |
) |
|
|
— |
|
|
|
— |
|
| AFS Financial assets |
|
|
|
|
|
|
|
|
|
|
|
|
|
|
|
|
|
|
|
|
|
|
|
|
|
|
|
|
|
|
|
|
| Equity securities (*3)(*4) |
|
|
— |
|
|
|
— |
|
|
|
33,536 |
|
|
|
(17,249 |
) |
|
|
— |
|
|
|
— |
|
|
|
31,412 |
|
|
|
(18,551 |
) |
| Beneficiary certificates (*4) |
|
|
— |
|
|
|
— |
|
|
|
2,428 |
|
|
|
(2,087 |
) |
|
|
— |
|
|
|
— |
|
|
|
2,903 |
|
|
|
(2,571 |
) |
|
|
|
|
|
|
|
|
|
|
|
|
|
|
|
|
|
|
|
|
|
|
|
|
|
|
|
|
|
|
|
|
|
| Total |
|
|
5,942 |
|
|
|
(7,026 |
) |
|
|
35,964 |
|
|
|
(19,336 |
) |
|
|
1,568 |
|
|
|
(2,905 |
) |
|
|
34,315 |
|
|
|
(21,122 |
) |
|
|
|
|
|
|
|
|
|
|
|
|
|
|
|
|
|
|
|
|
|
|
|
|
|
|
|
|
|
|
|
|
|
| Financial liabilities: |
|
|
|
|
|
|
|
|
|
|
|
|
|
|
|
|
|
|
|
|
|
|
|
|
|
|
|
|
|
|
|
|
| Financial liabilities held for trading |
|
|
|
|
|
|
|
|
|
|
|
|
|
|
|
|
|
|
|
|
|
|
|
|
|
|
|
|
|
|
|
|
| Derivative liabilities (*1)(*2) |
|
|
7,677 |
|
|
|
(6,538 |
) |
|
|
— |
|
|
|
— |
|
|
|
4,892 |
|
|
|
(3,568 |
) |
|
|
— |
|
|
|
— |
|
| Financial liabilities designated at FVTPL |
|
|
|
|
|
|
|
|
|
|
|
|
|
|
|
|
|
|
|
|
|
|
|
|
|
|
|
|
|
|
|
|
| Equity-linked securities (*1) |
|
|
144 |
|
|
|
(125 |
) |
|
|
— |
|
|
|
— |
|
|
|
905 |
|
|
|
(857 |
) |
|
|
— |
|
|
|
— |
|
|
|
|
|
|
|
|
|
|
|
|
|
|
|
|
|
|
|
|
|
|
|
|
|
|
|
|
|
|
|
|
|
|
| Total |
|
|
7,821 |
|
|
|
(6,663 |
) |
|
|
— |
|
|
|
— |
|
|
|
5,797 |
|
|
|
(4,425 |
) |
|
|
— |
|
|
|
— |
|
|
|
|
|
|
|
|
|
|
|
|
|
|
|
|
|
|
|
|
|
|
|
|
|
|
|
|
|
|
|
|
|
|
| (*1) |
Fair value changes of equity related derivatives assets and liabilities and equity-linked securities are calculated by increasing or decreasing historical volatility of the stock price and correlation, which are major
unobservable variables, by 10%, respectively. In the case of interest rate related derivative assets and liabilities, fair value changes are calculated by increasing or decreasing the volatility of interest rate, which are major unobservable
variables, by 10%, respectively. |
| (*2) |
Both derivative assets and liabilities for held for trading and hedging are included. |
| (*3) |
Fair value changes of equity securities are calculated by increasing or decreasing growth rate (0~1%) and discount rate or liquidation value (-1~1%) and discount rate. The growth
rate, discount rate, and liquidation value are major unobservable variables. |
| (*4) |
Among the equity securities, even if the sensitivity analysis of the capital contributions and beneficiary certificates is not possible in practice, fair value changes of beneficiary certificates and other securities
whose major unobservable variables are composed of the real estate are calculated by increasing or decreasing price fluctuation of real estate which is underlying assets and discount rate by 1%. |
| (*5) |
Changes of fair value are measured by increasing or decreasing the discount rate by 10%, which is major unobservable variable, respectively. |
- 38 -
| (5) |
Fair value and carrying amount of financial assets and liabilities that are recorded at amortized cost are as follows (Unit: Korean Won in millions): |
|
|
|
|
|
|
|
|
|
|
|
|
|
|
|
|
|
|
|
|
|
| |
|
As of June 30, 2017 |
|
| |
|
Fair value |
|
|
Book
value |
|
| |
|
Level 1 |
|
|
Level 2 |
|
|
Level 3 |
|
|
Total |
|
|
| Financial assets: |
|
|
|
|
|
|
|
|
|
|
|
|
|
|
|
|
|
|
|
|
| HTM financial assets |
|
|
1,478,690 |
|
|
|
13,725,181 |
|
|
|
— |
|
|
|
15,203,871 |
|
|
|
15,144,766 |
|
| Loans and receivables |
|
|
— |
|
|
|
— |
|
|
|
265,724,502 |
|
|
|
265,724,502 |
|
|
|
265,148,624 |
|
| Financial liabilities: |
|
|
|
|
|
|
|
|
|
|
|
|
|
|
|
|
|
|
|
|
| Deposits due to customers |
|
|
— |
|
|
|
226,268,221 |
|
|
|
— |
|
|
|
226,268,221 |
|
|
|
226,200,577 |
|
| Borrowings |
|
|
— |
|
|
|
15,686,207 |
|
|
|
— |
|
|
|
15,686,207 |
|
|
|
15,679,945 |
|
| Debentures |
|
|
— |
|
|
|
25,874,673 |
|
|
|
— |
|
|
|
25,874,673 |
|
|
|
25,649,132 |
|
| Other financial liabilities |
|
|
— |
|
|
|
24,649,686 |
|
|
|
— |
|
|
|
24,649,686 |
|
|
|
24,650,846 |
|
|
|
|
|
|
|
|
|
|
|
|
|
|
|
|
|
|
|
|
|
|
| |
|
As of December 31, 2016 |
|
| |
|
Fair value |
|
|
Book
value |
|
| |
|
Level 1 |
|
|
Level 2 |
|
|
Level 3 |
|
|
Total |
|
|
| Financial assets: |
|
|
|
|
|
|
|
|
|
|
|
|
|
|
|
|
|
|
|
|
| HTM financial assets |
|
|
741,880 |
|
|
|
13,243,297 |
|
|
|
— |
|
|
|
13,985,177 |
|
|
|
13,910,251 |
|
| Loans and receivables |
|
|
— |
|
|
|
— |
|
|
|
259,565,952 |
|
|
|
259,565,952 |
|
|
|
258,392,633 |
|
| Financial liabilities: |
|
|
|
|
|
|
|
|
|
|
|
|
|
|
|
|
|
|
|
|
| Deposits due to customers |
|
|
— |
|
|
|
221,001,466 |
|
|
|
— |
|
|
|
221,001,466 |
|
|
|
221,020,411 |
|
| Borrowings |
|
|
— |
|
|
|
18,785,325 |
|
|
|
— |
|
|
|
18,785,325 |
|
|
|
18,769,515 |
|
| Debentures |
|
|
— |
|
|
|
24,004,668 |
|
|
|
— |
|
|
|
24,004,668 |
|
|
|
23,565,449 |
|
| Other financial liabilities |
|
|
— |
|
|
|
21,984,171 |
|
|
|
— |
|
|
|
21,984,171 |
|
|
|
21,985,086 |
|
The fair values of financial instruments are measured using quoted market price in active markets. In case there is no active
market for financial instruments, the Group determines the fair value using alternative assumptions through developing fair value measurement methods. Alternative assumptions and fair value measurement methods for financial assets and liabilities
that are measured at amortized costs are given as follows:
|
|
|
|
|
| |
|
Fair value measurement technique |
|
Input variables |
| Debt securities |
|
The fair value is measured by discounting the projected cash flows of debt securities by applying
the market discount rate that has been applied to a proxy company that has similar credit rating to the issuers of the securities. |
|
Risk-free market rate and credit spread |
|
|
|
| Loans and receivables |
|
The fair value is measured by discounting the projected cash flows of loan products by applying
the market discount rate that has been applied to a proxy company that has similar credit rating to the debtor. |
|
Risk-free market rate, credit spread and prepayment-rate |
|
|
|
| Deposit due to customers, borrowings, debentures, and other financial liabilities |
|
The fair value is measured by discounting the projected cash flows of debt products by applying
the market discount rate that is reflecting credit rating of the Group. |
|
Risk-free market rate and forward rate |
- 39 -
| 12. |
DERECOGNITION AND OFFSET OF FINANCIAL INSTRUMENTS |
| (1) |
Derecognition of financial assets |
| |
1) |
Transferred financial assets that meet condition of derecognition |
The book value, fair value
of, and maximum exposure to loss from the financial assets that were derecognized from the consolidated financial statements of the Group through disposals, but the Group still have continuous involvements are given as follows (Unit: Korean Won in
millions):
|
|
|
|
|
|
|
|
|
|
|
|
|
|
|
| |
|
June 30, 2017 |
|
| |
|
Type of
continuous
involvement |
|
Book value
of
continuous
participation |
|
|
Fair value
of
continuous
participation |
|
|
Maximum
exposure
to loss |
|
| Conditional disposal of loans to KAMCO (*) |
|
Post settlement |
|
|
— |
|
|
|
— |
|
|
|
701 |
|
|
|
|
|
|
|
|
|
|
|
|
|
|
|
|
| |
|
December 31, 2016 |
|
| |
|
Type of
continuous
involvement |
|
Book value of
continuous
participation |
|
|
Fair value of
continuous
participation |
|
|
Maximum
exposure
to loss |
|
| Conditional disposal of loans to KAMCO (*) |
|
Post settlement |
|
|
— |
|
|
|
— |
|
|
|
701 |
|
| (*) |
For ex-post settling up amount of the collateral is not fixed yet, expected cash flow cannot be reliably measured as of June 30, 2017 and December 31, 2016, and the
maximum exposure to loss is disclosed at the transfer price. Though the transfer does not qualify for derecognition in accordance with K-IFRS 1039 – Financial Instrument: Recognition and
Measurement, the Group derecognized the financial asset from the consolidated financial statements applying exception for retrospective application of transactions before the date of transition to IFRSs in
K-IFRS 1101 – First-time Adoption of K-IFRS. |
| |
2) |
Transferred financial assets that do not meet condition of derecognition |
| |
a) |
Disposal of securities under repurchase agreements |
The financial instruments that were
disposed but the Group agreed to repurchase at the fixed amounts at the same time, so that they did not meet the conditions of derecognition, are as follows (Unit: Korean Won in millions):
|
|
|
|
|
|
|
|
|
|
|
| |
|
|
|
June 30,
2017 |
|
|
December 31,
2016 |
|
| Assets transferred |
|
Due from banks |
|
|
49,864 |
|
|
|
— |
|
|
|
AFS financial assets |
|
|
517,751 |
|
|
|
2,546,683 |
|
|
|
HTM financial assets |
|
|
7,139 |
|
|
|
7,133 |
|
|
|
|
|
|
|
|
|
|
|
|
|
|
Total |
|
|
574,754 |
|
|
|
2,553,816 |
|
|
|
|
|
|
|
|
|
|
|
|
| Related liabilities |
|
Bonds sold under repurchase agreements |
|
|
559,951 |
|
|
|
2,004,905 |
|
|
|
|
|
|
|
|
|
|
|
|
- 40 -
When the Group loans its securities to outside parties, the legal ownerships
of the securities are transferred, however, they should be returned at the end of lending period therefore the Group does not derecognize them from the consolidated financial statements as it owns majority of risks and benefits from the securities
continuously regardless of the transfer of legal ownership. The carrying amounts of securities loaned are as follows (Unit: Korean Won in millions):
|
|
|
|
|
|
|
|
|
|
|
|
|
| |
|
|
|
June 30,
2017 |
|
|
December 31,
2016 |
|
|
Loaned to |
| Financial assets at FVTPL |
|
Equity securities- listed stock |
|
|
— |
|
|
|
4,459 |
|
|
Samsung Securities Co., Ltd. and others |
| AFS financial
assets |
|
Debt securities- Korean treasury and government agencies and others |
|
|
171,688 |
|
|
|
493,579 |
|
|
Korea Securities Finance Corporation and others |
|
|
|
|
|
|
|
|
|
|
|
|
|
|
|
Total |
|
|
171,688 |
|
|
|
498,038 |
|
|
|
|
|
|
|
|
|
|
|
|
|
|
|
|
The details of the transferred financial assets that are not derecognized in their entirety, such as disposal
of securities under repurchase agreement or securities loaned, are explained in Note 18.
| |
(2) |
The offset of financial assets and liabilities |
The Group possesses both the uncollected
domestic exchange receivables and unpaid domestic exchange payable, which satisfy offsetting criteria of K-IFRS 1032. Therefore, the total number of uncollected domestic exchange receivables or unpaid domestic
exchange payable has been countervailed with part of unpaid domestic exchange payable or uncollected domestic exchange receivables, respectively, and has been disclosed in loans and receivables or other financial liabilities of the Group’s
statements of financial position and loans and receivables, respectively.
The Group possesses the derivative assets, derivative
liabilities, receivable spot exchange, and payable spot exchange which do not satisfy the offsetting criteria of K-IFRS 1032, but provide the Group the right of, under the circumstances of the trading
party’s defaults, insolvency, or bankruptcy, the offsetting. Item such as cash collateral cannot satisfy the offsetting criteria of K-IFRS 1032, but in accordance with the collateral arrangements and
under the circumstances of the trading party’s default, insolvency, or bankruptcy, the derivative assets, derivative liabilities, receivable spot exchange, and the net amount of payable spot exchange can be offset.
The Group has entered into a sale and repurchase agreements and accounted it as collateralized borrowing. Also, the Group has entered into a
purchase and resale agreement and accounted it as secured loans. The repurchase and resale agreement can have the offsetting right only under the trading party’s default, insolvency, or bankruptcy which do not satisfy the offsetting criteria of
K-IFRS 1032, the Group recorded the collateralized borrowings in borrowings and the secured loans in loans and receivables. The Group under the repurchase agreements has offsetting right only upon the
counter-party’s default, insolvency or bankruptcy, thus the repurchase agreements are applied by the TBMA/ISMA Global Master Repurchase Agreement of which do not satisfy the offsetting criteria of K-IFRS
1032. The Group disclosed bonds sold (purchased) under repurchase agreements as borrowings (loans and receivables).
- 41 -
As of June 30, 2017 and December 31, 2016, the financial instruments to be set off and
may be covered by master netting agreements and similar agreements are given as below (Unit: Korean Won in millions):
|
|
|
|
|
|
|
|
|
|
|
|
|
|
|
|
|
|
|
|
|
|
|
|
|
| |
|
June 30, 2017 |
|
| |
|
Gross
amounts of
recognized
financial
assets |
|
|
Gross amounts
of recognized
financial assets
set off |
|
|
Net
amounts of
financial
assets
presented |
|
|
Related amounts not set
off in the statement of
financial position |
|
|
Net
amounts |
|
| |
|
|
|
|
Financial
instruments |
|
|
Cash
collateral
received |
|
|
| Financial assets: |
|
|
|
|
|
|
|
|
|
|
|
|
|
|
|
|
|
|
|
|
|
|
|
|
| Derivative assets and others (*1) |
|
|
1,667,312 |
|
|
|
3,449 |
|
|
|
1,663,863 |
|
|
|
11,565,607 |
|
|
|
16,246 |
|
|
|
559,109 |
|
| Receivable spot exchange (*2) |
|
|
10,477,099 |
|
|
|
— |
|
|
|
10,477,099 |
|
|
|
|
|
|
|
|
|
|
|
|
|
| Bonds purchased under resale agreements (*2) |
|
|
11,102,133 |
|
|
|
— |
|
|
|
11,102,133 |
|
|
|
11,102,133 |
|
|
|
— |
|
|
|
— |
|
| Domestic exchanges receivable (*2)(*5) |
|
|
26,873,204 |
|
|
|
26,584,300 |
|
|
|
288,904 |
|
|
|
— |
|
|
|
— |
|
|
|
288,904 |
|
|
|
|
|
|
|
|
|
|
|
|
|
|
|
|
|
|
|
|
|
|
|
|
|
|
| Total |
|
|
50,119,748 |
|
|
|
26,587,749 |
|
|
|
23,531,999 |
|
|
|
22,667,740 |
|
|
|
16,246 |
|
|
|
848,013 |
|
|
|
|
|
|
|
|
|
|
|
|
|
|
|
|
|
|
|
|
|
|
|
|
|
|
|
|
| |
|
June 30, 2017 |
|
| |
|
Gross
amounts of
recognized
financial
liabilities |
|
|
Gross
amounts of
recognized
financial
liabilities set off |
|
|
Net
amounts of
financial
liabilities
presented |
|
|
Related amounts not set
off in the statement of
financial position |
|
|
Net
amounts |
|
| |
|
|
|
|
Financial
instruments |
|
|
Cash
collateral
pledged |
|
|
| Financial liabilities: |
|
|
|
|
|
|
|
|
|
|
|
|
|
|
|
|
|
|
|
|
|
|
|
|
| Derivative liabilities and others (*1) |
|
|
2,117,422 |
|
|
|
3,449 |
|
|
|
2,113,973 |
|
|
|
11,855,701 |
|
|
|
88,224 |
|
|
|
647,789 |
|
| Payable spot exchange (*3) |
|
|
10,477,741 |
|
|
|
— |
|
|
|
10,477,741 |
|
|
|
|
|
|
|
|
|
|
|
|
|
| Bonds sold under repurchase agreements (*4) |
|
|
559,952 |
|
|
|
— |
|
|
|
559,952 |
|
|
|
559,952 |
|
|
|
— |
|
|
|
— |
|
| Domestic exchanges payable (*3)(*5) |
|
|
30,934,394 |
|
|
|
26,584,300 |
|
|
|
4,350,094 |
|
|
|
4,345,347 |
|
|
|
— |
|
|
|
4,747 |
|
|
|
|
|
|
|
|
|
|
|
|
|
|
|
|
|
|
|
|
|
|
|
|
|
|
| Total |
|
|
44,089,509 |
|
|
|
26,587,749 |
|
|
|
17,501,760 |
|
|
|
16,761,000 |
|
|
|
88,224 |
|
|
|
652,536 |
|
|
|
|
|
|
|
|
|
|
|
|
|
|
|
|
|
|
|
|
|
|
|
|
|
|
|
|
| |
|
December 31, 2016 |
|
| |
|
Gross
amounts of
recognized
financial
assets |
|
|
Gross amounts
of recognized
financial assets
set off |
|
|
Net
amounts of
financial
assets
presented |
|
|
Related amounts not set
off in the statement of
financial position |
|
|
Net
amounts |
|
| |
|
|
|
|
Financial
instruments |
|
|
Cash
collateral
received |
|
|
| Financial assets: |
|
|
|
|
|
|
|
|
|
|
|
|
|
|
|
|
|
|
|
|
|
|
|
|
| Derivative assets and others (*1) |
|
|
2,962,969 |
|
|
|
8,442 |
|
|
|
2,954,527 |
|
|
|
6,546,232 |
|
|
|
69,834 |
|
|
|
1,016,550 |
|
| Receivable spot exchange (*2) |
|
|
4,678,089 |
|
|
|
— |
|
|
|
4,678,089 |
|
|
|
|
|
|
|
|
|
|
|
|
|
| Bonds purchased under resale agreements (*2) |
|
|
8,854,753 |
|
|
|
— |
|
|
|
8,854,753 |
|
|
|
8,854,753 |
|
|
|
— |
|
|
|
— |
|
| Domestic exchanges receivable (*2)(*5) |
|
|
31,456,123 |
|
|
|
30,883,281 |
|
|
|
572,842 |
|
|
|
— |
|
|
|
— |
|
|
|
572,842 |
|
|
|
|
|
|
|
|
|
|
|
|
|
|
|
|
|
|
|
|
|
|
|
|
|
|
| Total |
|
|
47,951,934 |
|
|
|
30,891,723 |
|
|
|
17,060,211 |
|
|
|
15,400,985 |
|
|
|
69,834 |
|
|
|
1,589,392 |
|
|
|
|
|
|
|
|
|
|
|
|
|
|
|
|
|
|
|
|
|
|
|
|
|
|
|
|
| |
|
December 31, 2016 |
|
| |
|
Gross
amounts of
recognized
financial
liabilities |
|
|
Gross
amounts of
recognized
financial
liabilities set
off |
|
|
Net
amounts of
financial
liabilities
presented |
|
|
Related amounts not set off
in the statement of
financial position |
|
|
Net
amounts |
|
| |
|
|
|
|
Financial
instruments |
|
|
Cash
collateral
pledged |
|
|
| Financial liabilities: |
|
|
|
|
|
|
|
|
|
|
|
|
|
|
|
|
|
|
|
|
|
|
|
|
| Derivative liabilities and others (*1) |
|
|
3,467,374 |
|
|
|
8,442 |
|
|
|
3,458,932 |
|
|
|
6,695,062 |
|
|
|
105,270 |
|
|
|
1,341,375 |
|
| Payable spot exchange (*3) |
|
|
4,682,775 |
|
|
|
— |
|
|
|
4,682,775 |
|
|
|
|
|
|
|
|
|
|
|
|
|
| Bonds sold under repurchase agreements (*4) |
|
|
2,004,905 |
|
|
|
— |
|
|
|
2,004,905 |
|
|
|
2,004,905 |
|
|
|
— |
|
|
|
— |
|
| Domestic exchanges payable (*3)(*5) |
|
|
39,345,524 |
|
|
|
30,883,281 |
|
|
|
8,462,243 |
|
|
|
6,161,151 |
|
|
|
— |
|
|
|
2,301,092 |
|
|
|
|
|
|
|
|
|
|
|
|
|
|
|
|
|
|
|
|
|
|
|
|
|
|
| Total |
|
|
49,500,578 |
|
|
|
30,891,723 |
|
|
|
18,608,855 |
|
|
|
14,861,118 |
|
|
|
105,270 |
|
|
|
3,642,467 |
|
|
|
|
|
|
|
|
|
|
|
|
|
|
|
|
|
|
|
|
|
|
|
|
|
|
| (*1) |
The items include derivatives held for trading, derivatives for hedging and equity linked securities. |
| (*2) |
The items are included in loans and receivables. |
| (*3) |
The items are included in other financial liabilities. |
| (*4) |
The items are included in borrowings. |
| (*5) |
Certain financial assets and liabilities are presented at as net amounts. |
- 42 -
| 13. |
INVESTMENTS IN JOINT VENTURES AND ASSOCIATES |
| (1) |
Investments in joint ventures and associates accounted for using the equity method of accounting are as follows (Unit: Korean Won in millions): |
|
|
|
|
|
|
|
|
|
|
|
|
|
|
|
| |
|
|
|
Percentage of ownership (%) |
|
|
|
|
| Subsidiaries |
|
Main business |
|
June 30,
2017 |
|
|
December 31,
2016 |
|
|
Financial
statements as of |
|
| Woori Bank and Woori Private Equity Asset Management Co., Ltd.,: |
|
|
|
|
|
| Woori Blackstone Korea
Opportunity No.1 Private Equity Fund |
|
Finance |
|
|
26.4 |
|
|
|
26.4 |
|
|
|
June 30 |
|
| Woori Bank: |
|
|
|
|
|
|
|
|
|
|
|
|
|
|
| Kumho Tire Co., Inc. (*1)(*2) |
|
Manufacturing |
|
|
14.2 |
|
|
|
14.2 |
|
|
|
March 31 (*3) |
|
| Woori Service Networks Co., Ltd. (*4) |
|
Freight & staffing services |
|
|
4.9 |
|
|
|
4.9 |
|
|
|
May 31 (*3) |
|
| Korea Credit Bureau Co., Ltd. (*5) |
|
Credit information |
|
|
9.9 |
|
|
|
9.9 |
|
|
|
June 30 |
|
| Korea Finance Security Co., Ltd. (*4) |
|
Security service |
|
|
15.0 |
|
|
|
15.0 |
|
|
|
May 31 (*3) |
|
| Chin Hung International Inc. (*2)(*9) |
|
Construction |
|
|
25.3 |
|
|
|
28.4 |
|
|
|
May 31 (*3) |
|
| Poonglim Industrial Co., Ltd. (*6)(*12)(*14) |
|
Construction |
|
|
30.2 |
|
|
|
31.0 |
|
|
|
March 31 (*3) |
|
| STX Engine Co., Ltd. (*1)(*2) |
|
Manufacturing |
|
|
29.2 |
|
|
|
29.2 |
|
|
|
March 31 (*3) |
|
| Samho International Co., Ltd. (*1)(*2)(*16) |
|
Construction |
|
|
7.8 |
|
|
|
7.8 |
|
|
|
— |
|
| Force TEC Co., Ltd. (*6)(*15) |
|
Freight & staffing services |
|
|
— |
|
|
|
34.4 |
|
|
|
— |
|
| STX Corporation (*1)(*2)(*6)(*13) |
|
Wholesale of non-specialized goods |
|
|
19.7 |
|
|
|
9.5 |
|
|
|
March 31 (*3) |
|
| Saman Corporation (*5) |
|
General construction Technology service |
|
|
9.2 |
|
|
|
9.2 |
|
|
|
March 31 (*3) |
|
| Dongwoo C & C Co., Ltd. (*6) |
|
Construction |
|
|
23.2 |
|
|
|
23.2 |
|
|
|
— |
|
| SJCO Co., Ltd. (*6) |
|
Aggregate transportation and wholesale |
|
|
26.5 |
|
|
|
26.5 |
|
|
|
— |
|
| G2 Collection Co., Ltd. (*6) |
|
Wholesale and retail sales |
|
|
28.9 |
|
|
|
28.9 |
|
|
|
— |
|
| The Base Enterprise Co., Ltd. (*6) |
|
Manufacturing |
|
|
48.4 |
|
|
|
48.4 |
|
|
|
— |
|
| Heungjiwon Co., Ltd. (*6) |
|
Other printing |
|
|
27.8 |
|
|
|
27.8 |
|
|
|
— |
|
| Kyesan Engineering Co., Ltd. (*6) |
|
Construction |
|
|
23.2 |
|
|
|
23.2 |
|
|
|
— |
|
| Good Software Lap Co., Ltd. (*6) |
|
Service |
|
|
28.9 |
|
|
|
28.9 |
|
|
|
— |
|
| Wongwang Co., Ltd. (*6) |
|
Wholesale and real estate |
|
|
29.0 |
|
|
|
29.0 |
|
|
|
— |
|
| Sejin Construction Co., Ltd. (*6) |
|
Construction |
|
|
29.6 |
|
|
|
29.6 |
|
|
|
— |
|
| Deokwon Food Co., Ltd. (*6)(*17) |
|
Poultry processing and storage |
|
|
— |
|
|
|
27.3 |
|
|
|
— |
|
| QTS Shipping Co., Ltd. (*6) |
|
Complex transportation brokerage |
|
|
49.4 |
|
|
|
49.4 |
|
|
|
— |
|
| DAEA SNC Co. Ltd. (*6) |
|
Wholesale and retail sales |
|
|
24.0 |
|
|
|
24.0 |
|
|
|
— |
|
| ARES-TECH Co.,Ltd. (*6) |
|
Electronic component manufacturing |
|
|
23.4 |
|
|
|
23.4 |
|
|
|
— |
|
| Reading Doctors Co., Ltd. (*6)(*10) |
|
Other service business |
|
|
35.4 |
|
|
|
— |
|
|
|
— |
|
| PREXCO Co., Ltd. (*6)(*10) |
|
Manufacturing |
|
|
28.1 |
|
|
|
— |
|
|
|
— |
|
| Hyunwoo International Co., Ltd. (*6)(*10) |
|
Manufacturing |
|
|
25.9 |
|
|
|
— |
|
|
|
— |
|
| Woori Growth Partnerships New Technology Private Equity Fund |
|
Other financial business |
|
|
23.1 |
|
|
|
23.1 |
|
|
|
June 30 |
|
| 2016KIF-IMM Woori Bank Technology Venture Fund |
|
Other financial business |
|
|
20.0 |
|
|
|
20.0 |
|
|
|
June 30 |
|
| K BANK Co.,Ltd. (*5) |
|
Finance |
|
|
13.0 |
|
|
|
13.0 |
|
|
|
May 31 (*3) |
|
| Smart Private Equity Fund No.2 (*11) |
|
Other financial business |
|
|
20.0 |
|
|
|
— |
|
|
|
June 30 |
|
| Woori Bank-Company K Korea Movie Asset Fund (*11) |
|
Other financial business |
|
|
25.0 |
|
|
|
— |
|
|
|
June 30 |
|
| Woori Private Equity Fund: |
|
|
|
|
|
|
|
|
|
|
|
|
|
|
| Woori Renaissance Holdings (*7) |
|
Other financial business |
|
|
— |
|
|
|
51.6 |
|
|
|
— |
|
| Woori Private Equity Asset Management Co., Ltd.,: |
|
|
|
|
|
|
|
|
|
|
|
|
|
|
| Woori Columbus 1st Private Equity Fund (*8) |
|
Other financial business |
|
|
2.0 |
|
|
|
2.0 |
|
|
|
June 30 |
|
- 43 -
| (*1) |
The Group has significant influence on these entities through its position in the creditors’ council which is the decision making body regarding to financial and operational policies of associates.
|
| (*2) |
The investments in associates that have quoted market prices are Kumho Tire Co., Ltd. (current period: KRW 7,150, previous year: KRW 8,480), Chin Hung International Inc. (current period: KRW 2,250, previous year: KRW
2,090), STX Engine Co., Ltd. (current period: KRW 19,000, previous year: KRW 6,630), Samho International Co., Ltd. (current period: KRW 20,500, previous year: KRW 16,900), STX Corporation. (previous year: KRW 1,660). |
| (*3) |
The significant transactions and events between the end of reporting period of the associates and the Group have been properly incorporated. |
| (*4) |
Most of the significant business transactions of associates are with the Group. |
| (*5) |
The Group can participate in decision-making body and exercise significant influence over associates through business partnerships. |
| (*6) |
The carrying values of investments in Reading Doctors Co., Ltd, PREXCO Co., Ltd and Hyunwoo International Co., Ltd are nill as of June 30, 2017 and those of investments in Force TEC Co., Ltd, STX Corporation and
Deokwon Food Co., Ltd are nil as of December 31, 2016. Furthermore, those of investments in Poonglim Industrial Co., Ltd, Dongwoo C&C Co., Ltd, SJCO Co., Ltd, G2 collection Co., Ltd, The Base Enterprise Co., Ltd, Heungjiwon Co., Ltd, Kyesan
Engineering Co., Ltd, Good Software Lab Co., Ltd, Wongwang Co., Ltd, Sejin Construction Co., Ltd, QTS Shipping Co., Ltd, DAEA SNC Co., Ltd and ARES-TECH Co., Ltd are nill as of both December 31, 2016 and June 30, 2017. |
| (*7) |
The Group owns over 50% ownership. However, the investment in this entity was accounted for using equity method as the ownership and related contracts meet the definition of joint arrangement under K-IFRS 1111 Joint Arrangements. As of June 30, 2017 the entity has been excluded from the range of associates as liquidated. |
| (*8) |
As a general partner of Woori Columbus 1st Private Equity Fund, the Group has significant influence over the entity’s operational and financial policy making process, including participating in making decision of
dividend or other distribution. As such, the investment in this entity was accounted for using equity method as of June 30, 2017 and December 31, 2016. Meanwhile, as of June 30, 2017, the principal investments in the associates were
returned, and is to maintain a 2.0% stake until its liquidation based on the resolution of special meeting of investors. |
| (*9) |
Due to consolidation of stocks and debt-equity swap, the Group’s number of holding shares and ownership ratio have decreased. |
| (*10) |
Even though the Group’s ownership ratio of the entity was more than 20%, the Group did not have significant influence over the entity due to the fact that the entity was going through workout process under
receivership, and thus the entity was excluded from the investment in associates. However, as the workout process was completed during the six months ended June 30, 2017, it has been included in the investment in associates. |
| (*11) |
Due to capital contribution by the Group during the six months ended June 30, 2017, the entities were included in the investment in associates |
| (*12) |
The Group has sold a part of shares of the associates so the number of shares holding has decreased. |
| (*13) |
Due to debt-equity swap capital stock, the Group ownership ratio have increased. |
| (*14) |
As the carrying amounts of certain investments in associates had been reduced to zero, the Group discontinued the use of the equity method in accounting for those investments, and unrecognized losses due to the
restricted application of equity method amount to 15,779 million Won and 612 million Won as of June 30, 2017 and December 31, 2016, respectively. |
| (*15) |
Not in scope for the associates, because the Group does not have significant influence over the entity due to the fact that it is going through workout process under receivership as of June 30, 2017.
|
| (*16) |
Transfers to assets held for sale during the six months ended June 30, 2017. |
| (*17) |
As the Group sold its entire ownership interest of the entities, they were exclude from the investment in associates. |
- 44 -
| (2) |
Changes in the carrying value of investments in joint ventures and associates accounted for using the equity method of accounting are as follows (Unit: Korean Won in millions): |
|
|
|
|
|
|
|
|
|
|
|
|
|
|
|
|
|
|
|
|
|
|
|
|
|
|
|
|
|
|
|
|
|
|
|
|
|
| |
|
For the six months ended June 30, 2017 |
|
| |
|
Acquisition
cost |
|
|
January 1,
2017 |
|
|
Share of
profits
(losses) |
|
|
Acquisition (*1) |
|
|
Disposal
and
others (*2) |
|
|
Dividends |
|
|
Change in
Capital |
|
|
Others
(*1) |
|
|
June 30,
2017 |
|
| Woori Blackstone Korea
Opportunity No.1 Private Equity Fund |
|
|
6,881 |
|
|
|
15,289 |
|
|
|
(1,460 |
) |
|
|
— |
|
|
|
— |
|
|
|
— |
|
|
|
— |
|
|
|
— |
|
|
|
13,829 |
|
| Kumho Tire Co., Inc. |
|
|
175,652 |
|
|
|
200,332 |
|
|
|
2 |
|
|
|
— |
|
|
|
— |
|
|
|
— |
|
|
|
(1,623 |
) |
|
|
— |
|
|
|
198,711 |
|
| Woori Service Networks Co., Ltd. |
|
|
108 |
|
|
|
145 |
|
|
|
(10 |
) |
|
|
— |
|
|
|
— |
|
|
|
(8 |
) |
|
|
— |
|
|
|
— |
|
|
|
127 |
|
| Korea Credit Bureau Co., Ltd. |
|
|
3,313 |
|
|
|
5,592 |
|
|
|
508 |
|
|
|
— |
|
|
|
— |
|
|
|
(149 |
) |
|
|
— |
|
|
|
— |
|
|
|
5,951 |
|
| Korea Finance Security Co., Ltd. |
|
|
3,266 |
|
|
|
3,376 |
|
|
|
63 |
|
|
|
— |
|
|
|
— |
|
|
|
(54 |
) |
|
|
— |
|
|
|
— |
|
|
|
3,385 |
|
| Chin Hung International Inc. |
|
|
89,725 |
|
|
|
43,032 |
|
|
|
(20,050 |
) |
|
|
41,053 |
|
|
|
— |
|
|
|
— |
|
|
|
171 |
|
|
|
(25,966 |
) |
|
|
38,240 |
|
| Poonglim Industrial Co., Ltd. |
|
|
13,916 |
|
|
|
— |
|
|
|
— |
|
|
|
— |
|
|
|
— |
|
|
|
— |
|
|
|
— |
|
|
|
— |
|
|
|
— |
|
| STX Engine Co., Ltd. |
|
|
92,038 |
|
|
|
43,036 |
|
|
|
722 |
|
|
|
— |
|
|
|
— |
|
|
|
— |
|
|
|
4,047 |
|
|
|
— |
|
|
|
47,805 |
|
| SamHo Co., Ltd. |
|
|
7,492 |
|
|
|
19,729 |
|
|
|
2,021 |
|
|
|
— |
|
|
|
(16,354 |
) |
|
|
— |
|
|
|
(73 |
) |
|
|
(5,323 |
) |
|
|
— |
|
| STX Corporation |
|
|
42,215 |
|
|
|
— |
|
|
|
(33,739 |
) |
|
|
8,546 |
|
|
|
— |
|
|
|
— |
|
|
|
(215 |
) |
|
|
27,772 |
|
|
|
2,364 |
|
| Saman Corporation |
|
|
8,521 |
|
|
|
8,699 |
|
|
|
(96 |
) |
|
|
— |
|
|
|
— |
|
|
|
|
|
|
|
26 |
|
|
|
— |
|
|
|
8,629 |
|
| Woori Growth Partnerships New Technology Private Equity Fund |
|
|
13,602 |
|
|
|
13,118 |
|
|
|
(371 |
) |
|
|
5,745 |
|
|
|
(498 |
) |
|
|
— |
|
|
|
(156 |
) |
|
|
— |
|
|
|
17,838 |
|
| 2016KIF-IMM Woori Bank Technology Venture Fund |
|
|
1,800 |
|
|
|
1,800 |
|
|
|
— |
|
|
|
3,240 |
|
|
|
— |
|
|
|
— |
|
|
|
— |
|
|
|
— |
|
|
|
5,040 |
|
| K BANK Co., Ltd. |
|
|
32,500 |
|
|
|
30,442 |
|
|
|
(5,861 |
) |
|
|
— |
|
|
|
— |
|
|
|
— |
|
|
|
(139 |
) |
|
|
— |
|
|
|
24,442 |
|
| Smart Private Equity Fund No.2 |
|
|
3,000 |
|
|
|
— |
|
|
|
(47 |
) |
|
|
3,000 |
|
|
|
— |
|
|
|
— |
|
|
|
— |
|
|
|
— |
|
|
|
2,953 |
|
| Woori Bank-Company K Korea Movie Asset Fund |
|
|
1,500 |
|
|
|
— |
|
|
|
(15 |
) |
|
|
1,500 |
|
|
|
— |
|
|
|
— |
|
|
|
— |
|
|
|
— |
|
|
|
1,485 |
|
| Woori Renaissance Holdings |
|
|
63,000 |
|
|
|
54,422 |
|
|
|
(622 |
) |
|
|
— |
|
|
|
— |
|
|
|
(57,109 |
) |
|
|
— |
|
|
|
3,309 |
|
|
|
— |
|
|
|
|
|
|
|
|
|
|
|
|
|
|
|
|
|
|
|
|
|
|
|
|
|
|
|
|
|
|
|
|
|
|
|
|
|
|
|
|
|
558,529 |
|
|
|
439,012 |
|
|
|
(58,955 |
) |
|
|
63,084 |
|
|
|
(16,852 |
) |
|
|
(57,320 |
) |
|
|
2,038 |
|
|
|
(208 |
) |
|
|
370,799 |
|
|
|
|
|
|
|
|
|
|
|
|
|
|
|
|
|
|
|
|
|
|
|
|
|
|
|
|
|
|
|
|
|
|
|
|
|
|
| (*1) |
Changes in investments in joint ventures and associates due to debt-equity swap is 51,405 million Won. |
| (*2) |
Investments in joint ventures and associates decreased by 16,354 million Won through transfers to assets held for sale occurred during the six months ended June 30, 2017. |
|
|
|
|
|
|
|
|
|
|
|
|
|
|
|
|
|
|
|
|
|
|
|
|
|
|
|
|
|
|
|
|
|
|
|
|
|
| |
|
For the six months ended June 30, 2016 |
|
| |
|
Acquisition
cost |
|
|
January 1,
2016 |
|
|
Share of
profits
(losses) |
|
|
Acquisition (*1) |
|
|
Disposal
and
others (*2) |
|
|
Dividends |
|
|
Change in
Capital |
|
|
Impairment |
|
|
June 30,
2016 |
|
| Woori Blackstone Korea
Opportunity No.1 Private Equity Fund |
|
|
43,917 |
|
|
|
56,044 |
|
|
|
182 |
|
|
|
— |
|
|
|
(10,561 |
) |
|
|
(2,971 |
) |
|
|
— |
|
|
|
— |
|
|
|
42,694 |
|
| Kumho Tire Co., Inc. |
|
|
175,652 |
|
|
|
214,050 |
|
|
|
(6,222 |
) |
|
|
— |
|
|
|
— |
|
|
|
— |
|
|
|
4,095 |
|
|
|
— |
|
|
|
211,923 |
|
| Woori Service Networks Co., Ltd. |
|
|
108 |
|
|
|
139 |
|
|
|
(9 |
) |
|
|
— |
|
|
|
— |
|
|
|
(12 |
) |
|
|
— |
|
|
|
— |
|
|
|
118 |
|
| Korea Credit Bureau Co., Ltd. |
|
|
3,313 |
|
|
|
5,291 |
|
|
|
54 |
|
|
|
— |
|
|
|
— |
|
|
|
(135 |
) |
|
|
— |
|
|
|
— |
|
|
|
5,210 |
|
| Korea Finance Security Co., Ltd. |
|
|
3,266 |
|
|
|
3,711 |
|
|
|
(364 |
) |
|
|
— |
|
|
|
— |
|
|
|
(54 |
) |
|
|
— |
|
|
|
— |
|
|
|
3,293 |
|
| United PF 1st Corporate financial stability |
|
|
172,441 |
|
|
|
187,592 |
|
|
|
3,266 |
|
|
|
— |
|
|
|
(190,858 |
) |
|
|
— |
|
|
|
— |
|
|
|
— |
|
|
|
— |
|
| Chin Hung International Inc. |
|
|
89,725 |
|
|
|
43,936 |
|
|
|
156 |
|
|
|
— |
|
|
|
— |
|
|
|
— |
|
|
|
81 |
|
|
|
— |
|
|
|
44,173 |
|
| Poonglim Industrial Co., Ltd. |
|
|
13,916 |
|
|
|
5,313 |
|
|
|
863 |
|
|
|
— |
|
|
|
— |
|
|
|
— |
|
|
|
(2,928 |
) |
|
|
— |
|
|
|
3,248 |
|
| STX Engine Co., Ltd. |
|
|
92,038 |
|
|
|
51,276 |
|
|
|
(1,564 |
) |
|
|
— |
|
|
|
— |
|
|
|
— |
|
|
|
(451 |
) |
|
|
(4,645 |
) |
|
|
44,616 |
|
| SamHo Co., Ltd. |
|
|
7,492 |
|
|
|
14,325 |
|
|
|
1,744 |
|
|
|
— |
|
|
|
— |
|
|
|
— |
|
|
|
1 |
|
|
|
— |
|
|
|
16,070 |
|
| STX Corporation |
|
|
42,215 |
|
|
|
4,251 |
|
|
|
(3,824 |
) |
|
|
— |
|
|
|
— |
|
|
|
— |
|
|
|
4,029 |
|
|
|
— |
|
|
|
4,456 |
|
| Osung LST Co., Ltd. |
|
|
15,405 |
|
|
|
10,985 |
|
|
|
(2,903 |
) |
|
|
— |
|
|
|
— |
|
|
|
— |
|
|
|
19 |
|
|
|
— |
|
|
|
8,101 |
|
| Saman Corporation |
|
|
8,521 |
|
|
|
8,521 |
|
|
|
219 |
|
|
|
— |
|
|
|
— |
|
|
|
— |
|
|
|
— |
|
|
|
— |
|
|
|
8,740 |
|
| K-Growth crowd 2step Fund |
|
|
800 |
|
|
|
— |
|
|
|
(13 |
) |
|
|
800 |
|
|
|
— |
|
|
|
— |
|
|
|
— |
|
|
|
— |
|
|
|
787 |
|
| Woori Growth Partnerships New Technology Private Equity Fund |
|
|
5,421 |
|
|
|
— |
|
|
|
(373 |
) |
|
|
5,421 |
|
|
|
— |
|
|
|
— |
|
|
|
— |
|
|
|
— |
|
|
|
5,048 |
|
| Woori Renaissance Holdings |
|
|
63,000 |
|
|
|
37,121 |
|
|
|
1,723 |
|
|
|
— |
|
|
|
— |
|
|
|
— |
|
|
|
— |
|
|
|
— |
|
|
|
38,844 |
|
| Woori Columbus First PEF |
|
|
1,200 |
|
|
|
1,306 |
|
|
|
66 |
|
|
|
— |
|
|
|
— |
|
|
|
— |
|
|
|
— |
|
|
|
— |
|
|
|
1,372 |
|
|
|
|
|
|
|
|
|
|
|
|
|
|
|
|
|
|
|
|
|
|
|
|
|
|
|
|
|
|
|
|
|
|
|
|
|
|
|
|
|
738,430 |
|
|
|
643,861 |
|
|
|
(6,999 |
) |
|
|
6,221 |
|
|
|
(201,419 |
) |
|
|
(3,172 |
) |
|
|
4,846 |
|
|
|
(4,645 |
) |
|
|
438,693 |
|
|
|
|
|
|
|
|
|
|
|
|
|
|
|
|
|
|
|
|
|
|
|
|
|
|
|
|
|
|
|
|
|
|
|
|
|
|
| (*1) |
Changes in investments in joint ventures and associates due to debt-equity swap is 5,421 million Won. |
| (*2) |
Investments in joint ventures and associates decreased by 190,858 million Won through transfers to AFS financial assets occurred during the six months ended June 30, 2016. |
- 45 -
| (3) |
Summary financial information relating to investments in joint ventures and associates accounted for using the equity method of accounting is as follows (Unit: Korean Won in millions): |
|
|
|
|
|
|
|
|
|
|
|
|
|
|
|
|
|
| |
|
June 30, 2017 |
|
| |
|
Assets |
|
|
Liabilities |
|
|
Operating
revenue |
|
|
Net income
(loss) |
|
| Woori Blackstone Korea
Opportunity No.1 Private Equity Fund |
|
|
51,420 |
|
|
|
56 |
|
|
|
1,442 |
|
|
|
(2,716 |
) |
| Kumho Tire Co., Inc. |
|
|
4,978,733 |
|
|
|
3,827,086 |
|
|
|
669,303 |
|
|
|
(61,018 |
) |
| Woori Service Networks Co., Ltd. |
|
|
4,324 |
|
|
|
1,751 |
|
|
|
6,866 |
|
|
|
374 |
|
| Korea Credit Bureau Co., Ltd. |
|
|
71,842 |
|
|
|
14,297 |
|
|
|
31,726 |
|
|
|
4,944 |
|
| Korea Finance Security Co., Ltd. |
|
|
31,229 |
|
|
|
8,671 |
|
|
|
25,206 |
|
|
|
176 |
|
| Chin Hung International Inc. |
|
|
319,651 |
|
|
|
273,600 |
|
|
|
207,440 |
|
|
|
6,248 |
|
| Poonglim Industrial Co., Ltd. |
|
|
238,034 |
|
|
|
302,458 |
|
|
|
30,868 |
|
|
|
(4,889 |
) |
| STX Engine Co., Ltd. |
|
|
795,581 |
|
|
|
683,485 |
|
|
|
90,787 |
|
|
|
6,345 |
|
| STX Corporation |
|
|
581,304 |
|
|
|
552,655 |
|
|
|
446,050 |
|
|
|
322,863 |
|
| Saman Corporation |
|
|
94,619 |
|
|
|
59,182 |
|
|
|
27,112 |
|
|
|
835 |
|
| Woori Growth Partnerships New Technology Private Equity Fund |
|
|
77,793 |
|
|
|
493 |
|
|
|
274 |
|
|
|
(2,283 |
) |
| 2016KIF-IMM Woori Bank Technology Venture Fund |
|
|
24,751 |
|
|
|
— |
|
|
|
4 |
|
|
|
(759 |
) |
| K BANK Co., Ltd. |
|
|
650,031 |
|
|
|
462,009 |
|
|
|
2,655 |
|
|
|
(31,852 |
) |
| Smart Private Equity Fund No.2 |
|
|
14,814 |
|
|
|
51 |
|
|
|
1 |
|
|
|
(237 |
) |
| Woori Bank-Company K Korea Movie Asset Fund |
|
|
5,940 |
|
|
|
— |
|
|
|
6 |
|
|
|
(60 |
) |
| Woori Columbus 1st Private Equity Fund |
|
|
293 |
|
|
|
4 |
|
|
|
— |
|
|
|
(16 |
) |
|
|
| |
|
December 31, 2016 |
|
| |
|
Assets |
|
|
Liabilities |
|
|
Operating
revenue |
|
|
Net income
(loss) |
|
| Woori Blackstone Korea
Opportunity Private Equity Fund No.1 |
|
|
57,971 |
|
|
|
427 |
|
|
|
75,084 |
|
|
|
38,226 |
|
| Kumho Tire Co., Inc. |
|
|
5,079,740 |
|
|
|
3,914,306 |
|
|
|
2,156,667 |
|
|
|
(53,328 |
) |
| Woori Service Networks Co., Ltd. |
|
|
4,722 |
|
|
|
1,782 |
|
|
|
14,875 |
|
|
|
801 |
|
| Korea Credit Bureau Co., Ltd. |
|
|
71,245 |
|
|
|
17,322 |
|
|
|
59,868 |
|
|
|
3,517 |
|
| Korea Finance Security Co., Ltd. |
|
|
32,262 |
|
|
|
9,759 |
|
|
|
52,657 |
|
|
|
700 |
|
| Chin Hung International Inc. |
|
|
421,710 |
|
|
|
354,995 |
|
|
|
578,640 |
|
|
|
794 |
|
| Poonglim Industrial Co., Ltd. |
|
|
304,718 |
|
|
|
323,765 |
|
|
|
156,770 |
|
|
|
(15,135 |
) |
| STX Engine Co., Ltd. |
|
|
865,265 |
|
|
|
769,481 |
|
|
|
372,295 |
|
|
|
(22,978 |
) |
| Samho Co., Ltd. |
|
|
740,786 |
|
|
|
489,130 |
|
|
|
909,927 |
|
|
|
68,077 |
|
| STX Corporation |
|
|
781,622 |
|
|
|
1,087,469 |
|
|
|
1,252,968 |
|
|
|
(378,782 |
) |
| Saman Corporation |
|
|
83,380 |
|
|
|
47,175 |
|
|
|
72,850 |
|
|
|
2,746 |
|
| Woori Growth Partnerships New Technology Private Equity Fund |
|
|
57,339 |
|
|
|
493 |
|
|
|
37 |
|
|
|
(2,177 |
) |
| 2016KIF-IMM Woori Bank Technology Venture Fund |
|
|
9,005 |
|
|
|
254 |
|
|
|
5 |
|
|
|
(250 |
) |
| K BANK Co., Ltd. |
|
|
239,806 |
|
|
|
5,633 |
|
|
|
2,927 |
|
|
|
(12,222 |
) |
| Woori Renaissance Holdings Inc. |
|
|
127,411 |
|
|
|
26,703 |
|
|
|
37,206 |
|
|
|
33,508 |
|
| Woori Columbus 1st Private Equity Fund |
|
|
811 |
|
|
|
506 |
|
|
|
3,764 |
|
|
|
(450 |
) |
- 46 -
| (4) |
The entities that the Group has not applied equity method of accounting although the Group’s ownership interest is more than 20% as of June 30, 2017 and December 31, 2016, are as follows:
|
|
|
|
|
|
|
|
|
|
| |
|
As of June 30, 2017 |
|
| |
|
Number of shares owned |
|
|
Ownership (%) |
|
| Orient Shipyard Co., Ltd. (*) |
|
|
465,050 shares |
|
|
|
23.0 |
|
| Saenuel Co., Ltd. (*) |
|
|
3,531 shares |
|
|
|
37.4 |
|
| E Mirae Tech Co., Ltd. (*) |
|
|
7,696 shares |
|
|
|
41.0 |
|
| Jehin Trading Co., Ltd. (*) |
|
|
81,610 shares |
|
|
|
27.3 |
|
| NK Eng Co., Ltd. (*) |
|
|
697,033 shares |
|
|
|
23.1 |
|
| The season Co., Ltd. (*) |
|
|
18,187 shares |
|
|
|
30.1 |
|
| Yuil PESC Co., Ltd. (*) |
|
|
8,642 shares |
|
|
|
24.0 |
|
| Youngdong Sea Food Co., Ltd. (*) |
|
|
12,106 shares |
|
|
|
24.0 |
|
| Sinseong Trading Co., Ltd. (*) |
|
|
2,584 shares |
|
|
|
27.2 |
|
| CL Tech Co., Ltd. (*) |
|
|
13,759 shares |
|
|
|
38.6 |
|
| Force TEC Co., Ltd. (*) |
|
|
4,780,907 shares |
|
|
|
25.8 |
|
| Cultizm Korea LTD Co., Ltd. (*) |
|
|
858 shares |
|
|
|
31.3 |
|
| Protronics Co., Ltd. (*) |
|
|
95,921 shares |
|
|
|
48.1 |
|
| (*) |
Even though the Group’s ownership interest of the entity is more than 20%, the Group does not have significant influence over the entity since it is going through work-out
process under receivership, thus it is excluded from the investment in associates. |
|
|
|
|
|
|
|
|
|
| |
|
As of December 31, 2016 |
|
| |
|
Number of shares owned |
|
|
Ownership (%) |
|
| Orient Shipyard Co., Ltd. (*) |
|
|
465,050 shares |
|
|
|
23.0 |
|
| Saenuel Co., Ltd. (*) |
|
|
3,531 shares |
|
|
|
37.4 |
|
| E Mirae Tech Co., Ltd. (*) |
|
|
7,696 shares |
|
|
|
41.0 |
|
| Jehin Trading Co., Ltd. (*) |
|
|
81,610 shares |
|
|
|
27.3 |
|
| NK Eng Co., Ltd. (*) |
|
|
697,033 shares |
|
|
|
23.1 |
|
| The season Co., Ltd. (*) |
|
|
18,187 shares |
|
|
|
30.1 |
|
| Yuil PESC Co., Ltd. (*) |
|
|
8,642 shares |
|
|
|
24.0 |
|
| Reading Doctors Co., Ltd. (*) |
|
|
7,398 shares |
|
|
|
35.4 |
|
| Youngdong Sea Food Co., Ltd. (*) |
|
|
12,106 shares |
|
|
|
24.0 |
|
| Sinseong Trading Co., Ltd. (*) |
|
|
2,584 shares |
|
|
|
27.2 |
|
| PREXCO Co., Ltd. (*) |
|
|
919,972 shares |
|
|
|
28.1 |
|
| Hyunwoo International Co., Ltd. (*) |
|
|
59,873 shares |
|
|
|
25.9 |
|
| (*) |
Even though the Group’s ownership interest of the entity is more than 20%, the Group does not have significant influence over the entity since it is going through work-out
process under receivership, thus it is excluded from the investment in associates. |
- 47 -
| (5) |
As of June 30, 2017 and December 31, 2016, the reconciliations from the net assets of associates based on the ownership ratio of the Group to its corresponding book value of investment in joint ventures and
associates are as follows (Unit: Korean Won in millions except for ownership): |
|
|
|
|
|
|
|
|
|
|
|
|
|
|
|
|
|
|
|
|
|
|
|
|
|
|
|
|
|
| |
|
As of June 30, 2017 |
|
| |
|
Total net
asset |
|
|
Ownership
(%) |
|
|
Net assets of
associates
(or joint
ventures) |
|
|
cost-book
value
differential
and others |
|
|
Impairment |
|
|
Intercompany
transaction
and others |
|
|
Book
value |
|
| Woori Blackstone Korea
Opportunity Private Equity Fund No.1 |
|
|
51,364 |
|
|
|
26.4 |
|
|
|
13,559 |
|
|
|
— |
|
|
|
— |
|
|
|
270 |
|
|
|
13,829 |
|
| Kumho Tire Co., Inc. (*) |
|
|
1,043,772 |
|
|
|
14.2 |
|
|
|
147,704 |
|
|
|
48,459 |
|
|
|
— |
|
|
|
2,548 |
|
|
|
198,711 |
|
| Woori Service Networks Co., Ltd. |
|
|
2,573 |
|
|
|
4.9 |
|
|
|
127 |
|
|
|
— |
|
|
|
— |
|
|
|
— |
|
|
|
127 |
|
| Korea Credit Bureau |
|
|
57,545 |
|
|
|
9.9 |
|
|
|
5,703 |
|
|
|
248 |
|
|
|
— |
|
|
|
— |
|
|
|
5,951 |
|
| Korea Finance Security Co., Ltd. |
|
|
22,558 |
|
|
|
15.0 |
|
|
|
3,385 |
|
|
|
— |
|
|
|
— |
|
|
|
— |
|
|
|
3,385 |
|
| Chin Hung International Inc. (*) |
|
|
54,579 |
|
|
|
25.3 |
|
|
|
13,812 |
|
|
|
24,566 |
|
|
|
— |
|
|
|
(138 |
) |
|
|
38,240 |
|
| Poonglim Industrial Co., Ltd. (*) |
|
|
(161,836 |
) |
|
|
30.2 |
|
|
|
(48,879 |
) |
|
|
54,542 |
|
|
|
(20,504 |
) |
|
|
14,841 |
|
|
|
— |
|
| STX Engine Co., Ltd. |
|
|
112,096 |
|
|
|
29.2 |
|
|
|
32,770 |
|
|
|
14,954 |
|
|
|
— |
|
|
|
81 |
|
|
|
47,805 |
|
| STX Corporation |
|
|
28,649 |
|
|
|
19.7 |
|
|
|
5,649 |
|
|
|
24,614 |
|
|
|
(27,904 |
) |
|
|
5 |
|
|
|
2,364 |
|
| Saman Corporation |
|
|
35,437 |
|
|
|
9.2 |
|
|
|
3,255 |
|
|
|
5,374 |
|
|
|
— |
|
|
|
— |
|
|
|
8,629 |
|
| Woori Growth Partnerships New Technology Private Equity Fund |
|
|
77,300 |
|
|
|
23.1 |
|
|
|
17,838 |
|
|
|
— |
|
|
|
— |
|
|
|
— |
|
|
|
17,838 |
|
| 2016KIF-IMM Woori Bank Technology Venture Fund |
|
|
24,751 |
|
|
|
20.0 |
|
|
|
4,950 |
|
|
|
— |
|
|
|
— |
|
|
|
90 |
|
|
|
5,040 |
|
| K BANK Co.,Ltd. |
|
|
188,022 |
|
|
|
13.0 |
|
|
|
24,442 |
|
|
|
— |
|
|
|
— |
|
|
|
— |
|
|
|
24,442 |
|
| Smart Private Equity Fund No.2 |
|
|
14,763 |
|
|
|
20.0 |
|
|
|
2,953 |
|
|
|
— |
|
|
|
— |
|
|
|
— |
|
|
|
2,953 |
|
| Woori Bank-Company K Korea Movie Asset Fund |
|
|
5,940 |
|
|
|
25.0 |
|
|
|
1,485 |
|
|
|
— |
|
|
|
— |
|
|
|
— |
|
|
|
1,485 |
|
| Woori Columbus First PEF |
|
|
289 |
|
|
|
2.0 |
|
|
|
6 |
|
|
|
— |
|
|
|
— |
|
|
|
(6 |
) |
|
|
— |
|
| (*) |
The net asset amount is after reflecting debt-equity swap and others. |
|
|
|
|
|
|
|
|
|
|
|
|
|
|
|
|
|
|
|
|
|
|
|
|
|
|
|
|
|
| |
|
As of December 31, 2016 |
|
| |
|
Total net
asset |
|
|
Ownership
(%) |
|
|
Net assets of
associates
(or joint
ventures) |
|
|
cost-book
value
differential |
|
|
Impairment |
|
|
Intercompany
transaction
and others |
|
|
Book
value |
|
| Woori Blackstone Korea
Opportunity Private Equity Fund No.1 |
|
|
57,544 |
|
|
|
26.4 |
|
|
|
15,191 |
|
|
|
— |
|
|
|
— |
|
|
|
98 |
|
|
|
15,289 |
|
| Kumho Tire Co., Inc. (*) |
|
|
1,055,219 |
|
|
|
14.2 |
|
|
|
149,324 |
|
|
|
48,459 |
|
|
|
— |
|
|
|
2,549 |
|
|
|
200,332 |
|
| Woori Service Networks Co., Ltd. |
|
|
2,940 |
|
|
|
4.9 |
|
|
|
145 |
|
|
|
— |
|
|
|
— |
|
|
|
— |
|
|
|
145 |
|
| Korea Credit Bureau |
|
|
53,923 |
|
|
|
9.9 |
|
|
|
5,344 |
|
|
|
248 |
|
|
|
— |
|
|
|
— |
|
|
|
5,592 |
|
| Korea Finance Security Co., Ltd. |
|
|
22,503 |
|
|
|
15.0 |
|
|
|
3,376 |
|
|
|
— |
|
|
|
— |
|
|
|
— |
|
|
|
3,376 |
|
| Chin Hung International Inc. (*) |
|
|
65,387 |
|
|
|
28.4 |
|
|
|
18,593 |
|
|
|
24,565 |
|
|
|
— |
|
|
|
(126 |
) |
|
|
43,032 |
|
| Poonglim Industrial Co., Ltd. (*) |
|
|
(111,156 |
) |
|
|
31.0 |
|
|
|
(34,463 |
) |
|
|
54,149 |
|
|
|
(21,062 |
) |
|
|
1,376 |
|
|
|
— |
|
| STX Engine Co., Ltd. |
|
|
95,784 |
|
|
|
29.2 |
|
|
|
28,002 |
|
|
|
14,954 |
|
|
|
— |
|
|
|
80 |
|
|
|
43,036 |
|
| SamHo Co., Ltd. |
|
|
251,656 |
|
|
|
7.8 |
|
|
|
19,729 |
|
|
|
— |
|
|
|
— |
|
|
|
— |
|
|
|
19,729 |
|
| STX Corporation (*) |
|
|
(250,018 |
) |
|
|
9.5 |
|
|
|
(23,633 |
) |
|
|
24,614 |
|
|
|
(27,904 |
) |
|
|
26,923 |
|
|
|
— |
|
| Saman Corporation |
|
|
36,205 |
|
|
|
9.2 |
|
|
|
3,326 |
|
|
|
5,373 |
|
|
|
— |
|
|
|
— |
|
|
|
8,699 |
|
| Woori Growth Partnerships New Technology Private Equity Fund |
|
|
56,846 |
|
|
|
23.1 |
|
|
|
13,118 |
|
|
|
— |
|
|
|
— |
|
|
|
— |
|
|
|
13,118 |
|
| 2016KIF-IMM Woori Bank Technology Venture Fund |
|
|
8,751 |
|
|
|
20.0 |
|
|
|
1,750 |
|
|
|
— |
|
|
|
— |
|
|
|
50 |
|
|
|
1,800 |
|
| K BANK Co.,Ltd. |
|
|
234,173 |
|
|
|
13.0 |
|
|
|
30,442 |
|
|
|
— |
|
|
|
— |
|
|
|
— |
|
|
|
30,442 |
|
| Woori Renaissance Holdings |
|
|
100,708 |
|
|
|
51.6 |
|
|
|
51,965 |
|
|
|
— |
|
|
|
(6,441 |
) |
|
|
8,898 |
|
|
|
54,422 |
|
| Woori Columbus First PEF |
|
|
305 |
|
|
|
2.0 |
|
|
|
6 |
|
|
|
— |
|
|
|
— |
|
|
|
(6 |
) |
|
|
— |
|
| (*) |
The net asset amount is after reflecting preferred stocks. |
- 48 -
| 14. |
INVESTMENT PROPERTIES |
| (1) |
Investment properties are as follows (Unit: Korean Won in millions): |
|
|
|
|
|
|
|
|
|
| |
|
June 30, 2017 |
|
|
December 31, 2016 |
|
| Acquisition cost |
|
|
391,243 |
|
|
|
387,675 |
|
| Accumulated depreciation |
|
|
(31,306 |
) |
|
|
(29,178 |
) |
|
|
|
|
|
|
|
|
|
| Net carrying value |
|
|
359,937 |
|
|
|
358,497 |
|
|
|
|
|
|
|
|
|
|
| (2) |
Changes in investment properties are as follows (Unit: Korean Won in millions): |
|
|
|
|
|
|
|
|
|
| |
|
For the six months
ended June 30, 2017 |
|
|
For the six months
ended June 30, 2016 |
|
| Beginning balance |
|
|
358,497 |
|
|
|
351,496 |
|
| Acquisition |
|
|
1,221 |
|
|
|
3,133 |
|
| Disposal |
|
|
(225 |
) |
|
|
— |
|
| Depreciation |
|
|
(1,991 |
) |
|
|
(1,860 |
) |
| Transfer |
|
|
(2,708 |
) |
|
|
15,627 |
|
| Classified to held for sale |
|
|
(534 |
) |
|
|
— |
|
| Foreign currencies translation adjustments |
|
|
(120 |
) |
|
|
(4 |
) |
| Others |
|
|
5,797 |
|
|
|
— |
|
|
|
|
|
|
|
|
|
|
| Ending balance |
|
|
359,937 |
|
|
|
368,392 |
|
|
|
|
|
|
|
|
|
|
| (3) |
Fair value of investment properties is amounting to 379,685 million Won and 382,370 million Won as of June 30, 2017 and December 31, 2016, respectively. The fair value of investment property, based on the
assessment that was independently performed by external appraisal agencies, is classified as level 3 on the fair value hierarchy as of June 30, 2017 and December 31, 2016. |
| (4) |
Rental fee earned from investment properties is amounting to 2,411 million Won and 2,667 million Won for the six months ended June 30, 2017 and 2016, respectively. |
- 49 -
| 15. |
PREMISES AND EQUIPMENT |
| (1) |
Details of premises and equipment are as follows (Unit: Korean Won in millions): |
|
|
|
|
|
|
|
|
|
|
|
|
|
|
|
|
|
|
|
|
|
|
|
|
|
|
|
|
|
| |
|
June 30, 2017 |
|
| |
|
Land |
|
|
Building |
|
|
Properties for
business use |
|
|
Structures in
leased office |
|
|
Construction
in progress |
|
|
Structures |
|
|
Total |
|
| Acquisition cost |
|
|
1,488,266 |
|
|
|
857,511 |
|
|
|
1,013,539 |
|
|
|
427,743 |
|
|
|
37,877 |
|
|
|
20 |
|
|
|
3,824,956 |
|
| Accumulated depreciation |
|
|
— |
|
|
|
(175,819 |
) |
|
|
(825,314 |
) |
|
|
(364,630 |
) |
|
|
— |
|
|
|
(17 |
) |
|
|
(1,365,780 |
) |
|
|
|
|
|
|
|
|
|
|
|
|
|
|
|
|
|
|
|
|
|
|
|
|
|
|
|
|
|
| Net carrying value |
|
|
1,488,266 |
|
|
|
681,692 |
|
|
|
188,225 |
|
|
|
63,113 |
|
|
|
37,877 |
|
|
|
3 |
|
|
|
2,459,176 |
|
|
|
|
|
|
|
|
|
|
|
|
|
|
|
|
|
|
|
|
|
|
|
|
|
|
|
|
|
|
|
|
|
|
|
|
|
|
|
|
|
|
|
|
|
|
|
|
|
|
|
|
|
|
|
|
|
|
|
| |
|
December 31, 2016 |
|
| |
|
Land |
|
|
Building |
|
|
Properties for
business use |
|
|
Structures in
leased office |
|
|
Construction
in progress |
|
|
Structures |
|
|
Total |
|
| Acquisition cost |
|
|
1,488,745 |
|
|
|
855,332 |
|
|
|
1,010,141 |
|
|
|
424,562 |
|
|
|
18,717 |
|
|
|
20 |
|
|
|
3,797,517 |
|
| Accumulated depreciation |
|
|
— |
|
|
|
(163,633 |
) |
|
|
(820,239 |
) |
|
|
(355,604 |
) |
|
|
— |
|
|
|
(16 |
) |
|
|
(1,339,492 |
) |
|
|
|
|
|
|
|
|
|
|
|
|
|
|
|
|
|
|
|
|
|
|
|
|
|
|
|
|
|
| Net carrying value |
|
|
1,488,745 |
|
|
|
691,699 |
|
|
|
189,902 |
|
|
|
68,958 |
|
|
|
18,717 |
|
|
|
4 |
|
|
|
2,458,025 |
|
|
|
|
|
|
|
|
|
|
|
|
|
|
|
|
|
|
|
|
|
|
|
|
|
|
|
|
|
|
| (2) |
Details of changes in premises and equipment are as follows (Unit: Korean Won in millions): |
|
|
|
|
|
|
|
|
|
|
|
|
|
|
|
|
|
|
|
|
|
|
|
|
|
|
|
|
|
| |
|
For the six months ended June 30, 2017 |
|
| |
|
Land |
|
|
Building |
|
|
Properties for
business use |
|
|
Structures in
leased office |
|
|
Construction
in progress |
|
|
Structures |
|
|
Total |
|
| Beginning balance |
|
|
1,488,745 |
|
|
|
691,699 |
|
|
|
189,902 |
|
|
|
68,958 |
|
|
|
18,717 |
|
|
|
4 |
|
|
|
2,458,025 |
|
| Acquisition |
|
|
— |
|
|
|
3,831 |
|
|
|
31,624 |
|
|
|
8,120 |
|
|
|
25,053 |
|
|
|
— |
|
|
|
68,628 |
|
| Disposal |
|
|
(606 |
) |
|
|
(205 |
) |
|
|
(235 |
) |
|
|
(423 |
) |
|
|
— |
|
|
|
— |
|
|
|
(1,469 |
) |
| Depreciation |
|
|
— |
|
|
|
(13,029 |
) |
|
|
(38,063 |
) |
|
|
(18,253 |
) |
|
|
— |
|
|
|
(1 |
) |
|
|
(69,346 |
) |
| Classified to assets held for sale |
|
|
(1,743 |
) |
|
|
(441 |
) |
|
|
— |
|
|
|
— |
|
|
|
— |
|
|
|
— |
|
|
|
(2,184 |
) |
| Transfer |
|
|
2,466 |
|
|
|
403 |
|
|
|
5,485 |
|
|
|
— |
|
|
|
(5,646 |
) |
|
|
— |
|
|
|
2,708 |
|
| Foreign currencies translation adjustment |
|
|
(596 |
) |
|
|
(560 |
) |
|
|
(676 |
) |
|
|
(675 |
) |
|
|
(247 |
) |
|
|
— |
|
|
|
(2,754 |
) |
| Others |
|
|
— |
|
|
|
(6 |
) |
|
|
188 |
|
|
|
5,386 |
|
|
|
— |
|
|
|
— |
|
|
|
5,568 |
|
|
|
|
|
|
|
|
|
|
|
|
|
|
|
|
|
|
|
|
|
|
|
|
|
|
|
|
|
|
| Ending balance |
|
|
1,488,266 |
|
|
|
681,692 |
|
|
|
188,225 |
|
|
|
63,113 |
|
|
|
37,877 |
|
|
|
3 |
|
|
|
2,459,176 |
|
|
|
|
|
|
|
|
|
|
|
|
|
|
|
|
|
|
|
|
|
|
|
|
|
|
|
|
|
|
|
|
|
|
|
|
|
|
|
|
|
|
|
|
|
|
|
|
|
|
|
|
|
|
|
|
|
|
|
| |
|
For the six months ended June 30, 2016 |
|
| |
|
Land |
|
|
Building |
|
|
Properties for
business use |
|
|
Structures in
leased office |
|
|
Construction
in progress |
|
|
Structures |
|
|
Total |
|
| Beginning balance |
|
|
1,493,628 |
|
|
|
704,017 |
|
|
|
193,291 |
|
|
|
79,744 |
|
|
|
522 |
|
|
|
4 |
|
|
|
2,471,206 |
|
| Acquisition |
|
|
— |
|
|
|
5,522 |
|
|
|
32,580 |
|
|
|
8,104 |
|
|
|
1,222 |
|
|
|
— |
|
|
|
47,428 |
|
| Disposal |
|
|
— |
|
|
|
— |
|
|
|
(166 |
) |
|
|
(1,324 |
) |
|
|
(67 |
) |
|
|
— |
|
|
|
(1,557 |
) |
| Depreciation |
|
|
— |
|
|
|
(12,637 |
) |
|
|
(40,943 |
) |
|
|
(31,175 |
) |
|
|
— |
|
|
|
— |
|
|
|
(84,755 |
) |
| Classified to assets held for sale |
|
|
(3,418 |
) |
|
|
(2,317 |
) |
|
|
— |
|
|
|
— |
|
|
|
— |
|
|
|
— |
|
|
|
(5,735 |
) |
| Foreign currencies translation adjustments |
|
|
420 |
|
|
|
446 |
|
|
|
(3 |
) |
|
|
91 |
|
|
|
(5 |
) |
|
|
— |
|
|
|
949 |
|
| Transfer |
|
|
(10,364 |
) |
|
|
(5,263 |
) |
|
|
— |
|
|
|
— |
|
|
|
— |
|
|
|
— |
|
|
|
(15,627 |
) |
| Others |
|
|
145 |
|
|
|
80 |
|
|
|
865 |
|
|
|
28,146 |
|
|
|
— |
|
|
|
— |
|
|
|
29,236 |
|
|
|
|
|
|
|
|
|
|
|
|
|
|
|
|
|
|
|
|
|
|
|
|
|
|
|
|
|
|
| Ending balance |
|
|
1,480,411 |
|
|
|
689,848 |
|
|
|
185,624 |
|
|
|
83,586 |
|
|
|
1,672 |
|
|
|
4 |
|
|
|
2,441,145 |
|
|
|
|
|
|
|
|
|
|
|
|
|
|
|
|
|
|
|
|
|
|
|
|
|
|
|
|
|
|
- 50 -
| 16. |
INTANGIBLE ASSETS AND GOODWILL |
| (1) |
Details of intangible assets are as follows (Unit: Korean Won in millions): |
|
|
|
|
|
|
|
|
|
|
|
|
|
|
|
|
|
|
|
|
|
|
|
|
|
|
|
|
|
| |
|
June 30, 2017 |
|
| |
|
Goodwill |
|
|
Software |
|
|
Industrial
property
rights |
|
|
Development
cost |
|
|
Others |
|
|
Membership
deposit |
|
|
Total |
|
| Acquisition cost |
|
|
117,429 |
|
|
|
200,338 |
|
|
|
768 |
|
|
|
359,071 |
|
|
|
630,871 |
|
|
|
26,412 |
|
|
|
1,334,889 |
|
| Accumulated amortization |
|
|
— |
|
|
|
(154,772 |
) |
|
|
(457 |
) |
|
|
(171,843 |
) |
|
|
(493,920 |
) |
|
|
— |
|
|
|
(820,992 |
) |
| Accumulated impairment losses |
|
|
— |
|
|
|
— |
|
|
|
— |
|
|
|
— |
|
|
|
(88 |
) |
|
|
(6,927 |
) |
|
|
(7,015 |
) |
|
|
|
|
|
|
|
|
|
|
|
|
|
|
|
|
|
|
|
|
|
|
|
|
|
|
|
|
|
| Net carrying value |
|
|
117,429 |
|
|
|
45,566 |
|
|
|
311 |
|
|
|
187,228 |
|
|
|
136,863 |
|
|
|
19,485 |
|
|
|
506,882 |
|
|
|
|
|
|
|
|
|
|
|
|
|
|
|
|
|
|
|
|
|
|
|
|
|
|
|
|
|
|
|
|
|
|
|
|
|
|
|
|
|
|
|
|
|
|
|
|
|
|
|
|
|
|
|
|
|
|
|
| |
|
December 31, 2016 |
|
| |
|
Goodwill |
|
|
Software |
|
|
Industrial
property
rights |
|
|
Development
cost |
|
|
Others |
|
|
Membership
deposit |
|
|
Total |
|
| Acquisition cost |
|
|
124,803 |
|
|
|
185,202 |
|
|
|
714 |
|
|
|
299,031 |
|
|
|
622,540 |
|
|
|
26,884 |
|
|
|
1,259,174 |
|
| Accumulated amortization |
|
|
— |
|
|
|
(149,725 |
) |
|
|
(401 |
) |
|
|
(160,335 |
) |
|
|
(458,088 |
) |
|
|
— |
|
|
|
(768,549 |
) |
| Accumulated impairment losses |
|
|
— |
|
|
|
— |
|
|
|
— |
|
|
|
— |
|
|
|
(88 |
) |
|
|
(6,798 |
) |
|
|
(6,886 |
) |
|
|
|
|
|
|
|
|
|
|
|
|
|
|
|
|
|
|
|
|
|
|
|
|
|
|
|
|
|
| Net carrying value |
|
|
124,803 |
|
|
|
35,477 |
|
|
|
313 |
|
|
|
138,696 |
|
|
|
164,364 |
|
|
|
20,086 |
|
|
|
483,739 |
|
|
|
|
|
|
|
|
|
|
|
|
|
|
|
|
|
|
|
|
|
|
|
|
|
|
|
|
|
|
| (2) |
Details of changes in intangible assets are as follows (Unit: Korean Won in millions): |
|
|
|
|
|
|
|
|
|
|
|
|
|
|
|
|
|
|
|
|
|
|
|
|
|
|
|
|
|
| |
|
For the six months ended June 30, 2017 |
|
| |
|
Goodwill |
|
|
Software |
|
|
Industrial
property
rights |
|
|
Development
cost |
|
|
Others |
|
|
Membership
deposit |
|
|
Total |
|
| Beginning balance |
|
|
124,803 |
|
|
|
35,477 |
|
|
|
313 |
|
|
|
138,696 |
|
|
|
164,364 |
|
|
|
20,086 |
|
|
|
483,739 |
|
| Acquisition |
|
|
105 |
|
|
|
10,152 |
|
|
|
54 |
|
|
|
68,612 |
|
|
|
10,276 |
|
|
|
480 |
|
|
|
89,679 |
|
| Disposal |
|
|
— |
|
|
|
— |
|
|
|
— |
|
|
|
— |
|
|
|
— |
|
|
|
(866 |
) |
|
|
(866 |
) |
| Amortization (*) |
|
|
— |
|
|
|
(8,064 |
) |
|
|
(56 |
) |
|
|
(11,515 |
) |
|
|
(30,389 |
) |
|
|
— |
|
|
|
(50,024 |
) |
| Impairment loss |
|
|
— |
|
|
|
— |
|
|
|
— |
|
|
|
— |
|
|
|
— |
|
|
|
(128 |
) |
|
|
(128 |
) |
| Transfer |
|
|
— |
|
|
|
8,091 |
|
|
|
— |
|
|
|
(8,127 |
) |
|
|
36 |
|
|
|
— |
|
|
|
— |
|
| Foreign currencies translation adjustment |
|
|
(7,479 |
) |
|
|
(68 |
) |
|
|
— |
|
|
|
(383 |
) |
|
|
(1,053 |
) |
|
|
(81 |
) |
|
|
(9,064 |
) |
| Others |
|
|
— |
|
|
|
(22 |
) |
|
|
— |
|
|
|
(55 |
) |
|
|
(6,371 |
) |
|
|
(6 |
) |
|
|
(6,454 |
) |
|
|
|
|
|
|
|
|
|
|
|
|
|
|
|
|
|
|
|
|
|
|
|
|
|
|
|
|
|
| Ending balance |
|
|
117,429 |
|
|
|
45,566 |
|
|
|
311 |
|
|
|
187,228 |
|
|
|
136,863 |
|
|
|
19,485 |
|
|
|
506,882 |
|
|
|
|
|
|
|
|
|
|
|
|
|
|
|
|
|
|
|
|
|
|
|
|
|
|
|
|
|
|
| (*) |
Amortization of other intangible assets amounting to 24,443 million Won is included in other operating expenses. |
|
|
|
|
|
|
|
|
|
|
|
|
|
|
|
|
|
|
|
|
|
|
|
|
|
|
|
|
|
| |
|
For the six months ended June 30, 2016 |
|
| |
|
Goodwill |
|
|
Software |
|
|
Industrial
property
rights |
|
|
Development
cost |
|
|
Others |
|
|
Membership
deposit |
|
|
Total |
|
| Beginning balance |
|
|
103,525 |
|
|
|
38,171 |
|
|
|
344 |
|
|
|
51,357 |
|
|
|
201,769 |
|
|
|
24,640 |
|
|
|
419,806 |
|
| Acquisition |
|
|
— |
|
|
|
233 |
|
|
|
— |
|
|
|
15,899 |
|
|
|
25,112 |
|
|
|
186 |
|
|
|
41,430 |
|
| Disposal |
|
|
— |
|
|
|
— |
|
|
|
— |
|
|
|
— |
|
|
|
— |
|
|
|
(2,631 |
) |
|
|
(2,631 |
) |
| Amortization |
|
|
— |
|
|
|
(7,744 |
) |
|
|
(46 |
) |
|
|
(8,687 |
) |
|
|
(28,359 |
) |
|
|
— |
|
|
|
(44,836 |
) |
| Reversal of impairment loss |
|
|
— |
|
|
|
— |
|
|
|
— |
|
|
|
— |
|
|
|
2,242 |
|
|
|
101 |
|
|
|
2,343 |
|
| Foreign currencies translation adjustments |
|
|
5,151 |
|
|
|
— |
|
|
|
— |
|
|
|
— |
|
|
|
822 |
|
|
|
11 |
|
|
|
5,984 |
|
| Others |
|
|
(963 |
) |
|
|
— |
|
|
|
— |
|
|
|
— |
|
|
|
(253 |
) |
|
|
431 |
|
|
|
(785 |
) |
|
|
|
|
|
|
|
|
|
|
|
|
|
|
|
|
|
|
|
|
|
|
|
|
|
|
|
|
|
| Ending balance |
|
|
107,713 |
|
|
|
30,660 |
|
|
|
298 |
|
|
|
58,569 |
|
|
|
201,333 |
|
|
|
22,738 |
|
|
|
421,311 |
|
|
|
|
|
|
|
|
|
|
|
|
|
|
|
|
|
|
|
|
|
|
|
|
|
|
|
|
|
|
- 51 -
Assets held for sale are as follows (Unit: Korean Won in millions):
|
|
|
|
|
|
|
|
|
| |
|
June 30, 2017 |
|
|
December 31, 2016 |
|
| Investments in joint ventures and associates |
|
|
16,354 |
|
|
|
— |
|
| Premises and equipment |
|
|
85 |
|
|
|
2,342 |
|
|
|
|
|
|
|
|
|
|
| Total |
|
|
16,439 |
|
|
|
2,342 |
|
|
|
|
|
|
|
|
|
|
| 18. |
ASSETS SUBJECT TO LIEN AND ASSETS ACQUIRED THROUGH FORECLOSURES |
| (1) |
Assets subjected to lien are as follows (Unit: Korean Won in millions): |
|
|
|
|
|
|
|
|
|
|
|
| |
|
|
|
June 30, 2017 |
| |
|
|
|
Collateral given to |
|
Amount |
|
|
Reason for collateral |
| Loan and receivables |
|
Due from banks on time in foreign currencies |
|
Rural Commercial Bank |
|
|
49,684 |
|
|
Related to bonds sold under repurchase agreements (*) |
|
|
Due from banks in local currency |
|
Samsung Securities Co., Ltd. and others |
|
|
14,209 |
|
|
Margin deposit for futures and options and others |
|
|
Due from banks in foreign currencies |
|
Korea Investment & Securities Co., Ltd. and others |
|
|
246,722 |
|
|
Foreign margin deposit for future or option and others |
| Financial assets at FVTPL |
|
Financial institutions debt securities and others |
|
Yuanta Securities Co., Ltd. and others |
|
|
254,107 |
|
|
Substitute securities and others |
| AFS financial assets |
|
Korean treasury and government agencies bonds and others |
|
Korea Securities Depository and others |
|
|
517,751 |
|
|
Related to bonds sold under repurchase agreements (*) |
|
|
Financial institutions debt securities and others |
|
The BOK and others |
|
|
2,111,506 |
|
|
Settlement risk and others |
| HTM financial assets |
|
Corporates bonds and others |
|
Korea Securities Depository |
|
|
7,139 |
|
|
Related to bonds sold under repurchase agreements (*) |
|
|
Korean treasury and government agencies bonds and others |
|
The BOK and others |
|
|
7,075,396 |
|
|
Settlement risk and others |
| Lands and buildings |
|
|
|
Credit Counselling & Recovery Service and others |
|
|
6,230 |
|
|
Leasehold rights and others |
|
|
|
|
|
|
|
|
|
|
|
|
|
|
|
Total |
|
|
10,282,924 |
|
|
|
|
|
|
|
|
|
|
|
|
|
|
| (*) |
The Group enters into the repurchase agreements at predetermined price or original sale price added with certain rate of return after the disposal of securities. In this regards, the securities are provided as
collaterals, and the purchasers are eligible to dispose or provide them as collateral. Therefore, as such securities have been transferred but have not been derecognized, the Group recognizes the relevant amount as liability (bond sold under
repurchase agreements). |
|
|
|
|
|
|
|
|
|
|
|
| |
|
|
|
December 31, 2016 |
| |
|
|
|
Collateral given to |
|
Amount |
|
|
Reason for collateral |
| Loan and receivables |
|
Due from banks in local currency |
|
Samsung Securities Co., Ltd. and others |
|
|
24,589 |
|
|
Margin deposit for futures and options and others |
|
|
Due from banks in foreign currencies |
|
Korea Investment & Securities Co., Ltd. and others |
|
|
227,249 |
|
|
Foreign margin deposit for future or option and others |
| Financial assets at FVTPL |
|
Financial institutions debt securities and others |
|
Yuanta Securities Co., Ltd. and others |
|
|
473,476 |
|
|
Substitute securities and others |
| AFS financial assets |
|
Korean treasury and government agencies bonds |
|
Korea Securities Depository and others |
|
|
2,546,683 |
|
|
Related to bonds sold under repurchase agreements (*) |
|
|
Financial institutions debt securities and others |
|
The BOK and others |
|
|
836,522 |
|
|
Settlement risk and others |
| HTM financial assets |
|
Korean treasury and government agencies bonds |
|
Korea Securities Depository and others |
|
|
7,133 |
|
|
Related to bonds sold under repurchase agreements (*) |
|
|
Korean treasury and government agencies bonds and others |
|
The BOK and others |
|
|
6,185,295 |
|
|
Settlement risk and others |
| Lands and buildings |
|
|
|
Credit Counselling & Recovery Service and others |
|
|
6,310 |
|
|
Leasehold rights and others |
|
|
|
|
|
|
|
|
|
|
|
|
|
|
|
Total |
|
|
10,307,257 |
|
|
|
|
|
|
|
|
|
|
|
|
|
|
| (*) |
The Group enters into the repurchase agreements at predetermined price or original sale price added with certain rate of return after the disposal of securities. In this regards, the securities are provided as
collaterals, and the purchasers are eligible to dispose or provide them as collateral. Therefore, as such securities have been transferred but have not been derecognized, the Group recognizes the relevant amount as liability (bond sold under
repurchase agreements). |
- 52 -
| (2) |
The carrying amounts of buildings acquired through foreclosure are as follow (Unit: Korean Won in millions): |
|
|
|
|
|
|
|
|
|
| |
|
June 30, 2017 |
|
|
December 31, 2016 |
|
| Land |
|
|
— |
|
|
|
4,138 |
|
| Buildings |
|
|
— |
|
|
|
1,852 |
|
| Properties for business use |
|
|
— |
|
|
|
202 |
|
|
|
|
|
|
|
|
|
|
| Total |
|
|
— |
|
|
|
6,192 |
|
|
|
|
|
|
|
|
|
|
| (3) |
Securities loaned are as follows (Unit: Korean Won in millions): |
|
|
|
|
|
|
|
|
|
|
|
|
|
| |
|
|
|
June 30,
2017 |
|
|
December 31,
2016 |
|
|
Loaned to |
| Financial assets at FVTPL |
|
Equity securities-listed stock |
|
|
— |
|
|
|
4,459 |
|
|
Samsung Securities Co., Ltd. and others |
| AFS financial assets |
|
Korean treasury and government agencies bonds and others |
|
|
171,688 |
|
|
|
493,579 |
|
|
Korea Securities Finance Corporation and others |
|
|
|
|
|
|
|
|
|
|
|
|
|
| Total |
|
|
171,688 |
|
|
|
498,038 |
|
|
|
|
|
|
|
|
|
|
|
|
|
|
Securities loaned are lending of specific securities to borrowers who agree to return the same quantity of the
same security at the end of lending period. As the Group does not derecognize these securities, there are no liabilities recognized through such transactions relates to securities loaned.
| (4) |
Collaterals held that can be disposed and re-subjected to lien regardless of defaults of counterparties |
Fair values of collaterals held can be disposed and re-subjected to lien regardless of defaults of
counterparties as of June 30, 2017 and December 31, 2016 are as follows (Unit: Korean Won in millions):
|
|
|
|
|
|
|
|
|
| |
|
June 30, 2017 |
|
| |
|
Fair values of collaterals |
|
|
Fair values of collaterals were
disposed or re-subjected to lien |
|
| Securities |
|
|
11,445,595 |
|
|
|
— |
|
|
|
|
|
|
|
|
|
|
| |
|
December 31, 2016 |
|
| |
|
Fair values of collaterals |
|
|
Fair values of collaterals were
disposed or re-subjected to lien |
|
| Securities |
|
|
8,746,101 |
|
|
|
— |
|
- 53 -
Details of other assets are as follows (Unit: Korean Won in millions):
|
|
|
|
|
|
|
|
|
| |
|
June 30, 2017 |
|
|
December 31, 2016 |
|
| Prepaid expenses |
|
|
112,423 |
|
|
|
111,445 |
|
| Advance payments |
|
|
4,774 |
|
|
|
1,944 |
|
| Non-operative assets |
|
|
— |
|
|
|
6,192 |
|
| Others |
|
|
8,617 |
|
|
|
9,265 |
|
|
|
|
|
|
|
|
|
|
| Total |
|
|
125,814 |
|
|
|
128,846 |
|
|
|
|
|
|
|
|
|
|
| 20. |
FINANCIAL LIABILITIES AT FVTPL |
Financial liabilities at FVTPL are composed of financial liabilities
held for trading and financial liabilities designated at FVTPL.
| (1) |
Financial liabilities at FVTPL are as follows (Unit: Korean Won in millions): |
|
|
|
|
|
|
|
|
|
| |
|
June 30, 2017 |
|
|
December 31, 2016 |
|
| Financial liabilities held for trading |
|
|
1,902,720 |
|
|
|
3,036,478 |
|
| Financial liabilities designated at FVTPL |
|
|
616,177 |
|
|
|
766,880 |
|
|
|
|
|
|
|
|
|
|
| Total |
|
|
2,518,897 |
|
|
|
3,803,358 |
|
|
|
|
|
|
|
|
|
|
| (2) |
Financial liabilities held for trading are as follows (Unit: Korean Won in millions): |
|
|
|
|
|
|
|
|
|
| |
|
June 30, 2017 |
|
|
December 31, 2016 |
|
| Deposits due to Customers: |
|
|
|
|
|
|
|
|
| Gold banking liabilities |
|
|
31,184 |
|
|
|
26,501 |
|
| Derivative liabilities |
|
|
1,864,704 |
|
|
|
3,009,977 |
|
| Securities sold |
|
|
6,832 |
|
|
|
— |
|
|
|
|
|
|
|
|
|
|
| Total |
|
|
1,902,720 |
|
|
|
3,036,478 |
|
|
|
|
|
|
|
|
|
|
| (3) |
Financial liabilities designated at FVTPL are as follows (Unit: Korean Won in millions): |
|
|
|
|
|
|
|
|
|
| |
|
June 30, 2017 |
|
|
December 31, 2016 |
|
| Equity linked securities index: |
|
|
|
|
|
|
|
|
| Equity linked securities index in short position |
|
|
522,587 |
|
|
|
673,906 |
|
| Debentures: |
|
|
|
|
|
|
|
|
| Debentures in local currency |
|
|
93,590 |
|
|
|
92,974 |
|
|
|
|
|
|
|
|
|
|
| Total |
|
|
616,177 |
|
|
|
766,880 |
|
|
|
|
|
|
|
|
|
|
| (4) |
Credit risk adjustments to financial liabilities designated at FVTPL is as follows (Unit: Korean Won in millions): |
|
|
|
|
|
|
|
|
|
| |
|
For the six months ended June 30 |
|
| |
|
2017 |
|
|
2016 |
|
| Financial liabilities designated at FVTPL subject to credit risk adjustments |
|
|
616,177 |
|
|
|
783,760 |
|
| Changes in fair value for credit risk adjustments |
|
|
(115 |
) |
|
|
(324 |
) |
| Accumulated changes in credit risk adjustments |
|
|
(15,893 |
) |
|
|
(15,323 |
) |
Credit risk adjustments are applied to reflect the Group’s own credit risk when measuring derivative
liabilities at fair value. The methodology to determine the adjustment incorporates the Group’s credit spread as observed through credit ratings.
- 54 -
| (5) |
The differences between financial liabilities at FVTPL’s carrying amount and nominal amount at maturity are as follows (Unit: Korean Won in millions): |
|
|
|
|
|
|
|
|
|
| |
|
June 30,
2017 |
|
|
December 31,
2016 |
|
| Carrying amount |
|
|
616,177 |
|
|
|
766,880 |
|
| Nominal amount at maturity |
|
|
658,114 |
|
|
|
902,375 |
|
|
|
|
|
|
|
|
|
|
| Difference |
|
|
(41,937 |
) |
|
|
(135,495 |
) |
|
|
|
|
|
|
|
|
|
| 21. |
DEPOSITS DUE TO CUSTOMERS |
Details of deposits due to customers by type are as follows (Unit: Korean Won
in millions):
|
|
|
|
|
|
|
|
|
| |
|
June 30, 2017 |
|
|
December 31, 2016 |
|
| Deposits in local currency: |
|
|
|
|
|
|
|
|
| Deposits on demand |
|
|
7,828,154 |
|
|
|
9,491,680 |
|
| Deposits at termination |
|
|
190,437,245 |
|
|
|
183,723,369 |
|
| Mutual installment |
|
|
35,623 |
|
|
|
37,128 |
|
| Deposits on notes payables |
|
|
863,609 |
|
|
|
943,446 |
|
| Deposits on CMA |
|
|
186,586 |
|
|
|
203,013 |
|
| Certificate of deposits |
|
|
4,873,175 |
|
|
|
3,836,430 |
|
| Other deposits |
|
|
1,378,153 |
|
|
|
1,360,176 |
|
|
|
|
|
|
|
|
|
|
| Sub-total |
|
|
205,602,545 |
|
|
|
199,595,242 |
|
|
|
|
|
|
|
|
|
|
| Deposits in foreign currencies |
|
|
20,643,537 |
|
|
|
21,453,096 |
|
| Present value discount |
|
|
(45,505 |
) |
|
|
(27,927 |
) |
|
|
|
|
|
|
|
|
|
| Total |
|
|
226,200,577 |
|
|
|
221,020,411 |
|
|
|
|
|
|
|
|
|
|
| 22. |
BORROWINGS AND DEBENTURES |
| (1) |
Details of borrowings are as follows (Unit: Korean Won in millions): |
|
|
|
|
|
|
|
|
|
|
|
| |
|
June 30, 2017 |
|
| |
|
Lenders |
|
Interest rate (%) |
|
|
Amount |
|
| Borrowings in local currency: |
|
|
|
|
|
|
|
|
|
|
| Borrowings from The BOK |
|
The BOK |
|
|
0.5 ~ 0.8 |
|
|
|
1,409,422 |
|
| Borrowings from government funds |
|
Small and Medium Business Corporation and others |
|
|
0.0 ~ 3.5 |
|
|
|
1,616,014 |
|
| Others |
|
The Korea Development Bank and others |
|
|
0.0 ~ 5.5 |
|
|
|
3,804,075 |
|
|
|
|
|
|
|
|
|
|
|
|
| Sub-total |
|
|
|
|
|
|
|
|
6,829,511 |
|
|
|
|
|
|
|
|
|
|
|
|
| Borrowings in foreign currencies: |
|
|
|
|
|
|
|
|
|
|
| Borrowings in foreign currencies |
|
The Export-Import BOK and others |
|
|
0.0 ~ 7.3 |
|
|
|
7,264,348 |
|
| Offshore borrowings in foreign currencies |
|
Commonwealth Bank and others |
|
|
1.6 |
|
|
|
30,085 |
|
|
|
|
|
|
|
|
|
|
|
|
| Sub-total |
|
|
|
|
|
|
|
|
7,294,433 |
|
|
|
|
|
|
|
|
|
|
|
|
| Bills sold |
|
Others |
|
|
0.0 ~ 1.2 |
|
|
|
43,048 |
|
| Call money |
|
Bank and others |
|
|
0.0 ~ 4.7 |
|
|
|
953,366 |
|
| Bonds sold under repurchase agreements |
|
Other financial institutions |
|
|
0.6 ~ 4.5 |
|
|
|
559,952 |
|
| Present value discount |
|
|
|
|
|
|
|
|
(365 |
) |
|
|
|
|
|
|
|
|
|
|
|
| Total |
|
|
|
|
|
|
|
|
15,679,945 |
|
|
|
|
|
|
|
|
|
|
|
|
- 55 -
|
|
|
|
|
|
|
|
|
|
|
| |
|
December 31, 2016 |
|
| |
|
Lenders |
|
Interest rate (%) |
|
|
Amount |
|
| Borrowings in local currency: |
|
|
|
|
|
|
|
|
|
|
| Borrowings from the BOK |
|
The BOK |
|
|
0.5 ~ 0.8 |
|
|
|
1,598,553 |
|
| Borrowings from government funds |
|
Small and Medium Business Corporation and others |
|
|
0.0 ~ 3.5 |
|
|
|
1,534,807 |
|
| Others |
|
Seoul Metropolitan Government and others |
|
|
0.0 ~ 3.8 |
|
|
|
3,922,878 |
|
|
|
|
|
|
|
|
|
|
|
|
| Sub-total |
|
|
|
|
|
|
|
|
7,056,238 |
|
|
|
|
|
|
|
|
|
|
|
|
| Borrowings in foreign currencies: |
|
|
|
|
|
|
|
|
|
|
| Borrowings in foreign currencies |
|
The Export-Import BOK and others |
|
|
0.0 ~ 5.2 |
|
|
|
7,737,237 |
|
| Offshore borrowings in foreign currencies |
|
Wells Fargo |
|
|
1.4 |
|
|
|
18,128 |
|
|
|
|
|
|
|
|
|
|
|
|
| Sub-total |
|
|
|
|
|
|
|
|
7,755,365 |
|
|
|
|
|
|
|
|
|
|
|
|
| Bills sold |
|
Others |
|
|
0.0 ~ 1.6 |
|
|
|
26,895 |
|
| Call money |
|
Bank and others |
|
|
0.0 ~ 5.1 |
|
|
|
1,926,779 |
|
| Bonds sold under repurchase agreements |
|
Other financial institutions |
|
|
0.0 ~ 4.5 |
|
|
|
2,004,905 |
|
| Present value discount |
|
|
|
|
|
|
|
|
(667 |
) |
|
|
|
|
|
|
|
|
|
|
|
| Total |
|
|
|
|
|
|
|
|
18,769,515 |
|
|
|
|
|
|
|
|
|
|
|
|
| (2) |
Details of debentures are as follows (Unit: Korean Won in millions): |
|
|
|
|
|
|
|
|
|
|
|
|
|
|
|
|
|
| |
|
June 30, 2017 |
|
|
December 31, 2016 |
|
| |
|
Interest rate
(%) |
|
|
Amount |
|
|
Interest rate
(%) |
|
|
Amount |
|
| Face value of bond(*): |
|
|
|
|
|
|
|
|
|
|
|
|
|
|
|
|
| Ordinary bonds |
|
|
1.5 ~ 11.8 |
|
|
|
20,614,399 |
|
|
|
1.5 ~ 11.8 |
|
|
|
18,268,403 |
|
| Subordinated bonds |
|
|
3.0 ~ 12.6 |
|
|
|
4,725,969 |
|
|
|
3.0 ~ 12.6 |
|
|
|
5,327,335 |
|
| Other bonds |
|
|
1.6 ~ 17.0 |
|
|
|
346,036 |
|
|
|
17.0 |
|
|
|
4,006 |
|
|
|
|
|
|
|
|
|
|
|
|
|
|
|
|
|
|
| Sub-total |
|
|
|
|
|
|
25,686,404 |
|
|
|
|
|
|
|
23,599,744 |
|
|
|
|
|
|
|
|
|
|
|
|
|
|
|
|
|
|
| Discounts on bond |
|
|
|
|
|
|
(37,272 |
) |
|
|
|
|
|
|
(34,295 |
) |
|
|
|
|
|
|
|
|
|
|
|
|
|
|
|
|
|
| Total |
|
|
|
|
|
|
25,649,132 |
|
|
|
|
|
|
|
23,565,449 |
|
|
|
|
|
|
|
|
|
|
|
|
|
|
|
|
|
|
| (*) |
Included debentures under fair value hedge relationships are 3,410,390 million Won and 3,610,193 million Won as of June 30, 2017 and December 31, 2016, respectively. |
| (1) |
Details of provisions are as follows (Unit: Korean Won in millions): |
|
|
|
|
|
|
|
|
|
| |
|
June 30, 2017 |
|
|
December 31, 2016 |
|
| Asset retirement obligation |
|
|
61,953 |
|
|
|
58,076 |
|
| Provision for guarantee (*1) |
|
|
188,754 |
|
|
|
238,117 |
|
| Provisions for unused commitments |
|
|
82,621 |
|
|
|
87,909 |
|
| Provisions for customer reward credits |
|
|
32,048 |
|
|
|
22,093 |
|
| Other provisions (*2) |
|
|
15,654 |
|
|
|
22,282 |
|
|
|
|
|
|
|
|
|
|
| Total
|
|
|
381,030 |
|
|
|
428,477 |
|
|
|
|
|
|
|
|
|
|
| (*1) |
Provision for guarantee includes provision for financial guarantee of 60,089 million Won and 67,557 million Won as of June 30, 2017 and December 31, 2016, respectively. |
| (*2) |
Other provisions consist of provision for litigation, provision for loss recovery, and others. |
- 56 -
| (2) |
Changes in provisions except for asset retirement obligation are as follows (Unit: Korean Won in millions): |
|
|
|
|
|
|
|
|
|
|
|
|
|
|
|
|
|
|
|
|
|
| |
|
For the six months ended June 30, 2017 |
|
| |
|
Provision for
guarantees |
|
|
Provision for
unused
commitments |
|
|
Provisions for
customer
reward credits |
|
|
Other
provisions |
|
|
Total |
|
| Beginning balance |
|
|
238,117 |
|
|
|
87,909 |
|
|
|
22,093 |
|
|
|
22,282 |
|
|
|
370,401 |
|
| Provisions provided |
|
|
1,003 |
|
|
|
491 |
|
|
|
32,208 |
|
|
|
2,390 |
|
|
|
36,092 |
|
| Provisions used |
|
|
(12,335 |
) |
|
|
(42 |
) |
|
|
(39,402 |
) |
|
|
(9,013 |
) |
|
|
(60,792 |
) |
| Reversal of unused amount |
|
|
(45,971 |
) |
|
|
(5,736 |
) |
|
|
— |
|
|
|
(40 |
) |
|
|
(51,747 |
) |
| Differences due to foreign currencies translation |
|
|
20 |
|
|
|
(1 |
) |
|
|
— |
|
|
|
(146 |
) |
|
|
(127 |
) |
| Transfer(*) |
|
|
— |
|
|
|
— |
|
|
|
11,482 |
|
|
|
— |
|
|
|
11,482 |
|
| Others |
|
|
7,920 |
|
|
|
— |
|
|
|
5,667 |
|
|
|
128 |
|
|
|
13,715 |
|
| Amortization |
|
|
— |
|
|
|
— |
|
|
|
— |
|
|
|
53 |
|
|
|
53 |
|
|
|
|
|
|
|
|
|
|
|
|
|
|
|
|
|
|
|
|
|
|
| Ending balance |
|
|
188,754 |
|
|
|
82,621 |
|
|
|
32,048 |
|
|
|
15,654 |
|
|
|
319,077 |
|
|
|
|
|
|
|
|
|
|
|
|
|
|
|
|
|
|
|
|
|
|
| (*) |
According to contracts with the third parties, the Group ultimately will be reimbursed for which it has paid out on behalf of customers, which has incurred through their customer loyalty programs. Therefore, when such
obligation incurs, the Group recognizes it as “transfer”, but there is no impact on the Group’s expense. |
|
|
|
|
|
|
|
|
|
|
|
|
|
|
|
|
|
|
|
|
|
| |
|
For the six months ended June 30, 2016 |
|
| |
|
Provision for
guarantees |
|
|
Provision for
unused
commitments |
|
|
Provisions for
customer
reward credits |
|
|
Other
provisions |
|
|
Total |
|
| Beginning balance |
|
|
364,141 |
|
|
|
85,313 |
|
|
|
5,445 |
|
|
|
22,581 |
|
|
|
477,480 |
|
| Provisions provided |
|
|
3,251 |
|
|
|
3,840 |
|
|
|
8,364 |
|
|
|
2,424 |
|
|
|
17,879 |
|
| Provisions used |
|
|
(73,594 |
) |
|
|
6 |
|
|
|
(7,748 |
) |
|
|
(8,438 |
) |
|
|
(89,774 |
) |
| Reversal of unused amount |
|
|
(78,905 |
) |
|
|
(2,000 |
) |
|
|
— |
|
|
|
— |
|
|
|
(80,905 |
) |
| Others |
|
|
10,725 |
|
|
|
21 |
|
|
|
— |
|
|
|
(3 |
) |
|
|
10,743 |
|
|
|
|
|
|
|
|
|
|
|
|
|
|
|
|
|
|
|
|
|
|
| Ending balance |
|
|
225,618 |
|
|
|
87,180 |
|
|
|
6,061 |
|
|
|
16,564 |
|
|
|
335,423 |
|
|
|
|
|
|
|
|
|
|
|
|
|
|
|
|
|
|
|
|
|
|
| (3) |
Changes in asset retirement obligation are as follows (Unit: Korean Won in millions): |
|
|
|
|
|
|
|
|
|
| |
|
For the six months
ended June 30, 2017 |
|
|
For the six months
ended June 30, 2016 |
|
| Beginning balance |
|
|
58,076 |
|
|
|
39,121 |
|
| Provisions provided |
|
|
654 |
|
|
|
452 |
|
| Provisions used |
|
|
(416 |
) |
|
|
(429 |
) |
| Reversal of unused amount |
|
|
(727 |
) |
|
|
— |
|
| Amortization |
|
|
203 |
|
|
|
219 |
|
| Increase in asset retirement expense and others |
|
|
4,163 |
|
|
|
18,912 |
|
|
|
|
|
|
|
|
|
|
| Ending balance |
|
|
61,953 |
|
|
|
58,275 |
|
|
|
|
|
|
|
|
|
|
- 57 -
| 24. |
NET DEFINED BENEFIT LIABILITY (ASSET) |
The characteristics of the Group’s defined benefit
retirement pension plans characteristics are as follows:
Employees and directors with one or more years of service are entitled to receive a payment upon
termination of their employment, based on their length of service and rate of pay at the time of termination. The assets of the plans are measured at their fair value at the end of reporting date. The plan liabilities are measured using the
projected unit method, which takes account of projected earnings increases, using actuarial assumptions that give the best estimate of the future cash flows that will arise under the plan liabilities.
The Group is exposed to various risks through defined benefit retirement pension plan, and the most significant risks are as follows:
|
|
|
| Volatility of asset |
|
The defined benefit obligation was estimated with an interest rate calculated based on blue chip corporate bonds earnings. A deficit may occur if the rate of return of plan assets falls short of the interest rate. |
|
|
| Decrease in profitability of blue chip bonds |
|
A decrease in profitability of blue chip bonds will be offset by some increase in the value of debt securities that the employee benefit plan owns but will bring an increase in the defined benefit obligation. |
|
|
| Risk of inflation |
|
Defined benefit obligations are related to inflation rate; the higher the inflation rate is, the higher the level of liabilities. Therefore, deficit occurs in the system if an inflation rate increases. |
| (1) |
Details of net defined benefit liability(asset) are as follows (Unit: Korean Won in millions): |
|
|
|
|
|
|
|
|
|
| |
|
June 30, 2017 |
|
|
December 31, 2016 |
|
| Defined benefit obligation |
|
|
1,034,636 |
|
|
|
984,381 |
|
| Fair value of plan assets |
|
|
(1,019,219 |
) |
|
|
(990,653 |
) |
|
|
|
|
|
|
|
|
|
| Net defined benefit liability (asset) |
|
|
15,417 |
|
|
|
(6,272 |
) |
|
|
|
|
|
|
|
|
|
| (2) |
Changes in the carrying value of defined benefit obligation are as follows (Unit: Korean Won in millions): |
|
|
|
|
|
|
|
|
|
| |
|
For the six months
ended June 30, 2017 |
|
|
For the six months
ended June 30, 2016 |
|
| Beginning balance |
|
|
984,381 |
|
|
|
901,219 |
|
| Current service cost |
|
|
73,564 |
|
|
|
76,515 |
|
| Interest expense |
|
|
13,144 |
|
|
|
11,953 |
|
| Remeasurements |
|
|
4,639 |
|
|
|
58,377 |
|
| Foreign currencies translation adjustments |
|
|
(121 |
) |
|
|
57 |
|
| Retirement benefit paid |
|
|
(31,022 |
) |
|
|
(29,464 |
) |
| Curtailment or liquidation |
|
|
(10,076 |
) |
|
|
(9,152 |
) |
| Others |
|
|
127 |
|
|
|
251 |
|
|
|
|
|
|
|
|
|
|
| Ending balance |
|
|
1,034,636 |
|
|
|
1,009,756 |
|
|
|
|
|
|
|
|
|
|
- 58 -
| (3) |
Changes in the plan assets are as follows (Unit: Korean Won in millions): |
|
|
|
|
|
|
|
|
|
| |
|
For the six months
ended June 30, 2017 |
|
|
For the six months
ended June 30, 2016 |
|
| Beginning balance |
|
|
990,653 |
|
|
|
801,528 |
|
| Interest income |
|
|
15,127 |
|
|
|
12,307 |
|
| Remeasurements |
|
|
(7,847 |
) |
|
|
(515 |
) |
| Employer’s contributions |
|
|
18,000 |
|
|
|
160,250 |
|
| Retirement benefit paid |
|
|
(29,431 |
) |
|
|
(28,909 |
) |
| Curtailment or liquidation |
|
|
(10,396 |
) |
|
|
(8,813 |
) |
| Others |
|
|
43,113 |
|
|
|
(5,347 |
) |
|
|
|
|
|
|
|
|
|
| Ending balance |
|
|
1,019,219 |
|
|
|
930,501 |
|
|
|
|
|
|
|
|
|
|
| (4) |
Plan assets wholly consist of time deposits as of June 30, 2017 and December 31, 2016, respectively. Among plan assets, realized returns on plan assets amount to 7,280 million Won and 11,792 million
Won for the six months ended June 30, 2017 and 2016, respectively. |
| (5) |
Current service cost, net interest expense, past service cost, loss on the curtailment or liquidation and remeasurements recognized in the consolidated statements of net income and total comprehensive income are as
follows (Unit: Korean Won in millions): |
|
|
|
|
|
|
|
|
|
| |
|
For the six months
ended June 30, 2017 |
|
|
For the six months
ended June 30, 2016 |
|
| Current service cost |
|
|
73,564 |
|
|
|
76,515 |
|
| Net interest income |
|
|
(1,983 |
) |
|
|
(354 |
) |
| Loss(gain) on the curtailment or settlement |
|
|
321 |
|
|
|
(339 |
) |
|
|
|
|
|
|
|
|
|
| Cost recognized in net income |
|
|
71,902 |
|
|
|
75,822 |
|
|
|
|
|
|
|
|
|
|
| Remeasurements |
|
|
12,486 |
|
|
|
58,892 |
|
|
|
|
|
|
|
|
|
|
| Cost recognized in total comprehensive income |
|
|
84,388 |
|
|
|
134,714 |
|
|
|
|
|
|
|
|
|
|
Retirement benefit service costs related to defined contribution plans are recognized 2,155 million Won
and 2,012 million Won for the six months ended June 30, 2017 and 2016, respectively.
| (6) |
Key actuarial assumptions used in defined benefit liability (asset) assessment are as follows: |
|
|
|
|
|
| |
|
June 30, 2017 |
|
December 31, 2016 |
| Discount rate |
|
2.96% |
|
2.85% |
| Future wage growth rate |
|
6.06% |
|
6.05% |
| Mortality rate |
|
Issued by Korea Insurance
Development Institute |
|
Issued by Korea Insurance
Development Institute |
| Retirement rate |
|
Experience rate for each
employment classification |
|
Experience rate for each
employment classification |
| (7) |
The sensitivity to actuarial assumptions used in the assessment of defined benefit obligation is as follows (Unit: Korean Won in millions): |
|
|
|
|
|
|
|
|
|
|
|
|
|
| |
|
|
|
|
June 30, 2017 |
|
|
December 31, 2016 |
|
| Discount rate |
|
|
Increase by 1% point |
|
|
|
(109,252 |
) |
|
|
(107,203 |
) |
| |
|
Decrease by 1% point |
|
|
|
127,837 |
|
|
|
125,395 |
|
| Future wage growth rate |
|
|
Increase by 1% point |
|
|
|
127,318 |
|
|
|
124,766 |
|
| |
|
Decrease by 1% point |
|
|
|
(110,652 |
) |
|
|
(108,344 |
) |
- 59 -
| 25. |
OTHER FINANCIAL LIABILITIES AND OTHER LIABILITIES |
Other financial liabilities and other liabilities are
as follows (Unit: Korean Won in millions):
|
|
|
|
|
|
|
|
|
| |
|
June 30, 2017 |
|
|
December 31, 2016 |
|
| Other financial liabilities: |
|
|
|
|
|
|
|
|
| Accounts payable |
|
|
11,813,551 |
|
|
|
5,626,661 |
|
| Accrued expenses |
|
|
1,703,152 |
|
|
|
2,055,936 |
|
| Borrowings from trust accounts |
|
|
3,781,656 |
|
|
|
3,329,683 |
|
| Agency business revenue |
|
|
536,882 |
|
|
|
331,159 |
|
| Foreign exchange payables |
|
|
486,111 |
|
|
|
702,968 |
|
| Domestic exchange payables |
|
|
4,469,497 |
|
|
|
8,480,765 |
|
| Other miscellaneous financial liabilities |
|
|
1,861,183 |
|
|
|
1,458,747 |
|
| Present value discount |
|
|
(1,186 |
) |
|
|
(833 |
) |
|
|
|
|
|
|
|
|
|
| Sub-total |
|
|
24,650,846 |
|
|
|
21,985,086 |
|
|
|
|
|
|
|
|
|
|
| Other liabilities: |
|
|
|
|
|
|
|
|
| Unearned Income |
|
|
174,468 |
|
|
|
171,050 |
|
| Other miscellaneous liabilities |
|
|
99,038 |
|
|
|
128,326 |
|
|
|
|
|
|
|
|
|
|
| Sub-total |
|
|
273,506 |
|
|
|
299,376 |
|
|
|
|
|
|
|
|
|
|
| Total |
|
|
24,924,352 |
|
|
|
22,284,462 |
|
|
|
|
|
|
|
|
|
|
| (1) |
Derivative assets and derivative liabilities are as follows (Unit: Korean Won in millions): |
|
|
|
|
|
|
|
|
|
|
|
|
|
|
|
|
|
|
|
|
|
|
|
|
|
|
|
|
|
| |
|
June 30, 2017 |
|
| |
|
|
|
|
Assets |
|
|
Liabilities |
|
| |
|
Nominal
amount |
|
|
For cash
flow hedge |
|
|
For fair
value
hedge |
|
|
For trading |
|
|
For cash
flow hedge |
|
|
For fair
value
hedge |
|
|
For trading |
|
| Interest rate: |
|
|
|
|
|
|
|
|
|
|
|
|
|
|
|
|
|
|
|
|
|
|
|
|
|
|
|
|
| Futures |
|
|
207,279 |
|
|
|
— |
|
|
|
— |
|
|
|
— |
|
|
|
— |
|
|
|
— |
|
|
|
— |
|
| Swaps |
|
|
125,264,575 |
|
|
|
— |
|
|
|
140,143 |
|
|
|
346,069 |
|
|
|
— |
|
|
|
2,348 |
|
|
|
364,524 |
|
| Written options |
|
|
730,000 |
|
|
|
— |
|
|
|
— |
|
|
|
15,003 |
|
|
|
— |
|
|
|
— |
|
|
|
— |
|
| Purchase options |
|
|
925,000 |
|
|
|
— |
|
|
|
— |
|
|
|
— |
|
|
|
— |
|
|
|
— |
|
|
|
15,993 |
|
| Currency: |
|
|
|
|
|
|
|
|
|
|
|
|
|
|
|
|
|
|
|
|
|
|
|
|
|
|
|
|
| Futures |
|
|
503,205 |
|
|
|
— |
|
|
|
— |
|
|
|
— |
|
|
|
— |
|
|
|
— |
|
|
|
— |
|
| Forwards |
|
|
68,932,550 |
|
|
|
— |
|
|
|
— |
|
|
|
480,511 |
|
|
|
— |
|
|
|
— |
|
|
|
519,445 |
|
| Swaps |
|
|
46,528,978 |
|
|
|
33 |
|
|
|
— |
|
|
|
652,287 |
|
|
|
20,642 |
|
|
|
— |
|
|
|
668,739 |
|
| Written options |
|
|
2,138,187 |
|
|
|
— |
|
|
|
— |
|
|
|
25,435 |
|
|
|
— |
|
|
|
— |
|
|
|
— |
|
| Purchase options |
|
|
2,987,630 |
|
|
|
— |
|
|
|
— |
|
|
|
— |
|
|
|
— |
|
|
|
— |
|
|
|
25,021 |
|
| Equity: |
|
|
|
|
|
|
|
|
|
|
|
|
|
|
|
|
|
|
|
|
|
|
|
|
|
|
|
|
| Futures |
|
|
390,006 |
|
|
|
— |
|
|
|
— |
|
|
|
— |
|
|
|
— |
|
|
|
— |
|
|
|
— |
|
| Swaps |
|
|
15,000 |
|
|
|
— |
|
|
|
— |
|
|
|
65 |
|
|
|
— |
|
|
|
— |
|
|
|
33 |
|
| Written options |
|
|
4,392,724 |
|
|
|
— |
|
|
|
— |
|
|
|
124,451 |
|
|
|
— |
|
|
|
— |
|
|
|
— |
|
| Purchase options |
|
|
5,973,184 |
|
|
|
— |
|
|
|
— |
|
|
|
— |
|
|
|
— |
|
|
|
6,239 |
|
|
|
269,943 |
|
| Others: |
|
|
|
|
|
|
|
|
|
|
|
|
|
|
|
|
|
|
|
|
|
|
|
|
|
|
|
|
| Futures |
|
|
2,041 |
|
|
|
— |
|
|
|
— |
|
|
|
— |
|
|
|
— |
|
|
|
— |
|
|
|
— |
|
| Swaps |
|
|
2,632 |
|
|
|
— |
|
|
|
— |
|
|
|
157 |
|
|
|
— |
|
|
|
— |
|
|
|
144 |
|
| Written options |
|
|
7,543 |
|
|
|
— |
|
|
|
— |
|
|
|
90 |
|
|
|
— |
|
|
|
— |
|
|
|
— |
|
| Purchase options |
|
|
46,948 |
|
|
|
— |
|
|
|
— |
|
|
|
— |
|
|
|
— |
|
|
|
— |
|
|
|
862 |
|
|
|
|
|
|
|
|
|
|
|
|
|
|
|
|
|
|
|
|
|
|
|
|
|
|
|
|
|
|
| Total |
|
|
259,047,482 |
|
|
|
33 |
|
|
|
140,143 |
|
|
|
1,644,068 |
|
|
|
20,642 |
|
|
|
8,587 |
|
|
|
1,864,704 |
|
|
|
|
|
|
|
|
|
|
|
|
|
|
|
|
|
|
|
|
|
|
|
|
|
|
|
|
|
|
- 60 -
|
|
|
|
|
|
|
|
|
|
|
|
|
|
|
|
|
|
|
|
|
| |
|
December 31, 2016 |
|
| |
|
|
|
|
Assets |
|
|
Liabilities |
|
| |
|
Notional
Amount |
|
|
For fair value
Hedge |
|
|
For trading |
|
|
For fair value
hedge |
|
|
For trading |
|
| Interest rate: |
|
|
|
|
|
|
|
|
|
|
|
|
|
|
|
|
|
|
|
|
| Futures |
|
|
54,785 |
|
|
|
— |
|
|
|
— |
|
|
|
— |
|
|
|
— |
|
| Swaps |
|
|
118,582,511 |
|
|
|
139,832 |
|
|
|
470,057 |
|
|
|
7,013 |
|
|
|
509,686 |
|
| Written options |
|
|
860,000 |
|
|
|
— |
|
|
|
21,172 |
|
|
|
— |
|
|
|
— |
|
| Purchase options |
|
|
1,035,000 |
|
|
|
— |
|
|
|
— |
|
|
|
— |
|
|
|
21,863 |
|
| Currency: |
|
|
|
|
|
|
|
|
|
|
|
|
|
|
|
|
|
|
|
|
| Futures |
|
|
493,733 |
|
|
|
— |
|
|
|
— |
|
|
|
— |
|
|
|
— |
|
| Forwards |
|
|
62,539,094 |
|
|
|
— |
|
|
|
1,265,852 |
|
|
|
— |
|
|
|
1,015,380 |
|
| Swaps |
|
|
39,782,049 |
|
|
|
— |
|
|
|
1,022,969 |
|
|
|
— |
|
|
|
1,221,959 |
|
| Written options |
|
|
1,120,949 |
|
|
|
— |
|
|
|
42,126 |
|
|
|
— |
|
|
|
— |
|
| Purchase options |
|
|
907,211 |
|
|
|
— |
|
|
|
— |
|
|
|
— |
|
|
|
8,589 |
|
| Equity: |
|
|
|
|
|
|
|
|
|
|
|
|
|
|
|
|
|
|
|
|
| Futures |
|
|
926,392 |
|
|
|
— |
|
|
|
— |
|
|
|
— |
|
|
|
— |
|
| Swaps |
|
|
15,000 |
|
|
|
— |
|
|
|
92 |
|
|
|
— |
|
|
|
88 |
|
| Written options |
|
|
3,007,969 |
|
|
|
745 |
|
|
|
73,261 |
|
|
|
— |
|
|
|
— |
|
| Purchase options |
|
|
4,460,233 |
|
|
|
— |
|
|
|
— |
|
|
|
208 |
|
|
|
228,900 |
|
| Others: |
|
|
|
|
|
|
|
|
|
|
|
|
|
|
|
|
|
|
|
|
| Futures |
|
|
5,105 |
|
|
|
— |
|
|
|
— |
|
|
|
— |
|
|
|
— |
|
| Swaps |
|
|
7,918 |
|
|
|
— |
|
|
|
2,645 |
|
|
|
— |
|
|
|
2,331 |
|
| Written options |
|
|
8,307 |
|
|
|
— |
|
|
|
121 |
|
|
|
— |
|
|
|
— |
|
| Purchase options |
|
|
64,352 |
|
|
|
— |
|
|
|
— |
|
|
|
— |
|
|
|
1,181 |
|
|
|
|
|
|
|
|
|
|
|
|
|
|
|
|
|
|
|
|
|
|
| Total |
|
|
233,870,608 |
|
|
|
140,577 |
|
|
|
2,898,295 |
|
|
|
7,221 |
|
|
|
3,009,977 |
|
|
|
|
|
|
|
|
|
|
|
|
|
|
|
|
|
|
|
|
|
|
Derivatives held for trading purpose are classified into financial assets or liabilities at FVTPL (see Notes 7 and 20) and
derivatives for hedging are stated as a separate line item in the consolidated statements of financial position.
| (2) |
Gains or losses from valuation of financial instruments under hedge accounting are as follows (Unit: Korean Won in millions): |
|
|
|
|
|
|
|
|
|
| |
|
For the six months ended June 30 |
|
| |
|
2017 |
|
|
2016 |
|
| Losses from hedged items |
|
|
(3,986 |
) |
|
|
(100,587 |
) |
| Gains (losses) from hedging instruments |
|
|
(19,475 |
) |
|
|
92,491 |
|
Meanwhile, the maximum period that the Group is exposed to cash flow risk arising from the hedging transaction
discussed above will be terminated by January 2020.
Among gain (loss) on valuation of derivatives that was included in the accumulated
other comprehensive income, the amount has been reclassified to loss is 19,018 million Won, before reduction of income tax effect during the six months ended June 30, 2017.
- 61 -
| 27. |
DEFERRED DAY 1 PROFITS OR LOSSES |
Changes in deferred day 1 profits or losses are as follows (Unit:
Korean Won in millions):
|
|
|
|
|
|
|
|
|
| |
|
For the six months ended June 30 |
|
| |
|
2017 |
|
|
2016 |
|
| Beginning balance |
|
|
13,422 |
|
|
|
28,008 |
|
| New transactions |
|
|
500 |
|
|
|
1,337 |
|
| Amounts recognized in profits or losses |
|
|
(3,613 |
) |
|
|
(7,020 |
) |
|
|
|
|
|
|
|
|
|
| Ending balance |
|
|
10,309 |
|
|
|
22,325 |
|
|
|
|
|
|
|
|
|
|
In case some variables to measure fair values of financial instruments are not observable or available in the market,
valuation techniques are utilized to evaluate such financial instruments. Those financial instruments are recorded at the fair value produced by the valuation techniques as at the time of acquisition, even though there are difference noted between
the transaction price and the fair value. The table above presents the difference yet to be realized as profit or losses.
| 28. |
CAPITAL STOCK AND CAPITAL SURPLUS |
| (1) |
The number of authorized shares and others are as follows: |
|
|
|
|
|
|
|
|
|
| |
|
June 30, 2017 |
|
|
December 31, 2016 |
|
| Authorized shares of common stock |
|
|
5,000,000,000 Shares |
|
|
|
5,000,000,000 Shares |
|
| Par value |
|
|
5,000 Won |
|
|
|
5,000 Won |
|
| Issued shares of common stock |
|
|
676,000,000 Shares |
|
|
|
676,000,000 Shares |
|
| Capital stock |
|
|
3,381,392 million Won |
|
|
|
3,381,392 million Won |
|
| (2) |
There is no change to be disclosed in numbers of issued and outstanding shares of common stock for the six months ended June 30, 2017 and 2016. |
| (3) |
Details of capital surplus are as follows (Unit: Korean Won in millions): |
|
|
|
|
|
|
|
|
|
| |
|
June 30, 2017 |
|
|
December 31, 2016 |
|
| Capital in excess of par value |
|
|
269,533 |
|
|
|
269,533 |
|
| Other capital surplus |
|
|
16,541 |
|
|
|
16,798 |
|
|
|
|
|
|
|
|
|
|
| Total |
|
|
286,074 |
|
|
|
286,331 |
|
|
|
|
|
|
|
|
|
|
-62 -
The bond-type hybrid securities classified as owner’s equity are as follows
(Unit: Korean Won in millions):
|
|
|
|
|
|
|
|
|
|
|
|
|
|
|
|
|
|
|
|
|
| |
|
Issue date |
|
|
Maturity |
|
|
Interest rate
(%) |
|
|
June 30,
2017 |
|
|
December 31,
2016 |
|
| Securities in local currency |
|
|
June 20, 2008 |
|
|
|
June 20, 2038 |
|
|
|
7.7 |
|
|
|
255,000 |
|
|
|
255,000 |
|
|
|
|
March 8, 2012 |
|
|
|
March 8, 2042 |
|
|
|
5.8 |
|
|
|
— |
|
|
|
190,000 |
|
|
|
|
April 25, 2013 |
|
|
|
April 25, 2043 |
|
|
|
4.4 |
|
|
|
500,000 |
|
|
|
500,000 |
|
|
|
|
November 13, 2013 |
|
|
|
November 13, 2043 |
|
|
|
5.7 |
|
|
|
200,000 |
|
|
|
200,000 |
|
|
|
|
December 12, 2014 |
|
|
|
December 12, 2044 |
|
|
|
5.2 |
|
|
|
160,000 |
|
|
|
160,000 |
|
|
|
|
June 3, 2015 |
|
|
|
June 3, 2045 |
|
|
|
4.4 |
|
|
|
240,000 |
|
|
|
240,000 |
|
| Securities in foreign currencies |
|
|
May 2, 2007 |
|
|
|
May 2, 2037 |
|
|
|
6.2 |
|
|
|
— |
|
|
|
930,900 |
|
|
|
|
June 10, 2015 |
|
|
|
June 10, 2045 |
|
|
|
5.0 |
|
|
|
559,650 |
|
|
|
559,650 |
|
|
|
|
September 27, 2016 |
|
|
|
— |
|
|
|
4.5 |
|
|
|
553,450 |
|
|
|
553,450 |
|
|
|
|
May 16, 2017 |
|
|
|
— |
|
|
|
5.3 |
|
|
|
562,700 |
|
|
|
— |
|
| Issuance cost |
|
|
|
|
|
|
|
|
|
|
|
|
|
|
(12,912 |
) |
|
|
(14,104 |
) |
|
|
|
|
|
|
|
|
|
|
|
|
|
|
|
|
|
|
|
|
|
| Total |
|
|
|
|
|
|
|
|
|
|
|
|
|
|
3,017,888 |
|
|
|
3,574,896 |
|
|
|
|
|
|
|
|
|
|
|
|
|
|
|
|
|
|
|
|
|
|
With respect to the hybrid securities issued, there’s no maturity or the contractual agreements allow the
Group to indefinitely extend the maturity date and defer the payment of interest. If the Group makes a resolution not to pay dividends on common stock, and then, the Group is exonerated from interest payment on the hybrid securities.
- 63 -
| (1) |
Details of other equity are as follows (Unit: Korean Won in millions): |
|
|
|
|
|
|
|
|
|
| |
|
June 30, 2017 |
|
|
December 31, 2016 |
|
| Accumulated other comprehensive income: |
|
|
|
|
|
|
|
|
| Gain on valuation of
available-for-sale financial assets |
|
|
357,948 |
|
|
|
386,981 |
|
| Share of other comprehensive loss of joint ventures and associates |
|
|
(356 |
) |
|
|
(1,863 |
) |
| Loss on foreign currency translation of foreign operations |
|
|
(112,297 |
) |
|
|
(48,353 |
) |
| Remeasurement loss related to defined benefit plan |
|
|
(173,019 |
) |
|
|
(163,397 |
) |
| Loss on valuation of cash flow hedges |
|
|
(1,526 |
) |
|
|
— |
|
|
|
|
|
|
|
|
|
|
| Sub-total |
|
|
70,750 |
|
|
|
173,368 |
|
|
|
|
|
|
|
|
|
|
| Treasury shares |
|
|
(34,113 |
) |
|
|
(34,113 |
) |
| Other capital adjustments |
|
|
(1,815,438 |
) |
|
|
(1,607,280 |
) |
|
|
|
|
|
|
|
|
|
| Total |
|
|
(1,778,801 |
) |
|
|
(1,468,025 |
) |
|
|
|
|
|
|
|
|
|
| (2) |
Changes in the accumulated other comprehensive income are as follows (Unit: Korean Won in millions): |
|
|
|
|
|
|
|
|
|
|
|
|
|
|
|
|
|
|
|
|
|
| |
|
For the six months ended June 30, 2017 |
|
| |
|
Beginning
balance |
|
|
Increase
(decrease)(*) |
|
|
Reclassification
adjustments(*) |
|
|
Income tax
effect |
|
|
Ending
balance |
|
| Gain (loss) on valuation of
available-for-sale financial assets |
|
|
386,981 |
|
|
|
46,479 |
|
|
|
(81,114 |
) |
|
|
5,602 |
|
|
|
357,948 |
|
| Share of other comprehensive income (loss) of joint ventures and associates |
|
|
(1,863 |
) |
|
|
2,038 |
|
|
|
— |
|
|
|
(531 |
) |
|
|
(356 |
) |
| Gain (loss) on foreign currency translation of foreign operations |
|
|
(48,353 |
) |
|
|
(81,571 |
) |
|
|
— |
|
|
|
17,627 |
|
|
|
(112,297 |
) |
| Remeasurement gain (loss) related to defined benefit plan |
|
|
(163,397 |
) |
|
|
(12,642 |
) |
|
|
— |
|
|
|
3,020 |
|
|
|
(173,019 |
) |
| Gain (loss) on valuation of cash flow hedges |
|
|
— |
|
|
|
(1,947 |
) |
|
|
— |
|
|
|
421 |
|
|
|
(1,526 |
) |
|
|
|
|
|
|
|
|
|
|
|
|
|
|
|
|
|
|
|
|
|
| Total |
|
|
173,368 |
|
|
|
(47,643 |
) |
|
|
(81,114 |
) |
|
|
26,139 |
|
|
|
70,750 |
|
|
|
|
|
|
|
|
|
|
|
|
|
|
|
|
|
|
|
|
|
|
|
|
|
|
|
|
|
|
|
|
|
|
|
|
|
|
|
|
|
|
|
| |
|
For the six months ended June 30, 2016 |
|
| |
|
Beginning
balance |
|
|
Increase
(decrease)
(*) |
|
|
Reclassification
adjustments(*) |
|
|
Income
tax effect |
|
|
Ending
balance |
|
| Gain (loss) on valuation of
available-for-sale financial assets |
|
|
374,685 |
|
|
|
108,105 |
|
|
|
(12,872 |
) |
|
|
(15,582 |
) |
|
|
454,336 |
|
| Share of other comprehensive income (loss) of joint ventures and associates |
|
|
6,074 |
|
|
|
4,846 |
|
|
|
(3,906 |
) |
|
|
(1,173 |
) |
|
|
5,841 |
|
| Gain (loss) on foreign currency translation of foreign operations |
|
|
(70,789 |
) |
|
|
(8,378 |
) |
|
|
— |
|
|
|
1,655 |
|
|
|
(77,512 |
) |
| Remeasurement gain (loss) related to defined benefit plan |
|
|
(197,579 |
) |
|
|
(58,888 |
) |
|
|
— |
|
|
|
14,224 |
|
|
|
(242,243 |
) |
| Gain (loss) on valuation of cash flow hedges |
|
|
(10,371 |
) |
|
|
10,371 |
|
|
|
— |
|
|
|
— |
|
|
|
— |
|
|
|
|
|
|
|
|
|
|
|
|
|
|
|
|
|
|
|
|
|
|
| Total |
|
|
102,020 |
|
|
|
56,056 |
|
|
|
(16,778 |
) |
|
|
(876 |
) |
|
|
140,422 |
|
|
|
|
|
|
|
|
|
|
|
|
|
|
|
|
|
|
|
|
|
|
| (*) |
For the change in gain (loss) on valuation of AFS financial assets, “increase (decrease)” represents change due to the valuation during the period, and “reclassification adjustments” explains
disposal or recognition of impairment losses on AFS financial assets. |
- 64 -
| (1) |
Details of retained earnings are as follows (Unit: Korean Won in millions): |
|
|
|
|
|
|
|
|
|
|
|
| |
|
|
|
June 30, 2017 |
|
|
December 31, 2016 |
|
| Legal reserve |
|
Legal reserve |
|
|
1,729,754 |
|
|
|
1,622,754 |
|
|
|
Other legal reserve |
|
|
45,669 |
|
|
|
44,634 |
|
|
|
|
|
|
|
|
|
|
|
|
|
|
Sub-total |
|
|
1,775,423 |
|
|
|
1,667,388 |
|
|
|
|
|
|
|
|
|
|
|
|
| Voluntary reserve |
|
Business rationalization reserve |
|
|
8,000 |
|
|
|
8,000 |
|
|
|
Reserve for financial structure improvement |
|
|
235,400 |
|
|
|
235,400 |
|
|
|
Additional reserve |
|
|
7,418,806 |
|
|
|
7,073,104 |
|
|
|
Regulatory reserve for credit loss |
|
|
2,438,191 |
|
|
|
2,255,252 |
|
|
|
Revaluation reserve |
|
|
751,964 |
|
|
|
753,908 |
|
|
|
Other voluntary reserve |
|
|
11,700 |
|
|
|
11,700 |
|
|
|
|
|
|
|
|
|
|
|
|
|
|
Sub-total |
|
|
10,864,061 |
|
|
|
10,337,364 |
|
|
|
|
|
|
|
|
|
|
|
|
| Retained earnings before appropriation |
|
|
2,710,312 |
|
|
|
2,606,814 |
|
|
|
|
|
|
|
|
|
|
|
|
|
|
Total |
|
|
15,349,796 |
|
|
|
14,611,566 |
|
|
|
|
|
|
|
|
|
|
|
|
In accordance with the Banking Act, legal reserve are appropriated at least one
tenth of the earnings after tax on every dividend declaration, not exceeding the paid in capital. This reserve may not be used other than for offsetting a deficit or transferring to capital.
Other legal reserves were appropriated in the branches located in Japan,
Vietnam and Bangladesh according to the banking laws of Japan, Vietnam and Bangladesh, and may be used to offset any deficit incurred in those branches.
| |
iii. |
Business rationalization reserve |
Pursuant to the Restriction of Special Taxation Act, the
Group was previously required to appropriate, as a reserve for business rationalization, amounts equal to tax reductions arising from tax exemptions and tax credits up to December 31, 2001. The requirement was no longer effective from 2002.
| |
iv. |
Reserve for financial structure improvement |
From 2002 to 2014, the Finance Supervisory
Services recommended banks in Korea to appropriate at least 10 percent of net income after accumulated deficit for financial structure improvement, until tangible common equity ratio equals 5.5 percent. But this reserve is not available
for payment of cash dividends; however, it can be used to reduce a deficit or be transferred to capital. The reserve and appropriation is an Autonomous judgment matter of the Group since 2015.
| |
v. |
Additional reserve and other voluntary reserve |
Additional reserve and other voluntary reserve
were appropriated for capital adequacy and other management purpose.
| |
vi. |
Regulatory reserve for credit loss |
In accordance with Article 29 of the Regulation on
Supervision of Banking Business (“RSBB”), if provisions for credit loss under K-IFRS for the accounting purpose are lower than provisions under RSBB, the Bank discloses such short fall amount as
regulatory reserve for credit loss.
Revaluation reserve is the amount of limited dividends set by the board of
directors to be the recognized as complementary capital when the gain or loss occurred in the property revaluation by adopting K-IFRS.
- 65 -
| (2) |
Changes in retained earnings are as follows (Unit: Korean Won in millions): |
|
|
|
|
|
|
|
|
|
| |
|
For the six months ended June 30 |
|
| |
|
2017 |
|
|
2016 |
|
| Beginning balance |
|
|
14,611,566 |
|
|
|
13,726,122 |
|
| Net attributable to owners |
|
|
1,098,361 |
|
|
|
750,266 |
|
| Dividends on common stock |
|
|
(269,308 |
) |
|
|
(168,317 |
) |
| Dividends on hybrid securities |
|
|
(90,823 |
) |
|
|
(100,236 |
) |
|
|
|
|
|
|
|
|
|
| Ending balance |
|
|
15,349,796 |
|
|
|
14,207,835 |
|
|
|
|
|
|
|
|
|
|
| 32. |
REGULATORY RESERVE FOR CREDIT LOSS |
In accordance with Paragraph 1 and 2 of Article 29 of the Regulation
on the Supervision of Banking Business (“RSBB”), if the estimated provisions for credit loss under K-IFRS for the accounting purpose are lower than those in accordance with the provisions under the
RSBB, the Group shall disclose the difference as the planned regulatory reserve for credit loss.
| (1) |
Balance of the planned regulatory reserve for credit loss is as follows (Unit: Korean Won in millions): |
|
|
|
|
|
|
|
|
|
| |
|
June 30, 2017 |
|
|
December 31, 2016 |
|
| Beginning balance |
|
|
2,438,191 |
|
|
|
2,255,252 |
|
| Planned provision of regulatory reserve for credit loss |
|
|
49,961 |
|
|
|
182,939 |
|
|
|
|
|
|
|
|
|
|
| Ending balance |
|
|
2,488,152 |
|
|
|
2,438,191 |
|
|
|
|
|
|
|
|
|
|
| (2) |
Planned reserves provided, adjusted net income after the planned reserves provided and adjusted earnings per share after the planned reserves provided are as follows (Unit: Korean Won in millions, except for earnings
per share amount): |
|
|
|
|
|
|
|
|
|
|
|
|
|
|
|
|
|
| |
|
2017 |
|
|
2016 |
|
| |
|
Three months
ended June 30 |
|
|
Six months
ended June 30 |
|
|
Three months
ended June 30 |
|
|
Six months
ended June 30 |
|
| Net income |
|
|
466,284 |
|
|
|
1,109,015 |
|
|
|
311,283 |
|
|
|
757,787 |
|
| Provision (reversal) of regulatory reserve for credit loss |
|
|
48,412 |
|
|
|
49,961 |
|
|
|
(5,206 |
) |
|
|
12,826 |
|
| Adjusted net income after the provision(reversal) of regulatory reserve |
|
|
417,872 |
|
|
|
1,059,054 |
|
|
|
316,489 |
|
|
|
744,961 |
|
| Adjusted EPS after the provision (reversal) of regulatory reserve(Unit: Korean Won) |
|
|
559 |
|
|
|
1,439 |
|
|
|
396 |
|
|
|
958 |
|
At the shareholders’ meeting on March 24, 2017, dividend payment for the year ended
December 31, 2016 amounting to 269,308 million Won (400 Won per share) was approved.
In addition, on July 28, 2017, the board of directors
approved interim dividend payment of 100 Won per share, which amounts to 67,327 million Won in total. In accordance with the Commercial Law, the dividend is required to be paid within a month from the date of declaration, and the amount of
dividend payable is not included in the consolidated financial statements attached.
- 66 -
| (1) |
Interest income recognized are as follows (Unit: Korean Won in millions): |
|
|
|
|
|
|
|
|
|
|
|
|
|
|
|
|
|
| |
|
2017 |
|
|
2016 |
|
| |
|
Three months
ended June 30 |
|
|
Six months
ended June 30 |
|
|
Three months
ended June 30 |
|
|
Six months
ended June 30 |
|
| Financial assets at FVTPL |
|
|
13,074 |
|
|
|
26,806 |
|
|
|
14,536 |
|
|
|
29,684 |
|
| AFS financial assets |
|
|
67,667 |
|
|
|
144,067 |
|
|
|
87,163 |
|
|
|
176,540 |
|
| HTM financial assets |
|
|
74,690 |
|
|
|
149,673 |
|
|
|
92,643 |
|
|
|
189,492 |
|
| Loans and receivables: |
|
|
|
|
|
|
|
|
|
|
|
|
|
|
|
|
| Interest on due from banks |
|
|
20,182 |
|
|
|
41,403 |
|
|
|
16,671 |
|
|
|
33,877 |
|
| Interest on loans |
|
|
1,921,359 |
|
|
|
3,810,008 |
|
|
|
1,921,276 |
|
|
|
3,843,951 |
|
| Interest of other receivables |
|
|
8,836 |
|
|
|
17,627 |
|
|
|
9,765 |
|
|
|
20,018 |
|
|
|
|
|
|
|
|
|
|
|
|
|
|
|
|
|
|
| Sub-total |
|
|
1,950,377 |
|
|
|
3,869,038 |
|
|
|
1,947,712 |
|
|
|
3,897,846 |
|
|
|
|
|
|
|
|
|
|
|
|
|
|
|
|
|
|
| Total |
|
|
2,105,808 |
|
|
|
4,189,584 |
|
|
|
2,142,054 |
|
|
|
4,293,562 |
|
|
|
|
|
|
|
|
|
|
|
|
|
|
|
|
|
|
| (2) |
Interest expense recognized are as follows (Unit: Korean Won in millions): |
|
|
|
|
|
|
|
|
|
|
|
|
|
|
|
|
|
| |
|
2017 |
|
|
2016 |
|
| |
|
Three months
ended June 30 |
|
|
Six months
ended June 30 |
|
|
Three months
ended June 30 |
|
|
Six months
ended June 30 |
|
| Interest on deposits due to customers |
|
|
586,051 |
|
|
|
1,174,384 |
|
|
|
658,849 |
|
|
|
1,326,553 |
|
| Interest on borrowings |
|
|
57,666 |
|
|
|
115,548 |
|
|
|
54,560 |
|
|
|
110,132 |
|
| Interest on debentures |
|
|
154,445 |
|
|
|
305,804 |
|
|
|
154,469 |
|
|
|
310,057 |
|
| Other interest expense |
|
|
20,070 |
|
|
|
43,528 |
|
|
|
29,079 |
|
|
|
58,062 |
|
|
|
|
|
|
|
|
|
|
|
|
|
|
|
|
|
|
| Total |
|
|
818,232 |
|
|
|
1,639,264 |
|
|
|
896,957 |
|
|
|
1,804,804 |
|
|
|
|
|
|
|
|
|
|
|
|
|
|
|
|
|
|
- 67 -
| 35. |
NET FEES AND COMMISSIONS INCOME |
| (1) |
Details of fees and commissions income recognized are as follows (Unit: Korean Won in millions): |
|
|
|
|
|
|
|
|
|
|
|
|
|
|
|
|
|
| |
|
2017 |
|
|
2016 |
|
| |
|
Three months
ended June 30 |
|
|
Six months
ended June 30 |
|
|
Three months
ended June 30 |
|
|
Six months
ended June 30 |
|
| Fees and commissions received (*) |
|
|
163,688 |
|
|
|
336,322 |
|
|
|
163,458 |
|
|
|
333,464 |
|
| Fees and commissions received for provision of guarantee |
|
|
15,911 |
|
|
|
31,700 |
|
|
|
16,336 |
|
|
|
34,163 |
|
| Fees and commissions received on project financing |
|
|
4,614 |
|
|
|
6,334 |
|
|
|
8,621 |
|
|
|
13,489 |
|
| Fees and commissions received on Credit card |
|
|
268,887 |
|
|
|
527,566 |
|
|
|
229,889 |
|
|
|
452,920 |
|
| Fees and commissions received on securities |
|
|
19,757 |
|
|
|
40,267 |
|
|
|
16,851 |
|
|
|
33,483 |
|
| Other fees and commissions received |
|
|
33,424 |
|
|
|
71,704 |
|
|
|
22,034 |
|
|
|
39,311 |
|
|
|
|
|
|
|
|
|
|
|
|
|
|
|
|
|
|
| Total |
|
|
506,281 |
|
|
|
1,013,893 |
|
|
|
457,189 |
|
|
|
906,830 |
|
|
|
|
|
|
|
|
|
|
|
|
|
|
|
|
|
|
| (*) |
Fees and commissions received include fees income from agency commission, fees income from electronic finance, fees income related to loan, fees for import letter of credit dealing, commission received on foreign
exchange and others. |
| (2) |
Details of fees and commissions expense incurred are as follows (Unit: Korean Won in millions): |
|
|
|
|
|
|
|
|
|
|
|
|
|
|
|
|
|
| |
|
2017 |
|
|
2016 |
|
| |
|
Three months
ended June 30 |
|
|
Six months
ended June 30 |
|
|
Three months
ended June 30 |
|
|
Six months
ended June 30 |
|
| Fees and commissions paid |
|
|
41,930 |
|
|
|
73,167 |
|
|
|
43,032 |
|
|
|
80,414 |
|
| Credit card commission |
|
|
200,275 |
|
|
|
400,349 |
|
|
|
176,818 |
|
|
|
356,451 |
|
| Brokerage commission |
|
|
121 |
|
|
|
348 |
|
|
|
257 |
|
|
|
434 |
|
| Others |
|
|
1,207 |
|
|
|
2,329 |
|
|
|
811 |
|
|
|
1,525 |
|
|
|
|
|
|
|
|
|
|
|
|
|
|
|
|
|
|
| Total |
|
|
243,533 |
|
|
|
476,193 |
|
|
|
220,918 |
|
|
|
438,824 |
|
|
|
|
|
|
|
|
|
|
|
|
|
|
|
|
|
|
Details of dividend income recognized are as follows (Unit: Korean Won in millions):
|
|
|
|
|
|
|
|
|
|
|
|
|
|
|
|
|
| |
|
2017 |
|
|
2016 |
|
| |
|
Three months
ended June 30 |
|
|
Six months
ended June 30 |
|
|
Three months
ended June 30 |
|
|
Six months
ended June 30 |
|
| Dividend from financial assets at FVTPL |
|
|
47 |
|
|
|
190 |
|
|
|
84 |
|
|
|
751 |
|
| Dividend from AFS financial assets |
|
|
19,570 |
|
|
|
59,255 |
|
|
|
52,997 |
|
|
|
119,648 |
|
|
|
|
|
|
|
|
|
|
|
|
|
|
|
|
|
|
| Total |
|
|
19,617 |
|
|
|
59,445 |
|
|
|
53,081 |
|
|
|
120,399 |
|
|
|
|
|
|
|
|
|
|
|
|
|
|
|
|
|
|
- 68 -
| 37. |
GAINS (LOSSES) ON FINANCIAL INSTRUMENTS AT FVTPL |
| (1) |
Details of gains or losses related to financial instruments at FVTPL are as follows (Unit: Korean Won in millions): |
|
|
|
|
|
|
|
|
|
|
|
|
|
|
|
|
|
| |
|
2017 |
|
|
2016 |
|
| |
|
Three months
ended June 30 |
|
|
Six months
ended June 30 |
|
|
Three months
ended June 30 |
|
|
Six months
ended June 30 |
|
| Gains (losses) on financial instruments held for trading |
|
|
36,266 |
|
|
|
(60,186 |
) |
|
|
115,880 |
|
|
|
11,099 |
|
| Gains (losses) on financial instruments designated at FVTPL |
|
|
(24,200 |
) |
|
|
(86,223 |
) |
|
|
983 |
|
|
|
47,497 |
|
|
|
|
|
|
|
|
|
|
|
|
|
|
|
|
|
|
| Total |
|
|
12,066 |
|
|
|
(146,409 |
) |
|
|
116,863 |
|
|
|
58,596 |
|
|
|
|
|
|
|
|
|
|
|
|
|
|
|
|
|
|
| (2) |
Gains (losses) on financial instruments held for trading are as follows (Unit: Korean Won in millions): |
|
|
|
|
|
|
|
|
|
|
|
|
|
|
|
|
|
|
|
|
|
| |
|
|
|
|
|
2017 |
|
|
2016 |
|
| |
|
|
|
|
|
Three months
ended
June 30 |
|
|
Six months
ended
June 30 |
|
|
Three months
ended
June 30 |
|
|
Six months
ended
June 30 |
|
| Financial Instruments held for trading |
|
Securities |
|
Gain on valuation |
|
|
1,055 |
|
|
|
5,895 |
|
|
|
5,283 |
|
|
|
17,014 |
|
|
|
|
|
Gain on disposals |
|
|
3,936 |
|
|
|
9,860 |
|
|
|
13,418 |
|
|
|
17,986 |
|
|
|
|
|
Loss on valuation |
|
|
(2,785 |
) |
|
|
(6,511 |
) |
|
|
(1,719 |
) |
|
|
(3,351 |
) |
|
|
|
|
Loss on disposals |
|
|
(1,308 |
) |
|
|
(2,057 |
) |
|
|
(2,072 |
) |
|
|
(4,980 |
) |
|
|
|
|
|
|
|
|
|
|
|
|
|
|
|
|
|
|
|
|
|
|
|
|
|
Sub-total |
|
|
898 |
|
|
|
7,187 |
|
|
|
14,910 |
|
|
|
26,669 |
|
|
|
|
|
|
|
|
|
|
|
|
|
|
|
|
|
|
|
|
|
|
|
|
Other financial instruments |
|
Gain on valuation |
|
|
1,495 |
|
|
|
3,071 |
|
|
|
2,372 |
|
|
|
10,368 |
|
|
|
|
|
Gain on disposals |
|
|
814 |
|
|
|
933 |
|
|
|
743 |
|
|
|
1,541 |
|
|
|
|
|
Loss on valuation |
|
|
(1,971 |
) |
|
|
(3,590 |
) |
|
|
(2,555 |
) |
|
|
(10,385 |
) |
|
|
|
|
Loss on disposals |
|
|
(211 |
) |
|
|
(234 |
) |
|
|
(482 |
) |
|
|
(1,315 |
) |
|
|
|
|
|
|
|
|
|
|
|
|
|
|
|
|
|
|
|
|
|
|
|
|
|
Sub-total |
|
|
127 |
|
|
|
180 |
|
|
|
78 |
|
|
|
209 |
|
|
|
|
|
|
|
|
|
|
|
|
|
|
|
|
|
|
|
|
|
|
|
|
|
|
Total |
|
|
1,025 |
|
|
|
7,367 |
|
|
|
14,988 |
|
|
|
26,878 |
|
|
|
|
|
|
|
|
|
|
|
|
|
|
|
|
|
|
|
|
|
|
| Derivatives (for trading) |
|
Interest rates derivatives |
|
Gain on transactions and valuation |
|
|
201,637 |
|
|
|
433,349 |
|
|
|
433,958 |
|
|
|
838,309 |
|
|
|
|
|
Loss on transactions and valuation |
|
|
(198,170 |
) |
|
|
(421,734 |
) |
|
|
(445,581 |
) |
|
|
(896,992 |
) |
|
|
|
|
|
|
|
|
|
|
|
|
|
|
|
|
|
|
|
|
|
|
|
|
|
Sub-total |
|
|
3,467 |
|
|
|
11,615 |
|
|
|
(11,623 |
) |
|
|
(58,683 |
) |
|
|
|
|
|
|
|
|
|
|
|
|
|
|
|
|
|
|
|
|
|
|
|
Currencies derivatives |
|
Gain on transactions and valuation |
|
|
(94,206 |
) |
|
|
3,773,565 |
|
|
|
697,568 |
|
|
|
2,746,051 |
|
|
|
|
|
Loss on transactions and valuation |
|
|
105,055 |
|
|
|
(3,943,609 |
) |
|
|
(571,832 |
) |
|
|
(2,632,295 |
) |
|
|
|
|
|
|
|
|
|
|
|
|
|
|
|
|
|
|
|
|
|
|
|
|
|
Sub-total |
|
|
10,849 |
|
|
|
(170,044 |
) |
|
|
125,736 |
|
|
|
113,756 |
|
|
|
|
|
|
|
|
|
|
|
|
|
|
|
|
|
|
|
|
|
|
|
|
Equity derivatives |
|
Gain on transactions and valuation |
|
|
92,302 |
|
|
|
302,927 |
|
|
|
36,564 |
|
|
|
70,145 |
|
|
|
|
|
Loss on transactions and valuation |
|
|
(71,116 |
) |
|
|
(211,551 |
) |
|
|
(47,604 |
) |
|
|
(136,822 |
) |
|
|
|
|
|
|
|
|
|
|
|
|
|
|
|
|
|
|
|
|
|
|
|
|
|
Sub-total |
|
|
21,186 |
|
|
|
91,376 |
|
|
|
(11,040 |
) |
|
|
(66,677 |
) |
|
|
|
|
|
|
|
|
|
|
|
|
|
|
|
|
|
|
|
|
|
|
|
Other derivatives |
|
Gain on transactions and valuation |
|
|
2,295 |
|
|
|
12,312 |
|
|
|
10,768 |
|
|
|
18,644 |
|
|
|
|
|
Loss on transactions and valuation |
|
|
(2,556 |
) |
|
|
(12,812 |
) |
|
|
(12,949 |
) |
|
|
(22,819 |
) |
|
|
|
|
|
|
|
|
|
|
|
|
|
|
|
|
|
|
|
|
|
|
|
|
|
Sub-total |
|
|
(261 |
) |
|
|
(500 |
) |
|
|
(2,181 |
) |
|
|
(4,175 |
) |
|
|
|
|
|
|
|
|
|
|
|
|
|
|
|
|
|
|
|
|
|
|
|
|
|
Total |
|
|
35,241 |
|
|
|
(67,553 |
) |
|
|
100,892 |
|
|
|
(15,779 |
) |
|
|
|
|
|
|
|
|
|
|
|
|
|
|
|
|
|
|
|
|
|
|
|
Total |
|
|
|
|
36,266 |
|
|
|
(60,186 |
) |
|
|
115,880 |
|
|
|
11,099 |
|
|
|
|
|
|
|
|
|
|
|
|
|
|
|
|
|
|
- 69 -
| (3) |
Gains (losses) on financial instruments designated at FVTPL are as follows (Unit: Korean Won in millions): |
|
|
|
|
|
|
|
|
|
|
|
|
|
|
|
|
|
| |
|
2017 |
|
|
2016 |
|
| |
|
Three months
ended June 30 |
|
|
Six months
ended June 30 |
|
|
Three months
ended June 30 |
|
|
Six months
ended June 30 |
|
| Gain (loss) on equity-linked securities: |
|
|
|
|
|
|
|
|
|
|
|
|
|
|
|
|
| Loss on disposals of equity-linked securities |
|
|
(3,686 |
) |
|
|
(15,877 |
) |
|
|
(3,813 |
) |
|
|
(7,153 |
) |
| Gain (loss) on valuation of equity-linked securities |
|
|
(20,667 |
) |
|
|
(69,714 |
) |
|
|
3,718 |
|
|
|
52,993 |
|
|
|
|
|
|
|
|
|
|
|
|
|
|
|
|
|
|
| Sub-total |
|
|
(24,353 |
) |
|
|
(85,591 |
) |
|
|
(95 |
) |
|
|
45,840 |
|
|
|
|
|
|
|
|
|
|
|
|
|
|
|
|
|
|
| Gain (loss) on other securities: |
|
|
|
|
|
|
|
|
|
|
|
|
|
|
|
|
| Gain (loss) on valuation of other securities |
|
|
(114 |
) |
|
|
(16 |
) |
|
|
308 |
|
|
|
390 |
|
|
|
|
|
|
|
|
|
|
|
|
|
|
|
|
|
|
| Gain (loss) on other financial instruments: |
|
|
|
|
|
|
|
|
|
|
|
|
|
|
|
|
| Gain (loss) on valuation of other financial instruments |
|
|
267 |
|
|
|
(616 |
) |
|
|
770 |
|
|
|
1,267 |
|
|
|
|
|
|
|
|
|
|
|
|
|
|
|
|
|
|
| Total |
|
|
(24,200 |
) |
|
|
(86,223 |
) |
|
|
983 |
|
|
|
47,497 |
|
|
|
|
|
|
|
|
|
|
|
|
|
|
|
|
|
|
| 38. |
GAINS (LOSSES) ON AFS FINANCIAL ASSETS |
Gains (losses) on AFS financial assets are as follows (Unit:
Korean Won in millions):
|
|
|
|
|
|
|
|
|
|
|
|
|
|
|
|
|
| |
|
2017 |
|
|
2016 |
|
| |
|
Three months
ended June 30 |
|
|
Six months
ended June 30 |
|
|
Three months
ended June 30 |
|
|
Six months
ended June 30 |
|
| Gains on redemption of securities |
|
|
220 |
|
|
|
547 |
|
|
|
600 |
|
|
|
611 |
|
| Gains on transaction of securities |
|
|
95,019 |
|
|
|
116,262 |
|
|
|
23,512 |
|
|
|
36,901 |
|
| Impairment losses on securities |
|
|
(6,852 |
) |
|
|
(12,637 |
) |
|
|
(4,516 |
) |
|
|
(8,629 |
) |
|
|
|
|
|
|
|
|
|
|
|
|
|
|
|
|
|
| Total |
|
|
88,387 |
|
|
|
104,172 |
|
|
|
19,596 |
|
|
|
28,883 |
|
|
|
|
|
|
|
|
|
|
|
|
|
|
|
|
|
|
| 39. |
IMPAIRMENT LOSSES DUE TO CREDIT LOSS |
Impairment losses on loans and receivables, guarantees and loan
commitment recognized for credit loss are as follows (Unit: Korean Won in millions):
|
|
|
|
|
|
|
|
|
|
|
|
|
|
|
|
|
| |
|
2017 |
|
|
2016 |
|
| |
|
Three months
ended June 30 |
|
|
Six months
ended June 30 |
|
|
Three months
ended June 30 |
|
|
Six months
ended June 30 |
|
| Impairment losses due to credit loss |
|
|
(211,842 |
) |
|
|
(333,976 |
) |
|
|
(249,523 |
) |
|
|
(504,558 |
) |
| Reversal of provision on guarantee |
|
|
16,071 |
|
|
|
44,968 |
|
|
|
787 |
|
|
|
75,654 |
|
| Reversal of provision on (provision provided for) loan commitment |
|
|
(8,715 |
) |
|
|
5,245 |
|
|
|
(1,798 |
) |
|
|
(1,840 |
) |
|
|
|
|
|
|
|
|
|
|
|
|
|
|
|
|
|
| Total |
|
|
(204,486 |
) |
|
|
(283,763 |
) |
|
|
(250,534 |
) |
|
|
(430,744 |
) |
|
|
|
|
|
|
|
|
|
|
|
|
|
|
|
|
|
- 70 -
| 40. |
GENERAL ADMINISTRATIVE EXPENSES AND OTHER NET OPERATING INCOME (EXPENSES) |
| (1) |
General and administrative expenses recognized are as follows (Unit: Korean Won in millions): |
|
|
|
|
|
|
|
|
|
|
|
|
|
|
|
|
|
|
|
|
|
| |
|
|
|
|
|
2017 |
|
|
2016 |
|
| |
|
|
|
|
|
Three months
ended June 30 |
|
|
Six months
ended June 30 |
|
|
Three months
ended June 30 |
|
|
Six months
ended June 30 |
|
| Salaries |
|
Short term employee benefits |
|
Salaries |
|
|
326,034 |
|
|
|
654,191 |
|
|
|
312,297 |
|
|
|
634,342 |
|
|
|
|
|
Employee benefits |
|
|
114,170 |
|
|
|
213,600 |
|
|
|
97,016 |
|
|
|
183,981 |
|
|
|
Retirement benefit service costs |
|
|
36,972 |
|
|
|
74,057 |
|
|
|
38,287 |
|
|
|
77,834 |
|
|
|
Termination |
|
|
5,477 |
|
|
|
5,477 |
|
|
|
92,405 |
|
|
|
92,791 |
|
|
|
|
|
|
|
|
|
|
|
|
|
|
|
|
|
|
|
|
|
|
Sub-Total |
|
|
482,653 |
|
|
|
947,325 |
|
|
|
540,005 |
|
|
|
988,948 |
|
|
|
|
|
|
|
|
|
|
|
|
|
|
|
|
|
|
|
|
| Depreciation and amortization |
|
|
|
|
|
|
45,380 |
|
|
|
94,927 |
|
|
|
57,665 |
|
|
|
129,591 |
|
| Other general and administrative expenses |
|
Rent |
|
|
|
|
76,297 |
|
|
|
156,708 |
|
|
|
76,505 |
|
|
|
155,913 |
|
|
|
Taxes and public dues |
|
|
|
|
34,077 |
|
|
|
63,178 |
|
|
|
35,321 |
|
|
|
62,685 |
|
|
|
Service charges |
|
|
|
|
47,611 |
|
|
|
96,418 |
|
|
|
58,154 |
|
|
|
115,613 |
|
|
|
Computer and IT related |
|
|
16,089 |
|
|
|
30,477 |
|
|
|
24,627 |
|
|
|
41,816 |
|
|
|
Telephone and communication |
|
|
16,111 |
|
|
|
31,590 |
|
|
|
15,044 |
|
|
|
29,989 |
|
|
|
Operating promotion |
|
|
10,003 |
|
|
|
21,053 |
|
|
|
10,489 |
|
|
|
21,997 |
|
|
|
Advertising |
|
|
|
|
22,434 |
|
|
|
29,880 |
|
|
|
21,259 |
|
|
|
34,279 |
|
|
|
Printing |
|
|
|
|
2,095 |
|
|
|
4,237 |
|
|
|
2,747 |
|
|
|
5,013 |
|
|
|
Traveling |
|
|
|
|
2,920 |
|
|
|
6,024 |
|
|
|
2,620 |
|
|
|
5,033 |
|
|
|
Supplies |
|
|
|
|
1,517 |
|
|
|
3,117 |
|
|
|
1,619 |
|
|
|
3,142 |
|
|
|
Insurance premium |
|
|
1,956 |
|
|
|
4,169 |
|
|
|
1,805 |
|
|
|
3,599 |
|
|
|
Reimbursement |
|
|
|
|
4,710 |
|
|
|
9,177 |
|
|
|
4,920 |
|
|
|
9,036 |
|
|
|
Maintenance |
|
|
|
|
3,331 |
|
|
|
6,882 |
|
|
|
3,895 |
|
|
|
7,469 |
|
|
|
Water, light, and heating |
|
|
2,883 |
|
|
|
7,146 |
|
|
|
2,977 |
|
|
|
7,440 |
|
|
|
Vehicle maintenance |
|
|
2,602 |
|
|
|
4,964 |
|
|
|
2,429 |
|
|
|
4,693 |
|
|
|
Others |
|
|
|
|
11,488 |
|
|
|
21,155 |
|
|
|
10,028 |
|
|
|
18,296 |
|
|
|
|
|
|
|
|
|
|
|
|
|
|
|
|
|
|
|
|
|
|
|
|
Sub-total |
|
|
256,124 |
|
|
|
496,175 |
|
|
|
274,439 |
|
|
|
526,013 |
|
|
|
|
|
|
|
|
|
|
|
|
|
|
|
|
|
|
|
|
|
|
Total |
|
|
784,157 |
|
|
|
1,538,427 |
|
|
|
872,109 |
|
|
|
1,644,552 |
|
|
|
|
|
|
|
|
|
|
|
|
|
|
|
|
|
|
| (2) |
Other operating income recognized is as follows (Unit: Korean Won in millions): |
|
|
|
|
|
|
|
|
|
|
|
|
|
|
|
|
|
| |
|
2017 |
|
|
2016 |
|
| |
|
Three months
ended June 30 |
|
|
Six months
ended June 30 |
|
|
Three months
ended June 30 |
|
|
Six months
ended June 30 |
|
| Gains on transaction of foreign exchange |
|
|
619,297 |
|
|
|
1,698,987 |
|
|
|
1,123,975 |
|
|
|
2,635,300 |
|
| Gains on disposal of loans and receivables |
|
|
14,861 |
|
|
|
201,860 |
|
|
|
110,758 |
|
|
|
173,465 |
|
| Gains on transactions of derivatives |
|
|
11,592 |
|
|
|
11,656 |
|
|
|
32,596 |
|
|
|
111,505 |
|
| Gains on fair value hedged items |
|
|
(7,094 |
) |
|
|
11,860 |
|
|
|
(7,070 |
) |
|
|
18,113 |
|
| Others (*) |
|
|
5,813 |
|
|
|
68,668 |
|
|
|
10,015 |
|
|
|
59,925 |
|
|
|
|
|
|
|
|
|
|
|
|
|
|
|
|
|
|
| Total |
|
|
644,469 |
|
|
|
1,993,031 |
|
|
|
1,270,274 |
|
|
|
2,998,308 |
|
|
|
|
|
|
|
|
|
|
|
|
|
|
|
|
|
|
| (*) |
Other income includes such income amounting to 28,800 million Won and 47,363 million Won for the six months ended June 30, 2017 and 2016, respectively, that the Group recognized for it is to receive from
other creditor financial institutions in accordance with the creditor financial institutions committee agreement. |
- 71 -
| (3) |
Other operating expenses recognized are as follows (Unit: Korean Won in millions): |
|
|
|
|
|
|
|
|
|
|
|
|
|
|
|
|
|
| |
|
2017 |
|
|
2016 |
|
| |
|
Three months
ended June 30 |
|
|
Six months
ended June 30 |
|
|
Three months
ended June 30 |
|
|
Six months
ended June 30 |
|
| Losses on transactions of foreign exchange |
|
|
534,740 |
|
|
|
1,374,764 |
|
|
|
1,178,863 |
|
|
|
2,592,193 |
|
| KDIC deposit insurance fees |
|
|
77,146 |
|
|
|
150,256 |
|
|
|
73,474 |
|
|
|
144,501 |
|
| Contribution to miscellaneous funds |
|
|
71,927 |
|
|
|
144,262 |
|
|
|
75,845 |
|
|
|
150,943 |
|
| Losses(Gains) on disposals of loans and receivables |
|
|
(40 |
) |
|
|
28 |
|
|
|
— |
|
|
|
5 |
|
| Losses(gains) related to derivatives |
|
|
(16,441 |
) |
|
|
31,131 |
|
|
|
(6,557 |
) |
|
|
19,014 |
|
| Losses on fair value hedged items |
|
|
15,820 |
|
|
|
15,846 |
|
|
|
32,450 |
|
|
|
118,700 |
|
| Others (*) |
|
|
38,584 |
|
|
|
75,554 |
|
|
|
71,615 |
|
|
|
113,195 |
|
|
|
|
|
|
|
|
|
|
|
|
|
|
|
|
|
|
| Total |
|
|
721,736 |
|
|
|
1,791,841 |
|
|
|
1,425,690 |
|
|
|
3,138,551 |
|
|
|
|
|
|
|
|
|
|
|
|
|
|
|
|
|
|
| (*) |
Other expense includes such expenses amounting to 3,325 million Won and 92,375 million Won for the six months ended June 30, 2017 and 2016, respectively, that the Group recognized for it is to carry out a
payment to other creditor financial institutions in accordance with the creditor financial institutions committee agreement. |
| 41. |
OTHER NON-OPERATING INCOME (EXPENSES) |
| (1) |
Details of gain or loss on valuation of investments in joint ventures and associates are as follows (Unit: Korean Won in millions): |
|
|
|
|
|
|
|
|
|
|
|
|
|
|
|
|
|
| |
|
2017 |
|
|
2016 |
|
| |
|
Three months
ended June 30 |
|
|
Six months
ended June 30 |
|
|
Three months
ended June 30 |
|
|
Six months
ended June 30 |
|
| Gain on valuation |
|
|
(10,061 |
) |
|
|
3,316 |
|
|
|
1,570 |
|
|
|
8,272 |
|
| Loss on valuation |
|
|
521 |
|
|
|
(62,271 |
) |
|
|
(8,519 |
) |
|
|
(15,271 |
) |
| Impairment loss |
|
|
(5,323 |
) |
|
|
(5,323 |
) |
|
|
(4,645 |
) |
|
|
(4,645 |
) |
|
|
|
|
|
|
|
|
|
|
|
|
|
|
|
|
|
| Total |
|
|
(14,863 |
) |
|
|
(64,278 |
) |
|
|
(11,594 |
) |
|
|
(11,644 |
) |
|
|
|
|
|
|
|
|
|
|
|
|
|
|
|
|
|
| (2) |
Other non-operating income and expenses recognized are as follows (Unit: Korean Won in millions): |
|
|
|
|
|
|
|
|
|
|
|
|
|
|
|
|
|
| |
|
2017 |
|
|
2016 |
|
| |
|
Three months
ended June 30 |
|
|
Six months
ended June 30 |
|
|
Three months
ended June 30 |
|
|
Six months
ended June 30 |
|
| Other non-operating incomes |
|
|
30,411 |
|
|
|
77,185 |
|
|
|
21,993 |
|
|
|
61,969 |
|
| Other non-operating expenses |
|
|
(18,714 |
) |
|
|
(67,187 |
) |
|
|
(57,488 |
) |
|
|
(88,307 |
) |
|
|
|
|
|
|
|
|
|
|
|
|
|
|
|
|
|
| Total |
|
|
11,697 |
|
|
|
9,998 |
|
|
|
(35,495 |
) |
|
|
(26,338 |
) |
|
|
|
|
|
|
|
|
|
|
|
|
|
|
|
|
|
- 72 -
| (3) |
Other non-operating income recognized are as follows (Unit: Korean Won in millions): |
|
|
|
|
|
|
|
|
|
|
|
|
|
|
|
|
|
| |
|
2017 |
|
|
2016 |
|
| |
|
Three months
ended June 30 |
|
|
Six months
ended June 30 |
|
|
Three months
ended June 30 |
|
|
Six months
ended June 30 |
|
| Rental fee income |
|
|
1,880 |
|
|
|
3,700 |
|
|
|
1,833 |
|
|
|
3,733 |
|
| Gains on disposal of investments in joint ventures and associates |
|
|
4,466 |
|
|
|
32,886 |
|
|
|
— |
|
|
|
1,199 |
|
| Gains on disposal of premises and equipment, intangible assets and other assets |
|
|
1,494 |
|
|
|
1,675 |
|
|
|
130 |
|
|
|
347 |
|
| Reversal of impairment loss of premises and equipment, intangible assets and other assets |
|
|
— |
|
|
|
32 |
|
|
|
200 |
|
|
|
2,585 |
|
| Others |
|
|
22,571 |
|
|
|
38,892 |
|
|
|
19,830 |
|
|
|
54,105 |
|
|
|
|
|
|
|
|
|
|
|
|
|
|
|
|
|
|
| Total |
|
|
30,411 |
|
|
|
77,185 |
|
|
|
21,993 |
|
|
|
61,969 |
|
|
|
|
|
|
|
|
|
|
|
|
|
|
|
|
|
|
| (4) |
Other non-operating expenses recognized are as follows (Unit: Korean Won in millions): |
|
|
|
|
|
|
|
|
|
|
|
|
|
|
|
|
|
| |
|
2017 |
|
|
2016 |
|
| |
|
Three months
ended June 30 |
|
|
Six months
ended June 30 |
|
|
Three months
ended June 30 |
|
|
Six months
ended June 30 |
|
| Depreciation on investment properties |
|
|
992 |
|
|
|
1,991 |
|
|
|
951 |
|
|
|
1,860 |
|
| Interest expense of rent leasehold deposits |
|
|
105 |
|
|
|
223 |
|
|
|
127 |
|
|
|
254 |
|
| Losses on disposal of investment in joint ventures and associates |
|
|
46 |
|
|
|
27,730 |
|
|
|
15,060 |
|
|
|
15,060 |
|
| Losses on disposal of premises and equipment, intangible assets and other assets |
|
|
271 |
|
|
|
608 |
|
|
|
4,157 |
|
|
|
5,887 |
|
| Impairment losses of premises and equipment, intangible assets and other assets |
|
|
40 |
|
|
|
160 |
|
|
|
315 |
|
|
|
343 |
|
| Donation |
|
|
10,426 |
|
|
|
14,980 |
|
|
|
18,714 |
|
|
|
33,917 |
|
| Others |
|
|
6,834 |
|
|
|
21,495 |
|
|
|
18,164 |
|
|
|
30,986 |
|
|
|
|
|
|
|
|
|
|
|
|
|
|
|
|
|
|
| Total |
|
|
18,714 |
|
|
|
67,187 |
|
|
|
57,488 |
|
|
|
88,307 |
|
|
|
|
|
|
|
|
|
|
|
|
|
|
|
|
|
|
- 73 -
| (1) |
Details of income tax expenses are as follows (Unit: Korean Won in millions): |
|
|
|
|
|
|
|
|
|
| |
|
For the six months ended June 30 |
|
| |
|
2017 |
|
|
2016 |
|
| Current tax expense |
|
|
|
|
|
|
|
|
| Current tax expense in respect of the current period |
|
|
284,030 |
|
|
|
83,665 |
|
| Adjustments recognized in the current period in relation to the current tax of prior
periods |
|
|
(4,919 |
) |
|
|
(22,043 |
) |
|
|
|
|
|
|
|
|
|
| Sub-total |
|
|
279,111 |
|
|
|
61,622 |
|
|
|
|
|
|
|
|
|
|
| Deferred tax expense |
|
|
|
|
|
|
|
|
| Deferred tax expense (benefit) relating to the origination and reversal of temporary
differences |
|
|
13,889 |
|
|
|
92,232 |
|
| Deferred tax charged direct to equity |
|
|
27,933 |
|
|
|
(520 |
) |
|
|
|
|
|
|
|
|
|
| Sub-total |
|
|
41,822 |
|
|
|
91,712 |
|
|
|
|
|
|
|
|
|
|
| Income tax expense |
|
|
320,933 |
|
|
|
153,334 |
|
|
|
|
|
|
|
|
|
|
| (2) |
Details of income tax expense can be reconciled to net income before income tax expense as follows (Unit: Korean Won in millions): |
|
|
|
|
|
|
|
|
|
| |
|
For the six months ended June 30 |
|
| |
|
2017 |
|
|
2016 |
|
| Net income before income tax expense |
|
|
1,429,948 |
|
|
|
911,121 |
|
| Tax calculated at statutory tax rate (*) |
|
|
345,585 |
|
|
|
220,029 |
|
| Adjustments |
|
|
|
|
|
|
|
|
| Effect of income that is exempt from taxation |
|
|
(32,683 |
) |
|
|
(38,662 |
) |
| Effect of expense that is not deductible in determining taxable profit |
|
|
9,624 |
|
|
|
10,553 |
|
| Adjustments recognized in the current period in relation to the current tax of prior
periods |
|
|
(4,919 |
) |
|
|
(22,043 |
) |
| Others |
|
|
3,326 |
|
|
|
(16,543 |
) |
|
|
|
|
|
|
|
|
|
| Sub-total |
|
|
(24,652 |
) |
|
|
(66,695 |
) |
|
|
|
|
|
|
|
|
|
| Income tax expense |
|
|
320,933 |
|
|
|
153,334 |
|
|
|
|
|
|
|
|
|
|
| Effective tax rate |
|
|
22.4 |
% |
|
|
16.8 |
% |
| (*) |
The corporate tax rate is 11 % up to 200 million Won in tax basis, 22 % over 200 million Won to 20 billion Won and 24.2 % over 20 billion Won. |
| (3) |
Details of accumulated deferred tax charged direct to equity are as follows (Unit: Korean Won in millions): |
|
|
|
|
|
|
|
|
|
| |
|
June 30, 2017 |
|
|
December 31, 2016 |
|
| Loss on valuation of AFS securities |
|
|
(107,454 |
) |
|
|
(113,161 |
) |
| Share of other comprehensive income of joint ventures and associates |
|
|
419 |
|
|
|
950 |
|
| Foreign currency translation of foreign operations |
|
|
36,176 |
|
|
|
16,930 |
|
| Remeasurements gain related to defined benefit plan |
|
|
54,686 |
|
|
|
51,661 |
|
| Gain on valuation of cash flow hedge |
|
|
487 |
|
|
|
— |
|
|
|
|
|
|
|
|
|
|
| Total |
|
|
(15,686 |
) |
|
|
(43,620 |
) |
|
|
|
|
|
|
|
|
|
- 74 -
| 43. |
EARNINGS PER SHARE (“EPS”) |
Basic EPS is calculated by dividing net income by weighted average
number of common shares outstanding (Unit: Korean Won in millions except for EPS and number of shares):
|
|
|
|
|
|
|
|
|
|
|
|
|
|
|
|
|
| |
|
2017 |
|
|
2016 |
|
| |
|
Three months
ended June 30 |
|
|
Six months
ended June 30 |
|
|
Three months
ended June 30 |
|
|
Six months
ended June 30 |
|
| Net income attributable to common shareholders |
|
|
460,888 |
|
|
|
1,098,361 |
|
|
|
306,974 |
|
|
|
750,266 |
|
| Dividends to hybrid securities |
|
|
(41,557 |
) |
|
|
(90,823 |
) |
|
|
(49,751 |
) |
|
|
(100,236 |
) |
| Net income attributable to common shareholders |
|
|
419,331 |
|
|
|
1,007,538 |
|
|
|
257,223 |
|
|
|
650,030 |
|
| Weighted average number of common shares outstanding |
|
|
673 shares in
million |
|
|
|
673 shares in
million |
|
|
|
673 shares in
million |
|
|
|
673 shares in
million |
|
| Basic earnings per share |
|
|
623 |
|
|
|
1,497 |
|
|
|
382 |
|
|
|
966 |
|
Diluted EPS is equal to basic EPS because there is no dilution effect for the six months ended June 30,
2017 and 2016.
| 44. |
CONTINGENT LIABILITIES AND COMMITMENTS |
| (1) |
Details of guarantees are as follows (Unit: Korean Won in millions): |
|
|
|
|
|
|
|
|
|
| |
|
June 30, 2017 |
|
|
December 31, 2016 |
|
| Confirmed guarantees |
|
|
|
|
|
|
|
|
| Guarantee for loans |
|
|
91,649 |
|
|
|
79,566 |
|
| Acceptances |
|
|
410,732 |
|
|
|
504,354 |
|
| Guarantees in acceptances of imported goods |
|
|
107,065 |
|
|
|
97,606 |
|
| Other confirmed guarantees |
|
|
6,701,772 |
|
|
|
7,588,661 |
|
|
|
|
|
|
|
|
|
|
| Total |
|
|
7,311,218 |
|
|
|
8,270,187 |
|
|
|
|
|
|
|
|
|
|
| Unconfirmed guarantees |
|
|
|
|
|
|
|
|
| Local letter of credit |
|
|
403,660 |
|
|
|
397,588 |
|
| Letter of credit |
|
|
3,510,846 |
|
|
|
3,844,345 |
|
| Other unconfirmed guarantees |
|
|
584,120 |
|
|
|
859,768 |
|
|
|
|
|
|
|
|
|
|
| Total |
|
|
4,498,626 |
|
|
|
5,101,701 |
|
|
|
|
|
|
|
|
|
|
| Commercial paper purchase commitments and others |
|
|
1,350,566 |
|
|
|
1,389,896 |
|
| (2) |
Details of loan commitments and others are as follows (Unit: Korean Won in millions): |
|
|
|
|
|
|
|
|
|
| |
|
June 30, 2017 |
|
|
December 31, 2016 |
|
| Loan commitments |
|
|
81,601,017 |
|
|
|
83,795,496 |
|
| Other commitments |
|
|
5,619,110 |
|
|
|
4,840,593 |
|
| |
1) |
The Group had filed lawsuits as follows (Unit: Korean Won in millions except for number of cases): |
|
|
|
|
|
|
|
|
|
|
|
|
|
|
|
|
|
| |
|
June 30, 2017 |
|
|
December 31, 2016 |
|
| |
|
As plaintiff |
|
|
As defendant |
|
|
As plaintiff |
|
|
As defendant |
|
| Number of cases |
|
|
75 cases |
|
|
|
176 cases |
|
|
|
88 cases |
|
|
|
175 cases |
|
| Amount of litigation |
|
|
440,298 |
|
|
|
337,925 |
|
|
|
308,848 |
|
|
|
246,465 |
|
| Provisions for litigations |
|
|
|
|
|
|
5,927 |
|
|
|
|
|
|
|
5,946 |
|
- 75 -
The Group operates Korean Won currency settlement service as for commercial trade
settlements between Korea and Iran. In accordance with the submission request of information from U.S. prosecutors (U.S. Federal Prosecutors and Prosecutors of the New York State), the Group is currently performing its own internal investigation to
confirm if the Group has met the requirements on sanction of U.S. Government in respect of its service operation. As of June 30, 2017, the Group believes that it cannot make reasonable estimation due to possible results from such investigation.
| 45. |
RELATED PARTY TRANSACTIONS |
Related parties of the Group as of June 30, 2017 and its assets and
liabilities recognized as of June 30, 2017 and December 31, 2016 and major transactions with related parties for the six months ended June 30, 2017 and 2016 are as follows:
|
|
|
| |
|
Related parties |
| Associates |
|
Kumho Tires Co., Inc., Woori Blackstone Korea Opportunity Private Equity Fund No.1, Woori Service Networks Co., Ltd., Korea Credit Bureau Co., Ltd., Korea Finance Security Co., Ltd., Chin Hung International Inc., Poonglim Industrial
Co., Ltd., STX Engine Co., Ltd., Samho International Co., Ltd., STX Corporation, Woori Columbus 1st Private Equity Fund, 2016KIF-IMM Woori Bank Technology Venture Fund, K BANK Co.,Ltd., and Others (Dongwoo
C & C Co., Ltd. and other 18 associates) |
| (2) |
Assets and liabilities from transactions with related parties are as follows (Unit: Korean Won in millions): |
|
|
|
|
|
|
|
|
|
|
|
|
|
| Related party |
|
A title of account |
|
June 30,
2017 |
|
|
December 31,
2016 |
|
| Corporation that have significant influence over the group |
|
KDIC (*1) |
|
Loans |
|
|
— |
|
|
|
9 |
|
| |
|
Other assets |
|
|
— |
|
|
|
270,041 |
|
| |
|
Deposits due to customers |
|
|
— |
|
|
|
1,894,631 |
|
| |
|
Other liabilities |
|
|
— |
|
|
|
15,568 |
|
| Associates |
|
Kumho Tires Co., Ltd. |
|
Loans |
|
|
226,031 |
|
|
|
299,523 |
|
|
|
|
|
Allowance for credit loss |
|
|
(1,757 |
) |
|
|
(715 |
) |
|
|
|
Deposits due to customers |
|
|
12,742 |
|
|
|
45,957 |
|
|
|
|
Other liabilities |
|
|
353 |
|
|
|
50 |
|
|
|
Woori Blackstone Korea Opportunity Private Equity Fund No.1 |
|
Other assets |
|
|
15 |
|
|
|
34 |
|
|
|
|
|
Other liabilities |
|
|
306 |
|
|
|
306 |
|
|
|
Woori Service Networks Co., Ltd. |
|
Loans |
|
|
29 |
|
|
|
29 |
|
|
|
|
Deposits due to customers |
|
|
1,832 |
|
|
|
2,572 |
|
|
|
|
Other liabilities |
|
|
361 |
|
|
|
393 |
|
|
|
Korea Credit Bureau Co., Ltd. |
|
Loans |
|
|
5 |
|
|
|
2 |
|
|
|
|
Deposits due to customers |
|
|
5,218 |
|
|
|
5,069 |
|
|
|
|
Other liabilities |
|
|
29 |
|
|
|
40 |
|
|
|
Korea Finance Security Co., Ltd. |
|
Loans |
|
|
36 |
|
|
|
55 |
|
|
|
|
Deposits due to customers |
|
|
2,320 |
|
|
|
2,801 |
|
|
|
|
Other liabilities |
|
|
2 |
|
|
|
6 |
|
|
|
Chin Hung International Inc. |
|
Loans |
|
|
148 |
|
|
|
4,320 |
|
|
|
|
Allowance for credit loss |
|
|
(17 |
) |
|
|
(4,287 |
) |
|
|
|
Deposits due to customers |
|
|
56,765 |
|
|
|
14,047 |
|
|
|
|
|
Other liabilities |
|
|
19 |
|
|
|
279 |
|
- 76 -
|
|
|
|
|
|
|
|
|
|
|
|
|
| Related party |
|
A title of account |
|
June 30,
2017 |
|
|
December 31,
2016 |
|
| Associates |
|
Poonglim Industrial Co., Ltd. |
|
Deposits due to customers |
|
|
4 |
|
|
|
283 |
|
|
|
STX Engine Co., Ltd. |
|
Loans |
|
|
104,990 |
|
|
|
107,974 |
|
|
|
|
|
Allowance for credit loss |
|
|
(87,696 |
) |
|
|
(89,531 |
) |
|
|
|
|
Deposits due to customers |
|
|
19,559 |
|
|
|
13,260 |
|
|
|
|
|
Other liabilities |
|
|
424 |
|
|
|
588 |
|
|
|
Samho International Co., Ltd. |
|
Loans |
|
|
35,059 |
|
|
|
37,327 |
|
|
|
|
|
Allowance for credit loss |
|
|
(601 |
) |
|
|
(717 |
) |
|
|
|
|
Deposits due to customers |
|
|
61,179 |
|
|
|
82,917 |
|
|
|
|
|
Other liabilities |
|
|
155 |
|
|
|
216 |
|
|
|
STX Corporation |
|
Loans |
|
|
51,489 |
|
|
|
144,035 |
|
|
|
|
|
Allowance for credit loss |
|
|
(33,136 |
) |
|
|
(92,643 |
) |
|
|
|
Deposits due to customers |
|
|
13,938 |
|
|
|
14,412 |
|
|
|
|
|
Other liabilities |
|
|
68 |
|
|
|
90 |
|
|
|
K BANK Co.,Ltd. |
|
Loans |
|
|
273 |
|
|
|
— |
|
|
|
|
|
Other assets |
|
|
— |
|
|
|
325 |
|
|
|
Others (*2) |
|
Loans |
|
|
242 |
|
|
|
619 |
|
|
|
|
|
Allowance for credit loss |
|
|
(242 |
) |
|
|
(253 |
) |
|
|
|
|
Other assets |
|
|
2 |
|
|
|
8 |
|
|
|
|
|
Deposits due to customers |
|
|
2,691 |
|
|
|
4,460 |
|
|
|
|
|
Other liabilities |
|
|
69 |
|
|
|
60 |
|
| (*1) |
As its ownership interest in the Group is lower than 20% as of June 30, 2017, it has been excluded from the corporation that have significant influence over the Group. |
| (*2) |
Others include Saman Corporation, Kyesan Engineering Co., Ltd., Hyunwoo International Co., Ltd.,DAEA SNC Co. Ltd. and others. |
| (3) |
Gain or loss from transactions with related parties are as follows (Unit: Korean Won in millions): |
|
|
|
|
|
|
|
|
|
|
|
|
|
| |
|
|
|
|
|
For the six months ended
June 30 |
|
| Related party |
|
A title of account |
|
2017 |
|
|
2016 |
|
| Corporation that has significant influence over the group |
|
KDIC(*1) |
|
Interest income |
|
|
— |
|
|
|
6,721 |
|
| |
|
Interest expenses |
|
|
15,331 |
|
|
|
9,123 |
|
| Associates |
|
Kumho Tires Co., Ltd. |
|
Interest income |
|
|
1,501 |
|
|
|
1,341 |
|
|
|
|
Fees income |
|
|
6 |
|
|
|
6 |
|
|
|
|
Interest expenses |
|
|
— |
|
|
|
37 |
|
|
|
|
Impairment losses due to credit loss |
|
|
1,042 |
|
|
|
64 |
|
|
|
Woori Blackstone Korea Opportunity No.1 Private Equity Fund |
|
Fees income |
|
|
29 |
|
|
|
94 |
|
|
|
|
|
|
|
|
Woori Service Networks Co., Ltd. |
|
Other income |
|
|
15 |
|
|
|
15 |
|
|
|
|
Interest expenses |
|
|
13 |
|
|
|
27 |
|
|
|
|
Fees expenses |
|
|
335 |
|
|
|
443 |
|
|
|
|
Other expenses |
|
|
249 |
|
|
|
111 |
|
|
|
Korea Credit Bureau Co., Ltd. |
|
Interest expenses |
|
|
38 |
|
|
|
78 |
|
|
|
|
|
Fees expenses |
|
|
1,023 |
|
|
|
875 |
|
- 77 -
|
|
|
|
|
|
|
|
|
|
|
|
|
| |
|
|
|
|
|
For the six months ended
June 30 |
|
| Related party |
|
A title of account |
|
2016 |
|
|
2015 |
|
| Associates |
|
Korea Finance Security Co., Ltd. |
|
Interest expenses |
|
|
5 |
|
|
|
5 |
|
| |
|
Fees expenses |
|
|
— |
|
|
|
53 |
|
|
|
Chin Hung International Inc. |
|
Interest income |
|
|
53 |
|
|
|
139 |
|
|
|
|
|
Fees income |
|
|
1 |
|
|
|
1 |
|
|
|
|
|
Interest expenses |
|
|
13 |
|
|
|
12 |
|
|
|
|
|
Reversal of impairment losses due to credit loss |
|
|
(4,270 |
) |
|
|
(1,039 |
) |
|
|
Poonglim Industrial Co., Ltd. |
|
Interest expenses |
|
|
— |
|
|
|
2 |
|
|
|
|
|
Reversal of impairment losses due to credit loss |
|
|
— |
|
|
|
(37 |
) |
|
|
STX Engine Co., Ltd. |
|
Interest income |
|
|
672 |
|
|
|
674 |
|
|
|
|
|
Fees income |
|
|
28 |
|
|
|
20 |
|
|
|
|
|
Interest expenses |
|
|
72 |
|
|
|
30 |
|
|
|
|
|
Impairment losses due to credit loss (reversal) |
|
|
(1,835 |
) |
|
|
1,254 |
|
|
|
Samho International Co., Ltd. |
|
Interest income |
|
|
364 |
|
|
|
457 |
|
|
|
|
|
Fees income |
|
|
6 |
|
|
|
5 |
|
|
|
|
Interest expenses |
|
|
214 |
|
|
|
250 |
|
|
|
|
Reversal of impairment losses due to credit loss |
|
|
(116 |
) |
|
|
(482 |
) |
|
|
Force TEC Co., Ltd. (*1) |
|
Interest income |
|
|
— |
|
|
|
123 |
|
|
|
|
|
Impairment losses due to credit loss |
|
|
— |
|
|
|
22,620 |
|
|
|
STX Corporation |
|
Interest income |
|
|
219 |
|
|
|
562 |
|
|
|
|
|
Fees income |
|
|
58 |
|
|
|
60 |
|
|
|
|
Interest expenses |
|
|
4 |
|
|
|
4 |
|
|
|
|
Impairment losses due to credit loss (reversal) |
|
|
(59,507 |
) |
|
|
73,387 |
|
|
|
Osung LST Co., Ltd. (*2) |
|
Interest income |
|
|
— |
|
|
|
113 |
|
|
|
|
|
Interest expenses |
|
|
— |
|
|
|
1 |
|
|
|
Woori Columbus 1st Private Equity Fund |
|
Fees income |
|
|
— |
|
|
|
272 |
|
|
|
K BANK Co., Ltd. (*3) |
|
Fees income |
|
|
396 |
|
|
|
— |
|
|
|
|
|
Other income |
|
|
1,051 |
|
|
|
— |
|
|
|
Others (*4) |
|
Interest expenses |
|
|
5 |
|
|
|
7 |
|
|
|
|
Reversal of impairment losses due to credit loss |
|
|
(10 |
) |
|
|
(938 |
) |
| (*1) |
As its ownership interest in the Group is lower than 20% as of June 30, 2017, it has been excluded from the corporation that have significant influence over the Group. |
| (*2) |
Due to disposition during the year ended December 31, 2016, the entity is not in scope for associate. |
| (*3) |
Due to capital contribution during the year ended December 31, 2016, the entity has been included in the investment in associates. |
| (*4) |
Others include Saman Corporation, Kyesan Engineering Co., Ltd., Hyunwoo International Co., Ltd.DAEA SNC Co. Ltd. and others. |
- 78 -
| (4) |
Guarantees provided to the related parties are as follows (Unit: Korean Won in millions): |
|
|
|
|
|
|
|
|
|
|
|
| |
|
June 30, 2017 |
|
|
December 31, 2016 |
|
|
|
| KDIC (*) |
|
|
— |
|
|
|
1,500,000 |
|
|
Loan commitment |
| Kumho Tires Co., Inc. |
|
|
8,379 |
|
|
|
24,187 |
|
|
Letter of credit and others |
|
|
|
191,106 |
|
|
|
126,435 |
|
|
Loan commitment |
| Korea Finance Security Co., Ltd. |
|
|
224 |
|
|
|
205 |
|
|
Loan commitment |
| Korea Credit Bureau Co., Ltd. |
|
|
30 |
|
|
|
33 |
|
|
Loan commitment |
| Woori Service Networks Co., Ltd. |
|
|
171 |
|
|
|
171 |
|
|
Loan commitment |
| Chin Hung International Inc. |
|
|
32,151 |
|
|
|
40,904 |
|
|
Loan commitment |
| STX Engine Co., Ltd. |
|
|
67,922 |
|
|
|
63,103 |
|
|
Letter of credit and others |
|
|
|
413 |
|
|
|
685 |
|
|
Loan commitment |
| SamHo Co., Ltd. |
|
|
32,852 |
|
|
|
30,083 |
|
|
Loan commitment |
| STX corporation |
|
|
22,717 |
|
|
|
24,316 |
|
|
Letter of credit and others |
|
|
|
— |
|
|
|
71 |
|
|
Loan commitment |
| (*) |
As its ownership interest in the Group is lower than 20% as of June 30, 2017, it has been excluded from the corporation that have significant influence over the Group. |
For the guarantee provided to the related parties, the Group recognized provisions for guarantees amounting to 73,025 million Won and
70,587 million Won, as of June 30, 2017 and December 31, 2016, respectively.
| (5) |
Compensation for key management is as follows (Unit: Korean Won in millions): |
|
|
|
|
|
|
|
|
|
| |
|
For the six months ended June 30 |
|
| |
|
2017 |
|
|
2016 (*) |
|
| Short term benefits |
|
|
6,524 |
|
|
|
4,281 |
|
| Severance payments |
|
|
280 |
|
|
|
186 |
|
|
|
|
|
|
|
|
|
|
| Total |
|
|
6,804 |
|
|
|
4,467 |
|
|
|
|
|
|
|
|
|
|
| (*) |
As the scope of the compensation for key management disclosure has changed, the comparative amounts are restated. |
Key management includes registered executives and non-registered executives. Outstanding assets and liabilities from
transactions with key management amount to 1,261 million Won and 5,816 million Won, respectively, as of June 30, 2017. With respect to the assets, the Group has not recognized any allowance, nor provision.
- 79 -
| (1) |
Trust accounts of the Group are as follows (Unit: Korean Won in millions): |
|
|
|
|
|
|
|
|
|
|
|
|
|
|
|
|
|
|
|
|
|
|
|
|
|
| |
|
Total assets |
|
|
Operating income |
|
| |
|
June 30, 2017 |
|
|
December 31, 2016 |
|
|
2017 |
|
|
2016 |
|
| |
|
|
|
Three months
ended June 30 |
|
|
Six months
ended June 30 |
|
|
Three months
ended June 30 |
|
|
Six months
ended June 30 |
|
| Trust accounts |
|
|
44,170,992 |
|
|
|
38,807,666 |
|
|
|
213,300 |
|
|
|
416,316 |
|
|
|
236,978 |
|
|
|
426,189 |
|
| (2) |
Receivables and payables from the transactions between the Group and trust accounts are as follows (Unit: Korean Won in millions): |
|
|
|
|
|
|
|
|
|
| |
|
June 30, 2017 |
|
|
December 31, 2016 |
|
| Receivables |
|
|
|
|
|
|
|
|
| Trust fees receivables |
|
|
25,769 |
|
|
|
23,667 |
|
|
|
|
|
|
|
|
|
|
| Payables |
|
|
|
|
|
|
|
|
| Deposits due to customers |
|
|
1,063,675 |
|
|
|
1,919,324 |
|
| Borrowings from trust accounts |
|
|
2,960,810 |
|
|
|
2,687,776 |
|
|
|
|
|
|
|
|
|
|
| Sub-total |
|
|
4,204,485 |
|
|
|
4,607,100 |
|
|
|
|
|
|
|
|
|
|
| (3) |
Significant transactions between the Group and trust accounts are as follows (Unit: Korean Won in millions): |
|
|
|
|
|
|
|
|
|
|
|
|
|
|
|
|
|
| |
|
2017 |
|
|
2016 |
|
| |
|
Three months
ended June 30 |
|
|
Six months
ended June 30 |
|
|
Three months
ended June 30 |
|
|
Six months
ended June 30 |
|
| Revenue |
|
|
|
|
|
|
|
|
|
|
|
|
|
|
|
|
| Trust fees |
|
|
30,472 |
|
|
|
65,207 |
|
|
|
19,069 |
|
|
|
33,277 |
|
|
|
|
|
|
|
|
|
|
|
|
|
|
|
|
|
|
| Expense |
|
|
|
|
|
|
|
|
|
|
|
|
|
|
|
|
| Interest expenses on deposits due to customers |
|
|
5,257 |
|
|
|
12,400 |
|
|
|
11,249 |
|
|
|
24,539 |
|
| Interest expenses on borrowings from trust accounts |
|
|
7,569 |
|
|
|
15,686 |
|
|
|
12,204 |
|
|
|
25,320 |
|
|
|
|
|
|
|
|
|
|
|
|
|
|
|
|
|
|
| Sub-total |
|
|
12,826 |
|
|
|
28,086 |
|
|
|
23,453 |
|
|
|
49,859 |
|
|
|
|
|
|
|
|
|
|
|
|
|
|
|
|
|
|
| (4) |
Principal guaranteed trusts and principal and fixed rate of return guaranteed trusts |
| |
1) |
As of June 30, 2017 and December 31, 2016, the carrying of principal guaranteed trusts and principal and fixed rate of return guaranteed trusts are as follows (Unit: Korean Won in millions): |
|
|
|
|
|
|
|
|
|
| |
|
June 30, 2017 |
|
|
December 31, 2016 |
|
| Principal guaranteed trusts |
|
|
|
|
|
|
|
|
| Old-age pension trusts |
|
|
4,313 |
|
|
|
4,513 |
|
| Personal pension trusts |
|
|
529,455 |
|
|
|
532,959 |
|
| Pension trusts |
|
|
766,951 |
|
|
|
741,759 |
|
| Retirement trusts |
|
|
51,612 |
|
|
|
53,773 |
|
| New personal pension trusts |
|
|
8,337 |
|
|
|
8,536 |
|
| New old-age pension trusts |
|
|
2,671 |
|
|
|
2,919 |
|
|
|
|
|
|
|
|
|
|
| Sub-total |
|
|
1,363,339 |
|
|
|
1,344,459 |
|
|
|
|
|
|
|
|
|
|
| Principal and fixed rate of return guaranteed trusts |
|
|
|
|
|
|
|
|
| Development trusts |
|
|
19 |
|
|
|
19 |
|
| Unspecified money trusts |
|
|
793 |
|
|
|
787 |
|
|
|
|
|
|
|
|
|
|
| Sub-total |
|
|
812 |
|
|
|
806 |
|
|
|
|
|
|
|
|
|
|
| Total |
|
|
1,364,151 |
|
|
|
1,345,265 |
|
|
|
|
|
|
|
|
|
|
- 80 -
| |
2) |
As of June 30, 2017 and December 31, 2016, the amounts that the Group has to pay by the capital guaranteed contract or the operating results of the principal and return guaranteed trusts are as follows (Unit:
Korean Won in millions): |
|
|
|
|
|
|
|
|
|
| |
|
June 30, 2017 |
|
|
December 31, 2016 |
|
| Liabilities for the account (subsidy for trust account adjustment) |
|
|
16 |
|
|
|
30 |
|
| 47. |
PROMOTING PRIVATIZATION PLAN |
Pursuant to the privatization plan of Woori Finance Holdings Co., Ltd.,
which was decided at the Public Fund Oversight Committee (the “PFOC”) on June 26, 2013, the Group has disposed of its subsidiaries. Kwangju Bank and Kyongnam Bank were demerged as of May 1, 2014, and Woori Investment &
Securities, Woori Aviva Life Insurance, Woori Savings Bank, Woori Asset Management, Woori Financial and Woori F&I were disposed of in due order during the period from March 2014 to June 2014.
With respect to the privatization of Woori Bank, the PFOC announced a plan on the merger between Woori Finance Holdings Co., Ltd (“Holding Company”)
and Woori Bank and on the disposal of controlling and non-controlling interests (30% of ownership and 26.97% of ownership, respectively) of Woori Bank after newly listing its shares on the stock exchange.
Pursuant to the plan, the Group merged with the Holding Company as of November 1, 2014, and was listed on Korea Stock Exchange on November 19, 2014.
On November 28, 2014, Korea Deposit Insurance Corporation (“KDIC”) commenced the bidding to dispose of controlling and non-controlling interests of the Group. With the successful bidding for non-controlling interests only, KDIC’s ownership of the Group decreased from 56.97% to 51.04%.
Further, KDIC’s ownership of the Group was changed to 51.06% due to retirement of treasury stocks on October 2015.
On July 21, 2015, the PFOC,
a deliberative body in charge of privatizing Woori Bank, held a meeting to discuss the means to promote the privatization plan. PFOC thereby announced a plan to maximize the retrieval of public fund that was initially invested and to sell the
controlling shares to the investors (“oligopolistic shareholders”), in an effort to promote the early privatization and development of financial industry.
On October 2, 2015, Financial Services Commission (“FSC”) announced the amendment on normalization of business memorandum of understanding
(“MOU”) in an effort to promote corporate value through enhanced managerial autonomy of the Group. FSC subsequently made amendments to the Enforcement Decree of the Special Act on the Management of Public Funds on March 29, 2016.
In addition, on August 22, 2016, PFOC announced a plan to sell about 30% shares out of 51.06% shares held by KDIC to multiple investors, ranging from 4
to 8% ownership each. Pursuant to the plan, the KDIC commenced the bidding to dispose of its shares by putting up a public notice of sale on August 24, 2016. As of September 23, 2016, KDIC received letters of intent from eighteen potential
investors, with an intent to hold shares ranging from 82% to 119%. As a result of the bid, eight potential investors submitted bid letters for total of 33.7% shares. On November 13, PFOC announced that seven selected buyers acquired total of
29.69% shares of the Group. Upon successful privatization of the Bank, PFOC, in an effort to ensure autonomous management of the private sector (i.e., oligopolistic shareholders), released the bank from the MOU on December 16, 2016.
By the way, for the six months ended June 30, 2017, as 2.41% of call options was exercised out of total 2.97% call options granted to the selected buyers
when selling the non-controlling interest, KDIC’s remaining ownership interest became 18.96%. In consideration with the benefits from privatization and the retrieval of public fund, the government will
hold a discussion with PFOC on its plan to sell the remaining shares of the Bank held by KDIC in the near future.
- 81 -
| 48. |
TERMINATION OF CONTRACT AND FOLLOW-UP AGREEMENT ON THE IMPLEMENTATION OF A MANAGEMENT PLAN |
Upon successful privatization, the MOU on management normalization between the Group and KDIC on December 16, 2016 was terminated. The same parties
instead signed a written agreement on disposal of shares of the Group for the purpose of the appropriate public fund management. According to the agreement, KDIC has the right to appoint one personnel from KDIC as a
non-executive member of the board of directors of the Group, as long as KDIC holds over 10% voting shares, or is the largest shareholder (disregarding National Pension Service) holding more than 4% but less
than 10% shares. Also, KDIC may claim inspection of the information related to the minutes of the board of directors and agenda that may have significant impact on the residual shares, as long as KDIC holds over 4% shares of the Group.
| 49. |
EVENTS AFTER REPORTING PERIODS. |
The Group decided to execute a voluntary retirement plan during the six
months ended December 31, 2017 through the agreement between labor and management. According to this plan, the related expense will be expected to incur during three months ended September 30, 2017.
- 82 -