UNITED STATES SECURITIES AND EXCHANGE COMMISSION
Washington, D.C. 20549
FORM 10-K
OR
Commission File Number 001-34257
(Exact name of registrant as specified in its charter)
(State or other jurisdiction of incorporation or organization) | (I.R.S Employer Identification No.) | |
(Address of principal executive offices) (Zip Code) | ||
Registrant's telephone number, including area code: (319 ) 399-5700
Securities Registered Pursuant to Section 12(b) of the Act:
Title of each class | Trading Symbol | Name of each exchange on which registered |
Securities Registered Pursuant to Section 12(g) of the Act: None
Indicate by check mark if the registrant is a well-known seasoned issuer, as defined in Rule 405 of the Securities Act. Yes ☒ No ☐
Indicate by check mark if the registrant is not required to file reports pursuant to Section 13 or Section 15(d) of the Act. Yes ☐ No ☒
Indicate by check mark whether the registrant (1) has filed all reports required to be filed by Section 13 or 15(d) of the Securities Exchange Act of 1934 during the preceding 12 months (or for such shorter period that the registrant was required to file such reports), and (2) has been subject to such filing requirements for the past 90 days. Yes ☒ No ☐
Indicate by check mark whether the registrant has submitted electronically every Interactive Data File required to be submitted pursuant to Rule 405 of Regulation S-T (§232.405 of this chapter) during the preceding 12 months (or for such shorter period that the registrant was required to submit such files). Yes ☒ No ☐
Indicate by check mark whether the registrant is a large accelerated filer, an accelerated filer, a non-accelerated filer, smaller reporting company, or an emerging growth company. See the definitions of "large accelerated filer," "accelerated filer", "smaller reporting company", and "emerging growth company" in Rule 12b-2 of the Exchange Act
☒ | Accelerated filer | ☐ | Non-accelerated filer | ☐ | Smaller reporting company | ||
Emerging growth company | |||||||
If an emerging growth company, indicate by check mark if the registrant has elected not to use the extended transition period for complying with any new or revised financial accounting standards provided pursuant to Section 13(a) of the Exchange Act. ☐
Indicate by check mark whether the registrant is a shell company (as defined in Rule 12b-2 of the Act). Yes ☐ No ☒
The aggregate market value of voting stock held by non-affiliates of the registrant as of June 30, 2019 was approximately $1.0 billion. For purposes of this calculation, all directors and executive officers of the registrant are considered affiliates. As of February 26, 2020, 25,051,170 shares of common stock were outstanding.
DOCUMENTS INCORPORATED BY REFERENCE
Part III of this Form 10-K incorporates by reference certain information from the registrant's definitive proxy statement to be filed with the Securities and Exchange Commission pursuant to Regulation 14A of the Securities Exchange Act of 1934, as amended, for its annual shareholder meeting to be held on May 20, 2020.
FORM 10-K TABLE OF CONTENTS
Page | |
FORWARD-LOOKING INFORMATION
This report may contain forward-looking statements about our operations, anticipated performance and other similar matters. The Private Securities Litigation Reform Act of 1995 provides a safe harbor under the Securities Act of 1933 (the "Securities Act") and the Securities Exchange Act of 1934, as amended (the "Exchange Act"), for forward-looking statements. The forward-looking statements are not historical facts and involve risks and uncertainties that could cause actual results to differ from those expected and/or projected. Such forward-looking statements are based on current expectations, estimates, forecasts and projections about United Fire Group, Inc. ("UFG," the "Registrant," the "Company," "we," "us," or "our"), the industry in which we operate, and beliefs and assumptions made by management. Words such as "expect(s)," "anticipate(s)," "intend(s)," "plan(s)," "believe(s)," "continue(s)," "seek(s)," "estimate(s)," "goal(s)," "target(s)," "forecast(s)," "project(s)," "predict(s)," "should," "could," "may," "will," "might," "hope," "can" and other words and terms of similar meaning or expression in connection with a discussion of future operations, financial performance or financial condition, are intended to identify forward-looking statements. See Part I, Item 1A "Risk Factors" of this report for more information concerning factors that could cause actual results to differ materially from those in the forward-looking statements.
Risks and uncertainties that may affect the actual financial condition and results of the Company include but are not limited to the following:
• | The frequency and severity of claims, including those related to catastrophe losses and the impact those claims have on our loss reserve adequacy; the occurrence of catastrophic events, including international events, significant severe weather conditions, climate change, acts of terrorism, acts of war and pandemics; |
• | The adequacy of our reserves for property and casualty insurance losses and loss settlement expenses; |
• | Geographic concentration risk in our property and casualty insurance business; |
• | The potential disruption of our operations and reputation due to unauthorized data access, cyber attacks or cyber-terrorism and other security breaches; |
• | Developments in general economic conditions, domestic and global financial markets, interest rates and other-than-temporary impairment losses that could affect the performance of our investment portfolio; |
• | Litigation or regulatory actions that could require us to pay significant damages, fines or penalties or change the way we do business; |
• | Our ability to effectively underwrite and adequately price insured risks; |
• | Changes in industry trends, an increase in competition and significant industry developments; |
• | Lowering of one or more of the financial strength ratings of our operating subsidiaries or our issuer credit ratings and the adverse impact such action may have on our premium writings, policy retention, profitability and liquidity; |
• | Governmental actions, policies and regulations, including, but not limited to, domestic health care reform, financial services regulatory reform, corporate governance, new laws or regulations or court decisions interpreting existing laws and regulations or policy provisions; changes in laws, regulations and stock exchange requirements relating to corporate governance and the cost of compliance; |
• | Our relationship with and the financial strength of our reinsurers; and |
• | Competitive, legal, regulatory or tax changes that affect the distribution cost or demand for our products through our independent agent/agency distribution network. |
These are representative of the risks, uncertainties, and assumptions that could cause actual outcomes and results to differ materially from what is expressed in forward-looking statements. Readers are cautioned not to place undue reliance on these forward-looking statements, which speak only as of the date of this report or as of the date they are made. Except as required under the federal securities laws and the rules and regulations of the Securities and Exchange Commission ("SEC"), we do not have any intention or obligation to update publicly any forward-looking statements, whether as a result of new information, future events, or otherwise.
1
PART I.
ITEM 1. BUSINESS
GENERAL DESCRIPTION
United Fire Group, Inc. ("UFG", "United Fire", the "Registrant", the "Company", "we", "us", or "our") and its consolidated subsidiaries and affiliates are engaged in the business of writing property and casualty insurance through a network of independent agencies. Our insurance company subsidiaries are currently licensed as a property and casualty insurer in 46 states, plus the District of Columbia. United Fire & Casualty Company was incorporated in Iowa in January 1946. Our principal executive office is located at 118 Second Avenue SE, Cedar Rapids, Iowa 52401; telephone: 319-399-5700.
United Fire Group, Inc. owns 100 percent of one subsidiary, United Fire & Casualty Company. United Fire & Casualty Company owns 100 percent of seven subsidiaries: (1) Addison Insurance Company; (2) Lafayette Insurance Company; (3) United Fire & Indemnity Company; (4) Mercer Insurance Company; (5) Financial Pacific Insurance Company; (6) UFG Specialty Insurance Company; and (7) United Real Estate Holdings Company, LLC. Mercer Insurance Company owns 100 percent of two subsidiaries: (1) Franklin Insurance Company; and (2) Mercer Insurance Company of New Jersey, Inc. United Fire Lloyds is an affiliate of United Fire & Indemnity Company.
Reportable Segments and Discontinued Operations
We have historically reported our operations in two business segments: property and casualty insurance and life insurance. On September 18, 2017, the Company signed a definitive agreement to sell its subsidiary, United Life Insurance Company ("United Life"), to Kuvare US Holdings, Inc. ("Kuvare") and on March 30, 2018, the sale closed. As a result, our life insurance business, previously a separate segment, was considered held for sale and reported as discontinued operations in the Consolidated Statements of Income and Comprehensive Income and Consolidated Statements of Cash Flows. Subsequent to the announcement of this sale, our continuing operations were reported as one business segment. For more information, refer to Note 17 "Discontinued Operations" contained in Part II, Item 8, "Financial Statements and Supplementary Data." Additionally, for a detailed discussion of our operating results by continuing operations and discontinued operations, refer to the "Results of Operations for the Years Ended December 31, 2019, 2018 and 2017" section in Part II, Item 7, "Management's Discussion and Analysis of Financial Condition and Results of Operations."
Our property and casualty insurance business is comprised of commercial lines insurance, including surety bonds, personal lines insurance and assumed reinsurance. All of our property and casualty insurance subsidiaries and our affiliate belong to an intercompany reinsurance pooling arrangement. Pooling arrangements permit the participating companies to rely on the capacity of the entire pool's capital and surplus, rather than being limited to policy exposures of a size commensurate with each participant's own surplus level. Under such arrangements, the members share substantially all of the insurance business that is written and allocate the combined premiums, losses and expenses based on percentages defined in the arrangement.
Employees
As of December 31, 2019, we employed 1,173 full-time employees and 12 part-time employees. We are not a party to any collective bargaining agreement.
Available Information
We provide free and timely access to all our reports filed with the SEC in the Investor Relations section of our website at www.ufginsurance.com. Under the "Investors" tab, select "Financial Documents" and then, select "SEC Filings" to view the list of our SEC filings, which includes annual reports on Form 10-K, quarterly reports on Form 10-Q, current reports on Form 8-K, proxy statements, beneficial ownership reports on Forms 3, 4 and 5 and amendments to reports filed or furnished pursuant to Section 13(a), 15(d) or 16(a) of the Exchange Act. Such reports are made available as soon as reasonably practicable after they are filed with or furnished to the SEC. They are also available on the SEC's website at www.sec.gov.
Our Code of Ethics and Business Conduct is also available at www.ufginsurance.com in the Investor Relations section. To view it, under the "Investors" tab, select "Overview," then "Governance Documents" and then "Code of Ethics and Business Conduct."
2
Free paper copies of any materials that we file with or furnish to the SEC can also be obtained by writing to Investor Relations, United Fire Group, Inc., 118 Second Avenue SE, Cedar Rapids, Iowa 52401.
MARKETING AND DISTRIBUTION
We market our products through our home office in Cedar Rapids, Iowa, and five regional offices: (1) Westminster, Colorado, a suburb of Denver; (2) Webster, Texas, a suburb of Houston; (3) Pennington, New Jersey; (4) Phoenix, Arizona; and (5) Rocklin, California. We are represented through approximately 1,000 independent property and casualty agencies.
Property and Casualty Insurance Business
We staff our regional offices with underwriting, claims and marketing representatives and administrative technicians, all of whom provide support and assistance to the independent agencies. Also, home office staff technicians and specialists provide support to our subsidiaries, regional offices and independent agencies. We use management reports to monitor subsidiary and regional offices for overall results and conformity to our business policies.
Competition
The property and casualty insurance industry is highly competitive. We compete with numerous property and casualty insurance companies in the regional and national market, many of which are substantially larger and have considerably greater financial and other resources. Except for regulatory considerations, there are limited barriers to entry into the insurance industry. Our competitors may be domestic or foreign, as well as licensed or unlicensed. The exact number of competitors within the industry is not known. Insurers compete on the basis of reliability, financial strength and stability, ratings, underwriting consistency, service, business ethics, price, performance, capacity, policy terms and coverage conditions.
In addition, because our products are marketed exclusively through independent insurance agencies, most of which represent more than one company, we face competition within each agency and competition to retain qualified independent agents. Our competitors include companies that market their products through agents, as well as companies that sell insurance directly to their customers.
Because we rely solely on independent agencies, we offer a competitive commissions program and a rewarding profit-sharing plan as incentives for agents to place high-quality property and casualty insurance business with us. Property and casualty insurance agencies will receive profit-sharing payments of $19.6 million in 2020, based on profitable business produced by the agencies in 2019. In 2019 for 2018 business, agencies received $21.4 million in profit-sharing payments and in 2018 for 2017 business, agencies received $15.1 million in payments.
Our competitive advantages include our commitment to:
• | Strong agency relationships — |
◦ | A stable workforce, with an average duration of employment of approximately 9.6 years, allows our agents to work with the same, highly-experienced personnel each day. |
◦ | Our organization is relatively flat, allowing our agents to be close to the highest levels of management and ensuring that our agents will receive answers quickly to their questions. |
• | Exceptional service — our agents and policyholders always have the option to speak with a real person. |
• | Fair and prompt claims handling — we view claims as an opportunity to prove to our customers that they have chosen the right insurance company. |
• | Disciplined underwriting — we empower our underwriters with the knowledge and tools needed to make good decisions for the Company. |
• | Superior loss control services — our loss control representatives make multiple visits to businesses and job sites each year to ensure safety. |
3
• | Effective and efficient use of technology — we use technology to provide enhanced service to our agents and policyholders, not to replace our personal relationships, but to reinforce them. |
REINSURANCE
Incorporated by reference from Note 4 "Reinsurance" contained in Part II, Item 8, "Financial Statements and Supplementary Data."
RESERVES
Property and Casualty Insurance Business
Property insurance indemnifies an insured with an interest in physical property for loss of, or damage to, such property or the loss of its income-producing abilities. Casualty insurance primarily covers liability for damage to property of, or injury to, a person or entity other than the insured. In most cases, casualty insurance also obligates the insurance company to provide a defense for the insured in litigation, arising out of events covered by the policy.
Liabilities for loss and loss settlement expenses reflect management's best estimates at a given point in time of what we expect to pay for claims that have been reported and those that have been incurred but not reported ("IBNR"), based on known facts, circumstances, and historical trends.
The determination of reserves (particularly those relating to liability lines of insurance that have relatively longer lag in claim reporting) requires significant work to reasonably project expected future claim reporting and payment patterns. If, during the course of our regular monitoring of reserves, we determine that coverages previously written are incurring higher than expected losses, we will take action that may include, among other things, increasing the related reserves. Any adjustments we make to reserves are reflected in operating results in the year in which we make those adjustments. We engage an independent actuary, Regnier Consulting Group, Inc. ("Regnier"), to render an opinion as to the reasonableness of our statutory reserves annually. The actuarial opinion is filed in those states where we are licensed.
On a quarterly basis, United Fire's internal actuary performs a detailed actuarial review of IBNR reserves. This review includes a comparison of results from the most recent analysis of reserves completed by both our internal and external actuaries. Senior management meets with our internal actuary to review, on a quarterly basis, the adequacy of carried reserves based on results from this actuarial analysis. There are two fundamental types or sources of IBNR reserves. We record IBNR reserves for "normal" types of claims and also specific IBNR reserves related to unique circumstances or events. A major hurricane is an example of an event that might necessitate establishing specific IBNR reserves because an analysis of existing historical data would not provide an appropriate estimate.
We do not discount loss reserves based on the time value of money.
For a more detailed discussion of our loss reserves, refer to the "Critical Accounting Policies" section in Part II, Item 7, "Management's Discussion and Analysis of Financial Condition and Results of Operations" and Note 5 "Reserves for Losses and Loss Settlement Expenses" contained in Part II, Item 8, "Financial Statements and Supplementary Data."
INVESTMENTS
Incorporated by reference from Part II, Item 7, "Management's Discussion and Analysis of Financial Condition and Results of Operations," under the headings "Investments," "Market Risk" and "Critical Accounting Policies"; and Note 1 "Summary of Significant Accounting Policies" under the headings "Investments," Note 2 "Summary of Investments," and Note 3 "Fair Value of Financial Instruments," contained in Part II, Item 8, "Financial Statements and Supplementary Data."
REGULATION
The insurance industry is subject to comprehensive and detailed regulation and supervision. Each jurisdiction in which we operate has established supervisory agencies with broad administrative powers. While we are not aware of any currently proposed or recently enacted state or federal regulation that would have a material impact on our operations, we cannot predict the effect that future regulatory changes might have on us.
4
State Regulation
We are subject to extensive regulation, primarily at the state level. The method, extent and substance of such regulation varies by state, but generally has its source in National Association of Insurance Commissioners ("NAIC") model laws and regulations that establish standards and requirements for conducting the business of insurance and that delegate regulatory authority to a state regulatory agency. Moreover, the NAIC Accreditation Program requires state regulatory agencies to meet baseline standards of solvency regulation, particularly with respect to regulation of multi-state insurers. In general, such regulation is intended for the protection of those who purchase or use our insurance products, and not our shareholders. These rules have a substantial effect on our business and relate to a wide variety of matters including: insurance company licensing and examination; the licensing of insurance agents and adjusters; price setting or premium rates; trade practices; approval of policy forms; claims practices; restrictions on transactions between our subsidiaries and their affiliates, including the payment of dividends; investments; underwriting standards; advertising and marketing practices; capital adequacy; and the collection, remittance and reporting of certain taxes, licenses and fees.
The state laws and regulations that have the most significant effect on our insurance operations and financial reporting are discussed below.
Insurance Holding Company Regulation
We are regulated as an insurance holding company system in the states of domicile of our property and casualty insurance companies: Iowa (United Fire & Casualty Company, UFG Specialty Insurance Company and Addison Insurance Company), California (Financial Pacific Insurance Company), Louisiana (Lafayette Insurance Company), New Jersey (Mercer Insurance Company of New Jersey, Inc.), Pennsylvania (Mercer Insurance Company and Franklin Insurance Company) and Texas (United Fire & Indemnity Company and United Fire Lloyds). These regulations require that we annually furnish financial and other information about the operations of the individual companies within our holding company system. Generally, the insurance laws of these states provide that notice to the state insurance commissioner is required before finalizing any transaction affecting the ownership or control of an insurer and before finalizing certain material transactions between an insurer and any person or entity within its holding company system. In addition, some of those transactions cannot be finalized without the commissioner's prior approval.
Most states have now adopted the version of the Model Insurance Holding Company System Regulation Act and Regulation as amended by the NAIC in December 2010 (the "Amended Model Act") to introduce the concept of "enterprise risk" within an insurance company holding system. Enterprise risk is defined as any activity, circumstance, event or series of events involving one or more affiliates of an insurer that, if not remedied promptly, is likely to have a material adverse effect upon the financial condition or the liquidity of the insurer or its insurance holding company system as a whole. The Amended Model Act imposes more extensive informational requirements on us, including requiring us to prepare an annual enterprise risk report that identifies the material risks within our insurance company holding system that could pose enterprise risk to our licensed insurers.
Restrictions on Shareholder Dividends
As an insurance holding company with no independent operations or source of revenue, our capacity to pay dividends to our shareholders is based on the ability of our insurance company subsidiaries to pay dividends to us. The ability of our subsidiaries to pay dividends to us is regulated by the laws of their state of domicile. Under these laws, insurance companies must provide advance informational notice to the domicile state insurance regulatory authority prior to payment of any dividend or distribution to its shareholders. Prior approval from the state insurance regulatory authority must be obtained before payment of an "extraordinary dividend" as defined under the state's insurance code. The amount of ordinary dividends that may be paid to us is subject to certain limitations, the amounts of which change each year. In all cases, we may pay dividends only from our earned surplus. Refer to Part II, Item 5, "Market for Registrant's Common Equity, Related Shareholder Matters and Issuer Purchases of Equity Securities" under the heading "Dividends" and Note 6 "Statutory Reporting, Capital Requirements and Dividends and Retained Earnings Restrictions," contained in Part II, Item 8, "Financial Statements and Supplementary Data" for additional information about the dividends we paid during 2019.
5
Price Regulation
Nearly all states have insurance laws requiring us to file rate schedules, policy or coverage forms, and other information with the state's regulatory authority. In certain states, rate schedules, policy forms, or both, must be approved prior to use. While insurance laws vary from state to state, their objectives are generally the same: an insurance rate cannot be excessive, inadequate or unfairly discriminatory. The speed with which we can change our rates in response to competition or in response to increasing costs depends, in part, on the willingness of state regulators to allow adequate rates for the business we write.
Investment Regulation
We are subject to various state regulations requiring investment portfolio diversification and limiting the concentration of investments we may maintain in certain asset categories. Failure to comply with these regulations leads to the treatment of nonconforming investments as non-admitted assets for purposes of measuring statutory surplus. Further, in some instances, state regulations require us to sell certain nonconforming investments.
Exiting Geographic Markets; Canceling and Non-renewing Policies
Most states regulate our ability to exit a market. For example, states limit, to varying degrees, our ability to cancel and non-renew insurance policies. Some states prohibit us from withdrawing one or more types of insurance business from the state, except upon prior regulatory approval. Regulations that limit policy cancellation and non-renewal may restrict our ability to exit unprofitable markets.
Insurance Guaranty Associations
Each state has insurance guaranty association laws. Membership in a state's insurance guaranty association is generally mandatory for insurers wishing to do business in that state. Under these laws, associations may assess their members for certain obligations that insolvent insurance companies have incurred with regard to their policyholders and claimants.
Typically, states assess each solvent association member with an amount related to that member's proportionate share of business written by all association members within the state. Most state guaranty associations allow solvent insurers to recoup the assessments they are charged through future rate increases, surcharges or premium tax credits. However, there is no assurance that we will ultimately recover these assessments. We cannot predict the amount and timing of any future assessments or refunds under these laws.
Shared Market and Joint Underwriting Plans
State insurance regulations often require insurers to participate in assigned risk plans, reinsurance facilities and joint underwriting associations. These are mechanisms that generally provide applicants with various types of basic insurance coverage that may not otherwise be available to them through voluntary markets. Such mechanisms are most commonly instituted for automobile and workers' compensation insurance, but many states also mandate participation in Fair Access to Insurance Requirements Plans or Windstorm Plans, which provide basic property coverage. Participation is based upon the amount of a company's voluntary market share in a particular state for the classes of insurance involved. Policies written through these mechanisms may require different underwriting standards and may pose greater risk than those written through our voluntary application process.
Statutory Accounting Rules
For public reporting, insurance companies prepare financial statements in accordance with GAAP. However, state laws require us to calculate and report certain data according to statutory accounting rules as defined in the NAIC Accounting Practices and Procedures Manual. While not a substitute for any GAAP measure of performance, statutory data frequently is used by industry analysts and other recognized reporting sources to facilitate comparisons of the performance of insurance companies.
Insurance Reserves
State insurance laws require that insurance companies analyze the adequacy of their reserves annually. Our appointed actuaries must submit an opinion that our statutory reserves are adequate to meet policy claims-paying obligations and related expenses.
6
Financial Solvency Ratios
The NAIC annually calculates 13 financial ratios to assist state insurance regulators in monitoring the financial condition of insurance companies. A "usual range" of results for each of these ratios is used by insurance regulators as a benchmark. Departure from the usual range on four or more of the ratios could lead to inquiries from individual state insurance departments as to certain aspects of a company's business. In addition to the financial ratios, states also require us to calculate a minimum capital requirement for each of our insurance companies based on individual company insurance risk factors. These "risk-based capital" results are used by state insurance regulators to identify companies that require regulatory attention or the initiation of regulatory action. At December 31, 2019, all of our insurance companies had capital in excess of the required levels.
Federal Regulation
Although the federal government and its regulatory agencies generally do not directly regulate the business of insurance, federal initiatives and legislation often have an impact on our business. These initiatives and legislation include tort reform proposals, proposals addressing natural catastrophe exposures, terrorism risk mechanisms, federal financial services reforms, various tax proposals affecting insurance companies, and possible regulatory limitations, impositions and restrictions arising from the Dodd-Frank Wall Street Reform and Consumer Protection Act ("Dodd-Frank"), and the Patient Protection and Affordable Care Act.
Various legislative and regulatory efforts to reform the tort liability system have impacted and will continue to impact our industry. Although there has been some tort reform with positive impact to the insurance industry, new causes of action and theories of damages continue to be proposed in state court actions or by federal or state legislatures that continue to expand liability for insurers and their policyholders. For example, some state legislatures have from time-to-time considered legislation addressing direct actions against insurers related to bad faith claims. As a result of this unpredictability in the law, insurance underwriting is expected to continue to be difficult in commercial lines, professional liability and other specialty coverages.
Dodd-Frank expanded the federal presence in insurance oversight and may increase regulatory requirements that are applicable to us. Dodd-Frank's requirements include streamlining the state-based regulation of reinsurance and non-admitted insurance (property or casualty insurance placed with insurers that are eligible to accept insurance, but are not licensed to write insurance in a particular state). Dodd-Frank also established the Federal Insurance Office within the U.S. Department of the Treasury that is authorized to, among other things, gather data and information to monitor aspects of the insurance industry, identify issues in the regulation of insurers about insurance matters, and preempt state insurance measures under certain circumstances.
Dodd-Frank also contains a number of provisions related to corporate governance and disclosure matters. In response to Dodd-Frank, the SEC has adopted or proposed rules regarding director independence, director and officer hedging activities, executive compensation clawback policies, compensation advisor independence, pay versus performance disclosures, internal pay equity disclosures, and shareholder proxy access. We continue to monitor developments under Dodd-Frank and their impact on us, insurers of similar size and the insurance industry as a whole.
FINANCIAL STRENGTH AND ISSUER CREDIT RATING
Our financial strength, as measured by statutory accounting principles, is regularly reviewed by an independent rating agency that assigns a rating based upon criteria such as results of operations, capital resources and minimum policyholders' surplus requirements. An insurer's financial strength rating is one of the primary factors evaluated by those in the market to purchase insurance. A poor rating indicates that there is an increased likelihood that the insurer could become insolvent and therefore not able to fulfill its obligations under the insurance policies it issues. This rating can also affect an insurer's level of premium writings, the lines of business it can write and, for insurers like us that are also public registrants, the market value of its securities.
Our property and casualty insurers are rated by A.M. Best Company, Inc. ("A.M. Best") on a group basis. Our pooled property and casualty insurers have all received an "A" (Excellent) financial strength rating from A.M. Best. According to A.M. Best, companies rated "A" have "an excellent ability to meet their ongoing obligations to policyholders."
7
A.M. Best also assigns issuer credit ratings based on a company's ability to repay its debts. All of our property and casualty insurers have received an issuer credit rating of "a" from A.M. Best. Beginning in 2012, our holding company parent was also rated by A.M. Best, receiving an issuer credit rating of "bbb."
INFORMATION ABOUT OUR EXECUTIVE OFFICERS
The following table sets forth information concerning the following executive officers:
Name | Age | Position |
Randy A. Ramlo | 58 | President and Chief Executive Officer |
Michael T. Wilkins | 56 | Executive Vice President and Chief Operating Officer |
Dawn M. Jaffray | 53 | Executive Vice President and Chief Financial Officer |
Barrie W. Ernst | 65 | Vice President and Chief Investment Officer |
Neal R. Scharmer | 63 | Vice President, General Counsel and Corporate Secretary |
A brief description of the business experience of these officers follows:
Randy A. Ramlo became our President and Chief Executive Officer in May 2007. He previously served as our Chief Operating Officer from May 2006 until May 2007, as Executive Vice President from May 2004 until May 2007, and as Vice President, Fidelity and Surety, from November 2001 until May 2004. He also worked as an underwriting manager in our Great Lakes region. Mr. Ramlo began his employment with us as an underwriter in 1984.
Michael T. Wilkins became our Executive Vice President and Chief Operating Officer in May 2014. He served as our Executive Vice President, Corporate Administration, from May 2007 to May 2014. He was our Senior Vice President, Corporate Administration, from May 2004 until May 2007, our Vice President, Corporate Administration, from August 2002 until May 2004 and the resident Vice President in our Lincoln regional office from 1998 until 2002. Prior to 1998, Mr. Wilkins held various other positions within the Company since joining us in 1985.
Dawn M. Jaffray became our Senior Vice President and Chief Financial Officer in May 2015. In May 2019, Ms. Jaffray was promoted to Executive Vice President and Chief Financial Officer. Ms. Jaffray previously served as Chief Financial Officer of Soleil Advisory Group, a consulting firm specializing in operational consulting, mergers and acquisitions, investment and strategy from 2009 to 2015. Prior to her service with Soleil Advisory Group, Ms. Jaffray held numerous positions in insurance operations and mergers/acquisition activities, primarily in the role of principal financial officer. Ms. Jaffray's business experience has been focused in particular on insurance, finance and capital management.
Barrie W. Ernst is our Vice President and Chief Investment Officer. He joined us in August 2002. Previously, Mr. Ernst served as Senior Vice President of SCI Financial Group in Cedar Rapids, Iowa, where he worked from 1980 to 2002. SCI Financial Group was a regional financial services firm providing brokerage, insurance and related services to its clients.
Neal R. Scharmer was appointed our Vice President and General Counsel in May 2001 and Corporate Secretary in May 2006. He joined us in 1995.
8
ITEM 1A. RISK FACTORS
We provide readers with the following discussion of risks and uncertainties relevant to our business. These are factors that we believe could cause our actual results to differ materially from our historic or anticipated results. We could also be adversely affected by other factors, in addition to those listed here. Additional information concerning factors that could cause actual results to differ materially from those contained in the forward-looking statements is set forth in Part II, Item 7, "Management's Discussion and Analysis of Financial Condition and Results of Operations."
Risks Relating to Our Business
The occurrence, frequency and severity of catastrophe losses are unpredictable and may adversely affect our results of operations, liquidity and financial condition.
Our property and casualty insurance operations expose us to claims arising from catastrophic events affecting multiple policyholders. Such catastrophic events consist of various natural disasters, including, but not limited to, hurricanes, tornadoes, windstorms, hailstorms, fires and wildfires, earthquakes, severe winter weather, tropical storms, volcanic eruptions and man-made disasters such as terrorist acts (including biological, chemical or radiological events), explosions, infrastructure failures and results from political instability. We have exposure to tropical storms and hurricanes along the Gulf Coast, Eastern and Southeastern coasts of the United States. We have exposure to tornadoes, windstorms and hail storms throughout the United States. We have exposure to earthquakes along the West Coast and the New Madrid Fault area. Our automobile and inland marine business also exposes us to losses arising from floods and other perils.
Property damage resulting from catastrophes is the greatest risk of loss we face in the ordinary course of our business. We have exposure to catastrophe losses under both our commercial insurance policies and our personal insurance policies. The losses from catastrophic events are a function of both the extent of our exposure, the frequency and severity of the events themselves and the level of reinsurance assumed and ceded. For example, the losses experienced from a tornado will vary on whether the location of the tornado was in a highly populated or unpopulated area, the concentration of insureds in that area and the severity of the tornado. Increases in the value and geographic concentration of insured property and the effects of inflation could increase the severity of claims from a catastrophic event.
Long-term weather trends may be changing and new types of catastrophe losses may be developing due to climate change, which is a phenomenon that has been associated with extreme weather events linked to rising temperatures, including effects on global weather patterns, greenhouse gases, sea, land and air temperature, sea levels, rain and snow. Such changes in climate conditions could cause our underlying modeling data to be less accurate, limiting our ability to evaluate and manage our risk. Climate change adds to the unpredictability, frequency and severity of natural disasters and creates additional uncertainty as to future trends and exposures. We cannot predict the impact that changing climate conditions may have on our results of operations, nor can we predict how any legal, regulatory or social responses to concerns about climate change may impact our business.
In addition, as with catastrophe losses generally, it can take a long time for us to determine our ultimate losses associated with a particular catastrophic event. The inability to access portions of the impacted area, the complexity of the losses, legal and regulatory uncertainty and the nature of the information available for certain catastrophic events may affect our ability to estimate the claims and claim adjustment expense reserves. Such complex factors include, but are not limited to: determining the cause of the damage, evaluating general liability exposures, estimating additional living expenses, the impact of demand surge, infrastructure disruption, fraud, business interruption costs and reinsurance collectability.
The timing of a catastrophic occurrence at the end or near the end of a reporting period may also affect the information available to us when estimating claims and claim adjustment expense reserves for the reporting period. As our claims experience for a particular catastrophe develops, we may be required to adjust our reserves to reflect our revised estimates of the total cost of claims. However, because the occurrence and severity of catastrophes are inherently unpredictable and may vary significantly from year to year and region to region, historical results of operations may not be indicative of future results of operations.
9
Catastrophes may reduce our net income, cause substantial volatility in our financial results for any fiscal quarter or year or otherwise adversely affect our financial condition, liquidity or results of operations. Catastrophes may also negatively affect our ability to write new business.
Following catastrophes there are also sometimes legislative, administrative and judicial decisions that seek to expand insurance coverage for claims beyond the original intent of the policies or seek to prevent the application of deductibles. Our ability to manage catastrophic exposure may be limited by public policy considerations, the political environment, changes in the general economic climate and/or social responsibilities.
Our reserves for property and casualty insurance losses and loss settlement expenses are based on estimates and may be inadequate, adversely impacting our financial results.
We maintain insurance reserves to cover our estimated ultimate unpaid liability for claim and claim adjustment expenses, including the estimated cost of the claims adjustment process, for reported and unreported claims and for future policy benefits. Our reserves may prove to be inadequate, which may result in future charges to earnings and/or a downgrade of our financial strength rating or the financial strength ratings of our insurance company subsidiaries.
Insurance reserves represent our best estimate at a given point in time. They are not an exact calculation of liability but instead are complex estimates, which are a product of actuarial expertise and projection techniques from a number of assumptions and expectations about future events, many of which are highly uncertain.
The process of estimating claims and claims adjustment expense reserves involves a high degree of judgment. These estimates are based on historical data and the impact of various factors such as:
• | actuarial and statistical projections of the cost of settlement and administration of claims reflecting facts and circumstances then known; |
• | historical claims information and loss emergence patterns; |
• | assessments of currently available data; |
• | estimates of future trends in claims severity and frequency; |
• | judicial theories of liability; |
• | economic factors such as inflation; |
• | estimates and assumptions regarding social, judicial and legislative trends, and actions such as class action lawsuits and judicial interpretation of coverages or policy exclusions; and |
• | the level of insurance fraud. |
Many of these factors are not quantifiable. The inherent uncertainties of estimating reserves are greater for certain types of liabilities, particularly those in which the various considerations affecting the type of claim are subject to change and in which long periods of time may elapse before a definitive determination of liability is made. Reserve estimates are continually refined in a regular and ongoing process as experience develops and further claims are reported and settled.
Along with other insurers, we use internal and external models in assessing our exposure to catastrophe losses that assume various conditions and probability scenarios; however, these models do not necessarily accurately predict future losses or accurately measure losses currently incurred. Models for catastrophes use historical information about various catastrophes and details about our in-force business. While we use this information in our pricing and risk managements, there are limitations with respect to their usefulness in predicting losses in any reporting period. Such limitations lead to questionable predictive capability and post-event measurements that have not been well understood or proved to be sufficiently reliable. In addition, the models are not necessarily reflective of our state-specific policy language, demand surge for labor and materials or loss settlement expenses, all of which are subject to wide variation.
Actual loss and loss settlement expenses paid might exceed our reserves. If our loss reserves are insufficient, or if we believe our loss reserves are insufficient to cover our actual loss and loss settlement expenses, we will have to increase our loss reserves and incur charges to our earnings, which could indicate that premium levels were
10
insufficient. As such, deviations from one or more of these assumptions could result in a material adverse impact on our Consolidated Financial Statements and our financial strength rating or the financial strength ratings of our insurance company subsidiaries could be downgraded.
For a detailed discussion of our reserving process and the factors we consider in estimating reserves, refer to the "Critical Accounting Policies" section in Part II, Item 7, "Management's Discussion and Analysis of Financial Condition and Results of Operations."
Our geographic concentration ties our performance to the business, economic and regulatory conditions of certain states.
The following states provided 49.0 percent of the direct statutory premiums written for the property and casualty insurance businesses in 2019: Texas (18.0 percent), California (11.4 percent), Iowa (8.4 percent), Missouri (6.4 percent) and Colorado (4.8 percent).
Our revenues and profitability are subject to the prevailing regulatory, legal, economic, political, demographic, competitive, weather and other conditions in the principal states in which we do business. With respect to regulatory conditions, the NAIC and state legislators continually reexamine existing laws and regulations, specifically focusing on modifications to holding company regulations, interpretations of existing laws and the development of new laws and regulations. In a time of financial uncertainty or a prolonged economic downturn, regulators may choose to adopt more restrictive insurance laws and regulations. Changes in regulatory or any other of these conditions could make it less attractive for us to do business in such states and would have a more pronounced effect on us compared to companies that are more geographically diversified. In addition, our exposure to severe losses from localized natural perils, such as hurricanes or hailstorms, is increased in those areas where we have written a significant amount of property insurance policies.
Unauthorized data access, cyber attacks and other security breaches could have an adverse impact on our business and reputation.
We rely on computer systems to conduct our business for our customer service, marketing and sales activities, customer relationship management and producing financial statements. Our business and operations rely on secure and efficient processing, storage and transmission of customer and Company data, including personally identifiable information. Our ability to effectively operate our business depends upon our ability, and the ability of certain third party vendors and business partners, to access our computer systems to perform necessary business functions, such as providing quotes and product pricing, billing and processing premiums, administering claims, and reporting our financial results.
We retain confidential information on our computer systems, including customer information and proprietary business information belonging to us and our policyholders. Our business and operations depend upon our ability to safeguard this personally identifiable information. Our systems may be vulnerable to unauthorized access and hackers, computer viruses, and other scenarios in which our data may be compromised.
Cyber attacks involving these systems, or those of our third party vendors, could be carried out remotely and from multiple sources and could interrupt, damage, or otherwise adversely affect the operations of these critical systems. Cyber attacks could result in the modification or theft of data, the distribution of false information, or the denial of service to users. Threats to data security can emerge from a variety of sources and change rapidly, resulting in the ongoing need to expend resources to secure our data in accordance with customer expectations and statutory and regulatory requirements.
Any compromise of the security of our data could expose us to liability and harm our reputation, which could affect our business and results of operations. We continually enhance our operating procedures and internal controls to effectively support our business and comply with our regulatory and financial reporting requirements, but there can be no assurances that we will be able to implement security measures adequate to prevent every security breach.
Although, to date, we do not believe we have experienced any material cyber attacks, the occurrence, scope and effect of any cyber attack may remain undetected for a period of time. We maintain cyber liability insurance coverage that provides both third-party liability and first-party insurance coverages; however, our insurance may be insufficient to cover all losses and expenses related to a cyber attack.
11
Federal and state policymakers have, and will likely continue to propose increased regulation of the protection of personally identifiable information and appropriate protocols after a related cybersecurity breach. The New York Department of Financial Services recently adopted a cyber protection and reporting regulation for financial services companies with which we are complying. The NAIC has created the Data Security Model Law ("DSML") based upon the New York regulation. Compliance with these regulations and efforts to address continually developing cybersecurity risks may result in a material adverse effect on our results of operations, liquidity, financial condition, and financial strength.
Conditions in the global capital markets and the economy generally may weaken materially and adversely affect our business and results of operations.
Our results of operations, financial position and liquidity are materially affected by conditions in the global capital markets and the economy generally, both in the U.S. and elsewhere around the world. As a result of such conditions, our policyholders may choose to defer paying insurance premiums or stop paying insurance premiums altogether. In addition, we may experience an elevated incidence of claims and lapses or surrenders of policies causing a change in our exposure.
Factors such as consumer spending, business investment, government spending, the volatility and strength of the capital markets, investor and consumer confidence and inflation levels all affect the business and economic environment and, ultimately, the amount and profitability of our business. In an economic downturn characterized by higher unemployment, lower family income, lower corporate earnings, lower business investment, negative investor sentiment and lower consumer spending, the demand for our insurance products could be adversely affected.
The effects of emerging claim and coverage issues and class action litigation on our business are uncertain.
We are subject to certain effects of emerging or potential claims and coverage issues that arise as industry practices and legal, judicial, social, economic and other environmental conditions change, including unexpected and unintended issues related to claims and coverage. These issues may adversely affect our business by either extending coverage beyond our underwriting intent or by increasing the number and/or size of claims, resulting in further increases in our reserves. The effects of these and other unforeseen emerging claim and coverage issues are extremely hard to predict. Examples of these issues include:
• | judicial expansion of policy coverage and the impact of new theories of liability; |
• | an increase of plaintiffs targeting property and casualty insurers, including us, in purported class action litigation regarding claims handling and other practices; |
• | medical developments that link health issues to particular causes, resulting in liability or workers' compensation (for example, cumulative trauma); |
• | claims relating to unanticipated consequences of current or new technologies; |
• | an increase in the variety, number and size of claims relating to liability losses, which often present complex coverage and damage valuation questions; |
• | claims relating to potentially changing climate conditions, including higher frequency and severity of weather-related events; and |
• | adverse changes in loss cost trends, including inflationary pressure in medical cost and auto and home repair costs. |
We are subject to certain risks related to our investment portfolio that could negatively affect our profitability.
Investment income is an important component of our net income and overall profitability. We invest premiums received from policyholders and other available cash to generate investment income and capital appreciation, while also maintaining sufficient liquidity to pay covered claims, operating expenses and dividends. As discussed in detail below, general economic conditions, changes in financial markets, global events and many other factors beyond our control can adversely affect the value of our investments and the realization of investment income.
12
We primarily manage our investment portfolio internally under required statutory guidelines and investment guidelines approved by our Board of Directors and the boards of directors of our subsidiaries. Although these guidelines stress diversification and capital preservation, our investments are subject to a variety of risks, including:
• | Credit Risk - The value of our investment in marketable securities is subject to impairment as a result of deterioration in the creditworthiness of the issuer. Such impairments could reduce our net investment income and result in realized investment losses. The vast majority of our investments (99.3% at December 31, 2019) are made in investment-grade securities. Although we try to manage this risk by diversifying our portfolio and emphasizing credit quality, our investments are subject to losses as a result of a general downturn in the economy. |
• | Interest Rate Risk - A significant portion of our investment portfolio (80.5 percent at December 31, 2019) consists of fixed income securities, primarily corporate and municipal bonds (69.9 percent at December 31, 2019). These securities are sensitive to changes in interest rates. An increase in interest rates typically reduces the fair value of fixed income securities, while a decline in interest rates reduces the investment income earned from future investments in fixed income securities. In recent periods, interest rates have been at or near historic lows. It is possible that this trend may continue for a prolonged period of time. We generally hold our fixed income securities to maturity, so our interest rate exposure does not usually result in realized losses. However, rising interest rates could result in a significant reduction of the book value of our fixed maturity investments. Low interest rates, and low investable yields, could adversely impact our net earnings as reinvested funds produce lower investment income. |
Interest rates are highly sensitive to many factors beyond our control including general economic conditions, changes in governmental regulations and monetary policy, and national and international political conditions.
• | Liquidity Risk - We seek to match the maturities of our investment portfolio with the estimated payment date of our loss and loss adjustment expense reserves to ensure strong liquidity and avoid having to liquidate securities to fund claims. Risk such as inadequate loss and loss adjustment reserves or unfavorable trends in litigation could potentially result in the need to sell investments to fund these liabilities. This could result in significant realized losses depending on the conditions of the general market, interest rates and credit profile of individual securities. |
Further, our investment portfolio is subject to increased valuation uncertainties when investment markets are illiquid. The valuation of investments is more subjective when markets are illiquid, thereby increasing the risk that the estimated fair value (i.e., the carrying amount) of the portion of the investment portfolio that is carried at fair value as reflected in our financial statements is not reflective of prices at which actual transactions could occur.
• | Market Risk - Our investments are subject to risks inherent in the global financial system and capital markets. The value and risks of our investments may be adversely affected if the functioning of those markets is disrupted or otherwise affected by local, national or international events, such as: changes in regulation or tax policy; changes in legislation relating to bankruptcy or other proceedings; infrastructure failures; wars or terrorist attacks; the overall health of global economies; a significant change in inflation expectations; a significant devaluation of government or private sector credit and/or currency values; and other factors or events not specifically attributable to changes in interest rates, credit losses, and liquidity needs. |
• | Credit Spread Risk - Our exposure to credit spreads primarily relates to market price variability and reinvestment risk associated with changes in credit spreads. Valuations may include assumptions or estimates that may have significant period-to-period changes from market volatility, which could have a material adverse effect on our results of operations or financial condition. |
Our fixed maturity investment portfolio is invested substantially in state, municipal and political subdivision bonds. Our fixed maturity investment portfolio could be subject to default or impairment, in particular:
• | States and local governments have been operating under deficits or projected deficits which may have an impact on the valuation of our municipal bond portfolio. |
13
• | There is a risk of widespread defaults which may increase if some issuers chose to voluntarily default instead of implementing fiscal measures such as increasing tax rates or reducing spending. Such risk may also increase if there are changes in legislation permitting states, municipalities and political subdivisions to file for bankruptcy protection where they were not permitted to before. Judicial interpretations in such bankruptcy proceedings may also adversely affect the collectability of principal and interest, and/or valuation of our bonds. Changes in tax laws impacting marginal tax rates, exemptions, deductions, credits and/or the preferred tax treatment of municipal obligations could also adversely affect the market value of municipal obligations. Since a large portion of our investment portfolio (43.0 percent at December 31, 2019) is invested in tax-exempt municipal obligations, any such changes in tax law could adversely affect the value of our investment portfolio. |
We exercise prudence and significant judgment in analyzing and validating fair values, which are primarily provided by third parties, for securities in our investment portfolio, including those that are not regularly traded in active markets. We also exercise prudence and significant judgment in determining whether the impairment of particular investments is temporary or other-than-temporary. Due to the inherent uncertainties involved in these judgments, we may incur unrealized losses and subsequently conclude that other-than-temporary write downs of our investments are required.
Our success depends primarily on our ability to underwrite risks effectively and adequately price the risks we underwrite.
The results of our operations and our financial condition depend on our ability to underwrite and set premium rates accurately for a wide variety of determinable and indeterminable risks based on available information. Adequate rates are necessary to generate premiums sufficient to pay losses, loss settlement expenses and underwriting expenses and to earn a profit. To price our products accurately, we must collect and properly analyze a substantial amount of data; develop, test and apply appropriate pricing techniques; closely monitor and timely recognize changes in trends; and project both severity and frequency of losses with reasonable accuracy. We could underprice risks which would adversely affect our profit margins. Conversely, we could overprice risks which could reduce our sales volume and competitiveness. Our ability to undertake these efforts successfully, and to price our products accurately, is subject to a number of risks and uncertainties, including but not limited to:
• | the availability of sufficient reliable data and our ability to properly analyze available data; |
• | market and competitive conditions; |
• | changes in medical care expenses and restoration costs; |
• | our selection and application of appropriate pricing techniques; and |
• | changes in the regulatory market, applicable legal liability standards and in the civil litigation system generally. |
The cyclical nature of the property and casualty insurance industry may affect our financial performance.
The property and casualty insurance industry is cyclical in nature and has historically been characterized by soft markets (periods of relatively high levels of price competition, less restrictive underwriting standards and generally low premium rates) followed by hard markets (periods of capital shortages resulting in a lack of insurance availability, relatively low levels of price competition, more selective underwriting of risks and relatively high premium rates). During soft markets, we may lose business to competitors offering competitive insurance at lower prices. We may reduce our premiums or limit premium increases leading to a reduction in our profit margins and revenues. We expect these cycles to continue.
The demand for property and casualty insurance can also vary significantly, rising as the overall level of economic activity increases and falling as that activity decreases. Fluctuations in demand and competition could produce underwriting results that would have a negative impact on the results of our operations and financial condition.
14
A downgrade or a potential downgrade in our financial strength or issuer credit ratings could result in a loss of business and could have a material adverse effect on our financial condition and results of operations.
Ratings are an important factor in establishing the competitive position of insurance companies. Third-party rating agencies assess and rate the claims-paying ability, capital strength and creditworthiness of insurers and reinsurers based on criteria established by the agencies. A.M. Best rates our property and casualty insurance companies on a group basis. Since 2012, A.M. Best has also given an issuer credit rating to our parent holding company. The table below shows the current ratings assigned to our companies by A.M. Best.
Financial Strength Rating | Issuer Credit Rating | Rating Held Since | |
Pooled Property and Casualty Companies | A | a | 1994 |
United Fire Group, Inc. | N/A | bbb | 2012 |
Financial strength and issuer credit ratings are used by policyholders, insurers, reinsurers and insurance and reinsurance intermediaries as an important means of assessing the financial strength, creditworthiness and quality of insurers and reinsurers. These ratings are not evaluations directed to potential purchasers of our common stock and are not recommendations to buy, sell or hold our common stock. These ratings are subject to change at any time and could be revised downward or revoked at the sole discretion of the rating agency. Downgrades in our financial strength ratings could adversely affect our ability to access the capital markets or could lead to increased borrowing costs in the future. Perceptions of the Company by investors, producers, other businesses and consumers could also be significantly impaired.
We believe that the ratings assigned by A.M. Best are an important factor in marketing our products. Our ability to retain our existing business and to attract new business in our insurance operations depends on our ratings by this agency. Our failure to maintain our ratings, or any other adverse development with respect to our ratings, could cause our current and future independent agents and policyholders to choose to transact their business with more highly rated competitors. If A.M. Best downgrades our ratings or publicly indicates that our ratings are under review, it is likely that we will not be able to compete as effectively with our competitors and our ability to sell insurance policies could decline, leading to a decrease in our premium revenue and earnings. For example, many of our agencies and policyholders have guidelines that require us to have an A.M. Best financial strength rating of "A-" or higher. A reduction of our A.M. Best ratings below "A-" would prevent us from issuing policies to a portion of our current policyholders or other potential policyholders with ratings requirements. Additionally, a ratings downgrade could materially increase the number of surrenders for all or a portion of the net cash values by the owners of policies and contracts we have issued, and materially increase the number of withdrawals by policyholders of cash values from their policies.
A reduction in our issuer credit rating could limit our ability to access capital markets or significantly increase the cost to us of raising capital. The failure of our insurance company subsidiaries to maintain their current ratings could dissuade a lender or reinsurance company from conducting business with us. A ratings downgrade could also cause some of our existing liabilities to be subject to acceleration, additional collateral support, changes in terms, or creation of additional financial obligations. It might also increase our interest or reinsurance costs.
We are exposed to credit risk in certain areas of our operations.
In addition to exposure to credit risk related to our investment portfolio, we are exposed to credit risk in several other areas of our business operations, including from:
• | our reinsurers, who are obligated to us under our reinsurance agreements. See the risk factor titled "Market conditions may affect our access to and the cost of reinsurance and our reinsurers may not pay losses in a timely manner, or at all," for a discussion of the credit risk associated with our reinsurance program; |
• | some of our independent agents, who collect premiums from policyholders on our behalf and are required to remit the collected premiums to us; |
• | some of our policyholders, which may be significant; and |
15
• | our surety insurance operations, where we guarantee to a third party that our bonded principal will satisfy certain performance obligations (for example, as in a construction contract) or certain financial obligations. If our policyholder defaults, we may suffer losses and be unable to be reimbursed by our policyholder. |
To a large degree, the credit risk we face is a function of the economy; accordingly, we face a greater risk during periods of economic downturn. While we attempt to manage these risks through underwriting and investment guidelines, collateral requirements and other oversight mechanisms, our efforts may not be successful. For example, collateral obtained may subsequently have little or no value. As a result, our exposure to credit risk could materially and adversely affect our results of operation and financial condition.
We are subject to comprehensive laws and regulations, changes to which may have an adverse effect on our financial condition and results of operations.
Insurance is a highly regulated industry. We are subject to extensive supervision and regulation by the states in which we operate. As a public company, we are also subject to increased regulation at the federal level. Our ability to comply with these laws and regulations and obtain necessary and timely regulatory action is, and will continue to be, critical to our success and ability to earn profits.
Examples of regulations that pose particular risks to our ability to earn profits include the following:
• | Required licensing. Our insurance company subsidiaries operate under licenses issued by various state insurance departments. If a regulatory authority were to revoke an existing license or deny or delay granting a new license, our ability to continue to sell insurance or to enter or offer new insurance products in that market would be substantially impaired. |
• | Regulation of insurance rates, fees and approval of policy forms. The insurance laws of most states in which we operate require insurance companies to file insurance premium rate schedules and policy forms for review and approval. When our loss ratio compares favorably to that of the industry, state regulatory authorities may resist or delay our efforts to raise premium rates, even if the property and casualty industry generally is not experiencing regulatory resistance to premium rate increases. If premium rate increases we deem necessary are not approved, we may not be able to respond to market developments and increased costs in that state. State regulatory authorities may even impose premium rate rollbacks or require us to pay premium refunds to policyholders, affecting our profitability. If insurance policy forms we seek to use are not approved by state insurance departments, our ability to offer new products and grow our business in that state could be substantially impaired. |
• | Restrictions on cancellation, nonrenewal or withdrawal. Many states have laws and regulations restricting an insurance company's ability to cease or significantly reduce its sales of certain types of insurance in that state, except pursuant to a plan that is approved by the state insurance departments. These laws and regulations could limit our ability to exit or reduce our business in unprofitable markets or discontinue unprofitable products. Additionally, our ability to adjust terms or increase pricing requires approval of regulatory authorities in certain states. |
• | Risk-based capital and capital adequacy requirements. Our insurance company subsidiaries and affiliate are subject to risk-based capital requirements that require us to report our results of risk-based capital calculations to state insurance departments and the NAIC. These standards apply specified risk factors to various asset, premium and reserve components of statutory capital and surplus reported in our statutory basis of accounting financial statements. Any failure to meet applicable risk-based capital requirements or minimum statutory capital requirements could subject us or our subsidiaries and affiliate to further examination or corrective action by state regulators, including limitations on our writing of additional business, state supervision or liquidation. |
• | Transactions between insurance companies and their affiliates. Transactions between us, our insurance company subsidiaries and our affiliates generally must be disclosed to, and in some cases approved by, state insurance departments. State insurance departments may refuse to approve or delay their approval of a transaction, which may impact our ability to innovate or operate efficiently. |
• | Required participation in guaranty funds and assigned risk pools. Certain states have enacted laws that require a property and casualty insurer conducting business in that state to participate in assigned risk plans, |
16
reinsurance facilities, and joint underwriting associations where participating insurers are required to provide coverage for assigned risks. The number of risks assigned to us by these plans is based on our share of total premiums written in the voluntary insurance market for that state. Pricing is controlled by the plan, often restricting our ability to charge the premium rate we might otherwise charge. Wherever possible, we utilize a designated servicing carrier to fulfill our obligations under these plans. Designated servicing carriers charge us fees to issue policies, adjust and settle claims and handle administrative reporting on our behalf. In these markets, we may be compelled to underwrite significant amounts of business at lower than desired premium rates, possibly leading to an unacceptable return on equity. While these facilities are generally designed so that the ultimate cost is borne by policyholders, the exposure to assessments and our ability to recoup these assessments through adequate premium rate increases may not offset each other in our financial statements. Moreover, even if they do offset each other, they may not offset each other in our financial statements for the same fiscal period, due to the ultimate timing of the assessments and recoupments or premium rate increases. Additionally, certain states require insurers to participate in guaranty funds to bear a portion of the unfunded obligations of impaired or insolvent insurance companies. These state funds periodically assess losses against all insurance companies doing business in the state. Our operating results and financial condition could be adversely affected by any of these factors.
• | Restrictions on the amount, type, nature, quality and concentration of investments. The various states in which we are domiciled have certain restrictions on the amount, type, nature, quality and concentration of our investments. Generally speaking, these regulations require us to be conservative in the nature and quality of our investments and restrict our ability to invest in riskier, but often higher yield investments. These restrictions may make it more difficult for us to obtain our desired investment results. |
We benefit from certain tax items, including but not limited to, tax-exempt bond interest, dividends-received deductions, tax credits (such as foreign tax credits) and insurance reserve deductions. From time to time, the U.S. Congress, as well as foreign, state and local governments, considers legislation that could reduce or eliminate the benefits associated with these tax items. Recent federal tax reform may negatively impact our ability to take deductions that we made in the past.
• | Terrorism Risk Insurance. The Terrorism Risk Insurance Program Reauthorization Act of 2015 ("TRIPRA") was signed into law. TRIPRA, which extended the Terrorism Risk Insurance Program until December 31, 2020, gradually increased the coverage trigger for shared terrorism losses between the federal government and the insurance industry to $200 billion per year, and gradually increased the industry-wide retention to $37.5 billion per year. For further information about TRIPRA and its effect on our operations, refer to the information in the "Results of Operations for the Years Ended December 31, 2019, 2018 and 2017" section in Part II, Item 7, "Management's Discussion and Analysis of Financial Condition and Results of Operations." |
• | Accounting standards. We prepare our consolidated financial statements in conformity with GAAP, which is periodically revised and/or expanded by recognized authoritative bodies, including the Financial Accounting Standards Board ("FASB"). These principles are subject to interpretation by the SEC and various other bodies formed to interpret and create appropriate accounting principles and guidance. Changes in GAAP and financial reporting requirements, or the interpretation of GAAP or those requirements, may have an impact on the content and presentation of our financial results and could have adverse consequences on our financial results, including lower reported results of operations and shareholders' equity and increased volatility and decreased comparability of our reported results with our historic results and with the results of other insurers. In addition, the required adoption of new accounting standards may result in significant incremental costs associated with initial implementation of and ongoing compliance with those standards. Additional information regarding recently proposed and adopted accounting standards and their potential impact on us is set forth in Note 1 “Summary of Significant Accounting Policies” to Part II, Item 8, “Financial Statements and Supplementary Data.” |
• | Corporate Governance and Public Disclosure Regulation. Changing laws, regulations and standards relating to corporate governance and public disclosure, including Dodd-Frank, the Sarbanes-Oxley Act of 2002 and related SEC regulations, as well as the listing standards of the Nasdaq stock market, have created and are continuing to create uncertainty for public companies. The Federal Insurance Office, established |
17
within the U.S. Department of the Treasury by Dodd Frank in 2010, has limited regulatory authority and is empowered to gather data and information regarding the insurance industry and insurers, monitor aspects of the insurance industry, identify issues with regulation of insurers that could contribute to a systemic crisis in the insurance industry or the overall financial system, coordinate federal policy on international insurance matters and preempt state insurance measures under certain circumstances. While certain details and much of the impact of Dodd-Frank are still unknown, Dodd-Frank and other federal regulation adopted in the future may impose burdens on us, including impacting the ways we conduct our business, increasing compliance costs and duplicating state regulation. Additional regulation under these laws in the area of compensation disclosure, particularly regarding internal pay equity, officer and director hedging activities and compensation clawback policies is still expected.
• | Information Privacy Regulation. We are required to safeguard the personal information of our customers and applicants and are subject to an increasing number of laws and regulations regarding privacy and data security, as well as in our contractual commitments with service providers. We could be subject to governmental enforcement actions and fines, penalties, litigation, or public statements against us by consumer advocacy groups if personal information is not appropriately controlled. Strategic service providers may refuse to continue to do business with us if we do not meet particular standards. |
Compliance with these laws and regulations requires us to incur administrative costs that decrease our profits. These laws and regulations may also prevent or limit our ability to underwrite and price risks accurately, obtain timely premium rate increases necessary to cover increased costs, discontinue unprofitable relationships or exit unprofitable markets and otherwise continue to operate our business profitably. In addition, our failure to comply with these laws and regulations could result in actions by state or federal regulators, including the imposition of fines and penalties or, in an extreme case, revocation of our ability to do business in one or more states. Finally, we could face individual, group and class action lawsuits by our policyholders and others for alleged violations of certain state laws and regulations. Each of these regulatory risks could have a negative effect on our profitability.
Market conditions may affect our access to and the cost of reinsurance and our reinsurers may not pay losses in a timely manner, or at all.
As part of our overall risk and capacity management strategy, we purchase reinsurance for significant amounts of the risk that we and our insurance company subsidiaries and affiliates underwrite, by transferring (or ceding) part of the risk we have assumed to a reinsurance company in exchange for part of the premium we receive in connection with the risk. These reinsurance arrangements diversify our business and reduce our exposure to large losses or from hazards of an unusual nature. As of December 31, 2019, we ceded premiums written of $74.5 million to our reinsurers.
Although reinsurance makes the reinsurer liable to us to the extent the risk is transferred, it does not eliminate our liability to our policyholders because we remain liable as the direct insurer on all of the reinsured risks. As a result we are subject to credit risk relating to our ability to recover amounts due from our reinsurers.
Our ability to collect reinsurance recoverables may be subject to uncertainty. Our losses must meet the qualifying conditions of the reinsurance agreement. Our reinsurance agreements are subject to specified limits and we would not have reinsurance coverage to the extent that it exceeds those limits. We are also subject to the risk that reinsurers may dispute their obligations to pay our claims. Reinsurers must have the financial capacity and willingness to make payments under the terms of a reinsurance agreement or program. Reinsurers may dispute amounts we believe are due to us. Particularly, following a major catastrophic event, our inability to collect a material recovery from a reinsurer on a timely basis, or at all, could have a material adverse effect on our liquidity, operating results and financial condition.
Market conditions determine the availability and cost of the reinsurance protection we purchase, which affects the level of our business profitability, as well as the level and types of risk we retain. Although we purposely work with several reinsurance intermediaries and reinsurers, we may be unable to maintain our current reinsurance facilities or obtain other reinsurance facilities in adequate amounts and at favorable premium rates. Moreover, there may be a situation in which we have more than two catastrophic events within one policy year. Because our current catastrophe reinsurance program only allows for one automatic reinstatement at an additional reinstatement premium, we would be required to obtain a new catastrophe reinsurance policy to maintain our current level of
18
catastrophe reinsurance coverage. Such coverage may be difficult to obtain, particularly if it is necessary to do so during hurricane season following the second catastrophe. If we are unable to renew our expiring facilities or to obtain new reinsurance facilities, either our net exposure to risk will increase or, if we are unwilling to bear an increase in net risk exposures, we will have to reduce the amount of risk we underwrite.
We face significant competitive pressures in our business that could cause demand for our products to fall or hinder our ability to introduce new products or services and keep pace with advances in technology, reducing our revenue and profitability.
The insurance industry is highly competitive and will likely remain that way for the foreseeable future. In our property and casualty insurance business we compete, and will continue to compete, with many major U.S. and non-U.S. insurers and smaller regional companies, as well as mutual companies, specialty insurance companies, underwriting agencies, and diversified financial services companies, including banks, mutual funds, broker-dealers and asset-managers. Except for regulatory considerations, there are few barriers to entry in the insurance market. These developments may increase competition, by increasing the number, size and financial strength of competitors who may be able to offer, due to economies of scale, more competitive pricing than we can.
Our competitors may attempt to increase their market share by lowering rates. In that case, we could experience reductions in our underwriting margins or sales of insurance policies. Losing business to competitors offering similar products at lower prices or who have a competitive advantage may adversely affect the results of our operations. Additionally, economic conditions may reduce the total volume of business available to us and our competitors.
We price our insurance products based on estimated profit margins, and we may not be able to react in a timely manner to reprice our insurance products to respond to changes in the market. Some of our competitors may be larger and have far greater financial, technology and marketing resources than we do. If new or existing competitors decide to target our policyholder base by offering similar or enhanced product offerings or technologies at lower prices than we are able to offer, our premium revenue and our profitability could decline.
Our products are marketed exclusively through independent insurance agencies, most of which represent more than one company. We face competition within each agency and competition to retain qualified independent agents. Our competitors include companies that market their products through agents, as well as companies that sell insurance directly to their customers. In personal insurance, the use of comparative rating technologies has impacted our business and may continue to impact the entire industry. This has resulted in an increase in the total level of quote activity but a lower percentage of quotes have resulted in new business from customers. There is also the potential for similar technology to be used to compare rates for small business.
The successful implementation of our business model depends on our ability to adapt to evolving technologies and industry standards and introduce new products and services. There is no guarantee we will be able to introduce new or improved products, or that our products will achieve market acceptance. We may also not be successful in using new technologies effectively or adapting our proprietary technology to evolving customer requirements, causing our products or services to become obsolete.
Technology may be increasingly playing a role in our ability to be competitive. Innovations such as telematics and other usage-based methods of determining premiums may impact product design and pricing and may be an increasingly important factor in our ability to be competitive. Our competitive position may also be impacted by our ability to institute technology that collects and analyzes a wide variety of data points to make underwriting or other decisions.
Our business depends on the uninterrupted operations of our facilities, systems and business functions.
Our business depends on our employees' or vendors' ability to perform necessary business functions, such as processing new and renewal policies, providing customer service, making claims payments, facilitating collections and cancellations and performing actuarial functions necessary for pricing and product development. We increasingly rely on technology and systems to accomplish these business functions in an efficient and uninterrupted fashion. Our inability to access our facilities or a failure of technology, telecommunications or other systems could significantly impair our ability to perform such functions on a timely basis or affect the accuracy of transactions. If sustained or repeated, such a business interruption or system failure could result in a deterioration of our ability to
19
write and process new and renewal business, serve our agents and policyholders or perform other necessary business functions as discussed above.
If a natural disaster or a terrorist act occurs, our company and employees could be directly adversely affected, depending on the nature of the event. We have an emergency preparedness plan that consists of the information and procedures required to enable rapid recovery from an occurrence, such as natural disaster or business disruption, which could potentially disable us for an extended period of time. This plan was successfully tested during 2016 by the Midwest flooding that affected our corporate headquarters in Cedar Rapids, Iowa, and by Hurricane Harvey in 2017 that affected our Gulf Coast regional office in Galveston, Texas. It was also tested, to a lesser extent, by Super Storm Sandy in 2012 that affected our East Coast regional office in Pennington, New Jersey.
Adverse capital and credit market conditions may significantly affect our ability to meet liquidity needs, as well as our access to and the cost of capital.
Although capital market conditions have improved, our results of operations, financial condition, cash flows and statutory capital position could be materially adversely affected by continued volatility, uncertainty and disruptions in the capital and credit markets.
We maintain a level of cash and securities which, combined with expected cash inflows from investments and operations, is believed adequate to meet anticipated short-term and long-term benefit and expense payment obligations. The availability of financing will depend on a variety of factors such as market conditions, the general availability of credit, the volume of trading activities, the overall availability of credit to the financial services industry, our credit ratings and credit capacity as well as customers' or lenders' perception of our long- or short-term financial prospects. Similarly, our access to funds may be impaired if regulatory authorities or rating agencies take negative actions against us.
Disruptions, uncertainty or volatility in the capital and credit markets may limit our access to capital required to operate our business. Such market conditions may limit our ability to replace, in a timely manner, maturing liabilities; satisfy statutory capital requirements; and access the capital necessary to grow our business. As such, we may be forced to delay raising capital, issue shorter term securities than we prefer, utilize available internal resources or bear an unattractive cost of capital, which could decrease our profitability and significantly reduce our financial flexibility and liquidity.
We may experience difficulty in integrating future acquisitions to our operations.
The successful integration of any newly acquired businesses into our operations will require, among other things:
• | the timely receipt of any required regulatory approvals; |
• | the retention and assimilation of their key management, sales and other personnel; |
• | the coordination of their lines of insurance products and services; |
• | the adaptation of their technology, information systems and other processes; and |
• | the retention and transition of their customers. |
Unexpected difficulties in integrating any acquisition could result in increased expenses and the diversion of management time and resources. If we do not successfully integrate any acquired business into our operations, we may not realize the anticipated benefits of the acquisition, which could have a material adverse impact on our financial condition and results of operations. Further, any potential acquisitions may require significant capital outlays and, if we issue equity or convertible debt securities to pay for an acquisition, the issuance may be dilutive to our existing shareholders.
The exclusions and limitations in our policies may not be enforceable.
Many of the policies we issue include exclusions and other conditions that define and limit coverage, which exclusions and conditions are designed to manage our exposure to certain types of risks and expanding theories of legal liability. In addition, many of our policies limit the period during which a policyholder may bring a claim under the policy, which period in many cases is shorter than the statutory period under which these claims can be brought by our policyholders. While these exclusions and limitations help us assess and control our loss exposure, it
20
is possible that a court or regulatory authority could nullify or void an exclusion or limitation, or legislation could be enacted which modifies or bars the use of these exclusions and limitations. This could result in higher than anticipated losses by extending coverage beyond the intent of our underwriting. In some instances, these changes may not become apparent until sometime after we have issued the insurance policies that are affected by these changes. As a result, the full extent of liability under our insurance contracts may not be known for many years after a policy is issued.
Our internal controls are not fail-safe.
As a result of the inherent limitations in all control systems, no system of controls can provide absolute assurance that all control objectives have been or will be met, and that every instance of error or fraud has been or will be detected. A control system, no matter how well conceived and operated, can provide only reasonable, not absolute, assurance that the objectives of the control system will be met. These inherent limitations include the realities that judgments in decision-making can be faulty and that breakdowns can occur because of a simple error or mistake.
The determination of the amount of impairments taken on our investments requires estimates and assumptions which are subject to differing interpretations and could materially impact our results of operations or financial position.
The determination of the amount of impairments varies by investment type and is based upon our periodic evaluation and assessment of known and inherent risks associated with the respective asset class. Such evaluations and assessments are revised as conditions change and new information becomes available. There can be no assurance that our management has accurately assessed the level of impairments taken in our financial statements. Furthermore, additional impairments may need to be taken in the future. Historical trends may not be indicative of future impairments.
Additionally, our management considers a wide range of factors about the instrument issuer and uses its best judgment in evaluating the cause of the decline in the estimated fair value of the instrument and in assessing the prospects for recovery. Inherent in management's evaluation of the security are assumptions and estimates about the operations of the issuer and its future earnings potential.
Risks Relating to Our Common Stock
The ability of our subsidiaries to pay dividends may affect our liquidity and ability to meet our obligations.
As a holding company, we have no significant independent operations of our own. Our principal sources of funds are dividends and other payments received from our subsidiaries. We rely on those dividends for our liquidity and to meet our obligations to pay dividends to shareholders and make share repurchases. Dividends from those subsidiaries depend on their statutory surplus, earnings and regulatory restrictions.
State insurance laws limit the ability of insurance subsidiaries to pay dividends and require our insurance subsidiaries to maintain specified minimum levels of statutory capital and surplus. The actual ability to pay dividends may further be constrained by business and regulatory considerations, such as the impact of dividends on surplus, by our competitive position and by the amount of premiums that we can write. Ordinary dividend payments, or dividends that do not require prior approval by the insurance subsidiaries' domiciliary state insurance regulator are generally limited to amounts determined by a formula which varies by jurisdiction. Extraordinary dividends, on the other hand, require prior regulatory approval by the insurance subsidiaries' domiciliary state insurance regulator before they can be made.
In addition, competitive pressures generally require insurance companies to maintain insurance financial strength ratings. These restrictions and other regulatory requirements affect the ability of our insurance subsidiaries to make dividend payments to us. At times we may not be able to pay dividends on our common stock, or we may be required to seek prior approval from the applicable regulatory authority before we can pay any such dividends. In addition, the payment of dividends by us is within the discretion of our Board of Directors and will depend on numerous factors, including our financial condition, our capital requirements and other factors that our Board of Directors considers relevant.
21
The price of our common stock may be volatile.
The trading price of our common stock may fluctuate substantially due to a variety of factors, some of which are beyond our control and may not be related to our operating performance. These fluctuations could be significant and could cause a loss in the amount invested in our shares of common stock. Factors that could cause fluctuations include, but are not limited to, the following:
• | variations in our actual or anticipated operating results or changes in the expectations of financial market analysts with respect to our results; |
• | investor perceptions of the insurance industry in general and the Company in particular; |
• | market conditions in the insurance industry and any significant volatility in the market; |
• | major catastrophic events; and |
• | departure of key personnel. |
Certain provisions of our organizational documents, as well as applicable insurance laws, could impede an attempt to replace or remove our management or members of our Board of Directors, prevent the sale of the Company or prevent or frustrate any attempt by shareholders to change the direction of the Company, each of which could diminish the value of our common stock.
Our articles of incorporation and bylaws, as well as applicable laws governing corporations and insurance companies, contain provisions that could impede an attempt to replace or remove our management or prevent the sale of the Company that, in either case, shareholders might consider being in their best interests. For example:
• | our Board of Directors is divided into three classes. At any annual meeting of our shareholders, our shareholders have the right to appoint approximately one-third of the directors on our Board of Directors. Consequently, it will take at least two annual shareholder meetings to effect a change in control of our Board of Directors; |
• | our articles of incorporation limit the rights of shareholders to call special shareholder meetings; |
• | our articles of incorporation set the minimum number of directors constituting the entire Board of Directors at nine and the maximum at 15, and they require approval of holders of 60.0 percent of all outstanding shares to amend these provisions. Within the range, the Board of Directors may increase by one each year the number of directors serving on the Board of Directors; |
• | our articles of incorporation require the affirmative vote of 60.0 percent of all outstanding shares to approve any plan of merger, consolidation, or sale or exchange of all, or substantially all, of our assets; |
• | our Board of Directors may fill vacancies on the Board of Directors; |
• | our Board of Directors has the authority, without further approval of our shareholders, to issue shares of preferred stock having such rights, preferences and privileges as the Board of Directors may determine; |
• | Section 490.1110 of the Iowa Business Corporation Act imposes restrictions on mergers and other business combinations between us and any holder of 10.0 percent or more of our common stock; and |
• | Section 490.624A of the Iowa Business Corporation Act authorizes the terms and conditions of stock rights or options issued by us to include restrictions or conditions that preclude or limit the exercise, transfer, or receipt of such rights or options by a person, or group of persons, owning or offering to acquire a specified number or percentage of the outstanding common shares or other securities of the corporation. |
Further, the insurance laws of Iowa and the states in which our insurance company subsidiaries are domiciled prohibit any person from acquiring direct or indirect control of us or our insurance company subsidiaries, generally defined as owning or having the power to vote 10.0 percent or more of our outstanding voting stock, without the prior written approval of state regulators.
These provisions of our articles of incorporation and bylaws, and these state laws governing corporations and insurance companies, may discourage potential acquisition proposals. These provisions and state laws may also delay, deter or prevent a change of control of the Company, in particular through unsolicited transactions that some
22
or all of our shareholders might consider to be desirable. As a result, efforts by our shareholders to change the direction or the Company's management may be unsuccessful, and the existence of such provisions may adversely affect market prices for our common stock if they are viewed as discouraging takeover attempts.
ITEM 1B. UNRESOLVED STAFF COMMENTS
None.
ITEM 2. PROPERTIES
Our headquarters are located in Cedar Rapids, Iowa, where we own approximately 261,000 square feet of office and building space. In addition, we own and lease office and building space, including underwriting and claims offices, throughout the U.S. We believe our existing facilities, both owned and leased, are in good condition and suitable for the conduct of our business.
ITEM 3. LEGAL PROCEEDINGS
In the normal course of its business, the Company is a party to a variety of legal proceedings. While the final outcome of these legal proceedings cannot be predicted with certainty, management believes all of the proceedings pending as of December 31, 2019 to be ordinary and routine and does not expect these legal proceedings to have a material adverse effect on the Company's financial position or results of operations.
ITEM 4. MINE SAFETY DISCLOSURES
Not applicable.
23
PART II.
ITEM 5. MARKET FOR REGISTRANT'S COMMON EQUITY, RELATED SHAREHOLDER MATTERS AND ISSUER PURCHASES OF EQUITY SECURITIES
Common Shareholders
United Fire Group, Inc.'s common stock is traded on the NASDAQ stock market under the symbol "UFCS." On February 26, 2020, there were 680 holders of record of United Fire Group, Inc. common stock. The number of record holders does not reflect shareholders who beneficially own common stock in nominee or street name, but does include participants in our employee stock purchase plan.
Dividends
Our practice has been to pay quarterly cash dividends, which we have paid every quarter since March 1968.
As a holding company with no independent operations of its own, United Fire Group, Inc. relies on dividends received from its insurance company subsidiaries in order to pay dividends to its common shareholders. Dividends payable by our insurance subsidiaries are governed by the laws in the states in which they are domiciled. In all cases, these state laws permit the payment of dividends only from earned surplus arising from business operations. For example, under Iowa law, the maximum dividend or distribution that may be paid within a 12-month period without prior approval of the Iowa Insurance Commissioner is generally restricted to the greater of 10 percent of statutory surplus as of the preceding December 31, or net income of the preceding calendar year on a statutory basis, not greater than earned statutory surplus. Other states in which our insurance company subsidiaries are domiciled may impose similar restrictions on dividends and distributions. Based on these restrictions, at December 31, 2019, our insurance company subsidiary, United Fire & Casualty, is able to make a maximum of $154.2 million in dividend payments without prior regulatory approval.
Payments of any future dividends and the amounts of such dividends will depend upon factors such as net income, financial condition, capital requirements, and general business conditions. We will only pay dividends if declared by our Board of Directors out of legally available funds and there can be no assurance that we will continue to pay such dividends or the amount of such dividends.
Additional information about these restrictions is incorporated by reference from Note 6 "Statutory Reporting, Capital Requirements and Dividends and Retained Earnings Restrictions" contained in Part II, Item 8, "Financial Statements and Supplementary Data."
Issuer Purchases of Equity Securities
Under our share repurchase program, we may purchase our common stock from time to time on the open market or through privately negotiated transactions. The amount and timing of any purchases will be at our discretion and will depend upon a number of factors, including the share price, general economic and market conditions, and corporate and regulatory requirements. Our share repurchase program may be modified or discontinued at any time.
The following table provides information with respect to purchases of shares of common stock made by or on our behalf or by any "affiliated purchaser," as defined in Rule 10b-18(a)(3) under the Exchange Act, during the year ended December 31, 2019:
24
Period | Total Number of Shares Purchased (1) | Average Price Paid per Share | Total Number of Shares Purchased as a Part of Publicly Announced Plans or Programs | Maximum Number of Shares that may yet be Purchased Under the Plans or Programs | ||||||||
1/1/19 - 1/31/19 | — | $ | — | — | 2,116,200 | |||||||
2/1/19 - 2/28/19 | — | — | — | 2,116,200 | ||||||||
3/1/19 - 3/31/19 | — | — | — | 2,116,200 | ||||||||
4/1/19 - 4/30/19 | — | — | — | 2,116,200 | ||||||||
5/1/19 - 5/31/19 | 1,507 | 45.93 | 1,507 | 2,114,693 | ||||||||
6/1/19 - 6/30/19 | — | — | — | 2,114,693 | ||||||||
7/1/19 - 7/31/19 | — | — | — | 2,114,693 | ||||||||
8/1/19 - 8/31/19 | 158,349 | 45.52 | 158,349 | 1,956,344 | ||||||||
9/1/19 - 9/30/19 | 18,900 | 44.95 | 18,900 | 1,937,444 | ||||||||
10/1/19 - 10/31/19 | 50,000 | 45.73 | 50,000 | 1,887,444 | ||||||||
11/1/19 - 11/30/19 | 12,500 | 42.94 | 12,500 | 1,874,944 | ||||||||
12/1/19 - 12/31/19 | 17,500 | 42.80 | 17,500 | 1,857,444 | ||||||||
Total | 258,756 | 258,756 | ||||||||||
(1) Our share repurchase program was originally announced in August 2007. In August 2016, our Board of Directors authorized the repurchase of up to an additional 1,500,000 shares of common stock through the end of August 2018. This is in addition to the 1,528,886 shares of common stock remaining under its previous authorizations. In August 2018, our Board of Directors extended our share repurchase program through the end of August, 2020. As of December 31, 2019 we remained authorized to repurchase 1,857,444 shares of common stock through the end of August 2020.
United Fire Group, Inc. Common Stock Performance Graph
The following graph compares the performance of an investment in United Fire Group Inc.'s common stock from December 31, 2014 through December 31, 2019, with the Standard & Poor's 500 Index ("S&P 500 Index"), and the Standard & Poor's 600 Property and Casualty Index ("S&P 600 P&C Index"). The graph assumes $100 was invested on December 31, 2014 in our common stock and each of the below listed indices and that all dividends were reinvested on the date of payment without payment of any commissions. Dollar amounts in the graph are rounded to the nearest whole dollar. The performance shown in the graph represents past performance and should not be considered an indication of future performance.
25
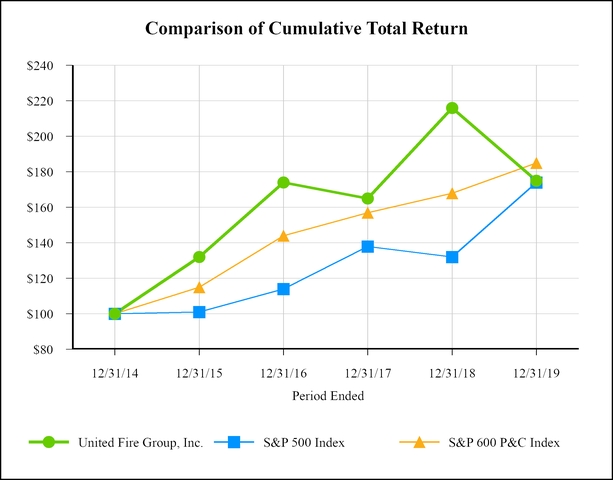
The following table shows the data used in the total return performance graph above.
Period Ended | |||||||||||||||||||||||
Index | 12/31/14 | 12/31/15 | 12/31/16 | 12/31/17 | 12/31/18 | 12/31/19 | |||||||||||||||||
United Fire Group, Inc. | $ | 100.00 | $ | 132.28 | $ | 173.66 | $ | 165.04 | $ | 216.29 | $ | 175.46 | |||||||||||
S&P 500 Index | 100.00 | 101.38 | 113.51 | 138.29 | 132.23 | 173.86 | |||||||||||||||||
S&P 600 P&C Index | 100.00 | 114.90 | 143.83 | 156.94 | 167.98 | 184.76 | |||||||||||||||||
The foregoing performance graph is being furnished as part of this Annual Report on Form 10-K solely in accordance with the requirement under Rule 14a-3(b)(9) to furnish our shareholders with such information, and therefore, shall not be deemed to be filed or incorporated by reference into any filings by the Company under the Securities Act or Exchange Act.
ITEM 6. SELECTED FINANCIAL DATA
The following table sets forth certain selected financial data derived from the Consolidated Financial Statements of United Fire Group, Inc. and its subsidiaries and affiliates. The data should be read in conjunction with Part II, Item 7, "Management's Discussion and Analysis of Financial Condition and Results of Operations" and Part II, Item 8, "Financial Statements and Supplementary Data."
26
(In Thousands, Except Per Share Data) | |||||||||||||||||||
As of and for the years Ended December 31 | 2019 | 2018 | 2017 | 2016 | 2015 | ||||||||||||||
Balance Sheet Data: | |||||||||||||||||||
Total cash and investments - continuing operations | $ | 2,275,821 | $ | 2,138,577 | $ | 1,984,495 | $ | 1,860,978 | $ | 1,737,161 | |||||||||
Total assets | |||||||||||||||||||
Continuing operations | 3,013,472 | 2,816,698 | 2,597,297 | 2,449,140 | 2,280,674 | ||||||||||||||
Assets held for sale | — | — | 1,586,134 | 1,605,618 | 1,609,702 | ||||||||||||||
Total assets | 3,013,472 | 2,816,698 | 4,183,431 | 4,054,758 | 3,890,376 | ||||||||||||||
Losses and loss settlement expenses | 1,421,754 | 1,312,483 | 1,224,183 | 1,123,896 | 1,003,895 | ||||||||||||||
Unearned premiums - continuing operations | 505,162 | 492,918 | 465,391 | 443,802 | 414,971 | ||||||||||||||
Total liabilities | |||||||||||||||||||
Continuing operations | 2,103,000 | 1,928,323 | 1,862,923 | 1,722,651 | 1,606,869 | ||||||||||||||
Liabilities held for sale | — | — | 1,347,135 | 1,390,223 | 1,404,610 | ||||||||||||||
Total liabilities | 2,103,000 | 1,928,323 | 3,210,058 | 3,112,874 | 3,011,479 | ||||||||||||||
Net unrealized investment gains (loss), after tax | 47,279 | (9,323 | ) | 214,865 | 133,892 | 128,369 | |||||||||||||
Repurchase of United Fire Group, Inc. common stock | (11,700 | ) | (5,404 | ) | (29,784 | ) | (3,746 | ) | (2,423 | ) | |||||||||
Total stockholders' equity | 910,472 | 888,375 | 973,373 | 941,884 | 878,897 | ||||||||||||||
Book value per share | 36.40 | 35.40 | 39.06 | 37.04 | 34.94 | ||||||||||||||
Income Statement Data from Continuing Operations: | |||||||||||||||||||
Revenues | |||||||||||||||||||
Net premiums earned | $ | 1,086,972 | $ | 1,037,451 | $ | 997,492 | $ | 936,131 | $ | 851,695 | |||||||||
Investment income, net of investment expenses | 60,414 | 52,894 | 51,190 | 55,284 | 46,559 | ||||||||||||||
Net realized investment gains (losses) | 53,779 | (20,179 | ) | 4,055 | 4,947 | 1,124 | |||||||||||||
Other income (loss) | — | — | — | — | (107 | ) | |||||||||||||
Revenues | 1,201,165 | 1,070,166 | 1,052,737 | 996,362 | 899,271 | ||||||||||||||
Losses and loss settlement expenses | 830,172 | 731,611 | 725,713 | 652,433 | 520,087 | ||||||||||||||
Amortization of deferred policy acquisition costs | 216,699 | 206,232 | 207,746 | 202,892 | 180,183 | ||||||||||||||
Other underwriting expenses | 137,415 | 141,473 | 103,628 | 83,540 | 83,631 | ||||||||||||||
Net income | 14,820 | 2,255 | 44,870 | 49,918 | 85,320 | ||||||||||||||
Combined ratio(1) | 109.0 | % | 104.0 | % | 104.0 | % | 100.3 | % | 92.0 | % | |||||||||
Income Statement Data from Discontinued Operations: | |||||||||||||||||||
Net premiums earned | $ | — | $ | 13,003 | $ | 61,368 | $ | 87,270 | $ | 79,195 | |||||||||
Investment income | — | 12,663 | 49,720 | 51,538 | 54,222 | ||||||||||||||
Revenues | — | 24,755 | 115,713 | 140,585 | 135,647 | ||||||||||||||
Losses and loss settlement expenses | — | 10,823 | 40,451 | 31,365 | 29,001 | ||||||||||||||
Increase in liability for future policy benefits | — | 5,023 | 27,632 | 59,969 | 50,945 | ||||||||||||||
Other underwriting expenses | — | 3,864 | 13,281 | 19,881 | 19,306 | ||||||||||||||
Interest on policyholders' accounts | — | 4,499 | 18,525 | 20,079 | 23,680 | ||||||||||||||
Net income (loss) | — | (1,912 | ) | 6,153 | 786 | 3,806 | |||||||||||||
Earnings Per Share Data: | |||||||||||||||||||
Continuing operations: | |||||||||||||||||||
Basic earnings per common share | $ | 0.59 | $ | 0.09 | $ | 1.79 | $ | 1.94 | $ | 3.41 | |||||||||
Diluted earnings per common share | 0.58 | 0.09 | 1.75 | 1.90 | 3.38 | ||||||||||||||
Discontinued operations: | |||||||||||||||||||
Basic earnings (loss) per common share | — | (0.08 | ) | 0.24 | 0.03 | 0.15 | |||||||||||||
Diluted earnings (loss) per common share | — | (0.07 | ) | 0.24 | 0.03 | 0.15 | |||||||||||||
Other Supplemental Data: | |||||||||||||||||||
Cash dividends declared per common share(2) | $ | 1.30 | $ | 4.21 | $ | 1.09 | $ | 0.97 | $ | 0.86 | |||||||||
(1) | The combined ratio is a commonly used financial measure of property and casualty underwriting performance. A combined ratio below 100.0 percent generally indicates a profitable book of business. |
(2) | On August 20, 2018, a special dividend of $3.00 per share was paid to shareholders. |
27
ITEM 7. MANAGEMENT'S DISCUSSION AND ANALYSIS OF FINANCIAL CONDITION AND RESULTS OF OPERATIONS
The following Management's Discussion and Analysis should be read in conjunction with Part II, Item 6, "Selected Financial Data" and Part II, Item 8, "Financial Statements and Supplementary Data." Amounts (except per share amounts) are presented in thousands, unless otherwise noted.
FORWARD-LOOKING STATEMENTS
It is important to note that our actual results could differ materially from those projected in any forward-looking statements in this Form 10-K. Please refer to "Forward-Looking Information" and Part I, Item 1A, "Risk Factors" of this report for information concerning factors that could cause actual results to differ materially from the forward-looking statements contained in this Form 10-K.
BUSINESS OVERVIEW
Originally founded in 1946 as United Fire & Casualty Company, United Fire Group, Inc. and its consolidated insurance company subsidiaries provide insurance protection for individuals and businesses through several regional companies. Our property and casualty insurance company subsidiaries are licensed in 46 states plus the District of Columbia and are represented by approximately 1,000 independent agencies.
Discontinued Operations
On September 18, 2017, the Company signed a definitive agreement to sell its subsidiary, United Life, to Kuvare and on March 30, 2018, the sale closed. As a result, our life insurance business, previously a separate segment, was considered held for sale and reported as discontinued operations in the Consolidated Financial Statements. All periods presented have been revised to show results from continuing and discontinued operations, unless otherwise noted. For more information, refer to Part II, Item 8, Note 17 "Discontinued Operations."
Reportable Segments
Prior to the announcement of the sale of our life insurance business, we have historically reported our operations in two business segments, each with a wide range of products:
• | property and casualty insurance, which includes commercial lines insurance, personal lines insurance and assumed reinsurance; and |
• | life insurance, which includes deferred and immediate annuities, universal life products and traditional life (primarily single premium whole life) insurance products. |
We managed these businesses separately, as they generally do not share the same customer base, and each has different products, pricing, and expense structures.
Subsequent to the announcement of the sale of our life insurance business on September 19, 2017, we operate and report one business segment, which contains our continuing operations. Our life insurance business was considered held for sale and reported as discontinued operations throughout this Form 10-K, unless otherwise noted. For more information, refer to Part II, Item 8, Note 10 "Segment Information" and Note 17 "Discontinued Operations."
Pooling Arrangement
All of our property and casualty insurance subsidiaries are members of an intercompany reinsurance pooling arrangement. The Company's pooling arrangement permits the participating companies to rely on the capacity of the entire pool's capital and surplus, rather than being limited to policy exposures of a size commensurate with each participant’s own surplus level.
28
Geographic Concentration
Continuing Operations - Property and Casualty Insurance Business
For 2019, approximately 49.0 percent of our property and casualty statutory direct premiums written were written in Texas, California, Iowa, Missouri and Colorado.
In 2019, 2018 and 2017 the direct statutory premiums written by our property and casualty insurance operations were distributed as follows:
Years Ended December 31, | % of Total | ||||||||||||||
(In Thousands) | 2019 | 2018 | 2017 | 2019 | 2018 | 2017 | |||||||||
Texas | $ | 205,420 | $ | 193,953 | $ | 178,314 | 18.0 | % | 17.4 | % | 16.7 | % | |||
California | 129,850 | 124,473 | 123,285 | 11.4 | 11.2 | 11.6 | |||||||||
Iowa | 96,052 | 98,128 | 100,826 | 8.4 | 8.8 | 9.5 | |||||||||
Missouri | 73,735 | 70,646 | 64,746 | 6.4 | 6.4 | 6.1 | |||||||||
Colorado | 54,907 | 56,152 | 53,981 | 4.8 | 5.1 | 5.1 | |||||||||
New Jersey | 51,539 | 52,037 | 49,305 | 4.5 | 4.7 | 4.6 | |||||||||
Minnesota | 47,890 | 49,491 | 50,432 | 4.2 | 4.4 | 4.7 | |||||||||
Louisiana | 46,827 | 44,007 | 39,849 | 4.1 | 4.0 | 3.7 | |||||||||
Illinois | 40,443 | 40,431 | 41,042 | 3.5 | 3.6 | 3.9 | |||||||||
All Other States | 396,709 | 382,385 | 363,427 | 34.7 | 34.4 | 34.1 | |||||||||
Direct Statutory Premiums Written | $ | 1,143,372 | $ | 1,111,703 | $ | 1,065,207 | 100.0 | % | 100.0 | % | 100.0 | % | |||
Discontinued Operations - Life Insurance Business
Our life insurance subsidiary marketed its products primarily in the Midwest, East Coast and West. In 2019, 2018 and 2017 the direct statutory premiums written by our life insurance operations were distributed as follows:
Years Ended December 31, | % of Total | ||||||||||||||
(In Thousands) | 2019 | 2018 | 2017 | 2019 | 2018 | 2017 | |||||||||
Iowa | $ | — | $ | 9,951 | $ | 40,773 | — | % | 31.3 | % | 32.5 | % | |||
Wisconsin | — | 3,578 | 14,897 | — | 11.3 | 11.9 | |||||||||
Illinois | — | 3,227 | 10,872 | — | 10.2 | 8.7 | |||||||||
Nebraska | — | 2,572 | 10,197 | — | 8.1 | 8.1 | |||||||||
Minnesota | — | 2,003 | 12,201 | — | 6.3 | 9.7 | |||||||||
All Other States | — | 10,432 | 36,581 | — | 32.8 | 29.1 | |||||||||
Direct Statutory Premiums Written | $ | — | $ | 31,763 | $ | 125,521 | — | % | 100.0 | % | 100.0 | % | |||
Sources of Revenue and Expense
We evaluate profit or loss based upon operating and investment results. Profit or loss described in the following sections of this Management's Discussion and Analysis is reported on a pre-tax basis. Our primary sources of revenue are premiums and investment income. Major categories of expenses include losses and loss settlement expenses, underwriting and other operating expenses.
Profit Factors
Our profitability is influenced by many factors, including price, competition, economic conditions, investment returns, interest rates, catastrophic events and other natural disasters, man-made disasters, state regulations, court decisions, and changes in the law. To manage these risks and uncertainties, we seek to achieve consistent profitability through strong agency relationships, exceptional customer service, fair and prompt claims handling,
29
disciplined underwriting, superior loss control services, prudent management of our investments, appropriate matching of assets and liabilities, effective use of ceded reinsurance and effective and efficient use of technology.
MEASUREMENT OF RESULTS
Our consolidated financial statements are prepared on the basis of GAAP. We also prepare financial statements for each of our insurance company subsidiaries based on statutory accounting principles and file them with insurance regulatory authorities in the states where they do business.
Management evaluates our operations by monitoring key measures of growth and profitability. We believe that disclosure of certain non-GAAP financial measures enhances investor understanding of our financial performance. The following provides further explanation of the key measures management uses to evaluate our results:
Catastrophe losses is a commonly used non-GAAP financial measure which utilizes the designations of the Insurance Services Office ("ISO") and are reported with losses and loss settlement expense amounts net of reinsurance recoverables, unless specified otherwise. According to the ISO, a catastrophe loss is defined as a single unpredictable incident or series of closely related incidents that result in $25.0 million or more in U.S. industry-wide direct insured losses to property and that affect a significant number of insureds and insurers ("ISO catastrophe"). In addition to ISO catastrophes, we also include as catastrophes those events ("non-ISO catastrophes"), which may include U.S. or international losses, that we believe are, or will be, material to our operations, either in amount or in number of claims made. Management, at times, may determine for comparison purposes of our financial results that it is more meaningful to exclude extraordinary catastrophe losses and resulting litigation. The frequency and severity of catastrophic losses we experience in any year affect our results of operations and financial position. In analyzing the underwriting performance of our property and casualty insurance business, we evaluate performance both including and excluding catastrophe losses. Portions of our catastrophe losses may be recoverable under our catastrophe reinsurance agreements. We include a discussion of the impact of catastrophes because we believe it is meaningful for investors to understand the variability in our periodic earnings.
Years Ended December 31, | |||||||||||
(In Thousands) | 2019 | 2018 | 2017 | ||||||||
ISO catastrophes | $ | 56,357 | $ | 46,757 | $ | 66,421 | |||||
Non-ISO catastrophes (1) | 8,011 | (64 | ) | 7,618 | |||||||
Total catastrophes | $ | 64,368 | $ | 46,693 | $ | 74,039 | |||||
(1) Includes international assumed losses.
30
RESULTS OF OPERATIONS FOR THE YEARS ENDED DECEMBER 31, 2019, 2018 AND 2017
FINANCIAL HIGHLIGHTS
Years Ended December 31, | % Change | ||||||||||||||||
2019 | 2018 | ||||||||||||||||
(In Thousands) | 2019 | 2018 | 2017 | vs. 2018 | vs. 2017 | ||||||||||||
Revenues | |||||||||||||||||
Net premiums earned | $ | 1,086,972 | $ | 1,037,451 | $ | 997,492 | 4.8 | % | 4.0 | % | |||||||
Investment income, net of investment expenses | 60,414 | 52,894 | 51,190 | 14.2 | 3.3 | ||||||||||||
Net realized investment gains (losses) | |||||||||||||||||
Change in the value of equity securities | 51,231 | (21,994 | ) | 332 | NM | NM | |||||||||||
All other net realized gains | 2,548 | 1,815 | 3,723 | 40.4 | (51.2 | ) | |||||||||||
Net realized investment gains (losses) | 53,779 | (20,179 | ) | 4,055 | NM | NM | |||||||||||
Total revenues | $ | 1,201,165 | $ | 1,070,166 | $ | 1,052,737 | 12.2 | % | 1.7 | % | |||||||
Benefits, losses and expenses | |||||||||||||||||
Losses and loss settlement expenses | $ | 830,172 | $ | 731,611 | $ | 725,713 | 13.5 | % | 0.8 | % | |||||||
Amortization of deferred policy acquisition costs | 216,699 | 206,232 | 207,746 | 5.1 | (0.7 | ) | |||||||||||
Other underwriting expenses | 137,415 | 141,473 | 103,628 | (2.9 | ) | 36.5 | |||||||||||
Total benefits, losses and expenses | $ | 1,184,286 | $ | 1,079,316 | $ | 1,037,087 | 9.7 | % | 4.1 | % | |||||||
Income (loss) from continuing operations before income taxes | $ | 16,879 | $ | (9,150 | ) | $ | 15,650 | NM | (158.5 | )% | |||||||
Federal income tax expense (benefit) | 2,059 | (11,405 | ) | (29,220 | ) | (118.1 | )% | (61.0 | )% | ||||||||
Net income from continuing operations | $ | 14,820 | $ | 2,255 | $ | 44,870 | NM | (95.0 | )% | ||||||||
Income (loss) from discontinued operations, net of tax | — | (1,912 | ) | 6,153 | (100.0 | )% | (131.1 | )% | |||||||||
Gain on sale of discontinued operations, net of tax | — | 27,307 | — | (100.0 | )% | NM | |||||||||||
Net income | $ | 14,820 | $ | 27,650 | $ | 51,023 | (46.4 | )% | (45.8 | )% | |||||||
GAAP Ratios: | |||||||||||||||||
Net loss ratio (without catastrophes) | 70.5 | % | 66.0 | % | 65.4 | % | 6.8 | % | 0.9 | % | |||||||
Catastrophes - effect on net loss ratio | 5.9 | % | 4.5 | % | 7.4 | % | 31.1 | % | (39.2 | )% | |||||||
Net loss ratio(1) | 76.4 | % | 70.5 | % | 72.8 | % | 8.4 | % | (3.2 | )% | |||||||
Expense ratio(2) | 32.6 | % | 33.5 | % | 31.2 | % | (2.7 | )% | 7.4 | % | |||||||
Combined ratio(3) | 109.0 | % | 104.0 | % | 104.0 | % | 4.8 | % | — | % | |||||||
NM = not meaningful
(1) The net loss ratio is calculated by dividing the sum of losses and loss settlement expenses by net premiums earned. We use the net loss ratio as a measure of the overall underwriting profitability of the insurance business we write and to assess the adequacy of our pricing. Our net loss ratio is meaningful in evaluating our financial results as reported in our Consolidated Financial Statements.
(2) The expense ratio is calculated by dividing non-deferred underwriting expenses and amortization of deferred policy acquisition costs by net premiums earned. The expense ratio measures a company's operational efficiency in producing, underwriting and administering its insurance business.
(3) The combined ratio is a commonly used financial measure of property and casualty underwriting performance. A combined ratio below 100.0 percent generally indicates a profitable book of business. The combined ratio is the sum of the net loss ratio and the underwriting expense ratio.
In 2019, the increase in net income from continuing operations compared to 2018 was primarily due to an increase in the value of our investments in equity securities from strong increases in equity markets and an increase in net premiums earned, from rate increases, offset by an increase in losses and loss settlement expenses from an increase
31
in severity of commercial auto and auto liability losses, reserve strengthening in our Gulf Coast Region and an increase in catastrophe losses.
In 2018, the decrease in net income from continuing operations compared to 2017 was due to the decrease in the fair value of equity securities and an increase in other underwriting expenses partially offset by an increase in net premiums earned. The decrease in the fair value of equity securities was the result of volatile equity markets in the fourth quarter 2018. The increase in other underwriting expenses was primarily due to our continued investment in our multi-year Oasis project to upgrade our technology platform to enhance core underwriting decisions, selection of risks and productivity. The increase in net premiums earned was due to organic growth from a combination of new business, geographical expansion and rate increases. In 2017, our net income benefited from the Tax Cuts and Jobs Act ("Tax Act"), which resulted in a tax benefit of $21.9 million for the year.
Premiums from continuing operations
The following table shows our premiums written and earned from continuing operations for 2019, 2018 and 2017:
% Change | |||||||||||||||||
(In Thousands) | 2019 | 2018 | |||||||||||||||
Years ended December 31, | 2019 | 2018 | 2017 | vs. 2018 | vs. 2017 | ||||||||||||
Direct premiums written | $ | 1,143,372 | $ | 1,111,703 | $ | 1,065,207 | 2.8 | % | 4.4 | % | |||||||
Assumed premiums written | 27,869 | 16,761 | 15,179 | 66.3 | 10.4 | ||||||||||||
Ceded premiums written | (74,511 | ) | (66,800 | ) | (61,273 | ) | 11.5 | 9.0 | |||||||||
Net premiums written(1) | $ | 1,096,730 | $ | 1,061,664 | $ | 1,019,113 | 3.3 | % | 4.2 | % | |||||||
Less: change in unearned premiums | (12,244 | ) | (27,527 | ) | (21,588 | ) | 55.5 | (27.5 | ) | ||||||||
Less: change in prepaid reinsurance premiums | 2,486 | 3,314 | (33 | ) | (25.0 | ) | NM | ||||||||||
Net premiums earned | $ | 1,086,972 | $ | 1,037,451 | $ | 997,492 | 4.8 | % | 4.0 | % | |||||||
NM = not meaningful
(1) Net premiums written: Net premiums written is a non-GAAP measure. While not a substitute for any GAAP measure of performance, net premiums written is frequently used by industry analysts and other recognized reporting sources to facilitate comparisons of the performance of insurance companies. Net premiums written are the amount charged for insurance policy contracts issued and recognized on an annualized basis at the effective date of the policy. Management believes net premiums written are a meaningful measure for evaluating insurance company sales performance and geographical expansion efforts. Net premiums written for an insurance company consists of direct premiums written and reinsurance assumed, less reinsurance ceded. Net premiums earned is calculated on a pro rata basis over the terms of the respective policies. Unearned premium reserves are established for the portion of premiums written applicable to the unexpired term of insurance policy in force. The difference between net premiums earned and net premiums written is the change in unearned premiums and change in prepaid reinsurance premiums.
Net Premiums Written
Net premiums written comprise direct and assumed premiums written, less ceded premiums written. Direct premiums written are the total policy premiums, net of cancellations, associated with policies issued and underwritten by our property and casualty insurance business. Assumed premiums written are the total premiums associated with the insurance risk transferred to us by other insurance and reinsurance companies pursuant to reinsurance contracts. Ceded premiums written is the portion of direct premiums written that we cede to our reinsurers under our reinsurance contracts. Net premiums earned are recognized ratably over the life of a policy and differ from net premiums written, which are recognized on the effective date of the policy.
Direct Premiums Written
Direct premiums written from continuing operations increased $31.7 million in 2019 as compared to 2018 primarily due to rate increases, premium audits and endorsements. Direct premiums written from continuing operations increased $46.5 million in 2018 as compared to 2017 due to organic growth from a combination of new business and geographical expansion.
32
Assumed Premiums Written
Assumed premiums written increased $11.1 million in 2019 as compared to 2018 due to an increase in cedant premium growth and additional program placements.
Assumed premiums written decreased $1.6 million in 2018 as compared to 2017 due to an increase in cedant premium growth. In 2018, we renewed our participation in all of our assumed programs.
Ceded Premiums Written
Direct and assumed premiums written are reduced by the ceded premiums that we pay to reinsurers. For 2019, we ceded 11.5 percent more premiums to reinsurers as a result of continued growth in direct premiums written, facultative reinsurance and addition of new managing general agency contracts. For 2018, we ceded 9.0 percent more premiums to reinsurers as a result of continued growth in direct premiums written.
Losses and Loss Settlement Expenses from continuing operations
Catastrophe Exposures
Catastrophe losses are inherent risks of the property and casualty insurance business. Catastrophic events include, without limitation, hurricanes, tornadoes, earthquakes, hailstorms, wildfires, high winds, winter storms and other natural disasters, along with man-made exposures to losses resulting from, without limitation, acts of war, acts of terrorism and political instability. Such events result in insured losses that can be, and may continue to be, a material factor in our results of operations and financial position, as the extent of losses from a catastrophe is a function of both the total amount of insured exposure in an area affected by the event and the severity of the event. Because the level of insured losses that may occur in any one year cannot be accurately predicted, these losses contribute to fluctuations in our year-to-year results of operations and financial position. Some types of catastrophes are more likely to occur at certain times within the year than others, which adds an element of seasonality to our property and casualty insurance claims. Our property and casualty insurance business experiences some seasonality with regard to premiums written, which are generally highest in January and July and lowest during the fourth quarter. Losses and loss settlement expenses incurred tend to remain consistent throughout the year, with the exception of catastrophe losses, which generally are highest in the second and third quarters. The frequency and severity of catastrophic events are difficult to accurately predict in any year. However, some geographic locations are more susceptible to these events than others.
We control our direct insurance exposures in regions that are prone to naturally occurring catastrophic events through a combination of geographic diversification, restrictions on the amount and location of new business production in such regions, and reinsurance. We regularly assess our concentration of risk exposures in natural catastrophe exposed areas. We have strategies and underwriting standards to manage these exposures through individual risk selection, subject to regulatory constraints, and through the purchase of catastrophe reinsurance coverage. We use catastrophe modeling and a risk concentration management tool to monitor and control our accumulations of potential losses in natural catastrophe exposed areas of the United States, such as the Gulf and East Coasts, as well as in areas of exposure in other countries where we are exposed to a portion of an insurer's underwriting risk under our assumed reinsurance contracts.
Overall, the models indicate increased risk estimates for our exposure to hurricanes in the U.S., but the impact of the models on our book of business varies significantly among the regions that we model for hurricanes. Based on our analysis, we have implemented more targeted underwriting and rate initiatives in some regions. We will continue to take underwriting actions and/or purchase additional reinsurance as necessary to reduce our exposure.
Catastrophe modeling generally relies on multiple inputs based on experience, science, engineering and history, and the selection of those inputs requires a significant amount of judgment. The modeling results may also fail to account for risks that are outside the range of normal probability or are otherwise unforeseen. Because of this, actual results may differ materially from those derived from our modeling assumptions.
33
Despite our efforts to manage our catastrophe exposure, the occurrence of one or more severe natural catastrophic events in heavily populated areas could have a material effect on our results of operations, financial condition or liquidity.
The process of estimating and establishing reserves for losses incurred from catastrophic events is inherently uncertain and the actual ultimate cost of a claim, net of reinsurance recoveries, may vary materially from the estimated amount reserved. Although we reinsure a portion of our exposure, reinsurance may prove to be inadequate if a major catastrophic event exceeds our reinsurance limits or if we experience a number of small catastrophic events that individually fall below our reinsurance retention level.
Catastrophe Losses
In 2019, our pre-tax catastrophe losses were $64.4 million, an increase as compared to $46.7 million in 2018 and a decrease as compared to $74.0 million in 2017. In 2019, our catastrophe losses included 54 catastrophes with no one event more than $5.0 million. Catastrophe losses in 2019 added 5.9 percentage points to the combined ratio, which is below our historical 10-year average of 6.4 percentage points.
In 2018, catastrophe losses included 46 catastrophes with our largest pre-tax catastrophe losses coming from the California wildfires, which totaled $9.2 million. Catastrophe losses in 2018 added 4.5 percentage points to the combined ratio, which is below our historical 10-year average of 6.4 percentage points. In 2017, catastrophe losses were primarily due to hurricanes (Harvey, Irma, Maria) in the third quarter and destructive California wildfires in the second half of the year. In 2017, catastrophe losses included 50 catastrophes and our largest single pre-tax catastrophe loss totaled $9.0 million. Catastrophe losses in 2017 added 7.4 percentage points to the combined ratio.
Catastrophe Reinsurance
In 2019, 2018 and 2017, we did not exceed our catastrophe reinsurance retention level of $20.0 million per event.
We use many reinsurers, both domestic and foreign, which helps us to avoid concentrations of credit risk associated with our reinsurance. All reinsurers we do business with must meet the following minimum criteria: capital and surplus of at least $300.0 million and an A.M. Best rating or an S&P rating of at least "A-." If a reinsurer is rated by both rating agencies, then both ratings must be at least an "A-."
34
The following table represents the primary reinsurers we utilize and their financial strength ratings as of December 31, 2019:
Name of Reinsurer | A.M. Best | S&P Rating |
Aspen Insurance UK Limited | A | A |
General Reinsurance Corporation(2) | A++ | AA+ |
Hannover Rueckversicherung AG (1) (2) | A+ | AA- |
Lloyd's | A | A+ |
Munich Re(2) | A+ | A- |
Odyssey Re(2) | A | A- |
Partner Re(1)(2) | A+ | A+ |
QBE Reinsurance Corporation(1) | A | A+ |
SCOR Reinsurance Company(1)(2) | A+ | AA- |
Toa Re(1) | A | A+ |
Transatlantic Re(1) | A+ | A+ |
(1) | Primary reinsurers participating in the property and casualty excess of loss programs. |
(2) | Primary reinsurers participating in the surety excess of loss program. |
Refer to Part II, Item 8, Note 4 "Reinsurance" for further discussion of our reinsurance programs.
Terrorism Coverage
In January 2015, TRIPRA, which extended the Terrorism Risk Insurance Program until December 31, 2020, gradually increased the coverage trigger for shared terrorism losses between the federal government and the insurance industry to $200 billion per year, and gradually increased the industry-wide retention to $37.5 billion per year. TRIPRA coverage includes most direct commercial lines of business, including coverage for losses from nuclear, biological and chemical exposures if coverage was afforded by an insurer, with exclusions for commercial automobile insurance, burglary and theft insurance, surety, professional liability insurance and farm owners multiple peril insurance. Under TRIPRA, each insurer has a deductible amount, which is 20.0 percent of the prior year's direct commercial lines earned premiums for the applicable lines of business, and retention of 15.0 percent above the deductible. No insurer that has met its deductible shall be liable for the payment of any portion of that amount that exceeds the annual aggregate loss cap specified in TRIPRA. TRIPRA provides marketplace stability. As a result, coverage for terrorist events in both the insurance and reinsurance markets is often available. The amount of aggregate losses necessary for an act of terrorism to be certified by the U.S. Secretary of Treasury, the Secretary of State and the Attorney General was $100.0 million for 2019 and remains the same for 2020. Our TRIPRA deductible was $137.3 million for 2019 and our TRIPRA deductible is expected to be $140.4 million for 2020. Our catastrophe and non-catastrophe reinsurance programs provide limited coverage for terrorism exposure excluding nuclear, biological and chemical-related claims.
2019 Results
In 2019, our losses and loss settlement expenses were 13.5 percent higher than 2018 and our net loss ratio increased 5.9 points. The increase is primarily driven by an increase in the severity of losses in commercial auto line of business, an increase in catastrophe losses and prior year reserve strengthening in our Gulf Coast region. With the escalation of commercial auto losses industry wide we plan to reduce the size of our commercial auto book in 2020. By reducing commercial auto unit counts in poor-performing segments and writing new classes of business that are not auto heavy, we intend to achieve a better balance across all lines of business in our portfolio. Catastrophe losses increased to $64.4 million in both our direct business and assumed reinsurance business as compared to $46.7 million in 2018.
2018 Results
In 2018, our losses and loss settlement expenses were 0.8 percent higher than 2017 and our net loss ratio decreased
35
2.3 points. The decrease in our net loss ratio was due to a decrease in catastrophe losses slightly offset by a
deterioration in our core loss ratio. Catastrophe losses decreased to $46.7 million in both our direct business and
assumed reinsurance business as compared to $74.0 million in 2017. The deterioration in our core loss ratio was 0.6
percent, which was primarily driven by an increase in severity of losses in our other liability line of business from
auto related bodily injury claims.
Reserve Development
For many liability claims, significant periods of time, ranging up to several years, and for certain construction defect claims, more than a decade, may elapse between the occurrence of the loss, the reporting of the loss to us and the settlement or other disposition of the claim. As a result, loss experience in the more recent accident years for the long-tail liability coverages has limited statistical credibility in our reserving process because a relatively small proportion of losses in these accident years are reported claims and an even smaller proportion are paid losses. In addition, long-tail liability claims are more susceptible to litigation and can be significantly affected by changing contract interpretations and the legal environment. Consequently, the estimation of loss reserves for long-tail coverages is more complex and subject to a higher degree of variability. Reserves for these long-tail coverages represent a significant portion of our overall carried reserves.
When establishing reserves and monitoring reserve adequacy, we analyze historical data and consider the potential impact of various loss development factors and trends including historical loss experience, legislative enactments, judicial decisions, legal developments in imposition of damages, experience with alternative dispute resolution, results of our medical bill review process and changes and trends in general economic conditions, including the effects of inflation. All of these factors influence our estimates of required reserves and for long-tail lines these factors can change over the course of the settlement of the claim. However, there is no precise method for evaluating the specific dollar impact of any individual factor on the development of reserves.
Our reserving philosophy is to reserve claims to their ultimate expected loss amount as soon as practicable after information about a claim becomes available. This approach tends to produce, on average, prudently conservative case reserves, which we expect to result in some level of favorable development over the course of settlement.
2019 Development
The property and casualty insurance business experienced $5.3 million of favorable development in our net reserves for prior accident years for the year ended December 31, 2019. Four lines contributed favorable development with the largest contribution coming from workers' compensation, which had $37.3 million favorable development. The three other lines that experienced favorable development were fidelity and surety with $3.1 million favorable development, commercial fire and allied lines with $2.3 million favorable development, and personal automobile with $1.2 million favorable development. The favorable development for workers' compensation was primarily from reductions in reserves for reported claims which were more than sufficient to offset paid loss; loss adjustment expense ("LAE") also contributed favorable development with reductions in reserves more than sufficient to offset payments. Fidelity and surety loss developed favorably because reductions in claim reserves and salvage recoveries were more than sufficient to offset loss payments. Commercial fire and allied lines developed favorably due to paid LAE where reductions in reserves for unpaid LAE were more than sufficient to offset payments. Personal automobile developed favorably primarily due to paid LAE where reductions in reserves for unpaid LAE were more than sufficient to offset payments. Much of the favorable development was offset by unfavorable development from two lines with the largest contribution coming from commercial liability which experienced $35.0 million unfavorable development. The other line which experienced unfavorable development was commercial automobile with $3.4 million unfavorable development. Commercial liability experienced unfavorable development primarily due to paid loss which was greater than reductions in reserves for unpaid loss. Paid LAE also contributed to the unfavorable result in commercial liability. Commercial automobile experienced unfavorable development because paid loss was greater than reductions in reserves for unpaid loss, but a portion of the unfavorable loss development was offset by favorable development from LAE. On an all lines combined basis, favorable development is attributable to LAE which continues to benefit from additional litigation management efforts. The lines of business
36
not mentioned individually above, contributed an additional total of $0.2 million of unfavorable development in the aggregate.
2018 Development
The property and casualty insurance business experienced $54.2 million of favorable development in our net reserves for prior accident years for the year ended December 31, 2018. The majority of favorable development came from four lines, workers' compensation with $27.0 million favorable development, reinsurance assumed with $15.6 million favorable development, commercial automobile with $9.5 million favorable development, and fidelity and surety with $2.8 million favorable development. The only individual line with unfavorable development was commercial liability with $3.7 million of unfavorable development. Workers' compensation favorable development was primarily from reserve reductions for both reported claims and loss IBNR which were more than sufficient to offset paid loss with additional favorable development coming from LAE where the LAE IBNR reduction was more than sufficient to offset paid LAE which continues to benefit from additional litigation management efforts when compared to prior years. Reinsurance assumed favorable development is attributable reductions in reserves for both reported claims and loss IBNR as we reviewed our book of business and released excess reserves during 2018. Commercial automobile favorable development was driven by LAE where LAE IBNR reductions were more than sufficient to offset paid LAE. Fidelity and surety favorable development is attributable to reductions in reserves for both reported claims and loss IBNR which were more than sufficient to offset paid loss. Commercial liability adverse development is attributable to reserve strengthening for both reported claims and loss IBNR primarily in response to an increase in umbrella auto related claims while LAE developed favorably with reductions of LAE IBNR more than sufficient to offset paid LAE.
2017 Development
The property and casualty insurance business experienced $54.3 million of favorable development in our net reserves for prior accident years for the year ended December 31, 2017. The majority of favorable development came from two lines, commercial liability with $35.1 million favorable development and workers' compensation with $19.2 million favorable development, partially offset by $6.3 million of unfavorable development for assumed reinsurance. All other lines combined $6.3 million favorable development with no single line experiencing more than $3.7 million of development, either favorable or unfavorable. Much of the favorable long-tail liability development continues to come from LAE and is attributed to our continued litigation management efforts. There was also a reduction in reserves for incurred but not reported claims because our long tail liability has experienced fewer late reported claims than what was initially anticipated. The favorable workers' compensation development is due to the combination of reductions in reserves for reported claims and reductions in reserves for incurred but not reported claims for both loss and LAE.
Reserve development amounts can vary significantly from year-to-year depending on a number of factors, including the number of claims settled and the settlement terms, and are subject to reallocation between accident years and lines of business.
37
Net Loss Ratios by Line
The following table depicts our net loss ratios for 2019, 2018 and 2017:
Years ended December 31, | 2019 | 2018 | 2017 | |||||||||||||||||||||||||||||
(In Thousands) | Net Premiums Earned | Net Losses and Loss Settlement Expenses Incurred | Net Loss Ratio | Net Premiums Earned | Net Losses and Loss Settlement Expenses Incurred | Net Loss Ratio | Net Premiums Earned | Net Losses and Loss Settlement Expenses Incurred | Net Loss Ratio | |||||||||||||||||||||||
Commercial lines | ||||||||||||||||||||||||||||||||
Other liability | $ | 318,412 | $ | 205,695 | 64.6 | % | $ | 311,931 | $ | 183,692 | 58.9 | % | $ | 306,480 | $ | 121,054 | 39.5 | % | ||||||||||||||
Fire and allied lines | 244,010 | 185,033 | 75.8 | 234,612 | 165,097 | 70.4 | 227,711 | 178,768 | 78.5 | |||||||||||||||||||||||
Automobile | 314,755 | 332,740 | 105.7 | 284,274 | 271,248 | 95.4 | 250,465 | 266,272 | 106.3 | |||||||||||||||||||||||
Workers' compensation | 87,376 | 25,784 | 29.5 | 95,203 | 57,601 | 60.5 | 104,166 | 71,053 | 68.2 | |||||||||||||||||||||||
Fidelity and surety | 25,539 | 240 | 0.9 | 24,437 | 1,878 | 7.7 | 24,981 | 2,206 | 8.8 | |||||||||||||||||||||||
Other | 1,710 | 105 | 6.1 | 1,728 | 449 | 26.0 | 1,829 | 312 | 17.1 | |||||||||||||||||||||||
Total commercial lines | $ | 991,802 | $ | 749,597 | 75.6 | % | $ | 952,185 | $ | 679,965 | 71.4 | % | $ | 915,632 | $ | 639,665 | 69.9 | % | ||||||||||||||
Personal lines | ||||||||||||||||||||||||||||||||
Fire and allied lines | $ | 41,195 | $ | 40,783 | 99.0 | % | $ | 41,581 | $ | 32,959 | 79.3 | % | $ | 43,005 | $ | 34,503 | 80.2 | % | ||||||||||||||
Automobile | 30,882 | 26,920 | 87.2 | 29,247 | 25,016 | 85.5 | 27,046 | 28,997 | 107.2 | |||||||||||||||||||||||
Other | 1,232 | 132 | 10.7 | 1,210 | (213 | ) | (17.6 | ) | 1,159 | 268 | 23.1 | |||||||||||||||||||||
Total personal lines | $ | 73,309 | $ | 67,835 | 92.5 | % | $ | 72,038 | $ | 57,762 | 80.2 | % | $ | 71,210 | $ | 63,768 | 89.5 | % | ||||||||||||||
Reinsurance assumed | $ | 21,861 | $ | 12,740 | 58.3 | % | $ | 13,228 | $ | (6,116 | ) | (46.2 | )% | $ | 10,650 | $ | 22,280 | 209.2 | % | |||||||||||||
Total | $ | 1,086,972 | $ | 830,172 | 76.4 | % | $ | 1,037,451 | $ | 731,611 | 70.5 | % | $ | 997,492 | $ | 725,713 | 72.8 | % | ||||||||||||||
NM=Not meaningful
38
Commercial Lines
The net loss ratio in our commercial lines of business, excluding assumed reinsurance, was 75.6 percent in 2019 compared to 71.4 percent in 2018 and 69.9 percent in 2017. The net loss ratio in 2019 increased compared to 2018 with a deterioration in commercial auto and other liability lines of business from an increase in severity of commercial auto losses and auto related bodily injury claims. Also contributing to the deterioration in 2019 compared to 2018, was an increase in commercial fire and allied lines of business due to an increase in catastrophe losses. The net loss ratio in 2018 increased slightly compared to 2017 with deterioration in other liability line of business from an increase in auto related bodily injury claims due to an adverse litigious environment.
Other Liability
Other liability is business insurance covering bodily injury and property damage arising from general business operations, accidents on the insured's premises and products manufactured or sold. Because of the long-tail nature of liability claims, significant periods of time, ranging up to several years, may elapse between the occurrence of the loss, the reporting of the loss to us and the settlement of the claim.
In recent years, we began to use our loss control department more extensively in an attempt to return this line of business to a higher level of profitability. For example, our loss control department has representatives who make multiple visits each year to businesses and job sites to ensure safety. We also do not renew accounts that no longer meet our underwriting or pricing guidelines. We avoid accounts that have become too underpriced for the risk.
Construction Defect Losses
Incurred losses from construction defect claims were $19.4 million in 2019 compared to $15.9 million and $15.7 million in 2018 and 2017, respectively. At December 31, 2019, we had $60.4 million in construction defect loss and loss settlement expense reserves (excluding IBNR reserves which are calculated at the overall other liability commercial line), which consisted of 3,439 claims. In comparison, at December 31, 2018, we had reserves of $44.5 million, excluding IBNR reserves, consisting of 2,706 claims. The increase in the incurred losses is due to continued improvement in the economic environment which increases construction activity. Our West Coast region continue to be the origin of the majority of the construction defect claim activity.
Construction defect claims generally relate to allegedly defective work performed in the construction of structures such as apartments, condominiums, single family dwellings or other housing, as well as the sale of defective building materials. Such claims seek recovery due to damage caused by alleged deficient construction techniques or workmanship. The reporting of such claims can be quite delayed due to an extended statute of limitations, sometimes up to ten years. Court decisions have expanded insurers' exposure to construction defect claims as well. Defense costs are also a part of the insured expenses covered by liability policies and can be significant, sometimes greater than the cost of the actual paid claims.
We have exposure to construction defect liabilities in Colorado and surrounding states. We have historically insured small- to medium-sized contractors in this geographic area. In an effort to limit the number of future claims from multi-unit buildings, we implemented policy exclusions in 2009, later revised in 2010, that exclude liability coverage for contractors performing "residential structural" operations on any building project with more than 12 units or on single family homes in any subdivision where the contractor is working on more than 15 homes. The exclusions do not apply to remodeling or repair of an existing structure. We also changed our underwriting guidelines to add a professional liability exclusion when contractors prepare their own design work or blueprints and implemented the multi-family exclusion and tract home building limitation form for the state of Colorado and our other western states as a means to reduce our exposure in future years. When offering commercial umbrella coverage for structural residential contractors, limits of liability are typically limited to a maximum of $2.0 million per occurrence. Requests to provide additional insured status for "developers" are declined.
As a result of our acquisition of Mercer Insurance Group, Inc. in 2011, we added construction defect exposure in the states of California, Nevada and Arizona. Mercer Insurance Group, Inc. has been writing in these states for more than 20 years. In order to minimize our exposure to construction defect claims in this region, we continually review
39
the coverage we offer and our pricing models. In an effort to limit our exposure from residential multi-unit buildings, we started including condominium and townhouse construction policy exclusions in 2012 for our contracting policies in this region. For the majority of our residential contractors we limit the size of any tracts the contractor is working on to 25 homes or less and do not include a continuous trigger with our designated work exclusion. In a majority of the policies in our small service, repair and remodel contractors program, we have a favorable new residential construction exclusion. We also apply strict guidelines when additional insured forms are required and changed our underwriting guidelines to limit our exposure to large, multi-party construction defect claims.
Commercial Fire and Allied Lines
Commercial fire and allied lines include fire, allied lines, commercial multiple peril and inland marine. The insurance covers losses to an insured's property, including its contents, from weather, fire, theft or other causes. We provide this coverage through a variety of business policies.
The net loss ratio deteriorated 5.4 percentage points in 2019 compared to 2018. The deterioration is attributable to an increase in catastrophe losses.
Commercial Automobile
Our commercial automobile insurance covers physical damage to an insured's vehicle, as well as liabilities to third parties. Automobile physical damage insurance covers loss or damage to vehicles from collision, vandalism, fire, theft, flood or other causes. Automobile liability insurance covers bodily injury, damage to property resulting from automobile accidents caused by the insured, uninsured or underinsured motorists and the legal costs of defending the insured against lawsuits.
The net loss ratio deteriorated 10.3 percentage points in 2019 compared to 2018. The deterioration is attributable to an increase in severity of commercial auto losses.
Workers' Compensation
We consider our workers' compensation business to be a companion product; we rarely write stand-alone workers' compensation policies. Our workers' compensation insurance covers primarily small- to mid-size accounts. The net loss ratio improved 31.0 percentage points in 2019 compared to 2018. This improvement is attributable to the combination of three factors, decrease in reserves for newly reported claims which is due to fewer large claims in 2019, favorable prior year reserve development and a decrease in LAE reserves due to lower legal expenses.
Although we have seen steady improvement in the net loss ratio for the last two years in our worker's compensation line of business, competitive market conditions continue putting downward pressure on rates. The challenges faced by workers' compensation insurance providers to attain profitability include the regulatory climates in some states that make it difficult to obtain appropriate premium rate increases and inflationary medical costs. Consequently, we have increased the utilization of our loss control unit in the analysis of current risks, with the intention of increasing the quality of our workers' compensation book of business. We are currently using these modeling analytics to assist us in risk selection, and we will continue to evaluate the model results.
Fidelity and Surety
Our surety products guarantee performance and payment by our bonded principals. Our contract bonds protect owners from failure to perform on the part of our principals. In addition, our surety bonds protect material suppliers and subcontractors from nonpayment by our contractors. When surety losses occur, our loss is determined by estimating the cost to complete the remaining work and to pay the contractor's unpaid bills, offset by contract funds due to the contractor, reinsurance, and the value of any collateral to which we may have access.
The net loss ratio improved 6.8 percentage points in 2019 compared to 2018. This improvement is attributable to the combination of fewer large claims and a decrease in LAE in 2019 vs. 2018.
40
Personal Lines
Our personal lines consist primarily of fire and allied lines (including homeowners) and automobile lines. The net loss ratio deteriorated 12.3 percentage points in 2019 compared to 2018. The deterioration is attributable to our personal fire and allied line of business due to the combination of increased in severity of losses and increased loss IBNR in 2019 vs. 2018 which had a modest decrease in loss IBNR in 2018. The improvement in 2018 vs. 2017 was primarily due to a decrease in frequency and severity of losses and loss IBNR.
For our personal lines, we use the CATography™ Underwriter tool, which gives us the ability to determine whether the premium we charge for an exposure is adequate in areas where hurricanes and earthquakes occur. We have also implemented predictive analytics and data prefill for our personal automobile line. Data prefill is a data accessing methodology that allows for a more complete profile of our customers at the agent's point of sale during the quotation process.
Assumed Reinsurance
Our assumed reinsurance is the business we choose to write by participating in programs insuring insurance companies. Our net loss ratio increased slightly in 2019 compared to 2018. Premiums increased due to additional program placements and cedant premium growth. In 2019 we added two additional assumed programs and did not accept to renew one program from 2018.
Other Underwriting Expenses
Our underwriting expense ratio, which is a percentage of other underwriting expenses over net premiums earned, was 32.6 percent, 33.5 percent and 31.2 percent for 2019, 2018, and 2017, respectively. The decrease in the expense ratio during in 2019 as compared to 2018 is primarily due to lower employee benefit accruals and expenses caused by post-retirement benefit plan amendments made at the end of 2018. The underwriting expense ratio increased in 2018 as compared to 2017 primarily due to our investment in our multi-year Oasis project to upgrade our technology platform to enhance core underwriting decisions, selection of risks and productivity.
41
Discontinued Operations Results
Years Ended December 31, | % Change | ||||||||||||||||
2019 | 2018 | ||||||||||||||||
(In Thousands) | 2019 | 2018 | 2017 | vs. 2018 | vs. 2017 | ||||||||||||
Revenues | |||||||||||||||||
Net premiums earned | $ | — | $ | 13,003 | $ | 61,368 | (100.0 | )% | (78.8 | )% | |||||||
Investment income, net | — | 12,663 | 49,720 | (100.0 | )% | (74.5 | )% | ||||||||||
Net realized investment gains (losses) | — | (1,057 | ) | 4,008 | (100.0 | )% | (126.4 | )% | |||||||||
Other income | — | 146 | 617 | (100.0 | )% | (76.3 | )% | ||||||||||
Total revenues | $ | — | $ | 24,755 | $ | 115,713 | (100.0 | )% | (78.6 | )% | |||||||
Benefits, Losses and Expenses | |||||||||||||||||
Losses and loss settlement expenses | $ | — | $ | 10,823 | $ | 40,451 | (100.0 | )% | (73.2 | )% | |||||||
Increase in liability for future policy benefits | — | 5,023 | 27,632 | (100.0 | )% | (81.8 | )% | ||||||||||
Amortization of deferred policy acquisition costs | — | 1,895 | 5,181 | (100.0 | )% | (63.4 | )% | ||||||||||
Other underwriting expenses | — | 3,864 | 13,281 | (100.0 | )% | (70.9 | )% | ||||||||||
Interest on policyholders' accounts | — | 4,499 | 18,525 | (100.0 | )% | (75.7 | )% | ||||||||||
Total benefits, losses and expenses | $ | — | $ | 26,104 | $ | 105,070 | (100.0 | )% | (75.2 | )% | |||||||
Income (loss) before income taxes | $ | — | $ | (1,349 | ) | $ | 10,643 | (100.0 | )% | (112.7 | )% | ||||||
The sale of our discontinued operations closed on March 30, 2018, and therefore income was only earned in the first quarter of 2018. For the year ended December 31, 2018, our discontinued operations had a loss before income taxes of $1.3 million, compared to income before income taxes of $10.6 million for the same period of 2017, respectively.
Federal Income Taxes
We reported a federal income tax expense on a consolidated basis of $2.1 million or 12.2 percent of pre-tax income in 2019. In 2018, federal income tax benefit on a consolidated basis of $3.3 million or 13.5 percent of pre-tax income and federal income tax benefit on a consolidated basis of $24.7 million or 94.1 percent of pre-tax income in 2017. In 2017 our effective tax rate was impacted by the Tax Act, which was enacted on December 22, 2017. The Tax Act significantly revised the U.S. corporate income tax laws including lowering the U.S. federal corporate tax rate from 35 percent to 21 percent effective January 1, 2018. Our effective federal tax rate varied from the statutory federal income tax expense rate in each year, due primarily to our portfolio of tax-exempt securities.
In December 2017, the SEC staff issued Staff Accounting Bulletin No. 118, which addresses how a company recognizes provisional amounts when a company does not have the necessary information available, prepared or analyzed in reasonable detail to complete its accounting for the effect of the changes in the Tax Act. The measurement period ends when a company has obtained, prepared and analyzed the information necessary to finalize its accounting, but cannot extend beyond one year. As of December 31, 2018 we had completed accounting for the tax effects of enactment of the Tax Act, and no adjustment was made during the measurement period.
Due to our determination that we may not be able to fully realize the benefits of the net operating loss ("NOL") acquired in the purchase of American Indemnity Financial Corporation in 1999, which are only available to offset the future taxable income of our property and casualty insurance operations and are further limited as to the amount that can be utilized in any given year, we have recorded a valuation allowance against these NOLs. Based on a yearly review, we determine whether the benefit of the NOLs can be realized, and, if so, the decrease in the valuation allowance is recorded as a reduction to current federal income tax expense. If NOLs expire during the year, the decrease in the valuation allowance is offset with a corresponding decrease to the deferred income tax asset. The valuation allowance was reduced by $0.7 million in 2018 due to the realization of $3.1 million in NOLs, therefore reducing the valuation allowance to zero. During 2018, the remaining NOL from the purchase of American Indemnity Financial Corporation was fully realized.
As of December 31, 2019, we had no alternative minimum tax credit carryforwards.
42
INVESTMENTS
Investment Environment
The investment landscape was plagued by headwinds and uncertainty throughout all of 2019 both domestic and abroad. Risks included trading negotiations between U.S. and China, the exit of United Kingdom from the European Union, known as "Brexit", negative yielding foreign sovereign debt, an inverted yield curve, manufacturing woes, and more. Despite these risks, the U.S. economy remained strong, aided by three Federal Reserve rate cuts, to expand for the 11th straight year. Final economic numbers for 2019 showed an unemployment rate of 3.5 percent, a fifty-year low, strong consumer confidence, and slow but steady growth. All major asset classes managed strong annual returns. U.S. investment grade bonds finished up 8.7 percent due to the aforementioned uncertainty and rate cuts. This resulted in lowered yields and tighter spreads as compared to the beginning of the year, making an already difficult fixed income environment even more challenging. The S&P 500 returned 28.8 percent, its highest return since 2013, as investors sought returns and companies participated in share-repurchase programs.
Overall, the fixed income market remains challenging with low yields expected to continue given the Federal Reserve’s view of current rates as “appropriate” due to the current low inflation environment. The overall economy is expected to continue to produce slow, steady growth in 2020 with global recession risks beginning to ease. While the economic outlook is positive, downside risks still exist entering 2020. We believe our investment program is conservative in nature, and designed to outperform during periods of market uncertainty.
Investment Philosophy
The Company's assets are invested to preserve capital and maximize after-tax returns while maintaining an appropriate balance of risk. The return on our portfolio is an important component of overall financial results, but quality and safety of principal is the highest priority of our investment program. Our general investment philosophy is to purchase financial instruments with the expectation that we will hold them to their maturity. However, active management of our portfolio is considered necessary to appropriately manage risk, achieve portfolio objectives and maximize investment income as market conditions change.
Each of our insurance company subsidiaries develops an appropriate investment strategy that aligns with its business needs and supports United Fire's strategic plan and risk appetite. The portfolio is structured so as to be in compliance with state insurance laws that prescribe the quality, concentration and type of investments that may be made by insurance companies. All but a very small portion of our investment portfolio is managed internally.
Investment Portfolio
Our invested assets from continuing operations at December 31, 2019 totaled $2.2 billion, compared to $2.1 billion at December 31, 2018, an increase of $81.0 million. At December 31, 2019, fixed maturity securities and equity securities comprised 80.5 percent and 13.9 percent of our investment portfolio, respectively. Because the primary purpose of the investment portfolio is to fund future claims payments, we utilize a conservative investment philosophy, investing in a diversified portfolio of high-quality, intermediate-term taxable corporate bonds, taxable U.S. government and government agency bonds and tax-exempt U.S. municipal bonds. Our overall investment strategy is to stay fully invested (i.e., minimize cash balances). If additional cash is needed we have an ability to borrow funds available under our revolving credit facility.
Composition
We develop our investment strategies based on a number of factors, including estimated duration of reserve liabilities, short- and long-term liquidity needs, projected tax status, general economic conditions, expected rates of inflation and regulatory requirements. We administer our investment portfolio based on investment guidelines approved by management and the investment committee of our Board of Directors that comply with applicable statutory regulations.
43
The composition of our investment portfolio at December 31, 2019 is presented at carrying value in the following table:
Percent | ||||||
(In Thousands) | of Total | |||||
Fixed maturities: | ||||||
Available-for-sale | $ | 1,719,607 | 79.8 | % | ||
Trading securities | 15,256 | 0.7 | ||||
Equity securities | 299,203 | 13.9 | ||||
Mortgage loans | 42,448 | 2.0 | ||||
Other long-term investments | 78,410 | 3.6 | ||||
Short-term investments | 175 | — | ||||
Total | $ | 2,155,099 | 100.0 | % | ||
At December 31, 2019, we classified $1.7 billion, or 99.1 percent, of our fixed maturities portfolio as available-for-sale, compared to $1.7 billion, or 99.2 percent, at December 31, 2018. Available-for-sale fixed maturity securities are carried at fair value, with changes in fair value recognized as a component of accumulated other comprehensive income in stockholders' equity. We record fixed maturity trading securities, primarily convertible redeemable preferred debt securities, and equity securities at fair value, with any changes in fair value recognized in earnings.
As of December 31, 2019 and 2018, we did not have direct exposure to investments in subprime mortgages or other credit enhancement vehicles.
Credit Quality
The following table shows the composition of fixed maturity securities held in our available-for-sale and trading security portfolios by credit rating for both continuing and discontinued operations at December 31, 2019 and 2018. Information contained in the table is generally based upon the issue credit ratings provided by Moody's, unless the rating is unavailable, in which case we obtain it from Standard & Poor's.
(In Thousands) | December 31, 2019 | December 31, 2018 | |||||||||||
Rating | Carrying Value | % of Total | Carrying Value | % of Total | |||||||||
AAA | $ | 721,446 | 41.6 | % | $ | 734,471 | 41.7 | % | |||||
AA | 664,238 | 38.3 | 684,863 | 38.9 | |||||||||
A | 179,553 | 10.3 | 178,282 | 10.1 | |||||||||
Baa/BBB | 157,350 | 9.1 | 157,349 | 8.9 | |||||||||
Other/Not Rated | 12,276 | 0.7 | 7,763 | 0.4 | |||||||||
$ | 1,734,863 | 100.0 | % | $ | 1,762,728 | 100.0 | % | ||||||
Duration
Our investment portfolio is invested primarily in fixed maturity securities whose fair value is susceptible to market risk, specifically interest rate changes. Duration is a measurement used to quantify our inherent interest rate risk and analyze our ability to match our invested assets to our reserve liabilities. If our invested assets and reserve liabilities have similar durations, then any change in interest rates will have an equal effect on these accounts. The primary purpose for matching invested assets and reserve liabilities is liquidity. With appropriate matching, our investments will mature when cash is needed, preventing the need to liquidate other assets prematurely. Mismatches in the duration of assets and liabilities can cause significant fluctuations in our results of operations.
The weighted average effective duration of our portfolio of fixed maturity securities was 4.2 years at December 31, 2019 compared to 5.1 years at December 31, 2018.
The amortized cost and fair value of available-for-sale and trading fixed maturity securities at December 31, 2019, by contractual maturity, are shown in the following table. Actual maturities may differ from contractual maturities
44
because borrowers may have the right to call or prepay obligations with or without call or prepayment penalties. Asset-backed securities, mortgage-backed securities and collateralized mortgage obligations may be subject to prepayment risk and are therefore not categorized by contractual maturity.
(In Thousands) | Available-For-Sale | Trading | ||||||||||||||
Amortized | Fair | Amortized | Fair | |||||||||||||
December 31, 2019 | Cost | Value | Cost | Value | ||||||||||||
Due in one year or less | $ | 56,316 | $ | 56,635 | $ | 2,464 | $ | 3,132 | ||||||||
Due after one year through five years | 286,426 | 293,956 | 6,967 | 8,586 | ||||||||||||
Due after five years through 10 years | 481,310 | 504,300 | — | — | ||||||||||||
Due after 10 years | 556,850 | 580,907 | 2,510 | 3,538 | ||||||||||||
Asset-backed securities | 314 | 750 | — | — | ||||||||||||
Mortgage-backed securities | 6,250 | 6,356 | — | — | ||||||||||||
Collateralized mortgage obligations | 272,294 | 276,703 | — | — | ||||||||||||
$ | 1,659,760 | $ | 1,719,607 | $ | 11,941 | $ | 15,256 | |||||||||
Investment Results
We invest the premiums received from our policyholders in order to generate investment income, which is an important component of our revenues and profitability. The amount of investment income that we are able to generate is affected by many factors, some of which are beyond our control. Some of these factors are volatility in the financial markets, economic growth, inflation, changes in interest rates, world political conditions, terrorist attacks or threats of terrorism, adverse events affecting other companies in our industry or the industries in which we invest and other unpredictable national or world events. Net investment income increased 14.2 percent in 2019, compared with the same period of 2018, primarily due to an increase in the fair value of our investments in limited liability partnerships resulting from the increase in the equity markets and an increase in invested assets in 2019 compared to 2018. The valuation of our investments in limited liability partnerships varies from period to period due to current equity market conditions. We expect to maintain our investment philosophy of purchasing quality investments rated investment grade or better.
We regularly monitor the difference between our cost basis and the estimated fair value of our investments. Our accounting policy for impairment recognition requires other-than-temporary impairment charges to be recorded when we determine that it is more likely than not that we will be unable to collect all amounts due according to the contractual terms of the fixed maturity security or that the anticipated recovery in fair value of the equity security will not occur in a reasonable amount of time. Impairment charges on investments are recorded based on the fair value of the investments at the measurement date or based on the value calculated using a discounted cash flow model. Factors considered in evaluating whether a decline in value is other-than-temporary include: the length of time and the extent to which fair value has been less than cost; the financial condition and near-term prospects of the issuer; our intention to hold the investment; and the likelihood that we will be required to sell the investment.
Changes in unrealized gains and losses on available-for-sale fixed-maturity securities do not affect net income and earnings per share but do impact comprehensive income, stockholders' equity and book value per share. We believe that any unrealized losses on our available-for-sale fixed-maturity securities at December 31, 2019 are temporary based upon our current analysis of the issuers of the securities that we hold and current market conditions. It is possible that we could recognize impairment charges in future periods on securities that we own at December 31, 2019 if future events and information cause us to determine that a decline in value is other-than-temporary. However, we endeavor to invest in high quality assets to provide protection from future credit quality issues and corresponding other-than-temporary impairment write-downs.
Net Investment Income
In 2019, our investment income for continuing operations, net of investment expenses, increased $7.5 million to $60.4 million as compared to 2018, primarily due to an increase in the value of our investments in limited liability
45
partnerships resulting from the increase in the equity markets and an increase in invested assets in 2019 compared to 2018.
In 2018, our investment income for continuing operations, net of investment expenses, increased $1.7 million to $52.9 million as compared to 2017, primarily due to the increase in our invested assets in our portfolio, partially offset by a decrease in the value of our investments in limited liability partnerships in the fourth quarter, specifically related to financial institutions.
The following table summarizes the components of net investment income:
(In Thousands) Years Ended December 31, | 2019 | 2018 | 2017 | ||||||||
Investment income from continuing operations: | |||||||||||
Interest on fixed maturities | $ | 50,274 | $ | 51,356 | $ | 44,784 | |||||
Dividends on equity securities | 7,842 | 7,731 | 7,108 | ||||||||
Income on other long-term investments | |||||||||||
Interest | 3,115 | 8,383 | 6,870 | ||||||||
Change in value (1) | 1,114 | (10,116 | ) | (2,812 | ) | ||||||
Interest on mortgage loans | 1,595 | 412 | — | ||||||||
Interest on short-term investments | 522 | 606 | 120 | ||||||||
Interest on cash and cash equivalents | 2,681 | 1,875 | 1,125 | ||||||||
Other | 252 | 307 | 300 | ||||||||
Total investment income from continuing operations | $ | 67,395 | $ | 60,554 | $ | 57,495 | |||||
Less investment expenses | 6,981 | 7,660 | 6,305 | ||||||||
Net investment income from continuing operations | $ | 60,414 | $ | 52,894 | $ | 51,190 | |||||
Net investment income from discontinued operations | — | 12,663 | 49,720 | ||||||||
Net investment income | $ | 60,414 | $ | 65,557 | $ | 100,910 | |||||
(1) | Represents the change in value of our interests in limited liability partnerships that are recorded on the equity method of accounting. |
In 2019, 74.6 percent of our gross investment income from continuing operations originated from interest on fixed maturities, compared to 84.8 percent and 77.9 percent in 2018 and 2017, respectively.
The following table details our annualized yield on average invested assets from continuing operations for 2019 and 2018, and both continuing and discontinued operations for 2017, which is based on our invested assets (including money market accounts) at the beginning and end of the year divided by net investment income:
(In Thousands) | ||||||||||
Years ended December 31, | Average Invested Assets | Investment Income, Net | Annualized Yield on Average Invested Assets | |||||||
2019 | $ | 2,120,916 | $ | 60,414 | 2.8 | % | ||||
2018 | 1,986,239 | 52,894 | 2.7 | % | ||||||
2017 | 3,333,809 | 100,910 | 3.0 | % | ||||||
46
Net Realized Investment Gains and Losses
The following table summarizes the components of our net realized investment gains or losses:
(In Thousands) Years Ended December 31, | 2019 | 2018 | 2017 | ||||||||
Net realized investment gains (losses) from continuing operations: | |||||||||||
Fixed maturities: | |||||||||||
Available-for-sale | $ | 655 | $ | (254 | ) | $ | 829 | ||||
Trading securities | |||||||||||
Change in fair value | 1,351 | (296 | ) | 924 | |||||||
Sales | 1,993 | 1,226 | 244 | ||||||||
Equity securities | |||||||||||
Change in fair value | 51,231 | (21,994 | ) | 332 | |||||||
Sales | 725 | 1,702 | 1,610 | ||||||||
Mortgage loans | (26 | ) | (46 | ) | — | ||||||
Real Estate | (2,150 | ) | (517 | ) | $ | 116 | |||||
Total net realized investment gains from continuing operations | $ | 53,779 | $ | (20,179 | ) | $ | 4,055 | ||||
Total net realized investment gains from discontinued operations | — | (1,057 | ) | 4,008 | |||||||
Total net realized investment gains | $ | 53,779 | $ | (21,236 | ) | $ | 8,063 | ||||
Net Unrealized Investment Gains and Losses
As of December 31, 2019, net unrealized investment gains, after tax, totaled $47.3 million compared to unrealized losses of $9.3 million and unrealized gains of $214.9 million as of December 31, 2018 and 2017, respectively. The increase in net unrealized investment gains in 2019 is primarily the result of an increase in the value of the fixed maturity portfolio due to lower interest rates during 2019.
The decrease in net unrealized investment gains in 2018 is primarily the result of the cumulative change in accounting principles on recognizing the change in the value of equity securities in the income statement. The change in accounting principles required unrealized gains on equity securities of $191.2 million, after-tax, as of January 1, 2018, to be reclassified to retained earnings from accumulated other comprehensive income, both within shareholders equity. The remaining decrease is due to a decrease in the value of the fixed maturity portfolio due to rising interest rates.
The increase in net unrealized investment gains in 2017 is primarily the result of a decrease in interest rates, which positively impacted the valuation of our fixed maturity security portfolio during 2017 and an increase in the fair value of our equity security portfolio. Our net unrealized investment gains also increased due to the decrease in the tax rate from the Tax Act enactment.
The following table summarizes the change in our net unrealized investment gains (losses):
(In Thousands) Years Ended December 31, | 2019 | 2018 | 2017 | ||||||||
Changes in net unrealized investment gains (losses): | |||||||||||
Available-for-sale fixed maturity securities | $ | 71,648 | $ | (57,475 | ) | $ | 25,573 | ||||
Equity securities | — | — | 40,168 | ||||||||
Deferred policy acquisition costs | — | 7,274 | 119 | ||||||||
Income tax effect | (15,046 | ) | 10,543 | (21,545 | ) | ||||||
Cumulative change in accounting principles | — | (191,244 | ) | — | |||||||
Net unrealized investment depreciation of discontinued operations, sold | — | 6,714 | — | ||||||||
Accumulated effect of change in enacted tax rate | — | — | 36,658 | ||||||||
Total change in net unrealized investment gains (losses), net of tax | $ | 56,602 | $ | (224,188 | ) | $ | 80,973 | ||||
47
MARKET RISK
Our Consolidated Balance Sheets include financial instruments whose fair values are subject to market risk. The active management of market risk is integral to our operations. Market risk is the potential for loss due to a decrease in the fair value of securities resulting from uncontrollable fluctuations, such as: interest rate risk, equity price risk, foreign exchange risk, credit risk, inflation, or geopolitical conditions. Our primary market risk exposures are: changes in interest rates, deterioration of credit quality in specific issuers, sectors or the economy as a whole, and an unforeseen decrease in the liquidity of securities we hold. We have no foreign exchange risk.
Interest Rate Risk
Interest rate risk is the price sensitivity of a fixed income maturity security or portfolio of securities to changes in level of interest rates. Generally, there is an inverse relationship between changes in interest rates and changes in the price of a fixed income/maturity security. Plainly stated, if interest rates go up (down), bond prices go down (up). A vast majority of our holdings are fixed income maturity and other interest rate sensitive securities that will decrease (increase) in value as interest rates increase (decrease). While it is generally our intent to hold our investments in fixed maturity securities to maturity, we have classified a majority of our fixed maturity portfolio as available-for-sale. Available-for-sale fixed income maturity securities are carried at fair value on the Consolidated Balance Sheets with unrealized gains or losses reported net of tax in Accumulated Other Comprehensive Income. A change in the prevailing interest rates generally translates into a change in the fair value of our fixed income/maturity securities, and by extension, our overall book value.
Market Risk and Duration
We analyze potential changes in the value of our investment portfolio due to the market risk factors noted above within the overall context of asset and liability management. A technique we use in the management of our investment portfolio is the calculation of duration. Our actuaries estimate the payout pattern of our reserve liabilities to determine their duration, which is the present value of the weighted average payments expressed in years. We then establish a target duration for our investment portfolio so that at any given time the estimated cash generated by the investment portfolio will closely match the estimated cash required for the payment of the related reserves. We structure the investment portfolio to meet the target duration to achieve the required cash flow, based on liquidity and market risk factors.
Impact of Interest Rate Changes
The amounts set forth in the following table detail the impact of hypothetical interest rate changes on the fair value of fixed maturity securities held at December 31, 2019. The sensitivity analysis measures the change in fair values arising from immediate changes in selected interest rate scenarios. We employed hypothetical parallel shifts in the yield curve of plus or minus 100 and 200 basis points in the simulations. Additionally, based upon the yield curve shifts, we employ estimates of prepayment speeds for mortgage-related products and the likelihood of call or put options being exercised within the simulations.
The selection of a 100-basis-point and 200-basis-point increase or decrease in interest rates should not be construed as a prediction by our management of future market events, but rather as an illustration of the potential impact of an event.
48
December 31, 2019 | -200 Basis | -100 Basis | +100 Basis | + 200 Basis | |||||||||||||||
(In Thousands) | Points | Points | Base | Points | Points | ||||||||||||||
AVAILABLE-FOR-SALE | |||||||||||||||||||
Fixed maturities | |||||||||||||||||||
Bonds | |||||||||||||||||||
U.S. Treasury | $ | 71,317 | $ | 70,391 | $ | 69,491 | $ | 68,614 | $ | 67,762 | |||||||||
U.S. government agency | 104,452 | 102,447 | 100,202 | 94,927 | 87,395 | ||||||||||||||
States, municipalities and political subdivisions | |||||||||||||||||||
General obligations: | |||||||||||||||||||
Midwest | 94,410 | 91,442 | 88,594 | 85,383 | 80,840 | ||||||||||||||
Northeast | 33,263 | 32,247 | 31,270 | 30,211 | 28,816 | ||||||||||||||
South | 123,741 | 119,371 | 115,203 | 110,506 | 104,153 | ||||||||||||||
West | 120,299 | 115,192 | 110,317 | 105,215 | 98,969 | ||||||||||||||
Special revenue: | |||||||||||||||||||
Midwest | 152,342 | 145,943 | 139,892 | 133,358 | 124,248 | ||||||||||||||
Northeast | 68,832 | 65,076 | 61,543 | 57,954 | 53,536 | ||||||||||||||
South | 260,451 | 247,229 | 234,666 | 220,980 | 203,020 | ||||||||||||||
West | 159,718 | 152,064 | 144,844 | 137,059 | 126,877 | ||||||||||||||
Foreign bonds | 5,372 | 5,243 | 5,117 | 4,996 | 4,878 | ||||||||||||||
Public utilities | 69,690 | 66,582 | 63,651 | 60,864 | 58,198 | ||||||||||||||
Corporate bonds | |||||||||||||||||||
Energy | 32,903 | 31,474 | 30,124 | 28,845 | 27,621 | ||||||||||||||
Industrials | 57,375 | 55,654 | 54,015 | 52,450 | 50,949 | ||||||||||||||
Consumer goods and services | 53,668 | 51,512 | 49,466 | 47,520 | 45,658 | ||||||||||||||
Health care | 10,345 | 9,899 | 9,480 | 9,085 | 8,714 | ||||||||||||||
Technology, media and telecommunications | 30,999 | 29,270 | 27,670 | 26,183 | 24,793 | ||||||||||||||
Financial services | 108,101 | 104,138 | 100,253 | 96,276 | 92,374 | ||||||||||||||
Mortgage backed securities | 6,757 | 6,554 | 6,356 | 6,106 | 5,828 | ||||||||||||||
Collateralized mortgage obligations | |||||||||||||||||||
Government national mortgage association | 87,871 | 84,825 | 80,356 | 74,868 | 69,303 | ||||||||||||||
Federal home loan mortgage corporation | 127,408 | 125,929 | 124,502 | 120,588 | 114,324 | ||||||||||||||
Federal national mortgage association | 74,189 | 73,410 | 71,845 | 67,893 | 63,173 | ||||||||||||||
Asset-backed securities | 750 | 750 | 750 | 750 | 750 | ||||||||||||||
Total Available-For-Sale Fixed Maturities | $ | 1,854,253 | $ | 1,786,642 | $ | 1,719,607 | $ | 1,640,631 | $ | 1,542,179 | |||||||||
TRADING | |||||||||||||||||||
Fixed maturities | |||||||||||||||||||
Bonds | |||||||||||||||||||
Corporate bonds | |||||||||||||||||||
Industrials | |||||||||||||||||||
Consumer goods and services | 2,334 | 2,305 | 2,276 | 2,248 | 2,220 | ||||||||||||||
Health care | 6,598 | 5,541 | 4,701 | 4,031 | 3,496 | ||||||||||||||
Technology, media and telecommunications | 2,479 | 2,069 | 1,732 | 1,455 | 1,226 | ||||||||||||||
Financial services | 2,573 | 2,516 | 2,460 | 2,407 | 2,355 | ||||||||||||||
Redeemable preferred stock | 4,087 | 4,087 | 4,087 | 4,087 | 4,087 | ||||||||||||||
Total Trading Fixed Maturities | $ | 18,071 | $ | 16,518 | $ | 15,256 | $ | 14,228 | $ | 13,384 | |||||||||
Total Fixed Maturity Securities | $ | 1,872,324 | $ | 1,803,160 | $ | 1,734,863 | $ | 1,654,859 | $ | 1,555,563 | |||||||||
To the extent actual results differ from the assumptions utilized, our duration and interest rate measures could be significantly affected. As a result, these calculations may not fully capture the impact of nonparallel changes in the relationship between short-term and long-term interest rates.
Equity Price Risk
Equity price risk is the potential loss arising from changes in the fair value (i.e., market price) of equity securities held in our portfolio. Changes in the price of an equity security may be due to a change in the future earnings capacity or strategic outlook of the security issuer, and what investors are willing to pay for those future earnings and related strategy. The carrying values of our equity securities are based on quoted market prices, from an independent source, as of the balance sheet date. Market prices of equity securities, in general, are subject to
49
fluctuations that could cause the amount to be realized upon the future sale of the securities to differ significantly from the current reported value. The fluctuations may result from perceived changes in the underlying economic characteristics of the security issuer, the relative price of alternative investments, general market conditions, and supply/demand factors related to a particular security.
Impact of Price Change
The following table details the effect on the fair value of our investments in equity securities for a positive and negative 10 percent price change at December 31, 2019:
(In Thousands) | -10% | Base | +10% | |||||||||
Estimated fair value of equity securities | $ | 269,283 | $ | 299,203 | $ | 329,123 | ||||||
Foreign Currency Exchange Rate Risk
Foreign currency exchange rate risk arises from the possibility that changes in foreign exchange rates will impact our transactions with foreign reinsurers relating to the settlement of amounts due to or from foreign reinsurers in the normal course of business. We consider this risk to be immaterial to our operations.
Credit Risk
Credit risk is the willingness and ability of a borrower to repay on time and in full any principal and interest due to the lender. Losses related to credit risk are realized through the income statement and have a direct impact on the earnings of UFG. Given the vast majority of our holdings are fixed income maturity securities, we view credit risk as our primary investment risk. Our internal Investment Department has developed and maintains a rigorous underwriting process to analyze and measure the expected frequency and severity of loss (i.e., credit quality) for government, agency, municipal, structured security, and corporate bond issuers. The objective is to maintain the appropriate balance of risk in our portfolio, consistent with our Investment Policy Statement and conservative investment style, and ensure the portfolio is compensated appropriately for the credit risk it holds. We do have within our municipal bond holdings a small number of securities whose ratings were enhanced by third-party insurance for the payment of principal and interest in the event of an issuer default. Of the insured municipal securities in our investment portfolio, 99.6 percent and 99.5 percent were rated "A" or above, and 95.6 percent and 94.7 percent were rated "AA" or above at December 31, 2019 and 2018, respectively, without the benefit of insurance. Due to the underlying financial strength of the issuers of the securities, we believe that the loss of insurance would not have a material impact on our operations, financial position, or liquidity.
We have no direct exposure in any of the guarantors of our investments. Our largest indirect exposure with a single guarantor totaled $11.7 million or 24.2 percent of our insured municipal securities at December 31, 2019, as compared to $20.0 million or 19.5 percent at December 31, 2018. Our five largest indirect exposures to financial guarantors accounted for 81.2 percent and 73.7 percent of our insured municipal securities at December 31, 2019 and 2018, respectively.
LIQUIDITY AND CAPITAL RESOURCES
Liquidity measures our ability to generate sufficient cash flows to meet our short- and long-term cash obligations. Our cash inflows are primarily a result of the receipt of premiums, reinsurance recoveries, sales or maturities of investments, and investment income. Cash provided from these sources is used to fund the payment of losses and loss settlement expenses, the purchase of investments, operating expenses, dividends, pension plan contributions, and in recent years, common stock repurchases.
We monitor our capital adequacy to support our business on a regular basis. The future capital requirements of our business will depend on many factors, including our ability to write new business successfully and to establish premium rates and reserves at levels sufficient to cover losses. Our ability to underwrite is largely dependent upon the quality of our claims paying and financial strength ratings as evaluated by independent rating agencies. In particular, we require (1) sufficient capital to maintain our financial strength ratings, as issued by various rating
50
agencies, at a level considered necessary by management to enable our insurance company subsidiaries to compete and (2) sufficient capital to enable our insurance company subsidiaries to meet the capital adequacy tests performed by regulatory agencies in the United States.
Cash outflows may be variable because of the uncertainty regarding settlement dates for losses. In addition, the timing and amount of individual catastrophe losses are inherently unpredictable and could increase our liquidity requirements. The timing and amount of reinsurance recoveries may be affected by reinsurer solvency and reinsurance coverage disputes.
Historically, we have generated substantial cash inflows from operations. It is our policy to invest the cash generated from operations in securities with maturities that, in the aggregate, correlate to the anticipated timing of payments for losses and loss settlement expenses. The majority of our assets are invested in available-for-sale fixed maturity securities.
The following table displays a summary of cash sources and uses in 2019, 2018 and 2017 from continuing and discontinued operations:
Cash Flow Summary | Years Ended December 31, | ||||||||||
(In Thousands) | 2019 | 2018 | 2017 | ||||||||
Cash provided by (used in) | |||||||||||
Operating activities | $ | 93,752 | $ | 110,104 | $ | 170,094 | |||||
Investing activities | 4,501 | (19,204 | ) | (61,985 | ) | ||||||
Financing activities | (41,985 | ) | (115,188 | ) | (107,549 | ) | |||||
Net increase (decrease) in cash and cash equivalents | $ | 56,268 | $ | (24,288 | ) | $ | 560 | ||||
In the Consolidated Statement of Cash Flows, cash flows from discontinued operations are shown in separate lines in each of the operating, investing and financing sections of the Cash Flow Statement. Our cash flows from continuing operations were sufficient to meet our current liquidity needs for the full-year periods ended December 31, 2019, 2018 and 2017 and we anticipate they will be sufficient to meet our future liquidity needs.
Operating Activities
Net cash flows provided by operating activities totaled $93.8 million, $110.1 million and $170.1 million in 2019, 2018 and 2017, respectively. Our cash flows from operations were sufficient to meet our liquidity needs for 2019, 2018 and 2017.
Investing Activities
Cash in excess of operating requirements is generally invested in fixed maturity securities and equity securities. Fixed maturity securities provide regular interest payments and allow us to match the duration of our liabilities. Equity securities provide dividend income, potential dividend income growth and potential appreciation. For further discussion of our investments, including our philosophy and portfolio, see the "Investment Portfolio" section contained in this Item.
In addition to investment income, possible sales of investments and proceeds from calls or maturities of fixed maturity securities also can provide liquidity. During the next five years, $0.3 billion, or 19.4 percent of our fixed maturity portfolio will mature.
We invest funds required for short-term cash needs primarily in money market accounts, which are classified as cash equivalents. At December 31, 2019, our cash and cash equivalents included $9.3 million related to these money market accounts, compared to $3.3 million at December 31, 2018.
Net cash flows provided by investing activities totaled $4.5 million in 2019 and used in investing activities totaled $19.2 million and $62.0 million in 2018 and 2017, respectively. In 2019, we had cash inflows from scheduled and unscheduled investment maturities, redemptions, prepayments, and sales of investments, from continuing
51
operations, that totaled $311.7 million compared to $263.8 million and $205.1 million for the same period in 2018 and 2017, respectively. Our cash inflows from scheduled and unscheduled investment maturities, redemptions, prepayments, and sales of investments, from discontinued operations totaled $29.7 million and $148.6 million in 2018 and 2017, respectively.
Our cash outflows for investment purchases from continuing operations totaled $274.7 million in 2019, compared to $540.4 million and $267.5 million for the same period in 2018 and 2017, respectively. Our cash outflows for investment purchases from discontinued operations totaled $15.4 million in 2018, compared to $131.0 million for the same period in 2017 respectively.
Financing Activities
Net cash flows used in financing activities totaled $42.0 million, $115.2 million and $107.5 million in 2019, 2018 and 2017, respectively. Net cash flows used in financing activities from continuing operations totaled $42.0 million, $103.6 million and $52.3 million in 2019, 2018 and 2017, respectively. The higher net cash flows used in financing activities in 2018 as compared to 2019 and 2017 is primarily due to the special cash dividend of $3.00 per share paid on August 20, 2018. Net cash flows used in financing activities from discontinued operations totaled $11.5 million and $55.3 million in 2018 and 2017, respectively, primarily due to net annuity withdrawals.
Dividends
Dividends paid to shareholders totaled $32.7 million, $105.4 million and $27.3 million in 2019, 2018 and 2017, respectively. The increase in dividends paid to shareholders in 2018 is primarily due to a special cash dividend of $3.00 per share paid to shareholders on August 20, 2018. Our practice has been to pay quarterly cash dividends, which we have paid every quarter since March 1968.
Payments of any future dividends and the amounts of such dividends, however, will depend upon factors such as net income, financial condition, capital requirements, and general business conditions. We will only pay dividends if declared by our Board of Directors out of legally available funds.
As a holding company with no independent operations of its own, United Fire Group, Inc. relies on dividends received from its insurance company subsidiaries in order to pay dividends to its common shareholders. Dividends payable by our insurance subsidiaries are governed by the laws in the states in which they are domiciled. In all cases, these state laws permit the payment of dividends only from earned surplus arising from business operations. For example, under Iowa law, the maximum dividend or distribution that may be paid within a 12-month period without prior approval of the Iowa Insurance Commissioner is generally restricted to the greater of 10 percent of statutory surplus as of the preceding December 31, or net income of the preceding calendar year on a statutory basis, not greater than earned statutory surplus. Other states in which our insurance company subsidiaries are domiciled may impose similar restrictions on dividends and distributions. Based on these restrictions, at December 31, 2019, our insurance company subsidiary, United Fire & Casualty, is able to make a minimum of $154.2 million in dividend payments without prior regulatory approval. These restrictions are not expected to have a material impact in meeting our cash obligations.
Share Repurchases
Under our share repurchase program, first announced in August 2007, we may purchase our common stock from time to time on the open market or through privately negotiated transactions. The amount and timing of any purchases will be at our discretion and will depend upon a number of factors, including the share price, economic and general market conditions, and corporate and regulatory requirements. Our share repurchase program may be modified or discontinued at any time.
During 2019, 2018 and 2017, pursuant to authorization by our Board of Directors, we repurchased 258,756, 120,372, and 701,899 shares of our common stock, respectively, which used cash totaling $11.7 million in 2019, $5.4 million in 2018 and $29.8 million in 2017. At December 31, 2019, we were authorized to purchase an
52
additional 1,857,444 shares of our common stock under our share repurchase program, which expires in August 2020.
Credit Facilities
Information specific to our credit facilities is incorporated by reference from Note 14 "Credit Facility" contained in Part II, Item 8, "Financial Statements and Supplementary Data."
Stockholders' Equity
Stockholders' equity increased 2.5 percent to $910.5 million at December 31, 2019, from $888.4 million at December 31, 2018. The increase is primarily attributed to the increase in net unrealized investment gains net of tax of $56.6 million, net income of $14.8 million, and stock based compensation of $8.5 million, all offset by payment of stockholder dividends of $32.7 million, share repurchases of $11.7 million, and change in liability for employee benefit plans of $13.0 million. As of December 31, 2019, the book value per share of our common stock was $36.40, compared to $35.40 at December 31, 2018.
Risk-Based Capital
The NAIC adopted risk-based capital requirements, which requires us to calculate a minimum capital requirement for each of our insurance companies based on individual company insurance risk factors. These "risk-based capital" results are used by state insurance regulators to identify companies that require regulatory attention or the initiation of regulatory action. At December 31, 2019, all of our insurance companies had capital well in excess of required levels.
Contractual Obligations and Commitments
The following table shows our contractual obligations and commitments, including our estimated payments due by period at December 31, 2019:
(In Thousands) | Payments Due By Period | ||||||||||||||||||
Contractual Obligations | Total | Less Than One Year | One to Three Years | Three to Five Years | More Than Five Years | ||||||||||||||
Loss and loss settlement expense reserves | $ | 1,421,754 | $ | 503,916 | $ | 490,744 | $ | 242,326 | $ | 184,768 | |||||||||
Operating leases | 16,861 | 7,517 | 7,728 | 1,577 | 39 | ||||||||||||||
Profit-sharing commissions | 19,600 | 19,600 | |||||||||||||||||
Pension plan contributions | 10,000 | 10,000 | |||||||||||||||||
Total | $ | 1,468,215 | $ | 541,033 | $ | 498,472 | $ | 243,903 | $ | 184,807 | |||||||||
Loss and Loss Settlement Expense Reserves
The amounts presented are estimates of the dollar amounts and time periods in which we expect to pay out our gross loss and loss settlement expense reserves. Because the timing of future payments may vary from the stated contractual obligation, these amounts are estimates based upon historical payment patterns and may not represent actual future payments. Refer to "Critical Accounting Policies — Loss and Loss Settlement Expenses" in this section for further discussion.
Operating Leases
Our operating lease obligations are for the rental of office space, vehicles, computer equipment and office equipment. For further discussion of our operating leases, refer to Part II, Item 8, Note 13 "Lease Commitments."
53
Profit-Sharing Commissions
We offer our agents a profit-sharing plan as an incentive for them to place high-quality property and casualty insurance business with us. Based on business produced by the agencies in 2019, property and casualty agencies will receive profit-sharing payments of $19.6 million in 2020.
Pension Plan Payments
We estimate the pension contribution for 2020 in accordance with the Pension Protection Act of 2006 (the "Act"). Contributions for future years are dependent on a number of factors, including actual performance versus assumptions made at the time of the actuarial valuations and maintaining certain funding levels relative to regulatory requirements. Contributions in 2020, and in future years, are expected to be at least equal to the IRS minimum required contribution in accordance with the Act.
OFF BALANCE SHEET ARRANGEMENTS
Funding Commitments
We hold investments in limited liability partnerships as part of our investment strategy. At December 31, 2019, pursuant to an agreement with our limited liability partnership investments, we are contractually committed to make consolidated capital contributions up to $14.1 million upon request of the partnerships through July 31, 2028. These partnerships are included in our other invested assets on the Consolidated Balance Sheets with a current fair value of $16.5 million, or 0.8% of our total invested assets, at December 31, 2019. We recognized investment income of $0.1 million from these investments during 2019.
CRITICAL ACCOUNTING POLICIES
Critical accounting policies are defined as those that are representative of significant judgments and uncertainties and that may potentially result in materially different results under different assumptions and conditions. We base our discussion and analysis of our results of operations and financial condition on the amounts reported in our Consolidated Financial Statements, which we have prepared in accordance with GAAP. As we prepare these Consolidated Financial Statements, we must make estimates and assumptions that affect the reported amounts of assets and liabilities, the disclosure of contingent assets and liabilities at the date of the financial statements, and the reported amounts of revenues and expenses for the reporting period. We evaluate our estimates on an ongoing basis. We base our estimates on historical experience and on other assumptions we believe to be reasonable under the circumstances. Actual results could differ from those estimates. We believe our most critical accounting policies are as follows.
Investment Valuation
Upon acquisition, we classify investments in marketable securities as held-to-maturity, available-for-sale, or trading. We record investments in available-for-sale and trading fixed maturity securities and equity securities at fair value. Other long-term investments consist primarily of our interests in limited liability partnerships that are recorded on the equity method of accounting. We record mortgage loans at their amortized cost less any valuation allowance.
In general, investment securities are exposed to various risks, such as interest rate risk, credit risk, and overall market volatility risk. Therefore, it is reasonably possible that changes in the fair value of our investment securities that are reported at fair value will occur in the near term and such changes could materially affect the amounts reported in the Consolidated Financial Statements. Also, it is reasonably possible that changes in the value of our investments in trading securities and limited liability partnerships could occur in the future and such changes could materially affect our results of operations as reported in our Consolidated Financial Statements.
54
Fair Value Measurement
Information specific to the fair value measurement of our financial instruments and disclosures is incorporated by reference from Note 3 "Fair Value of Financial Instruments" contained in Part II, Item 8, "Financial Statements and Supplementary Data."
Other-Than-Temporary Impairment ("OTTI") Charges
We continually monitor the difference between our cost basis and the estimated fair value of our investments. Our accounting policy for impairment recognition requires OTTI charges to be recorded when we determine that it is more likely than not that we will be unable to collect all amounts due according to the contractual terms of the fixed maturity security. Impairment charges on investments are recorded based on the fair value of the investments at the measurement date or based on the value calculated using a discounted cash flow model. Factors considered in evaluating whether a decline in value is other-than-temporary include: the length of time and the extent to which fair value has been less than cost; the financial condition and near-term prospects of the issuer; our intention to hold the investment; and the likelihood that we will be required to sell the investment.
The determination of the amount of impairments varies by investment type and is based upon our periodic evaluation and assessment of known and inherent risks associated with the respective asset class. Such evaluations and assessments are revised as conditions change and new information becomes available. Additionally, our management considers a wide range of factors about the instrument issuer and uses its best judgment in evaluating the cause of the decline in the estimated fair value of the instrument and in assessing the prospects for recovery. Inherent in management's evaluation of the security are assumptions and estimates about the operations of the issuer and its future earnings potential.
At December 31, 2019 and 2018, we had a number of securities with fair value less than the cost basis. The total unrealized loss on these securities was $0.8 million at December 31, 2019, compared with $23.6 million at December 31, 2018. Our rationale for not recording OTTI charges on these securities is discussed in Part II, Item 8, Note 2 "Summary of Investments."
Deferred Policy Acquisition Costs ("DAC")
We record an asset for certain costs of underwriting new business, primarily commissions, premium taxes and variable underwriting and policy issue expenses that have been deferred. The amount of underwriting compensation expense eligible for deferral is based on time studies and a ratio of success in policy placement. At December 31, 2019 and 2018, our DAC asset was $94.3 million and $92.8 million, respectively.
The DAC asset is amortized over the life of the policies written, generally one year. We assess the recoverability of DAC on a quarterly basis by line of business. This assessment is performed by comparing recorded unearned premium to the sum of unamortized DAC and estimates of expected losses and loss settlement expenses. If the sum of these costs exceeds the amount of recorded unearned premium (i.e., the line of business is expected to generate an operating loss), the excess is recognized in current period other underwriting expenses as an offset against the established DAC asset. We refer to this offset as a premium deficiency charge.
To calculate the premium deficiency charge by line of business, we estimate an expected loss and loss settlement expense ratio which is based on our best estimate of future losses for each line of business. This calculation is performed on a quarterly basis and developed in conjunction with our quarterly reserving process. The expected loss and loss settlement expense ratios are the only assumptions we utilize in our premium deficiency calculation. Changes in these assumptions can have a significant impact on the amount of premium deficiency charge recognized for a line of business. The premium deficiency calculation is aggregated by line of business in a manner consistent with how the policies are currently being marketed and managed.
The following table illustrates the hypothetical impact on the premium deficiency charge recorded for the quarter ended December 31, 2019, of reasonably likely changes in the assumed loss and loss settlement expense ratios utilized for purposes of this calculation. The entire impact of these changes would be recognized through income as
55
other underwriting expenses. The following table illustrates the impact of potential changes in the expected loss and loss settlement expense ratios for all lines of business on the premium deficiency charge. The base amount indicated below is the actual premium deficiency charge recorded as an offset against the DAC asset established as of the quarter ended December 31, 2019:
Sensitivity Analysis — Impact of Changes in Projected Loss and Loss Settlement Expense Ratios | |||||||||||||||||||
(In Thousands) | -10% | -5% | Base | +5% | +10% | ||||||||||||||
Premium deficiency charge estimated | $ | — | $ | — | $ | 4,557 | $ | 13,357 | $ | 24,386 | |||||||||
Actual future results could differ materially from our assumptions used to calculate the recorded DAC asset. Changes in our assumed loss and loss settlement expense ratios in the future would impact the amount of deferred costs in the period such changes in assumptions are made. The premium deficiency charge calculated for the quarter ended December 31, 2019 was $4.6 million compared to the premium deficiency charge of $4.3 million calculated for the same period of 2018.
Losses and Loss Settlement Expenses
Reserves for losses and loss settlement expenses are reported using our best estimate of ultimate liability for claims that occurred prior to the end of any given reporting period, but have not yet been paid. Before credit for reinsurance recoverables, these reserves were $1,421.8 million and $1,312.5 million at December 31, 2019 and 2018, respectively. We purchase reinsurance to mitigate the impact of large losses and catastrophic events. Loss and loss settlement expense reserves ceded to reinsurers were $68.5 million for 2019 and $57.1 million for 2018. Our reserves, before credit for reinsurance recoverables, by line of business as of December 31, 2019, were as follows:
(In Thousands) | Case Basis | IBNR | Loss Settlement Expense | Total Reserves | |||||||||||
Commercial lines | |||||||||||||||
Fire and allied lines | $ | 90,332 | $ | 17,170 | $ | 22,764 | $ | 130,266 | |||||||
Other liability | 302,120 | 107,942 | 189,895 | 599,957 | |||||||||||
Automobile | 282,213 | 79,552 | 83,228 | 444,993 | |||||||||||
Workers' compensation | 153,691 | 5,000 | 23,761 | 182,452 | |||||||||||
Fidelity and surety | 2,894 | 2,520 | 186 | 5,600 | |||||||||||
Miscellaneous | 455 | 563 | 143 | 1,161 | |||||||||||
Total commercial lines | $ | 831,705 | $ | 212,747 | $ | 319,977 | $ | 1,364,429 | |||||||
Personal lines | |||||||||||||||
Automobile | $ | 12,808 | $ | 1,488 | $ | 2,263 | $ | 16,559 | |||||||
Fire and allied lines | 9,040 | 3,727 | 2,540 | 15,307 | |||||||||||
Miscellaneous | 70 | 258 | 106 | 434 | |||||||||||
Total personal lines | $ | 21,918 | $ | 5,473 | $ | 4,909 | $ | 32,300 | |||||||
Reinsurance assumed | 12,134 | 12,720 | 171 | 25,025 | |||||||||||
Total | $ | 865,757 | $ | 230,940 | $ | 325,057 | $ | 1,421,754 | |||||||
Case-Basis Reserves
For each of our lines of business, with respect to reported claims, we establish reserves on a case-by-case basis. Our experienced claims personnel estimate these case-basis reserves using adjusting guidelines established by management. Our goal is to set the case-basis reserves at the ultimate expected loss amount as soon as possible after information about the claim becomes available.
Establishing the case reserve for an individual claim is subjective and complex, requiring us to estimate future payments and values that will be sufficient to settle an individual claim. Setting a reserve for an individual claim is
56
an inherently uncertain process. When we establish and adjust individual claim reserves, we do so based on our knowledge of the circumstances and facts of the claim. Upon notice of a claim, we establish a preliminary (average claim cost) reserve based on the limited claim information initially reported. Subsequently, we conduct an investigation of each reported claim, which allows us to more fully understand the factors contributing to the loss and our potential exposure. This investigation may extend over a long period of time. As our claim investigation progresses, and as our claims personnel identify trends in claims activity, we may refine and adjust our estimates of case reserves. To evaluate and refine our overall reserving process, we track and monitor all claims until they are settled and paid in full, with all salvage and subrogation claims being resolved.
Most of our insurance policies are written on an occurrence basis that provides coverage if a loss occurs during the policy period, even if the insured reports the loss many years later. For example, some liability claims for construction defect coverage are reported 10 years or more after the policy period, and the workers' compensation coverage provided by our policies pays unlimited medical benefits for the duration of the claimant's injury up to the lifetime of the claimant. In addition, final settlement of certain claims can be delayed for years due to litigation or other reasons. Reserves for these claims require us to estimate future costs, including the effect of judicial actions, litigation trends and medical cost inflation, among others. Reserve development can occur over time as conditions and circumstances change many years after the policy was issued and/or the loss occurred.
Our loss reserves include amounts related to both short-tail and long-tail lines of business. "Tail" refers to the time period between the occurrence of a loss and the ultimate settlement of the claim. A short-tail insurance product is one where ultimate losses are known and settled comparatively quickly. Ultimate losses under a long-tail insurance product are sometimes not known and settled for many years. The longer the time span between the incidence of a loss and the settlement of the claim, the more the ultimate settlement amount can vary from the reserves initially established. Accordingly, long-tail insurance products can have significant implications on the reserving process.
Our short-tail lines of business include fire and allied lines, homeowners, commercial property, auto physical damage and inland marine. The amounts of the case-based reserves that we establish for claims in these lines depend upon various factors, such as individual claim facts (including type of coverage and severity of loss), our historical loss experience and trends in general economic conditions (including changes in replacement costs, medical costs and inflation).
For short-tail lines of business, the estimation of case-basis loss reserves is less complex than for long-tail lines because the claims relate to tangible property. Because of the relatively short time from claim occurrence to settlement, actual losses typically do not vary significantly from reserve estimates.
Our long-tail lines of business include workers' compensation and other liability. In addition, certain product lines such as personal and commercial auto, commercial multi-peril and surety include both long-tail coverages and short-tail coverages. For many long-tail liability claims, significant periods of time, ranging up to several years, may elapse between the occurrence of the loss, the reporting of the loss to us and the settlement of the claim. As a result, loss experience in the more recent accident years for the long-tail liability coverages has limited statistical credibility in our reserving process because a relatively small proportion of losses in these accident years are reported claims and an even smaller proportion are paid losses. In addition, long-tail liability claims are more susceptible to litigation and can be significantly affected by changing contract interpretations and the legal environment. Consequently, the estimation of loss reserves for long-tail coverages is more complex and subject to a higher degree of variability than for short-tail coverages.
The amounts of the case-basis loss reserves that we establish for claims in long-tail lines of business depends upon various factors, including individual claim facts (including type of coverage, severity of loss and underlying policy limits), company historical loss experience, changes in underwriting practice, legislative enactments, judicial decisions, legal developments in the awarding of damages, changes in political attitudes and trends in general economic conditions, including inflation. As with our short-tail lines of business, we review and make changes to long-tail case-based reserves based on our review of continually evolving facts as they become available to us during the claims settlement process. Our adjustments to case-based reserves are reported in the financial statements in the period that new information arises about the claim. Examples of facts that become known that could cause us
57
to change our case-based reserves include, but are not limited to: evidence that loss severity is different than previously assessed; new claimants who have presented claims; and the assessment that no coverage exists.
Incurred But Not Reported Reserves
On a quarterly basis, the Company's internal actuary performs a detailed analysis of IBNR reserves. This analysis uses various loss projection methods to provide several estimates of ultimate loss (or loss adjustment expense ("LAE")) for each individual year and line of business. The loss projection methods include paid loss development; reported loss development; expected loss emergence based on paid losses; and expected loss emergence based on reported losses. The two methods utilized by our internal actuary to project loss settlement expenses are paid expenses development and development of the ratio of paid expense versus paid loss. Results of the projection methods are compared and a point estimate of ultimate loss (or LAE) is established for each individual year and line of business. The specific projection methods used to establish point estimates vary depending on what is deemed most appropriate for a particular line of business and year. Results of these methods are usually averaged together to provide a final point estimate. Given that there are several inputs depending on the line of business, the methods may be averaged and modified based on changes known to management or trends in the market. IBNR estimates are derived by subtracting reported loss from the final point estimate loss.
Senior management meets with our internal actuary and controller quarterly to review the adequacy of carried IBNR reserves based on results from this actuarial analysis and makes adjustments for changes in business and other factors not completely captured by the data within the actuarial analysis. There are two fundamental types or sources of IBNR reserves. We record IBNR for "normal" types of claims and also specific IBNR reserves related to unique circumstances or events. A major hurricane is an example of an event that might necessitate specific IBNR reserves because an analysis of existing historical data would not provide an appropriate estimate. This method of establishing our IBNR reserves has consistently resulted in aggregate reserve levels that management believes are reasonable in comparison to the reserve estimates indicated by the actuarial analysis.
For our short-tail lines of business, IBNR reserves constitute a small portion of the overall reserves. These claims are generally reported and settled shortly after the loss occurs. In our long-tail lines of business, IBNR reserves constitute a relatively higher proportion of total reserves, because, for many liability claims, significant periods of time may elapse between the initial occurrence of the loss, the reporting of the loss to us, and the ultimate settlement of the claim.
Loss Settlement Expense Reserves
Loss settlement expense reserves include amounts ultimately allocable to individual claims, as well as amounts required for the general overhead of the claims handling operation that are not specifically allocable to individual claims. We do not establish loss settlement expense reserves on a claim-by-claim basis. Instead, on a quarterly basis, our internal actuary performs a detailed statistical analysis (using historical data) to estimate the required reserve for unpaid loss settlement expenses. On a monthly basis, the required reserve estimate is adjusted to reflect additional earned exposure and expense payments that have occurred subsequent to completion of the quarterly analysis.
LAE is composed of two distinct kinds of expenses which are allocated LAE ("ALAE") and unallocated LAE ("ULAE"). These two expense types have different purposes and characteristics which necessitates different estimation methods in order to provide a valid quarterly estimate of the required reserve for unpaid expense which is generally referred to as an LAE IBNR reserve.
Reserves for unpaid ALAE are estimated quarterly by line of business for each individual accident year using three methods: (1) Paid development, (2) Expected emergence of ALAE, and (3) Development of the ratio of paid ALAE to paid loss. Each of the three methods produces an estimate of the ultimate ALAE cost for an individual accident year and the final estimate is generally a weighted average of the various methods. Inception to date paid ALAE is subtracted from the final ultimate ALAE estimate to provide the estimated ALAE IBNR reserve for each individual accident year.
58
Reserves for unpaid ULAE are estimated quarterly by line of business for each individual accident year using a single method. This method consists of applying a percentage factor to unpaid loss reserves. The percentage factor used differs by line of business and is evaluated and established on an annual basis using year-end data. The percentage factor is evaluated and selected after reviewing the ratio of paid ULAE to paid loss using calendar year data for the most recent five years.
Generally, the loss settlement expense reserves for long-tail lines of business are a greater portion of the overall reserves, as there are often substantial legal fees and other costs associated with the complex liability claims that are associated with long-tail coverages. Because short-tail lines of business settle much more quickly and the costs are easier to determine, loss settlement expense reserves for such claims constitute a smaller portion of the total reserves.
Reinsurance Reserves
The estimation of assumed and ceded reinsurance loss and loss settlement expense reserves is subject to the same factors as the estimation of loss and loss settlement expense reserves. In addition to those factors, which give rise to inherent uncertainties in establishing loss and loss settlement expense reserves, there exists a delay in our receipt of reported claims for assumed business due to the procedure of having claims first reported through one or more intermediary insurers or reinsurers.
Reserves for assumed reinsurance are established using methods and techniques identical to those used for direct lines of business. The additional delay inherent in assumed reinsurance reporting is considered in our reserving process and payment is not problematic. Assumed reinsurance, like every independent line of business, has unique reporting and payment patterns that are reviewed as part of the reserve estimation process.
There are three distinct types of reserves ceded to reinsurers: (1) reported claim reserves, (2) loss IBNR, and (3) LAE IBNR. Ceded reserves for reported claims are calculated by subtracting the primary retention from the claim value established by our claim adjuster. Ceded loss IBNR originates solely from our boiler and machinery business which is 100 percent reinsured. For this business ceded loss IBNR is equal to direct loss IBNR. Boiler and machinery business is included in our commercial fire and allied line of business. We will cede some LAE expenses when we cede loss. Our ceded LAE IBNR is estimated based on our ceded unpaid loss reserves and the general relation, by line of business, between LAE and loss. Our primary retention was $2.0 million for 2012 through 2015 and increased to $2.5 million for 2016 through 2019.
Key Assumptions
Our internal and external actuaries and management use a number of key assumptions in establishing an estimate of loss and loss settlement expense reserves, including the following assumptions: future loss settlement expenses can be estimated based on the Company's historical ratios of loss settlement expenses paid to losses; the Company's case-basis reserves reflect the most up-to-date information available about the unique circumstances of each individual claim; no new judicial decisions or regulatory actions will increase our case-basis obligations; historical aggregate claim reporting and payment patterns will continue into the future consistent with the observable past; significant unique and unusual claim events have been identified and appropriate adjustments have been made; and, to the best of our knowledge, there are no new latent trends that would impact our case-basis reserves.
Our key assumptions are subject to change as actual claims occur and as we gain additional information about the variables that underlie our assumptions. Accordingly, management reviews and updates these assumptions periodically to ensure that the assumptions continue to be valid. If necessary, management makes changes not only in the estimates derived from the use of these assumptions, but also in the assumptions themselves. Due to the inherent uncertainty in the loss reserving process, management believes that there is a reasonable chance that modification to key assumptions could individually, or in aggregate, result in reserve levels that are either significantly above or below the actual amount for which the related claims will eventually settle.
As an example, if our loss and loss settlement expense reserves of $1,421.8 million as of December 31, 2019, is 10.0 percent inadequate, we would experience a reduction in future pre-tax earnings of up to $142.2 million. This
59
reduction could be recorded in one year or multiple years, depending on when we identify the deficiency. The deficiency would also affect our financial position in that our equity would be reduced by an amount equivalent to the reduction in net income. Any deficiency that would be recognized in our loss and loss settlement expense reserves usually does not have a material effect on our liquidity because the claims have not been paid. Conversely, if our estimates of ultimate unpaid loss and loss settlement expense reserves prove to be redundant, our future earnings and financial position would be improved. We believe our reserving philosophy, coupled with what we believe to be aggressive and successful claims management and loss settlement practices, has resulted in year-to-year redundancies in reserves. We believe our approach produces recorded reserves that are reasonable as to their relative position within a range of reasonable reserves from year-to-year.
We are unable to reasonably quantify the impact of changes in our key assumptions utilized to establish individual case-basis reserves on our total reported reserves because the impact of these changes would be unique to each specific case-basis reserve established. However, based on historical experience, we believe that aggregate case-basis reserve volatility levels of 5.0 percent and 10.0 percent can be attributed to the ultimate development of our net case-basis reserves. The impact to pre-tax earnings would be a decrease if the reserves were to be adjusted upwards and an increase if the reserves were to be adjusted downwards. The table below details the impact of this development volatility on our reported net case-basis reserves at December 31, 2019:
(In Thousands) | |||||||
Change in level of net case-basis reserve development | 5% | 10% | |||||
Impact on reported net case-basis reserves | $ | 40,109 | $ | 80,218 | |||
Due to the formula-based nature of our IBNR and loss settlement expense reserve calculations, changes in the key assumptions utilized to generate these reserves can impact our reported results. It is not possible to isolate and measure the potential impact of just one of these factors, and future loss trends could be partially impacted by all factors concurrently. Nevertheless, it is meaningful to view the sensitivity of the reserves to potential changes in these variables. To demonstrate the sensitivity of reserves to changes in significant assumptions, the following example is presented. The amounts reflect the pre-tax impact on earnings from a hypothetical percentage change in the calculation of IBNR and loss settlement expense reserves at December 31, 2019. The impact to pre-tax earnings would be a decrease if the reserves were to be adjusted upwards and an increase if the reserves were to be adjusted downwards. We believe that the changes presented are reasonably likely based upon an analysis of our historical IBNR and loss settlement expense reserve experience.
(In Thousands) | |||||||
Change in claim frequency and claim severity assumptions | 5% | 10% | |||||
Impact due to change in IBNR reserving assumptions | $ | 11,524 | $ | 23,048 | |||
(In Thousands) | |||||||
Change in LAE paid to losses paid ratio | 1% | 2% | |||||
Impact due to change in LAE reserving assumptions | $ | 3,206 | $ | 6,411 | |||
In 2019, we did not change the key method through which we develop our assumptions on which we based our reserving calculations. In estimating our 2019 loss and loss settlement expense reserves, we did not anticipate future events or conditions that were inconsistent with past development patterns.
Certain of our lines of business are subject to the potential for greater loss and loss settlement expense development than others, which are discussed below:
Other Liability Reserves
Other liability is considered a long-tail line of business, as it can take a relatively long period of time to settle claims from prior accident years. This is partly due to the lag time between the date a loss or event occurs that triggers
60
coverage and the date when the claim is actually reported. Defense costs are also a part of the insured expenses covered by liability policies and can be significant, sometimes greater than the cost of the actual paid claims. For the majority of our products, defense costs are outside of the policy limit, meaning that the amounts paid for defense costs are not subtracted from the available policy limit.
Factors that can cause reserve uncertainty in estimating reserves in this line include: reporting time lags; the number of parties involved in the underlying tort action; whether the "event" triggering coverage is confined to only one time period or is spread over multiple time periods; the potential dollars involved in the individual claim actions; whether such claims were reasonably foreseeable and intended to be covered at the time the contracts were written (i.e., coverage disputes); and the potential for mass claim actions.
Claims with longer reporting time lags may result in greater inherent risk. This is especially true for alleged claims with a latency feature, particularly where courts have ruled that coverage is spread over multiple policy years, hence involving multiple defendants (and their insurers and reinsurers) and multiple policies (thereby increasing the potential dollars involved and the underlying settlement complexity). Claims with long latencies also increase the potential time lag between writing a policy in a certain market and the recognition that such policy has potential mass tort and/or latent claim exposure.
Our reserve for other liability claims at December 31, 2019, was $600.0 million and consisted of 6,461 claims, compared with $549.8 million, consisting of 6,542 claims at December 31, 2018. Of the $600.0 million total reserve for other liability claims, $151.2 million is identified as defense costs and $38.7 million is identified as general overhead required in the settlement of claims.
Included in the other liability line of business are gross reserves for construction defect losses and loss settlement expenses. Construction defect is a liability allegation relating to defective work performed in the construction of structures such as commercial buildings, apartments, condominiums, single family dwellings or other housing, as well as the sale of defective building materials. These claims seek recovery due to damage caused by alleged deficient construction techniques or workmanship. At December 31, 2019, we had $60.4 million in construction defect loss and loss settlement expense reserves, excluding IBNR reserves that are calculated for the overall other liability commercial line, which consisted of 3,439 claims. At December 31, 2018, our reserves, excluding IBNR reserves, totaled $44.5 million, which consisted of 2,706 claims. The reporting of such claims can be delayed, as the statute of limitations can be up to 10 years. Court decisions in recent years have expanded insurers' exposure to construction defect claims. As a result, claims may be reported more than 10 years after a project has been completed, as litigation can proceed for several years before an insurance company is identified as a potential contributor. Claims have also emerged from parties claiming additional insured status on policies issued to other parties, such as contractors seeking coverage from a subcontractor's policy.
In addition to these issues, other variables also contribute to a high degree of uncertainty in establishing reserves for construction defect claims. These variables include: whether coverage exists; when losses occur; the size of each loss; expectations for future interpretive rulings concerning contract provisions; and the extent to which the assertion of these claims will expand geographically. In recent years, we have implemented various underwriting measures that we anticipate will mitigate the amount of construction defect losses experienced. These initiatives include increased care regarding additional insured endorsements; stricter underwriting guidelines on the writing of residential contractors; and an increased utilization of loss control.
Asbestos and Environmental Reserves
Included in the other liability and assumed reinsurance lines of business are reserves for asbestos and other environmental losses and loss settlement expenses. At December 31, 2019 and 2018, we had $3.1 million and $3.0 million, respectively, in direct and assumed asbestos and environmental loss reserves. The estimation of loss reserves for environmental claims and claims related to long-term exposure to asbestos and other substances is one of the most difficult aspects of establishing reserves, especially given the inherent uncertainties surrounding such claims. Although we record our best estimate of loss and loss settlement expense reserves, the ultimate amounts paid upon settlement of such claims may be more or less than the amount of the reserves, because of the significant uncertainties involved and the likelihood that these uncertainties will not be resolved for many years.
61
Commercial Auto Reserves
Commercial auto claim reserves are established at exposure based on information either known and provided or obtained through the investigation, with some pessimism built in. Incorporated are the perspective and experience the claims staff has acquired, which may include assumptions as to how the claim will develop over time, and with a slightly pessimistic view. Exposures are identified and reserves established within 30 to 60 days depending on the complexity of the case.
Workers' Compensation Reserves
Like the other liability line of business, workers' compensation losses and loss settlement expense reserves are based upon variables that create imprecision in estimating the ultimate reserve. Estimates for workers' compensation are particularly sensitive to assumptions about medical cost inflation, which has been steadily increasing over the past few years. Other variables that we consider and that contribute to the uncertainty in establishing reserves for workers' compensation claims include: state legislative and regulatory environments; trends in jury awards; and mortality rates. Because of these variables, the process of reserving for the ultimate loss and loss settlement expense to be incurred requires the use of informed judgment and is inherently uncertain. Consequently, actual loss and loss settlement expense reserves may deviate from our estimates. Such deviations may be significant. Our reserve for workers' compensation claims at December 31, 2019 was $182.5 million and consisted of 3,869 claims, compared with $210.7 million, consisting of 4,337 claims, at December 31, 2018.
Reserve Development
The following reserve development section should be read in conjunction with the "Results of Operations for the Years Ended December 31, 2019, 2018 and 2017" section of this Item 7.
In 2019, 2018 and 2017, we recognized a favorable development in our net reserves for prior accident years totaling $5.3 million, $54.2 million and $54.3 million, respectively.
The factors contributing to our year-to-year redundancy include: establishing reserves at their ultimate expected loss amount as soon as practicable after information becomes available, which produces, on average, prudently conservative case reserves; using claims negotiation to control the size of settlements; assuming that we have liability for all claims, even though the issue of liability may, in some cases, be resolved in our favor; promoting claims management services to encourage return-to-work programs; case management by nurses for serious injuries and management of medical provider services and billings; and using programs and services to help prevent fraud and to assist in favorably resolving cases.
Based upon our comparison of carried reserves to actual claims experience over the last several years, we believe that using our Company's historical premium and claims data to establish reserves for losses and loss settlement expenses results in adequate and reasonable reserves. Reserve development is discussed in more detail under the heading "Reserve Development" in the "Results of Operations for the Years Ended December 31, 2019, 2018 and 2017" section in this Item 7.
The following table details the pre-tax impact on our property and casualty insurance business' financial results and financial condition of reasonably likely reserve development. Our lines of business that have historically been most susceptible to significant volatility in reserve development have been shown separately and utilize hypothetical levels of volatility of 5.0 percent and 10.0 percent. Our other, less volatile, lines of business have been aggregated and utilize hypothetical levels of volatility of 3.0 percent and 5.0 percent.
62
(In Thousands) | |||||||||||||||
Hypothetical Reserve Development Volatility Levels | -10% | -5% | +5% | +10% | |||||||||||
Impact on loss and loss settlement expenses | |||||||||||||||
Other liability | $ | (59,996 | ) | $ | (29,998 | ) | $ | 29,998 | $ | 59,996 | |||||
Workers' compensation | (18,245 | ) | (9,123 | ) | 9,123 | 18,245 | |||||||||
Automobile | (46,155 | ) | (23,078 | ) | 23,078 | 46,155 | |||||||||
Hypothetical Reserve Development Volatility Levels | -5% | -3% | +3% | +5% | |||||||||||
Impact on loss and loss settlement expenses | |||||||||||||||
All other lines | $ | (8,890 | ) | $ | (5,334 | ) | $ | 5,334 | $ | 8,890 | |||||
Independent Actuary
We engage an independent actuarial firm to render an opinion as to the reasonableness of the statutory reserves internal management establishes. During 2019 and 2018, we engaged the services of Regnier as our independent actuarial firm for the property and casualty insurance business. We anticipate that this engagement will continue in 2020.
It is management's policy to utilize staff adjusters to develop our estimate of case-basis loss reserves. IBNR and loss settlement expense reserves are established through various formulae that utilize pertinent, recent Company historical data. The calculations are supplemented with knowledge of current trends and events that could result in adjustments to the level of IBNR and loss settlement expense reserves. On a quarterly basis, we compare our estimate of total reserves to the estimates prepared by Regnier by line of business to ensure that our estimates are within the actuary's acceptable range. Regnier performs a review of loss and loss settlement expense reserves at each year end using generally accepted actuarial guidelines to ensure that the recorded reserves appear reasonable. Our net reserves for losses and loss settlement expenses as of December 31, 2019 and 2018 were $1,353.2 million and $1,255.4 million, respectively. In 2019 and 2018, after considering the independent actuary's range of reasonable estimates, management believes that carried reserves were reasonable and therefore did not adjust the recorded amount.
Regnier uses four projection methods in its actuarial analysis of our loss reserves and uses two projection methods in its actuarial analysis of our loss settlement expense reserves. Based on the results of the projection methods, the actuaries select an actuarial point estimate of the reserves, which is compared to our carried reserves to evaluate the reasonableness of the carried reserves. The four methods utilized by Regnier to project losses are: paid loss development; reported loss development; expected loss emergence based on paid losses; and expected loss emergence based on reported losses. The two methods utilized by Regnier to project loss expenses are: paid expenses-to-paid loss and paid expense-to-ultimate loss.
Pension and Post-retirement Benefit Obligations
The process of estimating our pension and post-retirement benefit obligations and related benefit expense is inherently uncertain, and the actual cost of benefits may vary materially from the estimates recorded. These liabilities are particularly volatile due to their long-term nature and are based on several assumptions. The main assumptions used in the valuation of our benefit obligations are: estimated mortality of the employees and retirees eligible for benefits; estimated expected long-term rates of return on investments; estimated compensation increases; estimated employee turnover; estimated medical expense trend rate; and estimated rate used to discount the ultimate estimated liability to a present value. We engage a consulting actuary from Principal Financial Group, an independent firm, to assist in evaluating and establishing assumptions used in the valuation of our benefit obligations.
A change in any one or more of these assumptions is likely to result in an ultimate liability different from the original actuarial estimate. Such changes in estimates may be material. For example, a 100 basis point decrease in our estimated discount rate would increase the pension and post-retirement benefit obligation at December 31, 2019,
63
by $47.9 million and $5.6 million, respectively, while a 100 basis point increase in the rate would decrease the benefit obligation at December 31, 2019, by $37.2 million and $4.4 million, respectively.
In addition, for the post-retirement benefit plan, a 100 basis point decrease in the medical trend rate would decrease the post-retirement benefit obligation at December 31, 2019, by $4.3 million, while a 100 basis point increase in the medical trend rate would increase the benefit obligation at December 31, 2019, by $5.3 million.
A 100 basis point decrease in our estimated long-term rate of return on pension plan assets would increase the benefit expense for the year ended December 31, 2019, by $2.0 million, while a 100 basis point increase in the rate would decrease benefit expense by $2.0 million, for the same period.
For the post-retirement benefit plan, a 100 basis point increase in our estimated medical trend rate would increase the benefit expense for the year ended December 31, 2019, by $0.7 million, while a 100 basis point decrease in the rate would decrease benefit expense by $0.5 million, for the same period.
Recently Issued Accounting Standards
Information specific to accounting standards that we adopted in 2019 or pending accounting standards that we expect to adopt in the future is incorporated by reference from Note 1 "Summary of Significant Accounting Policies" contained in Part II, Item 8, "Financial Statements and Supplementary Data."
ITEM 7A. QUANTITATIVE AND QUALITATIVE DISCLOSURES ABOUT MARKET RISK
Information required by this Item 7A is incorporated by reference from Part II, Item 7, "Management's Discussion and Analysis of Financial Condition and Results of Operations" under the headings "Investments" and "Market Risk."
64
ITEM 8. FINANCIAL STATEMENTS AND SUPPLEMENTARY DATA
United Fire Group, Inc. Consolidated Balance Sheets | |||||||
December 31, | |||||||
(In Thousands, Except Share Data) | 2019 | 2018 | |||||
Assets | |||||||
Investments | |||||||
Fixed maturities | |||||||
Available-for-sale, at fair value (amortized cost $1,659,760 in 2019 and $1,761,289 in 2018) | $ | $ | |||||
Trading securities, at fair value (amortized cost $11,941 in 2019 and $11,277 in 2018) | |||||||
Equity securities, at fair value (cost $67,529 in 2019 and $64,819 in 2018) | |||||||
Mortgage loans | |||||||
Other long-term investments | |||||||
Short-term investments | |||||||
Cash and cash equivalents | |||||||
Accrued investment income | |||||||
Premiums receivable (net of allowance for doubtful accounts of $1,239 in 2019 and $785 in 2018) | |||||||
Deferred policy acquisition costs | |||||||
Property and equipment (primarily land and buildings, at cost, less accumulated depreciation of $50,183 in 2019 and $39,894 in 2018) | |||||||
Reinsurance receivables and recoverables | |||||||
Prepaid reinsurance premiums | |||||||
Deferred tax asset | |||||||
Income taxes receivable | |||||||
Goodwill and net intangible assets | |||||||
Other assets | |||||||
Total assets | $ | $ | |||||
Liabilities and stockholders' equity | |||||||
Liabilities | |||||||
Losses and loss settlement expenses | $ | $ | |||||
Unearned premiums | |||||||
Accrued expenses and other liabilities | |||||||
Deferred tax liability | |||||||
Total liabilities | $ | $ | |||||
Stockholders' equity | |||||||
Common stock, $0.001 par value; authorized 75,000,000 shares; 25,015,963 and 25,097,408 shares issued and outstanding in 2019 and 2018, respectively | $ | $ | |||||
Additional paid-in capital | |||||||
Retained earnings | |||||||
Accumulated other comprehensive income (loss), net of tax | ( | ) | |||||
Total stockholders' equity | $ | $ | |||||
Total liabilities and stockholders' equity | $ | $ | |||||
The Notes to Consolidated Financial Statements are an integral part of these statements.
65
United Fire Group, Inc.
Consolidated Statements of Income and Comprehensive Income
For the Years Ended December 31, | |||||||||||
(In Thousands, Except Share Data) | 2019 | 2018 | 2017 | ||||||||
Revenues | |||||||||||
Net premiums earned | $ | $ | $ | ||||||||
Investment income, net of investment expenses | |||||||||||
Net realized investment gains (losses) (includes reclassifications for net unrealized gains on available-for-sale securities of ($1,521) in 2019; ($784) in 2018; and $6,390 in 2017 previously included in accumulated other comprehensive income) | ( | ) | |||||||||
Total revenues | $ | $ | $ | ||||||||
Benefits, losses and expenses | |||||||||||
Losses and loss settlement expenses | $ | $ | $ | ||||||||
Amortization of deferred policy acquisition costs | |||||||||||
Other underwriting expenses (includes reclassifications for employee benefit costs of $4,497 in 2019; $6,642 in 2018; and $5,408 in 2017 previously included in accumulated other comprehensive income) | |||||||||||
Total benefits, losses and expenses | $ | $ | $ | ||||||||
Income (loss) from continuing operations before income taxes | $ | $ | ( | ) | $ | ||||||
Federal income tax expense (benefit) (includes reclassifications of $1,263 in 2019; $1,559 in 2018; and ($344) in 2017 previously included in accumulated other comprehensive income) | ( | ) | ( | ) | |||||||
Net income from continuing operations | $ | $ | $ | ||||||||
Income (loss) from discontinued operations, net of taxes | ( | ) | |||||||||
Gain on sale of discontinued operations, net of taxes | |||||||||||
Net income | $ | $ | $ | ||||||||
Other comprehensive income (loss) | |||||||||||
Change in net unrealized appreciation on investments | $ | $ | ( | ) | $ | ||||||
Change in liability for underfunded employee benefit plans | ( | ) | ( | ) | |||||||
Other comprehensive income (loss), before tax and reclassification adjustments | ( | ) | |||||||||
Income tax effect | ( | ) | ( | ) | |||||||
Other comprehensive income (loss), after tax, before reclassification adjustments | ( | ) | |||||||||
Reclassification adjustment for net realized (gains) losses included in income | ( | ) | |||||||||
Reclassification adjustment for employee benefit costs included in expense | |||||||||||
Total reclassification adjustments, before tax | ( | ) | |||||||||
Income tax effect | ( | ) | ( | ) | |||||||
Total reclassification adjustments, after tax | ( | ) | |||||||||
Comprehensive income | $ | $ | $ | ||||||||
Weighted average common shares outstanding | |||||||||||
Earnings per common share from continuing operations: | |||||||||||
Basic | $ | $ | $ | ||||||||
Diluted | |||||||||||
Earnings per common share: | |||||||||||
Basic | $ | $ | $ | ||||||||
Diluted | |||||||||||
The Notes to Consolidated Financial Statements are an integral part of these statements.
66
United Fire Group, Inc.
Consolidated Statement of Stockholders' Equity
Common Stock | |||||||||||||||||
(In Thousands, Except Share Data) | Shares outstanding | Common stock | Additional paid-in capital | Retaining Earnings | Accumulated other comprehensive income | Total | |||||||||||
Balance, January 1, 2017 | $ | $ | $ | $ | $ | ||||||||||||
Net income | — | — | — | ||||||||||||||
Shares repurchased | ( | ) | ( | ) | ( | ) | |||||||||||
Stock based compensation | |||||||||||||||||
Dividends on common stock ($1.09 per share) | — | — | — | ( | ) | ( | ) | ||||||||||
Accumulated effect of change in enacted tax rate | — | — | — | ( | ) | ||||||||||||
Change in net unrealized investment appreciation(1) | — | — | — | — | |||||||||||||
Change in liability for underfunded employee benefit plans(2) | — | — | — | — | ( | ) | ( | ) | |||||||||
Compensation expense and related tax benefit for stock-based award grants | — | — | |||||||||||||||
Balance, January 1, 2018 | $ | $ | $ | $ | $ | ||||||||||||
Net income | — | $ | $ | $ | $ | $ | |||||||||||
Shares repurchased | ( | ) | ( | ) | ( | ) | |||||||||||
Stock based compensation | |||||||||||||||||
Dividends on common stock ($4.21 per share) | — | — | ( | ) | ( | ) | |||||||||||
Change in net unrealized investment appreciation(1) | — | — | — | — | ( | ) | ( | ) | |||||||||
Net unrealized investment depreciation of discontinued operations, sold | — | — | — | ( | ) | ( | ) | ||||||||||
Change in liability for underfunded employee benefit plans(2) | — | — | — | — | |||||||||||||
Cumulative effect of change in accounting principle | — | — | — | ( | ) | ||||||||||||
Compensation expense and related tax benefit for stock-based award grants | — | — | |||||||||||||||
Balance, January 1, 2019 | $ | $ | $ | $ | ( | ) | $ | ||||||||||
Net income | — | $ | $ | $ | $ | $ | |||||||||||
Shares repurchased | ( | ) | ( | ) | ( | ) | |||||||||||
Stock based compensation | |||||||||||||||||
Dividends on common stock ($1.30 per share) | — | — | — | ( | ) | ( | ) | ||||||||||
Change in net unrealized investment appreciation(1) | — | — | — | — | |||||||||||||
Change in liability for underfunded employee benefit plans(2) | — | — | — | — | ( | ) | ( | ) | |||||||||
Cumulative effect of change in accounting principle | — | — | — | ( | ) | ( | ) | ||||||||||
Compensation expense and related tax benefit for stock-based award grants | — | — | |||||||||||||||
Balance, December 31, 2019 | $ | $ | $ | $ | $ | ||||||||||||
(1) | The change in net unrealized appreciation is net of reclassification adjustments and income taxes. |
(2) | The change in liability for underfunded employee benefit plans is net of income taxes. |
The Notes to Consolidated Financial Statements are an integral part of these statements.
67
United Fire Group, Inc.
Consolidated Statements of Cash Flows
For the Years Ended December 31, | |||||||||||
(In Thousands) | 2019 | 2018 | 2017 | ||||||||
Cash Flows From Operating Activities | |||||||||||
Net income | $ | $ | $ | ||||||||
Less net income (loss) from discontinued operations, net of taxes | ( | ) | |||||||||
Adjustments to reconcile net income to net cash provided by operating activities | |||||||||||
Net accretion of bond premium | |||||||||||
Depreciation and amortization | |||||||||||
Stock-based compensation expense | |||||||||||
Net realized investment (gains) losses | ( | ) | ( | ) | |||||||
Net cash flows from trading investments | ( | ) | |||||||||
Deferred income tax benefit | ( | ) | ( | ) | |||||||
Changes in: | |||||||||||
Accrued investment income | ( | ) | ( | ) | |||||||
Premiums receivable | ( | ) | ( | ) | ( | ) | |||||
Deferred policy acquisition costs | ( | ) | ( | ) | |||||||
Reinsurance receivables | ( | ) | ( | ) | |||||||
Prepaid reinsurance premiums | ( | ) | ( | ) | |||||||
Income taxes receivable | ( | ) | ( | ) | |||||||
Other assets | ( | ) | ( | ) | ( | ) | |||||
Losses, claims and loss settlement expenses | |||||||||||
Unearned premiums | |||||||||||
Accrued expenses and other liabilities | ( | ) | ( | ) | |||||||
Deferred income taxes | ( | ) | ( | ) | ( | ) | |||||
Other, net | ( | ) | |||||||||
Cash from operating activities - continuing operations | |||||||||||
Cash from operating activities - discontinued operations | |||||||||||
Cash from operating activities - gain on sale of discontinued operations | ( | ) | |||||||||
Total adjustments | $ | $ | $ | ||||||||
Net cash provided by operating activities | $ | $ | $ | ||||||||
Cash Flows From Investing Activities | |||||||||||
Proceeds from sale of available-for-sale investments | $ | $ | $ | ||||||||
Proceeds from call and maturity of held-to-maturity investments | |||||||||||
Proceeds from call and maturity of available-for-sale investments | |||||||||||
Proceeds from short-term and other investments | |||||||||||
Proceeds from sale of discontinued operations | |||||||||||
Purchase of held-to-maturity investments | ( | ) | |||||||||
Purchase of available-for-sale investments | ( | ) | ( | ) | ( | ) | |||||
Purchase of mortgage loans | ( | ) | ( | ) | |||||||
Purchase of short-term and other investments | ( | ) | ( | ) | ( | ) | |||||
Net purchases and sales of property and equipment | ( | ) | ( | ) | ( | ) | |||||
Cash from investing activities - continuing operations | ( | ) | ( | ) | |||||||
Cash from investing activities - discontinued operations | |||||||||||
Net cash provided by (used in) investing activities | $ | $ | ( | ) | $ | ( | ) | ||||
Cash Flows From Financing Activities | |||||||||||
Payment of cash dividends | $ | ( | ) | $ | ( | ) | $ | ( | ) | ||
Repurchase of common stock | ( | ) | ( | ) | ( | ) | |||||
Issuance of common stock | |||||||||||
Cash from financing activities - continued operations | ( | ) | ( | ) | ( | ) | |||||
Cash from financing activities - discontinued operations | ( | ) | ( | ) | |||||||
Net cash used in financing activities | $ | ( | ) | $ | ( | ) | $ | ( | ) | ||
Net Change in Cash and Cash Equivalents | $ | $ | ( | ) | $ | ||||||
Less: decrease (increase) in cash and cash equivalents - discontinued operations | ( | ) | |||||||||
Net increase (decrease) in cash and cash equivalents - continuing operations | ( | ) | |||||||||
Cash and Cash Equivalents at Beginning of Year - Continuing Operations | |||||||||||
Cash and Cash Equivalents at End of Year - Continuing Operations | $ | $ | $ | ||||||||
The Notes to Consolidated Financial Statements are an integral part of these statements.
68
Index of Notes to Consolidated Financial Statements | Page |
69
UNITED FIRE GROUP, INC.
NOTES TO CONSOLIDATED FINANCIAL STATEMENTS
(Amounts in thousands, unless otherwise noted)
NOTE 1. SUMMARY OF SIGNIFICANT ACCOUNTING POLICIES
Nature of Business
United Fire Group, Inc. ("UFG", "United Fire", the "Registrant", the "Company", "we", "us", or "our") and its consolidated subsidiaries and affiliates are engaged in the business of writing property and casualty insurance through a network of independent agencies. Our insurance company subsidiaries are licensed as a property and casualty insurer in 46 states, plus the District of Columbia.
Discontinued Operations
Principles of Consolidation
The accompanying Consolidated Financial Statements include United Fire and its wholly owned subsidiaries: United Fire & Casualty Company, United Real Estate Holdings Company, LLC, Addison Insurance Company, Lafayette Insurance Company, United Fire & Indemnity Company, United Fire Lloyds, UFG Specialty Insurance Company, Financial Pacific Insurance Company, Franklin Insurance Company, Mercer Insurance Company, and Mercer Insurance Company of New Jersey, Inc.
United Fire Lloyds, an affiliate of United Fire & Indemnity Company, is organized as a Texas Lloyds plan, which is an aggregation of underwriters who, under a common name, engage in the business of insurance through a corporate attorney-in-fact. United Fire Lloyds is financially and operationally controlled by United Fire & Indemnity Company, its corporate attorney-in-fact, pursuant to three types of agreements: trust agreements between United Fire & Indemnity Company and certain individuals who agree to serve as trustees; articles of agreement among the trustees who agree to act as underwriters to establish how the Lloyds plan will be operated; and powers of attorney from each of the underwriters appointing a corporate attorney-in-fact, who is authorized to operate the Lloyds plan. Because United Fire & Indemnity Company can name the trustees, the Lloyds plan is perpetual, subject only to United Fire & Indemnity Company's desire to terminate it.
United Fire & Indemnity Company provides all of the statutory capital necessary for the formation of the Lloyds plan by contributing capital to each of the trustees. The trust agreements require the trustees to become underwriters of the Lloyds plan, to contribute the capital to the Lloyds plan, to sign the articles of agreement and to appoint the attorney-in-fact. The trust agreements also require the trustees to pay to United Fire & Indemnity Company all of the profits and benefits received by the trustees as underwriters of the Lloyds plan, which means that United Fire & Indemnity Company has the right to receive 100 percent of the gains and profits from the Lloyds plan. The trustees serve at the pleasure of United Fire & Indemnity Company, which may remove a trustee and replace that trustee at any time. Termination of a trustee must be accompanied by the resignation of the trustee as an underwriter, so that the trustee can obtain the capital contribution from the Lloyds plan to reimburse United Fire & Indemnity Company. By retaining the ability to terminate trustees, United Fire & Indemnity Company possesses the ability to name and remove the underwriters.
70
United Real Estate Holdings, LLC, formed in 2013, is a wholly owned subsidiary of United Fire & Casualty Company and is organized as an Iowa limited liability corporation, an unincorporated association formed for the purpose of holding United Fire & Casualty Company's ownership in commercial real estate.
The accompanying Consolidated Financial Statements have been prepared on the basis of U.S. generally accepted accounting principles ("GAAP"), which differ in some respects from those followed in preparing our statutory reports to insurance regulatory authorities. Our stand-alone subsidiary financial statements submitted to insurance regulatory authorities are presented on the basis of accounting practices prescribed or permitted by the insurance departments of the states in which we are domiciled ("statutory accounting principles").
The preparation of financial statements in conformity with GAAP requires management to make estimates and assumptions that affect the reported amounts of assets and liabilities and disclosure of contingent assets and liabilities at the date of the financial statements and the reported amounts of revenues and expenses during the reporting period. Actual results could differ from those estimates. The financial statement categories that are most dependent on management estimates and assumptions include: investments; deferred policy acquisition costs; reinsurance receivables and recoverables; losses and loss settlement expenses; and pension and post-retirement benefit obligations.
Continuing Operations - Property and Casualty Insurance Business
To establish loss and loss settlement expense reserves, we make estimates and assumptions about the future development of claims. Actual results could differ materially from those estimates, which are subjective, complex and inherently uncertain. When we establish and adjust reserves, we do so given our knowledge at the time of the circumstances and facts of known claims. To the extent that we have overestimated or underestimated our loss and loss settlement expense reserves, we adjust the reserves in the period in which such adjustment is determined.
Discontinued Operations - Life Insurance Business
Reinsurance
71
Investments
Investments in fixed maturities include bonds and redeemable preferred stocks. Our investments in available-for-sale fixed maturities and trading securities are recorded at fair value.
In 2018, due to the change in accounting principle adopted on January 1, 2018 described in this section under "Recently Issued Accounting Standards," investments in equity securities, which include common and non-redeemable preferred stocks are recorded at fair value with changes in value recorded as a component of income. Prior to 2018, the change in the fair value of equity securities were held as available-for-sale securities and were reported as a component of accumulated other comprehensive income, net of applicable deferred income taxes, in stockholders' equity.
Changes in unrealized appreciation and depreciation, with respect to available-for-sale fixed maturities are reported as a component of accumulated other comprehensive income, net of applicable deferred income taxes, in stockholders' equity. Changes in unrealized appreciation and depreciation, with respect to trading securities, are reported as a component of income.
We review all of our investment holdings for appropriate valuation on an ongoing basis. Refer to Note 2 "Summary of Investments" for a discussion of our accounting policy for impairment recognition.
Cash and Cash Equivalents
For purposes of reporting cash flows, cash and cash equivalents include cash, money market accounts, and non-negotiable certificates of deposit with original maturities of three months or less.
In 2019, 2018, and 2017, we made cash payments for income taxes of $1,575 , $29,071 and $7,667 , respectively. In addition, we received federal tax refunds of $5,401 , $1,503 and $13,383 in 2019, 2018 and 2017, respectively, which resulted from the utilization of our net operating losses and net capital loss carryforwards and carrybacks. We made no interest payments in 2019, 2018 and 2017. These payments exclude interest credited to policyholders' accounts.
Deferred Policy Acquisition Costs ("DAC")
72
Continuing Operations - Property and Casualty Insurance | 2019 | 2018 | 2017 | ||||||||
Recorded asset at beginning of year | $ | $ | $ | ||||||||
Underwriting costs deferred | |||||||||||
Amortization of deferred policy acquisition costs | ( | ) | ( | ) | ( | ) | |||||
Recorded asset at end of year | $ | $ | $ | ||||||||
Discontinued Operations - Life Insurance | |||||||||||
Recorded asset at beginning of year | $ | $ | $ | ||||||||
Underwriting costs deferred | |||||||||||
Amortization of deferred policy acquisition costs | ( | ) | ( | ) | |||||||
$ | $ | $ | |||||||||
Change in "shadow" deferred policy acquisition costs | |||||||||||
Sale of discontinued operations | ( | ) | |||||||||
Recorded asset at end of year | $ | $ | $ | ||||||||
Total | |||||||||||
Recorded asset at beginning of year | $ | $ | $ | ||||||||
Underwriting costs deferred | |||||||||||
Amortization of deferred policy acquisition costs | ( | ) | ( | ) | ( | ) | |||||
$ | $ | $ | |||||||||
Change in "shadow" deferred policy acquisition costs | |||||||||||
Sale of discontinued operations | ( | ) | |||||||||
Recorded asset at end of year | $ | $ | $ | ||||||||
Our continuing operations property and casualty insurance DAC is amortized as premium revenue is recognized. The method followed in computing DAC limits the amount of such deferred costs to their estimated realizable value. This takes into account the premium to be earned, losses and loss settlement expenses expected to be incurred and certain other costs expected to be incurred as the premium is earned. This calculation is performed by line of business in a manner consistent with how the policies are currently being marketed and managed.
For the discontinued operations traditional life insurance policies, DAC was amortized to income over the premium-paying period in proportion to the ratio of the expected annual premium revenue to the expected total premium revenue. Expected premium revenue and gross profits are based on the same mortality and withdrawal assumptions used in determining future policy benefits. These assumptions are not revised after policy issuance unless the recorded DAC asset is deemed to be unrecoverable from future expected profits.
For the discontinued operations non-traditional life insurance policies, DAC is amortized over the anticipated terms in proportion to the ratio of the expected annual gross profits to the total expected gross profits. Changes in the amount or timing of expected gross profits result in adjustments to the cumulative amortization of these costs. The effect on amortization of DAC for revisions to estimated gross profits is reported in earnings in the period the estimated gross profits are revised.
73
Property, Equipment and Depreciation
2019 | 2018 | |||||
Real estate: | ||||||
Land | $ | $ | ||||
Buildings | ||||||
Furniture and fixtures | ||||||
Computer equipment and software | ||||||
Airplane | ||||||
Total property and equipment | $ | $ | ||||
Expenditures for maintenance and repairs on property and equipment are generally expensed as incurred. We periodically review these assets for impairment whenever events or changes in business circumstances indicate that the carrying value of the underlying asset may not be recoverable. A loss would be recognized if the estimated fair value of the asset were less than its carrying value.
Depreciation is computed primarily by the straight-line method over the following estimated useful lives:
Useful Life | |
Computer equipment and software | |
Furniture and fixtures | |
Leasehold improvements | Shorter of the lease term or useful life of the asset |
Real estate | Seven to thirty-nine years |
Airplane | |
Depreciation expense totaled $10,482 , $4,455 and $3,805 for 2019, 2018 and 2017, respectively.
Goodwill and Other Intangible Assets
Goodwill and other intangible assets arise as a result of business combinations and consist of the excess of the fair value of consideration paid over the tangible assets acquired and liabilities assumed. All of our goodwill and the majority of our intangible assets relate to the acquisition of Mercer Insurance Group, Inc. on March 28, 2011. We evaluate goodwill and other intangible assets for impairment at least on an annual basis or whenever events or changes in circumstances indicate that it is more likely than not that the carrying amount of goodwill and other intangible assets may exceed its implied fair value. Goodwill is evaluated at the reporting unit level. Any impairment is charged to operations in the period that the impairment is identified. In 2019, 2018 and 2017, we performed a qualitative impairment assessment of our goodwill. As a result of these assessments, we did no t recognize an impairment charge on our goodwill in 2019, 2018 or 2017.
74
Income Taxes
The Tax Cuts and Jobs Act of 2017 (the "Tax Act") was enacted on December 22, 2017. The Tax Act significantly revised the U.S. corporate income tax laws including lowering the U.S. federal corporate tax rate from 35 percent to 21 percent, effective January 1, 2018.
In December 2017, the SEC staff issued Staff Accounting Bulletin No. 118, which addresses how a company recognizes provisional amounts when a company does not have the necessary information available, prepared or analyzed in reasonable detail to complete its accounting for the effect of the changes in the Tax Act. The measurement period ends when a company has obtained, prepared and analyzed the information necessary to finalize its accounting, but cannot extend beyond one year. As of December 31, 2018 we had completed accounting for the tax effects of enactment of the Tax Act and no adjustments were made during the measurement period.
Deferred tax assets and liabilities are established based on differences between the financial statement bases of assets and liabilities and the tax bases of those same assets and liabilities, using the currently enacted statutory tax rates. Deferred income tax expense is measured by the year-to-year change in the net deferred tax asset or liability, except for certain changes in deferred tax amounts that affect stockholders' equity and do not impact federal income tax expense.
The Company performs a quarterly review of its tax positions and makes a determination whether it is more likely than not that the tax position will be sustained upon examination. If, based on this review, it appears not more likely than not that the position will be sustained, the Company will calculate any unrecognized tax benefits and calculate any interest and penalties. At December 31, 2019, 2018, and 2017 the Company did no t recognize any liability for unrecognized tax benefits. In addition, we have not accrued for interest and penalties related to unrecognized tax benefits. However, if interest and penalties would need to be accrued related to unrecognized tax benefits, such amounts would be recognized as a component of federal income tax expense.
Leases
The Company determines if a contract contains a lease at inception of the contract. The Company's inventory of leases consists of operating leases which are recorded as a lease obligation liability disclosed in the "Accrued expenses and other liabilities" line on the Consolidated Balance Sheets and as a lease right-of-use asset disclosed in the "Other assets" line on the Consolidated Balance Sheets. The Company's operating leases consist of office space, vehicles, computer equipment and office equipment. The lease right-of-use asset represents the Company's right to use each underlying asset for the lease term and the lease obligation liability represents the Company's obligation over the lease term. The Company's lease obligation is recorded at the present value of the lease payments based on the term of the applied lease. The Company has elected to categorize its leases into four categories based on length of lease terms and applies an incremental borrowing rate of interest as of the effective date of adoption or the lease effective date equivalent to a collateralized rate with similar terms. The four categories are as follows: less than three years, three to five years, five to ten years and greater than ten years. The collateralized discount rate used to calculate the present value of future minimum lease payments is based, where appropriate, on the Company's incremental borrowing rate of its credit facility, described in Note 9 "Credit Facility". For leases that existed prior to the adoption of the new accounting guidance on January 1, 2019 or those with terms not similar to the credit facility, the Company has elected to use the remaining lease term based on the four categories noted above as of the date of initial application to measure its incremental borrowing rate. In this case, the incremental borrowing rate is a collateralized rate based on current industry borrowing rates for similar companies with similar ratings.
Certain leases include rental payments adjusted for increases on an annual basis as part of the rental expense and are included in measurement of the lease liability. Lease expenses for lease payments, where appropriate, are recognized on a straight-line basis over the lease term. Short-term leases of 12 months or less are recorded on the Consolidated Balance Sheets and lease payments are recognized on the Consolidated Statement of Income and Comprehensive
75
Income. The Company has agreements with lease and non-lease components, which the Company accounts for separately and continues to follow the guidance and its existing policy for minimum rental payments under Accounting Standard Codification ("ASC") Topic 840 for leases that commenced prior to the effective date. Modified or new leases subsequent to the effective date will follow ASC Topic 842. For more information on leases refer to Note 13 "Leases".
Variable Interest Entities
Stock-Based Compensation
We currently have two equity compensation plans. One plan allows us to grant restricted and unrestricted stock, stock appreciation rights, incentive stock options, and non-qualified stock options to employees. The other plan allows us to grant restricted and non-qualified stock options to non-employee directors.
Comprehensive Income
Comprehensive income includes all changes in stockholders' equity during a period except those resulting from investments by and dividends to stockholders.
Subsequent Events
In the preparation of the accompanying financial statements, the Company has evaluated all material subsequent events or transactions that occurred after the balance sheet date through the date on which the financial statements were issued for potential recognition or disclosure in the Company's financial statements.
Recently Issued Accounting Standards
Accounting Standards Adopted in 2019
Leases
In February 2016, the FASB issued guidance on the accounting for leases. The new guidance requires lessees to place a right-of-use asset and a lease liability on the balance sheets. The lease liability is based on the present value of the future lease payments and the right-of-use asset is based on the liability. Expenses are recognized in the income statement in a similar manner as previous methods. The new guidance also requires companies to classify all
76
leases as operating leases or financing leases. The Company has classified all of its leases as operating leases. The new guidance was effective for annual periods beginning after December 15, 2018 and interim periods within those years. The Company adopted the new guidance under the modified retrospective transition approach using the package of practical expedients and the Company elected to not adopt the hindsight practical expedient as of January 1, 2019. The package of practical expedients allowed the Company not to reassess whether each arrangement contains a lease, lease classification and whether previously capitalized costs qualify as initial direct costs. The practical expedients allowed the Company to continue classifying all of its leases as operating leases as they were previously classified under ASC Topic 840. Therefore, the Company's disclosures for the comparative periods presented in 2019 continues to be in accordance with previous lease guidance under ASC Topic 840. The Company used the accounting standard adoption date as its date of initial application.
Adoption of the new guidance resulted in the recording a lease right-of-use assets and lease obligations of $19.8 million and $20.3 million, respectively, as of January 1, 2019. The lease amounts recognized were measured based on the present value of discounted future lease payments, net of reversal of prepaid rent and deferred rent balances that existed prior to January 1, 2019. The Company had no adjustments upon adoption related to unrecorded but expected lease abandonments at December 31, 2018. The difference between the additional lease assets and lease liabilities, net of the deferred tax impact, was recorded as a cumulative change in accounting principles adjustment to retained earnings of $388 . The adoption did not have a significant impact on the Company's financial position or results of operations and had no impact on cash flows. See Note 13 "Lease Commitments" for more details.
Financial Instruments - Callable Debt Securities
In March 2016, the FASB issued an update to amend the amortization period for certain purchased callable debt securities held at a premium. The update requires the premium to be amortized to the earliest call date. The update doesn’t change the accounting for securities held at a discount, which will continue to be amortized to maturity. The new guidance was effective for annual periods beginning after December 15, 2018 and interim periods beginning after December 15, 2018. The Company adopted the new guidance as of January 1, 2019. The adoption of the new guidance resulted in cumulative change in accounting principles adjustment to retained earnings, net of the deferred tax, of $126 on January 1, 2019 and did not have a material impact on net income between the comparable periods.
Pending Adoption of Accounting Standards
Intangibles - Other Internal Use Software
In August 2018, the FASB issued guidance to align the requirements for capitalizing implementation costs incurred in a cloud computing hosting arrangement that is a service contract with the requirements for capitalizing implementation costs incurred to develop or obtain internal-use software. The guidance requires the Company to determine which implementation costs to capitalize as an asset related to the service contract and which costs to expense. The new guidance is effective for annual and interim periods beginning after December 15, 2019. The Company adopted the new guidance as of January 1, 2020. The adoption will not have a significant impact on the Company's financial position or results of operations.
Financial Instruments - Credit Losses
In June 2016, the FASB issued new guidance on the measurement of credit losses for most financial instruments. The new guidance replaces the current incurred loss model for recognizing credit losses with an expected loss model for instruments measured at amortized cost and requires allowances to be recorded for available-for-sale debt securities rather than reduce the carrying amount. These allowances will be remeasured each reporting period. The new guidance is effective for annual periods beginning after December 15, 2019 and interim periods within those years. The new guidance will impact the Company's impairment model related to our available-for-sale fixed-maturity portfolio, reinsurance receivables and mortgage loans. The Company has identified five filters and performed a run of the credit loss model over available-for-sale fixed maturity securities as of December 31, 2019, which determines the expected loss estimate. This model run resulted in an immaterial expected credit loss at December 31, 2019. The Company has a highly rated portfolio of available-for-sale fixed maturity securities which are in a net unrealized gain position as of December 31, 2019.
77
For reinsurance receivables, the Company developed a model which estimates expected credit loss by multiplying the exposure at default by both the probability of default and loss given default ("LGD"). The LGD is estimated by the rating of the company, historical relationship with UFG, existence of letters of credit and known regulation the company may be held accountable for. The ultimate LGD percentage is estimated on a conservative basis after considering Moody’s experience with unsecured year 1 bond recovery rates from 1983-2017. The Company ran the model as of December 31, 2019 and calculated an immaterial expected credit loss.
Prior to the adoption of the new guidance, the Company utilized an aging method to estimate credit losses on premiums receivable. This aging method is permitted under the new guidance. In addition, prior to the adoption of the new guidance, the Company had a mortgage loan allowance already established and adoption of the new guidance will not materially impact this valuation allowance. The Company will adopt the new guidance prospectively as of January 1, 2020 with an immaterial estimated cumulative effect adjustment to opening retained earnings. This cumulative effect adjustment is an allowance related to the Company's reinsurance receivables. The adoption of the new guidance will not have a material impact on the Company's financial position and results of operations.
Goodwill
In January 2017, the FASB issued new guidance which simplifies the test for goodwill impairment. The new guidance eliminates the implied fair value calculation when measuring a goodwill impairment charge. Under the new guidance, impairment charges will be based on the excess of the carrying value over fair value of goodwill. The new guidance is effective for annual and interim periods beginning after December 15, 2019. The Company adopted the new guidance as of January 1, 2020. The adoption will not have an impact on the Company's financial position and results of operations.
Financial Instruments - Disclosures
In August 2018, the FASB issued new guidance which modifies the disclosure requirements on fair value measurements of financial instruments. The new guidance removes the requirement for disclosing the amount and reason for transfers between Level 1 and Level 2 investment securities and the valuation processes for Level 3 fair value measurements. The guidance also requires additional disclosures on the range and weighted average of significant unobservable inputs used to develop Level 3 fair value measurements. The new guidance is effective for annual and interim periods beginning after December 15, 2019. The Company adopted the new guidance as of January 1, 2020. The adoption will modify existing fair value disclosures, but will not have an impact on the Company's financial position and results of operations.
Defined Benefit Plans - Disclosures
In August 2018, the FASB issued new guidance which modifies the disclosure requirements for employers that sponsor defined benefit pension and postretirement plans. The new guidance removes the requirement for disclosing the amounts in accumulated other comprehensive income expected to be recognized as components of net periodic benefit costs in the next year and the sensitivity of postretirement health plans to one-percentage-point changes in medical trend rates. The new guidance is effective for annual periods beginning after December 15, 2020. The Company will adopt the new guidance as of January 1, 2021. The adoption will modify existing disclosures, but will not have an impact on the Company's financial position and results of operations.
Income Taxes
In December 2019, the FASB issued new guidance which simplifies the accounting for income taxes by removing certain exceptions to income tax accounting. The amendments also improve consistent application of and simplify GAAP for other areas of income tax accounting. The new guidance clarifies and amends existing guidance, including removing certain requirements that an entity evaluate when a step-up in the tax basis of goodwill should be considered part of the business combination in which the book goodwill was originally recognized, when it should be considered a separate transaction and requiring an entity to reflect the effect of an enacted change in tax laws or rates in the annual effective tax rate computation in the interim period that includes the enactment date. The
78
new guidance is effective for annual periods beginning after December 15, 2020. The Company will adopt the new guidance as of January 1, 2021. Management is currently evaluating the impact on the Company's financial position and results of operations.
79
NOTE 2. SUMMARY OF INVESTMENTS
Fair Value of Investments
The table that follows is a reconciliation of the amortized cost (cost for equity securities) to fair value of investments in available-for-sale fixed maturity securities, presented on a consolidated basis, including both continuing and discontinued operations as of December 31, 2019 and 2018.
December 31, 2019 | |||||||||||||||
Type of Investment | Cost or Amortized Cost | Gross Unrealized Appreciation | Gross Unrealized Depreciation | Fair Value | |||||||||||
AVAILABLE-FOR-SALE | |||||||||||||||
Fixed maturities | |||||||||||||||
Bonds | |||||||||||||||
U.S. Treasury | $ | $ | $ | $ | |||||||||||
U.S. government agency | |||||||||||||||
States, municipalities and political subdivisions | |||||||||||||||
General obligations: | |||||||||||||||
Midwest | |||||||||||||||
Northeast | |||||||||||||||
South | |||||||||||||||
West | |||||||||||||||
Special revenue: | |||||||||||||||
Midwest | |||||||||||||||
Northeast | |||||||||||||||
South | |||||||||||||||
West | |||||||||||||||
Foreign bonds | |||||||||||||||
Public utilities | |||||||||||||||
Corporate bonds | |||||||||||||||
Energy | |||||||||||||||
Industrials | |||||||||||||||
Consumer goods and services | |||||||||||||||
Health care | |||||||||||||||
Technology, media and telecommunications | |||||||||||||||
Financial services | |||||||||||||||
Mortgage-backed securities | |||||||||||||||
Collateralized mortgage obligations | |||||||||||||||
Government national mortgage association | |||||||||||||||
Federal home loan mortgage corporation | |||||||||||||||
Federal national mortgage association | |||||||||||||||
Asset-backed securities | |||||||||||||||
Total Available-For-Sale Fixed Maturities | $ | $ | $ | $ | |||||||||||
80
December 31, 2018 | |||||||||||||||
Type of Investment | Cost or Amortized Cost | Gross Unrealized Appreciation | Gross Unrealized Depreciation | Fair Value | |||||||||||
AVAILABLE-FOR-SALE | |||||||||||||||
Fixed maturities | |||||||||||||||
Bonds | |||||||||||||||
U.S. Treasury | $ | $ | $ | $ | |||||||||||
U.S. government agency | |||||||||||||||
States, municipalities and political subdivisions | |||||||||||||||
General obligations: | |||||||||||||||
Midwest | |||||||||||||||
Northeast | |||||||||||||||
South | |||||||||||||||
West | |||||||||||||||
Special revenue: | |||||||||||||||
Midwest | |||||||||||||||
Northeast | |||||||||||||||
South | |||||||||||||||
West | |||||||||||||||
Foreign bonds | |||||||||||||||
Public utilities | |||||||||||||||
Corporate bonds | |||||||||||||||
Energy | |||||||||||||||
Industrials | |||||||||||||||
Consumer goods and services | |||||||||||||||
Health care | |||||||||||||||
Technology, media and telecommunications | |||||||||||||||
Financial services | |||||||||||||||
Mortgage-backed securities | |||||||||||||||
Collateralized mortgage obligations | |||||||||||||||
Government national mortgage association | |||||||||||||||
Federal home loan mortgage corporation | |||||||||||||||
Federal national mortgage association | |||||||||||||||
Asset-backed securities | |||||||||||||||
Total Available-For-Sale Fixed Maturities | $ | $ | $ | $ | |||||||||||
The amortized cost and fair value of available-for-sale and trading fixed maturity securities at December 31, 2019, by contractual maturity, are shown in the following table. Actual maturities may differ from contractual maturities because borrowers may have the right to call or prepay obligations with or without call or prepayment penalties. Asset-backed securities, mortgage-backed securities and collateralized mortgage obligations may be subject to prepayment risk and are therefore not categorized by contractual maturity.
81
Maturities | ||||||||||||||||
Available-For-Sale | Trading | |||||||||||||||
December 31, 2019 | Amortized Cost | Fair Value | Amortized Cost | Fair Value | ||||||||||||
Due in one year or less | $ | $ | $ | $ | ||||||||||||
Due after one year through five years | ||||||||||||||||
Due after five years through 10 years | ||||||||||||||||
Due after 10 years | ||||||||||||||||
Asset-backed securities | — | — | ||||||||||||||
Mortgage-backed securities | — | — | ||||||||||||||
Collateralized mortgage obligations | — | — | ||||||||||||||
$ | $ | $ | $ | |||||||||||||
Net realized gains (losses) on disposition of investments are computed using the specific identification method and are included in the computation of net income. A summary of net realized investment gains (losses) for 2019, 2018 and 2017, is as follows:
2019 | 2018 | 2017 | |||||||||
Net realized investment gains (losses) from continuing operations | |||||||||||
Fixed maturities: | |||||||||||
Available-for-sale | $ | $ | ( | ) | $ | ||||||
Trading securities | |||||||||||
Change in fair value | ( | ) | |||||||||
Sales | |||||||||||
Equity securities | |||||||||||
Change in fair value | ( | ) | |||||||||
Sales | |||||||||||
Mortgage loans | ( | ) | ( | ) | |||||||
Real estate | ( | ) | ( | ) | |||||||
Total net realized investment gains (losses) from continuing operations | $ | $ | ( | ) | $ | ||||||
Total net realized investment gains (losses) from discontinued operations | ( | ) | |||||||||
Total net realized investment gains (losses) | $ | $ | ( | ) | $ | ||||||
The proceeds and gross realized gains (losses) on the sale of available-for-sale fixed maturity securities from continuing operations for 2019, 2018 and 2017, are as follows:
2019 | 2018 | 2017 | |||||||||
Proceeds from sales | $ | $ | $ | ||||||||
Gross realized gains | |||||||||||
Gross realized losses | ( | ) | ( | ) | ( | ) | |||||
The proceeds and gross realized gains (losses) on the sale of available-for-sale fixed maturity securities from discontinued operations for 2019, 2018 and 2017, are as follows:
2019 | 2018 | 2017 | |||||||||
Proceeds from sales | $ | $ | $ | ||||||||
Gross realized gains | |||||||||||
Gross realized losses | ( | ) | |||||||||
82
Our investment portfolio includes trading securities with embedded derivatives. These securities are primarily convertible securities which are recorded at fair value. Income or loss, including the change in the fair value of these trading securities, is recognized currently in earnings as a component of net realized investment gains and losses. Our portfolio of trading securities had a fair value of $15,256 and $13,240 at December 31, 2019 and 2018, respectively.
Net investment income for the years ended December 31, 2019, 2018 and 2017, is comprised of the following:
Years Ended December 31, | 2019 | 2018 | 2017 | ||||||||
Investment income from continuing operations: | |||||||||||
Interest on fixed maturities | $ | $ | $ | ||||||||
Dividends on equity securities | |||||||||||
Income on other long-term investments | |||||||||||
Investment income | |||||||||||
Change in value (1) | ( | ) | ( | ) | |||||||
Interest on mortgage loans | |||||||||||
Interest on short-term investments | |||||||||||
Interest on cash and cash equivalents | |||||||||||
Other | |||||||||||
Total investment income from continuing operations | $ | $ | $ | ||||||||
Less investment expenses | |||||||||||
Net investment income from continuing operations | $ | $ | $ | ||||||||
Net investment income from discontinued operations | $ | $ | $ | ||||||||
Net investment income | $ | $ | $ | ||||||||
(1) | Represents the change in value of our interests in limited liability partnerships that are recorded on the equity method of accounting. |
Funding Commitment
At December 31, 2019, pursuant to an agreement with our limited liability partnership investments, we are contractually committed to make capital contributions up to $14,052 upon request of the partnerships through July 31, 2028.
Unrealized Appreciation and Depreciation
A summary of changes in net unrealized investment appreciation for 2019, 2018 and 2017, is as follows for continuing operations and discontinued operations:
2019 | 2018 | 2017 | |||||||||
Change in net unrealized investment appreciation | |||||||||||
Available-for-sale fixed maturities | $ | $ | ( | ) | $ | ||||||
Available-for-sale equity securities | |||||||||||
Deferred policy acquisition costs | |||||||||||
Income tax effect | ( | ) | ( | ) | |||||||
Cumulative change in accounting principles | ( | ) | |||||||||
Accumulated effect of change in enacted tax rate | |||||||||||
Net unrealized investment depreciation of discontinued operations, sold | |||||||||||
Total change in net unrealized investment appreciation (depreciation), net of tax | $ | $ | ( | ) | $ | ||||||
We continually monitor the difference between our cost basis and the estimated fair value of our investments. Our accounting policy for impairment recognition requires other-than-temporary impairment ("OTTI") charges to be recorded when we determine that it is more likely than not that we will be unable to collect all amounts due according to the contractual terms of the fixed maturity security. Impairment charges on investments are recorded
83
based on the fair value of the investments at the measurement date or based on the value calculated using a discounted cash flow model. Credit-related impairments on fixed maturity securities that we do not plan to sell, and for which we are not more likely than not to be required to sell, are recognized in net income. Any non-credit related impairment is recognized as a component of other comprehensive income. Factors considered in evaluating whether a decline in value is other-than-temporary include: the length of time and the extent to which fair value has been less than cost; the financial condition and near-term prospects of the issuer; our intention to hold the investment; and the likelihood that we will be required to sell the investment.
The tables on the following pages summarize our fixed maturity and equity securities that were in an unrealized loss position at December 31, 2019 and 2018 for continuing operations and discontinued operations. The securities are presented by the length of time they have been continuously in an unrealized loss position. It is possible that we could recognize OTTI charges in future periods on securities held at December 31, 2019 if future events or information cause us to determine that a decline in fair value is other-than-temporary.
We have evaluated the near-term prospects of the issuers of our fixed maturity securities in relation to the severity and duration of the unrealized loss and determined that these losses did not warrant the recognition of an OTTI charge in 2019, 2018 or 2017. All fixed maturity securities in the investment portfolio continue to pay the expected coupon payments under the contractual terms of the securities. We believe the unrealized depreciation in value of other securities in our fixed maturity portfolio is primarily attributable to changes in market interest rates and not the credit quality of the issuer. We have no intention to sell and it is more likely than not that we will not be required to sell these securities until the fair value recovers to at least equal to our cost basis or the securities mature.
84
December 31, 2019 | Less than 12 months | 12 months or longer | Total | ||||||||||||||||||||||||||
Type of Investment | Number of Issues | Fair Value | Gross Unrealized Depreciation | Number of Issues | Fair Value | Gross Unrealized Depreciation | Fair Value | Gross Unrealized Depreciation | |||||||||||||||||||||
AVAILABLE-FOR-SALE | |||||||||||||||||||||||||||||
Fixed maturities | |||||||||||||||||||||||||||||
Bonds | |||||||||||||||||||||||||||||
U.S. Treasury | $ | $ | $ | $ | $ | $ | |||||||||||||||||||||||
U.S. government agency | |||||||||||||||||||||||||||||
Corporate bonds - financial services | |||||||||||||||||||||||||||||
Mortgage-backed securities | |||||||||||||||||||||||||||||
Collateralized mortgage obligations | |||||||||||||||||||||||||||||
Government national mortgage association | |||||||||||||||||||||||||||||
Federal home loan mortgage corporation | |||||||||||||||||||||||||||||
Federal national mortgage association | |||||||||||||||||||||||||||||
Total Available-for-Sale Fixed Maturities | $ | $ | $ | $ | $ | $ | |||||||||||||||||||||||
85
December 31, 2018 | Less than 12 months | 12 months or longer | Total | ||||||||||||||||||||||||||
Type of Investment | Number of Issues | Fair Value | Gross Unrealized Depreciation | Number of Issues | Fair Value | Gross Unrealized Depreciation | Fair Value | Gross Unrealized Depreciation | |||||||||||||||||||||
AVAILABLE-FOR-SALE | |||||||||||||||||||||||||||||
Fixed maturities | |||||||||||||||||||||||||||||
Bonds | |||||||||||||||||||||||||||||
U.S. Treasury | $ | $ | $ | $ | $ | $ | |||||||||||||||||||||||
U.S. government agency | |||||||||||||||||||||||||||||
States, municipalities and political subdivisions | |||||||||||||||||||||||||||||
General obligations | |||||||||||||||||||||||||||||
Midwest | |||||||||||||||||||||||||||||
Northeast | |||||||||||||||||||||||||||||
South | |||||||||||||||||||||||||||||
West | |||||||||||||||||||||||||||||
Special revenue | |||||||||||||||||||||||||||||
Midwest | |||||||||||||||||||||||||||||
Northeast | |||||||||||||||||||||||||||||
South | |||||||||||||||||||||||||||||
West | |||||||||||||||||||||||||||||
Foreign bonds | |||||||||||||||||||||||||||||
Public utilities | |||||||||||||||||||||||||||||
Corporate bonds | |||||||||||||||||||||||||||||
Energy | |||||||||||||||||||||||||||||
Industrials | |||||||||||||||||||||||||||||
Consumer goods and services | |||||||||||||||||||||||||||||
Health care | |||||||||||||||||||||||||||||
Technology, media and telecommunications | |||||||||||||||||||||||||||||
Financial services | |||||||||||||||||||||||||||||
Mortgage-backed securities | |||||||||||||||||||||||||||||
Collateralized mortgage obligations | |||||||||||||||||||||||||||||
Government national mortgage association | |||||||||||||||||||||||||||||
Federal home loan mortgage corporation | |||||||||||||||||||||||||||||
Federal national mortgage association | |||||||||||||||||||||||||||||
Asset-backed securities | |||||||||||||||||||||||||||||
Total Available-for-Sale Fixed Maturities | $ | $ | $ | $ | $ | $ | |||||||||||||||||||||||
NOTE 3. FAIR VALUE OF FINANCIAL INSTRUMENTS
Current accounting guidance on fair value measurements includes the application of a fair value hierarchy that requires us to maximize the use of observable inputs and minimize the use of unobservable inputs when measuring fair value. Our financial instruments that are recorded at fair value are categorized into a three-level hierarchy, which is based upon the priority of the inputs to the valuation technique. The fair value hierarchy gives the highest priority to quoted prices in active markets for identical assets (i.e., Level 1) and the lowest priority to unobservable inputs (i.e., Level 3). If the inputs used to measure fair value fall within different levels of the hierarchy, the category level is based on the lowest priority level input that is significant to the fair value measurement of the financial instrument.
86
Financial instruments recorded at fair value are categorized in the fair value hierarchy as follows:
• | Level 1: Valuations are based on unadjusted quoted prices in active markets for identical financial instruments that we have the ability to access. |
• | Level 2: Valuations are based on quoted prices for similar financial instruments, other than quoted prices included in Level 1, in markets that are not active or on inputs that are observable either directly or indirectly for the full term of the financial instrument. |
• | Level 3: Valuations are based on pricing or valuation techniques that require inputs that are both unobservable and significant to the overall fair value measurement of the financial instrument. Such inputs may reflect management's own assumptions about the assumptions a market participant would use in pricing the financial instrument. |
We review our fair value hierarchy categorizations on a quarterly basis at which time the classification of certain financial instruments may change if the input observations have changed. Transfers between levels, if any, are recorded as of the beginning of the reporting period.
To determine the fair value of the majority of our investments, we utilize prices obtained from independent, nationally recognized pricing services. We obtain one price for each security. When the pricing services cannot provide a determination of fair value for a specific security, we obtain non-binding price quotes from broker-dealers with whom we have had several years experience and who have demonstrated knowledge of the subject security. We request and utilize one broker quote per security.
In order to determine the proper classification in the fair value hierarchy for each security where the price is obtained from an independent pricing service, we obtain and evaluate the vendors' pricing procedures and inputs used to price the security, which include unadjusted quoted market prices for identical securities, such as a New York Stock Exchange closing price, and quoted prices for identical securities in markets that are not active. For fixed maturity securities, an evaluation of interest rates and yield curves observable at commonly quoted intervals, volatility, prepayment speeds, credit risks and default rates may also be performed. We have determined that these processes and inputs result in fair values and classifications consistent with the applicable accounting guidance on fair value measurements.
When possible, we use quoted market prices to determine the fair value of fixed maturities, equity securities, trading securities and short-term investments. When quoted market prices do not exist, we base estimates of fair value on market information obtained from independent pricing services and brokers or on valuation techniques that are both unobservable and significant to the overall fair value measurement of the financial instrument. Such inputs may reflect management's own assumptions about the assumptions a market participant would use in pricing the financial instrument. Our valuation techniques are discussed in more detail throughout this section.
The fair value of our mortgage loans is determined by modeling performed by us based on the stated principal and coupon payments provided for in the loan agreements. These cash flows are then discounted using an appropriate risk-adjusted discount rate to determine the loan's fair value, which is a Level 3 fair value measurement.
Our other long-term investments consist primarily of our interests in limited liability partnerships that are recorded on the equity method of accounting. The fair value of the partnerships is obtained from the fund managers, which is based on the fair value of the underlying investments held in the partnerships. In management's opinion, these values represent a reasonable estimate of fair value. We have not adjusted the net asset value provided by the fund managers.
For cash and cash equivalents and accrued investment income, carrying value is a reasonable estimate of fair value due to the short-term nature of these financial instruments.
The Company formed a rabbi trust in 2014 to fund obligations under the United Fire & Casualty Company Non-qualified Deferred Compensation Plan and United Fire Group Supplemental Executive Retirement and Deferral Plan
87
(collectively the "Executive Retirement Plans"). Within the rabbi trust, corporate-owned life insurance ("COLI") policies are utilized as an investment vehicle and source of funding for the Company's Executive Retirement Plans. The COLI policies invest in mutual funds, which are priced daily by independent sources. As of December 31, 2019, the cash surrender value of the COLI policies was $6,777 , which is equal to the fair value measured using Level 2 inputs, based on the underlying assets of the COLI policies, and is included in other assets in the Consolidated Balance Sheets.
December 31, 2019 | December 31, 2018 | ||||||||||||||
Fair Value | Carrying Value | Fair Value | Carrying Value | ||||||||||||
Assets | |||||||||||||||
Investments | |||||||||||||||
Fixed maturities: | |||||||||||||||
Available-for-sale securities | $ | $ | $ | $ | |||||||||||
Trading securities | |||||||||||||||
Equity securities: | |||||||||||||||
Mortgage loans | |||||||||||||||
Other long-term investments | |||||||||||||||
Short-term investments | |||||||||||||||
Cash and cash equivalents | |||||||||||||||
Corporate-owned life insurance | |||||||||||||||
88
The following tables present the categorization for our financial instruments measured at fair value on a recurring basis. The tables include financial instruments at December 31, 2019 and 2018:
Fair Value Measurements | |||||||||||||||
Description | December 31, 2019 | Level 1 | Level 2 | Level 3 | |||||||||||
AVAILABLE-FOR-SALE | |||||||||||||||
Fixed maturities | |||||||||||||||
Bonds | |||||||||||||||
U.S. Treasury | $ | $ | $ | $ | |||||||||||
U.S. government agency | |||||||||||||||
States, municipalities and political subdivisions | |||||||||||||||
General obligations | |||||||||||||||
Midwest | |||||||||||||||
Northeast | |||||||||||||||
South | |||||||||||||||
West | |||||||||||||||
Special revenue | |||||||||||||||
Midwest | |||||||||||||||
Northeast | |||||||||||||||
South | |||||||||||||||
West | |||||||||||||||
Foreign bonds | |||||||||||||||
Public utilities | |||||||||||||||
Corporate bonds | |||||||||||||||
Energy | |||||||||||||||
Industrials | |||||||||||||||
Consumer goods and services | |||||||||||||||
Health care | |||||||||||||||
Technology, media and telecommunications | |||||||||||||||
Financial services | |||||||||||||||
Mortgage-backed securities | |||||||||||||||
Collateralized mortgage obligations | |||||||||||||||
Government national mortgage association | |||||||||||||||
Federal home loan mortgage corporation | |||||||||||||||
Federal national mortgage association | |||||||||||||||
Asset-backed securities | |||||||||||||||
Total Available-For-Sale Fixed Maturities | $ | $ | $ | $ | |||||||||||
TRADING | |||||||||||||||
Fixed maturities | |||||||||||||||
Bonds | |||||||||||||||
Corporate bonds | |||||||||||||||
Consumer goods and services | $ | $ | $ | $ | |||||||||||
Health care | |||||||||||||||
Technology, media and telecommunications | |||||||||||||||
Financial services | |||||||||||||||
Redeemable preferred stocks | |||||||||||||||
Total Trading Securities | $ | $ | $ | $ | |||||||||||
Equity securities | |||||||||||||||
Public utilities | |||||||||||||||
Energy | |||||||||||||||
Industrials | |||||||||||||||
Consumer goods and services | |||||||||||||||
Health care | |||||||||||||||
Technology, Media & Telecommunications | |||||||||||||||
Financial Services | |||||||||||||||
Nonredeemable preferred stocks | |||||||||||||||
89
Total Equity Securities | $ | $ | $ | $ | |||||||||||
Short-Term Investments | $ | $ | $ | $ | |||||||||||
Money Market Accounts | $ | $ | $ | $ | |||||||||||
Corporate-Owned Life Insurance | $ | $ | $ | $ | |||||||||||
Total Assets Measured at Fair Value | $ | $ | $ | $ | |||||||||||
90
Fair Value Measurements | |||||||||||||||
Description | December 31, 2018 | Level 1 | Level 2 | Level 3 | |||||||||||
AVAILABLE-FOR-SALE | |||||||||||||||
Fixed maturities | |||||||||||||||
Bonds | |||||||||||||||
U.S. Treasury | $ | $ | $ | $ | |||||||||||
U.S. government agency | |||||||||||||||
States, municipalities and political subdivisions | |||||||||||||||
General obligations | |||||||||||||||
Midwest | |||||||||||||||
Northeast | |||||||||||||||
South | |||||||||||||||
West | |||||||||||||||
Special revenue | |||||||||||||||
Midwest | |||||||||||||||
Northeast | |||||||||||||||
South | |||||||||||||||
West | |||||||||||||||
Foreign bonds | |||||||||||||||
Public utilities | |||||||||||||||
Corporate bonds | |||||||||||||||
Energy | |||||||||||||||
Industrials | |||||||||||||||
Consumer goods and services | |||||||||||||||
Health care | |||||||||||||||
Technology, media and telecommunications | |||||||||||||||
Financial services | |||||||||||||||
Mortgage-backed securities | |||||||||||||||
Collateralized mortgage obligations | |||||||||||||||
Government national mortgage association | |||||||||||||||
Federal home loan mortgage corporation | |||||||||||||||
Federal national mortgage association | |||||||||||||||
Asset-backed securities | |||||||||||||||
Total Available-For-Sale Fixed Maturities | $ | $ | $ | $ | |||||||||||
TRADING | |||||||||||||||
Fixed maturities | |||||||||||||||
Bonds | |||||||||||||||
Corporate bonds | |||||||||||||||
Industrials | $ | $ | $ | $ | |||||||||||
Consumer goods and services | |||||||||||||||
Health care | |||||||||||||||
Technology, media and telecommunications | |||||||||||||||
Financial services | |||||||||||||||
Redeemable preferred stocks | |||||||||||||||
Total Trading Securities | $ | $ | $ | $ | |||||||||||
Equity securities | |||||||||||||||
Public utilities | $ | $ | $ | $ | |||||||||||
Energy | |||||||||||||||
Industrials | |||||||||||||||
Consumer goods and services | |||||||||||||||
Health care | |||||||||||||||
Financial Services | |||||||||||||||
91
Technology, media and telecommunications | |||||||||||||||
Nonredeemable preferred stocks | |||||||||||||||
Total Equity Securities | $ | $ | $ | $ | |||||||||||
Short-Term Investments | $ | $ | $ | $ | |||||||||||
Money Market Accounts | $ | $ | $ | $ | |||||||||||
Corporate-Owned Life Insurance | $ | $ | $ | $ | |||||||||||
Total Assets Measured at Fair Value | $ | $ | $ | $ | |||||||||||
We use a market-based approach for valuing all of our Level 2 securities and receive them primarily from a third-party valuation service provider. Any of these securities not valued by this service provider are submitted to another third-party valuation service provider for pricing. Both service providers use a market approach to find pricing of similar financial instruments. The market inputs our service providers normally seek to value our securities include the following, listed in approximate order of priority: benchmark yields, reported trades, broker/dealer quotes, issuer spreads, two-sided markets, benchmark securities, bids, offers, and reference data including market research publications. The method and inputs for these securities classified as Level 2 are the same regardless of industry category, credit quality, duration, geographical concentration or economic characteristics. For our mortgage-backed securities, collateralized mortgage obligations and asset-backed securities, our service providers use additional market inputs to value these securities, including the following: new issue data, periodic payment information, monthly payment information, collateral performance and real estate analysis from third parties. Our service providers prioritize inputs based on market conditions, and not all inputs listed are available for use in the valuation process for each security on any given day.
At least annually, we review the methodologies and assumptions used by our valuation service providers and verify that they are reasonable and representative of the fair value of the underlying securities held in the investment portfolio. We validate the prices obtained from independent pricing services and brokers prior to their use for reporting purposes. In addition, we also test all securities in the portfolio and independently corroborate the valuations obtained from our third-party valuation service providers with additional pricing sources. We also perform deep dive analysis of the pricing method used by our third-party valuation service provider by selecting a random sample of securities by asset class. In our opinion, the pricing obtained at December 31, 2019 and 2018 was reasonable.
For the year ended December 31, 2019, the change in our available-for-sale securities categorized as Level 1 and Level 2 is the result of investment purchases that were made using funds held in our money market accounts, disposals and the change in unrealized gains on both fixed maturities and equity securities. During the twelve month period ended December 31, 2019, there were no securities transferred between Level 1 and Level 2.
Securities categorized as Level 3 include holdings in certain private placement fixed maturity and equity securities for which an active market does not currently exist. The fair value of our Level 3 private placement securities is determined by management relying on pricing received from our independent pricing services and brokers consistent with the process to estimate fair value for Level 2 securities. However, securities are categorized as Level 3 if these quotes cannot be corroborated by other market observable data due to the unobservable nature of the brokers’ valuation processes. If pricing cannot be obtained from these sources, which occurs on a limited basis, management will perform a discounted cash flow analysis, using an appropriate risk-adjusted discount rate, on the underlying security to estimate fair value. During the twelve month period ended December 31, 2019 and 2018, there were no securities transferred in or out of Level 3.
92
The following table provides a summary of the changes in fair value of our Level 3 securities for 2019:
Corporate bonds | Asset-backed securities | Equities | Total | |||||||||||||
Balance at January 1, 2019 | $ | $ | $ | $ | ||||||||||||
Unrealized gains (losses) (1) | ||||||||||||||||
Purchases | ||||||||||||||||
Disposals | ( | ) | ( | ) | ||||||||||||
Balance at December 31, 2019 | $ | $ | $ | $ | ||||||||||||
(1) Unrealized gains (losses) are recorded as a component of comprehensive income.
Corporate bonds | Asset-backed securities | Equities | Total | |||||||||||||
Balance at January 1, 2018 | $ | $ | $ | $ | ||||||||||||
Unrealized gains (losses) (1) | ( | ) | ( | ) | ||||||||||||
Purchases | ||||||||||||||||
Balance at December 31, 2018 | $ | $ | $ | $ | ||||||||||||
The fixed maturities reported as disposals relate to the receipt of principal on calls or sinking fund bonds, in accordance with the indentures.
Commercial Mortgage Loans
The following tables present the carrying value of our commercial mortgage loans and additional information at December 31, 2019 and 2018:
Commercial Mortgage Loans | |||||||
Loan-to-value | December 31, 2019 | December 31, 2018 | |||||
Less than 65% | $ | ||||||
65%-75% | |||||||
Greater than 75% | |||||||
Total amortized cost | $ | $ | |||||
Valuation allowance | ( | ) | ( | ) | |||
Total mortgage loans | $ | $ | |||||
Mortgage Loans by Region | |||||||||||||
December 31, 2019 | December 31, 2018 | ||||||||||||
Carrying Value | Percent of Total | Carrying Value | Percent of Total | ||||||||||
East North Central | $ | % | $ | % | |||||||||
Southern Atlantic | |||||||||||||
East South Central | |||||||||||||
New England | |||||||||||||
Middle Atlantic | |||||||||||||
Mountain | |||||||||||||
Total mortgage loans at amortized cost | $ | % | $ | % | |||||||||
93
Mortgage Loans by Property Type | |||||||||||||
December 31, 2019 | December 31, 2018 | ||||||||||||
Carrying Value | Percent of Total | Carrying Value | Percent of Total | ||||||||||
Commercial | |||||||||||||
Multifamily | $ | % | $ | % | |||||||||
Office | |||||||||||||
Retail | |||||||||||||
Mixed use/Other | |||||||||||||
Total mortgage loans at amortized cost | $ | % | $ | % | |||||||||
Mortgage Loan Valuation Allowance
The commercial mortgage loans originate with an initial loan-to-value ratio to provide sufficient collateral to absorb losses should a loan be required to foreclose. Mortgage loans are evaluated on a quarterly basis for impairment on an individual basis through a monitoring process and review of key credit indicators, such as economic trends, delinquency rates, property valuations, occupancy and rental rates and loan-to-value ratios. A loan is considered impaired when the Company believes it will not collect the contractual principal and interest set forth in the contractual terms of the loan. A valuation allowance is established on each loan recognizing a loss for amounts which we believe will not be collected according to the contractual terms of the respective loan agreement. For the year end December 31, 2019 the Company had a valuation allowance of $72 .
94
NOTE 4. REINSURANCE
Continuing Operations - Property and Casualty Insurance Business
Ceded and Assumed Reinsurance
Reinsurance is a contract by which one insurer, called the reinsurer, agrees to cover, under certain defined circumstances, a portion of the losses incurred by a primary insurer if a claim is made under a policy issued by the primary insurer. Our property and casualty insurance companies follow the industry practice of reinsuring a portion of their exposure by ceding to reinsurers a portion of the premium received and a portion of the risk under the policies written. We purchase reinsurance to reduce the net liability on individual risks to predetermined limits and to protect us against catastrophic losses, such as a hurricane or tornado. We do not engage in any reinsurance transactions classified as finite risk reinsurance.
We account for premiums, written and earned, and losses incurred net of reinsurance ceded. The ceding of insurance does not legally discharge us from primary liability under our policies, and we must pay the loss if the reinsurer fails to meet its obligation. We periodically monitor the financial condition of our reinsurers to confirm that they are financially stable. We believe that all of our reinsurers are in an acceptable financial condition and there were no reinsurance balances at December 31, 2019 for which collection is at risk that would result in a material impact on our Consolidated Financial Statements. The amount of reinsurance recoverable on paid losses totaled $3,833 and $3,779 at December 31, 2019 and 2018, respectively.
We also assume both property and casualty insurance from other insurance or reinsurance companies. Most of the business we have assumed is property insurance, with an emphasis on catastrophe coverage.
Premiums and losses and loss settlement expenses related to our ceded and assumed business are as follows:
Years Ended December 31, | 2019 | 2018 | 2017 | ||||||||
Ceded Business | |||||||||||
Ceded premiums written | $ | $ | $ | ||||||||
Ceded premiums earned | |||||||||||
Loss and loss settlement expenses ceded | |||||||||||
Assumed Business | |||||||||||
Assumed premiums written | $ | $ | $ | ||||||||
Assumed premiums earned | |||||||||||
Loss and loss settlement expenses assumed | ( | ) | |||||||||
In 2019 we added two additional assumed programs and did not renew one program from 2018. Loss and loss settlement expenses ceded increased in 2019 as compared to 2018, primarily due to an increase in severity of commercial auto losses, assumed reinsurance losses, extra contractual obligations and catastrophe losses.
In 2018, we renewed our participation in all of our assumed programs. Loss and loss settlement expenses decreased in 2018 compared to 2017 as we remain conservative in our reserving approach, and during the year we reviewed our book of business and released excess reserves. During 2018 for ceded business, ceded loss and loss settlement expenses decreased primarily due to commercial auto, commercial property, and catastrophe losses staying in our retention lowering our ceded recoverable amounts.
In 2017, we renewed our participation in all of our assumed programs.
Refer to Note 5 "Reserves for Losses and Loss Settlement Expenses" for an analysis of changes in our overall property and casualty insurance reserves.
95
Reinsurance Programs and Retentions
We have several programs that provide reinsurance coverage. This reinsurance coverage limits the risk of loss that we retain by reinsuring direct risks in excess of our retention limits. The following table provides a summary of our primary reinsurance programs. Retention amounts reflect the accumulated retentions and co-participation of all layers within a program. For 2019, there was an all lines annual aggregate excess of loss program with variable retention of 6.66 percent of gross net earned premium with a minimum retention of $58.5 million and a maximum of $71.5 million. Our all lines aggregate recovery is also limited to $30.0 million. For 2018, there was an all lines annual aggregate excess of loss program with a variable retention of 6.78 percent of gross net earned premium with a minimum retention of $58.5 million and a maximum of $71.5 million. Our all lines aggregate recovery is also limited to a maximum of $30.0 million. For 2017, there was an all lines annual aggregate excess of loss program with a variable retention of 7.02 percent of gross net earned premium with a minimum retention of $58.5 million and a maximum of $71.5 million. Our all lines aggregate recovery is also limited to a maximum of $30.0 million.
2019 Reinsurance Programs | ||||||||||||||
Type of Reinsurance | Stated Retention | Limits | Coverage | |||||||||||
Casualty excess of loss | $ | $ | % | of | $ | |||||||||
Property excess of loss | % | of | $ | |||||||||||
Surety excess of loss | % | of | $ | |||||||||||
Property catastrophe, excess | % | of | $ | |||||||||||
Boiler and machinery | N/A | % | of | $ | ||||||||||
2018 Reinsurance Programs | ||||||||||||||
Type of Reinsurance | Stated Retention | Limits | Coverage | |||||||||||
Casualty excess of loss | $ | $ | % | of | $ | |||||||||
Property excess of loss | % | of | $ | |||||||||||
Surety excess of loss | % | of | $ | |||||||||||
Property catastrophe, excess | % | of | $ | |||||||||||
Boiler and machinery | N/A | % | of | $ | ||||||||||
2017 Reinsurance Programs | ||||||||||||||
Type of Reinsurance | Stated Retention | Limits | Coverage | |||||||||||
Casualty excess of loss | $ | $ | % | of | $ | |||||||||
Property excess of loss | % | of | $ | |||||||||||
Surety excess of loss | % | of | $ | |||||||||||
Property catastrophe, excess | % | of | $ | |||||||||||
Boiler and machinery | N/A | % | of | $ | ||||||||||
If we incur catastrophe losses and loss settlement expenses that exceed the coverage limits of our reinsurance program, our property catastrophe program provides one guaranteed reinstatement. In such an instance, we are required to pay the reinsurers a reinstatement premium equal to the full amount of the original premium, which will reinstate the full amount of reinsurance available under the property catastrophe program.
Discontinued Operations - Life Insurance Business
Premiums and losses and loss settlement expenses related to our ceded business are as follows:
96
Years Ended December 31, | 2019 | 2018 | 2017 | ||||||||
Ceded Business | |||||||||||
Ceded insurance in-force | $ | $ | $ | ||||||||
Ceded premiums earned | |||||||||||
Loss and loss settlement expenses ceded | |||||||||||
The ceding of insurance did not legally discharge United Life from primary liability under its policies. United Life must pay the loss if the reinsurer fails to meet its obligations. United Life periodically monitored the financial condition of their reinsurers to confirm that they were financially stable and had strong credit ratings. We believe that all of the reinsurers were in an acceptable financial condition.
NOTE 5. RESERVES FOR LOSSES AND LOSS SETTLEMENT EXPENSES
Property insurance indemnifies an insured with an interest in physical property for loss of, or damage to, such property or the loss of its income-producing abilities. Casualty insurance primarily covers liability for damage to property of, or injury to, a person or entity other than the insured. In most cases, casualty insurance also obligates the insurance company to provide a defense for the insured in litigation, arising out of events covered by the policy.
Liabilities for losses and loss settlement expenses reflect management's best estimates at a given point in time of what we expect to pay for claims that have been reported and those that have been incurred but not reported ("IBNR"), based on known facts, circumstances, and historical trends. Because property and casualty insurance reserves are estimates of the unpaid portions of incurred losses that have been reported to us, as well as losses that have been incurred but not reported, the establishment of appropriate reserves, including reserves for catastrophes, is an inherently uncertain and complex process. The ultimate cost of losses and related loss settlement expenses may vary materially from recorded amounts. We regularly update our reserve estimates as new information becomes available and as events unfold that may affect the resolution of unsettled claims. Changes in prior year reserve estimates, which may be material, are reported as a component of losses and loss settlement expenses incurred in the period such changes are determined.
The determination of reserves (particularly those relating to liability lines of insurance that have relatively longer lag in claim reporting) requires significant work to reasonably project expected future claim reporting and payment patterns. If, during the course of our regular monitoring of reserves, we determine that coverages previously written are incurring higher than expected losses, we will take action that may include, among other things, increasing the related reserves. Any adjustments we make to reserves are reflected in operating results in the year in which we make those adjustments. We engage an independent actuary, Regnier Consulting Group, Inc. ("Regnier"), to render an opinion as to the reasonableness of our statutory reserves annually. The actuarial opinion is filed in those states where we are licensed.
On a quarterly basis, United Fire's internal actuary performs a detailed actuarial review of IBNR reserves. This review includes a comparison of results from the most recent analysis of reserves completed by both our internal and external actuaries. Senior management meets with our internal actuary to review, on a regular and quarterly basis, the adequacy of carried reserves based on results from this actuarial analysis. There are two fundamental types or sources of IBNR reserves. We record IBNR reserves for "normal" types of claims and also specific IBNR reserves related to unique circumstances or events. A major hurricane is an example of an event that might necessitate establishing specific IBNR reserves because an analysis of existing historical data would not provide an appropriate estimate.
Our IBNR methodologies and assumptions are reviewed periodically, but changes are infrequent. In response to an increase in miles driven by commercial vehicles and an increase in distracted driving claims, we revised our commercial automobile assumptions, resulting in an increase to our carried loss IBNR. We also reviewed our methodology and assumptions in our product liability line, associated with our construction defects business, and assumptions due to improvement in development patterns related to the statute of limitations on accident years that
97
have matured 13 to 15 years which haven't developed to the extent we initially expected. These assumption changes resulted in a release of IBNR in 2017 for our product liability line. Besides the changes to our assumptions used for our commercial automobile line and product liability line, we continually review and revise items affecting our projections of required reserves for unpaid loss and loss adjustment expense ("LAE"). Items reviewed and revised include development factors for paid and reported loss, paid development factors for allocated LAE, and the ratios of paid unallocated LAE to paid loss.
We do not discount loss reserves based on the time value of money.
The following table provides an analysis of changes in our property and casualty losses and loss settlement expense reserves for 2019, 2018 and 2017 (net of reinsurance amounts):
Years Ended December 31, | 2019 | 2018 | 2017 | ||||||||
Gross liability for losses and loss settlement expenses at beginning of year | $ | $ | $ | ||||||||
Ceded losses and loss settlement expenses | ( | ) | ( | ) | ( | ) | |||||
Net liability for losses and loss settlement expenses at beginning of year | $ | $ | $ | ||||||||
Losses and loss settlement expenses incurred for claims occurring during | |||||||||||
Current year | $ | $ | $ | ||||||||
Prior years | ( | ) | ( | ) | ( | ) | |||||
Total incurred | $ | $ | $ | ||||||||
Losses and loss settlement expense payments for claims occurring during | |||||||||||
Current year | $ | $ | $ | ||||||||
Prior years | |||||||||||
Total paid | $ | $ | $ | ||||||||
Net liability for losses and loss settlement expenses at end of year | $ | $ | $ | ||||||||
Ceded loss and loss settlement expenses | |||||||||||
Gross liability for losses and loss settlement expenses at end of year | $ | $ | $ | ||||||||
There are a multitude of factors that can impact loss reserve development. Those factors include, but are not limited to: historical data, the potential impact of various loss reserve development factors and trends including historical loss experience, legislative enactments, judicial decisions, legal developments in imposition of damages, experience with alternative dispute resolution, results of our medical bill review process, the potential impact of salvage and subrogation and changes and trends in general economic conditions, including the effects of inflation. All of these factors influence our estimates of required reserves and for long tail lines these factors can change over the course of the settlement of the claim. However, there is no precise method for evaluating the specific dollar impact of any individual factor on the development of reserves.
The significant drivers of the favorable reserve development in 2019 were our workers' compensation partially offset by unfavorable development primarily for commercial liability and commercial automobile. Workers compensation favorable development was primarily from reserve reductions for both reported claims and loss IBNR which were more than sufficient to offset paid loss with additional favorable development coming from LAE, where the reduction in LAE reserves was more than sufficient to offset paid LAE. The other lines with relatively small contributions to development, either favorable or unfavorable, generally experienced favorable development for LAE. Commercial liability unfavorable development was primarily from paid loss which exceeded reserve reductions for both reported claims and loss IBNR; additional unfavorable development came from LAE where paid LAE exceeded reductions of LAE reserves. Commercial liability and commercial automobile continue to be
98
adversely affected by reserve strengthening for both reported claims and loss IBNR in response to an increase in severity of claims. Commercial liability continues to receive umbrella claims which flow in from commercial automobile.
The significant drivers of the favorable reserve development in 2018 were our workers' compensation, reinsurance assumed, commercial automobile and fidelity and surety. During 2018 the only individual line with unfavorable development was commercial liability. Workers' compensation favorable development was primarily from reserve reductions for both reported claims and loss IBNR which were more than sufficient to offset paid loss with additional favorable development coming from LAE where the LAE IBNR reduction was more than sufficient to offset paid LAE which continues to benefit from additional litigation management efforts when compared to prior years. Reinsurance assumed favorable development is attributable reductions in reserves for both reported claims and loss IBNR as we reviewed our book of business and released excess reserves during 2018. Commercial automobile favorable development was driven by LAE where LAE IBNR reductions were more than sufficient to offset paid LAE. Fidelity and surety favorable development is attributable reductions in reserves for both reported claims and loss IBNR which were more than sufficient to offset paid loss. Commercial liability adverse development is attributable to reserve strengthening for both reported claims and loss IBNR primarily in response to an increase in umbrella auto related claims while LAE developed favorably with reductions of LAE IBNR more than sufficient to offset paid LAE.
The significant drivers of the favorable reserve development in 2017 were our commercial liability and workers' compensation lines of business. Much of the favorable commercial liability development came from LAE and is attributed to our continued litigation management efforts combined with some favorable development coming from decreases in reserves, which were more than sufficient to pay claims as they closed. Workers' compensation favorable development was due to the combined effects of decreases in claim reserves along with favorable changes affecting LAE. Our personal lines also contributed favorable development. The lines that experienced adverse development during the year, which partially offset the favorable development mentioned earlier, were assumed reinsurance and commercial automobile. The adverse development for assumed reinsurance is due to increases in prior year reserves for unpaid claims while the adverse development for commercial auto is due to paid losses which were greater than reductions in reported loss reserves and reserves for claims incurred but not reported. No other single line of business contributed a significant portion of the total development.
Generally, we base reserves for each claim on the estimated ultimate exposure for that claim. We believe that it is appropriate and reasonable to establish a best estimate for reserves within a range of reasonable estimates, especially when we are reserving for claims for bodily injury, disabilities and similar claims, for which settlements and verdicts can vary widely. Our reserving philosophy may result in favorable reserve development in future years that will decrease losses and loss settlement expenses for prior year claims in the year of adjustment. We realize that this philosophy, coupled with what we believe to be aggressive and successful claims management and loss settlement practices, has resulted in year-to-year redundancies in reserves. We believe our approach produces recorded reserves that are reasonably consistent as to their relative position within a range of reasonable reserves from year-to-year. However, conditions and trends that have affected the reserve development for a given year do change. Therefore, such development cannot be used to project future reserve redundancies or deficiencies.
We are not aware of any significant contingent liabilities related to environmental issues. Because of the type of property coverage we write, we have potential exposure to environmental pollution, mold and asbestos claims. Our underwriters are aware of these exposures and use riders or endorsements to limit exposure.
99
The following tables provide information about incurred and paid losses and loss settlement expense development as of December 31, 2019, net of reinsurance, as well as cumulative development, cumulative claim frequency and IBNR liabilities. Claim data for Mercer Insurance Group, Inc., which was acquired on March 28, 2011, is presented retrospectively.
The cumulative number of reported claims, for calendar year 2019, 2018 and 2017, are counted for all lines of business on a per claimant per coverage basis and a single event may result in multiple claims due to the involvement of multiple individual claimants and / or multiple independent coverages. Claim counts for calendar years 2016 and prior are counted on a per claim and per coverage basis. Claim counts include open claims, claims that have been paid and closed, and reported claims that have been closed without the need for any payment.
Line of business: Commercial other liability | ||||||||||||||||||||||||||||||||||||||
Incurred losses and allocated loss settlement expenses, net of reinsurance | As of December 31, 2019 | |||||||||||||||||||||||||||||||||||||
For the years ended December 31, | Total of incurred but not reported liabilities plus expected development on reported claims | Cumulative development | Cumulative number of reported claims | |||||||||||||||||||||||||||||||||||
Accident Year | 2010 | 2011 | 2012 | 2013 | 2014 | 2015 | 2016 | 2017 | 2018 | 2019 | ||||||||||||||||||||||||||||
(Unaudited) | ||||||||||||||||||||||||||||||||||||||
2010 | $ | $ | $ | $ | $ | $ | $ | $ | $ | $ | $ | ( | ) | |||||||||||||||||||||||||
2011 | ||||||||||||||||||||||||||||||||||||||
2012 | ( | ) | ||||||||||||||||||||||||||||||||||||
2013 | ( | ) | ||||||||||||||||||||||||||||||||||||
2014 | ( | ) | ||||||||||||||||||||||||||||||||||||
2015 | ( | ) | ||||||||||||||||||||||||||||||||||||
2016 | ||||||||||||||||||||||||||||||||||||||
2017 | ||||||||||||||||||||||||||||||||||||||
2018 | ||||||||||||||||||||||||||||||||||||||
2019 | ||||||||||||||||||||||||||||||||||||||
Total | $ | |||||||||||||||||||||||||||||||||||||
100
Line of business: Commercial other liability | ||||||||||||||||||||||||||||||
Cumulative paid losses and allocated loss settlement expenses, net of reinsurance | ||||||||||||||||||||||||||||||
For the years ended December 31, | ||||||||||||||||||||||||||||||
Accident Year | 2010 | 2011 | 2012 | 2013 | 2014 | 2015 | 2016 | 2017 | 2018 | 2019 | ||||||||||||||||||||
(Unaudited) | ||||||||||||||||||||||||||||||
2010 | $ | $ | $ | $ | $ | $ | $ | $ | $ | $ | ||||||||||||||||||||
2011 | ||||||||||||||||||||||||||||||
2012 | ||||||||||||||||||||||||||||||
2013 | ||||||||||||||||||||||||||||||
2014 | ||||||||||||||||||||||||||||||
2015 | ||||||||||||||||||||||||||||||
2016 | ||||||||||||||||||||||||||||||
2017 | ||||||||||||||||||||||||||||||
2018 | ||||||||||||||||||||||||||||||
2019 | ||||||||||||||||||||||||||||||
Total | $ | |||||||||||||||||||||||||||||
All outstanding liabilities for unpaid losses and loss settlement expenses before 2010, net of reinsurance | ||||||||||||||||||||||||||||||
Liabilities for unpaid losses and loss settlement expenses, net of reinsurance | $ | |||||||||||||||||||||||||||||
101
Line of business: Commercial fire and allied | ||||||||||||||||||||||||||||||||||||||
Incurred losses and allocated loss settlement expenses, net of reinsurance | As of December 31, 2019 | |||||||||||||||||||||||||||||||||||||
For the years ended December 31, | Total of incurred but not reported liabilities plus expected development on reported claims | Cumulative development | Cumulative number of reported claims | |||||||||||||||||||||||||||||||||||
Accident Year | 2010 | 2011 | 2012 | 2013 | 2014 | 2015 | 2016 | 2017 | 2018 | 2019 | ||||||||||||||||||||||||||||
(Unaudited) | ||||||||||||||||||||||||||||||||||||||
2010 | $ | $ | $ | $ | $ | $ | $ | $ | $ | $ | $ | ( | ) | |||||||||||||||||||||||||
2011 | ( | ) | ||||||||||||||||||||||||||||||||||||
2012 | ( | ) | ||||||||||||||||||||||||||||||||||||
2013 | ||||||||||||||||||||||||||||||||||||||
2014 | ||||||||||||||||||||||||||||||||||||||
2015 | ||||||||||||||||||||||||||||||||||||||
2016 | ( | ) | ||||||||||||||||||||||||||||||||||||
2017 | ||||||||||||||||||||||||||||||||||||||
2018 | ||||||||||||||||||||||||||||||||||||||
2019 | ||||||||||||||||||||||||||||||||||||||
Total | $ | |||||||||||||||||||||||||||||||||||||
102
Line of business: Commercial fire and allied | ||||||||||||||||||||||||||||||
Cumulative paid losses and allocated loss settlement expenses, net of reinsurance | ||||||||||||||||||||||||||||||
For the years ended December 31, | ||||||||||||||||||||||||||||||
Accident Year | 2010 | 2011 | 2012 | 2013 | 2014 | 2015 | 2016 | 2017 | 2018 | 2019 | ||||||||||||||||||||
(Unaudited) | ||||||||||||||||||||||||||||||
2010 | $ | $ | $ | $ | $ | $ | $ | $ | $ | $ | ||||||||||||||||||||
2011 | ||||||||||||||||||||||||||||||
2012 | ||||||||||||||||||||||||||||||
2013 | ||||||||||||||||||||||||||||||
2014 | ||||||||||||||||||||||||||||||
2015 | ||||||||||||||||||||||||||||||
2016 | ||||||||||||||||||||||||||||||
2017 | ||||||||||||||||||||||||||||||
2018 | ||||||||||||||||||||||||||||||
2019 | ||||||||||||||||||||||||||||||
Total | $ | |||||||||||||||||||||||||||||
All outstanding liabilities for unpaid losses and loss settlement expenses before 2010, net of reinsurance | ||||||||||||||||||||||||||||||
Liabilities for unpaid losses and loss settlement expenses, net of reinsurance | $ | |||||||||||||||||||||||||||||
103
Line of business: Commercial automobile | ||||||||||||||||||||||||||||||||||||||
Incurred losses and allocated loss settlement expenses, net of reinsurance | As of December 31, 2019 | |||||||||||||||||||||||||||||||||||||
For the years ended December 31, | Total of incurred but not reported liabilities plus expected development on reported claims | Cumulative development | Cumulative number of reported claims | |||||||||||||||||||||||||||||||||||
Accident Year | 2010 | 2011 | 2012 | 2013 | 2014 | 2015 | 2016 | 2017 | 2018 | 2019 | ||||||||||||||||||||||||||||
(Unaudited) | ||||||||||||||||||||||||||||||||||||||
2010 | $ | $ | $ | $ | $ | $ | $ | $ | $ | $ | $ | ( | ) | |||||||||||||||||||||||||
2011 | ||||||||||||||||||||||||||||||||||||||
2012 | ( | ) | ||||||||||||||||||||||||||||||||||||
2013 | ||||||||||||||||||||||||||||||||||||||
2014 | ||||||||||||||||||||||||||||||||||||||
2015 | ||||||||||||||||||||||||||||||||||||||
2016 | ||||||||||||||||||||||||||||||||||||||
2017 | ||||||||||||||||||||||||||||||||||||||
2018 | ||||||||||||||||||||||||||||||||||||||
2019 | ||||||||||||||||||||||||||||||||||||||
Total | $ | |||||||||||||||||||||||||||||||||||||
104
Line of business: Commercial automobile | ||||||||||||||||||||||||||||||
Cumulative paid losses and allocated loss settlement expenses, net of reinsurance | ||||||||||||||||||||||||||||||
For the years ended December 31, | ||||||||||||||||||||||||||||||
Accident Year | 2010 | 2011 | 2012 | 2013 | 2014 | 2015 | 2016 | 2017 | 2018 | 2019 | ||||||||||||||||||||
(Unaudited) | ||||||||||||||||||||||||||||||
2010 | $ | $ | $ | $ | $ | $ | $ | $ | $ | $ | ||||||||||||||||||||
2011 | ||||||||||||||||||||||||||||||
2012 | ||||||||||||||||||||||||||||||
2013 | ||||||||||||||||||||||||||||||
2014 | ||||||||||||||||||||||||||||||
2015 | ||||||||||||||||||||||||||||||
2016 | ||||||||||||||||||||||||||||||
2017 | ||||||||||||||||||||||||||||||
2018 | ||||||||||||||||||||||||||||||
2019 | ||||||||||||||||||||||||||||||
Total | $ | |||||||||||||||||||||||||||||
All outstanding liabilities for unpaid losses and loss settlement expenses before 2010, net of reinsurance | ||||||||||||||||||||||||||||||
Liabilities for unpaid losses and loss settlement expenses, net of reinsurance | $ | |||||||||||||||||||||||||||||
105
Line of business: Workers' compensation | ||||||||||||||||||||||||||||||||||||||
Incurred losses and allocated loss settlement expenses, net of reinsurance | As of December 31, 2019 | |||||||||||||||||||||||||||||||||||||
For the years ended December 31, | Total of incurred but not reported liabilities plus expected development on reported claims | Cumulative development | Cumulative number of reported claims | |||||||||||||||||||||||||||||||||||
Accident Year | 2010 | 2011 | 2012 | 2013 | 2014 | 2015 | 2016 | 2017 | 2018 | 2019 | ||||||||||||||||||||||||||||
(Unaudited) | ||||||||||||||||||||||||||||||||||||||
2010 | $ | $ | $ | $ | $ | $ | $ | $ | $ | $ | $ | |||||||||||||||||||||||||||
2011 | ( | ) | ||||||||||||||||||||||||||||||||||||
2012 | ( | ) | ||||||||||||||||||||||||||||||||||||
2013 | ( | ) | ||||||||||||||||||||||||||||||||||||
2014 | ( | ) | ||||||||||||||||||||||||||||||||||||
2015 | ( | ) | ||||||||||||||||||||||||||||||||||||
2016 | ( | ) | ||||||||||||||||||||||||||||||||||||
2017 | ( | ) | ||||||||||||||||||||||||||||||||||||
2018 | ( | ) | ||||||||||||||||||||||||||||||||||||
2019 | ||||||||||||||||||||||||||||||||||||||
Total | $ | |||||||||||||||||||||||||||||||||||||
106
Line of business: Workers' compensation | ||||||||||||||||||||||||||||||
Cumulative paid losses and allocated loss settlement expenses, net of reinsurance | ||||||||||||||||||||||||||||||
For the years ended December 31, | ||||||||||||||||||||||||||||||
Accident Year | 2010 | 2011 | 2012 | 2013 | 2014 | 2015 | 2016 | 2017 | 2018 | 2019 | ||||||||||||||||||||
(Unaudited) | ||||||||||||||||||||||||||||||
2010 | $ | $ | $ | $ | $ | $ | $ | $ | $ | $ | ||||||||||||||||||||
2011 | ||||||||||||||||||||||||||||||
2012 | ||||||||||||||||||||||||||||||
2013 | ||||||||||||||||||||||||||||||
2014 | ||||||||||||||||||||||||||||||
2015 | ||||||||||||||||||||||||||||||
2016 | ||||||||||||||||||||||||||||||
2017 | ||||||||||||||||||||||||||||||
2018 | ||||||||||||||||||||||||||||||
2019 | ||||||||||||||||||||||||||||||
Total | $ | |||||||||||||||||||||||||||||
All outstanding liabilities for unpaid losses and loss settlement expenses before 2010, net of reinsurance | ||||||||||||||||||||||||||||||
Liabilities for unpaid losses and loss settlement expenses, net of reinsurance | $ | |||||||||||||||||||||||||||||
107
Line of business: Personal | ||||||||||||||||||||||||||||||||||||||
Incurred losses and allocated loss settlement expenses, net of reinsurance | As of December 31, 2019 | |||||||||||||||||||||||||||||||||||||
For the years ended December 31, | Total of incurred but not reported liabilities plus expected development on reported claims | Cumulative development | Cumulative number of reported claims | |||||||||||||||||||||||||||||||||||
Accident Year | 2010 | 2011 | 2012 | 2013 | 2014 | 2015 | 2016 | 2017 | 2018 | 2019 | ||||||||||||||||||||||||||||
(Unaudited) | ||||||||||||||||||||||||||||||||||||||
2010 | $ | $ | $ | $ | $ | $ | $ | $ | $ | $ | $ | ( | ) | |||||||||||||||||||||||||
2011 | ( | ) | ||||||||||||||||||||||||||||||||||||
2012 | ( | ) | ||||||||||||||||||||||||||||||||||||
2013 | ( | ) | ||||||||||||||||||||||||||||||||||||
2014 | ( | ) | ||||||||||||||||||||||||||||||||||||
2015 | ( | ) | ||||||||||||||||||||||||||||||||||||
2016 | ( | ) | ||||||||||||||||||||||||||||||||||||
2017 | ( | ) | ||||||||||||||||||||||||||||||||||||
2018 | ||||||||||||||||||||||||||||||||||||||
2019 | ||||||||||||||||||||||||||||||||||||||
Total | $ | |||||||||||||||||||||||||||||||||||||
108
Line of business: Personal | ||||||||||||||||||||||||||||||
Cumulative paid losses and allocated loss settlement expenses, net of reinsurance | ||||||||||||||||||||||||||||||
For the years ended December 31, | ||||||||||||||||||||||||||||||
Accident Year | 2010 | 2011 | 2012 | 2013 | 2014 | 2015 | 2016 | 2017 | 2018 | 2019 | ||||||||||||||||||||
(Unaudited) | ||||||||||||||||||||||||||||||
2010 | $ | $ | $ | $ | $ | $ | $ | $ | $ | $ | ||||||||||||||||||||
2011 | ||||||||||||||||||||||||||||||
2012 | ||||||||||||||||||||||||||||||
2013 | ||||||||||||||||||||||||||||||
2014 | ||||||||||||||||||||||||||||||
2015 | ||||||||||||||||||||||||||||||
2016 | ||||||||||||||||||||||||||||||
2017 | ||||||||||||||||||||||||||||||
2018 | ||||||||||||||||||||||||||||||
2019 | ||||||||||||||||||||||||||||||
Total | $ | |||||||||||||||||||||||||||||
All outstanding liabilities for unpaid losses and loss settlement expenses before 2010, net of reinsurance | ||||||||||||||||||||||||||||||
Liabilities for unpaid losses and loss settlement expenses, net of reinsurance | $ | |||||||||||||||||||||||||||||
109
The reconciliation of the net incurred and loss development tables to the liability for unpaid losses and loss settlement expenses in the consolidated statement of financial position is as follows.
December 31, 2019 | ||||
Net outstanding liabilities for unpaid losses and allocated loss settlement expenses: | ||||
Commercial other liability | $ | |||
Commercial fire and allied | ||||
Commercial automobile | ||||
Commercial workers' compensation | ||||
Personal | ||||
All other lines | ||||
Net outstanding liabilities for unpaid losses and allocated loss settlement expenses | ||||
Net outstanding liabilities for unpaid unallocated loss settlement expenses | ||||
Fair value adjustment (purchase accounting adjustment for Mercer acquisition) | ||||
Liabilities for unpaid losses and loss settlement expenses, net of reinsurance | ||||
Reinsurance recoverable on unpaid losses and allocated loss settlement expenses: | ||||
Commercial other liability | ||||
Commercial fire and allied | ||||
Commercial automobile | ||||
Commercial workers' compensation | ||||
Personal | ||||
All other lines | ||||
Reinsurance recoverable on unpaid losses and allocated loss settlement expenses | ||||
Reinsurance fair value amortization (purchase accounting adjustment for Mercer acquisition) | ( | ) | ||
Total reinsurance recoverable on unpaid losses and loss settlement expenses | ||||
Total gross liability for unpaid losses and loss settlement expenses | $ | |||
110
The following is supplementary information about average historical claims duration as of December 31, 2019.
Average annual percentage payout of incurred claims by age, net of reinsurance | ||||||||||||||||||||
Year 1 | Year 2 | Year 3 | Year 4 | Year 5 | Year 6 | Year 7 | Year 8 | Year 9 | Year 10 | |||||||||||
(Unaudited) | ||||||||||||||||||||
Commercial other liability | % | % | % | % | % | % | % | % | % | % | ||||||||||
Commercial fire and allied | % | % | % | % | % | % | % | % | % | % | ||||||||||
Commercial automobile | % | % | % | % | % | % | % | % | % | % | ||||||||||
Commercial workers' compensation | % | % | % | % | % | % | % | % | % | % | ||||||||||
Personal | % | % | % | % | % | % | % | % | % | % | ||||||||||
111
NOTE 6. STATUTORY REPORTING, CAPITAL REQUIREMENTS AND DIVIDENDS AND RETAINED EARNINGS RESTRICTIONS
Statutory capital and surplus in regards to policyholders at December 31, 2019, 2018 and 2017 and statutory net income (loss) for the years then ended are as follows:
Statutory Capital and Surplus | Statutory Net Income (Loss) | ||||||
2019 | |||||||
Property and casualty business | $ | $ | ( | ) | |||
2018 | |||||||
Property and casualty business | $ | $ | |||||
Life, accident and health business(1) | |||||||
2017 | |||||||
Property and casualty business | $ | $ | |||||
Life, accident and health business | |||||||
(1) | The 2018 Life, accident and health business only includes results prior to the closing of the sale of United Life Insurance Company, which closed on March 30, 2018. Prior to the closing of the sale, United Fire & Casualty Company owned United Life Insurance Company, accordingly, the property and casualty statutory capital and surplus includes life, accident and health statutory capital and surplus, and therefore represents our total consolidated statutory capital and surplus. |
State insurance holding company laws and regulations generally require approval from the insurer's domicile state insurance Commissioner for any material transaction or extraordinary dividend. For property and casualty insurers, a material transaction is defined as any sale, loan, exchange, transfer or guarantee with an affiliate where the aggregate value of the transaction exceeds 25 percent of the insurer's policyholders' surplus or three percent of its admitted assets (measured at December 31 of the preceding year), whichever is less. For life insurers, a material transaction with an affiliate is defined as a transaction with an aggregate value exceeding three percent of the life insurer's admitted assets (measured at December 31 of the preceding year).
State laws and regulations generally limit the amount of funds that an insurance company may distribute to a parent as a dividend without Commissioner approval. As a holding company with no independent operations of its own, United Fire Group, Inc. relies on dividends received from its insurance company subsidiaries in order to pay dividends to its common shareholders. Dividends payable by our insurance subsidiaries are governed by the laws in the states in which they are domiciled. In all cases, these state laws permit the payment of dividends only from earned surplus arising from business operations. For example, under Iowa law, the maximum dividend or distribution that may be paid within a 12-month period without prior approval of the Iowa Insurance Commissioner is generally restricted to the greater of 10 percent of statutory surplus as of the preceding December 31, or net income of the preceding calendar year on a statutory basis, not greater than earned statutory surplus. Other states in which our insurance company subsidiaries are domiciled may impose similar restrictions on dividends and distributions. Based on these restrictions, at December 31, 2019, our insurance company subsidiary, United Fire & Casualty, is able to make a minimum of $154.2 million in dividend payments without prior regulatory approval. At December 31, 2019, we were in compliance with applicable state laws and regulations.
We paid dividends to our common shareholders of $32,662 , $105,408 and $27,337 in 2019, 2018 and 2017, respectively. Payments of any future dividends and the amounts of such dividends, however, will depend upon factors such as net income, financial condition, capital requirements, and general business conditions. We will only pay dividends if declared by our Board of Directors, out of funds legally available, and subject to any other restrictions that may be applicable to us.
In 2019, 2018 and 2017, United Fire & Casualty Company received dividends from its wholly owned subsidiaries of $6,300 , $8,500 and $13,300 , respectively. In 2019, 2018 and 2017, United Fire & Casualty Company paid dividends to United Fire Group, Inc. totaling $57,000 , $105,000 and $40,000 , respectively. These intercompany dividend payments are eliminated for reporting in our Consolidated Financial Statements.
112
Our property and casualty subsidiaries are required to prepare and file statutory-basis financial statements in conformity with the National Association of Insurance Commissioners ("NAIC") Accounting Practices and Procedures Manual, subject to any deviations prescribed or permitted by the applicable insurance commissioner and/or director. The accounting principles used to prepare these statutory-basis financial statements follow prescribed or permitted accounting practices that differ from GAAP. Prescribed statutory accounting principles include state laws, regulations and general administrative rules issued by the state of domicile, as well as a variety of publications and manuals of the NAIC. Permitted accounting practices encompass all accounting practices not prescribed, but allowed by the state of domicile. No material permitted accounting practices were used to prepare our statutory-basis financial statements during 2019, 2018 and 2017. Statutory accounting principles primarily differ from GAAP in that policy acquisition and certain sales inducement costs are charged to expense as incurred, goodwill is amortized, life insurance reserves are established based on different actuarial assumptions and the values reported for investments, pension obligations and deferred taxes are established on a different basis.
We are directed by the state insurance departments' solvency regulations to calculate a required minimum level of statutory capital and surplus based on insurance risk factors. The risk-based capital results are used by the NAIC and state insurance departments to identify companies that merit regulatory attention or the initiation of regulatory action. United Fire & Casualty Company and its property and casualty insurance subsidiaries and affiliates had statutory capital and surplus in regards to policyholders well in excess of their required levels at December 31, 2019.
NOTE 7. FEDERAL INCOME TAX
The Tax Act was enacted on December 22, 2017. The Tax Act significantly revised the U.S. corporate income tax laws including lowering the U.S. federal corporate tax rate from 35 percent to 21 percent, effective January 1, 2018.
In December 2017, the SEC staff issued Staff Accounting Bulletin No. 118, which addresses how a company recognizes provisional amounts when a company does not have the necessary information available, prepared or analyzed in reasonable detail to complete its accounting for the effect of the changes in the Tax Act. The measurement period ends when a company has obtained, prepared and analyzed the information necessary to finalize its accounting, but cannot extend beyond one year. As of December 31, 2018 we have completed accounting for the tax effects of enactment of the Tax Act and no adjustments were made during the measurement period.
Federal income tax expense (benefit) from both continuing and discontinued operations is composed of the following:
Years Ended December 31, | 2019 | 2018 | 2017 | ||||||||
Current | $ | ( | ) | $ | $ | ||||||
Deferred | ( | ) | ( | ) | |||||||
Total | $ | $ | ( | ) | $ | ( | ) | ||||
113
A reconciliation of income tax expense (benefit) computed at the applicable federal tax rate of 21.0 percent in 2019 and 2018 and 35.0 percent in 2017 to the amount recorded in the accompanying Consolidated Statements of Income and Comprehensive Income is as follows:
Years Ended December 31, | 2019 | 2018 | 2017 | ||||||||
Computed expected income tax expense | $ | $ | $ | ||||||||
Impact of enactment of Tax Act | ( | ) | |||||||||
Tax-exempt municipal bond interest income | ( | ) | ( | ) | ( | ) | |||||
Nontaxable dividend income | ( | ) | ( | ) | ( | ) | |||||
Valuation allowance reduction | ( | ) | ( | ) | |||||||
Compensation | ( | ) | ( | ) | |||||||
Reinsurance | |||||||||||
Other, net | ( | ) | ( | ) | |||||||
Consolidated federal income tax expense (benefit) | $ | $ | ( | ) | $ | ( | ) | ||||
Reconciliation of consolidated federal income tax expense (benefit) from: | |||||||||||
Continuing operations | $ | $ | ( | ) | $ | ( | ) | ||||
Gain on sale of discontinued operations | |||||||||||
Discontinued operations | |||||||||||
Consolidated federal income tax expense (benefit) | $ | $ | ( | ) | $ | ( | ) | ||||
114
We measure certain deferred tax assets and liabilities based on the rates at which they are expected to reverse in the future, which is 21.0 percent. The significant components of our net deferred tax liability at December 31, 2019 and 2018 are as follows:
December 31, | 2019 | 2018 | |||||
Deferred tax liabilities | |||||||
Net unrealized appreciation on investment securities: | |||||||
Equity securities | $ | $ | |||||
All other securities | ( | ) | |||||
Deferred policy acquisition costs | |||||||
Investments in partnerships | |||||||
Prepaid pension cost | |||||||
Net bond discount accretion | |||||||
Depreciation | |||||||
Revaluation of investment basis (1) | |||||||
Identifiable intangible assets (1) | |||||||
Other | |||||||
Gross deferred tax liability | $ | $ | |||||
Deferred tax assets | |||||||
Financial statement reserves in excess of income tax reserves | $ | $ | |||||
Unearned premium adjustment | |||||||
Net operating loss carryforwards | |||||||
Underfunded benefit plan obligation | |||||||
Post-retirement benefits other than pensions | |||||||
Other-than-temporary impairment of investments | |||||||
Contingent ceding commission accrual | |||||||
Compensation expense related to stock options | |||||||
Other | |||||||
Deferred tax asset | $ | $ | |||||
Net deferred tax liability (asset) | $ | $ | ( | ) | |||
(1) Related to our acquisition of Mercer Insurance Group, Inc.
NOTE 8. EMPLOYEE BENEFITS
We offer various benefits to our employees including a noncontributory defined benefit pension plan, an employee/retiree health and dental benefit plan, a profit-sharing plan and an employee stock ownership plan.
Pension and Post-retirement Benefit Plans
We offer a noncontributory defined benefit pension plan in which all of our employees are eligible to participate after they have completed one year of service, attained 21 years of age and have met the hourly service requirements. Retirement benefits under our pension plan are based on the number of years of service and level of compensation. Our policy to fund the pension plan on a current basis to not less than the minimum amounts required by the Employee Retirement Income Security Act of 1974, as amended, and the Internal Revenue Code of 1986, as amended, is to assure that plan assets will be adequate to provide retirement benefits. We estimate that we will contribute approximately $10,000 to the pension plan in 2020.
We also offer a health and dental benefit plan to all of our eligible employees and retirees that consists of two programs: (1) the self-funded employee health and dental benefit plan and (2) the self-funded (pre-65) and fully-funded (post-65) retiree health and dental benefit plan (the "post-retirement benefit plan"). Effective January 1, 2017, there was a plan amendment, which included the following changes: eliminated the pre-65 retirement plan with a $500 hundred dollar deductible; for retirements after January 1, 2017, the retiree will pay 50 percent of the
115
lower cost supplemental plan if they are 65 or older and 100 percent of the premium if less than 65; and removed spousal coverage after the death of the participant. The financial impact of the changes were reflected in accumulated other comprehensive income at December 31, 2016. Effective January 1, 2019, there was a plan amendment, which requires spouses to pay 100 percent of the medical, dental & vision premiums and the subsidy for the post-65 retirees is based off the lowest cost Medicare Supplement Plan (Plan 1). The financial impact of the changes were reflected in accumulated other comprehensive income at December 31, 2019.
The post-retirement benefit plan provides health and dental benefits to our retirees (and covered dependents) who have met the service and participation requirements stipulated by the post-retirement benefit plan. The third party administrators for the post-retirement benefit plan are responsible for making medical and dental care benefit payments. Participants are required to submit claims for reimbursement or payment to the claims administrator within twelve months after the end of the calendar year in which the charges were incurred. An unfunded benefit obligation is reported for the post-retirement benefit plan in the accompanying Consolidated Balance Sheets.
Investment Policies and Strategies
Our investment policy and objective for the pension plan is to generate long-term capital growth and income by way of a diversified investment portfolio along with appropriate employer contributions, which will allow us to provide for the pension plan's benefit obligation.
The investments held by the pension plan at December 31, 2019 include the following asset categories:
• | Fixed income securities, which may include bonds, and convertible securities; |
• | Equity securities, which may include various types of stock, such as large-cap, mid-cap, small-cap, and international stocks; |
• | Pooled separate accounts, which includes two separate funds, a core plus bond separate account and a real estate separate account; |
• | An arbitrage fund, which is a fund that takes advantage of price discrepancies, primarily equity securities, for the same asset in different markets; |
• | A group annuity contract that is administered by United Life, a former subsidiary of United Fire; and |
• | Cash and cash equivalents, which include money market funds. |
We have an internal investment/retirement committee, which includes our Chief Executive Officer, Chief Investment Officer, and Chief Operating Officer, all of whom receive monthly information on the value of the pension plan assets and their performance. Quarterly, the committee meets to review and discuss the performance of the pension plan assets as well as the allocation of investments within the pension plan.
As of December 31, 2019, we had six external investment managers that are allowed to exercise investment discretion, subject to limitations, if any, established by the investment/retirement committee. We utilize multiple investment managers in order to maximize the pension plan's investment return while mitigating risk. None of our investment managers uses leverage in managing the pension plan. Annually, the investment/retirement committee meets with each investment manager to review the investment manager's goals, objectives and the performance of the assets they manage. The decision to establish or terminate a relationship with an investment manager is at the discretion of our investment/retirement committee.
We consider historical experience for comparable investments and the target allocations we have established for the various asset categories of the pension plan to determine the expected long-term rate of return, which is an assumption as to the average rate of earnings expected on the pension plan funds invested, or to be invested, by the pension plan, to provide for the settlement of benefits included in the projected pension benefit obligation. Investment securities, in general, are exposed to various risks, such as fluctuating interest rates, credit standing of
116
the issuer of the security and overall market volatility. Annually, we perform an analysis of expected long-term rates of return based on the composition and allocation of our pension plan assets and recent economic conditions.
The following is a summary of the pension plan's actual and target asset allocations at December 31, 2019 and 2018 by asset category:
Target | |||||||||||||||||||
Pension Plan Assets | 2019 | % of Total | 2018 | % of Total | Allocation | ||||||||||||||
Fixed maturity securities - corporate bonds | $ | % | $ | % | % | - | % | ||||||||||||
Redeemable preferred stock | % | - | % | ||||||||||||||||
Equity securities | % | - | % | ||||||||||||||||
Pooled separate accounts | |||||||||||||||||||
Core plus bond separate account fund | % | - | % | ||||||||||||||||
U.S. property separate account fund | % | - | % | ||||||||||||||||
Arbitrage fund | % | - | % | ||||||||||||||||
United Life annuity | % | - | % | ||||||||||||||||
Cash and cash equivalents | % | - | % | ||||||||||||||||
Total plan assets | $ | % | $ | % | |||||||||||||||
The availability of assets held in cash and cash equivalents enables the pension plan to mitigate market risk that is associated with other types of investments and allows the pension plan to maintain liquidity both for the purpose of making future benefit payments to participants and their beneficiaries and for future investment opportunities.
Valuation of Investments
Fixed Maturity and Equity Securities
Investments in equity securities are stated at fair value based upon quoted market prices reported on recognized securities exchanges on the last business day of the year. Purchases and sales of securities are recorded as of the trade date.
The fair value of fixed maturity securities categorized as Level 2 is determined by management based on fair value
information reported in the custodial statements received from Plan’s investment managers, which is derived from
recent trading activity of the underlying security in the financial markets. These securities represent various taxable bonds held by the pension plan. These securities categorized as Level 2 are valued in the same manner as described in Part II, Item 8, Note 3 "Fair Value of Financial Instruments" and have the same controls in place.
Pooled Separate Accounts
The pension plan invests in two pooled separate account funds, a core plus bond separate account fund and a U.S. property separate account fund. Investments in the core plus bond separate account fund are stated at fair value as provided by the administrator of the fund based on the fair value of the underlying assets owned by the fund. The fair value measurement is classified within Level 2 of the fair value hierarchy. The fair value of the investments in the U.S. property separate account fund is provided by the administrator of the fund based on the net asset value of the fund. The net asset value is based on the fair value of the underlying properties included in the fund. The fair value of the underlying properties are based on property appraisals conducted by an independent third party. The fair value measurement is classified within Level 3 of the fair value hierarchy. We have not adjusted the net asset value provided by the custodian for either fund.
117
Arbitrage Fund
The fair value of the arbitrage fund is determined based on its net asset value, which is obtained from the custodian and determined monthly with issuances and redemptions of units of the fund made, based on the net asset value per unit as determined on the valuation date. We have not adjusted the net asset value provided by the custodian.
United Life Annuity
The United Life group annuity contract, which is a deposit administration contract, is stated at contract value as determined by United Life. Under the group annuity contract, the plan's investment account is credited with compound interest on the average account balance for the year. The interest rate is equivalent to the ratio of net investment income to mean assets of United Life, net of investment expenses.
Cash and Cash Equivalents
Cash and cash equivalents primarily consist of insured cash and money market funds held with various financial institutions. Interest is earned on a daily basis. The fair value of these funds approximates their cost basis due to their short-term nature.
Fair Value Measurement
The following tables present the categorization of the pension plan's assets measured at fair value on a recurring basis at December 31, 2019 and 2018:
Fair Value Measurements | |||||||||||||||
Description | December 31, 2019 | Level 1 | Level 2 | Level 3 | |||||||||||
Fixed maturity securities - corporate bonds | $ | $ | $ | $ | |||||||||||
Redeemable preferred stock | |||||||||||||||
Equity securities | |||||||||||||||
Pooled separate accounts | |||||||||||||||
Core plus bond separate account fund | |||||||||||||||
U.S. property separate account fund | |||||||||||||||
Arbitrage fund | |||||||||||||||
Money market funds | |||||||||||||||
Total assets measured at fair value | $ | $ | $ | $ | |||||||||||
Fair Value Measurements | |||||||||||||||
Description | December 31, 2018 | Level 1 | Level 2 | Level 3 | |||||||||||
Fixed maturity securities - corporate bonds | $ | $ | $ | $ | |||||||||||
Redeemable preferred stock | |||||||||||||||
Equity securities | |||||||||||||||
Pooled separate accounts | |||||||||||||||
Core plus bond separate account fund | |||||||||||||||
U.S. property separate account fund | |||||||||||||||
Arbitrage fund | |||||||||||||||
Money market funds | |||||||||||||||
Total assets measured at fair value | $ | $ | $ | $ | |||||||||||
There were no transfers of assets in or out of Level 1 or Level 2 during the period.
118
The fair value of investments categorized as Level 1 is based on quoted market prices that are readily and regularly available.
The fair value of fixed maturity securities categorized as Level 2 is determined by management based on fair value information reported in the custodial statements, which is derived from recent trading activity of the underlying security in the financial markets. These securities represent various taxable bonds held by the pension plan. These securities categorized as Level 2 are valued in the same manner as described in Part II, Item 8, Note 3 "Fair Value of Financial Instruments" and have the same controls in place.
The fair value of the arbitrage fund and bond and mortgage pooled separate account fund are categorized as Level 2 since there are no restrictions as to the pension plan's ability to redeem its investment at the net asset value of the fund as of the reporting date.
The following tables provide a summary of the changes in fair value of the pension plan's Level 3 securities:
U.S. property separate account fund | |||
Balance at January 1, 2019 | $ | ||
Unrealized gains | |||
Company Contributions | |||
Balance at December 31, 2019 | $ | ||
U.S. property separate account fund | |||
Balance at January 1, 2018 | $ | ||
Unrealized gains | |||
Company Contributions | |||
Balance at December 31, 2018 | $ | ||
Estimates and Assumptions
The preparation of financial statements in conformity with GAAP requires us to make various estimates and assumptions that affect the reporting of net periodic benefit cost, plan assets and plan obligations for each plan at the date of the financial statements. Actual results could differ from these estimates. One significant estimate relates to the calculation of the benefit obligation for each plan. We annually establish the discount rate, which is an estimate of the interest rate at which these benefits could be effectively settled, that is used to determine the present value of the respective plan's benefit obligations as of December 31. In estimating the discount rate, we look to rates of return on high-quality, fixed-income investments currently available and expected to be available during the period to maturity of the respective plan's benefit obligations.
In October 2014, the Society of Actuaries finalized a new mortality table and a new mortality improvement scale. The mortality improvement scale was further refined by the Society of Actuaries in 2015, 2016 and 2017. In October 2018, the mortality assumption has been updated to reflect the annual historical U.S. mortality data to 2016 published by the Society of Actuaries. These updated tables reflect improved life expectancies and an expectation that the trend will continue. We have reviewed these updated tables and have updated the mortality assumptions based on this information and also based on research provided by our external actuaries. We will continue to monitor mortality assumptions and make changes as appropriate to reflect additional research and our resulting best estimate of future mortality rates.
119
Assumptions Used to Determine Benefit Obligations
The following actuarial assumptions were used to determine the reported plan benefit obligations at December 31:
Weighted-average assumptions as of | Pension Benefits | Post-retirement Benefits | |||||||||
December 31, | 2019 | 2018 | 2019 | 2018 | |||||||
Discount rate | % | % | % | % | |||||||
Rate of compensation increase | N/A | N/A | |||||||||
Declining interest rates resulted in a decrease in the discount rates we use to value our respective plan's benefit obligations at December 31, 2019 compared to December 31, 2018.
Assumptions Used to Determine Net Periodic Benefit Cost
The following actuarial assumptions were used at January 1 to determine our reported net periodic benefit costs for the year ended December 31:
Weighted-average assumptions as of | Pension Benefits | Post-retirement Benefits | |||||||||||||||
January 1, | 2019 | 2018 | 2017 | 2019 | 2018 | 2017 | |||||||||||
Discount rate | % | % | % | % | % | % | |||||||||||
Expected long-term rate of return on plan assets | N/A | N/A | N/A | ||||||||||||||
Rate of compensation increase | N/A | N/A | N/A | ||||||||||||||
Assumed Health Care Cost Trend Rates
Health Care Benefits | Dental Claims | ||||||||||
Years Ended December 31, | 2019 | 2018 | 2019 | 2018 | |||||||
Health care cost trend rates assumed for next year | % | % | % | % | |||||||
Rate to which the health care trend rate is assumed to decline (ultimate trend rate) | % | % | N/A | N/A | |||||||
Year that the rate reaches the ultimate trend rate | 2030 | 2029 | N/A | N/A | |||||||
Assumed health care cost trend rates have a significant effect on the amounts reported for the post-retirement benefit plan. A 1.0 percent change in assumed health care cost trend rates would have the following effects:
1% Increase | 1% Decrease | |||||||
Effect on the net periodic post-retirement health care benefit cost | $ | $ | ( | ) | ||||
Effect on the accumulated post-retirement benefit obligation | ( | ) | ||||||
120
Benefit Obligation and Funded Status
The following table provides a reconciliation of benefit obligations, plan assets and funded status of our plans:
Pension Benefits | Post-retirement Benefits | ||||||||||||||
Years Ended December 31, | 2019 | 2018 | 2019 | 2018 | |||||||||||
Reconciliation of benefit obligation | |||||||||||||||
Benefit obligation at beginning of year | $ | $ | $ | $ | |||||||||||
Service cost | |||||||||||||||
Interest cost | |||||||||||||||
Actuarial loss (gain) | ( | ) | ( | ) | ( | ) | |||||||||
Adjustment for plan amendment | ( | ) | |||||||||||||
Benefit payments | ( | ) | ( | ) | ( | ) | ( | ) | |||||||
Benefit obligation at end of year (1) | $ | $ | $ | $ | |||||||||||
Reconciliation of fair value of plan assets | |||||||||||||||
Fair value of plan assets at beginning of year | $ | $ | $ | $ | |||||||||||
Actual return on plan assets | ( | ) | |||||||||||||
Employer contributions | |||||||||||||||
Benefit payments | ( | ) | ( | ) | ( | ) | ( | ) | |||||||
Fair value of plan assets at end of year | $ | $ | $ | $ | |||||||||||
Funded status at end of year | $ | ( | ) | $ | ( | ) | $ | ( | ) | $ | ( | ) | |||
(1) | For the pension plan, the benefit obligation is the projected benefit obligation. For the post-retirement benefit plan, the benefit obligation is the accumulated post-retirement benefit obligation. |
Our accumulated pension benefit obligation was $226,196 and $183,317 at December 31, 2019 and 2018, respectively.
The following table displays the effect that the unrecognized prior service cost and unrecognized actuarial loss of our plans had on accumulated other comprehensive income ("AOCI"), as reported in the accompanying Consolidated Balance Sheets:
Pension Benefits | Post-retirement Benefits | |||||||||||||||
Years Ended December 31 | 2019 | 2018 | 2019 | 2018 | ||||||||||||
Amounts recognized in AOCI | ||||||||||||||||
Unrecognized prior service cost | $ | $ | $ | ( | ) | $ | ( | ) | ||||||||
Unrecognized actuarial (gain) loss | ||||||||||||||||
Total amounts recognized in AOCI | $ | $ | $ | ( | ) | $ | ( | ) | ||||||||
We anticipate amortization of the net actuarial losses for our pension plan in 2020 to be $3,914 . We anticipate amortization of the net actuarial losses for our post-retirement benefit plan in 2020 to be $375
121
Net Periodic Benefit Cost
The components of the net periodic benefit cost for our pension and post-retirement benefit plans are as follows:
Pension Plan | Post-retirement Benefit Plan | ||||||||||||||||||||||
Years Ended December 31, | 2019 | 2018 | 2017 | 2019 | 2018 | 2017 | |||||||||||||||||
Net periodic benefit cost | |||||||||||||||||||||||
Service cost | $ | $ | $ | $ | $ | $ | |||||||||||||||||
Interest cost | |||||||||||||||||||||||
Expected return on plan assets | ( | ) | ( | ) | ( | ) | |||||||||||||||||
Amortization of prior service cost | ( | ) | ( | ) | ( | ) | |||||||||||||||||
Amortization of net loss | |||||||||||||||||||||||
Net periodic benefit cost | $ | $ | $ | $ | ( | ) | $ | $ | |||||||||||||||
A portion of the service cost component of net periodic pension and postretirement benefit costs are capitalized and amortized as part of deferred acquisition costs and is included in the income statement line titled "amortization of deferred policy acquisition costs." The portion not related to the compensation and the other components of net periodic pension and postretirement benefit costs are included in the income statement line titled "other underwriting expenses."
Projected Benefit Payments
The following table summarizes the expected benefits to be paid from our plans over the next 10 years:
2020 | 2021 | 2022 | 2023 | 2024 | 2025 - 2029 | |||||||||||||||||||
Pension benefits | $ | $ | $ | $ | $ | $ | ||||||||||||||||||
Post-retirement benefits | $ | $ | $ | $ | $ | $ | ||||||||||||||||||
Profit-Sharing Plan
We have a profit-sharing plan in which employees who meet service requirements are eligible to participate. The amount of our contribution is discretionary and is determined annually, but cannot exceed the amount deductible for federal income tax purposes. Our contribution to the profit-sharing plan for 2019, 2018 and 2017, was $4,096 , $7,607 , and $4,987 , respectively.
122
NOTE 9. STOCK-BASED COMPENSATION
Non-Qualified Employee Stock Award Plan
The United Fire Group, Inc. 2008 Stock Plan (the "2008 Stock Plan") authorized the issuance of restricted and unrestricted stock awards, stock appreciation rights, incentive stock options, and non-qualified stock options for up to 1,900,000 shares of United Fire common stock to employees. In May 2014, the Registrant's shareholders approved an additional 1,500,000 shares of United Fire common stock issuable at any time and from time to time pursuant to the 2008 Stock Plan, among other amendments, and renamed such plan as the United Fire Group, Inc. Stock Plan (as amended, the "Stock Plan"). At December 31, 2019, there were 834,910 authorized shares remaining available for future issuance. The Stock Plan is administered by the Board of Directors, which determines those employees who will receive awards, when awards will be granted, and the terms and conditions of the awards. The Board of Directors may also take any action it deems necessary and appropriate for the administration of the Stock Plan. Pursuant to the Stock Plan, the Board of Directors may, at its sole discretion, grant awards to our employees who are in positions of substantial responsibility with United Fire.
Options granted pursuant to the Stock Plan are granted to buy shares of United Fire's common stock at the market value of the stock on the date of grant. Options granted prior to March 2017 vest and are exercisable in installments of 20.0 percent of the number of shares covered by the option award each year from the grant date, unless the Board of Directors authorizes the acceleration of vesting. Options granted after March 2017 vest and are exercisable in installments of 33.3 percent of the number of shares covered by the option award each year from the grant date, unless the Board of Directors authorizes the acceleration of vesting. To the extent not exercised, vested option awards accumulate and are exercisable by the awardee, in whole or in part, in any subsequent year included in the option period, but not later than 10 years from the grant date. Restricted and unrestricted stock awards granted pursuant to the Stock Plan are granted at the market value of our common stock on the date of the grant. Restricted stock awards fully vest after 3 years or 5 years from the date of issuance, unless accelerated upon the approval of the Board of Directors, at which time United Fire common stock will be issued to the awardee. All awards are generally granted free of charge to the eligible employees of United Fire as designated by the Board of Directors.
The activity in the Stock Plan is displayed in the following table:
Authorized Shares Available for Future Award Grants | Year Ended December 31, 2019 | From Inception to December 31, 2019 | |||
Beginning balance | |||||
Additional shares authorized | |||||
Number of awards granted | ( | ) | ( | ) | |
Number of awards forfeited or expired | |||||
Ending balance | |||||
Number of option awards exercised | |||||
Number of unrestricted stock awards granted | |||||
Number of restricted stock awards vested | |||||
Non-Qualified Non-Employee Director Stock Option and Restricted Stock Plan
The United Fire Group, Inc. 2005 Non-Qualified Non-Employee Director Stock Option and Restricted Stock Plan (the "Director Plan") authorizes the issuance of restricted stock awards and non-qualified stock options to purchase shares of United Fire's common stock to non-employee directors. At December 31, 2019, we had 34,863 authorized shares available for future issuance.
The Board of Directors has the authority to determine which non-employee directors receive awards, when options and restricted stock shall be granted, the option price, the option expiration date, the date of grant, the vesting schedule of options or whether the options shall be immediately vested, the terms and conditions of options and restricted stock (other than those terms and conditions set forth in the plan) and the number of shares of common stock to be issued pursuant to an option agreement or restricted stock agreement (subject to limits set forth in the
123
plan). The Board of Directors may also take any action it deems necessary and appropriate for the administration of the Director Plan.
The activity in the Director Plan is displayed in the following table:
Authorized Shares Available for Future Award Grants | Year Ended December 31, 2019 | From Inception to December 31, 2019 | |||
Beginning balance | |||||
Number of awards granted | ( | ) | ( | ) | |
Number of awards forfeited or expired | |||||
Ending balance | |||||
Number of option awards exercised | |||||
Number of restricted stock awards vested | |||||
Stock-Based Compensation Expense
In 2019, 2018 and 2017, we recognized stock-based compensation expense of $6,152 , $5,249 and $4,808 , respectively. Stock-based compensation expense is recognized over the vesting period of the stock options.
As of December 31, 2019, we had $5,008 in stock-based compensation expense that has yet to be recognized through our results of operations. We expect this compensation to be recognized in subsequent years according to the following table, except with respect to awards that are accelerated by the Board of Directors, in which case we will recognize any remaining compensation expense in the period in which the awards are accelerated.
2020 | ||||
2021 | ||||
2022 | ||||
2023 | ||||
Total | $ | |||
Analysis of Award Activity
The analysis below details the option award activity for 2019 and the awards outstanding at December 31, 2019, for both of our plans and ad hoc options, which were granted prior to the adoption of the other plans:
Options | Shares | Weighted-Average Exercise Price | Weighted-Average Remaining Life (in years) | Aggregate Intrinsic Value | ||||||||
Outstanding at January 1, 2019 | $ | |||||||||||
Granted | ||||||||||||
Exercised | ( | ) | ||||||||||
Forfeited | ( | ) | ||||||||||
Expired | ( | ) | ||||||||||
Outstanding at December 31, 2019 | $ | $ | ||||||||||
Exercisable at December 31, 2019 | $ | $ | ||||||||||
Intrinsic value is the difference between our share price on the last day of trading (i.e., December 31, 2019) and the price of the options when granted and represents the value that would have been received by option holders had they exercised their options on that date. These values change based on the fair market value of our shares. The intrinsic value of options exercised totaled $2,055 , $5,850 and $3,159 in 2019, 2018 and 2017, respectively.
124
The analysis below details the award activity for the restricted stock and restricted stock unit awards outstanding at December 31, 2019:
Restricted stock awards | Shares | Weighted-Average Grant Date Fair Value | ||||
Non-vested at January 1, 2019 | $ | |||||
Granted | ||||||
Vested | ( | ) | ||||
Forfeited | ( | ) | ||||
Non-vested at December 31, 2019 | $ | |||||
In 2019, 2018 and 2017 we recognized $4,659 , $3,877 and $2,987 , respectively, in compensation expense related to the restricted stock and restricted stock unit awards. At December 31, 2019, we had $3,512 in compensation expense that has yet to be recognized through our results of operations related to the restricted stock and restricted stock unit awards. The intrinsic value of the non-vested restricted stock and restricted stock unit awards outstanding totaled $10,165 and $15,746 at December 31, 2019 and 2018, respectively.
Assumptions
The weighted-average grant-date fair value of the options granted under our plans has been estimated using the Black-Scholes option pricing model with the following weighted-average assumptions:
December 31, | 2019 | 2018 | 2017 | ||||||||
Risk-free interest rate | % | % | % | ||||||||
Expected volatility | % | % | % | ||||||||
Expected option life (in years) | |||||||||||
Expected dividends (in dollars) | $ | $ | $ | ||||||||
Weighted-average grant-date fair value of options granted during the year (in dollars) | $ | $ | $ | ||||||||
The following table summarizes information regarding the stock options outstanding and exercisable at December 31, 2019:
Options Outstanding | Options Exercisable | ||||||||||||||
Range of Exercise Prices | Number Outstanding (in shares) | Weighted-Average Remaining Contractual Life (in years) | Weighted-Average Exercise Price | Number Exercisable (in shares) | Weighted-Average Exercise Price | ||||||||||
$ | - | $ | $ | ||||||||||||
- | |||||||||||||||
- | |||||||||||||||
- | |||||||||||||||
- | |||||||||||||||
- | $ | ||||||||||||||
$ | - | $ | $ | ||||||||||||
125
NOTE 10. SEGMENT INFORMATION
On September 19, 2017, the Company announced that it had agreed to sell its subsidiary, United Life, to Kuvare. The sale closed on March 30, 2018. As a result, our life insurance business was considered held for sale and reported as discontinued operations in the Consolidated Financial Statements and all comparable prior periods have been presented to conform to the current year presentation. For more information, refer to Note 17 "Discontinued Operations."
Prior to the announcement to sell United Life, we had two reportable business segments in our operations: property and casualty insurance and life insurance. The property and casualty insurance business has six domestic locations from which it conducts its business. The life insurance business operated from our home office. Because all of our insurance is sold domestically, we have no revenues allocable to foreign operations.
After the announcement of the sale of United Life, our continuing operations, the property and casualty insurance business, is reported as one reportable segment. The property and casualty insurance business profit or loss is consistent with consolidated reporting as disclosed on the Consolidated Statements of Income and Comprehensive Income. We analyze the property and casualty insurance business results based on profitability (i.e., loss ratios), expenses and return on equity. The Company's property and casualty insurance business was determined using a management approach to make decisions on operating matters, including allocating resources, assessing performance, determining which products to market and sell, determining distribution networks with insurance agents and monitoring the regulatory environment. The property and casualty insurance business products have similar economic characteristics and use a similar marketing and distribution strategy with our independent agents. The property and casualty insurance business geographic concentration did not change after the announcement of the sale of the life insurance business. We will continue to evaluate our continuing operations on the basis of both statutory accounting principles prescribed or permitted by our states of domicile and GAAP.
The accounting policies of our businesses are the same as those described in Note 1 "Summary of Significant Accounting Policies" to our Consolidated Financial Statements. We analyze results based on profitability (i.e., loss ratios), expenses and return on equity.
Property and Casualty Insurance Business
We write both commercial and personal lines of property and casualty insurance. We focus on our commercial lines, which represented 93.3 percent of our property and casualty insurance premiums earned for 2019. Our personal lines represented 6.7 percent of our property and casualty insurance premiums earned for 2019.
Products
Our primary commercial policies are tailored business packages that include the following coverages: fire and allied lines, other liability, automobile, workers' compensation and surety. Our personal lines consist primarily of automobile and fire and allied lines coverage, including homeowners.
Pricing
Pricing levels for our property and casualty insurance products are influenced by many factors, including an estimation of expected losses, the expenses of producing, issuing and servicing business and managing claims, the time value of money associated with such loss and expense cash flows, and a reasonable allowance for profit. We have a disciplined approach to underwriting and risk management that emphasizes profitable growth rather than premium volume or market share. Our insurance company subsidiaries are subject to state laws and regulations regarding rate and policy form approvals. The applicable state laws and regulations establish standards in certain lines of business to ensure that rates are not excessive, inadequate, unfairly discriminatory, or used to engage in unfair price competition. Our ability to increase rates and the relative timing of the process are dependent upon each respective state's requirements, as well as the competitive market environment.
126
Seasonality
Our property and casualty insurance business experiences some seasonality with regard to premiums written, which are generally highest in January and July and lowest during the fourth quarter. Although we experience some seasonality in our premiums written, premiums are earned ratably over the period of coverage. Losses and loss settlement expenses incurred tend to remain consistent throughout the year, with the exception of catastrophe losses which generally are highest in the second and third quarters. Catastrophes inherently are unpredictable and can occur at any time during the year from man-made or natural disaster events that include, but are not limited to, hail, tornadoes, hurricanes and windstorms.
Premiums Earned
The following table sets forth our net premiums earned:
Years Ended December 31, | 2019 | 2018 | 2017 | ||||||||
Continuing Operations - Property and casualty insurance business | |||||||||||
Net premiums earned | |||||||||||
Other liability | $ | $ | $ | ||||||||
Fire and allied lines | |||||||||||
Automobile | |||||||||||
Workers' compensation | |||||||||||
Fidelity and surety | |||||||||||
Reinsurance assumed | |||||||||||
Other | |||||||||||
Total net premiums earned from continuing operations | $ | $ | $ | ||||||||
Discontinued Operations - Life insurance business | |||||||||||
Net premiums earned | |||||||||||
Ordinary life (excluding universal life) | $ | $ | $ | ||||||||
Universal life policy fees | |||||||||||
Immediate annuities with life contingencies | |||||||||||
Accident and health | |||||||||||
Other | |||||||||||
Total net premiums earned from discontinued operations | $ | $ | $ | ||||||||
127
NOTE 11. QUARTERLY SUPPLEMENTARY FINANCIAL INFORMATION (UNAUDITED)
The following table sets forth our selected unaudited quarterly financial information from continuing operations:
(In Thousands Except Share Data) | |||||||||||||||||||
Quarters | First | Second | Third | Fourth | Total | ||||||||||||||
Year Ended December 31, 2019 | |||||||||||||||||||
Total revenues | $ | $ | $ | $ | $ | ||||||||||||||
Income (loss) before income taxes | ( | ) | ( | ) | ( | ) | |||||||||||||
Net income (loss) | $ | $ | ( | ) | $ | ( | ) | $ | ( | ) | $ | ||||||||
Basic earnings (loss) per share (1) | $ | $ | ( | ) | $ | ( | ) | $ | ( | ) | $ | ||||||||
Diluted earnings (loss) per share (1) | ( | ) | ( | ) | ( | ) | |||||||||||||
Year Ended December 31, 2018 | |||||||||||||||||||
Total revenues | $ | $ | $ | $ | $ | ||||||||||||||
Income (loss) before income taxes | ( | ) | ( | ) | ( | ) | |||||||||||||
Net income (loss) | $ | $ | $ | $ | ( | ) | $ | ||||||||||||
Basic earnings (loss) per share (1) | $ | $ | $ | $ | ( | ) | $ | ||||||||||||
Diluted earnings (loss) per share (1) | ( | ) | |||||||||||||||||
(1) | The sum of the quarterly reported amounts may not equal the full year, as each is computed independently. |
The following table sets forth our selected unaudited quarterly financial information from discontinued operations:
(In Thousands Except Share Data) | |||||||||||||||||||
Quarters | First | Second | Third | Fourth | Total | ||||||||||||||
Year Ended December 31, 2019 | |||||||||||||||||||
Total revenues | $ | $ | $ | $ | $ | ||||||||||||||
Income (loss) before income taxes | |||||||||||||||||||
Net income (loss) | $ | $ | $ | $ | $ | ||||||||||||||
Basic earnings per share (1) | $ | $ | $ | $ | $ | ||||||||||||||
Diluted earnings per share (1) | |||||||||||||||||||
Year Ended December 31, 2018 | |||||||||||||||||||
Total revenues | $ | $ | $ | $ | $ | ||||||||||||||
Income (loss) before income taxes | ( | ) | ( | ) | |||||||||||||||
Net income (loss) | $ | ( | ) | $ | $ | $ | $ | ( | ) | ||||||||||
Basic earnings (loss) per share (1) | $ | ( | ) | $ | $ | $ | $ | ( | ) | ||||||||||
Diluted earnings (loss) per share (1) | ( | ) | ( | ) | |||||||||||||||
(1) | The sum of the quarterly reported amounts may not equal the full year, as each is computed independently. |
NOTE 12. EARNINGS PER COMMON SHARE
Basic earnings per share is computed by dividing net income by the weighted-average number of common shares outstanding during the reporting period. Diluted earnings per share gives effect to all dilutive common shares outstanding during the reporting period. The dilutive shares we consider in our diluted earnings per share calculation relate to our outstanding stock options and restricted stock awards.
We determine the dilutive effect of our outstanding stock options using the "treasury stock" method. Under this method, we assume the exercise of all of the outstanding stock options whose exercise price is less than the weighted-average market value of our common stock during the reporting period. This method also assumes that the proceeds from the hypothetical stock option exercises are used to repurchase shares of our common stock at the weighted-average market value of the stock during the reporting period. The net of the assumed stock options
128
exercised and assumed common shares repurchased represents the number of dilutive common shares, which we add to the denominator of the earnings per share calculation.
The components of basic and diluted earnings per share were as follows:
Years Ended December 31, | |||||||||||||||||||||||
2019 | 2018 | 2017 | |||||||||||||||||||||
(In Thousands Except Share and Per Share Data) | Basic | Diluted | Basic | Diluted | Basic | Diluted | |||||||||||||||||
Net income from continuing operations | $ | $ | $ | $ | $ | $ | |||||||||||||||||
Weighted-average common shares outstanding | |||||||||||||||||||||||
Add dilutive effect of restricted stock awards | — | — | — | ||||||||||||||||||||
Add dilutive effect of stock options | — | — | — | ||||||||||||||||||||
Weighted-average common shares | |||||||||||||||||||||||
Earnings per common share from continuing operations | $ | $ | $ | $ | $ | $ | |||||||||||||||||
Earnings (loss) per common share from discontinued operations | ( | ) | ( | ) | |||||||||||||||||||
Gain on sale of discontinued operations, net of taxes | $ | $ | $ | $ | $ | $ | |||||||||||||||||
Earnings per common share | $ | $ | $ | $ | $ | $ | |||||||||||||||||
Awards excluded from diluted calculation(1) | — | — | — | ||||||||||||||||||||
(1) | Outstanding awards that are not "in-the-money" are excluded from the diluted earnings per share calculation because the effect of including them would have been anti-dilutive. |
NOTE 13. LEASE COMMITMENTS
The Company determines if a contract contains a lease at inception of the contract by reviewing the facts and circumstances of the contract to determine if a lease is present. The Company has operating leases relating to office space, vehicles, computer equipment, and office equipment, which are recorded as a lease obligation liability disclosed in the "Accrued expenses and other liabilities" line on the Consolidated Balance Sheets and as a lease right-of-use asset disclosed in the "Other assets" line on the Consolidated Balance Sheets. The lease right-of-use asset represents the Company's right to use each underlying asset for the lease term and the lease obligation liability represents the Company's obligation over the lease term. As an accounting policy election, we have elected the practical expedient on not separating lease components from non-lease components to each major asset class.
The Company's lease obligation is recorded at the present value of the lease payments based on the term of the applied lease. The Company has elected to categorize its leases into four categories based on length of lease terms and applies an incremental borrowing rate of interest as of the effective date of adoption or the lease effective date equivalent to a collateralized rate with similar terms. The four categories are as follows: less than three years, three to five years, five to ten years and greater than ten years. The collateralized discount rate used to calculate the present value of future minimum lease payments is based, where appropriate, on the Company's incremental borrowing rate of its credit facility, described in Note 9 "Credit Facility". For leases that existed prior to the adoption of the new accounting guidance on January 1, 2019 or those with terms not similar to the credit facility, the Company has elected to use the remaining lease term based on the four categories noted above as of the date of initial application to measure its incremental borrowing rate. In this case, the incremental borrowing rate is a collateralized rate based on current industry borrowing rates for similar companies with similar ratings.
Lease terms and options vary in the Company's operating leases dependent upon the underlying leased asset. We exclude options to extend or terminate a lease from our recognition as part of our right-of-use assets and lease liabilities until those options are known and/or executed, as we typically do not exercise options to purchase the underlying leased asset. As of December 31, 2019, we have leases with remaining terms of 1 year to 6 years, some
129
of which may include no options for renewal and others with options to extend the lease terms from 6 months to 5 years.
The Company has also entered into a contract to lease office space for our East Coast Branch which will commence in the first half of 2020 after the lessor has substantially completed leasehold improvements. This lease has not been included in lease obligation liability or right-of-use assets as of December 31, 2019.
The components of our operating leases were as follows:
As of December 31, 2019 | ||||
Components of lease expense: | ||||
Operating lease expense | $ | |||
Less sublease income | ||||
Net lease expense | ||||
Cash flows information related to leases: | ||||
Operating cash outflow from operating leases | ||||
Balance sheet information for operating leases: | As of December 31, 2019 | |||
Operating lease right-of-use assets (Other assets on Consolidated Balance Sheets) | $ | |||
Operating lease liabilities (Accrued expenses and other liabilities on Consolidated Balance Sheets) | ||||
Right-of-use assets obtained in exchange for new operating lease liabilities | ||||
Weighted average remaining lease term | ||||
Weighted average discount rate | % | |||
Maturities of lease liabilities: | As of December 31, 2019 | |||
2020 | $ | |||
2021 | ||||
2022 | ||||
2023 | ||||
2024 | ||||
Thereafter | ||||
Total lease payments | ||||
Less imputed interest | ( | ) | ||
Lease liability | $ | |||
NOTE 14. CREDIT FACILITY
On February 2, 2016, the Company, as borrower, entered into a Credit Agreement (the "Credit Agreement") by and among the Company, with the lenders from time to time party thereto and KeyBank National Association ("Key Bank"), as administrative agent, swingline lender and letter of credit issuer. The Credit Agreement provides for a $50,000 four-year unsecured revolving credit facility that includes a $20,000 letter of credit subfacility and a
130
swingline subfacility in the amount up to $5,000 . The Credit Agreement allows the Company to increase the aggregate amount of the commitments thereunder by up to $100,000 , provided that no event of default has occurred and is continuing and certain other conditions are satisfied.
The Credit Agreement is available for the Company's general corporate purposes, including liquidity, acquisitions and working capital. All unpaid principal and accrued interest under the Credit Agreement is due and payable in full at maturity on February 2, 2020. Based on the type of loan, advances under the Credit Agreement would bear interest on either the London interbank offered rate ("LIBOR") or a base rate plus, in each case, a calculated margin amount.
The unused commitments under the Credit Agreement will be subject to a commitment fee that will be calculated at a per annum rate. The applicable margins for borrowings under the Credit Agreement and the commitment fee thereunder will be determined by reference to a pricing grid based on the Company’s issuer credit rating by A.M. Best Company, Inc.
The Credit Agreement contains customary representations, conditions to borrowing, covenants and events of default, including certain covenants that limit or restrict, subject to certain exceptions, the ability of the Company and its subsidiaries to sell or transfer assets, enter into a merger or consolidate with another company, create liens, impose restrictions on subsidiary dividends, enter into sale-leaseback transactions, make investments or acquisitions, enter into certain reinsurance agreements, pay dividends during any period of default, enter into transactions with affiliates, change the nature of its business, or incur indebtedness. The Credit Agreement also includes financial covenants that require the Company to (i) maintain a minimum consolidated net worth, (ii) maintain a minimum consolidated statutory surplus and (iii) not exceed a 0.35 to 1.0 debt to total capitalization ratio. As of December 31, 2019 we were in compliance with all covenants of the Credit Agreement.
There was no outstanding balance on the Credit Agreement at December 31, 2019 or 2018. We did no t incur any interest expense related to the Credit Agreement in 2019, 2018 or under our prior credit facility in 2017.
131
NOTE 15. INTANGIBLE ASSETS
The carrying value of our goodwill was $15,091 at both December 31, 2019 and 2018, respectively. The goodwill is fully allocated to our property and casualty insurance business.
Our major classes of intangible assets are presented in the following table:
Year Ended December 31, | |||||||
2019 | 2018 | ||||||
Agency relationships | $ | $ | |||||
Accumulated amortization - agency relationships | ( | ) | ( | ) | |||
$ | $ | ||||||
Software | $ | $ | |||||
Accumulated amortization - software | ( | ) | ( | ) | |||
$ | $ | ||||||
Trade names | $ | $ | |||||
Accumulated amortization - trade names | ( | ) | ( | ) | |||
$ | $ | ||||||
Favorable contract | $ | $ | |||||
Accumulated amortization - favorable contract | ( | ) | ( | ) | |||
$ | $ | ||||||
State insurance licenses (1) | $ | $ | |||||
Net intangible assets | $ | $ | |||||
(1) The intangible asset for licenses has an indefinite life and therefore is not amortized.
The estimated useful lives assigned to our major classes of amortizable intangible assets are as follows:
Useful Life | |
Agency relationships | |
Software | |
Trade names | |
Favorable contract | |
Our estimated aggregate amortization expense for each of the next five years is as follows:
2020 | $ | ||
2021 | |||
2022 | |||
2023 | |||
2024 | |||
132
NOTE 16. ACCUMULATED OTHER COMPREHENSIVE INCOME
The following table shows the changes in the components of our accumulated other comprehensive income (loss), net of tax, for the years ended December 31, 2019, 2018 and 2017:
Liability for | |||||||||||
Net unrealized | underfunded | ||||||||||
appreciation | employee | ||||||||||
on investments | benefit costs | Total | |||||||||
Balance as of January 1, 2017 | $ | $ | ( | ) | $ | ||||||
Change in accumulated other comprehensive income before reclassifications | ( | ) | |||||||||
Reclassification adjustments from accumulated other comprehensive income | ( | ) | ( | ) | |||||||
Accumulated effect of change in enacted tax rate | ( | ) | |||||||||
Balance as of December 31, 2017 | $ | $ | ( | ) | $ | ||||||
Cumulative effect of change in accounting principle | ( | ) | — | ( | ) | ||||||
Change in accumulated other comprehensive income before reclassifications | ( | ) | ( | ) | |||||||
Reclassification adjustments from accumulated other comprehensive income | |||||||||||
Balance as of December 31, 2018 | $ | ( | ) | $ | ( | ) | $ | ( | ) | ||
Change in accumulated other comprehensive income before reclassifications | ( | ) | |||||||||
Reclassification adjustments from accumulated other comprehensive income | |||||||||||
Balance as of December 31, 2019 | $ | $ | ( | ) | $ | ||||||
133
NOTE 17. DISCONTINUED OPERATIONS
On September 18, 2017, we signed a definitive agreement to sell our subsidiary, United Life Insurance Company, to Kuvare for $280,000 in cash, less a $21 adjustment as set forth in the definitive agreement, for a net amount of $279,979 . The sale closed on March 30, 2018 and we reported an after-tax gain on the sale of discontinued operations of $27,307 . The life insurance business (previously reported as a separate segment) was considered held for sale and reported as discontinued operations and its financial position, results of operations and cash flows were reported separately for all periods presented, as applicable, unless otherwise noted.
UFG has agreed to provide services to Kuvare through a transition services agreement ("TSA"). The TSA ensures a seamless transfer of the business between UFG and Kuvare. The TSA includes, among other considerations, accounting management, human resources, legal and information technology services, from the closing date for up to 24 months. Since the close date, the Company has received $885 as part of the TSA.
Summary operating results of discontinued operations were as follows for the periods indicated:
Discontinued Operations | |||||||||||
Statements of Income | |||||||||||
For the Years Ended December 31, | |||||||||||
(In Thousands, Except Share Data) | 2019 | 2018 | 2017 | ||||||||
Revenues | |||||||||||
Net premiums earned | $ | $ | $ | ||||||||
Investment income, net of investment expenses | |||||||||||
Total net realized investment gains (losses) | ( | ) | |||||||||
Other income | |||||||||||
Total revenues | $ | $ | $ | ||||||||
Benefits, Losses and Expenses | |||||||||||
Losses and loss settlement expenses | $ | $ | $ | ||||||||
Increase in liability for future policy benefits | |||||||||||
Amortization of deferred policy acquisition costs | |||||||||||
Other underwriting expenses | |||||||||||
Interest on policyholders’ accounts | |||||||||||
Total benefits, losses and expenses | $ | $ | $ | ||||||||
Income (loss) from discontinued operations before income taxes | $ | $ | ( | ) | $ | ||||||
Federal income tax expense | |||||||||||
Net income (loss) from discontinued operations | $ | $ | ( | ) | $ | ||||||
Earnings (loss) per common share from discontinued operations: | |||||||||||
Basic | $ | $ | ( | ) | $ | ||||||
Diluted | ( | ) | |||||||||
134
Report of Independent Registered Public Accounting Firm
Board of Directors and Shareholders
United Fire Group, Inc.
Opinion on the Financial Statements
We have audited the accompanying consolidated balance sheets of United Fire Group, Inc. (the Company) as of December 31, 2019 and 2018, and the related consolidated statements of income, comprehensive income, stockholders' equity and cash flows for each of the three years in the period ended December 31, 2019, and the related notes and financial statement schedules listed in the Index at Item 15(a)(2) (collectively referred to as the “financial statements”). In our opinion, the financial statements referred to above present fairly, in all material respects, the consolidated financial position of the Company at December 31, 2019 and 2018, and the consolidated results of its operations and its cash flows for each of the three years in the period ended December 31, 2019, in conformity with U.S. generally accepted accounting principles.
We also have audited, in accordance with the standards of the Public Company Accounting Oversight Board (United States) (PCAOB), the Company's internal control over financial reporting as of December 31, 2019, based on criteria established in Internal Control-Integrated Framework issued by the Committee of Sponsoring Organizations of the Treadway Commission (2013 framework), and our report dated February 28, 2020 expressed an unqualified opinion thereon.
Basis for Opinion
These financial statements are the responsibility of the Company's management. Our responsibility is to express an opinion on the Company’s financial statements based on our audits. We are a public accounting firm registered with the PCAOB and are required to be independent with respect to the Company in accordance with the U.S. federal securities laws and the applicable rules and regulations of the Securities and Exchange Commission and the PCAOB.
We conducted our audits in accordance with the standards of the PCAOB. Those standards require that we plan and perform the audit to obtain reasonable assurance about whether the financial statements are free of material misstatement, whether due to error or fraud. Our audits included performing procedures to assess the risks of material misstatement of the financial statements, whether due to error or fraud, and performing procedures that respond to those risks. Such procedures included examining, on a test basis, evidence regarding the amounts and disclosures in the financial statements. Our audits also included evaluating the accounting principles used and significant estimates made by management, as well as evaluating the overall presentation of the financial statements. We believe that our audits provide a reasonable basis for our opinion.
Critical Audit Matter
The critical audit matter communicated below is a matter arising from the current period audit of the financial statements that was communicated or required to be communicated to the audit committee and that: (1) relates to accounts or disclosures that are material to the financial statements and (2) involved our especially challenging, subjective, or complex judgments. The communication of the critical audit matter does not alter in any way our opinion on the consolidated financial statements, taken as a whole, and we are not, by communicating the critical audit matter below, providing a separate opinion on the critical audit matter or on the account or disclosure to which it relates.
135
Valuation of reserves for property and casualty loss and loss settlement expenses | ||
Description of the Matter | At December 31, 2019, the Company’s reserves for losses and loss settlement expenses was $1.4 billion, of which $230.9 million related to Incurred But Not Reported (IBNR) reserves. As described in Note 5 to the consolidated financial statements, liabilities for losses and loss settlement expenses reflect management's best estimates at a given point in time of what is expected to be paid for claims that have been reported and those that have been incurred but not reported, based on known facts, circumstances, and historical trends. There is significant uncertainty and subjectivity inherent in determining management’s best estimates of the ultimate cost of losses, which is used to determine IBNR reserves. Auditing management’s estimate of IBNR reserves was complex due to the highly judgmental nature of management’s selection of methods and assumptions used to develop those estimates. In particular, the estimates are sensitive to assumptions and the weighting of methodologies that are used to project the ultimate cost of losses. | |
How We Addressed the Matter in Our Audit | We obtained an understanding, evaluated the design and tested the operating effectiveness of controls over the reserving process, including, among others, the review and approval processes that management has in place for the methods and assumptions used in estimating the reserves and the reasonableness of the actuarially determined reserves. To test the estimated IBNR reserves we, including our actuarial specialists, performed audit procedures that included, among others, evaluating management’s selection and weighting of actuarial methods and assumptions by comparing to those used in prior periods and those used in the industry. We compared management’s best estimate of reserves to our independently calculated range of reasonable reserve estimates and assessed the development of prior year reserves. We also evaluated the results of the reserve analysis prepared by management’s independent third-party actuary for comparison to management’s best estimate. | |
/s/ Ernst & Young LLP | ||||
Ernst & Young LLP | ||||
We have served as the Company’s auditor since 2002.
Des Moines, Iowa
February 28, 2020
136
ITEM 9. CHANGES IN AND DISAGREEMENTS WITH ACCOUNTANTS ON ACCOUNTING AND FINANCIAL DISCLOSURE
None.
ITEM 9A. CONTROLS AND PROCEDURES
EVALUATION OF DISCLOSURE CONTROLS AND PROCEDURES
Our management, with the participation of our Chief Executive Officer and Chief Financial Officer, has evaluated the effectiveness of our disclosure controls and procedures (as such term is defined in Rules 13a-15(e) and 15d-15(e) under the Exchange Act) as of the end of the period covered by this report. Based on that evaluation, the Chief Executive Officer and Chief Financial Officer concluded that our disclosure controls and procedures, as of the end of the period covered by this report, were designed and functioning effectively to provide reasonable assurance that the information required to be disclosed by us in reports filed or submitted under the Exchange Act are recorded, processed, summarized and reported within the time periods specified in the SEC's rules and forms. We believe that a control system, no matter how well designed and operated, cannot provide absolute assurance that the objectives of the control system are met, and no evaluation of controls can provide absolute assurance that all control issues and instances of fraud, if any, within a company have been detected.
MANAGEMENT'S ANNUAL REPORT ON INTERNAL CONTROL OVER FINANCIAL REPORTING
The management of United Fire Group, Inc. is responsible for establishing and maintaining adequate internal control over financial reporting. United Fire Group, Inc.'s internal control over financial reporting is a process designed under the supervision of its Chief Executive Officer and Chief Financial Officer to provide reasonable assurance regarding the reliability of financial reporting and the preparation of its Consolidated Financial Statements for external purposes in accordance with U.S. generally accepted accounting principles.
As of December 31, 2019, United Fire Group, Inc.'s management assessed the effectiveness of United Fire Group Inc.'s internal control over financial reporting based on the criteria for effective internal control over financial reporting established in "Internal Control — Integrated Framework," issued by the Committee of Sponsoring Organizations of the Treadway Commission (2013 framework). Based on the assessment, United Fire Group, Inc.'s management determined that effective internal control over financial reporting was maintained as of December 31, 2019, based on those criteria.
Ernst & Young LLP, the independent registered public accounting firm that audited the Consolidated Financial Statements of United Fire Group, Inc. included in this Annual Report on Form 10-K, has audited the effectiveness of internal control over financial reporting as of December 31, 2019. Their attestation report, which expresses an unqualified opinion on the effectiveness of United Fire Group, Inc.'s internal control over financial reporting as of December 31, 2019, is included in this Item under the heading "Report of Independent Registered Public Accounting Firm."
137
Report of Independent Registered Public Accounting Firm
Board of Directors and Shareholders
United Fire Group, Inc.
Opinion on Internal Control over Financial Reporting
We have audited United Fire Group, Inc.’s (the Company) internal control over financial reporting as of December 31, 2019, based on criteria established in Internal Control-Integrated Framework issued by the Committee of Sponsoring Organizations of the Treadway Commission (2013 framework) (the COSO criteria). In our opinion, the Company maintained, in all material respects, effective internal control over financial reporting as of December 31, 2019, based on the COSO criteria.
We also have audited, in accordance with the standards of the Public Company Accounting Oversight Board (United States) (PCAOB), the consolidated balance sheets of United Fire Group, Inc. as of December 31, 2019 and 2018, and the related consolidated statements of income, comprehensive income, stockholders' equity and cash flows for each of the three years in the period ended December 31, 2019 of the Company and our report dated February 28, 2020 expressed an unqualified opinion thereon.
Basis for Opinion
The Company’s management is responsible for maintaining effective internal control over financial reporting and for its assessment of the effectiveness of internal control over financial reporting included in the accompanying Annual Report. Our responsibility is to express an opinion on the Company’s internal control over financial reporting based on our audit. We are a public accounting firm registered with the PCAOB and are required to be independent with respect to the Company in accordance with the U.S. federal securities laws and the applicable rules and regulations of the Securities and Exchange Commission and the PCAOB.
We conducted our audit in accordance with the standards of the PCAOB. Those standards require that we plan and perform the audit to obtain reasonable assurance about whether effective internal control over financial reporting was maintained in all material respects.
Our audit included obtaining an understanding of internal control over financial reporting, assessing the risk that a material weakness exists, testing and evaluating the design and operating effectiveness of internal control based on the assessed risk, and performing such other procedures as we considered necessary in the circumstances. We believe that our audit provides a reasonable basis for our opinion.
Definition and Limitations of Internal Control Over Financial Reporting
A company’s internal control over financial reporting is a process designed to provide reasonable assurance regarding the reliability of financial reporting and the preparation of financial statements for external purposes in accordance with generally accepted accounting principles. A company’s internal control over financial reporting includes those policies and procedures that (1) pertain to the maintenance of records that, in reasonable detail, accurately and fairly reflect the transactions and dispositions of the assets of the company; (2) provide reasonable assurance that transactions are recorded as necessary to permit preparation of financial statements in accordance with generally accepted accounting principles, and that receipts and expenditures of the company are being made only in accordance with authorizations of management and directors of the company; and (3) provide reasonable assurance regarding prevention or timely detection of unauthorized acquisition, use, or disposition of the company’s assets that could have a material effect on the financial statements.
138
Because of its inherent limitations, internal control over financial reporting may not prevent or detect misstatements. Also, projections of any evaluation of effectiveness to future periods are subject to the risk that controls may become inadequate because of changes in conditions, or that the degree of compliance with the policies or procedures may deteriorate.
/s/ Ernst & Young LLP | ||
Ernst & Young LLP | ||
Des Moines, Iowa | ||
February 28, 2020 | ||
139
CHANGES IN INTERNAL CONTROL OVER FINANCIAL REPORTING
There have been no changes in our internal control over financial reporting (as defined in Exchange Act Rules 13a-15 and 15d-15) that occurred during the fiscal quarter ended December 31, 2019 that have materially affected, or are reasonably likely to materially affect, our internal control over financial reporting.
140
ITEM 9B. OTHER INFORMATION
None.
PART III.
ITEM 10. DIRECTORS, EXECUTIVE OFFICERS AND CORPORATE GOVERNANCE
The information required by Item 10 regarding the Company’s executive officers is included in "Information About Our Executive Officers" under Part I, Item 1 of this report.
The information required by this Item regarding our directors and corporate governance matters is included under the captions "Board of Directors," subheading "Corporate Governance" and "Proposal One-Election of Directors," in our definitive proxy statement for our annual meeting of shareholders to be held on May 20, 2020 (the "2020 Proxy Statement") and is incorporated herein by reference.
The information regarding our Code of Ethics is included under the caption "Board of Directors," subheading "Corporate Governance," subpart "Code of Ethics" in our 2020 Proxy Statement and is incorporated herein by reference.
The information required by this Item regarding compliance with Section 16(a) of the Exchange Act is included under the caption "Delinquent Section 16(a) Reports" in our 2020 Proxy Statement and is incorporated herein by reference.
ITEM 11. EXECUTIVE COMPENSATION
The information required under this Item regarding our executive compensation and our Compensation Committee Report is included under the caption "Executive Compensation" in our 2020 Proxy Statement and is incorporated herein by reference. The information required by this Item regarding Compensation Committee interlocks and insider participation is included under the caption "Board of Directors," subheading "Committees of the Board," subheading "Compensation Committee," subpart "Compensation Committee Interlocks and Insider Participation" in our 2020 Proxy Statement and is incorporated herein by reference.
ITEM 12. SECURITY OWNERSHIP OF CERTAIN BENEFICIAL OWNERS AND MANAGEMENT AND RELATED SHAREHOLDER MATTERS
The information required under this Item is included under the captions "Security Ownership of Certain Beneficial Owners," "Security Ownership of Management" and "Equity Compensation Plan Information" in our 2020 Proxy Statement and is incorporated herein by reference.
ITEM 13. CERTAIN RELATIONSHIPS AND RELATED TRANSACTIONS, AND DIRECTOR INDEPENDENCE
The information required under this Item is included under the captions "Board of Directors" and "Transactions with Related Persons" in our 2020 Proxy Statement and is incorporated herein by reference.
ITEM 14. PRINCIPAL ACCOUNTANT FEES AND SERVICES
The information required under this Item is included under the caption "Proposal Two - Ratification of the Audit Committee's Appointment of Independent Registered Public Accounting Firm," subheading "Information About Our Independent Registered Public Accounting Firm" in our 2020 Proxy Statement and is incorporated herein by reference.
141
PART IV.
ITEM 15. EXHIBITS AND FINANCIAL STATEMENT SCHEDULES
We have filed the following documents as part of this Annual Report on Form 10-K:
Page | |
All other schedules have been omitted as not required, not applicable, not deemed material or because the information is included in the Consolidated Financial Statements. | |
142
(a) 3. Exhibit Index:
Incorporated by reference | |||||||||||||
Exhibit number | Exhibit description | Filed herewith | Form | Period ended | Exhibit | Filing date | |||||||
2.1† | 8-K | 2.1 | 9/19/2017 | ||||||||||
3.1 | S-4 | Annex II | 5/25/2011 | ||||||||||
3.2 | 8-K/A | 3.1 | 5/26/2015 | ||||||||||
3.3 | S-4 | Annex III | 5/25/2011 | ||||||||||
4.1 | X | ||||||||||||
10.1 | * | 10-K | 12/31/2007 | 10.2 | 2/27/2008 | ||||||||
10.2 | * | DEF14A | Exhibit A | 4/18/2011 | |||||||||
10.3 | * | 10-K | 12/31/2011 | 10.4 | 3/15/2012 | ||||||||
10.4 | * | 10-Q | 9/30/2007 | 10.3 | 10/25/2007 | ||||||||
10.5 | * | DEF14A | App A | 4/8/2014 | |||||||||
10.6 | * | 10-K | 12/31/2007 | 10.7 | 2/27/2008 | ||||||||
10.7 | * | 10-K | 12/31/2007 | 10.8 | 2/27/2008 | ||||||||
10.8 | * | 8-K | 99.2 | 5/22/2008 | |||||||||
10.9 | * | 8-K | 99.3 | 5/22/2008 | |||||||||
10.10 | * | 8-K | 99.4 | 5/22/2008 | |||||||||
10.11 | * | 8-K/A | 99.1 | 2/24/2009 | |||||||||
10.12 | * | 10-K | 12/31/2011 | 10.14 | 3/15/2012 | ||||||||
10.13 | * | 10-Q | 6/30/2016 | 10.1 | 8/3/2016 | ||||||||
10.14 | * | 10-K | 12/31/2011 | 10.15 | 3/15/2012 | ||||||||
*Indicates a management contract or compensatory plan or arrangement.
† The schedules to this Exhibit have been omitted in accordance with Regulation S-K Item 601(b)(2). The registrant agrees to furnish a copy of all omitted schedules to the SEC upon its request.
143
(a) 3. Exhibit Index (continued):
Incorporated by reference | |||||||||||||
Exhibit number | Exhibit description | Filed herewith | Form | Period ended | Exhibit | Filing date | |||||||
10.15 | * | 8-K | 10.1 | 11/19/2012 | |||||||||
10.16 | * | 8-K | 10.1 | 5/22/2014 | |||||||||
10.17 | * | 8-K | 10.2 | 5/22/2014 | |||||||||
10.18 | * | 8-K | 10.3 | 5/22/2014 | |||||||||
10.19 | * | 8-K | 10.4 | 5/22/2014 | |||||||||
10.20 | * | 8-K | 10.5 | 5/22/2014 | |||||||||
10.21 | * | 10-Q | 6/30/14 | 10.7 | 8/5/2014 | ||||||||
10.22 | * | 10-Q | 6/30/14 | 10.8 | 8/5/2014 | ||||||||
10.23 | * | 10-Q | 3/31/17 | 10.1 | 5/3/2017 | ||||||||
10.24 | 8-K | 10.1 | 2/5/2016 | ||||||||||
21 | X | ||||||||||||
23.1 | X | ||||||||||||
23.2 | X | ||||||||||||
*Indicates a management contract or compensatory plan or arrangement.
144
(a) 3. Exhibit Index (continued):
Incorporated by reference | ||||||||||||
Exhibit number | Exhibit description | Filed herewith | Form | Period ended | Exhibit | Filing date | ||||||
31.1 | X | |||||||||||
31.2 | X | |||||||||||
32.1 | X | |||||||||||
32.2 | X | |||||||||||
101.1 | X | |||||||||||
104.1 | ||||||||||||
145
Schedule I. Summary of Investments — Other than Investments in Related Parties
December 31, 2019 | (In thousands) | ||||||||||
Cost or Amortized Cost | Amounts at Which Shown in Balance Sheet | ||||||||||
Type of Investment | Fair Value | ||||||||||
Fixed maturities | |||||||||||
Bonds | |||||||||||
United States Government and government agencies and authorities | $ | $ | $ | ||||||||
States, municipalities and political subdivisions | |||||||||||
Foreign governments | |||||||||||
Public utilities | |||||||||||
All other bonds | |||||||||||
Redeemable preferred stock | |||||||||||
Total fixed maturities | $ | $ | $ | ||||||||
Equity securities | |||||||||||
Common stocks | |||||||||||
Public utilities | $ | $ | $ | ||||||||
Banks, trusts and insurance companies | |||||||||||
Industrial, miscellaneous and all other | |||||||||||
Nonredeemable preferred stocks | |||||||||||
Total equity securities | $ | $ | $ | ||||||||
Mortgage loans on real estate | $ | $ | $ | ||||||||
Other long-term investments | |||||||||||
Short-term investments | |||||||||||
Total investments | $ | $ | $ | ||||||||
146
Schedule II. Condensed Financial Statements of Parent Company
United Fire Group, Inc. (parent company only)
Condensed Balance Sheets
December 31, | ||||||
(In thousands, except share data) | 2019 | 2018 | ||||
Assets | ||||||
Fixed maturities | ||||||
Available-for-sale, at fair value (amortized cost $150 in 2019 and $150 in 2018) | $ | $ | ||||
Investment in subsidiary | ||||||
Cash and cash equivalents | ||||||
Federal income tax receivable | ||||||
Accrued investment income | ||||||
Total assets | $ | $ | ||||
Liabilities and stockholders' equity | ||||||
Liabilities | $ | $ | ||||
Stockholders' equity | ||||||
Common stock, $0.001 par value, authorized 75,000,000 shares; 25,015,963 and 25,097,408 issued and outstanding in 2019 and 2018, respectively | $ | $ | ||||
Additional paid-in capital | ||||||
Retained earnings | ||||||
Accumulated other comprehensive income, net of tax | ( | ) | ||||
Total stockholders' equity | $ | $ | ||||
Total liabilities and stockholders' equity | $ | $ | ||||
This condensed financial information should be read in conjunction with the Consolidated Financial Statements and Notes included in Part II, Item 8 of this Annual Report on Form 10-K.
147
Schedule II. Condensed Financial Statements of Parent Company (continued)
United Fire Group, Inc. (parent company only)
Condensed Statements of Income and Comprehensive Income
For the Years Ended December 31, | |||||||||
(In thousands) | 2019 | 2018 | 2017 | ||||||
Revenues | |||||||||
Investment income | $ | $ | $ | ||||||
Total revenues | |||||||||
Expenses | |||||||||
Other operating expenses | $ | $ | $ | ||||||
Total expenses | |||||||||
Income (loss) before income taxes and equity in net income of subsidiary | |||||||||
Federal income tax expense (benefit) | ( | ) | ( | ) | |||||
Net income before equity in net income of subsidiary | $ | $ | $ | ||||||
Equity in net income of subsidiary | |||||||||
Net income | $ | $ | $ | ||||||
Other comprehensive income (loss) | |||||||||
Change in unrealized appreciation on investments held by subsidiary | $ | $ | ( | ) | $ | ||||
Change in liability for underfunded employee benefit plans of subsidiary | ( | ) | ( | ) | |||||
Other comprehensive income (loss), before tax and reclassification adjustments | $ | $ | ( | ) | $ | ||||
Income tax effect | ( | ) | ( | ) | |||||
Other comprehensive income (loss), after tax, before reclassification adjustments | $ | $ | ( | ) | $ | ||||
Reclassification adjustment for net realized gains of the subsidiary included in income | ( | ) | |||||||
Reclassification adjustment for employee benefit costs of the subsidiary included in expense | |||||||||
Total reclassification adjustments, before tax | $ | $ | $ | ( | ) | ||||
Income tax effect | ( | ) | ( | ) | |||||
Total reclassification adjustments, after tax | $ | $ | $ | ( | ) | ||||
Comprehensive income | $ | $ | $ | ||||||
United Fire Group, Inc. and its subsidiaries file a consolidated federal income tax return. The federal income tax provision represents an allocation under its tax allocation agreements.
This condensed financial information should be read in conjunction with the Consolidated Financial Statements and Notes included in Part II, Item 8 of this Annual Report on Form 10-K.
148
Schedule II. Condensed Financial Statements of Parent Company (continued)
United Fire Group, Inc. (parent company only)
Condensed Statements of Cash Flows
For the Years Ended December 31, | |||||||||
(In thousands) | 2019 | 2018 | 2017 | ||||||
Cash flows from operating activities | |||||||||
Net income | $ | $ | $ | ||||||
Adjustments to reconcile net income to net cash provided by operating activities | |||||||||
Equity in net income of subsidiary | ( | ) | ( | ) | ( | ) | |||
Dividends received from subsidiary | |||||||||
Other, net | |||||||||
Total adjustments | $ | $ | $ | ( | ) | ||||
Net cash provided by operating activities | $ | $ | $ | ||||||
Cash flows from investing activities | |||||||||
Proceeds from maturity of held-to-maturity investments | $ | $ | $ | ||||||
Purchase of held-to-maturity investments | ( | ) | |||||||
Net cash used in investing activities | $ | $ | $ | ||||||
Cash flows from financing activities | |||||||||
Payment of cash dividends | $ | ( | ) | $ | ( | ) | $ | ( | ) |
Repurchase of common stock | ( | ) | ( | ) | ( | ) | |||
Issuance of common stock | |||||||||
Net cash used in financing activities | $ | ( | ) | $ | ( | ) | $ | ( | ) |
Net change in cash and cash equivalents | $ | $ | $ | ( | ) | ||||
Cash and cash equivalents at beginning of period | |||||||||
Cash and cash equivalents at end of year | $ | $ | $ | ||||||
This condensed financial information should be read in conjunction with the Consolidated Financial Statements and Notes included in Part II, Item 8 of this Form 10-K.
149
Schedule III. Supplementary Insurance Information
(In thousands) | Deferred Policy Acquisition Costs | Future Policy Benefits, Losses, Claims and Loss Expenses | Unearned Premiums | Earned Premium Revenue | Investment Income, Net | Benefits, Claims, Losses and Settlement Expenses | Amortization of Deferred Policy Acquisition Costs | Other Underwriting Expenses | Interest on Policyholders' Accounts | Premiums Written (2) | |||||||||||||||||||||||||||||
Year Ended December 31, 2019 | |||||||||||||||||||||||||||||||||||||||
Continuing Operations | $ | $ | $ | $ | $ | $ | $ | $ | $ | $ | |||||||||||||||||||||||||||||
Discontinued Operations(1) | |||||||||||||||||||||||||||||||||||||||
Total | $ | $ | $ | $ | $ | $ | $ | $ | $ | $ | |||||||||||||||||||||||||||||
Year Ended December 31, 2018 | |||||||||||||||||||||||||||||||||||||||
Continuing Operations | $ | $ | $ | $ | $ | $ | $ | $ | $ | $ | |||||||||||||||||||||||||||||
Discontinued Operations(1) | |||||||||||||||||||||||||||||||||||||||
Total | $ | $ | $ | $ | $ | $ | $ | $ | $ | $ | |||||||||||||||||||||||||||||
Year Ended December 31, 2017 | |||||||||||||||||||||||||||||||||||||||
Continuing Operations | $ | $ | $ | $ | $ | $ | $ | $ | $ | $ | |||||||||||||||||||||||||||||
Discontinued Operations(1) | |||||||||||||||||||||||||||||||||||||||
Total | $ | $ | $ | $ | $ | $ | $ | $ | $ | $ | |||||||||||||||||||||||||||||
(1) | Annuity deposits are included in future policy benefits, losses, claims and loss expenses. |
(2) |
150
Schedule IV. Reinsurance
(In thousands) | Gross Amount | Ceded to Other Companies | Assumed From Other Companies | Net Amount | Percentage of Amount Assumed to Net Earned | |||||||||||||
Year Ended December 31, 2019 | ||||||||||||||||||
Life insurance in force | $ | $ | $ | $ | ||||||||||||||
Premiums earned | ||||||||||||||||||
Continuing Operations - Property and casualty insurance | $ | $ | $ | $ | % | |||||||||||||
Discontinued Operations - Life, accident and health insurance | % | |||||||||||||||||
Total | $ | $ | $ | $ | % | |||||||||||||
Year Ended December 31, 2018 | ||||||||||||||||||
Life insurance in force | $ | $ | $ | $ | ||||||||||||||
Premiums earned | ||||||||||||||||||
Continuing Operations - Property and casualty insurance | $ | $ | $ | $ | % | |||||||||||||
Discontinued Operations - Life, accident and health insurance | % | |||||||||||||||||
Total | $ | $ | $ | $ | % | |||||||||||||
Year Ended December 31, 2017 | ||||||||||||||||||
Life insurance in force | $ | $ | $ | $ | ||||||||||||||
Premiums earned | ||||||||||||||||||
Continuing Operations - Property and casualty insurance | $ | $ | $ | $ | % | |||||||||||||
Discontinued Operations - Life, accident and health insurance | % | |||||||||||||||||
Total | $ | $ | $ | $ | % | |||||||||||||
151
Schedule V. Valuation And Qualifying Accounts
(In thousands) | Balance at beginning of period | Charged to costs and expenses | Deductions | Balance at end of period | |||||||||||
Description | |||||||||||||||
Allowance for bad debts | |||||||||||||||
Year Ended December 31, 2019 | $ | $ | $ | $ | |||||||||||
Year Ended December 31, 2018 | |||||||||||||||
Year Ended December 31, 2017 | |||||||||||||||
Deferred tax asset valuation allowance (1) | |||||||||||||||
Year Ended December 31, 2019 | $ | $ | $ | $ | |||||||||||
Year Ended December 31, 2018 | |||||||||||||||
Year Ended December 31, 2017 | |||||||||||||||
(1) | Recorded in connection with the purchase of American Indemnity Financial Corporation in 1999. |
152
Schedule VI. Supplemental Information Concerning Property and Casualty Insurance Operations
(In thousands) | |||||||||||||||||||||||||||||||||||||||||||
Affiliation with Registrant: United Fire & Casualty Company and consolidated property and casualty subsidiaries | Claims and Claim Adjustment Expenses Incurred Related to: | Amortization of Deferred Policy Acquisition Costs | |||||||||||||||||||||||||||||||||||||||||
Reserves for Unpaid Claims and Claim Adjustment Expenses | Net Realized Investment Gains (Losses) | ||||||||||||||||||||||||||||||||||||||||||
Deferred Policy Acquisition Costs | Net Investment Income | Paid Claims and Claim Adjustment Expenses | |||||||||||||||||||||||||||||||||||||||||
Unearned Premiums | Earned Premiums | Current Year | Prior Years | Premiums Written | |||||||||||||||||||||||||||||||||||||||
2019 | $ | $ | $ | $ | $ | $ | $ | $ | ( | ) | $ | $ | $ | ||||||||||||||||||||||||||||||
2018 | $ | $ | $ | $ | $ | ( | ) | $ | $ | $ | ( | ) | $ | $ | $ | ||||||||||||||||||||||||||||
2017 | $ | $ | $ | $ | $ | $ | $ | $ | ( | ) | $ | $ | $ | ||||||||||||||||||||||||||||||
153
ITEM 16. FORM 10-K SUMMARY
None.
154
SIGNATURES
Pursuant to the requirements of Section 13 or 15(d) of the Securities Exchange Act of 1934, the Registrant has duly caused this report to be signed on its behalf by the undersigned, thereunto duly authorized.
UNITED FIRE GROUP, INC.
By: | /s/ Randy A. Ramlo |
Randy A. Ramlo, Chief Executive Officer, Director and Principal Executive Officer | |
Date: | 2/28/2020 |
By: | /s/ Dawn M. Jaffray |
Dawn M. Jaffray, Executive Vice President, Chief Financial Officer, Principal Financial Officer and Principal Accounting Officer | |
Date: | 2/28/2020 |
Pursuant to the requirements of the Securities Exchange Act of 1934, this report has been signed below by the following persons on behalf of the Registrant and in the capacities and on the dates indicated.
By | /s/ Jack B. Evans | By | /s/ John Paul E. Besong | |
Jack B. Evans, Chairman and Director | John Paul E. Besong, Director | |||
Date | 2/28/2020 | Date | 2/28/2020 | |
By | /s/ Scott L. Carlton | By: | /s/ Brenda K. Clancy | |
Scott L. Carlton, Director | Brenda K. Clancy, Director | |||
Date | 2/28/2020 | Date | 2/28/2020 | |
By | /s/ Christopher R. Drahozal | By | /s/ Dawn M. Jaffray | |
Christopher R. Drahozal, Director | Dawn M. Jaffray, Executive Vice President, Chief Financial Officer, Principal Financial Officer and Principal Accounting Officer | |||
Date | 2/28/2020 | Date | 2/28/2020 | |
By | /s/ George D. Milligan | By | /s/ James W. Noyce | |
George D. Milligan, Director | James W. Noyce, Vice Chairman and Director | |||
Date | 2/28/2020 | Date | 2/28/2020 | |
By | /s/ Mary K. Quass | By | /s/ Randy A. Ramlo | |
Mary K. Quass, Director | Randy A. Ramlo, Chief Executive Officer, Director and Principal Executive Officer | |||
Date | 2/28/2020 | Date | 2/28/2020 | |
By | /s/ Kyle D. Skogman | By | /s/ Susan E. Voss | |
Kyle D. Skogman, Director | Susan E. Voss, Director | |||
Date | 2/28/2020 | Date | 2/28/2020 | |
155