00000960212021FYFALSE117,695334,810111,500,0001,500,000nonenone112,000,000,0002,000,000,000765,174,900765,174,900253,817,013256,915,825http://fasb.org/us-gaap/2021-01-31#AccountingStandardsUpdate201602Memberhttp://fasb.org/us-gaap/2021-01-31#AccountingStandardsUpdate201613Member1.531.741.821030310350.4542.602.502.601.253.553.655.653.753.307.163.256.502.405.955.3756.6256.604.854.504.456.603.304.404.53http://fasb.org/us-gaap/2021-01-31#PropertyPlantAndEquipmentAndFinanceLeaseRightOfUseAssetAfterAccumulatedDepreciationAndAmortizationhttp://fasb.org/us-gaap/2021-01-31#PropertyPlantAndEquipmentAndFinanceLeaseRightOfUseAssetAfterAccumulatedDepreciationAndAmortizationhttp://fasb.org/us-gaap/2021-01-31#LongTermDebtCurrenthttp://fasb.org/us-gaap/2021-01-31#LongTermDebtCurrenthttp://fasb.org/us-gaap/2021-01-31#LongTermDebthttp://fasb.org/us-gaap/2021-01-31#LongTermDebt00000960212020-06-282021-07-030000096021us-gaap:CommonStockMember2020-06-282021-07-030000096021syy:SeniorNotes1.25Due2023Member2020-06-282021-07-03iso4217:USD00000960212020-12-24xbrli:shares00000960212021-08-1000000960212021-07-0300000960212020-06-27iso4217:USDxbrli:shares00000960212019-06-302020-06-2700000960212018-07-012019-06-290000096021us-gaap:CommonStockMember2018-06-300000096021us-gaap:AdditionalPaidInCapitalMember2018-06-300000096021us-gaap:RetainedEarningsUnappropriatedMember2018-06-300000096021us-gaap:AccumulatedOtherComprehensiveIncomeMember2018-06-300000096021us-gaap:TreasuryStockMember2018-06-3000000960212018-06-300000096021us-gaap:RetainedEarningsUnappropriatedMember2018-07-012019-06-290000096021us-gaap:AccumulatedOtherComprehensiveIncomeMember2018-07-012019-06-290000096021us-gaap:TreasuryStockMember2018-07-012019-06-290000096021us-gaap:AdditionalPaidInCapitalMember2018-07-012019-06-290000096021us-gaap:CommonStockMember2019-06-290000096021us-gaap:AdditionalPaidInCapitalMember2019-06-290000096021us-gaap:RetainedEarningsUnappropriatedMember2019-06-290000096021us-gaap:AccumulatedOtherComprehensiveIncomeMember2019-06-290000096021us-gaap:TreasuryStockMember2019-06-2900000960212019-06-290000096021us-gaap:RetainedEarningsUnappropriatedMember2019-06-302020-06-270000096021us-gaap:AccumulatedOtherComprehensiveIncomeMember2019-06-302020-06-270000096021srt:CumulativeEffectPeriodOfAdoptionAdjustmentMemberus-gaap:RetainedEarningsUnappropriatedMember2019-06-290000096021srt:CumulativeEffectPeriodOfAdoptionAdjustmentMember2019-06-290000096021us-gaap:TreasuryStockMember2019-06-302020-06-270000096021us-gaap:AdditionalPaidInCapitalMember2019-06-302020-06-270000096021us-gaap:CommonStockMember2020-06-270000096021us-gaap:AdditionalPaidInCapitalMember2020-06-270000096021us-gaap:RetainedEarningsUnappropriatedMember2020-06-270000096021us-gaap:AccumulatedOtherComprehensiveIncomeMember2020-06-270000096021us-gaap:TreasuryStockMember2020-06-270000096021us-gaap:RetainedEarningsUnappropriatedMember2020-06-282021-07-030000096021us-gaap:AccumulatedOtherComprehensiveIncomeMember2020-06-282021-07-030000096021srt:CumulativeEffectPeriodOfAdoptionAdjustmentMemberus-gaap:RetainedEarningsUnappropriatedMember2020-06-270000096021srt:CumulativeEffectPeriodOfAdoptionAdjustmentMember2020-06-270000096021us-gaap:AdditionalPaidInCapitalMember2020-06-282021-07-030000096021us-gaap:TreasuryStockMember2020-06-282021-07-030000096021us-gaap:CommonStockMember2021-07-030000096021us-gaap:AdditionalPaidInCapitalMember2021-07-030000096021us-gaap:RetainedEarningsUnappropriatedMember2021-07-030000096021us-gaap:AccumulatedOtherComprehensiveIncomeMember2021-07-030000096021us-gaap:TreasuryStockMember2021-07-03syy:customersyy:facilitysyy:reporting_unitxbrli:pure0000096021srt:MinimumMember2020-06-282021-07-030000096021srt:MaximumMember2020-06-282021-07-030000096021us-gaap:ShippingAndHandlingMember2020-06-282021-07-030000096021us-gaap:ShippingAndHandlingMember2019-06-302020-06-270000096021us-gaap:ShippingAndHandlingMember2018-07-012019-06-290000096021syy:FreshAndFrozenMeats1Membersyy:U.S.FoodserviceOperationsMember2020-06-282021-07-030000096021syy:FreshAndFrozenMeats1Membersyy:InternationalFoodserviceOperationsMember2020-06-282021-07-030000096021syy:FreshAndFrozenMeats1Membersyy:SygmaSegmentMember2020-06-282021-07-030000096021syy:FreshAndFrozenMeats1Memberus-gaap:AllOtherSegmentsMember2020-06-282021-07-030000096021syy:FreshAndFrozenMeats1Member2020-06-282021-07-030000096021syy:CannedAndDryProducts1Membersyy:U.S.FoodserviceOperationsMember2020-06-282021-07-030000096021syy:InternationalFoodserviceOperationsMembersyy:CannedAndDryProducts1Member2020-06-282021-07-030000096021syy:SygmaSegmentMembersyy:CannedAndDryProducts1Member2020-06-282021-07-030000096021syy:CannedAndDryProducts1Memberus-gaap:AllOtherSegmentsMember2020-06-282021-07-030000096021syy:CannedAndDryProducts1Member2020-06-282021-07-030000096021syy:FrozenFruitsVegetablesBakeryAndOther1Membersyy:U.S.FoodserviceOperationsMember2020-06-282021-07-030000096021syy:InternationalFoodserviceOperationsMembersyy:FrozenFruitsVegetablesBakeryAndOther1Member2020-06-282021-07-030000096021syy:SygmaSegmentMembersyy:FrozenFruitsVegetablesBakeryAndOther1Member2020-06-282021-07-030000096021syy:FrozenFruitsVegetablesBakeryAndOther1Memberus-gaap:AllOtherSegmentsMember2020-06-282021-07-030000096021syy:FrozenFruitsVegetablesBakeryAndOther1Member2020-06-282021-07-030000096021syy:Poultry1Membersyy:U.S.FoodserviceOperationsMember2020-06-282021-07-030000096021syy:Poultry1Membersyy:InternationalFoodserviceOperationsMember2020-06-282021-07-030000096021syy:Poultry1Membersyy:SygmaSegmentMember2020-06-282021-07-030000096021syy:Poultry1Memberus-gaap:AllOtherSegmentsMember2020-06-282021-07-030000096021syy:Poultry1Member2020-06-282021-07-030000096021syy:DairyProducts1Membersyy:U.S.FoodserviceOperationsMember2020-06-282021-07-030000096021syy:InternationalFoodserviceOperationsMembersyy:DairyProducts1Member2020-06-282021-07-030000096021syy:SygmaSegmentMembersyy:DairyProducts1Member2020-06-282021-07-030000096021syy:DairyProducts1Memberus-gaap:AllOtherSegmentsMember2020-06-282021-07-030000096021syy:DairyProducts1Member2020-06-282021-07-030000096021syy:FreshProduce1Membersyy:U.S.FoodserviceOperationsMember2020-06-282021-07-030000096021syy:InternationalFoodserviceOperationsMembersyy:FreshProduce1Member2020-06-282021-07-030000096021syy:SygmaSegmentMembersyy:FreshProduce1Member2020-06-282021-07-030000096021us-gaap:AllOtherSegmentsMembersyy:FreshProduce1Member2020-06-282021-07-030000096021syy:FreshProduce1Member2020-06-282021-07-030000096021syy:PaperAndDisposables1Membersyy:U.S.FoodserviceOperationsMember2020-06-282021-07-030000096021syy:InternationalFoodserviceOperationsMembersyy:PaperAndDisposables1Member2020-06-282021-07-030000096021syy:SygmaSegmentMembersyy:PaperAndDisposables1Member2020-06-282021-07-030000096021us-gaap:AllOtherSegmentsMembersyy:PaperAndDisposables1Member2020-06-282021-07-030000096021syy:PaperAndDisposables1Member2020-06-282021-07-030000096021syy:Seafood1Membersyy:U.S.FoodserviceOperationsMember2020-06-282021-07-030000096021syy:InternationalFoodserviceOperationsMembersyy:Seafood1Member2020-06-282021-07-030000096021syy:SygmaSegmentMembersyy:Seafood1Member2020-06-282021-07-030000096021syy:Seafood1Memberus-gaap:AllOtherSegmentsMember2020-06-282021-07-030000096021syy:Seafood1Member2020-06-282021-07-030000096021syy:BeverageProducts1Membersyy:U.S.FoodserviceOperationsMember2020-06-282021-07-030000096021syy:BeverageProducts1Membersyy:InternationalFoodserviceOperationsMember2020-06-282021-07-030000096021syy:BeverageProducts1Membersyy:SygmaSegmentMember2020-06-282021-07-030000096021syy:BeverageProducts1Memberus-gaap:AllOtherSegmentsMember2020-06-282021-07-030000096021syy:BeverageProducts1Member2020-06-282021-07-030000096021syy:OtherProductsMembersyy:U.S.FoodserviceOperationsMember2020-06-282021-07-030000096021syy:InternationalFoodserviceOperationsMembersyy:OtherProductsMember2020-06-282021-07-030000096021syy:SygmaSegmentMembersyy:OtherProductsMember2020-06-282021-07-030000096021syy:OtherProductsMemberus-gaap:AllOtherSegmentsMember2020-06-282021-07-030000096021syy:OtherProductsMember2020-06-282021-07-030000096021syy:U.S.FoodserviceOperationsMember2020-06-282021-07-030000096021syy:InternationalFoodserviceOperationsMember2020-06-282021-07-030000096021syy:SygmaSegmentMember2020-06-282021-07-030000096021us-gaap:AllOtherSegmentsMember2020-06-282021-07-030000096021syy:FreshAndFrozenMeats1Membersyy:U.S.FoodserviceOperationsMember2019-06-302020-06-270000096021syy:FreshAndFrozenMeats1Membersyy:InternationalFoodserviceOperationsMember2019-06-302020-06-270000096021syy:FreshAndFrozenMeats1Membersyy:SygmaSegmentMember2019-06-302020-06-270000096021syy:FreshAndFrozenMeats1Memberus-gaap:AllOtherSegmentsMember2019-06-302020-06-270000096021syy:FreshAndFrozenMeats1Member2019-06-302020-06-270000096021syy:CannedAndDryProducts1Membersyy:U.S.FoodserviceOperationsMember2019-06-302020-06-270000096021syy:InternationalFoodserviceOperationsMembersyy:CannedAndDryProducts1Member2019-06-302020-06-270000096021syy:SygmaSegmentMembersyy:CannedAndDryProducts1Member2019-06-302020-06-270000096021syy:CannedAndDryProducts1Memberus-gaap:AllOtherSegmentsMember2019-06-302020-06-270000096021syy:CannedAndDryProducts1Member2019-06-302020-06-270000096021syy:FrozenFruitsVegetablesBakeryAndOther1Membersyy:U.S.FoodserviceOperationsMember2019-06-302020-06-270000096021syy:InternationalFoodserviceOperationsMembersyy:FrozenFruitsVegetablesBakeryAndOther1Member2019-06-302020-06-270000096021syy:SygmaSegmentMembersyy:FrozenFruitsVegetablesBakeryAndOther1Member2019-06-302020-06-270000096021syy:FrozenFruitsVegetablesBakeryAndOther1Memberus-gaap:AllOtherSegmentsMember2019-06-302020-06-270000096021syy:FrozenFruitsVegetablesBakeryAndOther1Member2019-06-302020-06-270000096021syy:DairyProducts1Membersyy:U.S.FoodserviceOperationsMember2019-06-302020-06-270000096021syy:InternationalFoodserviceOperationsMembersyy:DairyProducts1Member2019-06-302020-06-270000096021syy:SygmaSegmentMembersyy:DairyProducts1Member2019-06-302020-06-270000096021syy:DairyProducts1Memberus-gaap:AllOtherSegmentsMember2019-06-302020-06-270000096021syy:DairyProducts1Member2019-06-302020-06-270000096021syy:Poultry1Membersyy:U.S.FoodserviceOperationsMember2019-06-302020-06-270000096021syy:Poultry1Membersyy:InternationalFoodserviceOperationsMember2019-06-302020-06-270000096021syy:Poultry1Membersyy:SygmaSegmentMember2019-06-302020-06-270000096021syy:Poultry1Memberus-gaap:AllOtherSegmentsMember2019-06-302020-06-270000096021syy:Poultry1Member2019-06-302020-06-270000096021syy:FreshProduce1Membersyy:U.S.FoodserviceOperationsMember2019-06-302020-06-270000096021syy:InternationalFoodserviceOperationsMembersyy:FreshProduce1Member2019-06-302020-06-270000096021syy:SygmaSegmentMembersyy:FreshProduce1Member2019-06-302020-06-270000096021us-gaap:AllOtherSegmentsMembersyy:FreshProduce1Member2019-06-302020-06-270000096021syy:FreshProduce1Member2019-06-302020-06-270000096021syy:PaperAndDisposables1Membersyy:U.S.FoodserviceOperationsMember2019-06-302020-06-270000096021syy:InternationalFoodserviceOperationsMembersyy:PaperAndDisposables1Member2019-06-302020-06-270000096021syy:SygmaSegmentMembersyy:PaperAndDisposables1Member2019-06-302020-06-270000096021us-gaap:AllOtherSegmentsMembersyy:PaperAndDisposables1Member2019-06-302020-06-270000096021syy:PaperAndDisposables1Member2019-06-302020-06-270000096021syy:Seafood1Membersyy:U.S.FoodserviceOperationsMember2019-06-302020-06-270000096021syy:InternationalFoodserviceOperationsMembersyy:Seafood1Member2019-06-302020-06-270000096021syy:SygmaSegmentMembersyy:Seafood1Member2019-06-302020-06-270000096021syy:Seafood1Memberus-gaap:AllOtherSegmentsMember2019-06-302020-06-270000096021syy:Seafood1Member2019-06-302020-06-270000096021syy:BeverageProducts1Membersyy:U.S.FoodserviceOperationsMember2019-06-302020-06-270000096021syy:BeverageProducts1Membersyy:InternationalFoodserviceOperationsMember2019-06-302020-06-270000096021syy:BeverageProducts1Membersyy:SygmaSegmentMember2019-06-302020-06-270000096021syy:BeverageProducts1Memberus-gaap:AllOtherSegmentsMember2019-06-302020-06-270000096021syy:BeverageProducts1Member2019-06-302020-06-270000096021syy:OtherProductsMembersyy:U.S.FoodserviceOperationsMember2019-06-302020-06-270000096021syy:InternationalFoodserviceOperationsMembersyy:OtherProductsMember2019-06-302020-06-270000096021syy:SygmaSegmentMembersyy:OtherProductsMember2019-06-302020-06-270000096021syy:OtherProductsMemberus-gaap:AllOtherSegmentsMember2019-06-302020-06-270000096021syy:OtherProductsMember2019-06-302020-06-270000096021syy:U.S.FoodserviceOperationsMember2019-06-302020-06-270000096021syy:InternationalFoodserviceOperationsMember2019-06-302020-06-270000096021syy:SygmaSegmentMember2019-06-302020-06-270000096021us-gaap:AllOtherSegmentsMember2019-06-302020-06-270000096021syy:FreshAndFrozenMeats1Membersyy:U.S.FoodserviceOperationsMember2018-07-012019-06-290000096021syy:FreshAndFrozenMeats1Membersyy:InternationalFoodserviceOperationsMember2018-07-012019-06-290000096021syy:FreshAndFrozenMeats1Membersyy:SygmaSegmentMember2018-07-012019-06-290000096021syy:FreshAndFrozenMeats1Memberus-gaap:AllOtherSegmentsMember2018-07-012019-06-290000096021syy:FreshAndFrozenMeats1Member2018-07-012019-06-290000096021syy:CannedAndDryProducts1Membersyy:U.S.FoodserviceOperationsMember2018-07-012019-06-290000096021syy:InternationalFoodserviceOperationsMembersyy:CannedAndDryProducts1Member2018-07-012019-06-290000096021syy:SygmaSegmentMembersyy:CannedAndDryProducts1Member2018-07-012019-06-290000096021syy:CannedAndDryProducts1Memberus-gaap:AllOtherSegmentsMember2018-07-012019-06-290000096021syy:CannedAndDryProducts1Member2018-07-012019-06-290000096021syy:FrozenFruitsVegetablesBakeryAndOther1Membersyy:U.S.FoodserviceOperationsMember2018-07-012019-06-290000096021syy:InternationalFoodserviceOperationsMembersyy:FrozenFruitsVegetablesBakeryAndOther1Member2018-07-012019-06-290000096021syy:SygmaSegmentMembersyy:FrozenFruitsVegetablesBakeryAndOther1Member2018-07-012019-06-290000096021syy:FrozenFruitsVegetablesBakeryAndOther1Memberus-gaap:AllOtherSegmentsMember2018-07-012019-06-290000096021syy:FrozenFruitsVegetablesBakeryAndOther1Member2018-07-012019-06-290000096021syy:DairyProducts1Membersyy:U.S.FoodserviceOperationsMember2018-07-012019-06-290000096021syy:InternationalFoodserviceOperationsMembersyy:DairyProducts1Member2018-07-012019-06-290000096021syy:SygmaSegmentMembersyy:DairyProducts1Member2018-07-012019-06-290000096021syy:DairyProducts1Memberus-gaap:AllOtherSegmentsMember2018-07-012019-06-290000096021syy:DairyProducts1Member2018-07-012019-06-290000096021syy:Poultry1Membersyy:U.S.FoodserviceOperationsMember2018-07-012019-06-290000096021syy:Poultry1Membersyy:InternationalFoodserviceOperationsMember2018-07-012019-06-290000096021syy:Poultry1Membersyy:SygmaSegmentMember2018-07-012019-06-290000096021syy:Poultry1Memberus-gaap:AllOtherSegmentsMember2018-07-012019-06-290000096021syy:Poultry1Member2018-07-012019-06-290000096021syy:FreshProduce1Membersyy:U.S.FoodserviceOperationsMember2018-07-012019-06-290000096021syy:InternationalFoodserviceOperationsMembersyy:FreshProduce1Member2018-07-012019-06-290000096021syy:SygmaSegmentMembersyy:FreshProduce1Member2018-07-012019-06-290000096021us-gaap:AllOtherSegmentsMembersyy:FreshProduce1Member2018-07-012019-06-290000096021syy:FreshProduce1Member2018-07-012019-06-290000096021syy:PaperAndDisposables1Membersyy:U.S.FoodserviceOperationsMember2018-07-012019-06-290000096021syy:InternationalFoodserviceOperationsMembersyy:PaperAndDisposables1Member2018-07-012019-06-290000096021syy:SygmaSegmentMembersyy:PaperAndDisposables1Member2018-07-012019-06-290000096021us-gaap:AllOtherSegmentsMembersyy:PaperAndDisposables1Member2018-07-012019-06-290000096021syy:PaperAndDisposables1Member2018-07-012019-06-290000096021syy:Seafood1Membersyy:U.S.FoodserviceOperationsMember2018-07-012019-06-290000096021syy:InternationalFoodserviceOperationsMembersyy:Seafood1Member2018-07-012019-06-290000096021syy:SygmaSegmentMembersyy:Seafood1Member2018-07-012019-06-290000096021syy:Seafood1Memberus-gaap:AllOtherSegmentsMember2018-07-012019-06-290000096021syy:Seafood1Member2018-07-012019-06-290000096021syy:BeverageProducts1Membersyy:U.S.FoodserviceOperationsMember2018-07-012019-06-290000096021syy:BeverageProducts1Membersyy:InternationalFoodserviceOperationsMember2018-07-012019-06-290000096021syy:BeverageProducts1Membersyy:SygmaSegmentMember2018-07-012019-06-290000096021syy:BeverageProducts1Memberus-gaap:AllOtherSegmentsMember2018-07-012019-06-290000096021syy:BeverageProducts1Member2018-07-012019-06-290000096021syy:OtherProductsMembersyy:U.S.FoodserviceOperationsMember2018-07-012019-06-290000096021syy:InternationalFoodserviceOperationsMembersyy:OtherProductsMember2018-07-012019-06-290000096021syy:SygmaSegmentMembersyy:OtherProductsMember2018-07-012019-06-290000096021syy:OtherProductsMemberus-gaap:AllOtherSegmentsMember2018-07-012019-06-290000096021syy:OtherProductsMember2018-07-012019-06-290000096021syy:U.S.FoodserviceOperationsMember2018-07-012019-06-290000096021syy:InternationalFoodserviceOperationsMember2018-07-012019-06-290000096021syy:SygmaSegmentMember2018-07-012019-06-290000096021us-gaap:AllOtherSegmentsMember2018-07-012019-06-29syy:acquisition0000096021us-gaap:SeriesOfIndividuallyImmaterialBusinessAcquisitionsMember2021-07-030000096021us-gaap:SeriesOfIndividuallyImmaterialBusinessAcquisitionsMember2020-06-282021-07-030000096021us-gaap:FairValueInputsLevel1Memberus-gaap:FairValueMeasurementsRecurringMember2021-07-030000096021us-gaap:FairValueInputsLevel2Memberus-gaap:FairValueMeasurementsRecurringMember2021-07-030000096021us-gaap:FairValueInputsLevel3Memberus-gaap:FairValueMeasurementsRecurringMember2021-07-030000096021us-gaap:FairValueMeasurementsRecurringMember2021-07-030000096021us-gaap:FairValueInputsLevel1Memberus-gaap:FairValueMeasurementsRecurringMember2020-06-270000096021us-gaap:FairValueInputsLevel2Memberus-gaap:FairValueMeasurementsRecurringMember2020-06-270000096021us-gaap:FairValueInputsLevel3Memberus-gaap:FairValueMeasurementsRecurringMember2020-06-270000096021us-gaap:FairValueMeasurementsRecurringMember2020-06-270000096021us-gaap:NondesignatedMember2021-07-030000096021us-gaap:NondesignatedMember2020-06-270000096021us-gaap:CorporateDebtSecuritiesMember2021-07-030000096021us-gaap:ShortTermInvestmentsMemberus-gaap:CorporateDebtSecuritiesMember2021-07-030000096021us-gaap:OtherLongTermInvestmentsMemberus-gaap:CorporateDebtSecuritiesMember2021-07-030000096021us-gaap:USTreasuryAndGovernmentMember2021-07-030000096021us-gaap:ShortTermInvestmentsMemberus-gaap:USTreasuryAndGovernmentMember2021-07-030000096021us-gaap:OtherLongTermInvestmentsMemberus-gaap:USTreasuryAndGovernmentMember2021-07-030000096021us-gaap:ShortTermInvestmentsMember2021-07-030000096021us-gaap:OtherLongTermInvestmentsMember2021-07-030000096021us-gaap:CorporateDebtSecuritiesMember2020-06-270000096021us-gaap:ShortTermInvestmentsMemberus-gaap:CorporateDebtSecuritiesMember2020-06-270000096021us-gaap:OtherLongTermInvestmentsMemberus-gaap:CorporateDebtSecuritiesMember2020-06-270000096021us-gaap:USTreasuryAndGovernmentMember2020-06-270000096021us-gaap:ShortTermInvestmentsMemberus-gaap:USTreasuryAndGovernmentMember2020-06-270000096021us-gaap:OtherLongTermInvestmentsMemberus-gaap:USTreasuryAndGovernmentMember2020-06-270000096021us-gaap:ShortTermInvestmentsMember2020-06-270000096021us-gaap:OtherLongTermInvestmentsMember2020-06-270000096021us-gaap:LandMember2021-07-030000096021us-gaap:LandMember2020-06-270000096021syy:BuildingBuildingImprovementsAndLeaseholdImprovementsMember2021-07-030000096021syy:BuildingBuildingImprovementsAndLeaseholdImprovementsMember2020-06-270000096021syy:FleetAndEquipmentMember2021-07-030000096021syy:FleetAndEquipmentMember2020-06-270000096021syy:ComputerHardwareAndSoftwareMember2021-07-030000096021syy:ComputerHardwareAndSoftwareMember2020-06-270000096021srt:MinimumMembersyy:BuildingBuildingImprovementsAndLeaseholdImprovementsMember2020-06-282021-07-030000096021srt:MaximumMembersyy:BuildingBuildingImprovementsAndLeaseholdImprovementsMember2020-06-282021-07-030000096021srt:MinimumMembersyy:FleetAndEquipmentMember2020-06-282021-07-030000096021srt:MaximumMembersyy:FleetAndEquipmentMember2020-06-282021-07-030000096021srt:MinimumMembersyy:ComputerHardwareAndSoftwareMember2020-06-282021-07-030000096021srt:MaximumMembersyy:ComputerHardwareAndSoftwareMember2020-06-282021-07-030000096021syy:U.S.FoodserviceOperationsMember2019-06-290000096021syy:InternationalFoodserviceOperationsMember2019-06-290000096021syy:SygmaSegmentMember2019-06-290000096021us-gaap:AllOtherSegmentsMember2019-06-290000096021syy:U.S.FoodserviceOperationsMember2020-06-270000096021syy:InternationalFoodserviceOperationsMember2020-06-270000096021syy:SygmaSegmentMember2020-06-270000096021us-gaap:AllOtherSegmentsMember2020-06-270000096021syy:U.S.FoodserviceOperationsMember2021-07-030000096021syy:InternationalFoodserviceOperationsMember2021-07-030000096021syy:SygmaSegmentMember2021-07-030000096021us-gaap:AllOtherSegmentsMember2021-07-030000096021us-gaap:CustomerRelationshipsMember2021-07-030000096021us-gaap:CustomerRelationshipsMember2020-06-270000096021us-gaap:NoncompeteAgreementsMember2021-07-030000096021us-gaap:NoncompeteAgreementsMember2020-06-270000096021us-gaap:TrademarksMember2021-07-030000096021us-gaap:TrademarksMember2020-06-270000096021us-gaap:TrademarksMember2021-07-030000096021us-gaap:TrademarksMember2020-06-270000096021us-gaap:LicensingAgreementsMember2021-07-030000096021us-gaap:LicensingAgreementsMember2020-06-270000096021syy:SeniorNotes2.60Due2021Member2021-07-030000096021syy:SeniorNotes250Due2021Member2021-07-030000096021us-gaap:SeniorNotesMembersyy:SeniorNotes2.60Due2021Member2021-07-030000096021us-gaap:SeniorNotesMembersyy:SeniorNotes250Due2021Member2021-07-030000096021us-gaap:CrossCurrencyInterestRateContractMember2020-09-26iso4217:EUR0000096021syy:InterestRateSwapDueJune2023Member2021-07-030000096021syy:InterestRateSwapMarch2025Member2021-07-03iso4217:SEK0000096021syy:ForeignCurrencyInterestRateVariousMaturityDatesMember2021-07-03iso4217:GBP0000096021syy:ForeignCurrencyInterestRateEuroMaturingJune2023Member2021-07-03utr:gal0000096021us-gaap:EnergyRelatedDerivativeMember2020-06-282021-07-030000096021us-gaap:OtherCurrentAssetsMemberus-gaap:DesignatedAsHedgingInstrumentMemberus-gaap:InterestRateSwapMemberus-gaap:FairValueHedgingMember2021-07-030000096021us-gaap:OtherCurrentAssetsMemberus-gaap:DesignatedAsHedgingInstrumentMemberus-gaap:InterestRateSwapMemberus-gaap:FairValueHedgingMember2020-06-270000096021us-gaap:DesignatedAsHedgingInstrumentMemberus-gaap:OtherAssetsMemberus-gaap:InterestRateSwapMemberus-gaap:FairValueHedgingMember2021-07-030000096021us-gaap:DesignatedAsHedgingInstrumentMemberus-gaap:OtherAssetsMemberus-gaap:InterestRateSwapMemberus-gaap:FairValueHedgingMember2020-06-270000096021us-gaap:OtherCurrentAssetsMemberus-gaap:DesignatedAsHedgingInstrumentMemberus-gaap:CashFlowHedgingMemberus-gaap:EnergyRelatedDerivativeMember2021-07-030000096021us-gaap:OtherCurrentAssetsMemberus-gaap:DesignatedAsHedgingInstrumentMemberus-gaap:CashFlowHedgingMemberus-gaap:EnergyRelatedDerivativeMember2020-06-270000096021us-gaap:OtherCurrentAssetsMemberus-gaap:DesignatedAsHedgingInstrumentMemberus-gaap:ForeignExchangeForwardMemberus-gaap:CashFlowHedgingMember2021-07-030000096021us-gaap:OtherCurrentAssetsMemberus-gaap:DesignatedAsHedgingInstrumentMemberus-gaap:ForeignExchangeForwardMemberus-gaap:CashFlowHedgingMember2020-06-270000096021us-gaap:DesignatedAsHedgingInstrumentMemberus-gaap:OtherAssetsMemberus-gaap:CashFlowHedgingMemberus-gaap:EnergyRelatedDerivativeMember2021-07-030000096021us-gaap:DesignatedAsHedgingInstrumentMemberus-gaap:OtherAssetsMemberus-gaap:CashFlowHedgingMemberus-gaap:EnergyRelatedDerivativeMember2020-06-270000096021us-gaap:DesignatedAsHedgingInstrumentMemberus-gaap:OtherAssetsMemberus-gaap:CashFlowHedgingMemberus-gaap:CrossCurrencyInterestRateContractMember2021-07-030000096021us-gaap:DesignatedAsHedgingInstrumentMemberus-gaap:OtherAssetsMemberus-gaap:CashFlowHedgingMemberus-gaap:CrossCurrencyInterestRateContractMember2020-06-270000096021us-gaap:DesignatedAsHedgingInstrumentMemberus-gaap:OtherCurrentLiabilitiesMemberus-gaap:CashFlowHedgingMemberus-gaap:EnergyRelatedDerivativeMember2021-07-030000096021us-gaap:DesignatedAsHedgingInstrumentMemberus-gaap:OtherCurrentLiabilitiesMemberus-gaap:CashFlowHedgingMemberus-gaap:EnergyRelatedDerivativeMember2020-06-270000096021us-gaap:DesignatedAsHedgingInstrumentMemberus-gaap:ForeignExchangeForwardMemberus-gaap:OtherCurrentLiabilitiesMemberus-gaap:CashFlowHedgingMember2021-07-030000096021us-gaap:DesignatedAsHedgingInstrumentMemberus-gaap:ForeignExchangeForwardMemberus-gaap:OtherCurrentLiabilitiesMemberus-gaap:CashFlowHedgingMember2020-06-270000096021us-gaap:InterestExpenseMemberus-gaap:DesignatedAsHedgingInstrumentMemberus-gaap:InterestRateSwapMemberus-gaap:FairValueHedgingMember2020-06-282021-07-030000096021us-gaap:InterestExpenseMemberus-gaap:DesignatedAsHedgingInstrumentMemberus-gaap:InterestRateSwapMemberus-gaap:FairValueHedgingMember2019-06-302020-06-270000096021us-gaap:DesignatedAsHedgingInstrumentMemberus-gaap:CashFlowHedgingMemberus-gaap:EnergyRelatedDerivativeMember2020-06-282021-07-030000096021us-gaap:DesignatedAsHedgingInstrumentMemberus-gaap:OperatingIncomeLossMemberus-gaap:CashFlowHedgingMemberus-gaap:EnergyRelatedDerivativeMember2020-06-282021-07-030000096021us-gaap:DesignatedAsHedgingInstrumentMemberus-gaap:CashFlowHedgingMemberus-gaap:CurrencySwapMember2020-06-282021-07-030000096021us-gaap:DesignatedAsHedgingInstrumentMemberus-gaap:CashFlowHedgingMemberus-gaap:CurrencySwapMemberus-gaap:CostOfSalesMember2020-06-282021-07-030000096021us-gaap:DesignatedAsHedgingInstrumentMemberus-gaap:CashFlowHedgingMember2020-06-282021-07-030000096021us-gaap:ForeignExchangeContractMemberus-gaap:DesignatedAsHedgingInstrumentMemberus-gaap:NetInvestmentHedgingMember2020-06-282021-07-030000096021us-gaap:DesignatedAsHedgingInstrumentMemberus-gaap:NetInvestmentHedgingMember2020-06-282021-07-030000096021us-gaap:DesignatedAsHedgingInstrumentMemberus-gaap:CashFlowHedgingMemberus-gaap:EnergyRelatedDerivativeMember2019-06-302020-06-270000096021us-gaap:DesignatedAsHedgingInstrumentMemberus-gaap:OperatingIncomeLossMemberus-gaap:CashFlowHedgingMemberus-gaap:EnergyRelatedDerivativeMember2019-06-302020-06-270000096021us-gaap:DesignatedAsHedgingInstrumentMemberus-gaap:CashFlowHedgingMemberus-gaap:CurrencySwapMember2019-06-302020-06-270000096021us-gaap:DesignatedAsHedgingInstrumentMemberus-gaap:CashFlowHedgingMemberus-gaap:CurrencySwapMemberus-gaap:CostOfSalesMember2019-06-302020-06-270000096021us-gaap:DesignatedAsHedgingInstrumentMemberus-gaap:CashFlowHedgingMember2019-06-302020-06-270000096021us-gaap:DesignatedAsHedgingInstrumentMemberus-gaap:CurrencySwapMemberus-gaap:NetInvestmentHedgingMember2019-06-302020-06-270000096021us-gaap:ForeignExchangeContractMemberus-gaap:DesignatedAsHedgingInstrumentMemberus-gaap:NetInvestmentHedgingMember2019-06-302020-06-270000096021us-gaap:DesignatedAsHedgingInstrumentMemberus-gaap:NetInvestmentHedgingMember2019-06-302020-06-270000096021us-gaap:LongTermDebtMember2021-07-030000096021syy:CurrentMaturitiesOfLongtermDebtMember2020-06-270000096021us-gaap:LongTermDebtMember2020-06-270000096021us-gaap:InsuranceRelatedAssessmentsMember2020-06-270000096021us-gaap:InsuranceRelatedAssessmentsMember2019-06-290000096021us-gaap:InsuranceRelatedAssessmentsMember2018-06-300000096021us-gaap:InsuranceRelatedAssessmentsMember2020-06-282021-07-030000096021us-gaap:InsuranceRelatedAssessmentsMember2019-06-302020-06-270000096021us-gaap:InsuranceRelatedAssessmentsMember2018-07-012019-06-290000096021us-gaap:InsuranceRelatedAssessmentsMember2021-07-030000096021us-gaap:CommercialPaperMembersyy:CommercialPaper0454Member2021-07-030000096021us-gaap:CommercialPaperMembersyy:CommercialPaper0454Member2020-06-270000096021us-gaap:SeniorNotesMembersyy:SeniorNotes2.60Due2021Member2021-07-030000096021us-gaap:SeniorNotesMembersyy:SeniorNotes2.60Due2021Member2020-06-270000096021us-gaap:SeniorNotesMembersyy:SeniorNotes2.50Due2022Member2021-07-030000096021us-gaap:SeniorNotesMembersyy:SeniorNotes2.50Due2022Member2020-06-270000096021syy:SeniorNotes2.60Due2022Memberus-gaap:SeniorNotesMember2021-07-030000096021syy:SeniorNotes2.60Due2022Memberus-gaap:SeniorNotesMember2020-06-270000096021us-gaap:SeniorNotesMembersyy:SeniorNotes1.25Due2023Member2021-07-030000096021us-gaap:SeniorNotesMembersyy:SeniorNotes1.25Due2023Member2020-06-270000096021us-gaap:SeniorNotesMembersyy:SeniorNotes3.55Due2025Member2021-07-030000096021us-gaap:SeniorNotesMembersyy:SeniorNotes3.55Due2025Member2020-06-270000096021us-gaap:SeniorNotesMembersyy:SeniorNotes3.65Due2025Member2021-07-030000096021us-gaap:SeniorNotesMembersyy:SeniorNotes3.65Due2025Member2020-06-270000096021us-gaap:SeniorNotesMembersyy:SeniorNotes565Due2025Member2021-07-030000096021us-gaap:SeniorNotesMembersyy:SeniorNotes565Due2025Member2020-06-270000096021syy:SeniorNotes3.75Due2026Memberus-gaap:SeniorNotesMember2021-07-030000096021syy:SeniorNotes3.75Due2026Memberus-gaap:SeniorNotesMember2020-06-270000096021us-gaap:SeniorNotesMembersyy:SeniorNotes3.30Due2027Member2021-07-030000096021us-gaap:SeniorNotesMembersyy:SeniorNotes3.30Due2027Member2020-06-270000096021us-gaap:DebenturesSubjectToMandatoryRedemptionMembersyy:Debentures7.16Due2027Member2021-07-030000096021us-gaap:DebenturesSubjectToMandatoryRedemptionMembersyy:Debentures7.16Due2027Member2020-06-270000096021syy:SeniorNotes3.25Due2028Memberus-gaap:SeniorNotesMember2021-07-030000096021syy:SeniorNotes3.25Due2028Memberus-gaap:SeniorNotesMember2020-06-270000096021syy:Debentures6.50Due2029Memberus-gaap:DebenturesSubjectToMandatoryRedemptionMember2021-07-030000096021syy:Debentures6.50Due2029Memberus-gaap:DebenturesSubjectToMandatoryRedemptionMember2020-06-270000096021us-gaap:SeniorNotesMembersyy:SeniorNotes240Due2030Member2021-07-030000096021us-gaap:SeniorNotesMembersyy:SeniorNotes240Due2030Member2020-06-270000096021us-gaap:SeniorNotesMembersyy:SeniorNotes595Due2030Member2021-07-030000096021us-gaap:SeniorNotesMembersyy:SeniorNotes595Due2030Member2020-06-270000096021us-gaap:SeniorNotesMembersyy:SeniorNotes5.375Due2036Member2021-07-030000096021us-gaap:SeniorNotesMembersyy:SeniorNotes5.375Due2036Member2020-06-270000096021us-gaap:SeniorNotesMembersyy:SeniorNotes6.625Due2039Member2021-07-030000096021us-gaap:SeniorNotesMembersyy:SeniorNotes6.625Due2039Member2020-06-270000096021us-gaap:SeniorNotesMembersyy:SeniorNotes660Due2040Member2021-07-030000096021us-gaap:SeniorNotesMembersyy:SeniorNotes660Due2040Member2020-06-270000096021us-gaap:SeniorNotesMembersyy:SeniorNotes4.85Due2046Member2021-07-030000096021us-gaap:SeniorNotesMembersyy:SeniorNotes4.85Due2046Member2020-06-270000096021us-gaap:SeniorNotesMembersyy:SeniorNotes4.50DueApril2046Member2021-07-030000096021us-gaap:SeniorNotesMembersyy:SeniorNotes4.50DueApril2046Member2020-06-270000096021us-gaap:SeniorNotesMembersyy:SeniorNotes4.45Due2048Member2021-07-030000096021us-gaap:SeniorNotesMembersyy:SeniorNotes4.45Due2048Member2020-06-270000096021syy:SeniorNotes660Due2050Memberus-gaap:SeniorNotesMember2021-07-030000096021syy:SeniorNotes660Due2050Memberus-gaap:SeniorNotesMember2020-06-270000096021syy:SeniorNotes330Due2050Memberus-gaap:SeniorNotesMember2021-07-030000096021syy:SeniorNotes330Due2050Memberus-gaap:SeniorNotesMember2020-06-270000096021us-gaap:LineOfCreditMember2021-07-030000096021us-gaap:LineOfCreditMember2020-06-270000096021syy:CapitalLeasesAndOtherDebtMember2021-07-030000096021syy:CapitalLeasesAndOtherDebtMember2020-06-270000096021us-gaap:RevolvingCreditFacilityMemberus-gaap:LineOfCreditMember2021-07-0300000960212021-03-310000096021us-gaap:LineOfCreditMember2021-05-202021-05-200000096021us-gaap:CommercialPaperMember2021-07-030000096021us-gaap:CommercialPaperMembersyy:CommercialPaper0454Member2020-05-040000096021us-gaap:LineOfCreditMember2020-05-202020-05-200000096021us-gaap:LineOfCreditMember2020-05-200000096021us-gaap:SeniorNotesMember2021-03-282021-07-030000096021us-gaap:SeniorNotesMembersyy:Debentures7.16Due2027Member2021-07-030000096021us-gaap:SeniorNotesMembersyy:Debentures65Due2028Member2021-07-030000096021us-gaap:SeniorNotesMembersyy:SeniorNotesDue2030Member2021-07-030000096021syy:SeniorNotesDue2040Memberus-gaap:SeniorNotesMember2021-07-030000096021syy:SeniorNotesDue2050Memberus-gaap:SeniorNotesMember2021-07-030000096021us-gaap:InterestExpenseMemberus-gaap:SeniorNotesMember2021-03-282021-07-030000096021us-gaap:SeniorNotesMember2020-06-282021-07-030000096021us-gaap:SeniorNotesMembersyy:SeniorNotesInterestAt7160MaturingInFiscal2027Member2021-07-030000096021us-gaap:SeniorNotesMembersyy:SeniorNotesInterestAt7160MaturingInFiscal2027Member2020-06-282021-07-030000096021us-gaap:SeniorNotesMembersyy:SeniorNotesInterestAt6500MaturingInFiscal2028Member2021-07-030000096021us-gaap:SeniorNotesMembersyy:SeniorNotesInterestAt6500MaturingInFiscal2028Member2020-06-282021-07-030000096021us-gaap:SeniorNotesMembersyy:SeniorNotes595Due2030Member2020-06-282021-07-030000096021us-gaap:SeniorNotesMembersyy:SeniorNotesInterestAt6625MaturingInFiscal2039Member2021-07-030000096021us-gaap:SeniorNotesMembersyy:SeniorNotesInterestAt6625MaturingInFiscal2039Member2020-06-282021-07-030000096021us-gaap:SeniorNotesMembersyy:SeniorNotes660Due2040Member2020-06-282021-07-030000096021syy:SeniorNotes660Due2050Memberus-gaap:SeniorNotesMember2020-06-282021-07-030000096021us-gaap:SeniorNotesMembersyy:SeniorNotes2.60Due2021Member2020-09-012020-09-300000096021us-gaap:SeniorNotesMembersyy:SeniorNotes2.60Due2021Member2020-09-300000096021syy:SeniorNotes250Due2021Memberus-gaap:SeniorNotesMember2021-06-012021-06-300000096021syy:SeniorNotes250Due2021Memberus-gaap:SeniorNotesMember2021-06-300000096021syy:SafeHarbor401kPlanMember2020-06-282021-07-030000096021syy:SafeHarbor401kPlanNonAdoptingUnionsMember2020-06-282021-07-030000096021syy:ManagementSavingsPlanMember2020-06-282021-07-030000096021syy:ManagementSavingsPlanMember2021-07-030000096021syy:ManagementSavingsPlanMember2020-06-270000096021us-gaap:OtherPostretirementBenefitPlansDefinedBenefitMember2021-07-030000096021us-gaap:OtherPostretirementBenefitPlansDefinedBenefitMember2020-06-270000096021syy:PensionPlanandSupplementalEmployeeRetirementPlanMembercountry:US2020-06-270000096021syy:PensionPlanandSupplementalEmployeeRetirementPlanMembercountry:US2019-06-290000096021us-gaap:ForeignPlanMemberus-gaap:PensionPlansDefinedBenefitMember2020-06-270000096021us-gaap:ForeignPlanMemberus-gaap:PensionPlansDefinedBenefitMember2019-06-290000096021syy:PensionPlanandSupplementalEmployeeRetirementPlanMembercountry:US2020-06-282021-07-030000096021syy:PensionPlanandSupplementalEmployeeRetirementPlanMembercountry:US2019-06-302020-06-270000096021us-gaap:ForeignPlanMemberus-gaap:PensionPlansDefinedBenefitMember2020-06-282021-07-030000096021us-gaap:ForeignPlanMemberus-gaap:PensionPlansDefinedBenefitMember2019-06-302020-06-270000096021syy:PensionPlanandSupplementalEmployeeRetirementPlanMembercountry:US2021-07-030000096021us-gaap:ForeignPlanMemberus-gaap:PensionPlansDefinedBenefitMember2021-07-030000096021us-gaap:SupplementalEmployeeRetirementPlanDefinedBenefitMember2021-07-030000096021us-gaap:SupplementalEmployeeRetirementPlanDefinedBenefitMember2020-06-270000096021country:USus-gaap:PensionPlansDefinedBenefitMember2021-07-030000096021country:USus-gaap:PensionPlansDefinedBenefitMember2020-06-270000096021country:USus-gaap:PensionPlansDefinedBenefitMember2020-06-282021-07-030000096021country:USus-gaap:PensionPlansDefinedBenefitMember2019-06-302020-06-270000096021country:USus-gaap:PensionPlansDefinedBenefitMember2018-07-012019-06-290000096021us-gaap:ForeignPlanMemberus-gaap:PensionPlansDefinedBenefitMember2018-07-012019-06-290000096021us-gaap:PensionPlansDefinedBenefitMember2020-06-282021-07-030000096021us-gaap:PensionPlansDefinedBenefitMember2019-06-302020-06-270000096021country:GBus-gaap:PensionPlansDefinedBenefitMember2021-07-030000096021country:GBus-gaap:PensionPlansDefinedBenefitMember2020-06-270000096021us-gaap:SupplementalEmployeeRetirementPlanDefinedBenefitMember2020-06-282021-07-030000096021us-gaap:SupplementalEmployeeRetirementPlanDefinedBenefitMember2019-06-302020-06-270000096021us-gaap:SupplementalEmployeeRetirementPlanDefinedBenefitMember2018-07-012019-06-290000096021country:GBus-gaap:PensionPlansDefinedBenefitMember2020-06-282021-07-030000096021country:GBus-gaap:PensionPlansDefinedBenefitMember2019-06-302020-06-270000096021country:GBus-gaap:PensionPlansDefinedBenefitMember2018-07-012019-06-290000096021syy:GrowthAssetsMembercountry:USus-gaap:PensionPlansDefinedBenefitMember2021-07-030000096021country:USus-gaap:PensionPlansDefinedBenefitMemberus-gaap:DefinedBenefitPlanDerivativeMember2021-07-030000096021country:GBsyy:CommonContractualFundMemberus-gaap:PensionPlansDefinedBenefitMember2021-07-030000096021country:GBus-gaap:PensionPlansDefinedBenefitMemberus-gaap:DefinedBenefitPlanDerivativeMember2021-07-030000096021country:GBsrt:ScenarioForecastMembersyy:CommonContractualFundMemberus-gaap:PensionPlansDefinedBenefitMember2022-07-020000096021country:GBsrt:ScenarioForecastMemberus-gaap:PensionPlansDefinedBenefitMemberus-gaap:DefinedBenefitPlanDerivativeMember2022-07-020000096021country:USus-gaap:DefinedBenefitPlanCashAndCashEquivalentsMemberus-gaap:FairValueInputsLevel1Memberus-gaap:PensionPlansDefinedBenefitMember2021-07-030000096021us-gaap:FairValueInputsLevel2Membercountry:USus-gaap:DefinedBenefitPlanCashAndCashEquivalentsMemberus-gaap:PensionPlansDefinedBenefitMember2021-07-030000096021us-gaap:FairValueInputsLevel3Membercountry:USus-gaap:DefinedBenefitPlanCashAndCashEquivalentsMemberus-gaap:PensionPlansDefinedBenefitMember2021-07-030000096021country:USus-gaap:FairValueMeasuredAtNetAssetValuePerShareMemberus-gaap:DefinedBenefitPlanCashAndCashEquivalentsMemberus-gaap:PensionPlansDefinedBenefitMember2021-07-030000096021country:USus-gaap:DefinedBenefitPlanCashAndCashEquivalentsMemberus-gaap:PensionPlansDefinedBenefitMember2021-07-030000096021country:USus-gaap:DefinedBenefitPlanEquitySecuritiesUsMemberus-gaap:FairValueInputsLevel1Memberus-gaap:PensionPlansDefinedBenefitMember2021-07-030000096021us-gaap:FairValueInputsLevel2Membercountry:USus-gaap:DefinedBenefitPlanEquitySecuritiesUsMemberus-gaap:PensionPlansDefinedBenefitMember2021-07-030000096021us-gaap:FairValueInputsLevel3Membercountry:USus-gaap:DefinedBenefitPlanEquitySecuritiesUsMemberus-gaap:PensionPlansDefinedBenefitMember2021-07-030000096021country:USus-gaap:DefinedBenefitPlanEquitySecuritiesUsMemberus-gaap:FairValueMeasuredAtNetAssetValuePerShareMemberus-gaap:PensionPlansDefinedBenefitMember2021-07-030000096021country:USus-gaap:DefinedBenefitPlanEquitySecuritiesUsMemberus-gaap:PensionPlansDefinedBenefitMember2021-07-030000096021us-gaap:DefinedBenefitPlanEquitySecuritiesNonUsMembercountry:USus-gaap:FairValueInputsLevel1Memberus-gaap:PensionPlansDefinedBenefitMember2021-07-030000096021us-gaap:FairValueInputsLevel2Memberus-gaap:DefinedBenefitPlanEquitySecuritiesNonUsMembercountry:USus-gaap:PensionPlansDefinedBenefitMember2021-07-030000096021us-gaap:DefinedBenefitPlanEquitySecuritiesNonUsMemberus-gaap:FairValueInputsLevel3Membercountry:USus-gaap:PensionPlansDefinedBenefitMember2021-07-030000096021us-gaap:DefinedBenefitPlanEquitySecuritiesNonUsMembercountry:USus-gaap:FairValueMeasuredAtNetAssetValuePerShareMemberus-gaap:PensionPlansDefinedBenefitMember2021-07-030000096021us-gaap:DefinedBenefitPlanEquitySecuritiesNonUsMembercountry:USus-gaap:PensionPlansDefinedBenefitMember2021-07-030000096021us-gaap:HedgeFundsMembercountry:USus-gaap:FairValueInputsLevel1Memberus-gaap:PensionPlansDefinedBenefitMember2021-07-030000096021us-gaap:FairValueInputsLevel2Memberus-gaap:HedgeFundsMembercountry:USus-gaap:PensionPlansDefinedBenefitMember2021-07-030000096021us-gaap:HedgeFundsMemberus-gaap:FairValueInputsLevel3Membercountry:USus-gaap:PensionPlansDefinedBenefitMember2021-07-030000096021us-gaap:HedgeFundsMembercountry:USus-gaap:FairValueMeasuredAtNetAssetValuePerShareMemberus-gaap:PensionPlansDefinedBenefitMember2021-07-030000096021us-gaap:HedgeFundsMembercountry:USus-gaap:PensionPlansDefinedBenefitMember2021-07-030000096021country:USus-gaap:DefinedBenefitPlanRealEstateMemberus-gaap:FairValueInputsLevel1Memberus-gaap:PensionPlansDefinedBenefitMember2021-07-030000096021us-gaap:FairValueInputsLevel2Membercountry:USus-gaap:DefinedBenefitPlanRealEstateMemberus-gaap:PensionPlansDefinedBenefitMember2021-07-030000096021us-gaap:FairValueInputsLevel3Membercountry:USus-gaap:DefinedBenefitPlanRealEstateMemberus-gaap:PensionPlansDefinedBenefitMember2021-07-030000096021country:USus-gaap:FairValueMeasuredAtNetAssetValuePerShareMemberus-gaap:DefinedBenefitPlanRealEstateMemberus-gaap:PensionPlansDefinedBenefitMember2021-07-030000096021country:USus-gaap:DefinedBenefitPlanRealEstateMemberus-gaap:PensionPlansDefinedBenefitMember2021-07-030000096021country:USus-gaap:PrivateEquityFundsMemberus-gaap:FairValueInputsLevel1Memberus-gaap:PensionPlansDefinedBenefitMember2021-07-030000096021us-gaap:FairValueInputsLevel2Membercountry:USus-gaap:PrivateEquityFundsMemberus-gaap:PensionPlansDefinedBenefitMember2021-07-030000096021us-gaap:FairValueInputsLevel3Membercountry:USus-gaap:PrivateEquityFundsMemberus-gaap:PensionPlansDefinedBenefitMember2021-07-030000096021country:USus-gaap:FairValueMeasuredAtNetAssetValuePerShareMemberus-gaap:PrivateEquityFundsMemberus-gaap:PensionPlansDefinedBenefitMember2021-07-030000096021country:USus-gaap:PrivateEquityFundsMemberus-gaap:PensionPlansDefinedBenefitMember2021-07-030000096021country:USus-gaap:CorporateDebtSecuritiesMemberus-gaap:FairValueInputsLevel1Memberus-gaap:PensionPlansDefinedBenefitMember2021-07-030000096021us-gaap:FairValueInputsLevel2Membercountry:USus-gaap:CorporateDebtSecuritiesMemberus-gaap:PensionPlansDefinedBenefitMember2021-07-030000096021us-gaap:FairValueInputsLevel3Membercountry:USus-gaap:CorporateDebtSecuritiesMemberus-gaap:PensionPlansDefinedBenefitMember2021-07-030000096021country:USus-gaap:FairValueMeasuredAtNetAssetValuePerShareMemberus-gaap:CorporateDebtSecuritiesMemberus-gaap:PensionPlansDefinedBenefitMember2021-07-030000096021country:USus-gaap:CorporateDebtSecuritiesMemberus-gaap:PensionPlansDefinedBenefitMember2021-07-030000096021us-gaap:USTreasuryAndGovernmentMembercountry:USus-gaap:FairValueInputsLevel1Memberus-gaap:PensionPlansDefinedBenefitMember2021-07-030000096021us-gaap:FairValueInputsLevel2Memberus-gaap:USTreasuryAndGovernmentMembercountry:USus-gaap:PensionPlansDefinedBenefitMember2021-07-030000096021us-gaap:USTreasuryAndGovernmentMemberus-gaap:FairValueInputsLevel3Membercountry:USus-gaap:PensionPlansDefinedBenefitMember2021-07-030000096021us-gaap:USTreasuryAndGovernmentMembercountry:USus-gaap:FairValueMeasuredAtNetAssetValuePerShareMemberus-gaap:PensionPlansDefinedBenefitMember2021-07-030000096021us-gaap:USTreasuryAndGovernmentMembercountry:USus-gaap:PensionPlansDefinedBenefitMember2021-07-030000096021us-gaap:OtherDebtSecuritiesMembercountry:USus-gaap:FairValueInputsLevel1Memberus-gaap:PensionPlansDefinedBenefitMember2021-07-030000096021us-gaap:FairValueInputsLevel2Memberus-gaap:OtherDebtSecuritiesMembercountry:USus-gaap:PensionPlansDefinedBenefitMember2021-07-030000096021us-gaap:OtherDebtSecuritiesMemberus-gaap:FairValueInputsLevel3Membercountry:USus-gaap:PensionPlansDefinedBenefitMember2021-07-030000096021us-gaap:OtherDebtSecuritiesMembercountry:USus-gaap:FairValueMeasuredAtNetAssetValuePerShareMemberus-gaap:PensionPlansDefinedBenefitMember2021-07-030000096021us-gaap:OtherDebtSecuritiesMembercountry:USus-gaap:PensionPlansDefinedBenefitMember2021-07-030000096021country:USus-gaap:FairValueInputsLevel1Memberus-gaap:PensionPlansDefinedBenefitMember2021-07-030000096021us-gaap:FairValueInputsLevel2Membercountry:USus-gaap:PensionPlansDefinedBenefitMember2021-07-030000096021us-gaap:FairValueInputsLevel3Membercountry:USus-gaap:PensionPlansDefinedBenefitMember2021-07-030000096021country:USus-gaap:FairValueMeasuredAtNetAssetValuePerShareMemberus-gaap:PensionPlansDefinedBenefitMember2021-07-030000096021country:USus-gaap:DefinedBenefitPlanEquitySecuritiesMemberus-gaap:PensionPlansDefinedBenefitMember2021-07-030000096021country:GBus-gaap:DefinedBenefitPlanCashAndCashEquivalentsMemberus-gaap:FairValueInputsLevel1Memberus-gaap:PensionPlansDefinedBenefitMember2021-07-030000096021us-gaap:FairValueInputsLevel2Membercountry:GBus-gaap:DefinedBenefitPlanCashAndCashEquivalentsMemberus-gaap:PensionPlansDefinedBenefitMember2021-07-030000096021country:GBus-gaap:FairValueInputsLevel3Memberus-gaap:DefinedBenefitPlanCashAndCashEquivalentsMemberus-gaap:PensionPlansDefinedBenefitMember2021-07-030000096021country:GBus-gaap:FairValueMeasuredAtNetAssetValuePerShareMemberus-gaap:DefinedBenefitPlanCashAndCashEquivalentsMemberus-gaap:PensionPlansDefinedBenefitMember2021-07-030000096021country:GBus-gaap:DefinedBenefitPlanCashAndCashEquivalentsMemberus-gaap:PensionPlansDefinedBenefitMember2021-07-030000096021syy:UKTreasurySecuritiesMembercountry:GBus-gaap:FairValueInputsLevel1Memberus-gaap:PensionPlansDefinedBenefitMember2021-07-030000096021syy:UKTreasurySecuritiesMemberus-gaap:FairValueInputsLevel2Membercountry:GBus-gaap:PensionPlansDefinedBenefitMember2021-07-030000096021syy:UKTreasurySecuritiesMembercountry:GBus-gaap:FairValueInputsLevel3Memberus-gaap:PensionPlansDefinedBenefitMember2021-07-030000096021syy:UKTreasurySecuritiesMembercountry:GBus-gaap:FairValueMeasuredAtNetAssetValuePerShareMemberus-gaap:PensionPlansDefinedBenefitMember2021-07-030000096021syy:UKTreasurySecuritiesMembercountry:GBus-gaap:PensionPlansDefinedBenefitMember2021-07-030000096021country:GBus-gaap:FairValueInputsLevel1Memberus-gaap:PensionPlansDefinedBenefitMemberus-gaap:DefinedBenefitPlanDerivativeMember2021-07-030000096021us-gaap:FairValueInputsLevel2Membercountry:GBus-gaap:PensionPlansDefinedBenefitMemberus-gaap:DefinedBenefitPlanDerivativeMember2021-07-030000096021country:GBus-gaap:FairValueInputsLevel3Memberus-gaap:PensionPlansDefinedBenefitMemberus-gaap:DefinedBenefitPlanDerivativeMember2021-07-030000096021country:GBus-gaap:FairValueMeasuredAtNetAssetValuePerShareMemberus-gaap:PensionPlansDefinedBenefitMemberus-gaap:DefinedBenefitPlanDerivativeMember2021-07-030000096021country:GBsyy:CommonContractualFundMemberus-gaap:FairValueInputsLevel1Memberus-gaap:PensionPlansDefinedBenefitMember2021-07-030000096021us-gaap:FairValueInputsLevel2Membercountry:GBsyy:CommonContractualFundMemberus-gaap:PensionPlansDefinedBenefitMember2021-07-030000096021country:GBus-gaap:FairValueInputsLevel3Membersyy:CommonContractualFundMemberus-gaap:PensionPlansDefinedBenefitMember2021-07-030000096021country:GBus-gaap:FairValueMeasuredAtNetAssetValuePerShareMembersyy:CommonContractualFundMemberus-gaap:PensionPlansDefinedBenefitMember2021-07-030000096021country:GBus-gaap:FairValueInputsLevel1Memberus-gaap:PensionPlansDefinedBenefitMember2021-07-030000096021us-gaap:FairValueInputsLevel2Membercountry:GBus-gaap:PensionPlansDefinedBenefitMember2021-07-030000096021country:GBus-gaap:FairValueInputsLevel3Memberus-gaap:PensionPlansDefinedBenefitMember2021-07-030000096021country:GBus-gaap:FairValueMeasuredAtNetAssetValuePerShareMemberus-gaap:PensionPlansDefinedBenefitMember2021-07-030000096021country:USus-gaap:DefinedBenefitPlanCashAndCashEquivalentsMemberus-gaap:FairValueInputsLevel1Memberus-gaap:PensionPlansDefinedBenefitMember2020-06-270000096021us-gaap:FairValueInputsLevel2Membercountry:USus-gaap:DefinedBenefitPlanCashAndCashEquivalentsMemberus-gaap:PensionPlansDefinedBenefitMember2020-06-270000096021us-gaap:FairValueInputsLevel3Membercountry:USus-gaap:DefinedBenefitPlanCashAndCashEquivalentsMemberus-gaap:PensionPlansDefinedBenefitMember2020-06-270000096021country:USus-gaap:FairValueMeasuredAtNetAssetValuePerShareMemberus-gaap:DefinedBenefitPlanCashAndCashEquivalentsMemberus-gaap:PensionPlansDefinedBenefitMember2020-06-270000096021country:USus-gaap:DefinedBenefitPlanCashAndCashEquivalentsMemberus-gaap:PensionPlansDefinedBenefitMember2020-06-270000096021country:USus-gaap:DefinedBenefitPlanEquitySecuritiesUsMemberus-gaap:FairValueInputsLevel1Memberus-gaap:PensionPlansDefinedBenefitMember2020-06-270000096021us-gaap:FairValueInputsLevel2Membercountry:USus-gaap:DefinedBenefitPlanEquitySecuritiesUsMemberus-gaap:PensionPlansDefinedBenefitMember2020-06-270000096021us-gaap:FairValueInputsLevel3Membercountry:USus-gaap:DefinedBenefitPlanEquitySecuritiesUsMemberus-gaap:PensionPlansDefinedBenefitMember2020-06-270000096021country:USus-gaap:DefinedBenefitPlanEquitySecuritiesUsMemberus-gaap:FairValueMeasuredAtNetAssetValuePerShareMemberus-gaap:PensionPlansDefinedBenefitMember2020-06-270000096021country:USus-gaap:DefinedBenefitPlanEquitySecuritiesUsMemberus-gaap:PensionPlansDefinedBenefitMember2020-06-270000096021us-gaap:DefinedBenefitPlanEquitySecuritiesNonUsMembercountry:USus-gaap:FairValueInputsLevel1Memberus-gaap:PensionPlansDefinedBenefitMember2020-06-270000096021us-gaap:FairValueInputsLevel2Memberus-gaap:DefinedBenefitPlanEquitySecuritiesNonUsMembercountry:USus-gaap:PensionPlansDefinedBenefitMember2020-06-270000096021us-gaap:DefinedBenefitPlanEquitySecuritiesNonUsMemberus-gaap:FairValueInputsLevel3Membercountry:USus-gaap:PensionPlansDefinedBenefitMember2020-06-270000096021us-gaap:DefinedBenefitPlanEquitySecuritiesNonUsMembercountry:USus-gaap:FairValueMeasuredAtNetAssetValuePerShareMemberus-gaap:PensionPlansDefinedBenefitMember2020-06-270000096021us-gaap:DefinedBenefitPlanEquitySecuritiesNonUsMembercountry:USus-gaap:PensionPlansDefinedBenefitMember2020-06-270000096021us-gaap:HedgeFundsMembercountry:USus-gaap:FairValueInputsLevel1Memberus-gaap:PensionPlansDefinedBenefitMember2020-06-270000096021us-gaap:FairValueInputsLevel2Memberus-gaap:HedgeFundsMembercountry:USus-gaap:PensionPlansDefinedBenefitMember2020-06-270000096021us-gaap:HedgeFundsMemberus-gaap:FairValueInputsLevel3Membercountry:USus-gaap:PensionPlansDefinedBenefitMember2020-06-270000096021us-gaap:HedgeFundsMembercountry:USus-gaap:FairValueMeasuredAtNetAssetValuePerShareMemberus-gaap:PensionPlansDefinedBenefitMember2020-06-270000096021us-gaap:HedgeFundsMembercountry:USus-gaap:PensionPlansDefinedBenefitMember2020-06-270000096021country:USus-gaap:DefinedBenefitPlanRealEstateMemberus-gaap:FairValueInputsLevel1Memberus-gaap:PensionPlansDefinedBenefitMember2020-06-270000096021us-gaap:FairValueInputsLevel2Membercountry:USus-gaap:DefinedBenefitPlanRealEstateMemberus-gaap:PensionPlansDefinedBenefitMember2020-06-270000096021us-gaap:FairValueInputsLevel3Membercountry:USus-gaap:DefinedBenefitPlanRealEstateMemberus-gaap:PensionPlansDefinedBenefitMember2020-06-270000096021country:USus-gaap:FairValueMeasuredAtNetAssetValuePerShareMemberus-gaap:DefinedBenefitPlanRealEstateMemberus-gaap:PensionPlansDefinedBenefitMember2020-06-270000096021country:USus-gaap:DefinedBenefitPlanRealEstateMemberus-gaap:PensionPlansDefinedBenefitMember2020-06-270000096021country:USus-gaap:PrivateEquityFundsMemberus-gaap:FairValueInputsLevel1Memberus-gaap:PensionPlansDefinedBenefitMember2020-06-270000096021us-gaap:FairValueInputsLevel2Membercountry:USus-gaap:PrivateEquityFundsMemberus-gaap:PensionPlansDefinedBenefitMember2020-06-270000096021us-gaap:FairValueInputsLevel3Membercountry:USus-gaap:PrivateEquityFundsMemberus-gaap:PensionPlansDefinedBenefitMember2020-06-270000096021country:USus-gaap:FairValueMeasuredAtNetAssetValuePerShareMemberus-gaap:PrivateEquityFundsMemberus-gaap:PensionPlansDefinedBenefitMember2020-06-270000096021country:USus-gaap:PrivateEquityFundsMemberus-gaap:PensionPlansDefinedBenefitMember2020-06-270000096021country:USus-gaap:CorporateDebtSecuritiesMemberus-gaap:FairValueInputsLevel1Memberus-gaap:PensionPlansDefinedBenefitMember2020-06-270000096021us-gaap:FairValueInputsLevel2Membercountry:USus-gaap:CorporateDebtSecuritiesMemberus-gaap:PensionPlansDefinedBenefitMember2020-06-270000096021us-gaap:FairValueInputsLevel3Membercountry:USus-gaap:CorporateDebtSecuritiesMemberus-gaap:PensionPlansDefinedBenefitMember2020-06-270000096021country:USus-gaap:FairValueMeasuredAtNetAssetValuePerShareMemberus-gaap:CorporateDebtSecuritiesMemberus-gaap:PensionPlansDefinedBenefitMember2020-06-270000096021country:USus-gaap:CorporateDebtSecuritiesMemberus-gaap:PensionPlansDefinedBenefitMember2020-06-270000096021us-gaap:USTreasuryAndGovernmentMembercountry:USus-gaap:FairValueInputsLevel1Memberus-gaap:PensionPlansDefinedBenefitMember2020-06-270000096021us-gaap:FairValueInputsLevel2Memberus-gaap:USTreasuryAndGovernmentMembercountry:USus-gaap:PensionPlansDefinedBenefitMember2020-06-270000096021us-gaap:USTreasuryAndGovernmentMemberus-gaap:FairValueInputsLevel3Membercountry:USus-gaap:PensionPlansDefinedBenefitMember2020-06-270000096021us-gaap:USTreasuryAndGovernmentMembercountry:USus-gaap:FairValueMeasuredAtNetAssetValuePerShareMemberus-gaap:PensionPlansDefinedBenefitMember2020-06-270000096021us-gaap:USTreasuryAndGovernmentMembercountry:USus-gaap:PensionPlansDefinedBenefitMember2020-06-270000096021us-gaap:OtherDebtSecuritiesMembercountry:USus-gaap:FairValueInputsLevel1Memberus-gaap:PensionPlansDefinedBenefitMember2020-06-270000096021us-gaap:FairValueInputsLevel2Memberus-gaap:OtherDebtSecuritiesMembercountry:USus-gaap:PensionPlansDefinedBenefitMember2020-06-270000096021us-gaap:OtherDebtSecuritiesMemberus-gaap:FairValueInputsLevel3Membercountry:USus-gaap:PensionPlansDefinedBenefitMember2020-06-270000096021us-gaap:OtherDebtSecuritiesMembercountry:USus-gaap:FairValueMeasuredAtNetAssetValuePerShareMemberus-gaap:PensionPlansDefinedBenefitMember2020-06-270000096021us-gaap:OtherDebtSecuritiesMembercountry:USus-gaap:PensionPlansDefinedBenefitMember2020-06-270000096021country:USus-gaap:FairValueInputsLevel1Memberus-gaap:PensionPlansDefinedBenefitMember2020-06-270000096021us-gaap:FairValueInputsLevel2Membercountry:USus-gaap:PensionPlansDefinedBenefitMember2020-06-270000096021us-gaap:FairValueInputsLevel3Membercountry:USus-gaap:PensionPlansDefinedBenefitMember2020-06-270000096021country:USus-gaap:FairValueMeasuredAtNetAssetValuePerShareMemberus-gaap:PensionPlansDefinedBenefitMember2020-06-270000096021country:USus-gaap:DefinedBenefitPlanEquitySecuritiesMemberus-gaap:PensionPlansDefinedBenefitMember2020-06-270000096021country:GBus-gaap:DefinedBenefitPlanCashAndCashEquivalentsMemberus-gaap:FairValueInputsLevel1Memberus-gaap:PensionPlansDefinedBenefitMember2020-06-270000096021us-gaap:FairValueInputsLevel2Membercountry:GBus-gaap:DefinedBenefitPlanCashAndCashEquivalentsMemberus-gaap:PensionPlansDefinedBenefitMember2020-06-270000096021country:GBus-gaap:FairValueInputsLevel3Memberus-gaap:DefinedBenefitPlanCashAndCashEquivalentsMemberus-gaap:PensionPlansDefinedBenefitMember2020-06-270000096021country:GBus-gaap:FairValueMeasuredAtNetAssetValuePerShareMemberus-gaap:DefinedBenefitPlanCashAndCashEquivalentsMemberus-gaap:PensionPlansDefinedBenefitMember2020-06-270000096021country:GBus-gaap:DefinedBenefitPlanCashAndCashEquivalentsMemberus-gaap:PensionPlansDefinedBenefitMember2020-06-270000096021syy:UKTreasurySecuritiesMembercountry:GBus-gaap:FairValueInputsLevel1Memberus-gaap:PensionPlansDefinedBenefitMember2020-06-270000096021syy:UKTreasurySecuritiesMemberus-gaap:FairValueInputsLevel2Membercountry:GBus-gaap:PensionPlansDefinedBenefitMember2020-06-270000096021syy:UKTreasurySecuritiesMembercountry:GBus-gaap:FairValueInputsLevel3Memberus-gaap:PensionPlansDefinedBenefitMember2020-06-270000096021syy:UKTreasurySecuritiesMembercountry:GBus-gaap:FairValueMeasuredAtNetAssetValuePerShareMemberus-gaap:PensionPlansDefinedBenefitMember2020-06-270000096021syy:UKTreasurySecuritiesMembercountry:GBus-gaap:PensionPlansDefinedBenefitMember2020-06-270000096021country:GBus-gaap:FairValueInputsLevel1Memberus-gaap:PensionPlansDefinedBenefitMemberus-gaap:DefinedBenefitPlanDerivativeMember2020-06-270000096021us-gaap:FairValueInputsLevel2Membercountry:GBus-gaap:PensionPlansDefinedBenefitMemberus-gaap:DefinedBenefitPlanDerivativeMember2020-06-270000096021country:GBus-gaap:FairValueInputsLevel3Memberus-gaap:PensionPlansDefinedBenefitMemberus-gaap:DefinedBenefitPlanDerivativeMember2020-06-270000096021country:GBus-gaap:FairValueMeasuredAtNetAssetValuePerShareMemberus-gaap:PensionPlansDefinedBenefitMemberus-gaap:DefinedBenefitPlanDerivativeMember2020-06-270000096021country:GBus-gaap:PensionPlansDefinedBenefitMemberus-gaap:DefinedBenefitPlanDerivativeMember2020-06-270000096021country:GBsyy:CommonContractualFundMemberus-gaap:FairValueInputsLevel1Memberus-gaap:PensionPlansDefinedBenefitMember2020-06-270000096021us-gaap:FairValueInputsLevel2Membercountry:GBsyy:CommonContractualFundMemberus-gaap:PensionPlansDefinedBenefitMember2020-06-270000096021country:GBus-gaap:FairValueInputsLevel3Membersyy:CommonContractualFundMemberus-gaap:PensionPlansDefinedBenefitMember2020-06-270000096021country:GBus-gaap:FairValueMeasuredAtNetAssetValuePerShareMembersyy:CommonContractualFundMemberus-gaap:PensionPlansDefinedBenefitMember2020-06-270000096021country:GBsyy:CommonContractualFundMemberus-gaap:PensionPlansDefinedBenefitMember2020-06-270000096021country:GBus-gaap:FairValueInputsLevel1Memberus-gaap:PensionPlansDefinedBenefitMember2020-06-270000096021us-gaap:FairValueInputsLevel2Membercountry:GBus-gaap:PensionPlansDefinedBenefitMember2020-06-270000096021country:GBus-gaap:FairValueInputsLevel3Memberus-gaap:PensionPlansDefinedBenefitMember2020-06-270000096021country:GBus-gaap:FairValueMeasuredAtNetAssetValuePerShareMemberus-gaap:PensionPlansDefinedBenefitMember2020-06-27syy:plan0000096021syy:WesternConferenceOfTeamstersPensionPlanMember2020-06-282021-07-030000096021syy:WesternConferenceOfTeamstersPensionPlanMember2019-06-302020-06-27syy:agreement0000096021srt:MinimumMembersyy:WesternConferenceOfTeamstersPensionPlanMember2020-06-282021-07-030000096021srt:MaximumMembersyy:WesternConferenceOfTeamstersPensionPlanMember2020-06-282021-07-030000096021syy:WesternConferenceOfTeamstersPensionPlanMember2018-07-012019-06-290000096021us-gaap:EmployeeStockOptionMember2020-06-282021-07-030000096021us-gaap:EmployeeStockOptionMember2019-06-302020-06-270000096021us-gaap:EmployeeStockOptionMember2018-07-012019-06-290000096021us-gaap:AccumulatedDefinedBenefitPlansAdjustmentNetUnamortizedGainLossMember2020-06-282021-07-030000096021us-gaap:OtherExpenseMemberus-gaap:AccumulatedDefinedBenefitPlansAdjustmentNetPriorServiceCostCreditMember2020-06-282021-07-030000096021us-gaap:OtherExpenseMemberus-gaap:AccumulatedDefinedBenefitPlansAdjustmentNetUnamortizedGainLossMember2020-06-282021-07-030000096021us-gaap:AccumulatedDefinedBenefitPlansAdjustmentMemberus-gaap:OtherExpenseMember2020-06-282021-07-030000096021us-gaap:AccumulatedTranslationAdjustmentMember2020-06-282021-07-030000096021us-gaap:AccumulatedNetUnrealizedInvestmentGainLossMember2020-06-282021-07-030000096021us-gaap:AccumulatedGainLossNetCashFlowHedgeParentMemberus-gaap:OperatingExpenseMember2020-06-282021-07-030000096021syy:AccumulatedNetGainLossFromNetInvestmentHedgesAttributableToParentMember2020-06-282021-07-030000096021syy:AccumulatedNetGainLossFromCashFlowAndNetInvestmentHedgesAttributableToParentMember2020-06-282021-07-030000096021us-gaap:InterestExpenseMemberus-gaap:AccumulatedGainLossNetCashFlowHedgeParentMember2020-06-282021-07-030000096021us-gaap:AccumulatedDefinedBenefitPlansAdjustmentNetUnamortizedGainLossMember2019-06-302020-06-270000096021us-gaap:OtherExpenseMemberus-gaap:AccumulatedDefinedBenefitPlansAdjustmentNetPriorServiceCostCreditMember2019-06-302020-06-270000096021us-gaap:OtherExpenseMemberus-gaap:AccumulatedDefinedBenefitPlansAdjustmentNetUnamortizedGainLossMember2019-06-302020-06-270000096021us-gaap:AccumulatedDefinedBenefitPlansAdjustmentMemberus-gaap:OtherExpenseMember2019-06-302020-06-270000096021us-gaap:AccumulatedTranslationAdjustmentMember2019-06-302020-06-270000096021us-gaap:AccumulatedNetUnrealizedInvestmentGainLossMember2019-06-302020-06-270000096021us-gaap:AccumulatedGainLossNetCashFlowHedgeParentMemberus-gaap:OperatingExpenseMember2019-06-302020-06-270000096021syy:AccumulatedNetGainLossFromNetInvestmentHedgesAttributableToParentMember2019-06-302020-06-270000096021syy:AccumulatedNetGainLossFromCashFlowAndNetInvestmentHedgesAttributableToParentMember2019-06-302020-06-270000096021us-gaap:InterestExpenseMemberus-gaap:AccumulatedGainLossNetCashFlowHedgeParentMember2019-06-302020-06-270000096021us-gaap:AccumulatedDefinedBenefitPlansAdjustmentNetUnamortizedGainLossMember2018-07-012019-06-290000096021us-gaap:OperatingExpenseMemberus-gaap:AccumulatedDefinedBenefitPlansAdjustmentNetPriorServiceCostCreditMember2018-07-012019-06-290000096021us-gaap:OperatingExpenseMemberus-gaap:AccumulatedDefinedBenefitPlansAdjustmentNetUnamortizedGainLossMember2018-07-012019-06-290000096021us-gaap:AccumulatedDefinedBenefitPlansAdjustmentMemberus-gaap:OperatingExpenseMember2018-07-012019-06-290000096021us-gaap:AccumulatedTranslationAdjustmentMember2018-07-012019-06-290000096021us-gaap:AccumulatedNetUnrealizedInvestmentGainLossMember2018-07-012019-06-290000096021us-gaap:AccumulatedGainLossNetCashFlowHedgeParentMember2018-07-012019-06-290000096021syy:AccumulatedNetGainLossFromNetInvestmentHedgesAttributableToParentMember2018-07-012019-06-290000096021syy:AccumulatedNetGainLossFromCashFlowAndNetInvestmentHedgesAttributableToParentMember2018-07-012019-06-290000096021us-gaap:InterestExpenseMemberus-gaap:AccumulatedGainLossNetCashFlowHedgeParentMember2018-07-012019-06-290000096021us-gaap:AccumulatedDefinedBenefitPlansAdjustmentMember2018-06-300000096021us-gaap:AccumulatedTranslationAdjustmentMember2018-06-300000096021us-gaap:AociDerivativeQualifyingAsHedgeExcludedComponentParentMember2018-06-300000096021us-gaap:AccumulatedNetUnrealizedInvestmentGainLossMember2018-06-300000096021us-gaap:AccumulatedDefinedBenefitPlansAdjustmentMember2018-07-012019-06-290000096021us-gaap:AociDerivativeQualifyingAsHedgeExcludedComponentParentMember2018-07-012019-06-290000096021us-gaap:AccumulatedDefinedBenefitPlansAdjustmentMember2019-06-290000096021us-gaap:AccumulatedTranslationAdjustmentMember2019-06-290000096021us-gaap:AociDerivativeQualifyingAsHedgeExcludedComponentParentMember2019-06-290000096021us-gaap:AccumulatedNetUnrealizedInvestmentGainLossMember2019-06-290000096021us-gaap:AccumulatedDefinedBenefitPlansAdjustmentMember2019-06-302020-06-270000096021us-gaap:AociDerivativeQualifyingAsHedgeExcludedComponentParentMember2019-06-302020-06-270000096021us-gaap:AccumulatedDefinedBenefitPlansAdjustmentMember2020-06-270000096021us-gaap:AccumulatedTranslationAdjustmentMember2020-06-270000096021us-gaap:AociDerivativeQualifyingAsHedgeExcludedComponentParentMember2020-06-270000096021us-gaap:AccumulatedNetUnrealizedInvestmentGainLossMember2020-06-270000096021us-gaap:AccumulatedDefinedBenefitPlansAdjustmentMember2020-06-282021-07-030000096021us-gaap:AociDerivativeQualifyingAsHedgeExcludedComponentParentMember2020-06-282021-07-030000096021us-gaap:AccumulatedDefinedBenefitPlansAdjustmentMember2021-07-030000096021us-gaap:AccumulatedTranslationAdjustmentMember2021-07-030000096021us-gaap:AociDerivativeQualifyingAsHedgeExcludedComponentParentMember2021-07-030000096021us-gaap:AccumulatedNetUnrealizedInvestmentGainLossMember2021-07-030000096021syy:OmnibusIncentivePlan2018Member2018-11-300000096021syy:RestrictedStockRestrictedStockUnitsOrOtherTypesOfStockBasedAwardsMembersyy:OmnibusIncentivePlan2018Member2018-11-300000096021srt:MaximumMembersyy:OmnibusIncentivePlan2018Member2018-11-012018-11-300000096021syy:OmnibusIncentivePlan2018Member2018-11-012018-11-300000096021syy:OmnibusIncentivePlan2018Member2021-07-030000096021syy:OptionsOrStockApppreciationRightsMembersyy:OmnibusIncentivePlan2018Member2021-07-030000096021syy:RestrictedStockRestrictedStockUnitsOrOtherTypesOfStockBasedAwardsMembersyy:OmnibusIncentivePlan2018Member2021-07-030000096021syy:LongTermIncentivePlanPriorTo2018Member2020-06-282021-07-030000096021us-gaap:PerformanceSharesMember2020-06-282021-07-030000096021us-gaap:PerformanceSharesMember2019-06-302020-06-270000096021srt:ExecutiveOfficerMember2020-06-282021-07-030000096021syy:KeyEmployeesMember2020-06-282021-07-03syy:officersyy:employee0000096021srt:ExecutiveOfficerMember2019-06-302020-06-270000096021syy:KeyEmployeesMember2019-06-302020-06-270000096021srt:ExecutiveOfficerMember2018-07-012019-06-290000096021syy:KeyEmployeesMember2018-07-012019-06-290000096021us-gaap:RestrictedStockUnitsRSUMember2020-06-282021-07-030000096021us-gaap:RestrictedStockUnitsRSUMember2019-06-302020-06-270000096021us-gaap:RestrictedStockUnitsRSUMember2018-07-012019-06-290000096021syy:NonEmployeeDirectorRestrictedAwardMember2020-06-282021-07-030000096021syy:NonEmployeeDirectorRestrictedAwardMember2019-06-302020-06-270000096021syy:NonEmployeeDirectorRestrictedAwardMember2018-07-012019-06-290000096021syy:NonEmployeeDirectorsStockPlan2009Membersyy:ElectedSharesMember2020-06-282021-07-030000096021syy:ElectedSharesMember2020-06-282021-07-030000096021syy:ElectedSharesMember2019-06-302020-06-270000096021syy:ElectedSharesMember2018-07-012019-06-290000096021syy:NonEmployeeDirectorRestrictedAwardAndElectedSharesMember2020-06-282021-07-030000096021syy:AggregateNonVestedAwardsMember2020-06-270000096021syy:AggregateNonVestedAwardsMember2020-06-282021-07-030000096021syy:AggregateNonVestedAwardsMember2021-07-030000096021syy:EmployeesStockPurchasePlanMember2020-06-282021-07-030000096021syy:EmployeesStockPurchasePlanMember2021-07-030000096021syy:EmployeesStockPurchasePlanMember2019-06-302020-06-270000096021syy:EmployeesStockPurchasePlanMember2018-07-012019-06-290000096021us-gaap:ForeignCountryMembersrt:MinimumMember2020-06-282021-07-030000096021syy:ProductPurchasesForResaleCommitmentMember2021-07-030000096021syy:InformationTechnologyServicesCommitmentMember2020-06-282021-07-03syy:segment0000096021us-gaap:OperatingSegmentsMembersyy:U.S.FoodserviceOperationsMember2020-06-282021-07-030000096021us-gaap:OperatingSegmentsMembersyy:U.S.FoodserviceOperationsMember2019-06-302020-06-270000096021us-gaap:OperatingSegmentsMembersyy:U.S.FoodserviceOperationsMember2018-07-012019-06-290000096021syy:InternationalFoodserviceOperationsMemberus-gaap:OperatingSegmentsMember2020-06-282021-07-030000096021syy:InternationalFoodserviceOperationsMemberus-gaap:OperatingSegmentsMember2019-06-302020-06-270000096021syy:InternationalFoodserviceOperationsMemberus-gaap:OperatingSegmentsMember2018-07-012019-06-290000096021syy:SygmaSegmentMemberus-gaap:OperatingSegmentsMember2020-06-282021-07-030000096021syy:SygmaSegmentMemberus-gaap:OperatingSegmentsMember2019-06-302020-06-270000096021syy:SygmaSegmentMemberus-gaap:OperatingSegmentsMember2018-07-012019-06-290000096021us-gaap:OperatingSegmentsMemberus-gaap:AllOtherSegmentsMember2020-06-282021-07-030000096021us-gaap:OperatingSegmentsMemberus-gaap:AllOtherSegmentsMember2019-06-302020-06-270000096021us-gaap:OperatingSegmentsMemberus-gaap:AllOtherSegmentsMember2018-07-012019-06-290000096021us-gaap:OperatingSegmentsMember2020-06-282021-07-030000096021us-gaap:OperatingSegmentsMember2019-06-302020-06-270000096021us-gaap:OperatingSegmentsMember2018-07-012019-06-290000096021us-gaap:CorporateNonSegmentMember2020-06-282021-07-030000096021us-gaap:CorporateNonSegmentMember2019-06-302020-06-270000096021us-gaap:CorporateNonSegmentMember2018-07-012019-06-290000096021us-gaap:OperatingSegmentsMembersyy:U.S.FoodserviceOperationsMember2021-07-030000096021us-gaap:OperatingSegmentsMembersyy:U.S.FoodserviceOperationsMember2020-06-270000096021us-gaap:OperatingSegmentsMembersyy:U.S.FoodserviceOperationsMember2019-06-290000096021syy:InternationalFoodserviceOperationsMemberus-gaap:OperatingSegmentsMember2021-07-030000096021syy:InternationalFoodserviceOperationsMemberus-gaap:OperatingSegmentsMember2020-06-270000096021syy:InternationalFoodserviceOperationsMemberus-gaap:OperatingSegmentsMember2019-06-290000096021syy:SygmaSegmentMemberus-gaap:OperatingSegmentsMember2021-07-030000096021syy:SygmaSegmentMemberus-gaap:OperatingSegmentsMember2020-06-270000096021syy:SygmaSegmentMemberus-gaap:OperatingSegmentsMember2019-06-290000096021us-gaap:OperatingSegmentsMemberus-gaap:AllOtherSegmentsMember2021-07-030000096021us-gaap:OperatingSegmentsMemberus-gaap:AllOtherSegmentsMember2020-06-270000096021us-gaap:OperatingSegmentsMemberus-gaap:AllOtherSegmentsMember2019-06-290000096021us-gaap:OperatingSegmentsMember2021-07-030000096021us-gaap:OperatingSegmentsMember2020-06-270000096021us-gaap:OperatingSegmentsMember2019-06-290000096021us-gaap:CorporateNonSegmentMember2021-07-030000096021us-gaap:CorporateNonSegmentMember2020-06-270000096021us-gaap:CorporateNonSegmentMember2019-06-290000096021country:US2020-06-282021-07-030000096021country:US2019-06-302020-06-270000096021country:US2018-07-012019-06-290000096021country:CA2020-06-282021-07-030000096021country:CA2019-06-302020-06-270000096021country:CA2018-07-012019-06-290000096021country:GB2020-06-282021-07-030000096021country:GB2019-06-302020-06-270000096021country:GB2018-07-012019-06-290000096021country:FR2020-06-282021-07-030000096021country:FR2019-06-302020-06-270000096021country:FR2018-07-012019-06-290000096021syy:OtherGeographicAreasMember2020-06-282021-07-030000096021syy:OtherGeographicAreasMember2019-06-302020-06-270000096021syy:OtherGeographicAreasMember2018-07-012019-06-290000096021country:US2021-07-030000096021country:US2020-06-270000096021country:US2019-06-290000096021country:CA2021-07-030000096021country:CA2020-06-270000096021country:CA2019-06-290000096021country:FR2021-07-030000096021country:FR2020-06-270000096021country:FR2019-06-290000096021country:GB2021-07-030000096021country:GB2020-06-270000096021country:GB2019-06-290000096021syy:OtherGeographicAreasMember2021-07-030000096021syy:OtherGeographicAreasMember2020-06-270000096021syy:OtherGeographicAreasMember2019-06-2900000960212020-06-282020-09-2600000960212020-09-272020-12-2600000960212020-12-272021-03-2700000960212021-03-282021-07-03
UNITED STATES SECURITIES AND EXCHANGE COMMISSION
Washington, D.C. 20549
________________
Form 10-K | | | | | |
| (Mark One) | |
| ☑ | ANNUAL REPORT PURSUANT TO SECTION 13 OR 15(d) OF THE SECURITIES EXCHANGE ACT OF 1934 |
For the fiscal year ended July 3, 2021
OR | | | | | |
| ☐ | TRANSITION REPORT PURSUANT TO SECTION 13 OR 15(d) OF THE SECURITIES EXCHANGE ACT OF 1934 |
Commission File Number 1-6544
________________
Sysco Corporation
(Exact name of registrant as specified in its charter) | | | | | | | | |
Delaware (State or other jurisdiction of incorporation or organization) | | 74-1648137 (I.R.S. Employer Identification No.) |
1390 Enclave Parkway Houston, Texas (Address of principal executive offices) | | 77077-2099 (Zip Code) |
Registrant’s Telephone Number, Including Area Code:
(281) 584-1390
Securities Registered Pursuant to Section 12(b) of the Act: | | | | | | | | | | | | | | |
| Title of each class | | Trading symbols | | Name of each exchange on which registered |
| Common Stock, $1.00 Par Value | | SYY | | New York Stock Exchange |
| 1.25% Notes due June 2023 | | SYY 23 | | New York Stock Exchange |
Securities Registered Pursuant to Section 12(g) of the Act: None
Indicate by checkmark if the registrant is a well-known seasoned issuer, as defined in Rule 405 of the Securities Act. Yes ☑ No ☐
Indicate by checkmark if the registrant is not required to file reports pursuant to Section 13 or Section 15(d) of the Act. Yes ☐ No ☑
Indicate by check mark whether the registrant (1) has filed all reports required to be filed by Section 13 or 15(d) of the Securities Exchange Act of 1934 during the preceding 12 months (or for such shorter period that the registrant was required to file such reports), and (2) has been subject to such filing requirements for the past 90 days. Yes ☑ No ☐
Indicate by check mark whether the registrant has submitted electronically every Interactive Data File required to be submitted pursuant to Rule 405 of Regulation S-T during the preceding 12 months (or for such shorter period that the registrant was required to submit such files). Yes ☑ No ☐
Indicate by check mark whether the registrant is a large accelerated filer, an accelerated filer, a non-accelerated filer, a smaller reporting company or an emerging growth company. See definition of “large accelerated filer,” “accelerated filer,” “smaller reporting company” and “emerging growth company” in Rule 12b-2 of the Exchange Act. | | | | | | | | |
Large Accelerated Filer ☑ | | Accelerated Filer ☐ |
| Non-accelerated Filer ☐ | | Smaller Reporting Company ☐ |
| | Emerging Growth Company ☐ |
If an emerging growth company, indicate by check mark if the registrant has elected not to use the extended transition period for complying with any new or revised financial accounting standards provided pursuant to Section 13(a) of the Exchange Act ☐
Indicate by check mark whether the registrant has filed a report on and attestation to its management’s assessment of the effectiveness of its internal control over financial reporting under Section 404(b) of the Sarbanes-Oxley Act (15 U.S.C. 7262(b)) by the registered public accounting firm that prepared or issued its audit report. ☑
Indicate by check mark whether the registrant is a shell company (as defined in Rule 12b-2 of the Exchange Act). Yes ☐ No ☑
The aggregate market value of the voting stock of the registrant held by stockholders who were not affiliates (as defined by regulations of the Securities and Exchange Commission) of the registrant was approximately $35,407,391,982 as of December 24, 2020 (based on the closing sales price on the New York Stock Exchange Composite Tape on December 24, 2020, as reported by The Wall Street Journal (Southwest Edition)). As of August 10, 2021, the registrant had issued and outstanding an aggregate of 512,081,796 shares of its common stock.
DOCUMENTS INCORPORATED BY REFERENCE:
Portions of the company’s 2021 Proxy Statement to be filed with the Securities and Exchange Commission no later than 120 days after the end of the fiscal year covered by this Form 10-K are incorporated by reference into Part III.
TABLE OF CONTENTS
| | | | | | | | |
| | | |
| | PART I | Page No. |
Item 1. | | |
Item 1A. | | |
Item 1B. | | |
Item 2. | | |
Item 3. | | |
Item 4. | | |
| PART II | |
Item 5. | | |
Item 6. | | |
Item 7. | | |
Item 7A. | | |
Item 8. | | |
Item 9. | | |
Item 9A. | | |
Item 9B. | | |
Item 9C. | | |
| | PART III | |
Item 10. | | |
Item 11. | | |
Item 12. | | |
Item 13. | | |
Item 14. | | |
| | PART IV | |
Item 15. | | |
| Item 16. | | |
| | |
PART I
Item 1. Business
Unless this Form 10-K indicates otherwise or the context otherwise requires, the terms “we,” “our,” “us,” “Sysco,” or “the company” as used in this Form 10-K refer to Sysco Corporation together with its consolidated subsidiaries and divisions.
Overview
Sysco Corporation, acting through its subsidiaries and divisions, is the largest global distributor of food and related products primarily to the foodservice or food-away-from-home industry. Our purpose is “Connecting the World to Share Food and Care for One Another.” We provided products and related services to over 650,000 customer locations, including restaurants, healthcare and educational facilities, lodging establishments and other foodservice customers during fiscal 2021.
Founded in 1969, Sysco commenced operations as a public company in March 1970 when the stockholders of nine companies exchanged their stock for Sysco common stock. Since our formation, we have grown from $115 million to as high as $60.1 billion in annual sales in fiscal 2019, both through internal expansion of existing operations and through acquisitions. Sysco’s annual sales in fiscal 2021 were $51.3 billion.
Sysco’s fiscal year ends on the Saturday nearest to June 30th. This resulted in a 53-week year ended July 3, 2021 for fiscal 2021, a 52-week year ended June 27, 2020 for fiscal 2020 and a 52-week year ended June 29, 2019 for fiscal 2019. We will have a 52-week year ending July 2, 2022 for fiscal 2022.
Sysco Corporation is organized under the laws of Delaware. The address and telephone number of our executive offices are 1390 Enclave Parkway, Houston, Texas 77077-2099, (281) 584-1390. This annual report on Form 10-K, as well as all other reports filed or furnished by Sysco pursuant to Section 13(a) or 15(d) of the Securities Exchange Act of 1934, as amended (Exchange Act), are available free of charge on Sysco’s website at www.sysco.com as soon as reasonably practicable after they are electronically filed with or furnished to the Securities and Exchange Commission (SEC).
Reporting Segments
Sysco distributes food and related products to restaurants, healthcare and educational facilities, lodging establishments and other foodservice customers. Our primary operations are located in North America and Europe. Under the accounting provisions related to disclosures about segments of an enterprise, we have aggregated certain operating segments into three reportable segments. “Other” financial information is attributable to our other operating segments that do not meet the quantitative disclosure thresholds.
•U.S. Foodservice Operations – primarily includes U.S. Broadline operations, which distribute a full line of food products, including custom-cut meat, seafood, specialty produce, specialty imports and a wide variety of non-food products;
•International Foodservice Operations – includes operations in the Americas (primarily outside of the United States (U.S.)) and Europe, which distribute a full line of food products and a wide variety of non-food products. The Americas primarily consists of operations in Canada, Bahamas, Mexico, Costa Rica and Panama, as well as our operations that distribute to international customers. Our European operations primarily consist of operations in the United Kingdom (U.K.), France, Ireland and Sweden;
•SYGMA – our U.S. customized distribution operations serving quick-service chain restaurant customer locations; and
•Other – primarily our hotel supply operations, Guest Worldwide. Sysco sold its interests in Cake Corporation in the first quarter of fiscal 2021.
Broadline operating sites distribute a full line of food products and a wide variety of non-food products to both traditional and chain restaurant customers, hospitals, schools, hotels, industrial caterers and other venues where foodservice products are served. SYGMA operating sites distribute a full line of food products and a wide variety of non-food products to certain chain restaurant customer locations. Selected financial data for each of our reportable segments, as well as financial information concerning geographic areas, can be found in Note 21, “Business Segment Information,” in the Notes to Consolidated Financial Statements in Item 8.
Customers and Products
Sysco’s customers in the foodservice industry include restaurants, hospitals and nursing homes, schools and colleges, hotels and motels, industrial caterers and other similar venues where foodservice products are served.
The products we distribute include:
•frozen foods, such as meats, seafood, fully prepared entrées, fruits, vegetables and desserts;
•canned and dry foods;
•fresh meats and seafood;
•dairy products;
•beverage products;
•imported specialties; and
•fresh produce.
We also supply a wide variety of non-food items, including:
•paper products such as disposable napkins, plates and cups;
•tableware such as china and silverware;
•cookware such as pots, pans and utensils;
•restaurant and kitchen equipment and supplies; and
•cleaning supplies.
A comparison of the sales mix in the principal product categories during the last three years is presented below:
| | | | | | | | | | | | | | | | | |
| Principal product categories | 2021 | | 2020 | | 2019 |
| Fresh and frozen meats | 19 | % | | 19 | % | | 19 | % |
| Canned and dry products | 16 | | | 16 | | | 17 | |
| Frozen fruits, vegetables, bakery and other | 15 | | | 15 | | | 15 | |
| Poultry | 11 | | | 10 | | | 10 | |
| Dairy products | 10 | | | 10 | | | 10 | |
| Paper and disposables | 8 | | | 7 | | | 7 | |
| Fresh produce | 8 | | | 9 | | | 8 | |
| Seafood | 5 | | | 5 | | | 6 | |
| Beverage products | 3 | | | 4 | | | 4 | |
Other (1) | 5 | | | 5 | | | 4 | |
| Totals | 100 | % | | 100 | % | | 100 | % |
(1)Other sales relate to non-food products, including textiles and amenities for our hotel supply business, equipment and subscription sales for our previously-owned Cake business, and other janitorial products, medical supplies and smallwares. We sold our interests in Cake Corporation in the first quarter of fiscal 2021.
Our distribution centers, which we refer to as operating sites, distribute branded merchandise, as well as products packaged under our private brands. Products packaged under our private brands have been manufactured for Sysco according to specifications that have been developed by our quality assurance team. In addition, our quality assurance team certifies the manufacturing and processing plants where these products are packaged, enforces our quality control standards and identifies supply sources that satisfy our requirements.
We believe that prompt and accurate delivery of orders, competitive pricing, customer service and the ability to provide a full array of products and services to assist customers in their foodservice operations are of primary importance in the marketing and distribution of foodservice products to our customers. Our operating sites offer daily delivery to certain customer locations and have the capability of delivering special orders on short notice. Through the sales and marketing representatives and support staff, we stay informed of the needs of our customers and acquaint them with new products and services. We also provide ancillary services relating to foodservice distribution, such as providing customers with product usage reports and other data, menu-planning advice, food safety training and assistance in inventory control, as well as access to various third-party services designed to add value to our customers’ businesses.
No single customer accounted for 10% or more of Sysco’s total sales for the fiscal year ended July 3, 2021.
We estimate that our sales by type of customer during the past three fiscal years were as follows:
| | | | | | | | | | | | | | | | | |
| Type of Customer | 2021 | | 2020 | | 2019 |
| Restaurants | 66 | % | | 62 | % | | 62 | % |
| Healthcare | 9 | | | 9 | | | 8 | |
| Education, government | 6 | | | 8 | | | 9 | |
| Travel and leisure | 5 | | | 7 | | | 9 | |
Other (1) | 14 | | | 14 | | | 12 | |
| Totals | 100 | % | | 100 | % | | 100 | % |
(1)Other includes cafeterias that are not stand-alone restaurants, bakeries, caterers, churches, civic and fraternal organizations, vending distributors, other distributors and international exports, as well as retail food sales and logistics services. None of these types of customers, as a group, exceeded 5% of total sales in any of the years for which information is presented.
We estimate that sales to our customers in the food service management (FSM) sector, which include large customers that service cafeterias in institutions such as universities, hospitals, and sporting venues, accounted for just over 5% of sales in fiscal 2021. These sales are reflected within the respective customer types listed in the table above, depending on the type of customer the FSM operator serves.
Sources of Supply
We purchase from thousands of suppliers, both domestic and international, none of which individually accounts for more than 10% of our purchases. These suppliers consist generally of large corporations selling brand name and private label merchandise, as well as independent regional brand and private label processors and packers. We also provide specialty and seasonal products from small to mid-sized producers to meet a growing demand for locally sourced products. Our locally sourced products, including produce, meats, cheese and other products, help differentiate our customers’ offerings, satisfy demands for new products, and support local communities. Purchasing is generally carried out through both centrally developed purchasing programs, domestically and internationally, and direct purchasing programs established by our various operating sites.
We administer a consolidated product procurement program designed to develop, obtain and ensure consistent quality food and non-food products. The program covers the purchasing and marketing of branded merchandise, as well as products from a number of national brand suppliers, encompassing substantially all product lines. Some of our products are purchased internationally within global procurement centers in order to build strategic relationships with international suppliers and to optimize our supply chain network. We also focus on increasing profitability by lowering operating costs and by lowering aggregate inventory levels, which reduces future facility expansion needs at our operating sites, while providing greater value to our suppliers and customers.
Working Capital Practices
Our growth is funded through a combination of significant cash on hand, incremental cash flow from operations, commercial paper issuances and long-term borrowings. See the discussion in Item 7, “Management’s Discussion and Analysis of Financial Condition and Results of Operations – Liquidity and Capital Resources” regarding our liquidity, financial position and sources and uses of funds.
We extend credit terms to some of our customers based on our assessment of each customer’s creditworthiness. We monitor each customer’s account and will suspend shipments if necessary.
A majority of our sales orders are filled within 24 hours of when customer orders are placed. We generally maintain inventory on hand to be able to meet customer demand. The level of inventory on hand will vary by product depending on shelf-life, supplier order fulfillment lead times and customer demand. We also make purchases of additional volumes of certain products based on supply or pricing opportunities.
We take advantage of suppliers’ cash discounts where appropriate, otherwise we pay out suppliers according to our payment terms.
Corporate Headquarters
Our corporate staff makes available a number of services to our operating sites and our shared services staff performs support activities for employees, suppliers and customers. Members of these group possess experience and expertise in, among other areas, customer and vendor contract administration, accounting and finance, treasury, legal, information technology, payroll and employee benefits, risk management and insurance, sales and marketing, merchandising, inbound logistics, human resources, strategy and tax compliance services. The corporate office also makes available supply chain expertise, such as in warehousing and distribution services, which provide assistance in operational best practices, including space utilization, energy conservation, fleet management and work flow.
Capital Improvements
During fiscal 2021, 2020 and 2019, $470.7 million, $720.4 million and $692.4 million, respectively, were invested in facilities, technology, equipment, delivery fleet and other capital asset enhancements. From time to time, we dispose of assets in the normal course of business; we consider proceeds from these asset sales to be an offset to capital expenditures. During fiscal 2021, 2020 and 2019, capital expenditures, net of proceeds from sales of assets, were $411.5 million, $691.7 million and $671.5 million, respectively. Capital expenditures, net of proceeds from sales of assets, as a percentage of sales during fiscal 2021, 2020 and 2019 were 0.8%, 1.3% and 1.1%, respectively. In order to preserve our liquidity in response to the COVID-19 pandemic, we reduced our expected capital expenditures by eliminating capital projects that were not critical for our business. We estimate our capital expenditures, net of proceeds from sales of assets, in fiscal 2022 will be approximately 1.3% of fiscal 2022 sales, as we continue to invest in our business for the long-term. During the three years ended July 3, 2021, capital expenditures were financed primarily by internally generated funds, our commercial paper program and bank and other borrowings. We expect to finance our fiscal 2022 capital expenditures from internally generated funds.
Human Capital Resources
Sysco believes engaged and empowered associates drive business success and that attracting, developing and retaining the best talent globally to drive our business success is a key driver of the company’s long-term value. Our diverse associates and inclusive culture create an environment where associates can develop their skills and contribute to our success by driving strong financial performance. Sysco’s Board of Directors, through its Compensation and Leadership Development Committee, together with Sysco’s chief executive officer and chief human resources officer, are tasked with providing oversight of our human capital strategy, which consists of (1) talent acquisition, (2) talent management, (3) total rewards, (4) diversity, equity and inclusion and (5) health, well-being and safety. As of July 3, 2021, we had approximately 58,000 employees, including approximately 40,000 U.S. employees and approximately 18,000 employees outside the United States, as compared to approximately 57,000 employees as of June 27, 2020. As of July 3, 2021, approximately 99% of our U.S.-based associates are classified as full-time associates, defined as employees who work 30 or more hours per week.
Collective Bargaining Agreements — As of July 3, 2021, approximately 19% of our employees were represented by unions, primarily the International Brotherhood of Teamsters and unions in France and Sweden. Contract negotiations are handled by each individual operating site with support from our Labor Relations team. Approximately 1.2% of our union employees are covered by collective bargaining agreements that are subject to renegotiation in fiscal 2022. Since July 3, 2021, there have been two contract renegotiations. We consider our labor relations to be satisfactory.
COVID-19 Response — We have been actively responding to the COVID-19 pandemic and its impact globally. Our highest priorities continue to be the safety of our employees and working with our employees and network of suppliers and customers to help maintain the global food supply chain. We have defined and implemented procedures to protect the health and safety of our employees, while also ensuring business continuity and our ability to service our customers. We have allowed employees to work remotely whenever possible and have installed protocols for daily temperature checks and health screenings for our employees not working remotely. We have also provided guidelines for performing deep cleaning and proper social distancing in our offices and warehouses and have implemented requirements for employees to wear face coverings when not working remotely. Given the unprecedented challenges brought on by COVID-19, in April 2020 we launched a global mental health and well-being campaign that continues to be a primary focus for Sysco.
In response to the COVID-19 pandemic in fiscal 2020, we made a reduction to our staffing levels through both temporary workforce furloughs and permanent reductions in force. As business conditions improved in the second half of fiscal 2021, we hired over 6,000 additional sales consultants, new business developers, culinary experts and operations associates in preparation for the incremental volume associated with the expected business recovery. Sysco is monitoring the spread of variants of COVID-19, and while the future impact of the disease on our business is uncertain, we will respond appropriately to
maintain the health and safety of our associates. For more information on our COVID-19 workplace and community response, see our COVID-19 disclosures in “Management’s Discussion and Analysis of Financial Condition and Results of Operations.”
Talent Acquisition and Talent Management — Maintaining a pipeline of talent is critical to Sysco’s ongoing success and is essential to our succession planning efforts and to growing leaders throughout the organization. Our leadership and teams are responsible for attracting and retaining top talent by facilitating an environment where employees feel supported and encouraged in their professional and personal development. Specifically, we promote employee development by cultivating a high-impact learning culture for Sysco associates through a variety of enterprise development programs and learning resources, growing associates through goal-setting and career development processes, and reviewing strategic positions regularly and identifying potential internal candidates to fill those roles. We commit to investing in our employees through on the job experiences and coaching, as well as tuition reimbursement for a majority of our employees in the U.S. to promote continued professional growth. Additionally, we understand the importance of providing competitive compensation and benefits, as well as appropriate training that cultivates growth, developmental opportunities and multiple career paths within the company.
A key focus of Sysco’s Talent Acquisition in fiscal 2021 has been achieving hiring targets for our transportation associates. Throughout our industry, drivers are in short supply and hiring is a challenge. Sysco has developed partnerships with driving school organizations, on a national and local level, to support hiring across our U.S. sites. We encourage our business locations to partner with high schools to recruit non-college bound future graduates to consider a career path that will take them from a warehouse selector to a driver position and beyond. Our current national partner helps to identify a diverse slate of unemployed or underemployed individuals who aspire to be commercially qualified drivers and present them to Sysco as candidates for tuition sponsorship and subsequent hire; and our partner provides training to existing Sysco associates who choose to pursue a driving career. Sysco also has an in-house network of Supply Chain Instructors who ensure that we successfully onboard and train new drivers and support them as they learn how to deliver product to our customers safely and efficiently. In fiscal 2022, Sysco is investing in its first Sysco Driver Academy that will enable us to train our own drivers. For example, this program will give our warehouse associate population an opportunity to become drivers. Trainees will be paid to attend the academy, and Sysco will pay the licensing and certification fees. In return, associates will sign a contract to work for Sysco for an agreed upon period of time. If successful, we may expand the program nationally within the U.S.
Furthermore, through a program entitled Sysco Speaks, we conduct annual, confidential engagement surveys of our global workforce that are administered and analyzed by an independent third party. All Sysco associates across our global operations are invited to participate, and 86% of associates completed the survey in fiscal 2021. Aggregate survey results are reviewed by executive officers and the Board of Directors. By acting on results, both at an aggregate enterprise level and a department/business/work group level, and by analyzing our scores compared to both global and internal benchmarks, we have been able to enhance our culture and improve our overall engagement levels.
Total Rewards — We are committed to equal pay for equal work, regardless of gender, race, ethnicity or other personal characteristics. To deliver on that commitment, we benchmark and set pay ranges based on market data and consider various factors, such as an employee’s role and experience, job location and performance. We also regularly review our compensation practices to promote fair and equitable pay. In fiscal 2021, Sysco’s hourly associates received an average hourly wage of $28.46, and 100% of associates in our U.S. distribution facilities received pay above state minimum wage thresholds. Along with equitable pay, total rewards for Sysco’s full-time associates include paid vacation and sick time benefits, short-term and long-term incentives, retirement plans, training and development, access to career opportunities, paid pregnancy and adoption leave benefits, health and welfare, and recognition, as well as other programs like dependent scholarships and employee discounts.
Diversity, Equity and Inclusion — Sysco’s Diversity, Equity and Inclusion (DEI) team develops global strategic initiatives that are implemented locally to ensure that the needs specific to each region are addressed. To accelerate our global efforts to create a more diverse workforce and an equitable and inclusive culture, Sysco hired its Vice President, Chief Diversity Officer in fiscal 2021. Also, in fiscal 2021, we launched our Global DEI Advisory Council, which has been tasked with creating our three-year DEI Roadmap and our Real Talk Dialogues, which provide leaders and their associates safe forums to have open, honest, two-way and completely voluntary conversations. Sysco’s chief executive officer signed the CEO Pledge, as part of the CEO Action for Racial Equity, a group that includes business leaders from across the Fortune 100 companies. In addition, Sysco is a member of the Business Coalition for Equality Act, a group of U.S. employers that support legislation providing the same protections for LGBTQ+ associates as other protected groups under federal law.
At the end of fiscal 2021, women held 24% of U.S. management roles (defined as managers of people) and 24% of officer roles (defined as the executives and senior level positions within the corporate office and field organizations). For our U.S. leadership, Hispanic or Latinx, Black or African American, and Asian employees held 12%, 8% and 4% of management roles (defined as managers of people), respectively, at the end of fiscal 2021.
Our Associate Resource Groups (ARGs) are voluntary, associate-led groups organized to foster a diverse, inclusive workplace at Sysco, and are a critical element of our engagement and DEI efforts at both our headquarters and at operating sites by interested associates. These groups are effective vehicles for diverse associates to strengthen their skills, build relationships and foster mutually supportive interactions with their Sysco colleagues. By the end of fiscal 2021, twelve ARGs had been formed, representing gender, race, ethnicity, sexual orientation and gender identification, veterans and generations, among other groups.
Health, Well-being and Safety — Our occupational health services and total rewards/benefits teams offer a wide range of programs that address the needs of our workforce. We offer our associates and their families programs that support their lives, and we offer programs for U.S. associates that support health, mind, security and community. In fiscal 2020, our environmental compliance, occupational health and safety teams were combined under one central Environmental Health and Safety (EHS) team comprising functional experts across many geographies to address EHS at every point in our business process.
Competition
A large number of companies are engaged in the distribution of food and non-food products to the foodservice industry. Our customers may also choose to purchase products directly from wholesale or retail outlets, including club, cash and carry and grocery stores, online retailers, or negotiate prices directly with our suppliers. While we compete primarily with local and regional distributors, some organizations compete with us on a multi-region basis. In addition, these local, regional and multi-regional distributors can create purchasing cooperatives and marketing groups to enhance their competitive abilities by expanding their product mix, improving purchasing power and extending their geographic capabilities. Our customers are accustomed to purchasing from multiple suppliers and channels concurrently. Customers can choose from many broadline foodservice distributors, specialty distributors that focus on specific categories such as produce, meat or seafood, other wholesale channels, club stores, cash and carry stores, grocery stores and numerous online retailers. Since switching costs are very low, customers can make supplier and channel changes very quickly. We believe that the principal competitive factors in the foodservice industry are effective customer contacts, the ability to deliver a wide range of quality products and related services on a timely and dependable basis and competitive prices. There are few barriers to market entry. Existing foodservice competitors can extend their shipping distances and add truck routes and warehouses relatively quickly to serve new markets or customers.
We estimate that we serve about 17% of the approximately $230 billion annual foodservice market in the U.S., as estimated by Technomic, Inc., for calendar year 2020. Technomic projects the market size to increase to approximately $285 billion by the end of calendar 2021. We also serve certain international geographies that vary in size and amount of market share. We believe, based upon industry trade data, that our sales to the U.S. and Canada food-away-from-home industry were the highest of any foodservice distributor during fiscal 2021. While comprehensive industry statistics are not available, we believe that, in most instances, our operations in the U.S. and Canada are among the leading distributors of food and related non-food products to foodservice customers in those trading areas. We believe our competitive advantages include our sales consultants; our diversified product base, which includes quality-assured Sysco brand products; our service reliability; the ancillary services we provide to our customers, such as business reviews and menu analysis; and our multi-regional presence in North America and Europe, combined with a large geographical footprint of multi-temperature warehouses, which mitigates some of the impact of regional economic declines that may occur over time.
Government Regulation
Our company is required to comply, and it is our policy to comply, with all applicable laws and regulations in the numerous countries throughout the world in which we do business.
In the U.S., as a marketer and distributor of food products, we are subject to the Federal Food, Drug and Cosmetic Act and regulations promulgated thereunder by the U.S. Food and Drug Administration (FDA). The FDA regulates food safety and quality through various statutory and regulatory mandates, including manufacturing and holding requirements for foods through good manufacturing practice regulations, hazard analysis and critical control point (HACCP) requirements for certain foods, and the food and color additive approval process. The agency also specifies the standards of identity for certain foods, prescribes the format and content of information required to appear on food product labels, regulates food contact packaging and materials, and maintains a Reportable Food Registry for the industry to report when there is a reasonable probability that an article of food will cause serious adverse health consequences. For certain product lines, we are also subject to the Federal Meat Inspection Act, the Poultry Products Inspection Act, the Perishable Agricultural Commodities Act, the Packers and Stockyard Act and regulations promulgated by the U.S. Department of Agriculture (USDA) to interpret and implement these statutory
provisions. The USDA imposes standards for product safety, quality and sanitation through the federal meat and poultry inspection program. The USDA reviews and approves the labeling of these products and also establishes standards for the grading and commercial acceptance of produce shipments from our suppliers. We are also subject to the Public Health Security and Bioterrorism Preparedness and Response Act of 2002, which imposes certain registration and record keeping requirements on facilities that manufacture, process, pack or hold food for human or animal consumption, as well as Food Defense, which is a responsibility of the Department of Homeland Security.
The Food Safety Modernization Act (FSMA) has significantly expanded our food safety requirements. We have established and continue to maintain comprehensive, prevention-based controls across the food supply chain that are both verified and validated, as required by FDA regulations implementing FSMA. The FSMA further imposes requirements for food products imported into the U.S. and provides the FDA with mandatory recall authority.
We and our products are also subject to state and local regulation through such measures as the licensing of our facilities; enforcement by state and local health agencies of state and local standards for our products; and regulation of our trade practices in connection with the sale of our products. Our facilities are subject to regulations issued pursuant to the U.S. Occupational Safety and Health Act by the U.S. Department of Labor. These regulations require us to comply with certain manufacturing, health and safety standards to protect our employees from accidents and to establish hazard communication programs to transmit information on the hazards of certain chemicals present in products we distribute. We are also subject to the National Labor Relations Act, which governs the process for collective bargaining between employers and employees and protects the rights of both employers and employees in the workplace.
Our processing and distribution facilities must be registered with the FDA biennially and are subject to periodic government agency inspections by the FDA and USDA. Our facilities are generally inspected at least annually by federal and/or state authorities. We also must establish communication programs to transmit information about the hazards of certain chemicals present in some of the products we distribute.
Our customers include several departments of the federal government, including the Department of Defense and Department of Veterans Affairs facilities, as well as certain state and local entities. These customer relationships subject us to additional regulations applicable to government contractors.
We are also subject to regulation by numerous federal, state and local regulatory agencies, including, but not limited to, the U.S. Department of Labor, which sets employment practice standards for workers, and the U.S. Department of Transportation, as well as its agencies, the Surface Transportation Board, the Federal Highway Administration, the Federal Motor Carrier Safety Administration, and the National Highway Traffic Safety Administration, which collectively regulate our trucking operations through the regulation of operations, safety, insurance and hazardous materials. We must comply with the safety and fitness regulations promulgated by the Federal Motor Carrier Safety Administration, including those relating to drug and alcohol testing and hours-of service. Such matters as weight and dimension of equipment also fall under federal and state regulations. We are subject to regulations of the Federal Aviation Administration covering items transported by air. In addition, we are subject to the U.S. False Claims Act, and similar state statutes, which prohibit the submission of claims for payment to the government that are false and the knowing retention of overpayments.
The U.S. Foreign Corrupt Practices Act (FCPA) prohibits bribery of public officials to obtain or retain business in foreign jurisdictions. The FCPA also requires us to keep accurate books and records and to maintain internal accounting controls to detect and prevent bribery and to ensure that transactions are properly authorized and recorded. We have implemented and continue to develop a robust anti-corruption compliance program applicable to our global operations to detect and prevent bribery and to comply with these and other anti-corruption laws in countries where we operate.
Our business is subject to competition laws in the various jurisdictions where we operate, including the Sherman Antitrust Act and related federal and state antitrust laws in the U.S. These laws and regulations generally prohibit competitors from fixing prices, boycotting competitors, or engaging in other conduct that unreasonably restrains competition. In many jurisdictions, compliance with these competition laws is of special importance to us, and our operations may come under special scrutiny by competition law authorities, due to our competitive position in those jurisdictions.
Outside the U.S., our business is subject to numerous similar statutes and regulations, as well as other legal and regulatory requirements. For example, we are subject to legal and regulatory requirements of the European Union (the EU), as well as those of EU countries where we conduct business (including Ireland, France and Sweden), which requirements relate to, among other things, competition, product composition, packaging, labeling, advertisement (including nutrition and health claims) and the safety of food products, as well as the health, safety and working conditions of employees. We are subject to privacy laws in the EU, including the General Data Protection Regulation (GDPR), which requires companies to meet certain
requirements regarding the handling of personal data. In addition, our business is subject to the U.K. Modern Slavery Act 2015, which requires certain companies that operate in the U.K. to prepare a report describing steps that they have taken to ensure that slavery and human trafficking is not taking place in their supply chain or business. Our business is also subject to the U.K. Bribery Act 2010, an anti-corruption law that criminalizes the failure by a company to prevent persons associated with that company from offering or paying bribes to government officials or non-government persons in order to obtain or retain business or a business advantage for the company, as well as restricting the offer, payment or receipt of bribes to or from governmental officials and non-governmental persons.
All of our company’s facilities and other operations in the U.S. and elsewhere around the world are subject to various environmental protection statutes and regulations, including those in the U.S., the U.K. and the EU, relating to: (1) the use of water resources and the discharge of wastewater; (2) the discharge of pollutants into the air, including vehicle emissions; (3) proper handling, treatment and disposing of solid and hazardous wastes; and (4) protecting against and appropriately investigating and remediating spills and releases. Further, most of our distribution facilities have ammonia-based refrigeration systems and tanks for the storage of diesel fuel and other petroleum products which are subject to laws regulating such systems and storage tanks (including the investigation and remediation of soil and groundwater contamination associated with the use of underground storage tanks). See “Item 1A. Risk Factors - Business and Operational Risks - We may incur significant costs to comply with environmental laws and regulations, and we may be subject to substantial fines, penalties, or third-party claims for non-compliance.”
General
We have numerous trademarks that are of significant importance, including the SYSCO® and Brakes® trademarks, in addition to our privately branded product trademarks that include these trademarks. Five of our private brands have had annual sales in excess of $1 billion. These trademarks and the private brands on which they are used are widely recognized within the foodservice industry. Both our U.S. and European trademarks are effective for a ten-year period, and we generally renew our trademarks before their expiration dates unless a particular trademark is no longer in use. We believe the loss of the SYSCO® trademark would have a material adverse effect on our results of operations. We do not have any material patents or licenses.
We are not engaged in material research and development activities relating to the development of new products or the improvement of existing products.
Our sales do not generally fluctuate significantly on a seasonal basis; therefore, our business is not deemed to be seasonal.
As of July 3, 2021, we operated 343 distribution facilities throughout North America and Europe.
Item 1A. Risk Factors
The following discussion of “risk factors” identifies the most significant factors that may adversely affect our business, operations, financial position or future financial performance. This information should be read in conjunction with Management’s Discussion and Analysis of Financial Condition and Results of Operations and the consolidated financial statements and related notes contained in this report. The following discussion of risks is not all inclusive but is designed to highlight what we believe are the most significant factors to consider when evaluating our business. These factors could cause our future results to differ from our expectations expressed in the forward-looking statements identified within “Management’s Discussion and Analysis of Financial Condition and Results of Operations,” and from historical trends.
Industry and General Economic Risks
Global health developments and economic uncertainty resulting from the COVID-19 pandemic have adversely affected, and are expected to continue to adversely affect, our business, financial condition and results of operations.
Public health crises, pandemics and epidemics, such as the COVID-19 pandemic, have impacted our operations directly and may continue to impact us directly, or may continue to disrupt the operations of our business partners, suppliers and customers in ways that could have an adverse effect on our business, results of operations and financial condition. Fear of such events may further alter consumer confidence, behavior and spending patterns, and could adversely affect the economies and financial markets of many countries (or globally), resulting in an economic downturn that could affect customers’ demand for our products.
In response to the outbreak of COVID-19 and its development into a pandemic, governmental authorities in many countries in which we operate, and in which our customers are present and suppliers operate, have imposed mandatory closures, sought voluntary closures and imposed restrictions on, or advisories with respect to, travel, business operations and public gatherings or interactions. Among other matters, these actions have required or strongly urged various venues where foodservice products are served, including restaurants, schools, hotels and cruise liners, to reduce or discontinue operations, which have adversely affected and will continue to adversely affect demand in the foodservice industry, including demand for our products and services. In addition, some consumers are choosing to stay home due to the perceived risk of infection and health risk associated with COVID-19, which is adversely affecting demand in the foodservice industry, including demand for our products and services. Recently, mutations of the virus have arisen, some of which are proving to be particularly aggressive variants. As these variants spread, some governmental authorities have reintroduced certain restrictions and others may decide to do so in the future, which could adversely affect the timing of business reopenings and demand in the foodservice industry.
These events have had, and could continue to have, an adverse impact on numerous aspects of our business, financial condition and results of operations including, but not limited to, our growth, product costs, supply chain disruptions and the potential for inventory spoilage, labor shortages, logistics constraints, customer demand for our products and industry demand generally, difficulties in collecting our accounts receivables and corresponding increases in our bad debt exposure, consumer spending, our liquidity, the price of our securities and trading markets with respect thereto, our ability to access capital markets, and the global economy and financial markets generally. A prolonged or deeper economic downturn that adversely affects our business, financial condition or results of operations could affect our ability to access the credit markets for additional liquidity. A significant downgrade in our credit ratings or adverse conditions in the capital markets may increase the cost of borrowing for us or limit our access to capital. As a result, we may be unable to continue to comply with the debt covenants that are specific to our revolving credit facility, which could result in an event of default. We may see an increase in bankruptcies of customers, which could contribute to an increase in bad debt expense. In the third and fourth quarters of fiscal 2020, the company experienced an increase in past due receivables and recognized additional bad debt charges on its trade receivables that were outstanding at the time the pandemic caused closures among our customers in mid-March 2020. These receivables were all created in fiscal 2020 and are referred to as pre-pandemic receivables. As of July 3, 2021, our pre-pandemic receivable balance outstanding is no longer significant and a majority of the amount outstanding is reserved within our allowance for doubtful accounts. If further significant governmental restrictions are imposed in response to the spread of COVID-19 (including any variants thereof), Sysco could experience additional increases in past due receivables, which would have an adverse effect on the company’s financial condition and results of operations.
We have implemented employee safety measures, based on guidance from the Centers for Disease Control and Prevention and World Health Organization, across all our supply chain facilities, including proper hygiene, social distancing, mask use, and temperature screenings. These measures may not be sufficient to prevent the spread of COVID-19 among our employees. Illness, travel restrictions, absenteeism, or other workforce disruptions could negatively affect our supply chain, distribution, or other business processes. We may face additional production disruptions in the future, which may place constraints on our ability to distribute products in a timely manner or may increase our costs.
The ultimate extent of the impact of COVID-19 on our business, financial condition and results of operations will depend largely on future developments, including the duration and spread of the outbreak and the related impact on consumer confidence and spending, all of which are highly uncertain and cannot be predicted with certainty at this time. Even after the COVID-19 pandemic subsides, we could experience a longer-term impact on our business, such as costs associated with enhanced health, safety and hygiene requirements in one or more regions in attempts to counteract future outbreaks or the possibility that venues where foodservice products are served are slow to reopen and/or experience reduced customer traffic after reopening.
The impact of the COVID-19 pandemic may change our mix of earnings by customer type and by jurisdiction and has increased the risk that operating losses may occur within certain of our jurisdictions that could lead to the recognition of valuation allowances against certain deferred tax assets in the future, if these losses are prolonged beyond our current expectations. This would negatively impact our income tax expense, net earnings, and balance sheet.
Sustained adverse impacts to our company, certain suppliers, and customers may also affect our future valuation of certain assets, and therefore, may increase the likelihood of an impairment charge, write-off, or reserve associated with such assets, including goodwill, long-lived intangible assets, property and equipment, inventories, accounts receivable, tax assets and other assets.
To the extent the COVID-19 pandemic continues to adversely affect our business, results of operations and financial condition, it may also have the effect of heightening many of the other risks described in this Annual Report on Form 10-K and
subsequent filings with the SEC, such as those risks relating to our level of indebtedness, and may have an adverse effect on the price of our common stock.
Our industry is characterized by low margins, and periods of significant or prolonged inflation or deflation affect our product costs and may negatively impact our profitability.
The foodservice distribution industry is characterized by relatively high inventory turnover with relatively low profit margins. Volatile food costs have a direct impact on our industry. We experienced an elevated inflation rate of 9.6% combined for the U.S. and Canada during the fourth quarter of fiscal 2021, primarily in the paper and disposables, poultry and meat categories. The rate accelerated towards the end of the quarter and has continued into the first quarter of fiscal 2022. Periods of significant product cost inflation may adversely affect our results of operations if we are unable to pass on all or a portion of such product cost increases to our customers in a timely manner. In addition, periods of rapidly increasing inflation may adversely affect our business due to the impact of such inflation on discretionary spending by consumers and our limited ability to increase prices in the current, highly competitive environment. Conversely, our business may be adversely affected by periods of product cost deflation, because we make a significant portion of our sales at prices that are based on the cost of products we sell plus a percentage margin. As a result, our results of operations may be adversely affected during periods of product cost deflation, even though our gross profit percentage may remain relatively constant.
A shortage of qualified labor could negatively affect our business and materially reduce earnings.
The future success of our operations, including the achievement of our strategic objectives, depends on our ability, and the ability of third parties on which we rely to supply and to deliver our products, to identify, recruit, develop and retain qualified and talented individuals. As a result, any shortage of qualified labor could significantly adversely affect our business. Employee recruitment, development and retention efforts that we or such third parties undertake may not be successful, which could result in a shortage of qualified individuals in future periods. Any such shortage could decrease our ability to effectively serve our customers and achieve our strategic objectives. Such a shortage would also likely lead to higher wages for employees (or higher costs to purchase the services of such third parties) and a corresponding reduction in our results of operations. In the current operating environment, we are experiencing a shortage of qualified labor in certain geographies, particularly with warehouse workers and drivers, resulting in increased costs from certain temporary wage actions, such as hiring and referral and retention bonus programs. See the discussion under “Human Capital Resources” in Item 1, “Business” for additional information regarding our talent acquisition and talent management efforts in the context of these labor shortages. A continuation of such shortages for a prolonged period of time could have a material adverse effect on the company’s financial condition and results of operations.
Unfavorable macroeconomic conditions in North America and Europe, as well as unfavorable conditions in particular local markets, may adversely affect our results of operations and financial condition.
The foodservice industry is characterized by relatively low profit margins, consequently, our results of operations are susceptible to regional, national and international economic trends and uncertainties. Economic conditions can affect us in the following ways:
•Unfavorable conditions can depress sales and/or gross margins in a given market.
•Food cost and fuel cost inflation experienced by the consumer can lead to reductions in the frequency of dining out and the amount spent by consumers for food-away-from-home purchases, which could negatively impact our business by reducing demand for our products.
•Heightened uncertainty in the financial markets negatively affects consumer confidence and discretionary spending, which can cause disruptions with our customers and suppliers.
•Liquidity issues and an inability to consistently access credit markets would impair our ability to market and distribute food products, support our operations and meet our customers’ needs.
•Liquidity issues and the inability of our customers to consistently access credit markets to obtain cash to support their operations can cause temporary interruptions in our ability to conduct day-to-day transactions involving the collection of funds from such customers.
•Liquidity issues and the inability of our suppliers to consistently access credit markets to obtain cash to support their operations can cause temporary interruptions in our ability to obtain the foodservice products and supplies that we need in the quantities and at the prices that we request.
Historically, North America and Europe have experienced, from time to time, including during the COVID-19 pandemic, deteriorating economic conditions and heightened uncertainty in their financial markets, which have adversely
impacted business and consumer confidence and spending and depressed capital investment and economic activity in the affected regions. If similar unfavorable economic conditions were to arise in the future, or recent volatility in the financial markets and the global economy were to continue, our results of operations and financial condition could be adversely affected.
Economic and political instability and potential unfavorable changes in laws and regulations in international markets could adversely affect our results of operations and financial condition.
Our international operations subject us to certain risks, including economic and political instability and potential unfavorable changes in laws and regulations in international markets in which we operate. For example, the U.K.’s exit from the EU, which occurred on January 31, 2020 (commonly referred to as “Brexit”), and the resulting significant change to the U.K.’s relationship with the EU and with countries outside the EU (and the laws, regulations and trade deals impacting business conducted between them) could disrupt the overall economic growth or stability of the U.K. and the EU and otherwise negatively impact our European operations.
The Withdrawal Agreement between the U.K. and the EU that established the terms governing the U.K.’s departure provided that, among other things, there would be an ongoing transition period under which the U.K. remained a part of the EU customs and regulatory area until December 31, 2020. On January 1, 2021, the U.K. left the EU Single Market and Customs Union, as well as all EU policies and international agreements. As a result, the free movement of persons, goods, services and capital between the U.K. and the EU ended, and the EU and the U.K. formed two separate markets and two distinct regulatory and legal spaces. On December 24, 2020, the European Commission reached a trade agreement with the U.K. on the terms of its future cooperation with the EU (the “Trade Agreement”). The Trade Agreement offers U.K. and EU companies preferential access to each other’s markets, ensuring imported goods will be free of tariffs and quotas; however, economic relations between the U.K. and the EU will now be on more restricted terms than existed previously. At this time, we cannot predict the impact that the Trade Agreement and any future agreements contemplated under the terms of the Trade Agreement will have on our business and our customers, and it is possible that new terms may adversely affect our operations and financial results. We are currently in the process of evaluating our own risks and uncertainties to ascertain what financial, trade, regulatory and legal implications the Trade Agreement could have on our U.K. and European business operations. This uncertainty also includes the impact on our customers’ business operations and capital planning, as well as the overall impact on restaurants or other customers in the foodservice distribution industry.
The completion of Brexit could also adversely affect the value of our euro- and pound-denominated assets and obligations. Exchange rates related to the British pound sterling have been more volatile since the U.K. announced it would exit the EU and such volatility may continue in the future. Future fluctuations in the exchange rate between the British pound sterling and the local currencies of our suppliers may have the effect of increasing our cost of goods sold in the U.K., which increases we may not be able to pass on to our customers. Uncertainty surrounding Brexit has contributed to recent fluctuations in the U.K. economy and could result in future disruptions in economic activity in the U.K., Europe or globally, which could adversely affect our operating results and growth prospects. In addition, Brexit could cause financial and capital markets within and outside the U.K. or the EU to constrict, thereby negatively impacting our ability to finance our business, and could cause a substantial dip in consumer confidence and spending that could negatively impact the foodservice distribution industry. Any one of these impacts could have an adverse effect on our results of operations and financial condition.
As an example of political instability, in fiscal 2020, the “yellow vest” protests in France against a fuel tax increase, pension reform and the French government negatively impacted our sales in France. Similarly, future labor disruptions or disputes could disrupt the integration of Brakes France into Sysco France and our operations in France and the EU generally. In addition, if changes occur in laws and regulations impacting the flow of goods, services and workers in either the U.K or France or in other parts of the EU, with respect to Brexit or otherwise, our European operations could also be negatively impacted.
Competition and the impact of GPOs may reduce our margins and make it difficult for us to maintain our market share, growth rate and profitability.
The foodservice distribution industry is fragmented and highly competitive, with local, regional and multi-regional distributors and specialty competitors. Local and regional companies often align themselves with other smaller distributors through purchasing cooperatives and marketing groups, with the goal of enhancing their geographic reach, private label offerings, overall purchasing power, cost efficiencies and ability to meet customer distribution requirements. These suppliers may also rely on local presence as a source of competitive advantage, and they may have lower costs and other competitive advantages due to geographic proximity. Furthermore, barriers to entry by new competitors, or geographic or product line expansion by existing competitors, are low. Additionally, increased competition from non-traditional sources (such as club stores and commercial wholesale outlets with lower cost structures), online direct food wholesalers and cash and carry
operations have served to further increase pressure on the industry’s profit margins, and continued margin pressure within the industry may have a material adverse effect on our results of operations.
Moreover, some of our customers purchase their products from us through group purchasing organizations, or “GPOs,” in an effort to lower the prices paid by these customers on their foodservice orders. GPOs have a relatively larger presence in the healthcare, lodging and foodservice management customer segments. If these GPOs are able to add a significant number of our customers as members, it may negatively affect our business, financial condition, or results of operations.
Finally, demand for food-away-from-home products is volatile and price sensitive, imposing limits on our customers’ ability to absorb cost increases. New and increasing competitive sources may result in increased focus on pricing and on limiting price increases or may require increased discounting or other concessions. Such competition or other industry pressures may result in margin erosion and/or make it difficult for us to attract and retain customers.
If we are unable to effectively differentiate ourselves from our competitors, our results of operations could be adversely impacted. In addition, even if we are able to effectively differentiate ourselves, we may only be able to do so through increased expenditures or decreased prices, which could also adversely impact our results of operations.
We may not be able to fully compensate for increases in fuel costs, and fuel hedging arrangements intended to contain fuel costs could result in above market fuel costs.
Volatile fuel prices have a direct impact on our industry. We require significant quantities of fuel for our delivery vehicles and are exposed to the risk associated with fluctuations in the market price for fuel. The price and supply of fuel can fluctuate significantly based on international, political and economic circumstances, as well as other factors outside our control, such as actions by the Organization of the Petroleum Exporting Countries, or OPEC, and other oil and gas producers, regional production patterns, weather conditions and environmental concerns. The cost of fuel affects the price paid by us for products, as well as the costs we incur to deliver products to our customers. Although we have been able to pass along a portion of increased fuel costs to our customers in the past through, among other things, our fuel surcharge program, we may not be able to do so in the future. If fuel costs increase in the future, we may experience difficulties in passing all or a portion of these costs along to our customers, which may adversely affect our results of operations.
We routinely enter into fuel hedging arrangements, including fuel derivatives, to hedge our exposure to volatile fuel prices. Nevertheless, our fuel hedging transactions may not be effective in protecting us from changes in fuel prices, and if fuel prices were to decrease significantly, these hedging arrangements would result in our paying higher-than-market costs for a portion of our diesel fuel. In addition, our future use of fuel derivatives would expose us to the risk that any of our counterparties fails to perform its obligations, whether due to its insolvency or otherwise, which could result in financial losses.
Business and Operational Risks
Conditions beyond our control can interrupt our supplies, increase our product costs and impair our ability to deliver products and services to our customers.
We obtain substantially all of our foodservice and related products from third-party suppliers. Although our purchasing volume can provide benefits when dealing with suppliers, suppliers may not be able to provide the foodservice products and supplies that we need in the quantities and at the prices that we request due to conditions outside of their control. We are also subject to delays caused by interruptions in production and increases in product costs based on conditions outside of our control. These conditions include shortages of qualified labor for our suppliers, work slowdowns, work interruptions, strikes or other job actions by employees of suppliers, short-term weather conditions or more prolonged climate change, crop and other agricultural conditions, water shortages, transportation interruptions (such as shortages of ocean cargo containers), unavailability of fuel or increases in fuel costs, product recalls, competitive demands, civil insurrection or social unrest, terrorist attacks or international hostilities and natural disasters, epidemics, pandemics (such as the COVID-19 pandemic) or other human or animal disease outbreaks or other catastrophic events (including, but not limited to, foodborne illnesses). Many of these conditions outside of our control could also impair our ability to provide our products and services to our customers or increase the cost of doing so. Our current operating environment is constantly shifting in response to COVID-19, placing significant pressure on the food-away-from-home supply chain. Customer demand is currently outpacing available supply in certain categories. Certain suppliers are struggling to meet demand for our orders. Future supply shortages could have an adverse effect on the company’s financial condition and results of operations.
Further, increased frequency or duration of extreme weather conditions, whether due to global climate change or otherwise, could also impair production capabilities, disrupt our supply chain or adversely affect demand for our products. At
any time, input costs could increase for a prolonged period for a large portion of the products that we sell. Additionally, we procure products from suppliers outside of the U.S., and we are subject to the risks associated with political or financial instability, trade restrictions, tariffs, currency exchange rates, transport capacity and costs and other factors relating to foreign trade, including health and safety restrictions related to epidemics and pandemics (such as the COVID-19 pandemic), any or all of which could delay our receipt of products or increase our input costs.
Our inability to obtain adequate supplies of foodservice and related products and/or to timely provide our products and services and fulfill our other obligations to our customers, whether as a result of any of the foregoing factors or otherwise could mean that we could not fulfill our obligations to customers, could have an adverse effect on our business, results of operations and financial condition, as our customers may turn to other distributors.
In addition, as a foodservice distributor, it is necessary for us to maintain an inventory of products. Declines in product pricing levels between the time we purchase a product from our suppliers and the time we sell the product to our customers could reduce our margin on that inventory, adversely affecting our results of operations.
Adverse publicity about us or lack of confidence in our products could negatively impact our reputation and reduce earnings.
Maintaining a good reputation and public confidence in the safety of the products we distribute is critical to our business. Sysco’s brand names, trademarks and logos and our reputation are powerful sales and marketing tools, and we devote significant resources to promoting and protecting them. Anything that damages our reputation or public confidence in our products, whether or not justified, including negative publicity about the quality, safety, sustainability or integrity of our products or relating to illegal or unethical activities by our employees, suppliers or agents, could tarnish our reputation and diminish the value of our brand, which could adversely affect our results of operations.
Reports, whether true or not, of foodborne illnesses (such as e-coli, avian flu, bovine spongiform encephalopathy, hepatitis A, trichinosis, salmonella, listeria or swine flu) or injuries caused by food tampering could also severely injure our reputation or reduce public confidence in our products. If patrons of our restaurant customers were to become ill from foodborne illnesses, our customers could be forced to temporarily close restaurant locations, which would have an adverse effect on our sales and profitability. In addition, instances of foodborne illnesses or food tampering or other health concerns (even those unrelated to the use of Sysco products) or public concern regarding the safety of our products, can result in negative publicity about the food service distribution industry and materially adversely affect our results of operations.
Damage to our reputation and loss of brand equity could reduce demand for our products and services. This reduction in demand, together with the dedication of time and expense necessary to defend our reputation, would have an adverse effect on our financial condition and results of operations, as well as require additional resources to rebuild our reputation and restore the value of our brand. Our business prospects, financial condition and results of operations could be adversely affected if our public image or reputation were to be tarnished by negative publicity, including dissemination via print, broadcast or social media, or other forms of Internet-based communications. Adverse publicity about regulatory or legal action against us could damage our reputation and image, undermine our customers’ confidence in us and reduce short-term or long-term demand for our products and services, even if the regulatory or legal action is unfounded or not material to our operations. Any of these events could have a material adverse effect on our results of operations and financial condition.
Our relationships with long-term customers may be materially diminished or terminated.
We have long-standing relationships with a number of our customers, many of whom could unilaterally terminate their relationship with us or materially reduce the amount of business they conduct with us at any time. Market competition, customer requirements, customer financial condition and customer consolidation through mergers or acquisitions also could adversely affect our ability to continue or expand these relationships. We may not be able to retain or renew existing agreements, maintain relationships with any of our customers on acceptable terms, or at all, or collect amounts that insolvent customers might owe us. Some of our customer agreements are terminable upon written notice by either us or the customer, which provides some customers with the opportunity to renegotiate their contracts with us on less favorable terms or to award more business to our competitors. The loss of one or more of our major customers could adversely affect our business, financial condition, and results of operations.
Our anticipated change to the mix of locally managed customers versus multi-unit customers could reduce our gross and operating margins.
Gross margin from our multi-unit customers is generally lower than that of our locally managed customers because we typically sell higher volumes of products to these customers and provide a relatively lower level of value-added services than we do to locally managed customers. If sales to our locally managed customers do not grow at the same (or a greater) rate as sales to our multi-unit customers, our operating margins will likely decline. Meanwhile, the COVID-19 pandemic generally has negatively affected multi-unit customers less than locally managed customers.
If our sales to multi-unit customers were to continue to increase at a faster pace of growth than sales to our locally managed customers, we will become more dependent on multi-unit customers, as they begin to represent a greater proportion of our total sales. Therefore, a future loss of sales to the larger of these multi-unit customers could have a material negative impact on our results of operations and financial condition. Additionally, as a result of our greater dependence on these customers, they could pressure us to lower our prices and/or offer expanded or additional services at the same prices. In that event, if we were unable to achieve additional cost savings to offset these price reductions and/or cost increases, our results of operations could be materially adversely affected. We may be unable to change our cost structure and pricing practices rapidly enough to successfully compete in such an environment.
Changes in consumer eating habits could materially and adversely affect our business, financial condition, or results of operations.
Changes in consumer eating habits (such as a decline in consuming food away from home, a decline in portion sizes, or a shift in preferences toward restaurants that are not our customers) could reduce demand for our products. Consumer eating habits could be affected by a number of factors, including changes in attitudes regarding diet and health or new information regarding the health effects of consuming certain foods. There is a growing consumer preference for sustainable, organic and locally grown products, and a shift towards plant-based proteins and/or animal proteins derived from animals that were humanely treated and antibiotic free.
Changing consumer eating habits also occur due to generational shifts. Millennials, the largest demographic group in terms of spend, seek new and different, as well as more ethnic, menu options and menu innovation. If consumer eating habits change significantly, we may be required to modify or discontinue sales of certain items in our product portfolio, and we may experience higher costs and/or supply shortages associated with our efforts to accommodate those changes as our suppliers adapt to the new eating preferences. Changing consumer eating habits may reduce the frequency with which consumers purchase meals outside of the home. Additionally, changes in consumer eating habits may result in the enactment or amendment of laws and regulations that impact the ingredients and nutritional content of our food products, or laws and regulations requiring us to disclose the nutritional content of our food products. Compliance with these laws and regulations, as well as others regarding the ingredients and nutritional content of our food products, may be costly and time-consuming. We may not be able to effectively respond to changes in consumer health perceptions or resulting new laws or regulations or to adapt our menu offerings to trends in eating habits.
In addition, in response to the COVID-19 pandemic and the related economic downturn, many consumers have preferred to eat at home rather than consume food away from home. If these preferences continue and consumers continue to avoid gathering in public places in large groups, the demand for our products and services could be adversely affected. Moreover, once all governmental restrictions are lifted, it is unclear how quickly customers will return to their prior eating habits, which may be a function of continued concerns over safety or depressed consumer sentiment due to adverse economic conditions, including job losses.
Expanding into international markets and complementary lines of business presents unique challenges, and our expansion efforts with respect to international operations and complementary lines of business may not be successful.
An element of our strategy includes further expansion of operations into international markets and the establishment of international procurement organizations. Our ability to successfully operate in international markets may be adversely affected by political, economic and social conditions beyond our control, public health crises, epidemics and pandemics (such as the COVID-19 pandemic), local laws and customs, and legal and regulatory constraints, including compliance with applicable anti-corruption and currency laws and regulations, of the countries or regions in which we currently operate or intend to operate in the future. Risks inherent in our existing and future international operations also include, among others, the costs and difficulties of managing international operations, difficulties in identifying and gaining access to local suppliers, suffering possible adverse tax consequences from changes in tax laws or the unfavorable resolution of tax assessments or audits, maintaining product quality and greater difficulty in enforcing intellectual property rights. Additionally, foreign currency exchange rates and fluctuations thereof may have an adverse effect on the financial results of our international operations.
Another element of our strategy includes the possibility of expansion into businesses that are closely related or complementary to, but not currently part of, our core foodservice distribution business. Our ability to successfully operate in these complementary business markets may be adversely affected by legal and regulatory constraints, including compliance with regulatory programs to which we become subject. Risks inherent in branching out into such complementary markets also include the costs and difficulties of managing operations outside of our core business, which may require additional skills and competencies, as well as difficulties in identifying and gaining access to suppliers or customers in new markets.
Changes in applicable tax laws or regulations and the resolution of tax disputes could negatively affect our financial results.
As a multinational corporation, we are subject to income taxes, as well as non-income-based taxes, in both the U.S. and various foreign jurisdictions. Significant judgment is required in determining our worldwide provision for income taxes and other tax liabilities. Changes in tax laws or tax rulings may have a significant adverse impact on our effective tax rate. For example, the U.S. and many countries where we do business are actively considering or have recently enacted changes in relevant tax, accounting and other laws, regulations and interpretations, including changes to tax laws applicable to corporate multinationals. Recently, the Biden Administration committed to increasing the corporate income tax rate, and to increasing the tax rate applied to profits earned outside the United States. If enacted, the impact of these potential new rules could be material to our tax provision and value of deferred tax assets and liabilities.
Further, in the ordinary course of a global business, there are many intercompany transactions and calculations where the ultimate tax determination could change if tax laws or tax rulings were to be modified. We are also subject to non-income-based taxes, such as payroll, sales, use, value-added, net worth, property and goods and services taxes, in both the U.S. and various foreign jurisdictions. Although we believe that our income and non-income-based tax estimates are appropriate, there is no assurance that the final determination of tax audits or tax disputes will not be different from what is reflected in our historical income tax provisions and accruals.
Given the unpredictability of possible further changes to the U.S. or foreign tax laws and regulations and their potential interdependency, it is very difficult to predict the cumulative effect of such tax laws and regulations on our results of operations and cash flow, but such laws and regulations (and changes thereto) could adversely impact our financial results.
If the products distributed by us are alleged to have caused injury or illness, or to have failed to comply with governmental regulations, we may need to recall our products and may experience product liability claims.
We, like any other foodservice distributor, may be subject to product recalls, including voluntary recalls or withdrawals, if the products we distribute are alleged to have caused injury or illness, to have been mislabeled, misbranded, or adulterated or to otherwise have violated applicable governmental regulations. We may also choose to voluntarily recall or withdraw products that we determine do not satisfy our quality standards, whether for taste, appearance or otherwise, in order to protect our brand and reputation. Any future product recall or withdrawal that results in substantial and unexpected expenditures, destruction of product inventory, damage to our reputation and/or lost sales due to the unavailability of the product for a period of time could materially adversely affect our results of operations and financial condition.
We also face the risk of exposure to product liability claims if the use of products sold by Sysco is alleged to have caused injury or illness. We cannot be sure that consumption of our products will not cause a health-related illness in the future or that we will not be subject to claims or lawsuits relating to such matters. Further, even if a product liability claim is unsuccessful or is not fully pursued, the negative publicity surrounding any assertion that our products caused illness or injury could adversely affect our reputation with existing and potential customers and our corporate and brand image. Umbrella liability insurance that we maintain for product liability claims may not continue to be available at a reasonable cost or, if available, may not be adequate to cover all of our liabilities. We generally seek contractual indemnification and insurance coverage from parties supplying our products, but this indemnification or insurance coverage is limited, as a practical matter, to the creditworthiness of the indemnifying party and the insured limits of any insurance provided by suppliers. If we do not have adequate insurance or contractual indemnification available, product liability relating to defective products could materially adversely affect our results of operations and financial condition.
If we fail to comply with requirements imposed by applicable law or other governmental regulations, we could become subject to lawsuits, investigations and other liabilities and restrictions on our operations that could significantly and adversely affect our business.
We are subject to regulation by various federal, state, provincial, regional and local governments in the countries in which we operate with respect to many aspects of our business, such as food safety and sanitation, ethical business practices, transportation, minimum wage, overtime, wage payment, wage and hour and employment discrimination, immigration, human
health and safety, and due to the services we provide in connection with governmentally funded entitlement programs. For a detailed discussion of the laws and regulations to which our business is subject, please refer to “Business – Government Regulation” in Part I, Item 1 of this Annual Report on Form 10-K.
From time to time, both federal and state governmental agencies have conducted audits of our billing practices as part of investigations of providers of services under governmental contracts, or otherwise. We also receive requests for information from governmental agencies in connection with these audits. While we attempt to comply with all applicable laws and regulations, we may not be in full compliance with all applicable laws and regulations or interpretations of these laws and regulations at all times; moreover, we may not be able to comply with all future laws, regulations or interpretations of these laws and regulations.
If we fail to comply with applicable laws and regulations or encounter disagreements with respect to our contracts subject to governmental regulations, including those referred to above, we may be subject to investigations, criminal sanctions or civil remedies, including fines, injunctions, prohibitions on exporting, or seizures or debarments from contracting with such government. The cost of compliance or the consequences of non-compliance, including debarments, could have an adverse effect on our results of operations. In addition, governmental units may make changes in the regulatory frameworks within which we operate that may require us to incur substantial increases in costs in order to comply with such laws and regulations.
We may incur significant costs to comply with environmental laws and regulations, and we may be subject to substantial fines, penalties or third-party claims for non-compliance.
Our operations are subject to various federal, state, provincial, regional and local laws, rules and regulations in the various countries in which we operate relating to the protection of the environment, including those governing:
•the discharge of pollutants into the air, soil, and water;
•the management and disposal of solid and hazardous materials and wastes;
•employee exposure to hazards in the workplace; and
•the investigation and remediation of contamination resulting from releases of petroleum products and other regulated materials.
In the course of our operations, we operate, maintain and fuel fleet vehicles; store fuel in on-site above and underground storage tanks; operate refrigeration systems; and use and dispose of hazardous substances and food wastes. We could incur substantial costs, including fines or penalties and third-party claims for property damage or personal injury, as a result of any violations of environmental or workplace safety laws and regulations or releases of regulated materials into the environment. In addition, we could incur investigation, remediation or other costs related to environmental conditions at our currently or formerly owned or operated properties.
For example, most of our distribution facilities have ammonia-based refrigeration systems and tanks for the storage of diesel fuel and other petroleum products, which are subject to laws regulating such systems and storage tanks (including the investigation and remediation of soil and groundwater contamination associated with the use of underground storage tanks). Certain of these laws and regulations in the EU may impose liability for costs of investigation or remediation of contamination (which could be material), regardless of fault or the legality of the original disposal, and even if such contamination was present prior to the commencement of our operations at the site and was not caused by our activities. In addition, many of our facilities have propane and battery-powered forklifts. Proposed or recently enacted legal requirements, such as those requiring the phase-out of certain ozone-depleting substances, and proposals for the regulation of greenhouse gas emissions, may require us to upgrade or replace equipment, or may increase our transportation or other operating costs.
If we are unable to finance and integrate acquired businesses effectively, our earnings per share could be materially adversely affected.
Historically, a portion of our growth has come through acquisitions. If we are unable to integrate acquired businesses successfully or realize anticipated economic, operational and other benefits and synergies in a timely manner, our earnings per share may be materially adversely affected. For example, we encountered operational challenges in fiscal 2019 related to our efforts to integrate two businesses in France acquired in connection with the Brakes Group acquisition, which integration efforts have adversely affected our ability to drive growth in sales. Integration of an acquired business may be more difficult when we acquire a business in a market in which we have limited expertise, or with a culture different from Sysco’s.
A significant expansion of our business and operations, in terms of geography or magnitude, could strain our administrative and operational resources. Significant acquisitions may also require the issuance of material additional amounts of debt or equity, which could materially alter our debt-to-equity ratio, increase our interest expense and decrease earnings per share, and make it difficult for us to obtain favorable financing for other acquisitions or capital investments. In addition, our failure to implement effective internal control over financial reporting and disclosure controls and procedures with respect to a significant acquired business could result in material weaknesses and/or a failure to file our periodic reports with the Securities and Exchange Commission on a timely basis.
We rely on technology in our business, and any cybersecurity incident, other technology disruption or delay in implementing new technology could negatively affect our business and our relationships with customers.
We use technology in substantially all aspects of our business operations, and our ability to serve customers most effectively depends on the reliability of our technology systems. We use software and other technology systems, among other things, to generate and select orders, to load and route trucks, to make purchases, to manage our warehouses and to monitor and manage our business on a day-to-day basis. We also use mobile devices, social networking and other online platforms to connect with our employees, suppliers, business partners and customers. Further, our business involves the storage and transmission of numerous classes of sensitive and/or confidential information and intellectual property, including customers’ and suppliers’ personal information, private information about employees and financial and strategic information about the company and our business partners. This sensitive and/or confidential information and intellectual property are stored on information technology systems controlled by us, as well as systems controlled by third parties, such as our service providers.
These technology systems and the operation thereof are vulnerable to disruption from circumstances beyond our control, including fire, natural disasters, power outages, systems failures, security breaches, espionage, cyber-attacks, viruses, theft and inadvertent release of information. We and our third-party providers experience cyber-incidents of varying degrees from time-to-time, including ransomware and phishing attacks, as well as distributed denial of service attacks and the theft of data. To date, these have not had a material impact on our financial condition, results of operations or liquidity; however, there can be no assurance that there will not be a material adverse effect in the future, especially if the amount of insurance coverage we maintain is not sufficient to cover claims or liabilities relating to an incident.
Potential consequences of a future material cybersecurity incident include business disruption; disruption to systems; theft, destruction, loss, corruption, misappropriation or unauthorized release of sensitive and/or confidential information or intellectual property (including personal information in violation of one or more privacy laws); reputational and brand damage; and potential liability, including litigation or other legal actions against us or the imposition by governmental authorities of penalties, fines, fees or liabilities, which, in turn, could cause us to incur significantly increased cybersecurity protection and remediation costs and the loss of customers.
As the ongoing COVID-19 pandemic has resulted in many of our employees, contractors and other corporate partners working remotely, we must increasingly rely on information technology systems that are outside our direct control. These systems are potentially vulnerable to cyber-based attacks and security breaches. In addition, cyber criminals are increasing their attacks on individual employees, utilizing interest in pandemic-related information to increase business email compromise scams designed to trick victims into transferring sensitive data or funds, or steal credentials that compromise information systems.
The actions and controls we have implemented and are implementing to date, or which we seek to cause or have caused third-party providers to implement, may be insufficient to protect our systems, information or other intellectual property. Further, we anticipate devoting significant additional resources to upgrade our security measures generally, including those we employ to protect personal information against these cybersecurity threats.
Further, as we pursue our strategy to grow through acquisitions and to pursue new initiatives that improve our operations and cost structure, we are also expanding and improving our information technologies, resulting in a larger technological presence and corresponding exposure to cybersecurity risk. Failure to adequately assess and identify cybersecurity risks associated with acquisitions and new initiatives would increase our vulnerability to such risks.
Sysco’s efforts to prevent security breaches and cybersecurity incidents, and to implement effective disaster recovery plans, may not be entirely effective to insulate us from technology disruption that could result in adverse effects on our results of operations. Additionally, information technology systems continue to evolve and, in order to remain competitive, we must implement new technologies in a timely and efficient manner. If our competitors implement new technologies more quickly or successfully than we do, such competitors may be able to provide lower cost or enhanced services of superior quality compared to those we provide, which could have an adverse effect on our results of operations.
In addition, data privacy is subject to frequently changing rules and regulations, which sometimes conflict among the various jurisdictions and countries where we do business. For example, the EU adopted the GDPR, a new regulation that became effective in May 2018, which requires companies to meet certain requirements regarding the handling of personal data. We are working to comply with GDPR and other laws and regulations in this area that apply to us, such as California’s Consumer Privacy Act that became effective January 1, 2020, and we anticipate needing to devote significant additional resources to complying with these laws and regulations. Our failure to successfully implement or comply with appropriate processes to adhere to the requirements of GDPR and other laws and regulations in this area could result in substantial fines or penalties and legal liability and could tarnish our reputation.
We need access to borrowed funds to grow, and any default by us under our indebtedness could have a material adverse effect on our cash flow and liquidity.
A substantial part of our growth historically has been the result of acquisitions and capital expansion. We anticipate additional acquisitions and capital expansion in the future. As a result, our inability to finance acquisitions and capital expenditures through borrowed funds could restrict our ability to expand. Moreover, any default under the documents governing our indebtedness could have a significant adverse effect on our cash flows, as well as the market value of our common stock.
Our level of indebtedness and the terms of our indebtedness could adversely affect our business and liquidity position.
As described in Note 12, “Debt and Other Financing Arrangements,” in the Notes to Consolidated Financial Statements in Item 8, as of July 3, 2021, we had approximately $11.1 billion of total indebtedness. This amount included senior notes and borrowings under our revolving credit facility, which supports our U.S. commercial paper program allowing us to issue short-term notes in an aggregate amount not to exceed $2.0 billion scheduled to expire on June 28, 2024.
Certain covenants under our credit facilities place restrictions on some of the actions we may take with respect to our common stock. Our revolving credit agreement, as amended in May 2020 and May 2021, includes a covenant that restricts (1) increases to Sysco’s regular quarterly dividend and (2) repurchases of equity interests of Sysco, in each case, until the earlier of September 2022 or the date on which Sysco has achieved a certain ratio of consolidated earnings before interest, tax, depreciation and amortization (EBITDA) to consolidated interest expense.
Our level of indebtedness could have important consequences for us, including:
•limiting our ability to obtain additional financing, if needed, for working capital, capital expenditures, acquisitions, debt service requirements or other purposes;
•increasing our vulnerability to adverse economic, industry or competitive developments;
•limiting our flexibility in planning for, or reacting to, changes in our business and our industry; and
•placing us at a competitive disadvantage compared to our competitors that have less debt.
Our indebtedness may further increase from time to time for various reasons, including fluctuations in operating results, working capital needs, capital expenditures, potential acquisitions, joint ventures and/or share repurchase programs. Our increased level of indebtedness and the ultimate cost of such indebtedness could have a negative impact on our liquidity, cost of future debt financing and financial results, and our credit ratings may be adversely affected as a result of the incurrence of additional indebtedness. In the future, our cash flow and capital resources may not be sufficient for payments of interest on and principal of our debt, and any alternative financing measures available may not be successful and may not permit us to meet our scheduled debt service obligations.
Changes in the method of determining London Interbank Offered Rate (LIBOR), or the replacement of LIBOR with an alternative reference rate, may adversely affect interest expense related to outstanding debt.
Amounts drawn under our revolving credit facility may bear interest rates in relation to LIBOR, depending on our selection of repayment options. In addition, certain of our outstanding interest rate swap agreements have a floating interest rate in relation to three-month LIBOR. On July 27, 2017, the Financial Conduct Authority in the U.K. announced that it would phase out LIBOR as a benchmark by the end of 2021. It is unclear whether new methods of calculating LIBOR will be established such that it continues to exist after 2021. However, for U.S. dollar LIBOR, the relevant date was deferred to June 30, 2023 for certain tenors (including overnight and one, three, six and 12 months), at which time the LIBOR administrator will cease publication of U.S. dollar LIBOR. Despite this deferral, the LIBOR administrator has advised that no new contracts using
U.S. dollar LIBOR should be entered into after December 31, 2021. These actions indicate that the continuation of U.S. LIBOR on the current basis cannot be guaranteed after June 30, 2023. Moreover, it is possible that U.S. LIBOR will be discontinued or modified prior to June 30, 2023. The U.S. Federal Reserve, in conjunction with the Alternative Reference Rates Committee, a steering committee consisting of large U.S. financial institutions, is considering replacing U.S. dollar LIBOR with the Secured Overnight Financing Rate (SOFR), a new index calculated with a broad set of short-term repurchase agreements backed by treasury securities. If LIBOR ceases to exist, we may need to renegotiate the credit facility and any interest rate swap agreements expiring after 2021 and may not be able to do so with terms that are favorable to us. An alternative reference rate could be higher or more volatile than LIBOR prior to its discontinuance, which could result in an increase in the cost of our indebtedness, impacting our financial condition and results of operations. The overall financing market may be disrupted as a result of the phase-out or replacement of LIBOR. Disruption in the financial market or the inability to renegotiate the credit facility or our interest rate swap agreements with favorable terms could have a material adverse effect on our business, financial position, and operating results. We are evaluating the potential impact of the eventual replacement of the LIBOR benchmark interest rate; however, we are not able to predict whether LIBOR will cease to be available after 2021, whether SOFR will become a widely accepted benchmark in place of LIBOR, or what the impact of such a possible transition to SOFR may be on our business, financial condition and results of operations.
We may be required to pay material amounts under multiemployer defined benefit pension plans.
We contribute to several multiemployer defined benefit pension plans based on obligations arising under collective bargaining agreements covering union-represented employees. Approximately 12% of our current U.S. employees are participants in such multiemployer plans. In fiscal 2021, our total contributions to these plans were approximately $42.9 million. The costs of providing benefits through such plans have increased in recent years. The amount of any increase or decrease in our required contributions to these multiemployer plans will depend upon many factors, including the outcome of collective bargaining, actions taken by trustees who manage the plans, government regulations, changes in the funded status of these plans and the potential payment of a withdrawal liability if we, for any reason, cease to have an ongoing obligation to contribute to a given plan. Based upon the information available to us from the administrators of these plans, none of these plans have assets sufficient to fully pay their liabilities, and therefore all such plans have unfunded vested benefits. Increases in the unfunded liabilities of these plans may result in increased future contribution obligations imposed on us and on other participating employers. Under federal law, significant underfunding experienced by a given plan generally results in increased contribution obligations in the form of surcharges and supplemental contribution obligations. Our risk of such increased payments may be greater if any of the participating employers in these underfunded plans withdraws from a given plan due to insolvency and is not able to contribute an amount sufficient to fund the unfunded liabilities associated with its participants in the plan. We could also be treated as partially withdrawing from participation in one of these plans if the number of our employees participating in a given plan is reduced to a certain percentage over a certain period of time, or if we cease to have an obligation to contribute under one or more, but fewer than all, of the collective bargaining agreements that require us to make contributions to a particular plan. Such reductions in the number of employees participating in these plans could occur as a result of changes in our business operations, such as facility closures or consolidations. Based on the latest information available from plan administrators, we estimate our share of the aggregate withdrawal liability on the multiemployer plans in which we participate could have been as much as $170.2 million as of August 9, 2021. A significant increase to funding requirements could adversely affect the company’s financial condition, results of operations or cash flows.
Our funding requirements for our company-sponsored qualified pension plan may increase should financial markets experience future declines.
At the end of fiscal 2012, we decided to freeze future benefit accruals under the company-sponsored qualified pension plan (U.S. Retirement Plan) as of December 31, 2012 for all U.S.-based salaried and non-union hourly employees. Effective January 1, 2013, these employees were eligible for additional contributions under an enhanced, defined contribution plan. While these actions will serve to limit future growth in our pension liabilities, we had a sizable pension obligation of $4.5 billion, as compared to assets totaling $4.7 billion, as of July 3, 2021, both of which have sensitivity to financial market factors that could impact our funding requirements. See Note 14, “Company-Sponsored Employee Benefit Plans” in the Notes to Consolidated Financial Statements in Item 8 for a discussion of the funded status of the U.S. Retirement Plan.
The amount of our annual contribution to the U.S. Retirement Plan is dependent upon, among other things, the returns on the U.S. Retirement Plan’s assets and discount rates used to calculate the plan’s liability. In fiscal 2018, we made voluntary contributions of $380 million to the U.S. Retirement Plan, allowing us to set an investment strategy that more closely aligns the duration of the U.S. Retirement Plan’s assets with the duration of its liabilities. As a result, our U.S. Retirement Plan holds a greater amount of investments in fixed income securities, but also holds equity securities. Fluctuations in asset values can cause the amount of our anticipated future contributions to the plan to increase. The projected liability of the U.S. Retirement Plan will be impacted by the fluctuations of interest rates on high quality bonds in the public markets as these are inputs in
determining our minimum funding requirements. Specifically, decreases in these interest rates have had and may continue to have an adverse effect on our funding obligations. To the extent financial markets experience significant future declines, and/or interest rates on high quality bonds in the public markets decline, our required contributions may increase for future years as our funded status decreases, which could have an adverse effect on our financial condition.
Failure to successfully renegotiate union contracts could result in work stoppages.
As of July 3, 2021, we had approximately 58,000 employees, approximately 19% of whom were represented by unions, primarily the International Brotherhood of Teamsters and unions in France and Sweden. Contract negotiations are handled by each individual operating site. Approximately 1.2% of our union employees are covered by collective bargaining agreements that are subject to renegotiation in fiscal 2022. Failure of our operating sites to effectively renegotiate these contracts could result in work stoppages. Although our operating sites have not experienced any significant labor disputes or work stoppages to date, and we believe they have satisfactory relationships with their unions, a work stoppage due to failure of multiple operating subsidiaries to renegotiate union contracts could have a material adverse effect on us.
Organization and Common Stock Risks
Our authorized preferred stock provides anti-takeover benefits that may not be viewed as beneficial to stockholders.
Under our Restated Certificate of Incorporation, Sysco’s Board of Directors is authorized to issue up to 1,500,000 shares of preferred stock without stockholder approval. Issuance of these shares could make it more difficult for anyone to acquire Sysco without approval of the Board of Directors, depending on the rights and preferences of the stock issued. In addition, if anyone attempts to acquire Sysco without approval of the Board of Directors of Sysco, the existence of this undesignated preferred stock could allow the Board of Directors to adopt a shareholder rights plan without obtaining stockholder approval, which could result in substantial dilution to a potential acquirer. As a result, hostile takeover attempts that might result in an acquisition of Sysco, which could otherwise have been financially beneficial to our stockholders, could be deterred.
Our amended and restated bylaws provide that the Court of Chancery of the State of Delaware will be the exclusive forum for substantially all disputes between us and our stockholders, which could limit our stockholders’ ability to obtain a favorable judicial forum for disputes with us or our directors, officers or employees.
Our amended and restated bylaws provide that the Court of Chancery of the State of Delaware is the exclusive forum for any derivative action or proceeding brought on our behalf, any action asserting a breach of fiduciary duty, any action asserting a claim against us arising pursuant to the Delaware General Corporation Law, our amended and restated certificate of incorporation or our amended and restated bylaws, or any action asserting a claim against us that is governed by the internal affairs doctrine. This provision may limit a stockholder’s ability to bring a claim in a judicial forum that it finds favorable for disputes with us or our directors, officers or other employees, which may discourage such lawsuits against us and our directors, officers and other employees. Alternatively, if a court were to find this provision in our amended and restated bylaws to be inapplicable or unenforceable in an action, we may incur additional costs associated with resolving such action in other jurisdictions, which could adversely affect our business, financial condition and results of operations.
Item 1B. Unresolved Staff Comments
None.
Item 2. Properties
The table below shows the number of distribution facilities occupied by Sysco in each country and the aggregate square footage devoted to cold and dry storage as of July 3, 2021.
| | | | | | | | | | | | | | | | | |
| Location | Number of Facilities | | Square Feet
(in thousands) | | Segment Served (1) |
| Bahamas | 2 | | | 220 | | | I |
| Belgium | 1 | | | 200 | | | I |
| Canada | 32 | | | 4,181 | | | I, O |
| Costa Rica | 1 | | | 188 | | | I |
| | | | | |
| France | 65 | | | 3,005 | | | I |
| Ireland and Northern Ireland | 6 | | | 657 | | | I |
| Mexico | 7 | | | 299 | | | I |
| | | | | |
| Panama | 1 | | | 44 | | | I |
| | | | | |
| | | | | |
| Sweden | 7 | | | 948 | | | I |
| United Kingdom | 49 | | | 2,610 | | | I |
United States and its territories (2) | 172 | | | 39,623 | | | U, I, S, O |
| | | | | |
| Totals | 343 | | | 51,975 | | | |
(1)Segments served include U.S. Foodservice (U), International Foodservice (I), SYGMA (S), and Other (O).
(2) California, Florida, and Texas account for 20, 16, and 14, respectively, of the facilities located in the U.S.
We own approximately 40,600,000 square feet of our distribution facilities (or 78.1% of the total square feet), and the remainder is occupied under leases expiring at various dates from fiscal 2022 to fiscal 2063, exclusive of renewal options.
Within our Latin American operations, we operate 16 cash and carry facilities and 4 warehouse and storage facilities in Costa Rica and 3 cash and carry facilities in Panama.
We own our approximately 634,000 square foot headquarters office complex in Houston, Texas. In fiscal 2021, we sold our complex in Cypress, TX which previously housed our shared business services and other services, and began performing all corporate and shared service operations from our headquarters.
We are currently constructing expansions or build-outs for various distribution facilities in the United States. The various operating sites, in the aggregate, accounted for 3% of fiscal 2021 sales.
As of July 3, 2021, our fleet of approximately 14,000 delivery vehicles consisted of tractor and trailer combinations, vans and panel trucks, most of which are either wholly or partially refrigerated for the transportation of frozen or perishable foods. We own approximately 86% of these vehicles and lease the remainder.
Item 3. Legal Proceedings
Environmental Matters
Item 103 of SEC Regulation S-K requires disclosure of certain environmental matters in which a governmental authority is a party to the proceedings and when such proceedings involve the potential for monetary sanctions that Sysco’s management reasonably believes will exceed a specified threshold. Pursuant to recent SEC amendments to this item, Sysco has chosen a reporting threshold for such proceedings of $1 million. Applying this threshold, there are no environmental matters to disclose for this period.
From time to time, we may be party to legal proceedings that arise in the ordinary course of our business. We do not believe there are any pending legal proceedings that, individually or in the aggregate, will have a material adverse effect on the company’s financial condition, results of operations or cash flows.
Item 4. Mine Safety Disclosures
Not applicable.
PART II – FINANCIAL INFORMATION
Item 5. Market for Registrant’s Common Equity, Related Stockholder Matters and Issuer Purchases of Equity Securities
The principal market for Sysco’s common stock (SYY) is the New York Stock Exchange. The number of record owners of Sysco’s common stock as of August 10, 2021 was 8,016.
We currently expect that comparable quarterly cash dividends will continue to be paid in the future; however, future declarations of dividends and the establishment of future record and payment dates are subject to the final determination of our Board of Directors.
During March 2020, we discontinued share repurchases under the August 2019 program due to business conditions and certain restrictions imposed by the amendment to our credit agreement providing for Sysco’s $2 billion long-term revolving credit facility, and we made no further repurchases during fiscal 2021. See the discussion in Item 7, “Management’s Discussion and Analysis of Financial Condition and Results of Operations – Liquidity and Capital Resources – Debt Activity and Borrowing Availability” for additional information regarding the credit agreement amendment. In May 2021, our Board of Directors approved a separate repurchase program to authorize the repurchase of up to $5.0 billion of the company’s common stock, which will remain available until fully utilized.
Stock Performance Graph
The following performance graph and related information shall not be deemed “soliciting material” or to be “filed” with the Securities and Exchange Commission, nor shall such information be incorporated by reference into any future filing under the Securities Act of 1933, as amended, or the Exchange Act, except to the extent that Sysco specifically incorporates such information by reference into such filing.
The following stock performance graph compares the performance of Sysco’s Common Stock to the S&P 500 Index and to the S&P 500 Food/Staple Retail Index for Sysco’s last five fiscal years.
The graph assumes that the value of the investment in our Common Stock, the S&P 500 Index, and the S&P 500 Food/Staple Retail Index was $100 on the last trading day of fiscal 2016, and that all dividends were reinvested. Performance data for Sysco, the S&P 500 Index and the S&P 500 Food/Staple Retail Index is provided as of the last trading day of each of our last five fiscal years.
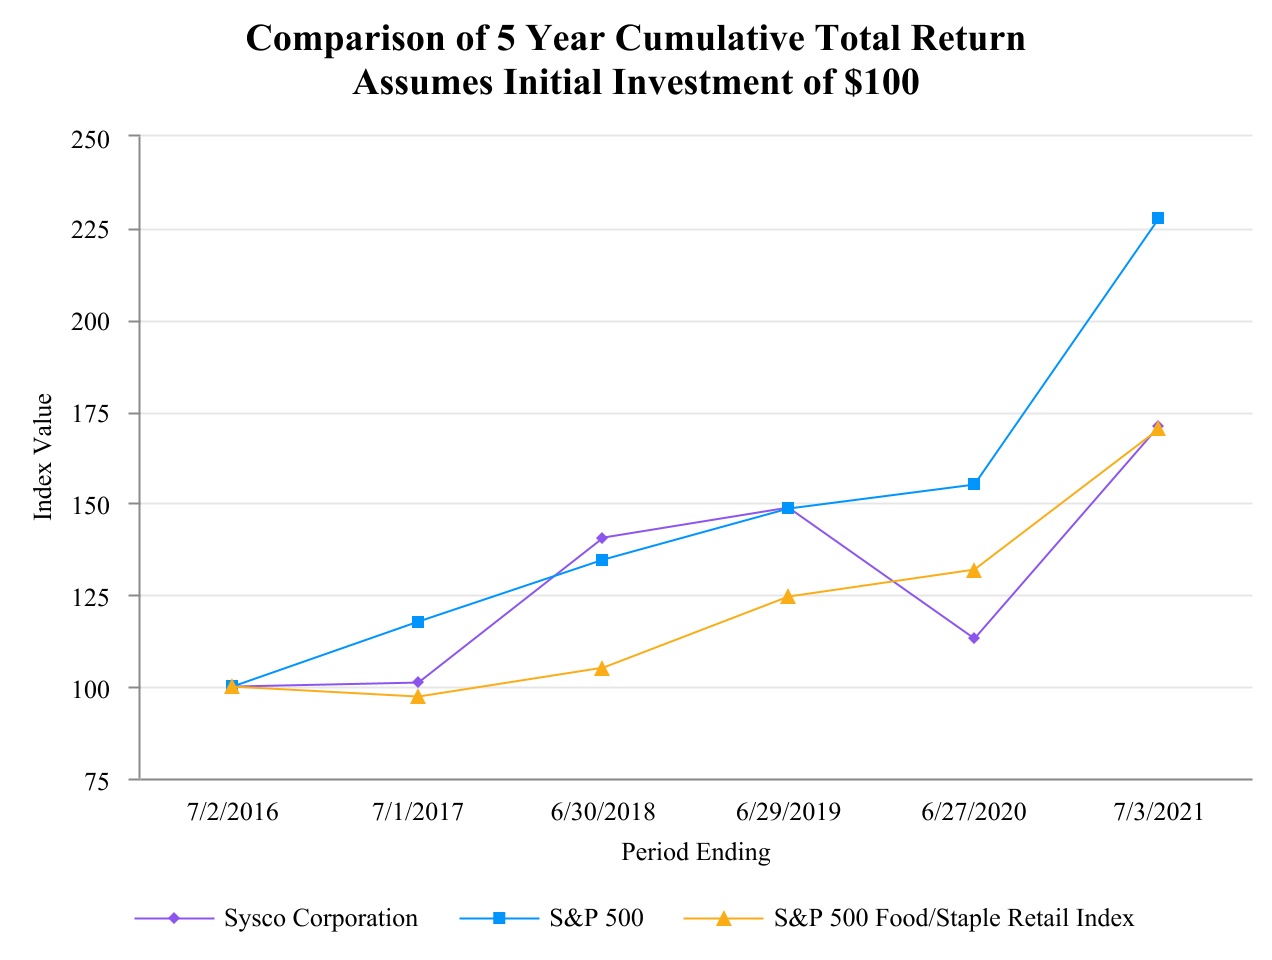
| | | | | | | | | | | | | | | | | | | | | | | | | | | | | | | | | | | | | | |
| | 7/2/2016 | | 7/1/2017 | | 6/30/2018 | | 6/29/2019 | | 6/27/2020 | | 7/3/2021 |
| Sysco Corporation | | $100 | | $101 | | $141 | | $149 | | $113 | | $171 |
| S&P 500 | | 100 | | 118 | | 135 | | 149 | | 155 | | 228 |
| S&P 500 Food/Staple Retail Index | | 100 | | 97 | | 105 | | 125 | | 132 | | 170 |
Item 6. [Reserved]
Item 7. Management’s Discussion and Analysis of Financial Condition and Results of Operations
The following discussion and analysis of Sysco’s financial condition, results of operations and liquidity and capital resources for the fiscal years ended July 3, 2021 and June 27, 2020 should be read as a supplement to our Consolidated Financial Statements and the accompanying notes contained in Item 8 of this report, and in conjunction with the “Forward-looking Statements” section set forth in Part II and the “Risk Factors” section set forth in Item 1A of Part I. All discussion of changes in our results of operations from fiscal 2019 to fiscal 2020 has been omitted from this Form 10-K, but may be found in Item 7, “Management’s Discussion and Analysis of Financial Condition and Results of Operations” of our Form 10-K for the year ended June 27, 2020, filed with the Securities and Exchange Commission on August 25, 2020.
Overview
Sysco distributes food and related products to restaurants, healthcare and educational facilities, lodging establishments and other foodservice customers. Our primary operations are located in North America and Europe. Under the accounting provisions related to disclosures about segments of an enterprise, we have aggregated certain operating segments into three reportable segments. “Other” financial information is attributable to our other operating segments that do not meet the quantitative disclosure thresholds.
•U.S. Foodservice Operations – primarily includes U.S. Broadline operations, which distribute a full line of food products, including custom-cut meat, seafood, specialty produce, specialty imports and a wide variety of non-food products;
•International Foodservice Operations – includes operations in the Americas (primarily outside of the United States (U.S.)) and Europe, which distribute a full line of food products and a wide variety of non-food products. The Americas primarily consists of operations in Canada, Bahamas, Mexico, Costa Rica and Panama, as well as our operations that distribute to international customers. Our European operations primarily consist of operations in the United Kingdom (U.K.), France, Ireland and Sweden;
•SYGMA – our U.S. customized distribution operations serving quick-service chain restaurant customer locations; and
•Other – primarily our hotel supply operations, Guest Worldwide. Sysco sold its interests in Cake Corporation in the first quarter of fiscal 2021.
We estimate that we serve about 17% of an approximately $230 billion annual foodservice market in the U.S. based on industry data obtained from Technomic, Inc as of the end of calendar 2020. Technomic projects the market size to increase to approximately $285 billion by the end of calendar 2021. From time to time, Technomic may revise the methodology used to calculate the size of the foodservice market and, as a result, our percentage can change not only from our sales results, but also from such revisions. We also serve certain international geographies that vary in size and amount of market share.
According to industry sources, the foodservice, or food-away-from-home, market represents approximately 45% of the total dollars spent on food purchases made at the consumer level in the U.S. as of the end of calendar year 2020.
COVID-19 Response
We have closely monitored developments in the COVID-19 pandemic as the situation has evolved, and we are continuously revising our approach to create new processes and guidelines to keep associates and customers safe, with careful consideration to remaining aligned with guidance from relevant health authorities.
•Supporting employees – We defined and implemented procedures to protect the health and safety of our employees while also ensuring business continuity and our ability to service our customers. Per our protocols, all employees at our offices or warehouses take part in daily temperature checks upon entry. Our policies for wearing face coverings at all Sysco and customer locations are aligned with the guidance provided by the Centers for Disease Control and Prevention (CDC), unless local or state regulations differ.
•Serving customers – We have procedures available to limit the contact between our drivers and customers’ employees, including alternative delivery methods, not collecting signatures for customer invoices, and guidelines for safely accepting customer returns. These contact-less procedures are available to all customers by request.
•Assisting our communities – We have donated over 27 million meals in fiscal 2021 across our global operations as part of our community response strategy to the pandemic. These donations were valued at over $55 million. Additionally, we continue to support community organizations in their efforts to address hunger and food insecurity by providing direct delivery to food banks and other hunger relief organizations by loaning refrigerated trucks and facility storage space to increase capacity for local food distribution and by providing volunteer and staffing support for mobile distribution efforts.
Highlights
Our fiscal 2021 results were strong due to improved sales and disciplined expense management. Our business recovery is stronger than anticipated in the U.S., and the recovery is beginning to present itself in our international markets. Our increased profitability drove an improved cash flow performance and allowed us to pay down a large amount of debt. We are also making meaningful progress in advancing our Recipe for Growth strategy, which we expect will allow us to better serve our customers and differentiate Sysco from our competition. See below for a comparison of our fiscal 2021 results to our fiscal 2020 results, both including and excluding Certain Items (as defined below).
Below is a comparison of results from fiscal 2021 to fiscal 2020:
•Sales:
◦decreased 3.0%, or $1.6 billion, to $51.3 billion;
•Operating income:
◦increased 91.8%, or $687.7 million, to $1.4 billion;
◦adjusted operating income decreased 14.7%, or $251.8 million, to $1.5 billion;
•Net earnings:
◦increased 143.3%, or $308.7 million, to $524.2 million;
◦adjusted net earnings decreased 28.3%, or $291.6 million, to $740.4 million;
•Basic earnings per share:
◦increased 145.2%, or $0.61, to $1.03 from the comparable prior year amount of $0.42 per share;
•Diluted earnings per share:
◦increased 142.9%, or $0.60, to $1.02 from the comparable prior year amount of $0.42 per share;
◦adjusted diluted earnings per share were $1.44 in fiscal 2021, a $0.57 decrease from the comparable prior year amount of $2.01 per share.
•EBITDA:
◦increased 46.1%, or $695.4 million, to $2.2 billion; and
◦adjusted EBITDA decreased 9.1%, or $216.2 million, to $2.2 billion.
Our discussion of our results includes certain non-GAAP financial measures, including EBITDA and adjusted EBITDA, that we believe provide important perspective with respect to underlying business trends. Other than free cash flow, any non-GAAP financial measures will be denoted as adjusted measures to remove the impact of restructuring and transformational project costs consisting of: (1) restructuring charges, (2) expenses associated with our various transformation initiatives and (3) facility closure and severance charges; and by acquisition-related costs consisting of: (1) intangible amortization expense related to the fiscal 2017 acquisition of Cucina Lux Investments Limited (the Brakes Acquisition) and (2) due diligence and integration costs incurred in fiscal 2021 associated with the acquisition of Greco and Sons, which closed in August 2021. Our results for fiscal 2021 were also impacted by the reduction of bad debt expense previously recognized in fiscal 2020 due to the impact of the COVID-19 pandemic on the collectability of our pre-pandemic trade receivable balances, as well as non-operating gains and losses including (1) losses on the extinguishment of debt, (2) losses on the sale of businesses and (3) gains on the sale of property.
Fiscal 2020 results of operations were also negatively impacted by costs arising from the COVID-19 pandemic and are also adjusted to remove the impact of (1) excess bad debt expense, as we experienced an increase in past due receivables and recognized additional bad debt charges, (2) goodwill and intangibles impairment charges and (3) fixed asset impairment charges. While Sysco traditionally incurs bad debt expense, the magnitude of such expenses and benefits that we have experienced since the onset of the COVID-19 pandemic is not indicative of our normal operations. Our adjusted results have not been normalized in a manner that would exclude the full impact of the COVID-19 pandemic on our business. As such, Sysco has not adjusted its results for lost sales, inventory write-offs or other costs associated with the COVID-19 pandemic not previously stated.
The fiscal 2021 and fiscal 2020 items discussed above are collectively referred to as “Certain Items.” The results of our foreign operations can be impacted by changes in exchange rates applicable to converting from local currencies to U.S. dollars. We measure our total Sysco and our International Foodservice Operations results on a constant currency basis. Our discussion below of our results includes certain non-GAAP financial measures that we believe provide important perspective with respect to underlying business trends. Other than free cash flow, any non-GAAP financial measures will be denoted as adjusted measures and exclude the impact from Certain Items, and certain metrics are stated on a constant currency basis.
Management believes that adjusting its operating expenses, operating income, interest expense, other (income) expense, net, net earnings and diluted earnings per share to remove these Certain Items, provides an important perspective with respect to our underlying business trends and results and provides meaningful supplemental information to both management and investors that (1) is indicative of the performance of the company’s underlying operations, (2) facilitates comparisons on a year-over-year basis and (3) removes those items that are difficult to predict and are often unanticipated and that, as a result, are difficult to include in analysts’ financial models and our investors’ expectations with any degree of specificity.
Sysco’s fiscal year ends on the Saturday nearest to June 30th. This resulted in a 53-week year ended July 3, 2021 for fiscal 2021, a 52-week year ended June 27, 2020 for fiscal 2020 and a 52-week year ended June 29, 2019 for fiscal 2019. We will have a 52-week year ending July 2, 2022 for fiscal 2022. Because fiscal 2021 contained an additional week as compared to fiscal 2020, our Consolidated Results of Operations for fiscal 2021 are not directly comparable to the prior year. Management
believes that adjusting the fiscal 2021 Consolidated Results of Operations for the estimated impact of the additional week provides more comparable financial results on a year-over-year basis. This is calculated by taking one-fourteenth of the total metric for the fourth quarter of fiscal 2021.
The company uses these non-GAAP measures when evaluating its financial results, as well as for internal planning and forecasting purposes. These financial measures should not be used as a substitute for GAAP measures in assessing the company’s results of operations for periods presented. An analysis of any non-GAAP financial measure should be used in conjunction with results presented in accordance with GAAP. Any metric within this section referred to as “adjusted” will reflect the applicable impact of Certain Items. More information on the rationale for the use of these measures and reconciliations to GAAP numbers can be found under “Non-GAAP Reconciliations.”
Key Performance Indicators
Sysco seeks to meet its strategic goals by continually measuring its success in its key performance metrics that drive stakeholder value through sales growth and capital allocation and deployment. The COVID-19 pandemic has significantly impacted the financial metrics used by management to evaluate the business, and certain metrics continue to be a near- and long-term focus, while other metrics do not provide meaningful comparable information in the near-term. We believe the following are our most significant performance metrics in our current business environment:
•Adjusted operating income growth (non-GAAP);
•Adjusted diluted earnings per share growth (non-GAAP);
•Adjusted EBITDA (non-GAAP);
•Case volume growth by customer type for U.S. Broadline operations;
•Sysco brand penetration for U.S. Broadline operations; and
•Free cash flow (non-GAAP).
We use these financial metrics and related computations, as well as sales and gross profit growth, to evaluate our business and to plan for near-and long-term operating and strategic decisions. We believe it is useful to provide investors with the same financial information that we use internally to make comparisons of our historical operating results, identify trends in our underlying operating results and evaluate our business.
Key Financial Definitions
•Sales – Sales is equal to gross sales, minus (1) sales returns and (2) sales incentives that we offer to certain customers, such as upfront monies and discounts. Our sales are driven by changes in case volumes, product inflation that is reflected in the pricing of our products and mix of products sold.
•Gross profit – Gross profit is equal to our net sales minus our cost of goods sold. Cost of goods sold primarily includes inventory costs (net of supplier consideration) and inbound freight. Cost of goods sold generally changes as we incur higher or lower costs from our suppliers and as our customer and product mix changes.
Adjusted Operating Income and Adjusted Diluted Earnings per Share Growth
Adjusted operating income represents our consolidated operating income, adjusted for the impact of Certain Items that we do not consider representative of our underlying performance. Adjusted diluted earnings per share represents our consolidated diluted earnings per share, adjusted for the impact of Certain Items that we do not consider representative of our underlying performance. Sysco’s management considers growth in these metrics to be useful measures of operating efficiency and profitability, as they facilitate comparison of performance on a consistent basis from period to period by providing a measurement of recurring factors and trends affecting our business.
Adjusted EBITDA
EBITDA represents net earnings (loss) plus (1) interest expense, (2) income tax expense and benefit, (3) depreciation and (4) amortization. The net earnings (loss) component of our EBITDA calculation is impacted by Certain Items that we do not consider representative of our underlying performance. As a result, in the non-GAAP reconciliations below for each period presented, adjusted EBITDA is computed as EBITDA plus the impact of Certain Items, excluding Certain Items related to interest expense, income taxes, depreciation and amortization. Sysco’s management considers growth in this metric to be a measure of overall financial performance that provides useful information to management and investors about the profitability of the business, as it facilitates comparison of performance on a consistent basis from period to period by providing a
measurement of recurring factors and trends affecting our business. Additionally, it is a commonly used component metric used to inform on capital structure decisions.
Case Volume Growth by Customer Type for U.S. Broadline Operations
Case volume represents the volume of product sold to customers during a period of time, and improvements in this metric are a primary driver of Sysco’s top line performance. We define a case, specifically for our U.S. Broadline operations, as the lowest level of packaged products that are sold from our warehouses, with one case potentially containing several pieces of a product packaged in bulk. Case size does not generally vary by location or from period to period, due to the design of our warehouses. Case volume growth is calculated by dividing the change in the volume of cases sold year-over-year by the volume of cases sold in the prior year. Sysco management considers case volume growth within its U.S. Broadline operations to be a measure that provides useful information to management and investors in evaluating sales performance and as an indicator of gross margin performance. Management monitors case volume growth by customer type, with bifurcation between local customers and national customers, as this provides a measure of gross profit performance due to the pricing strategies attached to each customer type. Local customers are primarily street customers, such as independent restaurants that do not have long-term contracts, or locally managed customers, such as local chain restaurants, while national customers are the multi-unit customers requiring national coverage from a customer-centric view and are managed centrally from the Corporate office. Sysco management seeks to drive higher case volume growth to local customers, which allows more favorable pricing terms for our U.S. Broadline operations and generates higher gross margins as a result. National customers benefit from purchasing power, as they are able to negotiate pricing agreements across multiple businesses, reducing our gross profit potential, but reducing our overall cost per case, as national customers have bigger drop sizes. While overall case volume growth reflects a key component of sales growth, local customer case growth provides additional context around gross profit performance.
Sysco Brand Penetration for U.S. Broadline Operations
Sysco management considers Sysco brand penetration to be a measure that provides useful information to management and investors in evaluating the gross profit performance of the company’s U.S. Broadline operations. Sysco offers an assortment of Sysco-branded products that can be differentiated from privately branded products, which enables us to achieve higher gross margin by administering and leveraging a consolidated product procurement program for quality food and non-food products. Due to cost efficiencies, Sysco-branded products generate a higher gross margin than sales from other privately branded products. We define Sysco brand penetration as the percentage of Sysco-branded case volume sold to U.S. Broadline customers over all cases sold to U.S. Broadline customers. This performance indicator, also measured at the customer type level, including local and national customers, is driven by growth in the distribution of branded products to more customers and more geographies, as well as increasing branded offerings through innovation and the launch of new products.
Free Cash Flow
Free cash flow represents net cash provided from operating activities, less purchases of plant and equipment, plus proceeds from sales of plant and equipment. Sysco management considers free cash flow to be a non-GAAP liquidity measure that provides useful information to management and investors about the amount of cash generated by the business after the purchases and sales of buildings, fleet, equipment and technology, which may potentially be used to pay for, among other things, strategic uses of cash, including dividend payments, share repurchases and acquisitions. However, free cash flow may not be available for discretionary expenditures, as it may be necessary that we use it to make mandatory debt service or other payments. Free cash flow should be considered in addition to, rather than as a substitute for, consolidated net income as a measure of our performance and net cash provided by operating activities as a measure of our liquidity. See “Liquidity and Capital Resources” for discussions of GAAP metrics, including net cash provided by operating activities and our reconciliation of this non-GAAP financial measure.
Trends
Economic and Industry Trends
In response to the COVID-19 pandemic, national and local governments have imposed substantial restrictions upon the customers we serve in the food-away-from-home sector; however, we saw demand in the restaurant industry increase throughout the fourth quarter of fiscal 2021 as restrictions continued to ease. The U.S. foodservice industry is now within 5% of calendar year 2019 levels, as foot traffic has increased since March 2021 and continues to increase more than foot traffic in grocery stores. Consumer spending power is robust, signaling that the food-away-from-home sector is not permanently impaired, but rather is vibrant and healthy. Our performance in the non-restaurant sectors of our business trailed the success of restaurants in fiscal 2021; however, we are beginning to see improvements in the travel, hospitality and food service management sectors of our business as restrictions ease and as leisure travel has returned this summer. We expect these non-restaurant business sectors to improve further as travel restrictions continue to ease and businesses return to the office setting. Our International Foodservice Operations segment improved sequentially throughout the fourth quarter of fiscal 2021, as most international regions have begun meaningfully easing the restrictions affecting our customers. Sysco is best positioned to support the rapidly increasing demand due to our balance sheet, our large physical footprint, and our substantial human capital investment in salespeople and supply chain resources. The spread of the COVID-19 variants is creating uncertainty in our industry’s business environment; however, the future impact to our customers and to Sysco’s results is not yet known.
The return of robust customer demand has created pressure on us and our industry for available product supply in select categories. Our supplier partners are struggling with meeting the demand of Sysco’s orders, and certain product categories remain in short supply. We believe that Sysco is performing better than the industry at large in delivering what we refer to as customer fill rate, but we are performing below our historical performance standards. Our merchant teams are working closely with current suppliers and actively sourcing incremental supply from new suppliers, and we are working with our sales teams to offer product substitutions to our customers. In the current operating environment, we are experiencing a tight labor market, particularly with our warehouse and driver positions, which is more concentrated in certain geographic areas. This is resulting in cost pressures, as we adopt mostly temporary wage actions, such as hiring bonuses, referral bonuses, and even retention bonus programs. We are working aggressively to fill open positions and improve productivity to offset cost increases.
Sales and Gross Profit Trends
Our sales and gross profit performance can be influenced by multiple factors, including price, volume, customer mix, product mix and the impact of the COVID-19 pandemic. The biggest factor affecting performance in fiscal 2021 was the COVID-19 pandemic due to reduced volume. The restaurant sector of our business, however, had nearly achieved full recovery as of the fourth quarter of fiscal 2021, as local sales volumes have exceeded fiscal 2019 volume levels. We are experiencing especially strong results from independent customers. Sysco has increased market share in this rapidly expanding market. Sales growth has continued into the first quarter of fiscal 2022, with July results indicating a further acceleration of this increase. We expect our fiscal 2022 sales will exceed fiscal 2019 sales by mid-single digits, with all segments of our business expected to exceed fiscal 2019 sales, except for our lodging supply business and food service management component of our US Foodservice Operations. During fiscal 2022, we expect to achieve growth at a rate of 1.2 times the industry. That rate of growth is expected to accelerate across the three years of our long range plan, and we intend to deliver 1.5 times the market growth in fiscal 2024.
In terms of customer mix, during fiscal 2021, we grew our local customer count by approximately 10%, as compared to fiscal 2019, which is a pace 2.5 times greater than the broadline industry. We believe these efforts demonstrate our ability to accelerate future growth. We continue to win business at the national and contract sales level. We have added commitments to over $2.0 billion of net new national account business on an annualized basis since the beginning of the pandemic, with the fourth quarter of fiscal 2021 representing another strong quarter of new contracts signed. The momentum shown in the fourth quarter of fiscal 2021 has accelerated into the first quarter of fiscal 2022 and, over the course of fiscal 2022, we expect to see an improving market, as additional sectors, including international markets, specialty foods, schools and colleges, and business office cafeterias, begin to reopen.
Our gross margin decreased 48 points in fiscal 2021, compared to the prior year period, as we managed profitability in an inflationary environment. The primary reason for the gross margin dilution at the enterprise level was business mix; however, our higher margin U.S. Foodservice Operations segment business is currently growing alongside improvements in higher-margin business in our International Foodservice Operations segment, reducing the business mix impact on gross margin from the lower-margin SYGMA segment. Manufacturers passed inflation to us, and we have passed it on to customers across categories and customer types. In terms of the impact on pricing, we experienced inflation at a rate of 9.6% combined for the U.S. and Canada during the fourth quarter of fiscal 2021, primarily in the paper and disposables, poultry and meat categories. The rate accelerated towards the end of the quarter and continued into the first quarter of fiscal 2022. The majority of our customer contracts have provisions to pass through inflation, and we are working closely and carefully with customers not managed through a contract. We are educating restaurant operators that consumers currently appear willing to accept menu price increases. The increased inflation is expected to benefit sales, while slightly negatively impacting gross margin rates and positively impacting gross profit dollars. For fiscal 2022, we expect gross margins to improve over fiscal 2021 and approach our fiscal 2019 levels.
Operating Expense Trends
Total operating expenses decreased 13.5% during fiscal 2021, as compared to fiscal 2020. The largest contributors to the decrease were the reduction of variable costs early in the year, as sales declined due to COVID-19, achievement of cost-out initiatives across fiscal 2021 (see “Cost-out Measures” below), and the benefit from a reduction in our allowance for doubtful accounts resulting from improved collections. Many of Sysco’s customers were operating at a substantially reduced volume due to governmental requirements for closures or other social-distancing measures, and a portion of Sysco’s customers closed. Some of these customers ceased paying their outstanding receivables, creating uncertainty as to their collectability. We established reserves for bad debts in fiscal 2020 for these receivables; however, collections have improved in fiscal 2021. In fiscal 2021, we recorded a net credit to the provision for losses on receivables totaling $152.7 million, which reflects a benefit on the reduction of our allowance for pre-pandemic receivable balances, as we have made excellent progress on obtaining timely payments from our customers. We continue to work with our customers to collect past due balances, including through the use of payment plans. We have also discontinued charging interest on past due balances. As of July 3, 2021, our pre-pandemic receivable balance outstanding is no longer significant and a majority of the amount outstanding is reserved within our allowance for doubtful accounts. The COVID-19 pandemic is more widespread and longer in duration than historical disasters that have impacted our business, and it is possible that actual uncollectible amounts will differ and additional charges may be required; however, if collections continue to improve, it is also possible that additional reductions in our bad debt reserve could occur.
Cost-out Measures
The COVID-19 crisis has compelled us to take action to reduce costs by reducing variable expenses in response to reduced customer demand, aligning inventory to current sales trends, reducing capital expenditures to only critical projects and targeted investments and tightly managing receivables. These actions produced savings in fiscal 2021, and we have surpassed our fiscal 2021 goal of $350 million of cost savings. The majority of these savings came from selling, general and administrative costs, but some savings came from cost of goods sold as we continue to improve our capabilities to better optimize supplier relationships. From our selling, general and administrative costs, we have reduced pay-related expenses through headcount reductions across the organization, most of which occurred in fiscal 2020. With the improvement in sales volume due to the business recovery; however, we have hired over 6,000 additional associates in the second half of fiscal 2021. We continue to have hiring needs, as the business recovery is happening faster than anticipated. Other examples of the cost saving efforts are the regionalization of our Broadline and specialty produce operations and the achievements we have made in reducing healthcare contract costs, indirect sourcing and freight contract costs. We expect to drive continued cost savings opportunities to help fuel our future growth agenda, and we are now targeting over $750 million in savings through fiscal 2024, including the savings delivered in fiscal 2021. These savings are structural and permanent, and are expected to substantially benefit the company so that we can grow our profit and create growth for the future. We expect to invest most of the fiscal 2022 savings into both the recovery occurring within our industry, including the temporary wage actions noted in “Economic and Industry Trends” above, as well as our Recipe for Growth transformational initiatives.
Income Tax Trends
Our provision for income taxes primarily reflects a combination of income earned and taxed in the various U.S. federal and state, as well as foreign, jurisdictions. Tax law changes, increases or decreases in book versus tax basis differences, accruals or adjustments of accruals for unrecognized tax benefits or valuation allowances, and our change in the mix of earnings from these taxing jurisdictions all affect the overall effective tax rate. The impact of the COVID-19 pandemic may change our mix of earnings by jurisdiction and has increased the risk that operating losses may occur within certain of our jurisdictions that could
lead to the recognition of valuation allowances against certain deferred tax assets in the future, if these losses are prolonged beyond our current expectations. These effects would negatively impact our income tax expense, net earnings, and balance sheet.
Our effective tax rate has been influenced by discrete events, such as tax law changes and excess tax benefits attributable to equity compensation exercises as discussed in Note 19, “Income Taxes,” in the Notes to Consolidated Financial Statements in Item 8. In fiscal 2022, we expect our effective tax rate to be approximately 24%.
Mergers and Acquisitions
We continue to focus on mergers and acquisitions as a part of our growth strategy. In August 2021, we acquired, within our U.S. Foodservice Operations, Greco and Sons, a leading independent Italian specialty distributor in the U.S. with approximately $800 million in annual revenue.
Divestitures
Sysco sold its interests in Davigel Spain, part of the International Foodservice Operations segment, in the third quarter of fiscal 2021 and sold its interest in Cake Corporation in the first quarter of fiscal 2021. These operations were not significant to Sysco’s business, and these divestitures will facilitate our efforts to prioritize our focus and investments on our core business.
Strategy
Our purpose is “Connecting the World to Share Food and Care for One Another,” which we believe will allow us to grow substantially faster than the foodservice distribution industry and deliver profitable growth through our “Recipe for Growth” transformation. This growth transformation is supported by strategic pillars that we believe will allow us to better serve our customers, including:
•Digital – We will enrich the customer experience through personalized digital tools that reduce friction in the purchase experience and introduce innovation to our customers. We continue to see excellent utilization of our Sysco SHOP platform by customers, and the implementation of our pricing software is on track to be complete by the end of this calendar year. We also have a new personalization engine that is currently under construction and has proved to be beneficial to our pilot customers.
•Products and Solutions – We will provide customer-focused marketing and merchandising solutions that inspire increased sales of our broad assortment of fair priced products and services. We are improving our merchandising and marketing solutions by developing improved strategies for specific cuisine segments.
•Supply Chain – We will efficiently and consistently serve customers with the products they need, when and how they need them, through a flexible, agile delivery framework. We are developing a more nimble, accessible and productive supply chain that is better positioned to support customers in their business recovery, we and have eliminated order minimums for our customers. Our strategic initiatives to increase delivery frequency and enable omnichannel inventory fulfillment remain on track.
•Customer Teams – Our greatest strength is our people, people who are passionate about food and food service. Our diverse team delivers expertise and differentiated services designed to help our customers grow their business. We intend to improve the effectiveness of our sales organization by leveraging data to increase the yield of the sales process.
•Future Horizons – We are committed to responsible growth. We will cultivate new channels, new segments, and new capabilities while being stewards of our company and our planet. We will fund our journey through cost-out and efficiency improvements.
Results of Operations
The following table sets forth the components of our consolidated results of operations expressed as a percentage of sales for the periods indicated:
| | | | | | | | | | | |
| | 2021 | | 2020 |
| Sales | 100.0 | % | | 100.0 | % |
| Cost of sales | 81.8 | | | 81.3 | |
| Gross profit | 18.2 | | | 18.7 | |
| Operating expenses | 15.4 | | | 17.3 | |
| Operating income | 2.8 | | | 1.4 | |
| Interest expense | 1.7 | | | 0.8 | |
| Other (income) expense, net | — | | | 0.1 | |
| Earnings before income taxes | 1.1 | | | 0.5 | |
| Income taxes | 0.1 | | | 0.1 | |
| Net earnings | 1.0 | % | | 0.4 | % |
The following table sets forth the change in the components of our consolidated results of operations expressed as a percentage increase or decrease over the comparable period in the prior year:
| | | | | | | |
| | 2021 | | |
| Sales | (3.0) | % | | |
| Cost of sales | (2.4) | | | |
| Gross profit | (5.5) | | | |
| Operating expenses | (13.5) | | | |
| Operating income | 91.8 | | | |
| Interest expense | 115.6 | | | |
Other (income) expense, net (1) | (157.7) | | | |
| Earnings before income taxes | 99.3 | | | |
| Income taxes | (22.3) | | | |
| Net earnings | 143.3 | % | | |
| Basic earnings per share | 145.2 | % | | |
| Diluted earnings per share | 142.9 | | | |
| Average shares outstanding | 0.1 | | | |
| Diluted shares outstanding | (0.1) | | | |
(1)Other (income) expense, net was income of $27.6 million in fiscal 2021 and expense of $47.9 million in fiscal 2020.
Segment Results
The following represents our results by reportable segments: | | | | | | | | | | | | | | | | | | | | | | | | | | | | | | | | | | | |
| | 53-Week Period Ended Jul. 3, 2021 |
| | U.S. Foodservice Operations | | International Foodservice Operations | | SYGMA | | Other | | Corporate | | Consolidated
Totals |
| | (In thousands) |
| Sales | $ | 35,724,843 | | | $ | 8,350,638 | | | $ | 6,498,601 | | | $ | 723,761 | | | $ | — | | | $ | 51,297,843 | |
| Sales increase (decrease) | (2.9) | % | | (13.7) | % | | 17.0 | % | | (18.8) | % | | | | (3.0) | % |
| Percentage of total | 69.6 | % | | 16.3 | % | | 12.7 | % | | 1.4 | % | | | | 100.0 | % |
| | | | | | | | | | | |
| Operating income (loss) | $ | 2,456,564 | | | $ | (232,403) | | | $ | 52,654 | | | $ | (396) | | | $ | (839,177) | | | $ | 1,437,242 | |
| Operating income (loss) increase (decrease) | 22.6 | % | | (37.4) | % | | 42.8 | % | | (98.1) | % | | | | 91.8 | % |
| Percentage of total segments | 107.9 | % | | (10.2) | % | | 2.3 | % | | — | % | | | | 100.0 | % |
| Operating income as a percentage of sales | 6.9 | % | | (2.8) | % | | 0.8 | % | | (0.1) | % | | | | 2.8 | % |
| | | | | | | | | | | | | | | | | | | | | | | | | | | | | | | | | | | |
| | 52-Week Period Ended Jun. 27, 2020 |
| | U.S. Foodservice Operations | | International Foodservice Operations | | SYGMA | | Other | | Corporate | | Consolidated
Totals |
| | (In thousands) |
| Sales | $ | 36,774,146 | | | $ | 9,672,190 | | | $ | 5,555,926 | | | $ | 891,048 | | | $ | — | | | $ | 52,893,310 | |
| | | | | | | | | | | |
| Percentage of total | 69.5 | % | | 18.3 | % | | 10.5 | % | | 1.7 | % | | | | 100.0 | % |
| | | | | | | | | | | |
| Operating income | $ | 2,003,159 | | | $ | (371,407) | | | $ | 36,880 | | | $ | (21,361) | | | $ | (897,766) | | | $ | 749,505 | |
| | | | | | | | | | | |
| Percentage of total segments | 121.6 | % | | (22.5) | % | | 2.2 | % | | (1.3) | % | | | | 100.0 | % |
| Operating income as a percentage of sales | 5.4 | % | | (3.8) | % | | 0.7 | % | | (2.4) | % | | | | 1.4 | % |
Based on information in Note 21, “Business Segment Information,” in the Notes to Consolidated Financial Statements in Item 8, in fiscal 2021, U.S. Foodservice Operations and International Foodservice Operations represented approximately 69.6% and 16.3%, respectively, of Sysco’s overall sales, compared to 69.5% and 18.3%, respectively, in fiscal 2020. In fiscal 2021 and fiscal 2020, U.S. Foodservice Operations represented approximately 107.9% and 121.6%, respectively, of the total segment operating income. This illustrates that these segments represent a substantial majority of our total segment results when compared to other reportable segments.
Cost of sales primarily includes our product costs, net of vendor consideration, and includes in-bound freight. Operating expenses include the costs of facilities, product handling, delivery, selling and general and administrative activities. Fuel surcharges are reflected within sales and gross profit; fuel costs are reflected within operating expenses. Along with sales, operating income is the most relevant measure for evaluating segment performance and allocating resources, as operating income includes cost of goods sold, as well as the costs to warehouse and deliver goods, which are significant and relevant costs when evaluating a distribution business.
Results of U.S. Foodservice Operations
In fiscal 2021, the U.S. Foodservice Operations operating results represented approximately 69.6% of Sysco’s overall sales and 107.9% of the aggregated operating income of Sysco’s reporting segments. Several factors contributed to these higher operating results as compared to the other operating segments. We have invested substantial amounts in assets, operating methods, technology and management expertise in this segment. The breadth of its sales force, geographic reach of its distribution area and its purchasing power enable this segment to generate its relatively stronger results of operations.
The following tables set forth a summary of the components of operating income and adjusted operating income expressed as a percentage increase or decrease over the prior year:
| | | | | | | | | | | | | | | | | | | | | | | |
| | 2021 | | 2020 | | Change in Dollars | | % Change |
| | (In thousands) |
| Sales | $ | 35,724,843 | | | $ | 36,774,146 | | | $ | (1,049,303) | | | (2.9) | % |
| Gross profit | 7,008,687 | | | 7,254,722 | | | (246,035) | | | (3.4) | |
| Operating expenses | 4,552,123 | | | 5,251,563 | | | (699,440) | | | (13.3) | |
| Operating income | $ | 2,456,564 | | | $ | 2,003,159 | | | $ | 453,405 | | | 22.6 | % |
| | | | | | | |
| Gross profit | $ | 7,008,687 | | | $ | 7,254,722 | | | $ | (246,035) | | | (3.4) | % |
Adjusted operating expenses (Non-GAAP) (1) | 4,691,103 | | | 5,010,764 | | | (319,661) | | | (6.4) | |
Adjusted operating income (Non-GAAP) (1) | $ | 2,317,584 | | | $ | 2,243,958 | | | $ | 73,626 | | | 3.3 | % |
(1) See “Non-GAAP Reconciliations” below.
Sales
The following table sets forth the percentage and dollar value increase or decrease in sales over the prior year in order to demonstrate the cause and magnitude of change.
| | | | | | | | | | | |
| Increase (Decrease) |
| 2021 |
| (In millions) |
| Cause of change | Percentage | | Dollars |
| Case volume | (8.6) | % | | $ | (3,144.5) | |
Inflation (1) | 4.1 | | | 1,522.8 | |
| Acquisitions | 0.1 | | | 50.5 | |
| Extra week in fiscal 2021 | 2.2 | | | 822.8 | |
Other (2) | (0.7) | | | (300.9) | |
| Total change in sales | (2.9) | % | | $ | (1,049.3) | |
(1) Includes product cost inflation of 4.3% for U.S. Broadline operations.
(2) Case volume excludes the volume impact from our custom-cut meat and seafood subsidiaries that do not measure volume in cases. Any impact in volumes from these operations are included within “Other.”
Sales were 2.9% lower in fiscal 2021 than in fiscal 2020. The primary driver of the decrease was the significant decline in case volume in our U.S. Broadline operations as a result of some of our customers closing and many other customers operating at a substantially reduced volume through portions of the fiscal year in response to the COVID-19 pandemic. We estimate that the extra week in fiscal 2021 accounted for $822.8 million of sales during the fiscal year. Our sales have progressively improved throughout fiscal 2021 due to volume improvements commensurate with an easing of restrictions on our customers. Case volumes for the company’s U.S. Broadline operations, including acquisitions within the last 12 months, decreased 5.8% in fiscal 2021 compared to fiscal 2020 and included a 1.1% decline in locally managed customer case growth, along with a decrease of 11.5% in national customer case volume, including chain restaurants and multi-locational restaurants. Sales from acquisitions within the last 12 months favorably impacted locally managed customer sales by 0.1%; therefore, organic local case volume, which excludes acquisitions, decreased 1.2%.
Operating Income
Operating income increased by 22.6% in fiscal 2021 over fiscal 2020, as our decline in gross profits was outpaced by the reduction of operating expenses. Operating income, on an adjusted basis (which is a non-GAAP financial measure for which a reconciliation is provided in “Non-GAAP Reconciliations” below), for fiscal 2021 increased 3.3%, or $73.6 million, compared to fiscal 2020. We estimate that the extra week in fiscal 2021 accounted for $58.4 million of adjusted operating income during the fiscal year.
Gross profit dollars decreased 3.4% in fiscal 2021, as compared to fiscal 2020, driven primarily by the decline in local cases and a decline in Sysco-branded products. The decrease was partially offset by higher inflation. We estimate that the extra week in fiscal 2021 accounted for $158.2 million of gross profit during the fiscal year. Our Sysco brand sales as a percentage of total U.S. cases decreased 87 basis points in fiscal 2021, which was driven by customer and product mix shift. Sysco brand sales as a percentage of local U.S. cases decreased by approximately 212 basis points in fiscal 2021, which was driven by product mix shifting into pre-packaged and takeaway ready products. The estimated change in product costs, an internal measure of inflation or deflation, in fiscal 2021 for our U.S. Broadline operations was inflation of 4.3% and was primarily driven by inflation in the paper and disposables, poultry and meat categories. Gross margin, which is gross profit as a percentage of sales, was 19.62% in fiscal 2021, which was a decrease of 11 basis points compared to gross margin of 19.73% in fiscal 2020, respectively, primarily attributable to customer and product mix shift.
Operating expenses in fiscal 2021 decreased 13.3%, or $699.4 million, compared to fiscal 2020. Our decline in operating expenses during fiscal 2021 was primarily driven by a favorable comparison of bad debt expense, including the reduction of reserves on pre-pandemic receivables, and a decrease in pay-related costs associated with permanent headcount reductions made in fiscal 2020 in response to the COVID-19 pandemic. Operating expenses, on an adjusted basis (which is a non-GAAP financial measure for which a reconciliation is provided in “Non-GAAP Reconciliations” below), for fiscal 2021 decreased 6.4%, or $319.7 million, compared to fiscal 2020. We estimate that the extra week in fiscal 2021 accounted for $99.8 million of adjusted operating expense during the fiscal year.
Results of International Foodservice Operations
In fiscal 2021, the International Foodservice Operations operating results represented approximately 16.3% of Sysco’s overall sales.
The following tables set forth a summary of the components of operating income and adjusted operating income expressed as a percentage increase or decrease over the prior year:
| | | | | | | | | | | | | | | | | | | | | | | |
| | 2021 | | 2020 | | Change in Dollars | | % Change |
| | (In thousands) |
| Sales | $ | 8,350,638 | | | $ | 9,672,190 | | | $ | (1,321,552) | | | (13.7) | % |
| Gross profit | 1,645,448 | | | 1,955,190 | | | (309,742) | | | (15.8) | |
| Operating expenses | 1,877,851 | | | 2,326,597 | | | (448,746) | | | (19.3) | |
| Operating (loss) income | $ | (232,403) | | | $ | (371,407) | | | $ | 139,004 | | | (37.4) | % |
| | | | | | | |
| Gross profit | $ | 1,645,448 | | | $ | 1,955,190 | | | $ | (309,742) | | | (15.8) | % |
Adjusted operating expenses (Non-GAAP) (1) | 1,774,245 | | | 1,847,152 | | | (72,907) | | | (3.9) | |
Adjusted operating income (Non-GAAP) (1) | $ | (128,797) | | | $ | 108,038 | | | $ | (236,835) | | | (219.2) | % |
| | | | | | | |
Comparable sales using a constant currency basis (Non-GAAP) (1) | $ | 7,906,258 | | | $ | 9,672,190 | | | $ | (1,765,932) | | | (18.3) | % |
Comparable gross profit using a constant currency basis (Non-GAAP) (1) | 1,554,004 | | | 1,955,190 | | | (401,186) | | | (20.5) | |
Comparable operating expenses adjusted for Certain Items using a constant currency basis (Non-GAAP) (1) | 1,673,300 | | | 1,847,152 | | | (173,852) | | | (9.4) | |
Comparable operating (loss) income adjusted for Certain Items using a constant currency basis (Non-GAAP) (1) | $ | (119,296) | | | $ | 108,038 | | | $ | (227,334) | | | (210.4) | % |
(1) See “Non-GAAP Reconciliations” below.
Sales
The following table sets forth the percentage and dollar value increase or decrease in sales over the comparable prior year period in order to demonstrate the cause and magnitude of change.
| | | | | | | | | | | |
| Increase (Decrease) |
| 2021 |
| (In millions) |
| Cause of change | Percentage | | Dollars |
| | | |
| Inflation | 3.6 | % | | $ | 351.7 | |
| | | |
| Foreign currency | 4.6 | | | 444.4 | |
| Extra week in fiscal 2021 | 1.8 | | | 178.3 | |
Other (1) | (23.7) | | | (2,296.0) | |
| Total change in sales | (13.7) | % | | $ | (1,321.6) | |
(1)The impact of volumes as a component of sales growth from international operations are included within “Other.” Volume in our foreign operations includes volume metrics that differ from country to country and cannot be aggregated on a consistent comparable basis.
Sales in fiscal 2021 were 13.7% lower, as compared to fiscal 2020, primarily due to the significant decline in volume, as our European, Canadian and Latin American businesses have been substantially impacted by lockdowns, although the restrictions in place are currently easing in many regions. We estimate that the extra week in fiscal 2021 accounted for $178.3 million of sales during the fiscal year. In fiscal 2021, changes in foreign exchange rates positively affected sales by 4.6%, resulting in an 18.3% decrease in sales on a constant currency basis.
Operating Income
Operating income decreased by $139.0 million in fiscal 2021, as compared to fiscal 2020, primarily due to the decline in business resulting from the reductions in our customers’ business in response to the COVID-19 pandemic. Operating income,
on an adjusted basis (which is a non-GAAP financial measure for which a reconciliation is provided in “Non-GAAP Reconciliations” below), decreased by $236.8 million, or 219.2%, in fiscal 2021, as compared to fiscal 2020. We estimate that the extra week had a negligible impact on adjusted operating income during the fiscal year. Foreign exchange rates positively affected operating income by 8.8% in fiscal 2021; therefore, adjusted operating income decreased 210.4% on a constant currency basis, as compared to fiscal 2020.
Gross profit dollars decreased by 15.8% in fiscal 2021, as compared to fiscal 2020, primarily attributable to decreased sales. We estimate that the extra week in fiscal 2021 accounted for $35.4 million of gross profit during the fiscal year. Changes in foreign exchange rates in fiscal 2021 positively affected gross profit by 4.7%, resulting in a 20.5% decrease in adjusted gross profit on a constant currency basis, as compared to fiscal 2020. Gross margin decreased by 51 basis points as a result of country mix, customer mix and product mix.
Operating expenses in fiscal 2021 decreased 19.3%, or $448.7 million, as compared to fiscal 2020, primarily due to a decrease in pay-related costs associated with permanent workforce reductions made in fiscal 2020 as a result of the COVID-19 pandemic. Additionally, the reduction of reserves on pre-pandemic receivables and reduced restructuring and integration charges in Europe contributed to the decrease. Operating expenses, on an adjusted basis (which is a non-GAAP financial measure for which a reconciliation is provided in “Non-GAAP Reconciliations” below), in fiscal 2021, decreased 3.9%, or $72.9 million, compared to fiscal 2020. We estimate that the extra week accounted for $35.4 million of adjusted operating expense during the fiscal year. Changes in foreign exchange rates used to translate our foreign operating expenses into U.S. dollars in fiscal 2021 negatively affected operating expenses during the period by 5.5%, resulting in a 9.4% decrease in adjusted operating expenses on a constant currency basis, as compared to fiscal 2020.
Results of SYGMA and Other Segment
For SYGMA, sales were 17.0% higher in fiscal 2021 as compared to fiscal 2020, primarily from an increase in case volume driven by the success of national and regional quick service restaurants servicing drive-through traffic through the COVID-19 pandemic. We estimate that the extra week in fiscal 2021 accounted for $133.8 million of sales during the fiscal year. Operating income increased by 42.8% in fiscal 2021, as compared to fiscal 2020, as our increase in gross profit from increased case volume exceeded the increase in operating expenses. Adjusted operating income (which is a non-GAAP financial measure for which a reconciliation is provided in “Non-GAAP Reconciliations” below) increased by 23.4% in fiscal 2021, as compared to fiscal 2020. We estimate that the extra week in fiscal 2021 accounted for $1.2 million of adjusted operating income during the fiscal year.
For the operations that are grouped within Other, operating loss decreased $21.0 million in fiscal 2021, as compared to fiscal 2020, primarily due to reduced operating expenses, as we sold a non-core asset, Cake Corporation, in the first quarter of fiscal 2021. Our hospitality business, Guest Worldwide, had a gross profit decrease of 24.5% in fiscal 2021, as compared to fiscal 2020. This business remains challenged, as hospitality occupancy rates remain low compared to prior year levels. Despite operating in a difficult hospitality environment, the business improved its underlying profitability during the second half of fiscal 2021 as leisure travel increased and as the travel and hospitality sector continued its recovery.
Corporate Expenses
Corporate expenses in fiscal 2021 decreased $59.8 million, or 6.7%, as compared to fiscal 2020, primarily due to a reduction in costs associated with the business impacts of the COVID-19 pandemic, including severance charges related to permanent headcount reductions made in the third and fourth quarters of fiscal 2020 and goodwill impairment charges recognized in fiscal 2020. Lower charges for professional fees and other business transformation initiatives also contributed to the decrease. Corporate expenses, on an adjusted basis, increased $97.7 million, or 14.6%, as compared to fiscal 2020, primarily due to an increase in incentives and stock-based compensation expense as compared to fiscal 2020, when these expenses were lower due to reduced performance against targets. Expenses for our transformational investments also contributed to the increase. We estimate that the extra week in fiscal 2021 accounted for $16.0 million of adjusted corporate expenses during the fiscal year.
Included in corporate expenses are Certain Items that totaled $62.9 million in fiscal 2021, as compared to $220.3 million in fiscal 2020. Certain Items impacting fiscal 2021 were primarily expenses associated with our business technology transformation initiatives. Certain Items impacting fiscal 2020 were primarily expenses associated with our various transformation initiatives, severance charges arising from the COVID-19 pandemic and goodwill impairment charges.
Interest Expense
Interest expense increased $471.9 million in fiscal 2021, as compared to fiscal 2020, primarily attributable the purchase of senior notes and debentures due 2027, 2028, 2030, 2039, 2040 and 2050 pursuant to a tender offer in the fourth quarter of fiscal 2021. Interest charges included a loss of $293.9 million related to the purchase costs noted above, and are considered Certain Items. Excluding Certain Items, our adjusted interest expense (which is a non-GAAP financial measure for which a reconciliation is provided in “Non-GAAP Reconciliations” below) increased $178.0 million due to higher fixed debt volume, partially offset by lower floating interest rates.
Net Earnings
Net earnings increased 143.3% in fiscal 2021 as compared to the prior year, due primarily to the items noted above for operating income and interest expense, as well as items impacting our income taxes that are discussed in Note 11, “Income Taxes,” in the Notes to Consolidated Financial Statements in Item 8. Adjusted net earnings, excluding Certain Items, decreased $291.6 million in fiscal 2021, primarily due to a significant decrease in sales volume and a large increase in interest expense.
Earnings Per Share
Basic earnings per share in fiscal 2021 were $1.03, a 145.2% increase from the comparable prior year period amount of $0.42 per share. Diluted earnings per share in fiscal 2021 were $1.02, a 142.9% increase from the comparable prior year period amount of $0.42 per share. Adjusted diluted earnings per share, excluding Certain Items (which is a non-GAAP financial measure for which a reconciliation is provided in “Non-GAAP Reconciliations” below), in fiscal 2021 were $1.44, a 28.4% decrease from the comparable prior year period amount of $2.01 per share. These results were primarily attributable to the factors discussed above related to net earnings in fiscal 2021.
Non-GAAP Reconciliations
| | |
Sysco’s results of operations for fiscal 2021 and fiscal 2020 were impacted by restructuring and transformational project costs consisting of: (1) restructuring charges; (2) expenses associated with our various transformation initiatives; and (3) facility closure and severance charges, and by acquisition-related costs consisting of: (1) intangible amortization expense related to the fiscal 2017 acquisition of Cucina Lux Investments Limited (the Brakes Acquisition); and (2) due diligence and integration costs incurred in fiscal 2021 associated with the acquisition of Greco and Sons, which closed in August 2021. Our results for fiscal 2021 were also impacted by the reduction of bad debt expense previously recognized in fiscal 2020 due to the impact of the COVID-19 pandemic on the collectability of our pre-pandemic trade receivable balances, as well as non-operating gains and losses including (1) losses on the extinguishment of debt; (2) losses on the sale of businesses; and (3) gains on the sale of property. |
|
Fiscal 2020 results of operations were also negatively impacted by costs arising from the COVID-19 pandemic and are also adjusted to remove the impact of (1) excess bad debt expense, as we experienced an increase in past due receivables and recognized additional bad debt charges; (2) goodwill and intangibles impairment charges; and (3) fixed asset impairment charges. While Sysco traditionally incurs bad debt expense, the magnitude of such expenses and benefits that we have experienced since the onset of the COVID-19 pandemic is not indicative of our normal operations. Our adjusted results have not been normalized in a manner that would exclude the full impact of the COVID-19 pandemic on our business. As such, Sysco has not adjusted its results for lost sales, inventory write-offs or other costs associated with the COVID-19 pandemic not previously stated. |
|
| The results of our foreign operations can be impacted due to changes in exchange rates applicable in converting local currencies to U.S. dollars. We measure our total Sysco and our International Foodservice Operations results on a constant currency basis. Constant currency operating results are calculated by translating current-period local currency operating results with the currency exchange rates used to translate the financial statements in the comparable prior-year period to determine what the current-period U.S. dollar operating results would have been if the currency exchange rate had not changed from the comparable prior-year period. The constant currency impact on our adjusted total Sysco and our adjusted International Foodservice Operations results are disclosed when the impact exceeds a defined threshold of greater than 1% on the growth metric. If the amount does not exceed this threshold, a disclosure will be made that the impact of the currency change was not significant. |
|
| Management believes that adjusting its operating expenses, operating income, interest expense, other (income) expense, net, net earnings and diluted earnings per share to remove these Certain Items and presenting its International Foodservice Operations results on a constant currency basis, provides an important perspective with respect to our underlying business trends and results and provides meaningful supplemental information to both management and investors that (1) is indicative of the performance of the company’s underlying operations and (2) facilitates comparisons on a year-over-year basis. |
|
Although Sysco has a history of growth through acquisitions, the Brakes Group was significantly larger than the companies historically acquired by Sysco, with a proportionately greater impact on Sysco’s consolidated financial statements. Accordingly, Sysco is excluding from its non-GAAP financial measures for the relevant period the impact of acquisition-related intangible amortization specific to the Brakes Acquisition. We believe this approach significantly enhances the comparability of Sysco’s results for fiscal 2021 and fiscal 2020. |
|
| Set forth below is a reconciliation of sales, operating expenses, operating income, interest expense, other (income) expense net earnings and diluted earnings per share to adjusted results for these measures for the periods presented. Individual components of diluted earnings per share may not add up to the total presented due to rounding. Adjusted diluted earnings per share is calculated using adjusted net earnings divided by diluted shares outstanding. |
| | | | | | | | | | | | | | | | | | | | | | | |
| | 2021 | | 2020 | | Change in Dollars | | % Change |
| | (In thousands, except for share and per share data) |
| Sales (GAAP) | $ | 51,297,843 | | | $ | 52,893,310 | | | $ | (1,595,467) | | | (3.0) | % |
| | | | | | | |
| | | | | | | |
Impact of currency fluctuations (1) | (454,004) | | | — | | | (454,004) | | | (0.9) | |
| Comparable sales using a constant currency basis (Non-GAAP) | $ | 50,843,839 | | | $ | 52,893,310 | | | $ | (2,049,471) | | | (3.9) | % |
| | | | | | | |
| Gross profit (GAAP) | $ | 9,356,749 | | | $ | 9,901,664 | | | $ | (544,915) | | | (5.5) | % |
| | | | | | | |
| | | | | | | |
Impact of currency fluctuations (1) | (94,664) | | | — | | | (94,664) | | | (1.0) | |
| Comparable gross profit using a constant currency basis (Non-GAAP) | $ | 9,262,085 | | | $ | 9,901,664 | | | $ | (639,579) | | | (6.5) | % |
| | | | | | | |
| | | | | | | |
| | | | | | | |
| | | | | | | |
| | | | | | | |
| Gross margin (GAAP) | 18.24 | % | | 18.72 | % | | | | -48 bps |
Impact of currency fluctuations (1) | (0.03) | | | — | | | | | -3 bps |
| Comparable Gross margin using a constant currency basis (Non-GAAP) | 18.22 | % | | 18.72 | % | | | | -50 bps |
| | | | | | | |
| Operating expenses (GAAP) | $ | 7,919,507 | | | $ | 9,152,159 | | | $ | (1,232,652) | | | (13.5) | % |
Impact of restructuring and transformational project costs (2) | (128,187) | | | (371,088) | | | 242,901 | | | 65.5 | |
Impact of acquisition-related costs (3) | (79,540) | | | (64,793) | | | (14,747) | | | (22.8) | |
Impact of bad debt reserve adjustments (4) | 184,813 | | | (323,403) | | | 508,216 | | | 157.1 | |
| Impact of goodwill impairment | — | | | (203,206) | | | 203,206 | | | NM |
| Operating expenses adjusted for Certain Items (Non-GAAP) | 7,896,593 | | | 8,189,669 | | | (293,076) | | | (3.6) | |
| | | | | | | |
| | | | | | | |
Impact of currency fluctuations (1) | (104,438) | | | — | | | (104,438) | | | (1.3) | |
| Comparable operating expenses adjusted for Certain Items using a constant currency basis (Non-GAAP) | $ | 7,792,155 | | | $ | 8,189,669 | | | $ | (397,514) | | | (4.9) | % |
| | | | | | | |
| Operating income (GAAP) | $ | 1,437,242 | | | $ | 749,505 | | | $ | 687,737 | | | 91.8 | % |
Impact of restructuring and transformational project costs (2) | 128,187 | | | 371,088 | | | (242,901) | | | (65.5) | |
Impact of acquisition-related costs (3) | 79,540 | | | 64,793 | | | 14,747 | | | 22.8 | |
Impact of bad debt reserve adjustments (4) | (184,813) | | | 323,403 | | | (508,216) | | | (157.1) | |
| Impact of goodwill impairment | — | | | 203,206 | | | (203,206) | | | NM |
| Operating income adjusted for Certain Items (Non-GAAP) | $ | 1,460,156 | | | $ | 1,711,995 | | | $ | (251,839) | | | (14.7) | % |
| | | | | | | |
| | | | | | | |
| | | | | | | |
| | | | | | | |
| | | | | | | |
| | | | | | | |
| | | | | | | |
| | | | | | | |
| Interest expense (GAAP) | $ | 880,137 | | | $ | 408,220 | | | $ | 471,917 | | | 115.6 | % |
| Impact of loss on extinguishment of debt | (293,897) | | | — | | | (293,897) | | | NM |
| Interest expense adjusted for Certain Items (Non-GAAP) | $ | 586,240 | | | $ | 408,220 | | | $ | 178,020 | | | 43.6 | % |
| | | | | | | |
| | | | | | | |
| | | | | | | |
| Other (income) expense (GAAP) | $ | (27,623) | | | $ | 47,901 | | | $ | (75,524) | | | 157.7 | % |
Impact of other non-routine gains and losses (5) | (10,460) | | | (46,968) | | | 36,508 | | | (77.7) | |
| Other (income) expense adjusted for Certain Items (Non-GAAP) | $ | (38,083) | | | $ | 933 | | | $ | (39,016) | | | NM |
| | | | | | | |
| | | | | | | |
| | | | | | | |
| Net earnings (GAAP) | $ | 524,209 | | | $ | 215,475 | | | $ | 308,734 | | | 143.3 | % |
Impact of restructuring and transformational project costs (2) | 128,187 | | | 371,088 | | | (242,901) | | | (65.5) | |
Impact of acquisition-related costs (3) | 79,540 | | | 64,793 | | | 14,747 | | | 22.8 | |
Impact of bad debt reserve adjustments (4) | (184,813) | | | 323,403 | | | (508,216) | | | (157.1) | |
| Impact of goodwill impairment | — | | | 203,206 | | | (203,206) | | | NM |
| Impact of loss on extinguishment of debt | 293,897 | | | — | | | 293,897 | | | NM |
| | | | | | | | | | | | | | | | | | | | | | | |
| | 2021 | | 2020 | | Change in Dollars | | % Change |
| | (In thousands, except for share and per share data) |
Impact of other non-routine gains and losses (5) | 10,460 | | | 46,968 | | | (36,508) | | | (77.7) | |
Tax impact of restructuring and transformational project costs (6) | (32,416) | | | (90,683) | | | 58,267 | | | 64.3 | |
Tax impact of acquisition-related costs (6) | (19,675) | | | (13,641) | | | (6,034) | | | (44.2) | |
Tax impact of bad debt reserves adjustments (6) | 46,260 | | | (76,864) | | | 123,124 | | | 160.2 | |
Tax impact of loss on extinguishment of debt (6) | (79,323) | | | — | | | (79,323) | | | NM |
Tax impact of other non-routine gains and losses (6) | (2,692) | | | (12,644) | | | 9,952 | | | 78.7 | |
Impact of foreign tax rate change (7) | (23,197) | | | 924 | | | (24,121) | | | NM |
| Net earnings adjusted for Certain Items (Non-GAAP) | $ | 740,437 | | | $ | 1,032,025 | | | $ | (291,588) | | | (28.3) | % |
| | | | | | | |
| | | | | | | |
| | | | | | | |
| Diluted earnings per share (GAAP) | $ | 1.02 | | | $ | 0.42 | | | $ | 0.60 | | | 142.9 | % |
Impact of restructuring and transformational project costs (2) | 0.25 | | | 0.72 | | | (0.47) | | | (65.3) | |
Impact of acquisition-related costs (3) | 0.15 | | | 0.13 | | | 0.02 | | | 15.4 | |
Impact of bad debt reserve adjustments (4) | (0.36) | | | 0.63 | | | (0.99) | | | (157.1) | |
| Impact of goodwill impairment | — | | | 0.40 | | | (0.40) | | | NM |
| Impact of loss on extinguishment of debt | 0.57 | | | — | | | 0.57 | | | NM |
Impact of other non-routine gains and losses (5) | 0.02 | | | 0.09 | | | (0.07) | | | (77.8) | |
Tax impact of restructuring and transformational project costs (6) | (0.06) | | | (0.18) | | | 0.12 | | | 66.7 | |
Tax impact of acquisition-related costs (6) | (0.04) | | | (0.03) | | | (0.01) | | | (33.3) | |
Tax impact of bad debt reserves adjustments (6) | 0.09 | | | (0.15) | | | 0.24 | | | 160.0 | |
Tax impact of loss on extinguishment of debt (6) | (0.15) | | | — | | | (0.15) | | | NM |
Tax impact of non-routine gains and losses (6) | (0.01) | | | (0.02) | | | 0.01 | | | 50.0 | |
Impact of foreign tax rate change (7) | (0.05) | | | — | | | (0.05) | | | NM |
Diluted earnings per share adjusted for Certain Items (Non-GAAP) (8) | $ | 1.44 | | | $ | 2.01 | | | $ | (0.57) | | | (28.4) | % |
| | | | | | | |
| | | | | | | |
| | | | | | | |
| | | | | | | |
| | | | | |
(1) | Represents a constant currency adjustment, which eliminates the impact of foreign currency fluctuations on current year results. |
(2) | Fiscal 2021 includes $72 million related to restructuring charges, facility closure and severance charges and $56 million related to various transformation initiative costs, primarily consisting of changes to our business technology strategy. Fiscal 2020 includes $265 million related to restructuring, facility closure and severance charges and $106 million related to various transformation initiative costs, primarily consisting of changes to our business technology strategy. |
(3) | Fiscal 2021 represents $74 million of intangible amortization expense from the Brakes Acquisition, which is included in the results of International Foodservice, as well as $6 million of due diligence and integration costs related to Greco and Sons, which are included within Corporate expenses. Fiscal 2020 represents intangible amortization expense from the Brakes Acquisition. |
(4) | Fiscal 2021 represents the reduction of bad debt charges previously taken on pre-pandemic trade receivable balances in fiscal 2020. Fiscal 2020 represents excess bad debt charges recognized on the increase in past due receivables arising from the COVID-19 pandemic. |
(5) | Fiscal 2021 includes $23 million of loss from the sale of businesses, $9 million of gains on sale of property and other non-recurring gains and losses. Fiscal 2020 represents the impairment of assets held for sale. |
(6) | The tax impact of adjustments for Certain Items is calculated by multiplying the pretax impact of each Certain Item by the statutory rates in effect for each jurisdiction where the Certain Item was incurred. |
(7) | Fiscal 2021 represents a net benefit from remeasuring Sysco’s accrued income taxes, deferred tax asset and deferred tax liabilities due to changes in tax rates in the United Kingdom. |
(8) | Individual components of diluted earnings per share may not add up to the total presented due to rounding. Total diluted earnings per share is calculated using adjusted net earnings divided by diluted shares outstanding. |
| |
| NM represents that the percentage change is not meaningful. |
Set forth below is a reconciliation by segment of actual operating expenses and operating income to adjusted results for these measures for the periods presented (dollars in thousands):
| | | | | | | | | | | | | | | | | | | | | | | |
| U.S. FOODSERVICE OPERATIONS | 2021 | | 2020 | | Change in Dollars | | % Change |
| | | | | | | |
| | | | | | | |
| | | | | | | |
| | | | | | | |
| | | | | | | |
| | | | | | | |
| | | | | | | |
| | | | | | | |
| | | | | | | |
| | | | | | | |
| | | | | | | |
| | | | | | | |
| Operating expenses (GAAP) | $ | 4,552,123 | | | $ | 5,251,563 | | | $ | (699,440) | | | (13.3) | % |
| Impact of restructuring and transformational project costs | (4,056) | | | (10,145) | | | 6,089 | | | 60.0 | |
| | | | | | | |
Impact of bad debt reserve adjustments (1) | 143,036 | | | (230,654) | | | 373,690 | | | 162.0 | |
| | | | | | | |
| Operating expenses adjusted for Certain Items (Non-GAAP) | $ | 4,691,103 | | | $ | 5,010,764 | | | $ | (319,661) | | | (6.4) | % |
| | | | | | | |
| | | | | | | |
| | | | | | | |
| Operating income (GAAP) | $ | 2,456,564 | | | $ | 2,003,159 | | | $ | 453,405 | | | 22.6 | % |
| Impact of restructuring and transformational project costs | 4,056 | | | 10,145 | | | (6,089) | | | (60.0) | |
| | | | | | | |
Impact of bad debt reserve adjustments (1) | (143,036) | | | 230,654 | | | (373,690) | | | (162.0) | |
| | | | | | | |
| Operating income adjusted for Certain Items (Non-GAAP) | $ | 2,317,584 | | | $ | 2,243,958 | | | $ | 73,626 | | | 3.3 | % |
| | | | | | | |
| | | | | | | |
| | | | | | | |
| INTERNATIONAL FOODSERVICE OPERATIONS | | | | | | | |
| Sales (GAAP) | $ | 8,350,638 | | | $ | 9,672,190 | | | $ | (1,321,552) | | | (13.7) | % |
| | | | | | | |
| | | | | | | |
Impact of currency fluctuations (2) | (444,380) | | | — | | | (444,380) | | | (4.6) | |
| Comparable sales using a constant currency basis (Non-GAAP) | $ | 7,906,258 | | | $ | 9,672,190 | | | $ | (1,765,932) | | | (18.3) | % |
| | | | | | | |
| Gross Profit (GAAP) | $ | 1,645,448 | | | $ | 1,955,190 | | | $ | (309,742) | | | (15.8) | % |
| | | | | | | |
| | | | | | | |
Impact of currency fluctuations (2) | (91,444) | | | — | | | (91,444) | | | (4.7) | |
| Comparable gross profit using a constant currency basis (Non-GAAP) | $ | 1,554,004 | | | $ | 1,955,190 | | | $ | (401,186) | | | (20.5) | % |
| | | | | | | |
| | | | | | | |
| | | | | | | |
| | | | | | | |
| | | | | | | |
| Gross Margin (GAAP) | 19.70 | % | | 20.21 | % | | | | -51 bps |
Impact of currency fluctuations (2) | 0.05 | % | | — | % | | | | -5 bps |
| Comparable gross margin using a constant currency basis (Non-GAAP) | 19.66 | % | | 20.21 | % | | | | -56 bps |
| | | | | | | |
| Operating expenses (GAAP) | $ | 1,877,851 | | | $ | 2,326,597 | | | $ | (448,746) | | | (19.3) | % |
Impact of restructuring and transformational project costs (3) | (66,147) | | | (191,900) | | | 125,753 | | | 65.5 | |
Impact of acquisition-related costs (4) | (73,673) | | | (64,793) | | | (8,880) | | | (13.7) | |
Impact of bad debt reserve adjustments (1) | 36,214 | | | (88,271) | | | 124,485 | | | 141.0 | |
| Impact of goodwill impairment | — | | | (134,481) | | | 134,481 | | | NM |
| Operating expenses adjusted for Certain Items (Non-GAAP) | 1,774,245 | | | 1,847,152 | | | (72,907) | | | (3.9) | |
| | | | | | | |
| | | | | | | |
Impact of currency fluctuations (2) | (100,945) | | | — | | | (100,945) | | | (5.5) | |
| Comparable operating expenses adjusted for Certain Items using a constant currency basis (Non-GAAP) | $ | 1,673,300 | | | $ | 1,847,152 | | | $ | (173,852) | | | (9.4) | % |
| | | | | | | |
| Operating loss (GAAP) | $ | (232,403) | | | $ | (371,407) | | | $ | 139,004 | | | 37.4 | % |
Impact of restructuring and transformational project costs (3) | 66,147 | | | 191,900 | | | (125,753) | | | (65.5) | |
Impact of acquisition-related costs (4) | 73,673 | | | 64,793 | | | 8,880 | | | 13.7 | |
Impact of bad debt reserve adjustments (1) | (36,214) | | | 88,271 | | | (124,485) | | | (141.0) | |
| Impact of goodwill impairment | — | | | 134,481 | | | (134,481) | | | NM |
| Operating (loss) income adjusted for Certain Items (Non-GAAP) | (128,797) | | | 108,038 | | | (236,835) | | | (219.2) | |
| | | | | | | |
| | | | | | | |
Impact of currency fluctuations (2) | 9,501 | | | — | | | 9,501 | | | (8.8) | |
| Comparable operating (loss) income adjusted for Certain Items using a constant currency basis (Non-GAAP) | $ | (119,296) | | | $ | 108,038 | | | $ | (227,334) | | | (210.4) | % |
| | | | | | | |
| | | | | | | | | | | | | | | | | | | | | | | |
| SYGMA | | | | | | | |
| | | | | | | |
| | | | | | | |
| | | | | | | |
| | | | | | | |
| | | | | | | |
| | | | | | | |
| | | | | | | |
| | | | | | | |
| | | | | | | |
| | | | | | | |
| | | | | | | |
| | | | | | | |
| Operating expenses (GAAP) | $ | 501,360 | | | $ | 446,614 | | | $ | 54,746 | | | 12.3 | % |
| Impact of restructuring and transformational project costs | (7) | | | (5,793) | | | 5,786 | | | 99.9 | |
| | | | | | | |
| | | | | | | |
| | | | | | | |
| Operating expenses adjusted for Certain Items (Non-GAAP) | $ | 501,353 | | | $ | 440,821 | | | $ | 60,532 | | | 13.7 | % |
| | | | | | | |
| | | | | | | |
| | | | | | | |
| Operating income (GAAP) | $ | 52,654 | | | $ | 36,880 | | | $ | 15,774 | | | 42.8 | % |
| Impact of restructuring and transformational project costs | 7 | | | 5,793 | | | (5,786) | | | (99.9) | |
| | | | | | | |
| | | | | | | |
| | | | | | | |
| Operating income adjusted for Certain Items (Non-GAAP) | $ | 52,661 | | | $ | 42,673 | | | $ | 9,988 | | | 23.4 | % |
| | | | | | | |
| | | | | | | |
| | | | | | | |
| OTHER | | | | | | | |
| | | | | | | |
| | | | | | | |
| | | | | | | |
| | | | | | | |
| | | | | | | |
| | | | | | | |
| | | | | | | |
| | | | | | | |
| | | | | | | |
| | | | | | | |
| | | | | | | |
| | | | | | | |
| Operating expenses (GAAP) | $ | 160,790 | | | $ | 240,245 | | | $ | (79,455) | | | (33.1) | % |
| Impact of restructuring and transformational project costs | (956) | | | — | | | (956) | | | NM |
| | | | | | | |
Impact of bad debt reserve adjustments (1) | 5,563 | | | (4,478) | | | 10,041 | | | 224.2 | |
| Impact of goodwill impairment | — | | | (11,660) | | | 11,660 | | | NM |
| Operating expenses adjusted for Certain Items (Non-GAAP) | $ | 165,397 | | | $ | 224,107 | | | $ | (58,710) | | | (26.2) | % |
| | | | | | | |
| | | | | | | |
| | | | | | | |
| Operating loss (GAAP) | $ | (396) | | | $ | (21,361) | | | $ | 20,965 | | | 98.1 | % |
| Impact of restructuring and transformational project costs | 956 | | | — | | | 956 | | | NM |
| | | | | | | |
Impact of bad debt reserve adjustments (1) | (5,563) | | | 4,478 | | | (10,041) | | | (224.2) | |
| Impact of goodwill impairment | — | | | 11,660 | | | (11,660) | | | NM |
| Operating loss adjusted for Certain Items (Non-GAAP) | $ | (5,003) | | | $ | (5,223) | | | $ | 220 | | | 4.2 | % |
| | | | | | | |
| | | | | | | |
| | | | | | | |
| CORPORATE | | | | | | | |
| | | | | | | |
| | | | | | | |
| | | | | | | |
| | | | | | | |
| Operating expenses (GAAP) | $ | 827,383 | | | $ | 887,140 | | | $ | (59,757) | | | (6.7) | % |
Impact of restructuring and transformational project costs (5) | (57,021) | | | (163,249) | | | 106,228 | | | 65.1 | |
Impact of acquisition-related costs (6) | (5,867) | | | — | | | (5,867) | | | NM |
| | | | | | | |
| Impact of goodwill impairment | — | | | (57,066) | | | 57,066 | | | NM |
| Operating expenses adjusted for Certain Items (Non-GAAP) | $ | 764,495 | | | $ | 666,825 | | | $ | 97,670 | | | 14.6 | % |
| | | | | | | |
| | | | | | | |
| | | | | | | |
| Operating loss (GAAP) | $ | (839,177) | | | $ | (897,766) | | | $ | 58,589 | | | 6.5 | % |
Impact of restructuring and transformational project costs (5) | 57,021 | | | 163,249 | | | (106,228) | | | (65.1) | |
Impact of acquisition-related costs (6) | 5,867 | | | — | | | 5,867 | | | NM |
| | | | | | | |
| Impact of goodwill impairment | — | | | 57,066 | | | (57,066) | | | NM |
| Operating loss adjusted for Certain Items (Non-GAAP) | $ | (776,289) | | | $ | (677,451) | | | $ | (98,838) | | | (14.6) | % |
| | | | | | | |
| | | | | | | |
| | | | | | | |
| | | | | | | |
| | | | | | | |
| | | | | | | |
| | | | | | | |
| | | | | | | |
| | | | | | | |
| | | | | | | |
| | | | | | | |
| | | | | | | |
| | | | | | | |
| | | | | | | |
| | | | | | | |
| | | | | | | |
| | | | | | | |
| | | | | | | |
| | | | | | | |
| | | | | | | |
| | | | | | | |
| | | | | | | |
| | | | | | | |
| | | | | | | |
| | | | | | | |
| | | | | | | |
| | | | | | | |
| | | | | | | |
| | | | | | | |
| | | | | | | |
| | | | | | | |
| | | | | | | |
| | | | | | | |
| | | | | | | |
| | | | | | | |
| | | | | | | |
| | | | | | | |
| | | | | | | |
| | | | | |
(1) | Fiscal 2021 represents the reduction of bad debt charges previously taken on pre-pandemic trade receivable balances in fiscal 2020. Fiscal 2020 represents excess bad debt charges recognized on the increase in past due receivables arising from the COVID-19 pandemic. |
(2) | Represents a constant currency adjustment, which eliminates the impact of foreign currency fluctuations on current year results. |
(3) | Includes restructuring, severance and facility closure costs primarily in Europe. |
(4) | Represents intangible amortization expense from the Brakes Acquisition. |
(5) | Includes various transformation initiative costs, primarily consisting of changes to our business technology strategy. |
(6) | Fiscal 2021 represents due diligence and integration costs related to the acquisition of Greco and Sons in the first quarter of fiscal 2022. |
| |
| |
| NM represents that the percentage change is not meaningful. |
EBITDA and Adjusted EBITDA
EBITDA and adjusted EBITDA should not be used as a substitute for the most comparable GAAP measure in assessing Sysco’s overall financial performance for the periods presented. An analysis of any non-GAAP financial measure should be used in conjunction with results presented in accordance with GAAP. See “Key Performance Indicators” for further discussion regarding this non-GAAP financial measure. Set forth below is a reconciliation of actual net earnings (loss) to EBITDA and to adjusted EBITDA results for the periods presented (dollars in thousands):
| | | | | | | | | | | | | | | | | | | | | | | |
| 2021 | | 2020 | | Change in Dollars | | % Change |
| Net earnings (GAAP) | $ | 524,209 | | | $ | 215,475 | | | $ | 308,734 | | | 143.3 | % |
| Interest (GAAP) | 880,137 | | | 408,220 | | | 471,917 | | | 115.6 | |
| Income taxes (GAAP) | 60,519 | | | 77,909 | | | (17,390) | | | (22.3) | |
| Depreciation and amortization (GAAP) | 737,916 | | | 805,765 | | | (67,849) | | | (8.4) | |
| EBITDA (Non-GAAP) | $ | 2,202,781 | | | $ | 1,507,369 | | | $ | 695,412 | | | 46.1 | % |
| Certain Item adjustments: | | | | | | | |
Impact of restructuring and transformational project costs (1) | 120,693 | | | 290,284 | | | (169,591) | | | (58.4) | |
| Impact of acquisition-related costs | 5,867 | | | — | | | 5,867 | | | NM |
Impact of bad debt reserve adjustments (2) | (184,813) | | | 323,403 | | | (508,216) | | | (157.1) | |
| Impact of goodwill impairment | — | | | 203,206 | | | (203,206) | | | NM |
Impact of other non-routine gains and losses (3) | 10,460 | | | 46,968 | | | (36,508) | | | (77.7) | |
EBITDA adjusted for Certain Items (Non-GAAP)(4) | $ | 2,154,988 | | | $ | 2,371,230 | | | $ | (216,242) | | | (9.1) | % |
| | | | | | | |
| | | | | | | |
| | | | | |
(1) | Includes various transformation initiative costs, primarily consisting of changes to our business technology strategy, excluding charges related to accelerated depreciation. |
(2) | Fiscal 2021 represents the reduction of bad debt charges previously taken on pre-pandemic trade receivable balances in fiscal 2020. Fiscal 2020 represents excess bad debt charges recognized on the increase in past due receivables arising from the COVID-19 pandemic. |
(3) | Fiscal 2021 includes $23 million of loss from the sale of businesses, $9 million of gains on sale of property and other non-recurring items. Fiscal 2020 represents the impairment of assets held for sale. |
(4) | In arriving at adjusted EBITDA, Sysco does not adjust out interest income of $15 million and $12 million or non-cash stock compensation expense of $96 million and $42 million for fiscal 2021 and fiscal 2020, respectively. |
Liquidity and Capital Resources
Highlights
Below are comparisons of the cash flows from fiscal 2021 to fiscal 2020:
•Cash flows from operations were $1.9 billion in fiscal 2021, compared to $1.6 billion in fiscal 2020;
•Net capital expenditures totaled $411.5 million in fiscal 2021, compared to $691.7 million in fiscal 2020;
•Free cash flow was $1.5 billion in fiscal 2021, compared to $927.0 million in fiscal 2020 (see “Cash Flows – Free Cash Flow – Non-GAAP Reconciliation” below for an explanation of this non-GAAP financial measure);
•There were no acquisitions in fiscal 2021; cash used for acquisition of businesses was $142.8 million in fiscal 2020;
•There were $826.2 million of bank and commercial paper repayments, net, in fiscal 2021, compared to $616.7 million of bank and commercial paper borrowings, net in fiscal 2020;
•Dividends paid were $917.6 million in fiscal 2021, compared to $856.3 million in fiscal 2020; and
•There were no stock repurchases in fiscal 2021; cash paid for treasury stock repurchases was $844.7 million in fiscal 2020.
We repaid senior notes in the amount of $1.3 billion, purchased senior notes and debentures in the amount of $712.4 million pursuant to a tender offer in fiscal 2021 and repaid $700 million of borrowings under our long-term revolving credit facility, utilizing cash flow from operations.
In response to the COVID-19 pandemic and its impact on our working capital, as well as the uncertainty regarding our ability to generate cash flow in the near term, we took steps to increase our liquidity in the second half of fiscal 2020, including the issuance of senior notes, borrowings under our long-term revolving credit facility and borrowings under a U.K. commercial paper program. In the fourth quarter of fiscal 2020, we entered into an amendment to our long-term revolving credit facility, which required us to suspend share repurchases and dividend increases. In the fourth quarter of fiscal 2021, we further amended our long-term revolving credit facility to increase the authorized dividend per share amount, which allowed us to declare a dividend increase of $0.02 per share, resulting in a quarterly cash dividend of $0.47 per share payable in the first quarter of fiscal 2022. In fiscal 2021, we continued to reduce our debt levels, and have paid down $3.4 billion of debt. As of July 3, 2021, there were no borrowings outstanding under our long-term revolving credit facility. As of August 10, 2021, the company has approximately $4.7 billion in cash and available liquidity.
Sources and Uses of Cash
Sysco’s strategic objectives include continuous investment in our business; these investments are funded by a combination of cash from operations and access to capital from financial markets. Our operations historically have produced significant cash flow. Cash generated from operations is generally allocated to:
•working capital requirements;
•capital investments in facilities, systems, fleet, other equipment and technology;
•cash dividends;
•acquisitions consistent with our growth strategy;
•debt repayments;
•share repurchases; and
•contributions to our various retirement plans.
Any remaining cash generated from operations may be invested in high-quality, short-term instruments. As a part of our ongoing strategic analysis, we regularly evaluate business opportunities, including potential acquisitions and sales of assets and businesses, and our overall capital structure. Any transactions resulting from these evaluations may materially impact our liquidity, borrowing capacity, leverage ratios and capital availability.
We continue to be in a strong financial position based on our balance sheet and operating cash flows; however, our liquidity and capital resources can be influenced by economic trends and conditions that impact our results of operations. We believe our mechanisms to manage working capital, such as actively working with customers to receive payments on receivables, optimizing inventory levels and maximizing payment terms with vendors, have been sufficient to limit a significant unfavorable impact on our cash flows from operations. We believe these mechanisms will continue to prevent a significant unfavorable impact on our cash flows from operations.
We extend credit terms to some of our customers based on our assessment of each customer’s creditworthiness. We monitor each customer’s account and will suspend shipments if necessary. In the ordinary course of business, customers periodically negotiate extended payment terms on trade accounts receivable. The company may utilize purchase arrangements with third-party financial institutions to transfer portions of our trade accounts receivable balance on a non-recourse basis in order to extend terms for the customer without negatively impacting our cash flow. The arrangements meet the requirements for the receivables transferred to be accounted for as sales. See Note 1, “Summary of Accounting Policies,” in the Notes to Consolidated Financial Statements in Item 8 for additional information.
As of July 3, 2021, we had $3.0 billion in cash and cash equivalents, approximately 19% of which was held by our international subsidiaries generated from our earnings of international operations. If these earnings were transferred among countries or repatriated to the U.S., such amounts may be subject to withholding and additional foreign tax obligations. Additionally, Sysco Corporation has provided intercompany loans to certain of its international subsidiaries, and when interest and principal payments are made, some of this cash will move to the U.S.
Our wholly owned captive insurance subsidiary (the Captive) must maintain a sufficient level of liquidity to fund future reserve payments. As of July 3, 2021, the Captive held $129.7 million of fixed income marketable securities and $30.0 million of restricted cash and restricted cash equivalents in a restricted investment portfolio in order to meet solvency requirements. We purchased $53.1 million in marketable securities in fiscal 2021 and received $36.0 million in proceeds from the sale of marketable securities in that period.
Cash Requirements
The Company’s cash requirements within the next twelve months include accounts payable and accrued liabilities, current maturities of long-term debt, other current liabilities, and purchase commitments and other obligations. We expect the cash required to meet these obligations to be primarily generated through a combination of cash from operations and access to capital from financial markets.
Our long-term cash requirements under our various contractual obligations and commitments include:
•Debt Obligations and Interest Payments – See Note 12, “Debt and Other Financing Arrangements,” in the Notes to Consolidated Financial Statements in Item 8 for further detail of our debt and the timing of expected future principal and interest payments.
•Operating and Finance leases – See Note 13, “Leases,” in the Notes to Consolidated Financial Statements in Item 8 for further detail of our obligations and the timing of expected future payments.
•Deferred Compensation – The estimate of the timing of future payments under the Executive Deferred Compensation Plan and Management Savings Plan involves the use of certain assumptions, including retirement ages and payout periods. See Note 14, “Company-Sponsored Employee Benefit Plans,” in the Notes to Consolidated Financial Statements in Item 8 for further detail of our obligations and the timing of expected future payments.
•Purchase and Other Obligations – Purchase obligations include agreements for purchases of product in the normal course of business for which all significant terms have been confirmed, including minimum quantities resulting from our category management process. Such amounts are based on estimates. Purchase obligations also include amounts committed with various third-party service providers to provide information technology services for periods up to fiscal 2026. See discussion under Note 20, “Commitments and Contingencies,” in the Notes to Consolidated Financial Statements in Item 8. Purchase obligations exclude full requirements electricity contracts where no stated minimum purchase volume is required.
•Other Liabilities – These include other long-term liabilities reflected in our Consolidated Balance Sheets as of July 3, 2021, including obligations associated with certain employee benefit programs, unrecognized tax benefits and various long-term liabilities, which have some inherent uncertainty in the timing of these payments.
•Contingent Consideration – Certain acquisitions involve contingent consideration, typically payable only if certain operating results are attained or certain outstanding contingencies are resolved. See Note 4, “Acquisitions,” in the Notes to Consolidated Financial Statements in Item 8 for aggregate contingent consideration amounts outstanding as of July 3, 2021.
We believe the following sources will be sufficient to meet our anticipated cash requirements for at least the next twelve months, while maintaining sufficient liquidity for normal operating purposes:
•our cash flows from operations;
•the availability of additional capital under our existing commercial paper programs, supported by our revolving credit facility; and
•our ability to access capital from financial markets, including issuances of debt securities, either privately or under our shelf registration statement filed with the SEC.
Due to our strong financial position, we believe that we will continue to be able to effectively access the commercial paper market and long-term capital markets, if necessary.
Cash Flows
Operating Activities
We generated $1.9 billion and $1.6 billion in cash flows from operations in fiscal 2021 and fiscal 2020, respectively. Fiscal 2021 reflects higher operating results, as well as year-over-year favorable comparisons on accrued expenses, income taxes and working capital.
The positive impact from accrued expenses was primarily due to a favorable comparison of customer rebate payments resulting from an increase in volume purchase incentives earned by our customers, as sales volumes increased throughout fiscal 2021, and a favorable comparison of incentive payments resulting from prior year incentive payments exceeding current payments, coupled with an increase in incentive accruals in fiscal 2021 due to improved business performance.
Income tax cash payments decreased $273.1 million year-over-year. This was a result of higher accrual of earnings in fiscal 2019 and the beginning of fiscal 2020 used to calculate estimated tax payments in fiscal 2020. Lower earnings at the end of fiscal 2020 and in fiscal 2021, including the impact of the debt tender in the fourth quarter of fiscal 2021, resulted in lower estimated tax payments for fiscal 2021. Additionally in fiscal 2021, we received a $50 million refund related to a payment made in fiscal 2020.
Changes in working capital had a positive impact of $49.3 million on cash flow from operations period-over-period. There was a favorable comparison on accounts payable, partially offset by unfavorable comparisons on accounts receivable and inventories. Accounts payable and inventories have increased, as we continue our business recovery efforts and investments in inventory. In the second half of fiscal 2021, we invested heavily in inventory, and we ended the fiscal year with inventory on-hand and inventory on-order in a combined amount that exceeds our pre-COVID-19 levels, which should enable us to ship product on time and in full during the upcoming period of expected volume recovery. The unfavorable comparison in cash flows from accounts receivables is primarily due to our customers beginning to purchase more in the second half of fiscal 2021, coupled with significantly lower sales in the latter half of fiscal 2020 due to the COVID-19 pandemic. In fiscal 2021, we recorded a net credit to the provision for losses on receivables totaling $152.7 million, which reflects a benefit on the reduction of our allowance for pre-pandemic receivable balances, as we have made excellent progress on obtaining timely payments from our customers. We continue to work with our customers to collect past due balances, including through the use of payment plans. We have also discontinued charging interest on past due balances.
The positive impacts to cash flows from operating activities noted above were partially offset by an unfavorable comparison year-over-year with regard to the provision for losses on trade receivables. During fiscal 2021, we recognized a net benefit on our allowance for credit losses on receivables due to improved collections on Sysco’s pre-pandemic receivables, as compared to the excess bad debt charges recognized in fiscal 2020, due to the impact of the COVID-19 pandemic on our customers.
Investing Activities
Fiscal 2021 capital expenditures included:
•buildings and building improvements;
•investments in technology;
•warehouse equipment; and
•fleet replacements.
Fiscal 2020 capital expenditures included:
•buildings and building improvements;
•fleet replacements;
•investments in technology; and
•warehouse equipment.
The level of gross capital expenditures in fiscal 2021 decreased $249.7 million, as compared to fiscal 2020. We reduced our capital expenditures in fiscal 2021 by eliminating capital projects that were not critical for our business in order to preserve our liquidity in response to the COVID-19 crisis. We estimate our capital expenditures, net of proceeds from sales of assets, in fiscal 2022 will be approximately 1.3% of fiscal 2022 sales as we continue to invest in our business for the long-term.
Fiscal 2022 expenditures are expected to include facility expansions and new facility construction; fleet and other equipment purchases, including replacements; and investments in technology.
During fiscal 2020, the company paid cash of $142.8 million for acquisitions, net of cash acquired, including the acquisitions of J. Kings Food Service Professionals, Armstrong Produce, and Kula Produce.
Free Cash Flow
Our free cash flow for fiscal 2021 increased by $565.3 million, to $1.5 billion, as compared to fiscal 2020, principally as a result of an increase in cash flows from operations and year-over-year decreased capital expenditures.
Non-GAAP Reconciliation
Free cash flow should not be used as a substitute for the most comparable GAAP measure in assessing the company’s liquidity for the periods presented. An analysis of any non-GAAP financial measure should be used in conjunction with results presented in accordance with GAAP. See “Key Performance Indicators” for further discussion regarding this non-GAAP financial measure. In the table that follows, free cash flow for each period presented is reconciled to net cash provided by operating activities.
| | | | | | | | | | | | | | | | | | | | | | | |
| | 2021 | | 2020 | | Change in Dollars | | % Change |
| | (In thousands) |
| Net cash provided by operating activities (GAAP) | $ | 1,903,842 | | | $ | 1,618,680 | | | $ | 285,162 | | | 17.6 | % |
| Additions to plant and equipment | (470,676) | | | (720,423) | | | 249,747 | | | (34.7) | |
| Proceeds from sales of plant and equipment | 59,147 | | | 28,717 | | | 30,430 | | | 106.0 | |
| Free Cash Flow (Non-GAAP) | $ | 1,492,313 | | | $ | 926,974 | | | $ | 565,339 | | | 61.0 | % |
Financing Activities
Equity Transactions
Proceeds from exercises of share-based compensation awards were $130.4 million and $227.6 million in fiscal 2021 and fiscal 2020, respectively. The level of option exercises, and thus proceeds, will vary from period to period and is largely dependent on movements in our stock price and the time remaining before option grants expire.
We have traditionally engaged in share repurchase programs to allow Sysco to continue offsetting dilution resulting from shares issued under the company’s benefit plans and to make opportunistic repurchases. In August 2019, our Board of Directors approved a repurchase program to authorize the repurchase of up to $2.5 billion of the company’s common stock through the end of fiscal 2021. During March 2020, we discontinued share repurchases under the program, and pursuant to the amendment to our long-term revolving credit facility as described below under “Debt Activity and Borrowing Availability,” we repurchased no shares during fiscal 2021, compared to 11.1 million shares repurchased in fiscal 2020 for $844.7 million. The remaining authorization of approximately $2.1 billion expired at the end of fiscal 2021. In May 2021, our Board of Directors approved a separate repurchase program to authorize the repurchase of up to $5.0 billion of the company’s common stock, which will remain available until fully utilized.
Certain conditions would need to be present for us to resume share repurchases in fiscal 2022, including but not limited to the following: the market recovery must be robust; our investments in our business must be fully funded, including acquisitions; our debt reduction must continue and our investment grade credit rating must be preserved; and excess liquidity must exist to fund the repurchase program. If current trends continue with respect to each of these conditions and our balanced capital allocation strategy is employed, we may return more capital to shareholders through share repurchases in fiscal 2022.
We have made dividend payments to our shareholders in each fiscal year since our company’s inception. Dividends paid were $917.6 million, or $1.80 per share, in fiscal 2021 and $856.3 million, or $1.68 per share, in fiscal 2020. In May 2021, we declared our regular quarterly dividend for the fourth quarter of fiscal 2021 of $0.47 per share, a $0.02 per share increase from the prior quarter, which was paid in July 2021.
In August 2018, we filed a universal shelf registration statement with the SEC under which we, as a well-known seasoned issuer, have the ability to issue and sell an indeterminate amount of various types of debt and equity securities. The
specific terms of any securities we issue under this registration statement, which we expect to replace with a new universal shelf registration statement to be filed shortly after this Form 10-K, will be provided in the applicable prospectus supplements.
In November 2000, we filed with the SEC a shelf registration statement covering 30,000,000 shares of common stock to be offered from time to time in connection with acquisitions. As of August 10, 2021, 29,477,835 shares remained available for issuance under this registration statement.
Debt Activity and Borrowing Availability
Our debt activity, including issuances and repayments, and our borrowing availability is described in Note 12, “Debt and Other Financing Arrangements,” in the Notes to Consolidated Financial Statements in Item 8. Our outstanding borrowings at July 3, 2021, and repayment activity since the end of fiscal 2021 are disclosed within those notes. Updated amounts at August 10, 2021, include:
•No outstanding borrowings from the credit facility supporting our U.S. commercial paper program; and
•No outstanding borrowings under our U.S. commercial paper program.
Our aggregate commercial paper issuances and short-term bank borrowings had weighted average interest rates of 0.97% for fiscal 2021 and 1.99% for fiscal 2020.
In the next 12 months, $450 million of long-term debt will mature. We expect to repay these senior notes in the fourth quarter of fiscal 2022 and to fund this repayment with internally generated funds.
The availability of financing in the form of debt is influenced by many factors, including our profitability, free cash flows, debt levels, credit ratings, debt covenants and economic and market conditions. For example, a significant downgrade in our credit ratings or adverse conditions in the capital markets may increase the cost of borrowing for us or limit our access to capital. To date, we have not experienced difficulty accessing the credit markets. As of August 10, 2021, the company had approximately $4.7 billion in cash and available liquidity.
During the fourth quarter of fiscal 2020 due to worsening business conditions, Sysco entered into an amendment to its $2 billion long-term revolving credit facility that expires on June 28, 2024. During the fourth quarter of fiscal 2021 due to improving business conditions, we further amended our long-term revolving credit facility to (1) adjust the covenant restricting increases to Sysco’s regular quarterly dividend to enable future increases; (2) remove access to a 364-day credit facility that the company believes it no longer needs; and (3) adjust the covenant requiring Sysco to maintain a certain ratio of EBITDA to consolidated interest expense. As of July 3, 2021, Sysco was in compliance with all of its debt covenants, and the company expects to remain in compliance through the next twelve months.
Guarantor Summarized Financial Information
On January 19, 2011, the wholly owned U.S. Broadline subsidiaries of Sysco Corporation, which distribute a full line of food products and a wide variety of non-food products, entered into full and unconditional guarantees of all outstanding senior notes and debentures of Sysco Corporation. A list of the current guarantors is included in Exhibit 22 to this Form 10-K. All subsequent issuances of senior notes and debentures in the U.S. and borrowings under the company’s $2.0 billion long-term revolving credit facility have also been guaranteed by these subsidiaries, as discussed in Note 12, “Debt and Other Financing Arrangements,” in the Notes to Consolidated Financial Statements in Item 8. As of July 3, 2021, Sysco had a total of $10.6 billion in senior notes, debentures and borrowings under the long-term revolving credit facility that were guaranteed by these subsidiary guarantors. Our remaining consolidated subsidiaries (non-guarantor subsidiaries) are not obligated under the senior notes indenture, debentures indenture or our long-term revolving credit facility.
All subsidiary guarantors are 100% owned by the parent company, all guarantees are full and unconditional, and all guarantees are joint and several. The guarantees rank equally and ratably in right of payment with all other existing and future unsecured and unsubordinated indebtedness of the respective guarantors.
The assets of Sysco Corporation consist principally of the stock of its subsidiaries. Therefore, the rights of Sysco Corporation and the rights of its creditors to participate in the assets of any subsidiary upon liquidation, recapitalization or otherwise will be subject to the prior claims of that subsidiary’s creditors, except to the extent that claims of Sysco Corporation itself and/or the claims of those creditors themselves may be recognized as creditor claims of the subsidiary. Furthermore, the ability of Sysco Corporation to service its indebtedness and other obligations is dependent upon the earnings and cash flow of its subsidiaries and the distribution or other payment to it of such earnings or cash flow. If any of Sysco Corporation’s
subsidiaries becomes insolvent, the direct creditors of that subsidiary will have a prior claim on its assets. Sysco Corporation’s rights and the rights of its creditors, including the rights of a holder of senior notes as an owner of debt securities, will be subject to that prior claim, unless Sysco Corporation or such noteholder, if such noteholder’s debt securities are guaranteed by such subsidiary, also is a direct creditor of that subsidiary.
The guarantee of any subsidiary guarantor with respect to a series of senior notes or debentures may be released under certain customary circumstances. If we exercise our defeasance option with respect to the senior notes or debentures of any series, then any subsidiary guarantor effectively will be released with respect to that series. Further, each subsidiary guarantee will remain in full force and effect until the earliest to occur of the date, if any, on which (1) the applicable subsidiary guarantor shall consolidate with or merge into Sysco Corporation or any successor of Sysco Corporation or (2) Sysco Corporation or any successor of Sysco Corporation consolidates with or merges into the applicable subsidiary guarantor.
Basis of Preparation of the Summarized Financial Information
The following tables include summarized financial information of Sysco Corporation (issuer), and certain wholly owned U.S. Broadline subsidiaries (guarantors) (together, the obligor group). The summarized financial information of the obligor group is presented on a combined basis with intercompany balances and transactions between entities in the obligor group eliminated. Investments in and equity in the earnings of our non-guarantor subsidiaries, which are not members of the obligor group, have been excluded from the summarized financial information.
The obligor group’s amounts due to, amounts due from and transactions with non-guarantor subsidiaries have been presented in separate line items, if they are material to the obligor financials.
| | | | | | | | |
| Combined Parent and Guarantor Subsidiaries Summarized Balance Sheet | | Jul. 3, 2021 |
| | (In thousands) |
| ASSETS | | |
| Receivables due from non-obligor subsidiaries | | $ | 171,718 | |
| Current assets | | 6,661,284 | |
| Total current assets | | $ | 6,833,002 | |
| Notes receivable from non-obligor subsidiaries | | $ | 83,457 | |
| Other noncurrent assets | | 3,933,833 | |
| Total noncurrent assets | | $ | 4,017,290 | |
| | |
| LIABILITIES | | |
| Payables due to non-obligor subsidiaries | | $ | 203,365 | |
| Other current liabilities | | 2,299,674 | |
| Total current liabilities | | $ | 2,503,039 | |
| Notes payable to non-obligor subsidiaries | | $ | 269,709 | |
| Long-term debt | | 10,139,596 | |
| Other noncurrent liabilities | | 1,209,598 | |
| Total noncurrent liabilities | | $ | 11,618,903 | |
| | | | | | | | |
| Combined Parent and Guarantor Subsidiaries Summarized Results of Operations | | 2021 |
| | (In thousands) |
| Sales | | $ | 32,944,700 | |
| Gross profit | | 6,206,924 | |
| Operating income | | 1,773,215 | |
| Interest expense from non-obligor subsidiaries | | 59,745 | |
| Net earnings | | 816,957 | |
Off-Balance Sheet Arrangements
We have no off-balance sheet arrangements.
Critical Accounting Policies and Estimates
The preparation of financial statements in conformity with GAAP requires us to make estimates and assumptions that affect the reported amounts of assets, liabilities, sales and expenses in the accompanying financial statements. Significant accounting policies employed by Sysco are presented in the notes to the financial statements.
Critical accounting policies and estimates are those that are most important to the portrayal of our financial position and results of operations. These policies require our most subjective or complex judgments, often employing the use of estimates about the effect of matters that are inherently uncertain. We have reviewed with the Audit Committee of the Board of Directors the development and selection of the critical accounting policies and estimates and this related disclosure. Our most critical accounting policies and estimates pertain to the goodwill and intangible assets, allowance for doubtful accounts, income taxes, share-based compensation and company-sponsored pension plans.
Goodwill and Intangible Assets
We account for acquired businesses using the acquisition method of accounting, which requires that, once control of a business is obtained, 100% of the assets acquired and liabilities assumed are recorded at the date of acquisition at their respective fair values. We use multiple valuation methods to determine the fair value of assets acquired and liabilities assumed. For intangible assets, we generally use the income method, which uses a forecast of the expected future net cash flows associated with each asset. These cash flows are then adjusted to present value by applying an appropriate discount rate that reflects the risk factors associated with the cash flow streams. Some of the more significant estimates and assumptions inherent in the income method or other methods include the amount and timing of projected future cash flows and the discount rate selected to measure the risks inherent in the future cash flows. Determining the useful life of an intangible asset also requires judgment, as different types of intangible assets will have different useful lives. Any excess of the purchase price over the estimated fair values of the net assets acquired is recorded as goodwill. More information on our acquisitions can be found in Note 4, “Acquisitions,” in the Notes to Consolidated Financial Statements in Item 8.
Annually in our fiscal fourth quarter, we assess the recoverability of goodwill and indefinite-lived intangibles by determining whether the fair values exceed the carrying values of these assets. Impairment reviews, outside our annual review time frame, are performed if events or circumstances occur that include changes in macroeconomic conditions, industry and market considerations, cost factors, overall financial performance, other relevant entity-specific events, specific events affecting the reporting unit or sustained decrease in share price. Our testing may be performed utilizing either a qualitative or quantitative assessment; however, if a qualitative assessment is performed and we determine that the fair value of a reporting unit is more likely than not (i.e., a likelihood of more than 50 percent) to be less than its carrying amount, a quantitative test is performed.
When using a quantitative test, we arrive at our estimates of fair value using a combination of discounted cash flow and earnings or revenue multiple models. The results from each of these models are then weighted and combined into a single estimate of fair value for each reporting unit. We use a higher weighting for our discounted cash flow valuation compared to the earnings multiple models because the forecasted operating results that serve as a basis for the analysis incorporate management’s outlook and anticipated changes for the businesses consistent with a market participant. The primary assumptions used in these various models include estimated earnings multiples of comparable acquisitions in the industry, including control premiums, earnings or revenue multiples on acquisitions completed by Sysco in the past, future cash flow estimates of the reporting units, which are dependent on internal forecasts and projected growth rates, and weighted average cost of capital, along with working capital and capital expenditure requirements. When possible, we use observable market inputs in our models to arrive at the fair values of our reporting units.
Certain reporting units have a greater proportion of goodwill recorded to estimated fair value as compared to the U.S. Broadline, Canada Broadline or SYGMA reporting units. This is primarily due to these businesses having been more recently acquired, and as a result there has been less history of organic growth than in the U.S. Broadline, Canadian Broadline and SYGMA reporting units. As such, these reporting units have a greater risk of future impairment if their operations were to suffer a significant downturn.
In the annual fiscal 2021 assessment, certain reporting units did not have a fair value substantially in excess of their book value. For two reporting units with goodwill of $181.4 million in the aggregate as of July 3, 2021, headroom was considered low at 18% and 27%. All other reporting units were concluded to have a fair value that exceeded book value by at least 30%.
The company estimated the fair value of these reporting units using a combination of discounted cash flow and earnings or revenue multiple models. For the purposes of the discounted cash flow models, fair value was determined based on the present value of estimated future cash flows, discounted at an appropriate risk adjusted rate. The fair value conclusions as of July 3, 2021 for the reporting units are highly sensitive to changes in the assumptions used in the income approach, which include forecasted revenues, perpetual growth rates, and long-term discount rates, among others, all of which require significant judgments by management. Fair value of the reporting unit is therefore determined using significant unobservable inputs, or level 3 in the fair value hierarchy. The company has used recent historical performance, current forecasted financial information, and broad-based industry and economic statistics as a basis to estimate the key assumptions utilized in the discounted cash flow model. These key assumptions are inherently uncertain and require a high degree of estimation and judgment and are subject to change based on future changes, industry and global economic and geo-political conditions, and the timing and success of the implementation of current strategic initiatives. The ongoing impact of the COVID-19 pandemic on estimated future cash flows is uncertain and will largely depend on the outcome of future events, which could result in goodwill impairments going forward.
Allowance for Doubtful Accounts
Sysco determines the past due status of trade receivables based on contractual terms with each customer and evaluates the collectability of accounts receivable to determine an appropriate allowance for credit losses on trade receivables. To calculate an allowance for credit losses, the company estimates uncollectible amounts based on historical loss experience, including those experienced during times of local and regional disasters, current conditions and collection rates, and expectations regarding future losses.
In the third and fourth quarters of fiscal 2020, the company experienced an increase in past due receivables and recognized additional bad debt charges on its trade receivables that were outstanding at the time the pandemic caused closures among our customers in mid-March 2020. These receivables were all created in fiscal 2020 and are referred to as pre-pandemic receivables. In fiscal 2021, we recorded a net credit to the provision for losses on receivables totaling $152.7 million, which reflects a benefit on the reduction of our allowance for pre-pandemic receivable balances, as we have made excellent progress on obtaining timely payments from our customers. We continue to work with our customers to collect past due balances, including through the use of payment plans. We have also discontinued charging interest on past due balances. Our balance for the allowance of doubtful accounts as of July 3, 2021 was $117.7 million. The COVID-19 pandemic is more widespread and longer in duration than historical disasters that have impacted our business, and it is possible that actual uncollectible amounts will differ and additional charges may be required; however, if collections continue to improve, it is also possible that additional reductions in our bad debt reserve could occur. Our judgment is required as to the impact of certain of these items and other factors as to ultimate realization of our accounts receivable.
Income Taxes
The determination of our provision for income taxes requires significant judgment, the use of estimates and the interpretation and application of complex tax laws. Our provision for income taxes primarily reflects a combination of income earned and taxed in the various U.S. federal and state, as well as foreign, jurisdictions. Tax law changes, increases or decreases in book versus tax basis differences, accruals or adjustments of accruals for unrecognized tax benefits or valuation allowances, and our change in the mix of earnings from these taxing jurisdictions all affect the overall effective tax rate. The impact of the COVID-19 pandemic may change our mix of earnings by jurisdiction and has increased the risk that operating losses may occur within certain of our jurisdictions that could lead to the recognition of valuation allowances against certain deferred tax assets in the future, if these losses are prolonged beyond our current expectations. This would negatively impact our income tax expense, net earnings, and balance sheet.
Our liability for unrecognized tax benefits contains uncertainties because management is required to make assumptions and to apply judgment in estimating the exposures associated with our various filing positions. We believe that the judgments and estimates discussed herein are reasonable; however, actual results could differ, and we may be exposed to losses or gains that could be material. To the extent we prevail in matters for which a liability has been established, or pay amounts in excess of recorded liabilities, our effective income tax rate in a given financial statement period could be materially affected. An unfavorable tax settlement generally would require use of our cash and may result in an increase in our effective income tax rate in the period of resolution. A favorable tax settlement may be recognized as a reduction in our effective income tax rate in the period of resolution.
Share-Based Compensation
Sysco provides compensation benefits to employees and non-employee directors under several share-based payment arrangements including various employee stock option plans, a non-employee director plan and the 2015 Employee Stock Purchase Plan (ESPP).
As of July 3, 2021, there was $124.4 million of total unrecognized compensation cost related to share-based compensation arrangements. That cost is expected to be recognized over a weighted-average period of 1.7 years.
The fair value of each option award is estimated on the date of grant using a Black-Scholes option pricing model. Expected volatility is based on historical volatility of Sysco’s stock, implied volatilities from traded options on Sysco’s stock and other factors. We utilize historical data to estimate option exercise and employee termination behavior within the valuation model; separate groups of employees that have similar historical exercise behavior are considered separately for valuation purposes. Expected dividend yield is estimated based on the historical pattern of dividends and the average stock price for the year preceding the option grant. The risk-free rate for the expected term of the option is based on the U.S. Treasury yield curve in effect at the time of grant.
The fair value of each restricted stock unit award and performance share unit award granted with a dividend equivalent is based on the company’s stock price as of the date of grant. For restricted stock units and performance share units granted without dividend equivalents, the fair value is reduced by the present value of expected dividends during the vesting period. Expense recognized on performance share unit awards is subsequently adjusted based on forecasted performance compared to planned targets until the performance period concludes and the actual number of shares of Sysco common stock to be received upon the vesting of the performance share units is known.
The fair value of the stock issued under the ESPP is calculated as the difference between the stock price and the employee purchase price.
The fair value of restricted stock granted to employees or non-employee directors is based on the stock price on grant date. The application of a discount to the fair value of a restricted stock grant is dependent upon whether or not each individual grant contains a post-vesting restriction.
The compensation cost related to these share-based awards is recognized over the requisite service period. The requisite service period is generally the period during which an employee is required to provide service in exchange for the award. The compensation cost related to stock issuances resulting from employee purchases of stock under the ESPP is recognized during the quarter in which the employee payroll withholdings are made.
Our share-based awards are generally subject to graded vesting over a service period. We will recognize compensation cost on a straight-line basis over the requisite service period for the entire award.
In addition, certain of our share-based awards provide that the awards continue to vest as if the award holder continued to be an employee or director if the award holder meets certain age and years of service thresholds upon retirement. In these cases, we will recognize compensation cost for such awards over the period from the grant date to the date the employee or director first becomes eligible to retire with the options continuing to vest after retirement.
Our option grants include options that qualify as incentive stock options for income tax purposes. In the period the compensation cost related to incentive stock options is recorded, a corresponding tax benefit is not recorded as it is assumed that we will not receive a tax deduction related to such incentive stock options. We may be eligible for tax deductions in subsequent periods to the extent that there is a disqualifying disposition of the incentive stock option. In such cases, we would record a tax benefit related to the tax deduction in an amount not to exceed the corresponding cumulative compensation cost recorded in the financial statements on the particular options multiplied by the statutory tax rate.
Company-Sponsored Pension Plans
Amounts related to defined benefit plans recognized in the financial statements are determined on an actuarial basis. Two of the more critical assumptions in the actuarial calculations are the discount rate for determining the current value of plan benefits and the expected rate of return on plan assets. Our U.S. Retirement Plan is largely frozen and is only open to a small number of employees. Our SERP is frozen and is not open to any employees. None of these plans have a significant sensitivity to changes in discount rates specific to our results of operations, but such changes could impact our balance sheet due to a
change in our funded status. Due to the low level of active employees in our retirement plans, our assumption for the rate of increase in future compensation is not a critical assumption.
The expected long-term rate of return on plan assets of the U.S. Retirement Plan is 4.75% for fiscal 2021, consistent with fiscal 2020. The expectations of future returns are derived from a mathematical asset model that incorporates assumptions as to the various asset class returns, reflecting a combination of historical performance analysis and the forward-looking views of the financial markets regarding the yield on bonds, historical returns of the major stock markets and returns on alternative investments. The rate of return assumption is reviewed annually and revised as deemed appropriate.
The expected return on plan assets impacts the recorded amount of net pension costs. The expected long-term rate of return on plan assets of the U.S. Retirement Plan decreased by 25 basis points to 4.50% for fiscal 2022, due to expected lower long-term rate of return. A 25 basis point increase (decrease) in the assumed rate of return in the Plan for fiscal 2022 would decrease (increase) Sysco’s net company-sponsored pension costs for fiscal 2022 by approximately $11 million.
Pension accounting standards require the recognition of the funded status of our defined benefit plans in the statement of financial position, with a corresponding adjustment to accumulated other comprehensive income, net of tax. The amount reflected in accumulated other comprehensive loss related to the recognition of the funded status of our defined benefit plans as of July 3, 2021 was a charge, net of tax, of $1.1 billion, driven by an increase in the discount rates and a decline in expected return on assets. The amount reflected in accumulated other comprehensive loss related to the recognition of the funded status of our defined benefit plans as of June 27, 2020 was a charge, net of tax, of $1.3 billion.
Forward-Looking Statements
Certain statements made herein that look forward in time or express management’s expectations or beliefs with respect to the occurrence of future events are forward-looking statements under the Private Securities Litigation Reform Act of 1995. Forward-looking statements provide current expectations of future events based on certain assumptions and include any statement that does not directly relate to any historical or current fact. Forward-looking statements can also be identified by words such as “future,” “anticipates,” “believes,” “estimates,” “expects,” “intends,” “plans,” “predicts,” “will,” “would,” “could,” “can,” “may,” “projected,” “continues,” “continuously,” variations of such terms, and similar terms and phrases denoting anticipated or expected occurrences or results. Examples of forward-looking statements include, but are not limited to, statements about:
•the effect, impact, potential duration or other implications of the COVID-19 pandemic and any expectations we may have with respect thereto, including our ability to withstand the crisis;
•expectations regarding our business and the economic recovery generally as the COVID-19 pandemic subsides, including beliefs regarding future customer activity;
•our expectations regarding the improvement in the performance of non-restaurant business sectors;
•our expectations of an improving market over the course of fiscal 2022;
•our expectations regarding the ability of our supply chain and facilities to remain in place and operational;
•our plans regarding our transformation initiatives and the expected effects from such initiatives;
•statements regarding uncollectible accounts, including that if collections continue to improve, additional reductions in bad debt expense could occur;
•our expectations that our Recipe for Growth strategy will allow us to better serve our customers and differentiate Sysco from our competition;
•our expectations regarding the Sysco Driver Academy;
•our expectations regarding our fiscal 2022 sales and our rate of sales growth in fiscal 2022 and the three years of our long-range plan;
•our expectations regarding the impact of inflation on sales, gross margin rates and gross profit dollars;
•our expectations regarding gross margins in fiscal 2022;
•our plans regarding cost savings, including our target for cost savings through fiscal 2024 and the impact of costs savings on the company;
•our expectations that divestitures in fiscal 2021 will facilitate our efforts to prioritize our focus and investments on our core business;
•our belief that our purpose will allow us to grow substantially faster than the foodservice distribution industry and deliver profitable growth through our Recipe for Growth transformation, and statements regarding our plans with respect to our strategic pillars that support this growth transformation;
•our expectations regarding the investment of remaining cash generated from operations;
•the expected long-term rate of return on plan assets of the U.S. Retirement Plan;
•the sufficiency of our available liquidity to sustain our operations for multiple years;
•estimates regarding the outcome of legal proceedings;
•the impact of seasonal trends on our free cash flow;
•our expectations regarding the use of remaining cash generated from operations;
•estimates regarding our capital expenditures and the sources of financing for our capital expenditures;
•our expectations regarding the impact of potential acquisitions and sales of assets on our liquidity, borrowing capacity, leverage ratios and capital availability;
•our expectations regarding real sales growth in the U.S. foodservice market;
•our expectations regarding trends in produce markets;
•our expectations regarding the calculation of adjusted return on invested capital, adjusted operating income, adjusted net earnings and adjusted diluted earnings per share;
•our expectations regarding the impact of future Certain Items on our projected future non-GAAP and GAAP results;
•our expectations regarding our effective tax rate in fiscal 2022;
•the sufficiency of our mechanisms for managing working capital and competitive pressures, and our beliefs regarding the impact of these mechanisms;
•our ability to meet future cash requirements, including the ability to access financial markets effectively, including issuances of debt securities, and maintain sufficient liquidity;
•our expectations regarding the payment of dividends, and the growth of our dividend, in the future;
•our expectations regarding future activity under our share repurchase program;
•future compliance with the covenants under our revolving credit facility;
•our ability to effectively access the commercial paper market and long-term capital markets;
•the expected redemption of $450 million of debt maturing in the next 12 months;
•our intention to repay our long-term debt with cash on hand, cash flow from operations, issuances of commercial paper, issuances of senior notes, or a combination thereof.
These statements are based on management’s current expectations and estimates; actual results may differ materially due in part to the risk factors set forth below and those within Part I, Item 1A of this document:
•the impact and effects of public health crises, pandemics and epidemics, such as the recent outbreak of COVID-19, and the adverse impact thereof on our business, financial condition and results of operations, including, but not limited to, our growth, product costs, supply chain, labor availability, logistical capabilities, customer demand for our products and industry demand generally, consumer spending, our liquidity, the price of our securities and trading markets with respect thereto, our ability to access capital markets, and the global economy and financial markets generally;
•the risk that if sales from our locally managed customers do not grow at the same rate as sales from multi-unit customers, our gross margins may decline;
•the risk that we are unlikely to be able to predict inflation over the long term, and lower inflation is likely to produce lower gross profit;
•periods of significant or prolonged inflation or deflation and their impact on our product costs and profitability generally;
•the risk that our efforts to modify truck routing, including our small truck initiative, in order to reduce outbound transportation costs may be unsuccessful;
•the risk that we may not be able to accelerate and/or identify additional administrative cost savings in order to compensate for any gross profit or supply chain cost leverage challenges;
•risks related to unfavorable conditions in North America and Europe and the impact on our results of operations and financial condition;
•the risks related to our efforts to implement our transformation initiatives and meet our other long-term strategic objectives, including the risk that these efforts may not provide the expected benefits in our anticipated time frame, if at all, and may prove costlier than expected; the risk that the actual costs of any initiatives may be greater or less than currently expected; and the risk of adverse effects to us if past and future undertakings and the associated changes to our business do not prove to be cost effective or do not result in the level of cost savings and other benefits that we anticipated;
•the impact of unexpected future changes to our business initiatives based on management’s subjective evaluation of our overall business needs;
•the risk that the actual costs of any business initiatives may be greater or less than currently expected;
•the risk that competition in our industry and the impact of GPOs may adversely impact our margins and our ability to retain customers and make it difficult for us to maintain our market share, growth rate and profitability;
•the risk that our relationships with long-term customers may be materially diminished or terminated;
•the risk that changes in consumer eating habits could materially and adversely affect our business, financial condition, or results of operations;
•the risk that changes in applicable tax laws or regulations and the resolution of tax disputes could negatively affect our financial results;
•the risk that we may not be able to fully compensate for increases in fuel costs, and forward purchase commitments intended to contain fuel costs could result in above market fuel costs;
•the risk of interruption of supplies and increase in product costs as a result of conditions beyond our control;
•the potential impact on our reputation and earnings of adverse publicity or lack of confidence in our products;
•risks related to unfavorable changes to the mix of locally managed customers versus corporate-managed customers;
•the risk that we may not realize anticipated benefits from our operating cost reduction efforts;
•difficulties in successfully expanding into international markets and complimentary lines of business;
•the potential impact of product liability claims;
•the risk that we fail to comply with requirements imposed by applicable law or government regulations;
•risks related to our ability to effectively finance and integrate acquired businesses;
•risks related to our access to borrowed funds in order to grow and any default by us under our indebtedness that could have a material adverse impact on cash flow and liquidity;
•our level of indebtedness and the terms of our indebtedness could adversely affect our business and liquidity position;
•the risk that the implementation of various initiatives, the timing and successful completion of acquisitions, construction schedules and the possibility that other cash requirements could result in delays or cancellations of capital spending;
•the risk that divestiture of one or more of our businesses may not provide the anticipated effects on our operations;
•the risk that Brexit may adversely impact our operations in the U.K., including those of the Brakes Group;
•the risk that future labor disruptions or disputes could disrupt the integration of Brake France and Davigel into Sysco France and our operations in France and the EU generally;
•the risk that factors beyond management’s control, including fluctuations in the stock market, as well as management’s future subjective evaluation of the company’s needs, would impact the timing of share repurchases;
•due to our reliance on technology, any technology disruption or delay in implementing new technology could have a material negative impact on our business;
•the risk that a cybersecurity incident and other technology disruptions could negatively impact our business and our relationships with customers;
•the risk that changes in the method of determining LIBOR, or the replacement of LIBOR with an alternative reference rate, may adversely affect interest expense related to outstanding debt;
•the potential requirement to pay material amounts under our multiemployer defined benefit pension plans;
•our funding requirements for our company-sponsored qualified pension plan may increase should financial markets experience future declines;
•labor issues, including the renegotiation of union contracts and shortage of qualified labor;
•capital expenditures may vary based on changes in business plans and other factors, including risks related to the implementation of various initiatives, the timing and successful completion of acquisitions, construction schedules and the possibility that other cash requirements could result in delays or cancellations of capital spending;
•the risk that the anti-takeover benefits provided by our preferred stock may not be viewed as beneficial to stockholders; and
•the risk that the exclusive forum provisions in our amended and restated bylaws could limit our stockholders’ ability to obtain a favorable judicial forum for disputes with us or our directors, officers or employees.
Item 7A. Quantitative and Qualitative Disclosures about Market Risk
Our market risks consist of interest rate risk, foreign currency exchange rate risk, fuel price risk and investment risk.
Interest Rate Risk
We do not utilize financial instruments for trading purposes. Our use of debt directly exposes us to interest rate risk. Floating rate debt, where the interest rate fluctuates periodically, exposes us to short-term changes in market interest rates. Fixed rate debt, where the interest rate is fixed over the life of the instrument, exposes us to changes in market interest rates reflected in the fair value of the debt and to the risk that we may need to refinance maturing debt with new debt at higher rates.
We manage our debt portfolio to achieve an overall desired position of fixed and floating rates and may employ interest rate swaps as a tool to achieve that position. The major risks from interest rate derivatives include changes in the interest rates affecting the fair value of such instruments, potential increases in interest expense due to market increases in floating interest rates and the creditworthiness of the counterparties in such transactions.
At July 3, 2021, there were no commercial paper issuances outstanding under our U.S. commercial paper program. Total debt as of July 3, 2021 was $11.1 billion, of which approximately 90% was at fixed rates of interest, including the impact of our interest rate swap agreements.
At June 27, 2020, there were no commercial paper issuances outstanding under our U.S. commercial paper program and we had £600.0 million outstanding under our U.K. commercial paper program. Total debt as of June 27, 2020 was $14.4 billion, of which approximately 79% was at fixed rates of interest, including the impact of our interest rate swap agreements.
Details of our outstanding swap agreements as of July 3, 2021 are below:
| | | | | | | | | | | | | | | | | | | | | | | | | | | | | | | | | | | | | | |
| Maturity Date of Swap | | Notional Value | | Fixed Coupon Rate on Hedged Debt | | Floating Interest Rate on Swap | | Floating Rate Reset Terms | | Location of Fair Value on Balance Sheet | | Fair Value
of Asset (Liability)
(in thousands) |
| | | | | | | | | | | | |
| June 23, 2023 | | € | 500,000,000 | | | 1.25 | | | Three-month EURIBOR | | Every three months in advance | | Other long-term assets | | $ | 6,532 | |
| March 15, 2025 | | $ | 500,000,000 | | | 3.55 | | | Three-month LIBOR | | Every three months in advance | | Other long-term assets | | $ | 36,685 | |
We receive or pay amounts on these interest rate swap agreements on a semi-annual basis.
The following tables present our interest rate position as of July 3, 2021. All amounts are stated in U.S. dollar equivalents.
| | | | | | | | | | | | | | | | | | | | | | | | | | | | | | | | | | | | | | | | | | | | | | | |
| | Interest Rate Position as of July 3, 2021 |
| | Principal Amount by Expected Maturity |
| | Average Interest Rate |
| | 2022 | | 2023 | | 2024 | | 2025 | | 2026 | | Thereafter | | Total | | Fair Value |
| | (Dollars in thousands) |
| U.S. Dollar Denominated: | | | | | | | | | | | | | | | |
| Fixed Rate Debt | $ | 450,000 | | | $ | — | | | $ | — | | | $ | 750,000 | | | $ | 750,000 | | | $ | 7,582,055 | | | $ | 9,532,055 | | | $ | 9,454,290 | |
| Average Interest Rate | 2.60 | % | | — | % | | — | % | | 5.65 | % | | 3.75 | % | | 4.80 | % | | 4.68 | % | | |
Floating Rate Debt (1) | $ | — | | | $ | — | | | $ | — | | | $ | 500,000 | | | $ | — | | | $ | — | | | $ | 500,000 | | | $ | 533,681 | |
| Average Interest Rate | — | % | | — | % | | — | % | | 3.55 | % | | — | % | | — | % | | 3.55 | % | | |
| | | | | | | | | | | | | | | |
| | | | | | | | | | | | | | | |
| | | | | | | | | | | | | | | |
| Euro Denominated: | | | | | | | | | | | | | | | |
Floating Rate Debt (1) | $ | — | | | $ | 593,303 | | | $ | — | | | $ | — | | | $ | — | | | $ | — | | | $ | 593,303 | | | $ | 598,253 | |
| Average Interest Rate | — | % | | 1.25 | % | | — | % | | — | % | | — | % | | — | % | | 1.25 | % | | |
| Canadian Dollar Denominated: | | | | | | | | | | | | | | | |
| Fixed Rate Debt | $ | — | | | $ | — | | | $ | — | | | $ | 404,138 | | | $ | — | | | $ | — | | | $ | 404,138 | | | $ | 402,589 | |
| Average Interest Rate | — | % | | — | % | | — | % | | 3.65 | % | | — | % | | — | % | | 3.65 | % | | |
(1)Includes fixed rate debt that has been converted to floating rate debt through an interest rate swap agreement.
| | | | | | | | | | | | | | | | | | | | | | | | | | | | | | | | | | | | | | | | | | | | | | | |
| | Interest Rate Position as of July 3, 2021 |
| | Notional Amount by Expected Maturity |
| | Average Interest Swap Rate |
| | 2022 | | 2023 | | 2024 | | 2025 | | 2026 | | Thereafter | | Total | | Fair Value |
| | (Dollars in thousands) |
| Interest Rate Swaps | | | | | | | | | | | | | | | |
| Related To Debt: | | | | | | | | | | | | | | | |
| Pay Variable/Receive Fixed | $ | — | | | $ | 593,303 | | | $ | — | | | $ | 500,000 | | | $ | — | | | $ | — | | | $ | 1,093,303 | | | $ | 43,217 | |
| Average Variable Rate Paid: | | | | | | | | | | | | | | | |
| | | | | | | | | | | | | | | |
| Rate A Plus | — | % | | 1.10 | % | | — | % | | 0.75 | % | | — | % | | — | % | | 0.94 | % | | |
| Fixed Rate Received | — | % | | 1.25 | % | | — | % | | 3.55 | % | | — | % | | — | % | | 2.30 | % | | |
Rate A – three-month LIBOR
Foreign Currency Exchange Rate Risk
The majority of our foreign subsidiaries use their local currency as their functional currency. To the extent that business transactions are not denominated in a foreign subsidiary’s functional currency, we are exposed to foreign currency exchange rate risk. We will also incur gains and losses within our shareholders’ equity due to the translation of our financial statements from foreign currencies into U.S. dollars. Our largest currency exposures are with Canadian dollars, British pound sterling and Euro currencies. Our income statement trends may be impacted by the translation of the income statements of our foreign subsidiaries into U.S. dollars. The exchange rates used to translate our foreign sales into U.S. dollars positively affected sales by 0.9% in fiscal 2021 when compared to fiscal 2020. The exchange rate used to translate our foreign sales into U.S. dollars negatively affected sales by 0.3% in fiscal 2020 when compared to fiscal 2019. The impact to our operating income, net earnings and earnings per share was not material in fiscal 2021 or fiscal 2020. A 10% unfavorable change in the fiscal 2021 weighted year-to-date exchange rate and the resulting impact on our financial statements would have negatively affected fiscal 2021 sales by 1.3% and would not have materially affected our operating income, net earnings and earnings per share. We do not routinely enter into material agreements to hedge foreign currency exchange rate risks.
Our investments and loans to our foreign operations created additional foreign currency exposure. In fiscal 2017, we designated €500 million of Euro notes issued in June 2016 as a hedge of a portion of our net investment in Euro-denominated foreign operations to reduce foreign currency risk associated with the investment in these operations. Changes in the value of these items resulting from fluctuations in the underlying exchange rates to U.S. Dollar exchange rates are recorded as foreign currency translation adjustments within Accumulated other comprehensive income (loss).
Fuel Price Risk
Due to the nature of our distribution business, we are exposed to potential volatility in fuel prices. The price and availability of diesel fuel fluctuates due to changes in production, seasonality and other market factors generally outside of our control. Increased fuel costs may have a negative impact on our results of operations in three areas. First, the high cost of fuel can negatively impact consumer confidence and discretionary spending and thus reduce the frequency and amount spent by consumers for food-away-from-home purchases. Second, the high cost of fuel can increase the price we pay for product purchases and we may not be able to pass these costs fully to our customers. Third, increased fuel costs impact the costs we incur to deliver product to our customers. Fuel costs related to outbound deliveries represented approximately 0.5% of sales during fiscal 2021, fiscal 2020 and fiscal 2019.
Our activities to mitigate fuel costs include routing optimization with the goal of reducing miles driven, improving fleet utilization by adjusting idling time and maximum speeds and using fuel surcharges that primarily track with the change in market prices of fuel. We use diesel fuel swap contracts to fix the price of a portion of our projected monthly diesel fuel requirements. As of July 3, 2021, we had diesel fuel swaps with a total notional amount of approximately 32 million gallons through June 2022. These swaps are expected to lock in the price of approximately 50% of our projected fuel purchase needs for fiscal 2022. Our remaining fuel purchase needs will occur at market rates unless contracted for a fixed price or hedged at a later date. Using current, published quarterly market price projections for diesel and estimates of fuel consumption, a 10% unfavorable change in diesel prices from the market price would result in a potential increase of approximately $7.1 million in our fuel costs on our non-contracted volumes.
Investment Risk
Our U.S. Retirement Plan holds various investments, including public and private equity, fixed income securities and real estate funds. The amount of our annual contribution to the plan is dependent upon, among other things, the return on the plan’s assets and discount rates used to calculate the plan’s liability. Fluctuations in asset values can cause the amount of our anticipated future contributions to the plan to increase and can result in a reduction to shareholders’ equity on our balance sheet as of fiscal year-end, which is when this plan’s funded status is measured. Also, the projected liability of the plan will be impacted by the fluctuations of interest rates on high quality bonds in the public markets. To the extent the financial markets experience declines, our anticipated future contributions and funded status will be affected for future years. A 10% unfavorable change in the value of the investments held by our company-sponsored retirement plans at the plans’ fiscal year end (December 31, 2020) would not have a material impact on our anticipated future contributions for fiscal 2022; however, such an unfavorable change would increase our pension expense for fiscal 2022 by $35.8 million and would reduce our shareholders’ equity on our balance sheet as of July 3, 2021 by $465.5 million.
Item 8. Financial Statements and Supplementary Data
SYSCO CORPORATION AND SUBSIDIARIES
INDEX TO CONSOLIDATED FINANCIAL STATEMENTS | | | | | |
| | Page |
| Consolidated Financial Statements: | |
| |
| |
| |
| |
| |
| |
| |
| |
| |
All schedules are omitted because they are not applicable or the information is set forth in the consolidated financial statements or notes thereto.
REPORT OF MANAGEMENT ON INTERNAL CONTROL OVER FINANCIAL REPORTING
The management of Sysco Corporation (“Sysco”) is responsible for establishing and maintaining adequate internal control over financial reporting for the company. Sysco’s internal control system is designed to provide reasonable assurance regarding the reliability of financial reporting and the preparation and fair presentation of published financial statements. All internal control systems, no matter how well designed, have inherent limitations. Therefore, even those systems determined to be effective can provide only reasonable assurance with respect to financial statement preparation and presentation.
Sysco’s management assessed the effectiveness of Sysco’s internal control over financial reporting as of July 3, 2021. In making this assessment, management used the criteria set forth by the Committee of Sponsoring Organizations of the Treadway Commission in Internal Control — Integrated Framework (2013). Based on this assessment, management concluded that, as of July 3, 2021, Sysco’s internal control over financial reporting was effective based on those criteria.
Ernst & Young LLP, the independent registered public accounting firm that audited the company’s consolidated financial statements included in this report, has issued an audit report on the effectiveness of Sysco’s internal control over financial reporting as of July 3, 2021.
REPORT OF INDEPENDENT REGISTERED PUBLIC ACCOUNTING FIRM
To the Shareholders and the Board of Directors of Sysco Corporation
Opinion on Internal Control over Financial Reporting
We have audited Sysco Corporation and its Consolidated Subsidiaries’ (the “Company”) internal control over financial reporting as of July 3, 2021, based on criteria established in Internal Control-Integrated Framework issued by the Committee of Sponsoring Organizations of the Treadway Commission (2013 framework) (the COSO criteria). In our opinion, Sysco Corporation and Consolidated Subsidiaries maintained, in all material respects, effective internal control over financial reporting as of July 3, 2021, based on the COSO criteria.
We also have audited, in accordance with the standards of the Public Company Accounting Oversight Board (United States) (PCAOB), the 2021 consolidated financial statements of the Company and our report dated August 27, 2021, expressed an unqualified opinion thereon.
Basis for Opinion
The Company’s management is responsible for maintaining effective internal control over financial reporting and for its assessment of the effectiveness of internal control over financial reporting included in the accompanying Report of Management on Internal Control over Financial Reporting. Our responsibility is to express an opinion on the Company’s internal control over financial reporting based on our audit. We are a public accounting firm registered with the PCAOB and are required to be independent with respect to the Company in accordance with the U.S. federal securities laws and the applicable rules and regulations of the Securities and Exchange Commission and the PCAOB.
We conducted our audit in accordance with the standards of the PCAOB. Those standards require that we plan and perform the audit to obtain reasonable assurance about whether effective internal control over financial reporting was maintained in all material respects.
Our audit included obtaining an understanding of internal control over financial reporting, assessing the risk that a material weakness exists, testing and evaluating the design and operating effectiveness of internal control based on the assessed risk, and performing such other procedures as we considered necessary in the circumstances. We believe that our audit provides a reasonable basis for our opinion.
Definition and Limitations of Internal Control over Financial Reporting
A company’s internal control over financial reporting is a process designed to provide reasonable assurance regarding the reliability of financial reporting and the preparation of financial statements for external purposes in accordance with generally accepted accounting principles. A company’s internal control over financial reporting includes those policies and procedures that (1) pertain to the maintenance of records that, in reasonable detail, accurately and fairly reflect the transactions and dispositions of the assets of the company; (2) provide reasonable assurance that transactions are recorded as necessary to permit preparation of financial statements in accordance with generally accepted accounting principles, and that receipts and expenditures of the company are being made only in accordance with authorizations of management and directors of the company; and (3) provide reasonable assurance regarding prevention or timely detection of unauthorized acquisition, use, or disposition of the company’s assets that could have a material effect on the financial statements.
Because of its inherent limitations, internal control over financial reporting may not prevent or detect misstatements. Also, projections of any evaluation of effectiveness to future periods are subject to the risk that controls may become inadequate because of changes in conditions, or that the degree of compliance with the policies or procedures may deteriorate.
/s/ Ernst & Young LLP
Houston, Texas
August 27, 2021
REPORT OF INDEPENDENT REGISTERED PUBLIC ACCOUNTING FIRM
To the Shareholders and the Board of Directors of Sysco Corporation
Opinion on the Financial Statements
We have audited the accompanying consolidated balance sheets of Sysco Corporation and its Consolidated Subsidiaries (the “Company”) as of July 3, 2021 and June 27, 2020, the related consolidated results of operations, statements of comprehensive income, changes in shareholders’ equity and cash flows for each of the three years in the period ended July 3, 2021 and the related notes (collectively referred to as the “consolidated financial statements”). In our opinion, the consolidated financial statements present fairly, in all material respects, the financial position of the Company at July 3, 2021 and June 27, 2020, and the results of its operations and its cash flows for each of the three years in the period ended July 3, 2021, in conformity with U.S. generally accepted accounting principles.
We also have audited, in accordance with the standards of the Public Company Accounting Oversight Board (United States) (PCAOB), the Company’s internal control over financial reporting as of July 3, 2021, based on criteria established in Internal Control-Integrated Framework issued by the Committee of Sponsoring Organizations of the Treadway Commission (2013 framework), and our report dated August 27, 2021 expressed an unqualified opinion thereon.
Basis for Opinion
These financial statements are the responsibility of the Company’s management. Our responsibility is to express an opinion on the Company’s financial statements based on our audits. We are a public accounting firm registered with the PCAOB and are required to be independent with respect to the Company in accordance with the U.S. federal securities laws and the applicable rules and regulations of the Securities and Exchange Commission and the PCAOB.
We conducted our audits in accordance with the standards of the PCAOB. Those standards require that we plan and perform the audit to obtain reasonable assurance about whether the financial statements are free of material misstatement, whether due to error or fraud. Our audits included performing procedures to assess the risks of material misstatement of the financial statements, whether due to error or fraud, and performing procedures that respond to those risks. Such procedures included examining, on a test basis, evidence regarding the amounts and disclosures in the financial statements. Our audits also included evaluating the accounting principles used and significant estimates made by management, as well as evaluating the overall presentation of the financial statements. We believe that our audits provide a reasonable basis for our opinion.
Critical Audit Matter
The critical audit matter communicated below is a matter arising from the current period audit of the financial statements that was communicated or required to be communicated to the audit committee and that: (1) relates to accounts or disclosures that are material to the consolidated financial statements and (2) involved our especially challenging, subjective or complex judgments. The communication of the critical audit matter does not alter in any way our opinion on the consolidated financial statements, taken as a whole, and we are not, by communicating the critical audit matter below, providing a separate opinion on the critical audit matter or on the account or disclosures to which it relates.
| | | | | | | | |
| | Valuation of Goodwill |
| Description of the Matter | | At July 3, 2021, the Company’s goodwill was $3.9 billion. As discussed in Note 1 of the financial statements, goodwill is tested by the Company’s management for impairment at least annually, in the fourth quarter, unless there are indications of impairment at other points throughout the fiscal year.
Auditing management’s impairment tests for goodwill is complex and highly judgmental due to the significant estimation required to determine the fair value of the reporting units. In particular, the fair value estimates of reporting units with fair values that do not significantly exceed their carrying values are sensitive to assumptions such as changes in projected cash flows, weighted average cost of capital, and terminal growth rates. All of these assumptions are sensitive to and affected by expected future market or economic conditions and company-specific qualitative factors. |
| | | | | | | | |
| | |
| How We Addressed the Matter in Our Audit | | We obtained an understanding, evaluated the design and tested the operating effectiveness of controls over the Company’s goodwill impairment review process, including controls over management’s review of the significant assumptions described above. We also tested controls over management’s review of the data used in their valuation models.
To test the estimated fair value of the Company’s reporting units, we performed audit procedures that included, among others, assessing methodologies and testing the significant assumptions discussed above and the underlying data used by the Company in its analysis. We compared projected cash flows to the Company’s historical cash flows and other available industry information. We involved our valuation specialists to assist in reviewing the valuation methodology and testing the weighted average cost of capital and terminal growth rates. We assessed the historical accuracy of management’s estimates and performed sensitivity analyses of significant assumptions to evaluate the changes in the fair value of the reporting units that would result from changes in the assumptions. In addition, we also tested management’s reconciliation of the fair value of the reporting units to the market capitalization of the Company. |
/s/ Ernst & Young LLP
We have served as the Company’s auditor since 2002.
Houston, Texas
August 27, 2021
Sysco Corporation and its Consolidated Subsidiaries
CONSOLIDATED BALANCE SHEETS
(In thousands, except for share data) | | | | | | | | | | | | | |
| | Jul. 3, 2021 | | Jun. 27, 2020 | | |
| ASSETS | | | | | |
| Current assets | | | | | |
| Cash and cash equivalents | $ | 3,007,123 | | | $ | 6,059,427 | | | |
| Accounts receivable, less allowances of $117,695 and $334,810 | 3,781,510 | | | 2,893,551 | | | |
| Inventories | 3,695,219 | | | 3,095,085 | | | |
| | | | | |
| Prepaid expenses and other current assets | 240,956 | | | 192,163 | | | |
| Income tax receivable | 8,759 | | | 108,006 | | | |
| Total current assets | 10,733,567 | | | 12,348,232 | | | |
| Plant and equipment at cost, less accumulated depreciation | 4,326,063 | | | 4,458,567 | | | |
| Other long-term assets | | | | | |
| Goodwill | 3,944,139 | | | 3,732,469 | | | |
| Intangibles, less amortization | 746,073 | | | 780,172 | | | |
| | | | | |
| Deferred income taxes | 352,523 | | | 194,115 | | | |
| Operating lease right-of-use assets, net | 709,163 | | | 603,616 | | | |
| Other assets | 602,011 | | | 511,095 | | | |
| Total other long-term assets | 6,353,909 | | | 5,821,467 | | | |
| Total assets | $ | 21,413,539 | | | $ | 22,628,266 | | | |
| | | | | |
| LIABILITIES AND SHAREHOLDERS’ EQUITY | | | | | |
| Current liabilities | | | | | |
| Notes payable | $ | 8,782 | | | $ | 2,266 | | | |
| Accounts payable | 4,884,781 | | | 3,447,065 | | | |
| Accrued expenses | 1,814,837 | | | 1,616,289 | | | |
| Accrued income taxes | 22,644 | | | 2,938 | | | |
| Current operating lease liabilities | 102,659 | | | 107,167 | | | |
| Current maturities of long-term debt | 486,141 | | | 1,542,128 | | | |
| Total current liabilities | 7,319,844 | | | 6,717,853 | | | |
| Long-term liabilities | | | | | |
| Long-term debt | 10,588,184 | | | 12,902,485 | | | |
| Deferred income taxes | 147,066 | | | 86,601 | | | |
| Long-term operating lease liabilities | 634,481 | | | 523,496 | | | |
| Other long-term liabilities | 1,136,480 | | | 1,204,953 | | | |
| Total long-term liabilities | 12,506,211 | | | 14,717,535 | | | |
| | | | | |
| Noncontrolling interest | 34,588 | | | 34,265 | | | |
| Shareholders’ equity | | | | | |
| Preferred stock, par value $1 per share Authorized 1,500,000 shares, issued none | — | | | — | | | |
| Common stock, par value $1 per share Authorized 2,000,000,000 shares, issued 765,174,900 shares | 765,175 | | | 765,175 | | | |
| Paid-in capital | 1,619,995 | | | 1,506,901 | | | |
| Retained earnings | 10,151,706 | | | 10,563,008 | | | |
| Accumulated other comprehensive loss | (1,148,764) | | | (1,710,881) | | | |
| Treasury stock at cost, 253,342,595 and 256,915,825 shares | (9,835,216) | | | (9,965,590) | | | |
| Total shareholders’ equity | 1,552,896 | | | 1,158,613 | | | |
| Total liabilities and shareholders’ equity | $ | 21,413,539 | | | $ | 22,628,266 | | | |
See Notes to Consolidated Financial Statements
Sysco Corporation and its Consolidated Subsidiaries
CONSOLIDATED RESULTS OF OPERATIONS
(In thousands, except for share and per share data) | | | | | | | | | | | | | | | | | |
| | Year Ended |
| | Jul. 3, 2021 | | Jun. 27, 2020 | | Jun. 29, 2019 |
| (In thousands except for share and per share data) |
| Sales | $ | 51,297,843 | | | $ | 52,893,310 | | | $ | 60,113,922 | |
| Cost of sales | 41,941,094 | | | 42,991,646 | | | 48,704,935 | |
| Gross profit | 9,356,749 | | | 9,901,664 | | | 11,408,987 | |
| Operating expenses | 7,919,507 | | | 9,152,159 | | | 9,078,837 | |
| Operating income | 1,437,242 | | | 749,505 | | | 2,330,150 | |
| Interest expense | 880,137 | | | 408,220 | | | 360,423 | |
| Other (income) expense, net | (27,623) | | | 47,901 | | | (36,109) | |
| Earnings before income taxes | 584,728 | | | 293,384 | | | 2,005,836 | |
| Income taxes | 60,519 | | | 77,909 | | | 331,565 | |
| Net earnings | $ | 524,209 | | | $ | 215,475 | | | $ | 1,674,271 | |
| | | | | |
| Net earnings: | | | | | |
| Basic earnings per share | $ | 1.03 | | | $ | 0.42 | | | $ | 3.24 | |
| Diluted earnings per share | 1.02 | | | 0.42 | | | 3.20 | |
| | | | | |
| Average shares outstanding | 510,696,398 | | | 510,121,071 | | | 516,890,581 | |
| Diluted shares outstanding | 513,555,088 | | | 514,025,974 | | | 523,381,124 | |
See Notes to Consolidated Financial Statements
Sysco Corporation and its Consolidated Subsidiaries
CONSOLIDATED STATEMENTS OF COMPREHENSIVE INCOME
(In thousands) | | | | | | | | | | | | | | | | | |
| | Year Ended |
| | Jul. 3, 2021 | | Jun. 27, 2020 | | Jun. 29, 2019 |
| (In thousands) |
| Net earnings | $ | 524,209 | | | $ | 215,475 | | | $ | 1,674,271 | |
| Other comprehensive income (loss): | | | | | |
| Foreign currency translation adjustment | 362,292 | | | (112,215) | | | (119,126) | |
| Items presented net of tax: | | | | | |
| Amortization of cash flow hedges | 8,812 | | | 8,620 | | | 8,620 | |
| Change in net investment hedges | (24,155) | | | 43,529 | | | 43,839 | |
| Change in cash flow hedges | 14,125 | | | (7,257) | | | (4,062) | |
| | | | | |
| | | | | |
| Amortization of prior service cost | 548 | | | 5,712 | | | 6,400 | |
| Amortization of actuarial loss | 46,695 | | | 38,934 | | | 26,116 | |
| | | | | |
| Actuarial gain (loss) | 156,480 | | | (92,743) | | | (155,074) | |
| Change in marketable securities | (2,680) | | | 4,268 | | | 2,827 | |
| Total other comprehensive income (loss) | 562,117 | | | (111,152) | | | (190,460) | |
| Comprehensive income | $ | 1,086,326 | | | $ | 104,323 | | | $ | 1,483,811 | |
See Notes to Consolidated Financial Statements
Sysco Corporation and its Consolidated Subsidiaries
CHANGES IN CONSOLIDATED SHAREHOLDERS’ EQUITY
(In thousands, except for share data)
| | | | | | | | | | | | | | | | | | | | | | | | | | | | | | | | | | | | | | | | | | | | | | | |
| | Common Stock | | Paid-in
Capital | | Retained
Earnings | | Accumulated
Other Comprehensive
Loss | | Treasury Stock | | |
| | Shares | | Amount | | | | | Shares | | Amounts | | Totals |
| | (In thousands except for share data) |
| Balance as of June 30, 2018 | 765,174,900 | | | $ | 765,175 | | | $ | 1,383,619 | | | $ | 10,348,628 | | | $ | (1,409,269) | | | 244,533,248 | | | $ | (8,581,196) | | | $ | 2,506,957 | |
| Net earnings | | | | | | | 1,674,271 | | | | | | | | | 1,674,271 | |
| | | | | | | | | | | | | | | |
| Foreign currency translation adjustment | | | | | | | | | (119,126) | | | | | | | (119,126) | |
| Amortization of cash flow hedges, net of tax | | | | | | | | | 8,620 | | | | | | | 8,620 | |
| Change in cash flow hedges, net of tax | | | | | | | | | (4,062) | | | | | | | (4,062) | |
| Change in net investment hedge, net of tax | | | | | | | | | 43,839 | | | | | | | 43,839 | |
| Reclassification of pension and other postretirement benefit plans amounts to net earnings, net of tax | | | | | | | | | 32,516 | | | | | | | 32,516 | |
| Pension funded status adjustment, net of tax | | | | | | | | | (155,074) | | | | | | | (155,074) | |
| Change in marketable securities, net of tax | | | | | | | | | 2,827 | | | | | | | 2,827 | |
| Dividends declared ($1.53 per common share) | | | | | | | (793,220) | | | | | | | | | (793,220) | |
| Treasury stock purchases | | | | | | | | | | | 14,960,390 | | | (1,021,881) | | | (1,021,881) | |
| Increase in ownership interest in subsidiaries | | | | | (54,877) | | | | | | | | | | | (54,877) | |
| Share-based compensation awards | | | | | 128,677 | | | | | | | (7,195,712) | | | 253,136 | | | 381,813 | |
| Balance as of June 29, 2019 | 765,174,900 | | | $ | 765,175 | | | $ | 1,457,419 | | | $ | 11,229,679 | | | $ | (1,599,729) | | | 252,297,926 | | | $ | (9,349,941) | | | $ | 2,502,603 | |
| Net earnings | | | | | | | 215,475 | | | | | | | | | 215,475 | |
| | | | | | | | | | | | | | | |
| Foreign currency translation adjustment | | | | | | | | | (112,215) | | | | | | | (112,215) | |
| Amortization of cash flow hedges, net of tax | | | | | | | | | 8,620 | | | | | | | 8,620 | |
| Change in cash flow hedges, net of tax | | | | | | | | | (7,257) | | | | | | | (7,257) | |
| Change in net investment hedges, net of tax | | | | | | | | | 43,529 | | | | | | | 43,529 | |
| Reclassification of pension and other postretirement benefit plans amounts to net earnings, net of tax | | | | | | | | | 44,646 | | | | | | | 44,646 | |
| Pension funded status adjustment, net of tax | | | | | | | | | (92,743) | | | | | | | (92,743) | |
| Change in marketable securities, net of tax | | | | | | | | | 4,268 | | | | | | | 4,268 | |
| Adoption of ASU 2016-02, Leases (Topic 842), net of tax | | | | | | | 1,978 | | | | | | | | | 1,978 | |
| Dividends declared ($1.74 per common share) | | | | | | | (884,124) | | | | | | | | | (884,124) | |
| Treasury stock purchases | | | | | | | | | | | 11,030,287 | | | (843,251) | | | (843,251) | |
| | | | | | | | | | | | | | | |
| Share-based compensation awards | | | | | 49,482 | | | | | | | (6,412,388) | | | 227,602 | | | 277,084 | |
| Balance as of June 27, 2020 | 765,174,900 | | | $ | 765,175 | | | $ | 1,506,901 | | | $ | 10,563,008 | | | $ | (1,710,881) | | | 256,915,825 | | | $ | (9,965,590) | | | $ | 1,158,613 | |
| Net earnings | | | | | | | 524,209 | | | | | | | | | 524,209 | |
| | | | | | | | | | | | | | | |
| | | | | | | | | | | | | | | |
| Foreign currency translation adjustment | | | | | | | | | 362,292 | | | | | | | 362,292 | |
| Amortization of cash flow hedges, net of tax | | | | | | | | | 8,812 | | | | | | | 8,812 | |
| Change in cash flow hedges, net of tax | | | | | | | | | 14,125 | | | | | | | 14,125 | |
| Change in net investment hedges, net of tax | | | | | | | | | (24,155) | | | | | | | (24,155) | |
| Reclassification of pension and other postretirement benefit plans amounts to net earnings, net of tax | | | | | | | | | 47,243 | | | | | | | 47,243 | |
| Pension funded status adjustment, net of tax | | | | | | | | | 156,480 | | | | | | | 156,480 | |
| Change in marketable securities, net of tax | | | | | | | | | (2,680) | | | | | | | (2,680) | |
| Adoption of ASU 2016-13, Financial Instruments - Credit Losses (Topic 326), net of tax | | | | | | | (2,068) | | | | | | | | | (2,068) | |
| Dividends declared ($1.82 per common share) | | | | | | | (933,443) | | | | | | | | | (933,443) | |
| | | | | | | | | | | | | | | |
| | | | | | | | | | | | | | | |
| Share-based compensation awards | | | | | 113,094 | | | | | | | (3,573,230) | | | 130,374 | | | 243,468 | |
| Balance as of July 3, 2021 | 765,174,900 | | | $ | 765,175 | | | $ | 1,619,995 | | | $ | 10,151,706 | | | $ | (1,148,764) | | | 253,342,595 | | | $ | (9,835,216) | | | $ | 1,552,896 | |
See Notes to Consolidated Financial Statements
Sysco Corporation and its Consolidated Subsidiaries
CONSOLIDATED CASH FLOWS
(In thousands) | | | | | | | | | | | | | | | | | |
| | Year Ended |
| | Jul. 3, 2021 | | Jun. 27, 2020 | | Jun. 29, 2019 |
| Cash flows from operating activities: | | | | | |
| Net earnings | $ | 524,209 | | | $ | 215,475 | | | $ | 1,674,271 | |
| Adjustments to reconcile net earnings to cash provided by operating activities: | | | | | |
| Share-based compensation expense | 95,815 | | | 42,234 | | | 104,904 | |
| Depreciation and amortization | 737,916 | | | 805,765 | | | 763,935 | |
| Operating lease asset amortization | 113,906 | | | 108,376 | | | — | |
| Amortization of debt issuance and other debt-related costs | 26,115 | | | 22,663 | | | 21,382 | |
| Deferred income taxes | (157,864) | | | (191,317) | | | (126,719) | |
| Provision for losses on receivables | (152,740) | | | 404,158 | | | 62,946 | |
| Loss on extinguishment of debt | 293,897 | | | — | | | — | |
| Loss (gain) on sale of businesses | 22,737 | | | — | | | (66,309) | |
| Goodwill impairment | — | | | 203,206 | | | — | |
| Impairment of assets held for sale | — | | | 55,942 | | | — | |
| Other non-cash items | (16,502) | | | (525) | | | (3,172) | |
| Additional changes in certain assets and liabilities, net of effect of businesses acquired: | | | | | |
| (Increase) decrease in receivables | (662,345) | | | 915,717 | | | (203,458) | |
| (Increase) decrease in inventories | (551,405) | | | 114,563 | | | (114,667) | |
| (Increase) decrease in prepaid expenses and other current assets | (32,577) | | | 9,835 | | | (18,535) | |
| Increase (decrease) in accounts payable | 1,459,222 | | | (834,118) | | | 246,420 | |
| Increase (decrease) in accrued expenses | 167,181 | | | (139,891) | | | 137,517 | |
| Decrease in operating lease liabilities | (142,351) | | | (124,040) | | | — | |
| Increase (decrease) in accrued income taxes | 118,953 | | | (102,678) | | | 4,929 | |
| Decrease (increase) in other assets | 18,822 | | | 20,666 | | | (21,346) | |
| Increase (decrease) in other long-term liabilities | 40,853 | | | 92,649 | | | (50,891) | |
| | | | | |
| Net cash provided by operating activities | 1,903,842 | | | 1,618,680 | | | 2,411,207 | |
| Cash flows from investing activities: | | | | | |
| Additions to plant and equipment | (470,676) | | | (720,423) | | | (692,391) | |
| Proceeds from sales of plant and equipment | 59,147 | | | 28,717 | | | 20,941 | |
| Acquisition of businesses, net of cash acquired | — | | | (142,780) | | | (106,616) | |
| Proceeds from sale of business | — | | | — | | | 149,879 | |
| Purchase of marketable securities | (53,148) | | | (11,424) | | | (116,440) | |
| Proceeds from sales of marketable securities | 35,979 | | | 20,532 | | | — | |
| Other investing activities | — | | | 69,071 | | | 1,772 | |
| Net cash used for investing activities | (428,698) | | | (756,307) | | | (742,855) | |
| Cash flows from financing activities: | | | | | |
| Bank and commercial paper (repayments) borrowings, net | (826,182) | | | 616,657 | | | 132,100 | |
| Other debt borrowings | 1,484 | | | 6,783,562 | | | 388,180 | |
| Other debt repayments | (2,003,135) | | | (1,119,232) | | | (790,250) | |
| Tender and redemption premiums for senior notes | (999,996) | | | — | | | — | |
| | | | | |
| | | | | |
| | | | | |
| | | | | |
| Proceeds from stock option exercises | 130,374 | | | 227,602 | | | 253,135 | |
| | | | | |
| Stock repurchases | — | | | (844,699) | | | (1,022,033) | |
| Dividends paid | (917,564) | | | (856,312) | | | (775,430) | |
| Other financing activities | (13,209) | | | (87,778) | | | (22,976) | |
| | | | | |
| Net cash (used for) provided by financing activities | (4,628,228) | | | 4,719,800 | | | (1,837,274) | |
| Effect of exchange rates on cash, cash equivalents and restricted cash | 94,614 | | | (18,848) | | | (14,677) | |
| Net (decrease) increase in cash, cash equivalents and restricted cash | (3,058,470) | | | 5,563,325 | | | (183,599) | |
| Cash, cash equivalents and restricted cash at beginning of period | 6,095,570 | | | 532,245 | | | 715,844 | |
| Cash, cash equivalents and restricted cash at end of period | $ | 3,037,100 | | | $ | 6,095,570 | | | $ | 532,245 | |
| Supplemental disclosures of cash flow information: | | | | | |
| Cash paid during the period for: | | | | | |
| Interest | $ | 877,512 | | | $ | 325,308 | | | $ | 346,670 | |
| Income taxes, net of refunds | 103,547 | | | 376,609 | | | 531,103 | |
See Notes to Consolidated Financial Statements
Sysco Corporation and its Consolidated Subsidiaries
NOTES TO CONSOLIDATED FINANCIAL STATEMENTS
Unless this Form 10-K indicates otherwise or the context otherwise requires, the terms “we,” “our,” “us,” “Sysco,” or “the company” as used in this Form 10-K refer to Sysco Corporation together with its consolidated subsidiaries and divisions.
1. SUMMARY OF ACCOUNTING POLICIES
Business and Consolidation
Sysco Corporation, acting through its subsidiaries and divisions (Sysco or the company), is engaged in the marketing and distribution of a wide range of food and related products primarily to the foodservice or food-away-from-home industry. These services are performed for over 650,000 customers from 343 distribution facilities located throughout North America and Europe.
Sysco’s fiscal year ends on the Saturday nearest to June 30th. This resulted in a 53-week year ended July 3, 2021 for fiscal 2021, a 52-week year ended June 27, 2020 for fiscal 2020 and a 52-week year ended June 29, 2019 for fiscal 2019. We will have a 52-week year ending July 2, 2022 for fiscal 2022.
The accompanying financial statements include the accounts of Sysco and its consolidated subsidiaries. All significant intercompany transactions and account balances have been eliminated.
The preparation of financial statements in conformity with generally accepted accounting principles requires management to make estimates that affect the reported amounts of assets, liabilities, sales and expenses. Actual results could differ from the estimates used.
Cash and Cash Equivalents
Cash includes cash equivalents such as cash deposits, time deposits, certificates of deposit, commercial paper, high-quality money market funds and all highly liquid instruments with original maturities of three months or less, which are recorded at fair value.
Accounts Receivable, Less Allowances
Accounts receivable consist primarily of trade receivables from customers and receivables from suppliers for marketing or incentive programs. Sysco determines the past due status of trade receivables based on contractual terms with each customer and evaluates the collectability of accounts receivable to determine an appropriate allowance for credit losses on trade receivables. To calculate an allowance for credit losses, the company estimates uncollectible amounts based on historical loss experience, including those experienced during times of local and regional disasters, current conditions and collection rates, and expectations regarding future losses. Allowances are recorded for all other receivables based on an analysis of historical trends of write-offs and recoveries.
The company utilizes arrangements to sell portions of its trade accounts receivable to third-party financial institutions on a non-recourse basis. The arrangements meet the requirements for the receivables transferred to be accounted for as sales. Proceeds from the sales are reported net of negotiated discount and are recorded as a reduction to accounts receivable outstanding in the company’s consolidated balance sheets and as cash flows from operating activities in the company’s consolidated statements of cash flows. The discounts and fees associated with these arrangements were not material for the fiscal years ended July 3, 2021. For the fiscal year ended July 3, 2021, Sysco sold, without recourse, $3.0 billion of accounts receivable under these arrangements.
In certain instances, Sysco has continuing involvement subsequent to the transfer, limited to providing certain servicing and collection actions on behalf of the purchasers of the designated trade receivables. As of July 3, 2021, the outstanding aggregate principal amount of receivables that has been derecognized was $40.7 million and $205.8 million at July 3, 2021 and June 27, 2020, respectively. Sysco continues to service the receivables post-transfer on a non-recourse basis with no participating interest. Transfers under these arrangements are treated as a sale and are accounted for as a reduction in trade receivables because the agreements transfer effective control of the receivables to the buyer.
Inventories
Inventories consisting primarily of finished goods include food and related products and lodging products held for resale and are valued at the lower of cost (first-in, first-out method) and net realizable value. Elements of costs include the purchase price of the product and freight charges to deliver the product to the company’s warehouses and are net of certain cash received from vendors (see “Vendor Consideration”).
Plant and Equipment
Capital additions, improvements and major replacements are classified as plant and equipment and are carried at cost. Depreciation is recorded using the straight-line method, which reduces the book value of each asset in equal amounts over its estimated useful life, and is included within operating expenses in the consolidated results of operations. Maintenance, repairs and minor replacements are charged to earnings when they are incurred. Upon the disposition of an asset, its accumulated depreciation is deducted from the original cost, and any gain or loss is reflected in current earnings.
Long-Lived Assets
Management reviews long-lived assets, including finite-lived intangible assets, for indicators of impairment whenever events or changes in circumstances indicate that the carrying value may not be recoverable. Cash flows expected to be generated by the related assets are estimated over the asset’s useful life on an undiscounted basis. For assets held for use, Sysco groups assets and liabilities at the lowest level for which cash flows are separately identifiable. If the evaluation indicates that the carrying value of the asset may not be recoverable, the potential impairment is measured using fair value. Impairment losses for assets to be disposed of, if any, are based on the estimated proceeds to be received, less costs of disposal.
Goodwill and Indefinite-Lived Intangibles
Goodwill represents the excess of cost over the fair value of net assets acquired. Goodwill and intangibles with indefinite lives are not amortized. Goodwill is assigned to the reporting units that are expected to benefit from the synergies of a business combination. The recoverability of goodwill and indefinite-lived intangibles is assessed annually, or more frequently as needed when events or changes have occurred that would suggest an impairment of carrying value, by determining whether the fair values of the applicable reporting units exceed their carrying values. This annual testing may be performed utilizing either a qualitative or quantitative assessment; however, if a qualitative assessment is performed and it is determined that the fair value of a reporting unit is more likely than not (i.e., a likelihood of more than 50 percent) to be less than its carrying amount, a quantitative test is performed.
For fiscal 2021, the company utilized a qualitative assessment for certain reporting units. For the remaining reporting units, Sysco performed a quantitative test using a combination of the income and market approaches. The evaluation of fair value requires the use of projections, estimates and assumptions as to the future performance of the operations in performing a discounted cash flow analysis, as well as assumptions regarding sales and earnings multiples that would be applied in comparable acquisitions. The company does not believe the estimates used in the analysis are reasonably likely to change materially in the future; however, the ongoing impact of the COVID-19 pandemic on estimated future cash flows is uncertain and will largely depend on the outcome of future events, which could result in goodwill impairments going forward.
In the annual fiscal 2021 assessment, certain reporting units did not have a fair value substantially in excess of their book value. For two reporting units, with goodwill of $181.4 million in the aggregate as of July 3, 2021, headroom was considered low at 18% and 27%. All other reporting units were concluded to have a fair value that exceeded book value by at least 30%.
Derivative Financial Instruments
All derivatives are recognized as assets or liabilities within the consolidated balance sheets at fair value at their gross values. Gains or losses on derivative financial instruments designated as fair value hedges are recognized immediately in the consolidated results of operations, along with the offsetting gain or loss related to the underlying hedged item.
Gains or losses on derivative financial instruments designated as cash flow hedges are recorded as a separate component of shareholders’ equity from inception of the hedges and are reclassified to the consolidated results of operations in conjunction with the recognition of the underlying hedged item.
For net investment hedges, the remeasurement gain or loss is recorded in accumulated other comprehensive income and will be subsequently reclassified to net earnings when the hedged net investment is either sold or substantially liquidated.
Investments in Corporate-Owned Life Insurance
Investments in Corporate-Owned Life Insurance (COLI) policies are recorded at their cash surrender values as of each balance sheet date. Changes in the cash surrender value during the period are recorded as a gain or loss within operating expenses. Sysco has the ability and intent to hold certain of its COLI policies to maturity; therefore, the company does not record deferred tax balances related to cash surrender value gains or losses for these policies. The company invests in COLI policies relating to its executive deferred compensation plan and Supplemental Executive Retirement Plan (SERP). The total amounts related to the company’s investments in COLI policies included in other assets in the consolidated balance sheets were $173.0 million and $162.9 million at July 3, 2021 and June 27, 2020, respectively.
Treasury Stock
The company records treasury stock purchases at cost. Shares removed from treasury are valued at cost using the average cost method.
Foreign Currency Translation
The assets and liabilities of all foreign subsidiaries are translated at current exchange rates. Related translation adjustments are recorded as a component of AOCI (loss).
Revenue Recognition
The company, in accordance with Accounting Standards Codification (ASC) Topic 606, recognizes revenues when the performance obligation is satisfied, which is the point at which control of the promised goods or services are transferred to its customers, in an amount that reflects the consideration Sysco expects to be entitled to receive in exchange for those goods or services. For the majority of Sysco’s customer arrangements, control transfers to customers at a point-in-time when goods have been delivered, as that is generally when legal title, physical possession and risks and rewards of goods/services transfers to the customer. The timing of satisfaction of the performance obligation is not subject to significant judgment. While certain additional services may be identified within a contract, we have concluded that those services are individually immaterial in the context of the contract with the customer, and, therefore, not assessed as performance obligations.
Sales tax collected from customers is not included in revenue, but rather recorded as a liability due to the respective taxing authorities. Shipping and handling costs include costs associated with the selection of products and delivery to customers and are included within operating expenses.
Product Sales Revenues
Sysco generates revenue primarily from the distribution and sale of food and related products to its customers. Substantially all revenue is recognized at the point in time in which the product is delivered to the customer. The company grants certain customers sales incentives, such as rebates or discounts, which are accounted for as variable consideration. The variable consideration is based on amounts known at the time the performance obligation is satisfied and, therefore, requires minimal judgment. The disclosure of disaggregated revenues are presented in Note 3, “Revenue.”
Contract Balances
After completion of Sysco’s performance obligations, the company has an unconditional right to consideration as outlined in its contracts with customers. We extend credit terms to some of our customers based on our assessment of each customer’s creditworthiness. Customer receivables, which are included in accounts receivable, less allowances in the consolidated balance sheet, were $3.5 billion and $2.7 billion as of July 3, 2021 and June 27, 2020, respectively.
Sysco has certain customer contracts in which upfront monies are paid to its customers. These payments have become industry practice and are not related to financing of the customer’s business. They are not associated with any distinct good or service to be received from the customer and, therefore, are treated as a reduction of transaction prices. All upfront payments are capitalized in other assets and amortized over the life of the contract or the expected life of the relationship with the customer on a straight-line basis. As of July 3, 2021, Sysco’s contract assets were not significant. Sysco has no significant commissions paid that are directly attributable to obtaining a particular contract.
Vendor Consideration
Sysco recognizes consideration received from vendors as a reduction to cost of sales when the services performed in connection with the monies received are completed and when the related product has been sold by Sysco. In many instances, the vendor consideration is in the form of a specified amount per case or per pound. In these instances, Sysco will recognize the vendor consideration as a reduction of cost of sales when the product is sold.
Shipping and Handling Costs
Shipping and handling costs include costs associated with the selection of products and delivery to customers. Included in operating expenses are shipping and handling costs of approximately $3.1 billion, $3.0 billion and $3.5 billion in fiscal 2021, 2020 and 2019, respectively.
Insurance Program
Sysco maintains a self-insurance program covering portions of workers’ compensation, general and vehicle liability and property insurance costs. The amounts in excess of the self-insured levels are fully insured by third party insurers. Sysco has a wholly owned captive insurance subsidiary (the Captive) with the primary purpose to enhance Sysco’s risk financing strategies by providing Sysco the opportunity to negotiate insurance premiums in the non-retail insurance market. The Captive must maintain a sufficient level of cash to fund future reserve payments and secure the insurer’s obligations for workers’ compensation, general liability and auto liability programs. The Captive holds restricted assets in order to meet solvency requirements, including a restricted investment portfolio of marketable fixed income securities, which have been classified and accounted for as available-for-sale, and cash and restricted cash equivalents held in a cash deposit account. Further, Sysco has letters of credit available to collateralize the remaining liabilities not covered by restricted cash, restricted cash equivalents and marketable securities. The company also maintains a fully self-insured group medical program. Liabilities associated with these risks are estimated in part by considering historical claims experience, medical cost trends, demographic factors, severity factors and other actuarial assumptions.
Share-Based Compensation
Sysco recognizes expense for its share-based compensation based on the fair value of the awards that are granted. The fair value of performance share unit awards is determined based on the target number of shares of common stock and the company’s stock price on the date of grant and subsequently adjusted based on actual and forecasted performance compared to planned targets. The fair value of stock options is estimated at the date of grant using the Black-Scholes option pricing model. Option pricing methods require the input of subjective assumptions, including the expected stock price volatility. The fair value of restricted stock and restricted stock unit awards are based on the company’s stock price on the date of grant. Measured compensation cost is recognized ratably over the vesting period of the related share-based compensation award. The method for estimating the fair value of stock options has not changed in the past three years.
During the vesting period, Sysco reduces share-based compensation expense for estimated forfeitures, which is based on analysis of historical trends reviewed on an annual basis. Sysco’s estimate of forfeitures is applied at the grant level. The estimate of forfeitures is trued up to actual forfeitures at the end of each vesting period.
Income Taxes
Sysco recognizes deferred tax assets and liabilities based on the estimated future tax consequences attributable to differences between the financial statement carrying amounts of existing assets and liabilities and their respective tax bases. Deferred tax assets and liabilities are measured pursuant to tax laws using rates expected to apply to taxable income in the years in which those temporary differences are expected to be recovered or settled. The impact on deferred tax assets and liabilities of a change in tax rate is recognized in income in the period that includes the enactment date. Valuation allowances are established when necessary to reduce deferred tax assets to the amount more likely than not to be realized. The additional United States (U.S.) federal tax burden as a result of the global intangible low taxed income regime is accounted for as a periodic cost.
The determination of the company’s provision for income taxes requires judgment, the use of estimates and the interpretation and application of complex tax laws. The company’s provision for income taxes primarily reflects a combination of income earned and taxed in the various U.S. federal and state, as well as various foreign jurisdictions. Jurisdictional tax law changes, increases or decreases in permanent differences between book and tax items, accruals or adjustments of accruals for
tax contingencies or valuation allowances, and the company’s change in the mix of earnings from these taxing jurisdictions all affect the overall effective tax rate.
Acquisitions
Acquisitions of businesses are accounted for using the acquisition method of accounting, and the financial statements include the results of the acquired operations from the respective dates of acquisition.
The purchase price of the acquired entities is preliminarily allocated to the net assets acquired and liabilities assumed based on the estimated fair value at the dates of acquisition, with any excess of cost over the fair value of net assets acquired, including intangibles, recognized as goodwill. Subsequent changes to preliminary amounts are made prospectively.
Basis of Presentation
The financial statements include consolidated balance sheets, consolidated results of operations, consolidated statements of comprehensive income, changes in consolidated shareholders’ equity and consolidated cash flows. In the opinion of management, all adjustments, which consist of normal recurring adjustments, except as otherwise disclosed, necessary to present fairly the financial position, results of operations, comprehensive income and cash flows for all periods presented have been made.
Sysco has interests in various jointly owned foodservice operations in Mexico, Panama and Sweden for which it consolidates the results of the operations; therefore, the financial position, results of operations and cash flows for these companies have been included in Sysco’s consolidated financial statements. The value of the noncontrolling interest in each entity is considered redeemable due to certain features of the investment agreement and has, therefore, been presented as mezzanine equity, which is outside of permanent equity, in the consolidated balance sheets. The income attributable to the noncontrolling interest is located within Other expense (income), net, in the consolidated results of operations, as this amount is not material. The non-cash add back for the change in the value of the noncontrolling interest is located within Other non-cash items on the consolidated cash flows.
Supplemental Cash Flow Information
Within the Consolidated Statement of Cash Flows, certain items have been grouped as other financing activities. These primarily includes cash paid for shares withheld to cover taxes from share-based compensation and debt issuance costs.
The following table sets forth the company’s reconciliation of cash, cash equivalents and restricted cash reported within the Consolidated Statement of Cash Flows that sum to the total of the same such amounts shown in the Consolidated Balance Sheets:
| | | | | | | | | | | | | | | | | |
| Jul. 3, 2021 | | Jun. 27, 2020 | | Jun. 29, 2019 |
| (In thousands) |
| Cash and cash equivalents | $ | 3,007,123 | | | $ | 6,059,427 | | | $ | 513,460 | |
Restricted cash (1) | 29,977 | | | 36,143 | | | 18,785 | |
| Total cash, cash equivalents and restricted cash shown in the Consolidated Statement of Cash Flows | $ | 3,037,100 | | | $ | 6,095,570 | | | $ | 532,245 | |
(1) Restricted cash primarily represents cash and cash equivalents of the Captive, restricted for use to secure the insurer’s obligations for workers’ compensation, general liability and auto liability programs. Restricted cash is located within Other assets in each consolidated balance sheet.
2. CHANGES IN ACCOUNTING
Management’s Discussion and Analysis, Selected Financial Data, and Supplementary Financial Information
In November 2020, the SEC issued a final rule, Management’s Discussion and Analysis, Selected Financial Data, and Supplementary Financial Information, that amended certain SEC disclosure requirements to primarily modernize, enhance and simplify financial statement disclosures required by Regulation S-K. Sysco has adopted provisions in the rule in the fourth quarter of fiscal 2021, which primarily resulted in the removal of the selected financial data previously required by Item 301. The rule allows for the removal of the quarterly financial data previously required by Item 302; however, we have retained
quarterly financial data for fiscal 2021 due to the significant interest expense charges incurred by Sysco in the fourth quarter. The disclosure of fiscal 2021 quarterly financial data is presented in Note 22, "Quarterly Results (Unaudited)."
Financial Instruments - Credit Losses
In June 2016, the Financial Accounting Standards Board (FASB) issued Accounting Standards Update (ASU) 2016-13, Financial Instruments – Credit Losses (Topic 326): Measurement of Credit Losses on Financial Instruments, which introduces a forward-looking approach, based on expected losses, to estimate credit losses on certain types of financial instruments, including trade receivables. Sysco adopted this ASU as of June 28, 2020, the first day of fiscal 2021, with no significant impact to the company’s financial statements.
Implementation Costs Incurred in a Cloud Computing Arrangement
In August 2018, the FASB issued ASU 2018-15, Customer’s Accounting for Implementation Costs Incurred in a Cloud Computing Arrangement That is a Service Contract, which aligns the accounting for implementation costs incurred in a cloud computing arrangement that is a service contract with the guidance on capitalizing costs associated with developing or obtaining internal-use software. The guidance amends Accounting Standards Codification (ASC) 350 to include in its scope implementation costs of a cloud computing arrangement that is a service contract and clarifies that a customer should apply ASC 350 to determine which implementation costs should be capitalized in such a cloud computing arrangement. Sysco adopted this ASU on June 28, 2020 on a prospective basis with no effect on the company’s financial statements.
3. REVENUE
Disaggregation of Sales
The following tables present our sales disaggregated by reportable segment and sales mix for the company’s principal product categories for the periods presented:
| | | | | | | | | | | | | | | | | | | | | | | | | | | | | | | | |
| | 53-Week Period Ended Jul. 3, 2021 |
| | US Foodservice Operations | | International Foodservice Operations | | SYGMA | | Other | | Total |
| | (In thousands) |
| Principal Product Categories | | | | | | | | | | |
| Fresh and frozen meats | | $ | 7,002,257 | | | $ | 1,147,809 | | | $ | 1,782,229 | | | $ | — | | | $ | 9,932,295 | |
| Canned and dry products | | 6,354,670 | | | 1,625,573 | | | 166,870 | | | 116 | | | 8,147,229 | |
| Frozen fruits, vegetables, bakery and other | | 4,771,288 | | | 1,618,027 | | | 1,126,020 | | | — | | | 7,515,335 | |
| Poultry | | 3,901,642 | | | 728,584 | | | 919,578 | | | — | | | 5,549,804 | |
| Dairy products | | 3,561,080 | | | 895,330 | | | 600,903 | | | — | | | 5,057,313 | |
| Paper and disposables | | 3,072,552 | | | 391,616 | | | 772,330 | | | 49,291 | | | 4,285,789 | |
| Fresh produce | | 3,077,074 | | | 637,376 | | | 284,092 | | | — | | | 3,998,542 | |
| Seafood | | 2,140,684 | | | 311,710 | | | 129,406 | | | — | | | 2,581,800 | |
| Beverage products | | 795,192 | | | 310,534 | | | 609,687 | | | 51,395 | | | 1,766,808 | |
| | | | | | | | | | |
| | | | | | | | | | |
| | | | | | | | | | |
Other (1) | | 1,048,404 | | | 684,079 | | | 107,486 | | | 622,959 | | | 2,462,928 | |
| Total Sales | | $ | 35,724,843 | | | $ | 8,350,638 | | | $ | 6,498,601 | | | $ | 723,761 | | | $ | 51,297,843 | |
(1)Other sales relate to non-food products, including textiles and amenities for our hotel supply business, equipment and subscription sales for our Sysco Labs business, and other janitorial products, medical supplies and smallwares. We sold our interests in Cake Corporation in the first quarter of fiscal 2021.
| | | | | | | | | | | | | | | | | | | | | | | | | | | | | | | | |
| | 52-Week Period Ended Jun. 27, 2020 |
| | US Foodservice Operations | | International Foodservice Operations | | SYGMA | | Other | | Total |
| | (In thousands) |
| Principal Product Categories | | | | | | | | | | |
| Fresh and frozen meats | | $ | 7,276,675 | | | $ | 1,339,340 | | | $ | 1,509,375 | | | $ | — | | | $ | 10,125,390 | |
| Canned and dry products | | 6,603,902 | | | 1,940,506 | | | 121,646 | | | — | | | 8,666,054 | |
| Frozen fruits, vegetables, bakery and other | | 5,019,696 | | | 1,831,950 | | | 979,480 | | | — | | | 7,831,126 | |
| Dairy products | | 3,885,771 | | | 1,021,195 | | | 545,985 | | | — | | | 5,452,951 | |
| Poultry | | 3,749,786 | | | 718,753 | | | 774,629 | | | — | | | 5,243,168 | |
| Fresh produce | | 3,425,558 | | | 834,056 | | | 236,408 | | | — | | | 4,496,022 | |
| Paper and disposables | | 2,616,184 | | | 336,199 | | | 646,920 | | | 57,159 | | | 3,656,462 | |
| Seafood | | 2,186,208 | | | 407,179 | | | 102,082 | | | — | | | 2,695,469 | |
| Beverage products | | 940,534 | | | 413,315 | | | 540,545 | | | 68,393 | | | 1,962,787 | |
| | | | | | | | | | |
| | | | | | | | | | |
| | | | | | | | | | |
Other (1) | | 1,069,832 | | | 829,697 | | | 98,856 | | | 765,496 | | | 2,763,881 | |
| Total Sales | | $ | 36,774,146 | | | $ | 9,672,190 | | | $ | 5,555,926 | | | $ | 891,048 | | | $ | 52,893,310 | |
(1)Other sales relate to non-food products, including textiles and amenities for our hotel supply business, equipment and subscription sales for our Sysco Labs business, and other janitorial products, medical supplies and smallwares.
| | | | | | | | | | | | | | | | | | | | | | | | | | | | | | | | |
| | 52-Week Period Ended Jun. 29, 2019 |
| | US Foodservice Operations | | International Foodservice Operations | | SYGMA | | Other | | Total |
| | (In thousands) |
| Principal Product Categories | | | | | | | | | | |
| Fresh and frozen meats | | $ | 8,422,126 | | | $ | 1,627,392 | | | $ | 1,520,907 | | | $ | — | | | $ | 11,570,425 | |
| Canned and dry products | | 7,344,015 | | | 2,326,584 | | | 270,651 | | | — | | | 9,941,250 | |
| Frozen fruits, vegetables, bakery and other | | 5,708,030 | | | 2,074,991 | | | 1,194,944 | | | — | | | 8,977,965 | |
| Dairy products | | 4,265,320 | | | 1,243,773 | | | 604,624 | | | — | | | 6,113,717 | |
| Poultry | | 4,121,367 | | | 833,844 | | | 892,316 | | | — | | | 5,847,527 | |
| Fresh produce | | 3,801,828 | | | 1,022,503 | | | 241,602 | | | — | | | 5,065,933 | |
| Paper and disposables | | 2,797,521 | | | 369,329 | | | 731,511 | | | 61,908 | | | 3,960,269 | |
| Seafood | | 2,550,524 | | | 717,703 | | | 113,746 | | | — | | | 3,381,973 | |
| Beverage products | | 1,127,701 | | | 531,247 | | | 563,401 | | | 86,845 | | | 2,309,194 | |
Other (1) | | 1,149,756 | | | 745,674 | | | 110,626 | | | 939,613 | | | 2,945,669 | |
| Total Sales | | $ | 41,288,188 | | | $ | 11,493,040 | | | $ | 6,244,328 | | | $ | 1,088,366 | | | $ | 60,113,922 | |
(1)Other sales relate to non-food products, including textiles and amenities for our hotel supply business, equipment and subscription sales for our Sysco Labs business, and other janitorial products, medical supplies and smallwares.
4. ACQUISITIONS
There were no acquisitions during fiscal 2021. Certain acquisitions involve contingent consideration that may include earnout agreements that are typically payable over periods of up to three years in the event that certain operating results are achieved. As of July 3, 2021, aggregate contingent consideration outstanding was $13.5 million, of which $12.5 million was recorded as earnout liabilities. Earnout liabilities are measured using unobservable inputs that are considered a Level 3 measurement.
In May 2021, Sysco entered into a share sale and purchase agreement to acquire Greco and Sons, Incorporated, a leading independent Italian specialty distributor in the United States. On August 12, 2021, following the end of fiscal 2021, Sysco closed the acquisition, and Greco and Sons became a wholly-owned subsidiary of Sysco. The purchase price was paid primarily using cash on hand, and is subject to contingent consideration and certain adjustments as provided in the purchase agreement.
5. FAIR VALUE MEASUREMENTS
Fair value is defined as the price that would be received to sell an asset or paid to transfer a liability in an orderly transaction between market participants at the measurement date (i.e., an exit price). The accounting guidance includes a fair value hierarchy that prioritizes the inputs to valuation techniques used to measure fair value. The three levels of the fair value hierarchy are as follows:
•Level 1 – Unadjusted quoted prices for identical assets or liabilities in active markets;
•Level 2 – Inputs other than quoted prices in active markets for identical assets and liabilities that are observable either directly or indirectly for substantially the full term of the asset or liability; and
•Level 3 – Unobservable inputs for the asset or liability, which include management’s own assumption about the assumptions market participants would use in pricing the asset or liability, including assumptions about risk.
Sysco’s policy is to invest in only high-quality investments. Cash equivalents primarily include cash deposits, time deposits, certificates of deposit, commercial paper, high-quality money market funds and all highly liquid instruments with original maturities of three months or less.
The following is a description of the valuation methodologies used for assets and liabilities measured at fair value:
•Cash deposits included in cash equivalents are valued at amortized cost, which approximates fair value. These are included within cash equivalents as a Level 1 measurement in the tables below.
•Time deposits and commercial paper included in cash equivalents are valued at amortized cost, which approximates fair value. These are included within cash equivalents as a Level 2 measurement in the tables below.
•Money market funds are valued at the closing price reported by the fund sponsor from an actively traded exchange. These are included within cash equivalents as Level 1 measurements in the tables below.
•Fixed income securities are valued using evaluated bid prices based on a compilation of observable market information or a broker quote in a non-active market. Inputs used vary by type of security, but include spreads, yields, rate benchmarks, rate of prepayment, cash flows, rating changes and collateral performance and type.
•The interest rate swap agreements are valued using a swap valuation model that utilizes an income approach using observable market inputs including interest rates, LIBOR swap rates and credit default swap rates.
•The foreign currency swap agreements, including cross-currency swaps, are valued using a swap valuation model that utilizes an income approach applying observable market inputs, including interest rates, LIBOR swap rates for United States dollars, Canadian dollars, pound sterling and euro currencies, and credit default swap rates.
•Foreign currency forwards are valued based on exchange rates quoted by domestic and foreign banks for similar instruments.
•Fuel swap contracts are valued based on observable market transactions of forward commodity prices.
The fair value of the company’s marketable securities are all measured using inputs that are considered a Level 2 measurement, as they rely on quoted prices in markets that are not actively traded or observable inputs over the full term of the asset. The location and the fair value of the company’s marketable securities in the consolidated balance sheet are disclosed in Note 6, “Marketable Securities.” The fair value of the company’s derivative instruments are all measured using inputs that are considered a Level 2 measurement, as they are not actively traded and are valued using pricing models that use observable market quotations. The location and the fair value of derivative assets and liabilities designated as hedges in the consolidated balance sheet are disclosed in Note 10, “Derivative Financial Instruments.”
The following tables present the company’s assets measured at fair value on a recurring basis as of July 3, 2021 and June 27, 2020: | | | | | | | | | | | | | | | | | | | | | | | |
| | Assets and Liabilities Measured at Fair Value as of Jul. 3, 2021 |
| | Level 1 | | Level 2 | | Level 3 | | Total |
| | (In thousands) |
| Assets: | | | | | | | |
| Cash equivalents | | | | | | | |
| Cash and cash equivalents | $ | 2,805,961 | | | $ | 3 | | | $ | — | | | $ | 2,805,964 | |
| | | | | | | |
| | | | | | | |
Other assets (1) | 29,977 | | | — | | | — | | | 29,977 | |
| | | | | | | |
| | | | | | | |
| Total assets at fair value | $ | 2,835,938 | | | $ | 3 | | | $ | — | | | $ | 2,835,941 | |
| | | | | | | |
| | | | | | | |
| | | | | | | |
| | | | | | | |
| | | | | | | |
| | | | | | | |
| | | | | | | |
| | | | | | | |
| | | | | | | |
| | | | | | | |
| | | | | | | |
(1) Represents restricted cash balance recorded within other assets in the consolidated balance sheet.
| | | | | | | | | | | | | | | | | | | | | | | |
| | Assets and Liabilities Measured at Fair Value as of Jun. 27, 2020 |
| | Level 1 | | Level 2 | | Level 3 | | Total |
| | (In thousands) |
| Assets: | | | | | | | |
| Cash equivalents | | | | | | | |
| Cash and cash equivalents | $ | 5,245,487 | | | $ | 300,200 | | | $ | — | | | $ | 5,545,687 | |
| | | | | | | |
Other assets (1) | 36,143 | | | — | | | — | | | 36,143 | |
| | | | | | | |
| | | | | | | |
| Total assets at fair value | $ | 5,281,630 | | | $ | 300,200 | | | $ | — | | | $ | 5,581,830 | |
| | | | | | | |
| | | | | | | |
| | | | | | | |
| | | | | | | |
| | | | | | | |
| | | | | | | |
| | | | | | | |
| | | | | | | |
| | | | | | | |
| | | | | | | |
| | | | | | | |
(1) Represents restricted cash balance recorded within other assets in the consolidated balance sheet.
The carrying values of accounts receivable and accounts payable approximated their respective fair values due to their short-term maturities. The fair value of Sysco’s total debt is estimated based on the quoted market prices for the same or similar issues or on the current rates offered to the company for new debt with the same maturities as existing debt, and is considered a Level 2 measurement. The fair value of total debt was approximately $13.3 billion and $16.3 billion as of July 3, 2021 and June 27, 2020, respectively. The carrying value of total debt was $11.1 billion and $14.4 billion as of July 3, 2021 and June 27, 2020, respectively.
6. MARKETABLE SECURITIES
Sysco invests a portion of the assets held by our wholly owned captive insurance subsidiary in a restricted investment portfolio of marketable fixed income securities, which have been classified and accounted for as available-for-sale. The company includes fixed income securities maturing in less than twelve months within Prepaid expenses and other current assets and includes fixed income securities maturing in more than twelve months within Other assets in the accompanying
Consolidated Balance Sheets. The company records the amounts at fair market value, which is determined using quoted market prices at the end of the reporting period.
ASC 326 requires Sysco to estimate lifetime expected credit losses for all available-for-sale debt securities in an unrealized loss position by assessing credit indicators, including credit ratings, for the applicable securities. If the assessment indicates that an expected credit loss exists, the company determines the portion of the unrealized loss attributable to credit deterioration and records an allowance for the expected credit loss through the consolidated results of operations. Unrealized gains and losses on marketable securities are recorded in Accumulated other comprehensive loss. The following table presents the company’s available-for-sale marketable securities as of July 3, 2021 and June 27, 2020:
| | | | | | | | | | | | | | | | | | | | | | | | | | | | | | | | | | | |
| Jul. 3, 2021 |
| Amortized Cost Basis | | Gross Unrealized Gains | | Gross Unrealized Losses | | Fair Value | | Short-Term Marketable Securities | | Long-Term Marketable Securities |
| (In thousands) |
| Fixed income securities: | | | | | | | | | | | |
| Corporate bonds | $ | 92,547 | | | $ | 2,491 | | | $ | (456) | | | $ | 94,582 | | | $ | 11,570 | | | $ | 83,012 | |
| Government bonds | 31,552 | | | 3,556 | | | — | | | 35,108 | | | — | | | 35,108 | |
| Total marketable securities | $ | 124,099 | | | $ | 6,047 | | | $ | (456) | | | $ | 129,690 | | | $ | 11,570 | | | $ | 118,120 | |
| | | | | | | | | | | | | | | | | | | | | | | | | | | | | | | | | | | |
| Jun. 27, 2020 |
| Amortized Cost Basis | | Gross Unrealized Gains | | Gross Unrealized Losses | | Fair Value | | Short-Term Marketable Securities | | Long-Term Marketable Securities |
| (In thousands) |
| Fixed income securities: | | | | | | | | | | | |
| Corporate bonds | $ | 78,651 | | | $ | 4,064 | | | $ | — | | | $ | 82,715 | | | $ | 18,233 | | | $ | 64,482 | |
| Government bonds | 28,633 | | | 4,919 | | | — | | | 33,552 | | | — | | | 33,552 | |
| Total marketable securities | $ | 107,284 | | | $ | 8,983 | | | $ | — | | | $ | 116,267 | | | $ | 18,233 | | | $ | 98,034 | |
As of July 3, 2021, the balance of available-for-sale securities by contractual maturity is shown in the following table. Within the table, maturities of fixed income securities have been allocated based upon timing of estimated cash flows. Actual maturities may differ from contractual maturities because the issuers of the securities may have the right to prepay obligations without prepayment penalties.
| | | | | |
| Jul. 3, 2021 |
| (In thousands) |
| Due in one year or less | $ | 11,570 | |
| Due after one year through five years | 73,860 | |
| Due after five years through ten years | 44,260 | |
| |
| Total | $ | 129,690 | |
There were no significant realized gains or losses in marketable securities during fiscal 2021.
7. ALLOWANCE FOR CREDIT LOSSES ON TRADE RECEIVABLES
Sysco determines the past due status of trade receivables based on contractual terms with each customer and evaluates the collectability of accounts receivable to determine an appropriate allowance for credit losses on trade receivables. To calculate an allowance for credit losses, the company estimates uncollectible amounts based on historical loss experience, including those experienced during times of local and regional disasters, current conditions and collection rates, and expectations regarding future losses. The COVID-19 pandemic is more widespread and longer in duration than historical disasters that have impacted Sysco’s business, and it is possible that actual uncollectible amounts will differ from historical results.
In the third and fourth quarters of fiscal 2020, the company experienced an increase in past due receivables and recognized additional bad debt charges on its trade receivables that were outstanding at the time the pandemic caused closures among our customers in mid-March 2020. These receivables were all created in fiscal 2020 and are referred to as pre-pandemic receivables. In fiscal 2021, conditions improved and the company’s results reflect a benefit on the reduction of its allowance for pre-pandemic receivable balances, as the company has made progress on obtaining timely payments from its customers. Sysco continues to work with its customers to collect past due balances, including through the use of payment plans. The company has also discontinued charging interest on past due balances. As a result, the company’s allowance for credit losses has been reduced accordingly, resulting in a $184.8 million benefit on pre-pandemic receivables. Below is a summary of the activity in the allowance for credit losses on trade receivables for fiscal 2021:
A summary of the activity in the allowance for credit losses on trade receivables appears below:
| | | | | | | | | | | | | | | | | |
| | 2021 | | 2020 | | 2019 |
| | (In thousands) |
| Balance at beginning of period | $ | 334,810 | | | $ | 28,176 | | | $ | 25,768 | |
| Adjustments to costs and expenses | (152,740) | | | 404,158 | | | 62,946 | |
| Customer accounts written off, net of recoveries | (45,230) | | | (83,915) | | | (64,219) | |
| Other adjustments | (19,145) | | | (13,609) | | | 3,681 | |
| Balance at end of period | $ | 117,695 | | | $ | 334,810 | | | $ | 28,176 | |
8. PLANT AND EQUIPMENT
A summary of plant and equipment, including the related accumulated depreciation, appears below:
| | | | | | | | | | | | | | | | | |
| | Jul. 3, 2021 | | Jun. 27, 2020 | | Estimated Useful Lives |
| | (In thousands) | | |
| Plant and equipment at cost: | | | | | |
| Land | $ | 492,504 | | | $ | 493,694 | | | |
| Buildings and improvements | 4,984,355 | | | 4,854,307 | | | 10-30 years |
| Fleet and equipment | 3,777,115 | | | 3,561,500 | | | 3-10 years |
| Computer hardware and software | 1,419,497 | | | 1,258,980 | | | 3-5 years |
| Total plant and equipment at cost | 10,673,471 | | | 10,168,481 | | | |
| Accumulated depreciation | (6,347,408) | | | (5,709,914) | | | |
| Total plant and equipment, net | $ | 4,326,063 | | | $ | 4,458,567 | | | |
Depreciation expense, including amortization of capital leases, was $635.0 million in 2021, $705.2 million in 2020 and $656.6 million in 2019.
9. GOODWILL AND OTHER INTANGIBLES
The changes in the carrying amount of goodwill by reportable segment for the years presented are as follows:
| | | | | | | | | | | | | | | | | | | | | | | | | | | | | |
| | U.S. Foodservice Operations | | International Foodservice Operations | | SYGMA | | Other | | Total |
| | (In thousands) |
| Carrying amount as of June 29, 2019 | $ | 1,265,485 | | | $ | 2,375,932 | | | $ | 32,607 | | | $ | 222,202 | | | $ | 3,896,226 | |
| Goodwill acquired during year | 90,477 | | | — | | | — | | | — | | | 90,477 | |
| Impairment | — | | | (169,007) | | | — | | | (34,199) | | | (203,206) | |
| Currency translation/other | 2,162 | | | (53,164) | | | — | | | (26) | | | (51,028) | |
| Carrying amount as of June 27, 2020 | $ | 1,358,124 | | | $ | 2,153,761 | | | $ | 32,607 | | | $ | 187,977 | | | $ | 3,732,469 | |
| Goodwill acquired during year | — | | | — | | | — | | | — | | | — | |
| | | | | | | | | |
| Currency translation/other | (4,520) | | | 216,012 | | | — | | | 178 | | | 211,670 | |
| Carrying amount as of July 3, 2021 | $ | 1,353,604 | | | $ | 2,369,773 | | | $ | 32,607 | | | $ | 188,155 | | | $ | 3,944,139 | |
There were no acquisitions in fiscal 2021.
Fully amortized intangible assets have been removed in the period fully amortized in the table below, which presents the company’s amortizable intangible assets in total by category as follows:
| | | | | | | | | | | | | | | | | | | | | | | | | | | | | | | | | | | |
| | Jul. 3, 2021 | | Jun. 27, 2020 |
| | Gross Carrying Amount | | Accumulated Amortization | | Net | | Gross Carrying Amount | | Accumulated Amortization | | Net |
| | (In thousands) |
| Customer relationships | $ | 1,125,464 | | | $ | (552,444) | | | $ | 573,020 | | | $ | 1,048,702 | | | $ | (434,262) | | | $ | 614,440 | |
| Non-compete agreements | 19,525 | | | (9,926) | | | 9,599 | | | 23,252 | | | (10,182) | | | 13,070 | |
| Trademarks | 14,360 | | | (6,943) | | | 7,417 | | | 13,691 | | | (5,816) | | | 7,875 | |
| | | | | | | | | | | |
Total amortizable intangible
assets | $ | 1,159,349 | | | $ | (569,313) | | | $ | 590,036 | | | $ | 1,085,645 | | | $ | (450,260) | | | $ | 635,385 | |
The table below presents the company’s indefinite-lived intangible assets by category as follows:
| | | | | | | | | | | |
| | Jul. 3, 2021 | | Jun. 27, 2020 |
| | (In thousands) |
| Trademarks | $ | 155,071 | | | $ | 143,820 | |
| Licenses | 966 | | | 966 | |
| Total indefinite-lived intangible assets | $ | 156,037 | | | $ | 144,786 | |
Amortization expense for 2021, 2020 and 2019 was $103.5 million, $95.3 million and $92.3 million, respectively. The estimated future amortization expense for the next five fiscal years on intangible assets outstanding as of July 3, 2021 is shown below:
| | | | | |
| | Amount |
| | (In thousands) |
| 2022 | $ | 102,921 | |
| 2023 | 99,836 | |
| 2024 | 95,991 | |
| 2025 | 90,237 | |
| 2026 | 83,622 | |
10. DERIVATIVE FINANCIAL INSTRUMENTS
Sysco uses derivative financial instruments to enact hedging strategies for risk mitigation purposes; however, the company does not use derivative financial instruments for trading or speculative purposes. Hedging strategies are used to manage interest rate risk, foreign currency risk and fuel price risk.
Hedging of interest rate risk
Sysco manages its debt portfolio with interest rate swaps from time to time to achieve an overall desired position of fixed and floating rates. In fiscal 2021, Sysco settled some of its previously held interest rate swap contracts, which had notional values of $750 million and $500 million, due to the redemption of Sysco’s 2.60% senior notes and 2.50% senior notes, respectively.
Hedging of foreign currency risk
Sysco previously entered into cross-currency swap contracts to hedge the foreign currency transaction risk of certain intercompany loans. There were no credit-risk related contingent features associated with these swaps, which had been designated as cash flow hedges. In the first quarter of 2021, Sysco settled its cross-currency swaps, which had a notional value of £234 million. The company also uses euro-bond denominated debt to hedge the foreign currency exposure of our net investment in certain foreign operations. Additionally, Sysco’s operations in Europe have inventory purchases denominated in currencies other than their functional currency, such as the euro, U.S. dollar, Polish zloty and Danish krone. These inventory purchases give rise to foreign currency exposure between the functional currency of each entity and these currencies. The company enters into foreign currency forward swap contracts to sell the applicable entity’s functional currency and buy currencies matching the inventory purchase, which operate as cash flow hedges of the company’s foreign currency-denominated inventory purchases.
Hedging of fuel price risk
Sysco uses fuel commodity swap contracts to hedge against the risk of the change in the price of diesel on anticipated future purchases. These swaps have been designated as cash flow hedges.
None of the company’s hedging instruments contain credit-risk-related contingent features. Details of outstanding hedging instruments as of July 3, 2021 are presented below:
| | | | | | | | | | | | | | |
| Maturity Date of the Hedging Instrument | | Currency / Unit of Measure | | Notional Value |
| | | | (In millions) |
| Hedging of interest rate risk | | | | |
| June 2023 | | Euro | | 500 |
| March 2025 | | U.S. Dollar | | 500 |
| | | | |
| Hedging of foreign currency risk | | | | |
| Various (July 2021 to August 2021) | | Swedish Krona | | 89 |
| Various (July 2021 to December 2021) | | British Pound Sterling | | 10 |
| June 2023 | | Euro | | 500 |
| | | | |
| Hedging of fuel risk | | | | |
| Various (July 2021 to June 2022) | | Gallons | | 32 |
The location and the fair value of derivative instruments designated as hedges in the consolidated balance sheet as of July 3, 2021 and June 27, 2020 are as follows:
| | | | | | | | | | | | | | | | | |
| | | | Derivative Fair Value |
| | Balance Sheet location | | Jul. 3, 2021 | | Jun. 27, 2020 |
| | | (In thousands) |
| Fair Value Hedges: | | | | | |
| Interest rate swaps | Other current assets | | $ | — | | | $ | 1,388 | |
| Interest rate swaps | Other assets | | 43,217 | | | 69,782 | |
| | | | | |
| | | | | |
| | | | | |
| Cash Flow Hedges: | | | | | |
| Fuel swaps | Other current assets | | $ | 16,732 | | | $ | 233 | |
| Foreign currency forwards | Other current assets | | 42 | | | 1,063 | |
| | | | | |
| Fuel swaps | Other assets | | — | | | 1,173 | |
| Cross currency swaps | Other assets | | — | | | 19,614 | |
| Fuel swaps | Other current liabilities | | — | | | 28,242 | |
| Foreign currency forwards | Other current liabilities | | 46 | | | 222 | |
| | | | | |
| | | | | |
| | | | | |
| | | | | |
| | | | | |
| | | | | |
| | | | | |
Gains or losses recognized in the consolidated results of operations for cash flow hedging relationships are not significant for each of the periods presented. The location and amount of gains or losses recognized in the consolidated results of operations for fair value hedging relationships for each of the periods, presented on a pretax basis, are as follows:
| | | | | | | | | | | | | | | | | | |
| | | | | | Jul. 3, 2021 | | Jun. 27, 2020 |
| | | | | | (In thousands) |
| Total amounts of income and expense line items presented in the consolidated results of operations in which the effects of fair value hedges are recorded | | | | | | $ | 880,137 | | | $ | 408,220 | |
| Gain or (loss) on fair value hedging relationships: | | | | | | | | |
| Interest rate swaps: | | | | | | | | |
| Hedged items | | | | | | $ | (15,749) | | | $ | (101,255) | |
| Derivatives designated as hedging instruments | | | | | | (53,701) | | | 44,489 | |
| | | | | | | | |
| | | | | | | | |
| | | | | | | | |
| | | | | | | | |
| | | | | | | | |
| | | | | | | | |
| | | | | | | | |
The losses on the fair value hedging relationships associated with the hedged items as disclosed in the table above are comprised of the following components for each of the periods presented: | | | | | | | | | | | | | | | | | | |
| | | | | | Jul. 3, 2021 | | Jun. 27, 2020 |
| | | | | | (In thousands) |
| Interest expense | | | | | | $ | (44,159) | | | $ | (58,244) | |
| Increase (decrease) in fair value of debt | | | | | | (28,410) | | | 43,011 | |
| Hedged items | | | | | | $ | (15,749) | | | $ | (101,255) | |
The location and effect of cash flow and net investment hedge accounting on the consolidated statements of comprehensive income for the fiscal years ended July 3, 2021 and June 27, 2020, presented on a pretax basis, are as follows:
| | | | | | | | | | | | | | | | | |
| 2021 |
| Amount of Gain or (Loss) Recognized in Other Comprehensive Income on Derivatives | | Location of Gain or (Loss) Reclassified from Accumulated Other Comprehensive Income into Income | | Amount of Gain or (Loss) Reclassified from Accumulated Other Comprehensive Income into Income |
| (In thousands) | | | | (In thousands) |
| Derivatives in cash flow hedging relationships: | | | | | |
| Fuel swaps | $ | 39,644 | | | Operating expense | | $ | (17,470) | |
| Foreign currency contracts | (20,578) | | | Cost of sales / Other income | | (2,692) | |
| Total | $ | 19,066 | | | | | $ | (20,162) | |
| | | | | |
| Derivatives in net investment hedging relationships: | | | | | |
| | | | | |
| Foreign denominated debt | (32,206) | | | N/A | | — | |
| Total | $ | (32,206) | | | | | $ | — | |
| | | | | | | | | | | | | | | | | |
| 2020 |
| Amount of Gain or (Loss) Recognized in Other Comprehensive Income on Derivatives | | Location of Gain or (Loss) Reclassified from Accumulated Other Comprehensive Income into Income | | Amount of Gain or (Loss) Reclassified from Accumulated Other Comprehensive Income into Income |
| (In thousands) | | | | (In thousands) |
| Derivatives in cash flow hedging relationships: | | | | | |
| Fuel swaps | $ | (16,586) | | | Operating expense | | $ | (22,058) | |
| Foreign currency contracts | 6,755 | | | Cost of sales / Other income | | 3,626 | |
| Total | $ | (9,831) | | | | | $ | (18,432) | |
| | | | | |
| Derivatives in net investment hedging relationships: | | | | | |
| Foreign currency contracts | $ | 51,354 | | | N/A | | $ | — | |
| Foreign denominated debt | 7,402 | | | N/A | | — | |
| Total | $ | 58,756 | | | | | $ | — | |
The location and carrying amount of hedged liabilities in the consolidated balance sheet as of July 3, 2021 are as follows:
| | | | | | | | | | | |
| Jul. 3, 2021 |
| Carrying Amount of Hedged Assets (Liabilities) | | Cumulative Amount of Fair Value Hedging Adjustments Included in the Carrying Amount of Hedged Assets (Liabilities) |
| (In thousands) |
| Balance sheet location: | | | |
| | | |
| Long-term debt | $ | (1,065,364) | | | $ | (43,217) | |
The location and carrying amount of hedged liabilities in the consolidated balance sheet as of June 27, 2020 are as follows:
| | | | | | | | | | | |
| Jun. 27, 2020 |
| Carrying Amount of Hedged Assets (Liabilities) | | Cumulative Amount of Fair Value Hedging Adjustments Included in the Carrying Amount of Hedged Assets (Liabilities) |
| (In thousands) |
| Balance sheet location: | | | |
| Current maturities of long-term debt | $ | (749,924) | | | $ | (1,388) | |
| Long-term debt | (1,563,636) | | | (70,239) | |
11. SELF-INSURED LIABILITIES
Sysco maintains a self-insurance program covering portions of workers’ compensation, general and vehicle liability and property insurance costs. The amounts in excess of the self-insured levels are fully insured by third party insurers. The company also maintains a fully self-insured group medical program. A summary of the activity in self-insured liabilities appears below:
| | | | | | | | | | | | | | | | | |
| | 2021 | | 2020 | | 2019 |
| | (In thousands) |
| Balance at beginning of period | $ | 329,648 | | | $ | 297,817 | | | $ | 270,986 | |
| Charged to costs and expenses | 494,328 | | | 502,315 | | | 492,411 | |
| Payments | (464,856) | | | (470,484) | | | (465,580) | |
| Balance at end of period | $ | 359,120 | | | $ | 329,648 | | | $ | 297,817 | |
The long-term portion of the self-insured liability balance was $227.7 million and $205.6 million as of July 3, 2021, and June 27, 2020, respectively.
12. DEBT AND OTHER FINANCING ARRANGEMENTS
Sysco’s debt consists of the following: | | | | | | | | | | | |
| | Jul. 3, 2021 | | Jun. 27, 2020 |
| | (In thousands) |
| | | |
| U.K. Commercial paper, interest at 0.454%, maturing in fiscal 2021 | $ | — | | | $ | 740,226 | |
Senior notes, interest at 2.60%, maturing in fiscal 2021 (1)(2) | — | | | 751,312 | |
Senior notes, interest at 2.50%, maturing in fiscal 2022 (1)(2) | — | | | 504,352 | |
Senior notes, interest at 2.60%, maturing in fiscal 2022 (1)(2) | 449,180 | | | 448,336 | |
Senior notes, interest at 1.25%, maturing in fiscal 2023 (1)(2) | 598,253 | | | 568,011 | |
Senior notes, interest at 3.55%, maturing in fiscal 2025 (1)(2) | 533,681 | | | 551,756 | |
Senior notes, interest at 3.65%, maturing in fiscal 2025 (1) | 402,589 | | | 362,785 | |
Senior notes, interest at 5.65%, maturing in fiscal 2025 (1)(2) | 746,186 | | | 745,241 | |
Senior notes, interest at 3.75%, maturing in fiscal 2026 (1)(2) | 748,165 | | | 747,727 | |
Senior notes, interest at 3.30%, maturing in fiscal 2027 (1)(2) | 994,916 | | | 993,978 | |
Debentures, interest at 7.16%, maturing in fiscal 2027 (2)(3) | 43,173 | | | 44,273 | |
Senior notes, interest at 3.25%, maturing in fiscal 2028 (1)(2) | 744,827 | | | 744,046 | |
Debentures, interest at 6.50%, maturing in fiscal 2029 (2) | 154,882 | | | 162,416 | |
Senior notes, interest at 2.40%, maturing in fiscal 2030 (1)(2) | 495,728 | | | 495,273 | |
Senior notes, interest at 5.95%, maturing in fiscal 2030 (1)(2) | 991,833 | | | 1,239,439 | |
Senior notes, interest at 5.375%, maturing in fiscal 2036 (1)(2) | 382,319 | | | 382,190 | |
Senior notes, interest at 6.625%, maturing in fiscal 2039 (1)(2) | 199,088 | | | 199,390 | |
Senior notes, interest at 6.60%, maturing in fiscal 2040 (1)(2) | 349,564 | | | 740,188 | |
Senior notes, interest at 4.85%, maturing in fiscal 2046 (1)(2) | 496,177 | | | 496,017 | |
Senior notes, interest at 4.50%, maturing in fiscal 2046 (1)(2) | 494,469 | | | 494,338 | |
Senior notes, interest at 4.45%, maturing in fiscal 2048 (1)(2) | 492,813 | | | 492,662 | |
Senior notes, interest at 6.60%, maturing in fiscal 2050 (1)(2) | 1,176,415 | | | 1,233,666 | |
Senior notes, interest at 3.30%, maturing in fiscal 2050 (1)(2) | 494,554 | | | 494,428 | |
Long-term revolving credit facility, at variable interest, maturing in fiscal 2024 (2) | — | | | 694,951 | |
| Notes payable, capital leases, and other debt, interest averaging 4.40% and maturing at various dates to fiscal 2050 as of July 3, 2021 and 4.53% and maturing at various dates to fiscal 2046 as of June 27, 2020 | 94,295 | | | 119,878 | |
| Total debt | 11,083,107 | | | 14,446,879 | |
| Less current maturities of long-term debt | (486,141) | | | (1,542,128) | |
| Less notes payable | (8,782) | | | (2,266) | |
| Net long-term debt | $ | 10,588,184 | | | $ | 12,902,485 | |
(1)Represents senior notes that are unsecured, are not subject to any sinking fund requirement and include a redemption provision that allows Sysco to retire the debentures and notes at any time prior to maturity at the greater of par plus accrued interest or an amount designed to ensure that the debenture and note holders are not penalized by the early redemption.
(2)Represents senior notes, debentures and borrowings under the company’s long-term revolving credit facility that are guaranteed by certain wholly owned U.S. Broadline subsidiaries of Sysco Corporation as discussed in Item 7, “Management’s Discussion and Analysis of Financial Condition and Results of Operations – Liquidity and Capital Resources.”
(3)This debenture is not subject to any sinking fund requirement and is no longer redeemable prior to maturity.
As of July 3, 2021, the principal and interest payments required to be made during the next five fiscal years on Sysco’s senior notes and debentures are shown below: | | | | | | | | | | | |
| | Principal | | Interest (1) |
| (In thousands) |
| 2022 | $ | 450,000 | | | $ | 484,793 | |
| 2023 | 593,303 | | | 474,331 | |
| 2024 | — | | | 465,614 | |
| 2025 | 1,654,138 | | | 465,583 | |
| 2026 | 750,000 | | | 377,786 | |
(1) Includes payments on floating rate debt based on rates as of July 3, 2021, assuming amount remains unchanged until maturity, and payments on fixed rate debt based on maturity dates. The impact of our outstanding fixed-to-floating interest rate swap on the fixed rate debt interest payments is included as well based on the floating rates in effect as of July 3, 2021.
The company has a $2.0 billion long-term revolving credit facility that expires on June 28, 2024, subject to extension. In March 2021, Sysco paid $700 million that was outstanding under this facility; therefore, as of July 3, 2021, there were no borrowings outstanding under this facility. During the fourth quarter of fiscal 2020 due to worsening business conditions, Sysco entered into an amendment to the credit agreement providing for the long-term revolving credit facility, and further amended the credit agreement in the fourth quarter of fiscal 2021 due to improving business conditions to (1) adjust the covenant restricting increases to Sysco’s regular quarterly dividend to enable future increases; (2) remove access to the 364-day credit facility that the company believes it no longer needs; and (3) adjust the covenant requiring Sysco to maintain a certain ratio of consolidated earnings before interest, tax, depreciation and amortization to consolidated interest expense.
Sysco has a commercial paper program allowing the company to issue short-term unsecured notes in an aggregate amount not to exceed $2.0 billion. Any outstanding amounts are classified within long-term debt, as the program is supported by the long-term revolving credit facility. As of July 3, 2021, there were no commercial paper issuances outstanding under this U.S. program.
Sysco’s United Kingdom-based subsidiary, Brake Bros Limited, had a separate U.K. commercial paper program for the purpose of issuing short-term, unsecured Sterling-denominated notes in an aggregate amount not to exceed £600.0 million. During the third and fourth quarters of fiscal 2021 the company repaid the £600.0 million prior to maturity on May 7, 2021.
Effective May 20, 2020, Sysco established a 364-day credit facility in the amount of $750.0 million. This facility expired on May 19, 2021.
During fiscal 2021, aggregate outstanding commercial paper issuances, borrowings under our long-term revolving credit facility and short-term bank borrowings ranged from no borrowings to approximately $1.5 billion.
Purchases and redemptions of senior notes and debentures
In the fourth quarter of fiscal 2021, Sysco purchased, pursuant to a tender offer, $712.4 million in combined aggregate principal amount of the following securities: its 7.160% debentures due 2027, its 6.500% debentures due 2028, its 5.950% senior notes due 2030, its 6.625% senior notes due 2039, its 6.600% senior notes due 2040 and its 6.600% senior notes due 2050. Holders of securities received an early tender payment of $50 per $1,000 principal amount of securities. Holders of such securities also received accrued and unpaid interest from, and including, the last interest payment date for their tendered securities, to but not including, the early settlement date of June 7, 2021. The tender offer transaction was considered to be a debt extinguishment. As such, Sysco recognized a loss on extinguishment of $293.9 million, which was recorded as a component of interest expense in the accompanying consolidated results of operations. Of this loss, $287.6 million was attributable to the purchase premium paid to the lenders, $4.9 million was attributable to the write-off of unamortized debt issuance costs associated with the redeemed debentures and notes, and $1.4 million was attributable to an accelerated charge on the debt discount related to these debentures and notes.
Details of the debentures and senior notes purchased are as follows:
| | | | | | | | | | | | | | | | | | | | | | | | | | | | | | | | |
| Maturity Date | | Par Value | | Coupon Rate | | Principal amount tendered | | Remaining Par Value after tender offer | | Cash amount paid (including interest) |
| | (Dollars in thousands) |
| April 15, 2027 | | $ | 44,276 | | | 7.160 | % | | $ | 1,100 | | | $ | 43,176 | | | $ | 1,429 | |
| August 1, 2028 | | 163,054 | | | 6.500 | | | 7,639 | | | 155,415 | | | 9,957 | |
| April 1, 2030 | | 1,250,000 | | | 5.950 | | | 249,987 | | | 1,000,013 | | | 323,720 | |
| March 17, 2039 | | 203,007 | | | 6.625 | | | 507 | | | 202,500 | | | 745 | |
| April 1, 2040 | | 750,000 | | | 6.600 | | | 395,026 | | | 354,974 | | | 582,197 | |
| April 1, 2050 | | 1,250,000 | | | 6.600 | | | 58,123 | | | 1,191,877 | | | 90,350 | |
In September 2020, Sysco redeemed all $750 million of its outstanding 2.60% senior notes prior to the October 2020 maturity. In June 2021, Sysco also redeemed $500 million of its outstanding 2.50% senior notes due July 15, 2021.
As of July 3, 2021 and June 27, 2020, letters of credit outstanding were $246.5 million and $233.2 million, respectively.
13. LEASES
Sysco leases certain of its distribution and warehouse facilities, office facilities, fleet vehicles, and office and warehouse equipment. The company determines if an arrangement is a lease at inception and recognizes a finance or operating lease liability and right-of-use (ROU) asset in the consolidated balance sheets if a lease exists. Lease liabilities are recognized based on the present value of future minimum lease payments over the lease term at the commencement date. If the borrowing rate implicit in the lease is not readily determinable, Sysco uses its incremental borrowing rate based on the information available at the commencement date in determining the present value of future payments.
The lease term is defined as the noncancelable period of the lease plus any options to extend or terminate the lease when it is reasonably certain that the company will exercise one of these options. Leases with an initial term of 12 months or less are not recorded in Sysco’s consolidated balance sheets, and the company recognizes expense for these leases on a straight-line basis over the lease term. Variable lease payments that do not depend on an index or a rate, such as insurance and property taxes, are excluded from the measurement of the lease liability and are recognized as variable lease cost when the obligation for that payment is incurred. For leases in which the lease and non-lease components have been combined, the variable lease expense includes expenses such as common area maintenance, utilities, and repairs and maintenance. Sysco’s leases do not contain significant residual value guarantees and do not impose significant restrictions or covenants.
The following table presents the location of the finance lease ROU assets and lease liabilities in the company’s Consolidated Balance Sheets at July 3, 2021 and June 27, 2020:
| | | | | | | | | | | | | | | | | | | | |
| | Consolidated Balance Sheet Location | | Jul. 3, 2021 | | Jun. 27, 2020 |
| | | | (In thousands) |
| Finance lease right-of-use assets | | Plant and equipment at cost, less accumulated depreciation | | $ | 76,381 | | | $ | 99,918 | |
| Current finance lease liabilities | | Current maturities of long-term debt | | 27,910 | | | 33,670 | |
| Long-term finance lease liabilities | | Long-term debt | | 51,282 | | | 68,942 | |
The following table presents lease costs for each of the presented periods ended July 3, 2021 and June 27, 2020:
| | | | | | | | | | | | | | | | | | | | | | |
| | Consolidated Results of Operations Location | | | | Jul. 3, 2021 | | Jun. 27, 2020 |
| | | | | (In thousands) |
| Operating lease cost | | Operating expenses | | | | $ | 131,503 | | | $ | 123,269 | |
| Financing lease cost: | | | | | | | | |
| Amortization of right-of-use assets | | Operating expenses | | | | 36,981 | | | 38,285 | |
| Interest on lease obligations | | Interest expense | | | | 3,824 | | | 4,667 | |
| Variable lease cost | | Operating expenses | | | | 6,083 | | | 7,606 | |
| Short-term lease cost | | Operating expenses | | | | 10,845 | | | 13,602 | |
| Net lease cost | | | | | | $ | 189,236 | | | $ | 187,429 | |
Future minimum lease obligations under existing noncancelable operating and finance lease agreements by fiscal year as of July 3, 2021 are as follows:
| | | | | | | | | | | | | | |
| | Operating Leases | | Finance Leases |
| | (In thousands) |
| 2022 | | $ | 120,286 | | | $ | 30,890 | |
| 2023 | | 105,458 | | | 22,625 | |
| 2024 | | 77,844 | | | 14,459 | |
| 2025 | | 71,422 | | | 9,199 | |
| 2026 | | 63,922 | | | 4,847 | |
| Thereafter | | 441,768 | | | 4,410 | |
| Total undiscounted lease obligations | | 880,700 | | | 86,430 | |
| Less imputed interest | | (143,560) | | | (7,238) | |
| Present value of lease obligations | | $ | 737,140 | | | $ | 79,192 | |
Other information related to lease agreements was as follows:
| | | | | | | | | | | | | | |
| | Jul. 3, 2021 | | Jun. 27, 2020 |
| Cash Paid For Amounts Included In Measurement of Liabilities: | | (Dollars in thousands) |
| Operating cash flows for operating leases | | $ | 142,351 | | | $ | 124,040 | |
| Operating cash flows for financing leases | | 3,824 | | | 4,666 | |
| Financing cash flows for financing leases | | 37,103 | | | 34,145 | |
| | | | |
| Supplemental Non-cash Information on Lease Liabilities: | | | | |
| Assets obtained in exchange for operating lease obligations | | $ | 93,416 | | | $ | 64,968 | |
| Assets obtained in exchange for finance lease obligations | | 8,687 | | | 17,019 | |
| Operating lease asset adjustments, including renewals and remeasurements | | 82,026 | | | (9,087) | |
| Operating lease liability adjustments, including renewals and remeasurements | | 90,578 | | | 18,621 | |
| | | | |
| Lease Term and Discount Rate: | | | | |
| Weighted-average remaining lease term (years): | | | | |
| Operating leases | | 12.34 years | | 11.54 years |
| Financing leases | | 3.67 years | | 4.03 years |
| Weighted-average discount rate: | | | | |
| Operating leases | | 2.84 | % | | 2.37 | % |
| Financing leases | | 4.04 | % | | 4.24 | % |
14. COMPANY-SPONSORED EMPLOYEE BENEFIT PLANS
Sysco has company-sponsored defined benefit and defined contribution retirement plans for its employees. Also, the company provides certain health care benefits to eligible retirees and their dependents.
Defined Contribution Plans
The company operates a defined contribution 401(k) Plan as a Safe Harbor Plan, which is a plan that treats all employees’ benefits equally within the plan, under Sections 401(k) and 401(m) of the Internal Revenue Code with respect to non-union employees and those union employees whose unions adopted the Safe Harbor Plan provisions. The company will make a non-elective contribution each pay period equal to 3% of a participant’s compensation. Additionally, the company will make matching contributions of 50% of a participant’s pretax contribution on the first 6% of the participant’s compensation contributed by the participant. Certain employees are also eligible for a transition contribution, and the company may also make discretionary contributions. For union employees who are members of unions that did not adopt the Safe Harbor Plan provisions, the plan provides that under certain circumstances the company may make matching contributions of up to 50% of the first 6% of a participant’s compensation.
The company also has a non-qualified, unfunded Management Savings Plan (MSP) available to key management personnel who are participants in the Management Incentive Plan (MIP). Participants may defer up to 50% of their annual salary and up to 90% of their annual bonus. The company will make a non-elective contribution each pay period equal to 3% of a participant’s compensation. Additionally, the company will make matching contributions of 50% of a participant’s pretax contribution on the first 6% of the participant’s eligible compensation that is deferred. Certain employees are also eligible for a transition contribution, and the company may also make discretionary contributions. All company contributions to the MSP are limited by the amounts contributed by the company to the participant’s 401(k) account. The company had deferred compensation obligations of $107.7 million as of July 3, 2021 and $113.0 million as of June 27, 2020 under the unfunded MSP and the company’s executive deferred compensation plan, which is frozen to all participants of the plan. More than half of the July 3, 2021 obligations are due to be paid beyond fiscal 2026.
Sysco’s expense related to its defined contribution plans was $145.8 million in fiscal 2021, $151.4 million in fiscal 2020, and $150.4 million in fiscal 2019.
Defined Benefit Plans
Sysco maintains various qualified pension plans that pay benefits to participating employees at retirement, using formulas based on a participant’s years of service and compensation. The U.S. pension plan (U.S. Retirement Plan) is frozen for all U.S.-based salaried and non-union hourly employees, as these employees are eligible for benefits under the company’s defined contribution 401(k) plan. Various defined benefit pension plans cover certain employees, primarily in the U.K., France and Sweden; however, the U.K. pension plan (U.K. Retirement Plan) is frozen to new plan participants and future accrual of benefits. The funding policy for each plan complies with the requirements of relevant governmental laws and regulations.
In addition to receiving benefits upon retirement under the company’s U.S. Retirement Plan, certain key management personnel who were participants in the MIP are entitled to receive benefits under the Supplemental Executive Retirement Plan (SERP). This plan is a nonqualified, unfunded supplementary retirement plan. This plan is frozen to all participants.
The company also provides certain health care benefits to eligible retirees and their dependents. These health care benefits represent Sysco’s unfunded other post-retirement medical plans. The plan had benefit obligations of $10.2 million as of July 3, 2021 and $10.9 million as of June 27, 2020.
Funded Status
Accumulated pension assets measured against the obligation for pension benefits represents the funded status of a given plan. The funded status of Sysco’s company-sponsored defined benefit plans is presented in the table below. The caption “U.S. Pension Benefits” in the tables below includes both the U.S. Retirement Plan and the SERP. As Sysco’s fiscal 2021 year end is July 3, 2021, the company utilized a practical expedient permitting Sysco to measure its defined benefit plan assets and obligations as of the month end closest to the fiscal year end, and has used June 30, 2021 as the measurement date of the plan assets and obligations disclosed herein.
| | | | | | | | | | | | | | | | | | | | | | | |
| | U.S. Pension Benefits | | International Pension Benefits |
| | Jul. 3, 2021 | | Jun. 27, 2020 | | Jul. 3, 2021 | | Jun. 27, 2020 |
| | (In thousands) |
| Change in benefit obligation: | | | | | | | |
| Benefit obligation at beginning of year | $ | 5,039,718 | | | $ | 4,537,648 | | | $ | 414,106 | | | $ | 406,697 | |
| Service cost | 16,472 | | | 15,532 | | | 3,288 | | | 2,800 | |
| Interest cost | 145,299 | | | 164,756 | | | 6,810 | | | 8,681 | |
| Amendments | — | | | (2,077) | | | — | | | 661 | |
| Curtailments | — | | | — | | | (1,333) | | | (4,012) | |
| | | | | | | |
| Plan Combinations | — | | | — | | | — | | | — | |
| Actuarial (gain) loss, net | (47,197) | | | 464,475 | | | (19,495) | | | 21,157 | |
| Total disbursements | (153,294) | | | (140,616) | | | (15,480) | | | (11,155) | |
| Exchange rate changes | — | | | — | | | 46,555 | | | (10,723) | |
| Benefit obligation at end of year | 5,000,998 | | | 5,039,718 | | | 434,451 | | | 414,106 | |
| Change in plan assets: | | | | | | | |
| Fair value of plan assets at beginning of year | 4,408,739 | | | 3,984,154 | | | 288,191 | | | 264,746 | |
| Actual return on plan assets | 365,251 | | | 533,676 | | | 4,250 | | | 35,594 | |
| Employer contribution | 34,067 | | | 31,525 | | | 7,892 | | | 7,141 | |
| Total disbursements | (153,294) | | | (140,616) | | | (15,480) | | | (11,155) | |
| Exchange rate changes | — | | | — | | | 34,763 | | | (8,135) | |
| Fair value of plan assets at end of year | 4,654,763 | | | 4,408,739 | | | 319,616 | | | 288,191 | |
| Funded status at end of year | $ | (346,235) | | | $ | (630,979) | | | $ | (114,835) | | | $ | (125,915) | |
As of July 3, 2021 and June 27, 2020, the SERP had benefit obligations of $470.7 million and $474.9 million, respectively. In order to meet a portion of its obligations under the SERP, Sysco has a rabbi trust that invests in Corporate-Owned Life Insurance policies on the lives of participants and interests in corporate-owned real estate assets. These assets are not included as plan assets or in the funded status amounts in the tables above and below. The life insurance policies on the lives of the participants had carrying values of $93.2 million as of July 3, 2021 and $94.0 million as of June 27, 2020. Sysco is the sole owner and beneficiary of such policies.
The amounts recognized on Sysco’s consolidated balance sheets related to its company-sponsored defined benefit plans are as follows:
| | | | | | | | | | | | | | | | | | | | | | | |
| | U.S. Pension Benefits | | International Pension Benefits |
| | Jul. 3, 2021 | | Jun. 27, 2020 | | Jul. 3, 2021 | | Jun. 27, 2020 |
| | (In thousands) |
| Noncurrent assets (Other assets) | $ | 124,453 | | | $ | — | | | $ | — | | | $ | — | |
| Current accrued benefit liability (Accrued expenses) | (31,733) | | | (31,121) | | | (1,479) | | | (1,359) | |
| Noncurrent accrued benefit liability (Other long-term liabilities) | (438,955) | | | (599,858) | | | (113,356) | | | (124,556) | |
| Net amount recognized | $ | (346,235) | | | $ | (630,979) | | | $ | (114,835) | | | $ | (125,915) | |
Accumulated other comprehensive loss (income) as of July 3, 2021 consists of the following amounts that had not, as of that date, been recognized in net benefit cost:
| | | | | | | | | | | | | | | | | |
| | U.S. Pension Benefits | | International Pension Benefits | | Total |
| | (In thousands) |
| Prior service cost | $ | 447 | | | $ | 1,130 | | | $ | 1,577 | |
| Actuarial losses (gains) | 1,438,775 | | | 16,026 | | | 1,454,801 | |
| Total | $ | 1,439,222 | | | $ | 17,156 | | | $ | 1,456,378 | |
Accumulated other comprehensive loss (income) as of June 27, 2020 consists of the following amounts that had not, as of that date, been recognized in net benefit cost:
| | | | | | | | | | | | | | | | | |
| | U.S. Pension Benefits | | International Pension Benefits | | Total |
| | (In thousands) |
| Prior service cost | $ | 1,176 | | | $ | 781 | | | $ | 1,957 | |
| Actuarial losses (gains) | 1,687,105 | | | 29,733 | | | 1,716,838 | |
| Total | $ | 1,688,281 | | | $ | 30,514 | | | $ | 1,718,795 | |
Information for plans with accumulated benefit obligation/aggregate benefit obligation in excess of fair value of plan assets is as follows: | | | | | | | | | | | | | | | | | | | | | | | |
| | U.S. Pension Benefits (1) | | International Pension Benefits |
| | Jul. 3, 2021 | | Jun. 27, 2020 | | Jul. 3, 2021 | | Jun. 27, 2020 |
| | (In thousands) |
| Accumulated benefit obligation/aggregate benefit obligation | $ | 470,511 | | | $ | 5,025,168 | | | $ | 427,028 | | | $ | 407,181 | |
| Fair value of plan assets at end of year | — | | | 4,408,739 | | | 319,616 | | | 288,191 | |
(1)Information under Pension Benefits as of July 3, 2021 and June 27, 2020 includes both the U.S. Retirement Plan and the SERP.
Components of Net Benefit Costs and Other Comprehensive Income
The components of net company-sponsored pension costs for each fiscal year are as follows:
| | | | | | | | | | | | | | | | | | | | | | | | | | | | | | | | | | | |
| | 2021 | | 2020 | | 2019 |
| | U.S. Pension Benefits | | International Pension Benefits | | U.S. Pension Benefits | | International Pension Benefits | | U.S. Pension Benefits | | International Pension Benefits |
| | (In thousands) |
| Service cost | $ | 16,472 | | | $ | 3,288 | | | $ | 15,531 | | | $ | 2,800 | | | $ | 13,977 | | | $ | 2,790 | |
| Interest cost | 145,299 | | | 6,810 | | | 164,756 | | | 8,681 | | | 172,213 | | | 10,637 | |
| Expected return on plan assets | (206,406) | | | (7,426) | | | (196,249) | | | (10,819) | | | (180,624) | | | (11,072) | |
| Amortization of prior service cost (credit) | 729 | | | (61) | | | 7,537 | | | 597 | | | 8,380 | | | (202) | |
| Amortization of actuarial loss (gain) | 42,288 | | | 250 | | | 39,483 | | | 157 | | | 35,537 | | | (98) | |
| Curtailment loss (gain) | — | | | (1,230) | | | — | | | (4,166) | | | — | | | — | |
| Settlement loss (gain) recognized | — | | | — | | | — | | | — | | | — | | | 109 | |
| Net pension (benefits) costs | $ | (1,618) | | | $ | 1,631 | | | $ | 31,058 | | | $ | (2,750) | | | $ | 49,483 | | | $ | 2,164 | |
The components of net company-sponsored pension costs other than the service cost component are reported in Other expense (income), net within the consolidated results of operations.
Other changes in plan assets and benefit obligations recognized in other comprehensive income (loss) related to company-sponsored pension plans for each fiscal year are as follows:
| | | | | | | | | | | | | | | | | | | | | | | | | | | | | | | | | | | |
| | 2021 | | 2020 | | 2019 |
| | U.S. Pension Benefits | | International Pension Benefits | | U.S. Pension Benefits | | International Pension Benefits | | U.S. Pension Benefits | | International Pension Benefits |
| | (In thousands) |
| Amortization of prior service cost (credit) | $ | 729 | | | $ | (131) | | | $ | 7,537 | | | $ | 422 | | | $ | 8,380 | | | $ | (202) | |
| Amortization of actuarial loss (gain) | 42,288 | | | 250 | | | 39,483 | | | 157 | | | 35,537 | | | 11 | |
| Prior service cost (credit) arising in current year | — | | | — | | | 2,077 | | | (661) | | | — | | | (3,050) | |
| Effect of exchange rates on amounts in AOCI | — | | | (3,254) | | | — | | | 784 | | | — | | | 1,163 | |
| Actuarial gain (loss) arising in current year | 192,041 | | | 16,493 | | | (127,048) | | | 3,640 | | | (163,588) | | | (8,090) | |
| Net pension cost (income) | $ | 235,058 | | | $ | 13,358 | | | $ | (77,951) | | | $ | 4,342 | | | $ | (119,671) | | | $ | (10,168) | |
Amounts included in accumulated other comprehensive loss (income) as of July 3, 2021 that are expected to be recognized as components of net company-sponsored benefit cost during fiscal 2022 are:
| | | | | | | | | | | | | | | | | |
| | U.S. Pension Benefits | | International Pension Benefits | | Total |
| | (In thousands) |
| Amortization of prior service cost (credit) | $ | 393 | | | $ | (57) | | | $ | 336 | |
| Amortization of actuarial losses (gains) | 34,962 | | | 216 | | | 35,178 | |
| Total | $ | 35,355 | | | $ | 159 | | | $ | 35,514 | |
Employer Contributions
The company made cash contributions to its company-sponsored pension plans of $42.0 million and $38.7 million in fiscal years 2021 and 2020, respectively. There were no contributions made to the U.S. Retirement Plan in fiscal 2021, as there were no required contributions to meet ERISA minimum funding requirements in fiscal 2021. There are no required contributions to the U.S. Retirement Plan to meet ERISA minimum funding requirements in fiscal 2022. The company’s contributions to the SERP plan are made in the amounts needed to fund current year benefit payments. The estimated aggregate fiscal 2022 contribution to fund benefit payments for the SERP plan is $31.7 million. The estimated fiscal 2022 contributions to fund benefit payments for the international retirement plans are $21.9 million.
Estimated Future Benefit Payments
Estimated future benefit payments for vested participants, based on actuarial assumptions, are as follows:
| | | | | | | | | | | |
| | U.S. Pension Benefits | | International Pension Benefits |
| | (In thousands) |
| 2022 | $ | 171,506 | | | $ | 15,578 | |
| 2023 | 181,064 | | | 15,799 | |
| 2024 | 190,670 | | | 16,946 | |
| 2025 | 200,203 | | | 18,130 | |
| 2026 | 209,991 | | | 18,003 | |
| Subsequent five years | 1,169,735 | | | 96,479 | |
Assumptions
Weighted-average assumptions used to determine benefit obligations as of year-end were:
| | | | | | | | | | | |
| | Jul. 3, 2021 | | Jun. 27, 2020 |
| Discount rate — U.S. Retirement Plan | 3.12 | % | | 2.94 | % |
| Discount rate — SERP | 2.91 | | | 2.91 | |
| Discount rate — U.K. Retirement Plan | 1.90 | | | 1.60 | |
| Rate of compensation increase — U.S. Retirement Plan | 2.56 | | | 2.56 | |
As benefit accruals under the SERP and U.K. Retirement Plan are frozen, future pay is not projected in the determination of the benefit obligation as of July 3, 2021 or June 27, 2020.
Weighted-average assumptions used to determine net company-sponsored pension costs for each fiscal year were:
| | | | | | | | | | | | | | | | | |
| | 2021 | | 2020 | | 2019 |
| Discount rate — U.S. Retirement Plan | 2.94 | % | | 3.70 | % | | 4.28 | % |
| Discount rate — SERP | 2.91 | | | 3.62 | | | 4.41 | |
| Discount rate — U.K. Retirement Plan | 1.60 | | | 2.30 | | | 2.85 | |
| | | | | |
| Expected rate of return — U.S. Retirement Plan | 4.75 | | | 5.00 | | | 5.00 | |
| Expected rate of return — U.K. Retirement Plan | 2.55 | | | 4.55 | | | 4.55 | |
| Rate of compensation increase — U.S. Retirement Plan | 2.56 | | | 2.56 | | | 2.62 | |
For guidance in determining the discount rate for U.S. defined benefit plans, Sysco calculates the implied rate of return on a hypothetical portfolio of high-quality fixed-income investments for which the timing and amount of cash outflows approximates the estimated payouts of the company-sponsored pension plans. Sysco uses an annualized corporate bond yield curve to estimate the rate at which pension benefits could effectively be settled to estimate a discount rate for the U.K. Retirement Plan. The discount rate assumption is updated annually and revised as deemed appropriate. The discount rates to be used for the calculation of fiscal 2022 net company-sponsored benefit costs for the U.S. Retirement Plan and U.K. Retirement Plan are 3.12% and 1.90%, respectively. The discount rate to be used for the calculation of fiscal 2022 net company-sponsored benefit costs for the SERP is 2.91%.
The expected long-term rate of return on plan assets assumption for the retirement plans are net return on assets assumption, representing gross return on assets less asset management expenses. Specific to the U.S. Retirement Plan, administrative expenses are also excluded from the gross return on assets. The expected return for the U.S. Retirement Plan is derived from a mathematical asset model that incorporates assumptions as to the various asset class returns, reflecting a combination of rigorous historical performance analysis and the forward-looking views of the financial markets regarding the yield on bonds, the historical returns of the major stock markets and returns on alternative investments. The expected return for the U.K. Retirement Plan is derived from a long-term swap yield time horizon adjusted for the expected return based on the plan’s current asset allocation and historical results. The rate of return assumption is reviewed annually and revised as deemed appropriate. The expected long-term rate of return to be used in the calculation of fiscal 2022 net company-sponsored benefit costs for the U.S. Retirement Plan and U.K. Retirement Plan are 4.50% and 3.30%, respectively.
Plan Assets
Investment Strategy
The company’s overall strategic investment objectives for the U.S. Retirement Plan are to preserve capital for future benefit payments and to balance risk and return commensurate with ongoing changes in the valuation of plan liabilities using an investment strategy that closely aligns the duration of the U.S. Retirement Plan’s assets with the duration of its liabilities. In order to accomplish these objectives, the company oversees the U.S. Retirement Plan’s investment objectives and policy design, decides proper plan asset class strategies and structures, monitors the performance of plan investment managers and investment funds and determines the proper investment allocation of pension plan contributions. The strategy results in an asset portfolio that more closely matches the behavior of the liability, thereby reducing the volatility of the U.S. Retirement Plan’s funded status. This structure ensures the U.S. Retirement Plan’s investments are diversified within each asset class, in addition to being diversified across asset classes with the intent to build asset class portfolios that are structured without strategic bias for or against any subcategories within each asset class. The company has also created a set of investment guidelines for the U.S. Retirement Plan’s investment managers to specify prohibited transactions, including borrowing of money except for real estate, private equity or hedge fund portfolios where leverage is a key component of the investment strategy and permitted in the investments’ governing documents, the purchase of securities on margin unless fully collateralized by cash or cash equivalents or short sales, pledging, mortgaging or hypothecating of any securities, except for loans of securities that are fully collateralized, market timing transactions and the direct purchase of the securities of Sysco or the investment manager. The purchase or sale of derivatives for speculation or leverage is also prohibited; however, investment managers are allowed to use derivative securities so long as they do not increase the risk profile or leverage of the manager’s portfolio.
The U.S. Retirement Plan’s target and actual investment allocation as of July 3, 2021 is as follows:
| | | | | | | | | | | |
| U.S. Retirement Plan |
| | Target Asset Allocation | | Actual Asset Allocation |
| Growth assets | 30 | % | | 29 | % |
| | | |
| | | |
| | | |
| | | |
| Liability hedging assets | 70 | | | 71 | |
| | | | 100 | % |
Sysco’s U.S. Retirement Plan investment strategy is implemented through a combination of balanced and specialized investment managers, passive investment funds and actively managed investment funds. Growth assets include, but are not limited to, equities, alternatives, real estate, and growth fixed income intended to generate returns in excess of the liability growth rate. The Liability Hedging assets will be comprised primarily of fixed income investments, including interest rate and credit derivatives, intended to reduce funded status volatility due to changes in interest rates and credit spreads, while generating returns consistent with the projected liability growth rate. The U.S. Retirement Plan’s portfolio includes investment funds which are selected based on each fund’s stated investment strategy to align with Sysco’s overall target mix of investments. Actual asset allocation is regularly reviewed and periodically rebalanced to the target allocation when considered appropriate.
The day-to-day management of the assets of the U.K. Retirement Plan has been delegated by the plan trustee to a fiduciary manager who decides the composition of the asset portfolio in line with the objectives of the plan’s trustee and within specific investment guidelines agreed upon with the trustee. The primary objective for the U.K. Retirement Plan is to provide sufficient assets to pay benefits as they fall due. The current objective for the U.K. Retirement Plan is to achieve a return on plan assets of 2.1% in excess of the return on the liability benchmark over a rolling five-year period. The liability benchmark is
the portfolio of gilts, which are bonds issued by the British government, that best matches the liability profile of the U.K. Retirement Plan. The investment objective includes a risk statement that targets a level of investment tracking error versus the liability benchmark to be below 10% per year. The actual tracking error targeted may fluctuate over time as the composition of the portfolio changes and the levels of risk in markets change. The U.K. Retirement Plan’s Trustee and its Fiduciary Manager seek to achieve the Plan’s investment objectives by investing in a suitably diversified mix of assets. The U.K. Retirement Plan uses derivatives such as forwards, futures, swaps and options for risk management and for the efficient implementation of the investment strategy.
The U.K. Retirement Plan’s target investment allocation and actual investment allocation for fiscal 2021 is as follows:
| | | | | | | | | | | |
| U.K. Retirement Plan |
| | Target Asset Allocation | | Actual Asset Allocation |
| Common contractual fund | 60 | % | | 50 | % |
| Liability hedging assets | 40 | | | 50 | |
| | | | 100 | % |
The U.K. Retirement Plan’s target investment allocation was revised to 45% and 55% for the common contractual fund and liability hedging assets, respectively, as of July 3, 2021 for fiscal year 2022.
The U.K. Retirement Plan’s investment strategy is implemented primarily through a common contractual investment fund and liability hedging assets both managed by the solvency manager. The pooled investment fund consists of investment types including (1) equity investments covering a range of geographies and including private equity investments, (2) credit investments including global investment grade and high yield bonds, loans and other debt and derivative securities, (3) property investments including global direct or indirect real estate holdings, and (4) macro-oriented funds that seek to generate return by going long and short in a variety of markets and operate strategies which focus on markets rather than individual stocks and often use derivatives rather than physical assets. Actual asset allocation is regularly reviewed and periodically rebalanced to the target allocation when considered appropriate.
As discussed above, the retirement plans’ investments in equities, debt instruments and alternative investments provide a range of returns and also expose the plan to investment risk. However, the investment policies put in place by the trustee and solvency manager ensure diversification of plan assets across issuers, industries and countries.
Fair Value of Plan Assets
Fair value is defined as the price that would be received to sell an asset or paid to transfer a liability in an orderly transaction between market participants at the measurement date (i.e. an exit price). See Note 5, “Fair Value Measurements,” for a description of the fair value hierarchy that prioritizes the inputs to valuation techniques used to measure fair value. The following is a description of the valuation methodologies used for assets and liabilities held by Sysco’s retirement plans measured at fair value.
Cash and cash equivalents: Valued at amortized cost, which approximates fair value due to the short-term maturities of these investments. Cash and cash equivalents is included as a Level 1 and Level 2 measurement in the table below.
Equity securities: Valued at the closing price reported on the exchange market. If a stock is not listed on a public exchange, such as an American Depository Receipt or some preferred stocks, the stock is valued using an evaluated bid price based on a compilation of observable market information. Inputs used include yields, the underlying security “best price,” adjustments for corporate actions and exchange prices of underlying and common stock of the same issuer. Equity securities valued at the closing price reported on the exchange market are classified as a Level 1 measurement in the table below.
Fixed income securities: Valued using evaluated bid prices based on a compilation of observable market information or a broker quote in a non-active market. Inputs used vary by type of security, but include spreads, yields, rate benchmarks, rate of prepayment, cash flows, rating changes and collateral performance and type. All fixed income securities are included as a Level 2 measurement in the table below.
Investment funds: Represents collective trust and funds holding debt, equity, hedge funds, private equity funds, exchange-traded real estate securities, and common contractual funds which are valued at the net asset value (NAV) provided by the manager of each fund. The NAV is based on the fair value of the underlying securities within the fund. Non-exchange traded real estate funds are valued based on the proportionate interest held by the U.S. Retirement Plan, which is based on the
valuations of the underlying real estate investments held by each fund. Each real estate investment is valued on the basis of a discounted cash flow approach. Inputs used include future rental receipts, expenses and residual values from a market participant view of the highest and best use of the real estate as rental property. The private equity funds are valued based on the proportionate interest held by the U.S. Retirement Plan, which is based on the valuations of the underlying private equity investments held by each fund. The hedge funds are valued based on the hedge funds’ proportionate share of the net assets of the underlying private investment fund as determined by the underlying private investment fund’s general partner. Indirectly held investments are valued utilizing the latest financial reports supplied by the fund’s portfolio investments. Directly held investments are valued initially based on transaction price and are adjusted utilizing available market data and investment-specific factors, such as estimates of liquidation value, prices of recent transactions in the same or similar issuer, current operating performance and future expectations of the particular investment, changes in market outlook and the financing environment.
Derivatives: Valuation method varies by type of derivative security.
•Credit default and interest rate swaps: Valued using evaluated bid prices based on a compilation of observable market information. Inputs used for credit default swaps include spread curves and trade data about the credit quality of the counterparty. Inputs used for interest rate swaps include benchmark yields, swap curves, cash flow analysis, and interdealer broker rates. Credit default and interest rate swaps are included as a Level 2 measurement in the table below.
•Foreign currency contracts: Valued using a standardized interpolation model that utilizes the quoted prices for standard-length forward foreign currency contracts and adjusts to the remaining term outstanding on the contract being valued. Foreign currency contracts are included as a Level 2 measurement in the table below.
•Futures and option contracts: Valued at the closing price reported on the exchange market for exchange-traded futures and options. Over-the-counter options are valued using pricing models that are based on observable market information. Exchange-traded futures and options are included as a Level 1 measurement in the table below; over-the-counter options are included as a Level 2 measurement.
The following table presents the fair value of the U.S. Retirement Plan’s assets by major asset category as of July 3, 2021: | | | | | | | | | | | | | | | | | | | | | | | | | | | | | |
| | Assets Measured at Fair Value as of Jul. 3, 2021 |
| | Level 1 | | Level 2 | | Level 3 | | Measured at NAV (6) | | Total |
| | (In thousands) |
| Cash and cash equivalents | $ | 48,581 | | | $ | 76,854 | | | $ | — | | | $ | — | | | $ | 125,435 | |
| Growth assets: | | | | | | | | | |
U.S. equity (1) | — | | | 95,300 | | | — | | | 414,081 | | | 509,381 | |
International equity (1) | — | | | — | | | — | | | 393,768 | | | 393,768 | |
Hedge fund of funds (2) | — | | | — | | | — | | | 278,400 | | | 278,400 | |
Real estate funds (3) | — | | | — | | | — | | | 90,738 | | | 90,738 | |
Private equity funds (4) | — | | | — | | | — | | | 99,320 | | | 99,320 | |
| Liability hedging assets: | | | | | | | | | |
| | | | | | | | | |
| Corporate bonds | — | | | 2,245,713 | | | — | | | 102,318 | | | 2,348,031 | |
| U.S. government and agency securities | — | | | 305,111 | | | — | | | 475,394 | | | 780,505 | |
Other (5) | — | | | 29,185 | | | — | | | — | | | 29,185 | |
| | | | | | | | | |
| | | | | | | | | |
| Total investments at fair value | $ | 48,581 | | | $ | 2,752,163 | | | $ | — | | | $ | 1,854,019 | | | $ | 4,654,763 | |
(1)Include direct investments in equity securities and within investment funds for which fair value is measured at NAV. There are no unfunded commitments as of July 3, 2021. The remaining investments may be redeemed once per day with advanced written notice and subject to applicable limits.
(2)There were no unfunded commitments as of July 3, 2021, and there were no redemption restrictions as of July 3, 2021. The investment may be redeemed once per quarter.
(3)For investments in the funds listed in this category, total unfunded commitment as of July 3, 2021 was $2.0 million. Approximately 3% of the investments cannot be redeemed. The estimate of the liquidation period for these funds varies
from 2021 to 2026. The remaining investments may be redeemed quarterly with advanced written notice and subject to applicable limits.
(4)Total unfunded commitments in the funds listed in this category as of July 3, 2021 were $16.1 million. The investments cannot be redeemed, but the fund will make distributions through liquidation. The estimate of the liquidation period varies for each fund from 2021 to 2031.
(5)Include foreign government and state and municipal debt securities.
(6)Include certain investments that are measured at fair value using the NAV practical expedient have not been classified in the fair value hierarchy. The fair value amounts presented in this table are intended to permit reconciliation of the fair value hierarchy to the amounts presented in the consolidated balance sheet.
The following table presents the fair value of the U.K. Retirement Plan’s assets by major asset category as of July 3, 2021: | | | | | | | | | | | | | | | | | | | | | | | | | | | | | |
| | Assets Measured at Fair Value as of Jul. 3, 2021 |
| | Level 1 | | Level 2 | | Level 3 | | Measured at NAV (3) | | Total |
| | (In thousands) |
| Liability hedging assets: | | | | | | | | | |
| Cash and cash equivalents | $ | 20,390 | | | $ | 9,269 | | | $ | — | | | $ | — | | | $ | 29,659 | |
| U.K. government securities | — | | | 129,521 | | | — | | | — | | | 129,521 | |
Derivatives, net (1) | — | | | 252 | | | — | | | — | | | 252 | |
| | | | | | | | | |
| Investment funds: | | | | | | | | | |
Common contractual fund (2) | — | | | — | | | — | | | 160,184 | | | 160,184 | |
| Total investments at fair value | $ | 20,390 | | | $ | 139,042 | | | $ | — | | | $ | 160,184 | | | $ | 319,616 | |
(1)Include interest rate swaps and zero coupon swaps. The fair value of asset positions totaled $5.7 million; the fair value of liability positions totaled $5.4 million.
(2)There were $12.9 million of unfunded commitments as of July 3, 2021, and there were no redemption restrictions as of July 3, 2021. The investment may be redeemed twice per month.
(3)Include certain investments that are measured at fair value using the NAV practical expedient have not been classified in the fair value hierarchy. The fair value amounts presented in this table are intended to permit reconciliation of the fair value hierarchy to the amounts presented in the consolidated balance sheet.
The following table presents the fair value of the U.S. Retirement Plan’s assets by major asset category as of June 27, 2020:
| | | | | | | | | | | | | | | | | | | | | | | | | | | | | |
| | Assets Measured at Fair Value as of Jun. 27, 2020 |
| | Level 1 | | Level 2 | | Level 3 | | Measured at NAV (6) | | Total |
| | (In thousands) |
| Cash and cash equivalents | $ | 34,475 | | | $ | 67,468 | | | $ | — | | | $ | — | | | $ | 101,943 | |
| Growth assets: | | | | | | | | | |
U.S. equity (1) | — | | | — | | | — | | | 575,035 | | | 575,035 | |
International equity (1) | — | | | — | | | — | | | 252,687 | | | 252,687 | |
Hedge fund of funds (2) | — | | | — | | | — | | | 233,792 | | | 233,792 | |
Real estate funds (3) | — | | | — | | | — | | | 87,730 | | | 87,730 | |
Private equity funds (4) | — | | | — | | | — | | | 74,631 | | | 74,631 | |
| | | | | | | | | |
| Liability hedging assets: | | | | | | | | | |
| Corporate bonds | — | | | 2,220,702 | | | — | | | — | | | 2,220,702 | |
| U.S. government and agency securities | — | | | 293,643 | | | — | | | 540,751 | | | 834,394 | |
Other (5) | — | | | 27,825 | | | — | | | — | | | 27,825 | |
| | | | | | | | | |
| | | | | | | | | |
| | | | | | | | | |
| Total investments at fair value | $ | 34,475 | | | $ | 2,609,638 | | | $ | — | | | $ | 1,764,626 | | | $ | 4,408,739 | |
(1)Include direct investments in equity securities and within investment funds for which fair value is measured at NAV. There are no unfunded commitments as of June 27, 2020. The remaining investments may be redeemed once per day with advanced written notice and subject to applicable limits.
(2)There were no unfunded commitments as of June 27, 2020, and there were no redemption restrictions as of June 27, 2020. The investment may be redeemed once per quarter.
(3)For investments in the funds listed in this category, total unfunded commitment as of June 27, 2020 was $2.0 million. Approximately 5% of the investments cannot be redeemed. The estimate of the liquidation period for these funds varies from 2020 to 2021. The remaining investments may be redeemed quarterly with advanced written notice and subject to applicable limits.
(4)Total unfunded commitment as of June 27, 2020 was $16.2 million. The investments cannot be redeemed, but the fund will make distributions through liquidation. The estimate of the liquidation period varies for each fund from 2020 to 2031.
(5)Include foreign government and state and municipal debt securities.
(6)Include certain investments that are measured at fair value using the NAV practical expedient have not been classified in the fair value hierarchy. The fair value amounts presented in this table are intended to permit reconciliation of the fair value hierarchy to the amounts presented in the consolidated balance sheet.
The following table presents the fair value of the U.K. Retirement Plan’s assets by major asset category as of June 27, 2020: | | | | | | | | | | | | | | | | | | | | | | | | | | | | | |
| | Assets Measured at Fair Value as of Jun. 27, 2020 |
| | Level 1 | | Level 2 | | Level 3 | | Measured at NAV (3) | | Total |
| | (In thousands) |
| Liability hedging assets: | | | | | | | | | |
| Cash and cash equivalents | $ | 2,510 | | | $ | — | | | $ | — | | | $ | — | | | $ | 2,510 | |
| U.K. government securities | — | | | 135,318 | | | — | | | — | | | 135,318 | |
Derivatives, net (1) | — | | | 123 | | | — | | | — | | | 123 | |
| | | | | | | | | |
| Investment funds: | | | | | | | | | |
Common contractual fund (2) | — | | | — | | | — | | | 150,240 | | | 150,240 | |
| Total investments at fair value | $ | 2,510 | | | $ | 135,441 | | | $ | — | | | $ | 150,240 | | | $ | 288,191 | |
(1)Include interest rate swaps and zero coupon swaps. The fair value of asset positions totaled $6.8 million; the fair value of liability positions totaled $6.6 million.
(2)There were $14.9 million of unfunded commitments as of June 27, 2020, and there were no redemption restrictions as of June 27, 2020. The investment may be redeemed once per week.
(3)Include certain investments that are measured at fair value using the NAV practical expedient have not been classified in the fair value hierarchy. The fair value amounts presented in this table are intended to permit reconciliation of the fair value hierarchy to the amounts presented in the consolidated balance sheet.
15. MULTIEMPLOYER EMPLOYEE BENEFIT PLANS
Defined Benefit Pension Plans
Sysco currently participates in eight different multiemployer defined benefit pension plans in the United States (U.S.) based on obligations arising under collective bargaining agreements covering union-represented employees. Expenses related to these plans are recognized at the time we make contributions to the plans. Sysco does not directly manage these multiemployer plans; pursuant to federal law, these plans are managed by boards of trustees, half of whom are appointed by the unions and the other half appointed by employers contributing to the plan. Approximately 12% of Sysco’s current employees in the U.S. are participants in such multiemployer plans as of July 3, 2021.
The risks of participating in these multiemployer plans are different from single-employer plans in the following respects:
•Assets contributed to the multiemployer plan by one employer may be used to provide benefits to employees of other participating employers.
•If a participating employer stops contributing to the plan, the unfunded obligations of the plan may be borne by the remaining participating employers.
•If Sysco chooses to stop participating in some of its multiemployer plans in the U.S, Sysco may be required to pay those plans an amount based on the underfunded status of the plan, referred to as a withdrawal liability.
Based upon the information available from plan administrators, management believes that all of these multiemployer plans are, to different degrees, underfunded. In addition, pension-related legislation in the U.S. requires underfunded pension plans to improve their funding ratios within prescribed intervals based on the level of their underfunding. As a result, Sysco expects its future contributions to these plans to increase. In addition, if a multiemployer defined benefit plan fails to satisfy certain minimum funding requirements, the Internal Revenue Service may impose a nondeductible excise tax of 5% on the amount of the accumulated funding deficiency for those employers contributing to the fund. However, under current law, this excise tax is unlikely to apply since multiemployer pension plans experiencing accumulated funding deficiencies are considered “critical” or “critical and declining,” and the excise tax does not apply to pension plans in critical or critical and declining status. Under current law regarding multiemployer defined benefit plans, a plan’s termination, Sysco’s voluntary withdrawal, or the mass withdrawal of all contributing employers from any underfunded multiemployer defined benefit plan would require Sysco to make withdrawal liability payments to the plan for Sysco’s allocated share of the multiemployer plan’s unfunded vested benefit liabilities.
Plan Contributions
Sysco’s contributions to multiemployer defined benefit pension plans were as follows for each fiscal year:
| | | | | | | | | | | | | | | | | |
| | 2021 | | 2020 | | 2019 |
| | (In thousands) |
| Individually significant plans | $ | 29,143 | | | $ | 31,683 | | | $ | 31,669 | |
| All other plans | 13,750 | | | 15,762 | | | 16,876 | |
| Total contributions | $ | 42,893 | | | $ | 47,445 | | | $ | 48,545 | |
Individually Significant Plans
The following information relates to multiemployer defined benefit pension plans that Sysco has determined to be individually significant to the company. As noted below, the company has determined only one plan – the Western Conference of Teamsters Pension Plan – as currently being individually significant to the company. To determine individually significant plans, the company evaluated several factors, including Sysco’s significance to the plan in terms of employees and contributions, the funded status of the plan and the size of the company’s potential withdrawal liability if it were to voluntarily withdraw from the plan.
The following table provides information about the funded status of individually significant plans:
•The “EIN-PN” column provides the Employer Identification Number (EIN) and the three-digit plan number (PN).
•The “Pension Protection Act Zone Status” columns provide the two most recent Pension Protection Act zone statuses available from each plan. The zone status is based on information that the company received from the plan’s administrators and is certified by each plan’s actuary, together with information included in the annual return/reports filed by each plan with the U.S. Department of Labor. Among other factors, plans in the red zone are generally less than 65% funded, plans in the orange zone are both less than 80% funded and have an accumulated funding deficiency or are expected to have a deficiency in any of the next six plan years, plans in the yellow zone are less than 80% funded and plans in the green zone are at least 80% funded. The Multiemployer Protection Act of 2014 created a new zone called “critical and declining.” Plans are generally considered “critical and declining” if they are projected to become insolvent within 15 years.
•The “FIP/RP Status” column indicates whether a financial improvement plan (FIP) for yellow/orange zone plans or a rehabilitation plan (RP) for red zone plans is pending or implemented in the current year or was put in place in a prior year. A status of “Pending” indicates a FIP/RP has been approved but actual period covered by the FIP/RP has not begun. A status of “Implemented” means the period covered by the FIP/RP began in the current year or is ongoing.
•The “Surcharge Imposed” column indicates whether a surcharge or supplemental contribution was paid during the most recent annual period presented for the company’s contributions to each plan in the yellow, orange or red zone. If the company’s current collective bargaining agreement (CBA) with a plan satisfies the requirements of a pending but not yet implemented FIP or RP, then the payment of surcharges or supplemental contributions is not required and “No” will be reflected in this column. If the company’s current CBA with a plan does not yet satisfy
the requirements of a pending but not yet implemented FIP or RP, then the payment of surcharges or supplemental contributions is required and “Yes” will be reflected in this column.
| | | | | | | | | | | | | | | | | | | | | | | | | | | | | | | | | | | | | | |
| | | | | Pension Protection Act
Zone Status | | | | | | |
| Pension Fund | | EIN-PN | | As of 12/31/21 | | As of 12/31/20 | | FIP/RP
Status | | Surcharge
Imposed | | Expiration
Date(s)
of CBA(s) |
| Western Conference of Teamsters Pension Plan | | 91-6145047-001 | | Green | | Green | | N/A | | N/A | | 8/12/21 to 11/30/2027 (1) |
| | | | | | | | | | | | |
| | | | | | | | | | | | |
| | | | | | | | | | | | |
(1)Sysco is party to 22 CBAs that require contributions to the Western Conference of Teamsters Pension Trust. Each agreement covers anywhere from less than 1% to 17% of the total contributions Sysco is required to pay the fund.
The following table provides information about the company’s contributions to individually significant plans:
•The “Sysco Contributions” columns provide contribution amounts based on Sysco’s fiscal years, which may not coincide with the plans’ fiscal years.
•The “Sysco 5% of Total Plan Contributions” columns indicate whether Sysco was listed on Schedule R of the plan’s most recently filed Form 5500s as providing more than five percent of the total contributions to the plan, and the plan year-end is noted.
| | | | | | | | | | | | | | | | | | | | | | | | | | | | | | | | |
| | | Sysco Contributions | | Sysco 5% of
Total Plan Contributions |
| Pension Fund | | 2021 | | 2020 | | 2019 | | 2020 | | 2019 |
| | | (In thousands) | | | | |
| Western Conference of Teamsters Pension Plan | | $ | 29,143 | | | $ | 31,683 | | | $ | 31,669 | | | No | | No |
| | | | | | | | | | |
| | | | | | | | | | |
| | | | | | | | | | |
For the plan noted in the table above, minimum contributions outside of the agreed upon contractual rate are not required.
16. EARNINGS PER SHARE
The following table sets forth the computation of basic and diluted earnings per share: | | | | | | | | | | | | | | | | | |
| | 2021 | | 2020 | | 2019 |
| | (In thousands, except for share and per share data) |
| Numerator: | | | | | |
| Net earnings | $ | 524,209 | | | $ | 215,475 | | | $ | 1,674,271 | |
| Denominator: | | | | | |
| Weighted-average basic shares outstanding | 510,696,398 | | | 510,121,071 | | | 516,890,581 | |
| Dilutive effect of share-based awards | 2,858,690 | | | 3,904,903 | | | 6,490,543 | |
| Weighted-average diluted shares outstanding | 513,555,088 | | | 514,025,974 | | | 523,381,124 | |
| Basic earnings per share | $ | 1.03 | | | $ | 0.42 | | | $ | 3.24 | |
| Diluted earnings per share | $ | 1.02 | | | $ | 0.42 | | | $ | 3.20 | |
The number of securities that were not included in the diluted earnings per share calculation because the effect would have been anti-dilutive was approximately 3,807,000, 4,833,000 and 2,338,000 for fiscal 2021, 2020 and 2019, respectively.
Dividends declared were $933.4 million, $884.1 million and $793.2 million in fiscal 2021, 2020 and 2019, respectively. Included in dividends declared for each year were dividends declared but not yet paid at year-end of approximately $240.6 million, $228.7 million and $200.0 million in fiscal 2021, 2020 and 2019, respectively.
17. OTHER COMPREHENSIVE INCOME
Comprehensive income is net earnings plus certain other items that are recorded directly to shareholders’ equity, such as foreign currency translation adjustment, changes in marketable securities, amounts related to certain hedging arrangements and amounts related to pension and other postretirement plans. Comprehensive income was $1.1 billion, $104.3 million and $1.5 billion for fiscal 2021, 2020 and 2019, respectively.
A summary of the components of other comprehensive income (loss) and the related tax effects for each of the periods presented is as follows:
| | | | | | | | | | | | | | | | | | | | | | | |
| | | | 2021 |
| | Location of Expense
(Income) Recognized
in Net Earnings | | Before Tax
Amount | | Tax | | Net of Tax
Amount |
| | | | (In thousands) |
| Pension and other postretirement benefit plans: | | | | | | | |
| Other comprehensive income before reclassification adjustments: | | | | | | | |
| Net actuarial gain, arising in the current year | | | $ | 208,640 | | | $ | 52,160 | | | $ | 156,480 | |
| | | | | | | |
| Reclassification adjustments: | | | | | | | |
| Amortization of prior service cost | Other expense, net | | 732 | | | 184 | | | 548 | |
| Amortization of actuarial loss, net | Other expense, net | | 61,042 | | | 14,347 | | | 46,695 | |
| Total reclassification adjustments | | 61,774 | | | 14,531 | | | 47,243 | |
| Foreign currency translation: | | | | | | | |
| Foreign currency translation adjustment | N/A | | 362,292 | | | — | | | 362,292 | |
| Marketable securities: | | | | | | | |
Change in marketable securities (1) | N/A | | (3,392) | | | (712) | | | (2,680) | |
| Hedging instruments: | | | | | | | |
| Other comprehensive income (loss) before reclassification adjustments: | | | | | | | |
| Change in cash flow hedges | Operating expenses (2) | | 19,066 | | | 4,941 | | | 14,125 | |
Change in net investment hedges (3) | N/A | | (32,206) | | | (8,051) | | | (24,155) | |
| Total other comprehensive income before reclassification adjustments | | | (13,140) | | | (3,110) | | | (10,030) | |
| Reclassification adjustments: | | | | | | | |
| Amortization of cash flow hedges | Interest expense | | 11,751 | | | 2,939 | | | 8,812 | |
| Total other comprehensive income | | | $ | 627,925 | | | $ | 65,808 | | | $ | 562,117 | |
(1)Realized gains or losses on marketable securities are presented within Other (income) expense, net in the Consolidated Results of Operations; however, there were no significant gains or losses realized in fiscal 2021.
(2)Amount partially impacts operating expense for fuel swaps accounted for as cash flow hedges.
(3)Change in net investment hedges includes the termination of some net investment hedges, as described in Note 10, “Derivative Financial Instruments.”
| | | | | | | | | | | | | | | | | | | | | | | |
| | | | 2020 |
| | Location of Expense
(Income) Recognized
in Net Earnings | | Before Tax
Amount | | Tax | | Net of Tax
Amount |
| | | | (In thousands) |
| Pension and other postretirement benefit plans: | | | | | | | |
| Other comprehensive income before reclassification adjustments: | | | | | | | |
| | | | | | | |
| Net actuarial gain (loss), arising in the current year | | | $ | (125,214) | | | $ | (32,471) | | | $ | (92,743) | |
| | | | | | |
| Reclassification adjustments: | | | | | | | |
| Amortization of prior service cost | Other expense, net | | 7,620 | | | 1,908 | | | 5,712 | |
| Amortization of actuarial loss, net | Other expense, net | | 49,284 | | | 10,350 | | | 38,934 | |
| Total reclassification adjustments | | 56,904 | | | 12,258 | | | 44,646 | |
| Foreign currency translation: | | | | | | | |
| | | | | | | |
| Foreign currency translation adjustment | N/A | | (112,215) | | | — | | | (112,215) | |
| Marketable Securities: | | | | | | | |
Change in marketable securities (1) | N/A | | 5,403 | | | 1,135 | | | 4,268 | |
| Hedging instruments: | | | | | | | |
| Other comprehensive income (loss) before reclassification adjustments: | | | | | | | |
| Change in cash flow hedges | Operating expenses (2) | | (9,831) | | | (2,574) | | | (7,257) | |
Change in net investment hedges (3) | N/A | | 58,756 | | | 15,227 | | | 43,529 | |
| Total other comprehensive income before reclassification adjustments | | | 48,925 | | | 12,653 | | | 36,272 | |
| Reclassification adjustments: | | | | | | | |
| Amortization of cash flow hedges | Interest expense | | 11,496 | | | 2,876 | | | 8,620 | |
| Total other comprehensive loss | | $ | (114,701) | | | $ | (3,549) | | | $ | (111,152) | |
(1)Realized gains or losses on marketable securities are presented within Other (income) expense, net in the Consolidated Results of Operations; however, there were no significant gains or losses realized in fiscal 2020.
(2)Amount partially impacts operating expense for fuel swaps accounted for as cash flow hedges.
(3)Change in net investment hedges includes the termination of some net investment hedges, as described in Note 10, “Derivative Financial Instruments.”
| | | | | | | | | | | | | | | | | | | | | | | |
| | | 2019 |
| Location of Expense
(Income) Recognized
in Net Earnings | | Before Tax
Amount | | Tax | | Net of Tax
Amount |
| | | (In thousands) |
| Pension and other postretirement benefit plans: | | | | | | | |
| Other comprehensive income before reclassification adjustments: | | | | | | | |
| | | | | | | |
| Net actuarial gain (loss), arising in the current year | | | $ | (200,144) | | | $ | (45,070) | | | $ | (155,074) | |
| | | | | | |
| Reclassification adjustments: | | | | | | | |
| Amortization of prior service cost | Other expense, net | | 8,532 | | | 2,132 | | | 6,400 | |
| Amortization of actuarial loss, net | Other expense, net | | 34,824 | | | 8,708 | | | 26,116 | |
| Total reclassification adjustments | | 43,356 | | | 10,840 | | | 32,516 | |
| | | | | | | |
| | | | | | | |
| | | | | | | |
| | | | | | |
| Foreign currency translation: | | | | | | | |
| | | | | | | |
| Foreign currency translation adjustment | N/A | | (119,126) | | | — | | | (119,126) | |
| Marketable securities: | | | | | | | |
Change in marketable securities | N/A | | 3,579 | | | 752 | | | 2,827 | |
| Hedging instruments: | | | | | | | |
| Other comprehensive income (loss) before reclassification adjustments: | | | | | | | |
| Change in cash flow hedges | Operating expenses (1) | | (5,394) | | | (1,332) | | | (4,062) | |
| Change in net investment hedges | N/A | | 58,138 | | | 14,299 | | | 43,839 | |
| Total other comprehensive income before reclassification adjustments | | | 52,744 | | | 12,967 | | | 39,777 | |
| Reclassification adjustments: | | | | | | | |
| Amortization of cash flow hedges | Interest expense | | 11,492 | | | 2,872 | | | 8,620 | |
| Total other comprehensive loss | | $ | (208,099) | | | $ | (17,639) | | | $ | (190,460) | |
(1)Amount partially impacts operating expense for fuel swaps accounted for as cash flow hedges.
The following tables provide a summary of the changes in accumulated other comprehensive (loss) income (AOCI) for the periods presented:
| | | | | | | | | | | | | | | | | | | | | | | | | | | | | |
| | Pension and Other Postretirement Benefit Plans,
net of tax | | Foreign Currency Translation | | Hedging, net of tax | | Marketable Securities | | Total |
| | (In thousands) |
| Balance as of Jun. 30,2018 | $ | (1,095,059) | | | $ | (171,043) | | | $ | (143,167) | | | $ | — | | | $ | (1,409,269) | |
Other comprehensive income before
reclassification adjustments | (155,074) | | | (119,126) | | | 39,777 | | | — | | | (234,423) | |
Amounts reclassified from accumulated
other comprehensive loss | 32,516 | | | — | | | 8,620 | | | — | | | 41,136 | |
Amounts reclassified to retained earnings (1) | — | | | — | | | — | | | 2,827 | | | 2,827 | |
| Balance as of Jun. 29, 2019 | (1,217,617) | | | (290,169) | | | (94,770) | | | 2,827 | | | (1,599,729) | |
Other comprehensive income before
reclassification adjustments | (92,743) | | | (112,215) | | | 36,272 | | | — | | | (168,686) | |
Amounts reclassified from accumulated
other comprehensive loss | 44,646 | | | — | | | 8,620 | | | — | | | 53,266 | |
| Change in marketable securities | — | | | — | | | — | | | 4,268 | | | 4,268 | |
| Balance as of Jun. 27, 2020 | (1,265,714) | | | (402,384) | | | (49,878) | | | 7,095 | | | (1,710,881) | |
Other comprehensive income before
reclassification adjustments | 156,480 | | | 362,292 | | | (10,030) | | | — | | | 508,742 | |
Amounts reclassified from accumulated
other comprehensive loss | 47,243 | | | — | | | 8,812 | | | — | | | 56,055 | |
| | | | | | | | | |
| Change in marketable securities | — | | | — | | | — | | | (2,680) | | | (2,680) | |
| Balance as of Jul. 3, 2021 | $ | (1,061,991) | | | $ | (40,092) | | | $ | (51,096) | | | $ | 4,415 | | | $ | (1,148,764) | |
(1)Deferred taxes stranded in AOCI as a result of the Tax Act were reclassified to retained earnings as a result of early adopting Accounting Standards Update 2018-02.
18. SHARE-BASED COMPENSATION
Sysco provides compensation benefits to employees under several share-based payment arrangements, including various long-term employee stock incentive plans and the 2015 Employee Stock Purchase Plan (ESPP).
Stock Incentive Plans
In November 2018, Sysco’s Omnibus Incentive Plan (2018 Plan) was adopted and reserved up to 51,500,000 shares of Sysco common stock for share-based awards to employees, non-employee directors and key advisors. Of the 51,500,000 authorized shares, the full 51,500,000 shares may be issued as options or stock appreciation rights and up to 17,500,000 shares may be issued as restricted stock, restricted stock units or other types of stock-based awards. To date, Sysco has issued options, restricted stock units and performance share units under the 2018 Plan. Vesting requirements for awards under the 2018 Plan vary by individual grant and may include either time-based vesting or time-based vesting subject to acceleration based on performance criteria for fiscal periods of at least one year. The contractual life of all options granted under the 2018 Plan are and will be no greater than ten years. As of July 3, 2021, there were 43,763,194 remaining shares authorized and available for grant in total under the 2018 Plan, of which the full 43,763,194 shares may be issued as options or stock appreciation rights, or as a combination of up to 14,227,255 shares that may be issued as restricted stock, restricted stock units or other types of stock-based awards, with the remainder available for issuance as options or stock appreciation rights.
Sysco has also granted employee options under several previous employee stock option plans for which previously granted options remain outstanding as of July 3, 2021. No new options will be issued under any of the prior plans, as future grants to employees will be made through the 2018 Plan or subsequently adopted plans. Awards under these plans are subject to time-based vesting with vesting periods that vary by individual grant. The contractual life of all options granted under these plans is ten years. Sysco’s policy is to utilize treasury stock for issuing shares upon share option exercise or share unit conversion.
Performance Share Units
During fiscal 2021 and 2020, 936,392 and 680,230 performance share units (PSUs), respectively, were granted to employees. Based on the jurisdiction in which the employee resides, some of these PSUs were granted with forfeitable dividend equivalents. The fair value of each PSU award granted with a dividend equivalent is based on the company’s stock price as of the date of grant. For PSUs granted without dividend equivalents, the fair value was reduced by the present value of expected dividends during the vesting period. The weighted average grant-date fair value per performance share unit granted during fiscal 2021 and 2020 was $61.33 and $73.37, respectively. The PSUs will convert into shares of Sysco common stock at the end of the two-year performance period based on actual performance targets achieved, as well as the market-based return of Sysco’s common stock relative to that of the S&P 500 index companies. The market-based return is applicable to the awards granted in fiscal 2021 only.
Stock Options
Sysco’s option awards are subject to graded vesting over a requisite service period with compensation cost recognized on a straight-line basis over the requisite service period over the duration of the award.
In addition, certain of Sysco’s options provide that the options continue to vest as if the optionee continued as an employee or director if the optionee meets certain age and years of service thresholds upon retirement. In these cases, Sysco will recognize compensation cost for such awards over the period from the grant date to the date the employee or director first becomes eligible to retire with the options continuing to vest after retirement.
The fair value of each option award is estimated as of the date of grant using a Black-Scholes option pricing model. Expected dividend yield is estimated based on the historical pattern of dividends and the average stock price for the year preceding the option grant. Expected volatility is based on historical volatility of Sysco’s stock, implied volatilities from traded options on Sysco’s stock and other factors. The risk-free rate for the expected term of the option is based on the United States Treasury yield curve in effect at the time of grant. Sysco utilizes historical data to estimate option exercise and employee termination behavior within the valuation model; separate groups of employees that have similar historical exercise behavior are considered separately in determining the expected life of awards for valuation purposes.
The weighted average assumptions discussed above are noted in the table below for relevant periods as follows:
| | | | | | | | | | | | | | | | | |
| | 2021 | | 2020 | | 2019 |
| Dividend yield | 2.7 | % | | 2.4 | % | | 2.5 | % |
| Expected volatility | 32.1 | % | | 18.3 | % | | 16.9 | % |
| Risk-free interest rate | 0.5 | % | | 1.5 | % | | 2.8 | % |
| Expected Life | 7.0 years | | 7.0 years | | 7.0 years |
The following summary presents information regarding outstanding options as of July 3, 2021 and changes during the fiscal year then ended with regard to options under all stock incentive plans:
| | | | | | | | | | | | | | | | | | | | | | | |
| | Shares Under Option | | Weighted Average Exercise Price Per Share | | Weighted Average Remaining Contractual Term (in years) | | Aggregate Intrinsic Value
(in thousands) |
| Outstanding as of June 27, 2020 | 11,948,204 | | | $ | 57.12 | | | | | |
| Granted | 1,975,413 | | | 59.05 | | | | | |
| Exercised | 2,350,245 | | | 47.52 | | | | | |
| Forfeited | 524,207 | | | 67.84 | | | | | |
| Expired | — | | | — | | | | | |
| Outstanding as of July 3, 2021 | 11,049,165 | | | $ | 59.00 | | | 6.61 | | $ | 194,693 | |
| Expected to vest as of July 3, 2021 | 3,974,102 | | | $ | 67.10 | | | 8.51 | | $ | 37,838 | |
| Exercisable as of July 3, 2021 | 7,003,540 | | | $ | 54.35 | | | 5.50 | | $ | 155,932 | |
The total number of employee options granted was 1,975,413, 3,286,943 and 2,609,755 in fiscal years 2021, 2020 and 2019, respectively.
During fiscal 2021, 706,229 and 1,269,184 options were granted to 13 executive officers and 117 other key employees, respectively. During fiscal 2020, 1,554,566 and 1,732,377 options were granted to 12 executive officers and 174 other key employees, respectively. During fiscal 2019, 657,341 and 1,952,414 options were granted to 9 executive officers and 179 other key employees, respectively.
The weighted average grant date fair value of options granted in fiscal 2021, 2020 and 2019 was $13.72, $10.57 and $11.70, respectively. The total intrinsic value of options exercised during fiscal 2021, 2020 and 2019 was $6.7 million, $11.6 million and $14.0 million, respectively.
Restricted Stock Units
During fiscal 2021, 2020 and 2019, 975,886, 704,732 and 617,685 restricted stock units, respectively, were granted to employees, the majority of which will vest ratably over a three-year period. Some of these restricted stock units were granted with dividend equivalents. The fair value of each restricted stock unit award granted with a dividend equivalent is based on the company’s stock price as of the date of grant. For restricted stock unit awards granted without dividend equivalents, the fair value was reduced by the present value of expected dividends as of the date of grant date during the vesting period. The weighted average grant date fair value per share of restricted stock units granted during fiscal 2021, 2020 and 2019 was $66.55, $71.01 and $63.91, respectively. The total fair value of restricted stock units vested during fiscal 2021, 2020 and 2019 was $34.8 million, $30.4 million and $35.3 million, respectively. The total intrinsic value of options exercised during fiscal 2021, 2020 and 2019 was $42.6 million, $35.7 million and $49.8 million, respectively.
Non-Employee Director Awards
During fiscal 2021, 2020 and 2019, 28,419, 27,431 and 30,870 restricted equity awards, respectively, were granted to non-employee directors (NEDs), which will vest over a one-year period. NEDs may elect to receive these awards in restricted stock shares that will vest at the end of the award stated vesting period or as deferred units that convert into shares of Sysco common stock on a date subsequent to the award stated vesting date selected by the NED. The fair value of the restricted awards is based on the company’s stock price as of the date of grant. The weighted average grant date fair value of the shares granted during fiscal 2021, 2020 and 2019 was $71.99, $74.17 and $66.22, respectively. The total fair value of restricted stock shares vested and deferred units distributed during fiscal 2021, 2020 and 2019 was $2.0 million for all periods. Restricted stock shares are valued on their vesting date. Vested deferred units are valued on their subsequent conversion and distribution date.
NEDs may elect to receive up to 100% of their annual directors’ fees in Sysco common stock on either an annual or deferred basis. As a result of such elections, a total of 5,887, 4,187 and 10,672 shares with a weighted-average grant date fair value of $57.19, $75.46 and $67.45 per share were issued in fiscal 2021, 2020 and 2019, respectively, in the form of fully vested common stock or deferred units. The total fair value of common stock issued as a result of election shares and deferred units distributed during fiscal 2021, 2020 and 2019 was $0.3 million, $0.2 million and $0.7 million, respectively. Common stock shares are valued on their vesting date. Vested deferred units are valued on their subsequent conversion and distribution date.
As of July 3, 2021, there were 95,053 fully vested deferred units outstanding that will convert into shares of Sysco common stock upon dates selected by the respective NED.
Summary of Equity Instruments Other Than Stock Options
The following summary presents information regarding outstanding non-vested awards as of July 3, 2021 and changes during the fiscal year then ended with regard to these awards under the stock incentive plans. Award types represented include restricted stock units granted to employees, restricted awards granted to non-employee directors and PSUs.
| | | | | | | | | | | |
| | Shares | | Weighted Average Grant Date Fair Value Per Share |
| Non-vested as of June 27, 2020 | 2,842,629 | | | $ | 66.31 | |
| Granted | 1,445,290 | | | 65.06 | |
| Vested | (638,675) | | | 63.11 | |
| Forfeited | (597,739) | | | 69.72 | |
| Non-vested as of July 3, 2021 | 3,051,505 | | | $ | 65.72 | |
2015 Employee Stock Purchase Plan
The Sysco ESPP permits employees to invest in Sysco common stock by means of periodic payroll deductions at a discount of 15% from the closing price on the last business day of each calendar quarter. The total number of shares that may be sold pursuant to the ESPP may not exceed 79,000,000 shares, of which 4,120,143 remained available as of July 3, 2021. In order to enhance the company’s liquidity position in response to the COVID-19 pandemic, Sysco temporarily reduced the discount applied to the common stock to 5% commencing at the beginning fiscal 2021. For fiscal 2022, the 15% discount was restored.
During fiscal 2021, 1,029,113 shares of Sysco common stock were purchased by the participants, as compared to 1,089,296 shares purchased in fiscal 2020 and 986,631 shares purchased in fiscal 2019. The weighted average fair value of employee stock purchase rights issued pursuant to the ESPP was $4.84, $10.03 and $10.17 per share during fiscal 2021, 2020 and 2019, respectively. The fair value of the stock purchase rights was calculated as the difference between the stock price at date of issuance and the employee purchase price.
All Share-Based Payment Arrangements
The total share-based compensation cost included in operating expenses in the consolidated results of operations was $95.8 million, $42.2 million and $104.9 million for fiscal 2021, 2020 and 2019, respectively. The company’s expense related to its PSUs increased, as the performance metrics are trending above target for awards not yet paid. The total income tax benefit for share-based compensation arrangements was $17.8 million, $7.0 million and $21.7 million for fiscal 2021, 2020 and 2019, respectively.
As of July 3, 2021, there was $124.4 million of total unrecognized share-based compensation cost, which is expected to be recognized over a weighted-average period of 1.7 years.
Cash received from option exercises and ESPP participation was $130.4 million, $227.6 million and $253.1 million during fiscal 2021, 2020 and 2019, respectively. The actual tax benefit realized for the tax deductions from option exercises totaled $11.0 million, $25.4 million and $32.4 million during fiscal 2021, 2020 and 2019, respectively.
19. INCOME TAXES
Income Tax Provisions
For financial reporting purposes, earnings (loss) before income taxes consists of the following:
| | | | | | | | | | | | | | | | | |
| | 2021 | | 2020 | | 2019 |
| | (In thousands) |
| U.S. | $ | 858,179 | | | $ | 742,332 | | | $ | 1,910,549 | |
| Foreign | (273,451) | | | (448,948) | | | 95,287 | |
| Total | $ | 584,728 | | | $ | 293,384 | | | $ | 2,005,836 | |
The income tax provision for each fiscal year consists of the following:
| | | | | | | | | | | | | | | | | |
| | 2021 | | 2020 | | 2019 |
| | (In thousands) |
| U.S. federal income taxes | $ | 158,762 | | | $ | 128,576 | | | $ | 262,940 | |
| State and local income taxes | 17,808 | | | 8,529 | | | 73,835 | |
| Foreign income taxes | (116,051) | | | (59,196) | | | (5,210) | |
| Total | $ | 60,519 | | | $ | 77,909 | | | $ | 331,565 | |
The current and deferred components of the income tax provisions for each fiscal year are as follows:
| | | | | | | | | | | | | | | | | |
| | 2021 | | 2020 | | 2019 |
| | (In thousands) |
| Current | $ | 218,383 | | | $ | 269,226 | | | $ | 458,284 | |
| Deferred | (157,864) | | | (191,317) | | | (126,719) | |
| Total | $ | 60,519 | | | $ | 77,909 | | | $ | 331,565 | |
The deferred tax provisions result from the effects of net changes during the year in deferred tax assets and liabilities arising from temporary differences between the carrying amounts of assets and liabilities for financial reporting purposes and the amounts used for income tax purposes.
Deferred Tax Assets and Liabilities
Significant components of Sysco’s deferred tax assets and liabilities are as follows:
| | | | | | | | | | | |
| | Jul. 3, 2021 | | Jun. 27, 2020 |
| | (In thousands) |
| Deferred tax assets: | | | |
| Net operating loss carryforwards | $ | 613,325 | | | $ | 379,620 | |
| Pension | 111,084 | | | 184,616 | |
| Receivables | 53,688 | | | 99,540 | |
| Deferred compensation | 28,978 | | | 31,603 | |
| Share-based compensation | 26,498 | | | 21,296 | |
| Inventory | 17,983 | | | 17,069 | |
| Self-insured liabilities | 7,521 | | | 3,409 | |
| | | |
| Other | 107,907 | | | 41,820 | |
| Deferred tax assets before valuation allowances | 966,984 | | | 778,973 | |
| Valuation allowances | (226,626) | | | (137,862) | |
| Total deferred tax assets | 740,358 | | | 641,111 | |
| Deferred tax liabilities: | | | |
| Goodwill and intangible assets | 351,758 | | | 329,940 | |
| Excess tax depreciation and basis differences of assets | 148,418 | | | 169,920 | |
| | | |
| Other | 34,725 | | | 33,737 | |
| Total deferred tax liabilities | 534,901 | | | 533,597 | |
| Total net deferred tax assets | $ | 205,457 | | | $ | 107,514 | |
The company’s deferred tax asset for net operating loss carryforwards as of July 3, 2021 and June 27, 2020 consisted of state and foreign net operating tax loss carryforwards. The state net operating loss carryforwards outstanding as of July 3, 2021 expire in fiscal years 2022 through 2041, with some losses having unlimited carryforward periods. The foreign net operating loss carryforward periods vary by jurisdiction, from 17 years to unlimited.
The company assesses the recoverability of its deferred tax assets each period by considering whether it is more likely than not that all or a portion of the deferred tax assets will not be realized. The company considers all available evidence (both
positive and negative) in determining whether a valuation allowance is required. As a result of the company’s analysis, it was concluded that, as of July 3, 2021, a valuation allowance of $226.6 million should be established against the portion of the deferred tax asset attributable to certain foreign and United States (U.S.) state losses. The company will continue to monitor facts and circumstances in the reassessment of the likelihood that net operating loss carryforwards will be realized.
Effective Tax Rates
Reconciliations of the statutory federal income tax rate to the effective income tax rates for each fiscal year are as follows:
| | | | | | | | | | | | | | | | | |
| | 2021 | | 2020 | | 2019 |
| U.S. statutory federal income tax rate | 21.00 | % | | 21.00 | % | | 21.00 | % |
| State and local income taxes, net of any applicable federal income tax benefit | 2.67 | | | 5.69 | | | 3.35 | |
| Foreign income taxes | (9.99) | | | (2.46) | | | (1.42) | |
| Uncertain tax positions | (0.38) | | | (1.44) | | | (0.31) | |
| Tax benefit of equity-based compensation | (1.07) | | | (9.77) | | | (2.07) | |
| Nondeductible impairment charges | — | | | 17.65 | | | — | |
| | | | | |
| | | | | |
| Impact of U.S. Tax Reform | — | | | — | | | (4.64) | |
| Other | (1.88) | | | (4.12) | | | 0.62 | |
| Effective income tax rate | 10.35 | % | | 26.55 | % | | 16.53 | % |
The effective tax rate of 10.35% for fiscal 2021 was impacted by (1) the tax benefit resulting from the changes in tax law in the U.K. of $23.2 million, (2) the favorable impact of excess tax benefits of equity-based compensation that totaled $15.0 million, and (3) the $7.6 million tax benefit attributable to the sale of the stock of Cake Corporation.
The effective tax rate of 26.55% for fiscal 2020 was impacted by the tax benefits attributable to equity compensation exercises. Our foreign operations are subject to their earnings being taxed at rates different than our domestic tax rate, as well as credits, local permanent differences and other minimum taxes, which resulted in a net decrease in the effective tax rate. Nondeductible asset impairment charges have an unfavorable impact. Included within “Other” is the effect of certain non-deductible expenses in the U.S. jurisdiction as well as the impact of U.S. tax credits, return to accrual adjustments and U.S. taxes on foreign earnings.
The effective tax rate of 16.53% for fiscal 2019 was favorably impacted by the reduction of the statutory rate in the U.S. and certain foreign jurisdictions, the excess tax benefits attributable to equity compensation exercises and the favorable impact of $95.1 million of foreign tax credits included within Impacts of U.S. Tax Reform. These credits fully offset our transition tax liability, as well as a reduction of the statutory tax rate in the U.S. and certain foreign jurisdictions. Foreign earnings taxed at rates different than our domestic tax rate had the impact of decreasing the effective tax rate.
Uncertain Tax Positions
A reconciliation of the beginning and ending amount of gross unrecognized tax benefits, excluding interest and penalties, is as follows:
| | | | | | | | | | | |
| | 2021 | | 2020 |
| | (In thousands) |
| Unrecognized tax benefits at beginning of year | $ | 23,135 | | | $ | 26,109 | |
| | | |
| Reductions for tax positions related to prior years | (2,735) | | | (2,974) | |
| | | |
| | | |
| | | |
| | | |
| Unrecognized tax benefits at end of year | $ | 20,400 | | | $ | 23,135 | |
As of July 3, 2021, the gross amount of liability for accrued interest and penalties related to unrecognized tax benefits was $3.0 million. As of June 27, 2020, the gross amount of liability for accrued interest and penalties related to unrecognized tax benefits was $4.1 million. The expense recorded for interest and penalties related to unrecognized tax benefits was not material in any year presented. It is reasonably possible that the amount of the unrecognized tax benefit with respect to certain
of the company’s unrecognized tax positions will increase or decrease in the next twelve months. At this time, an estimate of the range of the reasonably possible change cannot be made.
If Sysco were to recognize all unrecognized tax benefits recorded as of July 3, 2021, approximately $20.3 million of the $20.4 million reserve would reduce the effective tax rate. If Sysco were to recognize all unrecognized tax benefits recorded as of June 27, 2020, approximately $22.4 million of the $23.1 million reserve would reduce the effective tax rate. It is reasonably possible that the amount of the unrecognized tax benefits with respect to certain of the company’s unrecognized tax positions will increase or decrease in the next twelve months either because Sysco’s positions are sustained on audit or because the company agrees to their disallowance. Items that may cause changes to unrecognized tax benefits primarily include the consideration of various filing requirements in various jurisdictions and the allocation of income and expense between tax jurisdictions. In addition, the amount of unrecognized tax benefits recognized within the next twelve months may decrease due to the expiration of the statute of limitations for certain years in various jurisdictions; however, it is possible that a jurisdiction may open an audit on one of these years prior to the statute of limitations expiring. Sysco anticipates an immaterial decrease to the reserve within twelve months as a result of lapse of statutes.
Sysco’s federal tax returns for 2017 and subsequent tax years have statutes of limitations that remain open for audit. As of July 3, 2021, Sysco’s tax returns in the majority of the state and local and material foreign jurisdictions are no longer subject to audit for the years before 2014.
Other
Sysco intends to indefinitely reinvest income of its foreign operations, and, as a result, no material accruals have been made with respect to the tax effects of unremitted earnings, including impacts of outside basis differences and withholding taxes. As a result of the U.S. Tax Cuts and Jobs Act, unremitted earnings prior to the effective date of the act have been subject to U.S. income tax. Any residual tax effects, including foreign withholding taxes, are immaterial to the financial statements.
The determination of the company’s provision for income taxes requires judgment, the use of estimates and the interpretation and application of complex tax laws. The company’s provision for income taxes reflects income earned and taxed in the various U.S. federal and state, as well as foreign jurisdictions. Tax law changes, increases or decreases in permanent book versus tax basis differences, accruals or adjustments of accruals for unrecognized tax benefits or valuation allowances, and the company’s change in the mix of earnings from these taxing jurisdictions all affect the overall effective tax rate.
20. COMMITMENTS AND CONTINGENCIES
Legal Proceedings
Sysco is engaged in various legal proceedings that have arisen but have not been fully adjudicated. The likelihood of loss for these legal proceedings, based on definitions within contingency accounting literature, ranges from remote to reasonably possible to probable. When probable and reasonably estimable, the losses have been accrued. Although the final results of legal proceedings cannot be predicted with certainty, based on estimates of the range of potential losses associated with these matters, management does not believe the ultimate resolution of these proceedings, either individually or in the aggregate, will have a material adverse effect upon the consolidated financial position or results of operations of the company.
The company is pursuing claims against a variety of vendors from which the company purchased products. These matters are at different stages of the litigation process. Amounts, if any, realized from the defendants would represent gain contingencies. We account for gain contingencies in accordance with the provisions of ASC 450, Contingencies, and therefore, we do not recognize income until realized.
To mitigate the risk of incurring significant legal fees on these claims without any ultimate gain, in calendar 2019 and 2020, the company entered into separate agreements with a third party whereby the company secured a minimum amount of cash proceeds from the third party in exchange for assigning to the third party the rights to a portion of the future litigation proceeds. In the meantime, the company must continue to pursue the specific vendor litigation, as identified in the agreement with the third party.
As part of these arrangements, cash proceeds received from the third party are included in “Other long-term liabilities.” The portion of litigation proceeds in excess of the minimum that may be payable to the third party under each agreement represents a financial instrument that is measured at fair value each reporting period in accordance with the provisions of ASC 820, Fair Value Measurements, with changes recorded in the consolidated results of operations.
Other Commitments
Sysco has committed to aggregate product purchases for resale in order to benefit from a centralized approach to purchasing. A majority of these agreements expire within one year; however, certain agreements have terms through fiscal 2024. These agreements commit the company to a minimum volume at various pricing terms, including fixed pricing, variable pricing or a combination thereof. Minimum amounts committed to as of July 3, 2021 totaled approximately $5.1 billion. Minimum amounts committed to by year are as follows:
| | | | | |
| | Amount |
| | (In thousands) |
| 2022 | $ | 3,473,514 | |
| 2023 | 1,317,585 | |
| 2024 | 358,855 | |
| 2025 | — | |
| 2026 | — | |
Sysco has contracts with various third-party service providers to receive information technology services. The services have been committed for periods up to fiscal 2026 and may be extended. As of July 3, 2021, the total remaining cost of the services over that period is expected to be approximately $279.7 million. A portion of this committed amount may be reduced by Sysco utilizing less than estimated resources and can be increased by Sysco utilizing more than estimated resources. Certain agreements allow adjustments for inflation. Sysco may also cancel a portion or all of the services provided subject to termination fees that decrease over time. If Sysco were to terminate all of the services in fiscal 2022, the estimated termination fees incurred in fiscal 2022 would be approximately $38.3 million.
21. BUSINESS SEGMENT INFORMATION
The company has aggregated certain of its operating segments into three reportable segments. “Other” financial information is attributable to the company’s other operating segments that do not meet the quantitative disclosure thresholds.
•U.S. Foodservice Operations – primarily includes U.S. Broadline operations, which distribute a full line of food products, including custom-cut meat, seafood, specialty produce, specialty imports and a wide variety of non-food products;
•International Foodservice Operations – includes operations in the Americas (primarily outside of the United States (U.S.)) and Europe, which distribute a full line of food products and a wide variety of non-food products. The Americas primarily consists of operations in Canada, Bahamas, Mexico, Costa Rica and Panama, as well as our operations that distribute to international customers. Our European operations primarily consist of operations in the United Kingdom (U.K.), France, Ireland and Sweden;
•SYGMA – our U.S. customized distribution operations serving quick-service chain restaurant customer locations; and
•Other – primarily our hotel supply operations, Guest Worldwide. Sysco sold its interests in Cake Corporation in the first quarter of fiscal 2021.
The accounting policies for the segments are the same as those disclosed by Sysco for its consolidated financial statements. Corporate expenses generally include all expenses of the corporate and Sysco’s shared service operations. These also include all U.S. share-based compensation costs.
The following tables set forth certain financial information for Sysco’s business segments.
| | | | | | | | | | | | | | | | | |
| Fiscal Year |
| | 2021 | | 2020 | | 2019 |
| Sales: | (In thousands) |
| U.S. Foodservice Operations | $ | 35,724,843 | | | $ | 36,774,146 | | | $ | 41,288,188 | |
| International Foodservice Operations | 8,350,638 | | | 9,672,190 | | | 11,493,040 | |
| SYGMA | 6,498,601 | | | 5,555,926 | | | 6,244,328 | |
| Other | 723,761 | | | 891,048 | | | 1,088,366 | |
| Total | $ | 51,297,843 | | | $ | 52,893,310 | | | $ | 60,113,922 | |
| | | | | |
| Fiscal Year |
| 2021 | | 2020 | | 2019 |
| Operating income (loss): | (In thousands) |
| U.S. Foodservice Operations | $ | 2,456,564 | | | $ | 2,003,159 | | | $ | 2,991,794 | |
| International Foodservice Operations | (232,403) | | | (371,407) | | | 125,443 | |
| SYGMA | 52,654 | | | 36,880 | | | 27,780 | |
| Other | (396) | | | (21,361) | | | 35,848 | |
| Total segments | 2,276,419 | | | 1,647,271 | | | 3,180,865 | |
| Corporate | (839,177) | | | (897,766) | | | (850,715) | |
| Total operating income | 1,437,242 | | | 749,505 | | | 2,330,150 | |
| Interest expense | 880,137 | | | 408,220 | | | 360,423 | |
| Other (income) expense, net | (27,623) | | | 47,901 | | | (36,109) | |
| Earnings before income taxes | $ | 584,728 | | | $ | 293,384 | | | $ | 2,005,836 | |
| | | | | |
| Fiscal Year |
| 2021 | | 2020 | | 2019 |
| Depreciation and amortization: | (In thousands) |
| U.S. Foodservice Operations | $ | 366,808 | | | $ | 373,889 | | | $ | 342,277 | |
| International Foodservice Operations | 238,457 | | | 279,475 | | | 248,914 | |
| SYGMA | 32,774 | | | 34,785 | | | 35,473 | |
| Other | 9,961 | | | 12,072 | | | 10,868 | |
| Total segments | 648,000 | | | 700,221 | | | 637,532 | |
| Corporate | 89,916 | | | 105,544 | | | 126,403 | |
| Total | $ | 737,916 | | | $ | 805,765 | | | $ | 763,935 | |
| | | | | |
| Fiscal Year |
| 2021 | | 2020 | | 2019 |
| Capital Expenditures: | (In thousands) |
| U.S. Foodservice Operations | $ | 163,303 | | | $ | 263,943 | | | $ | 327,005 | |
| International Foodservice Operations | 152,017 | | | 217,694 | | | 249,527 | |
| SYGMA | 33,185 | | | 23,657 | | | 36,396 | |
| Other | 16,924 | | | 21,000 | | | 25,003 | |
| Total segments | 365,429 | | | 526,294 | | | 637,931 | |
| Corporate | 105,247 | | | 194,129 | | | 54,460 | |
| Total | $ | 470,676 | | | $ | 720,423 | | | $ | 692,391 | |
| | | | | | | | | | | | | | | | | |
| | Fiscal Year |
| 2021 | | 2020 | | 2019 |
| Assets: | (In thousands) |
| U.S. Foodservice Operations | $ | 7,632,481 | | | $ | 6,647,288 | | | $ | 7,238,309 | |
| International Foodservice Operations | 6,784,006 | | | 6,258,382 | | | 5,888,275 | |
| SYGMA | 760,388 | | | 685,184 | | | 624,720 | |
| Other | 455,236 | | | 458,316 | | | 477,038 | |
| Total segments | 15,632,111 | | | 14,049,170 | | | 14,228,342 | |
| Corporate | 5,781,428 | | | 8,579,096 | | | 3,738,180 | |
| Total | $ | 21,413,539 | | | $ | 22,628,266 | | | $ | 17,966,522 | |
Information concerning geographic areas is as follows:
| | | | | | | | | | | | | | | | | |
| | Fiscal Year |
| | 2021 | | 2020 | | 2019 |
| | (In thousands) |
| Sales: | | | | | |
| United States | $ | 42,610,406 | | | $ | 42,803,700 | | | $ | 48,257,385 | |
| Canada | 3,906,722 | | | 4,105,236 | | | 4,660,030 | |
| United Kingdom | 1,706,851 | | | 2,481,712 | | | 3,133,793 | |
| France | 1,097,868 | | | 1,222,742 | | | 1,581,663 | |
| | | | | |
| | | | | |
| Other | 1,975,996 | | | 2,279,920 | | | 2,481,051 | |
| Total | $ | 51,297,843 | | | $ | 52,893,310 | | | $ | 60,113,922 | |
| Long-lived assets: | | | | | |
| United States | $ | 3,148,279 | | | $ | 3,340,920 | | | $ | 3,361,629 | |
| Canada | 355,864 | | | 331,196 | | | 334,177 | |
| France | 323,461 | | | 308,983 | | | 329,923 | |
| United Kingdom | 275,385 | | | 255,153 | | | 270,613 | |
| Other | 223,074 | | | 222,315 | | | 205,363 | |
| Total | $ | 4,326,063 | | | $ | 4,458,567 | | | $ | 4,501,705 | |
The sales mix for the principal product categories by segment is disclosed in Note 3, “Revenue.”
22. QUARTERLY RESULTS (UNAUDITED)
Financial information for each quarter in the fiscal year ended July 3, 2021 is set forth below. Results for the quarterly periods in the fiscal year ended June 27, 2020 have been omitted pursuant to SEC Release No. 33-10890 issued by the SEC on November 19, 2020. | | | | | | | | | | | | | | | | | | | | | | | | | | | | | |
| | Fiscal 2021 Quarter Ended | | |
| | September 26 | | December 26 | | March 27 | | July 3 (1)(2) | | Fiscal Year (2) |
| | (In thousands except for per share data) |
| Sales | $ | 11,777,379 | | | $ | 11,558,982 | | | $ | 11,824,589 | | | $ | 16,136,893 | | | $ | 51,297,843 | |
| Cost of sales | 9,557,534 | | | 9,460,524 | | | 9,701,921 | | | 13,221,115 | | | 41,941,094 | |
| Gross profit | 2,219,845 | | | 2,098,458 | | | 2,122,668 | | | 2,915,778 | | | 9,356,749 | |
| Operating expenses | 1,800,266 | | | 1,886,396 | | | 1,886,751 | | | 2,346,094 | | | 7,919,507 | |
| Operating income | 419,579 | | | 212,062 | | | 235,917 | | | 569,684 | | | 1,437,242 | |
| Interest expense | 146,717 | | | 146,498 | | | 145,773 | | | 441,149 | | | 880,137 | |
| Other expense (income), net | 14,124 | | | (15,556) | | | (12,708) | | | (13,483) | | | (27,623) | |
| Earnings before income taxes | 258,738 | | | 81,120 | | | 102,852 | | | 142,018 | | | 584,728 | |
| Income tax expense (benefit) | 41,838 | | | 13,831 | | | 13,925 | | | (9,075) | | | 60,519 | |
| Net earnings | $ | 216,900 | | | $ | 67,289 | | | $ | 88,927 | | | $ | 151,093 | | | $ | 524,209 | |
| Per share: | | | | | | | | | |
Basic net earnings (3) | $ | 0.43 | | | $ | 0.13 | | | $ | 0.17 | | | $ | 0.29 | | | $ | 1.03 | |
Diluted net earnings (3) | 0.42 | | | 0.13 | | | 0.17 | | | 0.29 | | | 1.02 | |
| Dividends declared | 0.45 | | | 0.45 | | | 0.45 | | | 0.47 | | | 1.82 | |
(1) Sysco’s fourth quarter of fiscal 2021 included a charge for $293.9 million in interest expense related to the redemption of senior notes. See Note 12 “Debt and Other Financing Arrangements.”
(2) Sysco’s fiscal year ends on the Saturday nearest to June 30th, which resulted in a 14-week quarter and 53-week year ending
July 3, 2021 for fiscal 2021.
(3) Quarterly basic and diluted earnings per share amounts may not add up to the full fiscal year total presented due to rounding. Basic and diluted earnings per share are calculated by dividing net earnings by basic and diluted shares outstanding, respectively.
Item 9. Changes in and Disagreements with Accountants on Accounting and Financial Disclosure
None.
Item 9A. Controls and Procedures
Sysco’s management, with the participation of our chief executive officer and chief financial officer, evaluated the effectiveness of our disclosure controls and procedures as of July 3, 2021. The term “disclosure controls and procedures,” as defined in Rules 13a-15(e) and 15d-15(e) under the Exchange Act, means controls and other procedures of a company that are designed to ensure that information required to be disclosed by a company in the reports that it files or submits under the Exchange Act is recorded, processed, summarized and reported, within the time periods specified in the Securities and Exchange Commission’s rules and forms. Disclosure controls and procedures include, without limitation, controls and procedures designed to ensure that information required to be disclosed by a company in the reports that it files or submits under the Exchange Act is accumulated and communicated to the company’s management, including its principal executive and principal financial officers, as appropriate to allow timely decisions regarding the required disclosure. Management recognizes that any controls and procedures, no matter how well designed and operated, can provide only reasonable assurance of achieving their objectives and management necessarily applies its judgment in evaluating the cost-benefit relationship of possible controls and procedures. Sysco’s disclosure controls and procedures have been designed to provide reasonable assurance of achieving their objectives. Based on the evaluation of our disclosure controls and procedures as of July 3, 2021, our chief executive officer and chief financial officer concluded that, as of such date, Sysco’s disclosure controls and procedures were effective at the reasonable assurance level.
Management’s report on internal control over financial reporting is included in the financial statement pages at page 61.
There have been no changes in our internal control over financial reporting (as that term is defined in Rules 13a-15(f) and 15d-15(f) under the Exchange Act) that occurred during the fourth quarter ended July 3, 2021, that have materially affected, or are reasonably likely to materially affect, our internal control over financial reporting.
Item 9B. Other Information
On and effective August 27, 2021, the Company’s Board of Directors (the “Board”), upon the recommendation of the Corporate Governance and Nominating Committee of the Board, approved and adopted an amendment (the “Amendment”) to Article IX – “Exclusive Forum” of the amended and restated the By-Laws of the Company (the “By-Laws”) to provide that, unless the Company consents in writing to the selection of an alternative forum, the Court of Chancery of the State of Delaware (or the federal district court for the District of Delaware, if the Court of Chancery lacks jurisdiction) will, to the fullest extent permitted by law, be the sole and exclusive forum for:
•any derivative action or proceeding brought on behalf of the Company;
•any action asserting a claim of breach of a fiduciary duty owed by any director or officer or other employee of the Company to the Company (or the stockholders thereof);
•any action asserting a claim against the Company or any director or officer or other employee of the Company arising pursuant to any provision of the General Corporation Law or the Company’s certificate of incorporation or bylaws (as either may be amended from time to time); or
•any action asserting a claim against the Company (or any director or officer or other employee thereof) governed by the internal affairs doctrine.
This exclusive forum provision, as amended by the Amendment, does not apply to any claim (A) as to which such court determines that there is an indispensable party not subject to the jurisdiction of such court (and the indispensable party does not consent to the personal jurisdiction of such court within ten days following such determination), (B) which is vested in the exclusive jurisdiction of a court or forum other than such court, or (C) for which such court does not have subject matter jurisdiction.
The foregoing summary of the Amendment is qualified in its entirety by reference to the full text of the By-Laws, as amended and restated and filed as Exhibit 3.4 to this Annual Report on Form 10-K and incorporated by reference herein.
Item 9C. Disclosure Reporting Regarding Foreign Jurisdictions that Prevent Inspections
Not applicable.
PART III
Item 10. Directors, Executive Officers and Corporate Governance
The information required by this item will be included in our proxy statement for the 2021 Annual Meeting of Stockholders under the following captions, and is incorporated herein by reference thereto: “Corporate Governance,” “Executive Officers,” “Delinquent Section 16(a) Reports,” “Report of the Audit Committee” and “Board of Directors Matters.”
Item 11. Executive Compensation
The information required by this item will be included in our proxy statement for the 2021 Annual Meeting of Stockholders under the following captions, and is incorporated herein by reference thereto: “Compensation Discussion and Analysis,” “Report of the Compensation and Leadership Development Committee,” “Director Compensation” and “Executive Compensation.”
Item 12. Security Ownership of Certain Beneficial Owners and Management and Related Stockholder Matters
The information required by this item will be included in our proxy statement for the 2021 Annual Meeting of Stockholders under the following captions, and is incorporated herein by reference thereto: “Stock Ownership” and “Equity Compensation Plan Information.”
Item 13. Certain Relationships and Related Transactions, and Director Independence
The information required by this item will be included in our proxy statement for the 2021 Annual Meeting of Stockholders under the following caption, and is incorporated herein by reference thereto: “Corporate Governance – Certain Relationships and Related Person Transactions” and “Corporate Governance – Director Independence.”
Item 14. Principal Accountant Fees and Services
The information required by this item will be included in our proxy statement for the 2021 Annual Meeting of Stockholders under the following caption, and is incorporated herein by reference thereto: “Fees Paid to Independent Registered Public Accounting Firm.”
PART IV
Item 15. Exhibit and Financial Statement Schedules
(a)The following documents are filed, or incorporated by reference, as part of this Form 10-K:
1.All financial statements. See Index to Consolidated Financial Statements on page 60 of this Form 10-K.
2.All financial statement schedules are omitted because they are not applicable or the information is set forth in the consolidated financial statements or notes thereto within Item 8. Financial Statements and Supplementary Data.
3.Exhibits.
The exhibits listed on the Exhibit Index below are filed or furnished as part of this Annual Report on Form 10-K.
EXHIBIT INDEX
Exhibits. | | | | | | | | |
| 3.1 | — | |
| | |
| 3.2 | — | |
| | |
| 3.3 | — | |
| | |
| 3.4# | — | |
| | |
| 4.1 | — | |
| | |
| 4.2 | — | |
| | |
| 4.3 | — | |
| | |
| 4.4 | — | |
| | |
| 4.5# | — | |
| | |
| 10.1 | — | Credit Agreement dated as of June 28, 2019, among Sysco Corporation, Sysco Canada, Inc., Sysco EU II S.à r.l., JP Morgan Chase Bank, N.A., as administrative agent, and certain lenders and guarantors party thereto, incorporated by reference to Exhibit 10.1 to the Form 8-K filed on July 3, 2019 (File No. 1-6544). |
| | |
| 10.2 | — | Amendment dated as of May 20, 2020 to Credit Agreement dated as of June 28, 2019, among Sysco Corporation, Sysco Canada, Inc., Sysco EU II S.à r.l., the subsidiary guarantors party thereto, JP Morgan Chase Bank, N.A., as administrative agent, and the lenders party thereto, incorporated by reference to Exhibit 10.2 to the Form 8-K filed on May 22, 2020 (File No. 1-6544). |
| | |
| 10.3 | — | Amendment No. 2 dated as of May 20, 2021 to Credit Agreement dated as of June 28, 2019, among Sysco Corporation, Sysco Canada, Inc., Sysco EU II S.à r.l., the subsidiary guarantors party thereto, JP Morgan Chase Bank, N.A., as administrative agent, and the lenders party thereto, incorporated by reference to Exhibit 10.1 to the Form 8-K filed on May 22, 2021 (File No. 1-6544). |
| | |
| 10.4 | — | |
| | |
| 10.5 | — | |
| | |
| 10.6 | — | Commercial Paper Dealer Agreement, dated as of October 31, 2014, between Sysco Corporation, as issuer, and Goldman, Sachs & Co, as Dealer, incorporated by reference to Exhibit 10.3 to the Form 10-Q for the quarter ended December 27, 2014 filed on February 2, 2015(File No. 1-6544). |
| | |
| 10.7 | — | Commercial Paper Dealer Agreement, dated as of January 18, 2017, between Sysco Corporation, as issuer, and Wells Fargo Securities, LLC, as Dealer, incorporated by reference to Exhibit 10.5 to the Form 10-K for the year ended July 1, 2017 filed on August 30, 2017 (File No. 1-6544). |
| | |
| 10.8 | — | Commercial Paper Dealer Agreement, dated as of February 3, 2017, between Sysco Corporation, as issuer, and Merrill Lynch, Pierce, Fenner & Smith Incorporated, as Dealer, incorporated by reference to Exhibit 10.6 to the Form 10-K for the year ended July 1, 2017 filed on August 30, 2017 (File No. 1-6544). |
| | |
| 10.9 | — | |
| | |
| | | | | | | | |
| 10.10 | — | |
| | |
| 10.11 | — | |
| | |
| 10.12 | — | |
| | |
| 10.13† | — | |
| | |
| 10.14† | — | |
| | |
| 10.15† | — | |
| | |
| 10.16† | — | |
| | |
| 10.17† | — | |
| | |
| 10.18† | — | |
| | |
| 10.19† | — | |
| | |
| 10.20† | — | |
| | |
| 10.21† | — | |
| | |
| 10.22† | — | |
| | |
| 10.23† | — | |
| | |
| 10.24† | — | |
| | |
| 10.25† | — | |
| | |
| 10.26† | — | |
| | |
| 10.27† | — | |
| | |
| | | | | | | | |
| 10.28† | — | |
| | |
| 10.29† | — | |
| | |
| 10.30† | — | |
| | |
| 10.31† | — | |
| | |
| 10.32† | — | |
| | |
| 10.33† | — | |
| | |
| 10.34† | — | |
| | |
| 10.35† | — | |
| | |
| 10.36† | — | |
| | |
| 10.37† | — | |
| | |
| 10.38† | — | |
| | |
| 10.39† | — | |
| | |
| 10.40† | — | |
| | |
| 10.41† | — | |
| | |
| 10.42† | — | |
| | |
| 10.43† | — | |
| | |
| 10.44† | — | |
| | |
| 10.45† | — | |
| | |
| 10.46† | — | |
| | |
| | | | | | | | |
| 10.47† | — | |
| | |
| 10.48† | — | |
| | |
| 10.49† | — | |
| | |
| 10.50† | — | |
| | |
| 10.51† | — | |
| | |
| 10.52† | — | |
| | |
| 10.53† | — | |
| | |
| 10.54† | — | |
| | |
| 10.55† | — | |
| | |
| 10.56† | — | |
| | |
| 10.57† | — | |
| | |
| 10.58† | — | |
| | |
| 10.59† | | |
| | |
| 10.60† | | |
| | |
| 10.61† | | |
| | |
| 10.62† | — | |
| | |
| 10.63† | — | |
| | |
| 10.64† | | |
| | |
| 10.65† | | |
| | |
| | | | | | | | |
| 21.1# | — | |
| | |
| 22.1# | — | |
| | |
| 23.1# | — | |
| | |
| 31.1# | — | |
| | |
| 31.2# | — | |
| | |
| 32.1# | — | |
| | |
| 32.2# | — | |
| | |
| 101.SCH# | — | Inline XBRL Taxonomy Extension Schema Document |
| | |
| 101.CAL# | — | Inline XBRL Taxonomy Extension Calculation Linkbase Document |
| | |
| 101.DEF# | — | Inline XBRL Taxonomy Extension Definition Linkbase Document |
| | |
| 101.LAB# | — | Inline XBRL Taxonomy Extension Labels Linkbase Document |
| | |
| 101.PRE# | — | Inline XBRL Taxonomy Extension Presentation Linkbase Document |
| | |
| 104# | | Cover Page Interactive Data File (formatted as Inline XBRL and contained in Exhibit 101) |
_________
† Executive Compensation Arrangement pursuant to 601(b)(10)(iii)(A) of Regulation S-K
# Filed Herewith
Note: Debt instruments of Sysco Corporation and its subsidiaries defining the rights of long-term debt holders in principal amounts not exceeding 10% of Sysco Corporation’s consolidated assets have been omitted and will be provided to the Securities and Exchange Commission upon request.
Item 16. Form 10-K Summary
None.
SIGNATURES
Pursuant to the requirements of Section 13 or 15(d) of the Securities Exchange Act of 1934, Sysco Corporation has duly caused this Form 10-K to be signed on its behalf by the undersigned, thereunto duly authorized, on this 27th day of August 2021.
| | | | | |
| SYSCO CORPORATION | |
| By: | /s/ KEVIN P. HOURICAN |
| | Kevin P. Hourican |
| | President and Chief Executive Officer |
Pursuant to the requirements of the Securities Exchange Act of 1934, this report has been signed below by the following persons on behalf of Sysco Corporation in the capacities indicated and on the date indicated above.
PRINCIPAL EXECUTIVE, FINANCIAL & ACCOUNTING OFFICERS:
| | | | | |
| /s/ KEVIN P. HOURICAN | President and Chief Executive Officer |
| Kevin P. Hourican | (principal executive officer) |
| | |
| /s/ AARON E. ALT | Executive Vice President and Chief Financial Officer |
| Aaron E. Alt | (principal financial officer) |
| |
| /s/ ANITA A. ZIELINSKI | Senior Vice President and Chief Accounting Officer |
| Anita A. Zielinski | (principal accounting officer) |
| |
DIRECTORS:
| | | | | |
| /s/ DANIEL J. BRUTTO | /s/ KEVIN P. HOURICAN |
| Daniel J. Brutto | Kevin P. Hourican |
| |
| /s/ JOHN M. CASSADAY | /s/ HANS-JOACHIM KOERBER |
| John M. Cassaday | Hans-Joachim Koerber |
| | |
| /s/ LARRY C. GLASSCOCK | /s/ STEPHANIE A. LUNDQUIST |
| Larry C. Glasscock | Stephanie A. Lundquist |
| |
| /s/ BRADLEY M. HALVERSON | /s/ EDWARD D. SHIRLEY |
| Bradley M. Halverson | Edward D. Shirley |
| |
| /s/ JOHN M. HINSHAW | /s/ SHEILA G. TALTON |
| John M. Hinshaw | Sheila G. Talton |