UNITED STATES
SECURITIES AND EXCHANGE COMMISSION
WASHINGTON, D.C. 20549
FORM
|
|
QUARTERLY REPORT PURSUANT TO SECTION 13 OR 15(d) OF THE SECURITIES EXCHANGE ACT OF 1934 |
For the quarterly period ended
|
|
TRANSITION REPORT PURSUANT TO SECTION 13 OR 15(d) OF THE SECURITIES EXCHANGE ACT OF 1934 |
For the transition period from to .
Commission file number:
(Exact Name of Registrant as Specified in Its Charter)
|
|
|
|
(State or Other Jurisdiction of Incorporation or Organization) |
(I.R.S. Employer Identification No.) |
|
|
|
|
|
|
|
|
|
|
(Address of Principal Executive Offices) |
(Zip Code) |
Registrant’s Telephone Number, Including Area Code: (
Securities registered pursuant to Section 12(b) of the Act:
|
|
|
|
|
|
|
Title of Each Class |
|
Trading Symbol |
|
Name of Each Exchange on Which Registered |
|
|
|
|
|
|
Indicate by check mark whether the registrant: (1) has filed all reports required to be filed by Section 13 or 15(d) of the Securities Exchange Act of 1934 during the preceding 12 months (or for such shorter period that the registrant was required to file such reports), and (2) has been subject to such filing requirements for the past 90 days.
Indicate by check mark whether the registrant has submitted electronically every Interactive Data File required to be submitted pursuant to Rule 405 of Regulation S-T (§232.405 of this chapter) during the preceding 12 months (or for such shorter period that the registrant was required to submit such files).
Indicate by check mark whether the registrant is a large accelerated filer, an accelerated filer, a non-accelerated filer, a smaller reporting company, or an emerging growth company. See the definitions of “large accelerated filer,” “accelerated filer,” “smaller reporting company” and “emerging growth company” in Rule 12b-2 of the Exchange Act.
|
Large Accelerated Filer |
☐ |
Accelerated Filer |
☐ |
|
Non-Accelerated Filer |
☒ |
Smaller Reporting Company |
|
|
|
|
Emerging Growth Company |
|
If an emerging growth company, indicate by check mark if the registrant has elected not to use the extended transition period for complying with any new or revised financial accounting standards provided pursuant to Section 13(a) of the Exchange Act. ☐
Indicate by check mark whether the registrant is a shell company (as defined in Rule 12b-2 of the Exchange Act). Yes
Number of shares of common stock outstanding as of July 29, 2020:
TABLE OF CONTENTS
|
|
|
|
|
|
Page |
|
PART I |
- |
|
|||
|
|
|
|
|
|
|
|
|
|
Item 1 |
- |
|
|
|
|
|
|
|
|
|
|
|
|
|
|
1 |
|
|
|
|
|
|
|
|
|
|
|
|
|
Condensed Consolidated Statements of Comprehensive Income (Loss) |
2 |
|
|
|
|
|
|
|
|
|
|
|
|
3 |
|
|
|
|
|
|
|
|
|
|
|
|
|
4 |
|
|
|
|
|
|
|
|
|
|
|
|
|
Condensed Consolidated Statements of Shareholders’ Equity (Deficit) |
5 |
|
|
|
|
|
|
|
|
|
|
|
|
7 |
|
|
|
|
|
|
|
|
|
|
|
Item 2 |
- |
Management’s Discussion and Analysis of Financial Condition and Results of Operations |
27 |
|
|
|
|
|
|
|
|
|
|
Item 3 |
- |
42 |
|
|
|
|
|
|
|
|
|
|
|
Item 4 |
- |
42 |
|
|
|
|
|
|
||
|
PART II |
- |
43 |
|||
|
|
|
|
|
|
|
|
|
|
Item 1 |
- |
43 |
|
|
|
|
|
|
|
|
|
|
|
Item 1A |
- |
43 |
|
|
|
|
|
|
|
|
|
|
|
Item 2 |
- |
44 |
|
|
|
|
|
|
|
|
|
|
|
Item 5 |
- |
44 |
|
|
|
|
|
|
|
|
|
|
|
Item 6 |
- |
45 |
|
|
|
|
|
|
||
|
|
|
46 |
|||
PART I
FINANCIAL INFORMATION
Item 1. Financial Statements
SUPERIOR INDUSTRIES INTERNATIONAL, INC.
CONDENSED CONSOLIDATED STATEMENT OF INCOME (LOSS)
(Dollars in thousands, except per share data)
(Unaudited)
|
|
|
Three Months Ended |
|
|
Six Months Ended |
|
||||||||||
|
|
|
June 30, 2020 |
|
|
June 30, 2019 |
|
|
June 30, 2020 |
|
|
June 30, 2019 |
|
||||
|
NET SALES |
|
$ |
|
|
|
$ |
|
|
|
$ |
|
|
|
$ |
|
|
|
Cost of sales |
|
|
|
|
|
|
|
|
|
|
|
|
|
|
|
|
|
GROSS (LOSS) PROFIT |
|
|
( |
) |
|
|
|
|
|
|
|
|
|
|
|
|
|
Selling, general and administrative expenses |
|
|
|
|
|
|
|
|
|
|
|
|
|
|
|
|
|
Impairment of goodwill and indefinite-lived intangibles |
|
|
— |
|
|
|
— |
|
|
|
|
|
|
|
— |
|
|
(LOSS) INCOME FROM OPERATIONS |
|
|
( |
) |
|
|
|
|
|
|
( |
) |
|
|
|
|
|
Interest expense, net |
|
|
( |
) |
|
|
( |
) |
|
|
( |
) |
|
|
( |
) |
|
Other (expense) income, net |
|
|
( |
) |
|
|
|
|
|
|
|
|
|
|
|
|
|
(LOSS) INCOME BEFORE INCOME TAXES |
|
|
( |
) |
|
|
|
|
|
|
( |
) |
|
|
|
|
|
Income tax benefit (provision) |
|
|
|
|
|
|
( |
) |
|
|
|
|
|
|
( |
) |
|
NET (LOSS) INCOME |
|
$ |
( |
) |
|
$ |
|
|
|
$ |
( |
) |
|
$ |
|
|
|
LOSS PER SHARE – BASIC |
|
$ |
( |
) |
|
$ |
( |
) |
|
$ |
( |
) |
|
$ |
( |
) |
|
LOSS PER SHARE – DILUTED |
|
$ |
( |
) |
|
$ |
( |
) |
|
$ |
( |
) |
|
$ |
( |
) |
The accompanying unaudited notes are an integral part of these condensed consolidated financial statements.
1
SUPERIOR INDUSTRIES INTERNATIONAL, INC.
CONDENSED CONSOLIDATED STATEMENTS OF COMPREHENSIVE INCOME (LOSS)
(Dollars in thousands)
(Unaudited)
|
|
|
Three Months Ended |
|
|
Six Months Ended |
|
||||||||||
|
|
|
June 30, 2020 |
|
|
June 30, 2019 |
|
|
June 30, 2020 |
|
|
June 30, 2019 |
|
||||
|
Net (loss) income |
|
$ |
( |
) |
|
$ |
|
|
|
$ |
( |
) |
|
$ |
|
|
|
Other comprehensive income (loss), net of tax: |
|
|
|
|
|
|
|
|
|
|
|
|
|
|
|
|
|
Foreign currency translation gain (loss) |
|
|
|
|
|
|
|
|
|
|
( |
) |
|
|
|
|
|
Change in unrecognized gains (losses) on derivative instruments: |
|
|
|
|
|
|
|
|
|
|
|
|
|
|
|
|
|
Change in fair value of derivatives |
|
|
|
|
|
|
|
|
|
|
( |
) |
|
|
|
|
|
Tax (provision) benefit |
|
|
( |
) |
|
|
( |
) |
|
|
|
|
|
|
( |
) |
|
Change in unrecognized gains (losses) on derivative instruments, net of tax |
|
|
|
|
|
|
|
|
|
|
( |
) |
|
|
|
|
|
Defined benefit pension plan: |
|
|
|
|
|
|
|
|
|
|
|
|
|
|
|
|
|
Amortization of actuarial losses on pension obligations |
|
|
|
|
|
|
|
|
|
|
|
|
|
|
|
|
|
Tax (provision) |
|
|
( |
) |
|
|
( |
) |
|
|
( |
) |
|
|
( |
) |
|
Pension changes, net of tax |
|
|
|
|
|
|
|
|
|
|
|
|
|
|
|
|
|
Other comprehensive income (loss), net of tax |
|
|
|
|
|
|
|
|
|
|
( |
) |
|
|
|
|
|
Comprehensive (loss) income |
|
$ |
( |
) |
|
$ |
|
|
|
$ |
( |
) |
|
$ |
|
|
The accompanying unaudited notes are an integral part of these condensed consolidated financial statements.
2
SUPERIOR INDUSTRIES INTERNATIONAL, INC.
CONDENSED CONSOLIDATED BALANCE SHEETS
(Dollars in thousands)
(Unaudited)
|
|
|
June 30, 2020 |
|
|
December 31, 2019 |
|
||
|
ASSETS |
|
|
|
|
|
|
|
|
|
Current assets: |
|
|
|
|
|
|
|
|
|
Cash and cash equivalents |
|
$ |
|
|
|
$ |
|
|
|
Accounts receivable, net |
|
|
|
|
|
|
|
|
|
Inventories, net |
|
|
|
|
|
|
|
|
|
Income taxes receivable |
|
|
|
|
|
|
|
|
|
Other current assets |
|
|
|
|
|
|
|
|
|
Total current assets |
|
|
|
|
|
|
|
|
|
Property, plant and equipment, net |
|
|
|
|
|
|
|
|
|
Deferred income tax assets, net |
|
|
|
|
|
|
|
|
|
Goodwill |
|
|
— |
|
|
|
|
|
|
Intangibles, net |
|
|
|
|
|
|
|
|
|
Other non-current assets |
|
|
|
|
|
|
|
|
|
Total assets |
|
$ |
|
|
|
$ |
|
|
|
LIABILITIES, MEZZANINE EQUITY AND SHAREHOLDERS’ EQUITY |
|
|
|
|
|
|
|
|
|
Current liabilities: |
|
|
|
|
|
|
|
|
|
Accounts payable |
|
$ |
|
|
|
$ |
|
|
|
Short-term debt |
|
|
|
|
|
|
|
|
|
Accrued expenses |
|
|
|
|
|
|
|
|
|
Income taxes payable |
|
|
|
|
|
|
|
|
|
Total current liabilities |
|
|
|
|
|
|
|
|
|
Long-term debt (less current portion) |
|
|
|
|
|
|
|
|
|
Non-current income tax liabilities |
|
|
|
|
|
|
|
|
|
Deferred income tax liabilities, net |
|
|
— |
|
|
|
|
|
|
Other non-current liabilities |
|
|
|
|
|
|
|
|
|
Commitments and contingent liabilities (Note 17) |
|
|
|
|
|
|
|
|
|
Mezzanine equity: |
|
|
|
|
|
|
|
|
|
Preferred stock, $ |
|
|
|
|
|
|
|
|
|
Authorized - |
|
|
|
|
|
|
|
|
|
Issued and outstanding – June 30, 2020 and December 31, 2019 |
|
|
|
|
|
|
|
|
|
European non-controlling redeemable equity |
|
|
|
|
|
|
|
|
|
Shareholders’ equity (deficit): |
|
|
|
|
|
|
|
|
|
Common stock, $ |
|
|
|
|
|
|
|
|
|
Authorized - |
|
|
|
|
|
|
|
|
|
Issued and outstanding – June 30, 2020 and December 31, 2019 |
|
|
|
|
|
|
|
|
|
Accumulated other comprehensive loss |
|
|
( |
) |
|
|
( |
) |
|
Retained earnings |
|
|
|
|
|
|
|
|
|
Total shareholders’ equity (deficit) |
|
|
( |
) |
|
|
|
|
|
Total liabilities, mezzanine equity and shareholders’ equity (deficit) |
|
$ |
|
|
|
$ |
|
|
The accompanying unaudited notes are an integral part of these condensed consolidated financial statements.
3
SUPERIOR INDUSTRIES INTERNATIONAL, INC.
CONDENSED CONSOLIDATED STATEMENTS OF CASH FLOWS
(Dollars in thousands)
(Unaudited)
|
|
|
Six Months Ended |
|
|||||
|
|
|
June 30, 2020 |
|
|
June 30, 2019 |
|
||
|
CASH FLOWS FROM OPERATING ACTIVITIES: |
|
|
|
|
|
|
|
|
|
Net (loss) income |
|
$ |
( |
) |
|
$ |
|
|
|
Adjustments to reconcile net income (loss) to net cash provided by operating activities: |
|
|
|
|
|
|
|
|
|
Depreciation and amortization |
|
|
|
|
|
|
|
|
|
Income tax, non-cash changes |
|
|
( |
) |
|
|
|
|
|
Impairment of goodwill and indefinite-lived intangibles |
|
|
|
|
|
|
— |
|
|
Stock-based compensation |
|
|
|
|
|
|
|
|
|
Amortization of debt issuance costs |
|
|
|
|
|
|
|
|
|
Other non-cash items |
|
|
( |
) |
|
|
( |
) |
|
Changes in operating assets and liabilities: |
|
|
|
|
|
|
|
|
|
Accounts receivable |
|
|
|
|
|
|
( |
) |
|
Inventories |
|
|
|
|
|
|
( |
) |
|
Other assets and liabilities |
|
|
|
|
|
|
|
|
|
Accounts payable |
|
|
( |
) |
|
|
|
|
|
Income taxes |
|
|
|
|
|
|
|
|
|
NET CASH (USED IN) PROVIDED BY OPERATING ACTIVITIES |
|
|
( |
) |
|
|
|
|
|
CASH FLOWS FROM INVESTING ACTIVITIES: |
|
|
|
|
|
|
|
|
|
Additions to property, plant and equipment |
|
|
( |
) |
|
|
( |
) |
|
Other investing activities |
|
|
— |
|
|
|
|
|
|
NET CASH USED IN INVESTING ACTIVITIES |
|
|
( |
) |
|
|
( |
) |
|
CASH FLOWS FROM FINANCING ACTIVITIES: |
|
|
|
|
|
|
|
|
|
Proceeds from issuance of long-term debt |
|
|
|
|
|
|
— |
|
|
Repayments of debt |
|
|
( |
) |
|
|
( |
) |
|
Cash dividends paid |
|
|
( |
) |
|
|
( |
) |
|
Purchase of non-controlling redeemable shares |
|
|
( |
) |
|
|
( |
) |
|
Payments related to tax withholdings for stock-based compensation |
|
|
— |
|
|
|
( |
) |
|
Proceeds from borrowings on revolving credit facility |
|
|
|
|
|
|
|
|
|
Repayments of borrowings on revolving credit facility |
|
|
( |
) |
|
|
( |
) |
|
Other financing activities |
|
|
( |
) |
|
|
( |
) |
|
NET CASH PROVIDED BY (USED IN) FINANCING ACTIVITIES |
|
|
|
|
|
|
( |
) |
|
Effect of exchange rate changes on cash |
|
|
|
|
|
|
( |
) |
|
Net increase in cash and cash equivalents |
|
|
|
|
|
|
|
|
|
Cash and cash equivalents at the beginning of the period |
|
|
|
|
|
|
|
|
|
Cash and cash equivalents at the end of the period |
|
$ |
|
|
|
$ |
|
|
The accompanying unaudited notes are an integral part of these condensed consolidated financial statements.
4
SUPERIOR INDUSTRIES INTERNATIONAL, INC.
CONDENSED CONSOLIDATED STATEMENTS OF SHAREHOLDERS’ EQUITY (DEFICIT)
(Dollars in thousands)
For the six months ended June 30, 2019
|
(Unaudited) |
|
Common Stock |
|
|
Accumulated Other Comprehensive (Loss) Income |
|
|
|
|
|
|
|
|
|
|
||||||||||||||
|
|
|
Number of Shares |
|
|
Amount |
|
|
Unrecognized Gains (Losses) on Derivative Instruments |
|
|
Pension Obligations |
|
|
Cumulative Translation Adjustment |
|
|
Retained Earnings |
|
|
Total |
|
|
|||||||
|
BALANCE AT DECEMBER 31, 2018 |
|
|
|
|
|
$ |
|
|
|
$ |
( |
) |
|
$ |
( |
) |
|
$ |
( |
) |
|
$ |
|
|
|
$ |
|
|
|
|
Net income |
|
|
— |
|
|
|
— |
|
|
|
— |
|
|
|
— |
|
|
|
— |
|
|
|
|
|
|
|
|
|
|
|
Change in unrecognized gains/losses on derivative instruments, net of tax |
|
|
— |
|
|
|
— |
|
|
|
|
|
|
|
— |
|
|
|
— |
|
|
|
— |
|
|
|
|
|
|
|
Change in employee benefit plans, net of taxes |
|
|
— |
|
|
|
— |
|
|
|
— |
|
|
|
|
|
|
|
— |
|
|
|
— |
|
|
|
|
|
|
|
Net foreign currency translation adjustment |
|
|
— |
|
|
|
— |
|
|
|
— |
|
|
|
— |
|
|
|
|
|
|
|
— |
|
|
|
|
|
|
|
Common stock issued, net of shares withheld for employee taxes |
|
|
|
|
|
|
— |
|
|
|
— |
|
|
|
— |
|
|
|
— |
|
|
|
— |
|
|
|
— |
|
|
|
Stock-based compensation |
|
|
— |
|
|
|
|
|
|
|
— |
|
|
|
— |
|
|
|
— |
|
|
|
— |
|
|
|
|
|
|
|
Cash dividend declared ($ share) |
|
|
— |
|
|
|
— |
|
|
|
— |
|
|
|
— |
|
|
|
— |
|
|
|
( |
) |
|
|
( |
) |
|
|
Redeemable preferred dividend and accretion |
|
|
— |
|
|
|
— |
|
|
|
— |
|
|
|
— |
|
|
|
— |
|
|
|
( |
) |
|
|
( |
) |
|
|
European non-controlling redeemable equity dividend |
|
|
— |
|
|
|
— |
|
|
|
— |
|
|
|
— |
|
|
|
— |
|
|
|
( |
) |
|
|
( |
) |
|
|
BALANCE AT JUNE 30, 2019 |
|
|
|
|
|
$ |
|
|
|
$ |
|
|
|
$ |
( |
) |
|
$ |
( |
) |
|
$ |
|
|
|
$ |
|
|
|
|
|
|
|
|
|
|
|
|
|
|
|
|
|
|
|
|
|
|
|
|
|
|
|
|
|
|
|
|
|
|
|
For the three months ended June 30, 2019 |
|
|
|
|
|
|
|
|
|
|
|
|
|
|
|
|
|
|
|
|
|
|
|
|
|
|
|||
|
|
|
|
|
|
|
|
|
|
|
|
|
|
|
|
|
|
|
|
|
|
|
|
|
|
|
|
|
|
|
|
(Unaudited) |
|
Common Stock |
|
|
Accumulated Other Comprehensive (Loss) Income |
|
|
|
|
|
|
|
|
|
|
||||||||||||||
|
|
|
Number of Shares |
|
|
Amount |
|
|
Unrecognized Gains (Losses) on Derivative Instruments |
|
|
Pension Obligations |
|
|
Cumulative Translation Adjustment |
|
|
Retained Earnings |
|
|
Total |
|
|
|||||||
|
BALANCE AT MARCH 31, 2019 |
|
|
|
|
|
$ |
|
|
|
$ |
|
|
|
$ |
( |
) |
|
$ |
( |
) |
|
$ |
|
|
|
$ |
|
|
|
|
Net income |
|
|
— |
|
|
|
— |
|
|
|
— |
|
|
|
— |
|
|
|
— |
|
|
|
|
|
|
|
|
|
|
|
Change in unrecognized gains/losses on derivative instruments, net of tax |
|
|
— |
|
|
|
— |
|
|
|
|
|
|
|
— |
|
|
|
— |
|
|
|
— |
|
|
|
|
|
|
|
Change in employee benefit plans, net of taxes |
|
|
— |
|
|
|
— |
|
|
|
— |
|
|
|
|
|
|
|
— |
|
|
|
— |
|
|
|
|
|
|
|
Net foreign currency translation adjustment |
|
|
— |
|
|
|
— |
|
|
|
— |
|
|
|
— |
|
|
|
|
|
|
|
— |
|
|
|
|
|
|
|
Common stock issued, net of shares withheld for employee taxes |
|
|
|
|
|
|
— |
|
|
|
— |
|
|
|
— |
|
|
|
— |
|
|
|
— |
|
|
|
— |
|
|
|
Stock-based compensation |
|
|
— |
|
|
|
|
|
|
|
— |
|
|
|
— |
|
|
|
— |
|
|
|
— |
|
|
|
|
|
|
|
Cash dividend declared ($ share) |
|
|
— |
|
|
|
— |
|
|
|
— |
|
|
|
— |
|
|
|
— |
|
|
|
(2,259 |
) |
|
|
(2,259 |
) |
|
|
Redeemable preferred dividend and accretion |
|
|
— |
|
|
|
— |
|
|
|
— |
|
|
|
— |
|
|
|
— |
|
|
|
( |
) |
|
|
( |
) |
|
|
European non-controlling redeemable equity dividend |
|
|
— |
|
|
|
— |
|
|
|
— |
|
|
|
— |
|
|
|
— |
|
|
|
( |
) |
|
|
( |
) |
|
|
BALANCE AT JUNE 30, 2019 |
|
|
|
|
|
$ |
|
|
|
$ |
|
|
|
$ |
( |
) |
|
$ |
( |
) |
|
$ |
|
|
|
$ |
|
|
|
5
For the six months ended June 30, 2020
|
(Unaudited) |
|
Common Stock |
|
|
Accumulated Other Comprehensive (Loss) Income |
|
|
|
|
|
|
|
|
|
|
||||||||||||||
|
|
|
Number of Shares |
|
|
Amount |
|
|
Unrecognized Gains (Losses) on Derivative Instruments |
|
|
Pension Obligations |
|
|
Cumulative Translation Adjustment |
|
|
Retained Earnings |
|
|
Total |
|
|
|||||||
|
BALANCE AT DECEMBER 31, 2019 |
|
|
|
|
|
$ |
|
|
|
$ |
|
|
|
$ |
( |
) |
|
$ |
( |
) |
|
$ |
|
|
|
$ |
|
|
|
|
Net (loss) |
|
|
— |
|
|
|
— |
|
|
|
— |
|
|
|
— |
|
|
|
— |
|
|
|
( |
) |
|
|
( |
) |
|
|
Change in unrecognized gains/losses on derivative instruments, net of tax |
|
|
— |
|
|
|
— |
|
|
|
( |
) |
|
|
— |
|
|
|
— |
|
|
|
— |
|
|
|
( |
) |
|
|
Change in employee benefit plans, net of taxes |
|
|
— |
|
|
|
— |
|
|
|
— |
|
|
|
|
|
|
|
— |
|
|
|
— |
|
|
|
|
|
|
|
Net foreign currency translation adjustment |
|
|
— |
|
|
|
— |
|
|
|
— |
|
|
|
— |
|
|
|
( |
) |
|
|
— |
|
|
|
( |
) |
|
|
Common stock issued, net of shares withheld for employee taxes |
|
|
|
|
|
|
— |
|
|
|
— |
|
|
|
— |
|
|
|
— |
|
|
|
— |
|
|
|
— |
|
|
|
Stock-based compensation |
|
|
— |
|
|
|
|
|
|
|
— |
|
|
|
— |
|
|
|
— |
|
|
|
— |
|
|
|
|
|
|
|
Redeemable preferred |
|
|
— |
|
|
|
— |
|
|
|
— |
|
|
|
— |
|
|
|
— |
|
|
|
( |
) |
|
|
( |
) |
|
|
European non-controlling redeemable equity dividend |
|
|
— |
|
|
|
— |
|
|
|
— |
|
|
|
— |
|
|
|
— |
|
|
|
( |
) |
|
|
( |
) |
|
|
BALANCE AT JUNE 30, 2020 |
|
|
|
|
|
$ |
|
|
|
$ |
( |
) |
|
$ |
( |
) |
|
$ |
( |
) |
|
$ |
|
|
|
$ |
( |
) |
|
|
|
|
|
|
|
|
|
|
|
|
|
|
|
|
|
|
|
|
|
|
|
|
|
|
|
|
|
|
|
|
|
For the three months ended June 30, 2020 |
|
|
|
|
|
|
|
|
|
|
|
|
|
|
|
|
|
|
|
|
|
|
|
|
|
|
|||
|
|
|
|
|
|
|
|
|
|
|
|
|
|
|
|
|
|
|
|
|
|
|
|
|
|
|
|
|
|
|
|
(Unaudited) |
|
Common Stock |
|
|
Accumulated Other Comprehensive (Loss) Income |
|
|
|
|
|
|
|
|
|
|
||||||||||||||
|
|
|
Number of Shares |
|
|
Amount |
|
|
Unrecognized Gains (Losses) on Derivative Instruments |
|
|
Pension Obligations |
|
|
Cumulative Translation Adjustment |
|
|
Retained Earnings |
|
|
Total |
|
|
|||||||
|
BALANCE AT MARCH 31, 2020 |
|
|
|
|
|
$ |
|
|
|
$ |
( |
) |
|
$ |
( |
) |
|
$ |
( |
) |
|
$ |
|
|
|
$ |
( |
) |
|
|
Net (loss) |
|
|
— |
|
|
|
— |
|
|
|
— |
|
|
|
— |
|
|
|
— |
|
|
|
( |
) |
|
|
( |
) |
|
|
Change in unrecognized gains/losses on derivative instruments, net of tax |
|
|
— |
|
|
|
— |
|
|
|
|
|
|
|
— |
|
|
|
— |
|
|
|
— |
|
|
|
|
|
|
|
Change in employee benefit plans, net of taxes |
|
|
— |
|
|
|
— |
|
|
|
— |
|
|
|
|
|
|
|
— |
|
|
|
— |
|
|
|
|
|
|
|
Net foreign currency translation adjustment |
|
|
— |
|
|
|
— |
|
|
|
— |
|
|
|
— |
|
|
|
|
|
|
|
— |
|
|
|
|
|
|
|
Common stock issued, net of shares withheld for employee taxes |
|
|
|
|
|
|
— |
|
|
|
— |
|
|
|
— |
|
|
|
— |
|
|
|
— |
|
|
|
— |
|
|
|
Stock-based compensation |
|
|
— |
|
|
|
|
|
|
|
— |
|
|
|
— |
|
|
|
— |
|
|
|
— |
|
|
|
|
|
|
|
Redeemable preferred |
|
|
— |
|
|
|
— |
|
|
|
— |
|
|
|
— |
|
|
|
— |
|
|
|
( |
) |
|
|
( |
) |
|
|
European non-controlling redeemable equity dividend |
|
|
— |
|
|
|
— |
|
|
|
— |
|
|
|
— |
|
|
|
— |
|
|
|
( |
) |
|
|
( |
) |
|
|
BALANCE AT JUNE 30, 2020 |
|
|
|
|
|
$ |
|
|
|
$ |
( |
) |
|
$ |
( |
) |
|
$ |
( |
) |
|
$ |
|
|
|
$ |
( |
) |
|
The accompanying unaudited notes are an integral part of these condensed consolidated financial statements.
6
Superior Industries International, Inc.
Notes to Condensed Consolidated Financial Statements
June 30, 2020
(Unaudited)
NOTE 1 – NATURE OF OPERATIONS AND PRESENTATION OF CONDENSED CONSOLIDATED FINANCIAL STATEMENTS
Nature of Operations
Superior Industries International, Inc.’s (referred herein as the “Company,” “Superior,” or “we” and “our”) principal business is the design and manufacture of aluminum wheels for sale to original equipment manufacturers (OEMs) in North America and Europe and aftermarket distributors in Europe. We employ approximately
Presentation of Condensed Consolidated Financial Statements
The accompanying unaudited condensed consolidated financial statements have been prepared in accordance with the SEC’s requirements for quarterly reports on Form 10-Q and U.S. Generally Accepted Accounting Principles (“GAAP”) and, in our opinion, contain all adjustments, of a normal and recurring nature, which are necessary for fair presentation of (i) the condensed consolidated statements of income (loss) for the three and six-month periods ended June 30, 2020 and June 30, 2019, (ii) the condensed consolidated statements of comprehensive income (loss) for the three and six-month periods ended June 30, 2020 and June 30, 2019, (iii) the condensed consolidated balance sheets at June 30, 2020 and December 31, 2019, (iv) the condensed consolidated statements of cash flows for the six-month periods ended June 30, 2020 and June 30, 2019, and (v) the condensed consolidated statements of shareholders’ equity (deficit) for the three and six-month periods ended June 30, 2020 and June 30, 2019. This Quarterly Report on Form 10-Q should be read in conjunction with our consolidated financial statements and notes thereto filed with the Securities and Exchange Commission (“SEC”) in our 2019 Annual Report on Form 10-K.
Interim financial reporting standards require us to make estimates that are based on assumptions regarding the outcome of future events and circumstances not known at that time, including the use of estimated effective tax rates. Inevitably, some assumptions will not materialize, unanticipated events or circumstances may occur which vary from those estimates and such variations may significantly affect our future results. Additionally, interim results may not be indicative of our results for future interim periods or our annual results.
Certain prior year amounts have been reclassified to conform with the current year presentation.
Cash Paid for Interest and Taxes and Non-Cash Investing Activities
Cash paid for interest was $
New Accounting Standards
Accounting Standards Update (“ASU”) 2018-13, “Fair Value Measurement.” Effective January 1, 2020, the Company adopted ASU 2018-13 which allows companies to remove, modify and add certain disclosures related to fair value measurements. The adoption of this standard did not have a significant impact on the Company’s condensed consolidated financial statement disclosures.
7
Accounting Standards Issued but Not Yet Adopted
ASU 2016-13, “Financial Instruments – Credit Losses (Topic 326): Measurement of Credit Losses on Financial Instruments.” In June 2016, the Financial Accounting Standards Board (“FASB”) issued ASU 2016-13, "Financial Instruments – Credit Losses (Topic 326): Measurement of Credit Losses on Financial Instruments" (ASU 2016-13), which requires entities to use a new impairment model based on current expected credit losses (“CECL”) rather than incurred losses. Under CECL, estimated credit losses would incorporate relevant information about past events, current conditions and reasonable and supportable forecasts and any expected credit losses would be recognized at the time of sale. As a smaller reporting company (as defined under SEC regulations), the Company is not required to adopt the new standard until fiscal years beginning after December 31, 2022. We are evaluating the impact this new standard will have on our financial statements and disclosures.
ASU 2018-14, “Compensation - Retirement Benefits - Defined Benefit Plans.” In August 2018, the FASB issued an ASU entitled “Compensation - Retirement Benefits - Defined Benefit Plans - General Subtopic 715-20 - Disclosure Framework - Changes to the Disclosure Requirements for Defined Benefit Plans” (ASU 2018-14), which is designed to improve the effectiveness of disclosures by removing and adding disclosures related to defined benefit plans. ASU 2018-14 is effective for fiscal years ending after December 15, 2020. We are evaluating the impact this new standard will have on our financial statement disclosures.
ASU 2020-04, “Reference Rate Reform (Topic 848): Facilitation of the Effects of Reference Rate Reform on Financial Reporting.” In March 2020, the FASB issued ASU 2020-04 entitled “Reference Rate Reform (Topic 848): Facilitation of the Effects of Reference Rate Reform on Financial Reporting,” which provides temporary optional guidance to ease the potential burden in accounting for (or recognizing the effects of) reference rate reform on financial reporting. The relief provided by this guidance is elective and applies to all entities, subject to meeting certain criteria, that have contracts, hedging relationships, and other transactions that reference the London Interbank Offered Rate (“LIBOR”) or another reference rate expected to be discontinued because of reference rate reform initiatives being undertaken in an effort to identify alternative reference rates that are more observable or transaction based and less susceptible to manipulation. The optional amendments of this guidance are effective for all entities upon adoption. We are currently assessing the impact of this new standard on our financial statements and disclosures.
NOTE 2 – REVENUE
In accordance with ASC 606, “Revenue from Contracts with Customers,” the Company disaggregates revenue from contracts with customers into our operating segments, North America and Europe. Revenues by segment for the three and six-month periods ended June 30, 2020 and 2019 are summarized in Note 5, “Business Segments.”
The Company’s customer receivables and current and long-term contract liabilities balances as of June 30, 2020 and December 31, 2019 are as follows (in thousands):
|
|
|
June 30, 2020 |
|
|
December 31, 2019 |
|
|
Change |
|
|||
|
Customer receivables |
|
$ |
|
|
|
$ |
|
|
|
$ |
( |
) |
|
Contract liabilities—current |
|
|
|
|
|
|
|
|
|
|
|
|
|
Contract liabilities—noncurrent |
|
|
|
|
|
|
|
|
|
|
|
|
NOTE 3 – FAIR VALUE MEASUREMENTS
The Company applies fair value accounting for all financial assets and liabilities and non-financial assets and liabilities that are recognized or disclosed at fair value in the financial statements on a recurring basis, while other assets and liabilities are measured at fair value on a nonrecurring basis, such as an asset impairment. Fair value is estimated by applying the following hierarchy, which prioritizes the inputs used to measure fair value into three levels and bases the categorization within the hierarchy upon the lowest level of input that is available and significant to the fair value measurement:
Level 1 - Quoted prices in active markets for identical assets or liabilities.
Level 2 - Observable inputs other than quoted prices in active markets for identical assets and liabilities, quoted prices for identical or similar assets or liabilities in inactive markets, or other inputs that are observable or can be corroborated by observable market data for substantially the full term of the assets or liabilities.
Level 3 - Inputs that are generally unobservable and typically reflect management’s estimate of assumptions that market participants would use in pricing the asset or liability.
8
The carrying amounts for cash and cash equivalents, accounts receivable, accounts payable and accrued expenses approximate their fair values due to the short period of time until maturity.
Cash and Cash Equivalents
Cash and cash equivalents generally consist of cash, certificates of deposit and fixed deposits and money market funds with original maturities of three months or less.
Derivative Financial Instruments
Our derivatives are over-the-counter customized derivative transactions and are not exchange traded. We estimate the fair value of these instruments using industry-standard valuation models such as discounted cash flow. These models project future cash flows and discount the future amounts to a present value using market-based expectations for interest rates, foreign exchange rates, commodity prices and the contractual terms of the derivative instruments. The discount rate used is the relevant interbank deposit rate (e.g., LIBOR) plus an adjustment for non-performance risk. In certain cases, market data may not be available and we may use broker quotes and models to determine fair value. This includes situations where there is lack of liquidity for a particular currency or commodity or when the instrument is longer dated.
The following tables categorize items measured at fair value at June 30, 2020 and December 31, 2019:
|
|
|
|
|
|
|
Fair Value Measurement at Reporting Date Using |
|
|||||||||
|
June 30, 2020 |
|
|
|
|
|
Quoted Prices in Active Markets for Identical Assets (Level 1) |
|
|
Significant Other Observable Inputs (Level 2) |
|
|
Significant Unobservable Inputs (Level 3) |
|
|||
|
(Dollars in thousands) |
|
|
|
|
|
|
|
|
|
|
|
|
|
|
|
|
|
Assets |
|
|
|
|
|
|
|
|
|
|
|
|
|
|
|
|
|
Derivative contracts |
|
$ |
|
|
|
$ |
— |
|
|
$ |
|
|
|
$ |
— |
|
|
Total |
|
$ |
|
|
|
$ |
— |
|
|
$ |
|
|
|
$ |
— |
|
|
Liabilities |
|
|
|
|
|
|
|
|
|
. |
|
|
|
|
|
|
|
Derivative contracts |
|
$ |
|
|
|
$ |
— |
|
|
$ |
|
|
|
$ |
— |
|
|
Total |
|
$ |
|
|
|
$ |
— |
|
|
$ |
|
|
|
$ |
— |
|
|
|
|
|
|
|
|
Fair Value Measurement at Reporting Date Using |
|
|||||||||
|
December 31, 2019 |
|
|
|
|
|
Quoted Prices in Active Markets for Identical Assets (Level 1) |
|
|
Significant Other Observable Inputs (Level 2) |
|
|
Significant Unobservable Inputs (Level 3) |
|
|||
|
(Dollars in thousands) |
|
|
|
|
|
|
|
|
|
|
|
|
|
|
|
|
|
Assets |
|
|
|
|
|
|
|
|
|
|
|
|
|
|
|
|
|
Derivative contracts |
|
$ |
|
|
|
$ |
— |
|
|
$ |
|
|
|
$ |
— |
|
|
Total |
|
$ |
|
|
|
$ |
— |
|
|
$ |
|
|
|
$ |
— |
|
|
Liabilities |
|
|
|
|
|
|
|
|
|
|
|
|
|
|
|
|
|
Derivative contracts |
|
$ |
|
|
|
$ |
— |
|
|
$ |
|
|
|
$ |
— |
|
|
Total |
|
$ |
|
|
|
$ |
— |
|
|
$ |
|
|
|
$ |
— |
|
9
Debt Instruments
The carrying values of the Company’s debt instruments vary from their fair values. The fair values were determined by reference to transacted prices of these securities (Level 2 input based on the U.S. GAAP fair value hierarchy).
|
|
|
June 30, 2020 |
|
|
December 31, 2019 |
|
||
|
(Dollars in thousands) |
|
|
|
|
|
|
|
|
|
Estimated aggregate fair value |
|
$ |
|
|
|
$ |
|
|
|
Aggregate carrying value (1) |
|
|
|
|
|
|
|
|
|
(1) |
Long-term debt excluding the impact of unamortized debt issuance costs. |
NOTE 4 - DERIVATIVE FINANCIAL INSTRUMENTS
Derivative Instruments and Hedging Activities
To help protect gross margins from fluctuations in foreign currency exchange rates, certain of our subsidiaries, whose functional currency is the U.S. dollar or the Euro, hedge a portion of their forecasted foreign currency costs denominated in the Mexican Peso and Polish Zloty, respectively. We may hedge portions of our forecasted foreign currency exposure up to
We record all derivatives in the condensed consolidated balance sheets at fair value. Our accounting treatment for these instruments is based on the hedge designation. Gains or losses on derivatives that are designated as hedging instruments are recorded in accumulated other comprehensive income (loss) (“AOCI”) until the hedged item is recognized in earnings, at which point accumulated gains or losses will be recognized in earnings and classified with the underlying hedged transaction.
The following tables display the fair value of derivatives by balance sheet line item at June 30, 2020 and December 31, 2019:
|
|
|
June 30, 2020 |
|
|||||||||||||
|
|
|
Other Current Assets |
|
|
Other Non-current Assets |
|
|
Accrued Liabilities |
|
|
Other Non-current Liabilities |
|
||||
|
(Dollars in thousands) |
|
|
|
|
|
|
|
|
|
|
|
|
|
|
|
|
|
Foreign exchange forward contracts designated as hedging instruments |
|
$ |
|
|
|
$ |
|
|
|
$ |
|
|
|
$ |
|
|
|
Foreign exchange forward contracts not designated as hedging instruments |
|
|
|
|
|
|
— |
|
|
|
|
|
|
|
— |
|
|
Aluminum forward contracts designated as hedging instruments |
|
|
— |
|
|
|
— |
|
|
|
|
|
|
|
— |
|
|
Natural gas forward contracts designated as hedging instruments |
|
|
|
|
|
|
|
|
|
|
|
|
|
|
|
|
|
Interest rate swap contracts designated as hedging instruments |
|
|
— |
|
|
|
— |
|
|
|
|
|
|
|
|
|
|
Total derivative financial instruments |
|
$ |
|
|
|
$ |
|
|
|
$ |
|
|
|
$ |
|
|
10
|
|
|
December 31, 2019 |
|
|||||||||||||
|
|
|
Other Current Assets |
|
|
Other Non-current Assets |
|
|
Accrued Liabilities |
|
|
Other Non-current Liabilities |
|
||||
|
(Dollars in thousands) |
|
|
|
|
|
|
|
|
|
|
|
|
|
|
|
|
|
Foreign exchange forward contracts designated as hedging instruments |
|
$ |
|
|
|
$ |
|
|
|
$ |
|
|
|
$ |
|
|
|
Foreign exchange forward contracts not designated as hedging instruments |
|
|
|
|
|
|
— |
|
|
|
|
|
|
|
— |
|
|
Aluminum forward contracts designated as hedging instruments |
|
|
|
|
|
|
— |
|
|
|
|
|
|
|
— |
|
|
Natural gas forward contracts designated as hedging instruments |
|
|
|
|
|
|
|
|
|
|
|
|
|
|
|
|
|
Interest rate swap contracts designated as hedging instruments |
|
|
— |
|
|
|
— |
|
|
|
|
|
|
|
|
|
|
Total derivative financial instruments |
|
$ |
|
|
|
$ |
|
|
|
$ |
|
|
|
$ |
|
|
The following table summarizes the notional amount and estimated fair value of our derivative financial instruments:
|
|
|
June 30, 2020 |
|
|
December 31, 2019 |
|
||||||||||
|
|
|
Notional U.S. Dollar Amount |
|
|
Fair Value |
|
|
Notional U.S. Dollar Amount |
|
|
Fair Value |
|
||||
|
(Dollars in thousands) |
|
|
|
|
|
|
|
|
|
|
|
|
|
|
|
|
|
Foreign currency forward contracts designated as hedging instruments |
|
$ |
|
|
|
$ |
( |
) |
|
$ |
|
|
|
$ |
|
|
|
Foreign exchange forward contracts not designated as hedging instruments |
|
|
|
|
|
|
|
|
|
|
|
|
|
|
|
|
|
Aluminum forward contracts designated as hedging instruments |
|
|
|
|
|
|
( |
) |
|
|
|
|
|
|
( |
) |
|
Natural gas forward contracts designated as hedging instruments |
|
|
|
|
|
|
( |
) |
|
|
|
|
|
|
( |
) |
|
Interest rate swap contracts designated as hedging instruments |
|
|
|
|
|
|
( |
) |
|
|
|
|
|
|
( |
) |
|
Total derivative financial instruments |
|
$ |
|
|
|
$ |
( |
) |
|
$ |
|
|
|
$ |
|
|
Notional amounts are presented on a net basis. The notional amounts of the derivative financial instruments do not represent amounts exchanged by the parties and, therefore, are not a direct measure of our exposure to the financial risks. The amounts exchanged are calculated by reference to the notional amounts and by other terms of the derivatives, such as interest rates, foreign currency exchange rates or commodity prices.
11
The following tables summarize the gain or loss recognized in AOCI as of June 30, 2020 and 2019, the amounts reclassified from AOCI into earnings and the amounts recognized directly into earnings for the three and six months ended June 30, 2020 and 2019:
|
Three Months Ended June 30, 2020 |
|
Amount of Gain or (Loss) Recognized in AOCI on Derivatives |
|
|
Amount of Pre-tax Gain or (Loss) Reclassified from AOCI into Income |
|
|
Amount of Pre-tax Gain or (Loss) Recognized in Income on Derivatives |
|
|||
|
(Dollars in thousands) |
|
|
|
|
|
|
|
|
|
|
|
|
|
Derivative Contracts |
|
$ |
|
|
|
$ |
( |
) |
|
$ |
|
|
|
Total |
|
$ |
|
|
|
$ |
( |
) |
|
$ |
|
|
|
|
|
|
|
|
|
|
|
|
|
|
|
|
|
Six Months Ended June 30, 2020 |
|
Amount of Gain or (Loss) Recognized in AOCI on Derivatives |
|
|
Amount of Pre-tax Gain or (Loss) Reclassified from AOCI into Income |
|
|
Amount of Pre-tax Gain or (Loss) Recognized in Income on Derivatives |
|
|||
|
(Dollars in thousands) |
|
|
|
|
|
|
|
|
|
|
|
|
|
Derivative Contracts |
|
$ |
( |
) |
|
$ |
( |
) |
|
$ |
( |
) |
|
Total |
|
$ |
( |
) |
|
$ |
( |
) |
|
$ |
( |
) |
|
Three Months Ended June 30, 2019 |
|
Amount of Gain or (Loss) Recognized in AOCI on Derivatives |
|
|
Amount of Pre-tax Gain or (Loss) Reclassified from AOCI into Income |
|
|
Amount of Pre-tax Gain or (Loss) Recognized in Income on Derivatives |
|
|||
|
(Dollars in thousands) |
|
|
|
|
|
|
|
|
|
|
|
|
|
Derivative Contracts |
|
$ |
|
|
|
$ |
|
|
|
$ |
|
|
|
Total |
|
$ |
|
|
|
$ |
|
|
|
$ |
|
|
|
|
|
|
|
|
|
|
|
|
|
|
|
|
|
Six Months Ended June 30, 2019 |
|
Amount of Gain or (Loss) Recognized in AOCI on Derivatives |
|
|
Amount of Pre-tax Gain or (Loss) Reclassified from AOCI into Income |
|
|
Amount of Pre-tax Gain or (Loss) Recognized in Income on Derivatives |
|
|||
|
(Dollars in thousands) |
|
|
|
|
|
|
|
|
|
|
|
|
|
Derivative Contracts |
|
$ |
|
|
|
$ |
|
|
|
$ |
|
|
|
Total |
|
$ |
|
|
|
$ |
|
|
|
$ |
|
|
NOTE 5 - BUSINESS SEGMENTS
The North American and European businesses represent separate operating segments in view of significantly different markets, customers and products in each of these regions. Within each of these regions, markets, customers, products and production processes are similar and production can be transferred between production facilities. Moreover, our business within each region leverages common systems, processes and infrastructure. Accordingly, North America and Europe comprise the Company’s reportable segments.
|
(Dollars in thousands) |
|
Net Sales |
|
|
Income from Operations |
|
||||||||||
|
Three Months Ended |
|
June 30, 2020 |
|
|
June 30, 2019 |
|
|
June 30, 2020 |
|
|
June 30, 2019 |
|
||||
|
North America |
|
$ |
|
|
|
$ |
|
|
|
$ |
( |
) |
|
$ |
|
|
|
Europe |
|
|
|
|
|
|
|
|
|
|
( |
) |
|
|
|
|
|
|
|
$ |
|
|
|
$ |
|
|
|
$ |
( |
) |
|
$ |
|
|
|
|
|
|
|
|
|
|
|
|
|
|
|
|
|
|
|
|
|
(Dollars in thousands) |
|
Depreciation and Amortization |
|
|
Capital Expenditures |
|
||||||||||
|
Three Months Ended |
|
June 30, 2020 |
|
|
June 30, 2019 |
|
|
June 30, 2020 |
|
|
June 30, 2019 |
|
||||
|
North America |
|
$ |
|
|
|
$ |
|
|
|
$ |
|
|
|
$ |
|
|
|
Europe |
|
|
|
|
|
|
|
|
|
|
|
|
|
|
|
|
|
|
|
$ |
|
|
|
$ |
|
|
|
$ |
|
|
|
$ |
|
|
12
|
(Dollars in thousands) |
|
Net Sales |
|
|
Income from Operations |
|
||||||||||
|
Six Months Ended |
|
June 30, 2020 |
|
|
June 30, 2019 |
|
|
June 30, 2020 |
|
|
June 30, 2019 |
|
||||
|
North America |
|
$ |
|
|
|
$ |
|
|
|
$ |
( |
) |
|
$ |
|
|
|
Europe |
|
|
|
|
|
|
|
|
|
|
( |
) |
|
|
|
|
|
|
|
$ |
|
|
|
$ |
|
|
|
$ |
( |
) |
|
$ |
|
|
|
|
|
|
|
|
|
|
|
|
|
|
|
|
|
|
|
|
|
(Dollars in thousands) |
|
Depreciation and Amortization |
|
|
Capital Expenditures |
|
||||||||||
|
Six Months Ended |
|
June 30, 2020 |
|
|
June 30, 2019 |
|
|
June 30, 2020 |
|
|
June 30, 2019 |
|
||||
|
North America |
|
$ |
|
|
|
$ |
|
|
|
$ |
|
|
|
$ |
|
|
|
Europe |
|
|
|
|
|
|
|
|
|
|
|
|
|
|
|
|
|
|
|
$ |
|
|
|
$ |
|
|
|
$ |
|
|
|
$ |
|
|
|
(Dollars in thousands) |
|
Property, Plant and Equipment, net |
|
|
Goodwill and Intangible Assets |
|
||||||||||
|
|
|
June 30, 2020 |
|
|
December 31, 2019 |
|
|
June 30, 2020 |
|
|
December 31, 2019 |
|
||||
|
North America |
|
$ |
|
|
|
$ |
|
|
|
$ |
— |
|
|
$ |
— |
|
|
Europe |
|
|
|
|
|
|
|
|
|
|
|
|
|
|
|
|
|
|
|
$ |
|
|
|
$ |
|
|
|
$ |
|
|
|
$ |
|
|
|
(Dollars in thousands) |
|
Total Assets |
|
|||||
|
|
|
June 30, 2020 |
|
|
December 31, 2019 |
|
||
|
North America |
|
$ |
|
|
|
$ |
|
|
|
Europe |
|
|
|
|
|
|
|
|
|
|
|
$ |
|
|
|
$ |
|
|
Geographic information
Net sales by geographic location are as follows:
|
|
|
Three Months Ended |
|
|
Six Months Ended |
|
|
||||||||||
|
|
|
June 30, 2020 |
|
|
June 30, 2019 |
|
|
June 30, 2020 |
|
|
June 30, 2019 |
|
|
||||
|
(Dollars in thousands) |
|
|
|
|
|
|
|
|
|
|
|
|
|
|
|
|
|
|
Net sales: |
|
|
|
|
|
|
|
|
|
|
|
|
|
|
|
|
|
|
U.S. |
|
$ |
|
|
|
$ |
|
|
|
$ |
|
|
|
$ |
|
|
|
|
Mexico |
|
|
|
|
|
|
|
|
|
|
|
|
|
|
|
|
|
|
Germany |
|
|
|
|
|
|
|
|
|
|
|
|
|
|
|
|
|
|
Poland |
|
|
|
|
|
|
|
|
|
|
|
|
|
|
|
|
|
|
Consolidated net sales |
|
$ |
|
|
|
$ |
|
|
|
$ |
|
|
|
$ |
|
|
|
NOTE 6 - INVENTORIES
|
|
|
June 30, 2020 |
|
|
December 31, 2019 |
|
||
|
(Dollars in thousands) |
|
|
|
|
|
|
|
|
|
Raw materials |
|
$ |
|
|
|
$ |
|
|
|
Work in process |
|
|
|
|
|
|
|
|
|
Finished goods |
|
|
|
|
|
|
|
|
|
Inventories, net |
|
$ |
|
|
|
$ |
|
|
Service wheel and supplies inventory included in other non-current assets in the condensed consolidated balance sheets totaled $
13
NOTE 7 - PROPERTY, PLANT AND EQUIPMENT
|
|
|
June 30, 2020 |
|
|
December 31, 2019 |
|
||
|
(Dollars in thousands) |
|
|
|
|
|
|
|
|
|
Land and buildings |
|
$ |
|
|
|
$ |
|
|
|
Machinery and equipment |
|
|
|
|
|
|
|
|
|
Leasehold improvements and others |
|
|
|
|
|
|
|
|
|
Construction in progress |
|
|
|
|
|
|
|
|
|
|
|
|
|
|
|
|
|
|
|
Accumulated depreciation |
|
|
( |
) |
|
|
( |
) |
|
Property, plant and equipment, net |
|
$ |
|
|
|
$ |
|
|
Depreciation expense for the three and six months ended June 30, 2020 was $
NOTE 8 - GOODWILL AND OTHER INTANGIBLE ASSETS
At March 31, 2020, the impact of COVID-19 and uncertainty with respect to the economic effects of the pandemic had introduced significant volatility in the financial markets and was having, and continues to have, a widespread adverse effect on the automotive industry, including reductions in both consumer demand and OEM automotive production. In response to the COVID-19 pandemic, our key customers temporarily closed nearly all their production facilities in Europe and North America (our primary markets) during the quarter ended March 31, 2020. As a result, we concluded that an interim test of our goodwill was required as of March 31, 2020. More specifically, the Company concluded that the following events and circumstances, in the aggregate, indicated that it was more likely than not that the carrying value of our European reporting unit exceeded its fair value: (1) our European reporting unit’s carrying value was effectively set to fair value at December 31, 2019, due to the $
We utilized both an income and a market approach, weighted
At March 31, 2020, we determined that the carrying value of the European reporting unit exceeded its fair value by an amount greater than the remaining goodwill balance. The decline in fair value was primarily due to significantly lower market multiples and increased discount rates, as well as further declines in forecasted industry production volumes in Western and Central Europe as a result of the COVID-19 pandemic and consequent economic instability. Forecasted revenues, EBITDA and cash flow for the European reporting unit also declined as compared to the prior year long-range plan due to lower forecasted industry production volumes which adversely impacted fair value under both the income and market approaches. In determining the fair value, the Company weighted the income and market approaches,
14
weighted average cost of capital (WACC) of
|
As of June 30, 2020 |
|
Gross Carrying Amount |
|
|
Impairment |
|
|
Accumulated Amortization |
|
|
Currency Translation |
|
|
Net Carrying Amount |
|
|
Remaining Weighted Average Amortization Period |
|||||
|
(Dollars in thousands) |
|
|
|
|
|
|
|
|
|
|
|
|
|
|
|
|
|
|
|
|
|
|
|
Brand name |
|
$ |
|
|
|
$ |
— |
|
|
$ |
( |
) |
|
$ |
|
|
|
$ |
|
|
|
|
|
Technology |
|
|
|
|
|
|
— |
|
|
|
( |
) |
|
|
|
|
|
|
|
|
|
|
|
Customer relationships |
|
|
|
|
|
|
— |
|
|
|
( |
) |
|
|
|
|
|
|
|
|
|
|
|
Total finite |
|
|
|
|
|
|
— |
|
|
|
( |
) |
|
|
|
|
|
|
|
|
|
|
|
Trade names |
|
|
|
|
|
|
( |
) |
|
|
— |
|
|
|
( |
) |
|
|
— |
|
|
Indefinite |
|
Total intangibles |
|
$ |
|
|
|
$ |
( |
) |
|
$ |
( |
) |
|
$ |
|
|
|
$ |
|
|
|
|
|
Six Months Ended June 30, 2020 |
|
Beginning Balance |
|
|
|
|
|
|
|
|
|
|
Ending Balance |
|
||||||||||||||||||
|
|
|
Gross |
|
|
Accumulated Impairment |
|
|
Net Balance |
|
|
Impairment |
|
|
Currency Translation |
|
|
Gross |
|
|
Accumulated Impairment |
|
|
Net Balance |
|
||||||||
|
(Dollars in thousands) |
|
|
|
|
|
|
|
|
|
|
|
|
|
|
|
|
|
|
|
|
|
|
|
|
|
|
|
|
|
|
|
|
|
Goodwill |
|
$ |
|
|
|
$ |
( |
) |
|
$ |
|
|
|
$ |
( |
) |
|
$ |
( |
) |
|
$ |
|
|
|
$ |
( |
) |
|
$ |
— |
|
|
As of December 31, 2019 |
|
Gross Carrying Amount |
|
|
Impairment |
|
|
Accumulated Amortization |
|
|
Currency Translation |
|
|
Net Carrying Amount |
|
|
Remaining Weighted Average Amortization Period |
|||||
|
(Dollars in thousands) |
|
|
|
|
|
|
|
|
|
|
|
|
|
|
|
|
|
|
|
|
|
|
|
Brand name |
|
$ |
|
|
|
$ |
— |
|
|
$ |
( |
) |
|
$ |
|
|
|
$ |
|
|
|
|
|
Technology |
|
|
|
|
|
|
— |
|
|
|
( |
) |
|
|
|
|
|
|
|
|
|
|
|
Customer relationships |
|
|
|
|
|
|
— |
|
|
|
( |
) |
|
|
|
|
|
|
|
|
|
|
|
Total finite |
|
|
|
|
|
|
— |
|
|
|
( |
) |
|
|
|
|
|
|
|
|
|
|
|
Trade names |
|
|
|
|
|
|
( |
) |
|
|
— |
|
|
|
( |
) |
|
|
|
|
|
Indefinite |
|
Total intangibles |
|
$ |
|
|
|
$ |
( |
) |
|
$ |
( |
) |
|
$ |
|
|
|
$ |
|
|
|
|
|
Year Ended December 31, 2019 |
|
Beginning Balance |
|
|
|
|
|
|
|
|
|
|
Ending Balance |
|
||||||||||||||||||
|
|
|
Gross |
|
|
Accumulated Impairment |
|
|
Net Balance |
|
|
Impairment |
|
|
Currency Translation |
|
|
Gross |
|
|
Accumulated Impairment |
|
|
Net Balance |
|
||||||||
|
(Dollars in thousands) |
|
|
|
|
|
|
|
|
|
|
|
|
|
|
|
|
|
|
|
|
|
|
|
|
|
|
|
|
|
|
|
|
|
Goodwill |
|
$ |
|
|
|
$ |
— |
|
|
$ |
|
|
|
$ |
( |
) |
|
$ |
( |
) |
|
$ |
|
|
|
$ |
( |
) |
|
$ |
|
|
Amortization expense for these intangible assets was $
15
NOTE 9 – DEBT
A summary of long-term debt and the related weighted average interest rates is shown below:
|
|
|
June 30, 2020 (Dollars in Thousands) |
|
|||||||||||||
|
Debt Instrument |
|
Total Debt |
|
|
Debt Issuance Costs (1) |
|
|
Total Debt, Net |
|
|
Weighted Average Interest Rate |
|
||||
|
Term Loan Facility |
|
$ |
|
|
|
$ |
( |
) |
|
$ |
|
|
|
|
|
% |
|
|
|
|
|
|
|
|
( |
) |
|
|
|
|
|
|
|
% |
|
Corporate Revolving Credit Facility |
|
|
|
|
|
|
— |
|
|
|
|
|
|
|
|
% |
|
European CapEx Loans |
|
|
|
|
|
|
— |
|
|
|
|
|
|
|
|
% |
|
European Revolving Credit Facility |
|
|
|
|
|
|
— |
|
|
|
|
|
|
|
|
% |
|
Finance Leases |
|
|
|
|
|
|
— |
|
|
|
|
|
|
|
|
% |
|
|
|
$ |
|
|
|
$ |
( |
) |
|
|
|
|
|
|
|
|
|
Less: Current portion |
|
|
|
|
|
|
|
|
|
|
( |
) |
|
|
|
|
|
Long-term debt |
|
|
|
|
|
|
|
|
|
$ |
|
|
|
|
|
|
|
|
|
December 31, 2019 (Dollars in Thousands) |
|
|||||||||||||
|
Debt Instrument |
|
Total Debt |
|
|
Debt Issuance Costs (1) |
|
|
Total Debt, Net |
|
|
Weighted Average Interest Rate |
|
||||
|
Term Loan Facility |
|
$ |
|
|
|
$ |
( |
) |
|
$ |
|
|
|
|
|
% |
|
|
|
|
|
|
|
|
( |
) |
|
|
|
|
|
|
|
% |
|
European CapEx Loan |
|
|
|
|
|
|
— |
|
|
|
|
|
|
|
|
% |
|
Finance Leases |
|
|
|
|
|
|
— |
|
|
|
|
|
|
|
|
% |
|
|
|
$ |
|
|
|
$ |
( |
) |
|
|
|
|
|
|
|
|
|
Less: Current portion |
|
|
|
|
|
|
|
|
|
|
( |
) |
|
|
|
|
|
Long-term debt |
|
|
|
|
|
|
|
|
|
$ |
|
|
|
|
|
|
|
|
(1) |
Unamortized portion |
Senior Notes
On June 15, 2017, the Company issued €
During the second quarter of 2019, the Company opportunistically purchased Notes on the open market with a face value totaling
$
16
debt issuance cost, was $
Guarantee
The Notes are unconditionally guaranteed by all material wholly-owned direct and indirect domestic restricted subsidiaries of the Company (the “Subsidiary Guarantors”), with customary exceptions including, among other things, where providing such guarantees is not permitted by law, regulation or contract, or would result in adverse tax consequences.
Covenants
Subject to certain exceptions, the indenture governing the Notes contains restrictive covenants that, among other things, limit the ability of the Company and the Subsidiary Guarantors to: (i) incur additional indebtedness or issue certain preferred stock; (ii) pay dividends on, or make distributions in respect of, their capital stock; (iii) make certain investments or other restricted payments; (iv) sell certain assets or issue capital stock of restricted subsidiaries; (v) create liens; (vi) merge, consolidate, transfer or dispose of substantially all of their assets; and (vii) engage in certain transactions with affiliates. These covenants are subject to several important limitations and exceptions that are described in the indenture.
The indenture provides for customary events of default that include, among other things (subject in certain cases to customary grace and cure periods): (i) nonpayment of principal, premium, if any, and interest, when due; (ii) breach of covenants in the indenture; (iii) a failure to pay certain judgments; and (iv) certain events of bankruptcy and insolvency. If an event of default occurs and is continuing, the Bank of New York Mellon, London Branch (“the Trustee”) or holders of at least
Senior Secured Credit Facilities
On March 22, 2017, the Company entered into a senior secured credit agreement (“Credit Agreement”) with Citibank, N.A, as Administrative Agent, Collateral Agent and Issuing Bank, JP Morgan Chase N.A., Royal Bank of Canada and Deutsche Bank A.G. New York Branch as Joint Lead Arrangers and Joint Book Runners, and the other lenders party thereto (collectively, the “Lenders”). The Credit Agreement consisted of a $
Borrowings under the Term Loan Facility will bear interest at a rate equal to, at the Company’s option, either (a) LIBOR for the relevant interest period, adjusted for statutory requirements, subject to a floor of
17
Borrowings under the Revolving Credit Facility bear interest at a rate equal to, at the Company’s option, either (a) LIBOR for the relevant interest period, with a floor of 0.00 percent per annum, plus the applicable rate or (b) a base rate, with a floor of 0.00 percent, equal to the highest of (1) the rate of interest in effect as publicly announced by the administrative agent as its prime rate, (2) the federal funds effective rate plus 0.50 percent and (3) LIBOR for an interest period of one month plus 1.00 percent, in each case, plus the applicable rate. The applicable rates for borrowings under the Revolving Credit Facility and commitment fees for unused commitments under the Revolving Credit Facility are based upon the First Lien Net Leverage Ratio effective for the preceding quarter, with LIBOR applicable rates ranging between
As of June 30, 2020, the Company had repaid $
Guarantees and Collateral Security
Our obligations under the Credit Agreement are unconditionally guaranteed by the Subsidiary Guarantors, with customary exceptions including, among other things, where providing such guarantees is not permitted by law, regulation or contract or would result in adverse tax consequences. The guarantees of such obligations, will be secured, subject to permitted liens and other exceptions, by substantially all of our assets and the Subsidiary Guarantors’ assets, including but not limited to: (i) a perfected pledge of all of the capital stock issued by each of the Subsidiary Guarantors or any guarantor (subject to certain exceptions) and up to
Covenants
The Credit Agreement contains a number of restrictive covenants that, among other things, restrict, subject to certain exceptions, our ability to incur additional indebtedness and guarantee indebtedness, create or incur liens, engage in mergers or consolidations, sell, transfer or otherwise dispose of assets, make investments, acquisitions, loans or advances, pay dividends, distributions or other restricted payments, or repurchase our capital stock, prepay, redeem, or repurchase any subordinated indebtedness, enter into agreements which limit our ability to incur liens on our assets or that restrict the ability of restricted subsidiaries to pay dividends or make other restricted payments to us, and enter into certain transactions with our affiliates, and, solely with respect to the Revolving Credit Facility, requires a Total Net Leverage Ratio (calculated as defined in the Credit Agreement) of not more than
In addition, the Credit Agreement contains customary default provisions, representations and warranties and other covenants. The Credit Agreement also contains a provision permitting the Lenders to accelerate the repayment of all loans outstanding under the Senior Secured Credit Facilities during an event of default. As of June 30, 2020, the Company was in compliance with all covenants under the Credit Agreement.
European Debt
In connection with the acquisition of Uniwheels, AG, the Company assumed $
During the second quarter of 2019, the Company amended its European Revolving Credit Facility (“EUR SSCF”), increasing the available borrowing limit from €
18
fees are both included in interest expense. Superior Europe AG has pledged substantially all of its assets, including land and buildings, receivables, inventory, and other moveable assets (other than collateral associated with equipment loans) as collateral under the EUR SSCF.
The EUR SSCF is subject to a number of restrictive covenants that, among other things, restrict, subject to certain exceptions, the ability of Superior Europe AG to incur additional indebtedness and guarantee indebtedness, create or incur liens, engage in mergers or consolidations, sell, transfer or otherwise dispose of assets, make investments, acquisitions, loans or advances, pay dividends or distributions, or repurchase our capital stock, prepay, redeem, or repurchase any subordinated indebtedness, and enter into agreements which limit our ability to incur liens on our assets. At June 30, 2020, Superior Europe AG was in compliance with all covenants under the EUR SSCF.
During the fourth quarter of 2019, the Company entered into new equipment loan agreements totaling $
NOTE 10 - REDEEMABLE PREFERRED STOCK
During 2017, we issued
The redeemable preferred stock is convertible into shares of our common stock equal to the number of shares determined by dividing the sum of the stated value and any accrued and unpaid dividends by the conversion price of $
We may mandate conversion of the redeemable preferred stock if the price of the common stock exceeds $
Since the redeemable preferred stock may be redeemed at the option of the holder, but is not mandatorily redeemable, the redeemable preferred stock has been classified as mezzanine equity and initially recognized at fair value of $
19
On November 7, 2018, the Company filed a Certificate of Correction to the Certificate of Designations for the preferred stock, which became effective upon filing and corrected the redemption date to September 14, 2025. This resulted in a modification of the redeemable preferred stock. As a result of the modification, the carrying value of the redeemable preferred stock decreased $
NOTE 11 – EUROPEAN NON-CONTROLLING REDEEMABLE EQUITY
On May 30, 2017, the Company acquired
|
Balance at December 31, 2018 |
|
$ |
|
|
|
Dividends accrued |
|
|
|
|
|
Dividends paid |
|
|
( |
) |
|
Translation adjustment |
|
|
( |
) |
|
Purchase of shares |
|
|
( |
) |
|
Balance at December 31, 2019 |
|
|
|
|
|
Dividends accrued |
|
|
|
|
|
Dividends paid |
|
|
( |
) |
|
Translation adjustment |
|
|
( |
) |
|
Purchase of shares |
|
|
( |
) |
|
Balance at June 30, 2020 |
|
$ |
|
|
20
NOTE 12 – EARNINGS PER SHARE
Basic earnings per share is computed by dividing net income (loss), after deducting preferred dividends and accretion and European non-controlling redeemable equity dividends, by the weighted average number of common shares outstanding. For purposes of calculating diluted earnings per share, the weighted average shares outstanding includes the dilutive effect of outstanding stock options and time and performance based restricted stock units under the treasury stock method. The redeemable preferred shares discussed in Note 10, “Redeemable Preferred Stock” are not included in the diluted earnings per share because the conversion would be anti-dilutive for the three- and six-month periods ended June 30, 2020 and 2019.
|
|
|
Three Months Ended |
|
|
Six Months Ended |
|
||||||||||
|
|
|
June 30, 2020 |
|
|
June 30, 2019 |
|
|
June 30, 2020 |
|
|
June 30, 2019 |
|
||||
|
(Dollars in thousands, except per share amounts) |
|
|
|
|
|
|
|
|
|
|
|
|
|
|
|
|
|
Basic Earnings Per Share: |
|
|
|
|
|
|
|
|
|
|
|
|
|
|
|
|
|
Net (loss) income |
|
$ |
( |
) |
|
$ |
|
|
|
$ |
( |
) |
|
$ |
|
|
|
Less: Redeemable preferred stock dividends and accretion |
|
|
( |
) |
|
|
( |
) |
|
|
( |
) |
|
|
( |
) |
|
Less: European non-controlling redeemable equity dividend |
|
|
( |
) |
|
|
( |
) |
|
|
( |
) |
|
|
( |
) |
|
Basic numerator |
|
$ |
( |
) |
|
$ |
( |
) |
|
$ |
( |
) |
|
$ |
( |
) |
|
Basic loss per share |
|
$ |
( |
) |
|
$ |
( |
) |
|
$ |
( |
) |
|
$ |
( |
) |
|
Weighted average shares outstanding – Basic |
|
|
|
|
|
|
|
|
|
|
|
|
|
|
|
|
|
Diluted Earnings Per Share: |
|
|
|
|
|
|
|
|
|
|
|
|
|
|
|
|
|
Net (loss) income |
|
$ |
( |
) |
|
$ |
|
|
|
$ |
( |
) |
|
$ |
|
|
|
Less: Redeemable preferred stock dividends and accretion |
|
|
( |
) |
|
|
( |
) |
|
|
( |
) |
|
|
( |
) |
|
Less: European non-controlling redeemable equity dividend |
|
|
( |
) |
|
|
( |
) |
|
|
( |
) |
|
|
( |
) |
|
Diluted numerator |
|
$ |
( |
) |
|
$ |
( |
) |
|
$ |
( |
) |
|
$ |
( |
) |
|
Diluted loss per share |
|
$ |
( |
) |
|
$ |
( |
) |
|
$ |
( |
) |
|
$ |
( |
) |
|
Weighted average shares outstanding – Basic |
|
|
|
|
|
|
|
|
|
|
|
|
|
|
|
|
|
Dilutive effect of common share equivalents |
|
|
— |
|
|
|
— |
|
|
|
— |
|
|
|
— |
|
|
Weighted average shares outstanding – Diluted |
|
|
|
|
|
|
|
|
|
|
|
|
|
|
|
|
NOTE 13 - INCOME TAXES
The estimated annual effective tax rate is forecasted quarterly using actual historical information and forward-looking estimates and applied to year-to-date ordinary income. The tax effects of unusual or infrequently occurring items, including changes in judgment about valuation allowances, settlements with taxing authorities and effects of changes in tax laws or rates, are reported in the interim period in which they occur.
The income tax benefit for the three and six months ended June 30, 2020, was $
The income tax provision for the three and six months ended June 30, 2019 was $
21
NOTE 14 - LEASES
The Company determines whether an arrangement is or contains a lease at the inception of the arrangement. Operating leases are included in other non-current assets, accrued expenses and other non-current liabilities in our condensed consolidated balance sheets. Finance leases are included in property, plant and equipment, net, short-term debt and long-term debt (less current portion) in our condensed consolidated balance sheets.
Right-of-use (“ROU”) assets represent our right to use an underlying asset for the lease term and lease liabilities represent our obligation to make lease payments arising from the lease. Operating lease ROU assets and liabilities are recognized at the commencement date based on the present value of the lease payments over the lease term. Since we generally do not have access to the interest rate implicit in the lease, the Company uses our incremental borrowing rate (for fully collateralized debt) at the inception of the lease in determining the present value of the lease payments. The implicit rate is, however, used where readily available. Lease expense under operating leases is recognized on a straight-line basis over the term of the lease. Certain of our leases contain both lease and non-lease components, which are accounted for separately.
The Company has operating and finance leases for office facilities, a data center and certain equipment. The remaining terms of our leases range from over
22
Lease expense and cash flow for the three and six months ended June 30, 2020 and 2019 and operating and finance lease assets and liabilities, average lease term and average discount rate as of June 30, 2020 and December 31, 2019 are as follows:
|
|
|
Three Months Ended |
|
|
Six Months Ended |
|
|
||||||||||
|
|
|
June 30, 2020 |
|
|
June 30, 2019 |
|
|
June 30, 2020 |
|
|
June 30, 2019 |
|
|
||||
|
Lease Expense |
|
|
|
|
|
|
|
|
|
|
|
|
|
|
|
|
|
|
Finance lease expense: |
|
|
|
|
|
|
|
|
|
|
|
|
|
|
|
|
|
|
Amortization of right-of-use assets |
|
$ |
|
|
|
$ |
|
|
|
$ |
|
|
|
$ |
|
|
|
|
Interest on lease liabilities |
|
|
|
|
|
|
|
|
|
|
|
|
|
|
|
|
|
|
Operating lease expense |
|
|
|
|
|
|
|
|
|
|
|
|
|
|
|
|
|
|
Total lease expense |
|
$ |
|
|
|
$ |
|
|
|
$ |
|
|
|
$ |
|
|
|
|
|
|
|
|
|
|
|
|
|
|
|
|
|
|
|
|
|
|
|
Cash Flow Components |
|
|
|
|
|
|
|
|
|
|
|
|
|
|
|
|
|
|
Cash paid for amounts included in the measurement of lease liabilities: |
|
|
|
|
|
|
|
|
|
|
|
|
|
|
|
|
|
|
Operating cash outflows from finance leases |
|
$ |
|
|
|
$ |
|
|
|
$ |
|
|
|
$ |
|
|
|
|
Operating cash outflows from operating leases |
|
|
|
|
|
|
|
|
|
|
|
|
|
|
|
|
|
|
Financing cash outflows from finance leases |
|
|
|
|
|
|
|
|
|
|
|
|
|
|
|
|
|
|
Right-of-use assets obtained in exchange for finance lease liabilities, net of terminations and disposals |
|
|
|
|
|
|
( |
) |
|
|
|
|
|
|
|
|
|
|
Right-of-use assets obtained in exchange for operating lease liabilities, net of terminations and disposals |
|
|
|
|
|
|
|
|
|
|
|
|
|
|
|
|
|
|
|
|
|
|
|
|
|
|
|
|
|
|
|
|
|
|
|
|
|
|
|
|
|
|
|
|
|
|
|
|
|
|
|
|
|
|
|
|
|
|
June 30, 2020 |
|
|
December 31, 2019 |
|
|
|
|
|
|
|
|
|
|
||
|
Balance Sheet Information |
|
|
|
|
|
|
|
|
|
|
|
|
|
|
|
|
|
|
Operating leases: |
|
|
|
|
|
|
|
|
|
|
|
|
|
|
|
|
|
|
Other non-current assets |
|
$ |
|
|
|
$ |
|
|
|
|
|
|
|
|
|
|
|
|
Accrued liabilities |
|
$ |
( |
) |
|
$ |
( |
) |
|
|
|
|
|
|
|
|
|
|
Other non-current liabilities |
|
|
( |
) |
|
|
( |
) |
|
|
|
|
|
|
|
|
|
|
Total operating lease liabilities |
|
$ |
( |
) |
|
$ |
( |
) |
|
|
|
|
|
|
|
|
|
|
|
|
|
|
|
|
|
|
|
|
|
|
|
|
|
|
|
|
|
Finance leases: |
|
|
|
|
|
|
|
|
|
|
|
|
|
|
|
|
|
|
Property and equipment gross |
|
$ |
|
|
|
$ |
|
|
|
|
|
|
|
|
|
|
|
|
Accumulated depreciation |
|
|
( |
) |
|
|
( |
) |
|
|
|
|
|
|
|
|
|
|
Property and equipment, net |
|
$ |
|
|
|
$ |
|
|
|
|
|
|
|
|
|
|
|
|
Current portion of long-term debt |
|
$ |
( |
) |
|
$ |
( |
) |
|
|
|
|
|
|
|
|
|
|
Long-term debt |
|
|
( |
) |
|
|
( |
) |
|
|
|
|
|
|
|
|
|
|
Total finance lease liabilities |
|
$ |
( |
) |
|
$ |
( |
) |
|
|
|
|
|
|
|
|
|
|
|
|
|
|
|
|
|
|
|
|
|
|
|
|
|
|
|
|
|
Lease Term and Discount Rates |
|
|
|
|
|
|
|
|
|
|
|
|
|
|
|
|
|
|
Weighted-average remaining lease term - finance leases (years) |
|
|
|
|
|
|
|
|
|
|
|
|
|
|
|
|
|
|
Weighted-average remaining lease term - operating leases (years) |
|
|
|
|
|
|
|
|
|
|
|
|
|
|
|
|
|
|
Weighted-average discount rate - finance leases |
|
|
|
% |
|
|
|
% |
|
|
|
|
|
|
|
|
|
|
Weighted-average discount rate - operating leases |
|
|
|
% |
|
|
|
% |
|
|
|
|
|
|
|
|
|
23
Summarized future minimum payments under our leases as of June 30, 2020 are as follows:
|
|
|
June 30, 2020 |
|
|||||
|
|
|
Finance Leases |
|
|
Operating Leases |
|
||
|
Lease Maturities (in thousands) |
|
|
|
|
|
|
|
|
|
Six remaining months of 2020 |
|
$ |
|
|
|
$ |
|
|
|
2021 |
|
|
|
|
|
|
|
|
|
2022 |
|
|
|
|
|
|
|
|
|
2023 |
|
|
|
|
|
|
|
|
|
2024 |
|
|
|
|
|
|
|
|
|
Thereafter |
|
|
|
|
|
|
|
|
|
Total |
|
|
|
|
|
|
|
|
|
Less: Imputed interest |
|
|
( |
) |
|
|
( |
) |
|
Total lease liabilities, net of interest |
|
$ |
|
|
|
$ |
|
|
NOTE 15 – RETIREMENT PLANS
We have an unfunded salary continuation plan covering certain directors, officers and other key members of management. Subject to certain vesting requirements, the plan provides for a benefit based on final average compensation, which becomes payable on the employee’s death or upon attaining age
For the six months ended June 30, 2020, payments to retirees or their beneficiaries totaled approximately $
|
|
|
Three Months Ended |
|
|
Six Months Ended |
|
||||||||||
|
|
|
June 30, 2020 |
|
|
June 30, 2019 |
|
|
June 30, 2020 |
|
|
June 30, 2019 |
|
||||
|
(Dollars in thousands) |
|
|
|
|
|
|
|
|
|
|
|
|
|
|
|
|
|
Interest cost |
|
$ |
|
|
|
$ |
|
|
|
$ |
|
|
|
$ |
|
|
|
Net amortization |
|
|
|
|
|
|
|
|
|
|
|
|
|
|
|
|
|
Net periodic pension cost |
|
$ |
|
|
|
$ |
|
|
|
$ |
|
|
|
$ |
|
|
NOTE 16 - STOCK-BASED COMPENSATION
Equity Incentive Plan
Our 2018 Equity Incentive Plan (the “Plan”) was approved by stockholders in May 2018. The Plan authorizes us to issue up to
Under the terms of the Plan, each year eligible participants are granted time value restricted stock units (“RSUs”), vesting ratably over a period, and performance restricted stock units (“PSUs”), with cliff vesting. Upon vesting, each restricted stock award is exchangeable for one share of the Company’s common stock, with accrued dividends.
Other Awards
On May 16, 2019 the Company granted the following equity awards to our then new President and Chief Executive Officer in connection with the 2019 Inducement Grant Plan (the “Inducement Plan”): (i) an initial award consisting of
24
Restricted stock unit and restricted performance stock unit activity for the six months ended June 30, 2020 is summarized in the following table:
|
|
|
Equity Incentive Awards |
|
|||||||||||||||||||||
|
|
|
Restricted Stock Units |
|
|
Weighted Average Grant Date Fair Value |
|
|
Performance Shares |
|
|
Weighted Average Grant Date Fair Value |
|
|
Options |
|
|
Weighted Average Exercise Price |
|
||||||
|
Balance at December 31, 2019 |
|
|
|
|
|
$ |
|
|
|
|
|
|
|
$ |
|
|
|
|
|
|
|
$ |
|
|
|
Granted |
|
|
|
|
|
|
|
|
|
|
|
|
|
|
|
|
|
|
— |
|
|
|
— |
|
|
Settled |
|
|
( |
) |
|
|
|
|
|
|
( |
) |
|
|
|
|
|
|
— |
|
|
|
— |
|
|
Forfeited or expired |
|
|
( |
) |
|
|
|
|
|
|
( |
) |
|
|
|
|
|
|
( |
) |
|
|
|
|
|
Balance at June 30, 2020 |
|
|
|
|
|
$ |
|
|
|
|
|
|
|
$ |
|
|
|
|
|
|
|
$ |
|
|
|
|
|
|
|
|
|
|
|
|
|
|
|
|
|
|
|
|
|
|
|
|
|
|
|
|
|
Vested or expected to vest at June 30, 2020 |
|
|
|
|
|
$ |
|
|
|
|
|
|
|
$ |
|
|
|
|
|
|
|
$ |
|
|
Stock-based compensation expense was $
NOTE 17 – COMMITMENTS AND CONTINGENCIES
Purchase Commitments
When market conditions warrant, we may enter into purchase commitments to secure the supply of certain commodities used in the manufacture of our products, such as aluminum, natural gas and other raw materials. Prices under our aluminum contracts are based on a market index, the London Mercantile Exchange, and regional premiums for processing, transportation and alloy components which are adjusted quarterly for purchases in the ensuing quarter. Changes in aluminum prices are generally passed through to our OEM customers and adjusted on a quarterly basis. Certain of our purchase agreements include volume commitments; however, any excess commitments are generally negotiated with suppliers and those which have occurred in the past have been carried over to future periods.
Contingencies
We are party to various legal and environmental proceedings incidental to our business. Certain claims, suits and complaints arising in the ordinary course of business have been filed or are pending against us. Based on facts now known, we believe all such matters are adequately provided for, covered by insurance, are without merit and/or involve such amounts that would not materially adversely affect our consolidated results of operations, cash flows or financial position.
NOTE 18 – RECEIVABLES FACTORING
The Company sells certain customer trade receivables on a non-recourse basis under factoring arrangements with designated financial institutions. These transactions are accounted for as sales and cash proceeds are included in cash provided by operating activities. Factoring arrangements incorporate customary representations and warranties, including representations as to validity of amounts due, completeness of performance obligations and absence of commercial disputes. During the three months ended June 30, 2020 and 2019, the Company sold trade receivables totaling $
25
NOTE 19 – RESTRUCTURING
During the third quarter of 2019, the Company initiated a plan to significantly reduce production and manufacturing operations at its Fayetteville, Arkansas location. As a result, the Company recognized a non-cash charge of $
During the quarter ended June 30, 2020, the Company discontinued the manufacture and sale of high performance aftermarket wheels for the automotive racing market segment. The Company incurred a total non-cash charge of $
26
Item 2. Management’s Discussion and Analysis of Financial Condition and Results of Operations
Forward-Looking Statements
The Private Securities Litigation Reform Act of 1995 provides a safe harbor for forward-looking statements made by us or on our behalf. We have included or incorporated by reference in this Quarterly Report on Form 10-Q (including in the sections entitled “Risk Factors” and “Management’s Discussion and Analysis of Financial Condition and Results of Operations”) and from time to time our management may make statements that may constitute “forward-looking statements” within the meaning of Section 27A of the Securities Exchange Act of 1933 and Section 21E of the Securities Act of 1934. These forward-looking statements are based upon management’s current expectations, estimates, assumptions and beliefs concerning future events and conditions and may discuss, among other things, the impact of COVID-19 on our future business, results, operation and prospects, anticipated future performance (including sales and earnings), expected growth, future business plans and costs and potential liability for environmental-related matters. Any statement that is not historical in nature is a forward-looking statement and may be identified using words and phrases such as “expects,” “anticipates,” “believes,” “will,” “will likely result,” “will continue,” “plans to” and similar expressions. These statements include our belief regarding general automotive industry and market conditions and growth rates, as well as general domestic and international economic conditions.
Readers are cautioned not to place undue reliance on forward-looking statements. Forward-looking statements are necessarily subject to risks, uncertainties and other factors, many of which are outside the control of the company, which could cause actual results to differ materially from such statements and from the company’s historical results and experience. These risks, uncertainties and other factors include, but are not limited to, those described in Part I—Item 1A—“Risk Factors” and Part II—Item 7—“Management’s Discussion and Analysis of Financial Condition and Results of Operations” of our Annual Report on Form 10-K for the year ended December 31, 2019, Part II —Item 1A—“Risk Factors” of our Quarterly Report on Form 10-Q for the quarter ended March 31, 2020 and Part I—Item 2—“Management’s Discussion and Analysis and Analysis of Financial Condition and Results of Operations” of this Quarterly Report on Form 10-Q, and elsewhere in the Quarterly Report and those described from time to time in our other reports filed with the Securities and Exchange Commission.
Readers are cautioned that it is not possible to predict or identify all the risks, uncertainties and other factors that may affect future results and that the risks described herein should not be considered to be a complete list. Any forward-looking statement speaks only as of the date on which such statement is made, and the company undertakes no obligation to update or revise any forward-looking statement, whether as a result of new information, future events or otherwise.
Management’s Discussion and Analysis of Financial Condition and Results of Operations should be read in conjunction with the accompanying unaudited condensed consolidated financial statements and notes thereto and with the audited consolidated financial statements and notes thereto and Management’s Discussion and Analysis of Financial Condition and Results of Operations included in our Annual Report on Form 10-K for the year ended December 31, 2019.
27
Executive Overview
Overview of Superior
Superior Industries International, Inc.’s (referred herein as the “Company,” “Superior,” or “we” and “our”) principal business is the design and manufacture of aluminum wheels for sale to original equipment manufacturers (OEMs) in North America and Europe and aftermarket distributors in Europe. We employ approximately 7,600 employees, operating in eight manufacturing facilities in North America and Europe with a combined annual manufacturing capacity of approximately 20 million wheels. We are one of the largest suppliers to global OEMs and we believe we are the #1 European aluminum wheel aftermarket manufacturer and supplier. Our OEM aluminum wheels accounted for approximately 92 percent of our sales in the first six months of 2020 and are primarily sold for factory installation on vehicle models manufactured by BMW (including Mini), Daimler AG Company (Mercedes-Benz, AMG, Smart), FCA, Ford, GM, Honda, Jaguar-Land Rover, Mazda, Mitsubishi, Nissan, PSA, Renault, Subaru, Suzuki, Toyota, VW Group (Volkswagen, Audi, SEAT, Skoda, Porsche, Bentley) and Volvo. We also sell aluminum wheels to the European aftermarket under the brands ATS, RIAL, ALUTEC and ANZIO. North America and Europe represent the principal markets for our products, but we have a global presence and diversified customer base consisting of North American, European and Asian OEMs. We continue to deliver on our strategic plan to be one of the leading light vehicle aluminum wheel suppliers globally, delivering innovative wheel solutions to our customers.
Our global reach encompasses sales to the ten largest OEMs in the world. The following chart shows our sales by customer for the six months ended June 30, 2020 and 2019.
Demand for our products is primarily driven by the production of light vehicles in North America and Europe and customer take rates on specific vehicle platforms that we serve and wheel SKUs that we produce. The majority of our customers’ wheel programs are awarded two to four years in advance. Our purchase orders with OEMs are typically specific to a particular vehicle model.
COVID-19 Pandemic
In December 2019, a novel strain of coronavirus (“COVID-19”) was reported in Wuhan, China. Since then, COVID-19 has spread to over 180 countries. On March 11, 2020, the World Health Organization designated COVID-19 as a global pandemic. In North America and Europe (our primary markets), federal, state and local governments have either recommended or mandated actions to slow the transmission of COVID-19. Most U.S. states and most countries implemented shelter-in-place orders, quarantines, significant restrictions on travel, as well as work restrictions that prohibited non-essential employees from going to work. Borders between countries have been closed to contain the spread of COVID-19 contagion. Superior has been complying with these government restrictions to reduce the transmission of COVID-19.
28
The impact of the COVID-19 developments and uncertainty with respect to the economic effects of the pandemic has introduced significant volatility in the financial markets and continues to have a widespread adverse effect on the automotive industry, including reductions in consumer demand and OEM automotive production. Our key customers temporarily closed nearly all of their production facilities in Europe and North America in the second half of March. The OEMs’ facilities in Europe and North America were reopened during May 2020.
While navigating through this period of volatility and uncertainty, Superior’s top priorities are:
|
|
• |
Ensuring the health and safety of our employees |
|
|
• |
Maintaining the financial health of the Company, and |
|
|
• |
Serving our customers. |
Consistent with these priorities, to ensure the health and safety of our employees globally and respond to the current industry production environment, we closed production at our European facilities in late March 2020. In North America, our manufacturing operations ceased production in early April 2020. Production remained suspended at the majority of our global facilities for the month of April 2020 and part of May 2020. In May, Superior reopened three of its four facilities in Europe and reopened the fourth in June based on demand and in line with identified safety precautions. In North America, the Company reopened its facilities on June 1, 2020, in line with production demand, finished goods levels, and in accordance with local government requirements.
To ensure the health and safety of its employees, Superior has developed and is executing a Safe Work Playbook across its footprint in connection with our employees’ return to work. We have also instituted a Global Employee Health & Safety (“EH&S”) Steering Team, led by our Director of EH&S, and comprised of our global and regional leaders from Operations and Human Resources. The purpose of the EH&S Steering Team is to ensure the Safe Work Playbook leverages global best practices and to ensure the consistent and complete implementation of the policies across our global footprint, including all policies and protocols in compliance with local rules and regulations. We have invested in facility updates to ensure social distancing, including changes in cafeteria layout and practices, transportation services and marked spacing throughout our manufacturing facilities. Formalized protocols have been implemented to measure employee temperatures prior to entering any Superior work environment to proactively identify potential COVID-19 symptoms. Formalized protocols and checklists are being used to ensure deep cleaning of equipment between plant shifts. Company-provided employee transportation vehicles are being sanitized after every route, with limited seating to ensure spacing between employees. Finally, we have established Personal Protective Equipment levels for each location, based on local requirements, and the purchasing controls are in place to ensure adequate supplies. In the event of a COVID-19 incident, the local COVID-19 response team immediately executes the defined protocols, including isolation of any employee showing symptoms, and conducts traceability activities to identify and quarantine all potentially exposed individuals.
To date, the Company’s manufacturing operations have successfully managed through the challenges of an extended shutdown and efficient restart. Also, leading up to and during the restart, Superior worked closely with its supply base, which continues to be supportive and effective delivering all material and services required for Superior’s production.
We are in continuous contact with our customers to understand their expected weekly vehicle platform order volumes. While Superior experienced stronger demand in June compared to April and May from its customers in North America, specifically on pickup/SUV platforms, as well as in Europe, the Company continues to extend and expand cost reduction initiatives to align costs to the lower production environment. Superior has executed temporary and permanent cost savings including furloughs, compensation and benefit reductions, temporary facility closures, deferral of merit increases, reduced travel, personnel restructurings, and use of government subsidies where available. In total, these cost initiatives are expected to benefit 2020 by approximately $40 million. Further, Superior may utilize in the future selective, temporary facility closures to efficiently balance capacity with production costs and inventory levels. In addition to these cost reductions, the Company is taking other measures to improve cash flow through targeted working capital initiatives and by reducing capital expenditures.
Industry production for the second quarter of 2020 declined by 69.1% in North America and Europe (71.2% in North America and 67.2% in Europe) compared to the same period in 2019. While our expectation during the first quarter of 2020 was that the Company’s unit shipments would decline by 60% to 70% in the second quarter of 2020, the Company’s second quarter unit shipments actually declined 57.7% year-over-year, which continued the trend of outperformance versus the industry. This decline in unit shipments in the second quarter of 2020 was driven by plant closures in April and May. Our shipments declined 92.2% and 67.6% year-over-year in April and May, respectively. The Company’s unit shipments declined only 12.5% in June as industry production volumes recovered.
While the Company has taken swift and decisive actions to reduce costs across the organization, Superior’s second quarter financial results were negatively impacted by lower unit shipments. As a result, the Company’s net loss was $43.2 million and $233.3 million
29
for the second quarter of 2020 and the six months ended June 30, 2020, respectively, as compared to a net income of $7.3 million and $9.2 million for the same periods in 2019. Our Adjusted EBITDA amounted to a loss of $3.7 million for the second quarter of 2020 and $35.8 million for the six months ended June 30, 2020, as compared to $49.2 million and $92.4 million for the same periods in 2019.
Because of the complexity of the global automotive supply chain, significant volume uncertainty remains. Based on recent IHS production forecasts, full-year 2020 industry volumes are now expected to be down approximately 24% in our key regions, 23% in North America and 25% in Western and Central Europe, as compared to the prior year, which may negatively impact our year-over-year financial results and cash flows.
The ultimate impact that COVID-19 will have on our business, results of operations and financial condition will depend on a number of evolving factors that we may not be able to accurately predict, including: the duration and scope of the pandemic; governmental, OEMs’, suppliers’, customers’ and individuals’ actions that have been and continue to be taken in response to the pandemic; and the impact of the pandemic on economic activity and actions that continue to be taken in response to such impact by the OEMs’ suppliers and customers. We will continue to obtain and assess all relevant available data, including customer orders and industry forecasts (and revisions) to manage our productive capacity as efficiently as possible.
30
Overview of the Second Quarter of 2020
The following charts show the operational performance in the quarter ended June 30, 2020 in comparison to June 30, 2019 ($ in millions):
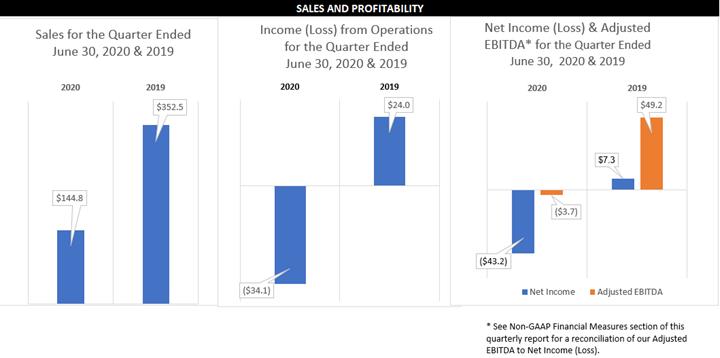
SALES AND PROFITABILITY FOR THE 3RD QUARTER OF 2019 AND 2018 ($ in millions) Sales for 3rd Quarter 2019 & 2018 $352.0 $347.6 2019 2019 Income from Operations 3rd Quarter 2019 & 2018$(0.2) $7.7 2019 218 Net Income & Adjusted EBITDA* for 3rd Quarter 2019 & 2018 Net Income Adjusted EBITDA $38.9 $30.6 $(6.6) 2019 2018 * See the Non-GAAP Financial Measures section of this quarterly report for a reconciliation of our Adjusted EBITDA to Net Income (Loss).
Results of Operations
|
|
|
Three Months Ended |
|
|
|
|
|
|||||
|
|
|
June 30, 2020 |
|
|
June 30, 2019 |
|
|
Net Change |
|
|||
|
(Dollars in thousands, except per share data) |
|
|
|
|
|
|
|
|
|
|
|
|
|
Net sales |
|
|
|
|
|
|
|
|
|
|
|
|
|
North America |
|
$ |
58,916 |
|
|
$ |
180,402 |
|
|
$ |
(121,486 |
) |
|
Europe |
|
|
85,919 |
|
|
|
172,097 |
|
|
|
(86,178 |
) |
|
Net sales |
|
|
144,835 |
|
|
|
352,499 |
|
|
|
(207,664 |
) |
|
Cost of sales |
|
|
167,676 |
|
|
|
312,504 |
|
|
|
144,828 |
|
|
Gross (loss) profit |
|
|
(22,841 |
) |
|
|
39,995 |
|
|
|
(62,836 |
) |
|
Percentage of net sales |
|
|
(15.8 |
)% |
|
|
11.3 |
% |
|
|
(27.1 |
)% |
|
Selling, general and administrative |
|
|
11,276 |
|
|
|
15,964 |
|
|
|
4,688 |
|
|
Income (loss) from operations |
|
|
(34,117 |
) |
|
|
24,031 |
|
|
|
(58,148 |
) |
|
Percentage of net sales |
|
|
(23.6 |
)% |
|
|
6.8 |
% |
|
|
(30.4 |
)% |
|
Interest expense, net |
|
|
(12,184 |
) |
|
|
(11,852 |
) |
|
|
(332 |
) |
|
Other (expense) income, net |
|
|
(670 |
) |
|
|
2,632 |
|
|
|
(3,302 |
) |
|
Income tax benefit (provision) |
|
|
3,753 |
|
|
|
(7,541 |
) |
|
|
11,294 |
|
|
Net (loss) income |
|
$ |
(43,218 |
) |
|
$ |
7,270 |
|
|
$ |
(50,488 |
) |
|
Percentage of net sales |
|
|
(29.8 |
)% |
|
|
2.1 |
% |
|
|
(31.9 |
)% |
|
Diluted loss per share |
|
$ |
(2.00 |
) |
|
$ |
(0.04 |
) |
|
$ |
(1.96 |
) |
|
Value added sales (1) |
|
$ |
84,284 |
|
|
$ |
193,646 |
|
|
$ |
(109,362 |
) |
|
Adjusted EBITDA (2) |
|
$ |
(3,696 |
) |
|
$ |
49,210 |
|
|
$ |
(52,906 |
) |
|
Percentage of net sales |
|
|
(2.6 |
)% |
|
|
14.0 |
% |
|
|
(16.6 |
)% |
|
Percentage of value added sales |
|
|
(4.4 |
)% |
|
|
25.4 |
% |
|
|
(29.8 |
)% |
31
|
Unit shipments in thousands |
|
|
2,068 |
|
|
|
4,890 |
|
|
|
(2,822 |
) |
|
|
(1) |
Value added sales is a key measure that is not calculated according to U.S. GAAP. Refer to “Non-U.S. GAAP Financial Measures” for a definition of value added sales and a reconciliation of value added sales to net sales, the most comparable U.S. GAAP measure. |
|
|
(2) |
Adjusted EBITDA is a key measure that is not calculated according to U.S. GAAP. Refer to “Non-U.S. GAAP Financial Measures” for a definition of adjusted EBITDA and a reconciliation of our adjusted EBITDA to net income, the most comparable U.S. GAAP measure. |
Shipments
Wheel unit shipments were 2.1 million for the second quarter of 2020 compared to unit shipments of 4.9 million in the prior year period, a decrease of 57.7 percent. The decrease occurred in both our North American and European operations and was primarily driven by temporary plant closings at our European and North American operations related to production shutdowns at our key OEM customers in response to the COVID-19 pandemic.
Net Sales
Net sales for the second quarter of 2020 were $144.8 million, compared to net sales of $352.5 million for the same period in 2019. The decrease in net sales is driven by lower production volumes in North America and Europe primarily due to the COVID-19 pandemic of approximately $200.0 million and lower aluminum pricing, which was partially offset by favorable mix.
Cost of Sales
Cost of sales were $167.7 million for the second quarter of 2020 compared to cost of sales of $312.5 million for the same period in 2019. The decrease in cost of sales was primarily due to significantly lower production volume in North America and Europe, lower aluminum prices and cost savings related to temporarily closing our global manufacturing facilities, reducing headcount and operating expenses and the rationalization of the Company’s manufacturing footprint.
Selling, General and Administrative Expenses
Selling, general and administrative (“SG&A”) expenses for the second quarter of 2020 were $11.3 million compared to SG&A expense of $16.0 million for same period in 2019. SG&A expenses were lower due to implementation of furloughs and wage, bonus, and travel expense reductions.
Net Interest Expense
Net interest expense for the second quarter of 2020 was $12.2 million compared to net interest expense of $11.9 million for same period in 2019. The increase in interest expense was primarily due to elevated borrowings under our revolving lines of credit during the second quarter of 2020, partially offset by the reduced interest expense due to early extinguishment of a portion of the 6% Senior Notes (the “Notes”) in the same period in 2019 and additional principal repayments of the Term Loan Facility in the 2019 calendar year and the first quarter of 2020.
Other Income (Expense)
Other expense was $0.7 million for the second quarter of 2020 compared to other income of $2.6 million for same period in 2019. The decline in other income in the second quarter of 2020 was primarily driven by a $2.4 million gain on early extinguishment of a portion of our Notes recognized in the second quarter of 2019. Additionally, we recognized a foreign exchange loss of $0.1 million in the second quarter of 2020 versus a foreign exchange gain of $0.5 million in the same period in 2019.
Income Tax (Provision) Benefit
The income tax benefit for the quarter ended June 30, 2020 was $3.8 million on a pre-tax loss of $47.0 million, representing an effective rate benefit of 8 percent. This was lower than the statutory rate due to the mix of earnings among tax jurisdictions partially offset by the recognition of a valuation allowance on non-deductible interest. The income tax provision for the quarter ended June 30, 2019 was $7.5 million on pre-tax income of $14.8 million, representing an effective rate of 50.9 percent. This was higher than the statutory rate due to the United States, Global Intangible Low-Tax Income (“GILTI”) provisions and the recognition of a valuation allowance on non-deductible interest, partially offset by a benefit from a mix of earnings among tax jurisdictions.
Net Income (Loss)
Net loss for the second quarter of 2020 was $43.2 million, or a loss of $2.00 per diluted share, compared to a net income of $7.3 million, or a loss of $0.04 per diluted share, for the same period in 2019.
32
Segment Sales and Income from Operations
|
|
|
Three Months Ended |
|
|
|
|
|
|||||
|
|
|
June 30, 2020 |
|
|
June 30, 2019 |
|
|
Change |
|
|||
|
(Dollars in thousands) |
|
|
|
|
|
|
|
|
|
|
|
|
|
Selected data |
|
|
|
|
|
|
|
|
|
|
|
|
|
Net sales |
|
|
|
|
|
|
|
|
|
|
|
|
|
North America |
|
$ |
58,916 |
|
|
$ |
180,402 |
|
|
$ |
(121,486 |
) |
|
Europe |
|
|
85,919 |
|
|
|
172,097 |
|
|
|
(86,178 |
) |
|
Total net sales |
|
$ |
144,835 |
|
|
$ |
352,499 |
|
|
$ |
(207,664 |
) |
|
Income (loss) from operations |
|
|
|
|
|
|
|
|
|
|
|
|
|
North America |
|
$ |
(19,792 |
) |
|
$ |
11,827 |
|
|
$ |
(31,619 |
) |
|
Europe |
|
|
(14,325 |
) |
|
|
12,204 |
|
|
|
(26,529 |
) |
|
Total income (loss) from operations |
|
$ |
(34,117 |
) |
|
$ |
24,031 |
|
|
$ |
(58,148 |
) |
North America
Net sales for our North American segment for the second quarter of 2020 decreased 67.3 percent, compared to the same period in 2019 due to a 66.2 percent decrease in volumes resulting from the temporary closure of our North American manufacturing plants in April and May and lower aluminum prices. The reduction in net sales was partially offset by improved product mix comprised of larger diameter wheels and premium wheel finishes. The decline in unit shipments was primarily due to production shutdowns by Superior’s key North American OEM customers during the quarter. U.S. and Mexico sales as a percentage of North America total sales were approximately 6.1 percent and 93.9 percent, respectively, for the quarter ended June 30, 2020, which compares to 14.7 percent and 85.3 percent for the same period of the prior year. The change in North American sales by country is due to discontinuation of manufacturing activities at our Fayetteville, Arkansas location in the fourth quarter of 2019. North American segment income from operations for the three months ended June 30, 2020 was lower than the same period of the prior year, due to significantly reduced volumes related to OEM customer shutdowns; partially offset by the execution of temporary and permanent cost reductions including furloughs, hourly and salary wage and benefit reductions, temporary facility closures, deferral of merit increases, reduced travel and personnel restructuring.
Europe
Net sales for our European segment for the second quarter of 2020 decreased 50.1 percent, compared to the same period in 2019, due to a 48.9 percent decrease in volumes, which is primarily attributable to COVID-19, and a weaker Euro. The decline in unit shipments was mainly due to production shutdowns by Superior’s key European OEM customers during the quarter. European segment sales in Germany and Poland were approximately 39.3 percent and 60.7 percent, respectively, during the quarter ended June 30, 2020, which compares to 33.2 percent and 66.8 percent for the same period of the prior year. European segment income from operations for the second quarter in 2020 decreased, compared to the same period in 2019 primarily due to reduced volumes related to OEM customer shutdowns, partially offset by temporary and permanent cost reductions related to temporary facility closures and use of government subsidies in both Poland and Germany, deferral of merit increases, reduced travel and personnel restructurings partially offset by costs to exit the automotive racing wheel market.
33
Overview of the First Half of 2020
The following chart shows the operational performance in the six months ended June 30, 2020 in comparison to the six months ended June 30, 2019 ($ in millions):
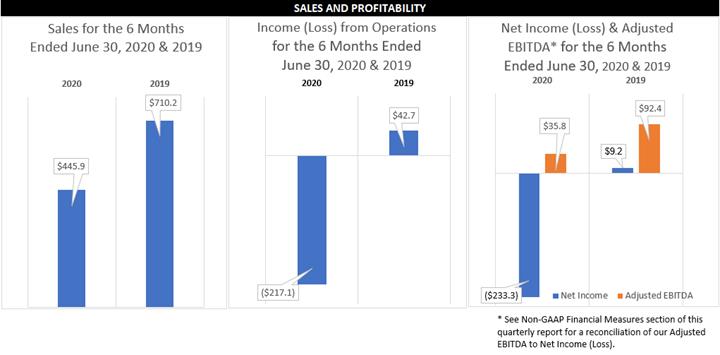
34
Results of Operations
|
|
|
Six Months Ended |
|
|
|
|
|
|||||
|
|
|
June 30, 2020 |
|
|
June 30, 2019 |
|
|
Net Change |
|
|||
|
(Dollars in thousands, except per share data) |
|
|
|
|
|
|
|
|
|
|
|
|
|
Net sales |
|
|
|
|
|
|
|
|
|
|
|
|
|
North America |
|
$ |
214,467 |
|
|
$ |
365,518 |
|
|
$ |
(151,051 |
) |
|
Europe |
|
|
231,480 |
|
|
|
344,674 |
|
|
|
(113,194 |
) |
|
Net sales |
|
|
445,947 |
|
|
|
710,192 |
|
|
|
(264,245 |
) |
|
Cost of sales |
|
|
445,627 |
|
|
|
637,075 |
|
|
|
(191,448 |
) |
|
Gross profit |
|
|
320 |
|
|
|
73,117 |
|
|
|
(72,797 |
) |
|
Percentage of net sales |
|
|
0.1 |
% |
|
|
10.3 |
% |
|
|
(10.2 |
)% |
|
Selling, general and administrative |
|
|
23,811 |
|
|
|
30,447 |
|
|
|
6,636 |
|
|
Impairment of goodwill and indefinite-lived intangibles |
|
|
193,641 |
|
|
|
— |
|
|
|
(193,641 |
) |
|
Income (loss) from operations |
|
|
(217,132 |
) |
|
|
42,670 |
|
|
|
(259,802 |
) |
|
Percentage of net sales |
|
|
(48.7 |
)% |
|
|
6.0 |
% |
|
|
(54.7 |
)% |
|
Interest expense, net |
|
|
(24,034 |
) |
|
|
(23,725 |
) |
|
|
(309 |
) |
|
Other income, net |
|
|
653 |
|
|
|
2,759 |
|
|
|
(2,106 |
) |
|
Income tax benefit (provision) |
|
|
7,213 |
|
|
|
(12,484 |
) |
|
|
19,697 |
|
|
Net (loss) income |
|
$ |
(233,300 |
) |
|
$ |
9,220 |
|
|
$ |
(242,520 |
) |
|
Percentage of net sales |
|
|
(52.3 |
)% |
|
|
1.3 |
% |
|
|
(53.6 |
)% |
|
Diluted loss per share |
|
$ |
(9.81 |
) |
|
$ |
(0.27 |
) |
|
$ |
(9.54 |
) |
|
Value added sales (1) |
|
$ |
254,375 |
|
|
$ |
386,448 |
|
|
$ |
(132,073 |
) |
|
Adjusted EBITDA (2) |
|
$ |
35,834 |
|
|
$ |
92,430 |
|
|
$ |
(56,596 |
) |
|
Percentage of net sales |
|
|
8.0 |
% |
|
|
13.0 |
% |
|
|
(5.0 |
)% |
|
Percentage of value added sales |
|
|
14.1 |
% |
|
|
23.9 |
% |
|
|
(9.8 |
)% |
|
Unit shipments in thousands |
|
|
6,375 |
|
|
|
9,929 |
|
|
|
(3,554 |
) |
|
(1) |
Value added sales is a key measure that is not calculated according to U.S. GAAP. Refer to “Non-U.S. GAAP Financial Measures” for a definition of value added sales and a reconciliation of value added sales to net sales, the most comparable U.S. GAAP measure. |
(2) Adjusted EBITDA is a key measure that is not calculated according to U.S. GAAP. Refer to “Non-U.S. GAAP Financial Measures” for a definition of adjusted EBITDA and a reconciliation of our adjusted EBITDA to net income, the most comparable U.S. GAAP measure.
Shipments
Wheel unit shipments were 6.4 million for the first half of 2020 compared to unit shipments of 9.9 million in the prior year period, a decrease of 35.8 percent. The decrease occurred in both our North American and European operations and was primarily driven by production shutdowns at our key OEM customers in response to the COVID-19 pandemic.
Net Sales
Net sales for the first half of 2020 were $445.9 million, compared to net sales of $710.2 million for the same period in 2019. The decrease in net sales was driven by lower production volumes in North America and Europe primarily due to the COVID-19 pandemic of approximately $240.0 million, lower aluminum pricing and a weaker Euro, partially offset by favorable mix.
Cost of Sales
Cost of sales were $445.6 million for the first half of 2020 compared to cost of sales of $637.1 million for the same period in 2019. The decrease in cost of sales was primarily due to significantly lower production volume in North America and Europe, lower aluminum prices and utilities (due to both lower volumes and cost savings from our North American plant investments in 2019 to use electricity from the secondary market), cost savings related to temporarily closing our global manufacturing facilities, reducing headcount and operating expenses and the rationalization of the Company’s manufacturing footprint.
Selling, General and Administrative Expenses
Selling, general and administrative (“SG&A”) expenses for the first half of 2020 were $23.8 million, compared to SG&A expense of $30.4 million for same period in 2019 due to due to reduced management compensation, implementing furloughs, and reducing wages, bonuses, certain benefits and travel expenses.
35
Impairment of Goodwill and Indefinite-lived Intangibles
For the first quarter of 2020, we recognized a goodwill and indefinite-lived intangible asset impairment charge totaling $193.6 million relating to our European reporting unit (refer to Note 8, “Goodwill and Other Intangible Assets” in the notes to the condensed consolidated financial statements).
Net Interest Expense
Net interest expense for the first half of 2020 was $24.0 million compared to net interest expense of $23.7 million for same period in 2019. The increase in interest expense was primarily due to elevated borrowings under our revolving lines of credit during the second quarter of 2020, partially offset by the reduced interest expense due to early extinguishment of a portion of the Notes in 2019 and additional principal repayments of the Term Loan Facility in the 2019 calendar year and the first quarter of 2020.
Other Income (Expense)
Other income was $0.7 million for the first half of 2020 compared to other income of $2.8 million for same period in 2019. The decline in other income in 2020 was primarily driven by a $2.4 million gain on early extinguishment of a portion of the Notes recognized in the second quarter of 2019.
Income Tax (Provision) Benefit
The income tax benefit for the six months ended June 30, 2020 was $7.2 million on a pre-tax loss of $240.5 million, representing an effective rate benefit of 3 percent. This was lower than the statutory rate due to the mix of earnings among tax jurisdictions, the impairment of goodwill for which there is no corresponding tax benefit, partially offset by the recognition of a valuation allowance on non-deductible interest. The income tax provision for the six months ended June 30, 2019 was $12.5 million on pre-tax income of $21.7 million, representing an effective rate of 57.5 percent. This was higher than the statutory rate due to the United States GILTI provisions and the recognition of a valuation allowance on non-deductible interest, partially offset by a benefit due to the mix of earnings among tax jurisdictions.
Net Income (Loss)
Net loss for the first half of 2020 was $233.3 million, or a loss of $9.81 per diluted share, compared to a net income of $9.2 million, or a loss of $0.27 per diluted share, for the same period in 2019.
Segment Sales and Income from Operations
|
|
|
Six Months Ended |
|
|
|
|
|
|||||
|
|
|
June 30, 2020 |
|
|
June 30, 2019 |
|
|
Change |
|
|||
|
(Dollars in thousands) |
|
|
|
|
|
|
|
|
|
|
|
|
|
Selected data |
|
|
|
|
|
|
|
|
|
|
|
|
|
Net Sales |
|
|
|
|
|
|
|
|
|
|
|
|
|
North America |
|
$ |
214,467 |
|
|
$ |
365,518 |
|
|
$ |
(151,051 |
) |
|
Europe |
|
|
231,480 |
|
|
|
344,674 |
|
|
|
(113,194 |
) |
|
Total net sales |
|
$ |
445,947 |
|
|
$ |
710,192 |
|
|
$ |
(264,245 |
) |
|
Income (loss) from operations |
|
|
|
|
|
|
|
|
|
|
|
|
|
North America |
|
$ |
(13,683 |
) |
|
$ |
18,026 |
|
|
$ |
(31,709 |
) |
|
Europe |
|
|
(203,449 |
) |
|
|
24,644 |
|
|
|
(228,093 |
) |
|
Total income (loss) from operations |
|
$ |
(217,132 |
) |
|
$ |
42,670 |
|
|
$ |
(259,802 |
) |
North America
Net sales for our North American segment for the first six months of 2020 decreased 41.3 percent, compared to the same period in 2019, due to a 40.2 percent decrease in volumes, which was primarily attributable to COVID-19 and lower aluminum prices, partially offset by improved product mix comprised of larger diameter wheels and premium wheel finishes. U.S. and Mexico sales as a percentage of North America total sales were approximately 9.2 percent and 90.8 percent, respectively, for the first six months of 2020, which compares to 15.0 percent and 85.0 percent for the prior year period. The change in North American sales by country is due to ending manufacturing activities at our Fayetteville, Arkansas location in the fourth quarter of 2019. North American segment income from operations for the six months ended June 30, 2020 was lower than the prior year period, due to significantly reduced volumes related to North American OEM customer shutdowns, partially offset by favorable product mix, utilities savings associated with plant investments made in 2019 to use electricity from a competitively priced market and cost reductions including furloughs, hourly and salary wage and benefit reductions, a temporary closure of our manufacturing facilities, deferral of merit increases, reduced travel and personnel restructuring.
Europe
36
Net sales for our European segment for the first six months of 2020 decreased 32.8 percent, compared to the same period in 2019, due to a 31.2 percent decrease in volumes, which was primarily attributable to COVID-19, a weaker Euro and lower aluminum prices, partially offset by improved product mix comprised of higher diameter wheels and premium wheel finishes. European segment sales between Germany and Poland were approximately 36.2 percent and 63.8 percent, respectively, during the first six months of 2020, which compares to 35.2 percent and 64.8 percent for the first six months of 2019. European segment income from operations for the six months ended June 30, 2020 was lower than the prior year period primarily due to lower volumes related to OEM customer shutdowns and negative foreign exchange effects from the Euro partially offset by favorable mix and by temporary and permanent cost reductions related to temporary facility closures and use of government subsidies in both Poland and Germany, deferral of merit increases, reduced travel and personnel restructurings.
Financial Condition, Liquidity and Capital Resources
As of June 30, 2020, our cash and cash equivalents totaled $130.7 million compared to $56.9 million and $77.9 million at June 30, 2019 and December 31, 2019, respectively. Our sources of liquidity primarily include cash, cash equivalents and short-term investments, net cash provided by operating activities, and borrowings under available debt facilities, factoring arrangements for trade receivables and, from time to time, other external sources of funds. Working capital (current assets minus current liabilities) and our current ratio (current assets divided by current liabilities) were $146.0 million and 1.7:1.0, respectively, at June 30, 2020, versus $163.1 million and 1.9:1.0 at December 31, 2019.
Our working capital requirements, investing activities and cash dividend payments have historically been funded from internally generated funds, debt facilities, cash equivalents and short-term investments, and we believe these sources will continue to meet our capital requirements, as well as our currently anticipated short-term needs. Capital expenditures consist of ongoing maintenance and operational improvements (“maintenance”), as well as capital related to new product offerings and expanded capacity for existing products (“new business”). Over time capital expenditures have consisted of roughly equal components of maintenance and new business, the most significant of which in recent years has been our investment in physical vapor deposition technology which went into production in 2019.
In connection with the acquisition of our European operations, we entered into several debt and equity financing arrangements during 2017. On March 22, 2017, we entered into a USD Senior Secured Credit facility (“USD SSCF”) consisting of a $400.0 million Senior Secured Term Loan Facility (“Term Loan Facility”) and a $160.0 million Revolving Credit Facility (“Revolving Credit Facility”). On May 22, 2017, we issued 150,000 shares of redeemable preferred stock for an aggregate purchase price of $150.0 million. On June 15, 2017, we issued €250.0 million aggregate principal amount of 6.00% Senior Notes due June 15, 2025 (“the Notes”). Finally, as part of the European business acquisition, we also assumed $70.7 million of outstanding debt, including a €45.0 million European Revolving Credit Facility (“EUR SSCF”).
On January 31, 2020, the available borrowing limit of the EUR SSCF was increased from €45.0 million to €60.0 million. All other terms of the EUR SSCF remained unchanged. In addition, the European business entered into equipment loan agreements totaling $13.4 million (€12.0 million) in the fourth quarter of 2019. During the first quarter of 2020, the Company drew down on these equipment loans and the outstanding balance was $11.9 million as of June 30, 2020.
In response to the COVID 19 pandemic and the ensuing economic uncertainty and to maintain and enhance our liquidity, we took the following actions during the six-month period ended June 30, 2020:
|
|
• |
reduced both the CEO’s base salary and the cash compensation of the non-employee Board of Directors members to $0 for April and May |
|
|
• |
implemented temporary facility closures, salary reductions, layoffs, furloughs, personnel restructurings, eliminated or deferred merit increases and reduced selected employee benefits across our global workforce in accordance with local laws and regulations |
|
|
• |
put on hold all non-critical capital expenditures |
|
|
• |
reduced purchases of direct materials |
|
|
• |
eliminated discretionary spending |
|
|
• |
drew down $156.0 million under our Revolving Credit Facility in late March 2020 and, in accordance with the provisions of the underlying agreement, repaid $101 million during the second quarter of 2020, resulting in an outstanding balance of $55.0 million as of June 30, 2020 |
|
|
• |
drew on our EUR SSCF in late March 2020, resulting in an outstanding balance of $52.8 million (or €47 million) as of June 30, 2020 |
37
|
|
• |
implemented regional cash disbursement councils who review and approve all cash disbursements, and |
|
|
• |
established an on-going communication protocol with our key suppliers and vendors to negotiate mutually acceptable credit terms and monitor productive material availability within our supply chain. |
In July 2020, the Company paid the outstanding balance on the Revolving Credit Facility down to $30.0 million and, as a result, has available and unused commitments under the Revolving Credit Facility of $125.2 million at July 31, 2020. In addition, the Company repaid $43.6 million (€37 million) on the EUR SSCF in early August 2020, resulting in an outstanding balance of $11.8 million and available and unused commitments of $58.9 million.
Both of our revolving credit facilities mature in May 2022, and based on various forecasted scenarios, Superior expects, at this time, to remain compliant with the terms of these facilities. The Company has no other significant funded debt obligations until May 2024.
Balances outstanding under the Term Loan Facility, Notes, the Revolving Credit Facility, EUR SSCF and equipment loans as of June 30, 2020 were $349.2 million, $244.0 million, $55.0 million, $52.8 million and $23.2 million, respectively. The redeemable preferred stock amounted to $169.9 million as of June 30, 2020. Our liquidity totaled $245.1 million at June 30, 2020, including cash on hand of $130.7 million and available and unused commitments under credit facilities of $114.4 million.
To further bolster our liquidity position, we are benefiting from COVID-19 related subsidies in Germany and Poland and assessing the availability of a low-interest rate loan in Germany.
The following table summarizes the cash flows from operating, investing and financing activities as reflected in the consolidated statements of cash flows.
|
|
|
Six Months Ended |
|
|
|
|
|
|||||
|
|
|
June 30, 2020 |
|
|
June 30, 2019 |
|
|
Change |
|
|||
|
(Dollars in thousands) |
|
|
|
|
|
|
|
|
|
|
|
|
|
Net cash provided by (used in) operating activities |
|
|
(7,135 |
) |
|
|
69,631 |
|
|
|
(76,766 |
) |
|
Net cash used in investing activities |
|
|
(22,761 |
) |
|
|
(19,034 |
) |
|
|
(3,727 |
) |
|
Net cash provided by (used in) financing activities |
|
|
82,205 |
|
|
|
(39,266 |
) |
|
|
121,471 |
|
|
Effect of exchange rate changes on cash |
|
|
496 |
|
|
|
(1,872 |
) |
|
|
2,368 |
|
|
Net increase (decrease) in cash and cash equivalents |
|
$ |
52,805 |
|
|
$ |
9,459 |
|
|
$ |
43,346 |
|
Operating Activities
Net cash used in operating activities was $7.1 million for the first six months of 2020 versus a source of cash of $69.6 million for the same period in 2019. The decrease in cash flow provided by operating activities was mainly due to lower sales volumes, driven by shutdowns at our key North American and European OEM customers in response to the COVID-19 pandemic. Additionally, working capital was a use of cash in the first six months of 2020 compared to a source of cash in the prior year period.
Investing Activities
Net cash used in investing activities was $22.8 million for the first six months of 2020 compared to $19.0 million for the same period in 2019. The increased usage of cash for investing activities year-over-year is driven by a one-time benefit from the sale of other assets in the second quarter of 2019, partially offset by 2020 reductions in capital expenditures.
Financing Activities
Net cash provided by financing activities was $82.2 million for the first six months of 2020 compared to a use of cash of $39.3 million for the same period in 2019. This was primarily due to increased borrowings under our revolving lines of credit and proceeds from the new European equipment loans, as well as the elimination of the common dividend in the third quarter of 2019.
38
Off-Balance Sheet Arrangements
As of June 30, 2020, we had no significant off-balance sheet arrangements other than factoring of $59.3 million of our trade receivables.
Non-GAAP Financial Measures
In this quarterly report, we discuss two important measures that are not calculated according to U.S. GAAP, value added sales and adjusted EBITDA.
Value added sales is a key measure that is not calculated according to U.S. GAAP. In the discussion of operating results, we provide information regarding value added sales. Value added sales represents net sales less the value of aluminum and services provided by outsourced service providers (“OSP”) that are included in net sales. As discussed further below, arrangements with our customers allow us to pass on changes in aluminum prices; therefore, fluctuations in underlying aluminum price generally does not directly impact our profitability. Accordingly, value added sales is worthy of being highlighted for the benefit of users of our financial statements. Our intent is to allow users of the financial statements to consider our net sales information both with and without the aluminum and OSP cost components. Management utilizes value added sales as a key metric to determine growth of the Company because it eliminates the volatility of aluminum prices.
Adjusted EBITDA is a key measure that is not calculated according to U.S. GAAP. Adjusted EBITDA is defined as earnings before interest income and expense, income taxes, depreciation, amortization, restructuring charges and other closure costs and impairments of long-lived assets and investments, changes in fair value of redeemable preferred stock embedded derivative, acquisition and integration costs, certain hiring and separation related costs, proxy contest fees, gains associated with early debt extinguishment and accounts receivable factoring fees. We use adjusted EBITDA as an important indicator of the operating performance of our business. Adjusted EBITDA is used in our internal forecasts and models when establishing internal operating budgets, supplementing the financial results and forecasts reported to our Board of Directors and evaluating short-term and long-term operating trends in our operations. We believe the adjusted EBITDA financial measure assists in providing a more complete understanding of our underlying operational measures to manage our business, to evaluate our performance compared to prior periods and the marketplace and to establish operational goals. Adjusted EBITDA is a non-GAAP financial measure and should not be considered in isolation or as a substitute for financial information provided in accordance with U.S. GAAP. This non-GAAP financial measure may not be computed in the same manner as similarly titled measures used by other companies.
The following table reconciles our net sales, the most directly comparable U.S. GAAP financial measure, to our value added sales:
|
|
|
Three Months Ended |
|
|
Six Months Ended |
|
||||||||||
|
|
|
June 30, 2020 |
|
|
June 30, 2019 |
|
|
June 30, 2020 |
|
|
June 30, 2019 |
|
||||
|
(Dollars in thousands) |
|
|
|
|
|
|
|
|
|
|
|
|
|
|
|
|
|
Net sales |
|
$ |
144,835 |
|
|
$ |
352,499 |
|
|
$ |
445,947 |
|
|
$ |
710,192 |
|
|
Less: aluminum value and outside service provider costs |
|
|
(60,551 |
) |
|
|
(158,853 |
) |
|
|
(191,572 |
) |
|
|
(323,744 |
) |
|
Value added sales |
|
$ |
84,284 |
|
|
$ |
193,646 |
|
|
$ |
254,375 |
|
|
$ |
386,448 |
|
39
The following table reconciles our net income, the most directly comparable U.S. GAAP financial measure, to our adjusted EBITDA:
|
|
|
Three Months Ended |
|
|
Six Months Ended |
|
||||||||||
|
|
|
June 30, 2020 |
|
|
June 30, 2019 |
|
|
June 30, 2020 |
|
|
June 30, 2019 |
|
||||
|
(Dollars in thousands) |
|
|
|
|
|
|
|
|
|
|
|
|
|
|
|
|
|
Net income (loss) |
|
$ |
(43,218 |
) |
|
$ |
7,270 |
|
|
$ |
(233,300 |
) |
|
$ |
9,220 |
|
|
Interest expense, net |
|
|
12,184 |
|
|
|
11,852 |
|
|
|
24,034 |
|
|
|
23,725 |
|
|
Income tax provision (benefit) |
|
|
(3,753 |
) |
|
|
7,541 |
|
|
|
(7,213 |
) |
|
|
12,484 |
|
|
Depreciation |
|
|
17,798 |
|
|
|
16,637 |
|
|
|
36,052 |
|
|
|
33,191 |
|
|
Amortization |
|
|
6,127 |
|
|
|
6,705 |
|
|
|
12,264 |
|
|
|
13,482 |
|
|
Impairment of goodwill and indefinite-lived intangibles |
|
|
— |
|
|
|
— |
|
|
|
193,641 |
|
|
|
— |
|
|
Integration, restructuring, factoring fees and other (1) (2) (3) |
|
|
7,166 |
|
|
|
(795 |
) |
|
|
10,356 |
|
|
|
328 |
|
|
Adjusted EBITDA |
|
$ |
(3,696 |
) |
|
$ |
49,210 |
|
|
$ |
35,834 |
|
|
$ |
92,430 |
|
|
Adjusted EBITDA as a percentage of net sales |
|
|
-2.6 |
% |
|
|
14.0 |
% |
|
|
8.0 |
% |
|
|
13.0 |
% |
|
Adjusted EBITDA as a percentage of value added sales |
|
|
-4.4 |
% |
|
|
25.4 |
% |
|
|
14.1 |
% |
|
|
23.9 |
% |
|
|
(1) |
In the second quarter of 2020, we incurred approximately $3.1 million of restructuring costs comprised of on-going fixed costs associated with our Fayetteville, Arkansas, facility, relocation and installation costs of repurposed machinery and severance costs as well as $0.2 million of accounts receivables factoring fees. Additionally, in the second quarter of 2020, we incurred $3.4 million of restructuring costs related to discontinuing the manufacturing and sale of high-performance wheels for the automotive racing market segment, $0.2 million for certain asset impairments and $0.3 million of other costs. |
|
|
(2) |
In the first half of 2020, we incurred approximately $9.5 million of restructuring costs comprised of on-going fixed costs associated with our Fayetteville, Arkansas facility, relocation and installation costs of repurposed machinery, salaried severance cost and second quarter 2020 costs incurred with exiting the automotive racing market segment, as well as $0.4 million of accounts receivable factoring fees, $0.2 million of certain asset impairments and $0.3 million of other costs. |
|
|
(3) |
In the second quarter of 2019, we incurred approximately $1.4 million of hiring and separation costs, $0.2 million of accounts receivables factoring fees, $0.1 million of integration costs and $2.4 million of gains on extinguishment of debt. In the first half of 2019, we incurred approximately $0.6 million of integration costs, $2.2 million of restructuring costs, $0.6 million of factoring fees and $2.4 million of gains on extinguishment of debt. |
Critical Accounting Policies and Estimates
The preparation of consolidated financial statements in conformity with U.S. GAAP requires management to apply significant judgment in making estimates and assumptions that affect amounts reported therein, as well as financial information included in this Management’s Discussion and Analysis of Financial Condition and Results of Operations. These estimates and assumptions, which are based upon historical experience, industry trends, terms of various past and present agreements and contracts, and information available from other sources that are believed to be reasonable under the circumstances, form the basis for making judgments about the carrying values of assets and liabilities that are not readily apparent through other sources. There can be no assurance that actual results reported in the future will not differ from these estimates, or that future changes in these estimates will not adversely impact our results of operations or financial condition.
40
Impairment of Goodwill –Goodwill and indefinite-lived intangible assets, such as certain trade names, are not amortized, but are instead evaluated for impairment annually at the end of the fiscal year, or more frequently if events or circumstances indicate that impairment may be more likely than not.
At March 31, 2020, the impact of the COVID-19 developments and uncertainty with respect to the economic effects of the pandemic had introduced significant volatility in the financial markets and was having, and continues to have, a widespread adverse effect on the automotive industry, including reductions in both consumer demand and OEM automotive production. In response, our key customers temporarily closed nearly all production facilities in Europe and North America (our primary markets) during the quarter ended March 31, 2020. As a result, we concluded that an interim test of our goodwill was required. More specifically, the Company concluded that the following events and circumstances, in the aggregate, indicated that it was more likely than not that the carrying value of our European reporting unit exceeded its fair value at March 31, 2020: (1) our European reporting unit’s carrying value was effectively set to fair value at December 31, 2019, due to the $
We utilized both an income and a market approach, weighted
At March 31, 2020, we determined that the carrying value of the European reporting unit exceeded its fair value by an amount greater than the remaining goodwill balance. The decline in fair value was primarily due to significantly lower market multiples and increased discount rates, as well as further declines in forecasted industry production volumes in Western and Central Europe as a result of the COVID-19 pandemic and consequent economic instability. Forecasted revenues, EBITDA and cash flow for the European reporting unit also declined as compared to the prior year long-range plan due to lower forecasted industry production volumes which adversely impacted fair value under both the income and market approaches. In determining the fair value, the Company weighted the income and market approaches,
Impairment of Intangible Assets – Intangible assets include both finite and indefinite-lived intangible assets. Finite-lived intangible assets consist of brand names, technology and customer relationships. Finite-lived intangible assets are amortized on a straight-line over their estimated useful lives (since the pattern in which the asset will be consumed cannot be reliably determined). Indefinite-lived intangible assets, excluding goodwill, consist of trade names associated with our aftermarket business. In the first quarter of 2020, we recognized a non-cash impairment charge of $11.0 million related to our aftermarket trade name indefinite-lived intangible asset which was primarily attributable to a further decline in forecasted aftermarket revenues and a decline in associated profitability (refer to Note 8, “Goodwill and Other Intangible Assets” in the notes to condensed consolidated financial statements in Item 1, “Financial Statements and Supplementary Data” in this Quarterly Report for further discussion of asset impairments).
Also see Item 7— “Management’s Discussion and Analysis of Financial Condition and Results of Operations” in Part II of our 2019 Annual Report on Form 10-K.
41
Item 3. Quantitative and Qualitative Disclosures About Market Risk
Not applicable for smaller reporting companies.
Item 4. Controls and Procedures
Evaluation of Disclosure Controls and Procedures
The Company’s management, with the participation of our Chief Executive Officer and Chief Financial Officer, evaluated the effectiveness of the Company’s disclosure controls and procedures (as defined in Rules 13a-15(e) and 15d-15(e) under the Exchange Act) as of June 30, 2020. Our disclosure controls and procedures are designed to ensure that information required to be disclosed in reports we file or submit under the Exchange Act is recorded, processed, summarized and reported within the time periods specified in SEC rules and forms and that such information is accumulated and communicated to our management, including our Chief Executive Officer and Chief Financial Officer, to allow timely decisions regarding required disclosures.
Based on this evaluation, our Chief Executive Officer and Chief Financial Officer concluded that, as of June 30, 2020 our disclosure controls and procedures were effective.
Changes in Internal Control Over Financial Reporting
There has been no change in our internal control over financial reporting during the six months ended June 30, 2020 that has materially affected, or is reasonably likely to materially affect, our internal control over financial reporting.
42
PART II
OTHER INFORMATION
Item 1. Legal Proceedings
We are party to various legal and environmental proceedings incidental to our business. Certain claims, suits and complaints arising in the ordinary course of business have been filed or are pending against us. Based on facts now known, we believe all such matters are adequately provided for, covered by insurance, are without merit, and/or involve such amounts that would not materially adversely affect our consolidated results of operations, cash flows or financial position. See also under Item 1A, “Risk Factors - We are from time to time subject to litigation, which could adversely impact our financial condition or results of operations” of our Annual Report on Form 10-K for the year ended December 31, 2019.
Item 1A. Risk Factors
In light of the recent events surrounding COVID-19, in our Quarterly Report on Form 10-Q for the quarter ended March 31, 2020, we added the below risk factors entitled “The COVID-19 pandemic has disrupted, and may continue to disrupt our business, which we expect will have a material adverse impact on our business, results of operations and financial condition” and “A delisting of our common stock from the NYSE could reduce the liquidity and market price of our common stock; reduce the number of investors and analysts that cover our common stock; limit our ability to issue additional shares, and damage our reputation which could have a material adverse impact on our business, results of operations and financial condition. In addition, a delisting of our common stock from the NYSE could cause a redemption of some or all of our outstanding redeemable preferred stock which would negatively impact our liquidity” to the risk factors as previously disclosed in “Item 1A Risk Factors” of our Form 10-K for the year ended December 31, 2019. Other than as set forth below, there have been no material changes to the risk factors set forth in “Item 1A Risk Factors” of our Form 10-K for the year ended December 31, 2019. However, many of the risk factors set forth in our Form 10-K for the year ended December 31, 2019 are, and will continue to be, exacerbated by the COVID-19 pandemic and any resulting worsening of the economic environment.
The COVID-19 pandemic has disrupted, and may continue to disrupt our business, which we expect will have a material adverse impact on our business, results of operations and financial condition.
The ongoing COVID-19 pandemic has caused a widespread health crisis, resulting in an economic downturn and government imposed measures to reduce the spread of COVID-19. In Europe and North America (our primary markets), federal, state and local governments have either recommended or mandated actions to slow the transmission of COVID-19. Most U.S. states and most countries have been implementing shelter-in-place orders, quarantines, significant restrictions on travel, as well as work restrictions that prohibit non-essential employees from going to work. The impact of COVID-19 and uncertainty with respect to the economic effects of the pandemic has introduced significant volatility in the financial markets and is having a widespread adverse effect on the automotive industry. Specific risks to our Company associated with the COVID-19 pandemic include the following:
|
|
• |
reductions in both consumer demand for vehicles and OEM automotive production, due to lower consumer confidence, may decrease demand for our products |
|
|
• |
OEMs may shift production to lower trim-levels or delay new product launches that result in the manufacture of less expensive light-vehicle products, which generally would decrease demand for our larger and/or premium wheel finishes that have higher average profit margins |
|
|
• |
OEMs may adjust their supply chains to eliminate reliance on certain suppliers, including Superior, based on credit rating agencies’ assessments of suppliers |
|
|
• |
further deterioration of worldwide credit and financial markets could limit our ability to factor customer receivables, or end-consumers’ ability to obtain financing to purchase new vehicles |
|
|
• |
the uncertainties associated with COVID-19 impacts on the automotive sector coupled with our negative equity position and a NYSE de-listing notification (as described below), may result in a decrease in (or elimination of) credit insurance available to our European and North American suppliers causing adverse payment term changes with our suppliers |
|
|
• |
disruptions to our supply chain in connection with the sourcing of materials and equipment from efforts to contain the spread of COVID-19 |
|
|
• |
negative impacts to our operations, including reductions in production levels and increased costs resulting from our efforts to mitigate the impact of COVID-19 and to protect our employees’ health and well-being, and |
43
|
|
• |
the occurrence of COVID-19 incidents at our customers’ facilities or in our facilities may interrupt our customers’ and our operations for an indeterminate period of time, and |
|
|
• |
the temporary or permanent closure of our customers’ facilities or our facilities. |
The ultimate impact that COVID-19 will have on our business, results of operations and financial condition will depend on a number of evolving factors that we may not be able to accurately predict, including: the duration and scope of the pandemic; governmental, OEMs’, suppliers’, customers’ and individuals’ actions that have been and continue to be taken in response to the pandemic and the impact of the pandemic on economic activity and actions taken in response to such impact by the OEMs’ suppliers and customers.
A delisting of our common stock from the NYSE could reduce the liquidity and market price of our common stock; reduce the number of investors and analysts that cover our common stock; limit our ability to issue additional shares, and damage our reputation which could have a material adverse impact on our business, results of operations and financial condition. In addition, a delisting of our common stock from the NYSE could cause a redemption of some or all of our outstanding redeemable preferred stock which would negatively impact our liquidity.
We are required under the NYSE continued listing standards to maintain a market capitalization of at least $50 million, over a consecutive 30 trading-day period, and maintain stockholders’ equity of at least $50 million. As of March 31, 2020, our market capitalization was less than $50 million over a consecutive 30-day trading period and our stockholders’ equity was less that the minimum threshold. As a result, on June 5, 2020, the NYSE sent us a formal notification that we were not compliance with the NYSE continued listing standards. In response, on July 20, 2020, we submitted a remediation plan to the NYSE. The NYSE has 45 days to review our plan. If the NYSE accepts our plan, we will have 18 months to cure the deficiency. The cure period effectively began on July 1, 2020 and will end on January 1, 2022. In the event that the NYSE does not accept our compliance plan or we are unable to cure the deficiency during the 18-month period, our stock may be delisted from the NYSE.
A delisting of our common stock could have a material adverse impact on our business, results of operations and financial condition by, among other things:
|
|
• |
reducing the liquidity and market price of our common stock |
|
|
• |
reducing the number of investors, including institutional investors, willing to hold or acquire our common stock, which could negatively impact our ability to raise equity |
|
|
• |
decreasing the amount of news and analyst coverage relating to us |
|
|
• |
limiting our ability to issue additional securities, obtain additional financing or pursue strategic restructuring, refinancing or other transactions, and |
|
|
• |
impacting our reputation and, as a consequence, our ability to attract new business. |
In addition, the holder of our redeemable preferred stock has the right to redeem all of the outstanding shares of redeemable preferred stock if our common stock is delisted from the NYSE. If we are delisted from the NYSE and the holder exercises its right to redeem all of the outstanding shares of redeemable preferred stock, we would be required to: (1) increase the then carrying value of the redeemable preferred stock to the $300 million redemption value through a corresponding charge (decrease) to our retained earnings, and (2) make a redemption payment in any amount up to $300 million if our Board determined, under Delaware law, that there was a “surplus” to fund a full or partial redemption and such payment would not render us insolvent. The shares of preferred stock that have not been redeemed would continue to receive a dividend of 9% per annum on the Stated Value, as defined in the Certificate of Designations, until such shares of preferred stock are redeemed. A redemption payment, if required, for some or all of our outstanding shares of preferred stock would negatively impact our liquidity and could adversely affect our business, results of operations and financial condition.
Item 2. Unregistered Sales of Equity Securities and Use of Proceeds
Not applicable.
Item 5. Other Information
Not applicable.
44
Item 6. Exhibits
|
10.1 |
|
|
|
|
|
10.5 |
|
|
|
|
|
31.1 |
|
|
|
|
|
31.2 |
|
|
|
|
|
32.1 |
|
|
|
|
|
101.INS |
Inline XBRL Instance Document—the instance document does not appear in the Interactive Data File because its XBRL tags are embedded within the Inline XBRL document ** |
|
|
|
|
101.SCH |
Inline XBRL Taxonomy Extension Schema Document ** |
|
|
|
|
101.CAL |
Inline XBRL Taxonomy Extension Calculation Linkbase Document ** |
|
|
|
|
101.LAB |
Inline XBRL Taxonomy Extension Label Linkbase Document ** |
|
|
|
|
101.PRE |
Inline XBRL Taxonomy Extension Presentation Linkbase Document ** |
|
|
|
|
101.DEF |
XBRL Taxonomy Extension Definition Linkbase Document ** |
|
|
|
|
104 |
Cover Page Interactive Data File (formatted as Inline XBRL and contained in exhibit 101) ** |
|
* |
Filed herewith. |
|
** |
Submitted electronically with the Report. |
45
SIGNATURES
Pursuant to the requirements of the Securities Exchange Act of 1934, the registrant has duly caused this report to be signed on its behalf by the undersigned thereunto duly authorized.
SUPERIOR INDUSTRIES INTERNATIONAL, INC.
(Registrant)
|
Date: August 5, 2020 |
/s/ Majdi B. Abulaban |
|
|
Majdi B. Abulaban President and Chief Executive Officer |
|
Date: August 5, 2020 |
/s/ Matti M. Masanovich |
|
|
Matti M. Masanovich Executive Vice President and Chief Financial Officer |
46