The Company’s Operations are Subject to Certain Operating Hazards Which Could Result in Unexpected Costs or Product Recalls That Could Harm the Company’s Business.
The Company’s operations are subject to certain hazards and liability risks faced by all brewers, such as potential contamination of ingredients or products by bacteria or other external agents that may be wrongfully or accidentally introduced into products or packaging, or defective packaging and handling. Such occurrences may create bad tasting beer, hard seltzer or hard ciders, or pose health risk to the consumer or risk to the integrity and safety of the packaging. These could result in unexpected costs to the Company and, in the case of a costly product recall, potentially serious damage to the Company’s reputation for product quality, as well as product liability claims.
The Company Relies Upon Complex Information Systems
The Company depends on information technology to be able to operate efficiently and interface with customers and suppliers, as well as maintain financial and accounting reporting accuracy to ensure compliance with all applicable laws. If the Company does not allocate and effectively manage the resources necessary to build and sustain the proper technology infrastructure, the Company could be subject to transaction errors, processing inefficiencies, the loss of customers, business disruptions, or the loss of or damage to intellectual property through security breach. The Company recognizes that many groups on a world-wide basis have experienced increases in cyber-attacks and other hacking activity. The Company has dedicated internal and external resources to review and address such threats. However, as with all large information technology systems, the Company’s systems could be penetrated by outside parties intent on extracting confidential or proprietary information, corrupting information, disrupting business processes, or engaging in the unauthorized use of strategic information. Such unauthorized access could disrupt business operations and could result in the loss of assets or revenues, remediation costs or damage to the Company’s reputation, as well as litigation against the Company by third parties adversely affected by the unauthorized access. Such events could have a material adverse effect on the Company’s business and financial results. The Company also relies on third parties for supply of software, software and data hosting and telecommunications and networking, and is reliant on those third parties for the quality and integrity of these complex services. Failure by a third party supplier could have material adverse effects on the Company’s ability to operate.
An Increase in Energy Costs Could Harm the Company’s Financial Results.
In the last five years, the Company has experienced significant variation in direct and indirect energy costs, and energy costs could change unpredictably. Increased energy costs would result in higher transportation, freight and other operating costs, including increases in the cost of ingredients and supplies. The Company’s future operating expenses and margins could be dependent on its ability to manage the impact of such cost increases. If energy costs increase, there is no guarantee that such costs can be fully passed along through increased prices.
Changes in Tax, Environmental and Other Regulations, Government Shutdowns or Failure to Comply with Existing Licensing, Trade or Other Regulations Could Have a Material Adverse Effect on the Company’s Financial Condition.
The Company’s business is highly regulated by federal, state and local laws and regulations regarding such matters as licensing requirements, trade and pricing practices, labeling, advertising, promotion and marketing practices, relationships with Distributors, environmental impact of operations and other matters. These laws and regulations are subject to frequent reevaluation, varying interpretations and political debate, and inquiries from governmental regulators charged with their enforcement. In addition, any delays in federal or state government
23
required approvals caused by federal or state government shutdowns, similar to the January 2019 federal government shutdown, could prevent new brands or innovations from getting to market on time or at all. Failure to comply with existing laws and regulations to which the Company’s operations are subject or any revisions to such laws and regulations or the failure to pay taxes or other fees imposed on the Company’s operations and results could result in the loss, revocation or suspension of the Company’s licenses, permits or approvals, and could have a material adverse effect on the Company’s business, financial condition and results of operations. Changes in federal and other tax rates could have a significant effect on the Company’s financial results.
There Is No Guarantee that the Company Will Not Face Litigation that Could Harm the Company’s Business.
While the Company has from time to time in the past been involved in material litigation, it is not currently a party to any pending or threatened litigation, the outcome of which would be expected to have a material adverse effect on its financial condition or the results of its operations. In general, while the Company believes it conducts its business appropriately in accordance with laws, regulations and industry guidelines, claims, whether or not meritorious, could be asserted against the Company that might adversely impact the Company’s results. See below.
Item 3 - Legal Proceedings
The Class B Shareholder Has Significant Control over the Company
The Company’s Class A Common Stock is not entitled to any voting rights except for the right as a class to (1) approve certain mergers, charter amendments and
by-law
amendments and (2) elect a minority of the directors of the Company. Although not as a matter of right, the Class A stockholders have also been afforded the opportunity to vote on an advisory basis on executive compensation. Consequently, the election of a majority of the Company’s directors and all other matters requiring stockholder approval are currently decided by C. James Koch, who is the founder and Chairman of the Company, as the holder of 100% of the voting rights to the outstanding shares of the Company’s Class B Common Stock. As a result, Mr. Koch is able to exercise substantial influence over all matters requiring stockholder approval, including the composition of the board of directors, approval of equity-based and other executive compensation and other significant corporate and governance matters, such as approval of the Company’s independent registered public accounting firm. This could have the effect of delaying or preventing a change in control of the Company and makes most material transactions difficult or impossible to accomplish without the support of Mr. Koch. While Mr. Koch is currently the 100% holder of the Company’s Class B Common Stock, there is nothing that prevents Mr. Koch or his heirs from transferring some or all shares of the Class B Common Stock to others.The Company’s Operating Results and Cash Flow May Be Adversely Affected by Unfavorable Economic, Financial and Societal Market Conditions.
Volatility and uncertainty in the financial markets and economic conditions may directly or indirectly affect the Company’s performance and operating results in a variety of ways, including: (a) prices for energy and agricultural products may rise faster than current estimates, including increases resulting from currency fluctuations; (b) the Company’s key suppliers may not be able to fund their capital requirements, resulting in disruption in the supplies of the Company’s raw and packaging materials; (c) the credit risks of the Company’s Distributors may increase; (d) the impact of currency fluctuations on amounts owed to the Company by distributors that pay in foreign currencies; (e) the Company’s credit facility, or portion thereof, may become unavailable at a time when needed by the Company to meet critical needs; (f) overall beer consumption may decline; or (g) drinkers of the Company’s products may change their purchase preferences and frequency, which might result in sales declines.
Item 1B. |
Unresolved Staff Comments |
The Company has not received any written comments from the staff of the Securities and Exchange Commission (the “SEC”) regarding the Company’s periodic or current reports that (1) the Company believes are material,
24
(2) were issued not less than 180 days before the end of the Company’s 2019 fiscal year, and (3) remain unresolved.
Item 2. |
Properties |
The Company maintains its principal corporate offices in approximately 54,200 square feet of leased space located in Boston, Massachusetts, the term of which is set to expire in 2031.
The Company owns approximately 76 acres of land in Breinigsville, Pennsylvania, consisting of the two parcels on which the Company’s Pennsylvania Brewery is located. The buildings on this property consist of approximately 1 million square feet of brewery and warehouse space.
The Company owns approximately 57 acres of land in Milton, Delaware, consisting of the two parcels on which the Company’s Milton Brewery is located. The buildings on this property consist of approximately 240,000 square feet of brewery and warehouse space.
The Company owns approximately 10 acres of land in Cincinnati, Ohio, on which the Company’s Cincinnati Brewery is located, and leases, with an option to purchase, approximately 1 acre of land from the City of Cincinnati which abuts its property. The buildings on this property consist of approximately 128,500 square feet of brewery and warehouse space.
The Company owns approximately 62 acres of land in Walden, New York, consisting of an apple orchard and certain buildings, including a small cidery and tour center. The small cidery and tour center on this property consist of approximately 15,000 square feet of space.
The Company owns approximately 1 acre of land in Lewes, Delaware, on which the Company’s Dogfish Head Inn is located. The buildings on this property consists of approximately 8,400 square feet of space.
The Company leases approximately 43,000 square feet of space in Boston, Massachusetts, on which it maintains a Samuel Adams brand tap room and tour center. The current term of the lease for this facility will expire in 2029, although it has an option to extend the term for an additional fifteen years in five year increments.
The Company leases approximately 48,650 square feet of space in Los Angeles, California, on which it maintains an Angel City brand tap room, small brewery and tour center. The current term of the lease for this facility will expire in 2021.
The Company leases approximately 11,365 square feet of space in Miami, Florida, on which it maintains a Concrete Beach brand tap room, small brewery and tour center. The current term of the lease for this facility will expire in 2023.
The Company leases approximately 9,000 square feet of space in Boston, Massachusetts, on which it maintains a Samuel Adams brand tap room and small brewery. The current term of the lease for this facility will expire in 2028, although it has two options to extend the term for an additional 5 years.
The Company leases approximately 8,900 square feet of space in Cincinnati, Ohio, on which it maintains a Samuel Adams brand tap room and small brewery. The current term of the lease for this facility will expire in 2028.
The Company leases approximately 7,100 square feet of space within the retail section of MCU Park in Brooklyn, New York on which it maintains a Coney Island brand tap room and small brewery. The current term of the lease for this facility will expire in 2020, although it has an option to extend the term for an additional 5 years.
25
The Company leases approximately 4,490 square feet of space in Rehoboth, DE, on which it maintains Dogfish Head Brewing and Eats, a tap room small brewery and the Chesapeake & Maine restaurant. The current term of the lease for this facility will expire in 2029.
The Company also leases a small office in Burlington, Vermont and Montreal, Quebec.
The Company believes that its facilities are adequate for its current needs and that suitable additional space will be available on commercially acceptable terms as required.
Item 3. |
Legal Proceedings |
The Company is currently not a party to any pending or threatened litigation, the outcome of which would be expected to have a material adverse effect on its financial condition or the results of its operations.
Item 4. |
Mine Safety Disclosures |
Not Applicable
PART II.
Item 5. |
Market for Registrant’s Common Equity, Related Stockholder Matters and Issuer Purchases of Equity Securities |
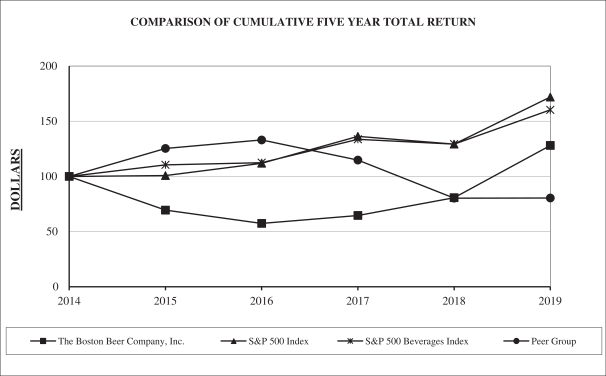
The graph set forth below shows the value of an investment of $100 on January 1, 2015 in each of the Company’s stock (“The Boston Beer Company, Inc.”), the Standard & Poor’s 500 Index (“S&P 500 Index”), the Standard & Poor’s 500 Beverage Index, which consists of producers of alcoholic and
non-alcoholic
beverages (“S&P 500 Beverages Index”) and a custom peer group which consists of Molson Coors Beverage Company and Craft Brewers Alliance, Inc., the two remaining U.S. publicly-traded brewing companies (“Peer Group”), for the five years ending December 28, 2019.Total Return To Shareholders
(Includes reinvestment of dividends)
| ANNUAL RETURN PERCENTAGE Years Ending |
||||||||||||||||||||
| Company Name / Index |
12/26/15 |
12/31/16 |
12/30/17 |
12/29/18 |
12/28/19 |
|||||||||||||||
| The Boston Beer Company, Inc. |
-30.55 |
-17.31 |
12.51 |
24.97 |
58.59 |
|||||||||||||||
| S&P 500 Index |
0.77 |
11.07 |
21.83 |
-5.20 |
32.97 |
|||||||||||||||
| S&P 500 Beverages Index |
10.52 |
1.77 |
18.84 |
-3.29 |
23.99 |
|||||||||||||||
| Peer Group |
25.35 |
6.10 |
-13.68 |
-30.08 |
0.20 |
|||||||||||||||
| INDEXED RETURNS Years Ending |
||||||||||||||||||||||||
| Company Name / Index |
Base Period 12/27/14 |
12/26/15 |
12/31/16 |
12/30/17 |
12/29/18 |
12/28/19 |
||||||||||||||||||
| The Boston Beer Company, Inc. |
100 |
69.45 |
57.43 |
64.62 |
80.75 |
128.07 |
||||||||||||||||||
| S&P 500 Index |
100 |
100.77 |
111.92 |
136.35 |
129.26 |
171.88 |
||||||||||||||||||
| S&P 500 Beverages Index |
100 |
110.52 |
112.48 |
133.67 |
129.27 |
160.29 |
||||||||||||||||||
| Peer Group |
100 |
125.35 |
133.00 |
114.81 |
80.27 |
80.43 |
||||||||||||||||||
26
Peer Group Companies
Craft Brew Alliance Inc
Molson Coors Brewing Company
The Company’s Class A Common Stock is listed for trading on the New York Stock Exchange under the symbol SAM.
There were 8,477 holders of record of the Company’s Class A Common Stock as of February 14, 2020. Excluded from the number of stockholders of record are stockholders who hold shares in “nominee” or “street” name. The closing price per share of the Company’s Class A Common Stock as of February 14, 2020, as reported under the New York Stock Exchange-Composite Transaction Reporting System, was $408.91.
Class A Common Stock
At December 28, 2019, the Company had 22,700,000 authorized shares of Class A Common Stock with a par value of $.01, of which 9,470,397 were issued and outstanding, which includes 99,871 shares that have trading restrictions. The Class A Common Stock has no voting rights, except (1) as required by law, (2) for the election of Class A Directors, and (3) that the approval of the holders of the Class A Common Stock is required for (a) future authorizations or issuances of additional securities which have rights senior to Class A Common Stock, (b) alterations of rights or terms of the Class A or Class B Common Stock as set forth in the Articles of Organization of the Company, (c) certain other amendments of the Articles of Organization of the Company, (d) certain mergers or consolidations with, or acquisitions of, other entities, and (e) sales or dispositions of any significant portion of the Company’s assets.
Class B Common Stock
At December 28, 2019, the Company had 4,200,000 authorized shares of Class B Common Stock with a par value of $.01, of which 2,672,983 shares were issued and outstanding. The Class B Common Stock has full
27