Exhibit 99.1
 |
TD
Bank Group Reports Third Quarter 2016 Results |
The financial information in this document is reported in Canadian dollars, and is based on the Bank's unaudited Interim Consolidated Financial Statements and related Notes prepared in accordance with International Financial Reporting Standards (IFRS) as issued by the International Accounting Standards Board (IASB), unless otherwise noted. Reported results conform to generally accepted accounting principles (GAAP), in accordance with IFRS. Adjusted measures are non-GAAP measures. Refer to the "How the Bank Reports" section of the Management's Discussion and Analysis (MD&A) for an explanation of reported and adjusted results. |
THIRD QUARTER FINANCIAL HIGHLIGHTS, compared with the third quarter a year ago:
| • | Reported diluted earnings per share were $1.24, compared with $1.19. |
| • | Adjusted diluted earnings per share were $1.27, compared with $1.20. |
| • | Reported net income was $2,358 million, compared with $2,266 million. |
| • | Adjusted net income was $2,416 million, compared with $2,285 million. |
YEAR-TO-DATE FINANCIAL HIGHLIGHTS, nine months ended July 31, 2016, compared with the corresponding period a year ago:
| • | Reported diluted earnings per share were $3.47, compared with $3.25. |
| • | Adjusted diluted earnings per share were $3.64, compared with $3.47. |
| • | Reported net income was $6,633 million, compared with $6,185 million. |
| • | Adjusted net income was $6,945 million, compared with $6,577 million. |
THIRD QUARTER ADJUSTMENT (ITEMS OF NOTE)
The third quarter reported earnings figures included the following item of note:
| • | Amortization of intangibles of $58 million after tax (3 cents per share), compared with $62 million after tax (3 cents per share) in the third quarter a year ago. |
TORONTO, August 25, 2016 – TD Bank Group ("TD" or the "Bank") today announced its financial results for the third quarter ending July 31, 2016, reflecting growth in retail and wholesale earnings.
"TD's results demonstrate the strength of our diversified business model, with adjusted earnings of $2.4 billion, up 6% from the third quarter last year," said Bharat Masrani, Group President and Chief Executive Officer. "Our performance reflects both organic growth and a focus on expense management."
Canadian
Retail
Canadian Retail net income was $1.5 billion compared with $1.6 billion in the same quarter last year. Revenue grew 3%
compared with the third quarter last year and was more than offset by higher insurance claims largely due to the Fort McMurray
wildfire, and a higher effective tax rate.
U.S.
Retail
U.S. Retail net income was $788 million (US$609 million) this quarter compared with $674 million (US$543 million)
on a reported basis and $650 million (US$524 million) on an adjusted basis in the third quarter last year.
The U.S. Retail Bank, which excludes the Bank's investment in TD Ameritrade, generated net income of $663 million (US$512 million), an increase of 14% (9% in U.S. dollars) on a reported basis and 19% (14% in U.S. dollars) on an adjusted basis compared with the third quarter last year. Earnings reflect revenue and customer balance growth and a focus on expense management.
TD Ameritrade contributed $125 million (US$97 million) in earnings to the segment, an increase of 36% (31% in U.S. dollars) compared with the third quarter last year reflecting asset growth, higher trading volumes, and a favourable tax liability adjustment, partially offset by higher operating expenses.
Wholesale Banking
Wholesale Banking net income was $302 million, an increase of 26% compared with the third quarter last year, reflecting higher
origination activity across debt and equity capital markets, corporate lending growth and trading-related revenue.
Capital
Common Equity Tier 1 Capital ratio on a Basel III fully phased-in basis was 10.4%, compared with 10.1% last quarter.
Conclusion
"This quarter we were pleased to mark a milestone of 500,000 downloads of our TD MySpend money management app, which helps
our customers track their spending and saving," said Masrani. "We remain focused on going above and
beyond for our customers by providing legendary service and convenience while investing for the future to meet their evolving
needs."
The foregoing contains forward-looking statements. Please refer to the "Caution Regarding Forward-Looking Statements" on page 2.
| TD BANK GROUP • THIRD QUARTER 2016 • REPORT TO SHAREHOLDERS | Page 1 |
CONTENTS
| 1 | THIRD QUARTER FINANCIAL HIGHLIGHTS and | 28 | Managing Risk |
| ADJUSTMENTS (ITEMS OF NOTE) | 42 | Securitization and Off-Balance Sheet Arrangements | |
| 44 | Accounting Policies and Estimates | ||
| 45 | Changes in Internal Control over Financial Reporting | ||
| MANAGEMENT'S DISCUSSION AND ANALYSIS | INTERIM CONSOLIDATED FINANCIAL STATEMENTS | ||
| 3 | Financial Highlights | 46 | Interim Consolidated Balance Sheet |
| 4 | How We Performed | 47 | Interim Consolidated Statement of Income |
| 6 | Financial Results Overview | 48 | Interim Consolidated Statement of Comprehensive Income |
| 11 | How Our Businesses Performed | 49 | Interim Consolidated Statement of Changes in Equity |
| 17 | Quarterly Results | 50 | Interim Consolidated Statement of Cash Flows |
| 18 | Balance Sheet Review | 51 | Notes to Interim Consolidated Financial Statements |
| 18 | Credit Portfolio Quality | ||
| 25 | Capital Position | 76 | SHAREHOLDER AND INVESTOR INFORMATION |
Caution Regarding Forward-Looking Statements
From time to time, the Bank (as defined in this document) makes written and/or oral forward-looking statements, including in this document, in other filings with Canadian regulators or the United States (U.S.) Securities and Exchange Commission (SEC), and in other communications. In addition, representatives of the Bank may make forward-looking statements orally to analysts, investors, the media and others. All such statements are made pursuant to the "safe harbour" provisions of, and are intended to be forward-looking statements under, applicable Canadian and U.S. securities legislation, including the U.S. Private Securities Litigation Reform Act of 1995. Forward-looking statements include, but are not limited to, statements made in this document, the Management's Discussion and Analysis ("2015 MD&A") in the Bank's 2015 Annual Report under the heading "Economic Summary and Outlook", for each business segment under headings "Business Outlook and Focus for 2016", and in other statements regarding the Bank's objectives and priorities for 2016 and beyond and strategies to achieve them, the regulatory environment in which the Bank operates, and the Bank's anticipated financial performance. Forward-looking statements are typically identified by words such as "will", "should", "believe", "expect", "anticipate", "intend", "estimate", "plan", "may", and "could".
By their very nature, these forward-looking statements require the Bank to make assumptions and are subject to inherent risks and uncertainties, general and specific. Especially in light of the uncertainty related to the physical, financial, economic, political, and regulatory environments, such risks and uncertainties – many of which are beyond the Bank's control and the effects of which can be difficult to predict – may cause actual results to differ materially from the expectations expressed in the forward-looking statements. Risk factors that could cause, individually or in the aggregate, such differences include: credit, market (including equity, commodity, foreign exchange, and interest rate), liquidity, operational (including technology and infrastructure), reputational, insurance, strategic, regulatory, legal, environmental, capital adequacy, and other risks. Examples of such risk factors include the general business and economic conditions in the regions in which the Bank operates; the ability of the Bank to execute on key priorities, including the successful completion of acquisitions, business retention, and strategic plans and to attract, develop and retain key executives; disruptions in or attacks (including cyber-attacks) on the Bank's information technology, internet, network access or other voice or data communications systems or services; the evolution of various types of fraud or other criminal behaviour to which the Bank is exposed; the failure of third parties to comply with their obligations to the Bank or its affiliates, including relating to the care and control of information; the impact of new and changes to, or application of, current laws and regulations, including without limitation tax laws, risk-based capital guidelines and liquidity regulatory guidance; the overall difficult litigation environment, including in the U.S.; increased competition, including through internet and mobile banking and non-traditional competitors; changes to the Bank's credit ratings; changes in currency and interest rates (including the possibility of negative interest rates); increased funding costs and market volatility due to market illiquidity and competition for funding; critical accounting estimates and changes to accounting standards, policies, and methods used by the Bank; existing and potential international debt crises; and the occurrence of natural and unnatural catastrophic events and claims resulting from such events. The Bank cautions that the preceding list is not exhaustive of all possible risk factors and other factors could also adversely affect the Bank's results. For more detailed information, please refer to the "Risk Factors and Management" section of the 2015 MD&A, as may be updated in subsequently filed quarterly reports to shareholders and news releases (as applicable) related to any transactions or events discussed under the heading "Significant Events" in the relevant MD&A, which applicable releases may be found on www.td.com. All such factors should be considered carefully, as well as other uncertainties and potential events, and the inherent uncertainty of forward-looking statements, when making decisions with respect to the Bank and the Bank cautions readers not to place undue reliance on the Bank's forward-looking statements.
Material economic assumptions underlying the forward-looking statements contained in this document are set out in the 2015 MD&A under the headings "Economic Summary and Outlook", and for each business segment, "Business Outlook and Focus for 2016", each as may be updated in subsequently filed quarterly reports to shareholders.
Any forward-looking statements contained in this document represent the views of management only as of the date hereof and are presented for the purpose of assisting the Bank's shareholders and analysts in understanding the Bank's financial position, objectives and priorities and anticipated financial performance as at and for the periods ended on the dates presented, and may not be appropriate for other purposes. The Bank does not undertake to update any forward-looking statements, whether written or oral, that may be made from time to time by or on its behalf, except as required under applicable securities legislation.
This document was reviewed by the Bank's Audit Committee and was approved by the Bank's Board of Directors, on the Audit Committee's recommendation, prior to its release.
| TD BANK GROUP • THIRD QUARTER 2016 • REPORT TO SHAREHOLDERS | Page 2 |
MANAGEMENT'S DISCUSSION AND ANALYSIS OF OPERATING PERFORMANCE
This MD&A is presented to enable readers to assess material changes in the financial condition and operating results of TD Bank Group ("TD" or the "Bank") for the three and nine months ended July 31, 2016, compared with the corresponding periods shown. This MD&A should be read in conjunction with the Bank's unaudited Interim Consolidated Financial Statements and related Notes included in this Report to Shareholders and with the 2015 Consolidated Financial Statements and related Notes and 2015 MD&A. This MD&A is dated August 24, 2016. Unless otherwise indicated, all amounts are expressed in Canadian dollars and have been primarily derived from the Bank's 2015 Consolidated Financial Statements and related Notes or Interim Consolidated Financial Statements and related Notes, prepared in accordance with IFRS as issued by the IASB. Note that certain comparative amounts have been restated/reclassified to conform with the presentation adopted in the current period. Additional information relating to the Bank, including the Bank's 2015 Annual Information Form, is available on the Bank's website at http://www.td.com, as well as on SEDAR at http://www.sedar.com and on the SEC's website at http://www.sec.gov (EDGAR filers section).
| TABLE 1: FINANCIAL HIGHLIGHTS | ||||||||||||||||
| (millions of Canadian dollars, except as noted) | As at or for the three months ended | As at or for the nine months ended | ||||||||||||||
| July 31 | April 30 | July 31 | July 31 | July 31 | ||||||||||||
| 2016 | 2016 | 2015 | 2016 | 2015 | ||||||||||||
| Results of operations | ||||||||||||||||
| Total revenue | $ | 8,701 | $ | 8,259 | $ | 8,006 | $ | 25,570 | $ | 23,379 | ||||||
| Provision for credit losses | 556 | 584 | 437 | 1,782 | 1,174 | |||||||||||
| Insurance claims and related expenses | 692 | 530 | 600 | 1,877 | 1,863 | |||||||||||
| Non-interest expenses | 4,640 | 4,736 | 4,292 | 14,029 | 13,162 | |||||||||||
| Net income – reported | 2,358 | 2,052 | 2,266 | 6,633 | 6,185 | |||||||||||
| Net income – adjusted1 | 2,416 | 2,282 | 2,285 | 6,945 | 6,577 | |||||||||||
| Return on common equity – reported | 14.1 | % | 12.5 | % | 14.9 | % | 13.3 | % | 14.2 | % | ||||||
| Return on common equity – adjusted2 | 14.5 | 14.0 | 15.0 | 14.0 | 15.1 | |||||||||||
| Financial position | ||||||||||||||||
| Total assets | $ | 1,182,436 | $ | 1,124,786 | $ | 1,099,202 | $ | 1,182,436 | $ | 1,099,202 | ||||||
| Total equity | 71,204 | 67,823 | 65,965 | 71,204 | 65,965 | |||||||||||
| Total Common Equity Tier 1 Capital risk-weighted assets3 | 388,243 | 383,589 | 369,495 | 388,243 | 369,495 | |||||||||||
| Financial ratios | ||||||||||||||||
| Efficiency ratio – reported | 53.3 | % | 57.3 | % | 53.6 | % | 54.9 | % | 56.3 | % | ||||||
| Efficiency ratio – adjusted1 | 52.6 | 54.8 | 53.4 | 53.6 | 54.0 | |||||||||||
| Common Equity Tier 1 Capital ratio3 | 10.4 | 10.1 | 10.1 | 10.4 | 10.1 | |||||||||||
| Tier 1 Capital ratio3 | 11.9 | 11.7 | 11.5 | 11.9 | 11.5 | |||||||||||
| Total Capital ratio3 | 14.6 | 14.4 | 13.9 | 14.6 | 13.9 | |||||||||||
| Leverage ratio | 3.8 | 3.8 | 3.7 | 3.8 | 3.7 | |||||||||||
| Provision for credit losses as a % of net average loans | ||||||||||||||||
| and acceptances4 | 0.39 | 0.42 | 0.33 | 0.42 | 0.31 | |||||||||||
| Common share information – reported (dollars) | ||||||||||||||||
| Per share earnings | ||||||||||||||||
| Basic | $ | 1.24 | $ | 1.07 | $ | 1.20 | $ | 3.48 | $ | 3.26 | ||||||
| Diluted | 1.24 | 1.07 | 1.19 | 3.47 | 3.25 | |||||||||||
| Dividends per share | 0.55 | 0.55 | 0.51 | 1.61 | 1.49 | |||||||||||
| Book value per share | 35.68 | 33.89 | 33.25 | 35.68 | 33.25 | |||||||||||
| Closing share price | 56.89 | 55.85 | 52.77 | 56.89 | 52.77 | |||||||||||
| Shares outstanding (millions) | ||||||||||||||||
| Average basic | 1,853.4 | 1,850.9 | 1,851.1 | 1,852.8 | 1,847.9 | |||||||||||
| Average diluted | 1,856.6 | 1,853.9 | 1,855.7 | 1,856.1 | 1,853.0 | |||||||||||
| End of period | 1,854.8 | 1,853.5 | 1,853.6 | 1,854.8 | 1,853.6 | |||||||||||
| Market capitalization (billions of Canadian dollars) | $ | 105.5 | $ | 103.5 | $ | 97.8 | $ | 105.5 | $ | 97.8 | ||||||
| Dividend yield | 3.8 | % | 4.0 | % | 3.7 | % | 4.0 | % | 3.6 | % | ||||||
| Dividend payout ratio | 44.5 | 51.2 | 42.7 | 46.3 | 45.7 | |||||||||||
| Price-earnings ratio | 12.8 | 12.7 | 12.7 | 12.8 | 12.7 | |||||||||||
| Common share information – adjusted (dollars)1 | ||||||||||||||||
| Per share earnings | ||||||||||||||||
| Basic | $ | 1.27 | $ | 1.20 | $ | 1.21 | $ | 3.65 | $ | 3.47 | ||||||
| Diluted | 1.27 | 1.20 | 1.20 | 3.64 | 3.47 | |||||||||||
| Dividend payout ratio | 43.4 | % | 45.9 | % | 42.3 | % | 44.1 | % | 42.9 | % | ||||||
| Price-earnings ratio | 11.9 | 11.8 | 11.9 | 11.9 | 11.9 | |||||||||||
| 1 | Adjusted measures are non-GAAP measures. Refer to the "How the Bank Reports" section of this document for an explanation of reported and adjusted results. |
| 2 | Adjusted return on common equity is a non-GAAP financial measure. Refer to the "Return on Common Equity" section of this document for an explanation. |
| 3 | Each capital ratio has its own risk-weighted assets (RWA) measure due to the Office of the Superintendent of Financial Institutions Canada (OSFI) prescribed scalar for inclusion of the Credit Valuation Adjustment (CVA). The scalars for inclusion of CVA for Common Equity Tier 1 (CET1), Tier 1, and Total Capital RWA are 64%, 71%, and 77%, respectively. |
| 4 | Excludes acquired credit-impaired (ACI) loans and debt securities classified as loans. For additional information on ACI loans, refer to the "Credit Portfolio Quality" section of the MD&A and Note 5 of the Interim Consolidated Financial Statements. For additional information on debt securities classified as loans, refer to the "Exposure to Non-Agency Collateralized Mortgage Obligations" discussion and tables in the "Credit Portfolio Quality" section of the MD&A and Note 5 of the Interim Consolidated Financial Statements. |
| TD BANK GROUP • THIRD QUARTER 2016 • REPORT TO SHAREHOLDERS | Page 3 |
HOW WE PERFORMED
Corporate Overview
The Toronto-Dominion Bank and its subsidiaries are collectively known as TD Bank Group. TD is the sixth largest bank in North America by branches and serves approximately 25 million customers in three key businesses operating in a number of locations in financial centres around the globe: Canadian Retail, U.S. Retail, and Wholesale Banking. TD also ranks among the world's leading online financial services firms, with approximately 10.8 million active online and mobile customers. TD had $1.2 trillion in assets as at July 31, 2016. The Toronto-Dominion Bank trades under the symbol "TD" on the Toronto and New York Stock Exchanges.
How the Bank Reports
The Bank prepares its Interim Consolidated Financial Statements in accordance with IFRS, the current GAAP, and refers to results prepared in accordance with IFRS as "reported" results. The Bank also utilizes non-GAAP financial measures referred to as "adjusted" results to assess each of its businesses and to measure the Bank's overall performance. To arrive at adjusted results, the Bank removes "items of note", net of income taxes, from reported results. The items of note relate to items which management does not believe are indicative of underlying business performance. The Bank believes that adjusted results provide the reader with a better understanding of how management views the Bank's performance. The items of note are disclosed in Table 3. As explained, adjusted results differ from reported results determined in accordance with IFRS. Adjusted results, items of note, and related terms used in this document are not defined terms under IFRS and, therefore, may not be comparable to similar terms used by other issuers.
| TABLE 2: OPERATING RESULTS – Reported | ||||||||||||
| (millions of Canadian dollars) | For the three months ended | For the nine months ended | ||||||||||
| July 31 | April 30 | July 31 | July 31 | July 31 | ||||||||
| 2016 | 2016 | 2015 | 2016 | 2015 | ||||||||
| Net interest income | $ | 4,924 | $ | 4,880 | $ | 4,697 | $ | 14,851 | $ | 13,837 | ||
| Non-interest income | 3,777 | 3,379 | 3,309 | 10,719 | 9,542 | |||||||
| Total revenue | 8,701 | 8,259 | 8,006 | 25,570 | 23,379 | |||||||
| Provision for credit losses | 556 | 584 | 437 | 1,782 | 1,174 | |||||||
| Insurance claims and related expenses | 692 | 530 | 600 | 1,877 | 1,863 | |||||||
| Non-interest expenses | 4,640 | 4,736 | 4,292 | 14,029 | 13,162 | |||||||
| Income before income taxes and equity in net income of an | ||||||||||||
| investment in TD Ameritrade | 2,813 | 2,409 | 2,677 | 7,882 | 7,180 | |||||||
| Provision for income taxes | 576 | 466 | 502 | 1,588 | 1,264 | |||||||
| Equity in net income of an investment in TD Ameritrade | 121 | 109 | 91 | 339 | 269 | |||||||
| Net income – reported | 2,358 | 2,052 | 2,266 | 6,633 | 6,185 | |||||||
| Preferred dividends | 36 | 37 | 25 | 98 | 73 | |||||||
| Net income available to common shareholders and non-controlling | ||||||||||||
| interests in subsidiaries | $ | 2,322 | $ | 2,015 | $ | 2,241 | $ | 6,535 | $ | 6,112 | ||
| Attributable to: | ||||||||||||
| Common shareholders | $ | 2,293 | $ | 1,987 | $ | 2,213 | $ | 6,449 | $ | 6,029 | ||
| Non-controlling interests | 29 | 28 | 28 | 86 | 83 | |||||||
| TD BANK GROUP • THIRD QUARTER 2016 • REPORT TO SHAREHOLDERS | Page 4 |
The following table provides a reconciliation between the Bank's adjusted and reported results.
| TABLE 3: NON-GAAP FINANCIAL MEASURES – Reconciliation of Adjusted to Reported Net Income | ||||||||||||
| (millions of Canadian dollars) | For the three months ended | For the nine months ended | ||||||||||
| July 31 | April 30 | July 31 | July 31 | July 31 | ||||||||
| 2016 | 2016 | 2015 | 2016 | 2015 | ||||||||
| Operating results – adjusted | ||||||||||||
| Net interest income | $ | 4,924 | $ | 4,880 | $ | 4,697 | $ | 14,851 | $ | 13,837 | ||
| Non-interest income1 | 3,777 | 3,437 | 3,288 | 10,731 | 9,504 | |||||||
| Total revenue | 8,701 | 8,317 | 7,985 | 25,582 | 23,341 | |||||||
| Provision for credit losses | 556 | 584 | 437 | 1,782 | 1,174 | |||||||
| Insurance claims and related expenses | 692 | 530 | 600 | 1,877 | 1,863 | |||||||
| Non-interest expenses2 | 4,577 | 4,556 | 4,261 | 13,712 | 12,596 | |||||||
| Income before income taxes and equity in net income of an | ||||||||||||
| investment in TD Ameritrade | 2,876 | 2,647 | 2,687 | 8,211 | 7,708 | |||||||
| Provision for income taxes3 | 597 | 491 | 508 | 1,654 | 1,445 | |||||||
| Equity in net income of an investment in TD Ameritrade4 | 137 | 126 | 106 | 388 | 314 | |||||||
| Net income – adjusted | 2,416 | 2,282 | 2,285 | 6,945 | 6,577 | |||||||
| Preferred dividends | 36 | 37 | 25 | 98 | 73 | |||||||
| Net income available to common shareholders and non-controlling | ||||||||||||
| interests in subsidiaries – adjusted | 2,380 | 2,245 | 2,260 | 6,847 | 6,504 | |||||||
| Attributable to: | ||||||||||||
| Non-controlling interests in subsidiaries, net of income taxes | 29 | 28 | 28 | 86 | 83 | |||||||
| Net income available to common shareholders – adjusted | 2,351 | 2,217 | 2,232 | 6,761 | 6,421 | |||||||
| Adjustments for items of note, net of income taxes | ||||||||||||
| Amortization of intangibles5 | (58) | (63) | (62) | (186) | (190) | |||||||
| Fair value of derivatives hedging the reclassified available-for-sale | ||||||||||||
| securities portfolio6 | – | (51) | 19 | (10) | 34 | |||||||
| Impairment of goodwill, non-financial assets, and other charges7 | – | (116) | – | (116) | – | |||||||
| Restructuring charges8 | – | – | – | – | (228) | |||||||
| Litigation and litigation-related charge(s)/reserve(s)9 | – | – | 24 | – | (8) | |||||||
| Total adjustments for items of note | (58) | (230) | (19) | (312) | (392) | |||||||
| Net income available to common shareholders – reported | $ | 2,293 | $ | 1,987 | $ | 2,213 | $ | 6,449 | $ | 6,029 | ||
| 1 | Adjusted non-interest income excludes the following items of note: second quarter 2016 – $58 million loss due to change in fair value of derivatives hedging the reclassified available-for-sale (AFS) securities portfolio as explained in footnote 6; first quarter 2016 – $46 million gain due to change in fair value of derivatives hedging the reclassified AFS securities portfolio; third quarter 2015 – $21 million gain due to change in fair value of derivatives hedging the reclassified AFS securities portfolio; second quarter 2015 – $17 million gain due to change in fair value of derivatives hedging the reclassified AFS securities portfolio. These amounts were reported in the Corporate segment. |
| 2 | Adjusted non-interest expenses excludes the following items of note: third quarter 2016 – $63 million amortization of intangibles, as explained in footnote 5; second quarter 2016 – $69 million amortization of intangibles; $111 million impairment of goodwill, certain intangibles, other non-financial assets, and other charges, as further explained in footnote 7; first quarter 2016 – $74 million amortization of intangibles; third quarter 2015 – $70 million amortization of intangibles; $39 million recovery of litigation losses, as explained in footnote 9; second quarter 2015 – $73 million amortization of intangibles; $337 million due to the initiatives to reduce costs, as explained in footnote 8; $52 million of litigation charges; first quarter 2015 – $73 million amortization of intangibles. These amounts were reported in the Corporate segment, with the exception of litigation and litigation-related charge(s)/reserve(s) which were reported in the U.S. Retail segment. |
| 3 | For a reconciliation between reported and adjusted provision for income taxes, refer to the "Non-GAAP Financial Measures – Reconciliation of Reported to Adjusted Provision for Income Taxes" table in the "Income Taxes" section of the MD&A. |
| 4 | Adjusted equity in net income of an investment in TD Ameritrade excludes the following items of note: third quarter 2016 – $16 million amortization of intangibles, as explained in footnote 5; second quarter 2016 – $17 million amortization of intangibles; first quarter 2016 – $16 million amortization of intangibles; third quarter 2015 – $15 million amortization of intangibles; second quarter 2015 – $16 million amortization of intangibles; first quarter 2015 – $14 million amortization of intangibles. These amounts were reported in the Corporate segment. |
| 5 | Amortization of intangibles relate to intangibles acquired as a result of asset acquisitions and business combinations. Although the amortization of software and asset servicing rights are recorded in amortization of intangibles, they are not included for purposes of the items of note. |
| 6 | The Bank changed its trading strategy with respect to certain trading debt securities and reclassified these securities from trading to the AFS category effective August 1, 2008. These debt securities are economically hedged, primarily with credit default swap and interest rate swap contracts which are recorded on a fair value basis with changes in fair value recorded in the period's earnings. Management believes that this asymmetry in the accounting treatment between derivatives and the reclassified debt securities results in volatility in earnings from period to period that is not indicative of the economics of the underlying business performance in Wholesale Banking. The Bank may from time to time replace securities within the portfolio to best utilize the initial, matched fixed term funding. As a result, the derivatives are accounted for on an accrual basis in Wholesale Banking and the gains and losses related to the derivatives in excess of the accrued amounts are reported in the Corporate segment. Adjusted results of the Bank exclude the gains and losses of the derivatives in excess of the accrued amount. |
| 7 | In the second quarter of 2016, the Bank recorded impairment losses on goodwill, certain intangibles, other non-financial assets and deferred tax assets, as well as other charges relating to the Direct Investing business in Europe that has been experiencing continued losses. These amounts are reported in the Corporate segment. |
| 8 | During 2015, the Bank commenced its restructuring review and recorded restructuring charges of $337 million ($228 million after tax) and $349 million ($243 million after tax) on a net basis, in the second quarter and fourth quarter of 2015, respectively. The restructuring initiatives were intended to reduce costs and manage expenses in a sustainable manner and to achieve greater operational efficiencies. These measures included process redesign and business restructuring, retail branch and real estate optimization, and organizational review. The restructuring charges have been recorded as an adjustment to net income within the Corporate segment. |
| 9 | As a result of an adverse judgment and evaluation of certain other developments and exposures in the U.S. in 2015, the Bank took prudent steps to reassess its litigation provision. Having considered these factors, including related or analogous cases, the Bank determined, in accordance with applicable accounting standards, that an increase of $52 million ($32 million after tax) to the Bank’s litigation provision was required in the second quarter of 2015. During the third quarter of 2015, distributions of $39 million ($24 million after tax) were received by the Bank as a result of previous settlements reached on certain matters in the U.S., whereby the Bank was assigned the right to these distributions, if and when made available. The amount in the third quarter of 2015 reflects this recovery of previous settlements. |
| TD BANK GROUP • THIRD QUARTER 2016 • REPORT TO SHAREHOLDERS | Page 5 |
| TABLE 4: RECONCILIATION OF REPORTED TO ADJUSTED EARNINGS PER SHARE (EPS)1 | |||||||||||
| (Canadian dollars) | For the three months ended | For the nine months ended | |||||||||
| July 31 | April 30 | July 31 | July 31 | July 31 | |||||||
| 2016 | 2016 | 2015 | 2016 | 2015 | |||||||
| Basic earnings per share – reported | $ | 1.24 | $ | 1.07 | $ | 1.20 | $ | 3.48 | $ | 3.26 | |
| Adjustments for items of note2 | 0.03 | 0.13 | 0.01 | 0.17 | 0.21 | ||||||
| Basic earnings per share – adjusted | $ | 1.27 | $ | 1.20 | $ | 1.21 | $ | 3.65 | $ | 3.47 | |
| Diluted earnings per share – reported | $ | 1.24 | $ | 1.07 | $ | 1.19 | $ | 3.47 | $ | 3.25 | |
| Adjustments for items of note2 | 0.03 | 0.13 | 0.01 | 0.17 | 0.22 | ||||||
| Diluted earnings per share – adjusted | $ | 1.27 | $ | 1.20 | $ | 1.20 | $ | 3.64 | $ | 3.47 | |
| 1 | EPS is computed by dividing net income available to common shareholders by the weighted-average number of shares outstanding during the period. |
| 2 | For explanations of items of note, refer to the "Non-GAAP Financial Measures – Reconciliation of Adjusted to Reported Net Income" table in the "How We Performed" section of this document. |
| TABLE 5: AMORTIZATION OF INTANGIBLES, NET OF INCOME TAXES1 | ||||||||||||
| (millions of Canadian dollars) | For the three months ended | For the nine months ended | ||||||||||
| July 31 | April 30 | July 31 | July 31 | July 31 | ||||||||
| 2016 | 2016 | 2015 | 2016 | 2015 | ||||||||
| TD Bank, National Association (TD Bank, N.A.) | $ | 25 | $ | 28 | $ | 27 | $ | 83 | $ | 86 | ||
| TD Ameritrade Holding Corporation (TD Ameritrade)2 | 16 | 17 | 15 | 49 | 45 | |||||||
| MBNA Canada | 9 | 9 | 10 | 27 | 28 | |||||||
| Aeroplan | 4 | 5 | 5 | 13 | 13 | |||||||
| Other | 4 | 4 | 5 | 14 | 18 | |||||||
| 58 | 63 | 62 | 186 | 190 | ||||||||
| Software and asset servicing rights | 89 | 77 | 74 | 246 | 213 | |||||||
| Amortization of intangibles, net of income taxes | $ | 147 | $ | 140 | $ | 136 | $ | 432 | $ | 403 | ||
| 1 | Amortization of intangibles, with the exception of software and asset servicing rights, are included as items of note. For explanations of items of note, refer to the "Non-GAAP Financial Measures – Reconciliation of Adjusted to Reported Net Income" table in the "How We Performed" section of this document. |
| 2 | Included in equity in net income of an investment in TD Ameritrade. |
Return on Common Equity
The Bank's methodology for allocating capital to its business segments is aligned with the common equity capital requirements under Basel III. The capital allocated to the business segments is based on 9% CET1 Capital.
Adjusted return on common equity (ROE) is adjusted net income available to common shareholders as a percentage of average common equity.
Adjusted ROE is a non-GAAP financial measure as it is not a defined term under IFRS. Readers are cautioned that earnings and other measures adjusted to a basis other than IFRS do not have standardized meanings under IFRS and, therefore, may not be comparable to similar terms used by other issuers.
| TABLE 6: RETURN ON COMMON EQUITY | |||||||||||||||
| (millions of Canadian dollars, except as noted) | For the three months ended | For the nine months ended | |||||||||||||
| July 31 | April 30 | July 31 | July 31 | July 31 | |||||||||||
| 2016 | 2016 | 2015 | 2016 | 2015 | |||||||||||
| Average common equity | $ | 64,595 | $ | 64,536 | $ | 58,891 | $ | 64,568 | $ | 56,932 | |||||
| Net income available to common shareholders – reported | 2,293 | 1,987 | 2,213 | 6,449 | 6,029 | ||||||||||
| Items of note, net of income taxes1 | 58 | 230 | 19 | 312 | 392 | ||||||||||
| Net income available to common shareholders – adjusted | 2,351 | 2,217 | 2,232 | 6,761 | 6,421 | ||||||||||
| Return on common equity – adjusted | 14.5 | % | 14.0 | % | 15.0 | % | 14.0 | % | 15.1 | % | |||||
| 1 | For explanations of items of note, refer to the "Non-GAAP Financial Measures – Reconciliation of Adjusted to Reported Net Income" table in the "How We Performed" section of this document. |
FINANCIAL RESULTS OVERVIEW
Performance Summary
Outlined below is an overview of the Bank's performance on an adjusted basis for the third quarter of 2016 against the financial performance indicators included in TD's 2015 Annual Report. Shareholder performance indicators help guide and benchmark the Bank's accomplishments. For the purposes of this analysis, the Bank utilizes adjusted earnings, which excludes items of note from the reported results that are prepared in accordance with IFRS. Reported and adjusted results and items of note are explained in the "How the Bank Reports" section of this document.
| • | Adjusted diluted earnings per share for the nine months ended July 31, 2016, increased 5% from the same period last year reflecting higher earnings in the U.S. Retail, Canadian Retail, and Wholesale Banking segments, partially offset by a higher loss in the Corporate segment. The Bank's goal is to achieve 7 to 10% adjusted earnings per share growth over the medium term. |
| • | Adjusted return on CET1 Capital RWA for the nine months ended July 31, 2016, was 2.32%. |
| • | Adjusted return on common equity for the nine months ended July 31, 2016, was 14.0%. |
| • | For the twelve months ended July 31, 2016, the total shareholder return was 12.2% compared to the Canadian peer1 average of 12.1%. |
Impact of Foreign Exchange Rate on U.S. Retail Segment Translated Earnings
U.S. Retail segment earnings, including the contribution from the Bank's investment in TD Ameritrade, reflect fluctuations in the U.S. dollar to Canadian dollar exchange rate compared with the same period last year. Depreciation of the Canadian dollar had a favourable impact on U.S. Retail segment earnings for the three and nine months ended July 31, 2016, compared with the same period last year, as shown in the following table.
| 1 | Canadian peers include Bank of Montreal, Canadian Imperial Bank of Commerce, Royal Bank of Canada, and The Bank of Nova Scotia. |
| TD BANK GROUP • THIRD QUARTER 2016 • REPORT TO SHAREHOLDERS | Page 6 |
| TABLE 7: IMPACT OF FOREIGN EXCHANGE RATE ON U.S. RETAIL SEGMENT TRANSLATED EARNINGS | ||||||||
| (millions of Canadian dollars, except as noted) | For the three months ended | For the nine months ended | ||||||
| July 31, 2016 vs. | July 31, 2016 vs. | |||||||
| July 31, 2015 | July 31, 2015 | |||||||
| U.S. Retail Bank increased total revenue | $ | 89 | $ | 589 | ||||
| U.S. Retail Bank increased non-interest expenses | 52 | 350 | ||||||
| U.S. Retail Bank increased net income, after tax | 25 | 159 | ||||||
| Increased equity in net income of an investment in TD Ameritrade | 6 | 33 | ||||||
| U.S. Retail segment increased net income, after tax | 31 | 193 | ||||||
| Increase in basic earnings per share (dollars) | 0.02 | 0.10 | ||||||
| Increase in diluted earnings per share (dollars) | $ | 0.02 | $ | 0.10 | ||||
On a trailing twelve month basis, a one cent appreciation/depreciation in the U.S. dollar to Canadian dollar average exchange rate increases/decreases U.S. Retail segment net income by approximately $40 million.
Economic Summary and Outlook
Economic activity in Canada expanded at a healthy 2.4% (quarter-over-quarter, at annual rates) pace in the first quarter of calendar 2016. Despite this strong start, a subsequent softening in underlying growth momentum along with the temporary economic disruptions due to the Fort McMurray wildfire in May are expected to constrain Canada's overall growth rate to a sub-par 1.1% for 2016 as a whole. Beneath the national figures lie diverging regional performances, with healthy growth expected in British Columbia and Ontario. Conversely, the oil-producing regions such as Newfoundland and Labrador and Alberta continue to struggle with the fallout from low oil prices – made worse for Alberta by this year's wildfires.
Globally, the economy remains unable to accelerate meaningfully, with expansion running at around 3%. Eurozone growth slowed in the second quarter after a strong first quarter advance. The increased economic uncertainty in the aftermath of the United Kingdom referendum in June and ongoing deflationary risks are likely to keep a number of central banks in easing mode in the coming months, including the Bank of Japan and the European Central Bank. These moves are helping to support global rallies in stocks and bond markets as well as overall risk appetite in recent months. Emerging markets have been major beneficiaries of capital inflows since January, despite continuing to face a number of longer-term structural challenges. While China remains a key source of world growth, the pace of expansion continues to decelerate, with negative implications for countries within its supply chain.
The economic outlook for the United States has been decidedly mixed. In the second calendar quarter, real gross domestic product (GDP) growth came in at a weak 1.2% at annual rates – well below market expectations of 2.5% growth. Particular weakness was seen in business investment, and, with the elevated dollar and weak global growth weighing on corporate profits and exports, the outlook for U.S. capital spending remains restrained. However, continued solid hiring trends and gradually firming wage growth in recent months have painted a more upbeat picture of underlying activity stateside. With this mix of factors in play we expect the Federal Reserve is likely to remain on hold through the remainder of this year, and nudge up the federal funds interest rate by 50 basis points (bps) over the course of 2017.
Canada remains in the midst of a complex adjustment process resulting from the marked declines in commodity prices since 2014, with the Fort McMurray wildfire in May 2016 providing an additional setback to growth. Business investment is expected to stop contracting in the second half of calendar 2016, but meaningful growth is not expected until early 2018, as oil prices remain unsupportive of further investment and manufacturing sales growth remains weak.
As the economic adjustment process continues, external demand for Canadian goods and services should provide some relief. However, exports have confounded expectations over the first half of 2016, with volumes falling on broad-based weakness across major product categories. This reflects foreign demand that has disappointed as U.S. business investment has remained soft. Weakness is not expected to persist, as healthy U.S. growth over the second half of 2016 should provide support to Canadian exports.
The real estate sector has been a key driver of economic growth in Canada, supported by a low interest rate environment and gains in home prices. Growth is expected to remain strong in 2016, but momentum is projected to ease significantly as the impact of past interest rate decreases fade and a number of recently-implemented tax and other regulatory changes, including the 15% land transfer tax on non-residents in the Vancouver region, act to ease demand. Any correction over the next year is likely to be modest in light of continued low interest rates and a stable unemployment rate.
Government spending is also expected to provide a boost to growth over the second half of calendar 2016 and throughout 2017. Payment of the new Canada Child Benefit began in July, providing some lift to consumer spending this year. Infrastructure spending will further boost growth in 2017 by as much as 0.3 percentage points.
Against the backdrop of modest economic growth and a labour market that is expected to generate only modest employment gains, inflationary pressures are likely to remain in line with the Bank of Canada's target of 2%. Although overall inflation is currently below this target, the impacts of past energy price declines are fading, while import prices are rising. As a result, we expect inflation to converge back towards the central bank's preferred target by the latter half of the 2017 calendar year.
Given the muted inflationary pressures, the Bank of Canada is expected to maintain its policy rate at 0.50% throughout the 2016 and 2017 calendar years. This is consistent with the July 2016 Monetary Policy Report, where the Bank of Canada suggested that economic activity is likely to return to its potential level only towards the end of the 2017 calendar year.
There are a number of important risks that may push the Canadian economy off course. Should U.S. demand remain weak, Canadian export growth is likely to follow suit, removing a key source of growth. Domestically, high household debt levels may precipitate a consumer deleveraging cycle, reducing consumption growth. Accounting for more than half of economic activity, a slowing in consumption growth will have a deleterious effect on the economy as a whole. Similarly, a moderation in housing activity, whether driven by weakened affordability or other reasons, would remove what has been a key driver of growth in recent quarters.
Net Income
Quarterly comparison – Q3 2016 vs. Q3 2015
Reported net income for the quarter was $2,358 million, an increase of $92 million, or 4%, compared with the third quarter last year. The increase in reported net income was due to higher earnings in the U.S. Retail and Wholesale Banking segments, partially offset by a decrease in the Canadian Retail segment, and a higher loss in the Corporate segment. U.S. Retail net income increased primarily due to loan and deposit volume growth, positive operating leverage, good credit quality, higher contributions from the Bank’s investment in TD Ameritrade, and the favourable impact of foreign currency translation, partially offset by a recovery of litigation losses in the prior year which was reported as an item of note. Wholesale Banking net income reflected higher revenue, partially offset by higher provision for credit losses (PCL) and non-interest expenses. Canadian Retail net income reflected higher insurance claims, a higher effective tax rate, increased non-interest expenses, and higher PCL, partially offset by higher revenue. Corporate segment net loss increased primarily due to higher provisions for incurred but not identified credit losses and higher net corporate expenses, partially offset by higher revenue from treasury and balance sheet management activities and a change in the fair value of derivatives hedging the reclassified available-for-sale securities portfolio which was reported as an item of note in the prior year. Adjusted net income for the quarter was $2,416 million, an increase of $131 million, or 6%.
| TD BANK GROUP • THIRD QUARTER 2016 • REPORT TO SHAREHOLDERS | Page 7 |
Quarterly comparison – Q3 2016 vs. Q2 2016
Reported net income for the quarter increased $306 million, or 15%, compared with the prior quarter. The increase in reported net income was due to higher earnings in the Wholesale Banking, U.S. Retail, and Canadian Retail segments, and a lower loss in the Corporate segment. Wholesale Banking net income reflected higher revenue, lower PCL, and lower non-interest expenses, partially offset by a higher effective tax rate. U.S. Retail net income increased due to loan volumes, fee income growth, two additional days, and higher contributions from the Bank’s investment in TD Ameritrade. Canadian Retail net income reflected increased revenue, partially offset by higher insurance claims and increased non-interest expenses. Corporate segment experienced a lower net loss due the impairment of goodwill, non-financial assets and other charges, partially offset by a change in the fair value of derivatives hedging the reclassified available-for-sale securities portfolio, both of which were reported as items of note in the prior quarter, higher net corporate expenses, higher tax provisions, and lower revenue from treasury and balance sheet management this quarter. Adjusted net income for the quarter increased $134 million, or 6%.
Year-to-date comparison – Q3 2016 vs. Q3 2015
Reported net income was $6,633 million, an increase of $448 million, or 7%, compared with the same period last year. The increase in reported net income was due to higher earnings in the U.S. Retail, Canadian Retail, and Wholesale segments, and a lower loss in the Corporate segment. U.S. Retail net income increased primarily due to loan and deposit volume growth, positive operating leverage, contribution from an acquisition in the strategic cards portfolio, higher contributions from the Bank’s investment in TD Ameritrade, and the favourable impact of foreign currency translation, partially offset by higher PCL. Canadian Retail net income reflected revenue growth, partially offset by the impact of a higher effective tax rate, higher PCL, and increased non-interest expenses. Wholesale Banking increased due to higher revenue, lower non-interest expenses and a lower effective tax rate, partially offset by higher PCL. Corporate segment net loss reflected an impairment of goodwill, non-financial assets and other charges, which was reported as an item of note, higher net corporate expenses, and provisions for incurred but not identified credit losses, partially offset by restructuring charges in the prior year which were reported as an item of note, higher revenue from treasury and balance sheet management activities, a change in the fair value of derivatives hedging the reclassified available-for-sale securities portfolio which was reported as an item of note, and lower tax provisions in the current year. Adjusted net income was $6,945 million, an increase of $368 million or 6%.
Net Interest Income
Quarterly comparison – Q3 2016 vs. Q3 2015
Net interest income for the quarter was $4,924 million, an increase of $227 million, or 5%, compared with the third quarter last year. Net interest income increased in the U.S. Retail, Corporate, and Canadian Retail segments, partially offset by a decrease in the Wholesale Banking segment. U.S. Retail net interest income reflected loan and deposit growth, higher margins, the benefit of an acquisition in the strategic cards portfolio, and the favourable impact of foreign currency translation. Corporate segment net interest income increased primarily due to the contribution from an acquisition in the strategic cards portfolio and higher net revenue from treasury and balance sheet management activities. Canadian Retail net interest income increased due to loan and deposit volume growth, partially offset by lower margins. Wholesale Banking reflected lower trading net interest income.
Quarterly comparison – Q3 2016 vs. Q2 2016
Net interest income for the quarter increased $44 million, or 1%, compared with the prior quarter. Net interest income increased in the Canadian Retail and U.S. Retail segments, partially offset by a decrease in the Wholesale Banking and Corporate segments. Canadian Retail net interest income increased primarily due to loan and deposit volume growth, two additional days, and seasonal factors, partially offset by lower margins. U.S. Retail net interest income increased due to loan volume growth and two additional days, partially offset by the unfavourable impact of foreign currency translation. Wholesale Banking reflected lower trading net interest income. Corporate segment net interest income decreased primarily due to lower revenue from treasury and balance sheet management activities.
Year-to-date comparison – Q3 2016 vs. Q3 2015
Net interest income was $14,851 million, an increase of $1,014 million, or 7%, compared with the same period last year. Net interest income increased in the U.S. Retail, Corporate, and Canadian Retail segments, partially offset by a decrease in the Wholesale Banking segment. U.S. Retail net interest income increased due to loan and deposit volume growth, the benefit of an acquisition in the strategic cards portfolio, and the favourable impact of foreign currency translation, partially offset by lower margins. Corporate segment net interest income increased primarily due to the contribution from an acquisition in the strategic cards portfolio and higher revenue from treasury and balance sheet management activities. Canadian Retail net interest income increased reflecting loan and deposit volume growth, partially offset by lower margins. Wholesale Banking decreased primarily due to lower trading net interest income.
Non-Interest Income
Quarterly comparison – Q3 2016 vs. Q3 2015
Reported non-interest income for the quarter was $3,777 million, an increase of $468 million, or 14%, compared with the third quarter last year. All segments experienced increases in reported non-interest income. Wholesale Banking non-interest income reflected higher origination activity from debt and equity capital markets, higher corporate lending fees and higher trading revenue. Corporate segment non-interest income increased primarily due to contribution from an acquisition in the strategic cards portfolio and a change in the fair value of derivatives hedging the reclassified available-for-sale securities portfolio which was reported as an item of note in the prior year. Canadian Retail non-interest income increased due to wealth asset-based fee growth, changes in the fair value of investments supporting claims liabilities and higher fee-based revenue in personal and commercial banking. U.S. Retail non-interest income increased primarily due to the benefit of an acquisition in the strategic cards portfolio and the favourable impact of foreign currency translation. Adjusted non-interest income for the quarter was $3,777 million, an increase of $489 million or 15%.
Quarterly comparison – Q3 2016 vs. Q2 2016
Reported non-interest income for the quarter increased $398 million, or 12%, compared with the prior quarter. All segments experienced increases in reported non-interest income. Canadian Retail non-interest income increased due to changes in the fair value of investments supporting claims liabilities, seasonality of insurance premiums, wealth asset-based fee growth, higher fee-based revenue in personal and commercial banking, and two additional days. Wholesale Banking non-interest income reflected higher origination activity from debt and equity capital markets, and higher corporate lending fees and trading revenue. Corporate segment non-interest income increased primarily due to the contribution from an acquisition in the strategic cards portfolio, partially offset by a change in the fair value of derivatives hedging the reclassified available-for-sale securities portfolio which was reported as an item of note in the prior quarter. U.S. Retail non-interest income reflected organic and seasonal growth in personal banking fee revenue. Adjusted non-interest income for the quarter increased $340 million or 10%.
Year-to-date comparison – Q3 2016 vs. Q3 2015
Reported non-interest income was $10,719 million, an increase of $1,177 million, or 12%, compared with the same period last year. All segments experienced increases in reported non-interest income. Wholesale Banking non-interest income increased due to higher corporate lending fees, trading revenue, and origination activity from debt and equity capital markets. Corporate segment non-interest income increased primarily due to the contribution from an acquisition in the strategic cards portfolio, higher revenue from treasury and balance sheet management activities, and a change in the fair value of derivatives hedging the reclassified available-for-sale securities portfolio which was reported as an item of note. Canadian Retail non-interest income reflected wealth asset-based fee growth, higher fee-based revenue in personal and commercial banking, a change in mix of reinsurance contracts, and higher insurance premiums, partially offset by changes in the fair value of investments supporting claims liabilities. U.S. Retail non-interest income reflected the favourable impact of foreign currency translation. Adjusted non-interest income for the period was $10,731 million, an increase of $1,227 million or 13%.
| TD BANK GROUP • THIRD QUARTER 2016 • REPORT TO SHAREHOLDERS | Page 8 |
Provision for Credit Losses
Quarterly comparison – Q3 2016 vs. Q3 2015
PCL for the quarter was $556 million, an increase of $119 million, or 27%, compared with the third quarter last year. All segments experienced increases in PCL. Corporate segment included higher provisions for incurred but not identified credit losses due to credit deterioration in exposures within the oil and gas industry, volume growth within the Canadian Retail and Wholesale Banking loan portfolios, and contribution from an acquisition in the strategic cards portfolio. Canadian Retail PCL reflected higher provisions in the auto lending portfolio in the current quarter. U.S. Retail PCL increased primarily due to provisions for business banking, auto lending and credit card loans, and the unfavourable impact of foreign currency translation. Wholesale Banking PCL increased due to specific provisions in the oil and gas sector.
Quarterly comparison – Q3 2016 vs. Q2 2016
PCL for the quarter decreased $28 million, or 5%, compared with the prior quarter, primarily in the Wholesale Banking segment, partially offset by the Corporate segment. Wholesale Banking PCL decreased primarily due to lower specific provisions in the oil and gas sector. Corporate segment included a higher provision related to credit card loans in the strategic cards portfolio, partially offset by lower provisions for incurred but not identified credit losses within the Canadian Retail and Wholesale Banking loan portfolios.
Year-to-date comparison – Q3 2016 vs. Q3 2015
PCL was $1,782 million, an increase of $608 million, or 52%, compared with the same period last year. All segments experienced increases in PCL. Corporate segment PCL increased primarily due to higher provisions for incurred but not identified credit losses due to an increase in portfolio risk, credit deterioration in exposures impacted by low oil and gas prices, volume growth within the Canadian Retail and Wholesale Banking loan portfolios, and contribution from an acquisition in the strategic cards portfolio. U.S. Retail PCL increased primarily due to commercial loan volume growth, and allowance increase reflecting the current business economic environment in business banking, higher provisions for auto loans and credit cards, and the unfavourable impact of foreign currency translation. Canadian Retail PCL reflected higher provisions in the auto lending portfolio. Wholesale Banking PCL increased due to specific provisions in the oil and gas sector.
| TABLE 8: PROVISION FOR CREDIT LOSSES1 | ||||||||||||
| (millions of Canadian dollars) | For the three months ended | For the nine months ended | ||||||||||
| July 31 | April 30 | July 31 | July 31 | July 31 | ||||||||
| 2016 | 2016 | 2015 | 2016 | 2015 | ||||||||
| Provision for credit losses – counterparty-specific and individually | ||||||||||||
| insignificant | ||||||||||||
| Provision for credit losses – counterparty-specific | $ | 25 | $ | 75 | $ | 37 | $ | 120 | $ | 77 | ||
| Provision for credit losses – individually insignificant | 546 | 555 | 485 | 1,714 | 1,535 | |||||||
| Recoveries | (142) | (154) | (146) | (465) | (465) | |||||||
| Total provision for credit losses for counterparty-specific and individually | ||||||||||||
| insignificant | 429 | 476 | 376 | 1,369 | 1,147 | |||||||
| Provision for credit losses – incurred but not identified | ||||||||||||
| Canadian Retail and Wholesale Banking2 | 40 | 60 | – | 165 | 8 | |||||||
| U.S. Retail | 57 | 50 | 47 | 192 | 6 | |||||||
| Corporate3 | 30 | (2) | 14 | 56 | 13 | |||||||
| Total provision for credit losses – incurred but not identified | 127 | 108 | 61 | 413 | 27 | |||||||
| Provision for credit losses – reported | $ | 556 | $ | 584 | $ | 437 | $ | 1,782 | $ | 1,174 | ||
| 1 | Certain comparative amounts have been recast to conform with revised presentation for the U.S. strategic cards portfolio adopted in the first quarter of 2016. For further details, refer to the "How our Businesses Performed" section of this document. |
| 2 | The incurred but not identified PCL is included in the Corporate segment results for management reporting. |
| 3 | The retailer program partners' share of the U.S. strategic cards portfolio. |
Insurance claims and related expenses
Quarterly comparison – Q3 2016 vs. Q3 2015
Insurance claims and related expenses for the quarter were $692 million, an increase of $92 million, or 15%, compared with the third quarter last year, reflecting the net impact of the Fort McMurray wildfire as well as other weather-related claims, and changes in the fair value of investments supporting claims liabilities, partially offset by more favourable prior years’ claims development.
Quarterly comparison – Q3 2016 vs. Q2 2016
Insurance claims and related expenses for the quarter increased $162 million, or 31%, compared with the prior quarter, reflecting the net impact of the Fort McMurray wildfire as well as other weather-related claims, seasonal increases in claims and changes in the fair value of investments supporting claims liabilities, partially offset by more favourable prior years’ claims development.
Year-to-date comparison – Q3 2016 vs. Q3 2015
Insurance claims and related expenses were $1,877 million, an increase of $14 million, or 1%, compared with the same period last year.
Non-Interest Expenses and Efficiency Ratio
Quarterly comparison – Q3 2016 vs. Q3 2015
Reported non-interest expenses were $4,640 million, an increase of $348 million, or 8%, compared with the third quarter last year. All segments experienced increases in reported non-interest expenses. Corporate segment non-interest expenses increased primarily due to contribution from an acquisition in the strategic cards portfolio, and ongoing investments in enterprise and regulatory projects. U.S. Retail non-interest expenses increased due to a recovery of litigation losses in the prior year which was reported as an item of note, higher employee costs, business initiatives, and the unfavourable impact of foreign exchange translation, partially offset by productivity savings. Canadian Retail non-interest expenses reflected higher employee-related expenses including revenue-based variable expenses in the wealth business, technology spend and business growth, partially offset by productivity savings. Wholesale non-interest expenses reflected higher variable compensation. Adjusted non-interest expenses were $4,577 million, an increase of $316 million or 7%.
The Bank's reported efficiency ratio was 53.3%, compared with 53.6% in the third quarter last year. The Bank's adjusted efficiency ratio was 52.6%, compared with 53.4%.
| TD BANK GROUP • THIRD QUARTER 2016 • REPORT TO SHAREHOLDERS | Page 9 |
Quarterly comparison – Q3 2016 vs. Q2 2016
Reported non-interest expenses for the quarter decreased $96 million, or 2%, compared with the prior quarter. Reported non-interest expenses decreased in the Corporate and U.S. Retail segments, partially offset by the Canadian Retail segment. Wholesale Banking segment non-interest expenses were relatively flat. Corporate segment non-interest expenses decreased due to the impairment of goodwill, non-financial assets and other charges in the prior quarter which was reported as an item of note, partially offset by the contribution from an acquisition in the strategic cards portfolio. U.S. Retail non-interest expenses decreased primarily due to the favourable impact of foreign exchange translation. Canadian Retail non-interest expenses reflected higher technology spend, two additional days and business growth. Adjusted non-interest expenses increased $21 million.
The Bank's reported efficiency ratio was 53.3%, compared with 57.3% in the prior quarter. The Bank's adjusted efficiency ratio was 52.6%, compared with 54.8%.
Year-to-date comparison – Q3 2016 vs. Q3 2015
Reported non-interest expenses were $14,029 million, an increase of $867 million, or 7%, compared with the same period last year. Reported non-interest expenses increased in the U.S. Retail, Corporate and Canadian Retail segments. Wholesale Banking non-interest expenses were relatively flat. U.S. Retail non-interest expenses increased primarily due to business initiatives, employee costs, volume growth, and the unfavourable impact of foreign exchange translation, partially offset by productivity savings. Corporate non-interest expenses increased primarily due to contribution from an acquisition in the strategic cards portfolio and the ongoing investments in enterprise and regulatory projects, partially offset by restructuring charges in the prior year which were reported as an item of note, lower amortization of intangibles compared to the prior year, and the impairment of goodwill, non-financial assets and other charges this year. Canadian Retail non-interest expenses reflected higher employee-related expenses including revenue-based variable expenses in the wealth business, business growth and technology spend, partially offset by productivity savings. Adjusted non-interest expenses were $13,712 million, an increase of $1,116 million, or 9%.
The Bank’s reported efficiency ratio was 54.9%, compared with 56.3% in the same period last year. The Bank’s adjusted efficiency ratio was 53.6%, compared with 54.0%.
Income Taxes
As discussed in the "How the Bank Reports" section of this document, the Bank adjusts its reported results to assess each of its businesses and to measure overall Bank performance. As such, the provision for income taxes is stated on a reported and an adjusted basis.
The Bank's effective income tax rate on a reported basis was 20.5% for the third quarter, compared with 18.8% in the third quarter last year and 19.3% in the prior quarter. The year-over-year increase was largely due to an increase in taxes associated with the Bank's insurance business, an increase in income and lower tax exempt dividend income in the current quarter. The quarter-over-quarter increase was largely due to an increase in income in the current quarter and the tax impact to the prior quarter resulting from the resolution of certain audit issues as well as the prior quarter's impairment of goodwill, non-financial assets and other charges.
| TABLE 9: INCOME TAXES | |||||||||||||||||||||
| (millions of Canadian dollars, except as noted) | For the three months ended | For the nine months ended | |||||||||||||||||||
| July 31 | April 30 | July 31 | July 31 | July 31 | |||||||||||||||||
| 2016 | 2016 | 2015 | 2016 | 2015 | |||||||||||||||||
| Income taxes at Canadian statutory income tax rate | $ | 745 | 26.5 | % | $ | 638 | 26.5 | % | $ | 707 | 26.3 | % | $ | 2,087 | 26.5 | % | $ | 1,886 | 26.3 | % | |
| Increase (decrease) resulting from: | |||||||||||||||||||||
| Dividends received | (60) | (2.1) | (61) | (2.5) | (71) | (2.7) | (176) | (2.2) | (243) | (3.4) | |||||||||||
| Rate differentials on international operations | (124) | (4.4) | (86) | (3.6) | (145) | (5.4) | (325) | (4.2) | (398) | (5.5) | |||||||||||
| Other | 15 | 0.5 | (25) | (1.1) | 11 | 0.6 | 2 | – | 19 | 0.2 | |||||||||||
| Provision for income taxes and effective | |||||||||||||||||||||
| income tax rate – reported | $ | 576 | 20.5 | % | $ | 466 | 19.3 | % | $ | 502 | 18.8 | % | $ | 1,588 | 20.1 | % | $ | 1,264 | 17.6 | % | |
The Bank's adjusted effective tax rate was 20.8% for the quarter, higher than 18.9% in the third quarter last year and 18.5% in the prior quarter. The year-over-year increase was due to an increase in taxes associated with the Bank’s insurance business and an increase in income in the current quarter. The quarter-over-quarter increase was due to the positive resolution of certain audit issues in the prior quarter.
| TABLE 10: NON-GAAP FINANCIAL MEASURES – Reconciliation of Reported to Adjusted Provision for Income Taxes | ||||||||||||||||
| (millions of Canadian dollars, except as noted) | For the three months ended | For the nine months ended | ||||||||||||||
| July 31 | April 30 | July 31 | July 31 | July 31 | ||||||||||||
| 2016 | 2016 | 2015 | 2016 | 2015 | ||||||||||||
| Provision for income taxes – reported | $ | 576 | $ | 466 | $ | 502 | $ | 1,588 | $ | 1,264 | ||||||
| Adjustments for items of note: Recovery of (provision for) income | ||||||||||||||||
| taxes1,2 | ||||||||||||||||
| Amortization of intangibles | 21 | 23 | 23 | 69 | 71 | |||||||||||
| Fair value of derivatives hedging the reclassified available-for-sale | ||||||||||||||||
| securities portfolio | – | 7 | (2) | 2 | (4) | |||||||||||
| Impairment of goodwill, non-financial assets, and other charges | – | (5) | – | (5) | – | |||||||||||
| Restructuring charges | – | – | – | – | 109 | |||||||||||
| Litigation and litigation-related charge(s)/reserve(s) | – | – | (15) | – | 5 | |||||||||||
| Total adjustments for items of note | 21 | 25 | 6 | 66 | 181 | |||||||||||
| Provision for income taxes – adjusted | $ | 597 | $ | 491 | $ | 508 | $ | 1,654 | $ | 1,445 | ||||||
| Effective income tax rate – adjusted3 | 20.8 | % | 18.5 | % | 18.9 | % | 20.1 | % | 18.7 | % | ||||||
| 1 | For explanations of items of note, refer to the "Non-GAAP Financial Measures – Reconciliation of Adjusted to Reported Net Income" table in the "How We Performed" section of this document. |
| 2 | The tax effect for each item of note is calculated using the effective statutory income tax rate of the applicable legal entity. |
| 3 | Adjusted effective income tax rate is the adjusted provision for income taxes before other taxes as a percentage of adjusted net income before taxes. |
| TD BANK GROUP • THIRD QUARTER 2016 • REPORT TO SHAREHOLDERS | Page 10 |
HOW OUR BUSINESSES PERFORMED
For management reporting purposes, the Bank reports its results under three key business segments: Canadian Retail, which includes the results of the Canadian personal and commercial banking, wealth, and insurance businesses; U.S. Retail, which includes the results of the U.S. retail and commercial banking operations, wealth management services, and the Bank's investment in TD Ameritrade; and Wholesale Banking. The Bank's other activities are grouped into the Corporate segment.
Results of each business segment reflect revenue, expenses, assets, and liabilities generated by the businesses in that segment. Where applicable, the Bank measures and evaluates the performance of each segment based on adjusted results and ROE, and for those segments the Bank indicates that the measure is adjusted. For further details, refer to the "How the Bank Reports" section of this document, the "Business Focus" section in the 2015 MD&A, and Note 30 of the Bank's Consolidated Financial Statements for the year ended October 31, 2015. For information concerning the Bank's measure of ROE, which is a non-GAAP financial measure, refer to the "How We Performed" section of this document.
Effective the first quarter of 2016, the presentation of the U.S. strategic cards portfolio revenues, provision for credit losses (PCL), and expenses in the U.S. Retail segment includes only the Bank's agreed portion of the U.S. strategic cards portfolio, while the Corporate segment includes the retailer program partners' share. Certain comparative amounts have been recast to conform with this revised presentation. There was no impact on the net income of the segments or on the presentation of gross and net results in the Bank's Interim Consolidated Statement of Income.
Net interest income within Wholesale Banking is calculated on a taxable equivalent basis (TEB), which means that the value of non-taxable or tax-exempt income, including dividends, is adjusted to its equivalent before-tax value. Using TEB allows the Bank to measure income from all securities and loans consistently and makes for a more meaningful comparison of net interest income with similar institutions. The TEB increase to net interest income and provision for income taxes reflected in Wholesale Banking's results are reversed in the Corporate segment. The TEB adjustment for the quarter was $79 million, compared with $91 million in the third quarter last year, and $82 million in the prior quarter. The TEB adjustment for the nine months ended July 31, 2016, was $226 million, compared with $322 million in the same period last year.
| TABLE 11: CANADIAN RETAIL | ||||||||||||||||
| (millions of Canadian dollars, except as noted) | For the three months ended | For the nine months ended | ||||||||||||||
| July 31 | April 30 | July 31 | July 31 | July 31 | ||||||||||||
| 2016 | 2016 | 2015 | 2016 | 2015 | ||||||||||||
| Net interest income | $ | 2,519 | $ | 2,418 | $ | 2,480 | $ | 7,428 | $ | 7,284 | ||||||
| Non-interest income | 2,622 | 2,469 | 2,531 | 7,631 | 7,404 | |||||||||||
| Total revenue | 5,141 | 4,887 | 5,011 | 15,059 | 14,688 | |||||||||||
| Provision for credit losses | 258 | 262 | 237 | 748 | 666 | |||||||||||
| Insurance claims and related expenses | 692 | 530 | 600 | 1,877 | 1,863 | |||||||||||
| Non-interest expenses | 2,133 | 2,095 | 2,104 | 6,307 | 6,264 | |||||||||||
| Net income | $ | 1,509 | $ | 1,464 | $ | 1,557 | $ | 4,486 | $ | 4,442 | ||||||
| Selected volumes and ratios | ||||||||||||||||
| Return on common equity | 41.9 | % | 41.7 | % | 44.6 | % | 42.0 | % | 42.9 | % | ||||||
| Margin on average earning assets (including securitized assets) | 2.79 | 2.77 | 2.88 | 2.79 | 2.88 | |||||||||||
| Efficiency ratio | 41.5 | 42.9 | 42.0 | 41.9 | 42.6 | |||||||||||
| Assets under administration (billions of Canadian dollars) | $ | 337 | $ | 321 | $ | 314 | $ | 337 | $ | 314 | ||||||
| Assets under management (billions of Canadian dollars) | 265 | 254 | 249 | 265 | 249 | |||||||||||
| Number of Canadian retail branches | 1,152 | 1,152 | 1,166 | 1,152 | 1,166 | |||||||||||
| Average number of full-time equivalent staff | 38,852 | 37,987 | 39,180 | 38,383 | 39,365 | |||||||||||
Quarterly comparison – Q3 2016 vs. Q3 2015
Canadian Retail net income for the quarter was $1,509 million, a decrease of $48 million, or 3%, compared with the third quarter last year. Revenue growth was more than offset by higher insurance claims, a higher effective tax rate, increased non-interest expenses and higher PCL. The annualized ROE for the quarter was 41.9%, compared with 44.6% in the third quarter last year.
Canadian Retail revenue is derived from the Canadian personal and commercial banking, wealth, and insurance businesses. Revenue for the quarter was $5,141 million, an increase of $130 million, or 3%, compared with the third quarter last year. Net interest income increased $39 million, or 2%, reflecting loan and deposit volume growth, partially offset by lower margins. Non-interest income increased $91 million, or 4%, reflecting wealth asset-based fee growth, changes in the fair value of investments supporting claims liabilities and higher fee-based revenue in personal and commercial banking. Margin on average earning assets was 2.79%, a 9 basis points (bps) decrease, primarily reflecting competitive pricing in lending.
Average loan volumes increased $19 billion, or 5%, compared with the third quarter last year, comprised of 4% growth in personal loan volumes and 10% growth in business loan volumes. Average deposit volumes increased $20 billion, or 8%, compared with the third quarter last year, comprised of 7% growth in personal deposit volumes, 8% growth in business deposit volumes and 15% growth in wealth deposit volumes.
Assets under administration (AUA) were $337 billion as at July 31, 2016, an increase of $23 billion, or 7%, and assets under management (AUM) were $265 billion as at July 31, 2016, an increase of $16 billion, or 6%, compared with the third quarter last year, both reflecting new asset growth and increases in market value.
PCL for the quarter was $258 million, an increase of $21 million, or 9%, compared with the third quarter last year. Personal banking PCL was $248 million, an increase of $43 million, or 21%, reflecting higher provisions in the auto lending portfolio in the current quarter. Business banking PCL was $10 million, a decrease of $22 million. Annualized PCL as a percentage of credit volume was 0.28%, or an increase of 1 basis point. Net impaired loans were $732 million, an increase of $26 million, or 4%. Net impaired loans as a percentage of total loans were 0.20%, or flat compared with July 31, 2015.
Insurance claims and related expenses for the quarter were $692 million, an increase of $92 million, or 15%, compared with the third quarter last year. The increase reflects the net impact of the Fort McMurray wildfire as well as other weather-related claims, and changes in the fair value of investments supporting claims liabilities, partially offset by more favourable prior years’ claims development.
Non-interest expenses were $2,133 million, an increase of $29 million, or 1%, compared with the third quarter last year. The increase reflected business growth, higher employee-related expenses including revenue-based variable expenses in the wealth business and technology spend, partially offset by productivity savings.
The efficiency ratio for the quarter was 41.5%, compared with 42.0% in the third quarter last year.
| TD BANK GROUP • THIRD QUARTER 2016 • REPORT TO SHAREHOLDERS | Page 11 |
Quarterly comparison – Q3 2016 vs. Q2 2016
Canadian Retail net income increased $45 million, or 3%, compared with the prior quarter, reflecting increased revenue, partially offset by higher insurance claims and increased non-interest expenses. The annualized ROE for the quarter was 41.9%, compared with 41.7% in the prior quarter.
Revenue increased $254 million, or 5%, compared with the prior quarter. Net interest income increased $101 million, or 4%, reflecting loan and deposit volume growth, additional days in the quarter, and seasonal factors, partially offset by lower margins. Non-interest income increased $153 million, or 6%, reflecting changes in the fair value of investments supporting claims liabilities, seasonality of insurance premiums, wealth asset-based fee growth, higher fee-based revenue in personal and commercial banking, and additional days in the quarter. Margin on average earning assets was 2.79%, or a 2 bps increase, primarily reflecting higher seasonal revenue, partially offset by lower lending margins.
Average loan volumes increased $5 billion, or 1%, compared with the prior quarter, comprised of 1% growth in personal loan volumes and 2% growth in business loan volumes. Average deposit volumes increased $10 billion, or 4%, comprised of 2% growth in personal deposit volumes, 7% growth in business deposit volumes and 4% growth in wealth deposit volumes.
AUA were $337 billion as at July 31, 2016, an increase of $16 billion, or 5%, and AUM were $265 billion as at July 31, 2016, an increase of $11 billion, or 4%, compared with the prior quarter-end, both reflecting increases in market value and new asset growth.
PCL for the quarter decreased $4 million, or 2%, compared with the prior quarter. Personal banking PCL for the quarter decreased $4 million, or 2%, primarily reflecting lower delinquencies in the current quarter. Business banking PCL was flat. Annualized PCL as a percentage of credit volume was 0.28%, or a 2 bps decrease. Net impaired loans decreased $25 million, or 3%. Net impaired loans as a percentage of total loans were 0.20%, compared with 0.21% as at April 30, 2016.
Insurance claims and related expenses for the quarter increased $162 million, or 31%, compared with the prior quarter. The increase reflects the net impact of the Fort McMurray wildfire as well as other weather-related claims, seasonal increases in claims and changes in the fair value of investments supporting claims liabilities, partially offset by more favourable prior years’ claims development.
Non-interest expenses increased $38 million, or 2%, reflecting business growth, additional days in the quarter and higher technology spend.
The efficiency ratio for the quarter was 41.5%, compared with 42.9% in the prior quarter.
Year-to-date comparison – Q3 2016 vs. Q3 2015
Canadian Retail net income for the nine months ended July 31, 2016, was $4,486 million, an increase of $44 million, or 1%, compared with the same period last year. The increase in earnings reflects revenue growth, partially offset by the impact of a higher effective tax rate, higher PCL and increased non-interest expenses. The annualized ROE for the period was 42.0%, compared with 42.9% in the same period last year.
Revenue was $15,059 million, an increase of $371 million, or 3%, compared with the same period last year. Net interest income increased $144 million, or 2%, reflecting loan and deposit volume growth, partially offset by lower margins. Non-interest income increased $227 million, or 3%, reflecting wealth asset-based fee growth, higher fee-based revenue in personal and commercial banking, a change in mix of reinsurance contracts, and higher insurance premiums, partially offset by changes in the fair value of investments supporting claims liabilities. Margin on average earning assets was 2.79%, a 9 bps decrease, reflecting lower margins and competitive pricing.
Average loan volumes increased $19 billion, or 6%, compared with the same period last year, comprised of 5% growth in personal loan volumes and 10% growth in business loan volumes. Average deposit volumes increased $16 billion, or 6%, comprised of 6% growth in personal deposit volumes, 5% growth in business deposit volumes and 13% growth in wealth deposit volumes.
PCL was $748 million, an increase of $82 million, or 12%, compared with the same period last year. Personal banking PCL was $725 million, an increase of $98 million, or 16%, reflecting higher provisions in the auto lending portfolio. Business banking PCL was $23 million, a decrease of $16 million. Annualized PCL as a percentage of credit volume was 0.28%, an increase of 2 bps, compared with the same period last year.
Insurance claims and related expenses were $1,877 million, an increase of $14 million, or 1%, compared with the same period last year.
Non-interest expenses were $6,307 million, an increase of $43 million, or 1%, compared with the same period last year. The increase reflects higher employee-related expenses including revenue-based variable expenses in the wealth business, business growth and technology spend, partially offset by productivity savings.
The efficiency ratio was 41.9%, compared with 42.6% in the same period last year.
| TD BANK GROUP • THIRD QUARTER 2016 • REPORT TO SHAREHOLDERS | Page 12 |
| TABLE 12: U.S. RETAIL1 | |||||||||||||||||||
| (millions of dollars, except as noted) | For the three months ended | ||||||||||||||||||
| Canadian dollars | U.S. dollars | ||||||||||||||||||
| July 31 | April 30 | July 31 | July 31 | April 30 | July 31 | ||||||||||||||
| 2016 | 2016 | 2015 | 2016 | 2016 | 2015 | ||||||||||||||
| Net interest income | $ | 1,755 | $ | 1,737 | $ | 1,527 | $ | 1,354 | $ | 1,308 | $ | 1,224 | |||||||
| Non-interest income | 591 | 553 | 576 | 456 | 417 | 463 | |||||||||||||
| Total revenue | 2,346 | 2,290 | 2,103 | 1,810 | 1,725 | 1,687 | |||||||||||||
| Provision for credit losses | 168 | 162 | 153 | 130 | 123 | 122 | |||||||||||||
| Non-interest expenses – reported | 1,372 | 1,416 | 1,239 | 1,058 | 1,067 | 994 | |||||||||||||
| Non-interest expenses – adjusted | 1,372 | 1,416 | 1,278 | 1,058 | 1,067 | 1,024 | |||||||||||||
| U.S. Retail Bank net income – reported2 | 663 | 611 | 582 | 512 | 459 | 469 | |||||||||||||
| Adjustments for items of note, net of income taxes3 | |||||||||||||||||||
| Litigation and litigation-related charge(s)/reserve(s) | – | – | (24) | – | – | (19) | |||||||||||||
| U.S. Retail Bank net income – adjusted2 | 663 | 611 | 558 | 512 | 459 | 450 | |||||||||||||
| Equity in net income of an investment in TD Ameritrade | 125 | 108 | 92 | 97 | 78 | 74 | |||||||||||||
| Net income – adjusted | 788 | 719 | 650 | 609 | 537 | 524 | |||||||||||||
| Net income – reported | $ | 788 | $ | 719 | $ | 674 | $ | 609 | $ | 537 | $ | 543 | |||||||
| Selected volumes and ratios | |||||||||||||||||||
| Return on common equity – reported | 9.5 | % | 8.7 | % | 8.6 | % | 9.5 | % | 8.7 | % | 8.6 | % | |||||||
| Return on common equity – adjusted | 9.5 | 8.7 | 8.3 | 9.5 | 8.7 | 8.3 | |||||||||||||
| Margin on average earning assets4 | 3.14 | 3.11 | 3.05 | 3.14 | 3.11 | 3.05 | |||||||||||||
| Efficiency ratio – reported | 58.5 | 61.8 | 58.9 | 58.5 | 61.8 | 58.9 | |||||||||||||
| Efficiency ratio – adjusted | 58.5 | 61.8 | 60.8 | 58.5 | 61.8 | 60.8 | |||||||||||||
| Assets under administration (billions of dollars) | $ | 16 | $ | 15 | $ | 15 | $ | 13 | $ | 12 | $ | 11 | |||||||
| Assets under management (billions of dollars) | 93 | 90 | 97 | 71 | 72 | 74 | |||||||||||||
| Number of U.S. retail stores | 1,267 | 1,265 | 1,305 | 1,267 | 1,265 | 1,305 | |||||||||||||
| Average number of full-time equivalent staff | 25,998 | 25,599 | 25,546 | 25,998 | 25,599 | 25,546 | |||||||||||||
| For the nine months ended | |||||||||||||||||||
| Canadian dollars | U.S. dollars | ||||||||||||||||||
| July 31 | July 31 | July 31 | July 31 | ||||||||||||||||
| 2016 | 2015 | 2016 | 2015 | ||||||||||||||||
| Net interest income | $ | 5,261 | $ | 4,473 | $ | 3,950 | $ | 3,665 | |||||||||||
| Non-interest income | 1,774 | 1,606 | 1,332 | 1,316 | |||||||||||||||
| Total revenue | 7,035 | 6,079 | 5,282 | 4,981 | |||||||||||||||
| Provision for credit losses | 551 | 361 | 413 | 297 | |||||||||||||||
| Non-interest expenses – reported | 4,194 | 3,746 | 3,147 | 3,069 | |||||||||||||||
| Non-interest expenses – adjusted | 4,194 | 3,733 | 3,147 | 3,057 | |||||||||||||||
| U.S. Retail Bank net income – reported2 | 1,916 | 1,626 | 1,441 | 1,333 | |||||||||||||||
| Adjustments for items of note, net of income taxes3 | |||||||||||||||||||
| Litigation and litigation-related charge(s)/reserve(s) | – | 8 | – | 7 | |||||||||||||||
| U.S. Retail Bank net income – adjusted2 | 1,916 | 1,634 | 1,441 | 1,340 | |||||||||||||||
| Equity in net income of an investment in TD Ameritrade | 342 | 267 | 257 | 222 | |||||||||||||||
| Net income – adjusted | 2,258 | 1,901 | 1,698 | 1,562 | |||||||||||||||
| Net income – reported | $ | 2,258 | $ | 1,893 | $ | 1,698 | $ | 1,555 | |||||||||||
| Selected volumes and ratios | |||||||||||||||||||
| Return on common equity – reported | 9.0 | % | 8.3 | % | 9.0 | % | 8.3 | % | |||||||||||
| Return on common equity – adjusted | 9.0 | 8.4 | 9.0 | 8.4 | |||||||||||||||
| Margin on average earning assets4 | 3.12 | 3.13 | 3.12 | 3.13 | |||||||||||||||
| Efficiency ratio – reported | 59.6 | 61.6 | 59.6 | 61.6 | |||||||||||||||
| Efficiency ratio – adjusted | 59.6 | 61.4 | 59.6 | 61.4 | |||||||||||||||
| Assets under administration (billions of dollars) | $ | 16 | $ | 15 | $ | 13 | $ | 11 | |||||||||||
| Assets under management (billions of dollars) | 93 | 97 | 71 | 74 | |||||||||||||||
| Number of U.S. retail stores | 1,267 | 1,305 | 1,267 | 1,305 | |||||||||||||||
| Average number of full-time equivalent staff | 25,608 | 25,781 | 25,608 | 25,781 | |||||||||||||||
| 1 | Certain comparative amounts and ratios have been recast to conform with the revised presentation, which includes only the Bank’s agreed portion of revenue, PCL, and expenses for the U.S. strategic cards portfolio and was adopted in the first quarter of 2016. For further details, refer to the "How our Businesses Performed" section of this document. |
| 2 | Before the equity in net income of the Bank's investment in TD Ameritrade. |
| 3 | For explanations of items of note, refer to the "Non-GAAP Financial Measures − Reconciliation of Adjusted to Reported Net Income" table in the "How We Performed" section of this document. |
| 4 | The margin on average earning assets excludes the impact related to the TD Ameritrade insured deposit accounts (IDA) and the impact of intercompany deposits and cash collateral. In addition, the value of tax-exempt interest income is adjusted to its equivalent before-tax value. |
| TD BANK GROUP • THIRD QUARTER 2016 • REPORT TO SHAREHOLDERS | Page 13 |
Quarterly comparison – Q3 2016 vs. Q3 2015
U.S. Retail net income for the quarter was $788 million (US$609 million), which included net income of $663 million (US$512 million) from the U.S. Retail Bank and $125 million (US$97 million) from the Bank's investment in TD Ameritrade. U.S. Retail reported earnings increased US$66 million, or 12%, compared with the third quarter last year, while adjusted earnings were up US$85 million, or 16%. In addition to U.S. dollar earnings growth, U.S. Retail Canadian dollar earnings benefited from the strength of the U.S. dollar with reported earnings up $114 million, or 17%, and adjusted earnings up $138 million, or 21%. The reported and adjusted annualized ROE for the quarter was 9.5%, compared with 8.6% and 8.3%, respectively, in the third quarter last year.
U.S. Retail Bank reported net income for the quarter increased US$43 million, or 9%, compared with the third quarter last year, due to higher loan and deposit volumes, positive operating leverage, and good credit quality, partially offset by recovery of litigation losses in the same period last year. U.S. Retail Bank adjusted net income increased US$62 million, or 14%. The contribution from TD Ameritrade of US$97 million was up US$23 million, or 31%, reflecting asset growth, higher trading volumes and a favourable tax liability adjustment, partially offset by higher operating expenses.
U.S. Retail Bank revenue is derived from retail and commercial banking operations, wealth management services, and investments. Revenue for the quarter was US$1,810 million, an increase of US$123 million, or 7%, compared with the third quarter last year. Net interest income increased US$130 million, or 11%, reflecting loan and deposit growth, higher margins, and the benefit of an acquisition in the strategic cards portfolio. Margin on average earning assets was 3.14%, a 9 bps increase, due to the December 2015 Fed rate increase (the "Rate Increase"), positive hedging impact, and favourable balance sheet mix, partially offset by lower loan margins. Non-interest income decreased US$7 million, or 2%, reflecting fee income growth in personal banking and wealth management, and the benefit of an acquisition in the strategic cards portfolio, offset by unfavourable hedging impact and lower overdraft fees attributable to a change in time order posting of customer transactions.
Excluding an acquisition in the strategic cards portfolio, average loan volumes increased US$13 billion, or 11%, compared with the third quarter last year due to growth in business and personal loans of 17% and 4%, respectively. Average deposit volumes increased US$19 billion, or 9%, reflecting 7% growth in business deposit volumes, 9% growth in personal deposit volumes and 11% increase in sweep deposit volume from TD Ameritrade.
AUA were US$13 billion as at July 31, 2016, an increase of 11%, compared with the third quarter last year, primarily due to increases in private banking balances. AUM were US$71 billion as at July 31, 2016, a decrease of 4%, primarily due to declines in international equity markets.
PCL for the quarter was US$130 million, an increase of US$8 million, or 7%, compared with the third quarter last year. Personal banking PCL was US$80 million, an increase of US$4 million, or 4%, primarily related to auto lending and credit card loans. Business banking PCL was US$49 million, a US$4 million increase, or 9%, primarily due to portfolio growth. PCL associated with debt securities classified as loans was US$1 million, flat compared with the third quarter last year. Net impaired loans, excluding ACI loans and debt securities classified as loans, were US$1.5 billion, an increase of US$101 million, or 7%. The increase was related to certain legacy performing home equity loans that were classified as impaired due to concerns about the borrowers' ability to continue to pay under modified terms. As the borrowers demonstrate an ability to perform under the modified terms, the loans are returned to performing status. Net impaired loans, excluding ACI loans and debt securities classified as loans, as a percentage of total loans were 1.1% as at July 31, 2016. Net impaired debt securities classified as loans were US$672 million, a decrease of US$140 million, or 17%.
Non-interest expenses for the quarter were US$1,058 million. Reported non-interest expenses increased US$64 million, or 6%, compared with the third quarter last year, reflecting higher employee costs, business initiatives, and recovery of litigation losses in the same period last year, partially offset by productivity savings. Adjusted non-interest expenses increased US$34 million, or 3%.
The reported and adjusted efficiency ratios for the quarter were 58.5%, compared with 58.9% and 60.8%, respectively, in the third quarter last year.
Quarterly comparison – Q3 2016 vs. Q2 2016
U.S. Retail earnings increased US$72 million, or 13%, compared with the prior quarter. U.S. Retail Canadian dollar earnings were up $69 million, or 10%. The annualized ROE for the quarter was 9.5%, compared to 8.7% in the prior quarter.
U.S. Retail Bank net income for the quarter increased US$53 million, or 12%, compared with the prior quarter, due to higher loan volumes, fee income growth, and two additional days in the quarter. The contribution from TD Ameritrade increased US$19 million, or 24%, primarily due to higher asset-based revenue, a favourable tax liability adjustment and lower operating expenses, partially offset by decreased transaction-based revenue.
Revenue for the quarter increased US$85 million, or 5%, compared with the prior quarter. Net interest income increased US$46 million, or 4%, reflecting higher loan volumes and two additional days in the quarter. Margin on average earning assets was 3.14%, a 3 bps increase, due to positive hedging impact and higher deposit margins. Non-interest income increased US$39 million, or 9%, primarily reflecting organic and seasonal growth in personal banking fee revenue.
Average loan volumes increased US$4 billion, or 3%, compared with the prior quarter, due to growth in the commercial and auto lending portfolios. Average deposit volumes were flat compared with the prior quarter.
AUA and AUM were US$13 billion and US$71 billion, respectively, as at July 31, 2016, both relatively flat compared with the prior quarter.
PCL for the quarter increased US$7 million, or 6%, compared with the prior quarter. Personal banking PCL was US$80 million, down US$6 million, reflecting the favourable housing environment. Business banking PCL was US$49 million, an increase of US$13 million, primarily due to portfolio growth. PCL associated with debt securities classified as loans was US$1 million, flat compared with the prior quarter. Net impaired loans, excluding ACI loans and debt securities classified as loans, were US$1.5 billion, a decrease of US$155 million, or 10%. The decrease was mainly related to certain legacy home equity loans returning to performing status after demonstrating a sustained ability to pay under modified terms. Net impaired loans, excluding ACI loans and debt securities classified as loans, as a percentage of total loans decreased 14 bps compared to the prior quarter. Net impaired debt securities classified as loans decreased US$59 million, or 8%.
Non-interest expenses for the quarter were relatively flat compared with the prior quarter.
The efficiency ratio for the quarter was 58.5%, compared with 61.8% in the prior quarter.
Year-to-date comparison – Q3 2016 vs. Q3 2015
U.S. Retail net income for the nine months ended July 31, 2016, was $2,258 million (US$1,698 million), which included net income of $1,916 million (US$1,441 million) from the U.S. Retail Bank and $342 million (US$257 million) from the Bank’s investment in TD Ameritrade. U.S. Retail reported earnings increased US$143 million, or 9%, compared with the same period last year, while adjusted earnings were up US$136 million, or 9%. In addition to U.S. dollar earnings growth, Canadian dollar earnings benefited from the strength of the U.S. dollar, with reported earnings up $365 million, or 19%, and adjusted earnings up $357 million, or 19%. The reported and adjusted annualized ROE for the nine months ended July 31, 2016, was 9.0%, compared with 8.3% and 8.4%, respectively.
U.S. Retail Bank net income on a reported basis increased US$108 million, or 8%, compared with the same period last year, due to higher loan and deposit volumes, positive operating leverage, and contribution from an acquisition in the strategic cards portfolio, partially offset by higher PCL. U.S. Retail Bank adjusted net income increased US$101 million, or 8%. The contribution from TD Ameritrade of US$257 million increased US$35 million, or 16%, primarily due to increased asset-based revenue and a favourable tax liability adjustment, partially offset by higher operating expenses.
Revenue was US$5,282 million, an increase of US$301 million, or 6%, compared with the same period last year. Net interest income increased US$285 million, or 8%, reflecting loan and deposit volume growth, and the benefit of an acquisition in the strategic cards portfolio, partially offset by lower margins. Margin on average earning assets was 3.12%, a 1 basis point decrease, due to lower loan margins as a result of the competitive environment, partially offset by the Rate Increase and positive hedging impact. Non-interest income increased US$16 million, or 1%, primarily reflecting customer account growth, higher transaction volumes, and the benefit of an acquisition in the strategic cards portfolio, offset by unfavourable hedging impact.
| TD BANK GROUP • THIRD QUARTER 2016 • REPORT TO SHAREHOLDERS | Page 14 |
Excluding an acquisition in the strategic cards portfolio, average loan volumes increased US$13 billion, or 11%, compared with the same period last year due to growth in business loans and personal loans of 18% and 4%, respectively. Average deposit volumes increased US$18 billion, or 9%, reflecting 8% growth in business deposits, 8% growth in personal deposits, and 11% growth in sweep deposit volume from TD Ameritrade.
PCL was US$413 million, an increase of US$116 million, or 39%, compared with the same period last year. Personal banking PCL was US$285 million, an increase of US$39 million, or 16%, primarily due to higher provision for auto loans and credit cards, partially offset by improvements on residential mortgages. Business banking PCL was US$125 million, an increase of US$67 million, primarily due to commercial loan volume growth and an allowance increase reflecting the current business economic environment. PCL associated with debt securities classified as loans was US$3 million, an increase of US$10 million. Annualized PCL as a percentage of credit volume for loans excluding debt securities classified as loans was 0.39%, an increase of 6 bps.
Non-interest expenses for the nine months ended July 31, 2016, were US$3,147 million. Reported non-interest expenses for the period increased US$78 million, or 3%, compared with the same period last year, primarily due to business initiatives, employee costs, and volume growth, partially offset by productivity savings. Adjusted non-interest expenses increased US$90 million, or 3%.
The reported and adjusted efficiency ratio for the period was 59.6%, compared with 61.6% and 61.4%, respectively, for the same period last year.
TD AMERITRADE HOLDING CORPORATION
Refer to Note 8 of the Bank's Interim Consolidated Financial Statements for further information on TD Ameritrade.
| TABLE 13: WHOLESALE BANKING | ||||||||||||||||
| (millions of Canadian dollars, except as noted) | For the three months ended | For the nine months ended | ||||||||||||||
| July 31 | April 30 | July 31 | July 31 | July 31 | ||||||||||||
| 2016 | 2016 | 2015 | 2016 | 2015 | ||||||||||||
| Net interest income (TEB) | $ | 390 | $ | 440 | $ | 564 | $ | 1,289 | $ | 1,745 | ||||||
| Non-interest income | 469 | 326 | 201 | 1,000 | 515 | |||||||||||
| Total revenue | 859 | 766 | 765 | 2,289 | 2,260 | |||||||||||
| Provision for credit losses | 11 | 50 | 2 | 73 | 4 | |||||||||||
| Non-interest expenses | 437 | 441 | 431 | 1,307 | 1,311 | |||||||||||
| Net income | $ | 302 | $ | 219 | $ | 239 | $ | 682 | $ | 677 | ||||||
| Selected volumes and ratios | ||||||||||||||||
| Trading-related revenue | $ | 447 | $ | 429 | $ | 425 | $ | 1,256 | $ | 1,229 | ||||||
| Gross drawn (billions of dollars)1 | 21 | 19 | 16 | 21 | 16 | |||||||||||
| Return on common equity | 20.4 | % | 14.8 | % | 17.2 | % | 15.2 | % | 15.9 | % | ||||||
| Efficiency ratio | 50.9 | 57.6 | 56.3 | 57.1 | 58.0 | |||||||||||
| Average number of full-time equivalent staff | 3,808 | 3,649 | 3,736 | 3,724 | 3,751 | |||||||||||
| 1 | Includes gross loans and bankers' acceptances, excluding letters of credit and before any cash collateral, credit default swaps, and reserves for the corporate lending business. |
Quarterly comparison – Q3 2016 vs. Q3 2015
Wholesale Banking net income for the quarter was $302 million, an increase of $63 million, or 26%, compared with the third quarter last year reflecting higher revenue, partially offset by higher PCL and higher non-interest expenses. The annualized ROE for the quarter was 20.4%, compared with 17.2% in the third quarter last year.
Wholesale Banking revenue is derived primarily from capital markets services and corporate lending. The capital markets businesses generate revenue from advisory, underwriting, trading, facilitation, and trade execution services. Revenue for the quarter was $859 million, an increase of $94 million, or 12%, compared with the third quarter last year reflecting higher origination activity from debt and equity capital markets, higher corporate lending fees and higher trading-related revenue.
PCL increased $9 million compared with the third quarter last year reflecting specific provisions in the oil and gas sector.
Non-interest expenses were $437 million, an increase of $6 million, or 1%, compared with the third quarter last year, reflecting higher variable compensation and the unfavourable impact of foreign exchange translation, partially offset by lower operating expenses.
Quarterly comparison – Q3 2016 vs. Q2 2016
Wholesale Banking net income for the quarter increased $83 million, or 38%, compared with the prior quarter reflecting higher revenue, lower PCL and lower non-interest expenses, partially offset by a higher effective tax rate. The annualized ROE for the quarter was 20.4%, compared with 14.8% in the prior quarter.
Revenue for the quarter increased $93 million, or 12%, compared with the prior quarter reflecting higher origination activity from debt and equity capital markets, higher corporate lending fees and higher trading-related revenue.
PCL for the quarter was $11 million, a decrease of $39 million, reflecting lower specific provisions in the oil and gas sector.
Non-interest expenses for the quarter decreased $4 million, or 1%, compared with the prior quarter.
Year-to-date comparison – Q3 2016 vs. Q3 2015
Wholesale Banking net income for the nine months ended July 31, 2016, was $682 million, an increase of $5 million, compared with the same period last year reflecting higher revenue, lower non-interest expenses and a lower effective tax rate, partially offset by higher PCL. The annualized ROE was 15.2%, compared with 15.9% in the same period last year.
Revenue was $2,289 million, an increase of $29 million, or 1%, compared with the same period last year.
PCL was $73 million, an increase of $69 million compared with the same period last year, reflecting specific provisions in the oil and gas sector.
Non-interest expenses were $1,307 million, a decrease of $4 million, compared with the same period last year.
| TD BANK GROUP • THIRD QUARTER 2016 • REPORT TO SHAREHOLDERS | Page 15 |
| TABLE 14: CORPORATE | ||||||||||||
| (millions of Canadian dollars) | For the three months ended | For the nine months ended | ||||||||||
| July 31 | April 30 | July 31 | July 31 | July 31 | ||||||||
| 2016 | 2016 | 2015 | 2016 | 2015 | ||||||||
| Net income (loss) – reported | $ | (241) | $ | (350) | $ | (204) | $ | (793) | $ | (827) | ||
| Adjustments for items of note, net of income taxes1 | ||||||||||||
| Amortization of intangibles | 58 | 63 | 62 | 186 | 190 | |||||||
| Fair value of derivatives hedging the reclassified available-for-sale securities | ||||||||||||
| portfolio | – | 51 | (19) | 10 | (34) | |||||||
| Impairment of goodwill, non-financial assets, and other charges | – | 116 | – | 116 | – | |||||||
| Restructuring charges | – | – | – | – | 228 | |||||||
| Net income (loss) – adjusted | $ | (183) | $ | (120) | $ | (161) | $ | (481) | $ | (443) | ||
| Decomposition of items included in net income (loss) – adjusted | ||||||||||||
| Net corporate expenses | $ | (222) | $ | (196) | $ | (193) | $ | (621) | $ | (542) | ||
| Other | 10 | 48 | 4 | 54 | 16 | |||||||
| Non-controlling interests | 29 | 28 | 28 | 86 | 83 | |||||||
| Net income (loss) – adjusted | $ | (183) | $ | (120) | $ | (161) | $ | (481) | $ | (443) | ||
| 1 | For explanations of items of note, refer to the "Non-GAAP Financial Measures – Reconciliation of Adjusted to Reported Net Income" table in the "How We Performed" section of this document. |
Quarterly comparison – Q3 2016 vs. Q3 2015
Corporate segment's reported net loss for the quarter was $241 million, compared with a reported net loss of $204 million in the third quarter last year. Reported net loss included gains related to the fair value of derivatives hedging the reclassified available-for-sale securities portfolio in the third quarter last year. Adjusted net loss was $183 million, compared with an adjusted net loss of $161 million in the third quarter last year. Adjusted net loss increased primarily due to higher net corporate expenses, partially offset by higher contribution from Other Items. Net corporate expenses increased due to ongoing investments in enterprise and regulatory projects. Other items included higher revenue from treasury and balance sheet management activities and higher provisions for incurred but not identified credit losses due to credit deterioration in exposures within the oil and gas industry, and volume growth within the Canadian Retail and Wholesale Banking loan portfolios.
Quarterly comparison – Q3 2016 vs. Q2 2016
Corporate segment's reported net loss for the quarter was $241 million, compared with a reported net loss of $350 million in the prior quarter. Reported net loss in the second quarter included impairment of goodwill, non-financial assets, and other charges, and losses related to the fair value of derivatives hedging the reclassified available-for-sale securities portfolio. Adjusted net loss was $183 million, compared with an adjusted net loss of $120 million in the prior quarter. Adjusted net loss increased primarily due to higher net corporate expenses and lower contribution from Other Items. Lower contribution from Other Items included higher tax provisions this quarter and lower revenue from treasury and balance sheet management activities, partially offset by lower provisions for incurred but not identified credit losses.
Year-to-date comparison – Q3 2016 vs. Q3 2015
Corporate segment’s reported net loss for the nine months ended July 31, 2016, was $793 million, compared with a reported net loss of $827 million in the same period last year. Reported net loss included impairment of goodwill, non-financial assets, and other charges, and losses related to the fair value of derivatives hedging the reclassified available-for-sale securities portfolio in the current period, and restructuring charges, partially offset by gains related to the fair value of derivatives hedging the reclassified available-for-sale securities portfolio in the same period last year. Adjusted net loss for the nine months ended July 31, 2016, was $481 million, compared with an adjusted net loss of $443 million in the same period last year. The increase in adjusted net loss was due to higher net corporate expenses, partially offset by higher contribution from Other Items. Net corporate expenses increased due to ongoing investments in enterprise and regulatory projects. Higher contribution from Other Items was primarily due to higher revenue from treasury and balance sheet management activities and lower tax provisions in the current period, partially offset by higher provisions for incurred but not identified credit losses due to an increase in portfolio risk, credit deterioration in exposures impacted by low oil and gas prices, and volume growth within the Canadian Retail and Wholesale Banking loan portfolios.
| TD BANK GROUP • THIRD QUARTER 2016 • REPORT TO SHAREHOLDERS | Page 16 |
QUARTERLY RESULTS
The following table provides summary information related to the Bank's eight most recently completed quarters.
| TABLE 15: QUARTERLY RESULTS | |||||||||||||||||||||||||
| (millions of Canadian dollars, except as noted) | For the three months ended | ||||||||||||||||||||||||
| 2016 | 2015 | 2014 | |||||||||||||||||||||||
| Jul. 31 | Apr. 30 | Jan. 31 | Oct. 31 | Jul. 31 | Apr. 30 | Jan. 31 | Oct. 31 | ||||||||||||||||||
| Net interest income | $ | 4,924 | $ | 4,880 | $ | 5,047 | $ | 4,887 | $ | 4,697 | $ | 4,580 | $ | 4,560 | $ | 4,457 | |||||||||
| Non-interest income | 3,777 | 3,379 | 3,563 | 3,160 | 3,309 | 3,179 | 3,054 | 2,995 | |||||||||||||||||
| Total revenue | 8,701 | 8,259 | 8,610 | 8,047 | 8,006 | 7,759 | 7,614 | 7,452 | |||||||||||||||||
| Provision for credit losses | 556 | 584 | 642 | 509 | 437 | 375 | 362 | 371 | |||||||||||||||||
| Insurance claims and related expenses | 692 | 530 | 655 | 637 | 600 | 564 | 699 | 720 | |||||||||||||||||
| Non-interest expenses | 4,640 | 4,736 | 4,653 | 4,911 | 4,292 | 4,705 | 4,165 | 4,331 | |||||||||||||||||
| Provision for (recovery of) income taxes | 576 | 466 | 546 | 259 | 502 | 344 | 418 | 370 | |||||||||||||||||
| Equity in net income of an investment in | |||||||||||||||||||||||||
| TD Ameritrade | 121 | 109 | 109 | 108 | 91 | 88 | 90 | 86 | |||||||||||||||||
| Net income – reported | 2,358 | 2,052 | 2,223 | 1,839 | 2,266 | 1,859 | 2,060 | 1,746 | |||||||||||||||||
| Adjustments for items of note, net of | |||||||||||||||||||||||||
| income taxes1 | |||||||||||||||||||||||||
| Amortization of intangibles | 58 | 63 | 65 | 65 | 62 | 65 | 63 | 62 | |||||||||||||||||
| Fair value of derivatives hedging the | |||||||||||||||||||||||||
| reclassified available-for-sale | |||||||||||||||||||||||||
| securities portfolio | – | 51 | (41) | (21) | (19) | (15) | – | – | |||||||||||||||||
| Impairment of goodwill, non-financial assets, | |||||||||||||||||||||||||
| and other charges | – | 116 | – | – | – | – | – | – | |||||||||||||||||
| Restructuring charges | – | – | – | 243 | – | 228 | – | – | |||||||||||||||||
| Charge related to the acquisition in U.S. strategic | |||||||||||||||||||||||||
| cards portfolio and related integration costs | – | – | – | 51 | – | – | – | – | |||||||||||||||||
| Litigation and litigation-related charge(s)/reserve(s) | – | – | – | – | (24) | 32 | – | – | |||||||||||||||||
| Integration charges relating to the | |||||||||||||||||||||||||
| acquisition of the credit card portfolio | |||||||||||||||||||||||||
| of MBNA Canada | – | – | – | – | – | – | – | 54 | |||||||||||||||||
| Total adjustments for items of note | 58 | 230 | 24 | 338 | 19 | 310 | 63 | 116 | |||||||||||||||||
| Net income – adjusted | 2,416 | 2,282 | 2,247 | 2,177 | 2,285 | 2,169 | 2,123 | 1,862 | |||||||||||||||||
| Preferred dividends | 36 | 37 | 25 | 26 | 25 | 24 | 24 | 32 | |||||||||||||||||
| Net income available to common | |||||||||||||||||||||||||
| shareholders and non-controlling | |||||||||||||||||||||||||
| interests in subsidiaries – adjusted | 2,380 | 2,245 | 2,222 | 2,151 | 2,260 | 2,145 | 2,099 | 1,830 | |||||||||||||||||
| Attributable to: | |||||||||||||||||||||||||
| Common shareholders – adjusted | 2,351 | 2,217 | 2,193 | 2,122 | 2,232 | 2,117 | 2,072 | 1,803 | |||||||||||||||||
| Non-controlling interests – adjusted | 29 | 28 | 29 | 29 | 28 | 28 | 27 | 27 | |||||||||||||||||
| (Canadian dollars, except as noted) | |||||||||||||||||||||||||
| Basic earnings per share | |||||||||||||||||||||||||
| Reported | $ | 1.24 | $ | 1.07 | $ | 1.17 | $ | 0.96 | $ | 1.20 | $ | 0.98 | $ | 1.09 | $ | 0.92 | |||||||||
| Adjusted | 1.27 | 1.20 | 1.18 | 1.15 | 1.21 | 1.15 | 1.12 | 0.98 | |||||||||||||||||
| Diluted earnings per share | |||||||||||||||||||||||||
| Reported | 1.24 | 1.07 | 1.17 | 0.96 | 1.19 | 0.97 | 1.09 | 0.91 | |||||||||||||||||
| Adjusted | 1.27 | 1.20 | 1.18 | 1.14 | 1.20 | 1.14 | 1.12 | 0.98 | |||||||||||||||||
| Return on common equity – reported | 14.1 | % | 12.5 | % | 13.3 | % | 11.4 | % | 14.9 | % | 12.8 | % | 14.6 | % | 13.1 | % | |||||||||
| Return on common equity – adjusted | 14.5 | 14.0 | 13.5 | 13.5 | 15.0 | 15.0 | 15.1 | 14.0 | |||||||||||||||||
| 1 | For explanations of items of note, refer to the "Non-GAAP Financial Measures – Reconciliation of Adjusted to Reported Net Income" table in the "How We Performed" section of this document. |
| TD BANK GROUP • THIRD QUARTER 2016 • REPORT TO SHAREHOLDERS | Page 17 |
BALANCE SHEET REVIEW
| TABLE 16: SELECTED CONSOLIDATED BALANCE SHEET ITEMS | |||||
| (millions of Canadian dollars) | As at | ||||
| July 31, 2016 | October 31, 2015 | ||||
| Assets | |||||
| Loans, net of allowance for loan losses | $ | 571,637 | $ | 544,341 | |
| Interest-bearing deposits with banks | 54,605 | 42,483 | |||
| Available-for-sale securities | 99,674 | 88,782 | |||
| Derivatives | 77,858 | 69,438 | |||
| Trading loans, securities, and other | 102,934 | 95,157 | |||
| Liabilities | |||||
| Deposits | 757,912 | 695,576 | |||
| Derivatives | 69,720 | 57,218 | |||
| Obligations related to securities sold short | 44,564 | 38,803 | |||
| Obligations related to securities sold under repurchase agreements | 58,762 | 67,156 | |||
Total assets were $1,182 billion as at July 31, 2016, an increase of $78 billion, or 7%, from October 31, 2015. The increase was primarily due to an increase in loans, net of allowance for loan losses of $27 billion, interest-bearing deposits with banks of $12 billion, AFS securities of $11 billion, derivatives of $8 billion, and trading loans, securities, and other of $8 billion. The foreign currency translation impact on total assets, primarily in the U.S. Retail segment, was relatively flat.
Loans, net of allowance for loan losses increased $27 billion primarily due to an increase in the Canadian Retail, U.S. Retail, and Wholesale Banking segments. The increase in the Canadian Retail was primarily due to growth in business and government loans, residential mortgages, and personal loans. The increase in U.S. Retail and Wholesale was primarily due to growth in business and government loans.
Interest-bearing deposits with banks increased $12 billion primarily due to higher volumes.
Available-for-sale securities increased $11 billion primarily due to new investments, net of maturities and sales.
Derivatives increased $8 billion primarily due to the current interest rate and foreign exchange environment, partially offset by netting of positions.
Trading loans, securities, and other increased $8 billion primarily in Wholesale Banking.
Total liabilities were $1,111 billion as at July 31, 2016, an increase of $74 billion, or 7%, from October 31, 2015. The increase was primarily due to an increase in deposits of $62 billion, derivatives of $13 billion, and obligations related to securities sold short of $6 billion, partially offset by a decrease in obligations related to securities sold under repurchase agreements of $8 billion. The foreign currency translation impact on total liabilities, primarily in the U.S. Retail segment, was relatively flat.
Deposits increased $62 billion largely driven by the Canadian Retail, U.S. Retail and Corporate segments. Canadian Retail reflected increases in business and government loans and personal non-term deposits. U.S. Retail deposits increased primarily due to personal non-term deposits. Corporate segment's deposits increased primarily due to senior debt and covered bond issuances.
Derivatives increased $13 billion primarily due to the current interest rate and foreign exchange environment, partially offset by netting of positions.
Obligations related to securities sold short increased $6 billion primarily due to an increase in trade volumes and foreign exchange.
Obligations related to securities sold under repurchase agreements decreased $8 billion due to a decrease in trading volumes.
Equity was $71 billion as at July 31, 2016, an increase of $4 billion, or 6%, from October 31, 2015. The increase was primarily due to growth in retained earnings, an increase in accumulated other comprehensive income reflecting gains on cash flow hedge, and a preferred share issuance.
CREDIT PORTFOLIO QUALITY
Quarterly comparison – Q3 2016 vs. Q3 2015
Gross impaired loans excluding debt securities classified as loans, Federal Deposit Insurance Corporation (FDIC) covered loans, and other ACI loans were $3,467 million as at July 31, 2016, an increase of $390 million, or 13%, compared with the third quarter last year, primarily due to new credit impaired formations in both the U.S. home equity line of credit portfolio and wholesale oil and gas sector, and the impact of foreign exchange. U.S. Retail gross impaired loans increased $200 million, or 10%, compared with the third quarter last year, primarily due to U.S. home equity line of credit new impaired loan formations and the impact of foreign exchange. Canadian Retail gross impaired loans increased $15 million, or 2%, compared with the third quarter last year. Net impaired loans were $2,786 million as at July 31, 2016, an increase of $254 million, or 10%, compared with the third quarter last year, primarily due to new credit impaired formations in both the U.S. home equity line of credit portfolio and wholesale oil and gas sector, and the impact of foreign exchange.
The allowance for credit losses of $4,230 million as at July 31, 2016, was composed of a counterparty-specific allowance of $418 million, a collectively assessed allowance for individually insignificant impaired loans of $532 million, and an allowance for incurred but not identified credit losses of $3,280 million.
The counterparty-specific allowance increased $23 million, or 6%, compared with the third quarter last year primarily due to an increase in the oil and gas portfolio and the impact of foreign exchange offset by a decrease in the debt securities classified as loans portfolio. The collectively assessed allowance for individually insignificant impaired loans increased $51 million, or 11%, compared with the third quarter last year primarily due to the impact of foreign exchange, the U.S. strategic cards portfolio and the Canadian indirect auto portfolio. The allowance for incurred but not identified credit losses increased $525 million, or 19%, compared with the third quarter last year primarily due to volume growth, credit deterioration in exposures impacted by low oil and gas prices and the impact of foreign exchange.
| TD BANK GROUP • THIRD QUARTER 2016 • REPORT TO SHAREHOLDERS | Page 18 |
The allowance for incurred but not identified credit losses is established to recognize losses that management estimates to have occurred at the portfolio level as at the balance sheet date for loans not yet specifically identified as impaired. The Bank periodically reviews the methodology for calculating the allowance for incurred but not identified credit losses. As part of this review, certain revisions may be made to reflect updates in statistically derived loss estimates for the Bank's recent loss experience of its credit portfolios, which may cause the Bank to provide or release amounts from the allowance for incurred but not identified losses. During the third quarter of 2016, certain refinements were made to the methodology, the cumulative effect of which was not material and which was included in the change for the quarter.
Quarterly comparison – Q3 2016 vs. Q2 2016
Gross impaired loans excluding debt securities classified as loans, FDIC covered loans, and other ACI loans decreased $100 million, or 3%, compared with the prior quarter primarily due to the U.S. home equity line of credit and U.S. commercial portfolios, offset by the negative impact of foreign exchange and new formations in the wholesale oil and gas sector. Impaired loans net of allowance decreased $122 million, or 4%, compared with the prior quarter, primarily due to the U.S. home equity line of credit and U.S. commercial portfolios, offset by the negative impact of foreign exchange and new formations in the wholesale oil and gas sector.
The counterparty-specific allowance increased $13 million, or 3%, compared with the prior quarter. The collectively assessed allowance for individually insignificant impaired loans increased $8 million, or 2%, compared with the prior quarter. The allowance for incurred but not identified credit losses increased $200 million, or 6%, compared with the prior quarter primarily due to volume growth in the U.S. retail portfolio and credit deterioration in exposures within the oil and gas industry.
| TABLE 17: CHANGES IN GROSS IMPAIRED LOANS AND ACCEPTANCES | |||||||||||
| (millions of Canadian dollars) | For the three months ended | For the nine months ended | |||||||||
| July 31 | April 30 | July 31 | July 31 | July 31 | |||||||
| 2016 | 2016 | 2015 | 2016 | 2015 | |||||||
| Personal, Business, and Government Loans1,2 | |||||||||||
| Impaired loans as at beginning of period | $ | 3,567 | $ | 3,799 | $ | 2,905 | $ | 3,244 | $ | 2,731 | |
| Classified as impaired during the period | 1,224 | 1,453 | 1,206 | 4,394 | 3,498 | ||||||
| Transferred to not impaired during the period | (463) | (414) | (329) | (1,247) | (909) | ||||||
| Net repayments | (379) | (391) | (334) | (1,169) | (880) | ||||||
| Disposals of loans | (3) | – | – | (3) | (8) | ||||||
| Amounts written off | (579) | (592) | (527) | (1,730) | (1,619) | ||||||
| Recoveries of loans and advances previously written off | – | – | – | – | – | ||||||
| Exchange and other movements | 100 | (288) | 156 | (22) | 264 | ||||||
| Impaired loans as at end of period | $ | 3,467 | $ | 3,567 | $ | 3,077 | $ | 3,467 | $ | 3,077 | |
| 1 | Excludes debt securities classified as loans. For additional information refer to the "Exposure to Non-Agency Collateralized Mortgage Obligations" section of this document and Note 5 of the Interim Consolidated Financial Statements. |
| 2 | Excludes FDIC covered loans and other ACI loans. For additional information refer to the "Exposure to Acquired Credit-Impaired Loans" discussion and table in this section of the document and Note 5 of the Interim Consolidated Financial Statements. |
| TABLE 18: ALLOWANCE FOR CREDIT LOSSES | ||||||||||
| (millions of Canadian dollars, except as noted) | As at | |||||||||
| July 31 | April 30 | July 31 | ||||||||
| 2016 | 2016 | 2015 | ||||||||
| Allowance for loan losses for on-balance sheet loans | ||||||||||
| Counterparty-specific | $ | 418 | $ | 405 | $ | 395 | ||||
| Individually insignificant | 532 | 524 | 481 | |||||||
| Incurred but not identified credit losses | 2,823 | 2,687 | 2,468 | |||||||
| Total allowance for loan losses for on-balance sheet loans | 3,773 | 3,616 | 3,344 | |||||||
| Allowance for off-balance sheet positions | ||||||||||
| Incurred but not identified credit losses | 457 | 393 | 287 | |||||||
| Total allowance for off-balance sheet positions | 457 | 393 | 287 | |||||||
| Allowance for credit losses | $ | 4,230 | $ | 4,009 | $ | 3,631 | ||||
| Impaired loans, net of allowance1,2 | $ | 2,786 | $ | 2,908 | $ | 2,532 | ||||
| Net impaired loans as a percentage of net loans1,2 | 0.48 | % | 0.51 | % | 0.47 | % | ||||
| Provision for credit losses as a percentage of net average loans and acceptances | 0.38 | 0.42 | 0.33 | |||||||
| 1 | Excludes debt securities classified as loans. For additional information refer to the "Exposure to Non-Agency Collateralized Mortgage Obligations" section of this document and Note 5 of the Interim Consolidated Financial Statements. |
| 2 | Excludes FDIC covered loans and other ACI loans. For additional information refer to the "Exposure to Acquired Credit-Impaired Loans" discussion and table in this section of the document and Note 5 of the Interim Consolidated Financial Statements. |
Oil and Gas Exposure
From the beginning of fiscal 2015, West Texas Intermediate crude oil prices fell from approximately US$80 per barrel to US$42 as at July 31, 2016. Within the non-retail credit portfolio, TD had $4.1 billion of drawn exposure to oil and gas producers and services as at July 31, 2016, representing less than 1% of the Bank’s total gross loans and acceptances outstanding. Of the $4.1 billion drawn exposure, $1.4 billion is to investment grade borrowers and $2.7 billion to non-investment grade borrowers based on the Bank's internal rating system. The portfolio of oil and gas exposure is broadly diversified and consistent with TD’s North American strategy. For certain producers, a borrowing base re-determination is performed on a semi-annual basis, the results of which are used to determine exposure levels and credit terms. Within the retail credit portfolios, TD had $62.1 billion of consumer and small business outstanding exposure in Alberta, Saskatchewan, and Newfoundland and Labrador as at July 31, 2016, the regions most impacted by lower oil prices. Excluding real estate secured lending, consumer and small business banking drawn exposure represents 2% of the Bank’s total gross loans and acceptances outstanding. The Bank regularly conducts stress testing on its credit portfolios in light of current market conditions. The Bank’s portfolios continue to perform within expectations given the current level and near term outlook for commodity prices in this sector. TD expects such losses to be manageable given the Bank's relatively small exposure to the oil and gas sector.
| TD BANK GROUP • THIRD QUARTER 2016 • REPORT TO SHAREHOLDERS | Page 19 |
Real Estate Secured Lending
Retail real estate secured lending includes mortgages and lines of credit to North American consumers to satisfy financing needs including home purchases and refinancing. While the Bank retains first lien on the majority of properties held as security, there is a small portion of loans with second liens, but most of these are behind a TD mortgage that is in first position. In Canada, credit policies ensure that the combined exposure of all uninsured facilities on one property does not exceed 80% of the collateral value at origination. Lending at a higher loan-to-value ratio is permitted by legislation but requires default insurance. This insurance is contractual coverage for the life of eligible facilities and protects the Bank's real estate secured lending portfolio against potential losses caused by borrowers’ default. The Bank also purchases default insurance on lower loan-to-value ratio loans. The insurance is provided by either government-backed entities or approved private mortgage insurers. In the U.S., for residential mortgage originations, mortgage insurance is usually obtained from either government-backed entities or approved private mortgage insurers when the loan-to-value exceeds 80% of the collateral value at origination.
The Bank regularly performs stress tests on its real estate lending portfolio as part of its overall stress testing program. This is done with a view to determine the extent to which the portfolio would be vulnerable to a severe downturn in economic conditions. The effect of severe changes in house prices, interest rates, and unemployment levels are among the factors considered when assessing the impact on credit losses and the Bank's overall profitability. A variety of portfolio segments, including dwelling type and geographical regions, are examined during the exercise to determine whether specific vulnerabilities exist. Based on the Bank's most recent reviews, potential losses on all real estate secured lending exposures are considered manageable.
| TABLE 19: REAL ESTATE SECURED LENDING1,2 | |||||||||||||||||||||||||
| (millions of Canadian dollars, except as noted) | As at | ||||||||||||||||||||||||
| Residential mortgages | Home equity lines of credit | Total | |||||||||||||||||||||||
| Insured3 | Uninsured | Insured3 | Uninsured | Insured3 | Uninsured | ||||||||||||||||||||
| July 31, 2016 | |||||||||||||||||||||||||
| Canada | |||||||||||||||||||||||||
| Atlantic provinces | $ | 4,003 | 2.1 | % | $ | 1,860 | 1.0 | % | $ | 527 | 0.8 | % | $ | 1,022 | 1.6 | % | $ | 4,530 | 1.8 | % | $ | 2,882 | 1.1 | % | |
| British Columbia4 | 17,684 | 9.4 | 16,098 | 8.6 | 2,769 | 4.3 | 8,916 | 13.9 | 20,453 | 8.1 | 25,014 | 9.9 | |||||||||||||
| Ontario4 | 49,767 | 26.5 | 40,121 | 21.2 | 9,365 | 14.7 | 24,150 | 37.7 | 59,132 | 23.6 | 64,271 | 25.5 | |||||||||||||
| Prairies4 | 27,370 | 14.6 | 12,574 | 6.7 | 4,211 | 6.6 | 8,110 | 12.7 | 31,581 | 12.5 | 20,684 | 8.2 | |||||||||||||
| Québec | 11,879 | 6.3 | 6,690 | 3.6 | 1,641 | 2.6 | 3,241 | 5.1 | 13,520 | 5.4 | 9,931 | 3.9 | |||||||||||||
| Total Canada | 110,703 | 58.9 | % | 77,343 | 41.1 | % | 18,513 | 29.0 | % | 45,439 | 71.0 | % | 129,216 | 51.4 | % | 122,782 | 48.6 | % | |||||||
| United States | 923 | 26,081 | 10 | 13,015 | 933 | 39,096 | |||||||||||||||||||
| Total | $ | 111,626 | $ | 103,424 | $ | 18,523 | $ | 58,454 | $ | 130,149 | $ | 161,878 | |||||||||||||
| October 31, 2015 | |||||||||||||||||||||||||
| Canada | |||||||||||||||||||||||||
| Atlantic provinces | $ | 4,086 | 2.2 | % | $ | 1,675 | 0.9 | % | $ | 580 | 0.9 | % | $ | 965 | 1.6 | % | $ | 4,666 | 1.9 | % | $ | 2,640 | 1.1 | % | |
| British Columbia4 | 19,364 | 10.5 | 14,099 | 7.6 | 3,173 | 5.2 | 7,798 | 12.7 | 22,537 | 9.1 | 21,897 | 8.9 | |||||||||||||
| Ontario4 | 53,592 | 29.0 | 34,447 | 18.6 | 10,603 | 17.4 | 21,411 | 34.8 | 64,195 | 26.1 | 55,858 | 22.7 | |||||||||||||
| Prairies4 | 27,890 | 15.1 | 11,477 | 6.2 | 4,607 | 7.5 | 7,596 | 12.4 | 32,497 | 13.2 | 19,073 | 7.7 | |||||||||||||
| Québec | 12,435 | 6.7 | 5,944 | 3.2 | 1,816 | 3.0 | 2,768 | 4.5 | 14,251 | 5.8 | 8,712 | 3.5 | |||||||||||||
| Total Canada | 117,367 | 63.5 | % | 67,642 | 36.5 | % | 20,779 | 34.0 | % | 40,538 | 66.0 | % | 138,146 | 56.1 | % | 108,180 | 43.9 | % | |||||||
| United States | 951 | 26,413 | 10 | 13,439 | 961 | 39,852 | |||||||||||||||||||
| Total | $ | 118,318 | $ | 94,055 | $ | 20,789 | $ | 53,977 | $ | 139,107 | $ | 148,032 | |||||||||||||
| 1 | Geographic location is based on the address of the property mortgaged. |
| 2 | Excludes loans classified as trading as the Bank intends to sell the loans immediately or in the near term, and loans designated at fair value through profit or loss for which no allowance is recorded. |
| 3 | Default insurance is contractual coverage for the life of eligible facilities whereby the Bank's exposure to real estate secured lending, all or in part, is protected against potential losses caused by borrower default. It is provided by either government-backed entities or other approved private mortgage insurers. |
| 4 | The territories are included as follows: Yukon is included in British Columbia; Nunavut is included in Ontario; and the Northwest Territories is included in the Prairies region. |
The following table provides a summary of the Bank's residential mortgages by remaining amortization period. All figures are calculated based on current customer payment behaviour in order to properly reflect the propensity to prepay by borrowers. The current customer payment basis accounts for any accelerated payments made to date and projects remaining amortization based on existing balance outstanding and current payment terms.
| TABLE 20: RESIDENTIAL MORTGAGES BY REMAINING AMORTIZATION1,2 | |||||||||||||||||||
| As at | |||||||||||||||||||
| <5 | 5– <10 | 10– <15 | 15– <20 | 20– <25 | 25– <30 | 30– <35 | >=35 | ||||||||||||
| years | years | years | years | years | years | years | years | Total | |||||||||||
| July 31, 2016 | |||||||||||||||||||
| Canada | 1.1 | % | 4.3 | % | 7.7 | % | 14.4 | % | 38.8 | % | 31.7 | % | 2.0 | % | – | % | 100 | % | |
| United States | 3.3 | 4.3 | 13.2 | 4.6 | 14.2 | 59.2 | 0.9 | 0.3 | 100 | ||||||||||
| Total | 1.4 | % | 4.3 | % | 8.4 | % | 13.1 | % | 35.7 | % | 35.2 | % | 1.8 | % | 0.1 | % | 100 | % | |
| October 31, 2015 | |||||||||||||||||||
| Canada | 1.2 | % | 4.4 | % | 7.9 | % | 14.3 | % | 37.5 | % | 31.8 | % | 2.9 | % | – | % | 100 | % | |
| United States | 2.6 | 2.9 | 16.1 | 4.1 | 12.3 | 61.2 | 0.6 | 0.2 | 100 | ||||||||||
| Total | 1.4 | % | 4.3 | % | 8.9 | % | 13.0 | % | 34.3 | % | 35.4 | % | 2.6 | % | 0.1 | % | 100 | % | |
| 1 | Excludes loans classified as trading as the Bank intends to sell the loans immediately or in the near term, and loans designated at fair value through profit or loss for which no allowance is recorded. |
| 2 | Percentage based on outstanding balance. |
| TD BANK GROUP • THIRD QUARTER 2016 • REPORT TO SHAREHOLDERS | Page 20 |
| TABLE 21: UNINSURED AVERAGE LOAN-TO-VALUE – Newly Originated and Newly Acquired1,2,3 | ||||||||||||||
| For the three months ended | ||||||||||||||
| Residential | Home equity | Residential | Home equity | |||||||||||
| mortgages | lines of credit4,5 | Total | mortgages | lines of credit4,5 | Total | |||||||||
| July 31, 2016 | October 31, 2015 | |||||||||||||
| Canada | ||||||||||||||
| Atlantic provinces | 73 | % | 69 | % | 72 | % | 73 | % | 68 | % | 72 | % | ||
| British Columbia6 | 67 | 61 | 64 | 68 | 63 | 66 | ||||||||
| Ontario6 | 69 | 65 | 67 | 68 | 64 | 67 | ||||||||
| Prairies6 | 73 | 69 | 71 | 73 | 68 | 71 | ||||||||
| Québec | 72 | 72 | 72 | 72 | 70 | 72 | ||||||||
| Total Canada | 69 | 65 | 67 | 70 | 65 | 68 | ||||||||
| United States | 71 | 63 | 66 | 70 | 61 | 64 | ||||||||
| Total | 69 | % | 65 | % | 67 | % | 70 | % | 64 | % | 67 | % | ||
| 1 | Geographic location is based on the address of the property mortgaged. |
| 2 | Excludes loans classified as trading as the Bank intends to sell the loans immediately or in the near term, and loans designated at fair value through profit or loss for which no allowance is recorded. |
| 3 | Based on house price at origination. |
| 4 | Home equity lines of credit loan-to-value includes first position collateral mortgage if applicable. |
| 5 | Home equity lines of credit fixed rate advantage option is included in loan-to-value calculation. |
| 6 | The territories are included as follows: Yukon is included in British Columbia; Nunavut is included in Ontario; and the Northwest Territories is included in the Prairies region. |
Non-Prime Loans
As at July 31, 2016, the Bank had approximately $2.6 billion (October 31, 2015 – $2.6 billion) gross exposure to non-prime loans, which primarily consists of automotive loans originated in Canada. The credit loss rate, defined as the total PCL of the quarter divided by the average month-end loan balance, was approximately 6.33% on an annual basis (October 31, 2015 – 3.43%). PCL primarily increased due to higher provisions for individually insignificant impaired loans, reflecting continued weakness in oil and gas impacted regions. These loans are recorded at amortized cost.
| TD BANK GROUP • THIRD QUARTER 2016 • REPORT TO SHAREHOLDERS | Page 21 |
Sovereign Risk
The following table provides a summary of the Bank's credit exposure to certain European countries, including Greece, Italy, Ireland, Portugal, and Spain (GIIPS).
| TABLE 22: EXPOSURE TO EUROPE – Total Net Exposure by Country and Counterparty | |||||||||||||||||||||||||||||||
| (millions of Canadian dollars) | |||||||||||||||||||||||||||||||
| As at | |||||||||||||||||||||||||||||||
| Loans and commitments1 | Derivatives, repos, and securities lending2 | Trading and investment portfolio3,4 | Total | ||||||||||||||||||||||||||||
| Corporate | Sovereign | Financial | Total | Corporate | Sovereign | Financial | Total | Corporate | Sovereign | Financial | Total | Exposure5 | |||||||||||||||||||
| Country | July 31, 2016 | ||||||||||||||||||||||||||||||
| GIIPS | |||||||||||||||||||||||||||||||
| Greece | $ | – | $ | – | $ | – | $ | – | $ | – | $ | – | $ | – | $ | – | $ | – | $ | – | $ | – | $ | – | $ | – | |||||
| Italy | – | 202 | 6 | 208 | – | – | – | – | 7 | 37 | 11 | 55 | 263 | ||||||||||||||||||
| Ireland | – | – | – | – | 18 | – | 855 | 873 | – | – | – | – | 873 | ||||||||||||||||||
| Portugal | – | – | – | – | – | – | – | – | 9 | – | – | 9 | 9 | ||||||||||||||||||
| Spain | – | 99 | 48 | 147 | – | – | 51 | 51 | 4 | – | – | 4 | 202 | ||||||||||||||||||
| Total GIIPS | – | 301 | 54 | 355 | 18 | – | 906 | 924 | 20 | 37 | 11 | 68 | 1,347 | ||||||||||||||||||
| Rest of Europe | |||||||||||||||||||||||||||||||
| Belgium | 957 | – | 16 | 973 | 375 | 26 | 10 | 411 | 34 | – | – | 34 | 1,418 | ||||||||||||||||||
| Finland | 7 | 235 | 13 | 255 | – | 20 | 82 | 102 | – | 1,209 | – | 1,209 | 1,566 | ||||||||||||||||||
| France | 432 | – | 508 | 940 | 120 | 884 | 1,345 | 2,349 | 43 | 6,793 | 435 | 7,271 | 10,560 | ||||||||||||||||||
| Germany | 975 | 599 | 45 | 1,619 | 503 | 862 | 779 | 2,144 | 75 | 10,135 | 30 | 10,240 | 14,003 | ||||||||||||||||||
| Netherlands | 585 | 369 | 473 | 1,427 | 597 | 288 | 273 | 1,158 | 30 | 4,164 | 533 | 4,727 | 7,312 | ||||||||||||||||||
| Sweden | – | 46 | 222 | 268 | – | 211 | 69 | 280 | 5 | 686 | 571 | 1,262 | 1,810 | ||||||||||||||||||
| Switzerland | 1,160 | 262 | 136 | 1,558 | 69 | – | 810 | 879 | 19 | – | 204 | 223 | 2,660 | ||||||||||||||||||
| United Kingdom | 1,738 | 3,036 | 51 | 4,825 | 854 | 306 | 4,104 | 5,264 | 134 | 1,575 | 3,475 | 5,184 | 15,273 | ||||||||||||||||||
| Other6 | 81 | 4 | 7 | 92 | 55 | 305 | 297 | 657 | 3 | 1,126 | 456 | 1,585 | 2,334 | ||||||||||||||||||
| Total Rest of Europe | 5,935 | 4,551 | 1,471 | 11,957 | 2,573 | 2,902 | 7,769 | 13,244 | 343 | 25,688 | 5,704 | 31,735 | 56,936 | ||||||||||||||||||
| Total Europe | $ | 5,935 | $ | 4,852 | $ | 1,525 | $ | 12,312 | $ | 2,591 | $ | 2,902 | $ | 8,675 | $ | 14,168 | $ | 363 | $ | 25,725 | $ | 5,715 | $ | 31,803 | $ | 58,283 | |||||
| Country | October 31, 2015 | ||||||||||||||||||||||||||||||
| GIIPS | |||||||||||||||||||||||||||||||
| Greece | $ | – | $ | – | $ | – | $ | – | $ | – | $ | – | $ | – | $ | – | $ | – | $ | – | $ | – | $ | – | $ | – | |||||
| Italy | – | 203 | 4 | 207 | – | – | 3 | 3 | 1 | 25 | 2 | 28 | 238 | ||||||||||||||||||
| Ireland | – | – | – | – | – | – | 375 | 375 | – | – | – | – | 375 | ||||||||||||||||||
| Portugal | – | – | – | – | – | – | – | – | – | – | – | – | – | ||||||||||||||||||
| Spain | – | 63 | 47 | 110 | – | – | 37 | 37 | 7 | – | – | 7 | 154 | ||||||||||||||||||
| Total GIIPS | – | 266 | 51 | 317 | – | – | 415 | 415 | 8 | 25 | 2 | 35 | 767 | ||||||||||||||||||
| Rest of Europe | |||||||||||||||||||||||||||||||
| Belgium | 4,794 | – | 40 | 4,834 | 98 | 32 | 1 | 131 | 6 | – | – | 6 | 4,971 | ||||||||||||||||||
| Finland | 7 | 65 | 13 | 85 | – | 23 | 64 | 87 | – | 952 | – | 952 | 1,124 | ||||||||||||||||||
| France | 469 | – | 205 | 674 | 97 | 617 | 1,178 | 1,892 | 29 | 3,339 | 176 | 3,544 | 6,110 | ||||||||||||||||||
| Germany | 1,451 | 1,094 | 100 | 2,645 | 507 | 754 | 738 | 1,999 | 88 | 9,442 | 127 | 9,657 | 14,301 | ||||||||||||||||||
| Netherlands | 457 | 295 | 517 | 1,269 | 641 | 330 | 223 | 1,194 | 14 | 4,189 | 464 | 4,667 | 7,130 | ||||||||||||||||||
| Sweden | – | 30 | 167 | 197 | – | 27 | 62 | 89 | 28 | 458 | 441 | 927 | 1,213 | ||||||||||||||||||
| Switzerland | 1,103 | 181 | 216 | 1,500 | 22 | – | 707 | 729 | 11 | – | 211 | 222 | 2,451 | ||||||||||||||||||
| United Kingdom | 2,161 | 2,434 | 128 | 4,723 | 750 | 764 | 3,982 | 5,496 | 114 | 548 | 4,002 | 4,664 | 14,883 | ||||||||||||||||||
| Other6 | 118 | 15 | 8 | 141 | 63 | 113 | 356 | 532 | 9 | 1,235 | 137 | 1,381 | 2,054 | ||||||||||||||||||
| Total Rest of Europe | 10,560 | 4,114 | 1,394 | 16,068 | 2,178 | 2,660 | 7,311 | 12,149 | 299 | 20,163 | 5,558 | 26,020 | 54,237 | ||||||||||||||||||
| Total Europe | $ | 10,560 | $ | 4,380 | $ | 1,445 | $ | 16,385 | $ | 2,178 | $ | 2,660 | $ | 7,726 | $ | 12,564 | $ | 307 | $ | 20,188 | $ | 5,560 | $ | 26,055 | $ | 55,004 | |||||
| 1 | Exposures include interest-bearing deposits with banks and are presented net of impairment charges where applicable. There were no impairment charges for European exposures as at July 31, 2016, or October 31, 2015. |
| 2 | Exposures are calculated on a fair value basis and are net of collateral. Total market value of pledged collateral is $9.3 billion for GIIPS (October 31, 2015 – $5.6 billion) and $33.9 billion for the rest of Europe (October 31, 2015 – $41.9 billion). Derivatives are presented as net exposures where there is an International Swaps and Derivatives Association (ISDA) master netting agreement. |
| 3 | Trading Portfolio exposures are net of eligible short positions. Deposits of $1.7 billion (October 31, 2015 – $1.5 billion) are included in the Trading and Investment Portfolio. |
| 4 | The fair values of the GIIPS exposures in Level 3 in the Trading and Investment Portfolio were not significant as at July 31, 2016, and October 31, 2015. |
| 5 | The reported exposures do not include $0.4 billion of protection the Bank purchased through credit default swaps (October 31, 2015 – $0.4 billion). |
| 6 | Other European exposure is distributed across 10 countries (October 31, 2015 – 10 countries), each of which has a net exposure including loans and commitments, derivatives, repos and securities lending, and trading and investment portfolio below $1 billion as at July 31, 2016, and October 31, 2015. |
| TD BANK GROUP • THIRD QUARTER 2016 • REPORT TO SHAREHOLDERS | Page 22 |
| TABLE 23: EXPOSURE TO EUROPE – Gross European Lending Exposure by Country | |||||||||||||
| (millions of Canadian dollars) | As at | ||||||||||||
| Loans and commitments | Loans and commitments | ||||||||||||
| Direct1 | Indirect2 | Total | Direct1 | Indirect2 | Total | ||||||||
| Country | July 31, 2016 | October 31, 2015 | |||||||||||
| GIIPS | |||||||||||||
| Greece | $ | – | $ | – | $ | – | $ | – | $ | – | $ | – | |
| Italy | 204 | 4 | 208 | 204 | 3 | 207 | |||||||
| Ireland | – | – | – | – | – | – | |||||||
| Portugal | – | – | – | – | – | – | |||||||
| Spain | 99 | 48 | 147 | 63 | 47 | 110 | |||||||
| Total GIIPS | 303 | 52 | 355 | 267 | 50 | 317 | |||||||
| Rest of Europe | |||||||||||||
| Belgium | – | 973 | 973 | – | 4,834 | 4,834 | |||||||
| Finland | 62 | 193 | 255 | 61 | 24 | 85 | |||||||
| France | 400 | 540 | 940 | 179 | 495 | 674 | |||||||
| Germany | 695 | 924 | 1,619 | 1,730 | 915 | 2,645 | |||||||
| Netherlands | 872 | 555 | 1,427 | 744 | 525 | 1,269 | |||||||
| Sweden | 264 | 4 | 268 | 193 | 4 | 197 | |||||||
| Switzerland | 703 | 855 | 1,558 | 662 | 838 | 1,500 | |||||||
| United Kingdom | 3,116 | 1,709 | 4,825 | 2,581 | 2,142 | 4,723 | |||||||
| Other3 | 87 | 5 | 92 | 135 | 6 | 141 | |||||||
| Total Rest of Europe | 6,199 | 5,758 | 11,957 | 6,285 | 9,783 | 16,068 | |||||||
| Total Europe | $ | 6,502 | $ | 5,810 | $ | 12,312 | $ | 6,552 | $ | 9,833 | $ | 16,385 | |
| 1 | Includes interest-bearing deposits with banks, funded loans, and banker's acceptances. |
| 2 | Includes undrawn commitments and letters of credit. |
| 3 | Other European exposure is distributed across 10 countries (October 31, 2015 – 10 countries), each of which has a net exposure including loans and commitments, derivatives, repos and securities lending, and trading and investment portfolio below $1 billion as at July 31, 2016, and October 31, 2015. |
Of the Bank's European exposure, approximately 98% (October 31, 2015 – 99%) is to counterparties in countries rated AA or better by either Moody's Investor Services (Moody's) or Standard & Poor's (S&P), with the majority of this exposure to the sovereigns themselves and to well-rated, systemically important banks in these countries. Derivatives and securities repurchase transactions are completed on a collateralized basis. The vast majority of derivatives exposure is offset by cash collateral while the repurchase transactions are backed largely by government securities rated AA- or better by either Moody's or S&P, and cash. Additionally, the Bank has exposure to well-rated corporate issuers in Europe where the Bank also does business with their related entities in North America.
In addition to the European exposure identified above, the Bank also has $8.7 billion (October 31, 2015 – $8.8 billion) of direct exposure to supranational entities with European sponsorship and indirect exposure including $0.6 billion (October 31, 2015 – $1.6 billion) of European collateral from non-European counterparties related to repurchase and securities lending transactions that are margined daily.
As part of the Bank's usual credit risk and exposure monitoring processes, all exposures are reviewed on a regular basis. European exposures are reviewed monthly or more frequently as circumstances dictate and are periodically stress tested to identify and understand any potential vulnerabilities. Based on the most recent reviews, all European exposures are considered manageable.
Exposure to ACQUIRED CREDIT-IMPAIRED LOANS
ACI loans are generally loans with evidence of incurred credit loss where it is probable at the purchase date that the Bank will be unable to collect all contractually required principal and interest payments. Evidence of credit quality deterioration as of the acquisition date may include statistics such as past due status and credit scores. ACI loans are initially recorded at fair value and, as a result, no allowance for credit losses is recorded on the date of acquisition.
ACI loans were acquired through the acquisitions of FDIC-assisted transactions, which include FDIC-covered loans subject to loss sharing agreements with the FDIC, South Financial, Chrysler Financial, and a credit card portfolio within the U.S. strategic cards portfolio. The following table presents the unpaid principal balance, carrying value, counterparty-specific allowance, allowance for individually insignificant impaired loans, and the net carrying value as a percentage of the unpaid principal balance for ACI loans.
| TABLE 24: ACQUIRED CREDIT-IMPAIRED LOAN PORTFOLIO | |||||||||||||||
| (millions of Canadian dollars, except as noted) | As at | ||||||||||||||
| Allowance for | |||||||||||||||
| Unpaid | Counterparty- | individually | Carrying | Percentage of | |||||||||||
| principal | Carrying | specific | insignificant | value net of | unpaid principal | ||||||||||
| balance1 | value | allowance | impaired loans | allowances | balance | ||||||||||
| July 31, 2016 | |||||||||||||||
| FDIC-assisted acquisitions | $ | 525 | $ | 497 | $ | 2 | $ | 37 | $ | 458 | 87.2 | % | |||
| South Financial | 561 | 525 | 3 | 24 | 498 | 88.8 | |||||||||
| Other2 | 3 | – | – | – | – | – | |||||||||
| Total ACI loan portfolio | $ | 1,089 | $ | 1,022 | $ | 5 | $ | 61 | $ | 956 | 87.8 | % | |||
| October 31, 2015 | |||||||||||||||
| FDIC-assisted acquisitions | $ | 636 | $ | 601 | $ | 1 | $ | 45 | $ | 555 | 87.3 | % | |||
| South Financial | 853 | 813 | 5 | 32 | 776 | 91.0 | |||||||||
| Other2 | 40 | – | – | – | – | – | |||||||||
| Total ACI loan portfolio | $ | 1,529 | $ | 1,414 | $ | 6 | $ | 77 | $ | 1,331 | 87.1 | % | |||
| 1 | Represents contractual amount owed net of charge-offs since acquisition of the loan. |
| 2 | Other includes the ACI loan portfolios of Chrysler Financial and an acquired credit card portfolio within the U.S. strategic cards portfolio. |
During the three and nine months ended July 31, 2016, the Bank recorded a recovery of $8 million and $24 million, respectively, in PCL on ACI loans (three and nine months ended July 31, 2015 – $7 million and $24 million, respectively). The following table provides key credit statistics by past due contractual status and geographic concentrations based on ACI loans unpaid principal balance.
| TD BANK GROUP • THIRD QUARTER 2016 • REPORT TO SHAREHOLDERS | Page 23 |
| TABLE 25: ACQUIRED CREDIT-IMPAIRED LOANS – Key Credit Statistics | |||||||||
| (millions of Canadian dollars, except as noted) | As at | ||||||||
| July 31, 2016 | October 31, 2015 | ||||||||
| Unpaid principal balance1 | Unpaid principal balance1 | ||||||||
| Past due contractual status | |||||||||
| Current and less than 30 days past due | $ | 950 | 87.2 | % | $ | 1,314 | 85.9 | % | |
| 30-89 days past due | 29 | 2.7 | 42 | 2.8 | |||||
| 90 or more days past due | 110 | 10.1 | 173 | 11.3 | |||||
| Total ACI loans | 1,089 | 100.0 | 1,529 | 100.0 | |||||
| Geographic region | |||||||||
| Florida | 727 | 66.8 | 933 | 61.0 | |||||
| South Carolina | 266 | 24.4 | 443 | 29.0 | |||||
| North Carolina | 91 | 8.3 | 110 | 7.2 | |||||
| Other U.S. and Canada | 5 | 0.5 | 43 | 2.8 | |||||
| Total ACI loans | $ | 1,089 | 100.0 | % | $ | 1,529 | 100.0 | % | |
| 1 | Represents contractual amount owed net of charge-offs since acquisition of the loan. |
Exposure to Non-Agency Collateralized Mortgage Obligations
As a result of the acquisition of Commerce Bancorp Inc., the Bank has exposure to non-agency Collateralized Mortgage Obligations (CMO) collateralized primarily by Alt-A and Prime Jumbo mortgages, most of which are pre-payable fixed-rate mortgages without rate reset features. At the time of acquisition, the portfolio was recorded at fair value, which became the new cost basis for this portfolio. Refer to the "Exposure to Non-Agency Collateralized Mortgage Obligations" section of the 2015 Annual Report for further details on CMOs.
The allowance for losses that are incurred but not identified as at July 31, 2016, was US$41 million (October 31, 2015 – US$43 million).
The following table presents the par value, carrying value, allowance for loan losses, and the net carrying value as a percentage of the par value for the non-agency CMO portfolio as at July 31, 2016, and October 31, 2015. As at July 31, 2016, the balance of the remaining acquisition-related incurred loss was US$166 million (October 31, 2015 – US$158 million). This amount is reflected in the following table as a component of the discount from par to carrying value.
| TABLE 26: NON-AGENCY CMO LOANS PORTFOLIO | ||||||||||||
| (millions of U.S. dollars, except as noted) | As at | |||||||||||
| Allowance | Carrying | Percentage | ||||||||||
| Par | Carrying | for loan | value net of | of par | ||||||||
| value | value | losses | allowance | value | ||||||||
| July 31, 2016 | ||||||||||||
| Non-Agency CMOs | $ | 1,217 | $ | 1,068 | $ | 196 | $ | 872 | 71.7 | % | ||
| October 31, 2015 | ||||||||||||
| Non-Agency CMOs | $ | 1,431 | $ | 1,268 | $ | 202 | $ | 1,066 | 74.5 | % | ||
During the second quarter of 2009, the Bank re-securitized a portion of the non-agency CMO portfolio. As part of the on-balance sheet re-securitization, new credit ratings were obtained for the re-securitized securities that better reflect the discount on acquisition and the Bank's risk inherent on the entire portfolio. The net capital benefit of the re-securitization transaction is reflected in the changes in RWA. For accounting purposes, the Bank retained a majority of the beneficial interests in the re-securitized securities resulting in no financial statement impact. The Bank's assessment of impairment for these reclassified securities is not impacted by a change in the credit ratings.
| TABLE 27: NON-AGENCY ALT-A AND PRIME JUMBO CMO PORTFOLIO BY VINTAGE YEAR | ||||||||||||||
| (millions of U.S. dollars) | As at | |||||||||||||
| Alt-A | Prime Jumbo | Total | ||||||||||||
| Amortized | Fair | Amortized | Fair | Amortized | Fair | |||||||||
| cost | value | cost | value | cost | value | |||||||||
| July 31, 2016 | ||||||||||||||
| 2003 | $ | 22 | $ | 25 | $ | 22 | $ | 23 | $ | 44 | $ | 48 | ||
| 2004 | 52 | 58 | 16 | 18 | 68 | 76 | ||||||||
| 2005 | 213 | 257 | 15 | 18 | 228 | 275 | ||||||||
| 2006 | 166 | 196 | 78 | 88 | 244 | 284 | ||||||||
| 2007 | 236 | 279 | 93 | 104 | 329 | 383 | ||||||||
| Total portfolio net of counterparty-specific | ||||||||||||||
| and individually insignificant credit losses | $ | 689 | $ | 815 | $ | 224 | $ | 251 | $ | 913 | $ | 1,066 | ||
| Less: allowance for incurred but not identified credit losses | 41 | |||||||||||||
| Total | $ | 872 | ||||||||||||
| October 31, 2015 | ||||||||||||||
| 2003 | $ | 36 | $ | 41 | $ | 41 | $ | 44 | $ | 77 | $ | 85 | ||
| 2004 | 62 | 69 | 19 | 21 | 81 | 90 | ||||||||
| 2005 | 256 | 297 | 18 | 20 | 274 | 317 | ||||||||
| 2006 | 201 | 220 | 90 | 101 | 291 | 321 | ||||||||
| 2007 | 274 | 314 | 112 | 120 | 386 | 434 | ||||||||
| Total portfolio net of counterparty-specific | ||||||||||||||
| and individually insignificant credit losses | $ | 829 | $ | 941 | $ | 280 | $ | 306 | $ | 1,109 | $ | 1,247 | ||
| Less: allowance for incurred but not identified credit losses | 43 | |||||||||||||
| Total | $ | 1,066 | ||||||||||||
| TD BANK GROUP • THIRD QUARTER 2016 • REPORT TO SHAREHOLDERS | Page 24 |
CAPITAL POSITION
REGULATORY CAPITAL
Capital requirements of the Basel Committee on Banking Supervision (BCBS) are commonly referred to as Basel III. Under Basel III, Total Capital consists of three components, namely CET1, Additional Tier 1, and Tier 2 Capital. Risk sensitive regulatory capital ratios are calculated by dividing CET1, Tier 1, and Total Capital by their respective RWAs. Basel III also implemented, in 2015, a non-risk sensitive leverage ratio to act as a supplementary measure to the risk-sensitive capital requirements. The objective of the leverage ratio is to constrain the build-up of excess leverage in the banking sector. The key components in the calculation of the leverage ratio include, but are not limited to, Tier 1 Capital, on balance sheet assets with adjustments made to derivative and securities financing transaction exposures, and credit equivalent amounts of off-balance sheet exposures. TD continues to manage its regulatory capital in accordance with the Basel III Capital Framework as discussed in the "Capital Position" section of the 2015 Annual Report.
OSFI's Capital Requirements under Basel III
OSFI's Capital Adequacy Requirements (CAR) guideline details how the Basel III capital rules apply to Canadian banks.
Effective January 1, 2014, the CVA capital charge is to be phased in over a five year period based on a scalar approach. For fiscal 2016, the scalars for inclusion of the CVA for CET1, Tier 1, and Total Capital RWA are 64%, 71%, and 77%, respectively, unchanged from fiscal 2015. This scalar increases to 72% in 2017, 80% in 2018, and 100% in 2019 for the CET1 calculation. A similar set of scalar phase-in percentages apply to the Tier 1 and Total Capital ratio calculations.
Effective January 1, 2013, all newly issued non-common Tier 1 and Tier 2 Capital instruments must include non-viability contingent capital (NVCC) provisions to qualify as regulatory capital. NVCC provisions require the conversion of non-common capital instruments into a variable number of common shares of the Bank upon the occurrence of a trigger event as defined in the guidance. Existing non-common Tier 1 and Tier 2 capital instruments which do not include NVCC provisions are non-qualifying capital instruments and are subject to a phase-out period which began in 2013 and ends in 2022.
The CAR guideline contains two methodologies for capital ratio calculation: (1) the "transitional" method; and (2) the "all-in" method. The minimum CET1, Tier 1, and Total Capital ratios, based on the "all-in" method, are 4.5%, 6%, and 8%, respectively. OSFI expects Canadian banks to include an additional capital conservation buffer of 2.5%, effectively raising the CET1, Tier 1 Capital, and Total Capital ratio minimum requirements to 7%, 8.5%, and 10.5%, respectively.
At the discretion of OSFI, a common equity countercyclical capital buffer (CCB) within a range of 0% to 2.5% could be imposed. No CCB is currently in effect.
In March 2013, OSFI designated the six major Canadian banks as domestic systemically important banks (D-SIB), for which a 1% common equity capital surcharge is in effect from January 1, 2016. As a result, the six Canadian banks designated as D-SIBs, including TD, are required to meet an "all-in" Pillar 1 target CET1, Tier 1, and Total Capital ratios of 8%, 9.5%, and 11.5%, respectively.
The leverage ratio is calculated as per OSFI's Leverage Requirements guideline and has a regulatory minimum requirement of 3%.
The following table provides details of TD's regulatory capital position.
| TABLE 28: REGULATORY CAPITAL POSITION | |||||||||
| (millions of Canadian dollars, except as noted) | As at | ||||||||
| July 31 | October 31 | July 31 | |||||||
| 2016 | 2015 | 2015 | |||||||
| Capital | |||||||||
| Common Equity Tier 1 Capital | $ | 40,363 | $ | 37,958 | $ | 37,161 | |||
| Tier 1 Capital | 46,427 | 43,416 | 42,648 | ||||||
| Total Capital | 56,737 | 53,600 | 51,738 | ||||||
| Common Equity Tier 1 Capital risk-weighted assets for: | |||||||||
| Credit risk1,2 | 328,851 | 328,587 | 317,529 | ||||||
| Market risk | 12,456 | 12,655 | 11,659 | ||||||
| Operational risk3 | 46,936 | 41,118 | 40,307 | ||||||
| Total | $ | 388,243 | $ | 382,360 | $ | 369,495 | |||
| Capital and leverage ratios | |||||||||
| Common Equity Tier 1 Capital ratio1 | 10.4 | % | 9.9 | % | 10.1 | % | |||
| Tier 1 Capital ratio1 | 11.9 | 11.3 | 11.5 | ||||||
| Total Capital ratio1 | 14.6 | 14.0 | 13.9 | ||||||
| Leverage ratio | 3.8 | 3.7 | 3.7 | ||||||
| 1 | Each capital ratio has its own RWA measure due to the OSFI-prescribed scalar for inclusion of the CVA. For fiscal 2015 and 2016, the scalars are 64%, 71%, and 77%, respectively. |
| 2 | Effective the third quarter of 2016, OSFI approved the Bank to calculate the majority of retail portfolio credit RWAs in the U.S. Retail segment using the Advanced Internal Ratings Based (AIRB) approach. |
| 3 | Effective the third quarter of 2016, OSFI approved the Bank to use Advanced Measurement Approach (AMA). |
As at July 31, 2016, the Bank's CET1, Tier 1, and Total Capital ratios were 10.4%, 11.9%, and 14.6%, respectively. Compared with the Bank's CET1 Capital ratio of 9.9% at October 31, 2015, the CET1 Capital ratio, as at July 31, 2016, increased due to organic capital growth offset by a combination of common shares repurchased, actuarial losses on employee benefit plans, primarily due to a decline in long term interest rates, and RWA growth in the Canadian and U.S. Retail segments.
As at July 31, 2016, the Bank's leverage ratio was 3.8%. Compared with the Bank's leverage ratio of 3.7% at October 31, 2015, the leverage ratio, as at July 31, 2016, increased mainly from capital generation, partially offset by business growth in all segments.
Future Regulatory Capital Developments
Future regulatory capital developments, in addition to those described in the "Future Changes in Basel" section of the 2015 Annual Report, are noted below.
In December 2015, BCBS released the second consultative document on revisions to the standardized approach for credit risk. Similar to the first consultative document published in December 2014, the scope covers most asset classes, including Bank and Corporate, Residential and Commercial real estate, and off-balance sheet exposures.
In January 2016, OSFI issued for comment a draft guideline on Pillar 3 Disclosure Requirements. This guideline clarifies OSFI's expectations regarding domestic implementation by federally regulated deposit-taking institutions of the Revised Pillar 3 Disclosure Requirements issued by the BCBS in January 2015, which require disclosure of standard templates to provide comparability and consistency of capital and risk disclosures amongst banks. The final version of the guideline will replace OSFI's November 2007 Advisory on Pillar 3 Disclosure Requirements. The implementation date for these requirements is expected to be no later than the fourth quarter of fiscal 2018.
| TD BANK GROUP • THIRD QUARTER 2016 • REPORT TO SHAREHOLDERS | Page 25 |
In March 2016, BCBS issued a consultative document "Reducing variation in credit risk-weighted assets - constraints on the use of internal model approaches". The key aspects of the proposal include removing the option to use the Internal Ratings Based (IRB) approaches for certain exposure categories, such as loans to financial institutions and large corporations, and providing greater specification of parameter estimation practices, including model-parameter floors.
In March 2016, BCBS also released the consultative paper on a new Standardized Measurement Approach (SMA) to replace the AMA to measure operational risk.
In April 2016, BCBS issued a consultative document on revisions to the Basel III Leverage Ratio Framework and reaffirmed the 3% minimum leverage ratio requirement, but is considering higher requirements for global systemically important banks (G-SIBs), which would not currently be applicable to TD. Proposed revisions to the design and calibration of the framework include changes to the measurement of derivative exposures, equalization of trade date and settlement date accounting methodologies, treatment of provisions, and alignment of the credit conversion factors for off-balance sheet items with those proposed in the revised standardized approach for credit risk.
In April 2016, OSFI released for public consultation proposed updates to the regulatory capital requirements for loans secured by residential real estate. The update introduces a risk-sensitive floor for capital models that will be tied to the behaviour of property prices, both in terms of recent housing price trends and the behaviour of housing prices relative to household incomes, thereby increasing risk weights for certain loans secured by residential real estate. The new rule will come into effect for fiscal 2017 and will apply prospectively to newly issued loans.
In July 2016, BCBS published an updated standard on the revised securitization framework to incorporate the final standard for the capital treatment for "simple, transparent, and comparable" (STC) securitizations. Securitization exposures that meet the STC criteria qualify for reduced minimum capital requirements. The updated framework will be effective January 2018.
Normal Course Issuer Bid
On December 9, 2015, the Bank announced that the Toronto Stock Exchange (TSX) and OSFI approved the Bank's normal course issuer bid (NCIB) to repurchase for cancellation up to 9.5 million of the Bank's common shares. During the quarter ended January 31, 2016, the Bank completed its share repurchase under the NCIB and repurchased 9.5 million common shares at an average price of $51.23 per share for a total amount of $487 million.
| TABLE 29: OUTSTANDING EQUITY AND SECURITIES EXCHANGEABLE/CONVERTIBLE INTO EQUITY1 | ||||
| (millions of shares/units, except as noted) | As at | |||
| July 31, 2016 | October 31, 2015 | |||
| Number of | Number of | |||
| shares/units | shares/units | |||
| Common shares outstanding | 1,855.5 | 1,856.2 | ||
| Treasury shares – common | (0.7) | (1.1) | ||
| Total common shares | 1,854.8 | 1,855.1 | ||
| Stock options | ||||
| Vested | 6.1 | 7.0 | ||
| Non-vested | 10.0 | 11.4 | ||
| Series S | 5.4 | 5.4 | ||
| Series T | 4.6 | 4.6 | ||
| Series Y | 5.5 | 5.5 | ||
| Series Z | 4.5 | 4.5 | ||
| Series 1 | 20.0 | 20.0 | ||
| Series 3 | 20.0 | 20.0 | ||
| Series 5 | 20.0 | 20.0 | ||
| Series 7 | 14.0 | 14.0 | ||
| Series 9 | 8.0 | 8.0 | ||
| Series 11 | 6.0 | 6.0 | ||
| Series 122 | 28.0 | – | ||
| Total preferred shares – equity | 136.0 | 108.0 | ||
| Treasury shares – preferred | (0.2) | (0.1) | ||
| Total preferred shares | 135.8 | 107.9 | ||
| Capital Trust Securities (thousands of shares) | ||||
| Trust units issued by TD Capital Trust III: | ||||
| TD Capital Trust III Securities – Series 2008 | 1,000.0 | |||
| Debt issued by TD Capital Trust IV: | ||||
| TD Capital Trust IV Notes – Series 1 | 550.0 | |||
| TD Capital Trust IV Notes – Series 2 | 450.0 | |||
| TD Capital Trust IV Notes – Series 3 | 750.0 | |||
| 1 | For further details, including the principal amount, conversion and exchange features, and distributions, refer to Note 14 of the Interim Consolidated Financial Statements. |
| 2 | On January 14, 2016, the Bank issued 28 million non-cumulative 5-Year Rate Reset Preferred Shares, Series 12 ("Series 12 shares") for gross cash consideration of $700 million, which included NVCC Provisions to ensure loss absorbency at the point of non-viability. If the NVCC Provisions were to be triggered, the maximum number of common shares that could be issued based on the formula for conversion applicable to the Series 12 shares, and assuming there are no declared and unpaid dividends on the Series 12 shares or Series 13 shares, as applicable, would be 140 million. |
| TD BANK GROUP • THIRD QUARTER 2016 • REPORT TO SHAREHOLDERS | Page 26 |
| TABLE 30: FLOW STATEMENT FOR RISK-WEIGHTED ASSETS – Disclosure for Non-Counterparty Credit Risk and Counterparty Credit Risk | |||||||||||||
| Risk-Weighted Assets Movement by Key Driver | |||||||||||||
| (billions of Canadian dollars) | For the three months ended | ||||||||||||
| July 31, 2016 | April 30, 2016 | ||||||||||||
| Non-counterparty | Counterparty | Non-counterparty | Counterparty | ||||||||||
| credit risk | credit risk | credit risk | credit risk | ||||||||||
| Common Equity Tier 1 Capital RWA, balance at | |||||||||||||
| beginning of period | $ | 310.7 | $ | 16.8 | $ | 326.9 | $ | 18.7 | |||||
| Book size | 4.6 | (1.2) | 4.8 | (0.3) | |||||||||
| Book quality | 0.5 | – | 1.7 | (0.3) | |||||||||
| Model updates | (11.8) | – | 0.2 | – | |||||||||
| Methodology and policy | – | – | – | – | |||||||||
| Acquisitions and disposals | – | – | – | – | |||||||||
| Foreign exchange movements | 8.2 | 0.5 | (23.1) | (1.3) | |||||||||
| Other | 0.6 | – | 0.2 | – | |||||||||
| Total RWA movement | 2.1 | (0.7) | (16.2) | (1.9) | |||||||||
| Common Equity Tier 1 Capital RWA, balance at | |||||||||||||
| end of period | $ | 312.8 | $ | 16.1 | $ | 310.7 | $ | 16.8 | |||||
Counterparty credit risk is comprised of over-the-counter (OTC) derivatives, repo-style transactions, trades cleared through central counterparties, and CVA RWA (phased in at 64% for fiscal 2015 and 2016).
Non-counterparty credit risk includes loans and advances to retail customers (individuals and small business), corporate entities (wholesale and commercial customers), and banks and governments, as well as holdings of debt, equity securities, and other assets (including prepaid expenses, deferred income taxes, land, building, equipment, and other depreciable property).
The Book size category consists of organic changes in book size and composition (including new business and maturing loans) and, for the third quarter of 2016, increased mainly due to growth in various retail portfolios and commercial loans in the U.S. Retail and Canadian Retail segments.
The Book quality category includes quality of book changes caused by experience such as underlying customer behaviour or demographics, including changes through model calibrations/realignments.
The Model updates category relates to model implementation, changes in model scope, or any changes to address model malfunctions. Effective the third quarter of 2016, OSFI approved the Bank to calculate the majority of the retail portfolio credit RWAs in the U.S. Retail segment using the AIRB approach.
The Methodology and policy category impacts reflect newly adopted methodology changes to the calculations driven by regulatory policy changes, such as new regulations.
Foreign exchange movements are mainly due to a change in the U.S. dollar foreign exchange rate for the U.S. portfolios in the U.S. Retail and Wholesale Banking segments.
The Other category consists of items not described in the above categories, including changes in exposures not included under advanced or standardized methodologies, such as prepaid expenses, deferred income taxes, land, building, equipment and other depreciable property, and other assets.
| TABLE 31: FLOW STATEMENT FOR RISK-WEIGHTED ASSETS – Disclosure for Market Risk | ||
| Risk-Weighted Assets Movement by Key Driver | ||
| (billions of Canadian dollars) | For the three months ended | ||||
| July 31, 2016 | April 30, 2016 | ||||
| RWA, balance at beginning of period | $ | 12.9 | $ | 11.8 | |
| Movement in risk levels | (0.4) | 1.1 | |||
| Model updates | – | – | |||
| Methodology and policy | – | – | |||
| Acquisitions and disposals | – | – | |||
| Foreign exchange movements and other | n/m1 | n/m1 | |||
| Total RWA movement | (0.4) | 1.1 | |||
| RWA, balance at end of period | $ | 12.5 | $ | 12.9 | |
| 1 | Not meaningful. |
The Movement in risk levels category reflects changes in risk due to position changes and market movements. Reductions in interest rate risk contributed to the decrease in RWA. The Model updates category reflects updates to the model to reflect recent experience and change in model scope. The Methodology and policy category reflects newly adopted methodology changes to the calculations driven by regulatory policy changes. Foreign exchange movements and other are deemed not meaningful since RWA exposure measures are calculated in Canadian dollars. Therefore, no foreign exchange translation is required.
| TABLE 32: FLOW STATEMENT FOR RISK-WEIGHTED ASSETS – Disclosure for Operational Risk | ||||||
| Risk-Weighted Assets Movement by Key Driver | ||||||
| (billions of Canadian dollars) | For the three months ended | |||||
| July 31, 2016 | April 30, 2016 | |||||
| RWA, balance at beginning of period | $ | 43.2 | $ | 42.2 | ||
| Revenue generation | 0.1 | 1.0 | ||||
| Movement in risk levels | – | – | ||||
| Model updates | – | – | ||||
| Methodology and policy | 3.6 | – | ||||
| Acquisitions and disposals | – | – | ||||
| RWA, balance at end of period | $ | 46.9 | $ | 43.2 | ||
The movement in the Revenue generation category is due to a change in gross income. The Movement in risk levels category primarily reflects changes in risk due to operational loss experience, business environment and internal control factors, scenario analysis and movements in foreign exchange. The Model updates category relates to model implementation, changes in model scope, or any changes to address model malfunctions. The Methodology and policy category reflects newly adopted methodology changes to the calculations driven by regulatory policy changes. Effective the third quarter of 2016, OSFI approved the Bank to use the AMA to calculate operational risk weighted assets.
| TD BANK GROUP • THIRD QUARTER 2016 • REPORT TO SHAREHOLDERS | Page 27 |
MANAGING RISK
EXECUTIVE SUMMARY
Growing profitability in financial services involves selectively taking and managing risks within TD's risk appetite. The Bank's goal is to earn a stable and sustainable rate of return for every dollar of risk it takes, while putting significant emphasis on investing in TD's businesses to ensure it can meet its future strategic objectives.
TD's businesses and operations are exposed to a broad number of risks that have been identified and defined in the Enterprise Risk Framework. The Bank's tolerance to those risks is defined in the Enterprise Risk Appetite which has been developed within a comprehensive framework that takes into consideration current conditions in which the Bank operates and the impact that emerging risks will have on TD's strategy and risk profile. The Bank's risk appetite states that it takes risks required to build its business, but only if those risks: (1) fit the business strategy, and can be understood and managed; (2) do not expose the enterprise to any significant single loss events; TD does not 'bet the bank' on any single acquisition, business, or product; and (3) do not risk harming the TD brand. Each business is responsible for setting and aligning its individual risk appetites with that of the enterprise based on a thorough examination of the specific risks to which it is exposed.
TD considers it critical to assess regularly the operating environment and highlight top and emerging risks within the individual business and enterprise that could have a significant impact on the Bank. These risks can be internal or external, impacting the financial results, reputation, or sustainability of the business. They may also represent exposures or potential events which may or may not materialize. These risks are identified, discussed, and actioned by senior risk leaders and reported quarterly to the Risk Committee of the Board. Specific plans to mitigate top and emerging risks are prepared, monitored, and adjusted as required.
The Bank's risk governance structure and risk management approach have not substantially changed from that described in the 2015 MD&A. Additional information on risk factors can be found in the 2015 MD&A under the heading "Risk Factors and Management". For a complete discussion of the risk governance structure and the risk management approach, refer to the "Managing Risk" section in the 2015 MD&A.
The shaded sections of this MD&A represent a discussion relating to market and liquidity risks and form an integral part of the Interim Consolidated Financial Statements for the period ended July 31, 2016.
CREDIT RISK
Gross credit risk exposure, also referred to as exposure at default (EAD), is the total amount the Bank is exposed to at the time of default of a loan and is measured before counterparty-specific provisions or write-offs. Gross credit risk exposure does not reflect the effects of credit risk mitigation and includes both on-balance sheet and off-balance sheet exposures. On-balance sheet exposures consist primarily of outstanding loans, acceptances, non-trading securities, derivatives, and certain other repo-style transactions. Off-balance sheet exposures consist primarily of undrawn commitments, guarantees, and certain other repo-style transactions.
Gross credit risk exposures for the two approaches the Bank uses to measure credit risk are included in the following table.
| TABLE 33: GROSS CREDIT RISK EXPOSURES – Standardized and Advanced Internal Ratings Based (AIRB) Approaches1,2 | |||||||||||||
| (millions of Canadian dollars) | As at | ||||||||||||
| July 31, 2016 | October 31, 2015 | ||||||||||||
| Standardized | AIRB | Total | Standardized | AIRB | Total | ||||||||
| Retail | |||||||||||||
| Residential secured | $ | 1,245 | $ | 329,577 | $ | 330,822 | $ | 32,897 | $ | 276,526 | $ | 309,423 | |
| Qualifying revolving retail | – | 88,115 | 88,115 | – | 63,169 | 63,169 | |||||||
| Other retail | 18,675 | 70,247 | 88,922 | 59,655 | 38,952 | 98,607 | |||||||
| Total retail | 19,920 | 487,939 | 507,859 | 92,552 | 378,647 | 471,199 | |||||||
| Non-retail | |||||||||||||
| Corporate | 121,509 | 244,463 | 365,972 | 114,698 | 225,263 | 339,961 | |||||||
| Sovereign | 70,830 | 133,391 | 204,221 | 55,934 | 128,496 | 184,430 | |||||||
| Bank | 15,993 | 89,020 | 105,013 | 13,542 | 111,602 | 125,144 | |||||||
| Total non-retail | 208,332 | 466,874 | 675,206 | 184,174 | 465,361 | 649,535 | |||||||
| Gross credit risk exposures | $ | 228,252 | $ | 954,813 | $ | 1,183,065 | $ | 276,726 | $ | 844,008 | $ | 1,120,734 | |
| 1 | Gross credit risk exposures represent EAD and are before the effects of credit risk mitigation. This table excludes securitization, equity, and other credit RWA. |
| 2 | Effective the third quarter of 2016, OSFI approved the Bank to calculate the majority of the retail portfolio credit RWAs in the U.S. Retail segment using the AIRB approach. |
| TD BANK GROUP • THIRD QUARTER 2016 • REPORT TO SHAREHOLDERS | Page 28 |
MARKET RISK
Market risk capital is calculated using internal models and comprises three components: (1) Value-at-Risk (VaR); (2) Stressed VaR; and (3) Incremental Risk Charge (IRC). In addition, the Bank calculates market risk capital using the Standardized approach for a limited number of portfolios.
Market Risk Linkage to the Balance Sheet
The following table provides a breakdown of the Bank's balance sheet into assets and liabilities exposed to trading and non-trading market risks. Market risk of assets and liabilities included in the calculation of VaR and other metrics used for regulatory market risk capital purposes is classified as trading market risk.
| TABLE 34: MARKET RISK LINKAGE TO THE BALANCE SHEET | ||||||||||||||||
| (millions of Canadian dollars) | As at | |||||||||||||||
| July 31, 2016 | October 31, 2015 | |||||||||||||||
| Non-trading market | ||||||||||||||||
| Balance | Trading | Non-trading | Balance | Trading | Non-trading | risk – primary risk | ||||||||||
| sheet | market risk | market risk | sheet | market risk | market risk | sensitivity | ||||||||||
| Assets subject to market risk | ||||||||||||||||
| Interest-bearing deposits with banks | $ | 54,605 | $ | 419 | $ | 54,186 | $ | 42,483 | $ | 219 | $ | 42,264 | Interest rate | |||
| Trading loans, securities, and other | 102,934 | 95,190 | 7,744 | 95,157 | 89,372 | 5,785 | Interest rate | |||||||||
| Equity, foreign exchange, | ||||||||||||||||
| Derivatives | 77,858 | 68,720 | 9,138 | 69,438 | 58,144 | 11,294 | interest rate | |||||||||
| Financial assets designated at fair value | ||||||||||||||||
| through profit or loss | 4,333 | – | 4,333 | 4,378 | – | 4,378 | Interest rate | |||||||||
| Available-for-sale securities | 99,674 | – | 99,674 | 88,782 | – | 88,782 | Foreign exchange, interest rate | |||||||||
| Held-to-maturity securities | 81,341 | – | 81,341 | 74,450 | – | 74,450 | Foreign exchange, interest rate | |||||||||
| Securities purchased under reverse | ||||||||||||||||
| repurchase agreements | 100,109 | 9,569 | 90,540 | 97,364 | 13,201 | 84,163 | Interest rate | |||||||||
| Loans | 575,410 | – | 575,410 | 547,775 | – | 547,775 | Interest rate | |||||||||
| Customers' liability under acceptances | 15,756 | – | 15,756 | 16,646 | – | 16,646 | Interest rate | |||||||||
| Investment in TD Ameritrade | 6,859 | – | 6,859 | 6,683 | – | 6,683 | Equity | |||||||||
| Other assets1 | 1,883 | – | 1,883 | 1,545 | – | 1,545 | Interest rate | |||||||||
| Assets not exposed to market risk | 61,674 | – | – | 59,672 | – | – | ||||||||||
| Total Assets | 1,182,436 | 173,898 | 946,864 | 1,104,373 | 160,936 | 883,765 | ||||||||||
| Liabilities subject to market risk | ||||||||||||||||
| Trading deposits | 73,084 | 2,765 | 70,319 | 74,759 | 2,231 | 72,528 | Interest rate | |||||||||
| Derivatives | 69,720 | 64,348 | 5,372 | 57,218 | 52,752 | 4,466 | Foreign exchange, interest rate | |||||||||
| Securitization liabilities at fair value | 12,145 | 12,145 | – | 10,986 | 10,986 | – | Interest rate | |||||||||
| Other financial liabilities designated at fair | ||||||||||||||||
| value through profit or loss | 413 | 402 | 11 | 1,415 | 1,402 | 13 | Interest rate | |||||||||
| Deposits | 757,912 | – | 757,912 | 695,576 | – | 695,576 | Equity, interest rate | |||||||||
| Acceptances | 15,756 | – | 15,756 | 16,646 | – | 16,646 | Interest rate | |||||||||
| Obligations related to securities sold short | 44,564 | 40,342 | 4,222 | 38,803 | 33,594 | 5,209 | Interest rate | |||||||||
| Obligations related to securities sold under | ||||||||||||||||
| repurchase agreements | 58,762 | 9,391 | 49,371 | 67,156 | 12,376 | 54,780 | Interest rate | |||||||||
| Securitization liabilities at amortized cost | 19,313 | – | 19,313 | 22,743 | – | 22,743 | Interest rate | |||||||||
| Subordinated notes and debentures | 8,941 | – | 8,941 | 8,637 | – | 8,637 | Interest rate | |||||||||
| Other liabilities1 | 15,497 | – | 15,497 | 11,866 | – | 11,866 | Interest rate | |||||||||
| Liabilities and Equity not exposed to | ||||||||||||||||
| market risk | 106,329 | – | – | 98,568 | – | – | ||||||||||
| Total Liabilities and Equity | $ | 1,182,436 | $ | 129,393 | $ | 946,714 | $ | 1,104,373 | $ | 113,341 | $ | 892,464 | ||||
| 1 | Relates to retirement benefits, insurance, and structured entity liabilities. |
| TD BANK GROUP • THIRD QUARTER 2016 • REPORT TO SHAREHOLDERS | Page 29 |
Calculating VaR
TD computes total VaR on a daily basis by combining the General Market Risk (GMR) and Idiosyncratic Debt Specific Risk (IDSR) associated with the Bank's trading positions.
GMR is determined by creating a distribution of potential changes in the market value of the current portfolio using historical simulation. The Bank values the current portfolio using the market price and rate changes of the most recent 259 trading days for equity, interest rate, foreign exchange, credit, and commodity products. GMR is computed as the threshold level that portfolio losses are not expected to exceed more than one out of every 100 trading days. A one-day holding period is used for GMR calculation, which is scaled up to ten days for regulatory capital calculation purposes.
IDSR measures idiosyncratic (single-name) credit spread risk for credit exposures in the trading portfolio using Monte Carlo simulation. The IDSR model is based on the historical behaviour of five-year idiosyncratic credit spreads. Similar to GMR, IDSR is computed as the threshold level that portfolio losses are not expected to exceed more than one out of every 100 trading days. IDSR is measured for a ten-day holding period.
The following graph discloses daily one-day VaR usage and trading-related revenue within Wholesale Banking. Trading-related revenue is the total of trading income reported in non-interest income and the net interest income on trading positions reported in net interest income, and is reported on a TEB. For the quarter ended July 31, 2016, there were 4 days of trading losses and trading-related revenue was positive for 94% of the trading days, reflecting normal trading activity. Losses in the quarter did not exceed VaR on any trading day.
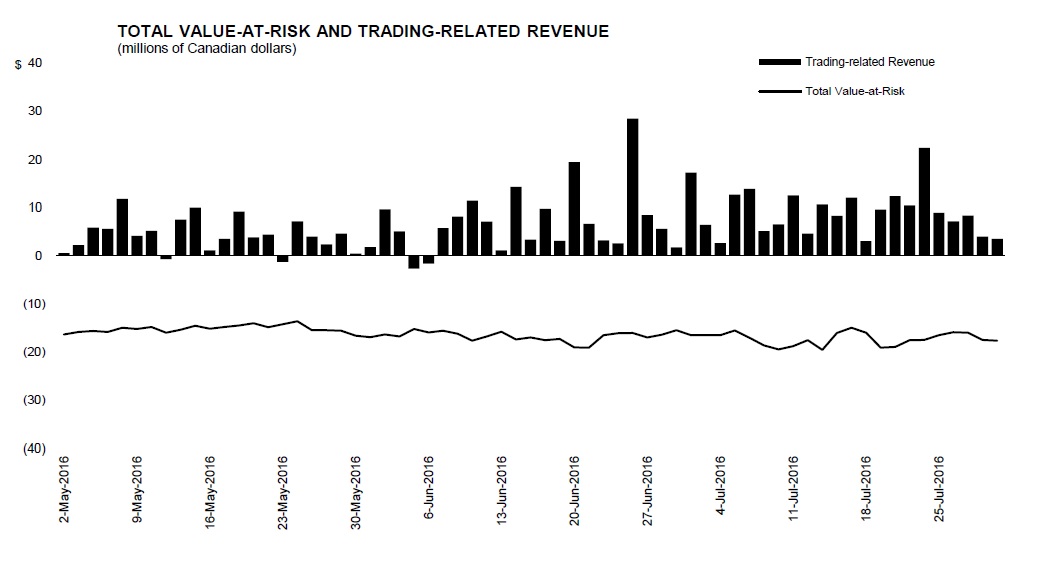
VaR is a valuable risk measure but it should be used in the context of its limitations, for example:
| • | VaR uses historical data to estimate future events, which limits its forecasting abilities; |
| • | it does not provide information on losses beyond the selected confidence level; and |
| • | it assumes that all positions can be liquidated during the holding period used for VaR calculation. |
The Bank continuously improves its VaR methodologies and incorporates new risk measures in line with market conventions, industry best practices, and regulatory requirements.
To mitigate some of the shortcomings of VaR, the Bank uses additional metrics designed for risk management and capital purposes. These include Stressed VaR, IRC, Stress Testing Framework, as well as limits based on the sensitivity to various market risk factors.
Calculating Stressed VaR
In addition to VaR, the Bank also calculates Stressed VaR, which includes Stressed GMR and Stressed IDSR. Stressed VaR is designed to measure the adverse impact that potential changes in market rates and prices could have on the value of a portfolio over a specified period of stressed market conditions. Stressed VaR is determined using similar techniques and assumptions in GMR and IDSR VaR. However, instead of using the most recent 259 trading days (one year), the Bank uses a selected year of stressed market conditions. In the third quarter of 2016, Stressed VaR was calculated using the one-year period that began on February 1, 2008. The appropriate historical one-year period to use for Stressed VaR is determined on a quarterly basis. Stressed VaR is a part of regulatory capital requirements.
Calculating the Incremental Risk Charge
The IRC is applied to all instruments in the trading book subject to migration and default risk. Migration risk represents the risk of changes in the credit ratings of the Bank's exposures. TD applies a Monte Carlo simulation with a one-year horizon and a 99.9% confidence level to determine IRC, which is consistent with regulatory requirements. IRC is based on a "constant level of risk" assumption, which requires banks to assign a liquidity horizon to positions that are subject to IRC. IRC is a part of regulatory capital requirements.
| TD BANK GROUP • THIRD QUARTER 2016 • REPORT TO SHAREHOLDERS | Page 30 |
The following table presents the end of quarter, average, high, and low usage of TD's portfolio metrics.
| TABLE 35: PORTFOLIO MARKET RISK MEASURES | ||||||||||||||||||
| (millions of Canadian dollars) | For the three months ended | For the nine months ended | ||||||||||||||||
| July 31 | April 30 | July 31 | July 31 | July 31 | ||||||||||||||
| 2016 | 2016 | 2015 | 2016 | 2015 | ||||||||||||||
| As at | Average | High | Low | Average | Average | Average | Average | |||||||||||
| Interest rate risk | $ | 8.7 | $ | 7.7 | $ | 11.3 | $ | 5.4 | $ | 10.2 | $ | 10.3 | $ | 10.4 | $ | 7.4 | ||
| Credit spread risk | 8.3 | 7.2 | 10.4 | 5.1 | 9.5 | 6.4 | 8.7 | 7.3 | ||||||||||
| Equity risk | 10.2 | 8.5 | 10.5 | 5.9 | 8.9 | 9.4 | 9.0 | 8.4 | ||||||||||
| Foreign exchange risk | 2.1 | 2.4 | 4.4 | 1.4 | 3.7 | 3.3 | 3.3 | 3.4 | ||||||||||
| Commodity risk | 2.7 | 2.9 | 4.2 | 1.9 | 1.8 | 1.6 | 2.2 | 1.5 | ||||||||||
| Idiosyncratic debt specific risk | 11.7 | 11.5 | 15.2 | 7.9 | 16.1 | 15.5 | 13.3 | 16.0 | ||||||||||
| Diversification effect1 | (26.1) | (23.8) | n/m2 | n/m2 | (26.3) | (25.3) | (25.6) | (23.7) | ||||||||||
| Total Value-at-Risk (one-day) | 17.6 | 16.4 | 19.5 | 13.6 | 23.9 | 21.2 | 21.3 | 20.3 | ||||||||||
| Stressed Value-at-Risk (one-day) | 37.0 | 38.1 | 43.6 | 33.9 | 37.2 | 28.4 | 35.1 | 29.3 | ||||||||||
| Incremental Risk Capital Charge | ||||||||||||||||||
| (one-year) | $ | 193.7 | $ | 215.6 | $ | 287.2 | $ | 162.1 | $ | 209.3 | $ | 233.5 | $ | 212.2 | $ | 252.2 | ||
| 1 | The aggregate VaR is less than the sum of the VaR of the different risk types due to risk offsets resulting from portfolio diversification. |
| 2 | Not meaningful. It is not meaningful to compute a diversification effect because the high and low may occur on different days for different risk types. |
Average VaR declined quarter-over-quarter and year-over-year due to a decrease in interest rate and debt specific risks reflecting a combination of decreased exposures and changes in market rates. The year-over-year average Stressed VaR increase was mostly driven by higher equity positions.
Average IRC was relatively unchanged.
Validation of VaR Model
The Bank uses a back-testing process to compare the actual and theoretical profit and losses to VaR to ensure that they are consistent with the statistical results of the VaR model. The theoretical profit or loss is generated using the daily price movements on the assumption that there is no change in the composition of the portfolio. Validation of the IRC model must follow a different approach since the one-year horizon and 99.9% confidence level preclude standard back-testing techniques. Instead, key parameters of the IRC model such as transition and correlation matrices are subject to independent validation by benchmarking against external study results or through analysis using internal or external data.
Interest Rate Risk
The following graph2 shows the Bank's interest rate risk exposure (as measured by Economic Value at Risk (EVaR)) on all non-trading assets, liabilities, and derivative instruments used for interest rate risk management.

| 2 | The footnotes included in Table 36 are also applicable to this graph. |
| TD BANK GROUP • THIRD QUARTER 2016 • REPORT TO SHAREHOLDERS | Page 31 |
The Bank uses derivative financial instruments, wholesale investments, funding instruments, other capital market alternatives, and, less frequently, product pricing strategies to manage interest rate risk. As at July 31, 2016, an immediate and sustained 100 bps increase in interest rates would have decreased the economic value of shareholders' equity by $291 million (April 30, 2016 – $64 million) after tax. An immediate and sustained 100 bps decrease in interest rates is typically used to determine the reduction in the economic value of shareholders' equity. However, due to the low rate environment in both Canada and in the U.S. at the end of the quarter, it was only possible to shock Canadian and U.S. rates by 75 bps and 50 bps respectively, while maintaining a floor at 0%. The impact of these scenarios would have reduced the economic value of shareholders' equity by $101 million (April 30, 2016 – $207 million) after tax.
The interest risk exposure, or EVaR, in the insurance business is not included in the above graph. Interest rate risk is managed using defined exposure limits and processes, as set and governed by the insurance Board of Directors.
The following table shows the sensitivity of the economic value of shareholders' equity (after tax) by currency for those currencies where TD has material exposure.
| TABLE 36: SENSITIVITY OF AFTER-TAX ECONOMIC VALUE AT RISK BY CURRENCY1,2 | |||||||||||||
| (millions of Canadian dollars) | As at | ||||||||||||
| July 31, 2016 | April 30, 2016 | July 31, 2015 | |||||||||||
| 100 bps | 100 bps | 100 bps | 100 bps | 100 bps | 100 bps | ||||||||
| increase | decrease | increase | decrease | increase | decrease | ||||||||
| Canadian dollar | $ | (14) | $ | (55)3 | $ | 124 | $ | (155)3 | $ | 6 | $ | (26)3 | |
| U.S. dollar | (277) | (47)4 | (188) | (52)4 | (59) | (22)4 | |||||||
| $ | (291) | $ | (101) | $ | (64) | $ | (207) | $ | (52) | $ | (48) | ||
| 1 | Effective the second quarter of 2016, unfunded pension and benefit liabilities are included in EVaR sensitivity. |
| 2 | Effective the third quarter of 2016, the Bank enhanced the methodology used to stabilize product margins over time. |
| 3 | Due to the low rate environment EVaR sensitivity has been measured using a 75 bps rate decline for Canadian interest rates for the quarter ended July 31, 2016, a 75 bps decline for the quarter ended April 30, 2016, and a 50 bps decline for the quarter ended July 31, 2015, corresponding to an interest rate environment that is floored at 0%. |
| 4 | Due to the low rate environment EVaR sensitivity has been measured using a 50 bps rate decline for U.S. interest rates for the quarter ended July 31, 2016, 50 bps decline for the quarter ended April 30, 2016, and a 25 bps decline for the quarter ended July 31, 2015. All rate shocks are floored at 0%. |
Liquidity Risk
The risk of having insufficient cash or collateral to meet financial obligations without, in a timely manner, raising funding at unfavourable rates or selling assets at distressed prices. Financial obligations can arise from deposit withdrawals, debt maturities, commitments to provide credit or liquidity support, or the need to pledge additional collateral.
The Bank maintains a prudent and disciplined approach to managing its potential exposure to liquidity risk. The Bank targets a 90-day survival horizon under a combined Bank-specific and market-wide stress scenario, and a minimum buffer over regulatory requirements prescribed by the OSFI Liquidity Adequacy Requirements (LAR) guidelines that took effect in January 2015.
The Bank’s Asset, Liability and Capital Committee (ALCO) oversees the Bank’s liquidity risk management program. It ensures there are effective management structures and policies in place to properly measure and manage liquidity risk. The Global Liquidity Forum (GLF), a subcommittee of the ALCO comprised of senior management from Treasury and Balance Sheet Management (TBSM), Risk Management, Finance, Wholesale Banking, and representatives from foreign operations, identifies and monitors TD's liquidity risks. The management of liquidity risk is the responsibility of the Head of TBSM, while oversight and challenge is provided by the ALCO and independently by Risk Management. The Risk Committee of the Board regularly reviews the Bank’s liquidity position and approves the Bank’s Liquidity Risk Management Framework and Policies annually.
The Bank's liquidity risk appetite and liquidity risk management approach have not substantially changed from that described in the 2015 Annual Report. For a complete discussion of liquidity risk, refer to the "Liquidity Risk" section in the 2015 Annual Report.
Pursuant to the Enhanced Prudential Standards for Bank Holding Companies and Foreign Banking Organizations, effective July 1, 2016, TD Group US Holding LLC (TDGUS), which is TD's U.S. Intermediate Holding Company (IHC), was expanded to encompass both the U.S. Retail and wholesale legal entities. Also effective July 1, 2016, TD established a Combined U.S. Operations (CUSO) unit that consists of the IHC and TD's U.S. branch and agency network. Both TDGUS and CUSO are managed to the U.S. Enhanced Prudential Standards liquidity requirements in addition to the Bank's liquidity management framework.
Liquid assets
The unencumbered liquid assets TD includes as available liquidity in the 90-day measurement period must be high quality securities that the Bank believes can be quickly monetized in stress conditions with minimum loss in market value. Unencumbered liquid assets are represented in a cumulative liquidity gap framework with adjustments made for estimated market or trading depths, settlement timing, and/or other identified impediments to potential sale or pledging.
Although TD has access to the Bank of Canada’s Emergency Lending Assistance Program, the Federal Reserve Bank Discount Window in the U.S., and the European Central Bank standby facilities, TD does not consider borrowing capacity at central banks under these types of programs as a source of available liquidity when assessing liquidity positions.
| TD BANK GROUP • THIRD QUARTER 2016 • REPORT TO SHAREHOLDERS | Page 32 |
| TABLE 37: SUMMARY OF LIQUID ASSETS BY TYPE AND CURRENCY1 | ||||||||||||||
| (billions of Canadian dollars, except as noted) | As at | |||||||||||||
| Securities | ||||||||||||||
| received as | ||||||||||||||
| collateral from | ||||||||||||||
| securities | ||||||||||||||
| financing and | ||||||||||||||
| Bank-owned | derivative | Total | Encumbered | Unencumbered | ||||||||||
| liquid assets | transactions2 | liquid assets | liquid assets | liquid assets2 | ||||||||||
| July 31, 2016 | ||||||||||||||
| Cash and due from banks | $ | 3.3 | $ | – | $ | 3.3 | 1 | % | $ | 0.2 | $ | 3.1 | ||
| Canadian government obligations | 13.5 | 36.6 | 50.1 | 11 | 22.9 | 27.2 | ||||||||
| National Housing Act Mortgage-Backed | ||||||||||||||
| Securities (NHA MBS) | 35.7 | 0.3 | 36.0 | 8 | 3.1 | 32.9 | ||||||||
| Provincial government obligations | 9.5 | 11.5 | 21.0 | 4 | 11.5 | 9.5 | ||||||||
| Corporate issuer obligations | 7.9 | 4.0 | 11.9 | 3 | 1.7 | 10.2 | ||||||||
| Equities | 16.1 | 5.5 | 21.6 | 5 | 8.6 | 13.0 | ||||||||
| Other marketable securities and/or loans | 4.2 | 1.1 | 5.3 | 1 | 1.1 | 4.2 | ||||||||
| Total Canadian dollar-denominated | 90.2 | 59.0 | 149.2 | 33 | 49.1 | 100.1 | ||||||||
| Cash and due from banks | 48.0 | – | 48.0 | 10 | 1.1 | 46.9 | ||||||||
| U.S. government obligations | 23.9 | 28.9 | 52.8 | 12 | 26.4 | 26.4 | ||||||||
| U.S. federal agency obligations, including U.S. | ||||||||||||||
| federal agency mortgage-backed obligations | 33.1 | 6.4 | 39.5 | 9 | 15.7 | 23.8 | ||||||||
| Other sovereign obligations | 50.5 | 27.6 | 78.1 | 17 | 13.9 | 64.2 | ||||||||
| Corporate issuer obligations | 55.1 | 10.8 | 65.9 | 14 | 14.6 | 51.3 | ||||||||
| Equities | 6.1 | 7.9 | 14.0 | 3 | 3.1 | 10.9 | ||||||||
| Other marketable securities and/or loans | 7.4 | 0.8 | 8.2 | 2 | – | 8.2 | ||||||||
| Total non-Canadian dollar-denominated | 224.1 | 82.4 | 306.5 | 67 | 74.8 | 231.7 | ||||||||
| Total | $ | 314.3 | $ | 141.4 | $ | 455.7 | 100 | % | $ | 123.9 | $ | 331.8 | ||
| October 31, 2015 | ||||||||||||||
| Cash and due from banks | $ | 2.9 | $ | – | $ | 2.9 | 1 | % | $ | 0.2 | $ | 2.7 | ||
| Canadian government obligations | 17.6 | 29.0 | 46.6 | 11 | 19.6 | 27.0 | ||||||||
| NHA MBS | 38.5 | 0.5 | 39.0 | 9 | 3.3 | 35.7 | ||||||||
| Provincial government obligations | 9.3 | 6.8 | 16.1 | 4 | 7.0 | 9.1 | ||||||||
| Corporate issuer obligations | 5.3 | 4.1 | 9.4 | 2 | 1.5 | 7.9 | ||||||||
| Equities | 15.3 | 3.5 | 18.8 | 5 | 7.2 | 11.6 | ||||||||
| Other marketable securities and/or loans | 3.5 | 1.2 | 4.7 | 1 | 0.7 | 4.0 | ||||||||
| Total Canadian dollar-denominated | 92.4 | 45.1 | 137.5 | 33 | 39.5 | 98.0 | ||||||||
| Cash and due from banks | 36.9 | – | 36.9 | 9 | – | 36.9 | ||||||||
| U.S. government obligations | 13.0 | 28.7 | 41.7 | 10 | 29.1 | 12.6 | ||||||||
| U.S. federal agency obligations, including U.S. | ||||||||||||||
| federal agency mortgage-backed obligations | 31.3 | 5.8 | 37.1 | 9 | 14.4 | 22.7 | ||||||||
| Other sovereign obligations | 43.0 | 35.5 | 78.5 | 19 | 21.8 | 56.7 | ||||||||
| Corporate issuer obligations | 55.5 | 0.9 | 56.4 | 13 | 4.3 | 52.1 | ||||||||
| Equities | 5.9 | 3.1 | 9.0 | 2 | 1.3 | 7.7 | ||||||||
| Other marketable securities and/or loans | 6.6 | 14.2 | 20.8 | 5 | 12.4 | 8.4 | ||||||||
| Total non-Canadian dollar-denominated | 192.2 | 88.2 | 280.4 | 67 | 83.3 | 197.1 | ||||||||
| Total | $ | 284.6 | $ | 133.3 | $ | 417.9 | 100 | % | $ | 122.8 | $ | 295.1 | ||
| 1 | Positions stated include gross asset values pertaining to secured borrowing/lending and reverse-repurchase/repurchase businesses. |
| 2 | Liquid assets include collateral received that can be rehypothecated or otherwise redeployed. |
The increase of $36.7 billion in total unencumbered liquid assets from October 31, 2015, was mainly due to term wholesale funding activity. Liquid assets are held in The Toronto-Dominion Bank and multiple domestic and foreign subsidiaries and branches and are summarized in the following table.
| TABLE 38: SUMMARY OF UNENCUMBERED LIQUID ASSETS BY BANK, SUBSIDIARIES, AND BRANCHES | |||||
| (billions of Canadian dollars) | As at | ||||
| July 31 | October 31 | ||||
| 2016 | 2015 | ||||
| The Toronto-Dominion Bank (Parent) | $ | 118.9 | $ | 91.4 | |
| Bank subsidiaries | 194.0 | 176.1 | |||
| Foreign branches | 18.9 | 27.6 | |||
| Total | $ | 331.8 | $ | 295.1 | |
| TD BANK GROUP • THIRD QUARTER 2016 • REPORT TO SHAREHOLDERS | Page 33 |
TD's monthly average liquid assets for the quarter ended July 31, 2016, and April 30, 2016, are summarized in the following table.
| TABLE 39: SUMMARY OF AVERAGE LIQUID ASSETS BY TYPE AND CURRENCY1 | ||||||||||||||
| (billions of Canadian dollars, except as noted) | Average for the three months ended | |||||||||||||
| Securities | ||||||||||||||
| received as | ||||||||||||||
| collateral from | ||||||||||||||
| securities | ||||||||||||||
| financing and | ||||||||||||||
| Bank-owned | derivative | Total | Encumbered | Unencumbered | ||||||||||
| liquid assets | transactions2 | liquid assets | liquid assets | liquid assets2 | ||||||||||
| July 31, 2016 | ||||||||||||||
| Cash and due from banks | $ | 3.2 | $ | – | $ | 3.2 | 1 | % | $ | 0.2 | $ | 3.0 | ||
| Canadian government obligations | 13.8 | 35.5 | 49.3 | 11 | 22.5 | 26.8 | ||||||||
| NHA MBS | 35.1 | 0.3 | 35.4 | 8 | 3.0 | 32.4 | ||||||||
| Provincial government obligations | 10.0 | 10.6 | 20.6 | 4 | 11.0 | 9.6 | ||||||||
| Corporate issuer obligations | 7.8 | 4.3 | 12.1 | 3 | 1.6 | 10.5 | ||||||||
| Equities | 15.9 | 5.2 | 21.1 | 5 | 9.1 | 12.0 | ||||||||
| Other marketable securities and/or loans | 4.4 | 1.0 | 5.4 | 1 | 1.0 | 4.4 | ||||||||
| Total Canadian dollar-denominated | 90.2 | 56.9 | 147.1 | 33 | 48.4 | 98.7 | ||||||||
| Cash and due from banks | 45.5 | – | 45.5 | 10 | 1.1 | 44.4 | ||||||||
| U.S. government obligations | 21.3 | 32.9 | 54.2 | 12 | 29.7 | 24.5 | ||||||||
| U.S. federal agency obligations, including U.S. | ||||||||||||||
| federal agency mortgage-backed obligations | 32.5 | 6.7 | 39.2 | 9 | 15.8 | 23.4 | ||||||||
| Other sovereign obligations | 48.7 | 26.5 | 75.2 | 17 | 15.0 | 60.2 | ||||||||
| Corporate issuer obligations | 54.9 | 11.6 | 66.5 | 15 | 14.0 | 52.5 | ||||||||
| Equities | 4.5 | 6.7 | 11.2 | 2 | 2.8 | 8.4 | ||||||||
| Other marketable securities and/or loans | 7.2 | 0.6 | 7.8 | 2 | – | 7.8 | ||||||||
| Total non-Canadian dollar-denominated | 214.6 | 85.0 | 299.6 | 67 | 78.4 | 221.2 | ||||||||
| Total | $ | 304.8 | $ | 141.9 | $ | 446.7 | 100 | % | $ | 126.8 | $ | 319.9 | ||
| April 30, 2016 | ||||||||||||||
| Cash and due from banks | $ | 2.6 | $ | – | $ | 2.6 | 1 | % | $ | 0.1 | $ | 2.5 | ||
| Canadian government obligations | 14.6 | 36.5 | 51.1 | 12 | 25.3 | 25.8 | ||||||||
| NHA MBS | 35.9 | 0.4 | 36.3 | 8 | 3.0 | 33.3 | ||||||||
| Provincial government obligations | 10.6 | 9.2 | 19.8 | 5 | 7.9 | 11.9 | ||||||||
| Corporate issuer obligations | 7.8 | 4.3 | 12.1 | 3 | 1.5 | 10.6 | ||||||||
| Equities | 15.3 | 4.3 | 19.6 | 5 | 8.1 | 11.5 | ||||||||
| Other marketable securities and/or loans | 3.4 | 1.1 | 4.5 | 1 | 0.7 | 3.8 | ||||||||
| Total Canadian dollar-denominated | 90.2 | 55.8 | 146.0 | 35 | 46.6 | 99.4 | ||||||||
| Cash and due from banks | 41.1 | – | 41.1 | 9 | 0.1 | 41.0 | ||||||||
| U.S. government obligations | 20.0 | 32.4 | 52.4 | 12 | 31.3 | 21.1 | ||||||||
| U.S. federal agency obligations, including U.S. | ||||||||||||||
| federal agency mortgage-backed obligations | 31.2 | 8.2 | 39.4 | 9 | 16.8 | 22.6 | ||||||||
| Other sovereign obligations | 44.1 | 26.6 | 70.7 | 16 | 14.3 | 56.4 | ||||||||
| Corporate issuer obligations | 56.3 | 12.9 | 69.2 | 16 | 15.4 | 53.8 | ||||||||
| Equities | 3.9 | 3.2 | 7.1 | 1 | 1.2 | 5.9 | ||||||||
| Other marketable securities and/or loans | 7.2 | 0.8 | 8.0 | 2 | – | 8.0 | ||||||||
| Total non-Canadian dollar-denominated | 203.8 | 84.1 | 287.9 | 65 | 79.1 | 208.8 | ||||||||
| Total | $ | 294.0 | $ | 139.9 | $ | 433.9 | 100 | % | $ | 125.7 | $ | 308.2 | ||
| 1 | Positions stated include gross asset values pertaining to secured borrowing/lending and reverse-repurchase/repurchase businesses. |
| 2 | Liquid assets include collateral received that can be rehypothecated or otherwise redeployed. |
Average liquid assets held in The Toronto-Dominion Bank and multiple domestic and foreign subsidiaries and branches are summarized in the following table.
| TABLE 40: SUMMARY OF AVERAGE UNENCUMBERED LIQUID ASSETS BY BANK, SUBSIDIARIES, AND BRANCHES | |||||||||||
| (billions of Canadian dollars) | Average for the three months ended | ||||||||||
| July 31 | April 30 | ||||||||||
| 2016 | 2016 | ||||||||||
| The Toronto-Dominion Bank (Parent) | $ | 113.3 | $ | 99.3 | |||||||
| Bank subsidiaries | 190.0 | 189.3 | |||||||||
| Foreign branches | 16.6 | 19.6 | |||||||||
| Total | $ | 319.9 | $ | 308.2 | |||||||
| TD BANK GROUP • THIRD QUARTER 2016 • REPORT TO SHAREHOLDERS | Page 34 |
Asset Encumbrance
In the course of the Bank’s day-to-day operations, securities and other assets are pledged to obtain funding, support trading and prime brokerage business, and participate in clearing and settlement systems. In addition to liquid assets, a summary of encumbered and unencumbered assets is presented in the following table to identify assets that are used or available for potential funding needs.
| TABLE 41: ENCUMBERED AND UNENCUMBERED ASSETS | ||||||||||||||
| (billions of Canadian dollars, except as noted) | As at | |||||||||||||
| Encumbered1 | Unencumbered | |||||||||||||
| Encumbered | ||||||||||||||
| Pledged as | Available as | Total | assets as a % | |||||||||||
| collateral2 | Other3 | collateral4 | Other5 | assets | of total assets | |||||||||
| July 31, 2016 | ||||||||||||||
| Cash and due from banks | $ | – | $ | – | $ | – | $ | 3.6 | $ | 3.6 | – | % | ||
| Interest-bearing deposits with banks | 5.1 | 1.6 | 45.3 | 2.6 | 54.6 | 0.6 | ||||||||
| Securities, trading loans, and other6 | 66.6 | 11.4 | 199.3 | 11.0 | 288.3 | 6.6 | ||||||||
| Derivatives | – | – | – | 77.9 | 77.9 | – | ||||||||
| Securities purchased under reverse | ||||||||||||||
| repurchase agreements7 | – | – | – | 100.1 | 100.1 | – | ||||||||
| Loans, net of allowance for loan losses | 22.6 | 57.4 | 73.4 | 418.2 | 571.6 | 6.8 | ||||||||
| Customers' liability under acceptances | – | – | – | 15.8 | 15.8 | – | ||||||||
| Investment in TD Ameritrade | – | – | – | 6.9 | 6.9 | – | ||||||||
| Goodwill | – | – | – | 16.3 | 16.3 | – | ||||||||
| Other intangibles | – | – | – | 2.5 | 2.5 | – | ||||||||
| Land, buildings, equipment, and other | ||||||||||||||
| depreciable assets | – | – | – | 5.3 | 5.3 | – | ||||||||
| Deferred tax assets | – | – | – | 1.9 | 1.9 | – | ||||||||
| Other assets8 | 0.5 | – | – | 37.1 | 37.6 | – | ||||||||
| Total on-balance sheet assets | $ | 94.8 | $ | 70.4 | $ | 318.0 | $ | 699.2 | $ | 1,182.4 | 14.0 | % | ||
| Off-balance sheet items9 | ||||||||||||||
| Securities purchased under reverse | ||||||||||||||
| repurchase agreements | 77.4 | – | 34.6 | (100.1) | ||||||||||
| Securities borrowing and collateral received | 26.7 | 0.4 | 18.5 | 0.1 | ||||||||||
| Margin loans and other client activity | 2.3 | – | 14.4 | (7.7) | ||||||||||
| Total off-balance sheet items | 106.4 | 0.4 | 67.5 | (107.7) | ||||||||||
| Total | $ | 201.2 | $ | 70.8 | $ | 385.5 | $ | 591.5 | ||||||
| October 31, 2015 | ||||||||||||||
| Total on-balance sheet assets | $ | 84.4 | $ | 61.7 | $ | 285.7 | $ | 672.6 | $ | 1,104.4 | 13.2 | % | ||
| Total off-balance sheet items | 98.5 | – | 51.6 | (104.5) | ||||||||||
| Total | $ | 182.9 | $ | 61.7 | $ | 337.3 | $ | 568.1 | ||||||
| 1 | Asset encumbrance has been analyzed on an individual asset basis. Where a particular asset has been encumbered and TD has holdings of the asset both on-balance sheet and off-balance sheet, it is assumed for the purpose of this disclosure that the on-balance sheet holding is encumbered ahead of the off-balance sheet holding. |
| 2 | Represents assets that have been posted externally to support the Bank's liabilities and day-to-day operations, including securities related to repurchase agreements, securities lending, clearing and payment systems, and assets pledged for derivative transactions. Also includes assets that have been pledged supporting Federal Home Loan Bank (FHLB) activity. |
| 3 | Assets supporting TD's funding activities, assets pledged against securitization liabilities, and assets held by consolidated securitization vehicles or in pools for covered bond issuance. |
| 4 | Assets that are considered readily available in their current legal form to generate funding or support collateral needs. This category includes reported FHLB assets that remain unutilized and held-to-maturity securities that are available for collateral purposes however not regularly utilized in practice. |
| 5 | Assets that cannot be used to support funding or collateral requirements in their current form. This category includes those assets that are potentially eligible as funding program collateral (for example, Canada Mortgage and Housing Corporation (CMHC) insured mortgages that can be securitized into NHA MBS). |
| 6 | Securities include trading loans, securities, and other financial assets designated at fair value through profit or loss, available-for-sale securities, and held-to-maturity securities. |
| 7 | Assets reported in Securities purchased under reverse repurchase agreements represent the value of the loans extended and not the value of the collateral received. |
| 8 | Other assets include amounts receivable from brokers, dealers, and clients. |
| 9 | Off-balance sheet items include the collateral value from the securities received under reverse repurchase agreements, securities borrowing, margin loans, and other client activity. The loan value from the reverse repurchase transactions and margin loans/client activity is deducted from the on-balance sheet Unencumbered – Other category. |
LIQUIDITY Stress Testing and Contingency Funding Plans
In addition to the 90-day "Severe Combined Stress" scenario, TD also performs liquidity stress testing on multiple alternate scenarios. These scenarios are a mix of TD-specific events, global macroeconomic stress events, and/or regional/subsidiary specific events designed to test the impact from unique drivers. Liquidity assessments are also part of the Bank's enterprise-wide stress testing program. Results from these stress event scenarios are used to inform the establishment of or make enhancements to policy limits and contingency funding plan actions.
The Bank has liquidity contingency funding plans in place at the enterprise level ("Enterprise CFP") and for subsidiaries operating in both domestic and foreign jurisdictions ("Regional CFP"). The Enterprise CFP provides a documented framework for managing unexpected liquidity situations and is an integral component of the Bank's overall liquidity risk management program. It outlines different contingency stages based on the severity and duration of the liquidity situation, and identifies recovery actions appropriate for each stage. For each recovery action, it provides key operational steps required to execute the action. Regional CFP recovery actions are aligned to support the Enterprise CFP as well as any identified local liquidity needs during stress. The actions and governance structure proposed in the Enterprise CFP are aligned with the Bank's Crisis Management Recovery Plan.
| TD BANK GROUP • THIRD QUARTER 2016 • REPORT TO SHAREHOLDERS | Page 35 |
Credit Ratings
Credit ratings impact TD's borrowing costs and ability to raise funds. Rating downgrades could potentially result in higher financing costs, reduce access to capital markets, and could also affect the Bank's ability to enter into derivative or hedging transactions.
Credit ratings and outlooks provided by rating agencies reflect their views and are subject to change from time-to-time, based on a number of factors including the Bank's financial strength, competitive position, and liquidity, as well as factors not entirely within the Bank's control, including the methodologies used by rating agencies and conditions affecting the overall financial services industry.
| TABLE 42: CREDIT RATINGS1 | |||||||
| As at | |||||||
| July 31, 2016 | |||||||
| Short-term | Senior long-term | ||||||
| Rating agency | debt rating | debt rating | Outlook | ||||
| Moody's | P-1 | Aa1 | Negative | ||||
| S&P | A-1+ | AA- | Stable | ||||
| DBRS | R-1 (high) | AA | Negative | ||||
| 1 | The above ratings are for The Toronto-Dominion Bank legal entity. A more extensive listing, including subsidiaries' ratings, is available on the Bank's website at http://www.td.com/investor/credit.jsp. Credit ratings are not recommendations to purchase, sell, or hold a financial obligation inasmuch as they do not comment on market price or suitability for a particular investor. Ratings are subject to revision or withdrawal at any time by the rating organization. |
The Bank regularly reviews the level of increased collateral its trading counterparties would require in the event of a downgrade of TD’s credit rating. Severe downgrades could have an impact on liquidity by requiring the Bank to post additional collateral for the benefit of the Bank's trading counterparties. The following table presents the additional collateral that could have been called at the reporting date in the event of one, two, and three-notch downgrades of the Bank's credit ratings.
| TABLE 43: ADDITIONAL COLLATERAL REQUIREMENTS FOR RATING DOWNGRADES | |||||
| (billions of Canadian dollars) | Average for the three months ended | ||||
| July 31 | April 30 | ||||
| 2016 | 2016 | ||||
| One-notch downgrade | $ | 0.1 | $ | 0.2 | |
| Two-notch downgrade | 0.2 | 0.2 | |||
| Three-notch downgrade | 0.4 | 0.4 | |||
LIQUIDITY COVERAGE RATIO
The Bank must maintain the Liquidity Coverage Ratio (LCR) above 100% under normal operating conditions in accordance with the OSFI LAR requirement. The LCR is calculated as the ratio of the stock of unencumbered high quality liquid assets (HQLA) over the net cash outflow requirements in the next 30 days under a hypothetical liquidity stress event. The stress event incorporates a number of idiosyncratic and market-wide shocks, including deposit run-offs, partial loss of wholesale funding, additional collateral requirements due to credit rating downgrades and market volatility, sudden increases in the drawdown of unused lines provided to the Bank's clients, and other obligations the Bank expects to honour during stress to mitigate reputational risk. HQLA eligible for the LCR calculation under the OSFI LAR are primarily central bank reserves, sovereign issued or guaranteed securities, and high quality securities issued by non-financial entities.
| TD BANK GROUP • THIRD QUARTER 2016 • REPORT TO SHAREHOLDERS | Page 36 |
The following table summarizes the Bank's average monthly LCR position for the third quarter of 2016, calculated in accordance with OSFI's LAR guideline.
| TABLE 44: AVERAGE BASEL III LIQUIDITY COVERAGE RATIO1 | |||||||||
| (billions of Canadian dollars, except as noted) | Average for the three months ended | ||||||||
| July 31, 2016 | |||||||||
| Total unweighted | Total weighted | ||||||||
| value (average)2 | value (average)3 | ||||||||
| High-quality liquid assets | |||||||||
| Total high-quality liquid assets | $ | n/a4 | $ | 189.8 | |||||
| Cash outflows | |||||||||
| Retail deposits and deposits from small business customers, of which: | $ | 390.0 | $ | 27.0 | |||||
| Stable deposits5 | 171.2 | 5.1 | |||||||
| Less stable deposits | 218.8 | 21.9 | |||||||
| Unsecured wholesale funding, of which: | 200.8 | 92.8 | |||||||
| Operational deposits (all counterparties) and deposits in networks of cooperative banks6 | 90.2 | 21.2 | |||||||
| Non-operational deposits (all counterparties) | 81.7 | 42.7 | |||||||
| Unsecured debt | 28.9 | 28.9 | |||||||
| Secured wholesale funding | n/a4 | 7.6 | |||||||
| Additional requirements, of which: | 150.7 | 36.7 | |||||||
| Outflows related to derivative exposures and other collateral requirements | 22.6 | 6.3 | |||||||
| Outflows related to loss of funding on debt products | 6.1 | 6.1 | |||||||
| Credit and liquidity facilities | 122.0 | 24.3 | |||||||
| Other contractual funding obligations | 12.9 | 7.6 | |||||||
| Other contingent funding obligations7 | 514.3 | 7.3 | |||||||
| Total cash outflows | $ | n/a4 | $ | 179.0 | |||||
| Cash inflows | |||||||||
| Secured lending | $ | 114.9 | $ | 17.8 | |||||
| Inflows from fully performing exposures | 13.0 | 7.2 | |||||||
| Other cash inflows | 9.9 | 9.9 | |||||||
| Total cash inflows | $ | 137.8 | $ | 34.9 | |||||
| Average for the three months ended | |||||||||
| July 31, 2016 | April 30, 2016 | ||||||||
| Total adjusted | Total adjusted | ||||||||
| value | value | ||||||||
| Total high-quality liquid assets8 | $ | 189.8 | $ | 179.6 | |||||
| Total net cash outflows9 | 144.1 | 140.5 | |||||||
| Liquidity coverage ratio10 | 132 | % | 128 | % | |||||
| 1 | The average is comprised of the three month ends that are in the fiscal quarter. |
| 2 | Unweighted inflow and outflow values are outstanding balances maturing or callable within 30 days. |
| 3 | Weighted values are calculated after the application of respective HQLA haircuts or inflow and outflow rates, as prescribed by the OSFI LAR guidelines. |
| 4 | Not applicable. |
| 5 | As defined by OSFI LAR, stable deposits from retail and small medium-sized enterprise (SME) customers are deposits that are insured, and are either held in transactional accounts or the depositors have an established relationship with the Bank that make deposit withdrawal highly unlikely. |
| 6 | Operational deposits from non-SME business customers are deposits kept with the Bank in order to facilitate their access and ability to conduct payment and settlement activities. These activities include clearing, custody, or cash management services. |
| 7 | Includes uncommitted credit and liquidity facilities, stable value money market mutual funds, outstanding debt securities with remaining maturity greater than 30 days, and other contractual cash outflows. TD has no contractual obligation to buyback these outstanding TD debt securities, and as a result, a 0% outflow rate is applied under the OSFI LAR guideline. |
| 8 | Adjusted HQLA includes both asset haircut and applicable caps, as prescribed by the OSFI LAR (HQLA assets after haircuts are capped at 40% for Level 2 and 15% for Level 2B). |
| 9 | Adjusted Net Cash Outflows include both inflow and outflow rates and applicable caps, as prescribed by the OSFI LAR (inflows are capped at 75% of outflows). |
| 10 | The LCR percentage is calculated as the simple average of the three month-end LCR percentages. |
The Bank’s average LCR of 132% for quarter ended July 31, 2016, continues to meet the regulatory requirement. The 4% change over the prior quarter's LCR was mainly due to the increase in HQLA as a result of term wholesale funding activity.
The Bank holds a variety of liquid assets commensurate with liquidity needs in the organization. Many of these assets qualify as HQLA under the OSFI LAR guidelines. The average HQLA of the Bank for the quarter ended July 31, 2016, was $189.8 billion (April 30, 2016 – $179.6 billion), with Level 1 assets representing 83% (April 30, 2016 – 83%). Level 1 assets are defined as the highest quality of HQLA, and include cash, central bank reserves, and highly-rated securities issued or guaranteed by governments, central banks, public-sector entities, and multilateral development banks. The Bank’s reported HQLA excludes excess HQLA from the U.S. Retail operations, as required by the OSFI LAR, to reflect liquidity transfer considerations between U.S. Retail and its affiliates in the Bank as a result of U.S. Federal Reserve Board's regulations. By excluding excess HQLA, the U.S. Retail LCR is effectively capped at 100% prior to total Bank consolidation.
The Bank manages its LCR position with a target minimum that reflects management's liquidity risk tolerances. As described in the "How TD Manages Liquidity Risk" section of the 2015 Annual Report, the Bank manages its HQLA and other liquidity buffers to the higher of TD's 90-day surplus requirement and the target buffers over regulatory requirements from the LCR and the Net Cumulative Cash Flow (NCCF) metrics. As a result, the total stock of HQLA is subject to ongoing rebalancing against the projected liquidity requirements.
| TD BANK GROUP • THIRD QUARTER 2016 • REPORT TO SHAREHOLDERS | Page 37 |
FUNDING
The Bank has access to a variety of unsecured and secured funding sources. The Bank’s funding activities are conducted in accordance with the liquidity management policy that requires, among other things, assets be funded to the appropriate term or stressed trading market depth.
The Bank's primary approach to managing funding activities is to maximize the use of deposits raised through personal and commercial banking channels. The following table illustrates the Bank’s large base of personal and commercial, domestic wealth, and TD Ameritrade sweep deposits (collectively, "P&C deposits") that make up over 72% of total funding excluding securitization.
| TABLE 45: SUMMARY OF DEPOSIT FUNDING | |||||
| (billions of Canadian dollars) | As at | ||||
| July 31 | October 31 | ||||
| 2016 | 2015 | ||||
| P&C deposits – Canadian Retail | $ | 312.9 | $ | 293.3 | |
| P&C deposits – U.S. Retail | 299.1 | 284.7 | |||
| Other deposits | 1.3 | 1.6 | |||
| Total | $ | 613.3 | $ | 579.6 | |
The Bank actively maintains various external wholesale term (greater than 1 year) funding programs to provide access to diversified funding sources, including asset securitization, covered bonds, and unsecured wholesale debt. The Bank's wholesale funding is diversified by geography, by currency, and by funding channel. The Bank also utilizes certificates of deposit and commercial paper as short term (1 year and less) funding.
The following table summarizes by geography the term funding programs, with the related program size.
| Canada | United States | Europe/Australia |
|
Capital Securities Program ($10 billion)
Senior Medium Term Linked Notes Program ($2 billion) |
U.S. SEC (F-3) Registered Senior Debt, Capital Securities and Linked Notes Program (US$40 billion) |
United Kingdom Listing Authority (UKLA) Registered Legislative Covered Bond Program ($40 billion)
UKLA Registered European Medium Term Note Program (US$20 billion)
Australian Debt Issuance Program (A$5 billion)
|
TD regularly evaluates opportunities to diversify its funding into new markets and to new investors. Through this diversification, the Bank aims to maximize funding flexibility and minimize funding concentrations and dependency. As presented in the following table, TD's long-term debt profile is well diversified by currency as well as by type of long-term funding product. Long-term funding for the quarter ended July 31, 2016, was $123.6 billion (October 31, 2015 – $102.2 billion).
| TABLE 46: LONG-TERM FUNDING | ||||||
| As at | ||||||
| Long-term funding by currency | July 31, 2016 | October 31, 2015 | ||||
| Canadian dollar | 38 | % | 41 | % | ||
| U.S. dollar | 44 | 43 | ||||
| Euro | 12 | 10 | ||||
| British pound | 3 | 4 | ||||
| Other | 3 | 2 | ||||
| Total | 100 | % | 100 | % | ||
| Long-term funding by type | ||||||
| Senior unsecured medium term notes | 54 | % | 51 | % | ||
| Covered bonds | 26 | 23 | ||||
| Mortgage securitization1 | 16 | 22 | ||||
| Term asset backed securities | 4 | 4 | ||||
| Total | 100 | % | 100 | % | ||
| 1 | Mortgage securitization excludes the residential mortgage trading business. |
The Bank maintains depositor concentration limits against short-term wholesale deposits so that it does not depend on one or small groups of depositors for funding. The Bank further limits short-term wholesale funding that can mature in a given time period in an effort to mitigate exposures to refinancing risk during a stress event.
| TD BANK GROUP • THIRD QUARTER 2016 • REPORT TO SHAREHOLDERS | Page 38 |
The following table represents the remaining maturity of various sources of funding outstanding as at July 31, 2016, and October 31, 2015.
| TABLE 47: WHOLESALE FUNDING | |||||||||||||||||
| (millions of Canadian dollars) | As at | ||||||||||||||||
| July 31 | October 31 | ||||||||||||||||
| 2016 | 2015 | ||||||||||||||||
| Less than | 1 to 3 | 3 to 6 | 6 months | Over 1 to | Over | ||||||||||||
| 1 month | months | months | to 1 year | 2 years | 2 years | Total | Total | ||||||||||
| Deposits from banks1 | $ | 5,642 | $ | 2,940 | $ | 1,664 | $ | 1,525 | $ | 7 | $ | – | $ | 11,778 | $ | 9,902 | |
| Bearer deposit note | 635 | 1,373 | 720 | 956 | – | – | 3,684 | 1,678 | |||||||||
| Certificates of deposit | 6,392 | 11,129 | 17,256 | 13,133 | 571 | 96 | 48,577 | 66,046 | |||||||||
| Commercial paper | 3,402 | 7,757 | 8,300 | 3,871 | – | – | 23,330 | 15,304 | |||||||||
| Asset backed commercial paper2 | – | – | – | – | – | – | – | – | |||||||||
| Covered bonds | – | 3,920 | – | 3,912 | 2,419 | 22,320 | 32,571 | 23,719 | |||||||||
| Mortgage securitization | 33 | 1,590 | 1,369 | 2,543 | 6,357 | 19,567 | 31,459 | 33,729 | |||||||||
| Senior unsecured medium term notes | 1,809 | 6,965 | 2,212 | 6,060 | 13,563 | 36,024 | 66,633 | 53,656 | |||||||||
| Subordinated notes and debentures3 | – | – | – | – | – | 8,941 | 8,941 | 8,637 | |||||||||
| Term asset backed securitization | – | – | – | 939 | 1,306 | 3,153 | 5,398 | 3,400 | |||||||||
| Other4 | 2,746 | 231 | 1,457 | 885 | 3 | 15 | 5,337 | 1,613 | |||||||||
| Total | $ | 20,659 | $ | 35,905 | $ | 32,978 | $ | 33,824 | $ | 24,226 | $ | 90,116 | $ | 237,708 | $ | 217,684 | |
| Of which: | |||||||||||||||||
| Secured | $ | 33 | $ | 5,510 | $ | 1,369 | $ | 7,396 | $ | 10,085 | $ | 45,055 | $ | 69,448 | $ | 60,871 | |
| Unsecured | 20,626 | 30,395 | 31,609 | 26,428 | 14,141 | 45,061 | 168,260 | 156,813 | |||||||||
| Total | $ | 20,659 | $ | 35,905 | $ | 32,978 | $ | 33,824 | $ | 24,226 | $ | 90,116 | $ | 237,708 | $ | 217,684 | |
| 1 | Includes fixed-term deposits from banks. |
| 2 | Represents Asset backed commercial paper (ABCP) issued by consolidated bank-sponsored structured entities. |
| 3 | Subordinated notes and debentures are not considered wholesale funding as they may be raised primarily for capital management purposes. |
| 4 | Includes fixed-term deposits from non-bank institutions (unsecured) of $5.3 billion (October 31, 2015 – $1.6 billion). |
Excluding the Wholesale Banking mortgage aggregation business, the Bank's total mortgage-backed securities issuance for the three and nine months ended July 31, 2016, was $0.6 billion and $1.4 billion, respectively (three and nine months ended July 31, 2015 – $0.5 billion and $1.7 billion, respectively). Other asset backed securities issuance for both three and nine months ended July 31, 2016, was $2.0 billion (three and nine months ended July 31, 2015 – nil and $0.8 billion, respectively). The Bank also issued $8.6 billion and $20.8 billion, respectively, of unsecured medium-term notes for the three and nine months ended July 31, 2016 (three and nine months ended July 31, 2015 – $5.4 billion and $12.7 billion, respectively) in various currencies and markets. The total covered bonds issuance for the three and nine months ended July 31, 2016, was $2.5 billion and $9.1 billion, respectively (three and nine months ended July 31, 2015 – $1.8 billion and $6.5 billion, respectively).
REGULATORY DEVELOPMENTS CONCERNING LIQUIDITY AND FUNDING
Regulatory developments concerning liquidity and funding have not substantially changed from that described in the 2015 Annual Report, except as noted below.
On November 9, 2015, the Financial Stability Board issued the final Total Loss-Absorbing Capacity (TLAC) standard for G-SIBs. The TLAC standard defines a minimum requirement for the instruments and liabilities that should be readily available for bail-in in resolution. Separately and on the same day, the Basel Committee on Banking Supervision released a consultative document on TLAC holdings, setting out its proposed prudential treatment of banks' investments in TLAC. It is applicable to all banks subject to the Basel Committee's standards, including both G-SIBs and non-G-SIBs. The comment period on the consultative document concluded on February 12, 2016.
Since TD is not a G-SIB, we do not expect the TLAC requirements to apply to the Bank. As a Canadian D-SIB, however, TD will be subject to the bail-in law in Canada. On March 22, 2016, the Government of Canada in its 2016 federal budget, proposed to introduce framework legislation for the bail-in regime along with accompanying enhancements to Canada’s bank resolution toolkit. The regime will provide the Canada Deposit Insurance Corporation (CDIC) with a new statutory power to convert specified eligible liabilities of D-SIBs into common shares in the unlikely event such banks become non-viable. On April 20, 2016, the Budget Implementation Act was tabled, providing amendments to the CDIC Act, Bank Act and other statutes to allow for bail-in. TD is monitoring the bail-in developments and expects further details to be included in the regulations and an implementation timeline to be clarified in the near future.
MATURITY ANALYSIS OF ASSETS, LIABILITIES, AND OFF-bALANCE SHEET COMMITMENTS
The following table summarizes on-balance sheet and off-balance sheet categories by remaining contractual maturity. Off-balance sheet commitments include contractual obligations to make future payments on operating and capital lease commitments, certain purchase obligations and other liabilities. The values of credit instruments reported in the following table represent the maximum amount of additional credit that the Bank could be obligated to extend should contracts be fully utilized. Since a significant portion of guarantees and commitments are expected to expire without being drawn upon, the total of the contractual amounts is not representative of future liquidity requirements. These contractual obligations have an impact on the Bank’s short-term and long-term liquidity and capital resource needs.
The maturity analysis presented does not depict the Bank’s degree of maturity transformation or the Bank’s exposure to interest rate and liquidity risk. The Bank ensures that assets are appropriately funded to protect against borrowing cost volatility and potential reductions to funding market availability. The Bank utilizes stable P&C non-specific maturity deposits (chequing and savings accounts) and P&C term deposits as the primary source of long-term funding for the Bank’s non-trading assets. The Bank also funds the stable balance of revolving lines of credit with long-term funding sources. The Bank conducts long-term funding activities based on the projected net growth for non-trading assets after considering such items as new business volumes, renewals of both term loans and term deposits, and how customers exercise options to prepay loans and pre-redeem deposits. The Bank also raises shorter-term unsecured wholesale deposits to fund trading assets based on its internal estimates of liquidity of these assets under stressed market conditions.
| TD BANK GROUP • THIRD QUARTER 2016 • REPORT TO SHAREHOLDERS | Page 39 |
| TABLE 48: REMAINING CONTRACTUAL MATURITY | ||||||||||||||||||||||
| (millions of Canadian dollars) | As at | |||||||||||||||||||||
| July 31, 2016 | ||||||||||||||||||||||
| No | ||||||||||||||||||||||
| Less than | 1 to 3 | 3 to 6 | 6 to 9 | 9 months | Over 1 to | Over 2 to | Over | specific | ||||||||||||||
| 1 month | months | months | months | to 1 year | 2 years | 5 years | 5 years | maturity | Total | |||||||||||||
| Assets | ||||||||||||||||||||||
| Cash and due from banks | $ | 3,593 | $ | – | $ | – | $ | – | $ | – | $ | – | $ | – | $ | – | $ | – | $ | 3,593 | ||
| Interest-bearing deposits with banks | 28,280 | 569 | 205 | 299 | 179 | – | – | – | 25,073 | 54,605 | ||||||||||||
| Trading loans, securities, and other1 | 2,151 | 4,987 | 4,343 | 2,342 | 4,806 | 9,106 | 20,184 | 16,442 | 38,573 | 102,934 | ||||||||||||
| Derivatives | 5,592 | 6,613 | 4,410 | 3,730 | 3,497 | 9,120 | 24,837 | 20,059 | – | 77,858 | ||||||||||||
| Financial assets designated at fair value through | ||||||||||||||||||||||
| profit or loss | 120 | 715 | 93 | 312 | 288 | 480 | 1,283 | 847 | 195 | 4,333 | ||||||||||||
| Available-for-sale securities | 159 | 458 | 2,198 | 678 | 1,799 | 7,115 | 44,207 | 40,965 | 2,095 | 99,674 | ||||||||||||
| Held-to-maturity securities | 1,548 | 2,905 | 5,164 | 1,871 | 1,025 | 7,657 | 37,225 | 23,946 | – | 81,341 | ||||||||||||
| Securities purchased under reverse repurchase agreements | 65,868 | 23,927 | 7,134 | 1,030 | 2,002 | 143 | 5 | – | – | 100,109 | ||||||||||||
| Loans | ||||||||||||||||||||||
| Residential mortgages | 2,277 | 4,200 | 5,568 | 5,223 | 9,056 | 48,166 | 109,990 | 30,570 | – | 215,050 | ||||||||||||
| Consumer instalment and other personal | 1,007 | 2,136 | 3,249 | 3,713 | 4,488 | 19,800 | 32,336 | 13,800 | 60,936 | 141,465 | ||||||||||||
| Credit card | – | – | – | – | – | – | – | – | 31,099 | 31,099 | ||||||||||||
| Business and government | 21,809 | 4,398 | 5,469 | 5,636 | 5,560 | 15,612 | 57,439 | 56,850 | 13,316 | 186,089 | ||||||||||||
| Debt securities classified as loans | – | – | 68 | 16 | 27 | 31 | 123 | 1,442 | – | 1,707 | ||||||||||||
| Total loans | 25,093 | 10,734 | 14,354 | 14,588 | 19,131 | 83,609 | 199,888 | 102,662 | 105,351 | 575,410 | ||||||||||||
| Allowance for loan losses | – | – | – | – | – | – | – | – | (3,773) | (3,773) | ||||||||||||
| Loans, net of allowance for loan losses | 25,093 | 10,734 | 14,354 | 14,588 | 19,131 | 83,609 | 199,888 | 102,662 | 101,578 | 571,637 | ||||||||||||
| Customers' liability under acceptances | 12,117 | 3,360 | 275 | 2 | 2 | – | – | – | – | 15,756 | ||||||||||||
| Investment in TD Ameritrade | – | – | – | – | – | – | – | – | 6,859 | 6,859 | ||||||||||||
| Goodwill2 | – | – | – | – | – | – | – | – | 16,262 | 16,262 | ||||||||||||
| Other intangibles2 | – | – | – | – | – | – | – | – | 2,542 | 2,542 | ||||||||||||
| Land, buildings, equipment, and other depreciable assets2 | – | – | – | – | – | – | – | – | 5,309 | 5,309 | ||||||||||||
| Deferred tax assets | – | – | – | – | – | – | – | – | 1,850 | 1,850 | ||||||||||||
| Amounts receivable from brokers, dealers, and clients | 25,057 | – | – | – | – | – | – | – | – | 25,057 | ||||||||||||
| Other assets | 2,532 | 506 | 315 | 383 | 144 | 193 | 292 | 149 | 8,203 | 12,717 | ||||||||||||
| Total assets | $ | 172,110 | $ | 54,774 | $ | 38,491 | $ | 25,235 | $ | 32,873 | $ | 117,423 | $ | 327,921 | $ | 205,070 | $ | 208,539 | $ | 1,182,436 | ||
| Liabilities | ||||||||||||||||||||||
| Trading deposits | $ | 8,104 | $ | 17,495 | $ | 24,857 | $ | 11,938 | $ | 7,590 | $ | 960 | $ | 1,301 | $ | 839 | $ | – | $ | 73,084 | ||
| Derivatives | 5,135 | 6,546 | 4,728 | 3,373 | 2,509 | 7,434 | 22,768 | 17,227 | – | 69,720 | ||||||||||||
| Securitization liabilities at fair value | – | – | 598 | 347 | 685 | 2,208 | 4,651 | 3,656 | – | 12,145 | ||||||||||||
| Other financial liabilities designated at fair value through | ||||||||||||||||||||||
| profit or loss | 88 | 146 | 103 | 13 | 25 | 37 | – | 1 | – | 413 | ||||||||||||
| Deposits3,4 | ||||||||||||||||||||||
| Personal | 4,893 | 5,888 | 5,652 | 7,030 | 5,909 | 8,907 | 11,781 | 144 | 372,450 | 422,654 | ||||||||||||
| Banks | 6,272 | 2,040 | 568 | 85 | 72 | 3 | 3 | 12 | 9,904 | 18,959 | ||||||||||||
| Business and government | 18,334 | 22,226 | 8,098 | 12,128 | 1,574 | 17,026 | 47,602 | 13,942 | 175,369 | 316,299 | ||||||||||||
| Total deposits | 29,499 | 30,154 | 14,318 | 19,243 | 7,555 | 25,936 | 59,386 | 14,098 | 557,723 | 757,912 | ||||||||||||
| Acceptances | 12,117 | 3,360 | 275 | 2 | 2 | – | – | – | – | 15,756 | ||||||||||||
| Obligations related to securities sold short1 | 803 | 917 | 2,804 | 1,458 | 1,078 | 4,140 | 13,464 | 11,757 | 8,143 | 44,564 | ||||||||||||
| Obligations related to securities sold under repurchase | ||||||||||||||||||||||
| agreements | 45,616 | 8,390 | 2,693 | 994 | 754 | 214 | 101 | – | – | 58,762 | ||||||||||||
| Securitization liabilities at amortized cost | 33 | 1,590 | 771 | 528 | 982 | 4,150 | 8,746 | 2,513 | – | 19,313 | ||||||||||||
| Amounts payable to brokers, dealers, and clients | 24,445 | – | – | – | – | – | – | – | – | 24,445 | ||||||||||||
| Insurance-related liabilities | 146 | 221 | 321 | 387 | 383 | 1,000 | 1,942 | 1,056 | 1,779 | 7,235 | ||||||||||||
| Other liabilities5 | 2,943 | 1,174 | 1,413 | 1,414 | 185 | 1,695 | 3,113 | 783 | 6,222 | 18,942 | ||||||||||||
| Subordinated notes and debentures | – | – | – | – | – | – | 39 | 8,902 | – | 8,941 | ||||||||||||
| Equity | – | – | – | – | – | – | – | – | 71,204 | 71,204 | ||||||||||||
| Total liabilities and equity | $ | 128,929 | $ | 69,993 | $ | 52,881 | $ | 39,697 | $ | 21,748 | $ | 47,774 | $ | 115,511 | $ | 60,832 | $ | 645,071 | $ | 1,182,436 | ||
| Off-balance sheet commitments | ||||||||||||||||||||||
| Purchase obligations | ||||||||||||||||||||||
| Operating lease commitments | $ | 78 | $ | 157 | $ | 234 | $ | 231 | $ | 228 | $ | 881 | $ | 2,146 | $ | 3,893 | $ | – | $ | 7,848 | ||
| Network service agreements | – | – | – | – | – | – | – | – | – | – | ||||||||||||
| Automated teller machines | 12 | 25 | 6 | 6 | 6 | 23 | 25 | – | – | 103 | ||||||||||||
| Contact center technology | 3 | 5 | 8 | 8 | 8 | 34 | 3 | – | – | 69 | ||||||||||||
| Software licensing and equipment maintenance | 28 | 24 | 97 | 28 | 44 | 129 | 116 | 1 | – | 467 | ||||||||||||
| Credit and liquidity commitments | ||||||||||||||||||||||
| Financial and performance standby letters of credit | 340 | 811 | 3,570 | 2,687 | 2,966 | 3,557 | 8,366 | 126 | – | 22,423 | ||||||||||||
| Documentary and commercial letters of credit | 35 | 39 | 22 | 18 | 5 | 15 | 101 | – | – | 235 | ||||||||||||
| Commitments to extend credit and liquidity6,7 | 16,957 | 19,916 | 10,978 | 4,966 | 6,303 | 14,693 | 68,499 | 3,085 | 2,096 | 147,493 | ||||||||||||
| Unconsolidated structured entity commitments | ||||||||||||||||||||||
| Commitments to liquidity facilities for ABCP | – | 1,487 | 818 | 528 | 626 | 342 | – | – | – | 3,801 | ||||||||||||
| 1 | Amount has been recorded according to the remaining contractual maturity of the underlying security. |
| 2 | For the purposes of this table, non-financial assets have been recorded as having 'no specific maturity'. |
| 3 | As the timing of demand deposits and notice deposits is non-specific and callable by the depositor, obligations have been included as having 'no specific maturity'. |
| 4 | Includes $33 billion of covered bonds with remaining contractual maturities of $4 billion in ‘over 1 months to 3 months’, $4 billion in ‘over 6 months to 9 months’, $2 billion in 'over 1 to 2 years', $18 billion in 'over 2 to 5 years', and $5 billion in 'over 5 years'. |
| 5 | Includes $123 million of capital lease commitments with remaining contractual maturities of $5 million in 'less than 1 month', $5 million in '1 month to 3 months', $7 million in '3 months to 6 months', $6 million in '6 months to 9 months', $7 million in '9 months to 1 year', $27 million in 'over 1 to 2 years', $50 million in 'over 2 to 5 years', and $16 million in 'over 5 years'. |
| 6 | Includes $134 million in commitments to extend credit to private equity investments. |
| 7 | Commitments to extend credit exclude personal lines of credit and credit card lines, which are unconditionally cancellable at the Bank's discretion at any time. |
| TD BANK GROUP • THIRD QUARTER 2016 • REPORT TO SHAREHOLDERS | Page 40 |
| TABLE 48: REMAINING CONTRACTUAL MATURITY (continued) | ||||||||||||||||||||||
| (millions of Canadian dollars) | As at | |||||||||||||||||||||
| October 31, 2015 | ||||||||||||||||||||||
| No | ||||||||||||||||||||||
| Less than | 1 to 3 | 3 to 6 | 6 to 9 | 9 months | Over 1 to | Over 2 to | Over | specific | ||||||||||||||
| 1 month | months | months | months | to 1 year | 2 years | 5 years | 5 years | maturity | Total | |||||||||||||
| Assets | ||||||||||||||||||||||
| Cash and due from banks | $ | 3,154 | $ | – | $ | – | $ | – | $ | – | $ | – | $ | – | $ | – | $ | – | $ | 3,154 | ||
| Interest-bearing deposits with banks | 21,471 | 420 | 529 | 154 | 53 | – | – | – | 19,856 | 42,483 | ||||||||||||
| Trading loans, securities, and other1 | 1,955 | 3,957 | 3,327 | 3,524 | 4,587 | 9,410 | 15,426 | 17,958 | 35,013 | 95,157 | ||||||||||||
| Derivatives | 2,845 | 4,661 | 2,906 | 3,443 | 3,315 | 10,102 | 22,291 | 19,875 | – | 69,438 | ||||||||||||
| Financial assets designated at fair value through | ||||||||||||||||||||||
| profit or loss | 195 | 488 | 535 | 205 | 285 | 552 | 770 | 1,171 | 177 | 4,378 | ||||||||||||
| Available-for-sale securities | 268 | 1,763 | 1,899 | 1,299 | 1,249 | 4,556 | 33,196 | 42,580 | 1,972 | 88,782 | ||||||||||||
| Held-to-maturity securities | 170 | 966 | 1,779 | 1,930 | 1,896 | 6,952 | 35,744 | 25,013 | – | 74,450 | ||||||||||||
| Securities purchased under reverse repurchase agreements | 57,371 | 21,490 | 14,315 | 3,002 | 1,083 | 95 | 8 | – | – | 97,364 | ||||||||||||
| Loans | ||||||||||||||||||||||
| Residential mortgages | 1,301 | 2,418 | 12,045 | 11,703 | 11,579 | 30,751 | 111,105 | 31,471 | – | 212,373 | ||||||||||||
| Consumer instalment and other personal | 970 | 2,127 | 4,263 | 3,529 | 3,702 | 7,450 | 32,885 | 18,732 | 61,813 | 135,471 | ||||||||||||
| Credit card | – | – | – | – | – | – | – | – | 30,215 | 30,215 | ||||||||||||
| Business and government | 18,755 | 4,682 | 7,030 | 6,699 | 4,132 | 11,578 | 49,473 | 52,845 | 12,335 | 167,529 | ||||||||||||
| Debt securities classified as loans | 1 | 5 | 94 | 43 | – | 120 | 243 | 1,681 | – | 2,187 | ||||||||||||
| Total loans | 21,027 | 9,232 | 23,432 | 21,974 | 19,413 | 49,899 | 193,706 | 104,729 | 104,363 | 547,775 | ||||||||||||
| Allowance for loan losses | – | – | – | – | – | – | – | – | (3,434) | (3,434) | ||||||||||||
| Loans, net of allowance for loan losses | 21,027 | 9,232 | 23,432 | 21,974 | 19,413 | 49,899 | 193,706 | 104,729 | 100,929 | 544,341 | ||||||||||||
| Customers' liability under acceptances | 13,889 | 2,380 | 337 | 40 | – | – | – | – | – | 16,646 | ||||||||||||
| Investment in TD Ameritrade | – | – | – | – | – | – | – | – | 6,683 | 6,683 | ||||||||||||
| Goodwill2 | – | – | – | – | – | – | – | – | 16,337 | 16,337 | ||||||||||||
| Other intangibles2 | – | – | – | – | – | – | – | – | 2,671 | 2,671 | ||||||||||||
| Land, buildings, equipment, and other depreciable assets2 | – | – | – | – | – | – | – | – | 5,314 | 5,314 | ||||||||||||
| Deferred tax assets | – | – | – | – | – | – | – | – | 1,931 | 1,931 | ||||||||||||
| Amounts receivable from brokers, dealers, and clients | 21,996 | – | – | – | – | – | – | – | – | 21,996 | ||||||||||||
| Other assets | 2,356 | 539 | 1,468 | 85 | 120 | 93 | 140 | 82 | 8,365 | 13,248 | ||||||||||||
| Total assets | $ | 146,697 | $ | 45,896 | $ | 50,527 | $ | 35,656 | $ | 32,001 | $ | 81,659 | $ | 301,281 | $ | 211,408 | $ | 199,248 | $ | 1,104,373 | ||
| Liabilities | ||||||||||||||||||||||
| Trading deposits | $ | 12,654 | $ | 16,457 | $ | 27,238 | $ | 11,751 | $ | 4,308 | $ | 360 | $ | 1,202 | $ | 789 | $ | – | $ | 74,759 | ||
| Derivatives | 2,629 | 4,462 | 2,599 | 2,720 | 2,343 | 7,520 | 17,294 | 17,651 | – | 57,218 | ||||||||||||
| Securitization liabilities at fair value | – | 471 | 27 | 285 | – | 1,933 | 5,033 | 3,237 | – | 10,986 | ||||||||||||
| Other financial liabilities designated at fair value through | ||||||||||||||||||||||
| profit or loss | 190 | 204 | 284 | 337 | 224 | 176 | – | – | – | 1,415 | ||||||||||||
| Deposits3,4 | ||||||||||||||||||||||
| Personal | 4,580 | 6,736 | 7,075 | 5,252 | 4,896 | 9,333 | 12,353 | 190 | 345,403 | 395,818 | ||||||||||||
| Banks | 6,118 | 2,782 | 774 | 173 | 211 | 1 | 6 | 13 | 7,002 | 17,080 | ||||||||||||
| Business and government | 15,815 | 10,600 | 6,622 | 5,813 | 13,950 | 13,265 | 37,896 | 10,266 | 168,451 | 282,678 | ||||||||||||
| Total deposits | 26,513 | 20,118 | 14,471 | 11,238 | 19,057 | 22,599 | 50,255 | 10,469 | 520,856 | 695,576 | ||||||||||||
| Acceptances | 13,889 | 2,380 | 337 | 40 | – | – | – | – | – | 16,646 | ||||||||||||
| Obligations related to securities sold short1 | 942 | 1,631 | 2,017 | 1,917 | 417 | 3,113 | 9,583 | 10,904 | 8,279 | 38,803 | ||||||||||||
| Obligations related to securities sold under repurchase | ||||||||||||||||||||||
| agreements | 54,621 | 7,884 | 2,499 | 1,427 | 424 | 225 | 76 | – | – | 67,156 | ||||||||||||
| Securitization liabilities at amortized cost | 24 | 983 | 1,366 | 1,547 | 1,971 | 4,104 | 10,013 | 2,735 | – | 22,743 | ||||||||||||
| Amounts payable to brokers, dealers, and clients | 22,664 | – | – | – | – | – | – | – | – | 22,664 | ||||||||||||
| Insurance-related liabilities | 127 | 170 | 257 | 352 | 330 | 829 | 1,728 | 1,054 | 1,672 | 6,519 | ||||||||||||
| Other liabilities5 | 1,356 | 2,243 | 682 | 286 | 170 | 1,261 | 3,215 | 101 | 4,909 | 14,223 | ||||||||||||
| Subordinated notes and debentures | – | – | – | – | – | – | – | 8,637 | – | 8,637 | ||||||||||||
| Equity | – | – | – | – | – | – | – | – | 67,028 | 67,028 | ||||||||||||
| Total liabilities and equity | $ | 135,609 | $ | 57,003 | $ | 51,777 | $ | 31,900 | $ | 29,244 | $ | 42,120 | $ | 98,399 | $ | 55,577 | $ | 602,744 | $ | 1,104,373 | ||
| Off-balance sheet commitments | ||||||||||||||||||||||
| Purchase obligations | ||||||||||||||||||||||
| Operating lease commitments | $ | 77 | $ | 155 | $ | 231 | $ | 228 | $ | 227 | $ | 874 | $ | 2,183 | $ | 4,091 | $ | – | $ | 8,066 | ||
| Network service agreements | 2 | 3 | 5 | 5 | – | – | – | – | – | 15 | ||||||||||||
| Automated teller machines | 9 | 19 | 28 | 29 | 30 | 21 | 35 | – | – | 171 | ||||||||||||
| Contact center technology | 3 | 5 | 8 | 8 | 8 | 32 | 29 | – | – | 93 | ||||||||||||
| Software licensing and equipment maintenance | 12 | 71 | 36 | 38 | 27 | 112 | 74 | 7 | – | 377 | ||||||||||||
| Credit and liquidity commitments | ||||||||||||||||||||||
| Financial and performance standby letters of credit | 868 | 1,406 | 2,415 | 2,917 | 1,586 | 3,183 | 8,479 | 192 | – | 21,046 | ||||||||||||
| Documentary and commercial letters of credit | 53 | 50 | 97 | 64 | 12 | 35 | 19 | – | – | 330 | ||||||||||||
| Commitments to extend credit and liquidity6,7 | 12,541 | 14,457 | 9,654 | 5,665 | 8,509 | 11,579 | 63,334 | 3,660 | 1,881 | 131,280 | ||||||||||||
| Unconsolidated structured entity commitments | ||||||||||||||||||||||
| Commitments to liquidity facilities for ABCP | – | 151 | 148 | 138 | 138 | 464 | 707 | – | – | 1,746 | ||||||||||||
| 1 | Amount has been recorded according to the remaining contractual maturity of the underlying security. |
| 2 | For the purposes of this table, non-financial assets have been recorded as having 'no specific maturity'. |
| 3 | As the timing of demand deposits and notice deposits is non-specific and callable by the depositor, obligations have been included as having 'no specific maturity'. |
| 4 | Includes $24 billion of covered bonds with remaining contractual maturities of $4 billion in '9 months to 1 year', $4 billion in 'over 1 to 2 years', $13 billion in 'over 2 to 5 years', and $3 billion in 'over 5 years'. |
| 5 | Includes $106 million of capital lease commitments with remaining contractual maturities of $3 million in 'less than 1 month', $7 million in '1 month to 3 months', $8 million in '3 months to 6 months', $7 million in '6 months to 9 months', $6 million in '9 months to 1 year', $24 million in 'over 1 to 2 years', $29 million in 'over 2 to 5 years', and $22 million in 'over 5 years'. |
| 6 | Includes $133 million in commitments to extend credit to private equity investments. |
| 7 | Commitments to extend credit exclude personal lines of credit and credit card lines, which are unconditionally cancellable at the Bank's discretion at any time. |
| TD BANK GROUP • THIRD QUARTER 2016 • REPORT TO SHAREHOLDERS | Page 41 |
securitization and off-balance sheet arrangements
TD carries out certain business activities through arrangements with structured entities, including special purpose entities (SPEs). Refer to Note 7 of the Bank's Interim Consolidated Financial Statements and the "Structured Entities" section of the 2015 Annual Report for further details regarding the Bank's involvement with SPEs.
Securitization of Bank-Originated Assets
The Bank securitizes residential mortgages, business and government loans, and personal loans to enhance its liquidity position, to diversify sources of funding, and to optimize the management of the balance sheet. Refer to Note 6 and Note 7 of the Interim Consolidated Financial Statements and the "Securitization of Bank-Originated Assets" section of the 2015 Annual Report for further details.
| TABLE 49: EXPOSURES SECURITIZED BY THE BANK AS ORIGINATOR1 | ||||||||||||
| (millions of Canadian dollars) | As at | |||||||||||
| Significant | ||||||||||||
| Significant | consolidated | |||||||||||
| unconsolidated SPEs | SPEs | Non-SPE third-parties | ||||||||||
| Carrying | Carrying | |||||||||||
| value of | value of | |||||||||||
| Securitized | retained | Securitized | Securitized | retained | ||||||||
| assets | interests | assets | assets | interests | ||||||||
| July 31, 2016 | ||||||||||||
| Residential mortgage loans | $ | 22,855 | $ | – | $ | – | $ | 4,780 | $ | – | ||
| Consumer instalment and other personal loans2 | – | – | 3,642 | – | – | |||||||
| Credit card loans | – | – | 1,958 | – | – | |||||||
| Business and government loans | – | – | – | 1,703 | 33 | |||||||
| Total exposure | $ | 22,855 | $ | – | $ | 5,600 | $ | 6,483 | $ | 33 | ||
| October 31, 2015 | ||||||||||||
| Residential mortgage loans | $ | 23,452 | $ | – | $ | – | $ | 6,759 | $ | – | ||
| Consumer instalment and other personal loans2 | – | – | 3,642 | – | – | |||||||
| Credit card loans | – | – | – | – | – | |||||||
| Business and government loans | – | – | – | 1,828 | 38 | |||||||
| Total exposure | $ | 23,452 | $ | – | $ | 3,642 | $ | 8,587 | $ | 38 | ||
| 1 | Includes all assets securitized by the Bank, irrespective of whether they are on-balance sheet or off-balance sheet for accounting purposes, except for securitizations through U.S. government-sponsored entities. |
| 2 | In securitization transactions that the Bank has undertaken for its own assets it has acted as an originating bank and retained securitization exposure from a capital perspective. |
Residential Mortgage Loans
The Bank securitizes residential mortgage loans through significant unconsolidated SPEs and Canadian non-SPE third-parties. Residential mortgage loans securitized by the Bank may give rise to full derecognition of the financial assets depending on the individual arrangement of each transaction. In instances where the Bank fully derecognizes residential mortgage loans, the Bank may be exposed to the risks of transferred loans through retained interests. As at July 31, 2016, the Bank has not recognized any retained interests due to the securitization of residential mortgage loans on the Interim Consolidated Balance Sheet.
Consumer Instalment and Other Personal Loans
The Bank securitizes consumer instalment and other personal loans through consolidated SPEs. The Bank consolidates the SPEs as they serve as financing vehicles for the Bank's assets, the Bank has power over the key economic decisions of the SPE, and the Bank is exposed to the majority of the residual risks of the SPEs. As at July 31, 2016, the SPEs had $4 billion of issued notes outstanding (October 31, 2015 – $4 billion). The fair value of the notes is $4 billion as at July 31, 2016 (October 31, 2015 – nil).
Credit Card Loans
The Bank securitizes credit card loans through an SPE. The Bank has consolidated the SPE as it serves as a financing vehicle for the Bank’s assets, and the Bank is exposed to the majority of the residual risks of the SPE. As at July 31, 2016, the Bank securitized $2 billion of credit card receivables. As at July 31, 2016, the consolidated SPE had US$1.5 billion variable rate notes outstanding (October 31, 2015 – nil). The notes are issued to third party investors and have fair value of US$1.5 billion as at July 31, 2016 (October 31, 2015 – nil). Due to the nature of the credit card receivables, their carrying amounts approximate fair value.
Business and Government Loans
The Bank securitizes business and government loans through significant unconsolidated SPEs and Canadian non-SPE third parties. Business and government loans securitized by the Bank may be derecognized from the Bank's balance sheet depending on the individual arrangement of each transaction. In instances where the Bank fully derecognizes business and government loans, the Bank may be exposed to the risks of transferred loans through retained interests. There are no expected credit losses on the retained interests of the securitized business and government loans as the mortgages are all government insured.
| TD BANK GROUP • THIRD QUARTER 2016 • REPORT TO SHAREHOLDERS | Page 42 |
Securitization of Third Party-Originated Assets
Significant Unconsolidated Special Purpose Entities
Multi-Seller Conduits
The Bank administers multi-seller conduits and provides liquidity facilities as well as securities distribution services; it may also provide credit enhancements. Third party-originated assets are securitized through Bank-sponsored SPEs, which are not consolidated by the Bank. TD's maximum potential exposure to loss due to its ownership interest in commercial paper and through the provision of liquidity facilities for multi-seller conduits was $14.2 billion as at July 31, 2016 (October 31, 2015 – $10.6 billion). Further, as at July 31, 2016, the Bank had committed to provide an additional $3.8 billion in liquidity facilities that can be used to support future ABCP in the purchase of deal-specific assets (October 31, 2015 – $1.7 billion).
All third-party assets securitized by the Bank's unconsolidated multi-seller conduits were originated in Canada and sold to Canadian securitization structures. Details of the Bank-administered multi-seller ABCP conduits are included in the following table.
| TABLE 50: EXPOSURE TO THIRD PARTY-ORIGINATED ASSETS SECURITIZED BY BANK-SPONSORED UNCONSOLIDATED CONDUITS | |||||||
| (millions of Canadian dollars, except as noted) | As at | ||||||
| July 31, 2016 | October 31, 2015 | ||||||
| Exposure and | Expected | Exposure and | Expected | ||||
| ratings profile of | weighted- | ratings profile of | weighted- | ||||
| unconsolidated SPEs | average life | unconsolidated SPEs | average life | ||||
| AAA1 | (years)2 | AAA1 | (years)2 | ||||
| Residential mortgage loans | $ | 9,088 | 3.0 | $ | 6,962 | 3.2 | |
| Automobile loans and leases | 2,872 | 1.4 | 1,847 | 1.6 | |||
| Trade receivables | 2,300 | 1.9 | 1,792 | 2.2 | |||
| Total exposure | $ | 14,260 | 2.5 | $ | 10,601 | 2.7 | |
| 1 | The Bank's total liquidity facility exposure only relates to 'AAA' rated assets. |
| 2 | Expected weighted-average life for each asset type is based upon each of the conduit's remaining purchase commitment for revolving pools and the expected weighted-average life of the assets for amortizing pools. |
As at July 31, 2016, the Bank held $1.8 billion of ABCP issued by Bank-sponsored multi-seller conduits within the Available-for-sale securities and Trading loans, securities, and other categories on the Bank's Interim Consolidated Balance Sheet (October 31, 2015 – $1.1 billion).
Off-Balance Sheet Exposure to Third Party-Sponsored Conduits
The Bank has off-balance sheet exposure to third party-sponsored conduits arising from providing liquidity facilities and funding commitments of $2.1 billion as at July 31, 2016 (October 31, 2015 – $1.3 billion). The assets within these conduits are comprised of individual notes backed by automotive loan receivables, credit card receivables, and trade receivables. As at July 31, 2016, these assets have maintained ratings from various credit rating agencies, with a minimum rating of A. On-balance sheet exposure to third party-sponsored conduits have been included in the financial statements.
Leveraged Finance Credit Commitments
Leveraged finance credit commitments are included in "Commitments to extend credit and liquidity" of Table 48 of this document. Leveraged finance credit commitments are agreements that provide funding to a borrower with higher leverage ratio, relative to the industry in which it operates, and for the purposes of acquisitions, buyouts or capital distributions. During the current period, the Bank refined its definition and it may be subject to further refinement moving forward. As at July 31, 2016, the Bank's exposure to leveraged finance credit commitments, including funded and unfunded amounts, was $23.1 billion (October 31, 2015 – $11.2 billion).
| TD BANK GROUP • THIRD QUARTER 2016 • REPORT TO SHAREHOLDERS | Page 43 |
ACCOUNTING POLICIES AND ESTIMATES
The Bank's unaudited Interim Consolidated Financial Statements have been prepared in accordance with IFRS. For details of the Bank's accounting policies under IFRS, refer to Note 2 of the Bank's 2015 Annual Consolidated Financial Statements. For details of the Bank's significant accounting judgments, estimates, and assumptions under IFRS, refer to Note 3 of the Bank's 2015 Annual Consolidated Financial Statements.
FUTURE CHANGES IN ACCOUNTING POLICIES
The following standards have been issued, but are not yet effective on the date of issuance of the Bank's Interim Consolidated Financial Statements. The Bank is currently assessing the impact of the application of these standards on the Interim Consolidated Financial Statements and will adopt these standards when they become effective.
Financial Instruments
In July 2014, the IASB issued the final version of IFRS 9, Financial Instruments (IFRS 9), which replaces the guidance in IAS 39. This final version includes requirements on: (1) Classification and measurement of financial assets and liabilities; (2) Impairment of financial assets; and (3) General hedge accounting. IFRS 9 is effective for annual periods beginning on or after January 1, 2018 and is to be applied retrospectively with certain exceptions. IFRS 9 does not require restatement of comparative period financial statements except in limited circumstances related to aspects of hedge accounting. Entities are permitted to restate comparatives as long as hindsight is not applied. In January 2015, OSFI issued the final version of the Advisory titled "Early adoption of IFRS 9 Financial Instruments for Domestic Systemically Important Banks". All D-SIBs, including the Bank, are required to early adopt IFRS 9 for the annual period beginning on November 1, 2017. Consequential amendments were made to IFRS 7, Financial Instruments: Disclosures (IFRS 7) introducing expanded qualitative and quantitative disclosures related to IFRS 9, which are required to be adopted for the annual period beginning on November 1, 2017, when the Bank first applies IFRS 9. In December 2015, the BCBS issued "Guidance on credit risk and accounting for expected credit losses" which sets out supervisory guidance on sound credit risk practices associated with the implementation and ongoing application of expected credit loss accounting frameworks. In June 2016, OSFI issued the guideline, "IFRS 9 Financial Instruments and Disclosures", which provides guidance to Federally Regulated Entities on the application of IFRS 9 that is consistent with the BCBS guidance. This guideline, which is effective for the Bank upon adoption of IFRS 9, replaces certain guidelines that were in effect under IAS 39.
The adoption of IFRS 9 is a significant initiative for the Bank supported by a formal governance framework and a robust implementation plan. An Executive Steering Committee has been formed with joint leadership from Finance and Risk and with representation from Technology, Internal Audit, and project management teams. A communication plan including progress reporting protocols has been established with regular updates provided to the Executive Steering Committee on key decisions. IFRS 9 overview sessions have been held at various levels within the Bank, including the Audit and Risk Committees of the Board.
The key responsibilities of the project include defining IFRS 9 risk methodology and accounting policy, identifying data and system requirements, and developing an appropriate operating model and governance framework. The Bank's implementation plan includes the following phases: (a) Initiation and Planning; (b) Detailed Assessment; (c) Design and Solution Development; and (d) Implementation, with work streams focused on each of the three required sections of IFRS 9 noted above as well as Reporting and Disclosures. The Bank is on track with its project timelines. The Detailed Assessment and Design phase is near completion and the Solution Development phase is in progress.
The following is a summary of the new accounting concepts and project status under IFRS 9:
Classification and Measurement
Financial assets will be classified based on the Bank's business model for managing its financial assets and the contractual cash flow characteristics of the financial asset. Financial assets are classified into one of the following three categories, which determine how it is measured subsequent to initial recognition: amortized cost, fair value through other comprehensive income (FVOCI), and fair value through profit or loss. An election may be made to hold certain equity securities at FVOCI, with no subsequent recycling of gains and losses into net income. In addition to the classification tests described above, IFRS 9 also includes an option to irrevocably designate a financial asset as measured at fair value through profit or loss if doing so eliminates or significantly reduces an accounting mismatch.
The classification and measurement of financial liabilities remain largely unchanged under IFRS 9, except for financial liabilities measured at fair value through profit or loss when classified as held for trading or designated using the fair value option. When the fair value option is elected, the Bank will be required to recognize the change in the fair value of the financial liability arising from changes in the Bank's own credit risk in other comprehensive income.
The Bank has defined its significant business models and is in the process of assessing the cash flow characteristics for all financial assets under the scope of IFRS 9.
Impairment
IFRS 9 introduces a new impairment model based on expected credit losses (ECL) which will replace the existing incurred loss model under IAS 39. Currently, impairment losses are recognized when there is objective evidence of credit quality deterioration to the extent that the Bank no longer has reasonable assurance as to the timely collection of the full amount of principal and interest. If there is no objective evidence of impairment for an individual loan, the loan is included in a group of assets with similar credit risk characteristics and collectively assessed for impairment losses incurred but not identified. Under IFRS 9, ECLs will be recognized in profit or loss before a loss event has occurred, which could result in earlier recognition of credit losses compared to the current model.
The expected credit loss model requires the recognition of impairment at an amount equal to the probability-weighted 12-month ECLs or lifetime ECLs depending on whether there has been a significant increase in credit risk since initial recognition of the financial instrument. If a significant increase in credit risk has occurred since initial recognition, then impairment is measured as lifetime ECLs otherwise 12-month ECLs are measured, which represent the portion of lifetime ECLs that are expected to occur based on default events that are possible within 12 months after the reporting date. If credit quality improves in a subsequent period such that the increase in credit risk since initial recognition is no longer considered significant, the loss allowance will revert back to being measured based on 12-month ECLs. The IFRS 9 model breaks down into three stages: Stage 1 – 12-month ECLs for performing instruments, Stage 2 – Lifetime ECLs for performing instruments that have experienced a significant increase in credit risk, and Stage 3 – Lifetime ECLs for non-performing financial assets. The Stage 3 population is expected to largely align with the impaired population under IAS 39.
ECLs will be measured as the probability-weighted present value of expected cash shortfalls over the remaining expected life of the financial instrument and will consider reasonable and supportable information about past events, current conditions and forecasts of future events and economic conditions that impact our credit risk assessment.
| TD BANK GROUP • THIRD QUARTER 2016 • REPORT TO SHAREHOLDERS | Page 44 |
The IFRS 9 expected credit loss calculation will leverage where appropriate the Bank’s existing expected loss model parameters used for regulatory capital purposes including probability of default (PD), loss given default (LGD) and EAD with adjustments as required to comply with the IFRS 9 requirements. The main differences are summarized in the following chart:
| Regulatory Capital | IFRS 9 | |
| PD | Through-the-cycle 12-month PD based on the long run average of a full economic cycle. The default backstop is generally 90 days past due. | Point-in-time 12-month or lifetime PD based on historical experience, current conditions and relevant forward looking expectations. The default backstop will generally be 90 days past due. |
| LGD | Downturn LGD based on losses that would be expected in an economic downturn and subject to certain regulatory floors. Both direct and indirect collection costs are considered. | Expected LGD based on historical charge-off events and recovery payments, current information about attributes specific to borrower, and direct costs. Macroeconomic variables and expected cash flows from credit enhancements will be incorporated as appropriate and excludes undue conservatism and floors. |
| EAD | Based on the drawn balance plus expected utilization of any undrawn portion prior to default, and cannot be lower than the drawn balance. | EAD represents the expected balance at default across the lifetime horizon and conditional on forward looking expectations. |
| Other | Expected credit losses are discounted from the default date to the reporting date. |
The new impairment model will apply to all financial assets measured at amortized cost or fair value through other comprehensive income with the most significant impact expected to be on loan assets. The model will also apply to loan commitments and financial guarantees that are not measured at fair value through profit or loss.
The Bank has defined the functional requirements for the calculation of ECLs and is currently developing and integrating the end-to-end technology solution for tracking credit migration under the new ECL model as well as the impact to forecasting economic variables, risk parameters, and credit risk modelling processes. In the remainder of the year, the Bank will continue to focus on the development and validation of the new impairment models and related processes and controls.
General Hedge Accounting
IFRS 9 introduces a new general hedge accounting model which better aligns accounting with risk management activities. The new standard permits a wider range of qualifying hedged items and hedged risks as well as types of hedging instruments. Effectiveness testing will have an increased focus on establishing an economic relationship, achieving a target hedge ratio and monitoring credit risk exposures. Voluntary discontinuation of hedging relationships is no longer permitted except in limited circumstances based on the risk management objectives of hedge strategies. The Bank has an accounting policy choice to adopt the new general hedge accounting model under IFRS 9 or continue to apply the hedge accounting requirements under IAS 39. The Bank continues to evaluate this accounting policy choice in accordance with the project plan.
Revenue from Contracts with Customers
In May 2014, the IASB issued IFRS 15, Revenue from Contracts with Customers (IFRS 15), which establishes the principles for recognizing revenue and cash flows arising from contracts with customers and prescribes the application of a five-step recognition and measurement model. The standard excludes from its scope revenue arising from items such as financial instruments, insurance contracts, and leases. The standard also requires additional qualitative and quantitative disclosures. In July 2015, the IASB confirmed a one-year deferral of the effective date to annual periods beginning on or after January 1, 2018, which will be November 1, 2018 for the Bank, and is to be applied retrospectively. In April 2016, the IASB issued amendments to IFRS 15, which provided additional guidance on the identification of performance obligations, on assessing principal versus agent considerations and on licensing revenue. The amendments also provided additional transitional relief upon initial adoption of IFRS 15 and have the same effective date as the IFRS 15 standard. The Bank is currently assessing the impact of adopting this standard.
Leases
In January 2016, the IASB issued IFRS 16, Leases (IFRS 16), which will replace IAS 17, introducing a single lessee accounting model for all leases by eliminating the distinction between operating and financing leases. IFRS 16 requires lessees to recognize right-of-use assets and lease liabilities for most leases. Lessees will also recognize depreciation expense on the right-of-use asset and interest expense on the lease liability in the statement of income. Short-term leases, which are defined as those that have a lease term of 12 months or less; and leases of low-value assets are exempt. Lessor accounting remains substantially unchanged. IFRS 16 is effective for annual periods beginning on or after January 1, 2019, which will be November 1, 2019 for the Bank, and is to be applied retrospectively. Early adoption is permitted only if aligned with or after the adoption of IFRS 15. The Bank is currently assessing the impact of adopting IFRS 16.
Share-based Payment
In June 2016, the IASB published amendments to IFRS 2, Share-based Payment, which provide additional guidance on the classification and measurement of share-based payment transactions. The amendments clarify the accounting for cash-settled share-based payment transactions that include a performance condition, the classification of share-based payment transactions with net settlement features for withholding tax obligations, and the accounting for modifications of share-based payment transactions from cash-settled to equity-settled. The amendments to IFRS 2 are effective for annual periods beginning on or after January 1, 2018, and are to be applied prospectively; however, retrospective application is permitted in certain instances. Early adoption is permitted. The amendments to IFRS 2 are not expected to have a material impact on the Bank.
CHANGES IN INTERNAL CONTROL OVER FINANCIAL REPORTING
During the most recent interim period, there have been no changes in the Bank's policies and procedures and other processes that comprise its internal control over financial reporting, that have materially affected, or are reasonably likely to materially affect, the Bank's internal control over financial reporting.
| TD BANK GROUP • THIRD QUARTER 2016 • REPORT TO SHAREHOLDERS | Page 45 |
| INTERIM CONSOLIDATED FINANCIAL STATEMENTS (unaudited) | |||||||
| INTERIM CONSOLIDATED BALANCE SHEET (unaudited) | |||||||
| (millions of Canadian dollars) | As at | ||||||
| July 31 | October 31 | ||||||
| 2016 | 2015 | ||||||
| ASSETS | |||||||
| Cash and due from banks | $ | 3,593 | $ | 3,154 | |||
| Interest-bearing deposits with banks | 54,605 | 42,483 | |||||
| 58,198 | 45,637 | ||||||
| Trading loans, securities, and other (Note 3) | 102,934 | 95,157 | |||||
| Derivatives (Note 3) | 77,858 | 69,438 | |||||
| Financial assets designated at fair value through profit or loss (Note 3) | 4,333 | 4,378 | |||||
| Available-for-sale securities (Notes 3, 4) | 99,674 | 88,782 | |||||
| 284,799 | 257,755 | ||||||
| Held-to-maturity securities (Note 4) | 81,341 | 74,450 | |||||
| Securities purchased under reverse repurchase agreements | 100,109 | 97,364 | |||||
| Loans (Note 5) | |||||||
| Residential mortgages | 215,050 | 212,373 | |||||
| Consumer instalment and other personal | 141,465 | 135,471 | |||||
| Credit card | 31,099 | 30,215 | |||||
| Business and government | 186,089 | 167,529 | |||||
| Debt securities classified as loans | 1,707 | 2,187 | |||||
| 575,410 | 547,775 | ||||||
| Allowance for loan losses (Note 5) | (3,773) | (3,434) | |||||
| Loans, net of allowance for loan losses | 571,637 | 544,341 | |||||
| Other | |||||||
| Customers' liability under acceptances | 15,756 | 16,646 | |||||
| Investment in TD Ameritrade (Note 8) | 6,859 | 6,683 | |||||
| Goodwill (Note 9) | 16,262 | 16,337 | |||||
| Other intangibles | 2,542 | 2,671 | |||||
| Land, buildings, equipment, and other depreciable assets | 5,309 | 5,314 | |||||
| Deferred tax assets | 1,850 | 1,931 | |||||
| Amounts receivable from brokers, dealers, and clients | 25,057 | 21,996 | |||||
| Other assets (Note 10) | 12,717 | 13,248 | |||||
| 86,352 | 84,826 | ||||||
| Total assets | $ | 1,182,436 | $ | 1,104,373 | |||
| LIABILITIES | |||||||
| Trading deposits (Notes 3, 11) | $ | 73,084 | $ | 74,759 | |||
| Derivatives (Note 3) | 69,720 | 57,218 | |||||
| Securitization liabilities at fair value (Note 3) | 12,145 | 10,986 | |||||
| Other financial liabilities designated at fair value through profit or loss (Note 3) | 413 | 1,415 | |||||
| 155,362 | 144,378 | ||||||
| Deposits (Note 11) | |||||||
| Personal | 422,654 | 395,818 | |||||
| Banks | 18,959 | 17,080 | |||||
| Business and government | 316,299 | 282,678 | |||||
| 757,912 | 695,576 | ||||||
| Other | |||||||
| Acceptances | 15,756 | 16,646 | |||||
| Obligations related to securities sold short | 44,564 | 38,803 | |||||
| Obligations related to securities sold under repurchase agreements | 58,762 | 67,156 | |||||
| Securitization liabilities at amortized cost | 19,313 | 22,743 | |||||
| Amounts payable to brokers, dealers, and clients | 24,445 | 22,664 | |||||
| Insurance-related liabilities | 7,235 | 6,519 | |||||
| Other liabilities (Note 12) | 18,942 | 14,223 | |||||
| 189,017 | 188,754 | ||||||
| Subordinated notes and debentures (Note 13) | 8,941 | 8,637 | |||||
| Total liabilities | 1,111,232 | 1,037,345 | |||||
| EQUITY | |||||||
| Common shares (Note 14) | 20,597 | 20,294 | |||||
| Preferred shares (Note 14) | 3,400 | 2,700 | |||||
| Treasury shares – common (Note 14) | (42) | (49) | |||||
| Treasury shares – preferred (Note 14) | (5) | (3) | |||||
| Contributed surplus | 197 | 214 | |||||
| Retained earnings | 34,387 | 32,053 | |||||
| Accumulated other comprehensive income (loss) | 11,037 | 10,209 | |||||
| 69,571 | 65,418 | ||||||
| Non-controlling interests in subsidiaries | 1,633 | 1,610 | |||||
| Total equity | 71,204 | 67,028 | |||||
| Total liabilities and equity | $ | 1,182,436 | $ | 1,104,373 | |||
The accompanying Notes are an integral part of these Interim Consolidated Financial Statements.
| TD BANK GROUP • THIRD QUARTER 2016 • REPORT TO SHAREHOLDERS | Page 46 |
| INTERIM CONSOLIDATED STATEMENT OF INCOME (unaudited) | |||||||||||
| (millions of Canadian dollars, except as noted) | For the three months ended | For the nine months ended | |||||||||
| July 31 | July 31 | July 31 | July 31 | ||||||||
| 2016 | 2015 | 2016 | 2015 | ||||||||
| Interest income | |||||||||||
| Loans | $ | 5,433 | $ | 5,144 | $ | 16,162 | $ | 15,160 | |||
| Securities | |||||||||||
| Interest | 885 | 779 | 2,694 | 2,275 | |||||||
| Dividends | 215 | 307 | 671 | 958 | |||||||
| Deposits with banks | 62 | 36 | 157 | 108 | |||||||
| 6,595 | 6,266 | 19,684 | 18,501 | ||||||||
| Interest expense | |||||||||||
| Deposits | 1,194 | 1,069 | 3,418 | 3,219 | |||||||
| Securitization liabilities | 113 | 143 | 349 | 463 | |||||||
| Subordinated notes and debentures | 104 | 93 | 288 | 287 | |||||||
| Other | 260 | 264 | 778 | 695 | |||||||
| 1,671 | 1,569 | 4,833 | 4,664 | ||||||||
| Net interest income | 4,924 | 4,697 | 14,851 | 13,837 | |||||||
| Non-interest income | |||||||||||
| Investment and securities services | 1,086 | 991 | 3,079 | 2,889 | |||||||
| Credit fees | 271 | 238 | 780 | 671 | |||||||
| Net securities gain (loss) (Note 4) | 37 | 14 | 26 | 68 | |||||||
| Trading income (loss) | 174 | (7) | 312 | (124) | |||||||
| Service charges | 641 | 615 | 1,915 | 1,738 | |||||||
| Card services | 592 | 432 | 1,731 | 1,286 | |||||||
| Insurance revenue | 959 | 970 | 2,851 | 2,781 | |||||||
| Other income (loss) | 17 | 56 | 25 | 233 | |||||||
| 3,777 | 3,309 | 10,719 | 9,542 | ||||||||
| Total revenue | 8,701 | 8,006 | 25,570 | 23,379 | |||||||
| Provision for credit losses (Note 5) | 556 | 437 | 1,782 | 1,174 | |||||||
| Insurance claims and related expenses | 692 | 600 | 1,877 | 1,863 | |||||||
| Non-interest expenses | |||||||||||
| Salaries and employee benefits (Note 16) | 2,326 | 2,261 | 6,977 | 6,813 | |||||||
| Occupancy, including depreciation | 432 | 437 | 1,344 | 1,272 | |||||||
| Equipment, including depreciation | 231 | 225 | 705 | 658 | |||||||
| Amortization of other intangibles | 178 | 167 | 526 | 491 | |||||||
| Marketing and business development | 190 | 192 | 545 | 530 | |||||||
| Restructuring charges | (3) | – | (19) | 337 | |||||||
| Brokerage-related fees | 77 | 79 | 238 | 247 | |||||||
| Professional and advisory services | 300 | 258 | 853 | 727 | |||||||
| Other | 909 | 673 | 2,860 | 2,087 | |||||||
| 4,640 | 4,292 | 14,029 | 13,162 | ||||||||
| Income before income taxes and equity in net income of an investment | |||||||||||
| in TD Ameritrade | 2,813 | 2,677 | 7,882 | 7,180 | |||||||
| Provision for (recovery of) income taxes | 576 | 502 | 1,588 | 1,264 | |||||||
| Equity in net income of an investment in TD Ameritrade (Note 8) | 121 | 91 | 339 | 269 | |||||||
| Net income | 2,358 | 2,266 | 6,633 | 6,185 | |||||||
| Preferred dividends | 36 | 25 | 98 | 73 | |||||||
| Net income available to common shareholders and non-controlling | |||||||||||
| interests in subsidiaries | $ | 2,322 | $ | 2,241 | $ | 6,535 | $ | 6,112 | |||
| Attributable to: | |||||||||||
| Common shareholders | $ | 2,293 | $ | 2,213 | $ | 6,449 | $ | 6,029 | |||
| Non-controlling interests in subsidiaries | 29 | 28 | 86 | 83 | |||||||
| Earnings per share (dollars) (Note 17) | |||||||||||
| Basic | $ | 1.24 | $ | 1.20 | $ | 3.48 | $ | 3.26 | |||
| Diluted | 1.24 | 1.19 | 3.47 | 3.25 | |||||||
| Dividends per share (dollars) | 0.55 | 0.51 | 1.61 | 1.49 | |||||||
Certain comparative amounts have been reclassified to conform with the presentation adopted in the current period.
The accompanying Notes are an integral part of these Interim Consolidated Financial Statements.
| TD BANK GROUP • THIRD QUARTER 2016 • REPORT TO SHAREHOLDERS | Page 47 |
| INTERIM CONSOLIDATED STATEMENT OF COMPREHENSIVE INCOME (unaudited) | |||||||||||
| (millions of Canadian dollars) | For the three months ended | For the nine months ended | |||||||||
| July 31 | July 31 | July 31 | July 31 | ||||||||
| 2016 | 2015 | 2016 | 2015 | ||||||||
| Net income | $ | 2,358 | $ | 2,266 | $ | 6,633 | $ | 6,185 | |||
| Other comprehensive income (loss), net of income taxes | |||||||||||
| Items that will be subsequently reclassified to net income | |||||||||||
| Change in unrealized gains (losses) on available-for-sale securities1 | 233 | (143) | 235 | (80) | |||||||
| Reclassification to earnings of net losses (gains) in respect of | |||||||||||
| available-for-sale securities2 | (26) | (4) | (43) | (53) | |||||||
| Net change in unrealized foreign currency translation gains (losses) | |||||||||||
| on investments in foreign operations | 2,268 | 4,734 | (349) | 8,145 | |||||||
| Net foreign currency translation gains (losses) from hedging activities3 | (633) | (1,637) | 383 | (2,800) | |||||||
| Change in net gains (losses) on derivatives designated as cash flow hedges4 | 1,571 | 1,929 | 360 | 4,870 | |||||||
| Reclassification to earnings of net losses (gains) on cash flow hedges5 | (1,065) | (1,971) | 242 | (4,541) | |||||||
| Items that will not be subsequently reclassified to net income | |||||||||||
| Actuarial gains (losses) on employee benefit plans6 | (328) | 142 | (743) | (50) | |||||||
| 2,020 | 3,050 | 85 | 5,491 | ||||||||
| Comprehensive income (loss) for the period | $ | 4,378 | $ | 5,316 | $ | 6,718 | $ | 11,676 | |||
| Attributable to: | |||||||||||
| Common shareholders | $ | 4,313 | $ | 5,263 | $ | 6,534 | $ | 11,520 | |||
| Preferred shareholders | 36 | 25 | 98 | 73 | |||||||
| Non-controlling interests in subsidiaries | 29 | 28 | 86 | 83 | |||||||
| 1 | Net of income tax provision of $129 million for the three months ended July 31, 2016 (three months ended July 31, 2015 – net of income tax recovery of $27 million). Net of income tax provision of $100 million for the nine months ended July 31, 2016 (nine months ended July 31, 2015 – net of income tax provision of $4 million). |
| 2 | Net of income tax provision of $24 million for the three months ended July 31, 2016 (three months ended July 31, 2015 – net of income tax provision of $30 million). Net of income tax provision of $20 million for the nine months ended July 31, 2016 (nine months ended July 31, 2015 – net of income tax provision of $65 million). |
| 3 | Net of income tax recovery of $228 million for the three months ended July 31, 2016 (three months ended July 31, 2015 – net of income tax recovery of $582 million). Net of income tax provision of $135 million for the nine months ended July 31, 2016 (nine months ended July 31, 2015 – net of income tax recovery of $995 million). |
| 4 | Net of income tax provision of $910 million for the three months ended July 31, 2016 (three months ended July 31, 2015 – net of income tax provision of $1,365 million). Net of income tax provision of $263 million for the nine months ended July 31, 2016 (nine months ended July 31, 2015 – net of income tax provision of $2,970 million). |
| 5 | Net of income tax provision of $695 million for the three months ended July 31, 2016 (three months ended July 31, 2015 – net of income tax provision of $1,408 million). Net of income tax recovery of $53 million for the nine months ended July 31, 2016 (nine months ended July 31, 2015 – net of income tax provision of $2,890 million). |
| 6 | Net of income tax recovery of $118 million for the three months ended July 31, 2016 (three months ended July 31, 2015 – net of income tax provision of $51 million). Net of income tax recovery of $269 million for the nine months ended July 31, 2016 (nine months ended July 31, 2015 – net of income tax recovery of $22 million). |
Certain comparative amounts have been reclassified to conform with the presentation adopted in the current period.
The accompanying Notes are an integral part of these Interim Consolidated Financial Statements.
| TD BANK GROUP • THIRD QUARTER 2016 • REPORT TO SHAREHOLDERS | Page 48 |
| INTERIM CONSOLIDATED STATEMENT OF CHANGES IN EQUITY (unaudited) | |||||||||||
| (millions of Canadian dollars) | For the three months ended | For the nine months ended | |||||||||
| July 31 | July 31 | July 31 | July 31 | ||||||||
| 2016 | 2015 | 2016 | 2015 | ||||||||
| Common shares (Note 14) | |||||||||||
| Balance at beginning of period | $ | 20,499 | $ | 20,076 | $ | 20,294 | $ | 19,811 | |||
| Proceeds from shares issued on exercise of stock options | 12 | 7 | 156 | 96 | |||||||
| Shares issued as a result of dividend reinvestment plan | 86 | 97 | 251 | 273 | |||||||
| Purchase of shares for cancellation | – | – | (104) | – | |||||||
| Balance at end of period | 20,597 | 20,180 | 20,597 | 20,180 | |||||||
| Preferred shares (Note 14) | |||||||||||
| Balance at beginning of period | 3,400 | 2,800 | 2,700 | 2,200 | |||||||
| Issue of shares | – | 150 | 700 | 1,200 | |||||||
| Redemption of shares | – | (250) | – | (700) | |||||||
| Balance at end of period | 3,400 | 2,700 | 3,400 | 2,700 | |||||||
| Treasury shares – common (Note 14) | |||||||||||
| Balance at beginning of period | (4) | (11) | (49) | (54) | |||||||
| Purchase of shares | (1,389) | (1,475) | (4,408) | (4,123) | |||||||
| Sale of shares | 1,351 | 1,469 | 4,415 | 4,160 | |||||||
| Balance at end of period | (42) | (17) | (42) | (17) | |||||||
| Treasury shares – preferred (Note 14) | |||||||||||
| Balance at beginning of period | (4) | (14) | (3) | (1) | |||||||
| Purchase of shares | (23) | (85) | (57) | (235) | |||||||
| Sale of shares | 22 | 95 | 55 | 232 | |||||||
| Balance at end of period | (5) | (4) | (5) | (4) | |||||||
| Contributed surplus | |||||||||||
| Balance at beginning of period | 189 | 226 | 214 | 205 | |||||||
| Net premium (discount) on sale of treasury shares | 10 | (1) | 16 | 29 | |||||||
| Issuance of stock options, net of options exercised | 1 | 3 | (27) | 1 | |||||||
| Other | (3) | (2) | (6) | (9) | |||||||
| Balance at end of period | 197 | 226 | 197 | 226 | |||||||
| Retained earnings | |||||||||||
| Balance at beginning of period | 33,442 | 29,362 | 32,053 | 27,585 | |||||||
| Net income attributable to shareholders | 2,329 | 2,238 | 6,547 | 6,102 | |||||||
| Common dividends | (1,020) | (945) | (2,983) | (2,755) | |||||||
| Preferred dividends | (36) | (25) | (98) | (73) | |||||||
| Share issue expenses and others | – | (2) | (6) | (28) | |||||||
| Net premium on repurchase of common shares and redemption of preferred shares | – | (6) | (383) | (17) | |||||||
| Actuarial gains (losses) on employee benefit plans | (328) | 142 | (743) | (50) | |||||||
| Balance at end of period | 34,387 | 30,764 | 34,387 | 30,764 | |||||||
| Accumulated other comprehensive income (loss) | |||||||||||
| Net unrealized gain (loss) on available-for-sale securities: | |||||||||||
| Balance at beginning of period | 66 | 652 | 81 | 638 | |||||||
| Other comprehensive income (loss) | 207 | (147) | 192 | (133) | |||||||
| Balance at end of period | 273 | 505 | 273 | 505 | |||||||
| Net unrealized foreign currency translation gain (loss) on investments in foreign | |||||||||||
| operations, net of hedging activities: | |||||||||||
| Balance at beginning of period | 6,754 | 5,277 | 8,355 | 3,029 | |||||||
| Other comprehensive income (loss) | 1,635 | 3,097 | 34 | 5,345 | |||||||
| Balance at end of period | 8,389 | 8,374 | 8,389 | 8,374 | |||||||
| Net gain (loss) on derivatives designated as cash flow hedges: | |||||||||||
| Balance at beginning of period | 1,869 | 1,640 | 1,773 | 1,269 | |||||||
| Other comprehensive income (loss) | 506 | (42) | 602 | 329 | |||||||
| Balance at end of period | 2,375 | 1,598 | 2,375 | 1,598 | |||||||
| Total | 11,037 | 10,477 | 11,037 | 10,477 | |||||||
| Non-controlling interests in subsidiaries | |||||||||||
| Balance at beginning of period | 1,612 | 1,589 | 1,610 | 1,549 | |||||||
| Net income attributable to non-controlling interests in subsidiaries | 29 | 28 | 86 | 83 | |||||||
| Other | (8) | 22 | (63) | 7 | |||||||
| Balance at end of period | 1,633 | 1,639 | 1,633 | 1,639 | |||||||
| Total equity | $ | 71,204 | $ | 65,965 | $ | 71,204 | $ | 65,965 | |||
The accompanying Notes are an integral part of these Interim Consolidated Financial Statements.
| TD BANK GROUP • THIRD QUARTER 2016 • REPORT TO SHAREHOLDERS | Page 49 |
| INTERIM CONSOLIDATED STATEMENT OF CASH FLOWS (unaudited) | |||||||||||
| (millions of Canadian dollars) | For the three months ended | For the nine months ended | |||||||||
| July 31 | July 31 | July 31 | July 31 | ||||||||
| 2016 | 2015 | 2016 | 2015 | ||||||||
| Cash flows from (used in) operating activities | |||||||||||
| Net income before income taxes | $ | 2,934 | $ | 2,768 | $ | 8,221 | $ | 7,449 | |||
| Adjustments to determine net cash flows from (used in) operating activities | |||||||||||
| Provision for credit losses (Note 5) | 556 | 437 | 1,782 | 1,174 | |||||||
| Depreciation | 156 | 148 | 461 | 439 | |||||||
| Amortization of other intangibles | 178 | 167 | 526 | 491 | |||||||
| Net securities losses (gains) (Note 4) | (37) | (14) | (26) | (68) | |||||||
| Equity in net income of an investment in TD Ameritrade (Note 8) | (121) | (91) | (339) | (269) | |||||||
| Deferred taxes | (37) | (229) | 20 | (260) | |||||||
| Changes in operating assets and liabilities | |||||||||||
| Interest receivable and payable (Notes 10, 12) | 19 | (188) | (3) | (195) | |||||||
| Securities sold short | 3,838 | 1,862 | 5,761 | (5,129) | |||||||
| Trading loans and securities | (9,794) | (5,628) | (7,777) | (7,299) | |||||||
| Loans net of securitization and sales | (18,881) | (23,821) | (29,658) | (50,313) | |||||||
| Deposits | 49,725 | 46,447 | 59,659 | 104,816 | |||||||
| Derivatives | (2,329) | (7,401) | 4,082 | (7,349) | |||||||
| Financial assets and liabilities designated at fair value through profit or loss | (65) | (125) | 45 | 738 | |||||||
| Securitization liabilities | (356) | (256) | (2,271) | (2,316) | |||||||
| Other | 378 | (8,774) | 2,550 | (17,689) | |||||||
| Net cash from (used in) operating activities | 26,164 | 5,302 | 43,033 | 24,220 | |||||||
| Cash flows from (used in) financing activities | |||||||||||
| Change in securities sold under repurchase agreements | (5,066) | 14,532 | (8,394) | 20,915 | |||||||
| Issuance of subordinated notes and debentures (Note 13) | – | 1,500 | 1,250 | 1,500 | |||||||
| Redemption of subordinated notes and debentures (Note 13) | – | – | (1,000) | (875) | |||||||
| Common shares issued (Note 14) | 10 | 6 | 126 | 81 | |||||||
| Preferred shares issued (Note 14) | – | 148 | 694 | 1,184 | |||||||
| Repurchase of common shares (Note 14) | – | – | (487) | – | |||||||
| Redemption of preferred shares (Note 14) | – | (256) | – | (717) | |||||||
| Sale of treasury shares (Note 14) | 1,383 | 1,563 | 4,486 | 4,421 | |||||||
| Purchase of treasury shares (Note 14) | (1,412) | (1,560) | (4,465) | (4,358) | |||||||
| Dividends paid | (970) | (873) | (2,830) | (2,555) | |||||||
| Distributions to non-controlling interests in subsidiaries | (29) | (28) | (86) | (83) | |||||||
| Net cash from (used in) financing activities | (6,084) | 15,032 | (10,706) | 19,513 | |||||||
| Cash flows from (used in) investing activities | |||||||||||
| Interest-bearing deposits with banks | (6,827) | (3,427) | (12,122) | (5,308) | |||||||
| Activities in available-for-sale securities (Note 4) | |||||||||||
| Purchases | (13,185) | (14,496) | (36,003) | (38,811) | |||||||
| Proceeds from maturities | 7,692 | 9,038 | 22,088 | 21,276 | |||||||
| Proceeds from sales | 774 | 1,569 | 2,704 | 6,593 | |||||||
| Activities in held-to-maturity securities (Note 4) | |||||||||||
| Purchases | (5,622) | (2,426) | (15,290) | (14,366) | |||||||
| Proceeds from maturities | 3,724 | 2,875 | 9,440 | 7,231 | |||||||
| Activities in debt securities classified as loans | |||||||||||
| Purchases | (5) | (9) | (41) | (23) | |||||||
| Proceeds from maturities | 188 | 424 | 537 | 756 | |||||||
| Proceeds from sales | – | – | 1 | – | |||||||
| Net purchases of land, building, equipment, and other depreciable assets | (305) | (352) | (456) | (813) | |||||||
| Changes in securities purchased under reverse repurchase agreements | (6,289) | (13,081) | (2,745) | (19,769) | |||||||
| Net cash from (used in) investing activities | (19,855) | (19,885) | (31,887) | (43,234) | |||||||
| Effect of exchange rate changes on cash and due from banks | 76 | 148 | (1) | 262 | |||||||
| Net increase (decrease) in cash and due from banks | 301 | 597 | 439 | 761 | |||||||
| Cash and due from banks at beginning of period | 3,292 | 2,945 | 3,154 | 2,781 | |||||||
| Cash and due from banks at end of period | $ | 3,593 | $ | 3,542 | $ | 3,593 | $ | 3,542 | |||
| Supplementary disclosure of cash flows from operating activities | |||||||||||
| Amount of income taxes paid (refunded) during the period | $ | 235 | $ | 51 | $ | 617 | $ | 429 | |||
| Amount of interest paid during the period | 1,697 | 1,793 | 4,831 | 4,790 | |||||||
| Amount of interest received during the period | 6,425 | 5,995 | 19,008 | 17,474 | |||||||
| Amount of dividends received during the period | 263 | 356 | 701 | 946 | |||||||
The accompanying Notes are an integral part of these Interim Consolidated Financial Statements.
| TD BANK GROUP • THIRD QUARTER 2016 • REPORT TO SHAREHOLDERS | Page 50 |
| NOTES TO INTERIM CONSOLIDATED FINANCIAL STATEMENTS (unaudited) |
| NOTE 1: NATURE OF OPERATIONS |
CORPORATE INFORMATION
The Toronto-Dominion Bank is a bank chartered under the Bank Act. The shareholders of a bank are not, as shareholders, liable for any liability, act, or default of the bank except as otherwise provided under the Bank Act. The Toronto-Dominion Bank and its subsidiaries are collectively known as TD Bank Group ("TD" or the "Bank"). The Bank was formed through the amalgamation on February 1, 1955, of The Bank of Toronto (chartered in 1855) and The Dominion Bank (chartered in 1869). The Bank is incorporated and domiciled in Canada with its registered and principal business offices located at 66 Wellington Street West, Toronto, Ontario. TD serves customers in three business segments operating in a number of locations in key financial centres around the globe: Canadian Retail, U.S. Retail, and Wholesale Banking.
BASIS OF PREPARATION
The accompanying Interim Consolidated Financial Statements and accounting principles followed by the Bank have been prepared in accordance with International Financial Reporting Standards (IFRS), as issued by the International Accounting Standards Board (IASB), including the accounting requirements of the Office of the Superintendent of Financial Institutions Canada (OSFI). The Interim Consolidated Financial Statements are presented in Canadian dollars, unless otherwise indicated.
These Interim Consolidated Financial Statements were prepared on a condensed basis in accordance with International Accounting Standard 34, Interim Financial Reporting (IAS 34) using the accounting policies as described in Note 2 of the Bank's 2015 Annual Consolidated Financial Statements. Certain comparative amounts have been restated/reclassified to conform with the presentation adopted in the current period.
The preparation of consolidated financial statements requires that management make estimates, assumptions, and judgments regarding the reported amount of assets, liabilities, revenue and expenses, and disclosure of contingent assets and liabilities, as further described in Note 3 of the Bank's 2015 Annual Consolidated Financial Statements. Accordingly, actual results may differ from estimated amounts as future confirming events occur.
The Bank's Interim Consolidated Financial Statements have been prepared using uniform accounting policies for like transactions and events in similar circumstances. All intercompany transactions, balances, and unrealized gains and losses on transactions are eliminated on consolidation.
The Interim Consolidated Financial Statements for the three and nine months ended July 31, 2016, were approved and authorized for issue by the Bank's Board of Directors, in accordance with a recommendation of the Audit Committee, on August 24, 2016.
As the Interim Consolidated Financial Statements do not include all of the disclosures normally provided in the Annual Consolidated Financial Statements, it should be read in conjunction with the 2015 Annual Consolidated Financial Statements and the accompanying Notes, and the shaded sections of the 2015 Management's Discussion and Analysis (MD&A). Certain disclosures are included in the shaded sections of the "Managing Risk" section of the MD&A in this report, as permitted by IFRS, and form an integral part of the Interim Consolidated Financial Statements. The Interim Consolidated Financial Statements were prepared under a historical cost basis, except for certain items carried at fair value as discussed in Note 2 of the Bank's 2015 Annual Consolidated Financial Statements.
| NOTE 2: CURRENT AND FUTURE CHANGES IN ACCOUNTING POLICIES |
FUTURE CHANGES IN ACCOUNTING POLICIES
The following standards have been issued, but are not yet effective on the date of issuance of the Bank's Interim Consolidated Financial Statements. The Bank is currently assessing the impact of the application of these standards on the Interim Consolidated Financial Statements and will adopt these standards when they become effective.
Financial Instruments
In July 2014, the IASB issued the final version of IFRS 9, Financial Instruments (IFRS 9), which replaces the guidance in IAS 39. This final version includes requirements on: (1) Classification and measurement of financial assets and liabilities; (2) Impairment of financial assets; and (3) General hedge accounting. Accounting for macro hedging has been decoupled from IFRS 9. The Bank has an accounting policy choice to apply the hedge accounting requirements of IFRS 9 or IAS 39.
IFRS 9 is effective for annual periods beginning on or after January 1, 2018, and is to be applied retrospectively with certain exceptions. IFRS 9 does not require restatement of comparative period financial statements except in limited circumstances related to aspects of hedge accounting. Entities are permitted to restate comparatives as long as hindsight is not applied. In January 2015, OSFI issued the final version of the Advisory titled "Early adoption of IFRS 9 Financial Instruments for Domestic Systemically Important Banks". All domestic systemically important banks (D-SIBs), including the Bank, are required to early adopt IFRS 9 for the annual period beginning on November 1, 2017. Consequential amendments were made to IFRS 7, Financial Instruments: Disclosures (IFRS 7) introducing expanded qualitative and quantitative disclosures related to IFRS 9, which are required to be adopted for the annual period beginning on November 1, 2017, when the Bank first applies IFRS 9.
In December 2015, the Basel Committee on Banking Supervision (BCBS) issued "Guidance on credit risk and accounting for expected credit losses" which sets out supervisory guidance on sound credit risk practices associated with the implementation and ongoing application of expected credit loss accounting frameworks. In June 2016, OSFI issued the guideline, "IFRS 9 Financial Instruments and Disclosures", which provides guidance to Federally Regulated Entities on the application of IFRS 9 that is consistent with the BCBS guidance. This guideline, which is effective for the Bank upon adoption of IFRS 9, replaces certain guidelines that were in effect under IAS 39. The adoption of IFRS 9 is a significant initiative for the Bank supported by a formal governance framework and a robust implementation plan.
| TD BANK GROUP • THIRD QUARTER 2016 • REPORT TO SHAREHOLDERS | Page 51 |
Revenue from Contracts with Customers
In May 2014, the IASB issued IFRS 15, Revenue from Contracts with Customers (IFRS 15), which establishes the principles for recognizing revenue and cash flows arising from contracts with customers and prescribes the application of a five-step recognition and measurement model. The standard excludes from its scope revenue arising from items such as financial instruments, insurance contracts, and leases. The standard also requires additional qualitative and quantitative disclosures. In July 2015, the IASB confirmed a one-year deferral of the effective date to annual periods beginning on or after January 1, 2018, which will be November 1, 2018 for the Bank, and is to be applied retrospectively. In April 2016, the IASB issued amendments to IFRS 15, which provided additional guidance on the identification of performance obligations, on assessing principal versus agent considerations and on licensing revenue. The amendments also provided additional transitional relief upon initial adoption of IFRS 15 and have the same effective date as the IFRS 15 standard. The Bank is currently assessing the impact of adopting this standard.
Leases
In January 2016, the IASB issued IFRS 16, Leases (IFRS 16), which will replace IAS 17, introducing a single lessee accounting model for all leases by eliminating the distinction between operating and financing leases. IFRS 16 requires lessees to recognize right-of-use assets and lease liabilities for most leases. Lessees will also recognize depreciation expense on the right-of-use asset and interest expense on the lease liability in the statement of income. Short-term leases, which are defined as those that have a lease term of 12 months or less; and leases of low-value assets are exempt. Lessor accounting remains substantially unchanged. IFRS 16 is effective for annual periods beginning on or after January 1, 2019, which will be November 1, 2019 for the Bank, and is to be applied retrospectively. Early adoption is permitted only if aligned with or after the adoption of IFRS 15. The Bank is currently assessing the impact of adopting IFRS 16.
Share-based Payment
In June 2016, the IASB published amendments to IFRS 2, Share-based Payment, which provide additional guidance on the classification and measurement of share-based payment transactions. The amendments clarify the accounting for cash-settled share-based payment transactions that include a performance condition, the classification of share-based payment transactions with net settlement features for withholding tax obligations, and the accounting for modifications of share-based payment transactions from cash-settled to equity-settled. The amendments to IFRS 2 are effective for annual periods beginning on or after January 1, 2018, and are to be applied prospectively; however, retrospective application is permitted in certain instances. Early adoption is permitted. The amendments to IFRS 2 are not expected to have a material impact on the Bank.
| NOTE 3: FAIR VALUE MEASUREMENTS |
Certain assets and liabilities, primarily financial instruments, are carried on the balance sheet at their fair value on a recurring basis. These financial instruments include trading loans and securities, assets and liabilities designated at fair value through profit or loss, instruments classified as available-for-sale, derivatives, certain securities purchased under reverse repurchase agreements, certain deposits classified as trading, securitization liabilities at fair value, obligations related to securities sold short, and certain obligations related to securities sold under repurchase agreements. The fair value of assets and liabilities subsequently not measured at fair value include most loans, deposits, certain securitization liabilities, certain securities purchased under reverse repurchase agreements, obligations relating to securities sold under repurchase agreements, and subordinated notes and debentures. There have been no significant changes to the Bank's approach and methodologies used to determine fair value measurements during the three and nine months ended July 31, 2016. Refer to Note 5 of the 2015 Annual Consolidated Financial Statements for a description of the valuation techniques and inputs used in the fair value measurement of the Bank's financial instruments.
| TD BANK GROUP • THIRD QUARTER 2016 • REPORT TO SHAREHOLDERS | Page 52 |
Carrying Value and Fair Value of Financial Instruments not carried at Fair Value
The fair values in the following table exclude the value of assets that are not financial instruments, such as land, buildings and equipment, as well as goodwill and other intangible assets, including customer relationships, which are of significant value to the Bank.
| Financial Assets and Liabilities not carried at Fair Value1 | ||||||||||
| (millions of Canadian dollars) | As at | |||||||||
| July 31, 2016 | October 31, 2015 | |||||||||
| Carrying | Fair | Carrying | Fair | |||||||
| value | value | value | value | |||||||
| FINANCIAL ASSETS | ||||||||||
| Cash and due from banks | $ | 3,593 | $ | 3,593 | $ | 3,154 | $ | 3,154 | ||
| Interest-bearing deposits with banks | 54,605 | 54,605 | 42,483 | 42,483 | ||||||
| Held-to-maturity securities2 | ||||||||||
| Government and government-related securities | 50,273 | 51,056 | 43,667 | 44,095 | ||||||
| Other debt securities | 31,068 | 31,227 | 30,783 | 30,647 | ||||||
| Total held-to-maturity securities | 81,341 | 82,283 | 74,450 | 74,742 | ||||||
| Securities purchased under reverse repurchase agreements | 90,540 | 90,540 | 84,163 | 84,163 | ||||||
| Loans | 570,186 | 575,169 | 542,418 | 544,862 | ||||||
| Debt securities classified as loans | 1,451 | 1,707 | 1,923 | 2,166 | ||||||
| Total loans | 571,637 | 576,876 | 544,341 | 547,028 | ||||||
| Other | ||||||||||
| Customers' liability under acceptances | 15,756 | 15,756 | 16,646 | 16,646 | ||||||
| Amounts receivable from brokers, dealers, and clients | 25,057 | 25,057 | 21,996 | 21,996 | ||||||
| Other assets | 4,372 | 4,372 | 4,247 | 4,247 | ||||||
| Total assets not carried at fair value | $ | 846,901 | $ | 853,082 | $ | 791,480 | $ | 794,459 | ||
| FINANCIAL LIABILITIES | ||||||||||
| Deposits | $ | 757,912 | $ | 760,980 | $ | 695,576 | $ | 697,376 | ||
| Acceptances | 15,756 | 15,756 | 16,646 | 16,646 | ||||||
| Obligations related to securities sold under repurchase agreements | 49,371 | 49,371 | 54,780 | 54,780 | ||||||
| Securitization liabilities at amortized cost | 19,313 | 19,772 | 22,743 | 23,156 | ||||||
| Amounts payable to brokers, dealers, and clients | 24,445 | 24,445 | 22,664 | 22,664 | ||||||
| Other liabilities | 10,170 | 10,234 | 7,788 | 7,826 | ||||||
| Subordinated notes and debentures | 8,941 | 9,394 | 8,637 | 8,992 | ||||||
| Total liabilities not carried at fair value | $ | 885,908 | $ | 889,952 | $ | 828,834 | $ | 831,440 | ||
| 1 | Certain comparative amounts have been restated to conform with the presentation adopted in the current period. |
| 2 | Includes debt securities reclassified from available-for-sale to held-to-maturity. Refer to Note 4 for carrying value and fair value of the reclassified debt securities. |
Fair Value Hierarchy and Valuation of Assets and Liabilities Classified as Level 3
IFRS requires disclosure of a three-level hierarchy for fair value measurements based upon the observability of inputs to the valuation of an asset or liability as of the measurement date. Refer to Note 5 of the 2015 Annual Consolidated Financial Statements for a description of the three levels.
There have been no significant changes to these valuation techniques, unobservable inputs, and sensitivities during the three and nine months ended July 31, 2016. The significant valuation techniques and significant unobservable inputs used in the fair value measurements of Level 3 financial assets and financial liabilities are described and quantified within the "Valuation of Assets and Liabilities Classified as Level 3" section in Note 5 of the 2015 Annual Consolidated Financial Statements.
| TD BANK GROUP • THIRD QUARTER 2016 • REPORT TO SHAREHOLDERS | Page 53 |
The following table presents the levels within the fair value hierarchy for each of the assets and liabilities measured at fair value on a recurring basis as at July 31, 2016, and October 31, 2015.
| Fair Value Hierarchy for Assets and Liabilities Measured at Fair Value on a Recurring Basis | ||||||||||||||||||
| (millions of Canadian dollars) | As at | |||||||||||||||||
| July 31, 2016 | October 31, 2015 | |||||||||||||||||
| Level 1 | Level 2 | Level 3 | Total1 | Level 1 | Level 2 | Level 3 | Total1 | |||||||||||
| FINANCIAL ASSETS AND COMMODITIES | ||||||||||||||||||
| Trading loans, securities, and other | ||||||||||||||||||
| Government and government-related securities | ||||||||||||||||||
| Canadian government debt | ||||||||||||||||||
| Federal | $ | 92 | $ | 8,060 | $ | – | $ | 8,152 | $ | 493 | $ | 11,560 | $ | – | $ | 12,053 | ||
| Provinces | – | 6,084 | 63 | 6,147 | – | 6,121 | 24 | 6,145 | ||||||||||
| U.S. federal, state, municipal governments, | ||||||||||||||||||
| and agencies debt | 582 | 20,359 | – | 20,941 | 1 | 15,719 | – | 15,720 | ||||||||||
| Other OECD government guaranteed debt | – | 5,352 | – | 5,352 | – | 4,194 | 5 | 4,199 | ||||||||||
| Mortgage-backed securities | – | 841 | – | 841 | – | 1,019 | – | 1,019 | ||||||||||
| Other debt securities | ||||||||||||||||||
| Canadian issuers | – | 2,641 | 23 | 2,664 | – | 2,558 | 57 | 2,615 | ||||||||||
| Other issuers | – | 8,535 | 134 | 8,669 | – | 7,359 | 191 | 7,550 | ||||||||||
| Equity securities | ||||||||||||||||||
| Common shares | 31,060 | 115 | 4 | 31,179 | 28,933 | 447 | 186 | 29,566 | ||||||||||
| Preferred shares | 30 | – | 5 | 35 | 33 | – | 5 | 38 | ||||||||||
| Trading loans | – | 11,477 | – | 11,477 | – | 10,650 | – | 10,650 | ||||||||||
| Commodities | 7,227 | 217 | – | 7,444 | 5,410 | 154 | – | 5,564 | ||||||||||
| Retained interests | – | – | 33 | 33 | – | – | 38 | 38 | ||||||||||
| 38,991 | 63,681 | 262 | 102,934 | 34,870 | 59,781 | 506 | 95,157 | |||||||||||
| Derivatives | ||||||||||||||||||
| Interest rate contracts | 3 | 34,059 | – | 34,062 | 2 | 27,968 | – | 27,970 | ||||||||||
| Foreign exchange contracts | 77 | 41,217 | 5 | 41,299 | 45 | 38,692 | 6 | 38,743 | ||||||||||
| Credit contracts | – | 29 | – | 29 | – | 59 | 4 | 63 | ||||||||||
| Equity contracts | – | 1,073 | 727 | 1,800 | – | 1,376 | 560 | 1,936 | ||||||||||
| Commodity contracts | 66 | 596 | 6 | 668 | 32 | 691 | 3 | 726 | ||||||||||
| 146 | 76,974 | 738 | 77,858 | 79 | 68,786 | 573 | 69,438 | |||||||||||
| Financial assets designated at | ||||||||||||||||||
| fair value through profit or loss | ||||||||||||||||||
| Securities | 97 | 4,101 | 135 | 4,333 | 106 | 4,272 | – | 4,378 | ||||||||||
| 97 | 4,101 | 135 | 4,333 | 106 | 4,272 | – | 4,378 | |||||||||||
| Available-for-sale securities | ||||||||||||||||||
| Government and government-related securities | ||||||||||||||||||
| Canadian government debt | ||||||||||||||||||
| Federal | – | 14,661 | – | 14,661 | – | 14,431 | – | 14,431 | ||||||||||
| Provinces | – | 7,969 | – | 7,969 | – | 7,185 | – | 7,185 | ||||||||||
| U.S. federal, state, municipal governments, | ||||||||||||||||||
| and agencies debt | – | 30,991 | – | 30,991 | – | 22,585 | – | 22,585 | ||||||||||
| Other OECD government guaranteed debt | – | 11,507 | 7 | 11,514 | – | 11,648 | 7 | 11,655 | ||||||||||
| Mortgage-backed securities | – | 5,004 | – | 5,004 | – | 4,060 | – | 4,060 | ||||||||||
| Other debt securities | ||||||||||||||||||
| Asset-backed securities | – | 17,194 | – | 17,194 | – | 16,261 | 501 | 16,762 | ||||||||||
| Non-agency collateralized mortgage obligation portfolio | – | 1,556 | – | 1,556 | – | 916 | – | 916 | ||||||||||
| Corporate and other debt | – | 8,319 | 19 | 8,338 | – | 8,618 | 147 | 8,765 | ||||||||||
| Equity securities | ||||||||||||||||||
| Common shares2,3 | 212 | 184 | 1,553 | 1,949 | 177 | 100 | 1,575 | 1,852 | ||||||||||
| Preferred shares | 48 | – | 90 | 138 | 20 | – | 94 | 114 | ||||||||||
| Debt securities reclassified from trading | – | 87 | 267 | 354 | – | 169 | 282 | 451 | ||||||||||
| 260 | 97,472 | 1,936 | 99,668 | 197 | 85,973 | 2,606 | 88,776 | |||||||||||
| Securities purchased under reverse | ||||||||||||||||||
| repurchase agreements | – | 9,569 | – | 9,569 | – | 13,201 | – | 13,201 | ||||||||||
| FINANCIAL LIABILITIES | ||||||||||||||||||
| Trading deposits | $ | – | $ | 70,858 | $ | 2,226 | $ | 73,084 | $ | – | $ | 72,879 | $ | 1,880 | $ | 74,759 | ||
| Derivatives | ||||||||||||||||||
| Interest rate contracts | 3 | 26,947 | 91 | 27,041 | 34 | 22,959 | 88 | 23,081 | ||||||||||
| Foreign exchange contracts | 61 | 38,929 | 3 | 38,993 | 25 | 30,588 | 5 | 30,618 | ||||||||||
| Credit contracts | – | 265 | – | 265 | – | 290 | – | 290 | ||||||||||
| Equity contracts | – | 1,366 | 1,309 | 2,675 | 2 | 1,316 | 957 | 2,275 | ||||||||||
| Commodity contracts | 127 | 614 | 5 | 746 | 49 | 899 | 6 | 954 | ||||||||||
| 191 | 68,121 | 1,408 | 69,720 | 110 | 56,052 | 1,056 | 57,218 | |||||||||||
| Securitization liabilities at fair value | – | 12,145 | – | 12,145 | – | 10,986 | – | 10,986 | ||||||||||
| Other financial liabilities designated | ||||||||||||||||||
| at fair value through profit or loss | – | 401 | 12 | 413 | – | 1,402 | 13 | 1,415 | ||||||||||
| Obligations related to securities sold short | 8,377 | 36,167 | 20 | 44,564 | 8,783 | 29,961 | 59 | 38,803 | ||||||||||
| Obligations related to securities sold | ||||||||||||||||||
| under repurchase agreements | – | 9,391 | – | 9,391 | – | 12,376 | – | 12,376 | ||||||||||
| 1 | Fair value is the same as carrying value. |
| 2 | As at July 31, 2016, the carrying values of certain available-for-sale equity securities of $6 million (October 31, 2015 – $6 million) are assumed to approximate fair value in the absence of quoted market prices in an active market. |
| 3 | As at July 31, 2016, common shares include the fair value of Federal Reserve Stock and Federal Home Loan Bank stock of $1.3 billion (October 31, 2015 – $1.3 billion) which are redeemable by the issuer at cost for which cost approximates fair value. These securities cannot be traded in the market; hence, these securities have not been subject to sensitivity analysis of Level 3 financial assets and liabilities. |
| TD BANK GROUP • THIRD QUARTER 2016 • REPORT TO SHAREHOLDERS | Page 54 |
The Bank's policy is to record transfers of assets and liabilities between the different levels of the fair value hierarchy using the fair values as at the end of each reporting period. Assets are transferred between Level 1 and Level 2 depending on if there is sufficient frequency and volume in an active market.
There were no significant transfers between Level 1 and Level 2 during the three and nine months ended July 31, 2016, and the three months ended July 31, 2015. During the nine months ended July 31, 2015, the Bank transferred $100 million of available-for-sale securities from Level 1 to Level 2. The transfer represented previously on-the-run treasury securities that are now off-the-run.
Movements of Level 3 instruments
Significant transfers into and out of Level 3 occur mainly due to the following reasons:
| • | Transfers from Level 3 to Level 2 occur when techniques used for valuing the instrument incorporate significant observable market inputs or broker-dealer quotes which were previously not observable. |
| • | Transfers from Level 2 to Level 3 occur when an instrument's fair value, which was previously determined using valuation techniques with significant observable market inputs, is now determined using valuation techniques with significant non-observable inputs. |
Due to the unobservable nature of the inputs used to value Level 3 financial instruments there may be uncertainty about the valuation of these instruments. The fair value of Level 3 instruments may be drawn from a range of reasonably possible alternatives. In determining the appropriate levels for these unobservable inputs, parameters are chosen so that they are consistent with prevailing market evidence and management judgment.
| TD BANK GROUP • THIRD QUARTER 2016 • REPORT TO SHAREHOLDERS | Page 55 |
The following tables reconcile changes in fair value of all assets and liabilities measured at fair value using significant Level 3 non-observable inputs for the three and nine months ended July 31, 2016.
| Reconciliation of Changes in Fair Value for Level 3 Assets and Liabilities | ||||||||||||||||||||||
| (millions of Canadian dollars) | Total realized and | Change in | ||||||||||||||||||||
| Fair | unrealized gains | Fair | unrealized | |||||||||||||||||||
| value | (losses) | Movements | Transfers | value | gains | |||||||||||||||||
| as at | Included | as at | (losses) on | |||||||||||||||||||
| May 1 | in | Included | Into | Out of | July 31 | instruments | ||||||||||||||||
| 2016 | income1 | in OCI2 | Purchases | Issuances | Other3 | Level 3 | Level 3 | 2016 | still held4 | |||||||||||||
| FINANCIAL ASSETS | ||||||||||||||||||||||
| Trading loans, securities, | ||||||||||||||||||||||
| and other | ||||||||||||||||||||||
| Government and government- | ||||||||||||||||||||||
| related securities | ||||||||||||||||||||||
| Canadian government debt | ||||||||||||||||||||||
| Provinces | $ | 57 | $ | 2 | $ | – | $ | – | $ | – | $ | 1 | $ | 3 | $ | – | $ | 63 | $ | 4 | ||
| Other OECD government | ||||||||||||||||||||||
| guaranteed debt | – | – | – | – | – | – | – | – | – | – | ||||||||||||
| Other debt securities | ||||||||||||||||||||||
| Canadian issuers | 13 | (1) | – | 15 | – | (4) | – | – | 23 | (1) | ||||||||||||
| Other issuers | 244 | 6 | – | 16 | – | (113) | 28 | (47) | 134 | 10 | ||||||||||||
| Equity securities | ||||||||||||||||||||||
| Common shares | 5 | – | – | 4 | – | (5) | – | – | 4 | – | ||||||||||||
| Preferred shares | 1 | – | – | 5 | – | (1) | – | – | 5 | – | ||||||||||||
| Retained interests | 34 | 1 | – | – | – | (2) | – | – | 33 | 1 | ||||||||||||
| 354 | 8 | – | 40 | – | (124) | 31 | (47) | 262 | 14 | |||||||||||||
| Financial assets designated | ||||||||||||||||||||||
| at fair value through | ||||||||||||||||||||||
| profit or loss | ||||||||||||||||||||||
| Securities | 90 | 1 | – | 4 | – | – | 40 | – | 135 | 1 | ||||||||||||
| 90 | 1 | – | 4 | – | – | 40 | – | 135 | 1 | |||||||||||||
| Available-for-sale securities | ||||||||||||||||||||||
| Government and government- | ||||||||||||||||||||||
| related securities | ||||||||||||||||||||||
| Canadian government debt | ||||||||||||||||||||||
| Provinces | – | – | – | – | – | – | – | – | – | – | ||||||||||||
| Other OECD government | ||||||||||||||||||||||
| guaranteed debt | 7 | – | – | – | – | – | – | – | 7 | – | ||||||||||||
| Other debt securities | ||||||||||||||||||||||
| Asset-backed securities | – | – | – | – | – | – | – | – | – | – | ||||||||||||
| Corporate and other debt | 20 | 4 | (2) | – | – | – | – | (3) | 19 | (2) | ||||||||||||
| Equity securities | ||||||||||||||||||||||
| Common shares | 1,500 | 13 | 2 | 14 | – | 24 | – | – | 1,553 | 2 | ||||||||||||
| Preferred shares | 89 | (1) | 1 | 1 | – | – | – | – | 90 | 1 | ||||||||||||
| Debt securities reclassified | ||||||||||||||||||||||
| from trading | 253 | 9 | 6 | – | – | (1) | – | – | 267 | 6 | ||||||||||||
| $ | 1,869 | $ | 25 | $ | 7 | $ | 15 | $ | – | $ | 23 | $ | – | $ | (3) | $ | 1,936 | $ | 7 | |||
| Total realized and | Change in | |||||||||||||||||||||
| Fair | unrealized losses | Fair | unrealized | |||||||||||||||||||
| value | (gains) | Movements | Transfers | value | gains | |||||||||||||||||
| as at | Included | as at | (losses) on | |||||||||||||||||||
| May 1 | in | Included | Into | Out of | July 31 | instruments | ||||||||||||||||
| 2016 | income1 | in OCI2 | Purchases | Issuances | Other3 | Level 3 | Level 3 | 2016 | still held | |||||||||||||
| FINANCIAL LIABILITIES | ||||||||||||||||||||||
| Trading deposits5 | $ | 2,209 | $ | 47 | $ | – | $ | (168) | $ | 213 | $ | (92) | $ | 22 | $ | (5) | $ | 2,226 | $ | 41 | ||
| Derivatives6 | ||||||||||||||||||||||
| Interest rate contracts | 83 | 8 | – | – | – | – | – | – | 91 | 11 | ||||||||||||
| Foreign exchange contracts | (8) | 8 | – | – | – | (2) | – | – | (2) | 2 | ||||||||||||
| Credit contracts | – | – | – | – | – | – | – | – | – | – | ||||||||||||
| Equity contracts | 477 | 88 | – | (11) | 43 | (15) | – | – | 582 | 86 | ||||||||||||
| Commodity contracts | (4) | 2 | – | – | – | 2 | (1) | – | (1) | 2 | ||||||||||||
| 548 | 106 | – | (11) | 43 | (15) | (1) | – | 670 | 101 | |||||||||||||
| Other financial liabilities | ||||||||||||||||||||||
| designated at fair value | ||||||||||||||||||||||
| through profit or loss | 23 | (41) | – | – | 46 | (16) | – | – | 12 | (29) | ||||||||||||
| Obligations related to | ||||||||||||||||||||||
| securities sold short | $ | 4 | $ | – | $ | – | $ | (4) | $ | – | $ | 20 | $ | – | $ | – | $ | 20 | $ | – | ||
| 1 | Gains (losses) on financial assets and liabilities are recognized in Net securities gains (losses), Trading income (loss), and Other income (loss) on the Interim Consolidated Statement of Income. |
| 2 | Other comprehensive income (OCI). |
| 3 | Consists of sales, settlements, and foreign exchange. |
| 4 | Changes in unrealized gains (losses) on available-for-sale securities are recognized in accumulated other comprehensive income (AOCI). |
| 5 | Issuances and repurchases of trading deposits are reported on a gross basis. |
| 6 | As at July 31, 2016, consists of derivative assets of $0.7 billion (May 1, 2016 – $0.7 billion) and derivative liabilities of $1.4 billion (May 1, 2016 – $1.2 billion), which have been netted on this table for presentation purposes only. |
| TD BANK GROUP • THIRD QUARTER 2016 • REPORT TO SHAREHOLDERS | Page 56 |
| Reconciliation of Changes in Fair Value for Level 3 Assets and Liabilities | ||||||||||||||||||||||
| (millions of Canadian dollars) | Total realized and | Change in | ||||||||||||||||||||
| Fair | unrealized gains | Fair | unrealized | |||||||||||||||||||
| value | (losses) | Movements | Transfers | value | gains | |||||||||||||||||
| as at | Included | as at | (losses) on | |||||||||||||||||||
| November 1 | in | Included | Into | Out of | July 31 | instruments | ||||||||||||||||
| 2015 | income1 | in OCI | Purchases | Issuances | Other2 | Level 3 | Level 3 | 2016 | still held3 | |||||||||||||
| FINANCIAL ASSETS | ||||||||||||||||||||||
| Trading loans, securities, | ||||||||||||||||||||||
| and other | ||||||||||||||||||||||
| Government and government- | ||||||||||||||||||||||
| related securities | ||||||||||||||||||||||
| Canadian government debt | ||||||||||||||||||||||
| Provinces | $ | 24 | $ | 3 | $ | – | $ | 39 | $ | – | $ | (6) | $ | 3 | $ | – | $ | 63 | $ | (1) | ||
| Other OECD government | ||||||||||||||||||||||
| guaranteed debt | 5 | – | – | 1 | – | – | – | (6) | – | – | ||||||||||||
| Other debt securities | ||||||||||||||||||||||
| Canadian issuers | 57 | (1) | – | 23 | – | (56) | 1 | (1) | 23 | (1) | ||||||||||||
| Other issuers | 191 | 12 | – | 84 | – | (200) | 329 | (282) | 134 | 9 | ||||||||||||
| Equity securities | ||||||||||||||||||||||
| Common shares | 186 | – | – | 12 | – | (194) | – | – | 4 | – | ||||||||||||
| Preferred shares | 5 | – | – | 32 | – | (32) | – | – | 5 | – | ||||||||||||
| Retained interests | 38 | 1 | – | – | – | (6) | – | – | 33 | 1 | ||||||||||||
| 506 | 15 | – | 191 | – | (494) | 333 | (289) | 262 | 8 | |||||||||||||
| Financial assets designated | ||||||||||||||||||||||
| at fair value through | ||||||||||||||||||||||
| profit or loss | ||||||||||||||||||||||
| Securities | – | – | – | 95 | – | – | 40 | – | 135 | – | ||||||||||||
| – | – | – | 95 | – | – | 40 | – | 135 | – | |||||||||||||
| Available-for-sale securities | ||||||||||||||||||||||
| Government and government- | ||||||||||||||||||||||
| related securities | ||||||||||||||||||||||
| Canadian government debt | ||||||||||||||||||||||
| Provinces | – | – | – | – | – | – | – | – | – | – | ||||||||||||
| Other OECD government | ||||||||||||||||||||||
| guaranteed debt | 7 | – | – | – | – | – | – | – | 7 | – | ||||||||||||
| Other debt securities | ||||||||||||||||||||||
| Asset-backed securities | 501 | – | – | – | – | (501) | – | – | – | – | ||||||||||||
| Corporate and other debt | 147 | 5 | (4) | – | – | (5) | 3 | (127) | 19 | (2) | ||||||||||||
| Equity securities | ||||||||||||||||||||||
| Common shares | 1,575 | 42 | (25) | 51 | – | (90) | – | – | 1,553 | (17) | ||||||||||||
| Preferred shares | 94 | (19) | 7 | 8 | – | – | – | – | 90 | 6 | ||||||||||||
| Debt securities reclassified | ||||||||||||||||||||||
| from trading | 282 | 24 | – | – | – | (4) | – | (35) | 267 | 6 | ||||||||||||
| $ | 2,606 | $ | 52 | $ | (22) | $ | 59 | $ | – | $ | (600) | $ | 3 | $ | (162) | $ | 1,936 | $ | (7) | |||
| Total realized and | Change in | |||||||||||||||||||||
| Fair | unrealized losses | Fair | unrealized | |||||||||||||||||||
| value | (gains) | Movements | Transfers | value | losses | |||||||||||||||||
| as at | Included | as at | (gains) on | |||||||||||||||||||
| November 1 | in | Included | Into | Out of | July 31 | instruments | ||||||||||||||||
| 2015 | income1 | in OCI | Purchases | Issuances | Other2 | Level 3 | Level 3 | 2016 | still held | |||||||||||||
| FINANCIAL LIABILITIES | ||||||||||||||||||||||
| Trading deposits4 | $ | 1,880 | $ | 106 | $ | – | $ | (309) | $ | 742 | $ | (198) | $ | 10 | $ | (5) | $ | 2,226 | $ | 115 | ||
| Derivatives5 | ||||||||||||||||||||||
| Interest rate contracts | 88 | 7 | – | – | – | (3) | (1) | – | 91 | 6 | ||||||||||||
| Foreign exchange contracts | (1) | (1) | – | – | – | (1) | – | 1 | (2) | – | ||||||||||||
| Credit contracts | (4) | 4 | – | – | – | – | – | – | – | 4 | ||||||||||||
| Equity contracts | 397 | 168 | – | (68) | 168 | (83) | 1 | (1) | 582 | 166 | ||||||||||||
| Commodity contracts | 3 | 5 | – | – | – | (7) | (2) | – | (1) | – | ||||||||||||
| 483 | 183 | – | (68) | 168 | (94) | (2) | – | 670 | 176 | |||||||||||||
| Other financial liabilities | ||||||||||||||||||||||
| designated at fair value | ||||||||||||||||||||||
| through profit or loss | 13 | (56) | – | – | 101 | (46) | – | – | 12 | (32) | ||||||||||||
| Obligations related to | ||||||||||||||||||||||
| securities sold short | $ | 59 | $ | – | $ | – | $ | (82) | $ | – | $ | 43 | $ | – | $ | – | $ | 20 | $ | – | ||
| 1 | Gains (losses) on financial assets and liabilities are recognized in Net securities gains (losses), Trading income (loss), and Other income (loss) on the Interim Consolidated Statement of Income. |
| 2 | Consists of sales, settlements, and foreign exchange. |
| 3 | Changes in unrealized gains (losses) on available-for-sale securities are recognized in AOCI. |
| 4 | Beginning February 1, 2016, issuances and repurchases of trading deposits are reported on a gross basis. |
| 5 | As at July 31, 2016, consists of derivative assets of $0.7 billion (November 1, 2015 – $0.6 billion) and derivative liabilities of $1.4 billion (November 1, 2015 – $1.1 billion), which have been netted on this table for presentation purposes only. |
| TD BANK GROUP • THIRD QUARTER 2016 • REPORT TO SHAREHOLDERS | Page 57 |
| Reconciliation of Changes in Fair Value for Level 3 Assets and Liabilities | ||||||||||||||||||||||
| (millions of Canadian dollars) | Total realized and | Change in | ||||||||||||||||||||
| Fair | unrealized gains | Fair | unrealized | |||||||||||||||||||
| value | (losses) | Movements | Transfers | value | gains | |||||||||||||||||
| as at | Included | as at | (losses) on | |||||||||||||||||||
| May 1 | in | Included | Into | Out of | July 31 | instruments | ||||||||||||||||
| 2015 | income1 | in OCI | Purchases | Issuances | Other2 | Level 3 | Level 3 | 2015 | still held3 | |||||||||||||
| FINANCIAL ASSETS | ||||||||||||||||||||||
| Trading loans, securities, | ||||||||||||||||||||||
| and other | ||||||||||||||||||||||
| Government and government- | ||||||||||||||||||||||
| related securities | ||||||||||||||||||||||
| Canadian government debt | ||||||||||||||||||||||
| Provinces | $ | 6 | $ | – | $ | – | $ | – | $ | – | $ | (5) | $ | 25 | $ | – | $ | 26 | $ | – | ||
| Other debt securities | ||||||||||||||||||||||
| Canadian issuers | 50 | – | – | 30 | – | (37) | 1 | (1) | 43 | – | ||||||||||||
| Other issuers | 156 | (3) | – | 18 | – | (84) | 106 | (11) | 182 | 4 | ||||||||||||
| Equity securities | ||||||||||||||||||||||
| Common shares | 72 | – | – | – | – | (72) | – | – | – | – | ||||||||||||
| Preferred shares | – | – | – | 24 | – | – | – | – | 24 | – | ||||||||||||
| Retained interests | 43 | 1 | – | – | – | (4) | – | – | 40 | – | ||||||||||||
| 327 | (2) | – | 72 | – | (202) | 132 | (12) | 315 | 4 | |||||||||||||
| Financial assets designated | ||||||||||||||||||||||
| at fair value through | ||||||||||||||||||||||
| profit or loss | ||||||||||||||||||||||
| Loans | 3 | – | – | – | – | (2) | – | – | 1 | (1) | ||||||||||||
| 3 | – | – | – | – | (2) | – | – | 1 | (1) | |||||||||||||
| Available-for-sale securities | ||||||||||||||||||||||
| Government and government- | ||||||||||||||||||||||
| related securities | ||||||||||||||||||||||
| Canadian government debt | ||||||||||||||||||||||
| Provinces | – | – | – | – | – | – | – | – | – | – | ||||||||||||
| Other OECD government | ||||||||||||||||||||||
| guaranteed debt | 6 | – | 1 | – | – | – | – | – | 7 | – | ||||||||||||
| Other debt securities | ||||||||||||||||||||||
| Asset-backed securities | 502 | – | (43) | – | – | 42 | – | – | 501 | (43) | ||||||||||||
| Corporate and other debt | 159 | 2 | 9 | – | – | (2) | 34 | (53) | 149 | 9 | ||||||||||||
| Equity securities | ||||||||||||||||||||||
| Common shares | 1,594 | 17 | 1 | 101 | – | (22) | – | – | 1,691 | 1 | ||||||||||||
| Preferred shares | 116 | (5) | (2) | – | – | – | – | – | 109 | (1) | ||||||||||||
| Debt securities reclassified | ||||||||||||||||||||||
| from trading | 228 | 5 | 8 | – | – | (1) | 21 | – | 261 | 8 | ||||||||||||
| $ | 2,605 | $ | 19 | $ | (26) | $ | 101 | $ | – | $ | 17 | $ | 55 | $ | (53) | $ | 2,718 | $ | (26) | |||
| Total realized and | Change in | |||||||||||||||||||||
| Fair | unrealized losses | Fair | unrealized | |||||||||||||||||||
| value | (gains) | Movements | Transfers | value | gains | |||||||||||||||||
| as at | Included | as at | (losses) on | |||||||||||||||||||
| May 1 | in | Included | Into | Out of | July 31 | instruments | ||||||||||||||||
| 2015 | income1 | in OCI | Purchases | Issuances | Other2 | Level 3 | Level 3 | 2015 | still held | |||||||||||||
| FINANCIAL LIABILITIES | ||||||||||||||||||||||
| Trading deposits | $ | 1,797 | $ | (16) | $ | – | $ | – | $ | 219 | $ | (163) | $ | – | $ | – | $ | 1,837 | $ | (21) | ||
| Derivatives4 | ||||||||||||||||||||||
| Interest rate contracts | 98 | (7) | – | – | – | – | – | – | 91 | (4) | ||||||||||||
| Foreign exchange contracts | (12) | 5 | – | – | – | (1) | – | 5 | (3) | (2) | ||||||||||||
| Credit contracts | – | (4) | – | – | – | – | – | – | (4) | (4) | ||||||||||||
| Equity contracts | 488 | (104) | – | (21) | 44 | (17) | – | – | 390 | (104) | ||||||||||||
| Commodity contracts | 4 | 6 | – | – | – | (3) | (1) | – | 6 | 5 | ||||||||||||
| 578 | (104) | – | (21) | 44 | (21) | (1) | 5 | 480 | (109) | |||||||||||||
| Other financial liabilities | ||||||||||||||||||||||
| designated at fair value | ||||||||||||||||||||||
| through profit or loss | 27 | (29) | – | – | 33 | (25) | – | – | 6 | (30) | ||||||||||||
| Obligations related to | ||||||||||||||||||||||
| securities sold short | $ | 13 | $ | – | $ | – | $ | (13) | $ | – | $ | 6 | $ | – | $ | – | $ | 6 | $ | – | ||
| 1 | Gains (losses) on financial assets and liabilities are recognized in Net securities gains (losses), Trading income (loss), and Other income (loss) on the Interim Consolidated Statement of Income. |
| 2 | Consists of sales, settlements, and foreign exchange. |
| 3 | Changes in unrealized gains (losses) on available-for-sale securities are recognized in AOCI. |
| 4 | As at July 31, 2015, consists of derivative assets of $0.6 billion (May 1, 2015 – $0.8 billion) and derivative liabilities of $1.1 billion (May 1, 2015 – $1.4 billion), which have been netted on this table for presentation purposes only. |
| TD BANK GROUP • THIRD QUARTER 2016 • REPORT TO SHAREHOLDERS | Page 58 |
| Reconciliation of Changes in Fair Value for Level 3 Assets and Liabilities | ||||||||||||||||||||||
| (millions of Canadian dollars) | Total realized and | Change in | ||||||||||||||||||||
| Fair | unrealized gains | Fair | unrealized | |||||||||||||||||||
| value | (losses) | Movements | Transfers | value | gains | |||||||||||||||||
| as at | Included | as at | (losses) on | |||||||||||||||||||
| November 1 | in | Included | Into | Out of | July 31 | instruments | ||||||||||||||||
| 2014 | income1 | in OCI | Purchases | Issuances | Other2 | Level 3 | Level 3 | 2015 | still held3 | |||||||||||||
| FINANCIAL ASSETS | ||||||||||||||||||||||
| Trading loans, securities, | ||||||||||||||||||||||
| and other | ||||||||||||||||||||||
| Government and government- | ||||||||||||||||||||||
| related securities | ||||||||||||||||||||||
| Canadian government debt | ||||||||||||||||||||||
| Provinces | $ | – | $ | – | $ | – | $ | – | $ | – | $ | (6) | $ | 32 | $ | – | $ | 26 | $ | – | ||
| Other debt securities | ||||||||||||||||||||||
| Canadian issuers | 20 | – | – | 62 | – | (64) | 27 | (2) | 43 | – | ||||||||||||
| Other issuers | 66 | (7) | – | 51 | – | (144) | 227 | (11) | 182 | 2 | ||||||||||||
| Equity securities | ||||||||||||||||||||||
| Common shares | 4 | – | – | 77 | – | (81) | – | – | – | – | ||||||||||||
| Preferred shares | – | – | – | 24 | – | – | – | – | 24 | – | ||||||||||||
| Retained interests | 48 | 2 | – | – | – | (10) | – | – | 40 | (2) | ||||||||||||
| 138 | (5) | – | 214 | – | (305) | 286 | (13) | 315 | – | |||||||||||||
| Financial assets designated | ||||||||||||||||||||||
| at fair value through | ||||||||||||||||||||||
| profit or loss | ||||||||||||||||||||||
| Loans | 5 | 1 | – | – | – | (5) | – | – | 1 | (3) | ||||||||||||
| 5 | 1 | – | – | – | (5) | – | – | 1 | (3) | |||||||||||||
| Available-for-sale securities | ||||||||||||||||||||||
| Government and government- | ||||||||||||||||||||||
| related securities | ||||||||||||||||||||||
| Canadian government debt | ||||||||||||||||||||||
| Provinces | 51 | 1 | – | – | – | – | – | (52) | – | 1 | ||||||||||||
| Other OECD government | ||||||||||||||||||||||
| guaranteed debt | 5 | – | – | – | – | 2 | – | – | 7 | – | ||||||||||||
| Other debt securities | ||||||||||||||||||||||
| Asset-backed securities | – | – | (43) | – | – | 42 | 502 | – | 501 | (43) | ||||||||||||
| Corporate and other debt | 19 | 2 | 7 | – | – | (3) | 243 | (119) | 149 | 7 | ||||||||||||
| Equity securities | ||||||||||||||||||||||
| Common shares | 1,303 | 63 | 14 | 386 | – | (75) | – | – | 1,691 | 14 | ||||||||||||
| Preferred shares | 141 | (22) | (10) | – | – | – | – | – | 109 | (10) | ||||||||||||
| Debt securities reclassified | ||||||||||||||||||||||
| from trading | 309 | 30 | 22 | – | – | (67) | 21 | (54) | 261 | 22 | ||||||||||||
| $ | 1,828 | $ | 74 | $ | (10) | $ | 386 | $ | – | $ | (101) | $ | 766 | $ | (225) | $ | 2,718 | $ | (9) | |||
| Total realized and | Change in | |||||||||||||||||||||
| Fair | unrealized losses | Fair | unrealized | |||||||||||||||||||
| value | (gains) | Movements | Transfers | value | gains | |||||||||||||||||
| as at | Included | as at | (losses) on | |||||||||||||||||||
| November 1 | in | Included | Into | Out of | July 31 | instruments | ||||||||||||||||
| 2014 | income1 | in OCI | Purchases | Issuances | Other2 | Level 3 | Level 3 | 2015 | still held | |||||||||||||
| FINANCIAL LIABILITIES | ||||||||||||||||||||||
| Trading deposits | $ | 1,631 | $ | 30 | $ | – | $ | – | $ | 687 | $ | (511) | $ | – | $ | – | $ | 1,837 | $ | 14 | ||
| Derivatives4 | ||||||||||||||||||||||
| Interest rate contracts | 81 | 9 | – | – | – | 1 | – | – | 91 | 10 | ||||||||||||
| Foreign exchange contracts | (2) | (4) | – | – | – | – | (3) | 6 | (3) | (2) | ||||||||||||
| Credit contracts | – | (4) | – | – | – | – | – | – | (4) | (4) | ||||||||||||
| Equity contracts | 504 | (73) | – | (74) | 149 | (98) | – | (18) | 390 | (75) | ||||||||||||
| Commodity contracts | 4 | 24 | – | – | – | (20) | (2) | – | 6 | 9 | ||||||||||||
| 587 | (48) | – | (74) | 149 | (117) | (5) | (12) | 480 | (62) | |||||||||||||
| Other financial liabilities | ||||||||||||||||||||||
| designated at fair value | ||||||||||||||||||||||
| through profit or loss | 8 | (34) | – | – | 70 | (38) | – | – | 6 | (38) | ||||||||||||
| Obligations related to | ||||||||||||||||||||||
| securities sold short | $ | 34 | $ | – | $ | – | $ | (39) | $ | – | $ | 13 | $ | – | $ | (2) | $ | 6 | $ | – | ||
| 1 | Gains (losses) on financial assets and liabilities are recognized in Net securities gains (losses), Trading income (loss), and Other income (loss) on the Interim Consolidated Statement of Income. |
| 2 | Consists of sales, settlements, and foreign exchange. |
| 3 | Changes in unrealized gains (losses) on available-for-sale securities are recognized in AOCI. |
| 4 | As at July 31, 2015, consists of derivative assets of $0.6 billion (November 1, 2014 – $1.1 billion) and derivative liabilities of $1.1 billion (November 1, 2014 – $1.6 billion), which have been netted on this table for presentation purposes only. |
| TD BANK GROUP • THIRD QUARTER 2016 • REPORT TO SHAREHOLDERS | Page 59 |
FINANCIAL ASSETS AND LIABILITIES Designated at Fair Value
Securities Designated at Fair Value through Profit or Loss
Certain securities supporting insurance reserves within the Bank's insurance underwriting subsidiaries have been designated at fair value through profit or loss. The actuarial valuation of the insurance reserve is measured using a discount factor which is based on the yield of the supporting invested assets, with changes in the discount factor being recognized on the Interim Consolidated Statement of Income. By designating the securities at fair value through profit or loss, the unrealized gain or loss on the securities is recognized on the Interim Consolidated Statement of Income in the same period as a portion of the income or loss resulting from changes to the discount rate used to value the insurance liabilities.
In addition, certain debt securities are managed on a fair value basis, or are economically hedged with derivatives as doing so eliminates or significantly reduces an accounting mismatch. As a result, these debt securities have been designated at fair value through profit or loss. The derivatives are carried at fair value, with the change in fair value recognized in non-interest income.
Other Liabilities Designated at Fair Value through Profit or Loss
Certain deposits and loan commitments issued to customers to provide a mortgage at a fixed rate have been designated at fair value through profit or loss. These deposits and commitments are economically hedged with derivatives and other financial instruments where the changes in fair value are recognized in non-interest income. The designation of these deposits and loan commitments at fair value through profit or loss eliminates an accounting mismatch that would otherwise arise.
The contractual maturity amounts for the deposits designated at fair value through profit or loss were $1 million less than the carrying amount as at July 31, 2016 (October 31, 2015 – $4 million less than the carrying amount). As at July 31, 2016, the Bank's own credit risk on the fair value of deposits designated at fair value through profit or loss was not significant (October 31, 2015 – $1 million). Due to the short-term nature of the loan commitments, changes in the Bank's own credit risk do not have a significant impact on the determination of fair value.
Income (Loss) from Changes in Fair Value of Financial Assets and Liabilities Designated at Fair Value through Profit or Loss
During the three and nine months ended July 31, 2016, the income (loss) representing net changes in the fair value of financial assets and liabilities designated at fair value through profit or loss was $42 million and $(4) million, respectively, (three and nine months ended July 31, 2015 – $(13) million and $17 million, respectively).
| NOTE 4: SECURITIES |
RECLASSIFICATION OF CERTAIN DEBT SECURITIES – TRADING TO AVAILABLE-FOR-SALE
During 2008, the Bank changed its trading strategy with respect to certain debt securities as a result of deterioration in markets and severe dislocation in the credit market. These debt securities were initially recorded as trading securities measured at fair value with any changes in fair value as well as any gains or losses realized on disposal recognized in trading income. Since the Bank no longer intended to actively trade in these debt securities, the Bank reclassified these debt securities from trading to available-for-sale effective August 1, 2008.
The fair value of the reclassified debt securities was $354 million as at July 31, 2016 (October 31, 2015 – $451 million). For the three and nine months ended July 31, 2016, net interest income of $5 million and $16 million after tax, respectively (three and nine months ended July 31, 2015 – $6 million and $21 million after tax, respectively) was recorded relating to the reclassified debt securities. The increase in fair value of these securities during the three months ended July 31, 2016, of nil after tax and the increase in fair value of these securities during the nine months ended July 31, 2016, of $3 million after tax, respectively (three and nine months ended July 31, 2015 – decrease of $24 million and $19 million after tax, respectively) was recorded in OCI. Had the Bank not reclassified these debt securities, the change in the fair value of these debt securities would have been included as part of trading income, the impact of which would have resulted in an increase in net income for the three months ended July 31, 2016, of nil after tax and an increase in net income for the nine months ended July 31, 2016, of $3 million after tax (three and nine months ended July 31, 2015 – decrease in net income of $24 million and $19 million after tax, respectively). During the three and nine months ended July 31, 2016, reclassified debt securities with a fair value of $52 million and $121 million, respectively (three and nine months ended July 31, 2015 – $32 million and $282 million, respectively) were sold or matured, and $3 million and $4 million after tax was recorded in net securities gains during the three and nine months ended July 31, 2016 (three and nine months ended July 31, 2015 – $4 million and $12 million after tax, respectively).
RECLASSIFICATIONS OF CERTAIN DEBT SECURITIES – AVAILABLE-FOR-SALE TO HELD-TO-MATURITY
The Bank has reclassified certain debt securities from available-for-sale to held-to-maturity. For these debt securities, the Bank's strategy is to earn the yield to maturity to aid in prudent capital management under Basel III. These debt securities were previously recorded at fair value, with changes in fair value recognized in OCI. Subsequent to the date of reclassification, the net unrealized gain or loss recognized in AOCI is amortized to interest income over the remaining life of the reclassified debt securities using the effective interest rate method (EIRM). The reclassifications are non-cash transactions that are excluded from the Interim Consolidated Statement of Cash Flows.
The Bank has completed the following reclassifications.
| Reclassifications from Available-for-Sale to Held-to-Maturity Securities | ||||||||||||||||
| (millions of Canadian dollars, except as noted) | ||||||||||||||||
| July 31, 2016 | October 31, 2015 | As at the reclassification date | ||||||||||||||
| Weighted-Average | Undiscounted | |||||||||||||||
| Amount | Fair | Carrying | Fair | Carrying | effective interest | recoverable | ||||||||||
| Reclassification Date | reclassified | value | value | value | value | rate | cash flows | |||||||||
| March 1, 2013 | $ | 11,084 | $ | 1,980 | $ | 1,964 | $ | 4,248 | $ | 4,219 | 1.8 | % | $ | 11,341 | ||
| September 23, 2013 | 9,854 | 7,315 | 7,200 | 8,995 | 8,916 | 1.9 | 10,742 | |||||||||
| November 1, 2013 | 21,597 | 20,295 | 20,357 | 22,532 | 22,637 | 1.1 | 24,519 | |||||||||
| Other reclassifications1 | 6,221 | 6,381 | 6,271 | 5,085 | 5,121 | 2.4 | 7,030 | |||||||||
| 1 | Represents reclassifications completed during the three and nine months ended July 31, 2016, and the year ended October 31, 2015. |
| TD BANK GROUP • THIRD QUARTER 2016 • REPORT TO SHAREHOLDERS | Page 60 |
Had the Bank not reclassified these debt securities, the change in the fair value recognized in OCI for these debt securities would have been an increase of $155 million and an increase of $256 million, respectively, during the three and nine months ended July 31, 2016 (three and nine months ended July 31, 2015 – a decrease of $129 million and a decrease of $102 million, respectively). After the reclassification, the debt securities contributed the following amounts to net income.
| (millions of Canadian dollars) | For the three months ended | For the nine months ended | |||||||||||
| July 31, 2016 | July 31, 2015 | July 31, 2016 | July 31, 2015 | ||||||||||
| Net interest income1 | $ | 139 | $ | 137 | $ | 448 | $ | 396 | |||||
| Provision for (recovery of) income taxes | 53 | 51 | 170 | 145 | |||||||||
| Net income | $ | 86 | $ | 86 | $ | 278 | $ | 251 | |||||
| 1 | Includes amortization of net unrealized gains of $7 million and $21 million, respectively, during the three and nine months ended July 31, 2016 (three and nine months ended July 31, 2015 – net unrealized gains of $6 million and $30 million, respectively), associated with these reclassified held-to-maturity securities that is presented as reclassification to earnings of net gains in respect of available-for-sale securities on the Interim Consolidated Statement of Comprehensive Income. The impact of this amortization on net interest income is offset by the amortization of the corresponding net reclassification premium on these debt securities. |
Unrealized Securities Gains (Losses)
The following table summarizes the unrealized gains and losses as at July 31, 2016, and October 31, 2015.
| Unrealized Securities Gains (Losses) for Available-for-Sale Securities | |||||||||||||||||||
| (millions of Canadian dollars) | As at | ||||||||||||||||||
| July 31, 2016 | October 31, 2015 | ||||||||||||||||||
| Cost/ | Gross | Gross | Cost/ | Gross | Gross | ||||||||||||||
| amortized | unrealized | unrealized | Fair | amortized | unrealized | unrealized | Fair | ||||||||||||
| cost1 | gains | (losses) | value | cost1 | gains | (losses) | value | ||||||||||||
| Available-for-sale securities | |||||||||||||||||||
| Government and government-related | |||||||||||||||||||
| securities | |||||||||||||||||||
| Canadian government debt | |||||||||||||||||||
| Federal | $ | 14,619 | $ | 65 | $ | (23) | $ | 14,661 | $ | 14,450 | $ | 42 | $ | (61) | $ | 14,431 | |||
| Provinces | 7,983 | 32 | (46) | 7,969 | 7,233 | 19 | (67) | 7,185 | |||||||||||
| U.S. federal, state, municipal governments, and | |||||||||||||||||||
| agencies debt | 30,859 | 202 | (70) | 30,991 | 22,526 | 169 | (110) | 22,585 | |||||||||||
| Other OECD government guaranteed debt | 11,577 | 14 | (77) | 11,514 | 11,713 | 4 | (62) | 11,655 | |||||||||||
| Mortgage-backed securities | 4,972 | 38 | (6) | 5,004 | 4,021 | 49 | (10) | 4,060 | |||||||||||
| 70,010 | 351 | (222) | 70,139 | 59,943 | 283 | (310) | 59,916 | ||||||||||||
| Other debt securities | |||||||||||||||||||
| Asset-backed securities | 17,313 | 39 | (158) | 17,194 | 16,921 | 15 | (174) | 16,762 | |||||||||||
| Non-agency collateralized mortgage obligation | |||||||||||||||||||
| portfolio | 1,559 | 4 | (7) | 1,556 | 921 | 2 | (7) | 916 | |||||||||||
| Corporate and other debt | 8,284 | 82 | (28) | 8,338 | 8,770 | 75 | (80) | 8,765 | |||||||||||
| 27,156 | 125 | (193) | 27,088 | 26,612 | 92 | (261) | 26,443 | ||||||||||||
| Equity securities | |||||||||||||||||||
| Common shares | 1,847 | 120 | (12) | 1,955 | 1,770 | 118 | (30) | 1,858 | |||||||||||
| Preferred shares | 126 | 12 | – | 138 | 112 | 6 | (4) | 114 | |||||||||||
| 1,973 | 132 | (12) | 2,093 | 1,882 | 124 | (34) | 1,972 | ||||||||||||
| Debt securities reclassified from trading | 323 | 31 | – | 354 | 420 | 33 | (2) | 451 | |||||||||||
| Total available-for-sale securities | $ | 99,462 | $ | 639 | $ | (427) | $ | 99,674 | $ | 88,857 | $ | 532 | $ | (607) | $ | 88,782 | |||
| 1 | Includes the foreign exchange translation of amortized cost balances at the period-end spot rate. |
Securities Gains (Losses)
During the three and nine months ended July 31, 2016, the net realized gains (losses) on available-for-sale securities were $40 million and $53 million, respectively (three and nine months ended July 31, 2015 – $20 million and $96 million, respectively). Impairment losses on available-for-sale securities for the three and nine months ended July 31, 2016, were $3 million and $27 million, respectively (three and nine months ended July 31, 2015 – $6 million and $28 million, respectively). None of these impairment losses related to debt securities in the reclassified portfolio as described in the Reclassification of Certain Debt Securities – Trading to Available-for-sale section of the Note.
| TD BANK GROUP • THIRD QUARTER 2016 • REPORT TO SHAREHOLDERS | Page 61 |
| NOTE 5: LOANS, IMPAIRED LOANS, AND ALLOWANCE FOR CREDIT LOSSES |
The following table presents the Bank's loans, impaired loans, and related allowance for loan losses.
| Loans, Impaired Loans, and Allowance for Loan Losses | |||||||||||||||||||
| (millions of Canadian dollars) | Gross loans | Allowance for loan losses1 | |||||||||||||||||
| Neither | Individually | Incurred | Total | ||||||||||||||||
| past due | Past due | Counter- | insignificant | but not | allowance | ||||||||||||||
| nor | but not | party | impaired | identified | for loan | Net | |||||||||||||
| impaired | impaired | Impaired2 | Total | specific | loans | credit losses | losses | loans | |||||||||||
| As at July 31, 2016 | |||||||||||||||||||
| Residential mortgages3,4,5 | $ | 211,354 | $ | 2,472 | $ | 841 | $ | 214,667 | $ | – | $ | 36 | $ | 64 | $ | 100 | $ | 214,567 | |
| Consumer instalment and other personal6 | 133,233 | 6,759 | 1,366 | 141,358 | – | 144 | 677 | 821 | 140,537 | ||||||||||
| Credit card | 28,958 | 1,810 | 331 | 31,099 | – | 261 | 895 | 1,156 | 29,943 | ||||||||||
| Business and government3,4,5 | 183,290 | 1,338 | 929 | 185,557 | 210 | 30 | 1,134 | 1,374 | 184,183 | ||||||||||
| $ | 556,835 | $ | 12,379 | $ | 3,467 | $ | 572,681 | $ | 210 | $ | 471 | $ | 2,770 | $ | 3,451 | $ | 569,230 | ||
| Debt securities classified as loans | 1,707 | 203 | – | 53 | 256 | 1,451 | |||||||||||||
| Acquired credit-impaired loans | 1,022 | 5 | 61 | – | 66 | 956 | |||||||||||||
| Total | $ | 575,410 | $ | 418 | $ | 532 | $ | 2,823 | $ | 3,773 | $ | 571,637 | |||||||
| As at October 31, 2015 | |||||||||||||||||||
| Residential mortgages3,4,5 | $ | 208,802 | $ | 2,343 | $ | 786 | $ | 211,931 | $ | – | $ | 47 | $ | 58 | $ | 105 | $ | 211,826 | |
| Consumer instalment and other personal6 | 128,123 | 5,923 | 1,278 | 135,324 | – | 136 | 632 | 768 | 134,556 | ||||||||||
| Credit card | 28,148 | 1,761 | 306 | 30,215 | – | 217 | 897 | 1,114 | 29,101 | ||||||||||
| Business and government3,4,5 | 163,840 | 1,990 | 874 | 166,704 | 156 | 28 | 916 | 1,100 | 165,604 | ||||||||||
| $ | 528,913 | $ | 12,017 | $ | 3,244 | $ | 544,174 | $ | 156 | $ | 428 | $ | 2,503 | $ | 3,087 | $ | 541,087 | ||
| Debt securities classified as loans | 2,187 | 207 | – | 57 | 264 | 1,923 | |||||||||||||
| Acquired credit-impaired loans | 1,414 | 6 | 77 | – | 83 | 1,331 | |||||||||||||
| Total | $ | 547,775 | $ | 369 | $ | 505 | $ | 2,560 | $ | 3,434 | $ | 544,341 | |||||||
| 1 | Excludes allowance for off-balance sheet positions. |
| 2 | As at July 31, 2016, impaired loans exclude $1.1 billion (October 31, 2015 – $1.2 billion) of gross impaired debt securities classified as loans. |
| 3 | Excludes trading loans with a fair value of $11 billion as at July 31, 2016 (October 31, 2015 – $11 billion), and amortized cost of $11 billion as at July 31, 2016 (October 31, 2015 – $10 billion). |
| 4 | Includes insured mortgages of $120 billion as at July 31, 2016 (October 31, 2015 – $126 billion). |
| 5 | As at July 31, 2016, impaired loans with a balance of $461 million did not have a related allowance for loan losses (October 31, 2015 – $419 million). An allowance was not required for these loans as the balance relates to loans that are insured or loans where the realizable value of the collateral exceeded the loan amount. |
| 6 | Includes Canadian government-insured real estate personal loans of $18 billion as at July 31, 2016 (October 31, 2015 – $21 billion). |
FORECLOSED ASSETS
Foreclosed assets are repossessed non-financial assets where the Bank gains title, ownership, or possession of individual properties, such as real estate properties, which are managed for sale in an orderly manner with the proceeds used to reduce or repay any outstanding debt. The Bank does not generally occupy foreclosed properties for its business use. The Bank predominantly relies on third-party appraisals to determine the carrying value of foreclosed assets. Foreclosed assets held for sale were $117 million as at July 31, 2016 (October 31, 2015 – $134 million), and were recorded in Other assets on the Interim Consolidated Balance Sheet.
| TD BANK GROUP • THIRD QUARTER 2016 • REPORT TO SHAREHOLDERS | Page 62 |
The changes to the Bank's allowance for credit losses, as at and for the nine months ended July 31, are shown in the following tables.
| Allowance for Credit Losses | |||||||||||||||
| (millions of Canadian dollars) | Foreign | ||||||||||||||
| Balance as at | Provision | exchange | Balance as at | ||||||||||||
| November 1 | for credit | and other | July 31 | ||||||||||||
| 2015 | losses | Write-offs | Recoveries | Disposals | adjustments | 2016 | |||||||||
| Counterparty-specific allowance | |||||||||||||||
| Business and government | $ | 156 | $ | 72 | $ | (48) | $ | 35 | $ | (1) | $ | (4) | $ | 210 | |
| Debt securities classified as loans | 207 | 7 | (10) | – | – | (1) | 203 | ||||||||
| Total counterparty-specific allowance excluding | |||||||||||||||
| acquired credit-impaired loans | 363 | 79 | (58) | 35 | (1) | (5) | 413 | ||||||||
| Acquired credit-impaired loans1,2 | 6 | (5) | – | 11 | – | (7) | 5 | ||||||||
| Total counterparty-specific allowance | 369 | 74 | (58) | 46 | (1) | (12) | 418 | ||||||||
| Collectively assessed allowance for | |||||||||||||||
| individually insignificant impaired loans | |||||||||||||||
| Residential mortgages | 47 | 8 | (28) | 8 | – | 1 | 36 | ||||||||
| Consumer instalment and other personal | 136 | 520 | (706) | 195 | – | (1) | 144 | ||||||||
| Credit card | 217 | 740 | (873) | 182 | – | (5) | 261 | ||||||||
| Business and government | 28 | 46 | (72) | 29 | – | (1) | 30 | ||||||||
| Total collectively assessed allowance for | |||||||||||||||
| individually insignificant impaired loans | |||||||||||||||
| excluding acquired credit-impaired loans | 428 | 1,314 | (1,679) | 414 | – | (6) | 471 | ||||||||
| Acquired credit-impaired loans1,2 | 77 | (19) | (3) | 5 | – | 1 | 61 | ||||||||
| Total collectively assessed allowance for | |||||||||||||||
| individually insignificant impaired loans | 505 | 1,295 | (1,682) | 419 | – | (5) | 532 | ||||||||
| Collectively assessed allowance for incurred | |||||||||||||||
| but not identified credit losses | |||||||||||||||
| Residential mortgages | 58 | 7 | – | – | – | (1) | 64 | ||||||||
| Consumer instalment and other personal | 657 | 51 | – | – | – | (1) | 707 | ||||||||
| Credit card | 1,029 | 97 | – | – | – | 1 | 1,127 | ||||||||
| Business and government | 1,072 | 262 | – | – | – | (5) | 1,329 | ||||||||
| Debt securities classified as loans | 57 | (4) | – | – | – | – | 53 | ||||||||
| Total collectively assessed allowance for | |||||||||||||||
| incurred but not identified credit losses | 2,873 | 413 | – | – | – | (6) | 3,280 | ||||||||
| Allowance for credit losses | |||||||||||||||
| Residential mortgages | 105 | 15 | (28) | 8 | – | – | 100 | ||||||||
| Consumer instalment and other personal | 793 | 571 | (706) | 195 | – | (2) | 851 | ||||||||
| Credit card | 1,246 | 837 | (873) | 182 | – | (4) | 1,388 | ||||||||
| Business and government | 1,256 | 380 | (120) | 64 | (1) | (10) | 1,569 | ||||||||
| Debt securities classified as loans | 264 | 3 | (10) | – | – | (1) | 256 | ||||||||
| Total allowance for credit losses excluding | |||||||||||||||
| acquired credit-impaired loans | 3,664 | 1,806 | (1,737) | 449 | (1) | (17) | 4,164 | ||||||||
| Acquired credit-impaired loans1,2 | 83 | (24) | (3) | 16 | – | (6) | 66 | ||||||||
| Total allowance for credit losses | 3,747 | 1,782 | (1,740) | 465 | (1) | (23) | 4,230 | ||||||||
| Less: Allowance for off-balance sheet | |||||||||||||||
| positions3 | 313 | 149 | – | – | – | (5) | 457 | ||||||||
| Allowance for loan losses | $ | 3,434 | $ | 1,633 | $ | (1,740) | $ | 465 | $ | (1) | $ | (18) | $ | 3,773 | |
| 1 | Includes all Federal Deposit Insurance Corporation (FDIC) covered loans and other acquired credit-impaired (ACI) loans. |
| 2 | Other adjustments are required as a result of the accounting for FDIC covered loans. For additional information, refer to the "FDIC Covered Loans" section in this Note. |
| 3 | The allowance for credit losses for off-balance sheet positions is recorded in Other liabilities on the Interim Consolidated Balance Sheet. |
| TD BANK GROUP • THIRD QUARTER 2016 • REPORT TO SHAREHOLDERS | Page 63 |
| Allowance for Credit Losses | ||||||||||||||
| (millions of Canadian dollars) | Foreign | |||||||||||||
| Balance as at | Provision | exchange | Balance as at | |||||||||||
| November 1 | for credit | and other | July 31 | |||||||||||
| 2014 | losses | Write-offs | Recoveries | Disposals | adjustments | 2015 | ||||||||
| Counterparty-specific allowance | ||||||||||||||
| Business and government | $ | 134 | $ | 39 | $ | (54) | $ | 31 | $ | (3) | $ | 2 | $ | 149 |
| Debt securities classified as loans | 213 | 2 | (9) | – | – | 33 | 239 | |||||||
| Total counterparty-specific allowance excluding | ||||||||||||||
| acquired credit-impaired loans | 347 | 41 | (63) | 31 | (3) | 35 | 388 | |||||||
| Acquired credit-impaired loans1,2 | 8 | (5) | (1) | 10 | – | (5) | 7 | |||||||
| Total counterparty-specific allowance | 355 | 36 | (64) | 41 | (3) | 30 | 395 | |||||||
| Collectively assessed allowance for | ||||||||||||||
| individually insignificant impaired loans | ||||||||||||||
| Residential mortgages | 22 | 43 | (31) | 10 | – | 3 | 47 | |||||||
| Consumer instalment and other personal | 110 | 412 | (600) | 193 | – | 9 | 124 | |||||||
| Credit card | 199 | 607 | (834) | 182 | – | 41 | 195 | |||||||
| Business and government | 22 | 68 | (97) | 33 | – | 4 | 30 | |||||||
| Total collectively assessed allowance for | ||||||||||||||
| individually insignificant impaired loans | ||||||||||||||
| excluding acquired credit-impaired loans | 353 | 1,130 | (1,562) | 418 | – | 57 | 396 | |||||||
| Acquired credit-impaired loans1,2 | 89 | (19) | (5) | 6 | – | 14 | 85 | |||||||
| Total collectively assessed allowance for | ||||||||||||||
| individually insignificant impaired loans | 442 | 1,111 | (1,567) | 424 | – | 71 | 481 | |||||||
| Collectively assessed allowance for incurred | ||||||||||||||
| but not identified credit losses | ||||||||||||||
| Residential mortgages | 48 | 5 | – | – | – | 6 | 59 | |||||||
| Consumer instalment and other personal | 602 | (24) | – | – | – | 52 | 630 | |||||||
| Credit card | 924 | 2 | – | – | – | 65 | 991 | |||||||
| Business and government | 872 | 55 | – | – | – | 91 | 1,018 | |||||||
| Debt securities classified as loans | 59 | (11) | – | – | – | 9 | 57 | |||||||
| Total collectively assessed allowance for | ||||||||||||||
| incurred but not identified credit losses | 2,505 | 27 | – | – | – | 223 | 2,755 | |||||||
| Allowance for credit losses | ||||||||||||||
| Residential mortgages | 70 | 48 | (31) | 10 | – | 9 | 106 | |||||||
| Consumer instalment and other personal | 712 | 388 | (600) | 193 | – | 61 | 754 | |||||||
| Credit card | 1,123 | 609 | (834) | 182 | – | 106 | 1,186 | |||||||
| Business and government | 1,028 | 162 | (151) | 64 | (3) | 97 | 1,197 | |||||||
| Debt securities classified as loans | 272 | (9) | (9) | – | – | 42 | 296 | |||||||
| Total allowance for credit losses excluding | ||||||||||||||
| acquired credit-impaired loans | 3,205 | 1,198 | (1,625) | 449 | (3) | 315 | 3,539 | |||||||
| Acquired credit-impaired loans1,2 | 97 | (24) | (6) | 16 | – | 9 | 92 | |||||||
| Total allowance for credit losses | 3,302 | 1,174 | (1,631) | 465 | (3) | 324 | 3,631 | |||||||
| Less: Allowance for off-balance sheet | ||||||||||||||
| positions3 | 274 | (8) | – | – | – | 21 | 287 | |||||||
| Allowance for loan losses | $ | 3,028 | $ | 1,182 | $ | (1,631) | $ | 465 | $ | (3) | $ | 303 | $ | 3,344 |
| 1 | Includes all FDIC covered loans and other ACI loans. |
| 2 | Other adjustments are required as a result of the accounting for FDIC covered loans. For additional information, refer to the "FDIC Covered Loans" section in this Note. |
| 3 | The allowance for credit losses for off-balance sheet positions is recorded in Other liabilities on the Interim Consolidated Balance Sheet. |
LOANS PAST DUE BUT NOT IMPAIRED
A loan is classified as past due when a borrower has failed to make a payment by the contractual due date. The following table summarizes loans that are contractually past due but not impaired as at July 31, 2016, and October 31, 2015. U.S. Retail may grant a grace period of up to 15 days. As at July 31, 2016, there were $2.2 billion (October 31, 2015 – $3 billion) of U.S. Retail loans that were up to 15 days past due and are included in the 1-30 days category in the following table.
| Loans Past Due but not Impaired1 | |||||||||||||||||
| (millions of Canadian dollars) | As at | ||||||||||||||||
| July 31, 2016 | October 31, 2015 | ||||||||||||||||
| 1-30 | 31-60 | 61-89 | 1-30 | 31-60 | 61-89 | ||||||||||||
| days | days | days | Total | days | days | days | Total | ||||||||||
| Residential mortgages | $ | 1,750 | $ | 628 | $ | 94 | $ | 2,472 | $ | 1,511 | $ | 729 | $ | 103 | $ | 2,343 | |
| Consumer instalment and other personal | 5,787 | 773 | 199 | 6,759 | 5,023 | 702 | 198 | 5,923 | |||||||||
| Credit card | 1,354 | 283 | 173 | 1,810 | 1,317 | 287 | 157 | 1,761 | |||||||||
| Business and government | 1,163 | 145 | 30 | 1,338 | 1,829 | 123 | 38 | 1,990 | |||||||||
| Total | $ | 10,054 | $ | 1,829 | $ | 496 | $ | 12,379 | $ | 9,680 | $ | 1,841 | $ | 496 | $ | 12,017 | |
| 1 | Excludes all ACI loans and debt securities classified as loans. |
| TD BANK GROUP • THIRD QUARTER 2016 • REPORT TO SHAREHOLDERS | Page 64 |
COLLATERAL
As at July 31, 2016, the fair value of financial collateral held against loans that were past due but not impaired was $173 million (October 31, 2015 – $279 million). In addition, the Bank also holds non-financial collateral as security for loans. The fair value of non-financial collateral is determined at the origination date of the loan. A revaluation of non-financial collateral is performed if there has been a significant change in the terms and conditions of the loan and/or the loan is considered impaired. Management considers the nature of the collateral, seniority ranking of the debt, and loan structure in assessing the value of collateral. These estimated cash flows are reviewed at least annually, or more frequently when new information indicates a change in the timing or amount expected to be received.
ACQUIRED CREDIT-IMPAIRED LOANS
ACI loans are comprised of commercial, retail, and FDIC covered loans, from the acquisitions of South Financial, FDIC-assisted, Chrysler Financial, and a credit card portfolio within the U.S. strategic cards portfolio, and had outstanding unpaid principal balances of $6.3 billion, $2.1 billion, $874 million, and $41 million, respectively, and fair values of $5.6 billion, $1.9 billion, $794 million, and nil, respectively, at the acquisition dates.
| Acquired Credit-Impaired Loans | |||||
| (millions of Canadian dollars) | As at | ||||
| July 31 | October 31 | ||||
| 2016 | 2015 | ||||
| FDIC-assisted acquisitions | |||||
| Unpaid principal balance1 | $ | 525 | $ | 636 | |
| Credit related fair value adjustments2 | (11) | (12) | |||
| Interest rate and other related premium/(discount) | (17) | (23) | |||
| Carrying value | 497 | 601 | |||
| Counterparty-specific allowance3 | (2) | (1) | |||
| Allowance for individually insignificant impaired loans3 | (37) | (45) | |||
| Carrying value net of related allowance – FDIC-assisted acquisitions4 | 458 | 555 | |||
| South Financial | |||||
| Unpaid principal balance1 | 561 | 853 | |||
| Credit related fair value adjustments2 | (16) | (18) | |||
| Interest rate and other related premium/(discount) | (20) | (22) | |||
| Carrying value | 525 | 813 | |||
| Counterparty-specific allowance3 | (3) | (5) | |||
| Allowance for individually insignificant impaired loans3 | (24) | (32) | |||
| Carrying value net of related allowance – South Financial | 498 | 776 | |||
| Other5 | |||||
| Unpaid principal balance1 | 3 | 40 | |||
| Credit related fair value adjustments2 | (3) | (40) | |||
| Carrying value | – | – | |||
| Total carrying value net of related allowance – Acquired credit-impaired loans | $ | 956 | $ | 1,331 | |
| 1 | Represents contractual amount owed net of charge-offs since the acquisition of the loan. |
| 2 | Credit related fair value adjustments include incurred credit losses on acquisition and are not accreted to interest income. |
| 3 | Management concluded as part of the Bank's assessment of the ACI loans that it was probable that higher than estimated principal credit losses would result in a decrease in expected cash flows subsequent to acquisition. As a result, counterparty-specific and individually insignificant allowances have been recognized. |
| 4 | Carrying value does not include the effect of the FDIC loss sharing agreement. |
| 5 | Includes Chrysler Financial and an acquired credit card portfolio within the U.S. strategic cards portfolio. |
FDIC COVERED LOANS
As at July 31, 2016, the balance of FDIC covered loans was $497 million (October 31, 2015 – $601 million) and was recorded in Loans on the Interim Consolidated Balance Sheet. As at July 31, 2016, the balance of indemnification assets was $23 million (October 31, 2015 – $39 million) and was recorded in Other assets on the Interim Consolidated Balance Sheet.
| NOTE 6: TRANSFERS OF FINANCIAL ASSETS |
LOAN SECURITIZATIONS
The Bank securitizes loans through structured entity or non-structured entity third parties. Most loan securitizations do not qualify for derecognition since in certain circumstances the Bank continues to be exposed to substantially all of the prepayment, interest rate, and/or credit risk associated with the securitized financial assets and has not transferred substantially all of the risk and rewards of ownership of the securitized assets. Where loans do not qualify for derecognition, they are not derecognized from the balance sheet, retained interests are not recognized, and a securitization liability is recognized for the cash proceeds received. Certain transaction costs incurred are also capitalized and amortized using the EIRM.
The Bank securitizes insured residential mortgages under the National Housing Act Mortgage-Backed Securities (NHA MBS) program sponsored by the Canada Mortgage and Housing Corporation (CMHC). The MBS that are created through the NHA MBS program are sold to the Canada Housing Trust (CHT) as part of the Canada Mortgage Bonds (CMB) program, sold to third-party investors, or are held by the Bank. The CHT issues CMB to third-party investors and uses resulting proceeds to purchase NHA MBS from the Bank and other mortgage issuers in the Canadian market. Assets purchased by the CHT are comingled in a single trust from which CMB are issued. The Bank continues to be exposed to substantially all of the risks of the underlying mortgages, through the retention of a seller swap which transfers principal and interest payment risk on the NHA MBS back to the Bank in return for coupon paid on the CMB issuance and as such, the sales do not qualify for derecognition.
The Bank securitizes U.S. originated and purchased residential mortgages with U.S. government agencies which qualify for derecognition from the Bank's Interim Consolidated Balance Sheet. As part of the securitization, the Bank retains the right to service the transferred mortgage loans. The MBS that are created through the securitization are typically sold to third-party investors.
The Bank also securitizes personal loans and business and government loans to entities which may be structured entities. These securitizations may give rise to derecognition of the financial assets depending on the individual arrangement of each transaction.
| TD BANK GROUP • THIRD QUARTER 2016 • REPORT TO SHAREHOLDERS | Page 65 |
In addition, through structured entities that the Bank consolidates, the Bank transfers credit card receivables, consumer instalment and other personal loans. Refer to Note 7 for further details.
The following table summarizes the securitized asset types that did not qualify for derecognition, along with their associated securitization liabilities.
| Financial Assets Not Qualifying for Derecognition Treatment as Part of the Bank's Securitization Programs | |||||||||
| (millions of Canadian dollars) | As at | ||||||||
| July 31, 2016 | October 31, 2015 | ||||||||
| Fair | Carrying | Fair | Carrying | ||||||
| value | amount | value | amount | ||||||
| Nature of transaction | |||||||||
| Securitization of residential mortgage loans | $ | 27,830 | $ | 27,635 | $ | 30,355 | $ | 30,211 | |
| Other financial assets transferred related to securitization1 | 2,926 | 2,926 | 3,173 | 3,170 | |||||
| Total | 30,756 | 30,561 | 33,528 | 33,381 | |||||
| Associated liabilities2 | $ | (31,916) | $ | (31,458) | $ | (34,142) | $ | (33,729) | |
| 1 | Includes asset-backed securities, asset-backed commercial paper, cash, repurchase agreements, and Government of Canada securities used to fulfill funding requirements of the Bank's securitization structures after the initial securitization of mortgage loans. |
| 2 | Includes securitization liabilities carried at amortized cost of $19 billion as at July 31, 2016 (October 31, 2015 – $23 billion), and securitization liabilities carried at fair value of $12 billion as at July 31, 2016 (October 31, 2015 – $11 billion). |
Other Financial Assets Not Qualifying for Derecognition
The Bank enters into certain transactions where it transfers previously recognized commodities and financial assets, such as, debt and equity securities, but retains substantially all of the risks and rewards of those assets. These transferred assets are not derecognized and the transfers are accounted for as financing transactions. The most common transactions of this nature are repurchase agreements and securities lending agreements, in which the Bank retains substantially all of the associated credit, price, interest rate, and foreign exchange risks and rewards associated with the assets.
The following table summarizes the carrying amount of financial assets and the associated transactions that did not qualify for derecognition, as well as their associated financial liabilities.
| Other Financial Assets Not Qualifying for Derecognition | |||||
| (millions of Canadian dollars) | As at | ||||
| July 31 | October 31 | ||||
| 2016 | 2015 | ||||
| Carrying amount of assets | |||||
| Nature of transaction | |||||
| Repurchase agreements1,2 | $ | 25,139 | $ | 24,007 | |
| Securities lending agreements | 17,836 | 13,967 | |||
| Total | 42,975 | 37,974 | |||
| Carrying amount of associated liabilities2 | $ | 24,975 | $ | 23,954 | |
| 1 | Includes $5.1 billion of assets related to precious metals repurchase agreements as at July 31, 2016 (October 31, 2015 – $4.9 billion). |
| 2 | Associated liabilities are all related to repurchase agreements. |
TRANSFERS OF FINANCIAL ASSETS QUALIFYING FOR DERECOGNITION
Transferred financial assets that are derecognized in their entirety where the Bank has a continuing involvement
Continuing involvement may arise if the Bank retains any contractual rights or obligations subsequent to the transfer of financial assets. Certain business and government loans securitized by the Bank are derecognized from the Bank's Interim Consolidated Balance Sheet. In instances where the Bank fully derecognizes business and government loans, the Bank may be exposed to the risks of transferred loans through a retained interest. As at July 31, 2016, the fair value of retained interests was $33 million (October 31, 2015 – $38 million). There are no expected credit losses on the retained interests of the securitized business and government loans as the underlying mortgages are all government insured. A gain or loss on sale of the loans is recognized immediately in other income after considering the effect of hedge accounting on the assets sold, if applicable. The amount of the gain or loss recognized depends on the previous carrying values of the loans involved in the transfer, allocated between the assets sold and the retained interests based on their relative fair values at the date of transfer. For the three and nine months ended July 31, 2016, the trading income recognized on the retained interest was nil and $1 million, respectively (three and nine months ended July 31, 2015 – $1 million and $3 million, respectively).
Certain portfolios of U.S. residential mortgages originated by the Bank are sold and derecognized from the Bank's Interim Consolidated Balance Sheet. In certain instances, the Bank has a continuing involvement to service those loans. As at July 31, 2016, the carrying value of these servicing rights was $23 million (October 31, 2015 – $20 million) and the fair value was $27 million (October 31, 2015 – $26 million). A gain or loss on sale of the loans is recognized immediately in other income. The gain (loss) on sale of the loans for the three and nine months ended July 31, 2016, was $6 million and $15 million, respectively (both three and nine months ended July 31, 2015 – $6 million).
| TD BANK GROUP • THIRD QUARTER 2016 • REPORT TO SHAREHOLDERS | Page 66 |
| NOTE 7: STRUCTURED ENTITIES |
A structured entity is typically created to accomplish a narrow, well-defined objective and may take the form of a corporation, trust, partnership, or unincorporated entity. The Bank uses structured entities for a variety of purposes including: (1) to facilitate the transfer of specified risks to clients; (2) as financing vehicles for itself or for clients; or (3) to segregate assets on behalf of investors. The Bank is typically restricted from accessing the assets of the structured entity under the relevant arrangements.
Legal restrictions often impose limits on the decision-making power that the entity's governing board, trustee, or management have over the economic activities of the entity. Control over structured entities is not typically determined on the basis of voting rights as any such voting rights may not confer substantive power over the key economic activities of the entity. As a result, structured entities are consolidated when the substance of the relationship between the Bank and the entity indicates that the entity is controlled by the Bank, in accordance with the Bank's accounting policy.
The Bank is involved with structured entities that it sponsors as well as entities sponsored by third-parties. Sponsorship of a structured entity may indicate that the Bank had power over the entity at inception; however, this is not sufficient to determine if the Bank consolidates the entity. Regardless of whether or not the Bank sponsors an entity, consolidation is determined on a case-by-case basis.
As disclosed in Note 18, the TD Mortgage Fund (the "Fund") was discontinued and merged with another mutual fund managed by the Bank on April 22, 2016. Other than the discontinuation of the Fund, the Bank's involvement with key sponsored structured entities and third-party structured entities has not changed from that described in the Bank's 2015 Annual Report. Refer to Note 10 of the Bank's 2015 Annual Consolidated Financial Statements for further discussion.
| NOTE 8: INVESTMENT IN TD AMERITRADE HOLDING CORPORATION |
The Bank has significant influence over TD Ameritrade Holding Corporation (TD Ameritrade) and accounts for its investment in TD Ameritrade using the equity method. The Bank's equity share in TD Ameritrade's earnings, excluding dividends, is reported on a one-month lag basis. The Bank takes into account changes in the subsequent period that would significantly affect the results.
As at July 31, 2016, the Bank's reported investment in TD Ameritrade was 42.35% (October 31, 2015 – 41.54%) of the outstanding shares of TD Ameritrade with a fair value of $9 billion (US$7 billion) (October 31, 2015 – $10 billion (US$8 billion)) based on the closing price of US$30.36 (October 31, 2015 – US$34.47) on the New York Stock Exchange.
During the nine months ended July 31, 2016, TD Ameritrade repurchased 11.6 million shares (for the year ended October 31, 2015 – 8.4 million shares). Pursuant to the Stockholders Agreement in relation to the Bank's equity investment in TD Ameritrade, if stock repurchases by TD Ameritrade cause the Bank's ownership percentage to exceed 45%, the Bank is required to use reasonable efforts to sell or dispose of such excess stock, subject to the Bank's commercial judgment as to the optimal timing, amount, and method of sales with a view to maximizing proceeds from such sales. However, in the event that stock repurchases by TD Ameritrade cause the Bank's ownership percentage to exceed 45%, the Bank has no absolute obligation to reduce its ownership percentage to 45%. In addition, stock repurchases by TD Ameritrade cannot result in the Bank's ownership percentage exceeding 47%.
Pursuant to the Stockholders Agreement in relation to the Bank's equity investment in TD Ameritrade, the Bank has the right to designate five of twelve members of TD Ameritrade's Board of Directors. The Bank temporarily waived its right to designate one of its five directors to accommodate the appointment of a TD Ameritrade nominated director. This waiver is expected to expire by October 1, 2016. The Bank's designated directors include the Bank's Group President and Chief Executive Officer and three independent directors of TD.
TD Ameritrade has no significant contingent liabilities to which the Bank is exposed. During the nine months ended July 31, 2016, and July 31, 2015, TD Ameritrade did not experience any significant restrictions to transfer funds in the form of cash dividends, or repayment of loans or advances.
The condensed financial statements of TD Ameritrade, based on its consolidated financial statements, are included in the following tables.
| CONDENSED CONSOLIDATED BALANCE SHEETS1 | |||||||
| (millions of Canadian dollars) | As at | ||||||
| June 30 | September 30 | ||||||
| 2016 | 2015 | ||||||
| Assets | |||||||
| Receivables from brokers, dealers, and clearing organizations | $ | 1,688 | $ | 1,127 | |||
| Receivables from clients, net | 15,879 | 16,697 | |||||
| Other assets, net | 17,824 | 16,661 | |||||
| Total assets | $ | 35,391 | $ | 34,485 | |||
| Liabilities | |||||||
| Payable to brokers, dealers, and clearing organizations | $ | 2,522 | $ | 3,539 | |||
| Payable to clients | 22,853 | 20,966 | |||||
| Other liabilities | 3,525 | 3,570 | |||||
| Total liabilities | 28,900 | 28,075 | |||||
| Stockholders' equity2 | 6,491 | 6,410 | |||||
| Total liabilities and stockholders' equity | $ | 35,391 | $ | 34,485 | |||
| 1 | Customers' securities are reported on a settlement date basis whereas the Bank reports customers' securities on a trade date basis. |
| 2 | The difference between the carrying value of the Bank's investment in TD Ameritrade and the Bank's share of TD Ameritrade's stockholders' equity is comprised of goodwill, other intangibles, and the cumulative translation adjustment. |
| TD BANK GROUP • THIRD QUARTER 2016 • REPORT TO SHAREHOLDERS | Page 67 |
| CONDENSED CONSOLIDATED STATEMENTS OF INCOME | |||||||||||
| (millions of Canadian dollars, except as noted) | For the three months ended | For the nine months ended | |||||||||
| June 30 | June 30 | June 30 | June 30 | ||||||||
| 2016 | 2015 | 2016 | 2015 | ||||||||
| Revenues | |||||||||||
| Net interest revenue | $ | 184 | $ | 192 | $ | 592 | $ | 560 | |||
| Fee-based and other revenue | 896 | 784 | 2,736 | 2,343 | |||||||
| Total revenues | 1,080 | 976 | 3,328 | 2,903 | |||||||
| Operating expenses | |||||||||||
| Employee compensation and benefits | 269 | 248 | 823 | 732 | |||||||
| Other | 363 | 329 | 1,127 | 1,013 | |||||||
| Total operating expenses | 632 | 577 | 1,950 | 1,745 | |||||||
| Other expense (income) | 18 | 7 | 52 | 29 | |||||||
| Pre-tax income | 430 | 392 | 1,326 | 1,129 | |||||||
| Provision for income taxes | 121 | 150 | 452 | 412 | |||||||
| Net income1 | $ | 309 | $ | 242 | $ | 874 | $ | 717 | |||
| Earnings per share – basic (dollars) | $ | 0.58 | $ | 0.44 | $ | 1.64 | $ | 1.32 | |||
| Earnings per share – diluted (dollars) | 0.58 | 0.44 | 1.63 | 1.31 | |||||||
| 1 | The Bank's equity share of net income of TD Ameritrade is subject to adjustments relating to amortization of intangibles, which are not included. |
| NOTE 9: GOODWILL AND OTHER INTANGIBLES |
| Goodwill by Segment | |||||||||
| (millions of Canadian dollars) | Canadian | Wholesale | |||||||
| Retail | U.S. Retail | Banking | Total | ||||||
| Carrying amount of goodwill as at November 1, 2014 | $ | 2,249 | $ | 11,834 | $ | 150 | $ | 14,233 | |
| Foreign currency translation adjustments and other | 120 | 1,984 | – | 2,104 | |||||
| Carrying amount of goodwill as at October 31, 2015 | 2,369 | 13,818 | 150 | 16,337 | |||||
| Carrying amount of goodwill as at November 1, 2015 | 2,369 | 13,818 | 150 | 16,337 | |||||
| Foreign currency translation adjustments and other | (55) | (20) | – | (75) | |||||
| Carrying amount of goodwill as at July 31, 2016 | $ | 2,314 | $ | 13,798 | $ | 150 | $ | 16,262 | |
In the second quarter of 2016, the Bank recorded impairment losses of $98.9 million on goodwill, which is reflected in the Canadian Retail segment within the table above, and certain intangibles relating to a business that has been experiencing continued losses. This impairment is reported in the Corporate segment as Other Non-interest expenses.
| NOTE 10: OTHER ASSETS | |||||
| Other Assets | |||||
| (millions of Canadian dollars) | As at | ||||
| July 31 | October 31 | ||||
| 2016 | 2015 | ||||
| Accounts receivable and other items | $ | 8,084 | $ | 7,810 | |
| Accrued interest | 1,568 | 1,563 | |||
| Cheques and other items in transit | – | 216 | |||
| Current income tax receivable | 242 | 1,245 | |||
| Defined benefit asset | 12 | 104 | |||
| Insurance-related assets, excluding investments | 1,871 | 1,441 | |||
| Prepaid expenses | 940 | 869 | |||
| Total | $ | 12,717 | $ | 13,248 | |
| NOTE 11: DEPOSITS |
Demand deposits are those for which the Bank does not have the right to require notice prior to withdrawal. These deposits are in general chequing accounts.
Notice deposits are those for which the Bank can legally require notice prior to withdrawal. These deposits are in general savings accounts.
Term deposits are those payable on a fixed date of maturity purchased by customers to earn interest over a fixed period. The terms are from one day to ten years. Accrued interest on deposits, calculated using the EIRM, is included in Other liabilities on the Interim Consolidated Balance Sheet. The deposits are generally term deposits, guaranteed investment certificates, senior debt, and similar instruments. The aggregate amount of term deposits in denominations of $100,000 or more as at July 31, 2016, was $237 billion (October 31, 2015 – $213 billion).
Certain deposit liabilities are classified as Trading deposits on the Interim Consolidated Balance Sheet and accounted for at fair value with the change in fair value recognized on the Interim Consolidated Statement of Income.
| TD BANK GROUP • THIRD QUARTER 2016 • REPORT TO SHAREHOLDERS | Page 68 |
| Deposits | ||||||||||||||||||||
| (millions of Canadian dollars) | As at | |||||||||||||||||||
| July 31 | October 31 | |||||||||||||||||||
| By Type | By Country | 2016 | 2015 | |||||||||||||||||
| Demand | Notice | Term | Canada | United States | International | Total | Total | |||||||||||||
| Personal | $ | 14,557 | $ | 357,894 | $ | 50,203 | $ | 199,681 | $ | 221,300 | $ | 1,673 | $ | 422,654 | $ | 395,818 | ||||
| Banks1 | 10,294 | 37 | 8,628 | 13,248 | 1,085 | 4,626 | 18,959 | 17,080 | ||||||||||||
| Business and government2 | 68,669 | 106,722 | 140,908 | 223,866 | 88,058 | 4,375 | 316,299 | 282,678 | ||||||||||||
| Designated at fair value | ||||||||||||||||||||
| through profit or loss3 | – | – | 400 | 400 | – | – | 400 | 1,402 | ||||||||||||
| Trading1 | – | – | 73,084 | 6,645 | 42,992 | 23,447 | 73,084 | 74,759 | ||||||||||||
| Total | $ | 93,520 | $ | 464,653 | $ | 273,223 | $ | 443,840 | $ | 353,435 | $ | 34,121 | $ | 831,396 | $ | 771,737 | ||||
| Non-interest-bearing deposits | ||||||||||||||||||||
| included above | ||||||||||||||||||||
| In domestic offices | $ | 33,699 | $ | 27,661 | ||||||||||||||||
| In foreign offices | 49,799 | 47,485 | ||||||||||||||||||
| Interest-bearing deposits | ||||||||||||||||||||
| included above | ||||||||||||||||||||
| In domestic offices | 410,141 | 369,622 | ||||||||||||||||||
| In foreign offices | 337,737 | 326,885 | ||||||||||||||||||
| U.S. federal funds deposited1 | 20 | 84 | ||||||||||||||||||
| Total2,4 | $ | 831,396 | $ | 771,737 | ||||||||||||||||
| 1 | Includes deposits and advances with the Federal Home Loan Bank. |
| 2 | As at July 31, 2016, includes $33 billion in Deposits on the Interim Consolidated Balance Sheet relating to covered bondholders (October 31, 2015 – $24 billion) and $2 billion (October 31, 2015 – $2 billion) due to TD Capital Trust lV. |
| 3 | Included in Other financial liabilities designated at fair value through profit or loss on the Interim Consolidated Balance Sheet. |
| 4 | As at July 31, 2016, includes deposits of $458 billion (October 31, 2015 – $438 billion) denominated in U.S. dollars and $48 billion (October 31, 2015 – $36 billion) denominated in other foreign currencies. |
| NOTE 12: OTHER LIABILITIES |
| Other Liabilities | |||||
| (millions of Canadian dollars) | As at | ||||
| July 31 | October 31 | ||||
| 2016 | 2015 | ||||
| Accounts payable, accrued expenses, and other items | $ | 5,319 | $ | 3,901 | |
| Accrued interest | 884 | 882 | |||
| Accrued salaries and employee benefits | 2,396 | 2,601 | |||
| Cheques and other items in transit | 593 | – | |||
| Current income tax payable | 199 | 69 | |||
| Deferred tax liabilities | 335 | 323 | |||
| Defined benefit liability | 2,864 | 1,947 | |||
| Liabilities related to structured entities | 5,398 | 3,400 | |||
| Provisions | 954 | 1,100 | |||
| Total | $ | 18,942 | $ | 14,223 | |
| NOTE 13: SUBORDINATED NOTES AND DEBENTURES |
Issues and Redemptions
Issues
On March 4, 2016, the Bank issued $1.25 billion of medium term notes (non-viability contingent capital (NVCC)) constituting subordinated indebtedness of the Bank (the "Notes"). The Notes will bear interest at a fixed rate of 4.859% per annum (paid semi-annually) until March 4, 2026, and at the three-month bankers' acceptance rate plus 3.49% thereafter (paid quarterly) until maturity on March 4, 2031. With the prior approval of OSFI, the Bank may, at its option, redeem the Notes on or after March 4, 2026, in whole or in part, at par plus accrued and unpaid interest. Not more than 60 nor less than 30 days' notice is required to be given to the Notes' holders for such redemptions. The Notes qualify as Tier 2 Capital of the Bank.
Redemptions
On November 2, 2015 (the "Redemption Date"), the Bank redeemed all of its outstanding $1 billion 3.367% subordinated debentures due November 2, 2020, at a redemption price of 100% of the principal amount. Interest on the debentures ceased to accrue on and after the Redemption Date.
| TD BANK GROUP • THIRD QUARTER 2016 • REPORT TO SHAREHOLDERS | Page 69 |
| NOTE 14: SHARE CAPITAL |
The following table summarizes the shares issued and outstanding and treasury shares held as at July 31, 2016, and October 31, 2015.
| Common and Preferred Shares Issued and Outstanding and Treasury Shares Held | ||||||||
| (millions of shares and millions of Canadian dollars) | July 31, 2016 | October 31, 2015 | ||||||
| Number | Number | |||||||
| of shares | Amount | of shares | Amount | |||||
| Common Shares | ||||||||
| Balance as at beginning of year | 1,856.2 | $ | 20,294 | 1,846.2 | $ | 19,811 | ||
| Proceeds from shares issued on exercise of stock options | 4.2 | 156 | 3.3 | 128 | ||||
| Shares issued as a result of dividend reinvestment plan | 4.6 | 251 | 6.7 | 355 | ||||
| Purchase of shares for cancellation | (9.5) | (104) | – | – | ||||
| Balance as at end of period – common shares | 1,855.5 | $ | 20,597 | 1,856.2 | $ | 20,294 | ||
| Preferred Shares – Class A | ||||||||
| Series S | 5.4 | $ | 135 | 5.4 | $ | 135 | ||
| Series T | 4.6 | 115 | 4.6 | 115 | ||||
| Series Y | 5.5 | 137 | 5.5 | 137 | ||||
| Series Z | 4.5 | 113 | 4.5 | 113 | ||||
| Series 11 | 20.0 | 500 | 20.0 | 500 | ||||
| Series 31 | 20.0 | 500 | 20.0 | 500 | ||||
| Series 51 | 20.0 | 500 | 20.0 | 500 | ||||
| Series 71 | 14.0 | 350 | 14.0 | 350 | ||||
| Series 91 | 8.0 | 200 | 8.0 | 200 | ||||
| Series 111 | 6.0 | 150 | 6.0 | 150 | ||||
| Series 121,2 | 28.0 | 700 | – | – | ||||
| Balance as at end of period – preferred shares | 136.0 | $ | 3,400 | 108.0 | $ | 2,700 | ||
| Treasury shares – common3 | ||||||||
| Balance as at beginning of year | 1.1 | $ | (49) | 1.6 | $ | (54) | ||
| Purchase of shares | 81.4 | (4,408) | 98.2 | (5,269) | ||||
| Sale of shares | (81.8) | 4,415 | (98.7) | 5,274 | ||||
| Balance as at end of period – treasury shares – common | 0.7 | $ | (42) | 1.1 | $ | (49) | ||
| Treasury shares – preferred3 | ||||||||
| Balance as at beginning of year | 0.1 | $ | (3) | – | $ | (1) | ||
| Purchase of shares | 2.6 | (57) | 9.9 | (244) | ||||
| Sale of shares | (2.5) | 55 | (9.8) | 242 | ||||
| Balance as at end of period – treasury shares – preferred | 0.2 | $ | (5) | 0.1 | $ | (3) | ||
| 1 | Non-viability contingent capital (NVCC) Series 1, 3, 5, 7, 9, 11, and 12 Preferred Shares qualify as regulatory capital under OSFI's Capital Adequacy Requirements (CAR) guideline. If a NVCC conversion were to occur in accordance with the NVCC Provisions, the maximum number of common shares that could be issued based on the formula for conversion set out in the respective terms and conditions applicable to each Series of shares, assuming there are no declared and unpaid dividends on the respective Series of shares at the time of conversion, as applicable, would be 100 million, 100 million, 100 million, 70 million, 40 million, 30 million, and 140 million, respectively. |
| 2 | Issued by the Bank on January 14, 2016, with quarterly non-cumulative cash dividends on these shares, if declared, payable at a per annum rate of 5.50% for the initial period ending April 30, 2021. Thereafter, the dividend rate will reset every five years to equal the then five-year Government of Canada bond yield plus 4.66%. Holders of these shares will have the right to convert their shares into non-cumulative Floating Rate Preferred Shares, Series 13, subject to certain conditions, on April 30, 2021, and on April 30 every five years thereafter. Holders of the Series 13 Shares will be entitled to receive quarterly floating rate dividends, if declared, at a rate equal to the then average three-month Government of Canada Treasury Bills yield plus 4.66%. The Series 12 Shares are redeemable by the Bank, subject to regulatory consent, at $25 per share on April 30, 2021, and on April 30 every five years thereafter. |
| 3 | When the Bank purchases its own shares as part of its trading business, they are classified as treasury shares and the cost of these shares is recorded as a reduction in equity. |
Normal Course Issuer Bid
On December 9, 2015, the Bank announced that the Toronto Stock Exchange (TSX) and OSFI approved the Bank's normal course issuer bid (NCIB) to repurchase for cancellation up to 9.5 million of the Bank's common shares. During the quarter ended January 31, 2016, the Bank completed its share repurchase under the NCIB and repurchased 9.5 million common shares at an average price of $51.23 per share for a total amount of $487 million.
| NOTE 15: SHARE-BASED COMPENSATION |
For the three and nine months ended July 31, 2016, the net compensation expense for stock option awards was $3.2 million and $3.2 million, respectively (three and nine months ended July 31, 2015 – $4.0 million and $15.9 million, respectively).
During the three months ended July 31, 2016, and July 31, 2015, there were no options granted by the Bank. During the nine months ended July 31, 2016, 2.5 million stock options were granted by the Bank (nine months ended July 31, 2015 – 2.6 million) options were granted by the Bank with a weighted-average fair value of $4.93 per stock option (July 31, 2015 – $9.06 per stock option).
| TD BANK GROUP • THIRD QUARTER 2016 • REPORT TO SHAREHOLDERS | Page 70 |
The following table summarizes the assumptions used for estimating the fair value of options for the nine months ended July 31.
| Assumptions Used for Estimating the Fair Value of Options | ||||||
| (in Canadian dollars, except as noted) | For the nine months ended | |||||
| July 31 | July 31 | |||||
| 2016 | 2015 | |||||
| Risk-free interest rate | 1.00 | % | 1.44 | % | ||
| Expected option life (years) | 6.3 years | 6.3 years | ||||
| Expected volatility1 | 15.82 | % | 25.06 | % | ||
| Expected dividend yield | 3.45 | % | 3.65 | % | ||
| Exercise price/share price | $ | 53.15 | $ | 52.46 | ||
| 1 | Expected volatility is calculated based on the average daily volatility measured over a historical period corresponding to the expected option life. |
| NOTE 16: EMPLOYEE BENEFITS |
The following table summarizes expenses for the Bank's principal pension and non-pension post-retirement benefit plans and the Bank's significant other pension and retirement plans, for the three and nine months ended July 31.
| Employee Benefit Plans' Expenses | ||||||||||||||
| (millions of Canadian dollars) | Principal non-pension | |||||||||||||
| post-retirement | Other pension and | |||||||||||||
| Principal pension plans | benefit plan | retirement plans1 | ||||||||||||
| For the three months ended | ||||||||||||||
| July 31 | July 31 | July 31 | July 31 | July 31 | July 31 | |||||||||
| 2016 | 2015 | 2016 | 2015 | 2016 | 2015 | |||||||||
| Net employee benefits expense | ||||||||||||||
| Service cost – benefits earned | $ | 83 | $ | 89 | $ | 4 | $ | 5 | $ | 3 | $ | 3 | ||
| Net interest cost (income) on net defined benefit liability (asset) | (2) | 4 | 6 | 5 | 8 | 9 | ||||||||
| Defined benefit administrative expenses | 3 | 3 | – | – | 2 | 2 | ||||||||
| Past service cost – settlement (gains) losses | – | – | – | – | – | – | ||||||||
| Total expense | $ | 84 | $ | 96 | $ | 10 | $ | 10 | $ | 13 | $ | 14 | ||
| For the nine months ended | ||||||||||||||
| July 31 | July 31 | July 31 | July 31 | July 31 | July 31 | |||||||||
| 2016 | 2015 | 2016 | 2015 | 2016 | 2015 | |||||||||
| Net employee benefits expense | ||||||||||||||
| Service cost – benefits earned | $ | 249 | $ | 269 | $ | 13 | $ | 15 | $ | 8 | $ | 10 | ||
| Net interest cost (income) on net defined benefit liability (asset) | (4) | 11 | 16 | 17 | 24 | 27 | ||||||||
| Defined benefit administrative expenses | 7 | 6 | – | – | 5 | 6 | ||||||||
| Past service cost – settlement (gains) losses2 | – | – | – | – | (12) | (35) | ||||||||
| Total expense | $ | 252 | $ | 286 | $ | 29 | $ | 32 | $ | 25 | $ | 8 | ||
| 1 | Includes CT defined benefit pension plan, TD Banknorth defined benefit pension plan, certain TD Auto Finance retirement plans, and supplemental employee retirement plans. Other employee benefit plans operated by the Bank and certain of its subsidiaries are not considered material for disclosure purposes. The TD Banknorth defined benefit pension plan was frozen as of December 31, 2008, and no service credits can be earned after that date. Certain TD Auto Finance defined benefit pension plans were frozen as of April 1, 2012, and no service credits can be earned after March 31, 2012. |
| 2 | Includes a portion of certain defined benefit pension plans that were settled during the period. |
CASH FLOWS
The following table summarizes the Bank's contributions to its principal pension and non-pension post-retirement benefit plans and the Bank's significant other pension and retirement plans during the three and nine months ended July 31.
| Plan Contributions | ||||||||||
| (millions of Canadian dollars) | For the three months ended | For the nine months ended | ||||||||
| July 31 | July 31 | July 31 | July 31 | |||||||
| 2016 | 2015 | 2016 | 2015 | |||||||
| Principal pension plans | $ | 125 | $ | 111 | $ | 287 | $ | 260 | ||
| Principal non-pension post-retirement benefit plan | 4 | 3 | 11 | 10 | ||||||
| Other pension and retirement plans1 | 7 | 76 | 30 | 94 | ||||||
| Total | $ | 136 | $ | 190 | $ | 328 | $ | 364 | ||
| 1 | Includes CT defined benefit pension plan, TD Banknorth defined benefit pension plan, certain TD Auto Finance retirement plans, and supplemental employee retirement plans. Other employee benefit plans operated by the Bank and certain of its subsidiaries are not considered material for disclosure purposes. |
As at July 31, 2016, the Bank expects to contribute an additional $133 million to its principal pension plans, $5 million to its principal non-pension post-retirement benefit plan, and $72 million to its other pension and retirement plans by the end of the fiscal year. However, future contribution amounts may change upon the Bank's review of current contribution levels during fiscal 2016.
| TD BANK GROUP • THIRD QUARTER 2016 • REPORT TO SHAREHOLDERS | Page 71 |
| NOTE 17: EARNINGS PER SHARE |
Basic earnings per share is calculated by dividing net income attributable to common shareholders by the weighted-average number of common shares outstanding for the period.
Diluted earnings per share is calculated using the same method as basic earnings per share except that certain adjustments are made to net income attributable to common shareholders and the weighted-average number of shares outstanding for the effects of all dilutive potential common shares that are assumed to be issued by the Bank.
The following table presents the Bank's basic and diluted earnings per share for the three and nine months ended July 31, 2016, and July 31, 2015, and the twelve months ended October 31, 2015.
| Basic and Diluted Earnings Per Share | ||||||||||||
| (millions of Canadian dollars, except as noted) | For the three | For the nine | For the twelve | |||||||||
| months ended | months ended | months ended | ||||||||||
| July 31 | July 31 | July 31 | July 31 | October 31 | ||||||||
| 2016 | 2015 | 2016 | 2015 | 2015 | ||||||||
| Basic earnings per share | ||||||||||||
| Net income attributable to common shareholders | $ | 2,293 | $ | 2,213 | $ | 6,449 | $ | 6,029 | $ | 7,813 | ||
| Weighted-average number of common shares outstanding (millions) | 1,853.4 | 1,851.1 | 1,852.8 | 1,847.9 | 1,849.2 | |||||||
| Basic earnings per share (dollars) | $ | 1.24 | $ | 1.20 | $ | 3.48 | $ | 3.26 | $ | 4.22 | ||
| Diluted earnings per share | ||||||||||||
| Net income attributable to common shareholders | $ | 2,293 | $ | 2,213 | $ | 6,449 | $ | 6,029 | $ | 7,813 | ||
| Net income available to common shareholders including | ||||||||||||
| impact of dilutive securities | 2,293 | 2,213 | 6,449 | 6,029 | 7,813 | |||||||
| Weighted-average number of common shares outstanding (millions) | 1,853.4 | 1,851.1 | 1,852.8 | 1,847.9 | 1,849.2 | |||||||
| Effect of dilutive securities | ||||||||||||
| Stock options potentially exercisable (millions)1 | 3.2 | 4.6 | 3.3 | 5.1 | 4.9 | |||||||
| Weighted-average number of common shares outstanding | ||||||||||||
| – diluted (millions) | 1,856.6 | 1,855.7 | 1,856.1 | 1,853.0 | 1,854.1 | |||||||
| Diluted earnings per share (dollars)1 | $ | 1.24 | $ | 1.19 | $ | 3.47 | $ | 3.25 | $ | 4.21 | ||
| 1 | For the three and nine months ended July 31, 2016, and July 31, 2015, and the twelve months ended October 31, 2015, the computation of diluted earnings per share did not include any weighted-average options where the option price was greater than the average market price of the Bank's common shares. |
| NOTE 18: PROVISIONS, CONTINGENT LIABILITIES, PLEDGED ASSETS, AND COLLATERAL |
PROVISIONS
The following table summarizes the Bank's provisions.
| Provisions | ||||||||
| (millions of Canadian dollars) | ||||||||
| Litigation and | ||||||||
| Restructuring1 | Other | Total | ||||||
| Balance as at November 1, 2015 | $ | 486 | $ | 301 | $ | 787 | ||
| Additions | 4 | 122 | 126 | |||||
| Amounts used | (257) | (90) | (347) | |||||
| Release of unused amounts | (23) | (47) | (70) | |||||
| Foreign currency translation adjustments and other | 3 | (2) | 1 | |||||
| Balance as at July 31, 2016, before allowance for | ||||||||
| credit losses for off-balance sheet instruments | $ | 213 | $ | 284 | $ | 497 | ||
| Add: allowance for credit losses for off-balance sheet instruments2 | 457 | |||||||
| Balance as at July 31, 2016 | $ | 954 | ||||||
| 1 | Includes provisions for onerous lease contracts. |
| 2 | Refer to Note 5 for further details. |
LITIGATION AND OTHER
Litigation and other primarily include provisions relating to legal reserves. In the ordinary course of business, the Bank and its subsidiaries are involved in various legal and regulatory actions, including class actions and other litigation or disputes with third parties. Legal provisions are established when it becomes probable that the Bank will incur an expense and the amount can be reliably estimated, although it is possible the Bank may incur additional losses and actual losses may vary significantly from the current estimate. The Bank believes the estimate of the aggregate range of reasonably possible losses (that is, those which are neither probable nor remote), in excess of provisions, for its legal proceedings where it is possible to make such an estimate, is from zero to approximately $460 million as at July 31, 2016. This represents the Bank's best estimate based upon currently available information for actions for which an estimate can be made. Actions for which the Bank cannot currently make an estimate, such as those which are in a preliminary stage or for which no specific amount is claimed, have not been included. The Bank's estimate involves significant judgment, given the varying stages of the proceedings, the existence of multiple defendants in many of such proceedings whose share of liability has yet to be determined and the fact that the underlying matters will change from time to time.
| TD BANK GROUP • THIRD QUARTER 2016 • REPORT TO SHAREHOLDERS | Page 72 |
In management's opinion, based on its current knowledge and after consultation with counsel, the ultimate disposition of these actions, individually or in the aggregate, will not have a material adverse effect on the consolidated financial condition or the consolidated cash flows of the Bank. However, there are a number of uncertainties involved in such proceedings, some of which are beyond the Bank's control, including, for example, the risk that the requisite external approvals of a particular settlement may not be granted. As such, there is a possibility that the ultimate resolution of those legal or regulatory actions may be material to the Bank's consolidated results of operations for any particular reporting period.
Other than as described below, there have been no material developments in the matters identified in Note 28 of the 2015 Annual Consolidated Financial Statements, and no new material litigation matters have arisen since the issuance of the 2015 Annual Consolidated Financial Statements.
Stanford Litigation ─ On April 22, 2016, the Bank filed a motion to reconsider the court's April 2015 dismissal decision with respect to certain claims by the Official Stanford Investors Committee ("OSIC") under the Texas Uniform Fraudulent Transfer Act based on an intervening change in the law announced by the Texas Supreme Court on April 1, 2016. On July 28, 2016, the court issued a decision denying defendants’ motions to dismiss the class plaintiffs’ complaint and to reconsider with respect to the OSIC’s complaint.
Overdraft Litigation ─ All eleven of the actions have been consolidated for pretrial proceedings as MDL 2613 in the United States District Court for the District of South Carolina. The plaintiffs filed a consolidated amended class action complaint on June 19, 2015, which governs all of the consolidated cases other than the Mingrone action. The Mingrone class action complaint was dismissed without prejudice on July 21, 2015. The Toronto-Dominion Bank was not named as a defendant in the consolidated amended class action complaint. On December 10, 2015, the court granted in part and denied in part TD Bank, N.A.'s motion to dismiss. Discovery is ongoing.
Interchange Fee ─ While both the plaintiffs and defendants succeeded in part on their respective appeals, the class period for the plaintiffs' key claims has been shortened significantly.
PLEDGED ASSETS AND COLLATERAL
In the ordinary course of business, securities and other assets are pledged against liabilities or contingent liabilities, including repurchase agreements, securitization liabilities, covered bonds, obligations related to securities sold short, and securities borrowing transactions. Assets are also deposited for the purposes of participation in clearing and payment systems and depositories or to have access to the facilities of central banks in foreign jurisdictions, or as security for contract settlements with derivative exchanges or other derivative counterparties.
Details of assets pledged against liabilities and collateral assets held or repledged are shown in the following table:
| (millions of Canadian dollars) | As at | |||||
| July 31 | October 31 | |||||
| 2016 | 2015 | |||||
| Sources of pledged assets and collateral | ||||||
| Bank assets | ||||||
| Cash and due from banks | $ | 45 | $ | – | ||
| Interest-bearing deposits with banks | 6,732 | 5,862 | ||||
| Loans | 79,982 | 69,585 | ||||
| Securities | 77,781 | 70,612 | ||||
| Other assets | 736 | – | ||||
| 165,276 | 146,059 | |||||
| Third-party assets1 | ||||||
| Collateral received and available for sale or repledging | 171,044 | 150,125 | ||||
| Less: Collateral not repledged | (64,678) | (51,678) | ||||
| 106,366 | 98,447 | |||||
| 271,642 | 244,506 | |||||
| Uses of pledged assets and collateral2 | ||||||
| Derivatives | 13,329 | 11,478 | ||||
| Obligations related to securities sold under repurchase agreements | 63,536 | 70,011 | ||||
| Securities borrowing and lending | 41,506 | 30,867 | ||||
| Obligations related to securities sold short | 43,722 | 36,303 | ||||
| Securitization | 35,125 | 36,500 | ||||
| Covered bond | 31,783 | 22,071 | ||||
| Clearing systems, payment systems, and depositories | 4,296 | 4,137 | ||||
| Foreign governments and central banks | 1,447 | 1,320 | ||||
| Other | 36,898 | 31,819 | ||||
| Total | $ | 271,642 | $ | 244,506 | ||
| 1 | Includes collateral received from reverse repurchase agreements, securities borrowing, margin loans, and other client activity. |
| 2 | Includes $37.5 billion of on-balance sheet assets that the Bank has pledged and that the counterparty can subsequently repledge as at July 31, 2016 (October 31, 2015 – $33.4 billion). |
ASSETS SOLD WITH RECOURSE
In connection with its securitization activities, the Bank typically makes customary representations and warranties about the underlying assets which may result in an obligation to repurchase the assets. These representations and warranties attest that the Bank, as the seller, has executed the sale of assets in good faith, and in compliance with relevant laws and contractual requirements. In the event that they do not meet these criteria, the loans may be required to be repurchased by the Bank.
| TD BANK GROUP • THIRD QUARTER 2016 • REPORT TO SHAREHOLDERS | Page 73 |
ASSETS SOLD WITH CONTINGENT REPURCHASE OBLIGATIONS
The Bank sells mortgage loans, which it continues to service, to the TD Mortgage Fund (the "Fund"), a mutual fund managed by the Bank. As part of its responsibilities, the Bank has an obligation to repurchase mortgage loans when they default or if the Fund experiences a liquidity event such that it does not have sufficient cash to honour unit-holder redemptions. On April 22, 2016, the Fund was discontinued and merged with another mutual fund managed by the Bank. The mortgages held by the Fund were not merged into the other mutual fund and as a result of the Fund's discontinuation, the mortgages were repurchased from the Fund at a fair value of $155 million. Prior to the discontinuation of the Fund, during the three and nine months ended July 31, 2016, the fair value of the mortgages repurchased from the Fund as a result of a liquidity event was nil and $21 million, respectively (three and nine months ended July 31, 2015 – $3 million and $6 million, respectively).
| NOTE 19: SEGMENTED INFORMATION |
For management reporting purposes, the Bank reports its results under three key business segments: Canadian Retail, which includes the results of the Canadian personal and commercial banking, wealth, and insurance businesses; U.S. Retail, which includes the results of the U.S. retail and commercial banking operations, wealth management services, and the Bank's investment in TD Ameritrade; and Wholesale Banking. The Bank's other activities are grouped into the Corporate segment.
The following table summarizes the segment results for the three and nine months ended July 31.
| Results by Business Segment1 | ||||||||||||||||||||||
| (millions of Canadian dollars, except as noted) | ||||||||||||||||||||||
| Canadian Retail | U.S. Retail | Wholesale Banking | Corporate | Total | ||||||||||||||||||
| For the three months ended | ||||||||||||||||||||||
| July 31 | July 31 | July 31 | July 31 | July 31 | July 31 | July 31 | July 31 | July 31 | July 31 | |||||||||||||
| 2016 | 2015 | 2016 | 2015 | 2016 | 2015 | 2016 | 2015 | 2016 | 2015 | |||||||||||||
| Net interest income (loss) | $ | 2,519 | $ | 2,480 | $ | 1,755 | $ | 1,527 | $ | 390 | $ | 564 | $ | 260 | $ | 126 | $ | 4,924 | $ | 4,697 | ||
| Non-interest income (loss) | 2,622 | 2,531 | 591 | 576 | 469 | 201 | 95 | 1 | 3,777 | 3,309 | ||||||||||||
| Provision for (reversal of) | ||||||||||||||||||||||
| credit losses | 258 | 237 | 168 | 153 | 11 | 2 | 119 | 45 | 556 | 437 | ||||||||||||
| Insurance claims and related | ||||||||||||||||||||||
| expenses | 692 | 600 | – | – | – | – | – | – | 692 | 600 | ||||||||||||
| Non-interest expenses | 2,133 | 2,104 | 1,372 | 1,239 | 437 | 431 | 698 | 518 | 4,640 | 4,292 | ||||||||||||
| Income (loss) before income taxes | 2,058 | 2,070 | 806 | 711 | 411 | 332 | (462) | (436) | 2,813 | 2,677 | ||||||||||||
| Provision for (recovery of) | ||||||||||||||||||||||
| income taxes | 549 | 513 | 143 | 129 | 109 | 93 | (225) | (233) | 576 | 502 | ||||||||||||
| Equity in net income of an | ||||||||||||||||||||||
| investment in TD Ameritrade | – | – | 125 | 92 | – | – | (4) | (1) | 121 | 91 | ||||||||||||
| Net income (loss) | $ | 1,509 | $ | 1,557 | $ | 788 | $ | 674 | $ | 302 | $ | 239 | $ | (241) | $ | (204) | $ | 2,358 | $ | 2,266 | ||
| For the nine months ended | ||||||||||||||||||||||
| July 31 | July 31 | July 31 | July 31 | July 31 | July 31 | July 31 | July 31 | July 31 | July 31 | |||||||||||||
| 2016 | 2015 | 2016 | 2015 | 2016 | 2015 | 2016 | 2015 | 2016 | 2015 | |||||||||||||
| Net interest income (loss) | $ | 7,428 | $ | 7,284 | $ | 5,261 | $ | 4,473 | $ | 1,289 | $ | 1,745 | $ | 873 | $ | 335 | $ | 14,851 | $ | 13,837 | ||
| Non-interest income (loss) | 7,631 | 7,404 | 1,774 | 1,606 | 1,000 | 515 | 314 | 17 | 10,719 | 9,542 | ||||||||||||
| Provision for (reversal of) | ||||||||||||||||||||||
| credit losses | 748 | 666 | 551 | 361 | 73 | 4 | 410 | 143 | 1,782 | 1,174 | ||||||||||||
| Insurance claims and related | ||||||||||||||||||||||
| expenses | 1,877 | 1,863 | – | – | – | – | – | – | 1,877 | 1,863 | ||||||||||||
| Non-interest expenses | 6,307 | 6,264 | 4,194 | 3,746 | 1,307 | 1,311 | 2,221 | 1,841 | 14,029 | 13,162 | ||||||||||||
| Income (loss) before income taxes | 6,127 | 5,895 | 2,290 | 1,972 | 909 | 945 | (1,444) | (1,632) | 7,882 | 7,180 | ||||||||||||
| Provision for (recovery of) | ||||||||||||||||||||||
| income taxes | 1,641 | 1,453 | 374 | 346 | 227 | 268 | (654) | (803) | 1,588 | 1,264 | ||||||||||||
| Equity in net income of an | ||||||||||||||||||||||
| investment in TD Ameritrade | – | – | 342 | 267 | – | – | (3) | 2 | 339 | 269 | ||||||||||||
| Net income (loss) | $ | 4,486 | $ | 4,442 | $ | 2,258 | $ | 1,893 | $ | 682 | $ | 677 | $ | (793) | $ | (827) | $ | 6,633 | $ | 6,185 | ||
| Total assets as at July 31 | ||||||||||||||||||||||
| (billions of Canadian dollars) | $ | 378.6 | $ | 352.1 | $ | 368.9 | $ | 342.2 | $ | 373.9 | $ | 354.3 | $ | 61.0 | $ | 50.6 | $ | 1,182.4 | $ | 1,099.2 | ||
| 1 | Effective the first quarter of 2016, the presentation of the U.S. strategic cards portfolio revenues, provision for credit losses, and expenses in the U.S. Retail segment includes only the Bank's agreed portion of the U.S. strategic cards portfolio, while the Corporate segment includes the retailer program partners' share. Certain comparative amounts have been recast to conform with this revised presentation. There was no impact on the net income of the segments or on the presentation of gross and net results in the Bank's Interim Consolidated Statement of Income. |
| TD BANK GROUP • THIRD QUARTER 2016 • REPORT TO SHAREHOLDERS | Page 74 |
| NOTE 20: REGULATORY CAPITAL |
The Bank manages its capital under guidelines established by OSFI. The regulatory capital guidelines measure capital in relation to credit, market, and operational risks. The Bank has various capital policies, procedures, and controls which it utilizes to achieve its goals and objectives.
During the nine months ended July 31, 2016, the Bank complied with the OSFI Basel III guideline related to capital ratios and the leverage ratio. Effective January 1, 2016, OSFI's target Common Equity Tier 1 (CET1), Tier 1, and Total Capital ratios for Canadian banks designated as D-SIBs includes a 1% common equity capital surcharge bringing the targets to 8%, 9.5%, and 11.5%, respectively.
The following table summarizes the Bank's regulatory capital positions as at July 31, 2016, and October 31, 2015.
| Regulatory Capital Position | ||||||
| (millions of Canadian dollars, except as noted) | As at | |||||
| July 31 | October 31 | |||||
| 2016 | 2015 | |||||
| Capital | ||||||
| Common Equity Tier 1 Capital | $ | 40,363 | $ | 37,958 | ||
| Tier 1 Capital | 46,427 | 43,416 | ||||
| Total Capital | 56,737 | 53,600 | ||||
| Risk-weighted assets used in the calculation of capital ratios | ||||||
| Common Equity Tier 1 Capital | $ | 388,243 | $ | 382,360 | ||
| Tier 1 Capital | 388,872 | 383,301 | ||||
| Total Capital | 389,412 | 384,108 | ||||
| Capital and leverage ratios | ||||||
| Common Equity Tier 1 Capital ratio1 | 10.4 | % | 9.9 | % | ||
| Tier 1 Capital ratio1 | 11.9 | 11.3 | ||||
| Total Capital ratio1 | 14.6 | 14.0 | ||||
| Leverage ratio | 3.8 | 3.7 | ||||
| 1 | In accordance with the final CAR guideline, the Credit Valuation Adjustment (CVA) capital charge is being phased in until the first quarter of 2019. Each capital ratio has its own risk-weighted assets (RWA) measure due to the OSFI prescribed scalar for inclusion of the CVA. The scalars for inclusion of CVA for CET1, Tier 1, and Total Capital RWA are 64%, 71%, and 77%, respectively. |
| NOTE 21: RISK MANAGEMENT |
The risk management policies and procedures of the Bank are provided in the MD&A. The shaded sections of the "Managing Risk" section of the MD&A relating to market and liquidity risks are an integral part of the Interim Consolidated Financial Statements.
| TD BANK GROUP • THIRD QUARTER 2016 • REPORT TO SHAREHOLDERS | Page 75 |
SHAREHOLDER AND INVESTOR INFORMATION
Shareholder Services
| If you: | And your inquiry relates to: | Please contact: |
| Are a registered shareholder (your name appears on your TD share certificate) | Missing dividends, lost share certificates, estate questions, address changes to the share register, dividend bank account changes, the dividend reinvestment plan, eliminating duplicate mailings of shareholder materials or stopping (and resuming) receiving annual and quarterly reports |
Transfer Agent: CST Trust Company Montréal, Québec H3B 3K3 1-800-387-0825 (Canada and U.S. only) or 416-682-3860 Facsimile: 1-888-249-6189 inquiries@canstockta.com or www.canstockta.com |
|
Hold your TD shares through the Direct Registration System in the United States |
Missing dividends, lost share certificates, estate questions, address changes to the share register, eliminating duplicate mailings of shareholder materials or stopping (and resuming) receiving annual and quarterly reports |
Co-Transfer Agent and Registrar Computershare College Station, TX 77842-3170, or
Computershare 211 Quality Circle, Suite 210 College Station, TX 77845 1-866-233-4836 TDD for hearing impaired: 1-800-231-5469 Shareholders outside of U.S.: 201-680-6578 TDD shareholders outside of U.S.: 201-680-6610 |
| Beneficially own TD shares that are held in the name of an intermediary, such as a bank, a trust company, a securities broker or other nominee | Your TD shares, including questions regarding the dividend reinvestment plan and mailings of shareholder materials | Your intermediary |
For all other shareholder inquiries,
please contact TD Shareholder Relations at 416-944-6367 or 1-866-756-8936 or email tdshinfo@td.com.
Please note that by leaving us an e-mail or voicemail message, you are providing your consent for us to forward your inquiry to
the appropriate party for response.
General Information
Contact Corporate & Public Affairs: 416-982-8578
Products and services: Contact TD Canada Trust, 24 hours a day, seven days a week: 1-866-567-8888
French: 1-866-233-2323
Cantonese/Mandarin: 1-800-328-3698
Telephone device for the hearing impaired (TTY): 1-800-361-1180
Website: www.td.com
Email: customer.service@td.com
Quarterly Earnings Conference Call
TD Bank Group will host an earnings conference call in Toronto, Ontario on August 25, 2016. The call will be audio webcast live through TD's website at 3 p.m. ET. The call and audio webcast will feature presentations by TD executives on the Bank's financial results for the third quarter, discussions of related disclosures, and will be followed by a question-and-answer period with analysts. The presentation material referenced during the call will be available on the TD website at www.td.com/investor/qr_2016.jsp on August 25, 2016, by approximately 12 p.m. ET. A listen-only telephone line is available at 416-204-9271 or 1-800-505-9568 (toll free).
The audio webcast and presentations will be archived at www.td.com/investor/qr_2016.jsp. Replay of the teleconference will be available from 6 p.m. ET on August 25, 2016, until 6 p.m. ET on September 30, 2016, by calling 647-436-0148 or 1-888-203-1112 (toll free). The passcode is 9997574.
Annual Meeting
Thursday, March 30, 2017
Design Exchange
Toronto, Ontario
| TD BANK GROUP • THIRD QUARTER 2016 • REPORT TO SHAREHOLDERS | Page 76 |