
Exhibit 13.1
CIVISTA BANCSHARES, INC 2020 Annual report
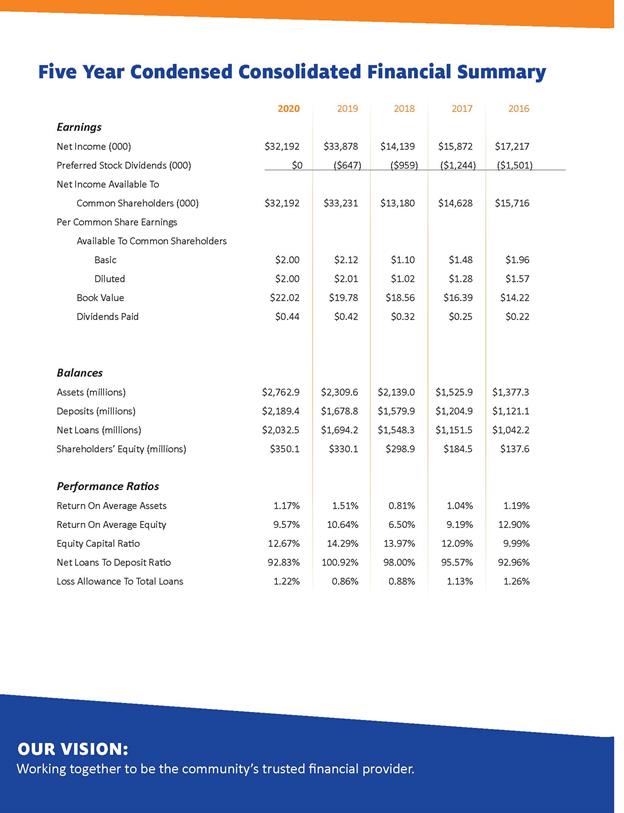
Five Year Condensed Consolidated Financial Summary 2020 2019 2018 2017 2016 $32,192 $33,878 $14,139 $15,872 $17,217 $0 ($647) ($959) ($1,244) ($1,501) $32,192 $33,231 $13,180 $14,628 $15,716 $2.00 $2.00 $22.02 $0.44 Net Income (000) Preferred Stock Dividends (000) Net Income Available To Common Shareholders (000) Per Common Share Earnings Available To Common Shareholders Basic Diluted Book Value Dividends Paid $2,762.9 $2,189.4 $2,032.5 $350.1 1.17% 9.57% 12.67% 92.83% 1.22% $2.12 $2.01 $19.78 $0.42 $2,309.6 $1,678.8 $1,694.2 $330.1 1.51% 10.64% 14.29% 100.92% 0.86% $1.10 $1.02 $18.56 $0.32 Balances Assets (millions) Deposits (millions) Net Loans (millions) Shareholders’ Equity (millions) Performance Ratios Return On Average Assets Return On Average Equity Equity Capital Ratio Net Loans To Deposit Ratio Loss Allowance To Total Loans $2,139.0 $1,579.9 $1,548.3 $298.9 0.81% 6.50% 13.97% 98.00% 0.88% $1.48 $1.28 $16.39 $0.25 $1,525.9 $1,204.9 $1,151.5 $184.5 1.04% 9.19% 12.09% 95.57% 1.13% $1.96 $1.57 $14.22 $0.22 $1,377.3 $1,121.1 $1,042.2 $137.6 1.19% 12.90% 9.99% 92.96% 1.26% OUR VISION: Working together to be the community’s trusted financial provider.
Five Year Condensed Consolidated Financial Summary 2020 2019 2018 2017 2016 $32,192 $33,878 $14,139 $15,872 $17,217 $0 ($647) ($959) ($1,244) ($1,501) $32,192 $33,231 $13,180 $14,628 $15,716 $2.00 $2.00 $22.02 $0.44 Net Income (000) Preferred Stock Dividends (000) Net Income Available To Common Shareholders (000) Per Common Share Earnings Available To Common Shareholders Basic Diluted Book Value Dividends Paid $2,762.9 $2,189.4 $2,032.5 $350.1 1.17% 9.57% 12.67% 92.83% 1.22% $2.12 $2.01 $19.78 $0.42 $2,309.6 $1,678.8 $1,694.2 $330.1 1.51% 10.64% 14.29% 100.92% 0.86% $1.10 $1.02 $18.56 $0.32 Balances Assets (millions) Deposits (millions) Net Loans (millions) Shareholders’ Equity (millions) Performance Ratios Return On Average Assets Return On Average Equity Equity Capital Ratio Net Loans To Deposit Ratio Loss Allowance To Total Loans $2,139.0 $1,579.9 $1,548.3 $298.9 0.81% 6.50% 13.97% 98.00% 0.88% $1.48 $1.28 $16.39 $0.25 $1,525.9 $1,204.9 $1,151.5 $184.5 1.04% 9.19% 12.09% 95.57% 1.13% $1.96 $1.57 $14.22 $0.22 $1,377.3 $1,121.1 $1,042.2 $137.6 1.19% 12.90% 9.99% 92.96% 1.26% OUR VISION: Working together to be the community’s trusted financial provider.
Dear Shareholder, The year 2020 proved to be challenging and unlike any other in our lifetime. COVID-19 created perhaps the greatest health threat ever, costing many lives and infecting millions of people. States issued stay-at-home orders and required some businesses to shut down or operate under restricted hours. Unemployment surged. Yet through it all, Civista employees rose to the challenge, working closely with many of our customers who have been impacted by the COVID-19 pandemic. To help our customers that had been impacted by COVID-19, the bank rolled out a number of financial assistance programs for those facing financial hardship in April 2020. These included consumer, mortgage and commercial loan payment deferral programs and the continued funding of businesses through conventional loans and through the SBA Payroll Protection Program (PPP), a government stimulus program for small businesses. Customer demand for the PPP product, in particular, was high and Civista employees worked countless hours and many long days to open accounts and to provide funding to support community businesses across our footprint. The bank made over 2,300 PPP loans totaling over $259.1 million. Nearly all of these loans were made to small businesses. These businesses employed over 36,000 employees. In addition, our front-line team helped many consumers navigate digital banking services for the first time and answer thousands of stimulus check deposit inquiries. Likewise, our Civista Wealth Management officers helped investors stay their course in what was a turbulent second quarter. Customers and employees also adapted to a new way of doing business. The safety and well-being of our customers and employees was, and is, our top priority. At the onset of the pandemic, to help do our part in slowing the spread of the virus, Civista limited lobby services to ‘by appointment only’ at all of our locations and we restricted employee movement between our offices. In April 2020, we had approximately 70% of our employees working from home and, as of today, we still have over 50% of our employees working remotely. As we shifted our work model, Civista was committed to minimizing service disruptions to our customers. We expanded the hours of our Customer Care Center so that we are now available 24/7, 365 days a year to assist you. We created Civista Curbside Banking, which provides a limited-contact option for customers to conduct select non-cash transactions from the comfort of their vehicles. We invested in video chat and electronic signature technology that allows customers to interact with our bankers from the safety of their homes and offices. And we continue to offer and invest in our digital services such as mobile banking, online banking and digital wallet. These products provide convenient, easy, safe and healthy options for customers to bank with us. As the COVID-19 pandemic persists, we have kept a very close eye on the bank’s capital and liquidity and at this time we believe that we are in a very strong position. We are frequently running stress test scenarios to evaluate capital and liquidity. Those results have been very favorable even in a severe stress test environment. Financially, the bank had one of its most successful years on record. We earned net income of $32.2 million, or $2.00 per diluted share, compared to $33.2 million, or $2.01 per diluted share, in 2019. We also recorded the highest pre-tax, pre-provision net income1 of $47.2 million in our 136-year history. Paycheck protection program Business Helped 2300+ funds secured $259 million employees supported curbside service 1 call 419.625.4123. “202 was a year to discover new potential and find new ways to do things; the ability to think outside the box will serve us better as we move forward. It’s the change in thinking that is the innovative benefit.”-Carl Kessler, information Technology
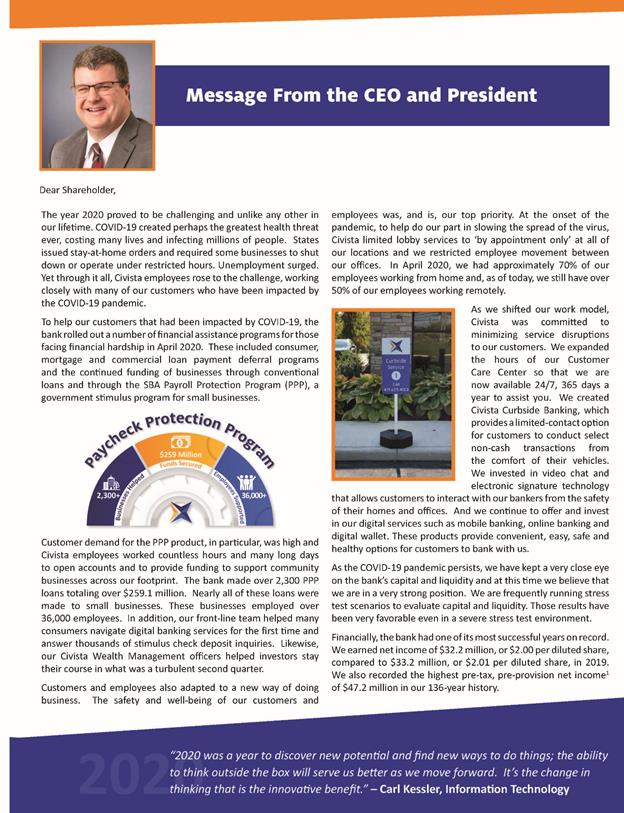
Dear Shareholder, The year 2020 proved to be challenging and unlike any other in our lifetime. COVID-19 created perhaps the greatest health threat ever, costing many lives and infecting millions of people. States issued stay-at-home orders and required some businesses to shut down or operate under restricted hours. Unemployment surged. Yet through it all, Civista employees rose to the challenge, working closely with many of our customers who have been impacted by the COVID-19 pandemic. To help our customers that had been impacted by COVID-19, the bank rolled out a number of financial assistance programs for those facing financial hardship in April 2020. These included consumer, mortgage and commercial loan payment deferral programs and the continued funding of businesses through conventional loans and through the SBA Payroll Protection Program (PPP), a government stimulus program for small businesses. Customer demand for the PPP product, in particular, was high and Civista employees worked countless hours and many long days to open accounts and to provide funding to support community businesses across our footprint. The bank made over 2,300 PPP loans totaling over $259.1 million. Nearly all of these loans were made to small businesses. These businesses employed over 36,000 employees. In addition, our front-line team helped many consumers navigate digital banking services for the first time and answer thousands of stimulus check deposit inquiries. Likewise, our Civista Wealth Management officers helped investors stay their course in what was a turbulent second quarter. Customers and employees also adapted to a new way of doing business. The safety and well-being of our customers and employees was, and is, our top priority. At the onset of the pandemic, to help do our part in slowing the spread of the virus, Civista limited lobby services to ‘by appointment only’ at all of our locations and we restricted employee movement between our offices. In April 2020, we had approximately 70% of our employees working from home and, as of today, we still have over 50% of our employees working remotely. As we shifted our work model, Civista was committed to minimizing service disruptions to our customers. We expanded the hours of our Customer Care Center so that we are now available 24/7, 365 days a year to assist you. We created Civista Curbside Banking, which provides a limited-contact option for customers to conduct select non-cash transactions from the comfort of their vehicles. We invested in video chat and electronic signature technology that allows customers to interact with our bankers from the safety of their homes and offices. And we continue to offer and invest in our digital services such as mobile banking, online banking and digital wallet. These products provide convenient, easy, safe and healthy options for customers to bank with us. As the COVID-19 pandemic persists, we have kept a very close eye on the bank’s capital and liquidity and at this time we believe that we are in a very strong position. We are frequently running stress test scenarios to evaluate capital and liquidity. Those results have been very favorable even in a severe stress test environment. Financially, the bank had one of its most successful years on record. We earned net income of $32.2 million, or $2.00 per diluted share, compared to $33.2 million, or $2.01 per diluted share, in 2019. We also recorded the highest pre-tax, pre-provision net income1 of $47.2 million in our 136-year history. Paycheck protection program Business Helped 2300+ funds secured $259 million employees supported curbside service 1 call 419.625.4123. “2020 was a year to discover new potential and find new ways to do things; the ability to think outside the box will serve us better as we move forward. It’s the change in thinking that is the innovative benefit.”-Carl Kessler, information Technology
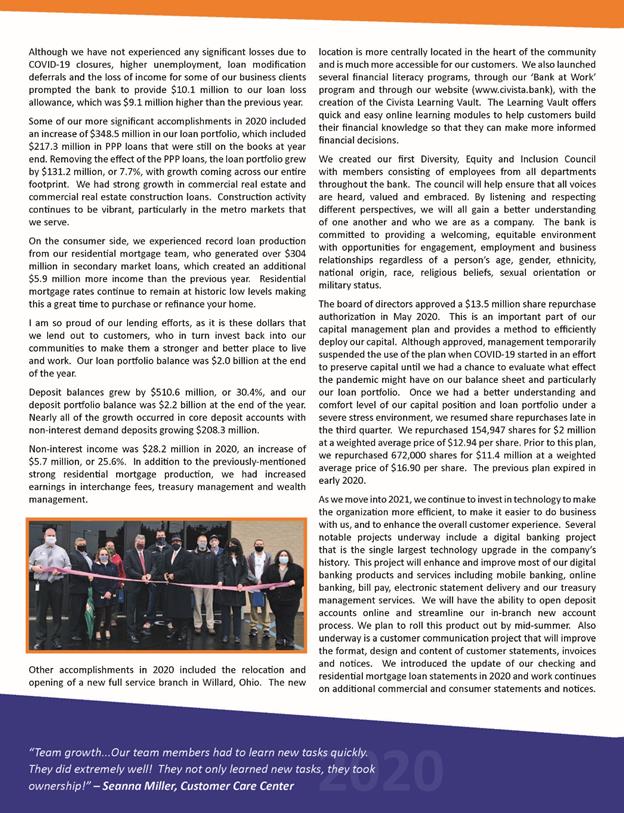
Although we have not experienced any significant losses due to COVID-19 closures, higher unemployment, loan modification deferrals and the loss of income for some of our business clients prompted the bank to provide $10.1 million to our loan loss allowance, which was $9.1 million higher than the previous year. Some of our more significant accomplishments in 2020 included an increase of $348.5 million in our loan portfolio, which included $217.3 million in PPP loans that were still on the books at year end. Removing the effect of the PPP loans, the loan portfolio grew by $131.2 million, or 7.7%, with growth coming across our entire footprint. We had strong growth in commercial real estate and commercial real estate construction loans. Construction activity continues to be vibrant, particularly in the metro markets that we serve. On the consumer side, we experienced record loan production from our residential mortgage team, who generated over $304 million in secondary market loans, which created an additional $5.9 million more income than the previous year. Residential mortgage rates continue to remain at historic low levels making this a great time to purchase or refinance your home. I am so proud of our lending efforts, as it is these dollars that we lend out to customers, who in turn invest back into our communities to make them a stronger and better place to live and work. Our loan portfolio balance was $2.0 billion at the end of the year. Deposit balances grew by $510.6 million, or 30.4%, and our deposit portfolio balance was $2.2 billion at the end of the year. Nearly all of the growth occurred in core deposit accounts with non-interest demand deposits growing $208.3 million. Non-interest income was $28.2 million in 2020, an increase of $5.7 million, or 25.6%. In addition to the previously-mentioned strong residential mortgage production, we had increased earnings in interchange fees, treasury management and wealth management. Other accomplishments in 2020 included the relocation and opening of a new full service branch in Willard, Ohio. The new location is more centrally located in the heart of the community and is much more accessible for our customers. We also launched several financial literacy programs, through our ‘Bank at Work’ program and through our website (www.civista.bank), with the creation of the Civista Learning Vault. The Learning Vault offers quick and easy online learning modules to help customers build their financial knowledge so that they can make more informed financial decisions. We created our first Diversity, Equity and Inclusion Council with members consisting of employees from all departments throughout the bank. The council will help ensure that all voices are heard, valued and embraced. By listening and respecting different perspectives, we will all gain a better understanding of one another and who we are as a company. The bank is committed to providing a welcoming, equitable environment with opportunities for engagement, employment and business relationships regardless of a person’s age, gender, ethnicity, national origin, race, religious beliefs, sexual orientation or military status. The board of directors approved a $13.5 million share repurchase authorization in May 2020. This is an important part of our capital management plan and provides a method to efficiently deploy our capital. Although approved, management temporarily suspended the use of the plan when COVID-19 started in an effort to preserve capital until we had a chance to evaluate what effect the pandemic might have on our balance sheet and particularly our loan portfolio. Once we had a better understanding and comfort level of our capital position and loan portfolio under a severe stress environment, we resumed share repurchases late in the third quarter. We repurchased 154,947 shares for $2 million at a weighted average price of $12.94 per share. Prior to this plan, we repurchased 672,000 shares for $11.4 million at a weighted average price of $16.90 per share. The previous plan expired in early 2020. As we move into 2021, we continue to invest in technology to make the organization more efficient, to make it easier to do business with us, and to enhance the overall customer experience. Several notable projects underway include a digital banking project that is the single largest technology upgrade in the company’s history. This project will enhance and improve most of our digital banking products and services including mobile banking, online banking, bill pay, electronic statement delivery and our treasury management services. We will have the ability to open deposit accounts online and streamline our in-branch new account process. We plan to roll this product out by mid-summer. Also underway is a customer communication project that will improve the format, design and content of customer statements, invoices and notices. We introduced the update of our checking and residential mortgage loan statements in 2020 and work continues on additional commercial and consumer statements and notices. “Team growth...Our team members had to learn new tasks quickly. They did extremely well! They not only learned new tasks, they took ownership!” – Seanna Miller, Customer Care Center 2020
The new statements provide more information and the design and format is easier to read. Civista continues to invest in the communities that we serve. We donate significant dollars to local schools, civic and non- profit organizations throughout our footprint each year. Our employees donate their time serving in leadership roles or as active volunteers at hundreds of organizations where we live and work. In 2020 more than ever, our communities needed support and our employees were there to help. We take great pride in being a community leader and in the commitment that we make to our communities. In closing, I am very pleased with our accomplishments and I am very proud to work with a group of employees who are so committed to each other and to our communities. As I have stated in the past, our goal is to remain an independent community bank and I believe we earn that independence through our actions and results each and every day. I am confident that through our disciplined approach to managing Civista and our long-term focus on driving shareholder value that we will continue to produce positive results. As always, please read your proxy and vote your shares in the company. The annual shareholders meeting is April 20, 2021 at 10 AM. Due to the COVID-19 pandemic, the meeting will be held from our 100 East Water Street, Sandusky, Ohio headquarters. Information including webcast registration instructions and the dial-in number is available at www.CIVB.com. Warmest Regards, Dennis G. Shaffer CEO and President 1 Additional information can be found in the Five-Year Selected Consolidated Financial Data section. Executive Leadership Team Lance A. Morrison, Richard J. Dutton, Paul J. Stark, Donna M. Jaskolski, Dennis G. Shaffer, Charles A. Parcher, John A. Betts, Todd A. Michel Dennis G. Shaffer CEO and President, Civista Bancshares, Inc. and Civista Bank John A. Betts Senior Vice President Richard J. Dutton Senior Vice President Officers Donna M. Waltz-Jaskolski Senior Vice President Todd A. Michel Senior Vice President Lance A. Morrison Senior Vice President, General Counsel and Corporate Secretary Charles A. Parcher Senior Vice President Paul J. Stark Senior Vice President “...Teaching customers who never used our digital services like online or mobile banking gain a little more confidence in how to set up bill pay or make a transfer.” – Gary Weaver, Retail Banking 2020

The new statements provide more information and the design and format is easier to read. Civista continues to invest in the communities that we serve. We donate significant dollars to local schools, civic and non- profit organizations throughout our footprint each year. Our employees donate their time serving in leadership roles or as active volunteers at hundreds of organizations where we live and work. In 2020 more than ever, our communities needed support and our employees were there to help. We take great pride in being a community leader and in the commitment that we make to our communities. In closing, I am very pleased with our accomplishments and I am very proud to work with a group of employees who are so committed to each other and to our communities. As I have stated in the past, our goal is to remain an independent community bank and I believe we earn that independence through our actions and results each and every day. I am confident that through our disciplined approach to managing Civista and our long-term focus on driving shareholder value that we will continue to produce positive results. As always, please read your proxy and vote your shares in the company. The annual shareholders meeting is April 20, 2021 at 10 AM. Due to the COVID-19 pandemic, the meeting will be held from our 100 East Water Street, Sandusky, Ohio headquarters. Information including webcast registration instructions and the dial-in number is available at www.CIVB.com. Warmest Regards, Dennis G. Shaffer CEO and President 1 Additional information can be found in the Five-Year Selected Consolidated Financial Data section. Executive Leadership Team Lance A. Morrison, Richard J. Dutton, Paul J. Stark, Donna M. Jaskolski, Dennis G. Shaffer, Charles A. Parcher, John A. Betts, Todd A. Michel Dennis G. Shaffer CEO and President, Civista Bancshares, Inc. and Civista Bank John A. Betts Senior Vice President Richard J. Dutton Senior Vice President Officers Donna M. Waltz-Jaskolski Senior Vice President Todd A. Michel Senior Vice President Lance A. Morrison Senior Vice President, General Counsel and Corporate Secretary Charles A. Parcher Senior Vice President Paul J. Stark Senior Vice President “...Teaching customers who never used our digital services like online or mobile banking gain a little more confidence in how to set up bill pay or make a transfer.” – Gary Weaver, Retail Banking 2020

Board Of Directors Thomas A. Depler Partner, Poland, Depler & Shepherd Co., LPA Julie A. Mattlin Principal and Owner, DKMG Consulting, LLC James O. Miller Chairman of the Board, Civista Bancshares, Inc. and Civista Bank Dennis E. Murray, Jr. Lead Director Partner, Murray & Murray Co., LPA Allen R. Nickles, CPA, CFE, FCPA, CFF, CICA Of Counsel, Payne, Nickles & Company Civista Bancshares, Inc. M. Patricia Oliver Retired Partner, Tucker Ellis, LLP Founder, The Oliver Consulting Group William F. Ritzmann Former Chairman of the Board, United Community Bancorp and United Community Bank Dennis G. Shaffer CEO and President, Civista Bancshares, Inc. and Civista Bank Harry Singer President and CEO, Sandusco, Inc. and ICM Distributing Company, Inc. Daniel J. White CEO, Norwalk Furniture Corp John O. Bacon President and CEO, The Mack Iron Works Company Barry W. Boerger Self-Employed Grain Farm Operator Thomas A. Depler Partner, Poland, Depler & Shepherd Co., LPA Blythe A. Friedley Owner/President, Friedley & Co. Agency, Inc. Julie A. Mattlin Principal and Owner, DKMG Consulting, LLC Elmer G. McLaughlin Former President and CEO, United Community Bancorp and United Community Bank James O. Miller Chairman of the Board, Civista Bancshares, Inc. and Civista Bank Dennis E. Murray, Jr. Partner, Murray & Murray Co., LPA Allen R. Nickles, CPA, CFE, FCPA, CFF, CICA Of Counsel, Payne, Nickles & Company M. Patricia Oliver Retired Partner, Tucker Ellis, LLP Founder, The Oliver Consulting Group William F. Ritzmann Former Chairman of the Board, United Community Bancorp and United Community Bank Dennis G. Shaffer CEO and President, Civista Bancshares, Inc. and Civista Bank Harry Singer President and CEO, Sandusco, Inc. and ICM Distributing Company, Inc. Daniel J. White CEO, Norwalk Furniture Corp Gerald B. Wurm President, Wurm’s Woodworking Co. and Creative Plastics International Directors Emeritus Civista Bancshares, Inc. and Civista Bank James D. Heckelman Retired, Founder of Dan-Mar Co., Inc. David A. Voight Former Chairman of the Board and Former President and CEO, Civista Bancshares, Inc. and Civista Bank “Many employees faced hardships with no school, daycare, babysitter, etc. I think Civista did a wonderful job to accommodate the employees so we did not have to choose between work and family…. Civista put the safety of our employees and customers first.” – Steffani McVety, Consumer Lending
ANNUAL REPORT
CONTENTS
|
|
1 |
|
|
|
|
|
|
|
5 |
|
|
|
|
|
|
|
5 |
|
|
|
|
|
|
Management’s Discussion and Analysis of Financial Condition and Results of Operations |
|
6 |
|
|
|
|
|
|
19 |
|
|
|
|
|
|
Financial Statements |
|
|
|
Management’s Report on Internal Control over Financial Reporting |
|
23 |
|
|
24 |
|
|
Report of Independent Registered Public Accounting Firm on Financial Statements |
|
25 |
|
|
28 |
|
|
|
29 |
|
|
|
30 |
|
|
|
31 |
|
|
|
32 |
|
|
|
34 |
This page left blank intentionally.
Five-Year Selected Consolidated Financial Data
(Amounts in thousands, except per share data)
|
|
|
Year ended December 31, |
|
|||||||||||||||||
|
|
|
2020 |
|
|
2019 |
|
|
2018 |
|
|
2017 |
|
|
2016 |
|
|||||
|
Statements of income: |
|
|
|
|
|
|
|
|
|
|
|
|
|
|
|
|
|
|
|
|
|
Total interest and dividend income |
|
$ |
99,865 |
|
|
$ |
98,054 |
|
|
$ |
73,677 |
|
|
$ |
58,594 |
|
|
$ |
53,567 |
|
|
Total interest expense |
|
|
10,138 |
|
|
|
12,954 |
|
|
|
7,570 |
|
|
|
4,092 |
|
|
|
3,308 |
|
|
Net interest income |
|
|
89,727 |
|
|
|
85,100 |
|
|
|
66,107 |
|
|
|
54,502 |
|
|
|
50,259 |
|
|
Provision (credit) for loan losses |
|
|
10,112 |
|
|
|
1,035 |
|
|
|
780 |
|
|
|
— |
|
|
|
(1,300 |
) |
|
Net interest income after provision for loan losses |
|
|
79,615 |
|
|
|
84,065 |
|
|
|
65,327 |
|
|
|
54,502 |
|
|
|
51,559 |
|
|
Net gain (loss) on sale of securities |
|
|
94 |
|
|
|
32 |
|
|
|
(413 |
) |
|
|
12 |
|
|
|
19 |
|
|
Other noninterest income |
|
|
28,088 |
|
|
|
22,411 |
|
|
|
18,544 |
|
|
|
16,322 |
|
|
|
16,113 |
|
|
Total noninterest income |
|
|
28,182 |
|
|
|
22,443 |
|
|
|
18,131 |
|
|
|
16,334 |
|
|
|
16,132 |
|
|
Total noninterest expense |
|
|
70,665 |
|
|
|
66,947 |
|
|
|
66,679 |
|
|
|
48,604 |
|
|
|
43,855 |
|
|
Income before federal income taxes |
|
|
37,132 |
|
|
|
39,561 |
|
|
|
16,779 |
|
|
|
22,232 |
|
|
|
23,836 |
|
|
Federal income tax expense |
|
|
4,940 |
|
|
|
5,683 |
|
|
|
2,640 |
|
|
|
6,360 |
|
|
|
6,619 |
|
|
Net income |
|
$ |
32,192 |
|
|
$ |
33,878 |
|
|
$ |
14,139 |
|
|
$ |
15,872 |
|
|
$ |
17,217 |
|
|
Preferred stock dividends and discount accretion |
|
|
— |
|
|
|
647 |
|
|
|
959 |
|
|
|
1,244 |
|
|
|
1,501 |
|
|
Net income available to common shareholders |
|
$ |
32,192 |
|
|
$ |
33,231 |
|
|
$ |
13,180 |
|
|
$ |
14,628 |
|
|
$ |
15,716 |
|
|
Per common share: |
|
|
|
|
|
|
|
|
|
|
|
|
|
|
|
|
|
|
|
|
|
Net income available to common shareholders (basic) |
|
|
2.00 |
|
|
|
2.12 |
|
|
|
1.10 |
|
|
|
1.48 |
|
|
|
1.96 |
|
|
Net income available to common shareholders (diluted) |
|
|
2.00 |
|
|
|
2.01 |
|
|
|
1.02 |
|
|
|
1.28 |
|
|
|
1.57 |
|
|
Dividends declared |
|
|
0.44 |
|
|
|
0.42 |
|
|
|
0.32 |
|
|
|
0.25 |
|
|
|
0.22 |
|
|
Book value |
|
|
22.02 |
|
|
|
19.78 |
|
|
|
18.56 |
|
|
|
16.39 |
|
|
|
14.22 |
|
|
Average common shares outstanding: |
|
|
|
|
|
|
|
|
|
|
|
|
|
|
|
|
|
|
|
|
|
Basic |
|
|
16,129,875 |
|
|
|
15,652,881 |
|
|
|
11,971,786 |
|
|
|
9,906,856 |
|
|
|
8,010,399 |
|
|
Diluted |
|
|
16,129,875 |
|
|
|
16,851,740 |
|
|
|
13,855,706 |
|
|
|
12,352,616 |
|
|
|
10,950,961 |
|
|
Year-end balances: |
|
|
|
|
|
|
|
|
|
|
|
|
|
|
|
|
|
|
|
|
|
Loans, net |
|
$ |
2,032,474 |
|
|
$ |
1,694,203 |
|
|
$ |
1,548,262 |
|
|
$ |
1,151,527 |
|
|
$ |
1,042,201 |
|
|
Securities |
|
|
384,887 |
|
|
|
379,970 |
|
|
|
368,385 |
|
|
|
245,309 |
|
|
|
209,919 |
|
|
Total assets |
|
|
2,762,918 |
|
|
|
2,309,557 |
|
|
|
2,138,954 |
|
|
|
1,525,857 |
|
|
|
1,377,263 |
|
|
Deposits |
|
|
2,189,398 |
|
|
|
1,678,764 |
|
|
|
1,579,893 |
|
|
|
1,204,923 |
|
|
|
1,121,103 |
|
|
Borrowings |
|
|
183,341 |
|
|
|
274,601 |
|
|
|
245,226 |
|
|
|
123,082 |
|
|
|
106,852 |
|
|
Shareholders’ equity |
|
|
350,108 |
|
|
|
330,126 |
|
|
|
298,898 |
|
|
|
184,461 |
|
|
|
137,616 |
|
|
Average balances: |
|
|
|
|
|
|
|
|
|
|
|
|
|
|
|
|
|
|
|
|
|
Loans, net |
|
$ |
1,953,472 |
|
|
$ |
1,598,991 |
|
|
$ |
1,261,568 |
|
|
$ |
1,095,956 |
|
|
$ |
1,011,683 |
|
|
Securities |
|
|
386,703 |
|
|
|
372,886 |
|
|
|
273,998 |
|
|
|
234,249 |
|
|
|
213,496 |
|
|
Total assets |
|
|
2,754,708 |
|
|
|
2,241,111 |
|
|
|
1,742,823 |
|
|
|
1,526,387 |
|
|
|
1,441,717 |
|
|
Deposits |
|
|
2,078,454 |
|
|
|
1,689,801 |
|
|
|
1,341,860 |
|
|
|
1,236,663 |
|
|
|
1,210,283 |
|
|
Borrowings |
|
|
288,551 |
|
|
|
208,932 |
|
|
|
167,752 |
|
|
|
101,880 |
|
|
|
79,391 |
|
|
Shareholders’ equity |
|
|
336,461 |
|
|
|
318,306 |
|
|
|
217,371 |
|
|
|
172,763 |
|
|
|
133,445 |
|
1
Five-Year Selected Ratios
|
|
|
Year ended December 31, |
|
|||||||||||||||||
|
|
|
2020 |
|
|
2019 |
|
|
2018 |
|
|
2017 |
|
|
2016 |
|
|||||
|
Net interest margin (1) |
|
|
3.70 |
% |
|
|
4.31 |
% |
|
|
4.21 |
% |
|
|
4.01 |
% |
|
|
3.93 |
% |
|
Return on average total assets |
|
|
1.17 |
|
|
|
1.51 |
|
|
|
0.81 |
|
|
|
1.04 |
|
|
|
1.19 |
|
|
Return on average shareholders’ equity |
|
|
9.57 |
|
|
|
10.64 |
|
|
|
6.50 |
|
|
|
9.19 |
|
|
|
12.90 |
|
|
Dividend payout ratio |
|
|
22.00 |
|
|
|
19.81 |
|
|
|
29.09 |
|
|
|
16.89 |
|
|
|
11.22 |
|
|
Average shareholders’ equity as a percent of average total assets |
|
|
12.21 |
|
|
|
14.20 |
|
|
|
12.47 |
|
|
|
11.32 |
|
|
|
9.26 |
|
|
Net loan charge-offs (recoveries) as a percent of average total loans |
|
|
(0.01 |
) |
|
|
(0.00 |
) |
|
|
0.02 |
|
|
|
0.02 |
|
|
|
(0.02 |
) |
|
Allowance for loan losses as a percent of loans at year-end |
|
|
1.22 |
|
|
|
0.86 |
|
|
|
0.88 |
|
|
|
1.13 |
|
|
|
1.26 |
|
|
Shareholders’ equity as a percent of total year-end assets |
|
|
12.67 |
|
|
|
14.29 |
|
|
|
13.97 |
|
|
|
12.09 |
|
|
|
9.99 |
|
|
|
(1) |
Calculated on a tax-equivalent basis using an effective tax rate of 21% for 2020, 2019 and 2018 and 35% for 2017 and 2016. |
Reconciliation of Non-GAAP Measures
Use of Non-GAAP Measures
To supplement the financial measures prepared in accordance with U.S. generally accepted accounting principles (“GAAP”), we use a non-GAAP financial measure. The reconciliation of this non-GAAP financial measure to the most directly comparable financial measure calculated and presented in accordance with GAAP is shown in the table below. This non-GAAP financial measure should not be considered in isolation from, or as a substitute for or superior to, the financial measure reported in accordance with GAAP. Moreover, this non-GAAP financial measure has limitations in that it does not reflect all the items associated with the operations of the business as determined in accordance with GAAP. Other companies may calculate similarly titled non-GAAP financial measures differently than us, limiting the usefulness of those measures for comparative purposes.
We believe that this non-GAAP financial measure is useful to investors in their assessment of operating performance and the valuation of the Company. Pre-Tax Pre-Provision Net Income (PTPP), is a non-GAAP supplemental measure that is used by management to evaluate and measure the Company’s performance. Management believes that this measure provides users of the Company’s financial information with a more meaningful view of the performance of the Company’s core earnings potential excluding credit related expenses.
|
|
|
Year ended December 31, |
|
|||||||||||||||||
|
(In thousands) |
|
2020 |
|
|
2019 |
|
|
2018 |
|
|
2017 |
|
|
2016 |
|
|||||
|
Net income (GAAP) |
|
$ |
32,192 |
|
|
$ |
33,878 |
|
|
$ |
14,139 |
|
|
$ |
15,872 |
|
|
$ |
17,217 |
|
|
Add back: income tax expense |
|
|
4,940 |
|
|
|
5,683 |
|
|
|
2,640 |
|
|
|
6,360 |
|
|
|
6,619 |
|
|
Add back: provision for loan losses |
|
|
10,112 |
|
|
|
1,035 |
|
|
|
780 |
|
|
|
— |
|
|
|
(1,300 |
) |
|
Pre-tax, pre-provision net income |
|
$ |
47,244 |
|
|
$ |
40,596 |
|
|
$ |
17,559 |
|
|
$ |
22,232 |
|
|
$ |
22,536 |
|
2
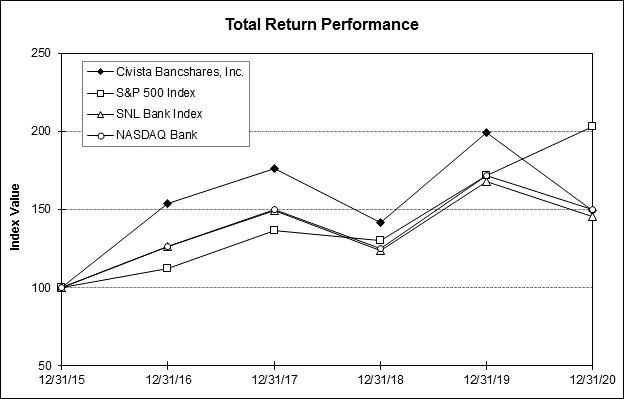
S hare holder Return Performance
Set forth below is a line graph comparing the five-year cumulative return of the common shares of Civista Bancshares, Inc. (ticker symbol CIVB), based on an initial investment of $100 on December 31, 2015 and assuming reinvestment of dividends, with the cumulative return of the Standard & Poor’s 500 Index, the NASDAQ Bank Index and the SNL Bank Index. The comparative indices were obtained from SNL Securities and NASDAQ.
Annual Report on Form 10-K
A copy of the Company’s Annual Report on Form 10-K, as filed with the Securities and Exchange Commission, will be furnished, free of charge, to shareholders, upon written request to Lance A. Morrison, Secretary of Civista Bancshares, Inc., 100 East Water Street, Sandusky, Ohio 44870.
3
This page left blank intentionally.
4
Common S hares and S hareholder Matters
The common shares of Civista Bancshares, Inc. (“CBI”) trade on The NASDAQ Capital Market under the symbol “CIVB”. As of February 25, 2021, there were 15,847,061 common shares outstanding and held by approximately 1,563 shareholders of record (not including the number of persons or entities holding stock in nominee or street name through various brokerage firms).
The Company paid quarterly dividends on its common shares in the aggregate amounts of $0.44 per share and $0.42 per share in 2020 and 2019, respectively. The Company presently anticipates continuing to pay quarterly dividends in the future at similar levels, subject to compliance with applicable restrictions on the payment of dividends as discussed in the “Liquidity and Capital Resources” section of the Management’s Discussion and Analysis of Financial Condition and Results of Operations and in Note 19 to the Consolidated Financial Statements.
General Development of Business
(Amounts in thousands)
CBI was organized under the laws of the State of Ohio on February 19, 1987 and is a registered financial holding company under the Gramm-Leach-Bliley Financial Modernization Act of 1999, as amended. CBI and its subsidiaries are sometimes referred to together as the “Company”. The Company’s office is located at 100 East Water Street, Sandusky, Ohio. The Company had total consolidated assets of $2,762,918 at December 31, 2020.
CIVISTA BANK (“Civista”), owned by CBI since 1987, opened for business in 1884 as The Citizens National Bank. In 1898, Civista was reorganized under Ohio banking law and was known as The Citizens Bank and Trust Company. In 1908, Civista surrendered its trust charter and began operation as The Citizens Banking Company. The name Civista Bank was introduced during the first quarter of 2015 to solidify our dual Citizens/Champaign brand and distinguish ourselves from the many other banks using the “Citizens” name in our existing and prospective markets. Civista maintains its main office at 100 East Water Street, Sandusky, Ohio and operates branch banking offices in the following Ohio communities: Sandusky (2), Norwalk (2), Berlin Heights, Huron, Port Clinton, Castalia, New Washington, Shelby (2), Willard, Greenwich, Plymouth, Shiloh, Akron, Dublin, Plain City, Russells Point, Urbana (2), West Liberty, Quincy, Dayton(3), Beachwood, and in the following Indiana communities: Lawrenceburg (3), Aurora, West Harrison, Milan, Osgood and Versailles. Civista also operates loan production offices in Westlake, Ohio and Fort Mitchell, Kentucky. Civista accounted for 99.8% of the Company’s consolidated assets at December 31, 2020.
FIRST CITIZENS INSURANCE AGENCY INC. (“FCIA”) was formed to allow the Company to participate in commission revenue generated through its third party insurance agreement. Assets of FCIA were less than one percent of the Company’s consolidated assets as of December 31, 2020.
WATER STREET PROPERTIES, INC. (“WSP”) was formed to hold properties repossessed by CBI subsidiaries. WSP accounted for less than one percent of the Company’s consolidated assets as of December 31, 2020.
FC REFUND SOLUTIONS, INC. (“FCRS”) was formed during 2012 to facilitate payment of individual state and federal income tax refunds. The operations of FCRS were discontinued June 30, 2019 as a result of inactivity. The discontinued operations of FCRS will not affect the Company’s participation in the tax refund processing program.
FIRST CITIZENS INVESTMENTS, INC. (“FCI”) is wholly-owned by Civista and holds and manages its securities portfolio. The operations of FCI are located in Wilmington, Delaware.
FIRST CITIZENS CAPITAL LLC (“FCC”) is wholly-owned by Civista and holds inter-company debt that is eliminated in consolidation. The operations of FCC are located in Wilmington, Delaware.
CIVB RISK MANAGEMENT, INC. (“CRMI”) is a wholly-owned captive insurance company formed in 2017 which insures against certain risks unique to the operations of the Company and its subsidiaries and for which insurance may not be currently available or economically feasible in today's insurance marketplace. Assets of CRMI were less than one percent of the Company’s consolidated assets as of December 31, 2020.
5
Acquisition of United Community Bancorp
On September 14, 2018, CBI completed the acquisition by merger of United Community Bancorp (“UCB”) in a stock and cash transaction for aggregate consideration of approximately $117,344. Immediately following the merger, UCB’s banking subsidiary, United Community Bank, was merged into CBI’s banking subsidiary, Civista Bank. At the time of the merger, UCB had total assets of $537,875, including $298,319 in loans, and $475,944 in deposits. As a result of the merger, we acquired eight offices of UCB in the Indiana communities of Lawrenceburg (3), Aurora, West Harrison, Milan, Osgood and Versailles and a loan production office in Fort Mitchell, Kentucky.
Management’s Discussion and Analysis of Financial Condition and Results of Operations—As of December 31, 2020 and December 31, 2019 and for the Years Ended December 31, 2020, 2019 and 2018
(Amounts in thousands, except per share data)
General
The following paragraphs more fully discuss the significant highlights, changes and trends as they relate to the Company’s financial condition, results of operations, liquidity and capital resources as of December 31, 2020 and 2019, and during the three-year period ended December 31, 2020. This discussion should be read in conjunction with the Consolidated Financial Statements and Notes to the Consolidated Financial Statements, which are included elsewhere in this report.
Forward-Looking Statements
This report may contain “forward-looking statements” within the meaning of Section 27A of the Securities Act of 1933, as amended (the “Securities Act”), and Section 21E of the Securities Exchange Act of 1934, as amended (the “Exchange Act”), relating to such matters as financial condition, anticipated operating results, cash flows, business line results, credit quality expectations, prospects for new lines of business, economic trends (including interest rates) and similar matters. Forward-looking statements reflect our expectations, estimates or projections concerning future results or events. These statements are generally identified by the use of forward-looking words or phrases such as “believe,” “belief,” “expect,” “anticipate,” “may,” “could,” “intend,” “intent,” “estimate,” “plan,” “foresee,” “likely,” “will,” “should” or other similar words or phrases. Forward-looking statements are not guarantees of performance and are inherently subject to known and unknown risks, uncertainties and assumptions that are difficult to predict and could cause our actual results, performance or achievements to differ materially from those expressed in or implied by the forward-looking statements. Factors that could cause actual results, performance or achievements to differ from those discussed in the forward-looking statements include, but are not limited to, impacts on our business, financial condition and results of operations resulting from the ongoing COVID-19 pandemic, including government regulations and stimulus programs related thereto: changes in financial markets or national or local economic or political conditions; adverse changes in the real estate market; volatility and direction of market interest rates; the transition away from LIBOR as a reference rate for financial contracts; credit risks of lending activities; operational risks; changes in the allowance for loan losses; legislation or regulatory changes or actions; increases in FDIC insurance premiums and assessments; changes in tax laws; accounting changes; inability to raise additional capital if and when needed in the future; unexpected losses of key management; failure, interruption or breach of security of our communications and information systems or those of our third party service providers; unforeseen litigation; increased competition in our market area; failures to manage growth and/or effectively integrate acquisitions; future revenues of our tax refund program; climate change, natural disasters, acts of war or terrorism, and other external events; and other risks identified from time-to-time in the Company’s other public documents on file with the Securities and Exchange Commission.
The forward-looking statements included in this report are only made as of the date of this report, and we disclaim any obligation to publicly update any forward-looking statement to reflect subsequent events or circumstances, except as required by law.
The Private Securities Litigation Reform Act of 1995 provides a safe harbor for forward-looking statements, and the purpose of this section is to secure the use of the safe harbor provisions.
6
Financial Condition
At December 31, 2020, the Company’s total assets were $2,762,918, compared to $2,309,557 at December 31, 2019. The increase in assets is primarily the result of increases in cash and due from financial institutions, securities available for sale, loans held for sale, loans and swap assets. Other factors contributing to the change in assets are discussed in the following sections.
Loans held for sale increased $4,716, or 206.4%, from $2,285 at December 31, 2019 to $7,001 at December 31, 2020. The increase is due to an increase in volume due to refinances as rates have declined. At December 31, 2020, 29 loans totaling $7,001 were held for sale as compared to 15 loans totaling $2,285 at December 31, 2019.
At $2,032,474, net loans increased from December 31, 2019 by 20.0%. The increase in net loans was spread across most segments. Commercial & Agriculture loans increased $206,766, Commercial Real Estate – Owner Occupied loans increased $32,807, Commercial Real Estate - Non-Owner Occupied loans increased $112,850, and Real estate construction loans increased $19,784. The increases in the foregoing loan segments were offset by decreases in Residential Real Estate loans of $20,444, Farm Real Estate loans of $1,012 and Consumer and other loans of $2,219. The increase in Commercial & Agriculture loans is the result of our origination of loans under the Paycheck Protection Program (“PPP”) loans totaling $217,295 at December 31, 2020.
Securities available for sale increased by $4,965, or 1.4%, from $358,499 at December 31, 2019 to $363,464 at December 31, 2020. U.S. Treasury securities and obligations of U.S. government agencies increased $2,092 from $19,601 at December 31, 2019 to $21,693 at December 31, 2020. Obligations of states and political subdivisions available for sale increased by $22,978 from 2019 to 2020. Mortgage-backed securities decreased by $20,105 to total $112,759 at December 31, 2020. The Company continues to utilize letters of credit from the Federal Home Loan Bank (FHLB) to replace maturing securities that were pledged for public entities. As of December 31, 2020, the Company was in compliance with all applicable pledging requirements.
Mortgage-backed securities totaled $112,759 at December 31, 2020 and none were considered unusual or “high risk” securities as defined by regulatory authorities. Of this total, $96,872 consisted of pass-through securities issued by the Federal National Mortgage Association (“FNMA”), Federal Home Loan Mortgage Corporation (“FHLMC”), and Government National Mortgage Association (“GNMA”), and $15,887 of these securities were collateralized by mortgage-backed securities issued or guaranteed by FNMA, FHLMC, or GNMA. The average interest rate of the mortgage-backed securities portfolio at December 31, 2020 was 3.1%. The average maturity at December 31, 2020 was approximately 4.7 years.
Securities available for sale had a fair value at December 31, 2020 of $363,464. This fair value includes unrealized gains of approximately $27,183 and unrealized losses of approximately $35. Net unrealized gains totaled $27,148 on December 31, 2020 compared to net unrealized gains of $16,307 on December 31, 2019. The change in unrealized gains is primarily due to changes in market interest rates. Note 3 to the Consolidated Financial Statements provides additional information on unrealized gains and losses.
Premises and equipment, net of accumulated depreciation, decreased $291 from December 31, 2019 to December 31, 2020. The decrease is the result of new purchases of $1,972, offset by disposals of $10 and depreciation of $2,253.
Accrued interest receivable increased $2,328 or 32.8% from December 31, 2019 to December 31, 2020. The increase is the result of loan modifications consisting of the deferral of principal and/or interest payments, which are the result of the COVID-19 pandemic.
Swap assets increased $12,782 from December 31, 2019 to December 31, 2020. The increase is primarily the result of an increase in volume of swap activity related to our Commercial Real Estate loan growth, as well as increases in volume due to the low rate environment.
Bank owned life insurance (BOLI) increased $977 from December 31, 2019 to December 31, 2020. The difference is the result of increases in the cash surrender value of the underlying insurance policies.
7
Year-end deposit balances totaled $ 2 , 189 , 398 in 20 20 compared to $1, 678 , 764 in 201 9 , an increase of $ 510 , 634 , or 30 . 4 %. Overall, the increase in deposits at December 31, 20 20 compared to December 31, 201 9 included increases in noninterest bearing demand deposits of $ 208 , 256 , or 40 . 6 %, interest bearing demand accounts of $ 108 , 465 , or 36 . 0 %, statement and passbook savings accounts of $ 182 , 915 , or 3 1.1 %, certificate of deposit accounts of $ 1 3 , 224 , or 5 . 8 % , offset by a decrease in individual retirement accounts of $ 2 , 226 , or 4 . 6 %. Average deposit balances for 20 20 were $ 2 , 078 , 454 compared to $1, 689 , 801 for 201 9 , an increase of 2 3 . 0 %. Noninterest bearing deposits averaged $ 739 , 648 for 20 20 , compared to $ 550 , 638 for 201 9 , increasing $ 189 , 010 , or 34 . 3 %. Savings, NOW, and MMDA accounts averaged $ 1,050 , 544 for 20 20 compared to $ 869 , 340 for 201 9 . Average certificates of deposit in creased $ 18 , 439 to total an average balance of $ 2 88 , 262 for 20 20 . The increase in year-to-date average balances was impacted by COVID-19 pandemic as the Company’s participation in originating PPP loans resulted in loan proceeds being deposited by borrowers into deposit accounts at Civista and customer deposits of stimulus checks and unemployment benefits also increased average deposit balance s in 2020.
Borrowings from the FHLB of Cincinnati were $125,000 at December 31, 2020 compared to $226,500 at December 31, 2019, a decrease of $101,500. Additional detail regarding these borrowings can be found in Note 10 and Note 11 to the Consolidated Financial Statements. Short-term FHLB advances decreased $101,500 from December 31, 2019 to December 31, 2020. The decrease is due to a decrease in overnight borrowings.
Civista offers repurchase agreements in the form of sweep accounts to commercial checking account customers. These repurchase agreements totaled $28,914 at December 31, 2020 compared to $18,674 at December 31, 2019. U.S. Treasury securities and obligations of U.S. government agencies maintained under Civista’s control are pledged as collateral for the repurchase agreements. Additional detail related to these repurchase agreements can be found in Note 12 to the Consolidated Financial Statements.
Swap liabilities increased $12,846 from December 31, 2019 to December 31, 2020. The increase is primarily the result of an increase in volume of swap activity related to our Commercial Real Estate loan growth, as well as an increase in the fair value resulting from the low interest rate environment.
Total shareholders’ equity increased $19,982, or 6.1%, during 2020 to $350,108. The change in shareholders’ equity resulted from net income of $32,192, a decrease in the Company’s pension liability, net of tax, of $819, an increase in the fair value of securities available for sale, net of tax, of $8,564 and decreases due to the purchase of treasury shares of $13,454 and dividends on common shares of $7,118, respectively. Additionally, $617 was recognized as stock-based compensation in 2020 in connection with the grant of restricted common shares. For further explanation of these items, see Note 1, Note 15 and Note 16 to the Consolidated Financial Statements. The Company paid $0.44 per common share in dividends in 2020 compared to $0.42 per common share in dividends in 2019. Total outstanding common shares at December 31, 2020 were 15,898,032. Total outstanding common shares at December 31, 2019 were 16,687,542. The decrease in common shares outstanding is the result of the repurchase of 830,755 common shares at an average repurchase price of $16.20. The Company repurchased 672,000 common shares pursuant to a stock repurchase program announced on December 17, 2019, 154,947 common shares pursuant to a stock repurchase program announced on May 4, 2020 and 3,808 common shares surrendered to pay taxes upon vesting of restricted shares. The repurchase plan publicly-announced on December 17, 2019 authorized the Company to repurchase up to 672,000 shares of the Company’s common shares until December 17, 2020. The repurchase plan publicly-announced on May 4, 2020 authorized the Company to repurchase a maximum aggregate value of $13,500 of the Company’s common shares until April 20, 2021. The decrease in common shares outstanding was offset by the grant of 26,979 restricted common shares to certain officers under the Company’s 2014 Incentive Plan and the grant of 14,266 common shares to directors of Civista as a retainer for their service. The ratio of total shareholders’ equity to total assets was 12.7% and 14.3%, at December 31, 2020 and 2019, respectively.
8
Results of Operations
The operating results of the Company are affected by general economic conditions, the monetary and fiscal policies of federal agencies and the regulatory policies of agencies that regulate financial institutions. The Company’s cost of funds is influenced by interest rates on competing investments and general market rates of interest. Lending activities are influenced by the demand for real estate loans and other types of loans, which in turn is affected by the interest rates at which such loans are made, general economic conditions and the availability of funds for lending activities.
The Company’s net income primarily depends on its net interest income, which is the difference between the interest income earned on interest-earning assets, such as loans and securities, and interest expense incurred on interest-bearing liabilities, such as deposits and borrowings. The level of net interest income is dependent on the interest rate environment and the volume and composition of interest-earning assets and interest-bearing liabilities. Net income is also affected by provisions for loan losses, service charges, gains on the sale of assets, other non-interest income, noninterest expense and income taxes.
Comparison of Results of Operations for the Years Ended December 31, 2020 and December 31, 2019
Net Income
The Company’s net income for the year ended December 31, 2020 was $32,192, compared to $33,878 for the year ended December 31, 2019. The change in net income was the result of the items discussed in the following sections.
Net Interest Income
Net interest income for 2020 was $89,727, an increase of $4,627, or 5.4%, from 2019. From 2019 to 2020, average earning assets increased 23.3%, interest income increased $1,811, and interest expense on interest-bearing liabilities decreased $2,816. The Company continually examines its rate structure to ensure that its interest rates are competitive and reflective of the current rate environment in which it competes.
Total interest income increased $1,811 to $99,865 for the year ended December 31, 2020, which is attributable to an increase of $2,805 in interest and fees on loans. This change was the result of an increase in the average balance of loans, accompanied by a lower yield on the portfolio. The average balance of loans increased by $340,497 or 21.1% to $1,953,472 for the year ended December 31, 2020, as compared to $1,612,975 for the year ended December 31, 2019. The loan yield decreased to 4.49% for 2020, from 5.27% in 2019.
Interest on taxable securities decreased $1,225 to $5,359 for the year ended December 31, 2020, compared to $6,584 for the same period in 2019. The average balance of taxable securities decreased $16,353 to $183,721 for the year ended December 31, 2020, as compared to $200,074 for the year ended December 31, 2019. The yield on taxable securities decreased 32 basis points to 3.03% for 2020, compared to 3.35% for 2019. Interest on tax-exempt securities increased $476 to $6,123 for the year ended December 31, 2020, compared to $5,647 for the same period in 2019. The average balance of tax-exempt securities increased $30,170 to $202,982 for the year ended December 31, 2020 as compared to $172,812 for the year ended December 31, 2019. The yield on tax-exempt securities decreased 21 basis points to 4.15% for 2020, compared to 4.36% for 2019.
Total interest expense decreased $2,816 or 21.7% to $10,138 for the year ended December 31, 2020, compared with $12,954 for the same period in 2019. The change in interest expense can be attributed to an increase in the average balance of interest-bearing liabilities and a decrease in the average rate paid. For the year ended December 31, 2020, the average balance of interest-bearing liabilities increased $279,262 to $1,627,357, as compared to $1,348,095 for the year ended December 31, 2019. Interest incurred on deposits decreased by $1,176 to $6,881 for the year ended December 31, 2020, compared to $8,057 for the same period in 2019. The change in deposit expense was due to an increase in the average balance of interest-bearing deposits of $199,643 for the year ended December 31, 2020 as compared to the same period in 2019. In addition, the average rate paid on demand and savings accounts decreased from 0.33% in 2019 to 0.17% in 2020 and the average rate paid on time deposits decreased from 1.92% to 1.76% in 2020. Interest expense incurred on FHLB advances and subordinated debentures decreased 41.0% from 2019. The decrease was due to a $27,896 decrease in average balance from 2019 and a decrease in rate from 2019. The average balance of other borrowings increased $101,295 for the period ended December 31, 2020 as compared to the same period in 2019 as a result of the Company’s borrowings under the Paycheck Protection Program Lending Facility (“PPPLF”) to fund PPP loans.
9
Refer to “Distribution of Assets, Liabilities and Shareholders’ Equity; Interest Rates and Interest Differential” and “Changes in Interest Income and Interest Expense Resulting from Changes in Volume and Changes in Rate” on pages 14 through 16 for further analysis of the impact of changes in interest-bearing assets and liabilities on the Company’s net interest income.
Provision and Allowance for Loan Losses
The following table contains information relating to the provision for loan losses, activity in and analysis of the allowance for loan losses as of and for each of the three years in the period ended December 31.
|
|
|
As of and for year ended December 31, |
|
|||||||||
|
|
|
2020 |
|
|
2019 |
|
|
2018 |
|
|||
|
Net loan charge-offs (recoveries) |
|
$ |
(149 |
) |
|
$ |
(53 |
) |
|
$ |
235 |
|
|
Provision (credit) for loan losses charged to expense |
|
|
10,112 |
|
|
|
1,035 |
|
|
|
780 |
|
|
Net loan charge-offs (recoveries) as a percent of average outstanding loans |
|
|
(0.01 |
)% |
|
|
(0.00 |
)% |
|
|
0.02 |
% |
|
Allowance for loan losses |
|
$ |
25,028 |
|
|
$ |
14,767 |
|
|
$ |
13,679 |
|
|
Allowance for loan losses as a percent of year-end outstanding loans |
|
|
1.22 |
% |
|
|
0.86 |
% |
|
|
0.88 |
% |
|
Impaired loans, excluding purchase credit impaired loans (PCI) |
|
$ |
2,666 |
|
|
$ |
3,597 |
|
|
$ |
2,857 |
|
|
Impaired loans as a percent of gross year-end loans (1) |
|
|
0.13 |
% |
|
|
0.21 |
% |
|
|
0.18 |
% |
|
Nonaccrual and 90 days or more past due loans, excluding PCI |
|
$ |
5,125 |
|
|
$ |
5,599 |
|
|
$ |
5,869 |
|
|
Nonaccrual and 90 days or more past due loans, excluding PCI as a percent of gross year-end loans (1) |
|
|
0.25 |
% |
|
|
0.33 |
% |
|
|
0.38 |
% |
|
(1) |
Nonaccrual loans and impaired loans are defined differently. Some loans may be included in both categories, whereas other loans may only be included in one category. A loan is considered nonaccrual if it is maintained on a cash basis because of deterioration in the borrower’s financial condition, where payment in full of principal or interest is not expected and where the principal and interest have been in default for 90 days, unless the asset is both well-secured and in process of collection. A loan is considered impaired when it is probable that all of the interest and principal due will not be collected according to the terms of the original contractual agreement. |
The Company’s policy is to maintain the allowance for loan losses at a level sufficient to provide for probable losses incurred in the current portfolio. Management believes the analysis of the allowance for loan losses supported a reserve of $25,028 at December 31, 2020. The Company provides for loan losses through regular provisions to the allowance for loan losses as necessary. The amount of the provision is affected by loan charge-offs, recoveries and changes in specific and general allocations required for the allowance for loan losses. A number of factors impact the provisions for loan losses, such as the level of higher risk loans in the portfolio, changes in practices related to loans, changes in collateral values and other factors. We continue to actively manage this process and have provided to maintain the reserve at a level that assures adequate coverage ratios.
Provisions for loan losses totaled $10,112, $1,035 and $780 in 2020, 2019 and 2018, respectively. The Company’s provision for loan losses increased $9,077 during 2020. The increase in the provision was due to an increase in the bank’s qualitative factors, primarily changes in international, national, regional and local conditions, related to the economic shutdown driven by COVID-19 and the ongoing payment deferrals on loans modified under the Coronavirus Aid Relief, and Economic Security Act (“CARES Act”). Economic impacts related to the COVID-19 pandemic include the loss of revenue being experience by our business clients, disruption of supply chains, additional employee costs for businesses due to the pandemic, higher unemployment rates throughout our footprint and a large number of customers requesting payment relief. Our Commercial, Commercial Real Estate and Consumer portfolios have been, and are expected to continue to be impacted the most.
Efforts are continually made to analyze each segment of the loan portfolio and quantify risk to assure that reserves are appropriate for each segment and the overall portfolio. Management specifically evaluates loans that are
10
impaired, which includes restructured loans, to estimate potential loss. This analysis includes a review of the loss migration calculation for all loan categories as well as fluctuations and trends in various risk factors that have occurred within the portfolios’ economic life cycle. The analysis also includes assessment of qualitative factors such as credit trends, unemployment trends, vacancy trends and loan growth. The composition and overall level of the loan portfolio and charge-off activity are also factors used to determine the amount of the allowance for loan losses.
Management analyzes each impaired commercial and commercial real estate loan relationship with a balance of $350 or larger, on an individual basis and when it is in nonaccrual status or when an analysis of the borrower’s operating results and financial condition indicates that underlying cash flows are not adequate to meet its debt service requirements. Loans held for sale and leases are excluded from consideration as impaired. Loans are generally moved to nonaccrual status when 90 days or more past due. Impaired loans or portions thereof are charged-off when deemed uncollectible.
Noninterest Income
Noninterest income increased $5,739, or 25.6%, to $28,182 for the year ended December 31, 2020, from $22,443 for the comparable 2019 period. The increase was primarily due to increases in net gain on sale of securities of $62, net gain on sale of loans of $5,856, ATM/Interchange fees of $416 and swap fees of $943, which were partially offset by decreases in service charges of $1,107, net gain (loss) on equity securities of $178 and tax refund processing fees of $375.
Net gain on sale of securities increased due to security sales. Management, from time to time, will reposition the investment portfolio to match liquidity needs of the Company. Net gain on sale of loans increased primarily as a result of an increase in volume of loans sold. During the twelve-months ended December 31, 2020, 1,575 loans were sold, totaling $304,026. During the twelve-months ended December 31, 2019, 709 loans were sold, totaling $125,796. ATM/Interchange fees increased as a result of increased transaction volume. Swap fees increased due to the volume of swaps originated during the twelve-months ended December 31, 2020 as compared to the same period of 2019. Service charges decreased due to Civista waiving $93 of service fees on deposit accounts related to the COVID-19 pandemic. In addition, overdraft fees decreased during 2020. Net gain (loss) on equity securities decreased as a result of market value decreases. Additionally, the Company processes state and federal income tax refund payments for customers of third-party income tax preparation vendors for which we receive a fee for processing the refund payments. These tax refund processing fees decreased as a result of a decrease in the volume of transactions processed during 2020 as compared to 2019.
Noninterest Expense
Noninterest expense increased $3,718, or 5.6%, to $70,665 for the year ended December 31, 2020, from $66,947 for the comparable 2019 period. The increase was primarily due to increases in compensation expense of $3,324, FDIC assessments of $590 and software maintenance expense of $310, which were partially offset by decreases in equipment expense of $240 and marketing expense of $337.
The increase in compensation expense was due to increased payroll, overtime pay, 401k expenses, payroll taxes and commission and incentive based costs, offset by decreases in employee insurance costs and unemployment taxes. The year-to-date average full time equivalent (FTE) employees were 453.4 at December 31, 2020, an increase of 8.6 FTEs over 2019, which increased payroll and payroll related expenses. Payroll and payroll related expenses also increased due to annual pay increases and increases in commission based costs as the result of increased loan activity. The year-over-year increase in FDIC assessments was attributable to small bank assessment credits applied to the 2019 assessment charges. The increase in software maintenance expense is due to a general increase in software maintenance contracts. The decrease in equipment expense is due to lower equipment repair and maintenance cost. The decrease in marketing expense is due to decreases in both advertising and business promotion expenses, primarily related to the COVID-19 pandemic. Event cancellations and postponed outreach efforts contributed to the decrease as our focus was on communicating changes in operations, safety protocols, alternative delivery channels, and economic relief programs with the safety and financial wellness of our employees and customers in mind.
11
Income Tax Expense
Federal income tax expense was $4,940 in 2020 compared to $5,683 in 2019. Federal income tax expense as a percentage of pre-tax income was 13.3% in 2020 compared to 14.4% in 2019. A lower federal effective tax rate than the statutory rate of 21% in 2020 and 2019 is primarily due to tax-exempt interest income from state and municipal investments, municipal loans, income from BOLI and low income housing credits.
Comparison of Results of Operations for the Years Ended December 31, 2019 and December 31, 2018
Net Income
The Company’s net income for the year ended December 31, 2019 was $33,878, compared to $14,139 for the year ended December 31, 2018. The change in net income was the result of the items discussed in the following sections.
Net Interest Income
Net interest income for 2019 was $85,100, an increase of $18,993, or 28.7%, from 2018. From 2018 to 2019, average earning assets increased 26.9%, interest income increased $24,377, and interest expense on interest-bearing liabilities increased $5,384. The Company continually examines its rate structure to ensure that its interest rates are competitive and reflective of the current rate environment in which it competes. The increase in net interest income is largely due to the UCB acquisition.
Total interest income increased $24,377 to $98,054 for the year ended December 31, 2019, which is attributable to an increase of $20,776 in interest and fees on loans. This change was the result of an increase in the average balance of loans, accompanied by a higher yield on the portfolio. The average balance of loans increased by $338,196 or 26.5% to $1,612,975 for the year ended December 31, 2019, as compared to $1,274,779 for the year ended December 31, 2018. The loan yield increased to 5.27% for 2019, from 5.04% in 2018. The increase in average loan balances and interest and fees on loans is largely due to the UCB acquisition.
Interest on taxable securities increased $1,814 to $6,584 for the year ended December 31, 2019, compared to $4,770 for the same period in 2018. The average balance of taxable securities increased $40,623 to $200,074 for the year ended December 31, 2019, as compared to $159,451 for the year ended December 31, 2018. The yield on taxable securities increased 38 basis points to 3.35% for 2019, compared to 2.97% for 2018. Interest on tax-exempt securities increased $1,671 to $5,647 for the year ended December 31, 2019, compared to $3,976 for the same period in 2018. The average balance of tax-exempt securities increased $58,265 to $172,812 for the year ended December 31, 2019 as compared to $114,547 for the year ended December 31, 2018. The yield on tax-exempt securities decreased 7 basis points to 4.36% for 2019, compared to 4.43% for 2018.
Total interest expense increased $5,384 or 71.1% to $12,954 for the year ended December 31, 2019, compared with $7,570 for the same period in 2018. The change in interest expense can be attributed to an increase in the average balance of interest-bearing liabilities and an increase in the average rate paid. For the year ended December 31, 2019, the average balance of interest-bearing liabilities increased $305,246 to $1,348,095, as compared to $1,042,849 for the year ended December 31, 2018. Interest incurred on deposits increased by $4,299 to $8,057 for the year ended December 31, 2019, compared to $3,758 for the same period in 2018, largely due to the UCB acquisition. The change in deposit expense was due to an increase in the average balance of interest-bearing deposits of $264,066 for the year ended December 31, 2019 as compared to the same period in 2018, largely due to the UCB acquisition. In addition, the average rate paid on demand and savings accounts increased from 0.21% in 2018 to 0.33% in 2019 and the average rate paid on time deposits increased from 1.22% to 1.92% in 2019. Interest expense incurred on FHLB advances and subordinated debentures increased 28.6% from 2018. The increase was due to a $41,294 increase in average balance from 2018 and a 2 basis point increase in rate from 2018.
Refer to “Distribution of Assets, Liabilities and Shareholders’ Equity; Interest Rates and Interest Differential” and “Changes in Interest Income and Interest Expense Resulting from Changes in Volume and Changes in Rate” on pages 14 through 16 for further analysis of the impact of changes in interest-bearing assets and liabilities on the Company’s net interest income.
12
Provision and Allowance for Loan Losses
Management believes the analysis of the allowance for loan losses supported a reserve of $14,767 at December 31, 2019.
Provisions (credits) for loan losses totaled $1,035 and, $780 in 2019 and 2018, respectively. The Company’s provision for loan losses increased $255 during 2019 to support loan growth.
Noninterest Income
Noninterest income increased $4,312, or 23.8%, to $22,443 for the year ended December 31, 2019, from $18,131 for the comparable 2018 period. The increase was primarily due to increases in service charges of $1,187, net gain on sale of securities of $445, net gain on equity securities of $95, net gain on sale of loans of $1,086, ATM/Interchange fees of $1,262 and bank owned life insurance of $289.
Service charges, ATM/Interchange fees and bank owned life insurance income increased primarily due to the Company’s acquisition of UCB during the third quarter of 2018. Net gain (loss) on sale of securities increased as a result of management’s decision to reposition the investment portfolio in 2018, which resulted in losses on the sales. Net gain on equity securities increased as a result of market value adjustments. Net gain on sale of loans increased primarily as a result of an increase in the volume of loans sold and the average loan balance of loans sold.
Noninterest Expense
Noninterest expense increased $268, or 0.4%, to $66,947 for the year ended December 31, 2019, from $66,679 for the comparable 2018 period. The increase was primarily due to increases in compensation expense of $1,857, net occupancy expense of $472, equipment expense of $592, state franchise tax of $473, amortization of intangible assets of $579, ATM expense of $818, marketing expense of $229, software maintenance expense of $387 and other operating expense of $2,340, which were partially offset by decreases in contracted data processing expense of $5,308, FDIC assessments of $398 and professional services expense of $1,385.
Compensation expense increased mainly due to being a larger company as a result of the acquisition of UCB. The Company had an average of 444.8 full time equivalent (FTE) employees during 2019, an increase of 74.7 FTEs over 2018. In addition, payroll and payroll related expenses increased due to annual pay increases and increases in commission based costs and employee insurance costs. The increases in net occupancy expense, equipment expense, amortization of intangible assets, ATM expense and marketing expense are primarily due to being a larger company as a result of the acquisition of UCB. The increase in state franchise taxes was attributable to an increase in equity capital, which is the basis of the Ohio Financial Institutions tax. Other operating expense increased due to general increases in components of other operating expenses mainly due to being a larger company as a result of the acquisition of UCB. Contracted data processing decreased due to $5,516 of UCB merger expenses paid in 2018 related to the conversion of UCB’s core system data to the Company’s core system. Professional services expense decreased due to $1,149 of legal and consulting expense paid in 2018 related to the merger with UCB. The decrease in FDIC assessment is due to a small bank assessment credit applied to the Company’s 2019 assessment.
Income Tax Expense
Federal income tax expense was $5,683 in 2019 compared to $2,640 in 2018. Federal income tax expense as a percentage of pre-tax income was 14.4% in 2019 compared to 15.7% in 2018. A lower federal effective tax rate than the statutory rate of 21% in 2019 and 2018 is primarily due to tax-exempt interest income from state and municipal investments, municipal loans, income from BOLI and low income housing credits.
13
Distribution of Assets, Liabilities and Shareholders’ Equity;
Interest Rates and Interest Differential
The following table sets forth, for the years ended December 31, 2020, 2019 and 2018, the distribution of assets, including interest amounts and average rates of major categories of interest-earning assets and interest-bearing liabilities (Amounts in thousands):
|
|
|
2020 |
|
|
2019 |
|
|
2018 |
|
|||||||||||||||||||||||||||
|
Assets |
|
Average balance |
|
|
Interest |
|
|
Yield/ rate |
|
|
Average balance |
|
|
Interest |
|
|
Yield/ rate |
|
|
Average balance |
|
|
Interest |
|
|
Yield/ rate |
|
|||||||||
|
Interest-earning assets: |
|
|
|
|
|
|
|
|
|
|
|
|
|
|
|
|
|
|
|
|
|
|
|
|
|
|
|
|
|
|
|
|
|
|
|
|
|
Loans (1)(2)(3)(5) |
|
$ |
1,953,472 |
|
|
$ |
87,777 |
|
|
|
4.49 |
% |
|
$ |
1,612,975 |
|
|
$ |
84,972 |
|
|
|
5.27 |
% |
|
$ |
1,274,779 |
|
|
$ |
64,196 |
|
|
|
5.04 |
% |
|
Taxable securities (4) |
|
|
183,721 |
|
|
|
5,359 |
|
|
|
3.03 |
% |
|
|
200,074 |
|
|
|
6,584 |
|
|
|
3.35 |
% |
|
|
159,451 |
|
|
|
4,770 |
|
|
|
2.97 |
% |
|
Non-taxable securities (4)(5) |
|
|
202,982 |
|
|
|
6,123 |
|
|
|
4.15 |
% |
|
|
172,812 |
|
|
|
5,647 |
|
|
|
4.36 |
% |
|
|
114,547 |
|
|
|
3,976 |
|
|
|
4.43 |
% |
|
Interest-bearing deposits in other banks |
|
|
155,960 |
|
|
|
606 |
|
|
|
0.39 |
% |
|
|
38,359 |
|
|
|
851 |
|
|
|
2.22 |
% |
|
|
45,766 |
|
|
|
735 |
|
|
|
1.61 |
% |
|
Total interest income assets |
|
|
2,496,135 |
|
|
|
99,865 |
|
|
|
4.10 |
% |
|
|
2,024,220 |
|
|
|
98,054 |
|
|
|
4.95 |
% |
|
|
1,594,543 |
|
|
|
73,677 |
|
|
|
4.69 |
% |
|
Noninterest-earning assets: |
|
|
|
|
|
|
|
|
|
|
|
|
|
|
|
|
|
|
|
|
|
|
|
|
|
|
|
|
|
|
|
|
|
|
|
|
|
Cash and due from financial institutions |
|
|
77,848 |
|
|
|
|
|
|
|
|
|
|
|
47,472 |
|
|
|
|
|
|
|
|
|
|
|
43,247 |
|
|
|
|
|
|
|
|
|
|
Premises and equipment, net |
|
|
22,831 |
|
|
|
|
|
|
|
|
|
|
|
21,946 |
|
|
|
|
|
|
|
|
|
|
|
19,045 |
|
|
|
|
|
|
|
|
|
|
Accrued interest receivable |
|
|
9,043 |
|
|
|
|
|
|
|
|
|
|
|
7,088 |
|
|
|
|
|
|
|
|
|
|
|
5,514 |
|
|
|
|
|
|
|
|
|
|
Intangible assets |
|
|
84,953 |
|
|
|
|
|
|
|
|
|
|
|
85,744 |
|
|
|
|
|
|
|
|
|
|
|
45,524 |
|
|
|
|
|
|
|
|
|
|
Other assets |
|
|
37,675 |
|
|
|
|
|
|
|
|
|
|
|
24,273 |
|
|
|
|
|
|
|
|
|
|
|
17,678 |
|
|
|
|
|
|
|
|
|
|
Bank owned life insurance |
|
|
45,454 |
|
|
|
|
|
|
|
|
|
|
|
44,352 |
|
|
|
|
|
|
|
|
|
|
|
30,483 |
|
|
|
|
|
|
|
|
|
|
Less allowance for loan losses |
|
|
(19,231 |
) |
|
|
|
|
|
|
|
|
|
|
(13,984 |
) |
|
|
|
|
|
|
|
|
|
|
(13,211 |
) |
|
|
|
|
|
|
|
|
|
Total |
|
$ |
2,754,708 |
|
|
|
|
|
|
|
|
|
|
$ |
2,241,111 |
|
|
|
|
|
|
|
|
|
|
$ |
1,742,823 |
|
|
|
|
|
|
|
|
|
|
(1) |
For purposes of these computations, the daily average loan amounts outstanding are net of unearned income and include loans held for sale. |
|
(2) |
Included in loan interest income are loan fees of $1,025 in 2020, $1,227 in 2019 and $776 in 2018. |
|
(3) |
Non-accrual loans are included in loan totals and do not have a material impact on the analysis presented. |
|
(4) |
Average balance is computed using the carrying value of securities. The average yield has been computed using the historical amortized cost average balance for available-for-sale securities. |
|
(5) |
Yield/Rate is calculated using the tax-equivalent adjustment of 21% for 2020, 2019 and 2018. |
14
Distribution of Assets, Liabilities and Shareholders’ Equity;
Interest Rates and Interest Differential (Continued)
The following table sets forth, for the years ended December 31, 2020, 2019 and 2018, the distribution of liabilities and shareholders’ equity, including interest amounts and average rates of major categories of interest-earning assets and interest-bearing liabilities (Amounts in thousands):
|
|
|
2020 |
|
|
2019 |
|
|
2018 |
|
|||||||||||||||||||||||||||
|
Liabilities and Shareholders’ Equity |
|
Average balance |
|
|
Interest |
|
|
Yield/ rate |
|
|
Average balance |
|
|
Interest |
|
|
Yield/ rate |
|
|
Average balance |
|
|
Interest |
|
|
Yield/ rate |
|
|||||||||
|
Interest-bearing liabilities: |
|
|
|
|
|
|
|
|
|
|
|
|
|
|
|
|
|
|
|
|
|
|
|
|
|
|
|
|
|
|
|
|
|
|
|
|
|
Savings and interest-bearing demand accounts |
|
$ |
1,050,544 |
|
|
$ |
1,813 |
|
|
|
0.17 |
% |
|
$ |
869,340 |
|
|
$ |
2,871 |
|
|
|
0.33 |
% |
|
$ |
685,497 |
|
|
$ |
1,442 |
|
|
|
0.21 |
% |
|
Certificates of deposit |
|
|
288,262 |
|
|
|
5,068 |
|
|
|
1.76 |
% |
|
|
269,823 |
|
|
|
5,186 |
|
|
|
1.92 |
% |
|
|
189,600 |
|
|
|
2,316 |
|
|
|
1.22 |
% |
|
Short-term Federal Home Loan Bank advances |
|
|
8,151 |
|
|
|
134 |
|
|
|
1.64 |
% |
|
|
112,088 |
|
|
|
2,600 |
|
|
|
2.32 |
% |
|
|
113,520 |
|
|
|
2,347 |
|
|
|
2.07 |
% |
|
Long-term Federal Home Loan Bank advances |
|
|
125,000 |
|
|
|
1,798 |
|
|
|
1.44 |
% |
|
|
48,959 |
|
|
|
852 |
|
|
|
1.74 |
% |
|
|
6,233 |
|
|
|
124 |
|
|
|
1.99 |
% |
|
Other borrowings |
|
|
101,295 |
|
|
|
354 |
|
|
|
0.35 |
% |
|
|
— |
|
|
|
— |
|
|
|
— |
|
|
|
— |
|
|
|
— |
|
|
|
— |
|
|
Securities sold under repurchase agreements |
|
|
24,390 |
|
|
|
25 |
|
|
|
0.10 |
% |
|
|
18,321 |
|
|
|
19 |
|
|
|
0.10 |
% |
|
|
18,456 |
|
|
|
18 |
|
|
|
0.10 |
% |
|
Federal funds purchased |
|
|
288 |
|
|
|
1 |
|
|
|
0.35 |
% |
|
|
137 |
|
|
|
3 |
|
|
|
2.19 |
% |
|
|
116 |
|
|
|
3 |
|
|
|
2.59 |
% |
|
Subordinated debentures |
|
|
29,427 |
|
|
|
945 |
|
|
|
3.21 |
% |
|
|
29,427 |
|
|
|
1,423 |
|
|
|
4.84 |
% |
|
|
29,427 |
|
|
|
1,320 |
|
|
|
4.49 |
% |
|
Total interest-bearing liabilities |
|
|
1,627,357 |
|
|
|
10,138 |
|
|
|
0.62 |
% |
|
|
1,348,095 |
|
|
|
12,954 |
|
|
|
0.96 |
% |
|
|
1,042,849 |
|
|
|
7,570 |
|
|
|
0.73 |
% |
|
Noninterest-bearing liabilities: |
|
|
|
|
|
|
|
|
|
|
|
|
|
|
|
|
|
|
|
|
|
|
|
|
|
|
|
|
|
|
|
|
|
|
|
|
|
Demand deposits |
|
|
739,648 |
|
|
|
|
|
|
|
|
|
|
|
550,638 |
|
|
|
|
|
|
|
|
|
|
|
466,763 |
|
|
|
|
|
|
|
|
|
|
Other liabilities |
|
|
51,242 |
|
|
|
|
|
|
|
|
|
|
|
24,072 |
|
|
|
|
|
|
|
|
|
|
|
15,840 |
|
|
|
|
|
|
|
|
|
|
|
|
|
790,890 |
|
|
|
|
|
|
|
|
|
|
|
574,710 |
|
|
|
|
|
|
|
|
|
|
|
482,603 |
|
|
|
|
|
|
|
|
|
|
Shareholders’ equity |
|
|
336,461 |
|
|
|
|
|
|
|
|
|
|
|
318,306 |
|
|
|
|
|
|
|
|
|
|
|
217,371 |
|
|
|
|
|
|
|
|
|
|
Total |
|
$ |
2,754,708 |
|
|
|
|
|
|
|
|
|
|
$ |
2,241,111 |
|
|
|
|
|
|
|
|
|
|
$ |
1,742,823 |
|
|
|
|
|
|
|
|
|
|
Net interest income and interest rate spread (1) |
|
|
|
|
|
$ |
89,727 |
|
|
|
3.48 |
% |
|
|
|
|
|
$ |
85,100 |
|
|
|
3.99 |
% |
|
|
|
|
|
$ |
66,107 |
|
|
|
3.96 |
% |
|
Net interest margin (2) |
|
|
|
|
|
|
|
|
|
|
3.70 |
% |
|
|
|
|
|
|
|
|
|
|
4.31 |
% |
|
|
|
|
|
|
|
|
|
|
4.21 |
% |
|
(1) |
Interest rate spread is calculated by subtracting the rate on average interest-bearing liabilities from the yield on average interest-earning assets. |
|
(2) |
Net interest margin is calculated by dividing tax-equivalent adjusted net interest income by average interest-earning assets. |
15
Changes in Interest Income and Interest Expense
Resulting from Changes in Volume and Changes in Rate
The following table sets forth, for the periods indicated, a summary of the changes in interest income and interest expense resulting from changes in volume and changes in rate (Amounts in thousands):
|
|
|
Increase (decrease) due to: |
|
|||||||||
|
|
|
Volume (1) |
|
|
Rate (1) |
|
|
Net |
|
|||
|
2020 compared to 2019 |
|
|
|
|
|
|
|
|
|
|
|
|
|
Interest income: |
|
|
|
|
|
|
|
|
|
|
|
|
|
Loans |
|
$ |
16,383 |
|
|
$ |
(13,578 |
) |
|
$ |
2,805 |
|
|
Taxable securities |
|
|
(633 |
) |
|
|
(592 |
) |
|
|
(1,225 |
) |
|
Nontaxable securities |
|
|
761 |
|
|
|
(285 |
) |
|
|
476 |
|
|
Interest-bearing deposits in other banks |
|
|
913 |
|
|
|
(1,158 |
) |
|
|
(245 |
) |
|
Total interest income |
|
$ |
17,424 |
|
|
$ |
(15,613 |
) |
|
$ |
1,811 |
|
|
Interest expense: |
|
|
|
|
|
|
|
|
|
|
|
|
|
Savings and interest-bearing demand accounts |
|
$ |
512 |
|
|
$ |
(1,570 |
) |
|
$ |
(1,058 |
) |
|
Certificates of deposit |
|
|
341 |
|
|
|
(459 |
) |
|
|
(118 |
) |
|
Short-term Federal Home Loan Bank advances |
|
|
(1,877 |
) |
|
|
(589 |
) |
|
|
(2,466 |
) |
|
Long-term Federal Home Loan Bank advances |
|
|
1,117 |
|
|
|
(171 |
) |
|
|
946 |
|
|
Securities sold under repurchase agreements |
|
|
6 |
|
|
|
— |
|
|
|
6 |
|
|
Federal funds purchased |
|
|
2 |
|
|
|
(4 |
) |
|
|
(2 |
) |
|
Other borrowings |
|
|
354 |
|
|
|
— |
|
|
|
354 |
|
|
Subordinated debentures |
|
|
— |
|
|
|
(478 |
) |
|
|
(478 |
) |
|
Total interest expense |
|
$ |
455 |
|
|
$ |
(3,271 |
) |
|
$ |
(2,816 |
) |
|
Net interest income |
|
$ |
16,969 |
|
|
$ |
(12,342 |
) |
|
$ |
4,627 |
|
|
2019 compared to 2018 |
|
|
|
|
|
|
|
|
|
|
|
|
|
Interest income: |
|
|
|
|
|
|
|
|
|
|
|
|
|
Loans |
|
$ |
17,700 |
|
|
$ |
3,076 |
|
|
$ |
20,776 |
|
|
Taxable securities |
|
|
1,159 |
|
|
|
655 |
|
|
|
1,814 |
|
|
Nontaxable securities |
|
|
1,728 |
|
|
|
(57 |
) |
|
|
1,671 |
|
|
Interest-bearing deposits in other banks |
|
|
(132 |
) |
|
|
248 |
|
|
|
116 |
|
|
Total interest income |
|
$ |
20,455 |
|
|
$ |
3,922 |
|
|
$ |
24,377 |
|
|
Interest expense: |
|
|
|
|
|
|
|
|
|
|
|
|
|
Savings and interest-bearing demand accounts |
|
$ |
457 |
|
|
$ |
972 |
|
|
$ |
1,429 |
|
|
Certificates of deposit |
|
|
1,219 |
|
|
|
1,651 |
|
|
|
2,870 |
|
|
Short-term Federal Home Loan Bank advances |
|
|
(30 |
) |
|
|
283 |
|
|
|
253 |
|
|
Long-term Federal Home Loan Bank advances |
|
|
745 |
|
|
|
(17 |
) |
|
|
728 |
|
|
Securities sold under repurchase agreements |
|
|
— |
|
|
|
1 |
|
|
|
1 |
|
|
Subordinated debentures |
|
|
— |
|
|
|
103 |
|
|
|
103 |
|
|
Total interest expense |
|
$ |
2,391 |
|
|
$ |
2,993 |
|
|
$ |
5,384 |
|
|
Net interest income |
|
$ |
18,064 |
|
|
$ |
929 |
|
|
$ |
18,993 |
|
|
(1) |
The change in interest income and interest expense due to changes in both volume and rate, which cannot be segregated, has been allocated proportionately to the change due to volume and the change due to rate. |
Liquidity and Capital Resources
Civista maintains a conservative liquidity position. All securities are classified as available for sale. At December 31, 2020, securities with maturities of one year or less totaled $11,898, or 3.3% of the total securities portfolio. The available for sale portfolio helps to provide Civista with the ability to meet its funding needs. The Consolidated Statements of Cash Flows contained in the Consolidated Financial Statements detail the Company’s cash flows from operating activities resulting from net earnings.
16
Net cash provided by operating activities for 20 20 , 201 9 and 201 8 was $ 43 , 229 , $ 39 , 526 and $ 19 , 957 , respectively. The primary additions to cash from operating activities are from net income, adjusted for amortization of intangible assets, amortization of securities net of accretion, the provision for loan losses, depreciation and proceeds from sale of loans. The primary use of cash from operating activities is from loans originated for sale. Net cash used for investing activities was $ 351 , 044 , $ 150 , 509 and $ 34 , 118 in 20 20 , 201 9 and 201 8 , respectively, principally reflecting our loan and investment security activities. Deposit s and borrowing s comprised most of our financing activities, which resulted in net cash provided of $ 398 , 802 , $ 1 1 6 , 739 and $ 1 6 , 421 for 20 20 , 201 9 and 201 8 respectively.
Future loan demand of Civista can be funded by increases in deposit accounts, proceeds from payments on existing loans, the maturity of securities and the sale of securities classified as available for sale. Additional sources of funds may also come from borrowing in the Federal Funds market and/or borrowing from the FHLB. As of December 31, 2020, Civista had total credit availability with the FHLB of $612,308, of which $467,308 was outstanding.
On a separate entity basis, CBI’s primary source of funds is dividends paid by its subsidiaries, primarily by Civista. Generally, subject to applicable minimum capital requirements, Civista may declare and pay a dividend without the approval of the Federal Reserve Bank of Cleveland and the State of Ohio Department of Commerce, Division of Financial Institutions, provided the total dividends in a calendar year do not exceed the total of its profits for that year combined with its retained profits for the two preceding years. At December 31, 2020, Civista was able to pay approximately $53,484 of dividends to CBI without obtaining regulatory approval. During 2020, Civista paid dividends totaling $15,300 to CBI. This represented approximately 48 percent of Civista’s earnings for the year.
The Company manages its liquidity and capital through quarterly Asset/Liability Management Committee (ALCO) meetings. The ALCO discusses issues like those in the above paragraphs as well as others that may affect the future liquidity and capital position of the Company. The ALCO also examines interest rate risk and the effect that changes in rates will have on the Company. For more information about interest rate risk, please refer to the “Quantitative and Qualitative Disclosures about Market Risk” section.
Capital Adequacy
Shareholders’ equity totaled $350,108 at December 31, 2020 compared to $330,126 at December 31, 2019. The increase in shareholders’ equity resulted primarily from net income of $32,192, a $819 net decrease in the Company’s pension liability and an increase in the fair value of securities available for sale, net of tax, of $8,564, which was offset by dividends on common shares of $7,118. In addition, the Company repurchased common shares pursuant to its publicly-announced share purchase program totaling $13,454 during 2020.
During the first quarter of 2015, the Company adopted the new BASEL III regulatory capital framework as approved by the federal banking agencies. The BASEL III rules also require the Company to maintain minimum amounts and ratios of Common Equity Tier 1 (“CET1”) Capital to risk-weighted assets (as these terms are defined in the BASEL III rules). Under the BASEL III rules, the Company elected to opt-out of including accumulated other comprehensive income in regulatory capital. All of the Company’s capital ratios exceeded the regulatory minimum guidelines as of December 31, 2020 and 2019 as identified in the following table:
|
|
|
Total Risk Based Capital |
|
|
Tier I Risk Based Capital |
|
|
CET1 Risk Based Capital |
|
|
Leverage Ratio |
|
||||
|
Company Ratios—December 31, 2020 |
|
|
16.0 |
% |
|
|
14.7 |
% |
|
|
13.2 |
% |
|
|
10.8 |
% |
|
Company Ratios—December 31, 2019 |
|
|
16.1 |
% |
|
|
15.3 |
% |
|
|
13.6 |
% |
|
|
12.3 |
% |
|
For Capital Adequacy Purposes |
|
|
8.0 |
% |
|
|
6.0 |
% |
|
|
4.5 |
% |
|
|
4.0 |
% |
|
To Be Well Capitalized Under Prompt Corrective Action Provisions |
|
|
10.0 |
% |
|
|
8.0 |
% |
|
|
6.5 |
% |
|
|
5.0 |
% |
Common equity for the CET1 risk-based capital ratio includes common stock (plus related surplus) and retained earnings, plus limited amounts of minority interests in the form of common stock, less the majority of certain regulatory deductions.
Tier 1 capital includes common equity as defined for the CET1 risk-based capital ratio, plus certain non-cumulative preferred stock and related surplus, cumulative preferred stock and related surplus and trust preferred securities that have been grandfathered (but which are not permitted going forward), and limited amounts of minority interests in the form of additional Tier 1 capital instruments, less certain deductions.
17
Tier 2 capital, which can be included in the total capital ratio, includes certain capital instruments (such as subordinated debt) and limited amounts of the allowance for loan and lease losses, subject to new eligibility criteria, less applicable deductions.
The deductions from CET1 capital include goodwill and other intangibles, certain deferred tax assets, mortgage-servicing assets above certain levels, gains on sale in connection with a securitization, investments in a banking organization’s own capital instruments and investments in the capital of unconsolidated financial institutions (above certain levels). The deductions were phased in from 2015 through 2019.
Under applicable regulatory guidelines, capital is compared to the relative risk related to the balance sheet. To derive the risk included in the balance sheet, one of several risk weights is applied to different balance sheet and off-balance sheet assets, primarily based on the relative credit risk of the counterparty. The capital amounts and classification are also subject to qualitative judgments by the regulators about components, risk weightings and other factors.
The BASEL III regulatory capital rules and regulations also place restrictions on the payment of capital distributions, including dividends, and certain discretionary bonus payments to executive officers if the company does not hold a capital conservation buffer of greater than 2.5 percent composed of CET1 capital above its minimum risk-based capital requirements, or if its eligible retained income is negative in that quarter and its capital conservation buffer ratio was less than 2.5 percent at the beginning of the quarter. The capital conservation buffer began to phase in starting on January 1, 2016, at 0.625%, and was fully phased in effective January 1, 2019, at 2.5%. The implementation of Basel III did not have a material impact on CBI’s or Civista’ capital ratios.
Effects of Inflation
The Company’s balance sheet is typical of financial institutions and reflects a net positive monetary position whereby monetary assets exceed monetary liabilities. Monetary assets and liabilities are those which can be converted to a fixed number of dollars and include cash assets, securities, loans, money market instruments, deposits and borrowed funds.
During periods of inflation, a net positive monetary position may result in an overall decline in purchasing power of an entity. No clear evidence exists of a relationship between the purchasing power of an entity’s net positive monetary position and its future earnings. Moreover, the Company’s ability to preserve the purchasing power of its net positive monetary position will be partly influenced by the effectiveness of its asset/liability management program. As part of the asset/liability management process, management reviews and monitors information and projections on inflation as published by the Federal Reserve Board and other sources. This information speaks to inflation as determined by its impact on consumer prices and also the correlation of inflation and interest rates. This information is but one component in an asset/liability management process designed to limit the impact of inflation on the Company. Management does not believe that the effect of inflation on its nonmonetary assets (primarily bank premises and equipment) is material as such assets are not held for resale and significant disposals are not anticipated.
Fair Value of Financial Instruments
The Company has disclosed the fair value of its financial instruments at December 31, 2020 and 2019 in Note 17 to the Consolidated Financial Statements. The fair value of loans at December 31, 2020 was 101.5% of the carrying value compared to 101.2% at December 31, 2019. The fair value of deposits at December 31, 2020 was 100.1% of the carrying value compared to 100.1% at December 31, 2019. Changes in fair value were primarily due to changes in the discount values used to measure fair value.
18
Contractual Obligations
The following table represents significant fixed and determinable contractual obligations of the Company as of December 31, 2020.
|
Contractual Obligations |
|
One year or less |
|
|
One to three years |
|
|
Three to five years |
|
|
Over five years |
|
|
Total |
|
|||||
|
Deposits without a stated maturity |
|
$ |
1,902,560 |
|
|
$ |
— |
|
|
$ |
— |
|
|
$ |
— |
|
|
$ |
1,902,560 |
|
|
Certificates of deposit and IRAs |
|
|
209,556 |
|
|
|
69,837 |
|
|
|
6,219 |
|
|
|
1,226 |
|
|
|
286,838 |
|
|
FHLB advances, securities sold under agreements to repurchase and U.S. Treasury interest-bearing demand note |
|
|
— |
|
|
|
— |
|
|
|
— |
|
|
|
125,000 |
|
|
|
125,000 |
|
|
Subordinated debentures (1) |
|
|
— |
|
|
|
— |
|
|
|
— |
|
|
|
29,427 |
|
|
|
29,427 |
|
|
Operating leases |
|
|
579 |
|
|
|
613 |
|
|
|
416 |
|
|
|
491 |
|
|
|
2,099 |
|
|
(1) |
The subordinated debentures consist of $2,000, $2,500, $5,000, $7,500, and $12,500 debentures. |
The Company has retail repurchase agreements with clients within its local market areas. These borrowings are collateralized with securities owned by the Company. See Note 12 to the Consolidated Financial Statements for further detail. The Company also has a cash management advance line of credit and outstanding letters of credit with the FHLB. For further discussion, refer to Note 10 and Note 11 to the Consolidated Financial Statements.
Quantitative and Qualitative Disclosures about Market Risk
The Company’s primary market risk exposure is interest-rate risk and, to a lesser extent, liquidity risk. All of the Company’s transactions are denominated in U.S. dollars with no specific foreign exchange exposure.
Interest-rate risk is the exposure of a banking organization’s financial condition to adverse movements in interest rates. Accepting this risk can be an important source of profitability and shareholder value. However, excessive levels of interest-rate risk can pose a significant threat to the Company’s earnings and capital base. Accordingly, effective risk management that maintains interest-rate risk at prudent levels is essential to the Company’s safety and soundness.
Evaluating a financial institution’s exposure to changes in interest rates includes assessing both the adequacy of the management process used to control interest-rate risk and the organization’s quantitative level of exposure. When assessing the interest-rate risk management process, the Company seeks to ensure that appropriate policies, procedures, management information systems and internal controls are in place to maintain interest-rate risk at prudent levels with consistency and continuity. Evaluating the quantitative level of interest rate risk exposure requires the Company to assess the existing and potential future effects of changes in interest rates on its consolidated financial condition, including capital adequacy, earnings, liquidity and, where appropriate, asset quality.
The Federal Reserve Board, together with the Office of the Comptroller of the Currency and the Federal Deposit Insurance Corporation, adopted a Joint Agency Policy Statement on interest-rate risk, effective June 26, 1996. The policy statement provides guidance to examiners and bankers on sound practices for managing interest-rate risk, which will form the basis for ongoing evaluation of the adequacy of interest-rate risk management at supervised institutions. The policy statement also outlines fundamental elements of sound management that have been identified in prior Federal Reserve guidance and discusses the importance of these elements in the context of managing interest-rate risk. Specifically, the guidance emphasizes the need for active board of director and senior management oversight and a comprehensive risk-management process that effectively identifies, measures, and controls interest-rate risk. Financial institutions derive their income primarily from the excess of interest collected over interest paid. The rates of interest an institution earns on its assets and owes on its liabilities generally are established contractually for a period of time. Since market interest rates change over time, an institution is exposed to lower profit margins (or losses) if it cannot adapt to interest-rate changes. For example, assume that an institution’s assets carry intermediate- or long-term fixed rates and that those assets were funded with short-term liabilities. If market interest rates rise by the time the short-term liabilities must be refinanced, the increase in the institution’s interest expense on its liabilities may not be sufficiently offset if assets continue to earn at the long-term fixed rates. Accordingly, an institution’s profits could decrease on existing assets because the institution will have
19
either lower net interest income or, possibly, net interest expense. Similar risks exist when assets are subject to contractual interest-rate ceilings, or rate sensitive assets are funded by longer-term, fixed-rate liabilities in a decreasing-rate environment.
Several techniques may be used by an institution to minimize interest-rate risk. One approach used by the Company is to periodically analyze its assets and liabilities and make future financing and investment decisions based on payment streams, interest rates, contractual maturities, and estimated sensitivity to actual or potential changes in market interest rates. Such activities fall under the broad definition of asset/liability management. The Company’s primary asset/liability management technique is the measurement of the Company’s asset/liability gap, that is, the difference between the cash flow amounts of interest sensitive assets and liabilities that will be refinanced (or repriced) during a given period. For example, if the asset amount to be repriced exceeds the corresponding liability amount for a certain day, month, year, or longer period, the institution is in an asset sensitive gap position. In this situation, net interest income would increase if market interest rates rose or decrease if market interest rates fell.
If, alternatively, more liabilities than assets will reprice, the institution is in a liability sensitive position. Accordingly, net interest income would decline when rates rose and increase when rates fell. Also, these examples assume that interest rate changes for assets and liabilities are of the same magnitude, whereas actual interest rate changes generally differ in magnitude for assets and liabilities.
Several ways an institution can manage interest-rate risk include selling existing assets or repaying certain liabilities and matching repricing periods for new assets and liabilities, for example, by shortening terms of new loans or securities. Financial institutions are also subject to prepayment risk in falling rate environments. For example, mortgage loans and other financial assets may be prepaid by a debtor so that the debtor may refund its obligations at new, lower rates. The Company does not have significant derivative financial instruments and does not intend to purchase a significant amount of such instruments in the near future. Prepayments of assets carrying higher rates reduce the Company’s interest income and overall asset yields. A large portion of an institution’s liabilities may be short term or due on demand, while most of its assets may be invested in long term loans or securities. Accordingly, the Company seeks to have in place sources of cash to meet short-term demands. These funds can be obtained by increasing deposits, borrowing, or selling assets. Also, FHLB advances and wholesale borrowings may be used as important sources of liquidity for the Company.
The following table provides information about the Company’s financial instruments that were sensitive to changes in interest rates as of December 31, 2020 and 2019, based on certain prepayment and account decay assumptions that management believes are reasonable. The Company had derivative financial instruments as of December 31, 2020 and 2019. The changes in fair value of the assets and liabilities of the underlying contracts offset each other. For more information about derivative financial instruments see Note 24 to the Consolidated Financial Statements. Expected maturity date values for interest-bearing core deposits were calculated based on estimates of the period over which the deposits would be outstanding. The Company’s borrowings were tabulated by contractual maturity dates and without regard to any conversion or repricing dates.
20
Net Portfolio Value
|
|
|
December 31, 2020 |
|
|
December 31, 2019 |
|
||||||||||||||||||
|
Change in Rates |
|
Dollar Amount |
|
|
Dollar Change |
|
|
Percent Change |
|
|
Dollar Amount |
|
|
Dollar Change |
|
|
Percent Change |
|
||||||
|
+200bp |
|
$ |
515,754 |
|
|
$ |
44,930 |
|
|
|
10 |
% |
|
$ |
449,843 |
|
|
$ |
31,596 |
|
|
|
8 |
% |
|
+100bp |
|
|
503,010 |
|
|
|
32,186 |
|
|
|
7 |
% |
|
|
437,195 |
|
|
|
18,948 |
|
|
|
5 |
% |
|
Base |
|
|
570,824 |
|
|
|
— |
|
|
|
— |
|
|
|
418,247 |
|
|
|
— |
|
|
|
— |
|
|
-100bp |
|
|
501,686 |
|
|
|
30,862 |
|
|
|
7 |
% |
|
|
394,943 |
|
|
|
(23,304 |
) |
|
|
(6 |
)% |
|
-200bp |
|
|
527,360 |
|
|
|
56,536 |
|
|
|
12 |
% |
|
|
416,878 |
|
|
|
(1,369 |
) |
|
|
0 |
% |
The change in net portfolio value from December 31, 2019 to December 31, 2020, can be attributed to a couple of factors. The yield curve has fallen and steepened from the end of the year and both the volume and mix of assets and funding sources have changed. The volume of loans has increased, and the mix has shifted toward loans. The volume of deposits has increased, with the mix shifting away from certificates of deposit toward deposits. The volume changes and mix shifts from the end of the last year led to an increase in the base net portfolio value. Individually, the asset and liability shifts have led to more volatility, but net to only small changes in volatility. Beyond the change in the base level of net portfolio value, projected movements in rates, up or down, would also lead to changes in market values. The change in the rates up scenarios for both the 100 and 200 basis point movements would lead to a larger decrease in the market value of liabilities. Accordingly, we see an increase in the net portfolio value. However, a 100 and 200 basis point downward change in rates would also lead to an increase in the net portfolio value as the market value of assets would increase more quickly than the market value of liabilities.
Critical Accounting Policies
Allowance for Loan Losses: The allowance for loan losses is regularly reviewed by management to determine that the amount is considered adequate to absorb probable losses in the loan portfolio. If not, an additional provision is made to increase the allowance. This evaluation includes specific loss estimates on certain individually reviewed impaired loans, the pooling of commercial credits risk graded as special mention and substandard that are not individually analyzed, and general loss estimates that are based upon the size, quality, and concentration characteristics of the various loan portfolios, adverse situations that may affect a borrower’s ability to repay, and current economic and industry conditions, among other items.
Those judgments and assumptions that are most critical to the application of this accounting policy are assessing the initial and on-going credit-worthiness of the borrower, the amount and timing of future cash flows of the borrower that are available for repayment of the loan, the sufficiency of underlying collateral, the enforceability of third-party guarantees, the frequency and subjectivity of loan reviews and risk ratings, emerging or changing trends that might not be fully captured in the historical loss experience, and charges against the allowance for actual losses that are greater than previously estimated. These judgments and assumptions are dependent upon or can be influenced by a variety of factors, including the breadth and depth of experience of lending officers, credit administration and the corporate loan review staff that periodically review the status of the loan, changing economic and industry conditions, changes in the financial condition of the borrower and changes in the value and availability of the underlying collateral and guarantees.
Note 1 and Note 5 to the Consolidated Financial Statements provide additional information regarding the Allowance for Loan Losses.
21
Goodwill: The Company accounts for business combinations using the acquisition method of accounting. Accordingly, the identifiable assets acquired and the liabilities assumed are recorded at their estimated fair values as of the date of acquisition with any excess of the cost of the acquisition over the fair value recorded as goodwill. The Company performs an evaluation of goodwill for impairment on an annual basis, or more frequently if events or changes in circumstances indicate that the asset might be impaired. The evaluation for impairment involves comparing the current estimated fair value of the C ompany to its carrying value. If the current estimated fair value exceeds the carrying value, no additional testing is required and an impairment loss is not recorded. If the estimated fair value is less than the carrying value, further valuation procedures are performed that could result in impairment of goodwill being recorded . Management estimated the fair value of the Reporting Unit as of the measurement date utilizing four valuation approaches: the comparable transactions approach, the control premium approach, the public market peers control premium approach and the discounted cash flow approach. These approaches were all considered in reaching a conclusion on fair value. The estimated fair value of the Reporting Unit was then compared to the current carrying value to determine if impairment had occurred. It is our opinion that, as of the November 30, 2020 measurement date, the aggregate fair value of the Reporting Unit exceeds the carrying value of the Reporting Unit. Therefore management concluded that goodwill was not impaired and made no adjustment in 20 20 .
Income Taxes: Management’s determination of the realization of net deferred tax assets is based upon management’s judgment of various future events and uncertainties, including the timing and amount of future income, as well as the implementation of various tax planning strategies to maximize realization of the deferred tax assets. A valuation allowance is provided when it is more likely than not that some portion of the deferred tax asset will not be realized.
Other-Than-Temporary Impairment of Investment Securities: The Company performs a quarterly valuation to determine if a decline in the value of an investment security is other than temporary. Although the term “other than temporary” is not intended to indicate that the decline is permanent, it does indicate that the prospects for a near-term recovery of value are not necessarily favorable, or that there is lack of evidence to support fair values equal to or greater than the carrying value of the investment. Once a decline in value is determined to be other than temporary, the value of the security is reduced and a corresponding charge to earnings is recognized. Management utilizes criteria such as the magnitude and duration of the decline, in addition to the reasons underlying the decline, to determine whether the loss in value is other than temporary.
Pension Benefits: Pension costs and liabilities are dependent on assumptions used in calculating such amounts. These assumptions include discount rates, benefits earned, interest costs, expected return on plan assets, mortality rates, and other factors. In accordance with GAAP, actual results that differ from the assumptions are accumulated and amortized over future periods and, therefore, generally affect recognized expense and the recorded obligation of future periods. While management believes that the assumptions used are appropriate, differences in actual experience or changes in assumptions may affect the Company’s pension obligations and future expense. Our pension benefits are described further in Note 15 of the “Notes to Consolidated Financial Statements.”
Derivative Financial Instruments : In the ordinary course of business, the Company enters into derivative financial instruments in connection with its asset/liability management activities and to accommodate the needs of its customers. Derivative financial instruments are stated at fair value on the Consolidated Statement of Conditions with changes in fair value reposted in current earnings.
22
Management’s Report on Internal Control over Financial Reporting
We, as management of Civista Bancshares, Inc., are responsible for establishing and maintaining effective internal control over financial reporting that is designed to produce reliable financial statements in conformity with United States generally accepted accounting principles. The system of internal control over financial reporting as it relates to the financial statements is evaluated for effectiveness by management and tested for reliability through a program of internal audits. Actions are taken to correct potential deficiencies as they are identified. Any system of internal control, no matter how well designed, has inherent limitations, including the possibility that a control can be circumvented or overridden and misstatements due to error or fraud may occur and not be detected. Also, because of changes in conditions, internal control effectiveness may vary over time. Accordingly, even an effective system of internal control will provide only reasonable assurance with respect to financial statement preparation.
Management assessed the Company’s system of internal control over financial reporting as of December 31, 2020, in relation to criteria for effective internal control over financial reporting as described in “2013 Internal Control – Integrated Framework,” issued by the Committee of Sponsoring Organizations of the Treadway Commission. Based on this assessment, management concludes that, as of December 31, 2020, its system of internal control over financial reporting is effective and meets the criteria of the “2013 Internal Control – Integrated Framework”. S.R. Snodgrass, P.C., independent registered public accounting firm, has issued an audit report on the effectiveness of the Company’s internal control over financial reporting as of December 31, 2020.
Management is responsible for compliance with the federal and state laws and regulations concerning dividend restrictions and federal laws and regulations concerning loans to insiders designated by the FDIC as safety and soundness laws and regulations. Management has assessed compliance by the Company with the designated laws and regulations relating to safety and soundness. Based on the assessment, management believes that the Company complied, in all significant respects, with the designated laws and regulations related to safety and soundness for the year ended December 31, 2020.
|
|
|
|
|
Dennis G. Shaffer |
|
Todd A. Michel |
|
President and Chief Executive Officer |
|
Senior Vice President, Controller |
|
|
|
|
|
|
|
|
|
Sandusky, Ohio |
|
|
|
March 15, 2021 |
|
|
23
REPORT OF INDEPENDENT REGISTERED PUBLIC ACCOUNTING FIRM
To the Shareholders and the Board of Directors of Civista Bancshares, Inc.
Opinion on Internal Control over Financial Reporting
We have audited Civista Bancshares, Inc. and subsidiaries’ (the “Company”) internal control over financial reporting as of December 31, 2020, based on criteria established in Internal Control – Integrated Framework, issued by the Committee of Sponsoring Organizations of the Treadway Commission in 2013. In our opinion, the Company maintained, in all material respects, effective internal control over financial reporting as of December 31, 2020, based on criteria established in Internal Control – Integrated Framework , issued by the Committee of Sponsoring Organizations of the Treadway Commission in 2013.
We have also audited, in accordance with the standards of the Public Company Accounting Oversight Board (United States) (PCAOB), the consolidated balance sheets of the Company as of December 31, 2020 and 2019; the related consolidated statements of operations, comprehensive income, changes in shareholders’ equity, and cash flows for each of the three years in the period ended December 31, 2020, of the Company; and our report dated March 15, 2021, expressed an unqualified opinion.
Basis for Opinion
The Company ’s management is responsible for maintaining effective internal control over financial reporting and for its assessment of the effectiveness of internal control over financial reporting in the accompanying Report on Management’s Assessment of Internal Control over Financial Reporting. Our responsibility is to express an opinion on the Company ’s internal control over financial reporting based on our audit. We are a public accounting firm registered with the PCAOB and are required to be independent, with respect to the Company, in accordance with U.S. federal securities laws and the applicable rules and regulations of the Securities and Exchange Commission and the PCAOB.
We conducted our audit in accordance with the standards of the PCAOB. Those standards require that we plan and perform the audit to obtain reasonable assurance about whether effective internal control over financial reporting was maintained in all material respects. Our audit included obtaining an understanding of internal control over financial reporting, assessing the risk that a material weakness exists, and testing and evaluating the design and operating effectiveness of internal control based on the assessed risk. Our audit also included performing such other procedures as we considered necessary in the circumstances. We believe that our audit provides a reasonable basis for our opinion.
Definition and Limitations of Internal Control over Financial Reporting
A company’s internal control over financial reporting is a process designed to provide reasonable assurance regarding the reliability of financial reporting and the preparation of financial statements for external purposes in accordance with generally accepted accounting principles. A company’s internal control over financial reporting includes those policies and procedures that (1) pertain to the maintenance of records that, in reasonable detail, accurately and fairly reflect the transactions and dispositions of the assets of the company; (2) provide reasonable assurance that transactions are recorded as necessary to permit preparation of financial statements in accordance with generally accepted accounting principles, and that receipts and expenditures of the company are being made only in accordance with authorizations of management and directors of the company; and (3) provide reasonable assurance regarding prevention or timely detection of unauthorized acquisition, use, or disposition of the company’s assets that could have a material effect on the financial statements.
Because of its inherent limitations, internal control over financial reporting may not prevent or detect misstatements. Also, projections of any evaluation of effectiveness to future periods are subject to the risk that controls may become inadequate because of changes in conditions or that the degree of compliance with the policies or procedures may deteriorate.

Cranberry Township, Pennsylvania
March 15, 2021
24
REPORT OF INDEPENDENT RE GISTERED PUBLIC ACCOUNTING FIRM
To the Shareholders and the Board of Directors of Civista Bancshares, Inc.
Opinion on the Financial Statements
We have audited the accompanying consolidated balance sheets of Civista Bancshares, Inc. and subsidiaries (the “Company”) as of December 31, 2020 and 2019; the related consolidated statements of operations, comprehensive income, changes in shareholders’ equity, and cash flows for each of the three years in the period ended December 31, 2020; and the related notes to the consolidated financial statements ( collectively, the financial statements). In our opinion, the financial statements present fairly, in all material respects, the financial position of the Company as of December 31, 2020 and 2019, and the results of its operations and its cash flows for each of the three years in the period ended December 31, 2020, in conformity with accounting principles generally accepted in the United States of America.
We have also audited, in accordance with the standards of the Public Company Accounting Oversight Board (United States) (PCAOB), the Company’s internal control over financial reporting as of December 31, 2020, based on criteria established in Internal Control – Integrated Framework , issued by the Committee of Sponsoring Organizations of the Treadway Commission in 2013, and our report dated March 15, 2021, which expressed an unqualified opinion on the effectiveness of the Company’s internal control over financial reporting.
Basis for Opinion
These financial statements are the responsibility of the Company’s management. Our responsibility is to express an opinion on the Company’s financial statements based on our audits. We are a public accounting firm registered with the PCAOB and are required to be independent, with respect to the Company, in accordance with U.S. federal securities laws and the applicable rules and regulations of the Securities and Exchange Commission and the PCAOB.
We conducted our audits in accordance with the standards of the PCAOB. Those standards require that we plan and perform the audit to obtain reasonable assurance about whether the financial statements are free of material misstatement, whether due to error or fraud.
Our audits included performing procedures to assess the risks of material misstatement of the financial statements, whether due to error or fraud, and performing procedures that respond to those risks. Such procedures included examining, on a test basis, evidence regarding the amounts and disclosures in the financial statements. Our audits also included evaluating the accounting principles used and significant estimates made by management, as well as evaluating the overall presentation of the financial statements. We believe that our audits provide a reasonable basis for our opinion.
Critical Audit Matters
The critical audit matters communicated below are matters arising from the current period audit of the financial statements that were communicated or required to be communicated to the audit committee and that: (1) relate to accounts or disclosures that are material to the financial statements; and (2) involved our especially challenging, subjective, or complex judgments. The communication of critical audit matters does not alter, in any way, our opinion on the financial statements, taken as a whole, and we are not, by communicating the critical audit matters below, providing separate opinions on the critical audit matters or on the accounts or disclosures to which they relate.
25
Allowance for Loan Losses (ALL) – Qualitative Factors
Description of the Matter
The Company’s loan portfolio totaled $2.03 billion as of December 31, 2020, and the associated ALL was $25.03 million. As discussed in Notes 1 and 5 to the consolidated financial statements, determining the amount of the ALL requires significant judgment about the collectability of loans, which includes an assessment of quantitative factors such as historical loss experience within each risk category of loans and testing of certain commercial loans for impairment. Management applies additional qualitative adjustments to reflect the inherent losses that exist in the loan portfolio at the balance sheet date that are not reflected in the historical loss experience. Qualitative adjustments are made based upon changes in lending policies and practices, economic conditions, changes in the loan portfolio mix, trends in loan delinquencies and classified loans, collateral values, and concentrations of credit risk for the commercial loan portfolios.
We identified these qualitative adjustments within the ALL as critical audit matters because they involve a high degree of subjectivity, which is magnified by the uncertainty resulting from the COVID-19 pandemic. In turn, auditing management’s judgments regarding the qualitative factors applied in the ALL calculation involved a high degree of subjectivity.
How We Addressed the Matter in Our Audit
We gained an understanding of the Company’s process for establishing the ALL, including the qualitative adjustments made to the ALL. We evaluated the design and tested the operating effectiveness of controls over the Company’s ALL process, which included, among others, management’s review and approval controls designed to assess the need and level of qualitative adjustments to the ALL.
To test the qualitative adjustments, we evaluated the appropriateness of management’s methodology and assessed whether relevant risks were reflected in the ALL and the need to consider qualitative adjustments, including the potential effect of COVID-19 on the adjustments
Regarding the measurement of the qualitative adjustments, we evaluated the completeness, accuracy, and relevance of the data and inputs utilized in management’s estimate. For example, we compared the inputs and data to the Company’s system reports, third-party macroeconomic data, and other internal and external sources and considered the existence of new or contrary information. Furthermore, we analyzed the changes in the components of the qualitative reserves relative to changes in external market factors, the Company’s loan portfolio, and asset quality trends, which included the evaluation of management’s ability to capture and assess relevant data from both external sources and internal reports on loan customers affected by the COVID-19 pandemic and the supporting documentation for substantiating revisions to qualitative factors to ensure that movement in the factors was directionally consistent with the underlying data and quantitatively reasonable based on the underlying risk related to the factor.
We also utilized internal credit review specialists with knowledge to evaluate the appropriateness of management’s risk-rating processes, to ensure that the risk ratings applied to the commercial loan portfolio were reasonable.
We have served as the Company’s auditor since 2009.

Cranberry Township, Pennsylvania
March 15, 2021
26
This page left blank intentionally.
27
CIVISTA BANCSHARES, INC.
CONSOLIDATED BALANCE SHEETS
December 31, 2020 and 2019
(Amounts in thousands, except share data)
|
|
|
2020 |
|
|
2019 |
|
||
|
ASSETS |
|
|
|
|
|
|
|
|
|
Cash and due from financial institutions |
|
$ |
|
|
|
$ |
|
|
|
Restricted cash |
|
|
|
|
|
|
— |
|
|
Cash and cash equivalents |
|
|
|
|
|
|
|
|
|
Securities available for sale |
|
|
|
|
|
|
|
|
|
Equity securities |
|
|
|
|
|
|
|
|
|
Loans held for sale |
|
|
|
|
|
|
|
|
|
Loans, net of allowance of $ |
|
|
|
|
|
|
|
|
|
Other securities |
|
|
|
|
|
|
|
|
|
Premises and equipment, net |
|
|
|
|
|
|
|
|
|
Accrued interest receivable |
|
|
|
|
|
|
|
|
|
Goodwill |
|
|
|
|
|
|
|
|
|
Other intangible assets |
|
|
|
|
|
|
|
|
|
Bank owned life insurance |
|
|
|
|
|
|
|
|
|
Swap assets |
|
|
|
|
|
|
|
|
|
Other assets |
|
|
|
|
|
|
|
|
|
Total assets |
|
$ |
|
|
|
$ |
|
|
|
LIABILITIES |
|
|
|
|
|
|
|
|
|
Deposits |
|
|
|
|
|
|
|
|
|
Noninterest-bearing |
|
$ |
|
|
|
$ |
|
|
|
Interest-bearing |
|
|
|
|
|
|
|
|
|
Total deposits |
|
|
|
|
|
|
|
|
|
Short-term Federal Home Loan Bank advances |
|
|
— |
|
|
|
|
|
|
Long-term Federal Home Loan Bank advances |
|
|
|
|
|
|
|
|
|
Securities sold under agreements to repurchase |
|
|
|
|
|
|
|
|
|
Subordinated debentures |
|
|
|
|
|
|
|
|
|
Swap liabilities |
|
|
|
|
|
|
|
|
|
Accrued expenses and other liabilities |
|
|
|
|
|
|
|
|
|
Total liabilities |
|
|
|
|
|
|
|
|
|
SHAREHOLDERS’ EQUITY |
|
|
|
|
|
|
|
|
|
Common stock,
par value,
shares issued at December 31, 2020 and
December 31, 2019 |
|
|
|
|
|
|
|
|
|
Accumulated earnings |
|
|
|
|
|
|
|
|
|
Treasury stock,
common shares at December 31, 2019, at cost |
|
|
(
|
) |
|
|
(
|
) |
|
Accumulated other comprehensive income |
|
|
|
|
|
|
|
|
|
Total shareholders’ equity |
|
|
|
|
|
|
|
|
|
Total liabilities and shareholders’ equity |
|
$ |
|
|
|
$ |
|
|
See accompanying notes to consolidated financial statements
28
CIVISTA BANCSHARES, INC.
CONSOLIDATED STATEMENTS OF OPERATIONS
Years ended December 31, 2020, 2019 and 2018
(Amounts in thousands, except per share data)
|
|
|
2020 |
|
|
2019 |
|
|
2018 |
|
|||
|
Interest and dividend income |
|
|
|
|
|
|
|
|
|
|
|
|
|
Loans, including fees |
|
$ |
|
|
|
$ |
|
|
|
$ |
|
|
|
Taxable securities |
|
|
|
|
|
|
|
|
|
|
|
|
|
Tax-exempt securities |
|
|
|
|
|
|
|
|
|
|
|
|
|
Federal funds sold and other |
|
|
|
|
|
|
|
|
|
|
|
|
|
Total interest and dividend income |
|
|
|
|
|
|
|
|
|
|
|
|
|
Interest expense |
|
|
|
|
|
|
|
|
|
|
|
|
|
Deposits |
|
|
|
|
|
|
|
|
|
|
|
|
|
Federal Home Loan Bank advances |
|
|
|
|
|
|
|
|
|
|
|
|
|
Subordinated debentures |
|
|
|
|
|
|
|
|
|
|
|
|
|
Securities sold under agreements to repurchase and other |
|
|
|
|
|
|
|
|
|
|
|
|
|
Total interest expense |
|
|
|
|
|
|
|
|
|
|
|
|
|
Net interest income |
|
|
|
|
|
|
|
|
|
|
|
|
|
Provision for loan losses |
|
|
|
|
|
|
|
|
|
|
|
|
|
Net interest income after provision for loan losses |
|
|
|
|
|
|
|
|
|
|
|
|
|
Noninterest income |
|
|
|
|
|
|
|
|
|
|
|
|
|
Service charges |
|
|
|
|
|
|
|
|
|
|
|
|
|
Net gain (loss) on sale of securities |
|
|
|
|
|
|
|
|
|
|
(
|
) |
|
Net gain (loss) on equity securities |
|
|
(
|
) |
|
|
|
|
|
|
|
|
|
Net gain on sale of loans |
|
|
|
|
|
|
|
|
|
|
|
|
|
ATM/Interchange fees |
|
|
|
|
|
|
|
|
|
|
|
|
|
Wealth management fees |
|
|
|
|
|
|
|
|
|
|
|
|
|
Bank owned life insurance |
|
|
|
|
|
|
|
|
|
|
|
|
|
Tax refund processing fees |
|
|
|
|
|
|
|
|
|
|
|
|
|
Computer center item processing fees |
|
|
|
|
|
|
|
|
|
|
|
|
|
Swap fees |
|
|
|
|
|
|
|
|
|
|
|
|
|
Other |
|
|
|
|
|
|
|
|
|
|
|
|
|
Total noninterest income |
|
|
|
|
|
|
|
|
|
|
|
|
|
Noninterest expense |
|
|
|
|
|
|
|
|
|
|
|
|
|
Compensation expense |
|
|
|
|
|
|
|
|
|
|
|
|
|
Net occupancy expense |
|
|
|
|
|
|
|
|
|
|
|
|
|
Equipment expense |
|
|
|
|
|
|
|
|
|
|
|
|
|
Contracted data processing |
|
|
|
|
|
|
|
|
|
|
|
|
|
FDIC Assessment |
|
|
|
|
|
|
|
|
|
|
|
|
|
State franchise tax |
|
|
|
|
|
|
|
|
|
|
|
|
|
Professional services |
|
|
|
|
|
|
|
|
|
|
|
|
|
Amortization of intangible assets |
|
|
|
|
|
|
|
|
|
|
|
|
|
ATM/Interchange expense |
|
|
|
|
|
|
|
|
|
|
|
|
|
Marketing expense |
|
|
|
|
|
|
|
|
|
|
|
|
|
Software maintenance expenses |
|
|
|
|
|
|
|
|
|
|
|
|
|
Other operating expenses |
|
|
|
|
|
|
|
|
|
|
|
|
|
Total noninterest expense |
|
|
|
|
|
|
|
|
|
|
|
|
|
Income before income taxes |
|
|
|
|
|
|
|
|
|
|
|
|
|
Income taxes |
|
|
|
|
|
|
|
|
|
|
|
|
|
Net income |
|
|
|
|
|
|
|
|
|
|
|
|
|
Preferred stock dividends |
|
|
— |
|
|
|
|
|
|
|
|
|
|
Net income available to common shareholders |
|
$ |
|
|
|
$ |
|
|
|
$ |
|
|
|
Earnings per common share, basic |
|
$ |
|
|
|
$ |
|
|
|
$ |
|
|
|
Earnings per common share, diluted |
|
$ |
|
|
|
$ |
|
|
|
$ |
|
|
See accompanying notes to consolidated financial statements
29
CIVISTA BANCSHARES, INC.
CONSOLIDATED STATEMENTS OF COMPREHENSIVE INCOME
Years ended December 31, 2020, 2019 and 2018
(Amounts in thousands)
|
|
|
2020 |
|
|
2019 |
|
|
2018 |
|
|||
|
Net income |
|
$ |
|
|
|
$ |
|
|
|
$ |
|
|
|
Other comprehensive income (loss): |
|
|
|
|
|
|
|
|
|
|
|
|
|
Unrealized holding gains (loss) on available for sale securities |
|
|
|
|
|
|
|
|
|
|
(
|
) |
|
Tax effect |
|
|
(
|
) |
|
|
(
|
) |
|
|
|
|
|
Pension liability adjustment |
|
|
(
|
) |
|
|
(
|
) |
|
|
|
|
|
Tax effect |
|
|
|
|
|
|
|
|
|
|
(
|
) |
|
Total other comprehensive income (loss) |
|
|
|
|
|
|
|
|
|
|
(
|
) |
|
Comprehensive income |
|
$ |
|
|
|
$ |
|
|
|
$ |
|
|
See accompanying notes to consolidated financial statements
30
CIVISTA BANCSHARES, INC.
CONSOLIDATED STATEMENTS OF CHANGES IN SHAREHOLDERS’ EQUITY
Years ended December 31, 2020, 2019 and 2018
(Amounts in thousands, except share data)
|
|
|
Preferred Shares |
|
|
Common Shares |
|
|
Accumulated |
|
|
Treasury |
|
|
Accumulated Other Comprehensive |
|
|
Total Shareholders’ |
|
||||||||||||||
|
|
|
Shares |
|
|
Amount |
|
|
Shares |
|
|
Amount |
|
|
Earnings |
|
|
Stock |
|
|
Income (Loss) |
|
|
Equity |
|
||||||||
|
Balance, December 31, 2017 |
|
|
|
|
|
$ |
|
|
|
|
|
|
|
$ |
|
|
|
$ |
|
|
|
$ |
(
|
) |
|
$ |
(
|
) |
|
$ |
|
|
|
Net income |
|
|
|
|
|
|
|
|
|
|
|
|
|
|
|
|
|
|
|
|
|
|
|
|
|
|
|
|
|
|
|
|
|
Other comprehensive income |
|
|
|
|
|
|
|
|
|
|
|
|
|
|
|
|
|
|
|
|
|
|
|
|
|
|
(
|
) |
|
|
(
|
) |
|
Change in accounting principle for adoption of ASU 2016-01 |
|
|
|
|
|
|
|
|
|
|
|
|
|
|
|
|
|
|
|
|
|
|
|
|
|
(
|
) |
|
|
— |
|
|
|
Conversion of Series B preferred shares to common shares |
|
|
(
|
) |
|
|
(
|
) |
|
|
|
|
|
|
|
|
|
|
|
|
|
|
|
|
|
|
|
|
|
|
— |
|
|
UCB acquisition |
|
|
|
|
|
|
|
|
|
|
|
|
|
|
|
|
|
|
|
|
|
|
|
|
|
|
|
|
|
|
|
|
|
Stock-based compensation |
|
|
|
|
|
|
|
|
|
|
|
|
|
|
|
|
|
|
|
|
|
|
|
|
|
|
|
|
|
|
|
|
|
Common share dividend ($ |
|
|
|
|
|
|
|
|
|
|
|
|
|
|
|
|
|
|
(
|
) |
|
|
|
|
|
|
|
|
|
|
(
|
) |
|
Preferred share dividends ($ |
|
|
|
|
|
|
|
|
|
|
|
|
|
|
|
|
|
|
(
|
) |
|
|
|
|
|
|
|
|
|
|
(
|
) |
|
Balance, December 31, 2018 |
|
|
|
|
|
$ |
|
|
|
|
|
|
|
$ |
|
|
|
$ |
|
|
|
$ |
(
|
) |
|
$ |
(
|
) |
|
$ |
|
|
|
Net income |
|
|
|
|
|
|
|
|
|
|
|
|
|
|
|
|
|
|
|
|
|
|
|
|
|
|
|
|
|
|
|
|
|
Other comprehensive loss |
|
|
|
|
|
|
|
|
|
|
|
|
|
|
|
|
|
|
|
|
|
|
|
|
|
|
|
|
|
|
|
|
|
Conversion of Series B preferred shares to common shares |
|
|
(
|
) |
|
|
(
|
) |
|
|
|
|
|
|
|
|
|
|
(
|
) |
|
|
|
|
|
|
|
|
|
|
(
|
) |
|
Stock-based compensation |
|
|
|
|
|
|
|
|
|
|
|
|
|
|
|
|
|
|
|
|
|
|
|
|
|
|
|
|
|
|
|
|
|
Common share dividends ($ |
|
|
|
|
|
|
|
|
|
|
|
|
|
|
|
|
|
|
(
|
) |
|
|
|
|
|
|
|
|
|
|
(
|
) |
|
Preferred share dividends ($ |
|
|
|
|
|
|
|
|
|
|
|
|
|
|
|
|
|
|
(
|
) |
|
|
|
|
|
|
|
|
|
|
(
|
) |
|
Purchase of treasury stock at cost |
|
|
|
|
|
|
|
|
|
|
(
|
) |
|
|
|
|
|
|
|
|
|
|
(
|
) |
|
|
|
|
|
|
(
|
) |
|
Balance, December 31, 2019 |
|
|
— |
|
|
$ |
— |
|
|
|
|
|
|
$ |
|
|
|
$ |
|
|
|
$ |
(
|
) |
|
$ |
|
|
|
$ |
|
|
|
Net income |
|
|
|
|
|
|
|
|
|
|
|
|
|
|
|
|
|
|
|
|
|
|
|
|
|
|
|
|
|
|
|
|
|
Other comprehensive income |
|
|
|
|
|
|
|
|
|
|
|
|
|
|
|
|
|
|
|
|
|
|
|
|
|
|
|
|
|
|
|
|
|
Stock-based compensation |
|
|
|
|
|
|
|
|
|
|
|
|
|
|
|
|
|
|
|
|
|
|
|
|
|
|
|
|
|
|
|
|
|
Common share dividends ($ |
|
|
|
|
|
|
|
|
|
|
|
|
|
|
|
|
|
|
(
|
) |
|
|
|
|
|
|
|
|
|
|
(
|
) |
|
Purchase of treasury stock at cost |
|
|
|
|
|
|
|
|
|
|
(
|
) |
|
|
— |
|
|
|
|
|
|
|
(
|
) |
|
|
|
|
|
|
(
|
) |
|
Balance, December 31, 2020 |
|
|
— |
|
|
$ |
— |
|
|
|
|
|
|
$ |
|
|
|
$ |
|
|
|
$ |
(
|
) |
|
$ |
|
|
|
$ |
|
|
See accompanying notes to consolidated financial statements
31
CIVISTA BANCSHARES, INC.
CONSOLIDATED STATEMENTS OF CASH FLOWS
Years ended December 31, 2020, 2019 and 2018
(Amounts in thousands)
|
|
|
2020 |
|
|
2019 |
|
|
2018 |
|
|||
|
Cash flows from operating activities: |
|
|
|
|
|
|
|
|
|
|
|
|
|
Net income |
|
$ |
|
|
|
$ |
|
|
|
$ |
|
|
|
Adjustments to reconcile net income to net cash from operating activities |
|
|
|
|
|
|
|
|
|
|
|
|
|
Security amortization, net |
|
|
|
|
|
|
|
|
|
|
|
|
|
Depreciation |
|
|
|
|
|
|
|
|
|
|
|
|
|
Amortization of core deposit intangible |
|
|
|
|
|
|
|
|
|
|
|
|
|
Amortization of net deferred loan fees |
|
|
(
|
) |
|
|
(
|
) |
|
|
(
|
) |
|
Net (gain) loss on sale of securities |
|
|
(
|
) |
|
|
(
|
) |
|
|
|
|
|
Net (gain) loss on equity securities |
|
|
|
|
|
|
(
|
) |
|
|
(
|
) |
|
Provision for loan losses |
|
|
|
|
|
|
|
|
|
|
|
|
|
Loans originated for sale |
|
|
(
|
) |
|
|
(
|
) |
|
|
(
|
) |
|
Proceeds from sale of loans |
|
|
|
|
|
|
|
|
|
|
|
|
|
Net gain on sale of loans |
|
|
(
|
) |
|
|
(
|
) |
|
|
(
|
) |
|
Increase in cash surrender value of bank owned life insurance |
|
|
(
|
) |
|
|
(
|
) |
|
|
(
|
) |
|
Share-based compensation |
|
|
|
|
|
|
|
|
|
|
|
|
|
Change in: |
|
|
|
|
|
|
|
|
|
|
|
|
|
Accrued interest payable |
|
|
(
|
) |
|
|
|
|
|
|
(
|
) |
|
Accrued interest receivable |
|
|
(
|
) |
|
|
(
|
) |
|
|
(
|
) |
|
Deferred taxes |
|
|
(
|
) |
|
|
|
|
|
|
|
|
|
Other, net |
|
|
|
|
|
|
|
|
|
|
|
|
|
Net cash from operating activities |
|
|
|
|
|
|
|
|
|
|
|
|
|
Cash flows used for investing activities: |
|
|
|
|
|
|
|
|
|
|
|
|
|
Securities available for sale |
|
|
|
|
|
|
|
|
|
|
|
|
|
Maturities, prepayments and calls |
|
|
|
|
|
|
|
|
|
|
|
|
|
Sales |
|
|
|
|
|
|
|
|
|
|
|
|
|
Purchases |
|
|
(
|
) |
|
|
(
|
) |
|
|
(
|
) |
|
Purchases of other securities |
|
|
(
|
) |
|
|
— |
|
|
|
(
|
) |
|
Redemption of other securities |
|
|
— |
|
|
|
|
|
|
|
— |
|
|
Redemption of equity securities |
|
|
|
|
|
|
— |
|
|
|
— |
|
|
Acquisition, net of cash acquired |
|
|
— |
|
|
|
— |
|
|
|
|
|
|
Purchases of bank owned life insurance |
|
|
— |
|
|
|
(
|
) |
|
|
— |
|
|
Net loan originations |
|
|
(
|
) |
|
|
(
|
) |
|
|
(
|
) |
|
Proceeds from sale of OREO properties |
|
|
— |
|
|
|
— |
|
|
|
|
|
|
Premises and equipment purchases |
|
|
(
|
) |
|
|
(
|
) |
|
|
(
|
) |
|
Proceeds from sale of premises and equipment |
|
|
|
|
|
|
|
|
|
|
|
|
|
Net cash used for investing activities |
|
|
(
|
) |
|
|
(
|
) |
|
|
(
|
) |
See accompanying notes to consolidated financial statements
32
CIVISTA BANCSHARES, INC.
CONSOLIDATED STATEMENTS OF CASH FLOWS (Continued)
Years ended December 31, 2020, 2019 and 2018
(Amounts in thousands)
|
|
|
2020 |
|
|
2019 |
|
|
2018 |
|
|||
|
Cash flows from financing activities: |
|
|
|
|
|
|
|
|
|
|
|
|
|
Increase (decrease) in deposits |
|
|
|
|
|
|
|
|
|
|
(
|
) |
|
Net change in short-term FHLB advances |
|
|
(
|
) |
|
|
(
|
) |
|
|
|
|
|
Repayment of long-term FHLB advances |
|
|
— |
|
|
|
(
|
) |
|
|
(
|
) |
|
Proceeds from long-term FHLB advances |
|
|
— |
|
|
|
|
|
|
|
— |
|
|
Repayment of other borrowings |
|
|
(
|
) |
|
|
— |
|
|
|
— |
|
|
Proceeds from other borrowings |
|
|
|
|
|
|
— |
|
|
|
— |
|
|
Increase (decrease) in securities sold under repurchase agreements |
|
|
|
|
|
|
(
|
) |
|
|
|
|
|
Cash payment for redemption of series B preferred stock |
|
|
— |
|
|
|
(
|
) |
|
|
— |
|
|
Purchase of treasury stock |
|
|
(
|
) |
|
|
(
|
) |
|
|
— |
|
|
Cash paid on fractional shares on preferred stock conversion |
|
|
— |
|
|
|
(
|
) |
|
|
— |
|
|
Cash dividends paid |
|
|
(
|
) |
|
|
(
|
) |
|
|
(
|
) |
|
Net cash from financing activities |
|
|
|
|
|
|
|
|
|
|
|
|
|
Increase in cash and due from financial institutions |
|
|
|
|
|
|
|
|
|
|
|
|
|
Cash and cash equivalents at beginning of year |
|
|
|
|
|
|
|
|
|
|
|
|
|
Cash and cash equivalents at end of year |
|
$ |
|
|
|
$ |
|
|
|
$ |
|
|
|
Supplemental disclosures of cash flow information: |
|
|
|
|
|
|
|
|
|
|
|
|
|
Interest paid |
|
$ |
|
|
|
$ |
|
|
|
$ |
|
|
|
Income taxes paid |
|
|
|
|
|
|
|
|
|
|
|
|
|
Transfer of loans from portfolio to other real estate owned |
|
|
|
|
|
|
— |
|
|
|
— |
|
|
Transfer of premises to held-for-sale |
|
|
— |
|
|
|
|
|
|
|
— |
|
|
Transfer of loans held-for-sale to portfolio |
|
|
— |
|
|
|
— |
|
|
|
|
|
|
Securities purchased not settled |
|
|
— |
|
|
|
|
|
|
|
|
|
|
Conversion of preferred stock to common stock |
|
|
— |
|
|
|
|
|
|
|
|
|
|
Acquisition of UCB |
|
|
|
|
|
|
|
|
|
|
|
|
|
Consideration paid |
|
|
|
|
|
|
|
|
|
$ |
|
|
|
Noncash assets acquired: |
|
|
|
|
|
|
|
|
|
|
|
|
|
Securities available for sale |
|
|
|
|
|
|
|
|
|
|
|
|
|
Equity securities |
|
|
|
|
|
|
|
|
|
|
|
|
|
Loans held for sale |
|
|
|
|
|
|
|
|
|
|
|
|
|
Loans receivable |
|
|
|
|
|
|
|
|
|
|
|
|
|
FHLB Stock |
|
|
|
|
|
|
|
|
|
|
|
|
|
Accrued interest receivable |
|
|
|
|
|
|
|
|
|
|
|
|
|
Premises and equipment, net |
|
|
|
|
|
|
|
|
|
|
|
|
|
Goodwill |
|
|
|
|
|
|
|
|
|
|
|
|
|
Core deposit intangible |
|
|
|
|
|
|
|
|
|
|
|
|
|
Bank owned life insurance |
|
|
|
|
|
|
|
|
|
|
|
|
|
Other assets |
|
|
|
|
|
|
|
|
|
|
|
|
|
Total non cash assets acquired |
|
|
|
|
|
|
|
|
|
|
|
|
|
Liabilities assumed: |
|
|
|
|
|
|
|
|
|
|
|
|
|
Deposits |
|
|
|
|
|
|
|
|
|
|
|
|
|
Other liabilities |
|
|
|
|
|
|
|
|
|
|
|
|
|
Total liabilities assumed |
|
|
|
|
|
|
|
|
|
|
|
|
|
Net noncash liabilities acquired |
|
|
|
|
|
|
|
|
|
|
(
|
) |
|
Cash acquired |
|
|
|
|
|
|
|
|
|
|
|
|
See accompanying notes to consolidated financial statements
33
CIVISTA BANCSHARES, INC.
NOTES TO CONSOLIDATED FINANCIAL STATEMENTS
December 31, 2020, 2019 and 2018
(Amounts in thousands, except share data)
NOTE 1 - SUMMARY OF SIGNIFICANT ACCOUNTING POLICIES
The following is a summary of the accounting policies adopted by Civista Bancshares, Inc., which have a significant effect on the Consolidated Financial Statements.
Nature of Operations and Principles of Consolidation : The Consolidated Financial Statements include the accounts of Civista Bancshares, Inc. (“CBI”) and its wholly-owned subsidiaries: Civista Bank (“Civista”), First Citizens Insurance Agency, Inc. (“FCIA”), Water Street Properties, Inc. (“WSP”), FC Refund Solutions, Inc. (“FCRS”) and CIVB Risk Management, Inc. (“CRMI”). First Citizens Capital LLC (“FCC”) is wholly-owned by Civista and holds inter-company debt. First Citizens Investments, Inc. (“FCI”) is wholly-owned by Civista and holds and manages its securities portfolio. The operations of FCI and FCC are located in Wilmington, Delaware. The above companies together are sometimes referred to as the “Company”. Intercompany balances and transactions are eliminated in consolidation.
Civista provides financial services through its offices in the Ohio counties of Erie, Crawford, Champaign, Cuyahoga, Franklin, Logan, Summit, Huron, Ottawa, Madison, Montgomery and Richland, in the Indiana counties of Dearborn and Ripley and in the Kentucky county of Kenton. Its primary deposit products are checking, savings, and term certificate accounts, and its primary lending products are residential mortgage, commercial, and installment loans. Substantially all loans are secured by specific items of collateral including business assets, consumer assets and commercial and residential real estate. Commercial loans are expected to be repaid from cash flow from operations of businesses. There are no significant concentrations of loans to any one industry or customer. However, our customers’ ability to repay their loans is dependent on the real estate and general economic conditions in the area. Other financial instruments that potentially represent concentrations of credit risk include deposit accounts in other financial institutions.
FCIA was formed to allow the Company to participate in commission revenue generated through its third party insurance agreement. Insurance commission revenue was less than
Use of Estimates : To prepare financial statements in conformity with accounting principles generally accepted in the United States of America, management makes estimates and assumptions based on available information. These estimates and assumptions affect the amounts reported in the financial statements and the disclosures provided, and future results could differ. The allowance for loan losses, determination of goodwill impairment, fair values of financial instruments, valuation of deferred tax assets, pension obligations and other-than-temporary-impairment of securities are considered material estimates that are particularly susceptible to significant change in the near term.
Cash Flows
: Cash and cash equivalents include cash on hand and demand deposits with financial institutions with original maturities of less than
Securities : Debt securities are classified as available-for-sale when they might be sold before maturity. Securities available for sale are carried at fair value, with unrealized holding gains and losses reported in other comprehensive income, net of tax.
34
CIVISTA BANCSHARES, INC.
NOTES TO CONSOLIDATED FINANCIAL STATEMENTS
December 31, 2020, 2019 and 2018
(Amounts in thousands, except share data)
NOTE 1 - SUMMARY OF SIGNIFICANT ACCOUNTING POLICIES (Continued)
Interest income includes amortization of purchase premium or discount. Premiums and discounts on securities are amortized on the level-yield method without anticipating prepayments, except for mortgage backed securities where prepayments are anticipated. Gains and losses on sales are based on the amortized cost of the security sold using the specific identification method.
Securities are evaluated on at least a quarterly basis and more frequently when economic or market conditions warrant such an evaluation to determine whether a decline in their value is other than temporary. For debt securities, management considers whether the present value of cash flows expected to be collected are less than the security’s amortized cost basis, the magnitude and duration of the decline, the reasons underlying the decline and the Company’s intent to sell the security or whether it is more likely than not that the Company would be required to sell the security before its anticipated recovery in market value, to determine whether the loss in value is other than temporary. Once a decline in value is determined to be other than temporary, if the Company does not intend to sell the security, and it is more likely than not that it will not be required to sell the security, before recovery of the security’s amortized cost basis, the charge to earnings is limited to the amount of credit loss. Any remaining difference between fair value and amortized cost is recognized in other comprehensive income, net of applicable taxes. Otherwise, the entire difference between far value and amortized cost is charged to earnings.
Other securities which include FHLB stock, Federal Reserve Bank (“FRB”) stock, Federal Agricultural Mortgage Corporation stock, Bankers’ Bancshares Inc. (“BB”) stock, and Norwalk Community Development Corp (“NCDC”) stock are carried at cost.
Equity securities : Equity securities are held at fair value. Holding gains and losses are recorded in noninterest income. Dividends are recognized as income when earned.
Loans Held for Sale: Mortgage loans originated and intended for sale in the secondary market and loans that management no longer intends to hold for the foreseeable future, are carried at the lower of aggregate cost or fair value, as determined by outstanding commitments from investors. Net unrealized losses, if any, are recorded as a valuation allowance and charged to earnings.
Loans: Loans that management has the intent and ability to hold for the foreseeable future or until maturity or payoff are reported at the principal balance outstanding, net of deferred loan fees and costs, and an allowance for loan losses. Interest income is accrued on the unpaid principal balance. Loan origination fees, net of certain direct origination costs, are deferred and recognized in interest income using the level-yield method without anticipating prepayments.
Interest income on mortgage and commercial loans is discontinued at the time the loan is 90 days delinquent unless the credit is well-secured and in process of collection. Interest income on consumer loans is discontinued when management determines future collection is unlikely. In all cases, loans are placed on nonaccrual or charged-off at an earlier date if collection of principal or interest is considered doubtful.
All interest accrued, but not received, for loans placed on nonaccrual, is reversed against interest income. Interest received on such loans is accounted for on the cash-basis or cost-recovery method, until qualifying for return to accrual. Loans are returned to accrual status when all the principal and interest amounts contractually due are brought current and future payments are reasonably assured.
35
CIVISTA BANCSHARES, INC.
NOTES TO CONSOLIDATED FINANCIAL STATEMENTS
December 31, 2020, 2019 and 2018
(Amounts in thousands, except share data)
NOTE 1 - SUMMARY OF SIGNIFICANT ACCOUNTING POLICIES (Continued)
Purchased Loans: The Company purchases individual loans and groups of loans. Purchased loans that show evidence of credit deterioration since origination are recorded at the amount paid (or allocated fair value in a purchase business combination), such that there is no carryover of the seller’s allowance for loan losses. After acquisition, incurred losses are recognized by an increase in the allowance for loan losses.
Purchased loans are accounted for individually or aggregated into pools of loans based on common risk characteristics (e.g., credit score, loan type, and date of origination). The Company estimates the amount and timing of expected cash flows for each purchased loan or pool, and the expected cash flows in excess of amount paid is recorded as interest income over the remaining life of the loan or pool (accretable yield). The excess of the loan’s, or pool’s, contractual principal and interest over expected cash flows is not recorded (nonaccretable difference).
Over the life of the loan or pool, expected cash flows continue to be estimated. If the present value of expected cash flows is less than the carrying amount, a loss is recorded. If the present value of expected future cash flows is greater than the carrying amount, the excess is recognized as part of future interest income.
Allowance for Loan Losses: The allowance for loan losses (allowance) is calculated with the objective of maintaining a reserve sufficient to absorb inherent loan losses in the loan portfolio. Management establishes the allowance for loan losses based upon its evaluation of the pertinent factors underlying the types and quality of loans in the portfolio. In determining the allowance and the related provision for loan losses, the Company considers three principal elements: (i) specific impairment reserve allocations (valuation allowances) based upon probable losses identified during the review of impaired loans in the Commercial loan portfolio, (ii) allocations established for adversely-rated loans in the Commercial loan portfolio and nonaccrual Real Estate Residential, Consumer installment and Home Equity loans, and (iii) allocations on all other loans based principally on the use of a three-year period for loss migration analysis. These allocations are adjusted for consideration of general economic and business conditions, credit quality and delinquency trends, collateral values, and recent loss experience for these similar pools of loans. The Company analyzes its loan portfolio each quarter to determine the appropriateness of its allowance for loan losses.
All Commercial, Commercial Real Estate and Farm Real Estate loans are monitored on a regular basis with a detailed loan review completed for all loan relationships greater than $
Loan Charge-off Policies:
All unsecured open- and closed-ended retail loans that become past due
36
CIVISTA BANCSHARES, INC.
NOTES TO CONSOLIDATED FINANCIAL STATEMENTS
December 31, 2020, 2019 and 2018
(Amounts in thousands, except share data)
NOTE 1 - SUMMARY OF SIGNIFICANT ACCOUNTING POLICIES (Continued)
Troubled Debt Restructurings: In certain situations based on economic or legal reasons related to a borrower’s financial difficulties, management may grant a concession for other than an insignificant period of time to the borrower that would not otherwise be considered. The related loan is classified as a troubled debt restructuring (TDR). Management strives to identify borrowers in financial difficulty early and work with them to modify to more affordable terms before their loan reaches nonaccrual status. These modified terms may include rate reductions, principal forgiveness, payment forbearance and other actions intended to minimize the economic loss and to avoid foreclosure or repossession of the collateral. In cases where borrowers are granted new terms that provide for a reduction of either interest or principal, management measures any impairment on the restructuring as noted above for impaired loans. In addition to the allowance for the pooled portfolios, management has developed a separate reserve for loans that are identified as impaired through a TDR. These loans are excluded from pooled loss forecasts and a separate reserve is provided under the accounting guidance for loan impairment. Consumer loans whose terms have been modified in a TDR are also individually analyzed for estimated impairment.
Other Real Estate: Other real estate acquired through or instead of loan foreclosure is initially recorded at fair value less costs to sell when acquired, establishing a new cost basis and any deficiency in the value is charged off through the allowance. If fair value declines subsequent to foreclosure, a valuation allowance is recorded through expense. Operating costs after acquisition are expensed.
Premises and Equipment: Land is carried at cost. Premises and equipment are stated at cost less accumulated depreciation. Depreciation is computed using both accelerated and straight-line methods over the estimated useful life of the asset, ranging from to for furniture and equipment and to years for buildings and improvements.
Federal Home Loan Bank (FHLB) Stock
: Civista is a member of the FHLB of Cincinnati and as such, is required to maintain a minimum investment in stock of the FHLB that varies with the level of advances outstanding with the FHLB. The stock is bought from and sold to the FHLB based upon its $
Federal Reserve Bank (FRB) Stock : Civista is a member of the Federal Reserve System. FRB stock is carried at cost, classified as a restricted security, and periodically evaluated for impairment based on ultimate recovery of par value.
Bank Owned Life Insurance (BOLI) : Civista has purchased BOLI policies on certain key executives. BOLI is recorded at the amount that can be realized under the insurance contract at the balance sheet date, which is the cash surrender value adjusted for other charges or other amounts due that are probable at settlement. Changes in the cash surrender value are recorded as income in the period that the change occurs.
Goodwill and Other Intangible Assets: Goodwill results from business acquisitions and represents the excess of the purchase price over the fair value of acquired tangible assets and liabilities and identifiable intangible assets. Goodwill is assessed at least annually for impairment and any such impairment will be recognized in the period identified.
37
CIVISTA BANCSHARES, INC.
NOTES TO CONSOLIDATED FINANCIAL STATEMENTS
December 31, 2020, 2019 and 2018
(Amounts in thousands, except share data)
NOTE 1 - SUMMARY OF SIGNIFICANT ACCOUNTING POLICIES (Continued)
Other intangible assets consist of core deposit intangibles arising from whole bank and branch acquisitions. These intangible assets are measured at fair value and then amortized on an accelerated method over their estimated useful lives, which range from to .
Repurchase Agreements : Substantially all repurchase agreement liabilities represent amounts advanced by various customers. Securities are pledged to cover these liabilities, which are not covered by federal deposit insurance.
Loan Commitments and Related Financial Instruments: Financial instruments include off-balance sheet credit instruments, such as commitments to make loans and commercial letters of credit, issued to meet customer financing needs. The face amount for these items represents the exposure to loss, before considering customer collateral or ability to repay.
Income Taxes : Income tax expense is the total of the current year income tax due or refundable and the change in deferred tax assets and liabilities. Deferred tax assets and liabilities are the expected future tax amounts for the temporary differences between carrying amounts and tax basis of assets and liabilities, computed using enacted tax rates. A valuation allowance, if needed, reduces deferred tax assets to the amount expected to be realized.
The Company prescribes a recognition threshold and a measurement attribute for the financial statement recognition and measurement of a tax position taken or expected to be taken in a tax return. Benefits from tax positions should be recognized in the financial statements only when it is more likely than not that the tax position will be sustained upon examination by the appropriate taxing authority that would have full knowledge of all relevant information.
A tax position that meets the more-likely-than-not recognition threshold is measured at the largest amount of benefit that is greater than 50% likely of being realized upon ultimate settlement. Tax positions that previously failed to meet the more-likely-than-not recognition threshold should be recognized in the first subsequent financial reporting period in which that threshold is met. Previously recognized tax positions that no longer meet the more-likely-than-not recognition threshold should be derecognized in the first subsequent financial reporting period in which that threshold is no longer met. The Company recognizes interest and/or penalties related to income tax matters in income tax expense.
Stock-Based Compensation : Compensation cost is recognized for stock options and restricted stock awards issued to employees and directors, based on the fair value of these awards at the grant date. A Black-Scholes model is utilized to estimate the fair value of stock options, while the market price of the Company’s common shares at the date of the grant is used for restricted shares.
38
CIVISTA BANCSHARES, INC.
NOTES TO CONSOLIDATED FINANCIAL STATEMENTS
December 31, 2020, 2019 and 2018
(Amounts in thousands, except share data)
NOTE 1 - SUMMARY OF SIGNIFICANT ACCOUNTING POLICIES (Continued)
Compensation cost is recognized over the required service period, generally defined as the vesting period. For awards with graded vesting, compensation cost is recognized on a straight-line basis over the requisite service period for the entire award.
Retirement Plans : Pension expense is the net of service and interest cost, expected return on plan assets and amortization of gains and losses not immediately recognized. Employee 401(k) and profit sharing plan expense is the amount of matching contributions. Deferred compensation allocates the benefits over the years of service.
Loss Contingencies : Loss contingencies, including claims and legal actions arising in the ordinary course of business, are recorded as liabilities when the likelihood of loss is probable and an amount or range of loss can be reasonably estimated. Management does not believe that any such loss contingencies currently exist that will have a material effect on the financial statements.
Restrictions on Cash
: Cash on hand or on deposit with the Federal Reserve Bank is required to meet regulatory reserve and clearing requirements. These balances do not earn interest. The required reserve amount at December 31, 2020 was $
Dividend Restriction : Banking regulations require maintaining certain capital levels and may limit the dividends paid by Civista to CBI or by CBI to shareholders. Additional information related to dividend restrictions can be found in Note 19.
Fair Value of Financial Instruments : Fair values of financial instruments are estimated using relevant market information and other assumptions that reflect exit price value, as more fully disclosed in Note 17. Fair value estimates involve uncertainties and matters of significant judgment regarding interest rates, credit risk, prepayments, and other factors, especially in the absence of broad markets for particular items. Changes in assumptions or in market conditions could significantly affect these estimates.
Operating Segments
: While the Company’s chief decision makers monitor the revenue streams of the Company’s various products and services, operations are managed and financial performance is evaluated on a Company-wide basis. Operating segments are aggregated into one as operating results for all segments are similar. Accordingly, all of the Company’s financial service operations are considered by management to be aggregated in
Treasury Stock : Shares of CBI common stock that are repurchased are recorded in treasury stock at cost.
Business Combinations: At the date of acquisition the Company records the assets and liabilities of the acquired companies on the Consolidated Balance Sheets at their fair value. The results of operations for acquired companies are included in the Company’s Consolidated Statements of Operations beginning at the acquisition date. Expenses arising from acquisition activities are recorded in the Consolidated Statements of Operations during the period incurred.
39
CIVISTA BANCSHARES, INC.
NOTES TO CONSOLIDATED FINANCIAL STATEMENTS
December 31, 2020, 2019 and 2018
(Amounts in thousands, except share data)
NOTE 1 - SUMMARY OF SIGNIFICANT ACCOUNTING POLICIES (Continued)
Derivative Instruments and Hedging Activities : The Company enters into interest rate swap agreements to facilitate the risk management strategies of a small number of commercial banking customers. All derivatives are accounted for in accordance with ASC-815, Derivatives and Hedging . The Company mitigates the risk of entering into these agreements by entering into equal and offsetting swap agreements with highly rated third party financial institutions. The swap agreements are free-standing derivatives and are recorded at fair value in the Company’s Consolidated Balance Sheets. Changes in fair value are recorded as income or expense in the period that they occur. The Company is party to master netting arrangements with its financial institution counterparties; however, the Company does not offset assets and liabilities under these arrangements for financial statement presentation purposes because the Company does not currently intend to execute a setoff with its counterparties. The master netting arrangements provide for a single net settlement of all swap agreements, as well as collateral, in the event of default on, or termination of, any one contract. Collateral, in the form of cash and marketable securities, is posted by the counterparty with net liability positions in accordance with contract thresholds.
Reclassifications: Some items in the prior year financial statements were reclassified to conform to the current presentation. Such reclassifications had no effect on net income or shareholders’ equity.
Adoption of New Accounting Standards:
In August 2018, the Financial Accounting Standards Board (“FASB”) issued Accounting Standards Update (“ASU”) 2018-13,
Fair Value Measurement (Topic 820): Disclosure Framework – Changes to the Disclosure Requirements for Fair Value Measurement
. The amendments in this Update remove the requirement to disclose the amount of and reasons for transfers between Level I and Level II of the fair value hierarchy; the policy for timing of transfers between levels; and the valuation processes for Level III fair value measurements. The amendments in this Update require disclosure of changes in unrealized gains and losses for the period included in other comprehensive income (loss) for recurring Level III fair value measurements held at the end of the reporting period and the range and weighted average of significant unobservable inputs used to develop Level III fair value measurements. We adopted ASU 2018-13 effective
In August 2018, the FASB issued ASU 2018-15,
Intangibles – Goodwill and Other – Internal-Use Software (Subtopic 350-40).
The amendment in this ASU addressed customers’ accounting for implementation costs incurred in a cloud computing arrangement that is a service contract and also added certain disclosure requirements related to implementation costs incurred for internal-use software and cloud computing arrangements. The amendment in this ASU aligned the requirements for capitalizing implementation costs incurred in a hosting arrangement that is a service contract with the requirements for capitalizing implementation costs incurred to develop or obtain internal-use software (and hosting arrangements that include an internal-use software license). We adopted ASU 2018-15 effective
In October, 2018, the FASB issued ASU 2018-17,
Consolidation (Topic 810)
, which made improvements in (1) applying the variable interest entity (VIE) guidance to private companies under common control and (2) considering indirect interests held through related parties under common control for determining whether fees paid to decision makers and service providers are variable interests. Under the amendments in this Update, a private company may elect not to apply VIE guidance to legal entities under common control (including common control leasing arrangements) if both the parent and the legal entity being evaluated for consolidation are not public business entities. In addition, indirect interests held through related parties in common control arrangements should be considered on a proportional basis for determining whether fees paid to decision makers and service providers are variable interests. We adopted ASU 2018-17 effective
40
CIVISTA BANCSHARES, INC.
NOTES TO CONSOLIDATED FINANCIAL STATEMENTS
December 31, 2020, 2019 and 2018
(Amounts in thousands, except share data)
NOTE 1 – SUMMARY OF SIGNIFICANT ACCOUNTING POLICIES (Continued)
In November, 2018, the FASB issued ASU 2018-18,
Collaborative Arrangements (Topic 808)
, which made the following targeted improvements to generally accepted accounting principles (GAAP) for collaborative arrangements: (1) clarified that certain transactions between collaborative arrangement participants should be accounted for as revenue under Topic 606 when the collaborative arrangement participant is a customer in the context of a unit of account, (2) added unit-of-account guidance in Topic 808 to align with the guidance in Topic 606 (that is, a distinct good or service) when an entity is assessing whether the collaborative arrangement or a part of the arrangement is within the scope of Topic 606, and (3) required that in a transaction with a collaborative arrangement participant that is not directly related to sales to third parties, presenting the transaction together with revenue recognized under Topic 606 is precluded if the collaborative arrangement participant is not a customer. We adopted ASU 2018-18 effective
Effect of Newly Issued but Not Yet Effective Accounting Standards:
In June 2016, the FASB issued ASU 2016-13, Financial Instruments-Credit Losses: Measurement of Credit Losses on Financial Instruments (“ASU 2016-13”), which changes the impairment model for most financial assets. This ASU is intended to improve financial reporting by requiring timelier recording of credit losses on loans and other financial instruments held by financial institutions and other organizations. The underlying premise of ASU 2016-13 is that financial assets measured at amortized cost should be presented at the net amount expected to be collected, through an allowance for credit losses that is deducted from the amortized cost basis. The allowance for credit losses should reflect management’s current estimate of credit losses that are expected to occur over the remaining life of a financial asset. The income statement will be effected for the measurement of credit losses for newly recognized financial assets, as well as the expected increases or decreases of expected credit losses that have taken place during the period. ASU 2016-13 is effective for annual and interim periods beginning after December 15, 2019, and early adoption is permitted for annual and interim periods beginning after December 15, 2018. On October 16, 2019, the FASB voted to defer the effective date for ASC 326, Financial Instruments – Credit Losses , for smaller reporting companies to fiscal years beginning after December 15, 2022, and interim periods within those fiscal years, which was codified in the final ASU issued by the FASB on November 15, 2019. As a result, because the Company qualified as a smaller reporting company, based on its most recent determination under applicable rules of the Securities and Exchange Commission (“SEC”), as of November 15, 2019, the Company will not be subject to ASU 2016-13 until its annual and interim periods beginning after December 15, 2022. Management is in the process of evaluating the impact adoption of ASU 2016-13 will have on the Company’s Consolidated Financial Statements. This process has engaged multiple areas of the Company in evaluating loss estimation methods and application of these methods to specific segments of the loan portfolio. Management has been actively monitoring FASB developments and evaluating the use of different methods allowed. Due to continuing development of our methodology, additional time is required to quantify the affect this ASU will have on the Company’s Consolidated Financial Statements. Management continues to refine its modeling and running parallel calculations and will finalize a method or methods of adoption in time for the effective date.
In January 2017, the FASB issued ASU 2017-04, Simplifying the Test for Goodwill Impairment . To simplify the subsequent measurement of goodwill, the FASB eliminated Step 2 from the goodwill impairment test. In computing the implied fair value of goodwill under Step 2, an entity had to perform procedures to determine the fair value at the impairment testing date of its assets and liabilities (including unrecognized assets and liabilities) following the procedure that would be required in determining the fair value of assets acquired and liabilities assumed in a business combination. Instead, under the amendments in this Update, an entity should perform its annual, or interim, goodwill impairment test by comparing the fair value of a reporting unit with its carrying amount. An entity should recognize an impairment charge for the amount by which the carrying amount exceeds the reporting unit’s fair value; however, the loss recognized should not exceed the total amount of goodwill allocated to that reporting unit. A public business entity that is an SEC filer, such as the Company, should adopt the amendments in this Update for its annual or any interim goodwill impairment tests in fiscal years beginning after December 15, 2019. On October 16, 2019, the FASB voted to defer the effective date for ASC 350, Intangibles – Goodwill and Other , for smaller reporting companies, such as the Company, to fiscal years beginning after December 15, 2022, and interim periods within those fiscal years. The final ASU was issued by the FASB on November 15, 2019. The Company is currently
evaluating the impact the adoption of the standard will have on the Company’s financial position or results of operations.
41
CIVISTA BANCSHARES, INC.
NOTES TO CONSOLIDATED FINANCIAL STATEMENTS
December 31, 2020, 2019 and 2018
(Amounts in thousands, except share data)
NOTE 1 – SUMMARY OF SIGNIFICANT ACCOUNTING POLICIES (Continued)
In April 2019, the FASB issued ASU 2019-04, Codification Improvements to Topic 326, Financial Instruments – Credit Losses, and Topic 825, Financial Instruments, which affects a variety of topics in the Codification and applies to all reporting entities within the scope of the affected accounting guidance. Topic 326, Financial Instruments – Credit Losses amendments are effective for SEC registrants for fiscal years beginning after December 15, 2019, and interim periods within those fiscal years. The Company is currently evaluating the potential impact of the Topic 326 amendments on the Company’s Consolidated Financial Statements. The amendments to Topic 825 are effective for interim and annual reporting periods beginning after December 15, 2019. On October 16, 2019, the FASB voted to defer the effective date for ASC 326, Financial Instruments – Credit Losses , for smaller reporting companies, such as the Company, to fiscal years beginning after December 15, 2022, and interim periods within those fiscal years. The final ASU was issued by the FASB on November 15, 2019. This Update is not expected to have a material impact on the Company’s financial statements.
In May 2019, the FASB issued ASU 2019-05, Financial Instruments – Credit Losses, Topic 326 , which allows entities to irrevocably elect the fair value option for certain financial assets previously measured at amortized cost upon adoption of the new credit losses standard. To be eligible for the transition election, the existing financial asset must otherwise be both within the scope of the new credit losses standard and eligible for the applying the fair value option in ASC 825-10.3. The election must be applied on an instrument-by-instrument basis and is not available for either available-for-sale or held-to-maturity debt securities. For entities that elect the fair value option, the difference between the carrying amount and the fair value of the financial asset would be recognized through a cumulative-effect adjustment to opening retained earnings as of the date an entity adopted ASU 2016-13. Changes in fair value of that financial asset would subsequently be reported in current earnings. For entities that have not yet adopted ASU 2016-13, the effective dates and transition requirements are the same as those in ASU 2016-13. For entities that have adopted ASU 2016-13, ASU 2019-05 is effective for fiscal years beginning after December 15, 2019, including interim periods within those fiscal years. Early adoption is permitted once ASU 2016-13 has been adopted. On October 16, 2019, the FASB voted to defer the effective date for ASC 326, Financial Instruments – Credit Losses , for smaller reporting companies, such as the Company, to fiscal years beginning after December 15, 2022, and interim periods within those fiscal years. The final ASU was issued by the FASB on November 15, 2019. The Company is currently evaluating the impact the adoption of the standard will have on the Company’s financial statements.
In November 2019, the FASB issued ASU 2019-10, Financial Instruments ‒ Credit Losses (Topic 326), Derivatives and Hedging (Topic 815), and Leases (Topic 842) . The Update defers the effective dates of ASU 2016-13 for SEC filers that are eligible to be smaller reporting companies, such as the Company, to fiscal years beginning after December 15, 2022, including interim periods within those fiscal years. This Update also amends the mandatory effective date for the elimination of Step 2 from the goodwill impairment test under ASU No. 2017-04, Intangibles ‒ Goodwill and Other (Topic 350): Simplifying the Test for Goodwill Impairment (Goodwill) , to align with those used for credit losses. Furthermore, the ASU provides a one-year deferral of the effective dates of the ASUs on derivatives and hedging and leases for companies that are not public business entities. The Company qualified as a smaller reporting company and does not expect to early adopt these ASUs.
42
CIVISTA BANCSHARES, INC.
NOTES TO CONSOLIDATED FINANCIAL STATEMENTS
December 31, 2020, 2019 and 2018
(Amounts in thousands, except share data)
NOTE 1 – SUMMARY OF SIGNIFICANT ACCOUNTING POLICIES (Continued)
In November 2019, the FASB issued ASU 2019-11, Codification Improvements to Topic 326, Financial Instruments – Credit Losses , to clarify its new credit impairment guidance in ASC 326, based on implementation issues raised by stakeholders. This Update clarified, among other things, that expected recoveries are to be included in the allowance for credit losses for these financial assets; an accounting policy election can be made to adjust the effective interest rate for existing troubled debt restructurings based on the prepayment assumptions instead of the prepayment assumptions applicable immediately prior to the restructuring event; and extends the practical expedient to exclude accrued interest receivable from all additional relevant disclosures involving amortized cost basis. The effective dates in this Update are the same as those applicable for ASU 2019-10. The Company is currently evaluating the impact the adoption of the standard will have on the Company’s financial position or results of operations.
In March 2020, the FASB issued ASU 2020-03 , Codification Improvements to Financial Instruments. This ASU was issued to improve and clarify various financial instruments topics, including the current expected credit losses (CECL) standard issued in 2016. The ASU includes seven issues that describe the areas of improvement and the related amendments to GAAP; they are intended to make the standards easier to understand and apply and to eliminate inconsistencies, and they are narrow in scope and are not expected to significantly change practice for most entities. Among its provisions, the ASU clarifies that all entities, other than public business entities that elected the fair value option, are required to provide certain fair value disclosures under ASC 825, Financial Instruments , in both interim and annual financial statements. It also clarifies that the contractual term of a net investment in a lease under Topic 842 should be the contractual term used to measure expected credit losses under Topic 326. Amendments related to ASU 2019-04 are effective for fiscal years beginning after December 15, 2019, including interim periods within those fiscal years. Early adoption is not permitted before an entity’s adoption of ASU 2016-01. Amendments related to ASU 2016-13 for entities that have not yet adopted that guidance are effective upon adoption of the amendments in ASU 2016-13. Early adoption is not permitted before an entity’s adoption of ASU 2016-13. Amendments related to ASU 2016-13 for entities that have adopted that guidance are effective for fiscal years beginning after December 15, 2019, including interim periods within those years. Other amendments are effective upon issuance of this ASU. This Update is not expected to have a significant impact on the Company’s financial statements.
In January 2020, the FASB issued ASU 2020-04, Reference Rate Reform (Topic 848): Facilitation of the Effects of Reference Rate Reform on Financial Reporting, March 2020 , to provide temporary optional expedients and exceptions to the U.S. GAAP guidance on contract modifications and hedge accounting to ease the financial reporting burdens of the expected market transition from LIBOR and other interbank offered rates to alternative reference rates, such as the Secured Overnight Financing Rate. Entities can elect not to apply certain modification accounting requirements to contracts affected by what the guidance calls “reference rate reform” if certain criteria are met. An entity that makes this election would not have to remeasure the contracts at the modification date or reassess a previous accounting determination. Also, entities can elect various optional expedients that would allow them to continue applying hedge accounting for hedging relationships affected by reference rate reform if certain criteria are met, and can make a one-time election to sell and/or reclassify held-to-maturity debt securities that reference an interest rate affected by reference rate reform. The amendments in this ASU are effective for all entities upon issuance through December 31, 2022. The Company is working through this transition via a multi-disciplinary project team. We are still evaluating the impact the change to a benchmark like SOFR or Prime Rate will have on our financial condition, results of operations or cash flows.
In October 2020, the FASB issued ASU 2020-08, Codification Improvements to Subtopic 310-20, Receivables – Nonrefundable Fees and Other Costs, which clarifies that, for each reporting period, an entity should reevaluate whether a callable debt security is within the scope of ASC 310-20-35-33. For public business entities, such as the Company, ASU 2020-08 is effective for fiscal years, and interim periods within those fiscal years, beginning after December 15, 2020. Early application is not permitted. This Update is not expected to have a significant impact on the Company’s financial statements.
43
CIVISTA BANCSHARES, INC.
NOTES TO CONSOLIDATED FINANCIAL STATEMENTS
December 31, 2020, 2019 and 2018
(Amounts in thousands, except share data)
NOTE 2 – MERGER
On
At the time of the merger, UCB had total assets of $
The following table presents financial information for the former UCB included in the Consolidated Statements of Operations from the date of acquisition through December 31, 2018.
|
|
|
Actual From Acquisition Date Through December 31, 2018 (in thousands) |
|
|
|
Net interest income after provision for loan losses |
|
$ |
|
|
|
Noninterest income |
|
|
|
|
|
Net income |
|
|
|
|
The following table summarizes the estimated fair values of the assets acquired and liabilities assumed at the date of acquisition for UCB. Core deposit intangibles will be amortized over a period of
|
|
|
|
|
|
|
|
|
|
|
Consideration paid |
|
|
|
|
|
$ |
|
|
|
|
|
|
|
|
|
|
|
|
|
Net assets acquired: |
|
|
|
|
|
|
|
|
|
Cash and due from financial institutions |
|
$ |
|
|
|
|
|
|
|
Securities available for sale |
|
|
|
|
|
|
|
|
|
Equity securities |
|
|
|
|
|
|
|
|
|
Loans held for sale |
|
|
|
|
|
|
|
|
|
Loans, net |
|
|
|
|
|
|
|
|
|
Other securities |
|
|
|
|
|
|
|
|
|
Premises and equipment |
|
|
|
|
|
|
|
|
|
Accrued interest receivable |
|
|
|
|
|
|
|
|
|
Core deposit intangible |
|
|
|
|
|
|
|
|
|
Bank owned life insurance |
|
|
|
|
|
|
|
|
|
Other assets |
|
|
|
|
|
|
|
|
|
Noninterest-bearing deposits |
|
|
(
|
) |
|
|
|
|
|
Interest-bearing deposits |
|
|
(
|
) |
|
|
|
|
|
Other liabilities |
|
|
(
|
) |
|
|
|
|
|
|
|
|
|
|
|
|
|
|
|
Goodwill resulting from UCB merger |
|
|
|
|
|
$ |
|
|
44
CIVISTA BANCSHARES, INC.
NOTES TO CONSOLIDATED FINANCIAL STATEMENTS
December 31, 2020, 2019 and 2018
(Amounts in thousands, except share data)
NOTE 3 - SECURITIES
The amortized cost and fair value of available for sale securities and the related gross unrealized gains and losses recognized were as follows:
|
|
|
Amortized Cost |
|
|
Gross Unrealized Gains |
|
|
Gross Unrealized Losses |
|
|
Fair Value |
|
||||
|
2020 |
|
|
|
|
|
|
|
|
|
|
|
|
|
|
|
|
|
U.S. Treasury securities and obligations of U.S. government agencies |
|
$ |
|
|
|
$ |
|
|
|
$ |
(
|
) |
|
$ |
|
|
|
Obligations of states and political subdivisions |
|
|
|
|
|
|
|
|
|
|
(
|
) |
|
|
|
|
|
Mortgage-back securities in government sponsored entities |
|
|
|
|
|
|
|
|
|
|
(
|
) |
|
|
|
|
|
Total debt securities |
|
$ |
|
|
|
$ |
|
|
|
$ |
(
|
) |
|
$ |
|
|
|
|
|
Amortized Cost |
|
|
Gross Unrealized Gains |
|
|
Gross Unrealized Losses |
|
|
Fair Value |
|
||||
|
2019 |
|
|
|
|
|
|
|
|
|
|
|
|
|
|
|
|
|
U.S. Treasury securities and obligations of U.S. government agencies |
|
$ |
|
|
|
$ |
|
|
|
$ |
(
|
) |
|
$ |
|
|
|
Obligations of states and political subdivisions |
|
|
|
|
|
|
|
|
|
|
(
|
) |
|
|
|
|
|
Mortgage-back securities in government sponsored entities |
|
|
|
|
|
|
|
|
|
|
(
|
) |
|
|
|
|
|
Total debt securities |
|
$ |
|
|
|
$ |
|
|
|
$ |
(
|
) |
|
$ |
|
|
The amortized cost and fair value of securities at year end 2020 by contractual maturity were as follows. Securities not due at a single maturity date, primarily mortgage-backed securities, are shown separately.
|
|
|
Available for sale |
|
|||||
|
|
|
Amortized Cost |
|
|
Fair Value |
|
||
|
Due in one year or less |
|
$ |
|
|
|
$ |
|
|
|
Due from one to five years |
|
|
|
|
|
|
|
|
|
Due from five to ten years |
|
|
|
|
|
|
|
|
|
Due after ten years |
|
|
|
|
|
|
|
|
|
Mortgage-backed securities in government sponsored entities |
|
|
|
|
|
|
|
|
|
Total securities available for sale |
|
$ |
|
|
|
$ |
|
|
Securities with a carrying value of $
45
CIVISTA BANCSHARES, INC.
NOTES TO CONSOLIDATED FINANCIAL STATEMENTS
December 31, 2020, 2019 and 2018
(Amounts in thousands, except share data)
NOTE 3 – SECURITIES (Continued)
Proceeds from sales of securities, gross realized gains and gross realized losses were as follows:
|
|
|
2020 |
|
|
2019 |
|
|
2018 |
|
|||
|
Sale proceeds |
|
$ |
|
|
|
$ |
|
|
|
$ |
|
|
|
Gross realized gains |
|
|
|
|
|
|
|
|
|
|
|
|
|
Gross realized losses |
|
|
|
|
|
|
|
|
|
|
|
|
|
Gains (losses) from securities called or settled by the issuer |
|
|
|
|
|
|
|
|
|
|
(
|
) |
Debt securities with unrealized losses at year end 2020 and 2019 not recognized in income were as follows:
|
2020 |
|
12 Months or less |
|
|
More than 12 months |
|
|
Total |
|
|||||||||||||||
|
Description of Securities |
|
Fair Value |
|
|
Unrealized Loss |
|
|
Fair Value |
|
|
Unrealized Loss |
|
|
Fair Value |
|
|
Unrealized Loss |
|
||||||
|
U.S. Treasury securities and obligations of U.S. government agencies |
|
$ |
|
|
|
$ |
(
|
) |
|
$ |
|
|
|
$ |
(
|
) |
|
$ |
|
|
|
$ |
(
|
) |
|
Obligations of states and political subdivisions |
|
|
|
|
|
|
(
|
) |
|
|
— |
|
|
|
— |
|
|
|
|
|
|
|
(
|
) |
|
Mortgage-backed securities in gov’t sponsored entities |
|
|
|
|
|
|
(
|
) |
|
|
— |
|
|
|
— |
|
|
|
|
|
|
|
(
|
) |
|
Total temporarily impaired |
|
$ |
|
|
|
$ |
(
|
) |
|
$ |
|
|
|
$ |
(
|
) |
|
$ |
|
|
|
$ |
(
|
) |
|
2019 |
|
12 Months or less |
|
|
More than 12 months |
|
|
Total |
|
|||||||||||||||
|
Description of Securities |
|
Fair Value |
|
|
Unrealized Loss |
|
|
Fair Value |
|
|
Unrealized Loss |
|
|
Fair Value |
|
|
Unrealized Loss |
|
||||||
|
U.S. Treasury securities and obligations of U.S. government agencies |
|
$ |
— |
|
|
$ |
— |
|
|
$ |
|
|
|
$ |
(
|
) |
|
$ |
|
|
|
$ |
(
|
) |
|
Obligations of states and political subdivisions |
|
|
|
|
|
|
(
|
) |
|
|
— |
|
|
|
— |
|
|
|
|
|
|
|
(
|
) |
|
Mortgage-backed securities in gov’t sponsored entities |
|
|
|
|
|
|
(
|
) |
|
|
|
|
|
|
(
|
) |
|
|
|
|
|
|
(
|
) |
|
Total temporarily impaired |
|
$ |
|
|
|
$ |
(
|
) |
|
$ |
|
|
|
$ |
(
|
) |
|
$ |
|
|
|
$ |
(
|
) |
The Company periodically evaluates securities for other-than-temporary impairment. An unrealized loss exists when the current fair value of an individual security is less than its amortized cost basis. Unrealized losses that are determined to be temporary in nature are recorded, net of tax, in accumulated other comprehensive loss on the Consolidated Balance Sheet.
The Company has assessed each available-for-sale security position for credit impairment. Factors considered in determining whether a loss is temporary include:
|
|
• |
The length of time and the extent to which fair value has been below cost; |
|
|
• |
The severity of impairment; |
|
|
• |
The cause of the impairment and the financial condition and near-term prospects of the issuer; |
|
|
• |
If the Company intends to sell the investment; |
46
CIVISTA BANCSHARES, INC.
NOTES TO CONSOLIDATED FINANCIAL STATEMENTS
December 31, 2020, 2019 and 2018
(Amounts in thousands, except share data)
|
|
• |
If it’s more-likely-than-not the Company will be required to sell the investment before recovering its amortized cost basis; and |
|
|
• |
If the Company does not expect to recover the investment’s entire amortized cost basis (even if the Company does not intend to sell the investment). |
NOTE 3 – SECURITIES (Continued)
The Company’s review for impairment generally entails:
|
|
• |
Identification and evaluation of investments that have indications of impairment; |
|
|
• |
Analysis of individual investments that have fair values less than amortized cost, including consideration of length of time each investment has been in unrealized loss position and the expected recovery period; |
|
|
• |
Evaluation of factors or triggers that could cause individual investments to qualify as having other-than-temporary impairment; and |
|
|
• |
Documentation of these analyses, as required by policy. |
At December 31, 2020, the Company owned
The following table presents the net gains and losses on equity investments recognized in earnings at year-end 2020 and 2019, and the portion of unrealized gains and losses for the period that relates to equity investments held at year-end 2020 and 2019:
|
|
|
2020 |
|
|
2019 |
|
||
|
Net gains (losses) recognized on equity securities during the year |
|
$ |
(
|
) |
|
$ |
|
|
|
Less: Net gains realized on the sale of equity securities during the period |
|
|
|
|
|
|
— |
|
|
Unrealized gains (losses) recognized in equity securities held at December 31 |
|
$ |
(
|
) |
|
$ |
|
|
47
CIVISTA BANCSHARES, INC.
NOTES TO CONSOLIDATED FINANCIAL STATEMENTS
December 31, 2020, 2019 and 2018
(Amounts in thousands, except share data)
NOTE 4 - LOANS
Loans at year-end were as follows:
|
|
|
2020 |
|
|
2019 |
|
||
|
Commercial and Agriculture |
|
$ |
|
|
|
$ |
|
|
|
Commercial Real Estate - owner occupied |
|
|
|
|
|
|
|
|
|
Commercial Real Estate - non-owner occupied |
|
|
|
|
|
|
|
|
|
Residential Real Estate |
|
|
|
|
|
|
|
|
|
Real Estate Construction |
|
|
|
|
|
|
|
|
|
Farm Real Estate |
|
|
|
|
|
|
|
|
|
Consumer and Other |
|
|
|
|
|
|
|
|
|
Total Loans |
|
|
|
|
|
|
|
|
|
Allowance for loan losses |
|
|
(
|
) |
|
|
(
|
) |
|
Net loans |
|
$ |
|
|
|
$ |
|
|
Included in Commercial & Agriculture as of December 31, 2020 is $
Included in total loans above are deferred loan fees of $
Paycheck Protection Program
During 2020, we processed over
Loans to principal officers, directors, and their affiliates at year-end 2020 and 2019 were as follows:
|
|
|
2020 |
|
|
2019 |
|
||
|
Balance - Beginning of year |
|
$ |
|
|
|
$ |
|
|
|
New loans and advances |
|
|
|
|
|
|
|
|
|
Repayments |
|
|
(
|
) |
|
|
(
|
) |
|
Effect of changes to related parties |
|
|
|
|
|
|
|
|
|
Balance - End of year |
|
$ |
|
|
|
$ |
|
|
48
CIVISTA BANCSHARES, INC.
NOTES TO CONSOLIDATED FINANCIAL STATEMENTS
December 31, 2020, 2019 and 2018
(Amounts in thousands, except share data)
NOTE 5 - ALLOWANCE FOR LOAN LOSSES
Management has an established methodology to determine the adequacy of the allowance for loan losses that assesses the risks and losses inherent in the loan portfolio. For purposes of determining the allowance for loan losses, the Company has segmented certain loans in the portfolio by product type. Loans are segmented into the following pools: Commercial and Agriculture loans, Commercial Real Estate – Owner Occupied loans, Commercial Real Estate – Non-owner Occupied loans, Residential Real Estate loans, Real Estate Construction loans, Farm Real Estate loans and Consumer and Other loans. Loss migration rates for each risk category are calculated and used as the basis for calculating loan loss allowance allocations. Loss migration rates are calculated over a period for all portfolio segments. Management also considers certain economic factors for trends that management uses to account for the qualitative and environmental changes in risk, which affects the level of the reserve. The following economic factors are analyzed:
|
|
• |
Changes in lending policies and procedures |
|
|
• |
Changes in experience and depth of lending and management staff |
|
|
• |
Changes in quality of credit review system |
|
|
• |
Changes in the nature and volume of the loan portfolio |
|
|
• |
Changes in past due, classified and nonaccrual loans and TDRs |
|
|
• |
Changes in economic and business conditions |
|
|
• |
Changes in competition or legal and regulatory requirements |
|
|
• |
Changes in concentrations within the loan portfolio |
|
|
• |
Changes in the underlying collateral for collateral dependent loans |
49
CIVISTA BANCSHARES, INC.
NOTES TO CONSOLIDATED FINANCIAL STATEMENTS
December 31, 2020, 2019 and 2018
(Amounts in thousands, except share data)
NOTE 5 - ALLOWANCE FOR LOAN LOSSES (Continued)
The total allowance reflects management’s estimate of loan losses inherent in the loan portfolio at the consolidated balance sheet date. The Company considers the allowance for loan losses of $
Allowance for loan losses:
|
December 31, 2020 |
|
Beginning balance |
|
|
Charge-offs |
|
|
Recoveries |
|
|
Provision (Credit) |
|
|
Ending Balance |
|
|||||
|
Commercial & Agriculture |
|
$ |
|
|
|
$ |
(
|
) |
|
$ |
|
|
|
$ |
|
|
|
$ |
|
|
|
Commercial Real Estate: |
|
|
|
|
|
|
|
|
|
|
|
|
|
|
|
|
|
|
|
|
|
Owner Occupied |
|
|
|
|
|
|
(
|
) |
|
|
|
|
|
|
|
|
|
|
|
|
|
Non-Owner Occupied |
|
|
|
|
|
|
— |
|
|
|
|
|
|
|
|
|
|
|
|
|
|
Residential Real Estate |
|
|
|
|
|
|
(
|
) |
|
|
|
|
|
|
|
|
|
|
|
|
|
Real Estate Construction |
|
|
|
|
|
|
— |
|
|
|
|
|
|
|
|
|
|
|
|
|
|
Farm Real Estate |
|
|
|
|
|
|
— |
|
|
|
|
|
|
|
(
|
) |
|
|
|
|
|
Consumer and Other |
|
|
|
|
|
|
(
|
) |
|
|
|
|
|
|
(
|
) |
|
|
|
|
|
Unallocated |
|
|
— |
|
|
|
— |
|
|
|
— |
|
|
|
|
|
|
|
|
|
|
Total |
|
$ |
|
|
|
$ |
(
|
) |
|
$ |
|
|
|
$ |
|
|
|
$ |
|
|
For the year ended December 31, 2020, the Company provided $
50
CIVISTA BANCSHARES, INC.
NOTES TO CONSOLIDATED FINANCIAL STATEMENTS
December 31, 2020, 2019 and 2018
(Amounts in thousands, except share data)
NOTE 5 - ALLOWANCE FOR LOAN LOSSES (Continued)
Allowance for loan losses:
|
December 31, 2019 |
|
Beginning balance |
|
|
Charge-offs |
|
|
Recoveries |
|
|
Provision (Credit) |
|
|
Ending Balance |
|
|||||
|
Commercial & Agriculture |
|
$ |
|
|
|
$ |
(
|
) |
|
$ |
|
|
|
$ |
|
|
|
$ |
|
|
|
Commercial Real Estate: |
|
|
|
|
|
|
|
|
|
|
|
|
|
|
|
|
|
|
|
|
|
Owner Occupied |
|
|
|
|
|
|
(
|
) |
|
|
|
|
|
|
|
|
|
|
|
|
|
Non-Owner Occupied |
|
|
|
|
|
|
— |
|
|
|
|
|
|
|
|
|
|
|
|
|
|
Residential Real Estate |
|
|
|
|
|
|
(
|
) |
|
|
|
|
|
|
|
|
|
|
|
|
|
Real Estate Construction |
|
|
|
|
|
|
(
|
) |
|
|
|
|
|
|
|
|
|
|
|
|
|
Farm Real Estate |
|
|
|
|
|
|
— |
|
|
|
|
|
|
|
(
|
) |
|
|
|
|
|
Consumer and Other |
|
|
|
|
|
|
(
|
) |
|
|
|
|
|
|
|
|
|
|
|
|
|
Unallocated |
|
|
|
|
|
|
— |
|
|
|
— |
|
|
|
(
|
) |
|
|
— |
|
|
Total |
|
$ |
|
|
|
$ |
(
|
) |
|
$ |
|
|
|
$ |
|
|
|
$ |
|
|
For the year ended December 31, 2019, the allowance for Commercial & Agriculture loans increased as a result of an increase in general reserves due to higher loan balances. The result was represented as an increase in the provision. The allowance for Commercial Real Estate – Owner Occupied loans increased as a result of an increase in general reserves due to higher loan balances. The result was represented as an increase in the provision. The allowance for Commercial Real Estate – Non-Owner Occupied loans increased due to an increase in general reserves required for this type as a result of higher loan balances. The allowance for Residential Real Estate loans increased as a result of an increase in general reserves required for this type as a result of an increase in outstanding loan balances, represented by an increase in the provision. The allowance for Real Estate Construction loans increased due to higher outstanding loan balances for this type of loan. The allowance for Farm Real Estate loans was reduced by a decrease in general reserves required for this type as a result of lower outstanding loan balances. The result was represented as a decrease in the provision.
51
CIVISTA BANCSHARES, INC.
NOTES TO CONSOLIDATED FINANCIAL STATEMENTS
December 31, 2020, 2019 and 2018
(Amounts in thousands, except share data)
NOTE 5 - ALLOWANCE FOR LOAN LOSSES (Continued)
Allowance for loan losses:
|
December 31, 2018 |
|
Beginning balance |
|
|
Charge-offs |
|
|
Recoveries |
|
|
Provision (Credit) |
|
|
Ending Balance |
|
|||||
|
Commercial & Agriculture |
|
$ |
|
|
|
$ |
(
|
) |
|
$ |
|
|
|
$ |
|
|
|
$ |
|
|
|
Commercial Real Estate: |
|
|
|
|
|
|
|
|
|
|
|
|
|
|
|
|
|
|
|
|
|
Owner Occupied |
|
|
|
|
|
|
(
|
) |
|
|
|
|
|
|
(
|
) |
|
|
|
|
|
Non-Owner Occupied |
|
|
|
|
|
|
(
|
) |
|
|
|
|
|
|
|
|
|
|
|
|
|
Residential Real Estate |
|
|
|
|
|
|
(
|
) |
|
|
|
|
|
|
(
|
) |
|
|
|
|
|
Real Estate Construction |
|
|
|
|
|
|
— |
|
|
|
— |
|
|
|
|
|
|
|
|
|
|
Farm Real Estate |
|
|
|
|
|
|
— |
|
|
|
|
|
|
|
(
|
) |
|
|
|
|
|
Consumer and Other |
|
|
|
|
|
|
(
|
) |
|
|
|
|
|
|
|
|
|
|
|
|
|
Unallocated |
|
|
|
|
|
|
— |
|
|
|
— |
|
|
|
|
|
|
|
|
|
|
Total |
|
$ |
|
|
|
$ |
(
|
) |
|
$ |
|
|
|
$ |
|
|
|
$ |
|
|
For the year ended December 31, 2018, the allowance for Commercial & Agriculture loans increased as a result of an increase in general reserves due to higher loan balances. The result was represented as an increase in the provision. The allowance for Commercial Real Estate – Owner Occupied loans was reduced by a decrease in general reserves as a result of lower loss rates. The result was represented as a decrease in the provision. The allowance for Commercial Real Estate – Non-Owner Occupied loans increased due to an increase in general reserves required for this type as a result of higher loan balances. The allowance for Residential Real Estate loans was reduced by a decrease in general reserves required for this type as a result of a decrease in loss rates, represented by a decrease in the provision. The allowance for Real Estate Construction loans increased due to higher outstanding loan balances for this type of loan. The allowance for Farm Real Estate loans was reduced by a decrease in general reserves required for this type as a result of lower outstanding loan balances. The result was represented as a decrease in the provision.
52
CIVISTA BANCSHARES, INC.
NOTES TO CONSOLIDATED FINANCIAL STATEMENTS
December 31, 2020, 2019 and 2018
(Amounts in thousands, except share data)
NOTE 5 - ALLOWANCE FOR LOAN LOSSES (Continued)
The following tables present, by portfolio segment, the allocation of the allowance for loan losses and related loan balances as of December 31, 2020 and December 31, 2019.
|
December 31, 2020 |
|
Loans acquired with credit deterioration |
|
|
Loans individually evaluated for impairment |
|
|
Loans collectively evaluated for impairment |
|
|
Total |
|
||||
|
Allowance for loan losses: |
|
|
|
|
|
|
|
|
|
|
|
|
|
|
|
|
|
Commercial & Agriculture |
|
$ |
— |
|
|
$ |
|
|
|
$ |
|
|
|
$ |
|
|
|
Commercial Real Estate: |
|
|
|
|
|
|
|
|
|
|
|
|
|
|
|
|
|
Owner Occupied |
|
|
— |
|
|
|
|
|
|
|
|
|
|
|
|
|
|
Non-Owner Occupied |
|
|
— |
|
|
|
— |
|
|
|
|
|
|
|
|
|
|
Residential Real Estate |
|
|
— |
|
|
|
|
|
|
|
|
|
|
|
|
|
|
Real Estate Construction |
|
|
— |
|
|
|
— |
|
|
|
|
|
|
|
|
|
|
Farm Real Estate |
|
|
— |
|
|
|
— |
|
|
|
|
|
|
|
|
|
|
Consumer and Other |
|
|
— |
|
|
|
— |
|
|
|
|
|
|
|
|
|
|
Unallocated |
|
|
— |
|
|
|
— |
|
|
|
|
|
|
|
|
|
|
Total |
|
$ |
— |
|
|
$ |
|
|
|
$ |
|
|
|
$ |
|
|
|
|
|
|
|
|
|
|
|
|
|
|
|
|
|
|
|
|
|
Outstanding loan balances: |
|
|
|
|
|
|
|
|
|
|
|
|
|
|
|
|
|
Commercial & Agriculture |
|
$ |
— |
|
|
$ |
|
|
|
$ |
|
|
|
$ |
|
|
|
Commercial Real Estate: |
|
|
|
|
|
|
|
|
|
|
|
|
|
|
|
|
|
Owner Occupied |
|
|
— |
|
|
|
|
|
|
|
|
|
|
|
|
|
|
Non-Owner Occupied |
|
|
— |
|
|
|
|
|
|
|
|
|
|
|
|
|
|
Residential Real Estate |
|
|
|
|
|
|
|
|
|
|
|
|
|
|
|
|
|
Real Estate Construction |
|
|
— |
|
|
|
— |
|
|
|
|
|
|
|
|
|
|
Farm Real Estate |
|
|
— |
|
|
|
|
|
|
|
|
|
|
|
|
|
|
Consumer and Other |
|
|
— |
|
|
|
— |
|
|
|
|
|
|
|
|
|
|
Total |
|
$ |
|
|
|
$ |
|
|
|
$ |
|
|
|
$ |
|
|
53
CIVISTA BANCSHARES, INC.
NOTES TO CONSOLIDATED FINANCIAL STATEMENTS
December 31, 2020, 2019 and 2018
(Amounts in thousands, except share data)
NOTE 5 - ALLOWANCE FOR LOAN LOSSES (Continued)
|
December 31, 2019 |
|
Loans acquired with credit deterioration |
|
|
Loans individually evaluated for impairment |
|
|
Loans collectively evaluated for impairment |
|
|
Total |
|
||||
|
Allowance for loan losses: |
|
|
|
|
|
|
|
|
|
|
|
|
|
|
|
|
|
Commercial & Agriculture |
|
$ |
— |
|
|
$ |
— |
|
|
$ |
|
|
|
$ |
|
|
|
Commercial Real Estate: |
|
|
|
|
|
|
|
|
|
|
|
|
|
|
|
|
|
Owner Occupied |
|
|
— |
|
|
|
|
|
|
|
|
|
|
|
|
|
|
Non-Owner Occupied |
|
|
— |
|
|
|
— |
|
|
|
|
|
|
|
|
|
|
Residential Real Estate |
|
|
— |
|
|
|
|
|
|
|
|
|
|
|
|
|
|
Real Estate Construction |
|
|
— |
|
|
|
— |
|
|
|
|
|
|
|
|
|
|
Farm Real Estate |
|
|
— |
|
|
|
— |
|
|
|
|
|
|
|
|
|
|
Consumer and Other |
|
|
— |
|
|
|
— |
|
|
|
|
|
|
|
|
|
|
Unallocated |
|
|
— |
|
|
|
— |
|
|
|
— |
|
|
|
— |
|
|
Total |
|
$ |
— |
|
|
$ |
|
|
|
$ |
|
|
|
$ |
|
|
|
|
|
|
|
|
|
|
|
|
|
|
|
|
|
|
|
|
|
Outstanding loan balances: |
|
|
|
|
|
|
|
|
|
|
|
|
|
|
|
|
|
Commercial & Agriculture |
|
$ |
— |
|
|
$ |
|
|
|
$ |
|
|
|
$ |
|
|
|
Commercial Real Estate: |
|
|
|
|
|
|
|
|
|
|
|
|
|
|
|
|
|
Owner Occupied |
|
|
— |
|
|
|
|
|
|
|
|
|
|
|
|
|
|
Non-Owner Occupied |
|
|
— |
|
|
|
|
|
|
|
|
|
|
|
|
|
|
Residential Real Estate |
|
|
|
|
|
|
|
|
|
|
|
|
|
|
|
|
|
Real Estate Construction |
|
|
— |
|
|
|
— |
|
|
|
|
|
|
|
|
|
|
Farm Real Estate |
|
|
— |
|
|
|
|
|
|
|
|
|
|
|
|
|
|
Consumer and Other |
|
|
— |
|
|
|
— |
|
|
|
|
|
|
|
|
|
|
Total |
|
$ |
|
|
|
$ |
|
|
|
$ |
|
|
|
$ |
|
|
The following tables represent credit exposures by internally assigned risk ratings for the periods ended December 31, 2020 and 2019. The remaining loans in the Residential Real Estate, Real Estate Construction and Consumer and Other loan categories that are not assigned a risk grade are presented in a separate table below. The risk rating analysis estimates the capability of the borrower to repay the contractual obligations of the loan agreements as scheduled or at all. The Company’s internal credit risk rating system is based on experiences with similarly graded loans.
The Company’s internally assigned grades are as follows:
|
|
• |
Pass – loans which are protected by the current net worth and paying capacity of the obligor or by the value of the underlying collateral. |
|
|
• |
Special Mention – loans where a potential weakness or risk exists, which could cause a more serious problem if not corrected. |
|
|
• |
Substandard – loans that have a well-defined weakness based on objective evidence and are characterized by the distinct possibility that Civista will sustain some loss if the deficiencies are not corrected. |
|
|
• |
Doubtful – loans classified as doubtful have all the weaknesses inherent in a substandard asset. In addition, these weaknesses make collection or liquidation in full highly questionable and improbable, based on existing circumstances. |
|
|
• |
Loss – loans classified as a loss are considered uncollectible, or of such value that continuance as an asset is not warranted. |
|
|
• |
Unrated – Generally, Residential Real Estate, Real Estate Construction and Consumer and Other loans are not risk-graded, except when collateral is used for a business purpose. |
54
CIVISTA BANCSHARES, INC.
NOTES TO CONSOLIDATED FINANCIAL STATEMENTS
December 31, 2020, 2019 and 2018
(Amounts in thousands, except share data)
NOTE 5 - ALLOWANCE FOR LOAN LOSSES (Continued)
|
December 31, 2020 |
|
Pass |
|
|
Special Mention |
|
|
Substandard |
|
|
Doubtful |
|
|
Ending Balance |
|
|||||
|
Commercial & Agriculture |
|
$ |
|
|
|
$ |
|
|
|
$ |
|
|
|
$ |
— |
|
|
$ |
|
|
|
Commercial Real Estate: |
|
|
|
|
|
|
|
|
|
|
|
|
|
|
|
|
|
|
|
|
|
Owner Occupied |
|
|
|
|
|
|
|
|
|
|
|
|
|
|
— |
|
|
|
|
|
|
Non-Owner Occupied |
|
|
|
|
|
|
|
|
|
|
|
|
|
|
— |
|
|
|
|
|
|
Residential Real Estate |
|
|
|
|
|
|
|
|
|
|
|
|
|
|
— |
|
|
|
|
|
|
Real Estate Construction |
|
|
|
|
|
|
|
|
|
|
|
|
|
|
— |
|
|
|
|
|
|
Farm Real Estate |
|
|
|
|
|
|
|
|
|
|
|
|
|
|
— |
|
|
|
|
|
|
Consumer and Other |
|
|
|
|
|
|
— |
|
|
|
|
|
|
|
— |
|
|
|
|
|
|
Total |
|
$ |
|
|
|
$ |
|
|
|
$ |
|
|
|
$ |
— |
|
|
$ |
|
|
|
December 31, 2019 |
|
Pass |
|
|
Special Mention |
|
|
Substandard |
|
|
Doubtful |
|
|
Ending Balance |
|
|||||
|
Commercial & Agriculture |
|
$ |
|
|
|
$ |
|
|
|
$ |
|
|
|
$ |
— |
|
|
$ |
|
|
|
Commercial Real Estate: |
|
|
|
|
|
|
|
|
|
|
|
|
|
|
|
|
|
|
|
|
|
Owner Occupied |
|
|
|
|
|
|
|
|
|
|
|
|
|
|
— |
|
|
|
|
|
|
Non-Owner Occupied |
|
|
|
|
|
|
|
|
|
|
|
|
|
|
— |
|
|
|
|
|
|
Residential Real Estate |
|
|
|
|
|
|
|
|
|
|
|
|
|
|
— |
|
|
|
|
|
|
Real Estate Construction |
|
|
|
|
|
|
— |
|
|
|
|
|
|
|
— |
|
|
|
|
|
|
Farm Real Estate |
|
|
|
|
|
|
|
|
|
|
|
|
|
|
— |
|
|
|
|
|
|
Consumer and Other |
|
|
|
|
|
|
— |
|
|
|
|
|
|
|
— |
|
|
|
|
|
|
Total |
|
$ |
|
|
|
$ |
|
|
|
$ |
|
|
|
$ |
— |
|
|
$ |
|
|
Due to the business disruptions and shut-downs due to the Covid-19 pandemic, management offered payment deferments to a number of customers that had previously been current in all respects. The bank instituted an enhanced portfolio management process which included meeting with customers, requesting additional financial information and evaluating cashflow and adjusting risk ratings as conditions warrant. During this process systematically downgraded a significant number of loans to recognize the increased risk attributed to the business disruptions related to the pandemic. The majority of the loans downgraded did not meet the definition of impaired, but were added to the criticized category due to the additional deferrals or reduced financial performance. Additionally, the bank did offer longer term deferrals under Section 4013 of the Cares Act, that were also downgraded as appropriate. The majority of the deferrals made during the year resulted in continued payments of interest. The Bank believes it has prudently identified risk, assigned appropriate risk ratings, and has a comprehensive portfolio monitoring process to identify and quantify risk.
The following tables present performing and nonperforming loans based solely on payment activity for the years ended December 31, 2020 and December 31, 2019 that have not been assigned an internal risk grade. The types of loans presented here are not assigned a risk grade unless there is evidence of a problem. Payment activity is reviewed by management on a monthly basis to evaluate performance. Loans are considered to be nonperforming when they become
55
CIVISTA BANCSHARES, INC.
NOTES TO CONSOLIDATED FINANCIAL STATEMENTS
December 31, 2020, 2019 and 2018
(Amounts in thousands, except share data)
NOTE 5 - ALLOWANCE FOR LOAN LOSSES (Continued)
|
December 31, 2020 |
|
Residential Real Estate |
|
|
Real Estate Construction |
|
|
Consumer and Other |
|
|
Total |
|
||||
|
Performing |
|
$ |
|
|
|
$ |
|
|
|
$ |
|
|
|
$ |
|
|
|
Nonperforming |
|
|
— |
|
|
|
— |
|
|
|
— |
|
|
|
— |
|
|
Total |
|
$ |
|
|
|
$ |
|
|
|
$ |
|
|
|
$ |
|
|
|
December 31, 2019 |
|
Residential Real Estate |
|
|
Real Estate Construction |
|
|
Consumer and Other |
|
|
Total |
|
||||
|
Performing |
|
$ |
|
|
|
$ |
|
|
|
$ |
|
|
|
$ |
|
|
|
Nonperforming |
|
|
— |
|
|
|
— |
|
|
|
— |
|
|
|
— |
|
|
Total |
|
$ |
|
|
|
$ |
|
|
|
$ |
|
|
|
$ |
|
|
The following tables include an aging analysis of the recorded investment of past due loans outstanding as of December 31, 2020 and 2019.
|
December 31, 2020 |
|
30-59 Days Past Due |
|
|
60-89 Days Past Due |
|
|
90 Days or Greater |
|
|
Total Past Due |
|
|
Current |
|
|
Purchased Credit- Impaired Loans |
|
|
Total Loans |
|
|
Past Due 90 Days and Accruing |
|
||||||||
|
Commercial & Agriculture |
|
$ |
|
|
|
$ |
|
|
|
$ |
|
|
|
$ |
|
|
|
$ |
|
|
|
$ |
— |
|
|
$ |
|
|
|
$ |
— |
|
|
Commercial Real Estate: |
|
|
|
|
|
|
|
|
|
|
|
|
|
|
|
|
|
|
|
|
|
|
|
|
|
|
|
|
|
|
|
|
|
Owner Occupied |
|
|
— |
|
|
|
|
|
|
|
|
|
|
|
|
|
|
|
|
|
|
|
— |
|
|
|
|
|
|
|
— |
|
|
Non-Owner Occupied |
|
|
— |
|
|
|
— |
|
|
|
|
|
|
|
|
|
|
|
|
|
|
|
— |
|
|
|
|
|
|
|
— |
|
|
Residential Real Estate |
|
|
|
|
|
|
|
|
|
|
|
|
|
|
|
|
|
|
|
|
|
|
|
|
|
|
|
|
|
|
— |
|
|
Real Estate Construction |
|
|
— |
|
|
|
— |
|
|
|
— |
|
|
|
— |
|
|
|
|
|
|
|
— |
|
|
|
|
|
|
|
— |
|
|
Farm Real Estate |
|
|
— |
|
|
|
— |
|
|
|
|
|
|
|
|
|
|
|
|
|
|
|
— |
|
|
|
|
|
|
|
— |
|
|
Consumer and Other |
|
|
|
|
|
|
|
|
|
|
|
|
|
|
|
|
|
|
|
|
|
|
— |
|
|
|
|
|
|
|
— |
|
|
Total |
|
$ |
|
|
|
$ |
|
|
|
$ |
|
|
|
$ |
|
|
|
$ |
|
|
|
$ |
|
|
|
$ |
|
|
|
$ |
— |
|
|
December 31, 2019 |
|
30-59 Days Past Due |
|
|
60-89 Days Past Due |
|
|
90 Days or Greater |
|
|
Total Past Due |
|
|
Current |
|
|
Purchased Credit- Impaired Loans |
|
|
Total Loans |
|
|
Past Due 90 Days and Accruing |
|
||||||||
|
Commercial & Agriculture |
|
$ |
|
|
|
$ |
|
|
|
$ |
|
|
|
$ |
|
|
|
$ |
|
|
|
$ |
— |
|
|
$ |
|
|
|
$ |
— |
|
|
Commercial Real Estate: |
|
|
|
|
|
|
|
|
|
|
|
|
|
|
|
|
|
|
|
|
|
|
|
|
|
|
|
|
|
|
|
|
|
Owner Occupied |
|
|
|
|
|
|
|
|
|
|
|
|
|
|
|
|
|
|
|
|
|
|
— |
|
|
|
|
|
|
|
— |
|
|
Non-Owner Occupied |
|
|
— |
|
|
|
— |
|
|
|
|
|
|
|
|
|
|
|
|
|
|
|
— |
|
|
|
|
|
|
|
— |
|
|
Residential Real Estate |
|
|
|
|
|
|
|
|
|
|
|
|
|
|
|
|
|
|
|
|
|
|
|
|
|
|
|
|
|
|
— |
|
|
Real Estate Construction |
|
|
— |
|
|
|
— |
|
|
|
— |
|
|
|
— |
|
|
|
|
|
|
|
— |
|
|
|
|
|
|
|
— |
|
|
Farm Real Estate |
|
|
— |
|
|
|
— |
|
|
|
|
|
|
|
|
|
|
|
|
|
|
|
— |
|
|
|
|
|
|
|
— |
|
|
Consumer and Other |
|
|
|
|
|
|
|
|
|
|
— |
|
|
|
|
|
|
|
|
|
|
|
— |
|
|
|
|
|
|
|
— |
|
|
Total |
|
$ |
|
|
|
$ |
|
|
|
$ |
|
|
|
$ |
|
|
|
$ |
|
|
|
$ |
|
|
|
$ |
|
|
|
$ |
— |
|
56
CIVISTA BANCSHARES, INC.
NOTES TO CONSOLIDATED FINANCIAL STATEMENTS
December 31, 2020, 2019 and 2018
(Amounts in thousands, except share data)
NOTE 5 - ALLOWANCE FOR LOAN LOSSES (Continued)
The following table presents loans on nonaccrual status, excluding purchased credit-impaired (PCI) loans, as of December 31, 2020 and 2019.
|
|
|
2020 |
|
|
2019 |
|
||
|
Commercial & Agriculture |
|
$ |
|
|
|
$ |
|
|
|
Commercial Real Estate: |
|
|
|
|
|
|
|
|
|
Owner Occupied |
|
|
|
|
|
|
|
|
|
Non-Owner Occupied |
|
|
|
|
|
|
|
|
|
Residential Real Estate |
|
|
|
|
|
|
|
|
|
Real Estate Construction |
|
|
|
|
|
|
|
|
|
Farm Real Estate |
|
|
|
|
|
|
|
|
|
Consumer and Other |
|
|
|
|
|
|
|
|
|
Total |
|
$ |
|
|
|
$ |
|
|
Nonaccrual Loans:
Loans are considered for nonaccrual status upon reaching
Modifications: A modification of a loan constitutes a TDR when the Company for economic or legal reasons related to a borrower’s financial difficulties grants a concession to the borrower that it would not otherwise consider. The Company offers various types of concessions when modifying a loan, however, forgiveness of principal is rarely granted. Commercial Real Estate loans modified in a TDR often involve reducing the interest rate lower than the current market rate for new debt with similar risk. Real Estate loans modified in a TDR were primarily comprised of interest rate reductions where monthly payments were lowered to accommodate the borrowers’ financial needs.
Loans modified in a TDR are typically already on non-accrual status and partial charge-offs have in some cases already been taken against the outstanding loan balance. As a result, loans modified in a TDR may have the financial effect of increasing the specific allowance associated with the loan. An allowance for impaired loans that have been modified in a TDR are measured based on the present value of expected future cash flows discounted at the loan’s effective interest rate or the estimated fair value of the collateral, less any selling costs, if the loan is collateral dependent. Management exercises significant judgment in developing these estimates. TDRs accounted for $
There were
57
CIVISTA BANCSHARES, INC.
NOTES TO CONSOLIDATED FINANCIAL STATEMENTS
December 31, 2020, 2019 and 2018
(Amounts in thousands, except share data)
NOTE 5 - ALLOWANCE FOR LOAN LOSSES (Continued)
|
|
|
For the Twelve Month Period Ended December 31, 2019 |
|
|||||||||
|
|
|
Number of Contracts |
|
|
Pre- Modification Outstanding Recorded Investment |
|
|
Post- Modification Outstanding Recorded Investment |
|
|||
|
Commercial & Agriculture |
|
|
— |
|
|
$ |
— |
|
|
$ |
— |
|
|
Commercial Real Estate: |
|
|
|
|
|
|
|
|
|
|
|
|
|
Owner Occupied |
|
|
— |
|
|
|
— |
|
|
|
— |
|
|
Non-Owner Occupied |
|
|
|
|
|
|
|
|
|
|
|
|
|
Residential Real Estate |
|
|
— |
|
|
|
— |
|
|
|
— |
|
|
Real Estate Construction |
|
|
— |
|
|
|
— |
|
|
|
— |
|
|
Farm Real Estate |
|
|
— |
|
|
|
— |
|
|
|
— |
|
|
Consumer and Other |
|
|
— |
|
|
|
— |
|
|
|
— |
|
|
Total Loan Modifications |
|
|
|
|
|
$ |
|
|
|
$ |
|
|
|
|
|
For the Twelve Month Period Ended December 31, 2018 |
|
|||||||||
|
|
|
Number of Contracts |
|
|
Pre- Modification Outstanding Recorded Investment |
|
|
Post- Modification Outstanding Recorded Investment |
|
|||
|
Commercial & Agriculture |
|
|
— |
|
|
$ |
— |
|
|
$ |
— |
|
|
Commercial Real Estate: |
|
|
|
|
|
|
|
|
|
|
|
|
|
Owner Occupied |
|
|
— |
|
|
|
— |
|
|
|
— |
|
|
Non-Owner Occupied |
|
|
— |
|
|
|
— |
|
|
|
— |
|
|
Residential Real Estate |
|
|
|
|
|
|
|
|
|
|
|
|
|
Real Estate Construction |
|
|
— |
|
|
|
— |
|
|
|
— |
|
|
Farm Real Estate |
|
|
|
|
|
|
|
|
|
|
|
|
|
Consumer and Other |
|
|
— |
|
|
|
— |
|
|
|
— |
|
|
Total Loan Modifications |
|
|
|
|
|
$ |
|
|
|
$ |
|
|
Recidivism, or the borrower defaulting on its obligation pursuant to a modified loan, results in the loan once again becoming a non-accrual loan. Recidivism occurs at a notably higher rate than do defaults on new originations loans, so modified loans present a higher risk of loss than do new origination loans. During the periods ended December 31, 2020, 2019 and 2018, there were
Impaired Loans:
Larger (
58
CIVISTA BANCSHARES, INC.
NOTES TO CONSOLIDATED FINANCIAL STATEMENTS
December 31, 2020, 2019 and 2018
(Amounts in thousands, except share data)
NOTE 5 - ALLOWANCE FOR LOAN LOSSES (Continued)
Loan Modifications/Troubled Debt Restructurings
During 2020, Civista modified
While most of the loans that received some form of modification have returned to making payments, Civista has received customer deferral requests for another round of modifications on loans. As of December 31, 2020, Civista has
|
|
|
Number of |
|
|
|
|
|
Percent of |
|
|
|
Type of Loan |
|
Loans |
|
Balance |
|
|
Loans Outstanding1 |
|
||
|
|
|
|
|
(In thousands) |
|
|
|
|
|
|
|
Commercial & Agriculture |
|
|
|
$ |
|
|
|
|
|
% |
|
Commercial Real Estate: |
|
|
|
|
|
|
|
|
|
|
|
Owner Occupied |
|
|
|
|
|
|
|
|
|
% |
|
Non-Owner Occupied |
|
|
|
|
|
|
|
|
|
% |
|
Residential Real Estate |
|
|
|
|
|
|
|
|
|
% |
|
Real Estate Construction |
|
|
|
|
|
|
|
|
|
% |
|
Total |
|
|
|
$ |
|
|
|
|
|
% |
|
1
|
|
|
|
|
|
|
|
|
|
|
59
CIVISTA BANCSHARES, INC.
NOTES TO CONSOLIDATED FINANCIAL STATEMENTS
December 31, 2020, 2019 and 2018
(Amounts in thousands, except share data)
NOTE 5 - ALLOWANCE FOR LOAN LOSSES (Continued)
The following table includes the recorded investment and unpaid principal balances for impaired financing receivables, excluding PCI loans, with the associated allowance amount, if applicable, as of December 31, 2020 and 2019.
|
|
|
December 31, 2020 |
|
|
December 31, 2019 |
|
||||||||||||||||||
|
|
|
Recorded Investment |
|
|
Unpaid Principal Balance |
|
|
Related Allowance |
|
|
Recorded Investment |
|
|
Unpaid Principal Balance |
|
|
Related Allowance |
|
||||||
|
With no related allowance recorded: |
|
|
|
|
|
|
|
|
|
|
|
|
|
|
|
|
|
|
|
|
|
|
|
|
|
Commercial & Agriculture |
|
$ |
— |
|
|
$ |
— |
|
|
|
|
|
|
$ |
|
|
|
$ |
|
|
|
|
|
|
|
Commercial Real Estate: |
|
|
|
|
|
|
|
|
|
|
|
|
|
|
|
|
|
|
|
|
|
|
|
|
|
Owner Occupied |
|
|
|
|
|
|
|
|
|
|
|
|
|
|
|
|
|
|
|
|
|
|
|
|
|
Non-Owner Occupied |
|
|
|
|
|
|
|
|
|
|
|
|
|
|
|
|
|
|
|
|
|
|
|
|
|
Residential Real Estate |
|
|
|
|
|
|
|
|
|
|
|
|
|
|
|
|
|
|
|
|
|
|
|
|
|
Farm Real Estate |
|
|
|
|
|
|
|
|
|
|
|
|
|
|
|
|
|
|
|
|
|
|
|
|
|
Total |
|
|
|
|
|
|
|
|
|
|
|
|
|
|
|
|
|
|
|
|
|
|
|
|
|
With an allowance recorded: |
|
|
|
|
|
|
|
|
|
|
|
|
|
|
|
|
|
|
|
|
|
|
|
|
|
Commercial & Agriculture |
|
|
|
|
|
|
|
|
|
$ |
|
|
|
|
— |
|
|
|
— |
|
|
$ |
— |
|
|
Commercial Real Estate: |
|
|
|
|
|
|
|
|
|
|
|
|
|
|
|
|
|
|
|
|
|
|
|
|
|
Owner Occupied |
|
|
|
|
|
|
|
|
|
|
|
|
|
|
|
|
|
|
|
|
|
|
|
|
|
Residential Real Estate |
|
|
|
|
|
|
|
|
|
|
|
|
|
|
|
|
|
|
|
|
|
|
|
|
|
Farm Real Estate |
|
|
— |
|
|
|
— |
|
|
|
— |
|
|
|
— |
|
|
|
— |
|
|
|
— |
|
|
Total |
|
|
|
|
|
|
|
|
|
|
|
|
|
|
|
|
|
|
|
|
|
|
|
|
|
Total: |
|
|
|
|
|
|
|
|
|
|
|
|
|
|
|
|
|
|
|
|
|
|
|
|
|
Commercial & Agriculture |
|
|
|
|
|
|
|
|
|
|
|
|
|
|
|
|
|
|
|
|
|
|
— |
|
|
Commercial Real Estate: |
|
|
|
|
|
|
|
|
|
|
|
|
|
|
|
|
|
|
|
|
|
|
|
|
|
Owner Occupied |
|
|
|
|
|
|
|
|
|
|
|
|
|
|
|
|
|
|
|
|
|
|
|
|
|
Non-Owner Occupied |
|
|
|
|
|
|
|
|
|
|
— |
|
|
|
|
|
|
|
|
|
|
|
— |
|
|
Residential Real Estate |
|
|
|
|
|
|
|
|
|
|
|
|
|
|
|
|
|
|
|
|
|
|
|
|
|
Farm Real Estate |
|
|
|
|
|
|
|
|
|
|
— |
|
|
|
|
|
|
|
|
|
|
|
— |
|
|
Total |
|
$ |
|
|
|
$ |
|
|
|
$ |
|
|
|
$ |
|
|
|
$ |
|
|
|
$ |
|
|
60
CIVISTA BANCSHARES, INC.
NOTES TO CONSOLIDATED FINANCIAL STATEMENTS
December 31, 2020, 2019 and 2018
(Amounts in thousands, except share data)
NOTE 5 - ALLOWANCE FOR LOAN LOSSES (Continued)
The following tables include the average recorded investment and interest income recognized for impaired financing receivables as of, and for the years ended, December 31, 2020, 2019 and 2018.
|
For the year ended: |
|
December 31, 2020 |
|
|
December 31, 2019 |
|
||||||||||
|
|
|
Average Recorded Investment |
|
|
Interest Income Recognized |
|
|
Average Recorded Investment |
|
|
Interest Income Recognized |
|
||||
|
Commercial & Agriculture |
|
$ |
|
|
|
$ |
|
|
|
$ |
|
|
|
$ |
|
|
|
Commercial Real Estate: |
|
|
|
|
|
|
|
|
|
|
|
|
|
|
|
|
|
Owner Occupied |
|
|
|
|
|
|
|
|
|
|
|
|
|
|
|
|
|
Non-Owner Occupied |
|
|
|
|
|
|
|
|
|
|
|
|
|
|
|
|
|
Residential Real Estate |
|
|
|
|
|
|
|
|
|
|
|
|
|
|
|
|
|
Farm Real Estate |
|
|
|
|
|
|
|
|
|
|
|
|
|
|
|
|
|
Total |
|
$ |
|
|
|
$ |
|
|
|
$ |
|
|
|
$ |
|
|
|
For the year ended: |
|
December 31, 2018 |
|
|||||
|
|
|
Average Recorded Investment |
|
|
Interest Income Recognized |
|
||
|
Commercial & Agriculture |
|
$ |
|
|
|
$ |
|
|
|
Commercial Real Estate: |
|
|
|
|
|
|
|
|
|
Owner Occupied |
|
|
|
|
|
|
|
|
|
Non-Owner Occupied |
|
|
|
|
|
|
|
|
|
Residential Real Estate |
|
|
|
|
|
|
|
|
|
Farm Real Estate |
|
|
|
|
|
|
|
|
|
Total |
|
$ |
|
|
|
$ |
|
|
Foreclosed assets acquired in settlement of loans are carried at fair value less estimated costs to sell and are included in other assets on the Consolidated Balance Sheet. As of December 31, 2020 there were $
Changes in the amortizable yield for PCI loans were as follows, since acquisition:
|
|
|
At December 31, 2020 |
|
|
At December 31, 2019 |
|
||
|
|
|
(In Thousands) |
|
|
(In Thousands) |
|
||
|
Balance at beginning of period |
|
$ |
|
|
|
$ |
|
|
|
Acquisition of PCI loans |
|
|
|
|
|
|
|
|
|
Accretion |
|
|
(
|
) |
|
|
(
|
) |
|
Transfers from non-accretable to accretable |
|
|
|
|
|
|
|
|
|
Balance at end of period |
|
$ |
|
|
|
$ |
|
|
61
CIVISTA BANCSHARES, INC.
NOTES TO CONSOLIDATED FINANCIAL STATEMENTS
December 31, 2020, 2019 and 2018
(Amounts in thousands, except share data)
NOTE 5 - ALLOWANCE FOR LOAN LOSSES (Continued)
The following table presents additional information regarding loans acquired and accounted for in accordance with ASC 310-30:
|
|
|
At December 31, 2020 |
|
|
At December 31, 2019 |
|
||
|
|
|
Acquired Loans with Specific Evidence of Deterioration of Credit Quality (ASC 310-30) |
|
|
Acquired Loans with Specific Evidence of Deterioration of Credit Quality (ASC 310-30) |
|
||
|
|
|
(In Thousands) |
|
|||||
|
Outstanding balance |
|
$ |
|
|
|
$ |
|
|
|
Carrying amount |
|
|
|
|
|
|
|
|
There was
62
CIVISTA BANCSHARES, INC.
NOTES TO CONSOLIDATED FINANCIAL STATEMENTS
December 31, 2020, 2019 and 2018
(Amounts in thousands, except share data)
NOTE 6 - OTHER COMPREHENSIVE INCOME (LOSS)
The following table presents the components of other comprehensive income (loss), net of tax, as of December 31, 2020, 2019 and 2018:
|
|
|
Before Tax |
|
|
Tax Effect |
|
|
Net of Tax |
|
|||
|
Year Ended December 31, 2020 |
|
|
|
|
|
|
|
|
|
|
|
|
|
Net unrealized Gains (Losses) on Investment Securities: |
|
|
|
|
|
|
|
|
|
|
|
|
|
Other comprehensive income (loss) before reclassifications |
|
$ |
|
|
|
$ |
|
|
|
$ |
|
|
|
Amounts reclassified from accumulated other comprehensive income (loss) |
|
|
(
|
) |
|
|
(
|
) |
|
|
(
|
) |
|
Net Unrealized Gains on Investment Securities |
|
|
|
|
|
|
|
|
|
|
|
|
|
|
|
|
|
|
|
|
|
|
|
|
|
|
|
Defined Benefit Plans: |
|
|
|
|
|
|
|
|
|
|
|
|
|
Other comprehensive income (loss) before reclassifications |
|
|
(
|
) |
|
|
(
|
) |
|
|
(
|
) |
|
Amounts reclassified from accumulated other comprehensive income (loss) |
|
|
|
|
|
|
|
|
|
|
|
|
|
Defined Benefit Plans, Net |
|
|
(
|
) |
|
|
(
|
) |
|
|
(
|
) |
|
Other Comprehensive Income |
|
$ |
|
|
|
$ |
|
|
|
$ |
|
|
|
|
|
|
|
|
|
|
|
|
|
|
|
|
|
Year Ended December 31, 2019 |
|
|
|
|
|
|
|
|
|
|
|
|
|
Net unrealized Gains (Losses) on Investment Securities: |
|
|
|
|
|
|
|
|
|
|
|
|
|
Other comprehensive income (loss) before reclassifications |
|
$ |
|
|
|
$ |
|
|
|
$ |
|
|
|
Amounts reclassified from accumulated other comprehensive income (loss) |
|
|
(
|
) |
|
|
(
|
) |
|
|
(
|
) |
|
Net Unrealized Gains on Investment Securities |
|
|
|
|
|
|
|
|
|
|
|
|
|
|
|
|
|
|
|
|
|
|
|
|
|
|
|
Defined Benefit Plans: |
|
|
|
|
|
|
|
|
|
|
|
|
|
Other comprehensive income (loss) before reclassifications |
|
|
(
|
) |
|
|
(
|
) |
|
|
(
|
) |
|
Amounts reclassified from accumulated other comprehensive income (loss) |
|
|
|
|
|
|
|
|
|
|
|
|
|
Defined Benefit Plans, Net |
|
|
(
|
) |
|
|
(
|
) |
|
|
(
|
) |
|
Other Comprehensive Income |
|
$ |
|
|
|
$ |
|
|
|
$ |
|
|
|
|
|
|
|
|
|
|
|
|
|
|
|
|
|
Year Ended December 31, 2018 |
|
|
|
|
|
|
|
|
|
|
|
|
|
Net unrealized Gains (Losses) on Investment Securities: |
|
|
|
|
|
|
|
|
|
|
|
|
|
Other comprehensive income (loss) before reclassifications |
|
$ |
(
|
) |
|
$ |
(
|
) |
|
$ |
(
|
) |
|
Amounts reclassified from accumulated other comprehensive income (loss) |
|
|
|
|
|
|
|
|
|
|
|
|
|
Reclassification of equity securities from accumulated other comprehensive income (loss) |
|
|
(
|
) |
|
|
(
|
) |
|
|
(
|
) |
|
Net Unrealized Losses on Investment Securities |
|
|
(
|
) |
|
|
(
|
) |
|
|
(
|
) |
|
|
|
|
|
|
|
|
|
|
|
|
|
|
|
Defined Benefit Plans: |
|
|
|
|
|
|
|
|
|
|
|
|
|
Other comprehensive income (loss) before reclassifications |
|
|
|
|
|
|
|
|
|
|
|
|
|
Amounts reclassified from accumulated other comprehensive income (loss) |
|
|
|
|
|
|
|
|
|
|
|
|
|
Defined Benefit Plans, Net |
|
|
|
|
|
|
|
|
|
|
|
|
|
Other Comprehensive Loss |
|
$ |
(
|
) |
|
$ |
(
|
) |
|
$ |
(
|
) |
|
|
|
|
|
|
|
|
|
|
|
|
|
|
63
CIVISTA BANCSHARES, INC.
NOTES TO CONSOLIDATED FINANCIAL STATEMENTS
December 31, 2020, 2019 and 2018
(Amounts in thousands, except share data)
NOTE 6 - OTHER COMPREHENSIVE INCOME (LOSS ) (Continued)
The following table presents the changes in each component of accumulated other comprehensive income (loss), net of tax, as of December 31, 2020, 2019 and 2018.
|
|
|
For the Year Ended December 31, 2020 |
|
|
For the Year Ended December 31, 2019 |
|
|
For the Year Ended December 31, 2018 |
|
|||||||||||||||||||||||||||
|
|
|
Unrealized Gains and Losses on Available for Sale Securities |
|
|
Defined Benefit Pension Items |
|
|
Total |
|
|
Unrealized Gains and Losses on Available for Sale Securities |
|
|
Defined Benefit Pension Items |
|
|
Total |
|
|
Unrealized Gains and Losses on Available for Sale Securities |
|
|
Defined Benefit Pension Items |
|
|
Total |
|
|||||||||
|
Beginning balance |
|
$ |
|
|
|
$ |
(
|
) |
|
$ |
|
|
|
$ |
|
|
|
$ |
(
|
) |
|
$ |
(
|
) |
|
$ |
|
|
|
$ |
(
|
) |
|
$ |
(
|
) |
|
Other comprehensive income (loss) before reclassifications |
|
|
|
|
|
|
(
|
) |
|
|
|
|
|
|
|
|
|
|
(
|
) |
|
|
|
|
|
|
(
|
) |
|
|
|
|
|
|
(
|
) |
|
Amounts reclassified from accumulated other comprehensive income (loss) |
|
|
(
|
) |
|
|
|
|
|
|
|
|
|
|
(
|
) |
|
|
|
|
|
|
|
|
|
|
|
|
|
|
|
|
|
|
|
|
|
Net current-period other comprehensive income (loss) |
|
|
|
|
|
|
(
|
) |
|
|
|
|
|
|
|
|
|
|
(
|
) |
|
|
|
|
|
|
(
|
) |
|
|
|
|
|
|
(
|
) |
|
Reclassification of equity securities from accumulated other comprehensive income (loss) |
|
|
— |
|
|
|
— |
|
|
|
— |
|
|
|
— |
|
|
|
— |
|
|
|
— |
|
|
|
(
|
) |
|
|
— |
|
|
|
(
|
) |
|
Ending balance |
|
$ |
|
|
|
$ |
(
|
) |
|
$ |
|
|
|
$ |
|
|
|
$ |
(
|
) |
|
$ |
|
|
|
$ |
|
|
|
$ |
(
|
) |
|
$ |
(
|
) |
64
CIVISTA BANCSHARES, INC.
NOTES TO CONSOLIDATED FINANCIAL STATEMENTS
December 31, 2020, 2019 and 2018
(Amounts in thousands, except share data)
NOTE 6 - OTHER COMPREHENSIVE INCOME (LOSS ) (Continued)
The following table presents the amounts reclassified out of each component of accumulated other comprehensive loss as of December 31, 2020, 2019 and 2018.
|
|
|
Amount Reclassified from Accumulated Other Comprehensive Loss (a) |
|
|
|
|
|||||||||||
|
|
|
For the year ended December 31, |
|
|
|
|
|||||||||||
|
Details about Accumulated Other Comprehensive Income (Loss) Components |
|
2020 |
|
|
|
2019 |
|
|
|
2018 |
|
|
|
Affected Line Item in the Statement Where Net Income is Presented |
|||
|
Unrealized gains (losses) on available-for-sale securities |
|
$ |
|
|
|
|
$ |
|
|
|
|
$ |
(
|
) |
|
|
Net gain (loss) on sale of securities |
|
Tax effect |
|
|
(
|
) |
|
|
|
(
|
) |
|
|
|
|
|
|
|
Income taxes |
|
|
|
|
|
|
|
|
|
|
|
|
|
|
(
|
) |
|
|
|
|
Amortization of defined benefit pension items |
|
|
|
|
|
|
|
|
|
|
|
|
|
|
|
|
|
|
Actuarial losses |
|
|
(
|
) |
(b) |
|
|
(
|
) |
(b) |
|
|
(
|
) |
(b) |
|
Other operating expenses |
|
Tax effect |
|
|
|
|
|
|
|
|
|
|
|
|
|
|
|
|
Income taxes |
|
|
|
|
(
|
) |
|
|
|
(
|
) |
|
|
|
(
|
) |
|
|
|
|
Total reclassifications for the period |
|
$ |
(
|
) |
|
|
$ |
(
|
) |
|
|
$ |
(
|
) |
|
|
|
|
(a) |
Amounts in parentheses indicate expenses and other amounts indicate income. |
|
(b) |
These accumulated other comprehensive income (loss) components are included in the computation of net periodic pension cost. |
NOTE 7 - PREMISES AND EQUIPMENT
Year-end premises and equipment were as follows:
|
|
|
At December 31, |
|
|||||
|
|
|
2020 |
|
|
2019 |
|
||
|
Land and improvements |
|
$ |
|
|
|
$ |
|
|
|
Buildings and improvements |
|
|
|
|
|
|
|
|
|
Furniture and equipment |
|
|
|
|
|
|
|
|
|
Total |
|
|
|
|
|
|
|
|
|
Accumulated depreciation |
|
|
(
|
) |
|
|
(
|
) |
|
Premises and equipment, net |
|
$ |
|
|
|
$ |
|
|
Depreciation expense was $
65
CIVISTA BANCSHARES, INC.
NOTES TO CONSOLIDATED FINANCIAL STATEMENTS
December 31, 2020, 2019 and 2018
(Amounts in thousands, except share data)
NOTE 8 - GOODWILL AND INTANGIBLE ASSETS
There was no change in the carrying amount of goodwill of $
Management performs an evaluation of goodwill for impairment on an annual basis, or more frequently if events or changes in circumstances indicate that the asset might be impaired. Management performed an evaluation of the Company’s goodwill during the fourth quarter of 2020. Based on this test, management concluded that the Company’s goodwill was not impaired at December 31, 2020.
Acquired intangible assets were as follows as of year-end.
|
|
|
2020 |
|
|
2019 |
|
||||||||||||||||||
|
|
|
Gross Carrying Amount |
|
|
Accumulated Amortization |
|
|
Net Carrying Amount |
|
|
Gross Carrying Amount |
|
|
Accumulated Amortization |
|
|
Net Carrying Amount |
|
||||||
|
Core deposit intangible assets(1): |
|
|
|
|
|
|
|
|
|
|
|
|
|
|
|
|
|
|
|
|
|
|
|
|
|
Core deposit intangibles |
|
|
|
|
|
|
|
|
|
|
|
|
|
|
|
|
|
|
|
|
|
|
|
|
|
Total core deposit intangible assets |
|
$ |
|
|
|
$ |
|
|
|
$ |
|
|
|
$ |
|
|
|
$ |
|
|
|
$ |
|
|
|
(1) |
Excludes fully amortized core deposit intangible assets |
Aggregate core deposit intangible amortization expense was $
Activity for mortgage servicing rights (MSRs) and the related valuation allowance follows:
|
|
|
2020 |
|
|
2019 |
|
||
|
Mortgage Servicing Rights: |
|
|
|
|
|
|
|
|
|
Beginning of year |
|
$ |
|
|
|
$ |
|
|
|
Additions |
|
|
|
|
|
|
|
|
|
Disposals |
|
|
— |
|
|
|
— |
|
|
Amortized to expense |
|
|
|
|
|
|
|
|
|
Other Charges |
|
|
— |
|
|
|
— |
|
|
Change in valuation allowance |
|
|
|
|
|
|
|
|
|
End of year |
|
$ |
|
|
|
$ |
|
|
|
|
|
|
|
|
|
|
|
|
|
Valuation allowance: |
|
|
|
|
|
|
|
|
|
Beginning of year |
|
$ |
|
|
|
$ |
— |
|
|
Additions expensed |
|
|
|
|
|
|
|
|
|
Reductions credited to operations |
|
|
(
|
) |
|
|
— |
|
|
Direct write-offs |
|
|
— |
|
|
|
— |
|
|
End of year |
|
$ |
|
|
|
$ |
|
|
Aggregate mortgage servicing rights (MSRs) amortization was $
The fair value of servicing rights was $
66
CIVISTA BANCSHARES, INC.
NOTES TO CONSOLIDATED FINANCIAL STATEMENTS
December 31, 2020, 2019 and 2018
(Amounts in thousands, except share data)
NOTE 8 - GOODWILL AND INTANGIBLE ASSETS (Continued)
Estimated amortization expense for each of the next five years and thereafter is as follows:
|
|
|
MSRs |
|
|
Core deposit intangibles |
|
|
Total |
|
|||
|
2021 |
|
$ |
|
|
|
$ |
|
|
|
$ |
|
|
|
2022 |
|
|
|
|
|
|
|
|
|
|
|
|
|
2023 |
|
|
|
|
|
|
|
|
|
|
|
|
|
2024 |
|
|
|
|
|
|
|
|
|
|
|
|
|
2025 |
|
|
|
|
|
|
|
|
|
|
|
|
|
Thereafter |
|
|
|
|
|
|
|
|
|
|
|
|
|
|
|
$ |
|
|
|
$ |
|
|
|
$ |
|
|
NOTE 9 - INTEREST-BEARING DEPOSITS
Interest-bearing deposits as of December 31, 2020 and 2019 were as follows:
|
|
|
2020 |
|
|
2019 |
|
||
|
Demand |
|
$ |
|
|
|
$ |
|
|
|
Savings and Money markets |
|
|
|
|
|
|
|
|
|
Certificates of Deposit: |
|
|
|
|
|
|
|
|
|
$250 and over |
|
|
|
|
|
|
|
|
|
Other |
|
|
|
|
|
|
|
|
|
Individual Retirement Accounts |
|
|
|
|
|
|
|
|
|
Total |
|
$ |
|
|
|
$ |
|
|
Scheduled maturities of certificates of deposit, including IRAs at December 31, 2020 were as follows:
|
2021 |
|
$ |
|
|
|
2022 |
|
|
|
|
|
2023 |
|
|
|
|
|
2024 |
|
|
|
|
|
2025 |
|
|
|
|
|
Thereafter |
|
|
|
|
|
Total |
|
$ |
|
|
Deposits from the Company’s principal officers, directors, and their affiliates at year-end 2020 and 2019 were $
As of December 31, 2020, CDs and IRAs totaling $
67
CIVISTA BANCSHARES, INC.
NOTES TO CONSOLIDATED FINANCIAL STATEMENTS
December 31, 2020, 2019 and 2018
(Amounts in thousands, except share data)
NOTE 10 - SHORT-TERM BORROWINGS
Short-term borrowings, which consist of federal funds purchased and other short-term borrowings are summarized as follows:
|
|
|
At December 31, 2020 |
|
|
At December 31, 2019 |
|
||||||||||
|
|
|
Federal Funds Purchased |
|
|
Short-term Borrowings |
|
|
Federal Funds Purchased |
|
|
Short-term Borrowings |
|
||||
|
Outstanding balance at year end |
|
$ |
— |
|
|
$ |
— |
|
|
$ |
— |
|
|
$ |
|
|
|
Maximum indebtedness during the year |
|
|
|
|
|
|
|
|
|
|
|
|
|
|
|
|
|
Average balance during the year |
|
|
|
|
|
|
|
|
|
|
|
|
|
|
|
|
|
Average rate paid during the year |
|
|
|
% |
|
|
|
% |
|
|
|
% |
|
|
|
% |
|
Interest rate on year end balance |
|
|
— |
|
|
|
— |
|
|
|
— |
|
|
|
|
% |
|
|
|
At December 31, 2018 |
|
|||||
|
|
|
Federal Funds Purchased |
|
|
Short-term Borrowings |
|
||
|
Outstanding balance at year end |
|
$ |
— |
|
|
$ |
|
|
|
Maximum indebtedness during the year |
|
|
|
|
|
|
|
|
|
Average balance during the year |
|
|
|
|
|
|
|
|
|
Average rate paid during the year |
|
|
|
% |
|
|
|
% |
|
Interest rate on year end balance |
|
|
— |
|
|
|
|
% |
Average balances during the year represent daily averages. Average interest rates represent interest expense divided by the related average balances.
These borrowing transactions can range from overnight to six months in maturity. The average maturity was one day at December 31, 2019.
NOTE 11 - FEDERAL HOME LOAN BANK ADVANCES
Long-term advances from the FHLB were $
Scheduled principal reductions of FHLB advances outstanding at December 31, 2020 were as follows:
|
2029 |
|
$ |
|
|
|
Total |
|
$ |
|
|
In addition to the borrowings, the Company had outstanding letters of credit with the FHLB totaling $
The Company had a FHLB maximum borrowing capacity of $
68
CIVISTA BANCSHARES, INC.
NOTES TO CONSOLIDATED FINANCIAL STATEMENTS
December 31, 2020, 2019 and 2018
(Amounts in thousands, except share data)
NOTE 12 - SECURITIES SOLD UNDER AGREEMENTS TO REPURCHASE
Securities sold under agreements to repurchase are used to facilitate the needs of our customers as well as to facilitate our short-term funding needs. Securities sold under repurchase agreements are carried at the amount of cash received in association with the agreement. We continuously monitor the collateral levels and may be required, from time to time, to provide additional collateral based on the fair value of the underlying securities. Securities pledged as collateral under repurchase agreements are maintained with our safekeeping agents.
The following table presents detail regarding the securities pledged as collateral under repurchase agreements as of December 31, 2020 and 2019. All of the repurchase agreements are overnight agreements.
|
|
|
December 31, 2020 |
|
|
December 31, 2019 |
|
||
|
Securities pledged for repurchase agreements: |
|
|
|
|
|
|
|
|
|
U.S. Treasury securities |
|
$ |
|
|
|
$ |
|
|
|
Obligations of U.S. government agencies |
|
|
|
|
|
|
|
|
|
Total securities pledged |
|
$ |
|
|
|
$ |
|
|
|
Gross amount of recognized liabilities for repurchase agreements |
|
$ |
|
|
|
$ |
|
|
|
Amounts related to agreements not included in offsetting disclosures above |
|
$ |
|
|
|
$ |
|
|
Information concerning securities sold under agreements to repurchase was as follows:
|
|
|
2020 |
|
|
2019 |
|
|
2018 |
|
|||
|
Outstanding balance at year end |
|
$ |
|
|
|
$ |
|
|
|
$ |
|
|
|
Average balance during the year |
|
|
|
|
|
|
|
|
|
|
|
|
|
Average interest rate during the year |
|
|
|
% |
|
|
|
% |
|
|
|
% |
|
Maximum month-end balance during the year |
|
$ |
|
|
|
$ |
|
|
|
$ |
|
|
|
Weighted average interest rate at year end |
|
|
|
% |
|
|
|
% |
|
|
|
% |
NOTE 13 - SUBORDINATED DEBENTURES
Trusts formed by the Company in March of 2002 and March of 2003 issued floating rate trust preferred securities, in the amounts of $
Additionally, the Company formed an additional trust in September of 2004 that issued $
69
CIVISTA BANCSHARES, INC.
NOTES TO CONSOLIDATED FINANCIAL STATEMENTS
December 31, 2020, 2019 and 2018
(Amounts in thousands, except share data)
NOTE 13 - SUBORDINATED DEBENTURES (Continued)
Finally, the Company acquired
NOTE 14 - INCOME TAXES
Income taxes were as follows for the years ended December 31:
|
|
|
2020 |
|
|
2019 |
|
|
2018 |
|
|||
|
Current |
|
$ |
|
|
|
$ |
|
|
|
$ |
|
|
|
State |
|
|
|
|
|
|
|
|
|
|
|
|
|
Deferred |
|
|
(
|
) |
|
|
|
|
|
|
|
|
|
Income taxes |
|
$ |
|
|
|
$ |
|
|
|
$ |
|
|
Effective tax rates differed from the statutory federal income tax rate of
|
|
|
2020 |
|
|
2019 |
|
|
2018 |
|
|||
|
Income taxes computed at the statutory federal tax rate |
|
$ |
|
|
|
$ |
|
|
|
$ |
|
|
|
Add (subtract) tax effect of: |
|
|
|
|
|
|
|
|
|
|
|
|
|
Nontaxable interest income, net of nondeductible interest expense |
|
|
(
|
) |
|
|
(
|
) |
|
|
(
|
) |
|
Low income housing tax credit |
|
|
(
|
) |
|
|
(
|
) |
|
|
(
|
) |
|
Cash surrender value of BOLI |
|
|
(
|
) |
|
|
(
|
) |
|
|
(
|
) |
|
Nondeductible merger costs |
|
|
— |
|
|
|
— |
|
|
|
|
|
|
Change in tax position BOLI |
|
|
— |
|
|
|
(
|
) |
|
|
— |
|
|
Other |
|
|
(
|
) |
|
|
|
|
|
|
(
|
) |
|
Income tax expense |
|
$ |
|
|
|
$ |
|
|
|
$ |
|
|
70
CIVISTA BANCSHARES, INC.
NOTES TO CONSOLIDATED FINANCIAL STATEMENTS
December 31, 2020, 2019 and 2018
(Amounts in thousands, except share data)
NOTE 14 - INCOME TAXES (Continued)
Year-end deferred tax assets and liabilities were due to the following:
|
|
|
2020 |
|
|
2019 |
|
||
|
Deferred tax assets |
|
|
|
|
|
|
|
|
|
Allowance for loan losses |
|
$ |
|
|
|
$ |
|
|
|
Deferred compensation |
|
|
|
|
|
|
|
|
|
Pension costs |
|
|
|
|
|
|
|
|
|
Intangible assets |
|
|
|
|
|
|
|
|
|
Purchase accounting adjustments |
|
|
— |
|
|
|
|
|
|
Net operating loss carryforward |
|
|
|
|
|
|
|
|
|
Deferred loan fees |
|
|
|
|
|
|
|
|
|
Other |
|
|
|
|
|
|
|
|
|
Deferred tax asset |
|
|
|
|
|
|
|
|
|
Deferred tax liabilities |
|
|
|
|
|
|
|
|
|
Tax depreciation in excess of book depreciation |
|
|
(
|
) |
|
|
(
|
) |
|
Discount accretion on securities |
|
|
(
|
) |
|
|
(
|
) |
|
FHLB stock dividends |
|
|
(
|
) |
|
|
(
|
) |
|
Unrealized gain on securities available for sale |
|
|
(
|
) |
|
|
(
|
) |
|
Pension costs |
|
|
— |
|
|
|
— |
|
|
Prepaids |
|
|
(
|
) |
|
|
(
|
) |
|
BOLI |
|
|
— |
|
|
|
— |
|
|
Other |
|
|
(
|
) |
|
|
(
|
) |
|
Deferred tax liability |
|
|
(
|
) |
|
|
(
|
) |
|
Net deferred tax asset |
|
$ |
|
|
|
$ |
|
|
The Company and its subsidiaries are subject to U.S. federal income tax. The Company is subject to tax in Ohio based upon its net worth and in Indiana based upon its net income.
There is currently
NOTE 15 - RETIREMENT PLANS
The Company sponsors a savings and retirement
The Company also sponsors a pension plan which is a noncontributory defined benefit retirement plan for all employees who have attained the age of 20 1 ⁄ 2, completed
71
CIVISTA BANCSHARES, INC.
NOTES TO CONSOLIDATED FINANCIAL STATEMENTS
December 31, 2020, 2019 and 2018
(Amounts in thousands, except share data)
NOTE 15 - RETIREMENT PLANS (Continued)
In October 2015, the Company, on behalf of it and its subsidiaries, entered into Pension Shortfall Agreements (the “Shortfall Agreements”) with
Information about the pension plan is as follows:
|
|
|
2020 |
|
|
2019 |
|
||
|
Change in benefit obligation: |
|
|
|
|
|
|
|
|
|
Beginning benefit obligation |
|
$ |
|
|
|
$ |
|
|
|
Service cost |
|
|
— |
|
|
|
— |
|
|
Interest cost |
|
|
|
|
|
|
|
|
|
Curtailment gain |
|
|
— |
|
|
|
— |
|
|
Settlement loss |
|
|
— |
|
|
|
— |
|
|
Actuarial (gain)/loss |
|
|
|
|
|
|
|
|
|
Benefits paid |
|
|
(
|
) |
|
|
(
|
) |
|
Settlement payments |
|
|
— |
|
|
|
— |
|
|
Ending benefit obligation |
|
|
|
|
|
|
|
|
|
Change in plan assets, at fair value: |
|
|
|
|
|
|
|
|
|
Beginning plan assets |
|
|
|
|
|
|
|
|
|
Actual return |
|
|
|
|
|
|
|
|
|
Employer contribution |
|
|
— |
|
|
|
— |
|
|
Benefits paid |
|
|
(
|
) |
|
|
(
|
) |
|
Settlement payments |
|
|
— |
|
|
|
— |
|
|
Administrative expenses |
|
|
— |
|
|
|
— |
|
|
Ending plan assets |
|
|
|
|
|
|
|
|
|
Funded status at end of year |
|
$ |
(
|
) |
|
$ |
(
|
) |
Amounts recognized in accumulated other comprehensive income (loss) at December 31, consist of unrecognized actuarial loss of $
The accumulated benefit obligation for the defined benefit pension plan was $
72
CIVISTA BANCSHARES, INC.
NOTES TO CONSOLIDATED FINANCIAL STATEMENTS
December 31, 2020, 2019 and 2018
(Amounts in thousands, except share data)
NOTE 15 - RETIREMENT PLANS (Continued)
The components of net periodic pension expense were as follows:
|
|
|
2020 |
|
|
2019 |
|
|
2018 |
|
|||
|
Service cost |
|
$ |
— |
|
|
$ |
— |
|
|
$ |
|
|
|
Interest cost |
|
|
|
|
|
|
|
|
|
|
|
|
|
Expected return on plan assets |
|
|
(
|
) |
|
|
(
|
) |
|
|
(
|
) |
|
Net amortization and deferral |
|
|
|
|
|
|
|
|
|
|
|
|
|
Net periodic pension cost (benefit) |
|
|
|
|
|
|
(
|
) |
|
|
(
|
) |
|
Additional loss due to settlement |
|
|
— |
|
|
|
— |
|
|
|
|
|
|
Total pension cost (benefit) |
|
$ |
|
|
|
$ |
(
|
) |
|
$ |
|
|
|
|
|
|
|
|
|
|
|
|
|
|
|
|
|
Net loss (gain) recognized in other comprehensive income |
|
$ |
|
|
|
$ |
|
|
|
$ |
(
|
) |
|
Total recognized in net periodic benefit cost and other comprehensive loss (before tax) |
|
$ |
|
|
|
$ |
|
|
|
$ |
(
|
) |
The components of net periodic benefit cost other than the service cost component are included in the line item “other operating expenses” in the Consolidated Statement of Operations.
The estimated net loss for the defined benefit pension plan that will be amortized from accumulated other comprehensive loss into net periodic benefit cost over the next fiscal year is $
The weighted average assumptions used to determine benefit obligations at year-end were as follows:
|
|
|
2020 |
|
|
2019 |
|
|
2018 |
|
|||
|
Discount rate on benefit obligation |
|
|
|
% |
|
|
|
% |
|
|
|
% |
|
Long-term rate of return on plan assets |
|
|
|
% |
|
|
|
% |
|
|
|
% |
|
Rate of compensation increase |
|
|
|
% |
|
|
|
% |
|
|
|
% |
The weighted average assumptions used to determine net periodic pension cost were as follows:
|
|
|
2020 |
|
|
2019 |
|
|
2018 |
|
|||
|
Discount rate on benefit obligation |
|
|
|
% |
|
|
|
% |
|
|
|
% |
|
Long-term rate of return on plan assets |
|
|
|
% |
|
|
|
% |
|
|
|
% |
|
Rate of compensation increase |
|
|
|
% |
|
|
|
% |
|
|
|
% |
The Company uses long-term market rates to determine the discount rate on the benefit obligation. Declines in the discount rate lead to increases in the actuarial loss related to the benefit obligation.
The expectation for long-term rate of return on the pension assets and the expected rate of compensation increases are reviewed periodically by management in consultation with outside actuaries and primary investment consultants. Factors considered in setting and adjusting these rates are historic and projected rates of return on the portfolio and historic and estimated rates of increases of compensation. Since the pension plan is frozen, the rate of compensation increase used to determine the benefit obligation for 2020, 2019 and 2018 was
73
CIVISTA BANCSHARES, INC.
NOTES TO CONSOLIDATED FINANCIAL STATEMENTS
December 31, 2020, 2019 and 2018
(Amounts in thousands, except share data)
NOTE 15 - RETIREMENT PLANS (Continued)
The Company’s pension plan asset allocation at year-end 2020 and 2019 and target allocation for 2020 by asset category are as follows:
|
|
|
Target Allocation |
|
Percentage of Plan Assets at Year-end |
|
|||||
|
Asset Category |
|
2021 |
|
2020 |
|
|
2019 |
|
||
|
Equity securities |
|
|
|
|
|
% |
|
|
|
% |
|
Debt securities |
|
|
|
|
|
|
|
|
|
|
|
Total |
|
|
|
|
|
% |
|
|
|
% |
The Company developed the pension plan investment policies and strategies for plan assets with its pension management firm. The assets are currently invested in seven diversified investment funds, which include four equity funds and three bond funds. The long-term guidelines from above were created to maximize the return on portfolio assets while reducing the risk of the portfolio. The management firm may allocate assets among the separate accounts within the established long-term guidelines. Transfers among these accounts will be at the management firm’s discretion based on their investment outlook and the investment strategies that are outlined at periodic meetings with the Company. The expected long-term rate of return on the plan assets was
The Company does
Common/Collective Trust Funds
Valued at the daily NAV as reported by the funds. These funds are not traded in an active market or exchange, and the NAV per unit is calculated by dividing the net assets of the fund by the number of units outstanding, which includes observable inputs. The method described above may produce a fair value calculation that may not be indicative of net realizable value or reflective of future fair values. Furthermore, while the Plan believes its valuation method is appropriate and consistent with other market participants, the use of different methodologies or assumptions to determine the fair value of certain financial instruments could result in a different fair value measurement at the reporting date.
Certain investments that are measured at fair value using the NAV per share (or its equivalent) as a practical expedient are not required to be categorized in the fair value hierarchy tables.
Fair Value of Investments in Entities That Use NAV
The following table summarizes investments measured at fair value based on NAV per share as of December 31, 2020 and 2019, respectively:
|
December 31, 2020 |
|
Fair Value |
|
|
Unfunded Commitments |
|
Redemption Frequency (if currently eligible) |
|
Redemption Notice Period |
|
|
|
|
|
|
|
|
|
|
|
|
|
|
Common/collective trust funds |
|
$ |
|
|
|
N/A |
|
|
|
|
74
CIVISTA BANCSHARES, INC.
NOTES TO CONSOLIDATED FINANCIAL STATEMENTS
December 31, 2020, 2019 and 2018
(Amounts in thousands, except share data)
NOTE 15 - RETIREMENT PLANS (Continued)
|
December 31, 2019 |
|
Fair Value |
|
|
Unfunded Commitments |
|
Redemption Frequency (if currently eligible) |
|
Redemption Notice Period |
|
|
|
|
|
|
|
|
|
|
|
|
|
|
Common/collective trust funds |
|
$ |
|
|
|
N/A |
|
|
|
|
The methods described above may produce a fair value calculation that may not be indicative of net realizable value or reflective of future fair values. Furthermore, while the Pension Plan believes its valuation methods are appropriate and consistent with other market participants, the use of different methodologies or assumptions to determine the fair value of certain financial instruments could result in a different fair value measurement at the reporting date.
Expected benefit payments, which reflect expected future service, are as follows:
|
2021 |
|
$ |
|
|
|
2022 |
|
|
|
|
|
2023 |
|
|
|
|
|
2024 |
|
|
|
|
|
2025 |
|
|
|
|
|
2026 through 2030 |
|
|
|
|
|
Total |
|
$ |
|
|
Supplemental Retirement Plan
Civista established a supplemental retirement plan (“SERP”) in 2013, which covers key members of management. Under the SERP, participants will receive annually, following retirement, a percentage of their base compensations at the time of their retirement for a maximum of
75
CIVISTA BANCSHARES, INC.
NOTES TO CONSOLIDATED FINANCIAL STATEMENTS
December 31, 2020, 2019 and 2018
(Amounts in thousands, except share data)
NOTE 16 - EQUITY INCENTIVE PLAN
At the Company’s 2014 annual meeting, the shareholders adopted the Company’s 2014 Incentive Plan (“2014 Incentive Plan”). The 2014 Incentive Plan authorizes the Company to grant options, stock awards, stock units and other awards for up to
In recent years, the Board of Directors has awarded restricted common shares to senior officers of the Company. The restricted shares vest ratably over a period following the grant date. The product of the number of restricted shares granted and the grant date market price of the Company’s common shares determines the fair value of restricted shares under the Company’s 2014 Incentive Plan. Management recognizes compensation expense for the fair value of restricted shares on a straight-line basis over the requisite service period for the entire award.
During the twelve months ended December 31, 2020, 2019 and 2018, directors of the Company’s banking subsidiary, Civista, were paid a retainer in the form of non-restricted common shares of the Company. The aggregate common shares of
The Company includes share-based compensation for employees as “Compensation expense” in the Consolidated Statements of Operations.
The following is a summary of the status of the Company’s restricted shares, and changes therein during the twelve months ended December 31, 2020:
|
|
|
December 31, 2020 |
|
|||||
|
|
|
Number of Restricted Shares |
|
|
Weighted Average Grant Date Fair Value |
|
||
|
Nonvested at beginning of period |
|
|
|
|
|
$ |
|
|
|
Granted |
|
|
|
|
|
|
|
|
|
Vested |
|
|
(
|
) |
|
|
|
|
|
Forfeited |
|
|
|
|
|
|
|
|
|
Nonvested at end of period |
|
|
|
|
|
|
|
|
76
CIVISTA BANCSHARES, INC.
NOTES TO CONSOLIDATED FINANCIAL STATEMENTS
December 31, 2020, 2019 and 2018
(Amounts in thousands, except share data)
NOTE 16 - EQUITY INCENTIVE PLAN (Continued)
The following is a summary of the status of the Company’s awarded restricted shares as of December 31, 2020:
|
At December 31, 2020 |
|
|||||||||||
|
Date of Award |
|
Shares |
|
|
Remaining Expense |
|
|
Remaining Vesting Period (Years) |
|
|||
|
|
|
|
|
|
|
$ |
— |
|
|
|
|
|
|
|
|
|
|
|
|
|
|
|
|
|
|
|
|
|
|
|
|
|
|
|
— |
|
|
|
|
|
|
|
|
|
|
|
|
|
|
|
|
|
|
|
|
|
|
|
|
|
|
|
|
|
|
|
|
|
|
|
|
|
|
|
|
|
|
|
|
|
|
|
|
|
|
|
|
|
|
|
|
|
|
|
|
|
|
|
|
|
|
|
|
|
|
|
|
|
|
|
|
|
|
|
|
|
|
$ |
|
|
|
|
|
|
During the twelve months ended December 31, 2020, 2019 and 2018, the Company recorded share-based compensation expense of $
NOTE 17 - FAIR VALUE MEASUREMENT
U.S. generally accepted accounting principles establish a hierarchal disclosure framework associated with the level of observable pricing utilized in measuring assets and liabilities at fair value. The three broad levels defined by the hierarchy are as follows: Level 1: Quoted prices for identical assets in active markets that are identifiable on the measurement date; Level 2: Significant other observable inputs, such as quoted prices for similar assets, quoted prices in markets that are not active and other inputs that are observable or can be corroborated by observable market data; Level 3: Significant unobservable inputs that reflect the Company’s own view about the assumptions that market participants would use in pricing an asset.
Securities: The fair values of securities available for sale are determined by matrix pricing, which is a mathematical technique widely used in the industry to value debt securities without relying exclusively on quoted prices for the specific securities, but rather by relying on the securities’ relationship to other benchmark quoted securities (Level 2 inputs).
Equity securities: The Company has two types of equity securities, one is not actively traded in an open market, while the other is listed on an exchange and is less frequently traded. The fair value of the equity security available for sale not actively traded in an open market is determined by using market data inputs for similar securities that are observable. (Level 2 inputs).
Fair value swap asset/liability: The fair value of the swap asset and liability is based on an external derivative model using data inputs as of the valuation date and classified Level 2.
77
CIVISTA BANCSHARES, INC.
NOTES TO CONSOLIDATED FINANCIAL STATEMENTS
December 31, 2020, 2019 and 2018
(Amounts in thousands, except share data)
NOTE 17 - FAIR VALUE MEASUREMENT (Continued)
Impaired loans: The Company has measured impairment on impaired loans generally based on the fair value of the loan’s collateral. Fair value is generally determined based upon independent third-party appraisals of the properties. In some cases, management may adjust the appraised value due to the age of the appraisal, changes in market conditions, or observable deterioration of the property since the appraisal was completed. Additionally, management makes estimates about expected costs to sell the property which are also included in the net realizable value. If the fair value of the collateral dependent loan is less than the carrying amount of the loan, a specific reserve for the loan is made in the allowance for loan losses or a charge-off is taken to reduce the loan to the fair value of the collateral (less estimated selling costs) and the loan is included in the table above as a Level 3 measurement.
Other real estate owned: OREO is carried at the lower of cost or fair value, which is measured at the date foreclosure. If the fair value of the collateral exceeds the carrying amount of the loan, no charge-off or adjustment is necessary, the loan is not considered to be carried at fair value, and is therefore not included in the table below. If the fair value of the collateral is less than the carrying amount of the loan, management will charge the loan down to its estimated realizable value. Management may adjust the appraised value due to the age of the appraisal, changes in market conditions, or observable deterioration of the property since the appraisal was completed. In these cases, the properties are categorized in the below table as Level 3 measurements since these adjustments are considered to be unobservable inputs. Income and expenses from operations are included in other operating expenses. Further declines in the fair value of the collateral subsequent to foreclosure are included in net gain on sale of other real estate owned.
Assets and liabilities measured at fair value are summarized below.
Fair Value Measurements at December 31, 2020 Using:
|
|
|
(Level 1) |
|
|
(Level 2) |
|
|
(Level 3) |
|
|||
|
Assets measured at fair value on a recurring basis: |
|
|
|
|
|
|
|
|
|
|
|
|
|
Securities available for sale |
|
|
|
|
|
|
|
|
|
|
|
|
|
U.S. Treasury securities and obligations of U.S. Government agencies |
|
$ |
— |
|
|
$ |
|
|
|
$ |
— |
|
|
Obligations of states and political subdivisions |
|
|
— |
|
|
|
|
|
|
|
— |
|
|
Mortgage-backed securities in government sponsored entities |
|
|
— |
|
|
|
|
|
|
|
— |
|
|
Total securities available for sale |
|
|
— |
|
|
|
|
|
|
|
— |
|
|
Equity securities |
|
|
— |
|
|
|
|
|
|
|
— |
|
|
Swap asset |
|
|
— |
|
|
|
|
|
|
|
— |
|
|
Liabilities measured at fair value on a recurring basis: |
|
|
|
|
|
|
|
|
|
|
|
|
|
Swap liability |
|
|
— |
|
|
|
|
|
|
|
— |
|
|
Assets measured at fair value on a nonrecurring basis: |
|
|
|
|
|
|
|
|
|
|
|
|
|
Impaired Loans |
|
$ |
— |
|
|
$ |
— |
|
|
$ |
|
|
|
Other Real Estate Owned |
|
|
— |
|
|
|
— |
|
|
|
|
|
78
CIVISTA BANCSHARES, INC.
NOTES TO CONSOLIDATED FINANCIAL STATEMENTS
December 31, 2020, 2019 and 2018
(Amounts in thousands, except share data)
NOTE 17 - FAIR VALUE MEASUREMENT (Continued)
Fair Value Measurements at December 31, 2019 Using:
|
|
|
(Level 1) |
|
|
(Level 2) |
|
|
(Level 3) |
|
|||
|
Assets measured at fair value on a recurring basis: |
|
|
|
|
|
|
|
|
|
|
|
|
|
Securities available for sale |
|
|
|
|
|
|
|
|
|
|
|
|
|
U.S. Treasury securities and obligations of U.S. Government agencies |
|
$ |
— |
|
|
$ |
|
|
|
$ |
— |
|
|
Obligations of states and political subdivisions |
|
|
— |
|
|
|
|
|
|
|
— |
|
|
Mortgage-backed securities in government sponsored entities |
|
|
— |
|
|
|
|
|
|
|
— |
|
|
Total securities available for sale |
|
|
— |
|
|
|
|
|
|
|
— |
|
|
Equity securities |
|
|
— |
|
|
|
|
|
|
|
— |
|
|
Swap asset |
|
|
— |
|
|
|
|
|
|
|
— |
|
|
Liabilities measured at fair value on a recurring basis: |
|
|
|
|
|
|
|
|
|
|
|
|
|
Swap liability |
|
|
— |
|
|
|
|
|
|
|
— |
|
|
Assets measured at fair value on a nonrecurring basis: |
|
|
|
|
|
|
|
|
|
|
|
|
|
Impaired Loans |
|
$ |
— |
|
|
$ |
— |
|
|
$ |
|
|
The following tables presents quantitative information about the Level 3 significant unobservable inputs for assets and liabilities measured at fair value on a nonrecurring basis at December 31, 2020 and 2019.
|
|
|
Quantitative Information about Level 3 Fair Value Measurements |
|
||||||||||
|
December 31, 2020 |
|
Fair Value |
|
|
Valuation Technique |
|
Unobservable Input |
|
Range |
|
Weighted Average |
|
|
|
Impaired loans |
|
$ |
|
|
|
Appraisal of collateral |
|
Appraisal adjustments |
|
|
|
|
|
|
|
|
|
|
|
|
|
|
Holding period |
|
|
|
|
|
|
Other real estate owned |
|
$ |
|
|
|
Appraisal of collateral |
|
Appraisal adjustments |
|
|
|
|
|
|
|
|
Quantitative Information about Level 3 Fair Value Measurements |
|
||||||||||
|
December 31, 2019 |
|
Fair Value |
|
|
Valuation Technique |
|
Unobservable Input |
|
Range |
|
Weighted Average |
|
|
|
Impaired loans |
|
$ |
|
|
|
Appraisal of collateral |
|
Appraisal adjustments |
|
|
|
|
|
|
|
|
|
|
|
|
|
|
Holding period |
|
|
|
|
|
79
CIVISTA BANCSHARES, INC.
NOTES TO CONSOLIDATED FINANCIAL STATEMENTS
December 31, 2020, 2019 and 2018
(Amounts in thousands, except share data)
NOTE 17 - FAIR VALUE MEASUREMENT (Continued)
The carrying amount and fair value of financial instruments carried at amortized cost were as follows:
|
December 31, 2020 |
|
Carrying Amount |
|
|
Total Fair Value |
|
|
Level 1 |
|
|
Level 2 |
|
|
Level 3 |
|
|||||
|
Financial Assets: |
|
|
|
|
|
|
|
|
|
|
|
|
|
|
|
|
|
|
|
|
|
Cash and due from financial institutions |
|
$ |
|
|
|
$ |
|
|
|
$ |
|
|
|
$ |
— |
|
|
$ |
— |
|
|
Other securities |
|
|
|
|
|
|
|
|
|
|
|
|
|
|
— |
|
|
|
— |
|
|
Loans, held for sale |
|
|
|
|
|
|
|
|
|
|
|
|
|
|
— |
|
|
|
— |
|
|
Loans, net of allowance for loan losses |
|
|
|
|
|
|
|
|
|
|
— |
|
|
|
— |
|
|
|
|
|
|
Bank owned life insurance |
|
|
|
|
|
|
|
|
|
|
|
|
|
|
— |
|
|
|
— |
|
|
Accrued interest receivable |
|
|
|
|
|
|
|
|
|
|
|
|
|
|
— |
|
|
|
— |
|
|
Financial Liabilities: |
|
|
|
|
|
|
|
|
|
|
|
|
|
|
|
|
|
|
|
|
|
Nonmaturing deposits |
|
|
|
|
|
|
|
|
|
|
|
|
|
|
— |
|
|
|
— |
|
|
Time deposits |
|
|
|
|
|
|
|
|
|
|
— |
|
|
|
— |
|
|
|
|
|
|
Long-term FHLB advances |
|
|
|
|
|
|
|
|
|
|
— |
|
|
|
— |
|
|
|
|
|
|
Securities sold under agreement to repurchase |
|
|
|
|
|
|
|
|
|
|
|
|
|
|
— |
|
|
|
— |
|
|
Subordinated debentures |
|
|
|
|
|
|
|
|
|
|
— |
|
|
|
— |
|
|
|
|
|
|
Accrued interest payable |
|
|
|
|
|
|
|
|
|
|
|
|
|
|
— |
|
|
|
— |
|
|
December 31, 2019 |
|
Carrying Amount |
|
|
Total Fair Value |
|
|
Level 1 |
|
|
Level 2 |
|
|
Level 3 |
|
|||||
|
Financial Assets: |
|
|
|
|
|
|
|
|
|
|
|
|
|
|
|
|
|
|
|
|
|
Cash and due from financial institutions |
|
$ |
|
|
|
$ |
|
|
|
$ |
|
|
|
$ |
— |
|
|
$ |
— |
|
|
Other securities |
|
|
|
|
|
|
|
|
|
|
|
|
|
|
— |
|
|
|
— |
|
|
Loans, held for sale |
|
|
|
|
|
|
|
|
|
|
|
|
|
|
— |
|
|
|
— |
|
|
Loans, net of allowance for loan losses |
|
|
|
|
|
|
|
|
|
|
— |
|
|
|
— |
|
|
|
|
|
|
Bank owned life insurance |
|
|
|
|
|
|
|
|
|
|
|
|
|
|
— |
|
|
|
— |
|
|
Accrued interest receivable |
|
|
|
|
|
|
|
|
|
|
|
|
|
|
— |
|
|
|
— |
|
|
Financial Liabilities: |
|
|
|
|
|
|
|
|
|
|
|
|
|
|
|
|
|
|
|
|
|
Nonmaturing deposits |
|
|
|
|
|
|
|
|
|
|
|
|
|
|
— |
|
|
|
— |
|
|
Time deposits |
|
|
|
|
|
|
|
|
|
|
— |
|
|
|
— |
|
|
|
|
|
|
Short-term FHLB advances |
|
|
|
|
|
|
|
|
|
|
|
|
|
|
— |
|
|
|
— |
|
|
Long-term FHLB advances |
|
|
|
|
|
|
|
|
|
|
— |
|
|
|
— |
|
|
|
|
|
|
Securities sold under agreement to repurchase |
|
|
|
|
|
|
|
|
|
|
|
|
|
|
— |
|
|
|
— |
|
|
Subordinated debentures |
|
|
|
|
|
|
|
|
|
|
— |
|
|
|
— |
|
|
|
|
|
|
Accrued interest payable |
|
|
|
|
|
|
|
|
|
|
|
|
|
|
— |
|
|
|
— |
|
NOTE 18 - COMMITMENTS, CONTINGENCIES AND OFF-BALANCE-SHEET RISK
Some financial instruments, such as loan commitments, credit lines, letters of credit, and overdraft protection are issued to meet customer financing needs. These are agreements to provide credit or to support the credit of others, as long as conditions established in the contract are met, and usually have expiration dates. Commitments may expire without being used. Off-balance-sheet risk to credit loss exists up to the face amount of these instruments, although material losses are not anticipated. The same credit policies are used to make such commitments as are used for loans, including obtaining collateral at exercise of the commitment.
80
CIVISTA BANCSHARES, INC.
NOTES TO CONSOLIDATED FINANCIAL STATEMENTS
December 31, 2020, 2019 and 2018
(Amounts in thousands, except share data)
NOTE 18 - COMMITMENTS, CONTINGENCIES AND OFF-BALANCE-SHEET RISK (Continued)
The contractual amount of financial instruments with off-balance-sheet risk was as follows at year-end.
|
|
|
2020 |
|
|
2019 |
|
||||||||||
|
|
|
Fixed Rate |
|
|
Variable Rate |
|
|
Fixed Rate |
|
|
Variable Rate |
|
||||
|
Commitments to extend credit: |
|
|
|
|
|
|
|
|
|
|
|
|
|
|
|
|
|
Lines of credit and construction loans |
|
$ |
|
|
|
$ |
|
|
|
$ |
|
|
|
$ |
|
|
|
Overdraft protection |
|
|
|
|
|
|
|
|
|
|
|
|
|
|
|
|
|
Letters of credit |
|
|
|
|
|
|
|
|
|
|
|
|
|
|
|
|
|
|
|
$ |
|
|
|
$ |
|
|
|
$ |
|
|
|
$ |
|
|
Commitments to make loans are generally made for a period of
Civista is required to maintain certain reserve balances on hand in accordance with the Federal Reserve Board requirements. The average reserve balance maintained in accordance with such requirements was $
NOTE 19 - CAPITAL REQUIREMENTS AND RESTRICTION ON RETAINED EARNINGS
CBI and Civista (collectively, the “Companies”) are subject to various regulatory capital requirements administered by the federal banking agencies. Failure to meet minimum capital requirements can initiate certain mandatory-and possibly additional discretionary-actions by regulators that, if undertaken, could have a direct material effect on the financial statements. Under capital adequacy guidelines and the regulatory framework for prompt corrective action, the Companies must meet specific capital guidelines that involve quantitative measures of the Companies’ assets, liabilities, and certain off-balance-sheet items as calculated under U.S. GAAP, regulatory reporting requirements, and regulatory capital standards. The Companies’ capital amounts and classification are also subject to qualitative judgments by the regulators about components, risk weightings, and other factors.
Quantitative measures established by regulatory capital standards to ensure capital adequacy require the Companies to maintain minimum amounts and ratios (set forth in the following table) of total and Tier 1 capital to risk-weighted assets, common equity Tier 1 capital to total risk-weighted assets, and of Tier 1 capital to average assets. Management believes, as of December 31, 2020, that the Companies met all capital adequacy requirements to which they were subject.
81
CIVISTA BANCSHARES, INC.
NOTES TO CONSOLIDATED FINANCIAL STATEMENTS
December 31, 2020, 2019 and 2018
(Amounts in thousands, except share data)
NOTE 19 - CAPITAL REQUIREMENTS AND RESTRICTION ON RETAINED EARNINGS (Continued)
As of December 31, 2020, and 2019, the most recent notification from the Federal Reserve Bank categorized the Bank as well capitalized under the regulatory framework for prompt corrective action. To be categorized as well capitalized the Companies must maintain minimum total risk-based capital, Tier 1 risk-based capital, common equity Tier 1 risk-based capital, and Tier 1 leverage ratios as set forth in the table below. There are no conditions or events since that notification that management believes have changed the institution’s category.
The Company’s and Civista’s actual capital levels and minimum required capital levels at December 31, 2020 and 2019 were as follows:
|
|
|
|
|
|
|
|
|
|
|
|
|
|
|
|
|
|
|
To Be Well |
|
|||||
|
|
|
|
|
|
|
|
|
|
|
|
|
|
|
|
|
|
|
Capitalized Under |
|
|||||
|
|
|
|
|
|
|
|
|
|
|
For Capital |
|
|
Prompt Corrective |
|
||||||||||
|
|
|
Actual |
|
|
Adequacy Purposes |
|
|
Action Purposes |
|
|||||||||||||||
|
|
|
Amount |
|
|
Ratio |
|
|
Amount |
|
|
Ratio |
|
|
Amount |
|
|
Ratio |
|
||||||
|
2020 |
|
|
|
|
|
|
|
|
|
|
|
|
|
|
|
|
|
|
|
|
|
|
|
|
|
Total Risk Based Capital |
|
|
|
|
|
|
|
|
|
|
|
|
|
|
|
|
|
|
|
|
|
|
|
|
|
Consolidated |
|
$ |
|
|
|
|
|
% |
|
$ |
|
|
|
|
|
% |
|
n/a |
|
|
n/a |
|
||
|
Civista |
|
|
|
|
|
|
|
|
|
|
|
|
|
|
|
|
|
$ |
|
|
|
|
|
% |
|
Tier I Risk Based Capital |
|
|
|
|
|
|
|
|
|
|
|
|
|
|
|
|
|
|
|
|
|
|
|
|
|
Consolidated |
|
|
|
|
|
|
|
|
|
|
|
|
|
|
|
|
|
n/a |
|
|
n/a |
|
||
|
Civista |
|
|
|
|
|
|
|
|
|
|
|
|
|
|
|
|
|
|
|
|
|
|
|
|
|
CET1 Risk Based Capital |
|
|
|
|
|
|
|
|
|
|
|
|
|
|
|
|
|
|
|
|
|
|
|
|
|
Consolidated |
|
|
|
|
|
|
|
|
|
|
|
|
|
|
|
|
|
n/a |
|
|
n/a |
|
||
|
Civista |
|
|
|
|
|
|
|
|
|
|
|
|
|
|
|
|
|
|
|
|
|
|
|
|
|
Leverage |
|
|
|
|
|
|
|
|
|
|
|
|
|
|
|
|
|
|
|
|
|
|
|
|
|
Consolidated |
|
|
|
|
|
|
|
|
|
|
|
|
|
|
|
|
|
n/a |
|
|
n/a |
|
||
|
Civista |
|
|
|
|
|
|
|
|
|
|
|
|
|
|
|
|
|
|
|
|
|
|
|
|
|
2019 |
|
|
|
|
|
|
|
|
|
|
|
|
|
|
|
|
|
|
|
|
|
|
|
|
|
Total Risk Based Capital |
|
|
|
|
|
|
|
|
|
|
|
|
|
|
|
|
|
|
|
|
|
|
|
|
|
Consolidated |
|
$ |
|
|
|
|
|
% |
|
$ |
|
|
|
|
|
% |
|
n/a |
|
|
n/a |
|
||
|
Civista |
|
|
|
|
|
|
|
|
|
|
|
|
|
|
|
|
|
$ |
|
|
|
|
|
% |
|
Tier I Risk Based Capital |
|
|
|
|
|
|
|
|
|
|
|
|
|
|
|
|
|
|
|
|
|
|
|
|
|
Consolidated |
|
|
|
|
|
|
|
|
|
|
|
|
|
|
|
|
|
n/a |
|
|
n/a |
|
||
|
Civista |
|
|
|
|
|
|
|
|
|
|
|
|
|
|
|
|
|
|
|
|
|
|
|
|
|
CET1 Risk Based Capital |
|
|
|
|
|
|
|
|
|
|
|
|
|
|
|
|
|
|
|
|
|
|
|
|
|
Consolidated |
|
|
|
|
|
|
|
|
|
|
|
|
|
|
|
|
|
n/a |
|
|
n/a |
|
||
|
Civista |
|
|
|
|
|
|
|
|
|
|
|
|
|
|
|
|
|
|
|
|
|
|
|
|
|
Leverage |
|
|
|
|
|
|
|
|
|
|
|
|
|
|
|
|
|
|
|
|
|
|
|
|
|
Consolidated |
|
|
|
|
|
|
|
|
|
|
|
|
|
|
|
|
|
n/a |
|
|
n/a |
|
||
|
Civista |
|
|
|
|
|
|
|
|
|
|
|
|
|
|
|
|
|
|
|
|
|
|
|
|
CBI’s primary source of funds for paying dividends to its shareholders and for operating expense is the cash accumulated from dividends received from Civista. Payment of dividends by Civista to CBI is subject to restrictions by Civista’s regulatory agencies. These restrictions generally limit dividends to the current and prior two years retained earnings as defined by the regulations. In addition, dividends may not reduce capital levels below minimum regulatory requirements. At December 31, 2020, Civista had $
82
CIVISTA BANCSHARES, INC.
NOTES TO CONSOLIDATED FINANCIAL STATEMENTS
December 31, 2020, 2019 and 2018
(Amounts in thousands, except share data)
NOTE 20 - PARENT COMPANY ONLY CONDENSED FINANCIAL INFORMATION
Condensed financial information of CBI follows:
|
|
|
December 31, |
|
|||||
|
Condensed Balance Sheets |
|
2020 |
|
|
2019 |
|
||
|
Assets: |
|
|
|
|
|
|
|
|
|
Cash |
|
$ |
|
|
|
$ |
|
|
|
Equity securities |
|
|
|
|
|
|
|
|
|
Investment in bank subsidiary |
|
|
|
|
|
|
|
|
|
Investment in nonbank subsidiaries |
|
|
|
|
|
|
|
|
|
Other assets |
|
|
|
|
|
|
|
|
|
Total assets |
|
$ |
|
|
|
$ |
|
|
|
Liabilities: |
|
|
|
|
|
|
|
|
|
Deferred income taxes and other liabilities |
|
$ |
|
|
|
$ |
|
|
|
Subordinated debentures |
|
|
|
|
|
|
|
|
|
Total liabilities |
|
|
|
|
|
|
|
|
|
Shareholders’ Equity: |
|
|
|
|
|
|
|
|
|
Common stock |
|
|
|
|
|
|
|
|
|
Accumulated earnings |
|
|
|
|
|
|
|
|
|
Treasury Stock |
|
|
(
|
) |
|
|
(
|
) |
|
Accumulated other comprehensive income |
|
|
|
|
|
|
|
|
|
Total shareholders’ equity |
|
|
|
|
|
|
|
|
|
Total liabilities and shareholders’ equity |
|
$ |
|
|
|
$ |
|
|
|
|
|
For the years ended December 31, |
|
|||||||||
|
Condensed Statements of Operations |
|
2020 |
|
|
2019 |
|
|
2018 |
|
|||
|
Dividends from bank subsidiaries |
|
$ |
|
|
|
$ |
|
|
|
$ |
|
|
|
Dividends from non-bank subsidiaries |
|
|
|
|
|
|
— |
|
|
|
— |
|
|
Interest expense |
|
|
(
|
) |
|
|
(
|
) |
|
|
(
|
) |
|
Pension expense |
|
|
(
|
) |
|
|
|
|
|
|
|
|
|
Acquisition expense |
|
|
— |
|
|
|
— |
|
|
|
(
|
) |
|
Other expense, net |
|
|
(
|
) |
|
|
(
|
) |
|
|
(
|
) |
|
Income (loss) before equity in undistributed net earnings of subsidiaries |
|
|
|
|
|
|
|
|
|
|
(
|
) |
|
Income tax benefit |
|
|
|
|
|
|
|
|
|
|
|
|
|
Equity in undistributed net earnings of subsidiaries |
|
|
|
|
|
|
|
|
|
|
|
|
|
Net income |
|
$ |
|
|
|
$ |
|
|
|
$ |
|
|
|
Comprehensive income |
|
$ |
|
|
|
$ |
|
|
|
$ |
|
|
83
CIVISTA BANCSHARES, INC.
NOTES TO CONSOLIDATED FINANCIAL STATEMENTS
December 31, 2020, 2019 and 2018
(Amounts in thousands, except share data)
NOTE 20 - PARENT COMPANY ONLY CONDENSED FINANCIAL INFORMATION (Continued)
|
|
|
For the years ended December 31, |
|
|||||||||
|
Condensed Statements of Cash Flows |
|
2020 |
|
|
2019 |
|
|
2018 |
|
|||
|
Operating activities: |
|
|
|
|
|
|
|
|
|
|
|
|
|
Net income |
|
$ |
|
|
|
$ |
|
|
|
$ |
|
|
|
Adjustment to reconcile net income to net cash from operating activities: |
|
|
|
|
|
|
|
|
|
|
|
|
|
Change in other assets and other liabilities |
|
|
|
|
|
|
|
|
|
|
|
|
|
Gain on sale of fixed assets |
|
|
— |
|
|
|
— |
|
|
|
(
|
) |
|
Equity in undistributed net earnings of subsidiaries |
|
|
(
|
) |
|
|
(
|
) |
|
|
(
|
) |
|
Net cash from (used for) operating activities |
|
|
|
|
|
|
|
|
|
|
(
|
) |
|
Investing activities: |
|
|
|
|
|
|
|
|
|
|
|
|
|
Proceeds from sale of premises and equipment |
|
|
— |
|
|
|
— |
|
|
|
|
|
|
Disposal of investment in subsidiary |
|
|
— |
|
|
|
|
|
|
|
— |
|
|
Acquisition and additional capitalization of subsidiary, net of cash acquired |
|
|
— |
|
|
|
— |
|
|
|
(
|
) |
|
Net cash from (used for) investing activities |
|
|
— |
|
|
|
|
|
|
|
(
|
) |
|
Financing activities: |
|
|
|
|
|
|
|
|
|
|
|
|
|
Cash paid on fractional shares on preferred stock conversion to common stock |
|
|
— |
|
|
|
(
|
) |
|
|
— |
|
|
Purchase of treasury stock |
|
|
(
|
) |
|
|
(
|
) |
|
|
— |
|
|
Payment to repurchase series B preferred stock |
|
|
— |
|
|
|
(
|
) |
|
|
— |
|
|
Cash dividends paid |
|
|
(
|
) |
|
|
(
|
) |
|
|
(
|
) |
|
Net cash used for financing activities |
|
|
(
|
) |
|
|
(
|
) |
|
|
(
|
) |
|
Net change in cash and cash equivalents |
|
|
(
|
) |
|
|
|
|
|
|
(
|
) |
|
Cash and cash equivalents at beginning of year |
|
|
|
|
|
|
|
|
|
|
|
|
|
Cash and cash equivalents at end of year |
|
$ |
|
|
|
$ |
|
|
|
$ |
|
|
NOTE 21 - PREFERRED SHARES
On December 19, 2013, the Company completed the sale of
Using proceeds from the sale of the depositary shares, the Company redeemed all of its outstanding Series A Preferred Shares for an aggregate purchase price of $
All outstanding depositary shares were redeemed or converted into common shares by December 20, 2019.
84
CIVISTA BANCSHARES, INC.
NOTES TO CONSOLIDATED FINANCIAL STATEMENTS
December 31, 2020, 2019 and 2018
(Amounts in thousands, except share data)
NOTE 22 - EARNINGS PER COMMON SHARE
The factors used in the earnings per share computation follow.
|
|
|
2020 |
|
|
2019 |
|
|
2018 |
|
|||
|
Basic |
|
|
|
|
|
|
|
|
|
|
|
|
|
Net income |
|
$ |
|
|
|
$ |
|
|
|
$ |
|
|
|
Preferred stock dividends |
|
|
— |
|
|
|
|
|
|
|
|
|
|
Net income available to common shareholders—basic |
|
$ |
|
|
|
$ |
|
|
|
$ |
|
|
|
Weighted average common shares outstanding—basic |
|
|
|
|
|
|
|
|
|
|
|
|
|
Basic earnings per share |
|
$ |
|
|
|
$ |
|
|
|
$ |
|
|
|
Diluted |
|
|
|
|
|
|
|
|
|
|
|
|
|
Net income available to common shareholders—basic |
|
$ |
|
|
|
$ |
|
|
|
$ |
|
|
|
Preferred stock dividends on convertible preferred stock |
|
|
— |
|
|
|
|
|
|
|
|
|
|
Net income available to common shareholders—diluted |
|
$ |
|
|
|
$ |
|
|
|
$ |
|
|
|
Weighted average common shares outstanding for earnings per common share basic |
|
|
|
|
|
|
|
|
|
|
|
|
|
Add: dilutive effects of convertible preferred shares |
|
|
— |
|
|
|
|
|
|
|
|
|
|
Average shares and dilutive potential common shares outstanding—diluted |
|
|
|
|
|
|
|
|
|
|
|
|
|
Diluted earnings per share |
|
$ |
|
|
|
$ |
|
|
|
$ |
|
|
Basic earnings per common share are calculated by dividing net income by the weighted-average number of common shares outstanding for the period. Diluted earnings per common share include the dilutive effect, if any, of additional potential common shares issuable under the equity incentive plan, computed using the treasury stock method, and the impact of the Company’s convertible preferred shares using the “if converted” method.
85
CIVISTA BANCSHARES, INC.
NOTES TO CONSOLIDATED FINANCIAL STATEMENTS
December 31, 2020, 2019 and 2018
(Amounts in thousands, except share data)
NOTE 23 - QUARTERLY FINANCIAL DATA (UNAUDITED)
|
|
|
Interest Income |
|
|
Net Interest Income |
|
|
Net Income |
|
|
Basic Earnings per Common Share |
|
|
Diluted Earnings per Common Share |
|
|||||
|
2020 |
|
|
|
|
|
|
|
|
|
|
|
|
|
|
|
|
|
|
|
|
|
First quarter (1)(2) |
|
$ |
|
|
|
$ |
|
|
|
$ |
|
|
|
$ |
|
|
|
$ |
|
|
|
Second quarter (1)(2) |
|
|
|
|
|
|
|
|
|
|
|
|
|
|
|
|
|
|
|
|
|
Third quarter (3)(4) |
|
|
|
|
|
|
|
|
|
|
|
|
|
|
|
|
|
|
|
|
|
Fourth quarter (3)(4) |
|
|
|
|
|
|
|
|
|
|
|
|
|
|
|
|
|
|
|
|
|
2019 |
|
|
|
|
|
|
|
|
|
|
|
|
|
|
|
|
|
|
|
|
|
First quarter (5)(6) |
|
$ |
|
|
|
$ |
|
|
|
$ |
|
|
|
$ |
|
|
|
$ |
|
|
|
Second quarter (5)(9) |
|
|
|
|
|
|
|
|
|
|
|
|
|
|
|
|
|
|
|
|
|
Third quarter (7)(9) |
|
|
|
|
|
|
|
|
|
|
|
|
|
|
|
|
|
|
|
|
|
Fourth quarter (8) |
|
|
|
|
|
|
|
|
|
|
|
|
|
|
|
|
|
|
|
|
|
( 1 ) |
Interest income and net interest income increased due to increased volume of interest earning assets, offset by a decrease in interest rate. |
|
(2) |
Net income decreased due to an increase in the provision for loan losses. |
|
( 3 ) |
Interest income and net interest income increased due to increased volume of interest earning assets, offset by decreases in interest earning asset and interest-bearing liabilities rate. |
|
( 4 ) |
Net income decreased due to an increase in the provision for loan losses, offset by an increase in gain on sale of loans. |
|
( 5 ) |
Interest income and net interest income increased due to increased volume and rate on loans, non-taxable securities and interest-bearing deposits in other banks. |
|
( 6 ) |
Net income increased due to fees on tax refund processing program. |
|
( 7 ) |
Interest income and net interest income decreased due to a decrease in rate on interest earning assets and an increase on rate on interest-bearing liabilities. |
|
( 8 ) |
Interest income and net interest income increased due to an increase in loan volume and a decrease in rate on interest-bearing liabilities. |
|
( 9 ) |
Net income decreased due to a decrease in fees on the tax refund program. |
NOTE 24 - DERIVATIVES
To accommodate customer need and to support the Company’s asset/liability positioning, on occasion we enter into interest rate swaps with a customer and a bank counterparty. The interest rate swaps are free-standing derivatives and are recorded at fair value. The Company enters into a floating rate loan and a fixed rate swap with our customer. Simultaneously, the Company enters into an offsetting fixed rate swap with a bank counterparty. In connection with each swap transaction, the Company agrees to pay interest to the customer on a notional amount at a variable interest rate and receive interest from the customer on the same notional amount at a fixed interest rate. At the same time, the Company agrees to pay a bank counterparty the same fixed interest rate on the same notional amount and receive the same variable interest rate on the same notional amount. These transactions allow the Company’s customer to effectively convert variable rate loans to fixed rate loans. Since the Company acts as an intermediary for its customer, changes in the fair value of the underlying derivative contracts offset each other and do not significantly impact the Company’s results of operations unless a significant difference in credit risk emerges between the counterparties at either end of one of the swap contracts. None of the Company’s derivatives are designated as hedging instruments.
86
CIVISTA BANCSHARES, INC.
NOTES TO CONSOLIDATED FINANCIAL STATEMENTS
December 31, 2020, 2019 and 2018
(Amounts in thousands, except share data)
NOTE 24 - DERIVATIVE HEDGING INSTRUMENTS (Continued)
The following table summarizes the Company’s interest rate swap positions as of December 31, 2020.
|
|
|
Classification on the Consolidated Balance Sheet |
|
Notional Amount |
|
|
Fair Value |
|
|
Weighted Average Rate Received/ (Paid) |
|
|||
|
Derivative Assets |
|
Other Assets |
|
$ |
|
|
|
$ |
|
|
|
|
|
% |
|
Derivative Liabilities |
|
Accrued expenses and other liabilities |
|
|
(
|
) |
|
|
(
|
) |
|
|
- |
% |
|
Net Exposure |
|
|
|
$ |
|
|
|
$ |
(
|
) |
|
|
|
|
The following table summarizes the Company’s interest rate swap positions as of December 31, 2019.
|
|
|
Classification on the Consolidated Balance Sheet |
|
Notional Amount |
|
|
Fair Value |
|
|
Weighted Average Rate Received/ (Paid) |
|
|||
|
Derivative Assets |
|
Other Assets |
|
$ |
|
|
|
$ |
|
|
|
|
|
% |
|
Derivative Liabilities |
|
Accrued expenses and other liabilities |
|
|
(
|
) |
|
|
(
|
) |
|
|
- |
% |
|
Net Exposure |
|
|
|
$ |
|
|
|
$ |
|
|
|
|
|
|
The Company monitors and controls all derivative products with a comprehensive Board of Director approved commercial loan swap policy. All hedge transactions must be approved in advance by the Lenders Loan Committee or the Directors Loan Committee of the Board of Directors. The Company classifies changes in the fair value of derivatives with “Other” in the Consolidated Statements of Operation. Any fees paid to enter the swap contract at inception are recognized in earnings when received. Such fees amounted to $
At December 31, 2020, the Company had cash and securities at fair value pledged for collateral on its interest rate swaps with third party financial institutions of $
NOTE 25 – QUALIFIED AFFORDABLE HOUSING PROJECT INVESTMENTS
The Company invests in qualified affordable housing projects. At December 31, 2020 and 2019, the balance of the Company’s investments in qualified affordable housing projects was $
During the years ended December 31, 2020, 2019 and 2018, the Company recognized amortization expense with respect to its investments in qualified affordable housing projects of $
Additionally, during the years ended December 31, 2020, 2019 and 2018, the Company recognized tax credits and other benefits from its investments in affordable housing tax credits of $
87
CIVISTA BANCSHARES, INC.
NOTES TO CONSOLIDATED FINANCIAL STATEMENTS
December 31, 2020, 2019 and 2018
(Amounts in thousands, except share data)
NOTE 26 – REVENUE RECOGNITION
The Company accounts for revenues from contracts with customers under ASC 606, Revenue from Contracts with Customers. Revenue associated with financial instruments, including revenue from loans and securities are outside the scope of the new standard and accounted for under existing GAAP. In addition, certain noninterest income streams such as fees associated with mortgage servicing rights, financial guarantees, derivatives and certain credit card fees are also not in scope of the new guidance. Noninterest revenue streams in-scope of ASC 606 are discussed below.
Service Charges
Service charges consist of account analysis fees (i.e., net fees earned on analyzed business and public checking accounts), monthly service fees, and other deposit account related fees. The Company’s performance obligation for account analysis fees and monthly service fees is generally satisfied, and the related revenue recognized, over the period in which the service is provided. Other deposit account related fees are largely transactional based, and therefore, the Company’s performance obligation is satisfied, and related revenue recognized, at a point in time. Payment for service charges on deposit accounts is primarily received immediately or in the following month through a direct charge to customers’ accounts.
ATM/Interchange Fees
Fees, exchange, and other service charges are primarily comprised of debit and credit card income, ATM fees and other service charges. Debit and credit card income is primarily comprised of interchange fees earned whenever the Company’s debit and credit cards are processed through card payment networks such as Mastercard. ATM fees are primarily generated when a Company cardholder uses a non-Company ATM or a non-Company cardholder uses a Company ATM. The Company’s performance obligation for fees, exchange, and other service charges are largely satisfied, and related revenue recognized, when the services are rendered or upon completion. Payment is typically received immediately or in the following month.
Wealth Management Fees
Wealth management fees are primarily comprised of fees earned from the management and administration of trusts and other customer assets. The Company’s performance obligation is generally satisfied over time and the resulting fees are recognized monthly, based upon the month-end market value of the assets under management and the applicable fee rate. Payment is generally received in the following month through a direct charge to customers’ accounts. The Company does not earn performance-based incentives. The Company’s performance obligation for these transactional-based services is generally satisfied, and related revenue recognized, at a point in time (i.e., as incurred). Payment is received shortly after services are rendered.
Tax Refund Processing Fees
The Company facilitates the payment of federal and state income tax refunds in partnership with a third-party vendor. Refund Transfers (“RTs”) are fee-based products whereby a tax refund is issued to the taxpayer after the Company has received the refund from the federal or state government. As part of this agreement the Company earns fee income, the majority of which is received in the first quarter of the year. The Company’s fee income revenue is recognized based on the estimated percent of business completed by each date.
88
CIVISTA BANCSHARES, INC.
NOTES TO CONSOLIDATED FINANCIAL STATEMENTS
December 31, 2020, 2019 and 2018
(Amounts in thousands, except share data)
NOTE 26 – REVENUE RECOGNITION (Continued)
Other
Other noninterest income consists of other recurring revenue streams such as check order fees, wire transfer fees, safety deposit box rental fees, item processing fees and other miscellaneous revenue streams. Check order income mainly represents fees charged to customers for checks. Wire transfer fees represent revenue from processing wire transfers. Safe deposit box rental fees are charged to the customer on an annual basis and recognized upon receipt of payment. The Company determined that since rentals and renewals occur fairly consistently over time, revenue is recognized on a basis consistent with the duration of the performance obligation. Item processing fee income represents fees charged to other financial institutions for processing their transactions. Payment is typically received in the following month.
The following presents noninterest income, segregated by revenue streams in-scope and out-of-scope of Topic 606, for the years ended December 31, 2020, 2019 and 2018.
|
|
|
For the years ended December 31, |
|
|||||||||
|
|
|
2020 |
|
|
2019 |
|
|
2018 |
|
|||
|
Noninterest Income |
|
|
|
|
|
|
|
|
|
|
|
|
|
In-scope of Topic 606: |
|
|
|
|
|
|
|
|
|
|
|
|
|
Service charges |
|
$ |
|
|
|
$ |
|
|
|
$ |
|
|
|
ATM/Interchange fees |
|
|
|
|
|
|
|
|
|
|
|
|
|
Wealth management fees |
|
|
|
|
|
|
|
|
|
|
|
|
|
Tax refund processing fees |
|
|
|
|
|
|
|
|
|
|
|
|
|
Other |
|
|
|
|
|
|
|
|
|
|
|
|
|
Noninterest Income (in-scope of Topic 606) |
|
|
|
|
|
|
|
|
|
|
|
|
|
Noninterest Income (out-of-scope of Topic 606) |
|
|
|
|
|
|
|
|
|
|
|
|
|
Total Noninterest Income |
|
$ |
|
|
|
$ |
|
|
|
$ |
|
|
89
CIVISTA BANCSHARES, INC.
NOTES TO CONSOLIDATED FINANCIAL STATEMENTS
December 31, 2020, 2019 and 2018
(Amounts in thousands, except share data)
NOTE 27 - LEASES
We have operating leases for several branch locations and office space. The Company’s lease agreements do not contain any material residual value guarantees or material restrictive covenants. We also lease certain office equipment under operating leases. Many of our leases include both lease (e.g., minimum rent payments) and non-lease (e.g., common-area or other maintenance costs) components. The Company accounts for each component separately based on the standalone price of each component. In addition, we have several operating leases with lease terms of less than one year and therefore, we have elected the practical expedient to exclude these short-term leases from our ROU assets and lease liabilities.
Most leases include one or more options to renew. The exercise of lease renewal options is typically at our sole discretion. The majority of renewals to extend the lease terms are included in our ROU assets and lease liabilities as they are reasonably certain of exercise.
As most of our leases do not provide an implicit rate, we use the fully collateralized FHLB borrowing rate, commensurate with the lease terms based on the information available at the lease commencement date in determining the present value of the lease payments.
The balance sheet information related to our operating leases were as follows as of December 31, 2020 and 2019:
|
|
|
Classification on the Consolidated Balance Sheet |
|
December 31, 2020 |
|
|
December 31, 2019 |
|
||
|
Assets: |
|
|
|
|
|
|
|
|
|
|
|
Operating lease |
|
Other assets |
|
$ |
|
|
|
$ |
|
|
|
Liabilities: |
|
|
|
|
|
|
|
|
|
|
|
Operating lease |
|
Accrued expenses and other liabilities |
|
$ |
|
|
|
$ |
|
|
The cost components of our operating leases were as follows for the period ended December 31, 2020 and 2019:
|
|
|
December 31, 2020 |
|
|
December 31, 2019 |
|
||
|
Lease cost |
|
|
|
|
|
|
|
|
|
Operating lease cost |
|
$ |
|
|
|
$ |
|
|
|
Short-term lease cost |
|
|
|
|
|
|
|
|
|
Sublease income |
|
|
(
|
) |
|
|
(
|
) |
|
Total lease cost |
|
$ |
|
|
|
$ |
|
|
90
CIVISTA BANCSHARES, INC.
NOTES TO CONSOLIDATED FINANCIAL STATEMENTS
December 31, 2020, 2019 and 2018
(Amounts in thousands, except share data)
NOTE 27 – LEASES (Continued)
Maturities of our lease liabilities for all operating leases for each of the next five years and thereafter is as follows:
|
2021 |
|
$ |
|
|
|
2022 |
|
|
|
|
|
2023 |
|
|
|
|
|
2024 |
|
|
|
|
|
2025 |
|
|
|
|
|
Thereafter |
|
|
|
|
|
Total lease payments |
|
$ |
|
|
|
Less: Imputed Interest |
|
|
|
|
|
Present value of lease liabilities |
|
$ |
|
|
The weighted average remaining lease terms and discount rates for all of our operating leases were as follows as of December 31, 2020:
|
Weighted-average remaining lease term - operating leases (years) |
|
|
|
|
|
Weighted-average discount rate - operating leases |
|
|
|
% |
NOTE 28 - SUBSEQUENT EVENTS
Paycheck Protection Program
The Consolidated Appropriations Act 2021, was signed into law on December 27, 2020 and provides an additional funding of $
Funds provided under legislation are earmarked both for first time PPP borrowers (subject to original PPP eligibility and limits) as well as ‘Second Draw’ loans for borrows that already received an original PPP loan.
As of February 22, 2021, we have received SBA approval on, and funded
91