00009434522020FYFALSEus-gaap:OtherLiabilities00009434522020-01-012020-12-31iso4217:USD00009434522020-06-30xbrli:shares00009434522021-02-1200009434522020-12-3100009434522019-12-31iso4217:USDxbrli:shares0000943452us-gaap:ProductMember2020-01-012020-12-310000943452us-gaap:ProductMember2019-01-012019-12-310000943452us-gaap:ProductMember2018-01-012018-12-310000943452us-gaap:ServiceMember2020-01-012020-12-310000943452us-gaap:ServiceMember2019-01-012019-12-310000943452us-gaap:ServiceMember2018-01-012018-12-3100009434522019-01-012019-12-3100009434522018-01-012018-12-3100009434522018-12-3100009434522017-12-310000943452us-gaap:CommonStockMember2017-12-310000943452us-gaap:AdditionalPaidInCapitalMember2017-12-310000943452us-gaap:TreasuryStockMember2017-12-310000943452us-gaap:RetainedEarningsMember2017-12-310000943452us-gaap:AccumulatedOtherComprehensiveIncomeMember2017-12-310000943452us-gaap:NoncontrollingInterestMember2017-12-310000943452us-gaap:RetainedEarningsMember2018-01-012018-12-310000943452us-gaap:AdditionalPaidInCapitalMember2018-01-012018-12-310000943452us-gaap:TreasuryStockMember2018-01-012018-12-310000943452us-gaap:NoncontrollingInterestMember2018-01-012018-12-310000943452us-gaap:AccumulatedOtherComprehensiveIncomeMember2018-01-012018-12-310000943452us-gaap:CommonStockMember2018-12-310000943452us-gaap:AdditionalPaidInCapitalMember2018-12-310000943452us-gaap:TreasuryStockMember2018-12-310000943452us-gaap:RetainedEarningsMember2018-12-310000943452us-gaap:AccumulatedOtherComprehensiveIncomeMember2018-12-310000943452us-gaap:NoncontrollingInterestMember2018-12-310000943452us-gaap:RetainedEarningsMember2019-01-012019-12-310000943452us-gaap:AdditionalPaidInCapitalMember2019-01-012019-12-310000943452us-gaap:TreasuryStockMember2019-01-012019-12-310000943452us-gaap:NoncontrollingInterestMember2019-01-012019-12-310000943452us-gaap:AccumulatedOtherComprehensiveIncomeMember2019-01-012019-12-310000943452us-gaap:CommonStockMember2019-01-012019-12-310000943452us-gaap:CommonStockMember2019-12-310000943452us-gaap:AdditionalPaidInCapitalMember2019-12-310000943452us-gaap:TreasuryStockMember2019-12-310000943452us-gaap:RetainedEarningsMember2019-12-310000943452us-gaap:AccumulatedOtherComprehensiveIncomeMember2019-12-310000943452us-gaap:NoncontrollingInterestMember2019-12-310000943452us-gaap:RetainedEarningsMember2020-01-012020-12-310000943452us-gaap:AdditionalPaidInCapitalMember2020-01-012020-12-310000943452us-gaap:TreasuryStockMember2020-01-012020-12-310000943452us-gaap:NoncontrollingInterestMember2020-01-012020-12-310000943452us-gaap:AccumulatedOtherComprehensiveIncomeMember2020-01-012020-12-310000943452us-gaap:CommonStockMember2020-12-310000943452us-gaap:AdditionalPaidInCapitalMember2020-12-310000943452us-gaap:TreasuryStockMember2020-12-310000943452us-gaap:RetainedEarningsMember2020-12-310000943452us-gaap:AccumulatedOtherComprehensiveIncomeMember2020-12-310000943452us-gaap:NoncontrollingInterestMember2020-12-31wab:countryxbrli:pure0000943452us-gaap:NonUsMemberus-gaap:GeographicConcentrationRiskMemberus-gaap:RevenueFromContractWithCustomerMember2020-01-012020-12-3100009434522021-01-012020-12-3100009434522020-05-310000943452us-gaap:CollateralPledgedMember2020-12-3100009434522020-10-012020-12-310000943452wab:GETransportationMember2019-02-252019-02-250000943452wab:GeneralElectricCompanyMemberwab:GETransportationMemberwab:SpinCoCommonStockMember2019-02-250000943452wab:GeneralElectricCompanyMemberwab:SpinCoClassAPreferredStockMemberwab:GETransportationMember2019-02-250000943452wab:GeneralElectricCompanyMemberwab:GETransportationMemberwab:SpinCoClassBPreferredStockMember2019-02-250000943452wab:GeneralElectricCompanyMemberwab:SpinCoClassCPreferredStockMemberwab:GETransportationMember2019-02-250000943452us-gaap:ConvertiblePreferredStockMemberwab:GETransportationMember2019-02-252019-02-250000943452wab:GETransportationMemberwab:GeneralElectricCompanyMember2019-02-250000943452wab:GETransportationMemberwab:SpinCoClassBPreferredStockMember2019-02-252019-02-250000943452wab:GeneralElectricCompanyMemberwab:GeneralElectricCompanyMember2019-12-310000943452wab:GeneralElectricCompanyMember2019-12-310000943452wab:GeneralElectricCompanyMember2019-01-012019-12-310000943452wab:GETransportationMemberwab:GEandPreMergerHoldersMember2019-02-250000943452us-gaap:ConvertiblePreferredStockMemberwab:GETransportationMemberwab:GeneralElectricCompanyMember2019-02-250000943452wab:GETransportationMemberwab:PremergerWabtecStockholdersMember2019-02-250000943452wab:WabtecMemberwab:GETransportationMemberwab:SpinCoClassBPreferredStockMember2019-02-250000943452wab:GeneralElectricCompanyMemberus-gaap:SeriesAPreferredStockMemberwab:GETransportationMember2019-05-060000943452us-gaap:CommonStockMemberwab:GeneralElectricCompanyMemberwab:GETransportationMember2019-05-060000943452us-gaap:CommonStockMember2019-05-060000943452us-gaap:CommonStockMemberwab:GeneralElectricCompanyMemberwab:GETransportationMember2019-08-092019-08-090000943452us-gaap:CommonStockMemberwab:GeneralElectricCompanyMemberwab:GETransportationMember2019-09-122019-09-120000943452wab:GETransportationMember2020-01-012020-12-310000943452wab:GETransportationMember2019-02-220000943452wab:GETBrazilMember2019-04-300000943452wab:GeneralElectricCompanyMember2019-02-250000943452wab:GeneralElectricCompanyMemberus-gaap:TradeNamesMember2019-02-250000943452wab:GeneralElectricCompanyMemberus-gaap:CustomerRelationshipsMember2019-02-250000943452us-gaap:IntellectualPropertyMemberwab:GeneralElectricCompanyMember2019-02-250000943452us-gaap:OrderOrProductionBacklogMemberwab:GeneralElectricCompanyMember2019-02-250000943452wab:GeneralElectricCompanyMemberus-gaap:CustomerContractsMember2019-02-250000943452wab:GETransportationMember2019-01-012019-12-310000943452us-gaap:LandImprovementsMembersrt:MinimumMember2020-01-012020-12-310000943452us-gaap:LandImprovementsMembersrt:MaximumMember2020-01-012020-12-310000943452us-gaap:BuildingAndBuildingImprovementsMembersrt:MinimumMember2020-01-012020-12-310000943452us-gaap:BuildingAndBuildingImprovementsMembersrt:MaximumMember2020-01-012020-12-310000943452us-gaap:MachineryAndEquipmentMembersrt:MinimumMember2020-01-012020-12-310000943452us-gaap:MachineryAndEquipmentMembersrt:MaximumMember2020-01-012020-12-310000943452us-gaap:ValuationTechniqueDiscountedCashFlowMember2020-01-012020-12-310000943452us-gaap:MarketApproachValuationTechniqueMember2020-01-012020-12-310000943452wab:FreightSegmentMember2019-12-310000943452wab:TransitSegmentMember2019-12-310000943452wab:FreightSegmentMember2020-01-012020-12-310000943452wab:TransitSegmentMember2020-01-012020-12-310000943452wab:FreightSegmentMember2020-12-310000943452wab:TransitSegmentMember2020-12-310000943452us-gaap:TradeNamesMember2020-01-012020-12-310000943452wab:IntellectualPropertyPatentsAndOtherMember2020-12-310000943452wab:IntellectualPropertyPatentsAndOtherMember2019-12-310000943452us-gaap:OrderOrProductionBacklogMember2020-12-310000943452us-gaap:OrderOrProductionBacklogMember2019-12-310000943452us-gaap:CustomerRelationshipsMember2020-12-310000943452us-gaap:CustomerRelationshipsMember2019-12-310000943452us-gaap:OrderOrProductionBacklogMember2020-01-012020-12-310000943452us-gaap:IntellectualPropertyMember2020-01-012020-12-310000943452us-gaap:CustomerRelationshipsMember2020-01-012020-12-310000943452us-gaap:OtherIntangibleAssetsMember2020-01-012020-12-310000943452us-gaap:LineOfCreditMemberus-gaap:RevolvingCreditFacilityMemberwab:USDollarDenominatedTermLoansMember2020-12-310000943452us-gaap:LineOfCreditMemberus-gaap:RevolvingCreditFacilityMemberwab:USDollarDenominatedTermLoansMember2019-12-310000943452us-gaap:LineOfCreditMemberus-gaap:RevolvingCreditFacilityMemberus-gaap:EstimateOfFairValueFairValueDisclosureMemberwab:USDollarDenominatedTermLoansMember2020-12-310000943452us-gaap:LineOfCreditMemberus-gaap:RevolvingCreditFacilityMemberus-gaap:EstimateOfFairValueFairValueDisclosureMemberwab:USDollarDenominatedTermLoansMember2019-12-310000943452us-gaap:LineOfCreditMemberus-gaap:RevolvingCreditFacilityMemberwab:MultiCurrencyRevolvingLoanFacilityMember2020-12-310000943452us-gaap:LineOfCreditMemberus-gaap:RevolvingCreditFacilityMemberwab:MultiCurrencyRevolvingLoanFacilityMember2019-12-310000943452us-gaap:LineOfCreditMemberus-gaap:RevolvingCreditFacilityMemberwab:MultiCurrencyRevolvingLoanFacilityMemberus-gaap:EstimateOfFairValueFairValueDisclosureMember2020-12-310000943452us-gaap:LineOfCreditMemberus-gaap:RevolvingCreditFacilityMemberwab:MultiCurrencyRevolvingLoanFacilityMemberus-gaap:EstimateOfFairValueFairValueDisclosureMember2019-12-310000943452wab:FloatingRateNotesDue2021Memberus-gaap:SeniorNotesMember2020-12-310000943452wab:FloatingRateNotesDue2021Memberus-gaap:SeniorNotesMember2019-12-310000943452wab:FloatingRateNotesDue2021Memberus-gaap:EstimateOfFairValueFairValueDisclosureMemberus-gaap:SeniorNotesMember2020-12-310000943452wab:FloatingRateNotesDue2021Memberus-gaap:EstimateOfFairValueFairValueDisclosureMemberus-gaap:SeniorNotesMember2019-12-310000943452wab:A4375PercentSeniorNotesDueTwoThousandAndTwentyThreeMemberus-gaap:SeniorNotesMember2020-12-310000943452wab:A4375PercentSeniorNotesDueTwoThousandAndTwentyThreeMemberus-gaap:SeniorNotesMember2019-12-310000943452wab:A4375PercentSeniorNotesDueTwoThousandAndTwentyThreeMemberus-gaap:EstimateOfFairValueFairValueDisclosureMemberus-gaap:SeniorNotesMember2020-12-310000943452wab:A4375PercentSeniorNotesDueTwoThousandAndTwentyThreeMemberus-gaap:EstimateOfFairValueFairValueDisclosureMemberus-gaap:SeniorNotesMember2019-12-310000943452wab:A4150PercentSeniorNotesDueTwoThousandAndTwentyFourMemberus-gaap:SeniorNotesMember2020-12-310000943452wab:A4150PercentSeniorNotesDueTwoThousandAndTwentyFourMemberus-gaap:SeniorNotesMember2019-12-310000943452wab:A4150PercentSeniorNotesDueTwoThousandAndTwentyFourMemberus-gaap:EstimateOfFairValueFairValueDisclosureMemberus-gaap:SeniorNotesMember2020-12-310000943452wab:A4150PercentSeniorNotesDueTwoThousandAndTwentyFourMemberus-gaap:EstimateOfFairValueFairValueDisclosureMemberus-gaap:SeniorNotesMember2019-12-310000943452wab:A32000PercentSeniorNotesDueTwoThousandAndTwentyFiveMemberus-gaap:SeniorNotesMember2020-12-310000943452wab:A32000PercentSeniorNotesDueTwoThousandAndTwentyFiveMemberus-gaap:SeniorNotesMember2019-12-310000943452wab:A32000PercentSeniorNotesDueTwoThousandAndTwentyFiveMemberus-gaap:EstimateOfFairValueFairValueDisclosureMemberus-gaap:SeniorNotesMember2020-12-310000943452wab:A32000PercentSeniorNotesDueTwoThousandAndTwentyFiveMemberus-gaap:EstimateOfFairValueFairValueDisclosureMemberus-gaap:SeniorNotesMember2019-12-310000943452wab:A3.45PercentSeniorNotesDueTwoThousandandTwentySixMemberus-gaap:SeniorNotesMember2020-12-310000943452wab:A3.45PercentSeniorNotesDueTwoThousandandTwentySixMemberus-gaap:SeniorNotesMember2019-12-310000943452wab:A3.45PercentSeniorNotesDueTwoThousandandTwentySixMemberus-gaap:EstimateOfFairValueFairValueDisclosureMemberus-gaap:SeniorNotesMember2020-12-310000943452wab:A3.45PercentSeniorNotesDueTwoThousandandTwentySixMemberus-gaap:EstimateOfFairValueFairValueDisclosureMemberus-gaap:SeniorNotesMember2019-12-310000943452wab:A470PercentSeniorNotesDueTwoThousandAndTwentySixMemberus-gaap:SeniorNotesMember2020-12-310000943452wab:A470PercentSeniorNotesDueTwoThousandAndTwentySixMemberus-gaap:SeniorNotesMember2019-12-310000943452wab:A470PercentSeniorNotesDueTwoThousandAndTwentySixMemberus-gaap:EstimateOfFairValueFairValueDisclosureMemberus-gaap:SeniorNotesMember2020-12-310000943452wab:A470PercentSeniorNotesDueTwoThousandAndTwentySixMemberus-gaap:EstimateOfFairValueFairValueDisclosureMemberus-gaap:SeniorNotesMember2019-12-310000943452us-gaap:OtherDebtSecuritiesMember2020-12-310000943452us-gaap:OtherDebtSecuritiesMemberus-gaap:EstimateOfFairValueFairValueDisclosureMember2020-12-310000943452us-gaap:OtherDebtSecuritiesMember2019-12-310000943452us-gaap:OtherDebtSecuritiesMemberus-gaap:EstimateOfFairValueFairValueDisclosureMember2019-12-310000943452us-gaap:EstimateOfFairValueFairValueDisclosureMember2020-12-310000943452us-gaap:EstimateOfFairValueFairValueDisclosureMember2019-12-310000943452us-gaap:LineOfCreditMemberus-gaap:RevolvingCreditFacilityMemberwab:TwoThousandandEighteenRefinancingAgreementMember2018-06-080000943452us-gaap:LineOfCreditMemberwab:TwoThousandandEighteenRefinancingAgreementMemberwab:SwingLineSubFacilityMember2018-06-080000943452us-gaap:LineOfCreditMemberus-gaap:LetterOfCreditMemberwab:TwoThousandandEighteenRefinancingAgreementMember2018-06-080000943452wab:TwoThousandandEighteenRefinancingAgreementMember2020-01-012020-12-310000943452us-gaap:LineOfCreditMember2020-04-100000943452us-gaap:LineOfCreditMember2020-04-102020-04-100000943452us-gaap:LineOfCreditMemberus-gaap:RevolvingCreditFacilityMember2020-04-100000943452us-gaap:LineOfCreditMemberwab:TermLoanMember2020-04-100000943452us-gaap:RevolvingCreditFacilityMemberwab:TwoThousandandEighteenRefinancingAgreementMember2020-12-310000943452us-gaap:RevolvingCreditFacilityMember2020-12-310000943452us-gaap:LineOfCreditMemberus-gaap:RevolvingCreditFacilityMemberwab:TwoThousandandEighteenRefinancingAgreementMember2020-12-310000943452us-gaap:LineOfCreditMemberus-gaap:RevolvingCreditFacilityMember2020-12-310000943452us-gaap:SeniorNotesMember2020-01-012020-12-310000943452wab:A32000PercentSeniorNotesDueTwoThousandAndTwentyFiveMemberus-gaap:SeniorNotesMember2020-06-290000943452wab:A32000PercentSeniorNotesDueTwoThousandAndTwentyFiveMemberus-gaap:SeniorNotesMember2020-06-292020-06-290000943452us-gaap:PensionPlansDefinedBenefitMember2020-01-012020-12-310000943452us-gaap:PensionPlansDefinedBenefitMembercountry:US2019-12-310000943452us-gaap:PensionPlansDefinedBenefitMembercountry:US2018-12-310000943452us-gaap:PensionPlansDefinedBenefitMemberus-gaap:ForeignPlanMember2019-12-310000943452us-gaap:PensionPlansDefinedBenefitMemberus-gaap:ForeignPlanMember2018-12-310000943452us-gaap:PensionPlansDefinedBenefitMembercountry:US2020-01-012020-12-310000943452us-gaap:PensionPlansDefinedBenefitMembercountry:US2019-01-012019-12-310000943452us-gaap:PensionPlansDefinedBenefitMemberus-gaap:ForeignPlanMember2020-01-012020-12-310000943452us-gaap:PensionPlansDefinedBenefitMemberus-gaap:ForeignPlanMember2019-01-012019-12-310000943452us-gaap:PensionPlansDefinedBenefitMembercountry:US2020-12-310000943452us-gaap:PensionPlansDefinedBenefitMemberus-gaap:ForeignPlanMember2020-12-310000943452us-gaap:PensionPlansDefinedBenefitMembercountry:US2018-01-012018-12-310000943452us-gaap:PensionPlansDefinedBenefitMemberus-gaap:ForeignPlanMember2018-01-012018-12-310000943452us-gaap:PensionPlansDefinedBenefitMembercountry:USus-gaap:DefinedBenefitPlanEquitySecuritiesMember2020-12-310000943452us-gaap:PensionPlansDefinedBenefitMembercountry:USus-gaap:DefinedBenefitPlanEquitySecuritiesMember2019-12-310000943452us-gaap:PensionPlansDefinedBenefitMemberus-gaap:ForeignPlanMemberus-gaap:DefinedBenefitPlanEquitySecuritiesMember2020-12-310000943452us-gaap:PensionPlansDefinedBenefitMemberus-gaap:ForeignPlanMemberus-gaap:DefinedBenefitPlanEquitySecuritiesMember2019-12-310000943452us-gaap:PensionPlansDefinedBenefitMembercountry:USus-gaap:DefinedBenefitPlanDebtSecurityMember2020-12-310000943452us-gaap:PensionPlansDefinedBenefitMembercountry:USus-gaap:DefinedBenefitPlanDebtSecurityMember2019-12-310000943452us-gaap:PensionPlansDefinedBenefitMemberus-gaap:ForeignPlanMemberus-gaap:DefinedBenefitPlanDebtSecurityMember2020-12-310000943452us-gaap:PensionPlansDefinedBenefitMemberus-gaap:ForeignPlanMemberus-gaap:DefinedBenefitPlanDebtSecurityMember2019-12-310000943452us-gaap:PensionPlansDefinedBenefitMemberus-gaap:DefinedBenefitPlanCashAndCashEquivalentsMembercountry:US2020-12-310000943452us-gaap:PensionPlansDefinedBenefitMemberus-gaap:DefinedBenefitPlanCashAndCashEquivalentsMembercountry:US2019-12-310000943452us-gaap:PensionPlansDefinedBenefitMemberus-gaap:ForeignPlanMemberus-gaap:DefinedBenefitPlanCashAndCashEquivalentsMember2020-12-310000943452us-gaap:PensionPlansDefinedBenefitMemberus-gaap:ForeignPlanMemberus-gaap:DefinedBenefitPlanCashAndCashEquivalentsMember2019-12-310000943452us-gaap:PensionPlansDefinedBenefitMemberus-gaap:OtherInvestmentsMemberus-gaap:ForeignPlanMember2020-12-310000943452us-gaap:DefinedBenefitPlanEquitySecuritiesUsMemberus-gaap:FairValueMeasuredAtNetAssetValuePerShareMember2020-12-310000943452us-gaap:DefinedBenefitPlanEquitySecuritiesUsMemberus-gaap:FairValueInputsLevel1Member2020-12-310000943452us-gaap:DefinedBenefitPlanEquitySecuritiesUsMemberus-gaap:FairValueInputsLevel2Member2020-12-310000943452us-gaap:DefinedBenefitPlanEquitySecuritiesUsMemberus-gaap:FairValueInputsLevel3Member2020-12-310000943452us-gaap:DefinedBenefitPlanEquitySecuritiesUsMember2020-12-310000943452us-gaap:FairValueMeasuredAtNetAssetValuePerShareMemberwab:DefinedBenefitPlanDebtSecurityAndOtherUSMember2020-12-310000943452us-gaap:FairValueInputsLevel1Memberwab:DefinedBenefitPlanDebtSecurityAndOtherUSMember2020-12-310000943452us-gaap:FairValueInputsLevel2Memberwab:DefinedBenefitPlanDebtSecurityAndOtherUSMember2020-12-310000943452us-gaap:FairValueInputsLevel3Memberwab:DefinedBenefitPlanDebtSecurityAndOtherUSMember2020-12-310000943452wab:DefinedBenefitPlanDebtSecurityAndOtherUSMember2020-12-310000943452us-gaap:FairValueMeasuredAtNetAssetValuePerShareMemberwab:DefinedBenefitPlanCashAndCashEquivalentsUSMember2020-12-310000943452us-gaap:FairValueInputsLevel1Memberwab:DefinedBenefitPlanCashAndCashEquivalentsUSMember2020-12-310000943452us-gaap:FairValueInputsLevel2Memberwab:DefinedBenefitPlanCashAndCashEquivalentsUSMember2020-12-310000943452us-gaap:FairValueInputsLevel3Memberwab:DefinedBenefitPlanCashAndCashEquivalentsUSMember2020-12-310000943452wab:DefinedBenefitPlanCashAndCashEquivalentsUSMember2020-12-310000943452us-gaap:DefinedBenefitPlanEquitySecuritiesNonUsMemberus-gaap:FairValueMeasuredAtNetAssetValuePerShareMember2020-12-310000943452us-gaap:DefinedBenefitPlanEquitySecuritiesNonUsMemberus-gaap:FairValueInputsLevel1Member2020-12-310000943452us-gaap:DefinedBenefitPlanEquitySecuritiesNonUsMemberus-gaap:FairValueInputsLevel2Member2020-12-310000943452us-gaap:DefinedBenefitPlanEquitySecuritiesNonUsMemberus-gaap:FairValueInputsLevel3Member2020-12-310000943452us-gaap:DefinedBenefitPlanEquitySecuritiesNonUsMember2020-12-310000943452us-gaap:FairValueMeasuredAtNetAssetValuePerShareMemberwab:DefinedBenefitPlanDebtSecuritiesAndOtherNonUSMember2020-12-310000943452us-gaap:FairValueInputsLevel1Memberwab:DefinedBenefitPlanDebtSecuritiesAndOtherNonUSMember2020-12-310000943452us-gaap:FairValueInputsLevel2Memberwab:DefinedBenefitPlanDebtSecuritiesAndOtherNonUSMember2020-12-310000943452us-gaap:FairValueInputsLevel3Memberwab:DefinedBenefitPlanDebtSecuritiesAndOtherNonUSMember2020-12-310000943452wab:DefinedBenefitPlanDebtSecuritiesAndOtherNonUSMember2020-12-310000943452us-gaap:FairValueMeasuredAtNetAssetValuePerShareMemberwab:InsuranceContractsMember2020-12-310000943452us-gaap:FairValueInputsLevel1Memberwab:InsuranceContractsMember2020-12-310000943452wab:InsuranceContractsMemberus-gaap:FairValueInputsLevel2Member2020-12-310000943452wab:InsuranceContractsMemberus-gaap:FairValueInputsLevel3Member2020-12-310000943452wab:InsuranceContractsMember2020-12-310000943452wab:DefinedBenefitPlanCashAndCashEquivalentsNonUSMemberus-gaap:FairValueMeasuredAtNetAssetValuePerShareMember2020-12-310000943452wab:DefinedBenefitPlanCashAndCashEquivalentsNonUSMemberus-gaap:FairValueInputsLevel1Member2020-12-310000943452wab:DefinedBenefitPlanCashAndCashEquivalentsNonUSMemberus-gaap:FairValueInputsLevel2Member2020-12-310000943452wab:DefinedBenefitPlanCashAndCashEquivalentsNonUSMemberus-gaap:FairValueInputsLevel3Member2020-12-310000943452wab:DefinedBenefitPlanCashAndCashEquivalentsNonUSMember2020-12-310000943452us-gaap:FairValueMeasuredAtNetAssetValuePerShareMember2020-12-310000943452us-gaap:FairValueInputsLevel1Member2020-12-310000943452us-gaap:FairValueInputsLevel2Member2020-12-310000943452us-gaap:FairValueInputsLevel3Member2020-12-310000943452us-gaap:DefinedBenefitPlanEquitySecuritiesUsMemberus-gaap:FairValueMeasuredAtNetAssetValuePerShareMember2019-12-310000943452us-gaap:DefinedBenefitPlanEquitySecuritiesUsMemberus-gaap:FairValueInputsLevel1Member2019-12-310000943452us-gaap:DefinedBenefitPlanEquitySecuritiesUsMemberus-gaap:FairValueInputsLevel2Member2019-12-310000943452us-gaap:DefinedBenefitPlanEquitySecuritiesUsMemberus-gaap:FairValueInputsLevel3Member2019-12-310000943452us-gaap:DefinedBenefitPlanEquitySecuritiesUsMember2019-12-310000943452us-gaap:FairValueMeasuredAtNetAssetValuePerShareMemberwab:DefinedBenefitPlanDebtSecurityAndOtherUSMember2019-12-310000943452us-gaap:FairValueInputsLevel1Memberwab:DefinedBenefitPlanDebtSecurityAndOtherUSMember2019-12-310000943452us-gaap:FairValueInputsLevel2Memberwab:DefinedBenefitPlanDebtSecurityAndOtherUSMember2019-12-310000943452us-gaap:FairValueInputsLevel3Memberwab:DefinedBenefitPlanDebtSecurityAndOtherUSMember2019-12-310000943452wab:DefinedBenefitPlanDebtSecurityAndOtherUSMember2019-12-310000943452us-gaap:FairValueMeasuredAtNetAssetValuePerShareMemberwab:DefinedBenefitPlanCashAndCashEquivalentsUSMember2019-12-310000943452us-gaap:FairValueInputsLevel1Memberwab:DefinedBenefitPlanCashAndCashEquivalentsUSMember2019-12-310000943452us-gaap:FairValueInputsLevel2Memberwab:DefinedBenefitPlanCashAndCashEquivalentsUSMember2019-12-310000943452us-gaap:FairValueInputsLevel3Memberwab:DefinedBenefitPlanCashAndCashEquivalentsUSMember2019-12-310000943452wab:DefinedBenefitPlanCashAndCashEquivalentsUSMember2019-12-310000943452us-gaap:DefinedBenefitPlanEquitySecuritiesNonUsMemberus-gaap:FairValueMeasuredAtNetAssetValuePerShareMember2019-12-310000943452us-gaap:DefinedBenefitPlanEquitySecuritiesNonUsMemberus-gaap:FairValueInputsLevel1Member2019-12-310000943452us-gaap:DefinedBenefitPlanEquitySecuritiesNonUsMemberus-gaap:FairValueInputsLevel2Member2019-12-310000943452us-gaap:DefinedBenefitPlanEquitySecuritiesNonUsMemberus-gaap:FairValueInputsLevel3Member2019-12-310000943452us-gaap:DefinedBenefitPlanEquitySecuritiesNonUsMember2019-12-310000943452us-gaap:FairValueMeasuredAtNetAssetValuePerShareMemberwab:DefinedBenefitPlanDebtSecuritiesAndOtherNonUSMember2019-12-310000943452us-gaap:FairValueInputsLevel1Memberwab:DefinedBenefitPlanDebtSecuritiesAndOtherNonUSMember2019-12-310000943452us-gaap:FairValueInputsLevel2Memberwab:DefinedBenefitPlanDebtSecuritiesAndOtherNonUSMember2019-12-310000943452us-gaap:FairValueInputsLevel3Memberwab:DefinedBenefitPlanDebtSecuritiesAndOtherNonUSMember2019-12-310000943452wab:DefinedBenefitPlanDebtSecuritiesAndOtherNonUSMember2019-12-310000943452us-gaap:FairValueMeasuredAtNetAssetValuePerShareMemberwab:InsuranceContractsMember2019-12-310000943452us-gaap:FairValueInputsLevel1Memberwab:InsuranceContractsMember2019-12-310000943452wab:InsuranceContractsMemberus-gaap:FairValueInputsLevel2Member2019-12-310000943452wab:InsuranceContractsMemberus-gaap:FairValueInputsLevel3Member2019-12-310000943452wab:InsuranceContractsMember2019-12-310000943452wab:DefinedBenefitPlanCashAndCashEquivalentsNonUSMemberus-gaap:FairValueMeasuredAtNetAssetValuePerShareMember2019-12-310000943452wab:DefinedBenefitPlanCashAndCashEquivalentsNonUSMemberus-gaap:FairValueInputsLevel1Member2019-12-310000943452wab:DefinedBenefitPlanCashAndCashEquivalentsNonUSMemberus-gaap:FairValueInputsLevel2Member2019-12-310000943452wab:DefinedBenefitPlanCashAndCashEquivalentsNonUSMemberus-gaap:FairValueInputsLevel3Member2019-12-310000943452wab:DefinedBenefitPlanCashAndCashEquivalentsNonUSMember2019-12-310000943452us-gaap:FairValueMeasuredAtNetAssetValuePerShareMember2019-12-310000943452us-gaap:FairValueInputsLevel1Member2019-12-310000943452us-gaap:FairValueInputsLevel2Member2019-12-310000943452us-gaap:FairValueInputsLevel3Member2019-12-310000943452us-gaap:PensionPlansDefinedBenefitMemberus-gaap:FairValueInputsLevel3Member2018-12-310000943452us-gaap:PensionPlansDefinedBenefitMemberus-gaap:FairValueInputsLevel3Member2019-01-012019-12-310000943452us-gaap:PensionPlansDefinedBenefitMemberus-gaap:FairValueInputsLevel3Member2019-12-310000943452us-gaap:PensionPlansDefinedBenefitMemberus-gaap:FairValueInputsLevel3Member2020-01-012020-12-310000943452us-gaap:PensionPlansDefinedBenefitMemberus-gaap:FairValueInputsLevel3Member2020-12-310000943452wab:PlanTwoThousandElevenMember2020-12-310000943452us-gaap:EmployeeStockOptionMemberwab:DirectorsPlanMember2020-12-310000943452us-gaap:EmployeeStockOptionMemberwab:DirectorsPlanMember2020-01-012020-12-310000943452wab:DirectorsPlanMemberus-gaap:RestrictedStockMember2020-01-012020-12-310000943452wab:DirectorsPlanMemberus-gaap:RestrictedStockMember2019-01-012019-12-310000943452wab:DirectorsPlanMemberus-gaap:RestrictedStockMember2018-01-012018-12-310000943452wab:DirectorsPlanMember2020-01-012020-12-310000943452us-gaap:EmployeeStockOptionMember2020-01-012020-12-310000943452wab:NonVestedRestrictedStockMember2020-01-012020-12-310000943452us-gaap:RestrictedStockUnitsRSUMember2020-01-012020-12-310000943452us-gaap:PerformanceSharesMember2020-01-012020-12-310000943452us-gaap:EmployeeStockOptionMemberwab:PlanTwoThousandMember2020-01-012020-12-310000943452us-gaap:EmployeeStockOptionMemberwab:PlanTwoThousandElevenMember2020-01-012020-12-3100009434522017-01-012017-12-310000943452wab:ExercisePriceRangeOneMember2020-01-012020-12-310000943452wab:ExercisePriceRangeOneMember2020-12-310000943452wab:ExercisePriceRangeTwoMember2020-01-012020-12-310000943452wab:ExercisePriceRangeTwoMember2020-12-310000943452wab:ExercisePriceRangeThreeMember2020-01-012020-12-310000943452wab:ExercisePriceRangeThreeMember2020-12-310000943452wab:ExercisePriceRangeFourMember2020-01-012020-12-310000943452wab:ExercisePriceRangeFourMember2020-12-310000943452wab:ExercisePriceRangeFiveMember2020-01-012020-12-310000943452wab:ExercisePriceRangeFiveMember2020-12-310000943452wab:PlanTwoThousandMemberus-gaap:RestrictedStockMember2020-01-012020-12-310000943452wab:PlanTwoThousandElevenMemberus-gaap:RestrictedStockMember2020-01-012020-12-310000943452us-gaap:RestrictedStockUnitsRSUMemberwab:DirectorsPlanMember2020-01-012020-12-310000943452us-gaap:PerformanceSharesMembersrt:MinimumMember2020-01-012020-12-310000943452us-gaap:PerformanceSharesMembersrt:MaximumMember2020-01-012020-12-310000943452us-gaap:PerformanceSharesMembersrt:ScenarioForecastMember2021-01-012021-12-310000943452us-gaap:PerformanceSharesMembersrt:ScenarioForecastMember2022-01-012022-12-310000943452wab:RestrictedStockAndUnitsMember2017-12-310000943452us-gaap:PerformanceSharesMember2017-12-310000943452wab:RestrictedStockAndUnitsMember2018-01-012018-12-310000943452us-gaap:PerformanceSharesMember2018-01-012018-12-310000943452wab:RestrictedStockAndUnitsMember2018-12-310000943452us-gaap:PerformanceSharesMember2018-12-310000943452wab:RestrictedStockAndUnitsMember2019-01-012019-12-310000943452us-gaap:PerformanceSharesMember2019-01-012019-12-310000943452wab:RestrictedStockAndUnitsMember2019-12-310000943452us-gaap:PerformanceSharesMember2019-12-310000943452wab:RestrictedStockAndUnitsMember2020-01-012020-12-310000943452wab:RestrictedStockAndUnitsMember2020-12-310000943452us-gaap:PerformanceSharesMember2020-12-310000943452us-gaap:AccumulatedTranslationAdjustmentMember2020-12-310000943452us-gaap:AccumulatedTranslationAdjustmentMember2019-12-310000943452us-gaap:AccumulatedGainLossNetCashFlowHedgeParentMember2020-12-310000943452us-gaap:AccumulatedGainLossNetCashFlowHedgeParentMember2019-12-310000943452us-gaap:AccumulatedDefinedBenefitPlansAdjustmentMember2020-12-310000943452us-gaap:AccumulatedDefinedBenefitPlansAdjustmentMember2019-12-310000943452us-gaap:AccumulatedTranslationAdjustmentMember2020-01-012020-12-310000943452us-gaap:AccumulatedGainLossNetCashFlowHedgeParentMember2020-01-012020-12-310000943452us-gaap:AccumulatedDefinedBenefitPlansAdjustmentMember2020-01-012020-12-310000943452us-gaap:ReclassificationOutOfAccumulatedOtherComprehensiveIncomeMemberus-gaap:AccumulatedDefinedBenefitPlansAdjustmentNetPriorServiceCostCreditMember2020-01-012020-12-310000943452us-gaap:ReclassificationOutOfAccumulatedOtherComprehensiveIncomeMemberus-gaap:AccumulatedDefinedBenefitPlansAdjustmentNetUnamortizedGainLossMember2020-01-012020-12-310000943452us-gaap:ReclassificationOutOfAccumulatedOtherComprehensiveIncomeMemberus-gaap:AccumulatedDefinedBenefitPlansAdjustmentMember2020-01-012020-12-310000943452us-gaap:AccumulatedTranslationAdjustmentMember2018-12-310000943452us-gaap:AccumulatedGainLossNetCashFlowHedgeParentMember2018-12-310000943452us-gaap:AccumulatedDefinedBenefitPlansAdjustmentMember2018-12-310000943452us-gaap:AccumulatedTranslationAdjustmentMember2019-01-012019-12-310000943452us-gaap:AccumulatedGainLossNetCashFlowHedgeParentMember2019-01-012019-12-310000943452us-gaap:AccumulatedDefinedBenefitPlansAdjustmentMember2019-01-012019-12-310000943452us-gaap:ReclassificationOutOfAccumulatedOtherComprehensiveIncomeMemberus-gaap:AccumulatedDefinedBenefitPlansAdjustmentNetPriorServiceCostCreditMember2019-01-012019-12-310000943452us-gaap:ReclassificationOutOfAccumulatedOtherComprehensiveIncomeMemberus-gaap:AccumulatedDefinedBenefitPlansAdjustmentNetUnamortizedGainLossMember2019-01-012019-12-310000943452us-gaap:ReclassificationOutOfAccumulatedOtherComprehensiveIncomeMemberus-gaap:AccumulatedDefinedBenefitPlansAdjustmentMember2019-01-012019-12-310000943452srt:MinimumMember2020-12-310000943452srt:MaximumMember2020-12-310000943452us-gaap:ForeignExchangeForwardMemberus-gaap:NondesignatedMember2020-01-012020-12-310000943452us-gaap:ForeignExchangeContractMemberus-gaap:DesignatedAsHedgingInstrumentMemberus-gaap:OtherCurrentAssetsMember2020-12-310000943452us-gaap:NondesignatedMemberus-gaap:ForeignExchangeContractMemberus-gaap:OtherCurrentAssetsMember2020-12-310000943452us-gaap:OtherCurrentLiabilitiesMemberus-gaap:ForeignExchangeContractMemberus-gaap:DesignatedAsHedgingInstrumentMember2020-12-310000943452us-gaap:NondesignatedMemberus-gaap:OtherCurrentLiabilitiesMemberus-gaap:ForeignExchangeContractMember2020-12-310000943452us-gaap:CurrencySwapMemberus-gaap:DesignatedAsHedgingInstrumentMemberus-gaap:OtherCurrentAssetsMember2020-12-310000943452us-gaap:CurrencySwapMemberus-gaap:NondesignatedMemberus-gaap:OtherCurrentAssetsMember2020-12-310000943452us-gaap:CurrencySwapMemberus-gaap:OtherCurrentLiabilitiesMemberus-gaap:DesignatedAsHedgingInstrumentMember2020-12-310000943452us-gaap:CurrencySwapMemberus-gaap:NondesignatedMemberus-gaap:OtherCurrentLiabilitiesMember2020-12-310000943452us-gaap:DesignatedAsHedgingInstrumentMember2020-12-310000943452us-gaap:NondesignatedMember2020-12-310000943452us-gaap:ForeignExchangeContractMemberus-gaap:DesignatedAsHedgingInstrumentMemberus-gaap:OtherCurrentAssetsMember2019-12-310000943452us-gaap:NondesignatedMemberus-gaap:ForeignExchangeContractMemberus-gaap:OtherCurrentAssetsMember2019-12-310000943452us-gaap:OtherCurrentLiabilitiesMemberus-gaap:ForeignExchangeContractMemberus-gaap:DesignatedAsHedgingInstrumentMember2019-12-310000943452us-gaap:NondesignatedMemberus-gaap:OtherCurrentLiabilitiesMemberus-gaap:ForeignExchangeContractMember2019-12-310000943452us-gaap:CurrencySwapMemberus-gaap:DesignatedAsHedgingInstrumentMemberus-gaap:OtherCurrentAssetsMember2019-12-310000943452us-gaap:CurrencySwapMemberus-gaap:NondesignatedMemberus-gaap:OtherCurrentAssetsMember2019-12-310000943452us-gaap:CurrencySwapMemberus-gaap:OtherCurrentLiabilitiesMemberus-gaap:DesignatedAsHedgingInstrumentMember2019-12-310000943452us-gaap:CurrencySwapMemberus-gaap:NondesignatedMemberus-gaap:OtherCurrentLiabilitiesMember2019-12-310000943452us-gaap:DesignatedAsHedgingInstrumentMember2019-12-310000943452us-gaap:NondesignatedMember2019-12-310000943452us-gaap:ForeignExchangeContractMember2020-12-310000943452us-gaap:FairValueInputsLevel1Memberus-gaap:ForeignExchangeContractMember2020-12-310000943452us-gaap:ForeignExchangeContractMemberus-gaap:FairValueInputsLevel2Member2020-12-310000943452us-gaap:ForeignExchangeContractMemberus-gaap:FairValueInputsLevel3Member2020-12-310000943452us-gaap:CurrencySwapMember2020-12-310000943452us-gaap:CurrencySwapMemberus-gaap:FairValueInputsLevel1Member2020-12-310000943452us-gaap:CurrencySwapMemberus-gaap:FairValueInputsLevel2Member2020-12-310000943452us-gaap:CurrencySwapMemberus-gaap:FairValueInputsLevel3Member2020-12-310000943452us-gaap:ForeignExchangeContractMember2019-12-310000943452us-gaap:FairValueInputsLevel1Memberus-gaap:ForeignExchangeContractMember2019-12-310000943452us-gaap:ForeignExchangeContractMemberus-gaap:FairValueInputsLevel2Member2019-12-310000943452us-gaap:ForeignExchangeContractMemberus-gaap:FairValueInputsLevel3Member2019-12-310000943452us-gaap:CurrencySwapMember2019-12-310000943452us-gaap:CurrencySwapMemberus-gaap:FairValueInputsLevel1Member2019-12-310000943452us-gaap:CurrencySwapMemberus-gaap:FairValueInputsLevel2Member2019-12-310000943452us-gaap:CurrencySwapMemberus-gaap:FairValueInputsLevel3Member2019-12-310000943452wab:OtherAccruedLiabilitiesMemberwab:GeneralElectricCompanyMemberus-gaap:FairValueInputsLevel3Member2020-12-310000943452srt:SubsidiariesMemberus-gaap:ThreatenedLitigationMemberwab:DenverTransitInstallationofConstantWirelessCrossingsMember2017-09-082017-09-08wab:claim0000943452us-gaap:PendingLitigationMember2020-12-31wab:segment0000943452wab:FreightSegmentMemberwab:CorporateAndEliminationsMember2020-01-012020-12-310000943452wab:TransitSegmentMemberwab:CorporateAndEliminationsMember2020-01-012020-12-310000943452wab:CorporateAndEliminationsMember2020-01-012020-12-310000943452wab:FreightSegmentMemberus-gaap:OperatingSegmentsMember2020-01-012020-12-310000943452wab:TransitSegmentMemberus-gaap:OperatingSegmentsMember2020-01-012020-12-310000943452wab:FreightSegmentMemberus-gaap:OperatingSegmentsMember2020-12-310000943452wab:TransitSegmentMemberus-gaap:OperatingSegmentsMember2020-12-310000943452wab:CorporateAndEliminationsMember2020-12-310000943452wab:FreightSegmentMember2019-01-012019-12-310000943452wab:TransitSegmentMember2019-01-012019-12-310000943452wab:FreightSegmentMemberwab:CorporateAndEliminationsMember2019-01-012019-12-310000943452wab:TransitSegmentMemberwab:CorporateAndEliminationsMember2019-01-012019-12-310000943452wab:CorporateAndEliminationsMember2019-01-012019-12-310000943452wab:FreightSegmentMemberus-gaap:OperatingSegmentsMember2019-01-012019-12-310000943452wab:TransitSegmentMemberus-gaap:OperatingSegmentsMember2019-01-012019-12-310000943452wab:FreightSegmentMemberus-gaap:OperatingSegmentsMember2019-12-310000943452wab:TransitSegmentMemberus-gaap:OperatingSegmentsMember2019-12-310000943452wab:CorporateAndEliminationsMember2019-12-310000943452wab:FreightSegmentMember2018-01-012018-12-310000943452wab:TransitSegmentMember2018-01-012018-12-310000943452wab:FreightSegmentMemberwab:CorporateAndEliminationsMember2018-01-012018-12-310000943452wab:TransitSegmentMemberwab:CorporateAndEliminationsMember2018-01-012018-12-310000943452wab:CorporateAndEliminationsMember2018-01-012018-12-310000943452wab:FreightSegmentMemberus-gaap:OperatingSegmentsMember2018-01-012018-12-310000943452wab:TransitSegmentMemberus-gaap:OperatingSegmentsMember2018-01-012018-12-310000943452country:US2020-01-012020-12-310000943452country:US2019-01-012019-12-310000943452country:US2018-01-012018-12-310000943452country:US2020-12-310000943452country:US2019-12-310000943452country:CA2020-01-012020-12-310000943452country:CA2019-01-012019-12-310000943452country:CA2018-01-012018-12-310000943452country:CA2020-12-310000943452country:CA2019-12-310000943452country:MX2020-01-012020-12-310000943452country:MX2019-01-012019-12-310000943452country:MX2018-01-012018-12-310000943452country:MX2020-12-310000943452country:MX2019-12-310000943452srt:NorthAmericaMember2020-01-012020-12-310000943452srt:NorthAmericaMember2019-01-012019-12-310000943452srt:NorthAmericaMember2018-01-012018-12-310000943452srt:NorthAmericaMember2020-12-310000943452srt:NorthAmericaMember2019-12-310000943452srt:SouthAmericaMember2020-01-012020-12-310000943452srt:SouthAmericaMember2019-01-012019-12-310000943452srt:SouthAmericaMember2018-01-012018-12-310000943452srt:SouthAmericaMember2020-12-310000943452srt:SouthAmericaMember2019-12-310000943452country:GB2020-01-012020-12-310000943452country:GB2019-01-012019-12-310000943452country:GB2018-01-012018-12-310000943452country:GB2020-12-310000943452country:GB2019-12-310000943452country:DE2020-01-012020-12-310000943452country:DE2019-01-012019-12-310000943452country:DE2018-01-012018-12-310000943452country:DE2020-12-310000943452country:DE2019-12-310000943452country:FR2020-01-012020-12-310000943452country:FR2019-01-012019-12-310000943452country:FR2018-01-012018-12-310000943452country:FR2020-12-310000943452country:FR2019-12-310000943452country:IT2020-01-012020-12-310000943452country:IT2019-01-012019-12-310000943452country:IT2018-01-012018-12-310000943452country:IT2020-12-310000943452country:IT2019-12-310000943452country:CH2020-01-012020-12-310000943452country:CH2019-01-012019-12-310000943452country:CH2018-01-012018-12-310000943452country:CH2020-12-310000943452country:CH2019-12-310000943452wab:OtherEuropeMember2020-01-012020-12-310000943452wab:OtherEuropeMember2019-01-012019-12-310000943452wab:OtherEuropeMember2018-01-012018-12-310000943452wab:OtherEuropeMember2020-12-310000943452wab:OtherEuropeMember2019-12-310000943452srt:EuropeMember2020-01-012020-12-310000943452srt:EuropeMember2019-01-012019-12-310000943452srt:EuropeMember2018-01-012018-12-310000943452srt:EuropeMember2020-12-310000943452srt:EuropeMember2019-12-310000943452country:IN2020-01-012020-12-310000943452country:IN2019-01-012019-12-310000943452country:IN2018-01-012018-12-310000943452country:IN2020-12-310000943452country:IN2019-12-310000943452wab:AustraliaAndNewZealandMember2020-01-012020-12-310000943452wab:AustraliaAndNewZealandMember2019-01-012019-12-310000943452wab:AustraliaAndNewZealandMember2018-01-012018-12-310000943452wab:AustraliaAndNewZealandMember2020-12-310000943452wab:AustraliaAndNewZealandMember2019-12-310000943452country:CN2020-01-012020-12-310000943452country:CN2019-01-012019-12-310000943452country:CN2018-01-012018-12-310000943452country:CN2020-12-310000943452country:CN2019-12-310000943452wab:OtherAsiaAndMiddleEastMember2020-01-012020-12-310000943452wab:OtherAsiaAndMiddleEastMember2019-01-012019-12-310000943452wab:OtherAsiaAndMiddleEastMember2018-01-012018-12-310000943452wab:OtherAsiaAndMiddleEastMember2020-12-310000943452wab:OtherAsiaAndMiddleEastMember2019-12-310000943452country:EG2020-01-012020-12-310000943452country:EG2019-01-012019-12-310000943452country:EG2018-01-012018-12-310000943452country:EG2020-12-310000943452country:EG2019-12-310000943452wab:OtherAfricaMember2020-01-012020-12-310000943452wab:OtherAfricaMember2019-01-012019-12-310000943452wab:OtherAfricaMember2018-01-012018-12-310000943452wab:OtherAfricaMember2020-12-310000943452wab:OtherAfricaMember2019-12-310000943452wab:RussiaAndCISMember2020-01-012020-12-310000943452wab:RussiaAndCISMember2019-01-012019-12-310000943452wab:RussiaAndCISMember2018-01-012018-12-310000943452wab:RussiaAndCISMember2020-12-310000943452wab:RussiaAndCISMember2019-12-310000943452us-gaap:EquipmentMemberwab:FreightSegmentMember2020-01-012020-12-310000943452us-gaap:EquipmentMemberwab:FreightSegmentMember2019-01-012019-12-310000943452us-gaap:EquipmentMemberwab:FreightSegmentMember2018-01-012018-12-310000943452wab:ComponentsMemberwab:FreightSegmentMember2020-01-012020-12-310000943452wab:ComponentsMemberwab:FreightSegmentMember2019-01-012019-12-310000943452wab:ComponentsMemberwab:FreightSegmentMember2018-01-012018-12-310000943452wab:DigitalElectronicsMemberwab:FreightSegmentMember2020-01-012020-12-310000943452wab:DigitalElectronicsMemberwab:FreightSegmentMember2019-01-012019-12-310000943452wab:DigitalElectronicsMemberwab:FreightSegmentMember2018-01-012018-12-310000943452wab:FreightSegmentMemberus-gaap:ServiceMember2020-01-012020-12-310000943452wab:FreightSegmentMemberus-gaap:ServiceMember2019-01-012019-12-310000943452wab:FreightSegmentMemberus-gaap:ServiceMember2018-01-012018-12-310000943452wab:TransitSegmentMemberwab:OEMMember2020-01-012020-12-310000943452wab:TransitSegmentMemberwab:OEMMember2019-01-012019-12-310000943452wab:TransitSegmentMemberwab:OEMMember2018-01-012018-12-310000943452wab:AftermarketMemberwab:TransitSegmentMember2020-01-012020-12-310000943452wab:AftermarketMemberwab:TransitSegmentMember2019-01-012019-12-310000943452wab:AftermarketMemberwab:TransitSegmentMember2018-01-012018-12-310000943452us-gaap:AllowanceForCreditLossMember2019-12-310000943452us-gaap:AllowanceForCreditLossMember2020-01-012020-12-310000943452us-gaap:AllowanceForCreditLossMember2020-12-310000943452us-gaap:ValuationAllowanceTaxCreditCarryforwardMember2019-12-310000943452us-gaap:ValuationAllowanceTaxCreditCarryforwardMember2020-01-012020-12-310000943452us-gaap:ValuationAllowanceTaxCreditCarryforwardMember2020-12-310000943452us-gaap:AllowanceForCreditLossMember2018-12-310000943452us-gaap:AllowanceForCreditLossMember2019-01-012019-12-310000943452us-gaap:ValuationAllowanceTaxCreditCarryforwardMember2018-12-310000943452us-gaap:ValuationAllowanceTaxCreditCarryforwardMember2019-01-012019-12-310000943452us-gaap:AllowanceForCreditLossMember2017-12-310000943452us-gaap:AllowanceForCreditLossMember2018-01-012018-12-310000943452us-gaap:ValuationAllowanceTaxCreditCarryforwardMember2017-12-310000943452us-gaap:ValuationAllowanceTaxCreditCarryforwardMember2018-01-012018-12-31
UNITED STATES
SECURITIES AND EXCHANGE COMMISSION
WASHINGTON, D.C. 20549
FORM 10-K
| | | | | |
| ☒ | Annual Report Pursuant to Section 13 or 15(d) of the Securities Exchange Act of 1934 |
For the fiscal year ended December 31, 2020
OR
| | | | | |
| ☐ | Transition Report Pursuant to Section 13 or 15(d) of the Securities Exchange Act of 1934 |
For the transition period from to
Commission file number 033-90866
WESTINGHOUSE AIR BRAKE TECHNOLOGIES CORPORATION
(Exact name of registrant as specified in its charter)
| | | | | |
| | |
| Delaware | 25-1615902 |
(State or other jurisdiction of
incorporation or organization) | (IRS Employer
Identification No.) |
| | | | | |
30 Isabella Street Pittsburgh, Pennsylvania 15212 | (412) 825-1000 |
| (Address of principal executive offices, including zip code) | (Registrant’s telephone number) |
Securities registered pursuant to Section 12(b) of the Act:
| | | | | | | | |
| Class | Trading Symbol | Name of Exchange on which registered |
| Common Stock, par value $.01 per share | WAB | New York Stock Exchange |
Securities registered pursuant to Section 12(g) of the Act: None
Indicate by check mark if the registrant is a well-known seasoned issuer, as defined in Rule 405 of the Securities Act. Yes ☒ No ¨.
Indicate by check mark if the registrant is not required to file reports pursuant to Section 13 or 15(d) of the Act. Yes ¨ No ý.
Indicate by check mark whether the registrant (1) has filed all reports required to be filed by Section 13 or 15(d) of the Securities Exchange Act of 1934 during the preceding 12 months (or for such shorter period that the registrant was required to file such reports) and (2) has been subject to such filing requirements for the past 90 days. Yes ý No ☐.
Indicate by check mark whether the registrant has submitted electronically every Interactive Data File required to be submitted pursuant to Rule 405 of Regulation S-T during the preceding 12 months (or for such shorter period that the registrant was required to submit and post such files) Yes ý No ¨.
Indicate by check mark whether the registrant is a large accelerated filer, an accelerated filer, a non-accelerated filer, a smaller reporting company, or an emerging growth company. See the definitions of “large accelerated filer,” “accelerated filer,” “smaller reporting company,” and "emerging growth company" in Rule 12b-2 of the Exchange Act.:
| | | | | | | | | | | | | | | | | | | | | | | |
| Large accelerated filer | x | Accelerated filer | ¨ | Non-accelerated filer | ¨ | |
| Emerging growth company | ☐ | Smaller reporting company | ☐ | | | | |
If an emerging growth company, indicate by check mark if the registrant has elected not to use the extended transition period for complying with any new or revised financial accounting standards provided pursuant to Section 13(a) of the Exchange Act. ☐
Indicate by check mark whether the registrant has filed a report on and attestation to its management's assessment of the effectiveness of its internal control over financial reporting under Section 404(b) of the Sarbanes-Oxley Act (15 U.S.C. 7262(b)) by the registered public accounting firm that prepared or issued its audit report. ☒
Indicate by check mark whether the registrant is a shell company (as defined in Rule 12b-2 of the Exchange Act). Yes ☐ No ý.
The registrant estimates that as of June 30, 2020, the aggregate market value of the voting shares held by non-affiliates of the registrant was approximately $10.5 billion based on the closing price on the New York Stock Exchange for such stock.
As of February 12, 2021, 188,896,023 shares of Common Stock of the registrant were issued and outstanding.
DOCUMENTS INCORPORATED BY REFERENCE:
Portions of the Proxy Statement for the registrant’s Annual Meeting of Stockholders to be held on May 19, 2021 are incorporated by reference into Part III of this Form 10-K.
TABLE OF CONTENTS
| | | | | | | | |
| | | |
| | PART I | Page |
| | | |
| Item 1. | | |
| Item 1A. | | |
| Item 1B. | | |
| Item 2. | | |
| Item 3. | | |
| Item 4. | | |
| | | |
| | PART II | |
| | | |
| Item 5. | | |
| Item 6. | | |
| Item 7. | | |
| Item 7A. | | |
| Item 8. | | |
| Item 9. | | |
| Item 9A. | | |
| Item 9B. | | |
| | | |
| | PART III | |
| | | |
| Item 10. | | |
| Item 11. | | |
| Item 12. | | |
| Item 13. | | |
| Item 14. | | |
| | | |
| | PART IV | |
| | | |
| Item 15. | | |
| Item 16. | | |
PART I
General
Westinghouse Air Brake Technologies Corporation, doing business as Wabtec Corporation, is a Delaware corporation with headquarters at 30 Isabella Street in Pittsburgh, Pennsylvania. Our telephone number is 412-825-1000, and our website is located at www.wabteccorp.com. All references to “we”, “our”, “us”, the “Company” and “Wabtec” refer to Westinghouse Air Brake Technologies Corporation and its consolidated subsidiaries. George Westinghouse founded the original Westinghouse Air Brake Co. in 1869 when he invented the air brake. Westinghouse Air Brake Company (“WABCO”) was formed in 1990 when it acquired certain assets and operations from American Standard, Inc., now known as Trane (“Trane”). The Company went public on the New York Stock Exchange in 1995.
Throughout the years, the Company has made a number of strategic acquisitions leading the Company to where it is today. These have primarily included:
•the 1999 merger with MotivePower Industries, Inc. whereby the Company adopted its current name of Westinghouse Air Brake Technologies Corporation, or Wabtec;
•the 2017 acquisition of Faiveley Transport, S.A. (“Faiveley Transport”), a leading provider of value-added, integrated systems and services, primarily for the global transit rail market. Based in France, the Faiveley Transport business has roots to 1919 and made Wabtec a leader in manufacturing pantographs, automatic door mechanisms, air conditioning systems, railway braking systems and couplers; and
•the 2019 acquisition of GE Transportation, a business unit of General Electric Company. This brought a global technology leader and supplier of locomotives, equipment, services and digital solutions to the rail, mining, marine, stationary power and drilling industries into Wabtec.
As a result of several strategic acquisitions, as well as other smaller acquisitions, and organic growth, Wabtec is now one of the world’s largest providers of locomotives, value-added, technology-based equipment, systems and services for the global freight rail and passenger transit industries with approximately 27,000 employees and operations in over 50 countries. We believe we hold a leading market share for many of our core product lines globally. Our highly engineered products, which are intended to enhance safety, improve productivity, and reduce maintenance costs for customers, can be found on most locomotives, freight cars, passenger transit cars and buses around the world.
Through both internal growth as well as acquisitions, Wabtec has positioned itself with the following strategic benefits:
•Increased diversity of revenues by product, geography and market. Comprehensive product offerings spanning the freight rail and passenger transit industries, as well as products in the bus, mining and marine, and discrete industrial markets help Wabtec to balance the cyclical nature of the global rail business.
•Significant Operating Synergies and Improved Financial Profile. The consummation of the GE Transportation acquisition is leading to operating synergies across all of Wabtec. As a result, we expect to generate approximately $250 million in annual run-rate operating synergies, driven by cost and revenue opportunities, before 2022. This will enhance Wabtec’s margins and revenue growth opportunities with strong free cash flow generation to enable strategic deleveraging through debt reduction and earnings growth.
•Increased technical and engineering expertise. Particularly with the onboarding of Faiveley Transport and GE Transportation, Wabtec's technical capabilities and product development efforts are strengthened.
•Increased Scale and Diversification of Wabtec’s Freight Product Portfolio. Wabtec is now one of the world’s largest providers of locomotives, freight car components, technology-enabled equipment, systems and services for the locomotive and freight rail industries.
•Broadened product line and international presence in the transit market. Wabtec now offers a comprehensive, broad and diversified portfolio of products to the transit rail industries throughout the world.
•Complementary Digital and Electronics Technologies. Wabtec now has a comprehensive digital portfolio and leading engineering and technical intellectual property, which provides electronics and digital technologies to meet growing demand for train intelligence and network optimization.
•Enhanced Aftermarket and Services Opportunities. Wabtec has an installed base of more than 22,500 locomotives and content on virtually all North American locomotives and freight cars, as well as a diverse offering of Transit locomotives and cars both internationally and domestically, which enables significant opportunities in the higher-margin aftermarket parts and services business and mitigates the exposure to cycles.
Industry Overview
The Company primarily serves the global freight rail and passenger transit industries. As such, our operating results are largely dependent on the level of activity, financial condition and capital spending plans of freight railroads and passenger transit agencies around the world, and transportation equipment manufacturers who serve those markets. Many factors influence these industries, including general economic conditions; traffic volumes, as measured by freight carloadings and passenger ridership; government spending on public transportation; and investment in new technologies. In general, trends such as increasing urbanization and growth in developing markets, a focus on sustainability and environmental awareness, increasing investment in technology solutions, an aging equipment fleet, and growth in global trade are expected to drive continued investment in freight rail and passenger transit.
According to the 2020 bi-annual edition of a market study by UNIFE, the Association of the European Rail Industry, the accessible global market for railway products and services is more than $120 billion and is expected to grow at a compounded annual growth rate of 2.3% through 2025. As the long-term effects of COVID-19 are still uncertain, UNIFE included a second, less likely scenario in which the recovery is more moderate. This alternative scenario shows a compounded annual growth rate of 0.9% through 2025 for the total accessible market. The three largest geographic markets, which represented about 85% of the total accessible market, were Europe, North America and Asia Pacific. UNIFE projected above-average growth rates in Latin America, Eastern Europe, North America, and Africa/Middle East, with the more mature markets of Western Europe, North America, and Asia Pacific accounting for the largest share of absolute growth. UNIFE said trends such as urbanization, digitalization, legislative action and government support, and an increased focus on energy and environmental issues continue to drive investment. The largest product segments of the market were rolling stock, services and infrastructure, which represent almost 90% of the accessible market. UNIFE projected spending growth in all product segments, with turnkey management projects, rolling stock, and infrastructure to grow fastest. UNIFE estimated that the global installed base of diesel and electric locomotives was about 118,200 units, with about 32% in Asia Pacific, about 25% in North America and about 18% in Russia-CIS (Commonwealth of Independent States). Wabtec estimates that about 3,000 new locomotives were delivered worldwide in 2020. UNIFE estimated the global installed base of freight cars was about 5.2 million, with about 35% in North America, about 24% in Russia-CIS, and about 24% in Asia Pacific. Wabtec estimates that about 155,000 new freight cars were delivered worldwide in 2020. UNIFE estimated the global installed base of passenger transit vehicles to be about 620,000 units, with about 45% in Asia Pacific, about 31% in Europe and about 10% in Russia-CIS. Wabtec estimates that about 32,000 new passenger transit vehicles were ordered worldwide in 2020.
In Europe, the majority of the rail system serves the passenger transit market, which is expected to continue growing as energy and environmental policies encourage continued investment in public mass transit, and modal shift from car to rail, although this growth may be stunted in the near-term as a result of the COVID-19 pandemic. According to UNIFE, Germany, France, and the United Kingdom were the largest Western European transit markets, representing about two-thirds of industry spending in the European Union. UNIFE projected the accessible Western European rail market to grow at about 2.0% annually, led by investments in new rolling stock in France and Germany. About 75% of freight traffic in Europe is hauled by truck, while rail accounts for about 19%. The largest freight markets in Europe are Germany, Poland and the United Kingdom. In recent years, the European Commission has adopted a series of measures designed to increase the efficiency of the European rail network by standardizing operating rules and certification requirements. UNIFE believes that adoption of these measures should have a positive effect on ridership and investment in public transportation over time.
In North America, railroads carry about 40% of intercity freight, as measured by ton-miles, which is more than any other mode of transportation. Through direct ownership and operating partnerships, U.S. railroads are part of an integrated network that includes railroads in Canada and Mexico, forming what is regarded as the world’s most-efficient and lowest-cost freight rail service. There are more than 600 railroads operating in North America, with the largest railroads, referred to as “Class I”, accounting for more than 90% of the industry’s revenues. The railroads carry a wide variety of commodities and goods, including coal, metals, minerals, chemicals, grain, and petroleum. These commodities represent about 50% of total rail carloads, with intermodal carloads accounting for the rest. Railroads operate in a competitive environment, especially with the trucking industry, and are always seeking ways to improve safety, cost and reliability. New technologies offered by Wabtec and others in the industry can provide some of these benefits. Demand for our freight related products and services in North America is driven by a number of factors, including rail traffic, and production of new locomotives and new freight cars. In the U.S., the passenger transit industry is dependent largely on funding from federal, state and local governments, and from fare box revenues. Demand for North American passenger transit products is driven by a number of factors, including government funding, deliveries of new subway cars and buses, and ridership. The U.S. federal government provides money to local transit authorities, primarily to fund the purchase of new equipment and infrastructure for their transit systems.
Growth in the Asia Pacific market has been driven mainly by the continued urbanization of China and India, and by continued investments in freight rail rolling stock and infrastructure in Australia to serve its mining and natural resources markets. India is making significant investments in rolling stock and infrastructure to modernize its rail system; for example, Wabtec is delivering on a 1,000-unit locomotive contract with Indian Railways.
Other key geographic markets include Russia-CIS and Africa-Middle East. With about 1.3 million freight cars and about 21,000 locomotives, Russia-CIS is among the largest freight rail markets in the world, and it’s expected to invest in both freight and transit rolling stock. PRASA, the Passenger Rail Agency of South Africa, is expected to continue to invest in new transit cars and new locomotives. According to UNIFE, most emerging markets were expected to grow at above-average rates as global trade led to increased freight volumes and urbanization led to increased demand for efficient mass-transportation systems. It is still uncertain as to how the COVID-19 pandemic will impact the expected growth in these emerging markets, especially in the near-term. As this growth occurs, Wabtec expects to have additional opportunities to provide products and services in these markets.
In its study, UNIFE also said it expected increased investment in digitalization, automation, and predictive maintenance through artificial intelligence, all of which would improve efficiency in the global rail industry. UNIFE expects these trends to increase the overall attractiveness of the rail sector as these trends are expected to lead to significant cost savings, allowing rail to be more competitive in comparison to other modes of transportation. Wabtec offers products and services to help customers make ongoing investments in these initiatives.
Business Segments and Products
We provide our products and services through two principal business segments, the Freight Segment and the Transit Segment, both of which have different market characteristics and business drivers. The Freight Segment primarily manufactures and provides aftermarket parts and services for new locomotives; provides components for new and existing locomotives and freight cars; builds new commuter locomotives; supplies rail control and infrastructure products including electronics, positive train control equipment, signal design and engineering services; provides a comprehensive suite of software-enabled solutions designed to improve customer efficiency and productivity in the transportation and mining industries; overhauls locomotives; and provides heat exchangers and cooling systems for rail and other industrial markets. Customers include large, publicly traded railroads, leasing companies, manufacturers of original equipment such as locomotives and freight cars, and utilities. We are the largest global manufacturer of diesel-electric locomotives for freight railroads producing mission-critical products and solutions that help railroads reduce operating costs, decrease fuel use, minimize downtime and comply with emissions standards. As a result of the large base of approximately 22,500 locomotives currently in use, Wabtec's services product lines of rebuilding, remanufacturing, maintaining, and exchanging locomotives and components in the aftermarkets provides a significant, recurring revenue stream. In 2020, the Freight Segment accounted for approximately 67% of Wabtec’s total net sales, with about 55% of its net sales in the U.S. In 2020, about 63% of the Freight Segment’s net sales were in the aftermarket.
The Transit Segment primarily manufactures and services components for new and existing passenger transit vehicles, typically regional trains, high speed trains, subway cars, light-rail vehicles and buses; supplies rail control and infrastructure products including electronics, signal design and engineering services; and refurbishes passenger transit vehicles. Customers include public transit authorities and municipalities, leasing companies, and manufacturers of passenger transit vehicles and buses around the world. In 2020, the Transit Segment accounted for approximately 33% of our total net sales, with about 15% of its net sales in the U.S. Approximately half of the Transit Segment’s net sales are in the aftermarket with the remainder in the original equipment market. Geographically, Faiveley Transport significantly strengthened Wabtec’s presence in the European and Asia Pacific transit markets.
Following is a summary of our leading products in both aftermarket and original equipment across both of our business segments in 2020:
Equipment:
•Diesel-electric locomotives for freight railroads
•Engines, electric motors and premium propulsion systems used in locomotives, mining, marine, stationary power and drilling applications
•Marine and mining products
Digital & Electronic Products:
•Positive Train Control equipment and electronically controlled pneumatic braking products
•Railway electronics, including event recorders, monitoring equipment and end of train devices
•Signal design and engineering services
•Train performance such as distributed locomotive power, train 'cruise control', and train remote control
•Transport intelligence such as Industrial/mobile Internet of Things (IoT) hardware & software, edge-to-cloud, on and off-board analytics & rules, asset performance management
•Transport logistics such as rail transportation management, shipper transportation management, port visibility and optimization
•Network optimization such as rail network scheduling, dispatch, and optimization, intermodal, terminal management and optimization, rail yard management and optimization
Components:
•Freight car trucks and braking equipment and related components for Freight applications
•Draft gears, couplers and slack adjusters
•Air compressors and dryers
•Heat exchangers and cooling products for locomotives and power generation equipment
•Track and switch products
•New commuter and switcher locomotives
Services:
•Freight locomotive overhaul and refurbishment
•Master service agreements for locomotive and car maintenance
•Transit locomotive and car overhaul
•Unit exchange of locomotive components
Transit Products:
•Railway braking equipment and related components for Transit applications, including high-speed passenger transit vehicles
•Friction products, including brake shoes, discs and pads
•Heating, ventilation and air conditioning equipment
•Doors for buses and subway cars
•Platform screen doors
•Pantographs
•Window assemblies
•Couplers
•Accessibility lifts and ramps for buses and subway cars
•Traction motors
We have become a leader in the freight rail and passenger transit industries by capitalizing on the strength of our existing products, technological capabilities and new product innovations, and by our ability to harden products to protect them from severe conditions, including extreme temperatures and high-vibration environments. Supported by our technical staff of more than 5,000 engineers and specialists, we have extensive experience in a broad range of product lines, which enables us to provide comprehensive, systems-based solutions for our customers.
In recent years, we have introduced a number of significant new products, including Positive Train Control (“PTC”) equipment that encompasses onboard digital data and global positioning communication protocols. We are making additional investments in this technology which we believe will provide customers with opportunities to improve safety and efficiency, in part through data analytics solutions. Other new products include HVAC inverter integrated solutions, brake discs and brake controls, platform doors and gates, and door controllers. In addition, we are continuing to develop Energy Management Solutions for railroads to further reduce fuel consumption and emissions. These developments include the design of a battery electric locomotive that will be integrated with other diesel electric locomotives in a train. This hybrid consist, under the control of our Trip Optimizer software, will significantly reduce fuel consumption as well as having the ability to operate in a low emission state while in populated areas. We are also considering development of locomotives for transit services to operate in a zero emissions environment (such as a tunnel) for extended periods of time.
For additional information on our business segments, see Note 20 of “Notes to Consolidated Financial Statements” included in Part IV, Item 15 of this report.
Competitive Strengths
Our key strengths include:
•Iconic Legacy and Strong Reputation with a History of over 150 Years of Innovation. The rail industry has been in operation for over 150 years and we have been at the forefront of shaping and transforming the rail landscape through various innovations and technologies. Dating back to 1869 and George Westinghouse’s invention of the air brake, we are an established leader in the rail industry for freight and passenger transit vehicles. For over 110 years, GE Transportation has served the worldwide rail industry, which is a critical component of the global transportation system and the global economy, with an installed base of more than 22,500 locomotives worldwide. Faiveley Transport, founded in 1919, has a long history and is a market leader for its core products, including pantographs, automatic door mechanisms and air conditioning systems. We have leveraged our leading positions by focusing on research and engineering to expand beyond pneumatic braking components to supplying integrated parts and assemblies from a full locomotive through the end of the train. We are a recognized leader in the development and production of electronic recording, measuring and communications systems, positive train control equipment, highly engineered compressors and heat exchangers for locomotives, and a leading manufacturer of freight car components, including electronic braking equipment, draft gears, trucks, brake shoes and electronic end-of-train devices. We are also a leading provider of braking equipment; heating, ventilation and air conditioning equipment; door assemblies and platform screen doors; lifts and ramps; couplers and current collection equipment, such as pantographs, for passenger transit vehicles.
•Breadth of product offering with a stable mix of original equipment market (OEM) and aftermarket business. Our product portfolio is one of the broadest in the rail industry, as we offer a wide selection of quality parts, components and assemblies across the entire train and worldwide. We provide our products in both the original equipment market and the aftermarket. Our substantial installed base of products with end-users such as the railroads and the passenger transit authorities is a significant competitive advantage for providing products and services to the aftermarket because these customers often look to purchase safety- and performance-related replacement parts from the original equipment components supplier. In addition, as OEMs and railroad operators attempt to modernize fleets with new products designed to improve and maintain safety and efficiency, these products must be designed to be interoperable with existing equipment. In 2020, net sales of aftermarket parts and services represented about 60% of total net sales.
•Market Leader with Longstanding Customer Partnerships in a Critical Infrastructure Sector. For more than a century, rail has been a cornerstone of the global transportation system, and thus, the economy. Rail remains one of the most cost-effective, energy-efficient modes of transport, both domestically and internationally. As the largest global producer of diesel-electric locomotives, we have a significant market share both in North America and globally.
•Leading design and engineering capabilities. We believe a hallmark of our relationship with our customers has been our leading design and engineering practice, which has assisted in the improvement and modernization of global railway equipment. We believe both our customers and government authorities value our technological capabilities and commitment to innovation, as we seek not only to enhance the efficiency and profitability of our customers, but also to improve the overall safety of the railways through continuous improvement of product performance. The Company designs, develops and manufactures critical components and systems for the rail, mining and marine industries, which include proprietary propulsion systems, engine platforms and controls technology. These innovative and differentiated solutions serve as the building blocks for the rail, mining and marine industries, and help keep our global customers at the forefront of advancing technologies. When coupled with our advanced digital analytic capabilities, our solutions help drive increased energy management, performance and reliability to our products. To that end, we have assembled a wide range of patented products, which we believe provides us with a competitive advantage.
•Leading the Digital Transformation of Wabtec’s Industries. Our early investment in data analytics and software has allowed us to become a strategic partner for customers looking to derive new value from assets and digitally transform their operations. Through these initiatives, the transportation industry, from mine to port, from shipper to receiver, from port to intermodal terminals to main line locomotives and railcars and across train yards and operation centers, has evolved to include digital solutions. The breadth of our Digital and Electronic solutions gives customers confidence in our ability to address their current and future needs.
•Experience with industry regulatory requirements. The freight rail and passenger transit industries are governed by various government agencies and regulators in each country and region. These groups mandate rigorous manufacturer certification, new product testing and approval processes that we believe are difficult for new entrants to meet cost-effectively and efficiently without the scale and extensive experience we possess. Certification processes are lengthy, and often require local presence and expertise. In addition, each transit agency places a high degree of importance on vehicle customization, which requires experience and technical expertise to meet ever-evolving specifications.
•Streamlined Cost Structure and Operational Excellence Provide Operating Leverage and Support Wabtec’s Growth. Wabtec’s lean manufacturing and continuous improvement initiatives have been a part of the Company’s culture for
more than 25 years and have enabled Wabtec to manage successfully through cycles in the rail supply market. We are continuing to expand our Operating Excellence focus in driving productivity and delighting customers. Our Operating Excellence Program leverages the breadth and depth of our One Wabtec expertise across the organization in sharing of best practice, instilling a culture of learning, problem solving, continuous improvement, and driving standard operating practices. This, coupled with our overall manufacturing and supply base footprint initiatives, will drive increased flexibility and improved responsiveness to our customer needs while driving margin improvement through productivity.
Business strategy
We strive to generate sufficient cash to invest in our growth strategies and to build on what we consider to be a leading position as a low-cost producer in the industry while maintaining world-class product quality, technology and customer responsiveness. We continuously strive to improve quality, delivery and productivity, and to reduce costs utilizing global sourcing and supply chain management. These practices enable us to streamline processes, improve product reliability and customer satisfaction, reduce product cycle times and respond more rapidly to market developments. We also rely on functional experts within the Company across various disciplines to train, coach and share best practices throughout the corporation, while benchmarking against best-in-class competitors and peers. Over time, we expect to continue to increase operating margins, improve cash flow and strengthen our ability to invest in the following growth strategies:
•Product innovation and new technologies. We continue to emphasize innovation and development funding to create new products and capabilities, such as the battery electric locomotive and vehicle monitoring and data analytics. We have a multi-year initiative to build on our existing expertise and technologies in the digital and electronics areas. In addition, we invest in developing enhancements and new features to existing products, such as brake discs and heat exchangers. We are focusing on technological advances, especially in the areas of electronics, braking products and other on-board equipment, as a means to deliver new product growth. We seek to provide customers with incremental technological advances that offer immediate benefits with cost-effective investments.
•Global and market expansion. We believe that international markets represent a significant opportunity for future growth. In 2020, net sales to non-U.S. customers were approximately $4.4 billion. We intend to increase international sales through direct sales of existing products to current and new customers, by developing specific new products for application in new geographic markets, by making strategic acquisitions, and through joint ventures with railway suppliers which have a strong presence in their local markets. In transit, we are focused on mature markets such as Europe and emerging markets such as India. In freight, we are targeting markets that operate significant fleets of U.S.-style locomotives and freight cars, including Australia, Brazil, China, India, Russia, South Africa, and other select areas within Europe and South America. In addition, we have opportunities to increase the sale of certain products that we currently manufacture for the rail industry into other industrial markets, such as mining, off-highway and energy. These products include heat exchangers and friction materials.
•Aftermarket products and services. Historically, aftermarket sales are less cyclical than OEM sales because a certain level of aftermarket maintenance and service work must be performed, even during an industry slowdown. In 2020, net sales of aftermarket parts and services represented about 60% of total net sales. As a long time supplier of original equipment, we have an extensive installed base of equipment in the field, which generates recurring aftermarket sales. Wabtec provides aftermarket parts and services for its components, and we seek to expand this business with customers who currently perform the work in-house. In this way, we expect to benefit as transit authorities and railroads outsource certain maintenance and overhaul functions.
•Acquisitions, joint ventures and alliances. We continue to invest in acquisitions, joint ventures and alliances using a disciplined, selective approach and rigorous financial criteria. These transactions are expected to meet our financial criteria and contribute to growth strategies of product innovation and new technologies, global expansion, and aftermarket products and services. We believe these expansion strategies will help Wabtec to grow profitably, expand geographically, and dampen the impact from potential cycles in the North American freight rail industry.
Recent Acquisitions and Joint Ventures
See Note 3 of the Notes to Consolidated Financial Statements included in Part IV, Item 5 of this report for additional information about our recent acquisitions and joint ventures.
Backlog
The Company’s backlog was about $21.6 billion at December 31, 2020. For 2020, about 60% of total net sales came from aftermarket orders, which typically carry lead times of less than 30 days and are not included in backlog for a significant period of time.
The Company’s contracts are subject to standard industry cancellation provisions, including cancellations on short notice or upon completion of designated stages. Generally, if a customer were to cancel a contract we would have an enforceable right to payment for work completed up to the date of cancellation which would include a reasonable profit margin. Substantial scope-of-work adjustments are common. For these and other reasons, completion of the Company’s backlog may be delayed or canceled. The railroad industry, in general, has historically been subject to fluctuations due to overall economic conditions and the level of use of alternative modes of transportation.
The rollforward of the Company's backlog of firm customer orders and the expected year of completion are as follows:
| | | | | | | | | | | | | | | | | | | | |
| in millions | | Freight Segment | | Transit Segment | | Consolidated |
| Balance at December 31, 2019 | | $ | 18,945.3 | | | $ | 3,486.4 | | | $ | 22,431.7 | |
| New orders | | $ | 4,255.2 | | | $ | 2,522.5 | | | $ | 6,777.7 | |
| Less: net sales | | $ | (5,082.3) | | | $ | (2,473.8) | | | $ | (7,556.1) | |
| Adjustments / foreign exchange | | $ | (231.1) | | | $ | 169.0 | | | $ | (62.1) | |
| Balance at December 31, 2020 | | $ | 17,887.1 | | | $ | 3,704.2 | | | $ | 21,591.3 | |
| | | | | | |
| Expected Delivery | | | | | | |
| 2021 | | $ | 3,586.3 | | | $ | 1,934.4 | | | $ | 5,520.7 | |
| Other years | | $ | 14,300.8 | | | $ | 1,769.8 | | | $ | 16,070.6 | |
The Company saw no significant cancellations of backlog during the year ended December 31, 2020 despite the unprecedented pandemic caused by COVID-19 and its effects on locomotive parkings, carbuilds, and transit ridership levels. However, the economic slowdown that was caused by COVID-19 did have some impact on the timing of orders in backlog as the delivery of goods and services previously expected to be completed in the current year has been pushed out to future years.
Engineering and Development
To execute our strategy to develop new products, we invest in a variety of engineering and development activities. For the fiscal years ended December 31, 2020, 2019 and 2018, we invested $162.1 million, $209.9 million and $87.5 million, respectively, on product development and improvement activities. Significant incremental engineering expense is incurred with the execution of original equipment customer contracts. Across the corporation we have established multiple Centers of Competence, which have specialized, technical expertise in various disciplines and product areas.
Our engineering and development program includes investments in data analytics, train control and other new technologies, with an emphasis on developing products that enhance safety, productivity and efficiency for our customers. For example, we have developed advanced cooling systems that enable lower emissions from diesel engines used in rail and other industrial markets. Sometimes we conduct specific research projects in conjunction with universities, customers and other industry suppliers.
We use our Product Development System to develop and monitor new product programs. The system requires the product development team to follow consistent steps throughout the development process, from concept to launch, to ensure the product will meet customer expectations and internal profitability targets.
Intellectual Property
We have about 6,000 active patents worldwide and on average file for approximately 300 new patents each year. We also rely on a combination of trade secrets and other intellectual property laws, nondisclosure agreements and other protective measures to establish and protect our proprietary rights in our intellectual property. We also follow the product development practices of our competitors to monitor any possible patent infringement by them, and to evaluate their strategies and plans.
Certain trademarks, among them the name WABCO®, were acquired or licensed from American Standard Inc., now known as Trane, in 1990 at the time of our acquisition of the North American operations of the Railway Products Group of Trane. Other trademarks have been developed through the normal course of business or acquired as a part of our ongoing merger and acquisition program.
We have entered into a variety of license agreements as licensor and licensee. We do not believe that any single license agreement is of material importance to our business or either of our business segments as a whole.
We have issued licenses to the two sole suppliers of railway air brakes and related products in Japan, Nabtesco and Mitsubishi Electric Company. The licensees pay annual license fees to us and also assist us by acting as liaisons with key
Japanese passenger transit vehicle builders for projects in North America. We believe that our relationships with these licensees are beneficial to our core transit business and customer relationships in North America.
Customers
We provide products and services for more than 500 customers worldwide. Our customers include passenger transit authorities and railroads throughout North America, Europe, Asia Pacific, South Africa and South America; manufacturers of transportation equipment, such as locomotives, freight cars, passenger transit vehicles and buses; and companies that own, lease, and maintain such equipment.
Top customers can change from year to year. For the fiscal year ended December 31, 2020, our top five customers accounted for approximately 24% of net sales. No one customer represents 10% or more of consolidated net sales. We believe that we have strong relationships with all of our key customers.
Competition
We hold a leading market share for many of our core product lines globally, although market shares vary by product lines and geographies. We operate in a highly competitive marketplace. Price competition is strong because we have a relatively small number of customers and they are very cost-conscious. In addition to price, competition is based on product performance and technological leadership, quality, reliability of delivery, and customer service and support.
Our principal competitors vary across product lines and geographies. Within North America, New York Air Brake Company, a subsidiary of the German air brake producer Knorr-Bremse AG (“Knorr”) and Amsted Rail Company, Inc., a subsidiary of Amsted Industries Corporation, are our principal overall Original Equipment Manufacturer ("OEM") competitors. Our competition for locomotive, freight and passenger transit service and repair is mostly from the railroads’ and passenger transit authorities’ in-house operations, Electro-Motive Diesel, a division of Caterpillar, and Knorr. We believe our key strengths, which include leading market positions in core products, breadth of product offering with a stable mix of OEM and aftermarket business, leading design and engineering capabilities, significant barriers to entry and an experienced management team, enable us to compete effectively in this marketplace. Outside of North America, Knorr is our main competitor, although not in every product line or geography. In addition, our competitors often include smaller, local suppliers in most international markets. Depending on the product line and geography, we can also compete with our customers, such as CRRC Corporation Limited, a China-based manufacturer of rolling stock.
Employees
Human Capital
At Wabtec, we believe performance drives progress, and are committed to developing sustainable transportation solutions that move and improve the world. We are committed to driving an inclusive culture and integrating our talent and capabilities across the enterprise. As a company, we believe that protecting the health and safety of our people and the environment is the responsibility of everyone at Wabtec, especially during a global pandemic.
Our headquarters are in Pittsburgh, Pennsylvania and we have offices and facilities in over 50 countries around the globe. As of December 31, 2020, we have a global workforce of approximately 27,000.
Diversity and Inclusion
Wabtec is committed to ensuring a diverse and inclusive workplace that respects and seeks the unique talents, experiences and viewpoints of all our employees. We strive to create an inclusive workplace where employees can be themselves. In 2019, women constituted approximately 16% of our global workforce and approximately 18% of our salaried employees. Our U.S. employee base was comprised of approximately 19% of people of color in 2019. We also announced our goals of 20% female representation globally, 25% female representation among salaried employees, 30% representation among people of color across the total U.S. workforce and 25% representation among people of color across U.S. salaried employees by 2030.
Training and Development
We continually invest in our employees’ career growth and provide employees with a wide range of development opportunities, including face-to-face, virtual, social and self-directed learning, mentoring and coaching programs. We have invested in training courses through Wabtec’s Learning Management System (LMS).
Our two-year Leadership, Expertise, Advancement and Development (LEAD) program is the primary path for university graduates into Wabtec. LEAD is a two-year program that offers an immersive learning experience in the fields of engineering, operations, finance and IT along with extensive leadership training designed to build the next generation of leaders. On average, there are 100 participants in the LEAD program that rotate between business units every six months to work on strategic projects and assignments, gain exposure to senior leadership and build their global professional network. Approximately 20
percent of Wabtec’s Equipment and Services engineering and operations leaders are graduates of LEAD. We are focused on growing this program to support our global talent pipeline.
Health and Safety
When it comes to employee safety, our commitment is to provide safe work environments for our employees and to meet or exceed environmental, health, and safety (EHS) laws and regulations in the places where we operate. In 2020, the company relaunched the Environment, Health, and Safety component of the Wabtec Management System (known as the “EHS WMS”) to strengthen our management system approach to addressing EHS risks and promote the consistent implementation of best practices across all our global manufacturing and services sites, regardless of how local laws are implemented or enforced. The EHS WMS establishes standard expectations in 13 core competency areas, including leadership and accountability, regulatory applicability review, EHS processes and systems, risk assessment, safety defenses, exposure defenses, environmental defenses and contractor management. Operational sites are measured against these EHS program expectations. In addition, the company’s EHS WMS is directly aligned to accepted international standards, such as ISO 14001 for Environmental and ISO 45001 for Occupational Health and Safety.
COVID-19
The pandemic has reinforced the importance of keeping Wabtec employees safe and healthy while keeping essential rail services and the global economy moving. When the pandemic began, Wabtec launched its COVID-19 Crisis Management Team, which met daily to focus on three key elements: protecting our people, serving our customers, and ensuring business continuity. Manufacturing and office locations were required to implement risk assessment methodologies and rethink work practices to allow for remote working or social distancing, develop new procedures for workplace entry, strengthen site-level crisis management teams and implement new tools for rapid communication with site employees. Site leaders and people managers were trained on techniques for communicating transparently and navigating complex business decisions during a crisis.
Compensation and Benefits
We remain committed to a strong pay-for performance philosophy that aligns individual performance, behaviors and business results with individual rewards. To deliver on that commitment, we utilize market data to benchmark to the external market, and consider factors such as an employee’s role and experience, the location of the job and performance when determining compensation.
We provide our employees resources to help them succeed. We offer a wide range of benefits including healthcare and wellness benefits, retirement benefits, an Employee Assistance Program, Employee Resource Groups to build diverse communities at Wabtec, and paid time off.
Regulation
In the course of our operations, we are subject to various regulations and standards of governments and other agencies in the U.S. and around the world. These entities typically govern equipment, safety and interoperability standards for freight rail rolling stock and passenger transit, oversee a wide variety of rules and regulations governing safety and design of equipment, and evaluate certification and qualification requirements for suppliers. New products generally must undergo testing and approval processes that are rigorous and lengthy. As a result of these regulations and requirements, we must usually obtain and maintain certifications in a variety of jurisdictions and countries. The governing bodies include the FRA and the Association of American Railroads ("AAR") in the U.S., and the International Union of Railways (“UIC”) and the European Railway Agencies in Europe. Also, in Europe, the European Committees for Standardization continually draft new European standards which cover, for example, the Reliability, Availability, Maintainability and Safety of railways systems. To guarantee interoperability in Europe, the European Union for Railway Agencies is responsible for defining and implementing Technical Standards of Interoperability, which covers areas such as infrastructure, energy, rolling stock, telematic applications, traffic operation and management subsystems, noise pollution and waste generation, protection against fire and smoke, and system safety.
Most countries and regions in which Wabtec does business have similar rule-making bodies. In Russia, a GOST-R certificate of conformity is mandatory for all products related to the safety of individuals in Russian territory. In China, any product or system sold on the Chinese market must have been certified in accordance with national standards. In the local Indian market, most products are covered by regulations patterned after AAR and UIC standards.
Effects of Seasonality
Our business is not typically seasonal. Third quarter results may be affected by the timing of services performed under our locomotive maintenance contracts and vacation and scheduled plant shutdowns at several of our major customers. Fourth quarter results may be affected by the timing of spare parts and service orders placed by transit agencies worldwide. Quarterly results can also be affected by the timing of projects in backlog and by project delays.
Environmental Matters
Additional information on environmental matters is included in Note 19 of “Notes to Consolidated Financial Statements” included in Part IV, Item 15 of this report.
Available Information
We maintain a website at www.wabteccorp.com. Our annual reports on Form 10-K, quarterly reports on Form 10-Q, current reports on Form 8-K and amendments to such reports filed or furnished pursuant to Section 13(a) or 15(d) of the Securities Exchange Act of 1934, as well as the annual report to stockholders and other information, are available free of charge on this site. The Internet site and the information contained therein or connected thereto are not incorporated by reference into this Form 10-K. The following are also available free of charge on this site and are available in print to any shareholder who requests them: Our Corporate Governance Guidelines, the charters of our Audit, Compensation and Nominating and Corporate Governance Committees, our Code of Conduct, which is applicable to all employees, our Code of Ethics for Senior Officers, which is applicable to our executive officers, our Policies on Related Party Transactions and Conflict Minerals, and our Sustainability Report.
INFORMATION ABOUT OUR EXECUTIVE OFFICERS
The following table provides information on our executive officers as of February 19, 2021.
| | | | | | | | | | | | | | |
| Officers | | Age | | Position |
| Rafael Santana | | 49 | | President and Chief Executive Officer |
| David L. DeNinno | | 65 | | Executive Vice President, General Counsel and Secretary |
| Patrick D. Dugan | | 54 | | Executive Vice President Finance and Chief Financial Officer |
| Nicole Theophilus | | 50 | | Executive Vice President and Chief Human Resources Officer |
| Eric Gebhardt | | 52 | | Chief Technology Officer |
| Michael E. Fetsko | | 56 | | President, Freight and Industrial Components |
| Pascal Schweitzer | | 44 | | President, Global Freight Services |
| Rogerio Mendonca | | 48 | | President, Equipment |
| Nalin Jain | | 51 | | President, Digital Electronics |
| Lillian Leroux | | 49 | | President, Transit |
| John A. Mastalerz | | 54 | | Senior Vice President of Finance and Chief Accounting Officer |
| Gina Trombley | | 50 | | Senior Vice President, Sales & Marketing & Chief Commercial Officer - Americas |
| Greg Sbrocco | | 52 | | Senior Vice President, Global Operations |
Rafael Santana was named President and Chief Executive Officer of the Company effective July 1, 2019. Previously, he served as Executive Vice President from February 2019 to July 2019. Mr. Santana was President and Chief Executive Officer of GE Transportation since November 2017. Mr. Santana has held several global leadership positions since joining GE in 2000, including roles in the Transportation, Power and Oil and Gas businesses. Prior to being named President and Chief Executive Officer of GE Transportation, Mr. Santana was President and Chief Executive Officer of GE in Latin America. He also served as President and Chief Executive Officer of GE Oil and Gas Turbomachinery Solutions and had roles as Chief Executive Officer for GE Gas Engines and Chief Executive Officer for GE Energy in Latin America.
David L. DeNinno was named Executive Vice President, General Counsel and Secretary of the Company effective December 2016. Previously, Mr. DeNinno served as Senior Vice President, General Counsel and Secretary since February 2012. Previously, Mr. DeNinno served as a partner at K&L Gates LLP since May 2011 and prior to that with Reed Smith LLP.
Patrick D. Dugan was named Executive Vice President and Chief Financial Officer effective December 2016. Previously Mr. Dugan served as Senior Vice President and Chief Financial Officer since January 2014. Previously, Mr. Dugan was Senior Vice President, Finance and Corporate Controller from January 2012 until November 2013. He originally joined Wabtec in 2003 as Vice President, Corporate Controller. Prior to joining Wabtec, Mr. Dugan served as Vice President and Chief Financial Officer of CWI International, Inc. from December 1996 to November 2003. Prior to 1996, Mr. Dugan was a Manager with PricewaterhouseCoopers LLP.
Nicole Theophilus was named Executive Vice President & Chief Human Resource Officer in October 2020. Prior to joining Wabtec, Ms. Theophilus served most recently as Chief Human Resource Officer of West Corporation. Previously she served as Executive Vice President and Chief Human Resource Officer, Vice President of Human Resources and Vice President and Chief Employment Counsel of ConAgra Corporation. Prior to 2006, Ms. Theophilus was a partner with the law firm Husch Blackwell.
Eric Gebhardt was named Chief Technology Officer in October 2020. Prior to joining Wabtec, Mr. Gebhardt served as Managing Director of KCK-US. He also served in a variety of roles with General Electric including Chief Technology Officer of GE Power, Chief Product Management Officer for GE Energy Connections, Chief Platforms and Operations Officer for Current, and Chief Technology Officer for GE Oil & Gas.
Michael E. Fetsko was named President, Freight and Industrial Components effective January 2017. Previously, Mr. Fetsko served as Vice President and Group Executive from January 2014. He joined Wabtec in July of 2011 as Vice President, Freight Pneumatics. Prior to joining Wabtec, Mr. Fetsko served in various executive management roles with Bombardier Transportation. Prior to Bombardier, Mr. Fetsko served in various management roles with two different environmental engineering firms.
Pascal Schweitzer was named President, Global Freight Services on February 25, 2019. Previously Mr. Schweitzer was the Vice President—Services of GE Transportation since April 2017. He served as General Manger – Europe – Power Services for GE Power from November 2015 through April 2017 and prior to that several positions with Alstom Power.
Rogerio Mendonca was named President, Freight Equipment on February 1, 2021. Previously Mr. Mendonca served as Vice President for Baker Hughes. Prior to that he served as President of GE Transportation in Latin America and in several roles leading up to that including Commercial Director and Service Operations General Manager.
Nalin Jain was named President, Digital Electronics business effective December 2020. Mr. Jain had served as President, Global Equipment since May 2019 and previously as President & CEO, International Markets since Aug 2017 for GE Transportation. Prior to that, Mr. Jain had multiple leadership roles of increasing responsibility with GE Aviation and GE Transportation, since September 2005. Mr. Jain served as Director Global Partnerships with Bombardier Inc since July 2002 and prior to that he worked for Saint Gobain.
Lilian Leroux was named President, Transit effective March 2019. Previously he served as Group President—Brakes & Safety from January 2017 to October 2019. Prior to that, Mr. Leroux held various executive management roles with Faiveley Transport, starting in January 2001.
John A. Mastalerz was named Senior Vice President of Finance and Chief Accounting Officer in February 2020. Previously, Mr. Mastalerz served as Senior Vice President, Corporate Controller and Principal Accounting Officer from July 2017 to February 2020 and as Vice President and Corporate Controller from January 2014 to July 2017. Prior to joining Wabtec, Mr. Mastalerz served in various executive management roles with the H.J. Heinz Company from January 2001 to December 2013, most recently as Corporate Controller and Principal Accounting Officer. Prior to 2001, Mr. Mastalerz was a Senior Manager with PricewaterhouseCoopers LLP.
Gina Trombley was named Senior Vice President, Sales & Marketing & Chief Commercial Officer - Americas, effective September 8, 2020. Prior to joining Wabtec, Ms. Trombley served in various executive roles at Bombardier Transportation from 2017 to 2019, most recently as Vice President of Services and previously as Vice President Sales for Bombardier Transport - Americas. Ms. Trombley also held progressive commercial and marketing leadership roles at Parsons and GE Transportation.
Greg Sbrocco was named Senior Vice President, Global Operations, effective February 25, 2019. Prior to this, Mr. Sbrocco was Global Supply Chain Leader for GE Transportation. Mr. Sbrocco had been with GE since 1992 when he joined as an Environmental Engineer for the GE Energy business. During his tenure with GE, Mr. Sbrocco held several leadership roles in GE Energy, GE Oil and Gas, and GE Transportation.
RISKS RELATED TO OUR BUSINESS AND OPERATIONS
We are dependent upon key customers.
We rely on several key customers who represent a significant portion of our business. While we believe our relationships with our customers are generally good, our top customers could choose to reduce or terminate their relationships with us. In addition, many of our customers place orders for products on an as-needed basis and operate in cyclical industries. As a result, customer order levels have varied from period to period in the past and may vary significantly in the future. Such customer orders are dependent upon their markets and customers and may be subject to delays and cancellations. Furthermore, the average service life of certain products in our end markets has increased in recent years due to innovations in technologies and manufacturing processes, which has also allowed end users to replace parts less often. As a result of our dependence on our key customers, we could experience a material adverse effect on our business, results of operations and financial condition if we lost any one or more of our key customers or if there is a reduction in their demand for our products.
Our business operates in a highly competitive industry.
We operate in a global, competitive marketplace and face substantial competition from a limited number of established competitors, some of which may have greater financial resources than we do, may have a more extensive low-cost sourcing strategy and presence in low-cost regions than we do or may receive significant governmental support. Price competition is strong and, coupled with the existence of a number of cost conscious customers with significant negotiating power, has historically limited our ability to increase prices. In addition to price, competition is based on product performance and technological leadership, quality, reliability of delivery and customer service and support. If our competitors invest heavily in innovation and develop products that are more efficient or effective than our products, we may not be able to compete effectively. There can be no assurance that competition in one or more of our markets will not adversely affect us and our results of operations.
A failure to predict and react to customer demand could adversely affect our business.
If we are unable to accurately forecast demand for our existing products or to react appropriately to changes in demand, we may experience delayed product shipments and customer dissatisfaction. If demand increases significantly from current
levels, both we and our suppliers may have difficulty meeting such demand, particularly if such demand increases occur rapidly. Alternatively, we may carry excess inventory if demand for our products decreases below projected levels.
Additionally, we have dedicated significant resources to the development, manufacturing and marketing of new products. Decisions to develop and market new transportation products are typically made without firm indications of customer acceptance. Moreover, by their nature, new products may require alteration of existing business methods or threaten to displace existing equipment in which our customers may have a substantial capital investment. There can be no assurance that any new products that we develop will gain widespread acceptance in the marketplace or that such products will be able to compete successfully with other new products or services that may be introduced by competitors. Furthermore, we may incur additional warranty or other costs as new products are tested and used by customers.
Failure to accurately predict and react to customer demand could have a material adverse effect on our business, results of operations and financial condition.
We may fail to respond adequately or in a timely manner to innovative changes in new technology.
In recent years, the global transportation landscape has been characterized by rapid changes in technology, leading to innovative transportation and logistics concepts that could change the way the railway industry does business. There may be additional innovations impacting the railway industry that we cannot yet foresee. Any failure by us to quickly adapt to and adopt new innovations in products and processes desired by our customers may result in a significant loss of demand for our product and service offerings. In addition, advances in technology may require us to increase investments in order to remain competitive, and our customers may not be willing to accept higher prices to cover the cost of these investments.
Our revenues are subject to cyclical variations in the railway and passenger transit markets and changes in government spending.
The railway industry historically has been subject to significant fluctuations due to overall economic conditions, the use of alternate methods of transportation and the levels of government spending on railway projects. In economic downturns, railroads have deferred, and may defer, certain expenditures in order to conserve cash in the short term. Reductions in freight traffic may reduce demand for our replacement products.
The passenger transit railroad industry is also cyclical and is influenced by a variety of factors. New passenger transit car orders vary from year to year and are influenced by a variety of factors, including major replacement programs, the construction or expansion of transit systems by transit authorities and the quality and cost of alternative modes of transportation. To the extent that future funding for proposed public projects is curtailed or withdrawn altogether as a result of changes in political, economic, fiscal or other conditions beyond our control, such projects may be delayed or canceled, resulting in a potential loss of business for us, including transit aftermarket and new transit car orders. There can be no assurance that economic conditions will be favorable or that there will not be significant fluctuations adversely affecting the industry as a whole and, as a result, us.
Our backlog is not necessarily indicative of the level of our future revenues.
Our backlog represents future production and estimated potential revenue attributable to firm contracts with, or written orders from, our customers for delivery in various periods. Instability in the global economy, negative conditions in the global credit markets, volatility in the industries that our products serve, changes in legislative policy, adverse changes in the financial condition of our customers, adverse changes in the availability of raw materials and supplies, or un-remedied contract breaches could possibly lead to contract termination or cancellations of orders in our backlog or request for deferred deliveries of our backlog orders, each of which could adversely affect our cash flows and results of operations.
Equipment failures, interruptions, delays in deliveries or extensive damage to our facilities, supply chains, distribution systems or information technology systems, could adversely affect our business.
All of our facilities, equipment, supply chains, distribution systems and information technology systems are subject to the risk of catastrophic loss due to unanticipated events, such as disease outbreak, fires, earthquakes, explosions, floods, tornadoes, hurricanes or weather conditions. An interruption in our manufacturing capabilities, supply chains, distribution systems or information technology systems, whether as a result of such catastrophic loss or any other reason, could reduce, prevent or delay our production and shipment of our product offerings, result in defective products or services, damage customer relationships and our reputation and result in legal exposure and large repair or replacement expenses. This could result in the delay or termination of orders, the loss of future sales and a negative impact to our reputation with our customers.
Third-party insurance coverage that we maintain with respect to such matters will vary from time to time in both type and amount depending on cost, availability and our decisions regarding risk retention, and may be unavailable or insufficient to protect us against losses. Any of these risks coming to fruition could materially adversely affect our business, results of operations and financial condition.
Disruption of our supply chain could have an adverse impact on our business, financial condition, and results of operations.
Our ability to make, move, and sell our products is critical to our success. Damage or disruption to our supply chain, including third-party manufacturing or transportation and distribution capabilities, could impair our ability to manufacture or sell our products. Failure to take adequate steps to mitigate the likelihood or potential impact of disruptions, or to effectively manage such events if they occur, particularly when a product is sourced from a single supplier or location, could adversely affect our business or financial results. Due to the on-going impacts and uncertainty of continued impacts of the COVID-19 pandemic and the global government actions to contain it, some of our supply chains, particularly in China, India and Europe, have been, and continue to be, impacted. There can be no assurance that there will not be further, or deeper, supply chain disruptions, or that the steps we are taking to mitigate such disruptions will be effective or achieve their desired results in a timely fashion.
In addition, disputes with significant suppliers, including disputes regarding pricing or performance, could adversely affect our ability to supply products to our customers and could materially and adversely affect our product sales, financial condition, and results of operations.
We intend to pursue acquisitions, joint ventures and alliances that involve a number of inherent risks, any of which may cause us not to realize anticipated benefits.
One aspect of our business strategy is to selectively pursue acquisitions, joint ventures and alliances that we believe will improve our market position and provide opportunities to realize operating synergies. These transactions involve inherent risks and uncertainties, any one of which could have a material adverse effect on our business, results of operations and financial condition including:
•difficulties in achieving identified financial and operating synergies, including the integration of operations, services and products;
•diversion of management’s attention from other business concerns;
•the assumption of unknown liabilities; and
•unanticipated changes in the market conditions, business and economic factors affecting such an acquisition, joint venture or alliance.
We cannot assure that we will be able to consummate any future acquisitions, joint ventures or other business combinations. If we are unable to identify or consummate suitable acquisitions, joint ventures or alliances, we may be unable to fully implement our business strategy, and our business and results of operations may be adversely affected as a result. In addition, our ability to engage in such strategic transactions will be dependent on our ability to raise substantial capital, and we may not be able to raise the funds necessary to implement this strategy on terms satisfactory to us, if at all.
The integration of our recently completed acquisitions may not result in anticipated improvements in market position or the realization of anticipated operating synergies or may take longer to realize than expected.
Although we believe that our recent acquisitions will improve our market position and realize positive operating results, including operating synergies, operating expense reductions and overhead cost savings, we cannot be assured that these improvements will be obtained or the timing of such improvements. The management and acquisition of businesses involves substantial risks, any of which may result in a material adverse effect on our business and results of operations, including:
•the uncertainty that an acquired business will achieve anticipated operating results;
•significant expenses to integrate;
•diversion of management’s attention from business operations to integration matters;
•departure of key personnel from the acquired business;
•effectively managing entrepreneurial spirit and decision-making;
•integration of different information systems;
•unanticipated costs and exposure to unforeseen liabilities; and
•impairment of assets.
The effects of COVID-19 and other potential future public health crises, epidemics, pandemics or similar events on our business, operating results and cash flows are uncertain.
We face a wide variety of risks related to health epidemics, pandemics and similar outbreaks, including the global outbreak of coronavirus disease 2019 ("COVID-19"). Since first reported in late 2019, the COVID-19 pandemic has
dramatically impacted the global health and economic environment, including millions of confirmed cases, business slowdowns or shutdowns, government challenges and market volatility of an unprecedented nature. Although we have, to date, managed to continue most of our operations, we cannot predict the future course of events nor can we assure that this global pandemic, including its economic impact, will not have a material adverse impact on our business, financial position, results of operations and/or cash flows. The extent of the impact of the COVID-19 pandemic on our operational and financial performance remains uncertain and will depend on future pandemic related developments, including the duration of the pandemic, any potential subsequent waves of COVID-19 and new strains of the virus, the effectiveness, distribution and acceptance of COVID-19 vaccines, and related government actions to prevent and manage disease spread, all of which are uncertain and cannot be predicted. Our operations may be further impacted by the COVID-19 pandemic if significant portions of our workforce are unable to work effectively, including because of illness, quarantines, travel restrictions or absenteeism; steps the company has taken to protect health and well-being; government actions; facility closures; work slowdowns or stoppages; inadequate supplies or resources (such as reliable personal protective equipment, testing and vaccines); or other circumstances related to COVID-19. Governments around the world have taken steps to mitigate some of the more severe anticipated economic effects, but there can be no assurance that such steps will be effective or achieve their desired results in a timely fashion.
The COVID-19 pandemic has resulted in operational and supply chain disruptions for us and our customers and may further adversely affect operations and the operations of our customers and suppliers. Accordingly, COVID-19 had a materially adverse impact on our operations and business results for the year ended December 31, 2020, and we expect COVID-19 to continue to have a materially adverse impact on our operations and business results into 2021. The spread of COVID-19 has caused us to modify our business practices and to implement significant proactive measures to protect the health and safety of employees, and we may take further actions as may be required by government authorities or as we determine are appropriate under the circumstances. There is no certainty that such measures will be sufficient to mitigate the continued risks posed by the pandemic.
The COVID-19 pandemic and related volatility in financial markets and deterioration of national and global economic conditions could affect our business and operations in a variety of ways. For example, we have experienced and could experience further operational disruptions and financial losses as a result of the following:
•a decrease in demand for our products as a result of COVID-19 and cost control measures implemented by our customers;
•delays in orders or delivery of orders, the occurrence of which negatively impacts our cash conversion cycle and ability to convert our backlog into cash;
•inability to collect full or partial payments from customers due to deterioration in customer liquidity, including customer bankruptcies;
•a shutdown of one or multiple of our manufacturing facilities due to government restrictions or illness in connection with COVID-19.
The continued spread of COVID-19 has also led to disruption and volatility in the global capital markets, which depending on future developments may make it more costly or difficult for us to obtain debt or equity financing, including to refinance our existing debt, or to identify or execute on investment opportunities, in each case on terms and within time periods acceptable to us. We are also monitoring the impacts of COVID-19 on the fair value of our assets. While we do not currently anticipate any material impairments on our assets as a result of COVID-19, future changes in expectations for sales, earnings and cash flows related to intangible assets and goodwill below our current projections could cause these assets to be impaired.
We continue to work with our stakeholders (including customers, employees, suppliers and local communities) in an effort to address responsibly this global pandemic. We continue to monitor the situation, to assess further possible implications to our employees, business, supply chain and customers, and to take certain actions in an effort to mitigate various adverse consequences.
We expect that the longer the COVID-19 pandemic, including its economic disruption, continues, the greater the adverse impact on our business operations, financial performance and results of operations could be. Given the tremendous uncertainties and variables, we cannot at this time predict the impact of the global COVID-19 pandemic, or any future pandemic, but any one could have a material adverse impact on our business, financial position, results of operations and/or cash flows.
RISKS RELATED TO INTERNATIONAL OPERATIONS
A growing portion of our sales may be derived from our international operations, which exposes us to certain risks inherent in doing business on an international level.
For the fiscal year ended December 31, 2020, approximately 58% of our consolidated net sales were to customers outside of the United States. We intend to continue to expand our international operations, including in emerging markets, in the future. Our global headquarters for the Transit group is located in France, and we conduct other international operations
through a variety of wholly and majority-owned subsidiaries and joint ventures, including in Australia, Austria, Brazil, Canada, China, Czech Republic, France, Germany, India, Italy, Macedonia, Mexico, the Netherlands, Poland, Russia, Spain, South Africa, Turkey, and the United Kingdom. As a result, we are subject to various risks, any one of which could have a material adverse effect on those operations and on our business as a whole, including:
•lack of complete operating control;
•lack of local business experience;
•currency exchange fluctuations and devaluations;
•restrictions on currency conversion or the transfer of funds or limitations on our ability to repatriate income or capital;
•the complexities of operating within multiple tax jurisdictions;
•foreign trade restrictions and exchange controls;
•adverse impacts of international trade policies, such as import quotas, capital controls or tariffs;
•difficulty enforcing agreements and intellectual property rights;
•the challenges of complying with complex and changing laws, regulations, and policies of foreign governments;
•the difficulties involved in staffing and managing widespread operations;
•the potential for nationalization of enterprises;
•economic, political and social instability;
•possible local catastrophes, such as natural disasters and epidemics; and
•possible terrorist attacks, conflicts and wars, including those against American interests.
Our exposure to the risks associated with international operations may intensify if our international operations expand in the future.
We may incur increased costs due to fluctuations in interest rates and foreign currency exchange rates
In the ordinary course of business, we are exposed to increases in interest rates that may adversely affect funding costs associated with variable-rate debt and changes in foreign currency exchange rates. We are subject to currency exchange rate risk to the extent that our costs may be denominated in currencies other than those in which we earn and report revenues and vice versa. In addition, a decrease in the value of any of these currencies relative to the U.S. dollar could reduce our profits from non-U.S. operations and the translated value of the net assets of our non-U.S. operations when reported in U.S. dollars in our consolidated financial statements. We may seek to minimize these risks through the use of interest rate swap contracts and currency hedging agreements. There can be no assurance that any of these measures will be effective. Material changes in interest or exchange rates could result in material losses to us.
We have substantial operations located in emerging markets, and are subject to regulatory, economic, social and political uncertainties in such markets.
We have substantial operations located in emerging markets, such as Brazil, India, Kazakhstan, the Russian Federation and Ukraine. Operations in such emerging markets are inherently risky due to a number of regulatory, economic, social and political uncertainties. These risks include economies that may be dependent on only a few products and are therefore subject to significant fluctuations, weak legal systems which may affect our ability to enforce contractual rights, possible exchange controls, unstable governments, nationalization or privatization actions or other government actions affecting the flow of goods and currency.
Significant changes in economic and regulatory policy in emerging countries as well as social or political uncertainties could significantly harm business and economic conditions in these markets generally and could disproportionately impact the rail industry, which could adversely affect our business and prospects in these markets.
In addition, physical and financial infrastructure may be less developed in some emerging countries than that of many developed nations. Any disruptions with respect to banking and financial infrastructure, communication systems or any public facility, including transportation infrastructure, could disrupt our normal business activity. Such disruptions could interrupt our business operations and significantly harm our results of operations, financial condition and cash flows.
RISKS RELATED TO MACRO-ECONOMIC CONDITIONS AND POLICIES
Prolonged unfavorable economic and market conditions could adversely affect our business.
Unfavorable general economic and market conditions in the United States and internationally, particularly in our key end markets, could have a negative impact on our sales and operations. To the extent that these factors result in continued instability of capital markets, shortages of raw materials or component parts, longer sales cycles, deferral or delay of customer orders or an inability to market our products effectively, our business and results of operations could be materially adversely affected.
We may be exposed to raw material shortages, supply shortages and fluctuations in raw material, energy and commodity prices.
We purchase energy, steel, aluminum, copper, rubber and rubber-based materials, chemicals, polymers and other key manufacturing inputs from outside sources, and traditionally have not had long-term pricing contracts with our pure raw material suppliers. The costs of these raw materials have been volatile historically and are influenced by factors that are outside our control. If we are unable to pass increases in the costs of our raw materials on to our customers, experience a lag in our ability to pass increases to our customers, or operational efficiencies are not achieved, our operating margins and results of operations may be materially adversely affected.
Our businesses compete globally for key production inputs. In addition, we rely upon third-party suppliers, including certain single-sourced suppliers, for various components for our products. In the event of a shortage or discontinuation of certain raw materials or key inputs, we may experience challenges sourcing certain of our components to meet our production requirements and may not be able to arrange for alternative sources of certain raw materials or key inputs. Any such shortage may materially adversely affect our competitive position versus companies that are able to better or more cheaply source such raw materials or key inputs.
Changes to international trade policies, including tariffs and foreign trade restrictions, could adversely affect our business.
As a global transportation company, we generate export sales from our U.S. operations and also derive international sales through our foreign subsidiaries, licensees and joint ventures. We also do business with industry suppliers located in various international markets. A protectionist trade environment in either the United States or those foreign countries in which we do business, such as a change in the current tariff structures, export compliance or other trade policies, may adversely affect our business. In particular, such policies may impact or delay our customers' investments in our products, reduce the competitiveness of our products in certain markets, and inhibit our ability to cost-effectively purchase necessary inputs from certain suppliers. In addition, to the extent developments in international trade relations result in reduced global trade or slower growth in global trade, it is likely that this would result in reductions in investment in freight and transit rail.
International trade policies are affected by a diverse array of factors, including global and national economic and political conditions, which make it impossible for us to predict future developments regarding tariffs and other trade restrictions. Although we actively monitor developments in international trade and proactively engage in efforts to mitigate the effect of trade policies, there can be no guarantee that these efforts will be successful.
LEGAL AND REGULATORY RISKS
We are subject to a variety of laws and regulations, including anti-corruption laws, in various jurisdictions.
We are subject to various laws, rules and regulations administered by authorities in jurisdictions in which we do business, such as the anti-corruption laws of the U.S. Foreign Corrupt Practices Act, the French Law n° 2016-1691 (Sapin II) and the U.K. Bribery Act, relating to our business and our employees. We are also subject to other laws and regulations governing our international operations, including regulations administered by the U.S. Department of Commerce’s Bureau of Industry and Security, the U.S. Department of Treasury’s Office of Foreign Assets Control, and various non-U.S. government entities, including applicable export control regulations, economic sanctions on countries and persons, customs requirements, currency exchange regulations, and transfer pricing regulations. Despite our policies, procedures and compliance programs, our internal controls and compliance systems may not be able to protect us from prohibited acts willfully committed by our employees, agents or business partners that would violate such applicable laws and regulations. Any such improper acts could damage our reputation, subject us to civil or criminal judgments, fines or penalties, and could otherwise disrupt our business, and as a result, could materially adversely impact our business, results of operations and financial condition.
In addition, our manufacturing operations are subject to safety, operations, maintenance and mechanical standards, rules and regulations enforced by various federal and state agencies and industry organizations both domestically and internationally. Our business may be adversely impacted by new rules and regulations or changes to existing rules or regulations, which could require additional maintenance or substantial modification or refurbishment of certain of our products or could make such products obsolete or require them to be phased out prior to their useful lives. We are unable to predict what impact these or other regulatory changes may have, if any, on our business or the industry as a whole. We cannot assure that costs incurred to comply with any new standards or regulations will not be material to our business, results of operations and financial condition.
We are subject to a variety of environmental laws and regulations.
We are subject to a variety of increasingly stringent environmental laws and regulations governing discharges to air and water, substances in products, the handling, storage and disposal of hazardous or solid waste materials and the remediation of contamination associated with releases of hazardous substances. We have incurred, and will continue to incur, both operating and capital costs to comply with environmental laws and regulations, including costs associated with the clean-up and investigation of some of our current and former properties and offsite disposal locations. We believe our operations currently comply in all material respects with all of the various environmental laws and regulations applicable to our business; however, there can be no assurance that environmental requirements will not change in the future or that we will not incur significant costs to comply with such requirements. Failure to comply with environmental laws and regulations could have significant consequences on our business and results of operations, including the imposition of substantial fines and sanctions for violations, injunctive relief (including requirements that we limit or cease operations at affected facilities), and reputational risk.
In addition, certain of our products are subject to extensive, and increasingly stringent, statutory and regulatory requirements governing, e.g., emissions and noise, including standards imposed by the U.S. Environmental Protection Agency, the European Union and other regulatory agencies around the world. We have made, and will continue to make, significant capital and research expenditures relating to compliance with these standards. The successful development and introduction of new and enhanced products in order to comply with new regulatory requirements are subject to other risks, such as delays in product development, cost over-runs and unanticipated technical and manufacturing difficulties. In addition to these risks, the nature and timing of government implementation and enforcement of these standards-particularly in emerging markets-are unpredictable and subject to change.
Future climate change regulation could result in increased operating costs, affect the demand for our products or affect the ability of our critical suppliers to meet our needs.
The potential challenges posed by evolving climate change policy and prospective legislation are heavily dependent on the nature and degree of climate change legislation and the extent to which it applies to our industry. While we are carefully monitoring developments and reviewing the challenges associated with alternative proposals, at this time, we cannot predict the ultimate impact of climate change and climate change legislation on our operations. Further, when or if these impacts may occur cannot be assessed until legislative policy is more developed and specific legislative proposals begin to take shape. Any laws or regulations that may be adopted to restrict or reduce emissions of greenhouse gas could require us to incur increased operating costs and could have an adverse effect on demand for our products. In addition, the price and availability of certain of the raw materials that we use could vary in the future as a result of environmental laws and regulations affecting our suppliers. An increase in the price of our raw materials or a decline in their availability could adversely affect our operating margins or result in reduced demand for our products.
The occurrence of litigation in which we are, or could be, named as a defendant is unpredictable.
From time to time, we are subject, directly or through our subsidiaries, to litigation or other commercial disputes and other legal and regulatory proceedings with respect to our business, customers, suppliers, creditors, stockholders, product liability (including, asbestos claims), intellectual property infringement, competition and antitrust claims, warranty claims or environmental-related matters.
Due to the inherent uncertainties of any litigation, commercial disputes or other legal or regulatory proceedings, we cannot accurately predict their ultimate outcome, including the outcome of any related appeals. We may incur significant expense to defend or otherwise address current or future claims. Although we maintain insurance policies for certain risks, we cannot make assurances that this insurance will be adequate to protect us from all material judgments and expenses related to potential future claims or that these levels of insurance will be available in the future at economical prices or at all. In addition, although in some cases we may be indemnified by non-affiliated entities that retain liabilities in connection with specific matters, there can be no assurance that these indemnitors will remain financially viable and capable of satisfying their obligations.
Any litigation, even a claim without merit, could result in substantial costs and diversion of resources and could have a material adverse effect on our business and results of operations.
Our manufacturer’s warranties or product liability may expose us to potentially significant claims.
We warrant the workmanship and materials of many of our products. Accordingly, we are subject to a risk of product liability or warranty claims in the event that the failure of any of our products results in personal injury or death or does not conform to our customers’ specifications. In addition, in recent years, we have introduced a number of new products for which we do not have a history of warranty experience. Although we currently maintain liability insurance coverage, we cannot assure that product liability claims, if made, would not exceed our insurance coverage limits or that insurance will continue to be available on commercially acceptable terms, if at all. The possibility exists for these types of warranty claims to result in costly product recalls, significant repair costs and damage to our reputation.
RISKS RELATED TO DATA SECURITY AND INTELLECTUAL PROPERTY
If we are not able to protect our intellectual property and other proprietary rights, we may be adversely affected.
Our success can be impacted by our ability to protect our intellectual property and other proprietary rights. We rely primarily on patents, trademarks, copyrights, trade secrets and unfair competition laws, as well as license agreements and other contractual provisions, to protect our intellectual property and other proprietary rights. However, filing, prosecuting and defending patents on our products in all countries and jurisdictions throughout the world would be prohibitively expensive. Moreover, existing U.S. legal standards relating to the validity, enforceability and scope of protection of intellectual property rights offer only limited protection, may not provide us with any competitive advantages and may be challenged by third parties. The laws of countries other than the United States may be even less protective of intellectual property rights. As a result, a significant portion of our technology is not patented, and we may be unable or may not seek to obtain patent protection for this technology. Further, although we routinely conduct anti-counterfeiting activities in multiple jurisdictions, we have encountered counterfeit reproductions of our products or products that otherwise infringe on our intellectual property rights. Counterfeit components of low quality may negatively impact our brand value. Accordingly, despite our efforts, we may be unable to prevent third parties from infringing upon, counterfeiting or misappropriating our intellectual property or otherwise gaining access to our technology. If we fail to protect our intellectual property and other proprietary rights, then our business, results of operations and financial condition could be negatively impacted.
In addition, we operate in industries in which there are many third-party owners of intellectual property rights. Owners of intellectual property that we need to conduct our business as it evolves may be unwilling to license such intellectual property rights to us on terms we consider reasonable. Third party intellectual property owners may assert infringement claims against us based on their intellectual property portfolios. If we are sued for intellectual property infringement, we may incur significant expenses investigating and defending such claims, even if we prevail.
We face cybersecurity and data protection risks relating to cyber attacks and information technology failures that could cause loss of confidential information and other business disruptions.
We rely extensively on information technology in our business. We also collect, process, and retain sensitive and confidential customer information, including proprietary business information, personal data and other information that may be subject to privacy and security laws, regulations and/or customer-imposed data protection controls. We also provide technological products integral to train operation. Accordingly, our business may be adversely impacted by disruptions to our own or third-party information technology infrastructure, which could result from individual or highly-coordinated cyber attacks, including but not limited to data theft, system breaches, malfeasance or improper use or unauthorized access to IT systems. Our business may also be adversely impacted by unintentional technology disruptions, including those resulting from programming errors, employee operational errors and software defects.
RISKS RELATED TO HUMAN CAPITAL
Labor shortages and labor disputes may have a material adverse effect on our operations and profitability.
We depend on skilled labor in our manufacturing and other businesses. Due to the competitive nature of the labor markets in which we operate, we may not be able to retain, recruit and train the personnel we require, particularly when the economy expands, production rates are high or competition for such skilled labor increases.
We collectively bargain with labor unions at some of our operations throughout the world. Failure to reach an agreement could result in strikes or other labor protests which could disrupt our operations. Furthermore, non-union employees in certain countries have the right to strike. If we were to experience a strike or work stoppage, it would be difficult for us to find a sufficient number of employees with the necessary skills to replace these employees. We cannot assure that we will reach any such agreement or that we will not encounter strikes or other types of conflicts with the labor unions of our personnel.
Any such labor shortages or labor disputes could have an adverse effect on our business, results of operations and financial condition, could cause us to lose revenues and customers and might have permanent effects on our business.
We rely on our management team and other key personnel.
We depend on the skills, working relationships, and continued services of key personnel, including our experienced management team, and other key employees. In addition, our ability to achieve our operating goals depends on our ability to identify, hire, train, and retain qualified individuals. We compete with other companies both within and outside of our industry for talented personnel, and we may lose key personnel or fail to attract, train, and retain other talented personnel. Any such loss or failure could adversely affect our product sales, financial condition, and operating results. If we lose key personnel, because they terminate their employment or retire, or as a result of illness, disability or death, or if an insufficient number of employees is retained to maintain effective operations, our business activities may be adversely affected and our management team's attention may be diverted. In addition, we may not be able to locate suitable replacements for any key personnel that we lose, or
we may not be able to hire potential replacements on reasonable terms, all of which could adversely affect our product sales, financial condition, and operating results.
RISKS RELATED TO OUR INDEBTEDNESS
Our indebtedness could adversely affect our financial health.
At December 31, 2020, we had total debt of $4.2 billion, including $3.5 billion related to senior notes and $0.7 billion related to term loans and amounts drawn under our revolving loan facility, in each case, under the Senior Credit Facility. Being indebted could have important consequences to us. For example, our indebtedness could:
•increase our vulnerability to general adverse economic and industry conditions;
•require us to dedicate a substantial portion of our cash flow from operations to payments on our indebtedness, thereby reducing the availability of our cash flow to fund working capital, capital expenditures, acquisitions and other general corporate purposes;
•limit our flexibility in planning for, or reacting to, changes in our business and the industries in which we operate;
•place us at a disadvantage compared to competitors that have less debt; and
•limit our ability to borrow additional funds.
The indentures for our outstanding senior notes and our Credit Agreement contain various covenants that limit our management’s discretion in the operation of our businesses.
Our Credit Agreement subjects us to customary (i) affirmative covenants, including requirements with respect to certain reporting obligations on us and our subsidiaries, and (ii) negative covenants, including limitations on: indebtedness; liens; restricted payments; fundamental changes (including certain changes in control); business activities; transactions with affiliates; restrictive agreements; changes in fiscal year; and use of proceeds. In addition, we are required to maintain (i) a ratio of EBITDA to interest expense of at least 3.00 to 1.00 over each period of four consecutive fiscal quarters ending on the last day of a fiscal quarter and (ii) a Leverage Ratio, calculated as of the last day of a fiscal quarter for a period of four consecutive fiscal quarters, of 3.25 to 1.00 or less; provided that, in connection with the acquisition of GE Transportation and in the event of any further material acquisition in which the cash consideration to be paid exceeds $500.0 million, the maximum Leverage Ratio permitted adjusts to (x) 3.75 to 1.00 at the end of the fiscal quarter in which such acquisition is consummated and each of the three fiscal quarters immediately following such fiscal quarter and (y) 3.50 to 1.00 at the end of each of the fourth and fifth full fiscal quarters after the consummation of such acquisition.
The indentures under which our senior notes were issued contain covenants and restrictions which limit, subject to certain exceptions, certain sale and leaseback transactions with respect to principal properties, the incurrence of secured debt without equally and ratably securing the senior notes and certain merger and consolidation transactions. In addition, the indentures require that we offer to repurchase our outstanding senior notes upon the occurrence of certain change of control triggering events.
| | | | | |
| Item 1B. | UNRESOLVED STAFF COMMENTS |
None.
Facilities
The following table provides certain summary information about the principal facilities owned or leased by the Company as of December 31, 2020. The Company believes that its facilities and equipment are generally in good condition and that, together with scheduled capital improvements, they are adequate for its present and immediately projected needs. Leases on the facilities are mainly long-term and generally include options to renew.
| | | | | | | | | | | | | | | | | | | | | | | | | | | | | | | | |
Location | | Primary Use | | Segment | | Own/Lease | | Approximate Square Feet |
| Domestic | | | | | | | | | | |
| Erie, PA | | Manufacturing/Warehouse/Office | | Freight | | Own | | 3,800,000 | | | |
| Grove City, PA | | Manufacturing/Warehouse | | Freight | | Own | | 486,000 | | | |
| Wilmerding, PA | | Manufacturing/Service | | Freight | | Own | | 365,000 | | | (1) | |
| Salem, VA | | Manufacturing | | Freight | | Own | | 320,000 | | | |
| Justin, Texas | | Manufacturing/Warehouse | | Freight | | Own | | 305,000 | | | |
| Fort Worth, Texas | | Manufacturing/Warehouse | | Freight | | Own | | 304,000 | | | |
| Houston, Texas | | Manufacturing/Service | | Freight | | Own | | 280,000 | | | |
| Hanover Park, Illinois | | Manufacturing | | Freight | | Lease | | 250,000 | | | |
| Pittsburgh, PA | | Office | | Global HQ | | Lease | | 84,000 | | | |
| | | | | | | | | | |
| International | | | | | | | | | | |
| Shenyang, China | | Manufacturing/Warehouse/Office | | Transit | | Own | | 336,000 | | | |
| Doncaster, UK | | Manufacturing | | Transit | | Own | | 330,000 | | | |
| Changzhou, China | | Manufacturing | | Transit | | Own | | 316,000 | | | |
| Northampton, UK | | Manufacturing | | Freight | | Lease | | 300,000 | | | |
| Shenyang City, China | | Manufacturing | | Transit | | Lease | | 291,000 | | | |
| Piossasco, Italy | | Manufacturing | | Transit | | Own | | 301,000 | | | |
| Burton on Trent, UK | | Manufacturing/Office | | Transit | | Lease | | 260,000 | | | |
| Bangalore, India | | Manufacturing | | Freight/Transit | | Lease | | 168,000 | | | |
(1)Approximately 250,000 square feet are currently used in connection with the Company’s manufacturing operations. The remainder is leased to a third party.
Additional information with respect to legal proceedings is included in Note 19 of “Notes to Consolidated Financial Statements” included in Part IV, Item 15 of this report and incorporated by reference herein.
| | | | | |
| Item 4. | MINE SAFETY DISCLOSURES |
Not applicable.
PART II
| | | | | |
| Item 5. | MARKET FOR REGISTRANT’S COMMON EQUITY, RELATED STOCKHOLDER MATTERS AND ISSUER PURCHASES OF EQUITY SECURITIES |
The Common Stock of the Company is listed on the New York Stock Exchange under the symbol “WAB.” As of February 12, 2021, there were 188,896,023 shares of Common Stock outstanding held by 119,046 holders of record.
The following performance graph and related information shall not be deemed “soliciting material” or to be “filed” with the Securities and Exchange Commission, nor shall such information be incorporated by reference to any future filings under the Securities Act of 1933 and the Securities Exchange Act of 1934, each as amended, except to the extent that Wabtec specifically incorporates it by reference into such filing. The graph below compares the total stockholder return through December 31, 2020, of Wabtec’s common stock to (i) the S&P 500, (ii) our peer group of manufacturing companies which consists of the following publicly traded companies: AGCO, American Axle & Manufacturing Holdings, AMETEK, Arconic, CSX, Dana, Dover, Flowserve, Fortive, Illinois Tool Works, Navistar International, Norfolk Southern, Oshkosh, Parker-Hannifin, Rockwell Automation, Tenneco, Terex, Textron, WABCO, and Xylem.
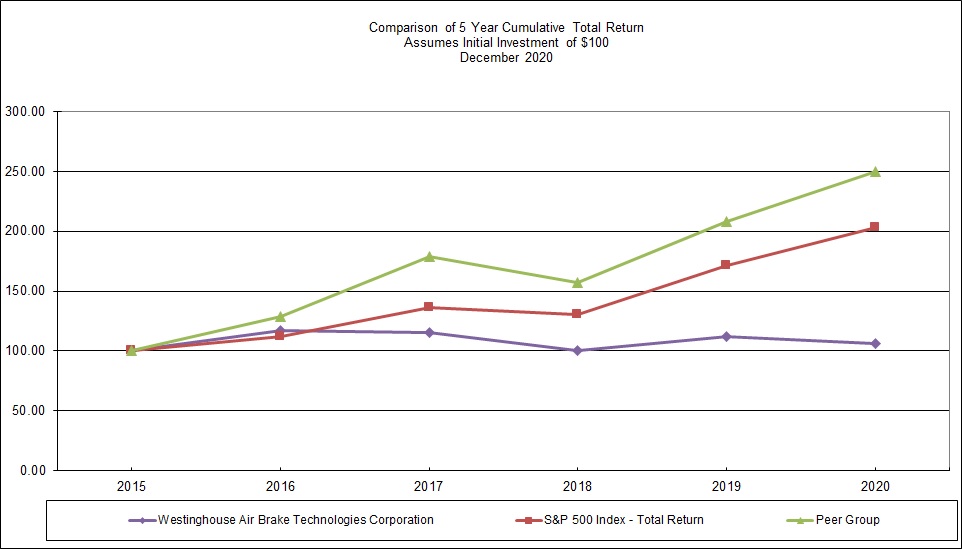
| | | | | | | | | | | | | | | | | | | | | | | | | | |
| Issuer Purchases of Common Stock |
| Month | | Total Number of Shares Purchased | | Average Price Paid per Share | | Total Number of Shares Purchased as Part of Publicly Announced Programs (1) | | Maximum Dollar Value of Shares That May Yet Be Purchased Under the Programs (1) In millions |
| October 2020 | | — | | | $ | — | | | — | | | $ | 394.7 | |
| November 2020 | | 1,096,678 | | | $ | 65.61 | | | 1,096,678 | | | $ | 322.8 | |
| December 2020 | | 407,493 | | | $ | 73.62 | | | 407,493 | | | $ | 292.8 | |
| Total quarter ended December 31, 2020 | | 1,504,171 | | | $ | 67.78 | | | 1,504,171 | | | $ | 292.8 | |
(1) On February 11, 2021, the Board of Directors increased its stock repurchase authorization to increase the amount available for stock repurchases to $500 million of the Company’s outstanding shares. This new stock repurchase authorization supersedes the previous authorization of $500 million, of which $292.5 million remained. No time limit was set for the completion of the program which conforms to the requirements under the Senior Credit Facility, the 364 Day Facility and the Senior Notes currently outstanding. The Company may repurchase shares in the future at any time, depending upon market conditions, our capital needs and other factors. Purchases of shares may be made by open market purchases or privately negotiated purchases and may be made pursuant to Rule 10b5-1 plan or otherwise.
| | | | | |
| Item 6. | SELECTED FINANCIAL DATA |
Not applicable.
| | | | | |
| Item 7. | MANAGEMENT’S DISCUSSION AND ANALYSIS OF FINANCIAL CONDITION AND RESULTS OF OPERATIONS |
OVERVIEW
Wabtec is one of the world’s largest providers of locomotives, value-added, technology-based equipment, systems and services for the global freight rail and passenger transit industries. Our highly engineered products, which are intended to enhance safety, improve productivity and reduce maintenance costs for customers, can be found on most locomotives, freight cars, passenger transit cars and buses around the world. Our products enhance safety, improve productivity and reduce maintenance costs for customers, and many of our core products and services are essential in the safe and efficient operation of freight rail and passenger transit vehicles. Wabtec is a global company with operations in over 50 countries and our products can be found in more than 100 countries throughout the world. In 2020, approximately 58% of the Company’s net sales came from customers outside the U.S.
COVID-19 Update
On March 11, 2020, the World Health Organization designated the outbreak of the novel strain of coronavirus, known as COVID-19, as a global pandemic. Governments and businesses around the world have taken unprecedented actions to mitigate the spread of COVID-19, including but not limited to, shelter-in-place orders, quarantines, significant restrictions on travel, as well as restrictions that prohibit many employees from going to work. Our top concern is, and remains, the health and well-being of our employees around the world. To date, COVID-19 has surfaced in nearly all regions around the world and has impacted our sales channels, supply chain, manufacturing operations, workforce, and other key aspects of our operations. The outbreak and preventive measures taken to help curb the spread, including temporary plant closures in China, India, Italy and other countries where outbreaks and stay-at-home orders were most prevalent had an adverse impact on our operations and business results for the year ended December 31, 2020.
We continue to monitor the situation and guidance from international and domestic authorities, including federal, state, and local public health authorities and may take additional actions based on their recommendations; however, there are numerous uncertainties, including the duration and severity of the pandemic, availability and effectiveness of vaccines, actions that may be taken by governmental authorities and private industry, including preventing or curtailing the operations of our plants, the potential impact on global economic activity, global supply chain operations, our employees, our customers, supplier and end-markets, and other consequences that could negatively impact our business. We also face the possibility that government policies may become more restrictive especially if COVID-19 transmission rates increase in certain areas. As a result of these numerous uncertainties, we are unable to specifically predict the extent and length of time the COVID-19 pandemic will negatively impact our business. COVID-19 had a materially adverse impact on our operations and business results for the year-ended December 31, 2020 which is discussed in the Results of Operations section below and we expect COVID-19 to continue to have a materially adverse impact on our operations and business results into 2021. The future adverse impact may include reduced demand for our products, reduced cash from operations and a volatile effective tax rate driven by changes in earnings mix across the Company’s different jurisdictions. We continue to work with our employees, customers, and suppliers to navigate the impacts of COVID-19. We also continue to assess possible implications to our business, customers, supply chain and end-markets and to take actions in an effort to mitigate adverse consequences.
Management Review and Future Outlook
Wabtec’s long-term financial goals are to drive strong cash flow conversion, maintain a strong credit profile while minimizing our overall cost of capital, increase margins through strict attention to cost controls, drive improved efficiencies across the business, and increase revenues through a focused growth strategy, including product innovation and new technologies, global and market expansion, aftermarket products and services, and acquisitions. In addition, Management evaluates the Company’s current operational performance through measures such as quality and on-time delivery.
The Company primarily serves the worldwide freight and transit rail industries. As such, our operating results are largely dependent on the level of activity, financial condition and capital spending plans of railroads and passenger transit agencies around the world, and transportation equipment manufacturers who serve those markets. Many factors influence these industries, including general economic conditions; traffic volumes, as measured by freight carloads and passenger ridership; government spending on public transportation; and investment in new technologies. In general, trends such as increasing urbanization, a focus on sustainability and environmental awareness, an aging equipment fleet, and growth in global trade are expected to drive continued investment in freight and transit rail.
The Company monitors a variety of factors and statistics to gauge market activity. Freight rail markets around the world are driven primarily by overall economic conditions and activity, while Transit markets are driven primarily by government funding and passenger ridership. Changes in these market drivers can cause fluctuations in demand for Wabtec's products and services.
In 2021 and beyond, general global economic and market conditions will have an impact on our sales and operations. The COVID-19 pandemic has increased the uncertainty around global economic and market conditions. To the extent that these factors cause instability of capital markets, shortages of raw materials or component parts, longer sales cycles, deferral or delay of customer orders or an inability to market our products effectively, our business and results of operations could be materially adversely affected. In addition, we face risks associated with our growth strategy including the level of investment that customers are willing to make in new technologies developed by the industry and the Company, and risks inherent in global expansion. When necessary, we will modify our financial and operating strategies to address changes in market conditions and risks.
ACQUISITION OF GE TRANSPORTATION
Wabtec acquired GE Transportation, a former business unit of GE, on February 25, 2019. For additional information related to this acquisition refer to Note 3 of "Notes to Consolidated Financial Statements" included in Part IV, Item 15 of this report.
RESULTS OF OPERATIONS
Consolidated Results
2020 COMPARED TO 2019
The following table shows our Consolidated Statements of Operations for the years indicated.
| | | | | | | | | | | | | | |
| | | For the year ended December 31, |
| In millions | | 2020 | | 2019 |
| Net sales: | | | | |
| Sales of goods | | $ | 6,233.3 | | | $ | 6,907.9 | |
| Sales of services | | 1,322.8 | | | 1,292.1 | |
| Total net sales | | 7,556.1 | | | 8,200.0 | |
| Cost of sales: | | | | |
| Cost of goods | | (4,629.4) | | | (5,128.4) | |
| Cost of services | | (789.6) | | | (793.6) | |
| Total cost of sales | | (5,419.0) | | | (5,922.0) | |
| Gross profit | | 2,137.1 | | | 2,278.0 | |
| Operating expenses: | | | | |
| Selling, general and administrative expenses | | (948.1) | | | (1,166.6) | |
| Engineering expenses | | (162.1) | | | (209.9) | |
| Amortization expense | | (282.4) | | | (238.4) | |
| Total operating expenses | | (1,392.6) | | | (1,614.9) | |
| Income from operations | | 744.5 | | | 663.1 | |
| Other income and expenses: | | | | |
| Interest expense, net | | (198.9) | | | (219.1) | |
| Other income (expense), net | | 11.6 | | | 2.8 | |
| Income before income taxes | | 557.2 | | | 446.8 | |
| Income tax expense | | (144.9) | | | (120.3) | |
| Net income | | 412.3 | | | 326.5 | |
| Less: Net loss attributable to noncontrolling interest | | 2.1 | | | 0.2 | |
| Net income attributable to Wabtec shareholders | | $ | 414.4 | | | $ | 326.7 | |
The following table shows the major components of the change in net sales in 2020 from 2019:
| | | | | | | | | | | | | | | | | | | | |
| In millions | | Freight Segment | | Transit Segment | | Total |
| 2019 Net Sales | | $ | 5,441.4 | | | $ | 2,758.6 | | | $ | 8,200.0 | |
| Acquisitions | | 543.4 | | | 3.0 | | | 546.4 | |
| Foreign Exchange | | (69.1) | | | 19.1 | | | (50.0) | |
| Organic | | (833.4) | | | (306.9) | | | (1,140.3) | |
| 2020 Net Sales | | $ | 5,082.3 | | | $ | 2,473.8 | | | $ | 7,556.1 | |
Results of operations were negatively impacted during the year ended December 31, 2020 as a result of the COVID-19 pandemic. Management’s discussion below includes analysis as to the impact of the COVID-19 pandemic where it could be explicitly identified; however, in many instances it is difficult to quantify with a high level of certainty the negative impact the COVID-19 pandemic had on our results of operations.
The following discussion compares our results for the year ended December 31, 2020, to the year ended December 31, 2019. The discussion comparing our results for the year ended December 31, 2019 to the year ended December 31, 2018 is included within Management's Discussion and Analysis of Financial Condition and Results of Operation in our Annual Report on Form 10-K for the year ended December 31, 2019, filed with the SEC on February 24, 2020.
Net sales
Net sales decreased by $644 million, or 7.9%, to $7,556 million. The decrease is primarily attributable to an organic decrease of $833 million in the Freight Segment, due to lower locomotive Equipment sales, lower sales in Components from a
reduction of freight carbuilds in 2020 compared to 2019, a decrease in Services sales due to lower freight rail volumes and an increase in parking of locomotives, particularly in North America. The lower freight rail volumes and increased parking of locomotives is partially due to the COVID-19 pandemic and its impact on the economy. The Transit Segment experienced an organic decrease in sales of $307 million, primarily due to COVID-19 related production delays and reduced passenger traffic. The decrease is partially offset by sales from acquisitions of $546 million, mainly, the acquisition of GE Transportation. Unfavorable changes in foreign currency exchange rates reduced net sales by $50 million.
Cost of sales
Cost of sales decreased by $503 million to $5,419 million in 2020 compared to $5,922 million in 2019. The decrease is primarily due to the sales decreases discussed above. Cost of sales in 2020 includes $44 million of restructuring costs, primarily for footprint rationalization and related headcount reductions as part of the ongoing integration actions related to the GE Transportation acquisition and in response to the COVID-19 pandemic. Cost of sales in 2019 included a $185 million charge related to purchase price accounting for the step-up of GE Transportation inventory and $38 million of restructuring costs, primarily for footprint rationalization and related headcount actions. Excluding these charges in both years, cost of sales as a percentage of sales was 71.1% in 2020 and 69.5% in 2019, representing a 1.6% increase. The increase can be attributed to an unfavorable sales mix, lower absorption of overhead costs due to the decrease in sales volumes, increased parking of locomotives, and lower rail passenger traffic. This was partially offset by increased synergy savings related to the GE Transportation acquisition and actions taken to reduce costs in response to the COVID-19 pandemic.
Operating expenses
Total operating expenses decreased $222 million to 18.4% of net sales in 2020 compared to 19.7% in 2019. Restructuring and transaction costs, primarily for headcount actions and costs related to acquisition of GE Transportation, included in SG&A were $71 million and $192 million for the year ended December 31, 2020 and 2019, respectively. Additionally, SG&A expenses decreased $155 million related to the acquisition synergy savings, reduced employee benefit costs, cost reduction initiatives and lower sales volumes, partially offset by $57 million of incremental expense from acquisitions. Engineering expense decreased $48 million due to cost control measures on research and development projects partially offset by incremental expense from acquisitions. Amortization expense increased $44 million, due to the acquisition of GE Transportation.
Interest expense, net
Interest expense, net, decreased $20 million in the 2020 over the same period in 2019 attributable to lower variable interest rates and lower overall average debt balances in 2020.
Other income (expense), net
Other expense, net, was $12 million of income in 2020 compared to $3 million of income in the same period of 2019. The variance is primarily driven by lower foreign exchange losses in the current year and an increase in income from equity method investments.
Income taxes
The effective income tax rate was 26.0% and 26.9% in 2020 and 2019, respectively. The decrease in the effective tax rate in 2020 is primarily the result of non-deductible transaction related expenses incurred during 2019 as a result of the GE Transportation acquisition that did not recur in 2020 and a decrease in the estimated liabilities resulting from provisions of the Tax Cuts and Jobs Act that were recognized in 2019.
Freight Segment
The following table shows our Consolidated Statements of Operations for our Freight Segment:
| | | | | | | | | | | | | | |
| | For the year ended December 31, |
| In millions | | 2020 | | 2019 |
| Net sales: | | | | |
| Sales of goods | | $ | 3,790.1 | | | $ | 4,186.5 | |
| Sales of services | | 1,292.2 | | | 1,254.9 | |
| Total net sales | | 5,082.3 | | | 5,441.4 | |
| Cost of sales: | | | | |
| Cost of goods | | (2,829.5) | | | (3,096.5) | |
| Cost of services | | (764.8) | | | (763.5) | |
| Total cost of sales | | (3,594.3) | | | (3,860.0) | |
| | | | |
| Gross profit | | 1,488.0 | | | 1,581.4 | |
| | | | |
| Operating expenses | | (904.1) | | | (938.5) | |
| | | | |
| Income from operations ($) | | 583.9 | | | 642.9 | |
| Income from operations (%) | | 11.5 | % | | 11.8 | % |
The following table shows the major components of the change in net sales for the Freight Segment in 2020 from 2019:
| | | | | | | | |
| In millions | | |
| 2019 Net Sales | | $ | 5,441.4 | |
| Acquisitions | | 543.4 | |
| Changes in Sales by Product Line | | |
| Equipment | | (333.9) | |
| Components | | (258.7) | |
| Digital Electronics | | (51.8) | |
| Services | | (189.0) | |
| Foreign Exchange | | (69.1) | |
| 2020 Net Sales | | $ | 5,082.3 | |
Net sales
Freight Segment sales decreased by $359 million, or 6.6%, to $5,082 million, primarily due to an organic decrease of $833 million due to lower locomotive Equipment Sales, lower sales in Components from a reduction of freight carbuilds in 2020 compared to 2019, and a decrease in Services sales due to lower freight rail volumes and an increase in parking of locomotives, particularly in North America. The lower freight rail volumes and increased parking of locomotives is partially due to the COVID-19 pandemic and its impact on the economy. These decreases were partially offset by sales from acquisitions of $543 million, primarily related to GE Transportation. Unfavorable foreign currency exchange rates decreased sales by $69 million.
Cost of sales
Freight Segment cost of sales decreased by $266 million to $3,594 million in 2020. The decrease is attributable to the organic sales decrease discussed above, partially offset by $391 million of incremental cost of sales from acquisitions, mainly the acquisition of GE Transportation. Included in cost of sales in 2020 is $30 million of restructuring costs, primarily for costs for footprint rationalization, and related headcount actions as part of the ongoing integration actions related to the GE Transportation acquisition and in response to the COVID-19 pandemic. Cost of sales in 2019 includes a $185 million charge related to purchase price accounting for the step-up of GE Transportation inventory and $34 million of restructuring costs, primarily for costs for footprint rationalization and related headcount reductions to integrate our combined businesses. Excluding these charges, cost of sales as a percentage of sales was 70.1% in 2020 and 66.9% in 2019, representing a 3.2 percentage point increase. The increase can be attributed to an unfavorable sales mix and lower absorption of overhead costs due to the decrease in organic sales volumes partially offset by increased synergy savings related to the GE Transportation acquisition and efforts to reduce costs in response to the COVID-19 pandemic.
Operating expenses
Freight Segment operating expenses decreased $34 million, or 3.6%, in 2020 to 17.8% of sales. Restructuring and transaction costs, primarily for headcount actions and costs related to acquisition of GE Transportation, included in SG&A were $46 million and $33 million for the years ended December 31, 2020 and 2019, respectively. SG&A expenses, excluding restructuring and transaction costs in both years, decreased $116 million primarily due to synergy savings, a reduction in employee benefit costs, and lower sales volumes partially offset by $56 million in incremental expense from acquisitions, primarily GE Transportation. Additionally, engineering expense decreased $32 million due to cost control measures on research and development projects partially offset by incremental expense from acquisitions. Amortization expense increased $44 million, due to the acquisition of GE Transportation
Transit Segment
The following table shows our Consolidated Statements of Operations for our Transit Segment:
| | | | | | | | | | | | | | |
| | For the year ended December 31, |
| In millions | | 2020 | | 2019 |
| Net sales | | $ | 2,473.8 | | | $ | 2,758.6 | |
| Cost of sales | | (1,824.7) | | | (2,062.0) | |
| Gross profit | | 649.1 | | | 696.6 | |
| | | | |
| Operating expenses | | (419.4) | | | (482.2) | |
| | | | |
| Income from operations ($) | | 229.7 | | | 214.4 | |
| Income from operations (%) | | 9.3 | % | | 7.8 | % |
The following table shows the major components of the change in net sales for the Transit Segment in 2020 from 2019:
| | | | | | | | |
| In millions | | |
| 2019 Net Sales | | $ | 2,758.6 | |
| Acquisitions | | 3.0 | |
| Changes in Sales by Product Line | | |
| Original Equipment Manufacturing | | (158.7) | |
| Aftermarket | | (148.2) | |
| Foreign Exchange | | 19.1 | |
| 2020 Net Sales | | $ | 2,473.8 | |
Net sales
Transit Segment net sales decreased by $285 million, or 10.3%, primarily due to disruptions to our operations caused by the COVID-19 pandemic, particularly in Asia and Europe. This impact was felt in both the Original Equipment Manufacturing and Aftermarket product lines as the pandemic lead to shutdowns that affected factory output and ridership levels. Favorable foreign currency exchange rate changes increased net sales by $19 million.
Cost of sales
Transit Segment cost of sales decreased by $237 million to $1,825 million in 2020 primarily due to the reduction in sales. Cost of sales in 2020 includes $14 million of restructuring costs primarily for footprint rationalization in the UK. Cost of Sales in 2019 included $5 million of restructuring costs primarily related to headcount actions and footprint rationalization. Excluding these costs, cost of sales as a percentage of sales was 73.2%, a 1.4 percentage point decrease over the comparable period in 2019, attributable to improved operational performance.
Operating expenses
Transit Segment operating expenses decreased $63 million to $419 million, or 12.9% in 2020 to 17.0% of net sales. SG&A expenses decreased $47 million in 2020, primarily due to lower sales and cost saving initiatives put in place to offset the adverse impact of COVID-19 and reduced employee benefit costs. SG&A included restructuring charges, mainly for severance, of $14 million and $13 million for the year ended December 31, 2020 and 2019, respectively. Engineering expense decreased $16 million due to cost savings measures put in place as a result of the COVID-19 pandemic and amortization expense remained consistent year over year. The combination of improved operational performance and cost saving initiatives mentioned above have resulted in a 200 basis point operating margin improvement in 2020 from 2019.
Liquidity and Capital Resources
Liquidity is provided by operating cash flow and borrowings under the Company’s Senior Notes and unsecured credit facility with a consortium of commercial banks. The following is a summary of selected cash flow information and other relevant data:
| | | | | | | | | | | | | | | | | | | | |
| | For the year ended
December 31, |
| In millions | | 2020 | | 2019 | | 2018 |
| Cash provided by (used for): | | | | | | |
| Operating activities | | $ | 783.7 | | | $ | 1,015.5 | | | $ | 314.7 | |
| Investing activities | | (155.4) | | | (3,177.8) | | | (147.3) | |
| Financing activities: | | | | | | |
| Proceeds from debt | | 3,878.0 | | | 3,982.4 | | | 3,480.7 | |
| Payments of debt | | (4,077.3) | | | (3,423.6) | | | (1,454.0) | |
| Cash dividends | | (92.5) | | | (81.7) | | | (46.3) | |
Operating activities. Cash provided by operations in 2020 was $784 million compared with $1,016 million in 2019. In comparison to 2019, cash provided by operations decreased due to an unfavorable change in other assets and liabilities of $492 million primarily due to the timing of payments related to accrued expenses including litigation settlements, unfavorable change in accounts payable of $125 million due to the timing of payments to suppliers, an unfavorable change in accrued liabilities and customer deposits of $80 million primarily related to the timing of accrued compensation payments and an unfavorable change in inventory of $75 million . These unfavorable changes were offset by higher net income of $86 million, a favorable change in non-cash items of $35 million related primarily to increased depreciation and amortization as a result of the acquisition of GE Transportation, and a favorable change in accounts receivable of $321 million due to improved collections and the acceleration of collections due to the newly implemented Revolving Receivable Program.
Investing activities. In 2020 and 2019, cash used in investing activities was $155 million and $3,178 million, respectively. The major components of the cash outflow in 2020 was planned additions to property, plant, and equipment of $136 million for continued investments in our facilities and manufacturing processes, and $40 million in net cash paid for various small acquisitions. The major components of the cash outflow in 2019 was $185 million for additions to property, plant, and equipment and $2,996 million in net cash paid for various acquisitions, primarily GE Transportation.
Financing activities. In 2020, cash used for financing activities was $619 million, which included net debt payments of $199 million, $115 million of contingent consideration payments, $93 million of dividend payments, and $207 million for share repurchases. In 2019, cash provided by financing activities was $462 million, which included net proceeds from debt of $559 million and dividend payments of $82 million.
The COVID-19 pandemic had an adverse impact on cash from operating activities for the year ended December 31, 2020, and management expects the COVID-19 pandemic to negatively impact cash from operations into 2021. The extent and length of time in which the Company’s cash from operations will be negatively impacted is uncertain. Because of this uncertainty, the Company took prudent measures to decrease cash used for investing activities in 2020. Additionally, the Company implemented new debt arrangements and a receivables securitization program (described below) as part of its liquidity planning. These measures further strengthen our liquidity position as we address the impacts of the COVID-19 pandemic. Management continues to monitor the rapidly evolving situation and will periodically reassess and adjust the Company’s cash management strategy as circumstances dictate.
As of December 31, 2020, the Company held approximately $599 million of cash and cash equivalents. Of this amount, approximately $108 million was held within the United States and approximately $491 million was held outside of the United States, primarily in Europe, India and China. While repatriation of some cash held outside the United States may be restricted by local laws, most of the Company’s foreign cash could be repatriated to the United States.
Additional information with respect to Senior Notes, credit facilities and long-term debt is included in Note 8 of "Notes to Consolidated Financial Statements” included in Part IV, Item 15 of this report.
Revolving Receivables Program
In May 2020, the Company entered into a revolving agreement to transfer up to $150.0 million of certain receivables of certain subsidiaries of the Company (the "Originators") through our bankruptcy-remote subsidiary to a financial institution on a recurring basis in exchange for cash equal to the gross receivables transferred. Additional information with respect to the Revolving Receivables Program is included in Note 2 of "Notes to Consolidated Financial Statements" included in Part IV, Item 15 of this report and referenced herein.
Supply Chain Financing Program
The Company has entered into supply chain financing arrangements with third-party financial institutions to provide our vendors with enhanced payment options. This arrangement does not change the payable terms negotiated by the Company and our vendors and does not result in a change in the classification of amounts due as accounts payable in the Consolidated Balance Sheet.
Guarantor Summarized Financial Information
The obligations under the Company's Senior Notes, Senior Credit Facility and 364 Day Facility have been fully and unconditionally guaranteed by certain of the Company's U.S. subsidiaries. Each guarantor is 100% owned by the parent company, with the exception of GE Transportation, a Wabtec Company, which has 15,000 shares outstanding of Class A Non-Voting Preferred Stock held by General Electric Company.
The following tables present summarized financial information of the parent and the guarantor subsidiaries on a combined basis. The combined summarized financial information eliminates intercompany balances and transactions among the parent and guarantor subsidiaries and equity in earnings and investments in any guarantor subsidiaries or non-guarantor subsidiaries. The summarized financial information is provided in accordance with the reporting requirements of Rule 13-01 under SEC Regulation S-X for the issuer and guarantor subsidiaries.
Summarized Statement of Income
| | | | | | | | |
| | Unaudited |
| | Westinghouse Air Brake Technologies Corp. and Guarantor Subsidiaries |
| In millions | | Year Ended December 31, 2020 |
| Net sales | | $ | 4,047.9 | |
| Gross profit | | 930.4 | |
| Net income attributable to Wabtec shareholders | | 437.4 | |
Summarized Balance Sheet
| | | | | | | | | | | | | | |
| | Unaudited |
| | Westinghouse Air Brake Technologies Corp. and Guarantor Subsidiaries |
| In millions | | December 31, 2020 | | December 31, 2019 |
| Current assets | | $ | 1,092.3 | | | $ | 1,360.1 | |
| Noncurrent assets | | 1,835.7 | | | 1,974.3 | |
| Current liabilities | | 1,408.8 | | | 1,695.6 | |
| Long-term debt | | 3,779.6 | | | 4,321.8 | |
| Other non-current liabilities | | 373.9 | | | 539.2 | |
The following is a description of the transactions between the combined Westinghouse Air Brake Technologies Corp. and guarantor subsidiaries with non-guarantor subsidiaries.
| | | | | | | | |
| | Unaudited |
| | Westinghouse Air Brake Technologies Corp. and Guarantor Subsidiaries |
| In millions | | Year Ended December 31, 2020 |
| Net sales to Non-Guarantor Subsidiaries | | $ | 674.7 | |
| Purchases from Non-Guarantor Subsidiaries | | 1,895.9 | |
| | |
| | Unaudited |
| | Westinghouse Air Brake Technologies Corp. and Guarantor Subsidiaries |
| In millions | | December 31, 2020 |
| Amount due from/(to) Non-Guarantor Subsidiaries | | $ | (469.6) | |
Contractual Obligations and Off-Balance Sheet Arrangements
The Company is obligated to make future payments under various contracts such as debt agreements, lease agreements and has certain contingent commitments such as debt guarantees. The Company has grouped these contractual obligations and off-balance sheet arrangements into operating activities, financing activities, and investing activities in the same manner as they are classified in the Statement of Consolidated Cash Flows to provide a better understanding of the nature of the obligations and arrangements and to provide a basis for comparison to historical information. The table below provides a summary of contractual obligations and off-balance sheet arrangements as of December 31, 2020:
| | | | | | | | | | | | | | | | | | | | | | | | | | | | | | | | |
| | | | Less than | | 1 - 3 | | 3 - 5 | | More than |
| In millions | | Total | | 1 year | | years | | years | | 5 years |
| Operating activities: | | | | | | | | | | |
| Purchase obligations (1) | | $ | 98.5 | | | $ | 57.4 | | | $ | 14.7 | | | $ | 6.2 | | | $ | 20.2 | |
| Operating leases (2) | | 323.8 | | | 56.4 | | | 93.5 | | | 70.3 | | | 103.6 | |
| Pension benefit payments (3) | | 185.8 | | | 16.7 | | | 35.1 | | | 36.7 | | | 97.3 | |
| Postretirement benefit payments (4) | | 9.4 | | | 1.1 | | | 2.1 | | | 2.0 | | | 4.2 | |
| Financing activities: | | | | | | | | | | |
| Interest payments (5) | | 846.6 | | | 152.0 | | | 286.0 | | | 207.7 | | | 200.9 | |
| Long-term debt (6) | | 4,239.4 | | | 447.2 | | | 560.4 | | | 1,241.3 | | | 1,990.5 | |
| Dividends to shareholders (7) | | 90.7 | | | 90.7 | | | — | | | — | | | — | |
| Other: | | | | | | | | | | |
| Standby letters of credit (8) | | 736.6 | | | 162.9 | | | 184.6 | | | 217.9 | | | 171.2 | |
| Total | | $ | 6,530.8 | | | $ | 984.4 | | | $ | 1,176.4 | | | $ | 1,782.1 | | | $ | 2,587.9 | |
(1)Purchase obligations represent non-cancelable contractual obligations at December 31, 2020. In addition, the Company had $1.1 billion of open purchase orders for which the related goods or services had not been received. Although open purchase orders are considered enforceable and legally binding, their terms generally allow us the option to cancel, reschedule and adjust our requirements based on our business needs prior to the delivery of goods or performance of services.
(2)Future minimum payments for operating leases are disclosed by year in Note 15 of the “Notes to Consolidated Financial Statements” included in Part IV, Item 15 of this report.
(3)Annual payments to participants are expected to continue into the foreseeable future at the amounts or ranges noted. Pension benefit payments are based on actuarial estimates using current assumptions for discount rates, expected return on long-term assets and rate of compensation increases. The Company expects to contribute about $7.3 million to pension plan investments in 2021. See further disclosure in Note 10 of the “Notes to Consolidated Financial Statements” included in Part IV, Item 15 of this report.
(4)Annual payments to participants are expected to continue into the foreseeable future at the amounts or ranges noted. Postretirement payments are based on actuarial estimates using current assumptions for discount rates and health care costs.
(5)Interest payments are payable February and August of each year at 4.375% of $250 million Senior Notes due in 2023. Interest payments are payable May and September of each year at 4.15% of $750 million Senior Notes due 2024. Interest payments are payable June and December of each year at 3.20% of the $500 million Senior Notes due in 2025. Interest payments are payable May and November of each year at 3.45% of $750 million Senior Notes due in 2026. Interest payments are payable March and September of each year at 4.7% of $1,250 million Senior Note due 2028. Interest payments for the Revolving Credit Facility and Other Borrowings are based on contractual terms and the Company’s current interest rates.
(6)Scheduled principal repayments of outstanding loan balances are disclosed in Note 9 of the “Notes to Consolidated Financial Statements” included in Part IV, Item 15 of this report.
(7)Shareholder dividends are subject to approval by the Company’s Board of Directors, currently at an annual rate of approximately $90.7 million.
(8)The $736.6 million of standby letters of credit is comprised of outstanding letters of credit for performance and bid bond purposes, which expire in various dates through 2039. Amounts include interest payments based on contractual terms and the Company’s current interest rate.
The above table does not reflect uncertain tax positions of $16.4 million, the timing of which are uncertain. Refer to Note 11 of the “Notes to Consolidated Financial Statements” for additional information on uncertain tax positions.
Obligations for operating activities. The Company has entered into $98.5 million of material long-term non-cancelable materials and supply purchase obligations. Operating leases represent multi-year obligations for rental of facilities and equipment. Estimated pension funding and post-retirement benefit payments are based on actuarial estimates using current assumptions for discount rates, expected return on long-term assets, rate of compensation increases and health care cost trend rates. Benefits paid for pension obligations were $17.3 million and $16.0 million in 2020 and 2019, respectively. Benefits paid for post-retirement plans were $0.9 million and $1.0 million in 2020 and in 2019, respectively.
Obligations for financing activities. Cash requirements for financing activities consist primarily of long-term debt repayments, interest payments and dividend payments to shareholders. The Company has historically paid quarterly dividends to shareholders, subject to quarterly approval by our Board of Directors, currently at a rate of approximately $90.7 million annually.
The Company arranges for performance bonds to be issued by third party insurance companies to support certain long term customer contracts. At December 31, 2020, the initial value of performance bonds issued on the Company’s behalf is about $878 million.
Forward Looking Statements
We believe that all statements other than statements of historical facts included in this report, including certain statements under “Business” and “Management’s Discussion and Analysis of Financial Condition and Results of Operations,” may constitute forward-looking statements. We have based these forward-looking statements on our current expectations and projections about future events. Although we believe that our assumptions made in connection with the forward-looking statements are reasonable, we cannot assure that our assumptions and expectations are correct.
These forward-looking statements are subject to various risks, uncertainties and assumptions about us, including, among other things:
Economic and industry conditions
•prolonged unfavorable economic and industry conditions in the markets served by us, including North America, South America, Europe, Australia, Asia and South Africa;
•decline in demand for freight cars, locomotives, passenger transit cars, buses and related products and services;
•reliance on major original equipment manufacturer customers;
•original equipment manufacturers’ program delays;
•demand for services in the freight and passenger rail industry;
•demand for our products and services;
•orders either being delayed, canceled, not returning to historical levels, or reduced or any combination of the foregoing;
•consolidations in the rail industry;
•continued outsourcing by our customers;
•industry demand for faster and more efficient braking equipment;
•fluctuations in interest rates and foreign currency exchange rates; or
•availability of credit;
Operating factors
•supply disruptions including but not limited to disease outbreak, fires, earthquakes, explosions, floods, tornadoes, hurricanes or weather conditions;
•technical difficulties;
•changes in operating conditions and costs;
•increases in raw material costs;
•successful introduction of new products;
•performance under material long-term contracts;
•labor relations;
•the outcome of our existing or any future legal proceedings, including litigation involving our principal customers and any litigation with respect to environmental matters, asbestos-related matters, pension liabilities, warranties, product liabilities, competition and anti-trust matters or intellectual property claims;
•completion and integration of acquisitions, including the acquisition of GE Transportation;
•the development and use of new technology;
•unexpected costs, charges or expenses resulting from the GE Transportation acquisition;
•failure to realize the anticipated benefits of the GE Transportation acquisition, including as a result of integrating GE Transportation into Wabtec; or
•the severity and duration of the evolving COVID-19 pandemic and the resulting impact on the global economy;
Competitive factors
•the actions of competitors; or
•the outcome of negotiations with partners, suppliers, customers or others;
Political/governmental factors
•political stability in relevant areas of the world;
•future regulation/deregulation of our customers and/or the rail industry;
•levels of governmental funding on transit projects, including for some of our customers;
•political developments and laws and regulations, including those related to Positive Train Control; or
•federal and state income tax legislation; and
•the outcome of negotiations with governments.
Statements in this 10-K apply only as of the date on which such statements are made, and we undertake no obligation to update any statement to reflect events or circumstances after the date on which the statement is made or to reflect the occurrence of unanticipated events.
Critical Accounting Estimates
The preparation of the financial statements in accordance with generally accepted accounting principles requires Management to make judgments, estimates and assumptions regarding uncertainties that affect the reported amounts of assets and liabilities, disclosure of contingent assets and liabilities and the reported amounts of revenues and expenses. Areas of uncertainty that require judgments, estimates and assumptions include the accounting for allowance for doubtful accounts, inventories, business combinations, the testing of goodwill and other intangibles for impairment, warranty reserves, stock based compensation, income taxes, and revenue recognition. Management uses historical experience and all available information to make these judgments and estimates, and actual results will inevitably differ from those estimates and assumptions that are used to prepare the Company’s financial statements at any given time. Despite these inherent limitations, Management believes that Management’s Discussion and Analysis of Financial Condition and Results of Operations (MD&A) and the financial statements and related footnotes provide a meaningful and fair perspective of the Company.
A summary of the Company’s significant accounting policies is included in Note 2 in the “Notes to Consolidated Financial Statements” included in Part IV, Item 15 of this report. Management believes that the application of these policies on a consistent basis enables the Company to provide the users of the financial statements with useful and reliable information about the Company’s operating results and financial condition.
Accounts Receivable and Allowance for Doubtful Accounts:
Description The Company provides an allowance for doubtful accounts to cover anticipated losses on uncollectible accounts receivable.
Judgments and Uncertainties The allowance for doubtful accounts receivable reflects our best estimate of expected losses inherent in our receivable portfolio determined on the basis of historical experience, relevant credit forecast information, changes to customer's solvency and other currently available evidence.
Effect if Actual Results Differ From Assumptions If our estimates regarding the collectability of troubled accounts, and/or our actual losses within our receivable portfolio exceed our estimated losses, we may be exposed to the expense of increasing our allowance for doubtful accounts.
Inventories:
Description Inventories are stated at the lower of cost or net realizable value and are reviewed to ensure that an adequate provision is recognized for excess, slow moving and obsolete inventories, and net realizable value reserves.
Judgments and Uncertainties Cost is determined under the first-in, first-out (FIFO) method. Inventory costs include material, labor and overhead. The Company compares inventory components to prior year sales history and current backlog and anticipated future requirements. To the extent that inventory parts exceed estimated usage and demand, a reserve is recognized to reduce the carrying value of inventory. Also, specific reserves are established for known inventory obsolescence, a decline in market value, or loss of a customer with specific inventory.
Effect if Actual Results Differ From Assumptions If the market value or demand for of our products were to decrease due to changing market conditions, the Company could be at risk of incurring write-downs to adjust inventory value to a net realizable value lower than stated cost. If our estimates regarding sales and backlog requirements are inaccurate, we may be exposed to the expense of increasing our reserves for slow moving and obsolete inventory.
Business Combinations:
Description The Company accounts for business acquisitions in accordance with ASC 805, Business Combinations which requires the purchase price of the acquired business to be allocated to tangible and intangible assets acquired and liabilities assumed based on the respective fair values. The amount of purchase price which is in excess of the fair values of assets acquired and liabilities assumed is recognized as goodwill.
Judgments and Uncertainties Discounted cash flow models are used to estimate the fair values of acquired contract backlog, customer relationships, intellectual property intangibles, and below-market customer contract liabilities. The significant assumptions used to estimate the value of the intangible assets and below-market customer contract liabilities included revenue growth rates, projected profit margins, discount rates, royalty rates, customer attrition rates, revenue obsolescence rates and market participant profit margins. These significant assumptions are forward-looking and could be affected by future economic and market conditions.
Effect if Actual Results Differ From Assumptions Different assumptions may result in materially different values for assets acquired and liabilities assumed, which may impact the Company's financial position and future results of operations.
Goodwill and Indefinite-Lived Intangibles:
Description Goodwill and indefinite-lived intangibles are required to be tested for impairment at least annually. The Company performs its annual impairment test during the fourth quarter and more frequently when indicators of impairment are present. The Company reviews goodwill for impairment at the reporting unit level. The Company has identified three reporting units for purposes of testing goodwill for impairment. Two reporting units exist within the freight segment and the transit segment is also a reporting unit. The evaluation of impairment involves comparing the current fair value of the business to the recorded value (including goodwill).
Judgments and Uncertainties A number of significant assumptions and estimates are involved in the application of the impairment test, including the identification of macroeconomic conditions, industry and market considerations, cost factors, overall financial performance, Wabtec specific events and share price trends and making the assessment on whether each relevant factor will impact the impairment test positively or negatively and the magnitude of any such amount.
Effect if Actual Results Differ From Assumptions Management considers historical experience and all available information at the time the fair values of its reporting units are estimated. However, actual amounts realized may differ from those used to evaluate the impairment of goodwill. If actual results are not consistent with our assumptions and judgments used in estimating future cash flows and asset fair values, we may be exposed to impairment losses that could be material to our results of operations. For example, based on the quantitative analysis performed as of October 1, 2020, a decline in the terminal growth rate by 100 basis points would decrease fair market value by $1,218 million, or an increase in the weighted-average cost of capital by 100 basis points would result in a decrease in fair market value by $2,031 million. Even with such changes the fair value of the reporting units would be greater than their net book values. At December 31, 2020, all three of the Company’s reporting units had fair values which were substantially in excess of their carrying values. See Note 2 in the “Notes to Consolidated Financial Statements” included in Part IV, Item 15 of this report for additional discussion regarding impairment testing.
Warranty Reserves:
Description The Company provides warranty reserves to cover expected costs from repairing or replacing products with durability, quality or workmanship issues occurring during established warranty periods.
Judgments and Uncertainties In general, reserves are provided for as a percentage of sales, based on historical experience. In addition, specific reserves are established for known warranty issues and their estimable losses.
Effect if Actual Results Differ From Assumptions If actual results are not consistent with the assumptions and judgments used to calculate our warranty liability, the Company may be exposed to the expense of increasing our reserves for warranty expense.
Stock-based Compensation:
Description The Company has issued incentive stock units to eligible employees that vest upon attainment of certain cumulative three-year performance goals. The program is structured as a rolling three-year plan; each year starts a new three-year performance cycle with the most recently completed cycle being 2018-2020. No incentive stock units will vest for performance below the three-year cumulative threshold. The Company utilizes an economic profit measure for this performance goal. Economic profit is a measure of the extent to which the Company produces financial results in excess of its cost of capital. Based on the Company’s achievement of the threshold and three-year cumulative performance, the stock units vested can range from 0% to 200% of the shares granted.
Judgments and Uncertainties Significant judgments and estimates are used in determining the estimated three-year performance, which is then used to estimate the total shares expected to vest over the three year vesting cycle and corresponding expense based on the grant date fair value of the award. When determining the estimated three-year performance, the Company utilizes a combination of historical actual results, budgeted results and forecasts. Upon the initial grant of a performance cycle, the Company estimates the three-year performance at 100%. As actual performance results for a cycle begin to accumulate and the Company completes its budgeting and forecasting cycles the performance estimates are updated. These judgments and estimates are reviewed and updated on a quarterly basis.
Effect if Actual Results Differ From Assumptions If assumptions used in determining the estimated three-year performance change significantly, stock-based compensation expense related to the unvested incentive stock awards can fluctuate from period to period. For example, a 10% decrease or increase in the estimated vesting percentage for incentive stock awards would decrease or increase stock-based compensation expense by approximately $2.5 million.
Income Taxes:
Description Wabtec records an estimated liability or benefit for income and other taxes based on what it determines will likely be paid in various tax jurisdictions in which it operates in accordance with ASC 740-10 Accounting for Income Taxes and Accounting for Uncertainty in Income Taxes.
Judgments and Uncertainties The estimate of our tax obligations are uncertain because Management must use judgment to estimate the exposures associated with our various filing positions, as well as realization of our deferred tax assets. ASC 740-10 establishes a recognition and measurement threshold to determine the amount of tax benefit that should be recognized related to uncertain tax positions.
Effect if Actual Results Differ From Assumptions Management uses its best judgment in the determination of these amounts. However, the liabilities ultimately realized and paid are dependent on various matters including the resolution of the tax audits in the various affected tax jurisdictions and may differ from the amounts recorded. An adjustment to the estimated liability would be recorded through income in the period in which new information changes the expected outcome of an uncertain tax position. A deferred tax valuation allowance is provided when it is more likely than not that some portion or all of the deferred tax assets will not be realized.
Revenue Recognition:
Description Revenue is recognized in accordance with ASC 606 “Revenue from Contracts with Customers.” Company recognizes a portion of its revenues on long-term customer agreements involving the design and production of highly engineered products that require revenue to be recognized over time because these products have no alternative use without significant economic loss and the agreements contain an enforceable right to payment including a reasonable profit margin from the customer in the event of contract termination. Generally, the Company uses an input method for determining the amount of revenue, cost and gross margin to recognize over time for these customer agreements. The input methods used for these agreements include costs of material and labor, both of which give an accurate representation of the progress made toward complete satisfaction of a particular performance obligation.
Judgments and Uncertainties Accounting for long-term customer agreements involves a judgmental process of estimating the total sales and costs for each contract, which results in the development of estimated profit margin percentages. Contract estimates related to long-term projects are based on various assumptions to project the outcome of future events that could span several years. These assumptions include cost of materials; labor availability and productivity; complexity of the work to be performed; and the performance of suppliers, customers and subcontracts that may be associated with the contract. Factors that influence these estimates include inflationary trends, technical and schedule risk, internal and subcontractor performance trends, business volume assumptions, asset utilization, and anticipated labor agreements. Generally, pricing is defined in our contracts but may include an estimate of variable consideration when required by the terms of the individual customer contract. Types of
variable consideration that the Company typically has include volume discounts, prompt payment discounts, liquidating damages, and performance bonuses.
Effect if Actual Results Differ From Assumptions Should market conditions and customer demands dictate changes to our standard shipping terms, the Company may be impacted by longer than typical revenue recognition cycles. The development of expected contract costs and contract profit margin percentages involves procedures and personnel in all areas that provide financial or production information on the status of contracts. Due to the significance of judgments in the estimation process, it is likely that materially different revenue amounts could be recorded if we used different assumptions or if the underlying circumstances were to change. Changes in underlying assumptions/estimates, supplier performance, or circumstances may adversely or positively affect financial performance in future periods. Some of our contracts are expected to be completed in a loss position. Provisions are made currently for estimated losses on uncompleted contracts.
| | | | | |
| Item 7A. | QUANTITATIVE AND QUALITATIVE DISCLOSURES ABOUT MARKET RISK |
Interest Rate Risk
In the ordinary course of business, Wabtec is exposed to risks that increases in interest rates may adversely affect funding costs associated with its variable-rate debt. The Company’s variable rate debt represents 15% and 32% of total debt at December 31, 2020 and 2019, respectively. On an annual basis, a 1% change in the interest rate for variable rate debt at December 31, 2020, would increase or decrease interest expense by about $6.5 million.
Foreign Currency Exchange Rate Risk
The Company is exposed to certain risks associated with changes in foreign currency exchange rates to the extent our operations are conducted in currencies other than the U.S. dollar. To reduce the impact of changes in currency exchange rates, the Company has periodically entered into foreign currency forward contracts. Refer to “Financial Derivatives and Hedging Activities” in Notes 2 and 20 of “Notes to Consolidated Financial Statements” included in Part IV, Item 15 of this report for more information regarding foreign currency exchange risk and sales by geographic area.
| | | | | |
| Item 8. | FINANCIAL STATEMENTS AND SUPPLEMENTARY DATA |
Financial statements and supplementary data are set forth in Item 15 of Part IV hereof.
| | | | | |
| Item 9. | CHANGES IN AND DISAGREEMENTS WITH ACCOUNTANTS ON ACCOUNTING AND FINANCIAL DISCLOSURE |
There have been no disagreements with our independent registered public accountants.
| | | | | |
| Item 9A. | CONTROLS AND PROCEDURES |
Evaluation of Disclosure Controls and Procedures
Wabtec’s principal executive officer and its principal financial officer have evaluated the effectiveness of Wabtec’s “disclosure controls and procedures,” (as defined in Exchange Act Rule 13a-15(e)) as of December 31, 2020. Based upon their evaluation, the principal executive officer and principal financial officer concluded that Wabtec’s disclosure controls and procedures are effective to provide reasonable assurance that information required to be disclosed by Wabtec in the reports filed or submitted by it under the Exchange Act is recorded, processed, summarized and reported within the time periods specified in the SEC’s rules and forms, and to provide reasonable assurance that information required to be disclosed by Wabtec in such reports is accumulated and communicated to Wabtec’s Management, including its principal executive officer and principal finance officer, as appropriate to allow timely decisions regarding required disclosure.
Changes in Internal Control over Financial Reporting
There was no change in Wabtec’s “internal control over financial reporting” (as defined in Rule 13a-15(f) under the Exchange Act) that occurred during the quarter ended December 31, 2020, that has materially affected, or is reasonably likely to materially affect, Wabtec’s internal control over financial reporting. Management’s annual report on internal control over financial reporting and the attestation report of the registered public accounting firm are included in Part IV, Item 15 of this report.
Management’s Report on Internal Control over Financial Reporting
Management’s Report on Internal Control Over Financial Reporting appears on page 46.
Report of Independent Registered Public Accounting Firm on Internal Control over Financial Reporting
Ernst & Young LLP's attestation report on internal control over financial reporting appears on page 49.
| | | | | |
| Item 9B. | OTHER INFORMATION |
None.
PART III
Items 10 through 14.
In accordance with the provisions of General Instruction G(3) to Form 10-K, the information required by Item 10 (Directors, Executive Officers and Corporate Governance), Item 11 (Executive Compensation), Item 12 (Security Ownership of Certain Beneficial Owners and Management and Related Stockholder Matters), Item 13 (Certain Relationships and Related Transactions, and Director Independence) and Item 14 (Principal Accounting Fees and Services) is incorporated herein by reference from the Company’s definitive Proxy Statement for its Annual Meeting of Stockholders to be held on May 19, 2021, except for the Equity Compensation Plan Information required by Item 12, which is set forth in the table below. The definitive Proxy Statement will be filed with the Securities and Exchange Commission not later than 120 days after December 31, 2020. Information relating to the executive officers of the Company is set forth in Part I.
Wabtec has adopted a Code of Business Conduct and Ethics which is applicable to our executive officers. This Code of Business Conduct and Ethics is posted on our website at www.wabteccorp.com. In the event that we make any amendments to or waivers from this code, we will disclose the amendment or waiver and the reasons for such on our website.
This table provides aggregate information as of December 31, 2020 concerning equity awards under Wabtec’s compensation plans and arrangements.
| | | | | | | | | | | | | | | | | | | | |
| Plan Category | | (a)
Number of securities to
be issued upon exercise
of outstanding options, warrants and rights | | (b)
Weighted-average
exercise price of
outstanding
options warrants and rights | | (c)
Number of securities
remaining available for
future issuance
under equity compensation
plans (excluding securities reflected in column a)) |
| Equity compensation plans approved by shareholders | | 552,669 | | | $ | 69.82 | | | 1,452,856 | |
| Equity compensation plans not approved by shareholders | | — | | | — | | | — | |
| Total | | 552,669 | | | $ | 69.82 | | | 1,452,856 | |
PART IV
| | | | | |
| Item 15. | EXHIBITS AND FINANCIAL STATEMENT SCHEDULES |
The financial statements, financial statement schedules and exhibits listed below are filed as part of this annual report:
| | | | | | | | |
| | | Page |
| (1) | Financial Statements and Reports on Internal Control | |
| | | |
| | | |
| | | |
| | | |
| | | |
| | | |
| | | |
| | | |
| | | |
| (2) | Financial Statement Schedules | |
| | | |
| | | Filing
Method |
| | Exhibits | |
| 2.1 | | 13 | |
| 2.2 | | 14 | |
| 2.3 | | 21 | |
| 2.4** | | 21 | |
| 3.1 | | 9 | |
| 3.2 | | 11 | |
| 3.3 | | 8 | |
| 3.4 | | 22 | |
| 3.5 | | 21 | |
| 4.1 | | 12 | |
| 4.2 | | 12 | |
| 4.3 | | 12 | |
| 4.4 | | 15 | |
| | | | | | | | |
| 4.5 | | 15 | |
| 4.6 | | 15 | |
| 4.7 | | 16 | |
| 4.8 | | 17 | |
| 4.9 | | 18 | |
| 4.10 | | 19 | |
| 4.11 | | 19 | |
| 4.12 | | 20 | |
| 4.13 | | 1 | |
| 4.14 | | 1 | |
| 4.15 | | 23 | |
| 4.16 | | 25 | |
| 4.17 | | 1 | |
| 4.18 | | 1 | |
| 10.1 | Agreement of Sale and Purchase of the North American Operations of the Railway Products Group, an operating division of American Standard Inc. (now known as Trane), dated as of 1990 between Rail Acquisition Corp. and American Standard Inc. (only provisions on indemnification are reproduced) | 2 | |
| 10.2 | Letter Agreement (undated) between the Company and American Standard Inc. (now known as Trane) on environmental costs and sharing | 2 | |
| 10.3 | Purchase Agreement dated as of June 17, 1992 among the Company, Schuller International, Inc., Manville Corporation and European Overseas Corporation (only provisions on indemnification are reproduced) | 2 | |
| 10.4 | | 4 | |
| 10.5 | | 4 | |
| 10.6 | | 3 | |
| 10.7 | | 10 | |
| 10.8 | | 5 | |
| 10.9 | | 6 | |
| 10.10 | | 7 | |
| 10.11 | | 10 | |
| 10.12 | | 10 | |
| 10.13 | | 10 | |
| 10.14 | | 10 | |
| | | | | | | | |
| 10.15 | Credit Agreement, dated as of June 8, 2018, by and among Westinghouse Air Brake Technologies Corporation, Wabtec Netherlands B.V. and the other borrowing subsidiaries party thereto, the lenders party thereto and PNC Bank, National Association, as Administrative Agent, Goldman Sachs Bank USA, HSBC Bank USA, N.A., JPMorgan Chase Bank, N.A., Merrill Lynch, Pierce, Fenner & Smith Incorporated, PNC Capital Markets LLC and TD Securities (USA) LLC, as Joint Lead Arrangers and Joint Bookrunners, Goldman Sachs Bank USA and PLC Capital Markets LLC, as Syndication Agents, and Bank of America, N.A., HSBC Bank USA, N.A., JPMorgan Chase Bank, N.A., and TD Securities | 19 | |
| 10.16 | | 22 | |
| 10.17 | | 24 | |
| 10.18 | | 24 | |
| 10.19 | | 26 | |
| 10.20 | | 1 | |
| 21.0 | | 1 | |
| 22.0 | | 1 | |
| 23.1 | | 1 | |
| 31.1 | | 1 | |
| 31.2 | | 1 | |
| 32.1 | | 1 | |
| 101.INS | XBRL Instance Document. | 1 | |
| 101.SCH | XBRL Taxonomy Extension Calculation Linkbase Document | 1 | |
| 101.CAL | XBRL Taxonomy Extension Calculation Linkbase Document | 1 | |
| 101.DEF | XBRL Taxonomy Extension Definition Linkbase Document. | 1 | |
| 101.LAB | XBRL Taxonomy Extension Label Linkbase Document | 1 | |
| 101.PRE | XBRL Taxonomy Extension Presentation Linkbase Document | 1 | |
| 104 | XBRL Cover Page Interactive Data (embedded within the Inline XBRL document) | 1 | |
| | | | | |
| 1 | | Filed herewith. |
| |
| 2 | | Filed as an exhibit to the Company’s Registration Statement on Form S-1 (File No. 033-90866). |
| |
| 3 | | Filed as an exhibit to the Company’s Quarterly Report on Form 10-Q (File No. 033-90866) for the period ended March 31, 2006. |
| |
| 4 | | Filed as an Annex to the Company’s Schedule 14A Proxy Statement (File No. 033-90866) filed on March 31, 2017. |
| |
| 5 | | Filed as an exhibit to the Company’s Current Report on Form 8-K (File No. 033-90866) filed on January 20,2021. |
| |
| 6 | | Filed as an exhibit to the Company’s Quarterly Report on Form 10-Q (File No. 033-90866) for the period ended September 30, 2008. |
| |
| 7 | | Filed as an exhibit to the Company’s Current Report on Form 8-K (File No. 033-90866) dated July 2, 2009. |
| |
| 8 | | Filed as an exhibit to the Company’s Current Report on Form 8-K (File No. 033-90866), dated February 18, 2021. |
| |
| 9 | | Filed as an exhibit to the Company’s Annual Report on Form 10-K (File No. 033-90866), dated February 25, 2011. |
| |
| 10 | | Filed as an exhibit to the Company’s Annual Report on Form 10-K (File No. 033-90866), dated February 22, 2013. |
| |
| 11 | | Filed as an exhibit to the Company’s Current Report on Form 8-K (File No. 033-90866), dated September 9, 2019. |
| |
| 12 | | Filed as an exhibit to the Company’s Current Report on Form 8-K (File No. 033-90866), dated August 8, 2013. |
| |
| | | | | |
| 13 | | Filed as an exhibit to the Company’s Current Report on Form 8-K (File No. 033-90866), dated October 6,2015. |
| |
| 14 | | Filed as an exhibit to the Company's Current Report on Form 8-K (File No. 033-90866), dated October 26, 2016. |
| |
| 15 | | Filed as an exhibit to the Company's Current Report on Form 8-K (File No. 033-90866), dated November 3, 2016. |
| |
| 16 | | Filed as an exhibit to the Company's Current Report on Form 10-K (File No. 033-90866), dated February 28, 2017. |
| |
| 17 | | Filed as an exhibit to the Company's Quarterly Report on Form 10-Q (File No. 033-90866), for the period ended March 31, 2017. |
| |
| 18 | | Filed as an exhibit to the Company's Registration Statement on Form S-4 (File No. 0333-219354). |
| |
| 19 | | Filed as an exhibit to the Company's Quarterly Report on Form 10-Q (File No. 033-90866), for the period ended June 30, 2018. |
| |
| 20 | | Filed as an exhibit to the Company’s Current Report on Form 8-K (File No. 033-90866), dated September 14, 2018. |
| |
| 21 | | Filed as an exhibit to the Company’s Current Report on Form 8-K (File No. 033-90866), dated February 25, 2019. |
| |
| 22 | | Filed as an exhibit to the Company’s Annual Report on Form 10-K (File No. 033-90866), dated February 27, 2019. |
| |
| 23 | | Filed as an exhibit to the Company’s Quarterly Report on Form 10-Q (File No. 033-90866), dated August 1, 2019. |
| |
| 24 | | Filed as an exhibit to the Company's Quarterly Report on Form 10-Q (File No. 033-90866), dated May 9, 2019. |
| |
| 25 | | Filed as an exhibit to the Company's Current Report on Form 8-K (File No. 033-90866), dated June 29, 2020. |
| |
| 26 | | Filed as an exhibit to the Company's Current Report on Form 8-K (File No 033-90866), dated May 7, 2020. |
| | | | | |
| * | Management contract or compensatory plan. |
| ** | Certain schedules have been omitted pursuant to Item 601(b)(2) of Regulation S-K. Wabtec hereby undertakes to furnish supplementally, copies of any of the omitted schedules upon request by the SEC. |
MANAGEMENT’S REPORTS TO WABTEC SHAREHOLDERS
Management’s Report on Financial Statements and Practices
The accompanying consolidated financial statements of Westinghouse Air Brake Technologies Corporation and subsidiaries (the “Company”) were prepared by Management, which is responsible for their integrity and objectivity. The statements were prepared in accordance with U.S. generally accepted accounting principles and include amounts that are based on Management’s best judgments and estimates. The other financial information included in the 10-K is consistent with that in the financial statements.
Management also recognizes its responsibility for conducting the Company’s affairs according to the highest standards of personal and corporate conduct. This responsibility is characterized and reflected in key policy statements issued from time to time regarding, among other things, conduct of its business activities within the laws of host countries in which the Company operates and potentially conflicting outside business interests of its employees. The Company maintains a systematic program to assess compliance with these policies.
Management’s Report on Internal Control over Financial Reporting
Management is responsible for establishing and maintaining adequate internal control over financial reporting for the Company. In order to evaluate the effectiveness of internal control over financial reporting, as required by Section 404 of the Sarbanes-Oxley Act, Management has conducted an assessment, including testing, using the criteria in Internal Control-Integrated Framework issued by the Committee of Sponsoring Organizations of the Treadway Commission (2013 Framework) (COSO). The Company’s system of internal control over financial reporting is designed to provide reasonable assurance regarding the reliability of financial reporting and the preparation of financial statements for external purposes in accordance with generally accepted accounting standards. Because of its inherent limitations, internal control over financial reporting may not prevent or detect misstatements. Also, projections of any evaluation of effectiveness to future periods are subject to the risk that controls may become inadequate because of changes in conditions, or that the degree of compliance with the policies or procedures may deteriorate.
Based on its assessment, Management has concluded that the Company maintained effective internal control over financial reporting as of December 31, 2020, based on criteria in Internal Control-Integrated Framework issued by the COSO. The effectiveness of the Company’s internal control over financial reporting as of December 31, 2020, has been audited by Ernst & Young LLP, independent registered public accounting firm, as stated in their report which is included herein.
REPORT OF INDEPENDENT REGISTERED PUBLIC ACCOUNTING FIRM
To the Shareholders and the Board of Directors of Westinghouse Air Brake Technologies Corporation
Opinion on the Financial Statements
We have audited the accompanying consolidated balance sheets of Westinghouse Air Brake Technologies Corporation (the Company) as of December 31, 2020 and 2019, the related consolidated statements of income, comprehensive income, cash flows and shareholders' equity for each of the three years in the period ended December 31, 2020, and the related notes and financial statement schedule listed in the Index at Item 15.(2) (collectively referred to as the “consolidated financial statements”). In our opinion, the consolidated financial statements present fairly, in all material respects, the financial position of the Company at December 31, 2020 and 2019, and the results of its operations and its cash flows for each of the three years in the period ended December 31, 2020, in conformity with U.S. generally accepted accounting principles.
We also have audited, in accordance with the standards of the Public Company Accounting Oversight Board (United States) (PCAOB), the Company's internal control over financial reporting as of December 31, 2020, based on criteria established in Internal Control-Integrated Framework issued by the Committee of Sponsoring Organizations of the Treadway Commission (2013 framework), and our report dated February 19, 2021 expressed an unqualified opinion thereon.
Basis for Opinion
These financial statements are the responsibility of the Company's management. Our responsibility is to express an opinion on the Company’s financial statements based on our audits. We are a public accounting firm registered with the PCAOB and are required to be independent with respect to the Company in accordance with the U.S. federal securities laws and the applicable rules and regulations of the Securities and Exchange Commission and the PCAOB.
We conducted our audits in accordance with the standards of the PCAOB. Those standards require that we plan and perform the audit to obtain reasonable assurance about whether the financial statements are free of material misstatement, whether due to error or fraud. Our audits included performing procedures to assess the risks of material misstatement of the financial statements, whether due to error or fraud, and performing procedures that respond to those risks. Such procedures included examining, on a test basis, evidence regarding the amounts and disclosures in the financial statements. Our audits also included evaluating the accounting principles used and significant estimates made by management, as well as evaluating the overall presentation of the financial statements. We believe that our audits provide a reasonable basis for our opinion.
Critical Audit Matter
The critical audit matter communicated below is a matter arising from the current period audit of the financial statements that was communicated or required to be communicated to the audit committee and that: (1) relates to accounts or disclosures that are material to the financial statements and (2) involved our especially challenging, subjective or complex judgments. The communication of a critical audit matter does not alter in any way our opinion on the consolidated financial statements, taken as a whole, and we are not, by communicating the critical audit matter below, providing a separate opinion on the critical audit matter or on the accounts or disclosures to which it relates.
| | | | | |
| Over Time Revenue Recognition for Long-Term Contracts |
| Description of the Matter | As described in Note 2 to the consolidated financial statements, the Company has long-term customer arrangements involving the design and production of highly engineered products that require revenue to be recognized over time. The Company uses input-based measures for determining the amount of revenue, cost and gross margin to recognize over time for these customer arrangements. The input methods used for these arrangements include costs of material and labor. During the year ended December 31, 2020, a material amount of the Company's total revenues were derived from performance obligations that are satisfied over time.
Auditing the Company's measurement of revenue recognized over time on long-term contracts is especially challenging because it involves subjective management assumptions regarding the estimated remaining costs of the long-term contract that could span several years. These assumptions could be impacted by the future cost of materials, labor availability and productivity, complexity of the work to be performed, and the performance of suppliers, customers and subcontractors that may be associated with the contract and may be affected by future market or economic conditions. |
| How We Addressed the Matter in Our Audit | We obtained an understanding, evaluated the design and tested the operating effectiveness of controls over the Company's process to recognize revenue over time on long-term contracts, including controls over management’s review of the significant underlying assumptions described above.
Our audit procedures also included, among others, evaluating the significant assumptions and the accuracy and completeness of the underlying data used in management's calculations. This included, for example, inspection of the executed contract and testing management's cost estimates by comparing the inputs to the Company’s historical data or experience for similar contracts, the performance of sensitivity analysis and the performance of retrospective review analysis of prior management cost estimates to actual costs incurred for completed contracts. In addition, for a sample of contracts, we involved our construction and engineering specialists to assist in our evaluation of management’s cost estimates at completion. |
/s/ Ernst & Young LLP
We have served as the Company's auditor since 2002.
Pittsburgh, Pennsylvania
February 19, 2021
REPORT OF INDEPENDENT REGISTERED PUBLIC ACCOUNTING FIRM
To the Shareholders and the Board of Directors of Westinghouse Air Brake Technologies Corporation
Opinion on Internal Control over Financial Reporting
We have audited Westinghouse Air Brake Technologies Corporation’s internal control over financial reporting as of December 31, 2020, based on criteria established in Internal Control-Integrated Framework issued by the Committee of Sponsoring Organizations of the Treadway Commission (2013 framework) (the COSO criteria). In our opinion, Westinghouse Air Brake Technologies Corporation (the Company) maintained, in all material respects, effective internal control over financial reporting as of December 31, 2020, based on the COSO criteria.
We also have audited, in accordance with the standards of the Public Company Accounting Oversight Board (United States) (PCAOB), the consolidated balance sheets of the Company as of December 31, 2020 and 2019, the related consolidated statements of income, comprehensive income, cash flows and shareholders’ equity for each of the three years in the period ended December 31, 2020, and the related notes and financial statement schedule listed in the Index at Item 15.(2) and our report dated February 19, 2021 expressed an unqualified opinion thereon.
Basis for Opinion
The Company’s management is responsible for maintaining effective internal control over financial reporting and for its assessment of the effectiveness of internal control over financial reporting included in the accompanying Management’s Report on Internal Control over Financial Reporting. Our responsibility is to express an opinion on the Company’s internal control over financial reporting based on our audit. We are a public accounting firm registered with the PCAOB and are required to be independent with respect to the Company in accordance with the U.S. federal securities laws and the applicable rules and regulations of the Securities and Exchange Commission and the PCAOB.
We conducted our audit in accordance with the standards of the PCAOB. Those standards require that we plan and perform the audit to obtain reasonable assurance about whether effective internal control over financial reporting was maintained in all material respects.
Our audit included obtaining an understanding of internal control over financial reporting, assessing the risk that a material weakness exists, testing and evaluating the design and operating effectiveness of internal control based on the assessed risk, and performing such other procedures as we considered necessary in the circumstances. We believe that our audit provides a reasonable basis for our opinion.
Definition and Limitations of Internal Control over Financial Reporting
A company’s internal control over financial reporting is a process designed to provide reasonable assurance regarding the reliability of financial reporting and the preparation of financial statements for external purposes in accordance with generally accepted accounting principles. A company’s internal control over financial reporting includes those policies and procedures that (1) pertain to the maintenance of records that, in reasonable detail, accurately and fairly reflect the transactions and dispositions of the assets of the company; (2) provide reasonable assurance that transactions are recorded as necessary to permit preparation of financial statements in accordance with generally accepted accounting principles, and that receipts and expenditures of the company are being made only in accordance with authorizations of management and directors of the company; and (3) provide reasonable assurance regarding prevention or timely detection of unauthorized acquisition, use, or disposition of the company’s assets that could have a material effect on the financial statements.
Because of its inherent limitations, internal control over financial reporting may not prevent or detect misstatements. Also, projections of any evaluation of effectiveness to future periods are subject to the risk that controls may become inadequate because of changes in conditions, or that the degree of compliance with the policies or procedures may deteriorate.
/s/ Ernst & Young LLP
Pittsburgh, Pennsylvania
February 19, 2021
WESTINGHOUSE AIR BRAKE TECHNOLOGIES CORPORATION
CONSOLIDATED BALANCE SHEETS
| | | | | | | | | | | | | | |
| | | December 31, |
| In millions, except shares and par value | | 2020 | | 2019 |
| Assets | | | | |
| Current Assets | | | | |
| Cash and cash equivalents | | $ | 598.7 | | | $ | 604.2 | |
| Accounts receivable | | 969.3 | | | 1,149.9 | |
| Unbilled accounts receivables | | 443.2 | | | 514.0 | |
| Inventories | | 1,642.1 | | | 1,773.1 | |
| Other current assets | | 226.5 | | | 150.9 | |
| Total current assets | | 3,879.8 | | | 4,192.1 | |
| Property, plant and equipment, net | | 1,601.6 | | | 1,655.8 | |
| Goodwill | | 8,485.2 | | | 8,360.6 | |
| Other intangibles, net | | 3,869.2 | | | 4,104.0 | |
| Other noncurrent assets | | 618.7 | | | 631.7 | |
| Total other assets | | 12,973.1 | | | 13,096.3 | |
| Total Assets | | $ | 18,454.5 | | | $ | 18,944.2 | |
| Liabilities and Shareholders’ Equity | | | | |
| Current Liabilities | | | | |
| Accounts payable | | $ | 909.4 | | | $ | 1,157.5 | |
| Customer deposits | | 642.7 | | | 604.2 | |
| Accrued compensation | | 242.3 | | | 343.8 | |
| Accrued warranty | | 240.1 | | | 226.5 | |
| Current portion of long-term debt | | 447.2 | | | 95.7 | |
| Other accrued liabilities | | 744.6 | | | 830.3 | |
| Total current liabilities | | 3,226.3 | | | 3,258.0 | |
| Long-term debt | | 3,792.2 | | | 4,333.6 | |
| Accrued postretirement and pension benefits | | 113.5 | | | 113.0 | |
| Deferred income taxes | | 168.4 | | | 145.3 | |
| Contingent consideration | | 218.1 | | | 291.8 | |
| Other long term liabilities | | 783.3 | | | 808.9 | |
| Total Liabilities | | 8,301.8 | | | 8,950.6 | |
| Commitment and Contingencies (Note 19) | | | | |
| Equity | | | | |
Convertible preferred stock, $.01 par value; 1.0 shares authorized, no shares issued and outstanding, at December 31, 2020 and 2019 | | — | | | — | |
Common stock, $.01 par value; 500.0 shares authorized: 226.9 and 226.9 shares issued and 188.9 and 191.7 outstanding at December 31, 2020 and 2019, respectively | | 2.0 | | | 2.0 | |
| Additional paid-in capital | | 7,880.6 | | | 7,877.2 | |
Treasury stock, at cost, 38.0 and 35.2 shares, at December 31, 2020 and 2019, respectively | | (1,010.1) | | | (807.1) | |
| Retained earnings | | 3,588.9 | | | 3,267.0 | |
| Accumulated other comprehensive loss | | (339.1) | | | (382.6) | |
| Total Westinghouse Air Brake Technologies Corporation shareholders’ equity | | 10,122.3 | | | 9,956.5 | |
| Noncontrolling interest | | 30.4 | | | 37.1 | |
| Total Equity | | 10,152.7 | | | 9,993.6 | |
| Total Liabilities and Equity | | $ | 18,454.5 | | | $ | 18,944.2 | |
The accompanying notes are an integral part of these statements.
WESTINGHOUSE AIR BRAKE TECHNOLOGIES CORPORATION
CONSOLIDATED STATEMENTS OF INCOME
| | | | | | | | | | | | | | | | | | | | |
| | | Year Ended December 31, |
| | | 2020 | | 2019 | | 2018 |
| In millions, except per share data | | | | | | |
| Net sales: | | | | | | |
| Sales of goods | | $ | 6,233.3 | | | $ | 6,907.9 | | | $ | 4,178.0 | |
| Sales of services | | 1,322.8 | | | 1,292.1 | | | 185.5 | |
| Total net sales | | 7,556.1 | | | 8,200.0 | | | 4,363.5 | |
| Cost of sales: | | | | | | |
| Cost of goods | | (4,629.4) | | | (5,128.4) | | | (2,973.5) | |
| Cost of services | | (789.6) | | | (793.6) | | | (156.1) | |
| Total cost of sales | | (5,419.0) | | | (5,922.0) | | | (3,129.6) | |
| Gross profit | | 2,137.1 | | | 2,278.0 | | | 1,233.9 | |
| Operating expenses: | | | | | | |
| Selling, general and administrative expenses | | (948.1) | | | (1,166.6) | | | (633.2) | |
| Engineering expenses | | (162.1) | | | (209.9) | | | (87.5) | |
| Amortization expense | | (282.4) | | | (238.4) | | | (39.8) | |
| Total operating expenses | | (1,392.6) | | | (1,614.9) | | | (760.5) | |
| Income from operations | | 744.5 | | | 663.1 | | | 473.4 | |
| Other income and expenses: | | | | | | |
| Interest expense, net | | (198.9) | | | (219.1) | | | (112.2) | |
| Other income (expense), net | | 11.6 | | | 2.8 | | | 6.4 | |
| Income before income taxes | | 557.2 | | | 446.8 | | | 367.6 | |
| Income tax expense | | (144.9) | | | (120.3) | | | (75.9) | |
| Net income | | 412.3 | | | 326.5 | | | 291.7 | |
| Less: Net loss attributable to noncontrolling interest | | 2.1 | | | 0.2 | | | 3.2 | |
| Net income attributable to Wabtec shareholders | | $ | 414.4 | | | $ | 326.7 | | | $ | 294.9 | |
| Earnings Per Common Share | | | | | | |
| Basic | | | | | | |
| Net income attributable to Wabtec shareholders | | $ | 2.18 | | | $ | 1.91 | | | $ | 3.06 | |
| Diluted | | | | | | |
| Net income attributable to Wabtec shareholders | | $ | 2.17 | | | $ | 1.84 | | | $ | 3.05 | |
| | | | | | |
| Weighted average shares outstanding | | | | | | |
| Basic | | 189.9 | | | 170.5 | | | 96.0 | |
| Diluted | | 190.4 | | | 177.3 | | | 96.5 | |
The accompanying notes are an integral part of these statements.
WESTINGHOUSE AIR BRAKE TECHNOLOGIES CORPORATION
CONSOLIDATED STATEMENTS OF COMPREHENSIVE INCOME
| | | | | | | | | | | | | | | | | | | | |
| | | Year Ended December 31, |
| | | 2020 | | 2019 | | 2018 |
| In millions | | | | | | |
| Net income attributable to Wabtec shareholders | | $ | 414.4 | | | $ | 326.7 | | | $ | 294.9 | |
| Foreign currency translation gain (loss) | | 48.4 | | | (106.4) | | | (207.3) | |
| Unrealized gain (loss) on derivative contracts | | 7.8 | | | (4.3) | | | (5.3) | |
| Unrealized loss on pension benefit plans and post-retirement benefit plans | | (14.3) | | | (21.5) | | | (3.8) | |
| Other comprehensive income (loss) before tax | | 41.9 | | | (132.2) | | | (216.4) | |
| Income tax benefit related to components of other comprehensive income | | 1.6 | | | 6.2 | | | 4.8 | |
| Other comprehensive income (loss), net of tax | | 43.5 | | | (126.0) | | | (211.6) | |
| Comprehensive income attributable to Wabtec shareholders | | $ | 457.9 | | | $ | 200.7 | | | $ | 83.3 | |
The accompanying notes are an integral part of these statements.
WESTINGHOUSE AIR BRAKE TECHNOLOGIES CORPORATION
CONSOLIDATED STATEMENTS OF CASH FLOWS
| | | | | | | | | | | | | | | | | | | | |
| | | December 31, |
| | | 2020 | | 2019 | | 2018 |
| In millions | | | | | | |
| Operating Activities | | | | | | |
| Net income | | $ | 412.3 | | | $ | 326.5 | | | $ | 291.7 | |
| Adjustments to reconcile net income to cash provided by operations: | | | | | | |
| Depreciation and amortization | | 473.3 | | | 401.4 | | | 109.3 | |
| Stock-based compensation expense | | 19.5 | | | 50.0 | | | 25.3 | |
| Below market intangible amortization | | (88.2) | | | (82.2) | | | — | |
| Deferred income taxes | | 29.4 | | | (27.3) | | | (5.3) | |
| Loss on disposal of property, plant and equipment | | 9.6 | | | 15.9 | | | 0.9 | |
| Changes in operating assets and liabilities, net of acquisitions | | | | | | |
| Accounts receivable and unbilled accounts receivable | | 315.0 | | | (6.3) | | | (54.6) | |
| Inventories | | 180.8 | | | 255.9 | | | (108.9) | |
| Accounts payable | | (269.0) | | | (144.3) | | | 48.8 | |
| Accrued income taxes | | 56.9 | | | 10.7 | | | 7.9 | |
| Accrued liabilities and customer deposits | | (91.4) | | | (11.9) | | | 31.7 | |
| Other assets and liabilities | | (264.5) | | | 227.1 | | | (32.1) | |
| Net cash provided by operating activities | | 783.7 | | | 1,015.5 | | | 314.7 | |
| Investing Activities | | | | | | |
| Purchase of property, plant and equipment | | (136.4) | | | (185.3) | | | (93.3) | |
| Proceeds from disposal of property, plant and equipment | | 21.3 | | | 3.9 | | | 11.3 | |
| Acquisitions of business, net of cash acquired | | (40.3) | | | (2,996.4) | | | (51.2) | |
| Other | | — | | | — | | | (14.1) | |
| Net cash used for investing activities | | (155.4) | | | (3,177.8) | | | (147.3) | |
| Financing Activities | | | | | | |
| Proceeds from debt, net of issuance costs | | 3,878.0 | | | 3,982.4 | | | 3,480.7 | |
| Payments of debt | | (4,077.3) | | | (3,423.6) | | | (1,454.0) | |
| Repurchase of stock | | (207.2) | | | — | | | — | |
| Payment of contingent consideration on acquisitions | | (115.4) | | | (10.1) | | | — | |
| Cash dividends | | (92.5) | | | (81.7) | | | (46.3) | |
| Other financing activities | | (4.6) | | | (5.5) | | | (2.3) | |
| Net cash (used for) provided by financing activities | | (619.0) | | | 461.5 | | | 1,978.1 | |
| Effect of changes in currency exchange rates | | (14.8) | | | (37.3) | | | (36.6) | |
| (Decrease) increase in cash | | (5.5) | | | (1,738.1) | | | 2,108.9 | |
| Cash, cash equivalents and restricted cash, beginning of year | | 604.2 | | | 2,342.3 | | | 233.4 | |
| Cash, cash equivalents and restricted cash, end of year | | $ | 598.7 | | | $ | 604.2 | | | $ | 2,342.3 | |
The accompanying notes are an integral part of these statements.
WESTINGHOUSE AIR BRAKE TECHNOLOGIES CORPORATION
CONSOLIDATED STATEMENTS OF SHAREHOLDERS’ EQUITY
| | | | | | | | | | | | | | | | | | | | | | | | | | | | | | | | | | | | | | | | | | | | | | | | | | | | | | | | |
| | Common
Stock | | Common
Stock | | Additional
Paid-in | | Treasury
Stock | | Treasury
Stock | | Retained | | Accumulated
Other | | Non-controlling | | |
| In millions, except share and per share data | | Shares | | Amount | | Capital | | Shares | | Amount | | Earnings | | Comprehensive Loss | | Interest | | Total |
| Balance, December 31, 2017 | | 132,349,534 | | | $ | 1.3 | | | $ | 906.6 | | | (36,315,182) | | | $ | (827.4) | | | $ | 2,773.4 | | | $ | (45.0) | | | $ | 19.7 | | | $ | 2,828.6 | |
Cash dividends ($0.48 dividend per share) | | — | | | — | | | — | | | — | | | — | | | (46.3) | | | — | | | — | | | (46.3) | |
| Proceeds from treasury stock issued from the exercise of stock options and other benefit plans, net of tax | | — | | | — | | | (13.5) | | | 580,594 | | | 11.3 | | | — | | | — | | | — | | | (2.2) | |
| Stock based compensation | | — | | | — | | | 21.5 | | | — | | | — | | | — | | | — | | | — | | | 21.5 | |
| Net income | | — | | | — | | | — | | | — | | | — | | | 294.9 | | | — | | | (3.2) | | | 291.7 | |
| Other comprehensive income, net of tax | | — | | | — | | | — | | | — | | | — | | | — | | | (211.6) | | | — | | | (211.6) | |
| Stock issued for Faiveley Transport Acquisition | | — | | | — | | | — | | | — | | | — | | | — | | | — | | | (12.6) | | | (12.6) | |
| Balance, December 31, 2018 | | 132,349,534 | | | 1.3 | | | 914.6 | | | (35,734,588) | | | (816.1) | | | 3,022.0 | | | (256.6) | | | 3.9 | | | 2,869.1 | |
Cash dividends ($0.48 dividend per share) | | — | | | — | | | — | | | — | | | — | | | (81.7) | | | — | | | — | | | (81.7) | |
| Proceeds from treasury stock issued from the exercise of stock options and other benefit plans, net of tax | | — | | | — | | | (14.6) | | | 486,601 | | | 9.0 | | | — | | | — | | | — | | | (5.6) | |
| Stock based compensation | | — | | | — | | | 38.2 | | | — | | | — | | | — | | | — | | | — | | | 38.2 | |
| Net income (loss) | | — | | | — | | | — | | | — | | | — | | | 326.7 | | | — | | | (0.2) | | | 326.5 | |
| Other comprehensive loss, net of tax | | — | | | — | | | — | | | — | | | — | | | — | | | (126.0) | | | — | | | (126.0) | |
| Acquisition of GE Transportation | | 94,598 | | | 0.7 | | | 6,939.0 | | | — | | | — | | | — | | | — | | | 30.6 | | | 6,970.3 | |
| Other owner changes | | — | | | — | | | — | | | — | | | — | | | — | | | — | | | 2.8 | | | 2.8 | |
| Balance, December 31, 2019 | | 226,947,180 | | | 2.0 | | | 7,877.2 | | | (35,247,987) | | | (807.1) | | | 3,267.0 | | | (382.6) | | | 37.1 | | | 9,993.6 | |
Cash dividends ($0.48 dividend per share) | | — | | | — | | | — | | | — | | | — | | | (92.5) | | | — | | | — | | | (92.5) | |
| Proceeds from treasury stock issued from the exercise of stock options and other benefit plans, net of tax | | — | | | — | | | (8.7) | | | 315,988 | | | 4.2 | | | — | | | — | | | — | | | (4.5) | |
| Stock based compensation | | — | | | — | | | 16.9 | | | — | | | — | | | — | | | — | | | — | | | 16.9 | |
| Net income | | — | | | — | | | — | | | — | | | — | | | 414.4 | | | — | | | (2.1) | | | 412.3 | |
| Other comprehensive loss, net of tax | | — | | | — | | | — | | | — | | | — | | | — | | | 43.5 | | | (1.3) | | | 42.2 | |
| Stock repurchase | | — | | | — | | | — | | | (3,127,698) | | | (207.2) | | | — | | | — | | | — | | | (207.2) | |
| Other owner changes | | — | | | — | | | (4.8) | | | — | | | — | | | — | | | — | | | (3.3) | | | (8.1) | |
| Balance, December 31, 2020 | | 226,947,180 | | | $ | 2.0 | | | $ | 7,880.6 | | | (38,059,697) | | | $ | (1,010.1) | | | $ | 3,588.9 | | | $ | (339.1) | | | $ | 30.4 | | | $ | 10,152.7 | |
The accompanying notes are an integral part of these statements.
NOTES TO CONSOLIDATED FINANCIAL STATEMENTS
1. BUSINESS
Wabtec is one of the world’s largest providers of locomotives, value-added, technology-based equipment, systems and services for the global freight rail and passenger transit industries. Our highly engineered products, which are intended to enhance safety, improve productivity and reduce maintenance costs for customers, can be found on most locomotives, freight cars, passenger transit cars and buses around the world. Our products enhance safety, improve productivity and reduce maintenance costs for customers, and many of our core products and services are essential in the safe and efficient operation of freight rail and passenger transit vehicles. Wabtec is a global company with operations in over 50 countries and our products can be found in more than 100 countries throughout the world. In 2020, approximately 58% of the Company’s net sales came from customers outside the U.S.
On March 11, 2020, the World Health Organization designated the outbreak of the novel strain of coronavirus, known as COVID-19, as a global pandemic. Governments and businesses around the world have taken unprecedented actions to mitigate the spread of COVID-19, including but not limited to, shelter-in-place orders, quarantines, significant restrictions on travel, as well as restrictions that prohibit many employees from going to work. Our top concern is, and remains, the health and well-being of our employees around the world. To date, COVID-19 has surfaced in nearly all regions around the world and has impacted our sales channels, supply chain, manufacturing operations, workforce, and other key aspects of our operations. The outbreak and preventive measures taken to help curb the spread, including temporary plant closures in China, India, Italy and other countries where outbreaks and stay-at-home orders were most prevalent, had an adverse impact on our operations and business results for the year ended December 31, 2020.
2. SUMMARY OF SIGNIFICANT ACCOUNTING POLICIES
Principles of Consolidation The consolidated financial statements include the accounts of the Company and all subsidiaries that it controls. For consolidated subsidiaries in which the Company's ownership is less than 100%, the outside shareholders' interests are shown as noncontrolling interests. These statements have been prepared in accordance with U.S. generally accepted accounting principles. Sales between subsidiaries are billed at prices consistent with sales to third parties and are eliminated in consolidation.
Cash Equivalents Cash equivalents are highly liquid investments purchased with an original maturity of three months or less.
Allowance for Doubtful Accounts The allowance for doubtful accounts receivable reflects our best estimate of expected losses inherent in our receivable portfolio determined on the basis of historical experience, relevant credit forecast information, changes to customer's solvency and other currently available evidence. The allowance for doubtful accounts was $36.5 million and $19.9 million as of December 31, 2020 and 2019, respectively.
Inventories Inventories are stated at the lower of cost or net realizable value. Cost is determined under the first-in, first-out (FIFO) method. Inventory costs include material, labor and overhead.
Property, Plant and Equipment Property, plant and equipment additions are stated at cost. Expenditures for renewals and improvements are capitalized. Expenditures for ordinary maintenance and repairs are expensed as incurred. The Company computes book depreciation principally on the straight-line method. Accelerated depreciation methods are utilized for income tax purposes.
Leasing Arrangements The Company conducts a portion of its operations from leased facilities and finances certain equipment purchases through lease agreements. In those cases in which the lease term approximates the useful life of the leased asset or the lease meets certain other prerequisites, the leasing arrangement is classified as a financing lease. The remaining arrangements are treated as operating leases. Right-of-use lease assets are classified as long-term assets under the caption "Other noncurrent assets" and lease liabilities are classified under the captions "Other accrued liabilities' and "Other long-term liabilities."
Goodwill and Intangible Assets Goodwill and other intangible assets with indefinite lives are not amortized. Other intangibles (with definite lives) are amortized on a straight-line basis over their estimated economic lives. Amortizable intangible assets are reviewed for impairment when indicators of impairment are present. The Company tests goodwill and indefinite-lived intangible assets for impairment at the reporting unit level and at least annually. The Company performs its annual impairment test during the fourth quarter after the annual forecasting process is completed, and also tests for impairment whenever events or changes in circumstances indicate that the carrying value may not be recoverable. Periodically, Management of the Company assesses whether or not an indicator of impairment is present that would necessitate an impairment analysis be performed.
Equity Method Investments The Company invests in privately-held companies which are accounted for using the equity method. The equity method is applied in situations where the Company has the ability to exercise significant influence, but not
control, over the investee. Equity method investments are classified as other assets under the caption "Other noncurrent assets" on the consolidated balance sheet. Equity method investments were $100.0 million and $95.2 million at December 31, 2020 and 2019, respectively.
Depreciation Expense Depreciation of property, plant and equipment related to the manufacturing of products or services provided is included in Cost of goods or Cost of services. Depreciation of other property, plant and equipment that is not attributable to the manufacturing of products or services provided is included in Selling, General and Administrative Expenses or Engineering Expense to the extent the property, plant, and equipment is used for research and development purposes.
Warranty Costs Warranty costs are accrued based on Management’s estimates of repair or upgrade costs per unit and historical experience.
Income Taxes Income taxes are accounted for under the liability method. Deferred tax assets and liabilities are determined based on differences between financial reporting and tax basis of assets and liabilities and are measured using the enacted tax rates and laws. The provision for income taxes includes federal, state and foreign income taxes.
Stock-Based Compensation The Company recognizes compensation expense for stock-based compensation based on the grant date fair value amortized ratably over the requisite service period following the date of grant.
Financial Derivatives and Hedging Activities In the normal course of business, the Company is exposed to interest rate, commodity price and foreign currency exchange rate fluctuations. At times, the Company limits these risks through the use of derivatives such as cross-currency swaps, foreign currency forward contracts, interest rate swaps, commodity forwards and futures. In accordance with the Company's policy, derivatives are only used for hedging purposes. The Company does not use derivatives for trading or speculative purposes. Foreign currency forward contracts are agreements with a counterparty to exchange two distinct currencies at a set exchange rate for delivery on a set date at some point in the future. There is no exchange of funds until the delivery date. At the delivery date, the Company can either take delivery of the currency or settle on a net basis. For further information regarding the foreign currency forward contracts, see Note 17.
Foreign Currency Translation Certain of our international operations have determined that the local currency is the functional currency whereas others have determined the U.S. dollar is their functional currency. Assets and liabilities of foreign subsidiaries where the functional currency is the local currency are translated at the rate of exchange in effect on the balance sheet date while income and expenses are translated at the average rates of exchange prevailing during the period. Foreign currency gains and losses resulting from transactions and the translation of financial statements are recorded in the Company’s consolidated financial statements based upon the provisions of ASC 830 “Foreign Currency Matters.” The effects of currency exchange rate changes on intercompany transactions and balances of a long-term investment nature are accumulated and carried as a component of accumulated other comprehensive loss. The effects of currency exchange rate changes on intercompany transactions that are denominated in a currency other than an entity’s functional currency are charged or credited to earnings. Foreign exchange transaction losses recognized in other income, net were $8.2 million, $13.5 million and $5.7 million for 2020, 2019 and 2018, respectively.
Noncontrolling Interests In accordance with ASC 810, the Company has classified noncontrolling interests as equity on our consolidated balance sheets as of December 31, 2020 and 2019. Net loss attributable to noncontrolling interests was not material for the years ended December 31, 2020, 2019 and 2018, respectively.
Revenue Recognition The Company accounts for Revenue under ASC 606 “Revenue from Contracts with Customers.” This guidance provides a five-step analysis of transactions to determine when and how revenue is recognized and requires entities to recognize revenue at an amount that reflects the consideration to which the Company expects to be entitled in exchange for transferring goods or services to a customer.
A majority of the Company’s revenues are derived from performance obligations that are satisfied at a point in time when control passes to the customer which is generally at the time of shipment in accordance with agreed upon delivery terms. The remaining revenues are earned over time. All fees billed to the customer for shipping and handling are classified as a component of Net sales. All costs associated with shipping and handling are classified as a component of Cost of sales.
The Company also has long-term customer agreements involving the design and production of highly engineered products that require revenue to be recognized over time because these products have no alternative use without significant economic loss and the agreements contain an enforceable right to payment including a reasonable profit margin from the customer in the event of contract termination. Additionally, the Company has customer agreements involving the creation or enhancement of an asset that the customer controls which also require revenue to be recognized over time. Generally, the Company uses an input method for determining the amount of revenue, cost and gross margin to recognize over time for these customer agreements. The input methods used for these agreements include costs of material and labor, both of which give an accurate representation of the progress made toward complete satisfaction of a particular performance obligation. Contract revenues and cost estimates are reviewed and revised periodically through the year and adjustments are reflected in the
accounting period as such amounts are determined. Additional information with respect to contract assets and liabilities is included in Note 8.
Due to the nature of work required to be performed on the Company’s long-term projects, the estimation of total revenue and cost at completion is subject to many variables and requires significant judgment. Contract estimates related to long-term projects are based on various assumptions to project the outcome of future events that could span several years. These assumptions include cost of materials; labor availability and productivity; complexity of the work to be performed; and the performance of suppliers, customers and subcontractors that may be associated with the contract. We have a disciplined process where management reviews the progress of long term-projects periodically throughout the year. As part of this process, management reviews information including key contract matters, progress towards completion, identified risks and opportunities and any other information that could impact the Company’s estimates of revenue and costs. After completing this analysis, any adjustments to net sales, cost of goods sold, and the related impact to operating income are recognized as necessary in the period they become known.
Generally, the Company’s revenue contains a single performance obligation for each distinct good or service; however, a single contract may have multiple performance obligations comprising multiple promises to customers. When there are multiple performance obligations, revenue is allocated based on the relative stand-alone selling price. Pricing is defined in our contracts on a line item basis and includes an estimate of variable consideration when required by the terms of the individual customer contract. Types of variable consideration the Company typically has include volume discounts, prompt payment discounts, price escalation clauses, liquidating damages, and performance bonuses. Sales returns and allowances are also estimated and recognized in the same period the related revenue is recognized, based upon the Company’s experience.
Remaining performance obligations represent the allocated transaction price of unsatisfied or partially unsatisfied performance obligations. As of December 31, 2020, the Company's remaining performance obligations were $20.8 billion. The Company expects to recognize revenue of approximately 25% of remaining performance obligations over the next 12 months, with the remainder recognized thereafter.
SEC regulations require that revenue categories that exceed 10% of total revenue are presented separately on the company's Statement of income. As such, the Company has displayed sales of goods and sales of services, and the related cost, in line with those regulations. Additionally, those regulations also require that goods are to include all sales of tangible products, and services must include all other sales. In Note 20 we refer to sales of both goods, such as spare parts and equipment upgrades, and related services, such as monitoring, maintenance and repairs, as sales in our Services product line.
Revolving Receivables Program In May 2020, the Company entered into a revolving agreement to transfer up to $150.0 million of certain receivables of certain subsidiaries of the Company (the "Originators") through our bankruptcy-remote subsidiary to a financial institution on a recurring basis in exchange for cash equal to the gross receivables transferred. As customers pay their balances, we transfer additional receivables into the program, resulting in our gross receivables sold exceeding net cash flow impacts (e.g., collect and reinvest). The sold receivables are fully guaranteed by our bankruptcy-remote subsidiary which holds additional receivables of $114.0 million and unbilled receivables of $19.7 million at December 31, 2020 that are pledged as collateral under this agreement. The transfers are recorded at fair value of the proceeds received and obligations assumed less derecognized receivables. No obligation was recorded at December 31, 2020 as the estimated expected credit losses on receivables sold is insignificant. Our maximum exposure to loss related to these receivables transferred is limited to the amount outstanding. The Company has agreed to guarantee the performance of the Originators respective obligations under the revolving agreement. None of the Company (except for the bankruptcy-remote consolidated subsidiary referenced above) nor the Originators guarantees the collectability of the receivables under the revolving agreements.
The following table sets forth a summary of receivables sold:
| | | | | | | | |
| In millions | | Twelve Months Ended December 31, 2020 |
| Gross receivables sold/cash proceeds received | | $ | 852.1 | |
| Collections reinvested under revolving agreement | | 779.4 | |
| Net cash proceeds (remitted) received | | 72.7 | |
Pre-Production Costs Certain pre-production costs relating to long-term production and supply contracts have been deferred and will be recognized over the life of the contracts. Deferred pre-production costs were $87.0 million and $88.0 million at December 31, 2020 and 2019, respectively.
Preferred Stock The Company’s authorized capital stock includes 1,000,000 shares of preferred stock. The Board of Directors has the authority to issue the preferred stock and to fix the designations, powers, preferences and rights of the shares of each such class or series, including dividend rates, conversion rights, voting rights, terms of redemption and liquidation preferences, without any further vote or action by the Company’s shareholders. The rights and preferences of the preferred
stock would be superior to those of the common stock. At December 31, 2020 and 2019 there was no preferred stock issued or outstanding.
Significant Customers and Concentrations of Credit Risk The Company’s trade receivables are primarily from rail and transit industry original equipment manufacturers, Class I railroads, railroad carriers and commercial companies that utilize rail cars in their operations, such as utility and chemical companies. No one customer accounted for more than 10% of the Company’s consolidated net sales in 2020, 2019 or 2018.
Reclassifications Certain prior year amounts have been reclassified, where necessary, to conform to the current year presentation.
Use of Estimates The preparation of financial statements in conformity with generally accepted accounting principles in the United States requires the Company to make estimates and assumptions that affect the reported amounts of assets and liabilities at the date of the financial statements and reported amounts of revenues and expenses during the reporting period. Actual amounts could differ materially from the estimates. On an ongoing basis, Management reviews its estimates based on currently available information. Changes in facts and circumstances may result in revised estimates.
Accounting Standards Adopted in 2020
On January 1, 2020, the Company adopted the following Accounting Standard Updates (ASU) issued by the Financial Accounting Standard Board (FASB), none of which had a material impact on the Company’s Consolidated Financial Statements:
•ASU No. 2016-13, Financial Instruments - Credit Losses (Topic 326): Measurement of Credit Losses on Financial Instruments;
•ASU No. 2017-04, Intangibles - Goodwill and Other (Topic 350): Simplifying the Test for Goodwill Impairment.
In March 2020, the SEC amended Rules 3-10 and 3-16 of Regulation S-X regarding financial disclosure requirements for registered debt offerings involving subsidiaries as either issuers or guarantors and affiliates whose securities are pledged as collateral. This new guidance narrows the circumstances that require separate financial statements of subsidiary issuers and guarantors and streamlines the alternative disclosures required in lieu of those statements. The final rule also allows for simplified disclosures to be included within Management’s Discussion and Analysis. This rule is effective January 4, 2021 with early adoption permitted. The Company elected to early adopt this rule during the three months ended June 30, 2020.
Accounting Standards to be Adopted in Future Years
In December 2019, the Financial Accounting Standards Board ("FASB") issued ASU 2019-12, “Income Taxes: Simplifying the Accounting for Income Taxes.” The amendments in this update simplify the accounting for certain income tax transactions by removing specific exceptions to the general principles in Topic 740, Income Taxes. This guidance is effective for fiscal years beginning after December 15, 2020 with early adoption permitted. The Company does not expect the adoption of this standard to have a material impact on its consolidated financial statements.
3. ACQUISITIONS
General Electric Transportation
Wabtec, General Electric Company ("GE"), GE Transportation, a Wabtec company formerly known as Transportation System Holdings Inc. ("SpinCo"), which was a newly formed wholly owned subsidiary of GE, and Wabtec US Rail Holdings, Inc. ("Merger Sub"), which was a newly formed wholly owned subsidiary of the Company, entered into the Original Merger Agreement on May 20, 2018, and GE, SpinCo, Wabtec and Wabtec US Rail, Inc. ("Direct Sale Purchaser") entered into the Original Separation Agreement on May 20, 2018, which together provided for the combination of Wabtec and GE Transportation. The Original Merger Agreement and Original Separation Agreement were subsequently amended on January 25, 2019 and the Merger was completed on February 25, 2019.
As part of the Merger, certain assets of GE Transportation, including the equity interests of certain pre-Transaction subsidiaries of GE that compose part of GE Transportation, were sold to Direct Sale Purchaser for a cash payment of $2.875 billion, and Direct Sale Purchaser assumed certain liabilities of GE Transportation in connection with this purchase (the "Direct Sale"). Thereafter, GE transferred the SpinCo business to SpinCo and its subsidiaries (to the extent not already held by SpinCo and its subsidiaries), and SpinCo issued to GE shares of SpinCo Class A preferred stock, SpinCo Class B preferred stock, SpinCo Class C preferred stock and additional shares of SpinCo common stock. Following this issuance of additional SpinCo common stock to GE, and immediately prior to the Distribution (as defined below), GE owned 8,700,000,000 shares of SpinCo common stock, 15,000 shares of SpinCo Class A preferred stock, 10,000 shares of SpinCo Class B preferred stock and one share of SpinCo Class C preferred stock, which constituted all of the outstanding stock of SpinCo.
Following the Direct Sale, GE distributed the distribution shares of SpinCo in a spin-off transaction to its stockholder (the "Distribution"). Immediately after the Distribution, Merger Sub merged with and into SpinCo (the "Merger"), whereby the separate corporate existence of Merger Sub ceased and SpinCo continued as the surviving company and a wholly owned subsidiary of Wabtec (except with respect to shares of SpinCo Class A preferred stock held by GE). In the Merger, subject to adjustment in accordance with the Merger Agreement, each share of SpinCo common stock converted into the right to receive a number of shares of Wabtec common stock based on the common stock exchange ratio set forth in the Merger Agreement and the share of SpinCo Class C preferred stock was converted into the right to receive (a) 10,000 shares of Wabtec convertible preferred stock and (b) a number of shares of Wabtec common stock equal to 9.9% of the fully-diluted pro forma Wabtec shares. Immediately prior to the Merger, Wabtec paid $10.0 million in cash to GE in exchange for all of the shares of SpinCo Class B preferred stock.
Upon consummation of the Merger, Wabtec issued 46,763,975 shares of common stock to the holders of GE common stock, 19,018,207 shares of common stock to GE and 10,000 shares of preferred stock to GE and made a cash payment to GE of $2.885 billion. As a result and calculated based on Wabtec’s outstanding common stock on a fully-diluted, as-converted and as-exercised basis, as of February 25, 2019, approximately 49.2% of the outstanding shares of Wabtec common stock was held collectively by GE and holders of GE common stock (with 9.9% held by GE directly in shares of Wabtec common stock and 15% underlying the shares of Wabtec convertible preferred stock held by GE) and approximately 50.8% of the outstanding shares of Wabtec common stock would be held by pre-Merger Wabtec stockholders, in each case calculated on a fully-diluted, as-converted and as-exercised basis. Following the Merger, GE also retained 15,000 shares of SpinCo Class A non-voting preferred stock, and Wabtec held 10,000 shares of SpinCo Class B non-voting preferred stock.
After the Merger, SpinCo, which is Wabtec’s wholly owned subsidiary (except with respect to shares of SpinCo Class A preferred stock held by GE), and Direct Sale Purchaser, which also is Wabtec’s wholly owned subsidiary, together, SpinCo and Direct Sale Purchaser own and operate the post-transaction GE Transportation. All shares of the Company’s common stock, including those issued in the Merger, are listed on the NYSE under the Company’s current trading symbol “WAB.” On the date of the Distribution, GE and SpinCo, directly or through subsidiaries entered into additional agreements relating to, among other things, intellectual property, employee matters, tax matters, research and development and transition services.
On May 6, 2019, GE completed the sale of approximately 8,780 shares of Wabtec's Series A Preferred stock which converted upon the sale to 25,300,000 shares of Wabtec's common stock. On August 9, 2019, GE completed a sale of the remaining shares of Series A Preferred Stock outstanding which converted to approximately 3,515,500 shares of common stock, as well as 16,969,656 shares of common stock owned directly by GE. Finally, on September 12, 2019, GE completed a sale of all of its remaining shares of common stock of Wabtec, approximately 2,048,515 shares. In conjunction with these secondary offerings, the Company waived the requirements under the shareholders agreement for GE to maintain certain ownership levels of Wabtec's stock following the closing date of the Merger. The Company did not receive any proceeds from the sale of any of these shares.
Total future consideration to be paid by Wabtec to GE includes a fixed payment of $470.0 million, of which $115.4 million was paid in 2020, which is directly related to the timing of tax benefits expected to be realized by Wabtec as a result of the acquisition of GE Transportation. This payment is considered contingent consideration because the timing of cash payments to GE is directly related to the future timing of tax benefits received by the Company as a result of the acquisition of
GE Transportation. The estimated total value of the consideration to be paid by Wabtec in the acquisition transactions is approximately $10.3 billion, including the cash paid for the Direct Sales Assets, equity transferred for SpinCo, contingent consideration, assumed debt and net of cash acquired. The consideration is based on the Company’s closing share price of $73.36 on February 22, 2019 and the fair value of the contingent consideration.
The fair values of the assets acquired and liabilities assumed were determined using the income, cost and market approaches. Discounted cash flow models were used to estimate the fair values of acquired contract backlog, customer relationships, intellectual property intangibles, and below-market customer contracts liabilities. The fair value measurements were primarily based on significant inputs that are not observable in the market and are considered Level 3. The noncontrolling interest includes equity interests in GE Transportation's Brazil operations held by third parties on the date of acquisition. At the time of acquisition, quotable market prices of the noncontrolling interest existed; therefore, the noncontrolling interest in the GE Transportation Brazil operations were measured using a Level 1 input. In April 2019, the Company acquired the noncontrolling interest in GE Transportation's Brazil operations for $56.2 million which approximated the fair value assigned to the noncontrolling interest on the date of acquisition. The remaining noncontrolling interest value was determined based on inputs that are not observable in the market and are considered Level 3.
The following table summarizes the final fair value of the GE Transportation assets acquired and liabilities assumed:
| | | | | | | | |
| In millions | | |
| Assets acquired | | |
| Cash and cash equivalents | | $ | 177.2 | |
| Accounts receivable | | 541.3 | |
| Inventories | | 1,189.7 | |
| Other current assets | | 71.5 | |
| Property, plant, and equipment | | 1,088.6 | |
| Goodwill | | 5,983.5 | |
| Trade names | | 55.0 | |
| Customer relationships | | 550.0 | |
| Intellectual property | | 1,180.0 | |
| Backlog | | 1,450.0 | |
| Other noncurrent assets | | 321.2 | |
| Total assets acquired | | 12,608.0 | |
| Liabilities assumed | | |
| Current liabilities | | 1,594.2 | |
| Contingent consideration | | 440.0 | |
| Other noncurrent liabilities | | 666.5 | |
| Total liabilities assumed | | 2,700.7 | |
| Net assets acquired | | 9,907.3 | |
| Noncontrolling interest | | $ | 88.3 | |
The revisions to the initial estimates were based on information that existed at the date of the acquisition. Trade names, customer relationships, patents and backlog intangible assets are subject to amortization. Customer relationship and backlog intangible assets are amortized using the straight-line method of amortization using a shortened estimated useful life then the projected future cash flow benefits of the intangible assets. Contingent liabilities assumed as part of the transaction were not material and are related to legal and tax matters. Contingent liabilities are recorded at fair value in purchase accounting, aside from those pertaining to uncertainty in income taxes which are an exception to the fair value basis of accounting. Included in other noncurrent liabilities are approximately $524.6 million of customer contracts whose terms are unfavorable compared to market terms at the date of consummation of the GE Transportation acquisition.
Goodwill was calculated as the difference between the acquisition date fair value of the consideration transferred and the fair value of the net assets acquired, and represents the future economic benefits, including synergies, and assembled workforce, that are expected to be achieved as a result of the consummation of the acquisition of GE Transportation. A majority of the purchased goodwill is expected to be deductible for tax purposes. The goodwill has been allocated to the Freight segment.
Costs related to the acquisition and integration of GE Transportation were approximately $47.5 million and $63.0 million for the years ended December 31, 2020 and 2019, respectively, and are included in selling, general and administrative expenses on the consolidated statements of income.
The Company also made smaller acquisitions not listed above which are individually and collectively immaterial.
The following unaudited pro forma consolidated financial information presents income statement results as if the GE Transportation acquisition had occurred January 1, 2019:
| | | | | | | | |
| In millions, except per share data | | Twelve Months Ended December 31, 2019 |
| Net sales | | $ | 8,675.6 | |
| Gross profit | | 2,343.3 | |
| Net income attributable to Wabtec shareholders | | 277.2 | |
| Diluted earnings per share | | |
| As Reported | | $ | 1.84 | |
| Pro forma | | $ | 1.45 | |
The historical consolidated financial information of the Company and the GE Transportation acquisition detailed above has been adjusted in the pro forma information to give effect to pro forma events that are (1) directly attributable to the transactions, (2) factually supportable and (3) expected to have a continuing impact on the combined results. Pro forma data may not be indicative of the results that would have been obtained had the GE Transportation acquisition occurred at the beginning of the periods presented, nor is it intended to be a projection of future results.
4. SUPPLEMENTAL CASH FLOW DISCLOSURES
| | | | | | | | | | | | | | | | | | | | |
| | | Year Ended December 31, |
| | | 2020 | | 2019 | | 2018 |
| In millions | | | | | | |
| Interest paid during the year | | $ | 174.2 | | | $ | 193.1 | | | $ | 81.8 | |
| Income taxes paid during the year, net of amount refunded | | $ | 128.8 | | | $ | 99.5 | | | $ | 83.9 | |
| Business acquisitions: | | | | | | |
| Fair value of assets acquired | | 70.3 | | | 12,612.9 | | | 91.8 | |
| Liabilities assumed | | 35.0 | | | 2,466.3 | | | 32.9 | |
| Non-controlling interest (acquired) assumed | | (5.6) | | | 30.9 | | | — | |
| Stock and cash paid | | 40.9 | | | 10,115.7 | | | 58.9 | |
| Less: Cash acquired | | 0.6 | | | 179.6 | | | 7.7 | |
| Stock used for acquisition | | — | | | 6,939.7 | | | — | |
| Net cash paid | | $ | 40.3 | | | $ | 2,996.4 | | | $ | 51.2 | |
5. INVENTORIES
The components of inventory, net of reserves, were:
| | | | | | | | | | | | | | |
| | | December 31, |
| In millions | | 2020 | | 2019 |
| Raw materials | | $ | 669.4 | | | $ | 786.4 | |
| Work-in-progress | | 339.4 | | | 374.0 | |
| Finished goods | | 633.3 | | | 612.7 | |
| Total inventories | | $ | 1,642.1 | | | $ | 1,773.1 | |
6. PROPERTY, PLANT & EQUIPMENT
The major classes of depreciable assets are as follows:
| | | | | | | | | | | | | | |
| | | December 31, |
| In millions | | 2020 | | 2019 |
| Machinery and equipment | | $ | 1,474.6 | | | $ | 1,363.8 | |
| Buildings and improvements | | 801.1 | | | 774.2 | |
| Land and improvements | | 97.6 | | | 78.0 | |
| Property, plant and equipment | | 2,373.3 | | | 2,216.0 | |
| Less: accumulated depreciation | | (771.7) | | | (560.2) | |
| Total | | $ | 1,601.6 | | | $ | 1,655.8 | |
The estimated useful lives of property, plant and equipment are as follows:
| | | | | | | | |
| | | Years |
| Land improvements | | 10 to 20 |
| Building and improvements | | 20 to 40 |
| Machinery and equipment | | 3 to 15 |
Depreciation expense was $183.1 million, $157.8 million, and $66.4 million for 2020, 2019 and 2018, respectively.
7. INTANGIBLES
Goodwill and indefinite lived intangible assets are reviewed annually during the fourth quarter for impairment. For 2020, the Company opted to proceed directly to the quantitative impairment test for all reporting units with goodwill. The discounted cash flow approach and the market approach were used to estimate the fair value of each reporting unit using a weighting of 75% and 25%, respectively. The discounted cash flow model requires several assumptions including future sales growth, EBIT (earnings before interest and taxes) margins, capital expenditures, a discount rate and a terminal revenue growth rate (the revenue growth rate for the period beyond the years forecasted by the reporting units) for each reporting unit. The market approach requires several assumptions including EBITDA (earnings before interest, taxes, depreciation and amortization) multiples for comparable companies that operate in the same markets as the Company’s reporting units. For 2020, the discounted cash flow approach was given more weight compared to the market approach due to a relatively reduced amount of publicly available data from companies with comparable operations to those of Wabtec; however, both valuation approaches resulted in a conclusion that the estimated fair value of all three of the Company's reporting units was in excess of their respective carrying value, which resulted in a conclusion that no impairment existed.
Additionally, the Company proceeded directly to the quantitative impairment test for some trade names with indefinite lives. The fair value of all material trade names subject to the quantitative impairment test exceeded its respective carrying value, resulting in a conclusion that no material impairment existed. For trade names not subject to the quantitative testing, the Company opted to perform a qualitative trade name impairment assessment and determined from the qualitative assessment that it was not more likely than not that the estimated fair values of the trade names were less than their carrying values; therefore, no further analysis was required. In assessing the qualitative factors to determine whether it is more likely than not that the fair value of a trade name is less than its carrying amount, the Company assessed relevant events and circumstances that may impact the fair value and the carrying amount of the trade name. The identification of relevant events and circumstances and how these may impact a trade name’s fair value or carrying amount involve significant judgments and assumptions. The judgment and assumptions include the identification of macroeconomic conditions, industry and market considerations, cost factors, overall financial performance, Wabtec specific events, share price trends and making the assessment on whether each relevant factor will impact the impairment test positively or negatively and the magnitude of any such impact.
The change in the carrying amount of goodwill by segment for the year ended December 31, 2020 is as follows:
| | | | | | | | | | | | | | | | | | | | |
| | Freight | | Transit | | |
| In millions | | Segment | | Segment | | Total |
| Balance at December 31, 2019 | | $ | 6,876.6 | | | $ | 1,484.0 | | | $ | 8,360.6 | |
| Additions | | 2.1 | | | — | | | 2.1 | |
| Disposals | | (5.6) | | | — | | | (5.6) | |
| Foreign currency impact | | (0.9) | | | 129.0 | | | 128.1 | |
| Balance at December 31, 2020 | | $ | 6,872.2 | | | $ | 1,613.0 | | | $ | 8,485.2 | |
As of December 31, 2020 and 2019, the Company’s trade names had a net carrying amount of $650.7 million and $623.1 million, respectively, and the Company believes these intangibles have indefinite lives, with the exception of the right to use the GE Transportation trade name, to which the Company has assigned a useful life of 5 years.
Intangible assets of the Company, other than goodwill and trade names, consist of the following:
| | | | | | | | | | | | | | |
| | | December 31, |
| In millions | | 2020 | | 2019 |
Intellectual property, patents, and other intangibles, net of accumulated amortization of $222.8 and $123.8 | | $ | 1,007.6 | | | $ | 1,108.9 | |
Backlog, net of accumulated amortization of $205.9 and $92.0 | | 1,224.7 | | | 1,342.1 | |
Customer relationships, net of accumulated amortization of $276.3 and $212.9 | | 986.2 | | | 1,029.9 | |
| Total | | $ | 3,218.5 | | | $ | 3,480.9 | |
The remaining weighted average useful lives of backlog, intellectual property, customer relationships, and other intangibles were 13 years, 12 years, 17 years, and 8 years, respectively. The backlog intangible primarily consists of in-place long-term service agreements acquired by the Company in conjunction with the acquisition of GE Transportation. Amortization expense for intangible assets was $282.4 million, $238.4 million, and $39.8 million for the years ended December 31, 2020, 2019, and 2018, respectively.
Estimated amortization expense for the five succeeding years is as follows (in millions):
| | | | | | | | |
| 2021 | | $ | 278.1 | |
| 2022 | | 277.6 | |
| 2023 | | 277.2 | |
| 2024 | | 267.6 | |
| 2025 | | 265.0 | |
8. CONTRACT ASSETS AND CONTRACT LIABILITIES
Contract assets include unbilled amounts resulting from sales under long-term contracts where revenue is recognized over time and revenue exceeds the amount that can be billed to the customer based on the terms of the contract. The current portion of the contract assets are classified as current assets under the caption “Unbilled accounts receivable” while the noncurrent contract assets are classified as other assets under the caption "Other noncurrent assets" on the consolidated balance sheet. Noncurrent contract assets were $101.0 million and $109.4 million at December 31, 2020 and 2019, respectively. Included in noncurrent contract assets are certain costs that are specifically related to a contract, however, do not directly contribute to the transfer of control of the tangible product being created, such as pre-production costs. The Company has elected to use the practical expedient and not consider unbilled amounts anticipated to be paid within one year as significant financing components.
Contract liabilities include customer deposits that are made prior to the incurrence of costs related to a newly agreed upon contract and advanced customer payments that are in excess of revenue recognized. The current portion of contract liabilities are classified as current liabilities under the caption “Customer deposits” while the noncurrent contract liabilities are classified as noncurrent liabilities under the caption "Other long-term liabilities" on the consolidated balance sheet. Noncurrent contract liabilities were $79.6 million and $77.0 million at December 31, 2020 and 2019, respectively. These contract liabilities are not considered a significant financing component because they are used to meet working capital demands that can be higher in the early stages of a contract and revenue associated with the contract liabilities is expected to be recognized within one year. Contract liabilities also include provisions for estimated losses from uncompleted contracts. Provisions for loss contracts were $108.9 million and $118.5 million at December 31, 2020 and 2019, respectively. These provisions for estimated
losses are classified as current liabilities and included within the caption “Other accrued liabilities” on the consolidated balance sheet.
The following table reconciles the changes in the Company’s contract assets and liabilities as follows:
| | | | | | | | | | | | | | |
| | Contract Assets |
| In millions | | 2020 | | 2019 |
| Balance at beginning of year | | $ | 623.4 | | | $ | 345.6 | |
| Acquisitions | | 4.1 | | | 237.5 | |
| Recognized in current year | | 849.7 | | | 619.3 | |
| Reclassified to accounts receivable | | (950.4) | | | (578.6) | |
| Foreign currency impact | | 17.4 | | | (0.4) | |
| Balance at end of year | | $ | 544.2 | | | $ | 623.4 | |
| | | | |
| | Contract Liabilities |
| In millions | | 2020 | | 2019 |
| Balance at beginning of year | | $ | 799.7 | | | $ | 444.8 | |
| Acquisitions | | 6.9 | | | 333.9 | |
| Recognized in current year | | 871.9 | | | 917.5 | |
| Amounts in beginning balance reclassified to revenue | | (532.4) | | | (410.6) | |
| Current year amounts reclassified to revenue | | (325.7) | | | (483.5) | |
| Foreign currency impact | | 10.8 | | | (2.4) | |
| Balance at end of year | | $ | 831.2 | | | $ | 799.7 | |
9. LONG-TERM DEBT
Long-term debt consisted of the following:
| | | | | | | | | | | | | | | | | | | | | | | | | | | | | |
| | | | December 31, |
| Effective | | 2020 | | 2019 |
| In millions | Interest Rate | | Book Value | | Fair Value 1 | | Book Value | | Fair Value 1 |
| Senior Credit and 364 Day Facility: | | | | | | | | | |
U.S. dollar-denominated Term Loans, net of unamortized debt issuance costs of $0.9 and $1.1 | 2.2 | % | | 645.1 | | | 645.1 | | | 684.7 | | | 684.7 | |
Multi-Currency Revolving loan facility net of unamortized debt issuance costs of $0.8 and $0.9 | — | % | | — | | | — | | | 231.5 | | | 231.5 | |
| Senior Notes: | | | | | | | | | |
Floating Senior Notes, due 2021, net of unamortized debt issuance costs of $0.0 and $2.0 | — | % | | — | | | — | | | 498.0 | | | 500.0 | |
4.375% Senior Notes, due 2023, net of unamortized discount and debt issuance costs of $0.7 and $0.9 | 4.5 | % | | 249.3 | | | 267.0 | | | 249.1 | | | 263.9 | |
4.15% Senior Notes, due 2024, net of unamortized debt issuance costs of $4.3 and $5.7 | 4.6 | % | | 745.7 | | | 817.3 | | | 744.3 | | | 805.5 | |
3.20% Senior Notes, due 2025, net of unamortized debt issuance costs of $4.4 and $0.0 | 3.4 | % | | 495.6 | | | 533.4 | | | — | | | — | |
3.45% Senior Notes, due 2026, net of unamortized debt issuance costs of $1.3 and $1.5 | 3.5 | % | | 748.7 | | | 819.5 | | | 748.5 | | | 759.1 | |
4.70% Senior Notes, due 2028, net of unamortized discount and debt issuance costs of $8.2 and $9.3 | 5.0 | % | | 1,241.8 | | | 1,472.2 | | | 1,240.8 | | | 1,378.3 | |
| Other Borrowings | | | 113.2 | | | 113.1 | | | 32.4 | | | 32.4 | |
| Total | | | 4,239.4 | | | 4,667.6 | | | 4,429.3 | | | 4,655.4 | |
| Less - current portion | | | 447.2 | | | 447.2 | | | 95.7 | | | 95.7 | |
| Long-term portion | | | 3,792.2 | | | 4,220.4 | | | 4,333.6 | | | 4,559.7 | |
1 See Note 18 for information on the fair value measurement of the Company's long-term debt.
| | | | | |
| As of December 31, 2020, the annual repayment requirements for debt obligations are as follows: |
| In millions | |
| 2021 | $ | 447.2 | |
| 2022 | 311.1 | |
| 2023 | 249.3 | |
| 2024 | 745.7 | |
| 2025 | 495.6 | |
| Thereafter | 1,990.5 | |
| Total | $ | 4,239.4 | |
For those debt securities that have a premium or discount at the time of issuance, the Company amortizes the amount through interest expense based on the maturity date or the first date the holders may require the Company to repurchase the debt securities, if applicable. A premium would result in a decrease in interest expense, and a discount would result in an increase in interest expense in future periods. Additionally, the Company has debt issuance costs related to certain financing transactions which are also amortized through interest expense. As of December 31, 2020 and 2019, the Company had total unamortized debt issuance costs of $20.5 million and $21.3 million, respectively. At December 31, 2020, the weighted average interest rate on the Company's variable debt was 2.3%
Credit Facilities
Senior Credit Facility
On June 8, 2018, the Company entered into a credit agreement ("Senior Credit Facility"), which replaced the Company's then-existing credit agreement. The Senior Credit Facility is with a syndicate of lenders and provides for borrowings consisting of (i) term loans denominated in euros and U.S. dollars ("Term Loans"); and (ii) a multi-currency revolving loan facility, providing for an equivalent in U.S. dollars of up to $1,200.0 million in multi-currency revolving loans (inclusive of swingline loans of up to $75.0 million and letters of credit of up to $450.0 million (the "Revolving Credit Facility")). The Revolving Credit Facility will mature on June 8, 2023.
Under the Senior Credit Facility, we can elect to receive advances bearing interest based on either the ABR rate or the LIBOR rate (each as defined in the Senior Credit Facility) plus applicable margin that is determined based on our credit ratings
or the Company's Leverage. The agreement contains affirmative, negative and financial covenants, and events of default customary for facilities of this type. The obligations under the Senior Credit Facility are guaranteed by Wabtec and certain of Wabtec's U.S. subsidiaries, as guarantors.
The company has agreed that, so long as any lender has any commitment under the Senior Credit Facility, any letter of credit is outstanding under the Senior Credit Facility, or any loan or other obligation is outstanding under the Senior Credit Facility, it will maintain the following as of the end of each fiscal quarter or the period of four quarters the ended:
| | | | | | | | |
Interest Coverage Ratio 1 | | 3.0x |
Leverage Ratio 2 | | 3.25x |
1. The interest coverage ratio is defined as EBITDA, as defined in the Credit Agreement and Term Loan Agreement, to net interest expense for the four quarters then ended.
2. The leverage ratio is defined as net debt as of the last day of such fiscal quarter to EBITDA, as defined in the Amendment Credit Agreement and Term Loan Agreement, for the four quarters then ended.
The company was in compliance with all covenants in the Senior Credit Facility as of December 31, 2020.
364-Day Facility
On April 10, 2020 the Company entered into a new $600 million 364 day credit facility ("364 Day Facility") maturing April 2021 with a group of banks which includes a $144.0 million revolving credit facility ("364 Day Revolver") and a $456.0 million term loan ("364 Term Loan"). The agreement calls for interest at either a LIBOR-based rate, or a rate based on the prime lending rate of the agent bank, at the Company's option. The agreement contains affirmative, negative and financial covenants, and events of default customary for facilities of this type and substantially similar to our existing Senior Credit Facility. The obligations under the 364 Day Facility are guaranteed by certain of the Company's U.S. subsidiaries, as guarantors. On June 12, 2020 the Company amended the 364 Day Facility maturity to July 9, 2021. The Company was in compliance with all covenants in the 364 Senior Credit Facility as of December 31, 2020.
The following table presents availability under the Revolving Facilities:
| | | | | | | | | | | | | | |
| (in millions) | | Revolving Credit Facility | | 364 Day Revolver |
| Maximum Availability | | $ | 1,200.0 | | | $ | 144.0 | |
| Letters of Credit Under Credit Agreement | | $ | 19.1 | | | — | |
| Current Availability | | $ | 1,180.9 | | | $ | 144.0 | |
Senior Notes
The "Senior Notes" comprises our 4.375% Senior Notes due 2023, 4.15% Senior Notes due 2024, 3.20% Senior Notes due 2025, 3.45% Senior Notes due 2026 and 4.70% Senior Notes due 2028. Interest on the fixed-rate Senior Notes is payable semi-annually. The Company may redeem each series of the notes at any time in whole or from time to time in part in accordance with the provisions of the indenture, under which such series of notes was issued. Each of the Senior Notes may be redeemed at a redemption price of 100% of the principal amount plus a specified make-whole premium and accrued interest. The Senior Notes are senior unsecured obligations of the Company and rank pari passu with all existing and future senior debt and senior to all existing and future subordinated indebtedness of the Company.
On June 29, 2020 the Company issued $500.0 million of 3.20% Senior Notes due in 2025 (the "2025 Notes"). The 2025 Notes were issued at 99.892% of face value. Interest on the 2025 Notes accrues at a rate of 3.20% per annum and is payable semi-annually on June 15 and December 15 of each year beginning December 15, 2020. The proceeds were used to redeem the Floating Rate Senior Notes due 2021. The Company incurred $1.5 million of deferred financing costs related to the issuance of the 2025 Notes.
The indentures under which the Senior Notes were issued contain covenants and restrictions which limit, subject to certain exceptions, certain sale and leaseback transactions with respect to principal properties, the incurrence of secured debt without equally and ratably securing the Senior Notes, and certain merger and consolidation transactions. The covenants do not require the Company to maintain any financial ratios or specified levels of net worth or liquidity.
The Company is in compliance with the restrictions and covenants in the indentures under which the Senior Notes were issued and expects that these restrictions and covenants will not be any type of limiting factor in executing our operating activities.
Cash Pooling
Wabtec aggregates the Company's domestic cash position on a daily basis. Outside the United States, the Company uses cash pooling arrangements with banks to help manage our liquidity requirements. In these pooling arrangements, Wabtec subsidiary “Participants” agree with a single bank that the cash balances of any of the pool Participants with the bank will be subject to a full right of set-off against amounts other Participants owe the bank, and the bank provides for overdrafts as long as the net balance for all Participants does not exceed an agreed-upon level. Typically, each Participant pays interest on outstanding overdrafts and receives interest on cash balances. The Company's Consolidated Balance Sheets reflect cash, net of bank overdrafts, under all pooling arrangements.
Letters of Credit
In the ordinary course of its business, the Company issues letters of credit related to commercial products. The outstanding amount, including the letters of credit issues under the credit facility, were $736.6 million and $714.0 million at December 31, 2020 and 2019, respectively.
10. EMPLOYEE BENEFIT PLANS
Defined Benefit Pension Plans
The Company sponsors defined benefit pension plans that cover certain U.S., Canadian, German, and United Kingdom employees and which provide benefits of stated amounts for each year of service of the employee. The Company uses a December 31 measurement date for the plans.
The following tables provide information regarding the Company’s significant defined benefit pension plans summarized by U.S. and international components.
Obligations and Funded Status
| | | | | | | | | | | | | | | | | | | | | | | | | | |
| | | U.S. | | International |
| In millions | | 2020 | | 2019 | | 2020 | | 2019 |
| Change in projected benefit obligation | | | | | | | | |
| Obligation at beginning of year | | $ | (41.1) | | | $ | (39.4) | | | $ | (347.3) | | | $ | (309.2) | |
| Service cost | | (0.3) | | | (0.3) | | | (3.4) | | | (2.7) | |
| Interest cost | | (1.1) | | | (1.5) | | | (5.4) | | | (7.0) | |
| Employee contributions | | — | | | — | | | (0.5) | | | (0.5) | |
| Plan settlements and amendments | | — | | | — | | | (2.0) | | | 4.4 | |
| Benefits paid | | 3.3 | | | 3.0 | | | 14.1 | | | 13.1 | |
| Acquisition | | — | | | — | | | — | | | (5.0) | |
| Actuarial loss | | (3.7) | | | (2.9) | | | (22.4) | | | (32.4) | |
| Effect of currency rate changes | | — | | | — | | | (17.9) | | | (8.0) | |
| Obligation at end of year | | $ | (42.9) | | | $ | (41.1) | | | $ | (384.8) | | | $ | (347.3) | |
| Change in plan assets | | | | | | | | |
| Fair value of plan assets at beginning of year | | $ | 34.3 | | | $ | 31.9 | | | $ | 269.8 | | | $ | 239.4 | |
| Actual return on plan assets | | 3.7 | | | 5.3 | | | 25.1 | | | 23.9 | |
| Employer contributions | | 1.3 | | | — | | | 10.0 | | | 9.4 | |
| Employee contributions | | — | | | — | | | 0.5 | | | 0.5 | |
| Benefits paid | | (3.3) | | | (2.9) | | | (14.0) | | | (13.1) | |
| Settlements | | — | | | — | | | (2.9) | | | (0.4) | |
| Acquisition | | — | | | — | | | — | | | 1.2 | |
| Other | | — | | | — | | | 4.8 | | | — | |
| Effect of currency rate changes | | — | | | — | | | 11.4 | | | 8.9 | |
| Fair value of plan assets at end of year | | $ | 36.0 | | | $ | 34.3 | | | $ | 304.7 | | | $ | 269.8 | |
| Funded status | | | | | | | | |
| Fair value of plan assets | | $ | 36.0 | | | $ | 34.3 | | | $ | 304.7 | | | $ | 269.8 | |
| Benefit obligations | | (42.9) | | | (41.1) | | | (384.8) | | | (347.3) | |
| Funded status | | $ | (6.9) | | | $ | (6.8) | | | $ | (80.1) | | | $ | (77.5) | |
| Amounts recognized in the statement of financial position consist of: | | | | | | | | |
| Noncurrent assets | | $ | — | | | $ | — | | | $ | 13.6 | | | $ | 11.8 | |
| Current liabilities | | — | | | — | | | (2.5) | | | (2.4) | |
| Noncurrent liabilities | | (6.9) | | | (6.9) | | | (91.2) | | | (86.9) | |
| Net amount recognized | | $ | (6.9) | | | $ | (6.9) | | | $ | (80.1) | | | $ | (77.5) | |
| Amounts recognized in accumulated other comprehensive income (loss) before tax consist of: | | | | | | | | |
| Prior service cost | | — | | | — | | | (1.5) | | | (1.4) | |
| Net actuarial loss | | (19.4) | | | (18.8) | | | (89.6) | | | (78.3) | |
| Net amount recognized | | $ | (19.4) | | | $ | (18.8) | | | $ | (91.1) | | | $ | (79.7) | |
The aggregate accumulated benefit obligation for the U.S. pension plans was $41.8 million and $40.2 million as of December 31, 2020 and 2019, respectively. The aggregate accumulated benefit obligation for the international pension plans was $371.8 million and $336.0 million as of December 31, 2020 and 2019, respectively.
| | | | | | | | | | | | | | | | | | | | | | | | | | |
| | | U.S. | | International |
| In millions | | 2020 | | 2019 | | 2020 | | 2019 |
| Information for pension plans with accumulated benefit obligations in excess of Plan assets: | | | | | | | | |
| Projected benefit obligation | | $ | (42.9) | | | $ | (41.1) | | | $ | (316.0) | | | $ | (283.1) | |
| Accumulated benefit obligation | | (41.8) | | | (40.2) | | | (303.9) | | | (272.6) | |
| Fair value of plan assets | | 36.0 | | | 34.3 | | | 222.4 | | | 193.9 | |
| Information for pension plans with projected benefit obligations in excess of plan assets: | | | | | | | | |
| Projected benefit obligation | | $ | (42.9) | | | $ | (41.1) | | | $ | (317.4) | | | $ | (284.4) | |
| Fair value of plan assets | | 36.0 | | | 34.3 | | | 223.7 | | | 195.1 | |
Components of Net Periodic Benefit Costs
| | | | | | | | | | | | | | | | | | | | | | | | | | | | | | | | | | | | | | |
| | | U.S. | | International |
| In millions | | 2020 | | 2019 | | 2018 | | 2020 | | 2019 | | 2018 |
| Service cost | | $ | 0.3 | | | $ | 0.3 | | | $ | 0.3 | | | $ | 3.4 | | | $ | 2.7 | | | $ | 2.6 | |
| Interest cost | | 1.1 | | | 1.5 | | | 1.3 | | | 5.4 | | | 7.0 | | | 7.0 | |
| Expected return on plan assets | | (1.7) | | | (1.7) | | | (1.8) | | | (11.5) | | | (11.8) | | | (13.5) | |
| Amortization of initial net obligation and prior service cost | | — | | | — | | | — | | | 0.1 | | | 0.1 | | | — | |
| Amortization of net loss | | 1.0 | | | 0.8 | | | 1.0 | | | 3.2 | | | 2.5 | | | 2.1 | |
| Settlement and curtailment losses recognized | | — | | | — | | | — | | | 0.1 | | | — | | | 3.1 | |
| Net periodic benefit cost | | $ | 0.7 | | | $ | 0.9 | | | $ | 0.8 | | | $ | 0.7 | | | $ | 0.5 | | | $ | 1.3 | |
Other Changes in Plan Assets and Benefit Obligations Recognized in Other Comprehensive Income during 2020 are as follows:
| | | | | | | | | | | | | | |
| In millions | | U.S. | | International |
| Net loss arising during the year | | $ | (1.6) | | | $ | (10.7) | |
| Effect of exchange rates | | — | | | (4.0) | |
| Amortization or curtailment recognition of prior service cost | | — | | | 0.1 | |
| Amortization or settlement recognition of net loss | | 1.0 | | | 3.2 | |
| Total recognized in other comprehensive income | | $ | (0.6) | | | $ | (11.4) | |
| Total recognized in net periodic benefit cost and other comprehensive income | | $ | 1.3 | | | $ | 12.1 | |
The weighted average assumptions in the following table represent the rates used to develop the actuarial present value of the projected benefit obligation for the year listed.
| | | | | | | | | | | | | | | | | | | | | | | | | | | | | | | | | | | | | | |
| | | U.S. | | International |
| | | 2020 | | 2019 | | 2018 | | 2020 | | 2019 | | 2018 |
| Discount rate | | 2.47 | % | | 3.27 | % | | 4.30 | % | | 1.39 | % | | 1.84 | % | | 2.53 | % |
| Expected return on plan assets | | 5.35 | % | | 5.35 | % | | 5.15 | % | | 4.43 | % | | 5.01 | % | | 5.10 | % |
| Rate of compensation increase | | 3.00 | % | | 3.00 | % | | 3.00 | % | | 2.65 | % | | 2.64 | % | | 2.61 | % |
The discount rate is based on settling the pension obligation with high grade, high yield corporate bonds, and the rate of compensation increase is based on actual experience. The expected return on plan assets is based on historical performance as well as expected future rates of return on plan assets considering the current investment portfolio mix and the long-term investment strategy.
As of December 31, 2020, the following table represents the amounts included in other comprehensive loss that are expected to be recognized as components of periodic benefit costs in 2021.
| | | | | | | | | | | | | | |
| In millions | | U.S. | | International |
| Prior service cost | | — | | | 0.1 | |
| Net actuarial loss | | 1.1 | | | 3.5 | |
| | | $ | 1.1 | | | $ | 3.6 | |
Pension Plan Assets
The Company has established formal investment policies for the assets associated with our pension plans. Objectives include maximizing long-term return at acceptable risk levels and diversifying among asset classes. Asset allocation targets are based on periodic asset liability study results which help determine the appropriate investment strategies. The investment policies permit variances from the targets within certain parameters. The plan assets consist primarily of equity security funds, debt security funds, and temporary cash and cash equivalent investments. The assets held in these funds are generally actively managed and are valued at the net asset value per share multiplied by the number of shares held as of the measurement date. (See Note 18 “Fair Value Measurement” included herein). Plan assets by asset category at December 31, 2020 and 2019 are as follows:
| | | | | | | | | | | | | | | | | | | | | | | | | | |
| | | U.S. | | International |
| In millions | | 2020 | | 2019 | | 2020 | | 2019 |
| Pension Plan Assets | | | | | | | | |
| Equity security funds | | $ | 18.6 | | | $ | 16.4 | | | $ | 74.3 | | | $ | 70.8 | |
| Debt security funds and other | | 15.8 | | | 16.3 | | | 213.8 | | | 191.3 | |
| Cash and cash equivalents | | 1.6 | | | 1.6 | | | 16.6 | | | 7.7 | |
| Fair value of plan assets | | $ | 36.0 | | | $ | 34.3 | | | $ | 304.7 | | | $ | 269.8 | |
The U.S. plan has a target asset allocation of 55% equity securities and 45% debt securities. The International plan has a target asset allocation of 10% equity securities, 22% debt securities and 68% in other investments. Investment policies are determined by the respective Plan’s Pension Committee and set forth in its Investment Policy. Rebalancing of the asset allocation occurs on a quarterly basis.
The following tables summarize our pension plan assets measured at fair value on a recurring basis by fair value hierarchy level (See Note 18):
| | | | | | | | | | | | | | | | | | | | | | | | | | | | | | | | |
| | December 31, 2020 |
| In millions | | NAV | | Level 1 | | Level 2 | | Level 3 | | Total |
| US: | | | | | | | | | | |
| Equity | | $ | — | | | $ | 18.6 | | | $ | — | | | $ | — | | | $ | 18.6 | |
| Debt Securities and other | | — | | | 6.2 | | | 9.6 | | | — | | | 15.8 | |
| Cash and cash equivalents | | — | | | 1.5 | | | — | | | — | | | 1.5 | |
| International: | | | | | | | | | | |
| Equity | | $ | 6.1 | | | $ | 22.1 | | | $ | 46.9 | | | $ | — | | | $ | 75.0 | |
| Debt Securities and other | | — | | | 3.2 | | | 194.9 | | | — | | | 198.1 | |
| Insurance Contracts | | — | | | — | | | 4.8 | | | 10.0 | | | 14.8 | |
| Cash and cash equivalents | | — | | | 9.0 | | | 7.8 | | | — | | | 16.8 | |
| Total | | $ | 6.1 | | | $ | 60.7 | | | $ | 264.0 | | | $ | 10.0 | | | $ | 340.7 | |
| | | | | | | | | | | | | | | | | | | | | | | | | | | | | | | | |
| | December 31, 2019 |
| In millions | | NAV | | Level 1 | | Level 2 | | Level 3 | | Total |
| US: | | | | | | | | | | |
| Equity | | $ | — | | | $ | 16.4 | | | $ | — | | | $ | — | | | $ | 16.4 | |
| Debt Securities | | — | | | 3.5 | | | 12.8 | | | — | | | 16.3 | |
| Cash and cash equivalents | | — | | | 1.5 | | | — | | | — | | | 1.5 | |
| International: | | | | | | | | | | |
| Equity | | $ | 4.9 | | | $ | 19.9 | | | $ | 46.0 | | | $ | — | | | $ | 70.8 | |
| Debt Securities | | — | | | 3.1 | | | 179.2 | | | — | | | 182.4 | |
| Insurance Contracts | | — | | | — | | | 4.3 | | | 4.6 | | | 8.9 | |
| Cash and cash equivalents | | — | | | 7.0 | | | 0.7 | | | — | | | 7.8 | |
| Total | | $ | 4.9 | | | $ | 51.5 | | | $ | 243.1 | | | $ | 4.6 | | | $ | 304.1 | |
The following table presents a reconciliation of Level 3 assets:
| | | | | | | | |
| In millions | | Total |
| Balance at December 31, 2018 | | $ | 9.9 | |
| Net purchases, issuances, and settlements | | 0.2 | |
| Actual return of plan assets | | 0.3 | |
| Transfers | | (5.8) | |
| Effect of currency rate changes | | — | |
| Balance at December 31, 2019 | | $ | 4.6 | |
| Net purchases, issuances, and settlements | | — | |
| Actual return of plan assets | | 1.9 | |
| Transfers | | 5.1 | |
| Effect of currency rate changes | | 0.4 | |
| Balance at December 31, 2020 | | $ | 12.0 | |
Cash Flows
The Company’s funding methods are based on governmental requirements and differ from those methods used to recognize pension expense. The Company expects to contribute $7.3 million to the international plan and does not expect to make a contribution to the U.S. plan during 2021.
Benefit payments expected to be paid to plan participants are as follows:
| | | | | | | | | | | | | | |
| In millions | | U.S. | | International |
| Year ended December 31, | | | | |
| 2021 | | $ | 3.0 | | | $ | 13.7 | |
| 2022 | | 3.1 | | | 14.2 | |
| 2023 | | 3.0 | | | 14.8 | |
| 2024 | | 2.9 | | | 15.4 | |
| 2025 | | 2.9 | | | 15.5 | |
| 2026 through 2030 | | 12.6 | | | 84.6 | |
Defined Contribution Plans
The Company also participates in certain defined contribution plans and multiemployer pension plans. Costs recognized under these plans are summarized as follows:
| | | | | | | | | | | | | | | | | | | | |
| | For the year ended
December 31, |
| In millions | | 2020 | | 2019 | | 2018 |
| Multi-employer pension and health & welfare plans | | $ | 0.2 | | | $ | 0.9 | | | $ | 1.0 | |
| 401(k) savings and other defined contribution plans | | 54.6 | | | 55.7 | | | 27.9 | |
| Total | | $ | 54.8 | | | $ | 56.6 | | | $ | 28.9 | |
The 401(k) savings plan is a participant directed defined contribution plan that holds shares of the Company’s stock as one of the investment options. At December 31, 2020 and 2019, the plan held on behalf of its participants about 409,104 shares with a market value of $29.9 million, and 431,744 shares with a market value of $33.6 million, respectively. Additionally, the Company has stock option based benefit and other plans further described in Note 13.
11. INCOME TAXES
The Company is responsible for filing consolidated U.S., foreign and combined, unitary or separate state income tax returns. The Company is responsible for paying the taxes relating to such returns, including any subsequent adjustments resulting from the redetermination of such tax liabilities by the applicable taxing authorities.
The components of the income before income taxes for the Company’s domestic and foreign operations for the years ended December 31 are provided below:
| | | | | | | | | | | | | | | | | | | | |
| | For the year ended
December 31, |
| In millions | | 2020 | | 2019 | | 2018 |
| Domestic | | $ | 78.0 | | | $ | 117.9 | | | $ | 145.1 | |
| Foreign | | 479.2 | | | 328.9 | | | 222.5 | |
| Income before income taxes | | $ | 557.2 | | | $ | 446.8 | | | $ | 367.6 | |
The consolidated provision for income taxes included in the Consolidated Statement of Income consisted of the following:
| | | | | | | | | | | | | | | | | | | | |
| | For the year ended
December 31, |
| In millions | | 2020 | | 2019 | | 2018 |
| Current taxes | | | | | | |
| Federal | | $ | 6.1 | | | $ | 5.7 | | | $ | 6.9 | |
| State | | 17.0 | | | 0.5 | | | 5.8 | |
| Foreign | | 92.4 | | | 141.4 | | | 68.5 | |
| | | 115.5 | | | 147.6 | | | 81.2 | |
| Deferred taxes | | | | | | |
| Federal | | 36.1 | | | 19.8 | | | 4.7 | |
| State | | (1.4) | | | 2.9 | | | 1.3 | |
| Foreign | | (5.3) | | | (50.0) | | | (11.3) | |
| | | 29.4 | | | (27.3) | | | (5.3) | |
| Total provision | | $ | 144.9 | | | $ | 120.3 | | | $ | 75.9 | |
A reconciliation of the United States federal statutory income tax rate to the effective income tax rate on operations for the years ended December 31 is provided below:
| | | | | | | | | | | | | | | | | | | | |
| | For the year ended
December 31, |
| In millions | | 2020 | | 2019 | | 2018 |
| U.S. federal statutory rate | | 21.0 | % | | 21.0 | % | | 21.0 | % |
| State taxes | | 2.6 | | | 0.7 | | | 1.6 | |
| Foreign | | 2.4 | | | 3.2 | | | 0.7 | |
| Research and development credit | | (1.3) | | | (1.7) | | | (1.1) | |
| U.S. tax rate change | | — | | | — | | | (0.6) | |
| U.S. tax reform provision (benefit) | | 1.3 | | | 2.0 | | | (1.4) | |
| Transaction costs related to acquisitions | | — | | | 1.0 | | | — | |
| Other, net | | — | | | 0.7 | | | 0.4 | |
| Effective rate | | 26.0 | % | | 26.9 | % | | 20.6 | % |
The decrease in the effective tax rate in 2020 is primarily the result of non-deductible transaction related expenses incurred during 2019 as a result of the GE Transportation acquisition that did not recur in 2020, a decrease in the estimated liabilities resulting from provisions of the Tax Cuts and Jobs Act that were recognized in 2019 and a decrease in foreign tax expense primarily due to favorable changes in the mix of foreign earnings, partially offset by an increase in state income tax expense recognized in 2020.
Components of deferred tax assets and liabilities were as follows:
| | | | | | | | | | | | | | |
| | | December 31, |
| In millions | | 2020 | | 2019 |
| Deferred income tax assets: | | | | |
| Accrued expenses and reserves | | $ | 38.5 | | | $ | 35.8 | |
| Warranty reserve | | 51.2 | | | 46.6 | |
| Deferred compensation/employee benefits | | 42.6 | | | 32.3 | |
| Right-of-use asset | | 70.0 | | | 63.1 | |
| Pension and postretirement obligations | | 26.4 | | | 28.1 | |
| Property, plant & equipment | | 47.8 | | | — | |
| Inventory | | 45.0 | | | 25.8 | |
| Net operating loss carry forwards | | 82.6 | | | 95.6 | |
| Other | | 46.6 | | | 18.8 | |
| Gross deferred income tax assets | | 450.7 | | | 346.1 | |
| Valuation allowance | | 41.7 | | | 58.0 | |
| Total deferred income tax assets | | 409.0 | | | 288.1 | |
| Deferred income tax liabilities: | | | | |
| Property, plant & equipment | | — | | | 42.7 | |
| Right-of-use liability | | 69.3 | | | 63.1 | |
| Intangibles | | 443.5 | | | 235.6 | |
| Total deferred income tax liabilities | | 512.8 | | | 341.4 | |
| Net deferred income tax liability | | $ | (103.8) | | | $ | (53.3) | |
A valuation allowance is provided when it is more likely than not that some portion or all of the deferred tax assets will not be realized. As of December 31, 2020, the valuation allowance for certain foreign deferred tax asset carryforwards was $41.7 million primarily in Brazil, China, Denmark, France, the Netherlands and South Africa.
Net operating loss carry-forwards in the amount of $312.6 million expire in various periods from December 31, 2021 to December 31, 2040.
As of December 31, 2020, the liability for income taxes associated with unrecognized tax benefits was $16.4 million, of which $14.8 million, if recognized, would favorably affect the Company’s effective income tax rate. As of December 31, 2019, the liability for income taxes associated with unrecognized tax benefits was $17.2 million, all of which, if recognized, would favorably affect the Company’s effective tax rate. A reconciliation of the beginning and ending amount of the liability for income taxes associated with unrecognized tax benefits follows:
| | | | | | | | | | | | | | | | | | | | |
| In millions | | 2020 | | 2019 | | 2018 |
| Gross liability for unrecognized tax benefits at beginning of year | | $ | 17.2 | | | $ | 9.5 | | | $ | 6.9 | |
| Gross increases - unrecognized tax benefits in prior periods | | 3.8 | | | 9.7 | | | 5.4 | |
| Gross decreases - audit settlement during year | | (4.6) | | | — | | | — | |
| Gross decreases - expiration of audit statute of limitations | | — | | | (2.0) | | | (2.8) | |
| Gross liability for unrecognized tax benefits at end of year | | $ | 16.4 | | | $ | 17.2 | | | $ | 9.5 | |
The Company includes interest and penalties related to unrecognized tax benefits in income tax expense. As of December 31, 2020, the total interest and penalties accrued was approximately $4.5 million. As of December 31, 2019, the total interest and penalties accrued was approximately $4.0 million.
With limited exception, the Company is no longer subject to examination by various U.S. and foreign taxing authorities for years before 2015. At this time, the Company believes that it is reasonably possible that unrecognized tax benefits of approximately $6.2 million may change within the next 12 months due to the expiration of statutory review periods and current examinations.
12. EARNINGS PER SHARE
The computation of earnings per share from operations is as follows:
| | | | | | | | | | | | | | | | | | | | |
| | For the Year Ended
December 31, |
| In millions, except per share data | | 2020 | | 2019 | | 2018 |
| Numerator | | | | | | |
| Numerator for basic and diluted earnings per common share - net income attributable to Wabtec shareholders | | $ | 414.4 | | | $ | 326.7 | | | $ | 294.9 | |
| Less: dividends declared - common shares and non-vested restricted stock | | (92.5) | | | (80.3) | | | (46.3) | |
| Undistributed earnings | | 321.9 | | | 246.4 | | | 248.6 | |
| Percentage allocated to common shareholders (1) | | 99.7 | % | | 99.7 | % | | 99.7 | % |
| | 320.9 | | | 245.7 | | | 247.9 | |
| Add: dividends declared - common shares | | 92.3 | | | 80.0 | | | 46.3 | |
| Less: dividends declared - preferred shares | | — | | | (0.4) | | | — | |
| Numerator for basic earnings per common share | | $ | 413.2 | | | $ | 325.3 | | | $ | 294.2 | |
| Add: dividends declared - preferred shares | | — | | | 0.4 | | | — | |
| Numerator for diluted earnings per common share | | $ | 413.2 | | | $ | 325.3 | | | $ | 294.2 | |
| Denominator | | | | | | |
| Denominator for basic earnings per common share - weighted average shares | | 189.9 | | | 170.5 | | | 96.0 | |
| Effect of dilutive securities: | | | | | | |
| Assumed conversion of preferred shares | | — | | | 6.4 | | | — | |
| Assumed conversion of dilutive stock-based compensation plans | | 0.5 | | | 0.4 | | | 0.5 | |
| Denominator for diluted earnings per common share - adjusted weighted average shares and assumed conversion | | 190.4 | | | 177.3 | | | 96.5 | |
| Net income per common share attributable to Wabtec shareholders | | | | | | |
| Basic | | $ | 2.18 | | | $ | 1.91 | | | $ | 3.06 | |
| Diluted | | $ | 2.17 | | | $ | 1.84 | | | $ | 3.05 | |
| | | | | | |
| (1) Basic weighted-average common shares outstanding | | 189.9 | | | 170.5 | | | 96.0 | |
| Basic weighted-average common shares outstanding and non-vested restricted stock expected to vest | | 190.4 | | | 171.0 | | | 96.3 | |
| Percentage allocated to common shareholders | | 99.7 | % | | 99.7 | % | | 99.7 | % |
Options to purchase approximately 403,000, 312,000, and 135,000 shares of Common Stock were outstanding in 2020, 2019 and 2018, respectively, but were not included in the computation of diluted earnings because their exercise price exceeded the average market price of the Company's common stock.
13. STOCK-BASED COMPENSATION PLANS
As of December 31, 2020, the Company maintains employee stock-based compensation plans for stock options, restricted stock, and incentive stock units as governed by the 2011 Stock Incentive Compensation Plan, as amended and restated (the “2011 Plan”) and the 2000 Stock Incentive Plan, as amended (the “2000 Plan”). The 2011 Plan has a term through May 10, 2027 and as of December 31, 2020 the number of shares available for future grants under the 2011 Plan was 1,870,396 shares, which includes remaining shares to grant under the 2000 Plan. The Company also maintains a 1995 Non-Employee Directors’ Fee and Stock Option Plan as amended and restated (“the Directors Plan”). The Directors Plan, as amended, authorizes a total of 1,000,000 shares of Common Stock to be issued. Under the Directors Plan options issued become exercisable over a three-year vesting period and expire ten years from the date of grant and restricted stock issued under the plan vests one year from the date of grant. As compensation for directors’ fees for the years ended December 31, 2020, 2019 and 2018, the Company issued a total of 23,152, 15,729 and 12,960 shares, respectively, of restricted stock to non-employee directors. The total number of shares issued under the Directors Plan as of December 31, 2020 was 933,033 shares.
Stock-based compensation expense for all of the plans was $19.5 million, $50.0 million and $25.3 million for the years ended December 31, 2020, 2019 and 2018, respectively. The Company recognized associated tax benefits related to the stock-based compensation plans of $1.8 million, $1.4 million and $6.3 million for the respective periods. Included in the stock-based compensation expense for 2020 above is $2.4 million of expense related to stock options, $17.2 million related to non-vested
restricted stock, $4.7 million related to restricted stock units, $1.2 million related to units issued for Directors’ fees and $6.0 million of expense reversal related to incentive stock units. At December 31, 2020, unamortized compensation expense related to those stock options, non-vested restricted shares and incentive stock units expected to vest totaled $31.9 million and will be recognized over a weighted period of 1.4 years.
Stock Options Stock options are granted to eligible employees and directors at the fair market value, which is the average of the high and low Wabtec stock price on the date of grant. Under the 2011 Plan and the 2000 Plan, options become exercisable over a three year vesting period and expire 10 years from the date of grant.
The following table summarizes the Company’s stock option activity and related information for the 2011 Plan, the 2000 Plan and Directors Plan for the years ended December 31:
| | | | | | | | | | | | | | | | | | | | | | | | | | |
| | Options | | Weighted
Average
Exercise
Price | | Weighted Average
Remaining
Contractual Life | | Aggregate
Intrinsic value
(in millions) |
| Outstanding at December 31, 2017 | | 983,512 | | | $ | 32.52 | | | 4.0 | | $ | 40.1 | |
| Granted | | 82,580 | | | 77.54 | | | | | — | |
| Exercised | | (582,303) | | | 28.29 | | | | | (24.4) | |
| Canceled | | (17,112) | | | 69.76 | | | | | — | |
| Outstanding at December 31, 2018 | | 466,677 | | | $ | 61.04 | | | 5.7 | | $ | 4.3 | |
| Granted | | 134,450 | | | 70.44 | | | | | 1.0 | |
| Exercised | | (4,868) | | | 22.45 | | | | | (0.3) | |
| Canceled | | (8,235) | | | 73.00 | | | | | — | |
| Outstanding at December 31, 2019 | | 588,024 | | | $ | 63.36 | | | 5.7 | | $ | 8.5 | |
| Granted | | 136,506 | | | 77.75 | | | | | — | |
| Exercised | | (86,145) | | | 35.47 | | | | | — | |
| Canceled | | (85,716) | | | 73.73 | | | | | — | |
| Outstanding at December 31, 2020 | | 552,669 | | | $ | 69.82 | | | 6.1 | | $ | 4.2 | |
| Exercisable at December 31, 2020 | | 336,114 | | | $ | 58.52 | | | 5.0 | | $ | 3.9 | |
Options outstanding at December 31, 2020 were as follows:
| | | | | | | | | | | | | | | | | | | | | | | | | | | | | | | | |
| | Number of
Options | | Weighted
Average
Exercise
Price of
Options | | Weighted
Average
Remaining
Contractual | | Number of
Options
Currently | | Weighted Average
Exercise Price of
Options Currently |
| Range of exercise prices | | Outstanding | | Outstanding | | Life | | Exercisable | | Exercisable |
Under $35.00 | | 8,876 | | | $ | 28.70 | | | 0.1 | | 8,876 | | | $ | 28.70 | |
35.00 - 50.00 | | 88,854 | | | 41.24 | | | 1.6 | | 88,854 | | | 41.24 | |
50.00 - 65.00 | | 50,934 | | | 59.56 | | | 5.5 | | 45,985 | | | 61.33 | |
65.00 - 80.00 | | 300,155 | | | 74.16 | | | 7.8 | | 98,159 | | | 46.63 | |
Over 80.00 | | 103,850 | | | 90.26 | | | 5.5 | | 94,240 | | | 88.63 | |
| | | 552,669 | | | $ | 69.82 | | | | | 336,114 | | | $ | 58.52 | |
The fair value of each option grant is estimated on the date of grant using the Black-Scholes option-pricing model with the following weighted-average assumptions:
| | | | | | | | | | | | | | | | | | | | |
| | For the year ended
December 31, |
| | | 2020 | | 2019 | | 2018 |
| Dividend yield | | 0.60 | % | | 0.66 | % | | 0.31 | % |
| Risk-free interest rate | | 1.5 | % | | 2.6 | % | | 2.8 | % |
| Stock price volatility | | 28.1 | % | | 25.8 | % | | 23.9 | % |
| Expected life (years) | | 5.0 | | 5.0 | | 5.0 |
| Weighted average fair value of options granted during the year | | $ | 21.05 | | | $ | 19.54 | | | $ | 20.59 | |
The dividend yield is based on the Company’s dividend rate and the current market price of the underlying common stock at the date of grant. Expected life in years is determined from historical stock option exercise data. Expected volatility is based on the historical volatility of the Company’s stock. The risk-free interest rate is based on the 7 years U.S. Treasury bond rates for the expected life of the option.
Restricted Stock and Incentive Stock Beginning in 2006 the Company adopted a restricted stock program. As provided for under the 2011 and 2000 Plans, eligible employees are granted restricted stock that generally vests over three years from the date of grant. Under the Directors Plan, restricted stock units vest one year from the date of grant.
In addition, the Company has issued incentive stock units to eligible employees that vest upon attainment of certain cumulative three-year performance goals. Based on the Company’s performance for each three year period then ended, the incentive stock units can vest and be awarded ranging from 0% to 200% of the initial incentive stock units granted. The incentive stock units included in the table below represent the number of shares that are expected to vest based on the Company’s estimate for meeting those established performance targets. As of December 31, 2020, the Company estimates that it will achieve 41%, 0% and 100% for the incentive stock units expected to vest based on performance for the three year periods ending December 31, 2020, 2021, and 2022, respectively, and has recorded incentive compensation expense accordingly. If estimates of the number of these stock units expected to vest changes in a future accounting period, cumulative compensation expense could increase or decrease and will be recognized in the current period for the elapsed portion of the vesting period and would change future expense for the remaining vesting period.
Compensation expense for the non-vested restricted stock and incentive stock units is based on the closing price of the Company’s common stock on the date of grant and recognized over the applicable vesting period.
The following table summarizes the restricted stock activity and related information for the 2011 Plan, the 2000 Plan, and Directors Plan, and incentive stock units activity and related information for the 2011 Plan and the 2000 Plan with related information for the years ended December 31:
| | | | | | | | | | | | | | | | | | | | |
| | Restricted
Stock
and Units | | Incentive
Stock
Awards | | Weighted
Average Grant
Date Fair
Value |
| Outstanding at December 31, 2017 | | 399,000 | | | 327,333 | | | $ | 78.76 | |
| Granted | | 224,060 | | | 175,100 | | | 73.76 | |
| Vested | | (148,644) | | | (93,312) | | | 81.55 | |
| Adjustment for incentive stock awards expected to vest | | — | | | 32,996 | | | 74.62 | |
| Canceled | | (29,327) | | | (26,875) | | | 78.60 | |
| Outstanding at December 31, 2018 | | 445,089 | | | 415,242 | | | $ | 75.51 | |
| Granted | | 608,813 | | | 259,950 | | | 70.61 | |
| Vested | | (235,406) | | | (119,835) | | | 71.65 | |
| Adjustment for incentive stock awards expected to vest | | — | | | 80,403 | | | 78.04 | |
| Canceled | | (27,465) | | | (63,758) | | | 74.04 | |
| Outstanding at December 31, 2019 | | 791,031 | | | 572,002 | | | $ | 73.64 | |
| Granted | | 283,587 | | | 250,197 | | | 75.68 | |
| Vested | | (345,859) | | | (147,069) | | | 77.45 | |
| Adjustment for incentive stock awards expected to vest | | — | | | (331,004) | | | 71.32 | |
| Canceled | | (83,705) | | | (73,481) | | | 72.83 | |
| Outstanding at December 31, 2020 | | 645,054 | | | 270,645 | | | $ | 73.75 | |
14. OTHER COMPREHENSIVE LOSS
The components of accumulated other comprehensive loss were:
| | | | | | | | | | | | | | |
| | | December 31, |
| In millions | | 2020 | | 2019 |
| Foreign currency translation loss | | $ | (260.2) | | | $ | (308.6) | |
Unrealized gain (loss) on derivative contracts, net of tax of $0.8 and $0 | | 2.4 | | | (3.3) | |
Unrealized loss on pension and post-retirement benefit plans, net of tax of $27.0 and $24.7 | | (81.3) | | | (70.7) | |
| Total accumulated other comprehensive loss | | $ | (339.1) | | | $ | (382.6) | |
The changes in accumulated other comprehensive loss by component, net of tax, for the year-ended December 31, 2020 are as follows:
| | | | | | | | | | | | | | | | | | | | | | | | | | |
| In millions | | Foreign currency translation | | Derivative contracts | | Pension and post retirement benefit plans | | Total |
| Balance at December 31, 2019 | | $ | (308.6) | | | $ | (3.3) | | | $ | (70.7) | | | $ | (382.6) | |
| Other comprehensive income before reclassifications | | 48.4 | | | 5.7 | | | (13.5) | | | 40.6 | |
| Amounts reclassified from accumulated other comprehensive income | | — | | | — | | | 2.9 | | | 2.9 | |
| Net current-period other comprehensive income | | 48.4 | | | 5.7 | | | (10.6) | | | 43.5 | |
| Balance at December 31, 2020 | | $ | (260.2) | | | $ | 2.4 | | | $ | (81.3) | | | $ | (339.1) | |
Reclassifications out of accumulated other comprehensive loss for the year-ended December 31, 2020 are as follows:
| | | | | | | | | | | | | | |
| In millions | | Amount reclassified from accumulated other comprehensive income | | Affected line item in the Condensed Consolidated Statements of Operations |
| Amortization of defined pension and post retirement items | | | | |
| Amortization of initial net obligation and prior service cost | | $ | (1.5) | | | Other income (expense), net |
| Amortization of net loss (gain) | | 5.4 | | | Other income (expense), net |
| | | 3.9 | | | Other income (expense), net |
| | | (1.0) | | | Income tax expense |
| | | $ | 2.9 | | | Net income |
The changes in accumulated other comprehensive loss by component, net of tax, for the year-ended December 31, 2019 are as follows:
| | | | | | | | | | | | | | | | | | | | | | | | | | |
| In millions | | Foreign currency translation | | Derivative contracts | | Pension and post retirement benefit plans | | Total |
| Balance at December 31, 2018 | | $ | (202.2) | | | $ | (0.1) | | | $ | (54.3) | | | $ | (256.6) | |
| Other comprehensive income before reclassifications | | (106.4) | | | (3.2) | | | (18.5) | | | (128.1) | |
| Amounts reclassified from accumulated other comprehensive income | | — | | | — | | | 2.1 | | | 2.1 | |
| Net current-period other comprehensive income | | (106.4) | | | (3.2) | | | (16.4) | | | (126.0) | |
| Balance at December 31, 2019 | | $ | (308.6) | | | $ | (3.3) | | | $ | (70.7) | | | $ | (382.6) | |
Reclassifications out of accumulated other comprehensive loss for the year-ended December 31, 2019 are as follows:
| | | | | | | | | | | | | | |
| In millions | | Amount reclassified from accumulated other comprehensive income | | Affected line item in the Condensed Consolidated Statements of Operations |
| Amortization of defined pension and post retirement items | | | | |
| Amortization of initial net obligation and prior service cost | | $ | (1.5) | | | Other income (expense), net |
| Amortization of net loss (gain) | | 4.4 | | | Other income (expense), net |
| | | 2.9 | | | Other income (expense), net |
| | | (0.8) | | | Income tax expense |
| | | $ | 2.1 | | | Net income |
15. LEASES
The Company leases property and equipment under finance and operating leases. For leases with terms greater than 12 months, the Company records the related asset and obligation at the present value of lease payments. Many of the Company's leases include rental escalation clauses, renewal options, and/or termination options that are factored into our determination of lease payments when appropriate. The Company does not separate lease and non-lease components.
As most of the Company's leases do not provide a readily stated discount rate, the Company must estimate our incremental borrowing rate to discount lease payments. The Company has established discount rates by geographic region ranging from 1.0% to 12.3%.
The components of lease expense are as follows:
| | | | | | | | | | | | | | |
| | For the year ended December 31, |
| In millions | | 2020 | | 2019 |
| Operating lease expense | | $ | 57.3 | | | $ | 54.4 | |
| Finance lease expense amortization of leased assets | | 1.2 | | | 1.1 | |
| Short-term and variable lease expense | | 0.1 | | | 0.6 | |
| Sublease income | | (0.4) | | | (0.5) | |
| Total | | $ | 58.2 | | | $ | 55.6 | |
Scheduled payments of lease liabilities are as follows:
| | | | | | | | | | | | | | | | | |
| In millions | Operating Leases | | Finance
Leases | | Total |
| 2021 | $ | 56.4 | | | $ | 0.4 | | | $ | 56.8 | |
| 2022 | 50.1 | | | 0.2 | | | 50.3 | |
| 2023 | 43.4 | | | 0.2 | | | 43.6 | |
| 2024 | 37.9 | | | 0.2 | | | 38.1 | |
| 2025 | 32.4 | | | 0.1 | | | 32.5 | |
| Thereafter | 103.6 | | | 0.1 | | | 103.7 | |
| Total lease payments | 323.8 | | 1.2 | | 325.0 | |
| Less: Present value discount | (29.0) | | | — | | | (29.0) | |
| Present value lease liabilities | $ | 294.8 | | | $ | 1.2 | | | $ | 296.0 | |
The following table summarizes the remaining lease term and discount rate assumptions used to develop the present value of lease liabilities:
| | | | | | | | | | | |
| December 31, 2020 | | December 31, 2019 |
| Weighted-average remaining lease term (years) | | | |
| Operating leases | 7.4 | | 7.0 |
| Finance leases | 4.5 | | 5.2 |
| Weighted-average discount rate | | | |
| Operating leases | 2.7 | % | | 4.6 | % |
| Finance leases | 1.4 | % | | 1.4 | % |
16. WARRANTIES
The following table reconciles the changes in the Company’s product warranty reserve as follows:
| | | | | | | | | | | | | | |
| In millions | | 2020 | | 2019 |
| Balance at beginning of year | | $ | 267.7 | | | $ | 153.7 | |
| Acquisitions | | 4.3 | | | 127.8 | |
| Warranty expense | | 130.0 | | | 105.5 | |
| Warranty claim payments | | (131.3) | | | (118.0) | |
| Foreign currency impact | | 7.8 | | | (1.3) | |
| Balance at end of year | | $ | 278.5 | | | $ | 267.7 | |
17. DERIVATIVE FINANCIAL INSTRUMENTS AND HEDGING
Hedging Activities In the normal course of business, we are exposed to interest rate, commodity price and foreign currency exchange rate fluctuations. At times, we limit these risks through the use of derivatives such as cross-currency swaps, foreign currency forward contracts, interest rate swaps, commodity forwards and futures. In accordance with our policy, derivatives are only used for hedging purposes. We do not use derivatives for trading or speculative purposes.
Foreign Currency Exchange Risk
The Company uses forward contracts to hedge forecasted foreign currency denominated sales of finished goods and future settlement of foreign currency denominated assets and liabilities. Derivatives used to hedge forecasted transactions and
specific cash flows associated with foreign currency denominated financial assets and liabilities that meet the criteria for hedge accounting are designated as cash flow hedges. The effective portion of gains and losses is deferred as a component of accumulated other comprehensive income and is recognized in earnings at the time the hedged item affects earnings, in the same line item as the underlying hedged item. For the years ended December 31, 2020, and 2019 the amounts reclassified into income were not material.
The Company has established revenue hedging, balance sheet risk management and net investment hedging programs to protect against volatility of future foreign currency cash flows and changes in fair value caused by volatility in foreign exchange rates. We conduct our business worldwide in U.S. dollars and the functional currencies of our foreign subsidiaries, including Euro, Indian rupee, British pound sterling, Australian dollars and several other foreign currencies. Changes in these foreign currency exchange rates could have a material adverse impact on our financial results that are reported in U.S. dollars. We are also exposed to foreign currency exchange rate risk related to our foreign subsidiaries, including intercompany loans denominated in non-functional currencies and net purchases and sales in non-functional currencies. We hedge these exposures using foreign currency swap contracts and cross-currency swaps to offset the potential income statement effects on intercompany loans denominated in non-functional currencies. These programs reduce but do not eliminate foreign currency exchange rate risk entirely.
The Company enters into certain derivative contracts in accordance with its risk management strategy that do not meet the criteria for hedge accounting, but which have the impact of largely mitigating foreign currency exposure. These foreign exchange contracts are accounted for on a full mark to market basis through earnings, with gains and losses recorded as a component of other expense, net. The net loss related to these contracts was $0.9 million for the twelve months ended December 31, 2020. These contracts are scheduled to mature within one year.
The following table summarizes the gross notional amounts and fair values of the designated and non-designated hedges discussed in the above sections as of December 31, 2020:
| | | | | | | | | | | | | | | | | | | | | | | | | | |
| | Fair Value | | Gross Notional Amount |
| In millions | | Designated | | Non-Designated | | Designated | | Non-Designated |
| Foreign Exchange Contracts | | | | | | | | |
| Other current assets | | $ | 9.2 | | | $ | 0.5 | | | $ | 793.6 | | | $ | 1.3 | |
| Other current liabilities | | (3.9) | | | (1.5) | | | 928.0 | | | 319.60 | |
| Cross-currency Swaps | | | | | | | | |
| Other current assets | | — | | | — | | | — | | | — | |
| Other current liabilities | | (26.0) | | | — | | | 613.2 | | | — | |
| Total | | $ | (20.7) | | | $ | (1.0) | | | $ | 2,334.8 | | | $ | 320.9 | |
The following table summarizes the gross notional amounts and fair values of the designated and non-designated hedged discussed in the above sections as of December 31, 2019:
| | | | | | | | | | | | | | | | | | | | | | | | | | |
| | Fair Value | | Gross Notional Amount |
| In millions | | Designated | | Non-Designated | | Designated | | Non-Designated |
| Foreign Exchange Contracts | | | | | | | | |
| Other current assets | | $ | 11.2 | | | $ | 1.4 | | | $ | 920.0 | | | $ | 412.9 | |
| Other current liabilities | | (9.8) | | | — | | | 1,184.6 | | | — | |
| Cross-currency Swaps | | | | | | | | |
| Other current assets | | — | | | — | | | — | | | — | |
| Other current liabilities | | (9.4) | | | — | | | 560.8 | | | — | |
| Total | | $ | (8.0) | | | $ | 1.4 | | | $ | 2,665.4 | | | $ | 412.9 | |
Interest Rate Risk
The Company may use interest rate swap contracts on certain investing and borrowing transactions to manage its net exposure to interest rate changes and to reduce its overall cost of borrowing. The Company does not use leveraged swaps and, in general, does not leverage any of its investment activities that would put principal capital at risk. For the twelve months ended December 31, 2020 the amounts reclassified into income were not material.
Commodity Price Risk
The Company may use commodity forward contracts and futures to manage its exposure to commodity price changes and to reduce its overall cost of manufacturing. For the twelve months ended December 31, 2020 the amounts reclassified into income were not material.
18. FAIR VALUE MEASUREMENT AND FAIR VALUE OF FINANCIAL INSTRUMENTS
ASC 820 “Fair Value Measurements and Disclosures” defines fair value, establishes a framework for measuring fair value and explains the related disclosure requirements. ASC 820 indicates, among other things, that a fair value measurement assumes that the transaction to sell an asset or transfer a liability occurs in the principal market for the asset or liability or, in the absence of a principal market, the most advantageous market for the asset or liability and defines fair value based upon an exit price model.
Valuation Hierarchy. ASC 820 establishes a valuation hierarchy for disclosure of the inputs to valuation used to measure fair value. This hierarchy prioritizes the inputs into three broad levels as follows. Level 1 inputs are quoted prices (unadjusted) in active markets for identical assets or liabilities. Level 2 inputs are quoted prices for similar assets and liabilities in active markets or inputs that are observable for the asset or liability, either directly or indirectly through market corroboration, for substantially the full term of the financial instrument. Level 3 inputs are unobservable inputs based on the Company’s assumptions used to measure assets and liabilities at fair value. A financial asset or liability’s classification within the hierarchy is determined based on the lowest level input that is significant to the fair value measurement.
The following table provides the assets and liabilities carried at fair value measured on a recurring basis as of December 31, 2020, which are included in other current assets and liabilities on the Consolidated Balance sheet:
| | | | | | | | | | | | | | | | | | | | | | | | | | |
| | | | | Fair Value Measurements at December 31, 2020 Using |
| | Total Carrying
Value at
December 31, | | Quoted Prices in
Active Markets for
Identical Assets | | Significant Other
Observable Inputs | | Significant
Unobservable
Inputs |
| In millions | | 2020 | | (Level 1) | | (Level 2) | | (Level 3) |
| Foreign Exchange Contracts | | | | | | | | |
| Other Current Assets | | 9.7 | | | — | | | 9.7 | | | — | |
| Other Current Liabilities | | 5.4 | | | — | | | 5.4 | | | — | |
| Cross-Currency Swap Agreement | | | | | | | | |
| Other Current Liabilities | | 26.0 | | | — | | | 26.0 | | | — | |
The following table provides the assets and liabilities carried at fair value measured on a recurring basis as of December 31, 2019, which are included in other current assets and liabilities on the Consolidated Balance sheet
| | | | | | | | | | | | | | | | | | | | | | | | | | |
| | | | Fair Value Measurements at December 31, 2019 Using |
| | Total Carrying
Value at
December 31, | | Quoted Prices in
Active Markets for
Identical Assets | | Significant Other
Observable Inputs | | Significant
Unobservable
Inputs |
| In millions | | 2019 | | (Level 1) | | (Level 2) | | (Level 3) |
| Foreign Exchange Contracts | | | | | | | | |
| Other Current Assets | | 12.6 | | | | | 12.6 | | | — | |
| Other Current Liabilities | | 9.8 | | | | | 9.8 | | | — | |
| Cross-Currency Swap Agreement | | | | | | | | |
| Other Current Liabilities | | 9.4 | | | | | 9.4 | | | — | |
As a result of our global operating activities, the Company is exposed to market risks from changes in foreign currency exchange rates, which may adversely affect our operating results and financial position. When deemed appropriate, the Company minimizes these risks through entering into foreign currency forward contracts. The foreign currency forward contracts are valued using broker quotations, or market transactions in either the listed or over-the counter markets. As such, these derivative instruments are classified within level 2.
The Company’s cash and cash equivalents are highly liquid investments purchased with an original maturity of three months or less and are considered Level 1 on the fair value valuation hierarchy. The fair value of cash and cash equivalents approximated the carrying value at December 31, 2020 and December 31, 2019. The Company’s defined benefit pension plan
assets consist primarily of equity security funds, debt security funds and temporary cash and cash equivalent investments. These investments are comprised of a number of investment funds that invest in a diverse portfolio of assets including equity securities, corporate and governmental bonds, and money markets. Trusts are valued at the net asset value (“NAV”) as determined by their custodian. NAV represents the accumulation of the unadjusted quoted close prices on the reporting date for the underlying investments divided by the total shares outstanding at the reporting dates. The Senior Notes are considered Level 2 based on the fair value valuation hierarchy. Contingent consideration related to the GE Transportation acquisition is considered Level 3 based on the fair value valuation hierarchy and includes $130.0 million classified as "Other accrued liabilities" on the Company's consolidated balance sheet and $218.1 million in long-term liabilities classified as "Contingent consideration" on the Company's consolidated balance sheet. The fair value approximates the carrying value at December 31, 2020.
19. COMMITMENTS AND CONTINGENCIES
The Company is subject to a variety of environmental laws and regulations governing discharges to air and water, the handling, storage and disposal of hazardous or solid waste materials and the remediation of contamination associated with releases of hazardous substances. The Company believes its operations currently comply in all material respects with all of the various environmental laws and regulations applicable to our business; however, there can be no assurance that environmental requirements will not change in the future or that we will not incur significant costs to comply with such requirements.
Under terms of the purchase agreement and related documents for the 1990 acquisition, Ingersoll Rand, the successor-in-interest to American Standard, Inc. (“Ingersoll”), has indemnified the Company for certain items including, among other things, certain environmental claims the Company asserted prior to 2000. If Ingersoll was unable to honor or meet these indemnifications, the Company would be responsible for such items. In the opinion of Management, Ingersoll currently has the ability to meet its indemnification obligations.
Claims have been filed against the Company and certain of its affiliates in various jurisdictions across the United States by persons alleging bodily injury as a result of exposure to asbestos-containing products. Most of these claims have been made against our wholly owned subsidiary, Railroad Friction Products Corporation (“RFPC”), and the vast majority of the claims, including all of the RFPC claims, are submitted to insurance carriers for defense and indemnity, or to non-affiliated companies that retain the liabilities for the asbestos-containing products at issue. We cannot, however, assure that all of these claims will be fully covered by insurance, or that the indemnitors or insurers will remain financially viable. Our ultimate legal and financial liability with respect to these claims, as is the case with other pending litigation, cannot be estimated. A limited number of claims are not covered by insurance, nor are they subject to indemnity from non-affiliated parties. Wabtec has incurred defense, administrative and indemnity costs in connection with these actions, but these costs have not been material, and the Company has no information that would suggest these costs would become material in the foreseeable future. Based on the Company’s history in resolving all asbestos claims over the last twenty years, Management believes that the costs of the Company’s asbestos-related cases will not be material to the Company’s overall financial position, results of operations and cash flows.
Xorail, Inc., a wholly owned subsidiary of the Company (“Xorail”), has received notices from Denver Transit Constructors (“DTC”) alleging breach of contract related to the operating of constant warning wireless crossings, and late delivery of the Train Management & Dispatch System (“TMDS”) for the Denver Eagle P3 Project, which is owned by the Denver Regional Transit District ("RTD"). No damages have been asserted for the alleged late delivery of the TMDS, and no formal claim has been filed; Xorail has successfully completed a remediation plan concerning the TMDS issues. With regard to the wireless crossing issue, as of September 8, 2017, DTC alleged that total damages were $36.8 million through July 31, 2017 and are continuing to accumulate. The majority of the damages stems from a delay in approval of the wireless crossing system by the Federal Railway Administration ("FRA") and the Public Utility Commission ("PUC"), resulting in the use of flaggers at all of the crossings pending approval of the wireless crossing system and certification of the crossings. DTC has alleged that the delay is due to Xorail's failure to achieve constant warning times for the crossings in accordance with the approval requirements imposed by the FRA and PUC. Xorail has denied DTC's assertions, stating that its system satisfied the contractual requirements. Xorail has worked with DTC to modify its system and implement the FRA's and PUC's previously undefined approval requirements; the FRA and PUC have both approved modified wireless crossing system, and as of August 2018, DTC completed the process of certifying the crossings and eliminated the use of flaggers. DTC has not updated its notices against Xorail, nor have they filed any formal claim against Xorail. On September 21, 2018, DTC filed a complaint against RTD in Colorado state court for breach of contract related to non-payments and the costs for the flaggers, asserting a change-in-law arising from the FRA/PUC’s new certification requirements. DTC’s complaint generally supports Xorail’s position and does not name or implicate Xorail. DTC's claim against RTD proceeded to trial on September 21, 2020; the trial has been completed, included post-trial submission. No decision is expected until March or April 2021.
On April 3, 2018, the Company and Knorr-Bremse AG entered into a consent decree with the United States Department of Justice resolving allegations that the Company and Knorr-Bremse AG had maintained unlawful agreements not to compete for each other’s employees. The allegations also related to Faiveley Transport before it was acquired by the Company in
November 2016. No monetary fines or penalties were imposed on the Company. The Company elected to settle this matter with the Department of Justice to avoid the cost and distraction of litigation. Putative class action lawsuits thereafter were filed in several different federal district courts naming the Company and Knorr as defendants in connection with the allegations contained in the consent decree. The lawsuits seek unspecified damages on behalf of employees of the Company (including Faiveley Transport) and Knorr allegedly caused by the defendants’ actions. A federal Multi-District Litigation (MDL) Panel consolidated the cases in the Western District of Pennsylvania, and on October 12, 2018, a consolidated class action complaint was filed in the Western District of PA with five named plaintiffs. On August 13, 2019, the Company was notified that co-defendant Knorr-Bremse settled with plaintiffs. On January 21, 2020, following Court-sponsored early mediation, the Company entered into a Memorandum of Understanding with plaintiffs, agreeing to settle all claims in the case. In March 2020, the Court issued preliminary approval of the agreed settlement terms and amount. In December 2020, payments were distributed to class members.
From time to time the Company is involved in litigation relating to claims arising out of its operations in the ordinary course of business. As of the date hereof, the Company is involved in no litigation that the Company believes will have a material adverse effect on its financial condition, results of operations or liquidity.
20. SEGMENT INFORMATION
The Company has two reportable segments—the Freight Segment and the Transit Segment. The key factors used to identify these reportable segments are the organization and alignment of the Company’s internal operations, the nature of the products and services, and customer type. Initiatives to integrate GE Transportation operations into Wabtec including recent restructuring programs announced in late 2019 resulted in changes to the Company's organizational structure and the financial reporting utilized by the Company's chief operating decision maker to assess performance and allocate resources; as a result, certain asset groups were reorganized from the Freight Segment to the Transit Segment and vice versa. The change in the Company’s reportable segments was effective in the fourth quarter of 2019 and is reflected below. The Company believes these changes better present Management's new view of the business. The Company’s business segments are:
Freight Segment primarily builds new locomotives, manufactures and services components for new and existing freight cars and locomotives, rebuilds freight locomotives, supplies railway electronics, positive train control equipment, signal design and engineering services, and provides related heat exchange and cooling systems. Customers include large, publicly traded railroads, leasing companies, manufacturers of original equipment such as locomotives and freight cars, and utilities.
Transit Segment primarily manufactures and services components for new and existing passenger transit vehicles, typically regional trains, high speed trains, subway cars, light-rail vehicles and buses. It also refurbishes subway cars and provides heating, ventilation, and air conditioning equipment, and doors for buses and subways. Customers include public transit authorities and municipalities, leasing companies, and manufacturers of subway cars and buses around the world.
The Company evaluates its business segments’ operating results based on income from operations. Intersegment sales are accounted for at prices that are generally established by reference to similar transactions with unaffiliated customers. Corporate activities include general corporate expenses, elimination of intersegment transactions, interest income and expense and other unallocated charges. The changes to the asset groups comprising the Freight and Transit segments have been reflected through retrospective revision of prior period segment information.
| | | | | | | | | | | | | | | | | | | | | | | | | | |
| Segment financial information for 2020 is as follows: | | | | | | | | |
| In million | | Freight Segment | | Transit Segment | | Corporate Activities and Elimination | | Total |
| Sales to external customers | | $ | 5,082.3 | | | $ | 2,473.8 | | | $ | — | | | $ | 7,556.1 | |
| Intersegment sales/(elimination) | | 48.6 | | | 36.5 | | | (85.1) | | | — | |
| Total sales | | $ | 5,130.9 | | | $ | 2,510.3 | | | $ | (85.1) | | | $ | 7,556.1 | |
| Income (loss) from operations | | $ | 583.9 | | | $ | 229.7 | | | $ | (69.1) | | | $ | 744.5 | |
| Interest expense and other, net | | — | | | — | | | (187.3) | | | (187.3) | |
| Income (loss) before income taxes | | $ | 583.9 | | | $ | 229.7 | | | $ | (256.4) | | | $ | 557.2 | |
| Depreciation and amortization | | $ | 393.9 | | | $ | 66.7 | | | $ | 12.7 | | | $ | 473.3 | |
| Capital expenditures | | 70.4 | | | 39.9 | | | 26.1 | | | 136.4 | |
| Segment assets | | 15,392.8 | | | 6,395.0 | | | (3,333.3) | | | 18,454.5 | |
| | | | | | | | | | | | | | | | | | | | | | | | | | |
| Segment financial information for 2019 is as follows: |
| In millions | | Freight Segment | | Transit Segment | | Corporate Activities and Elimination | | Total |
| Sales to external customers | | $ | 5,441.4 | | | $ | 2,758.6 | | | $ | — | | | $ | 8,200.0 | |
| Intersegment sales/(elimination) | | 59.6 | | | 23.4 | | | (83.0) | | | — | |
| Total sales | | $ | 5,501.0 | | | $ | 2,782.0 | | | $ | (83.0) | | | $ | 8,200.0 | |
| Income (loss) from operations | | $ | 642.9 | | | $ | 214.4 | | | $ | (194.2) | | | $ | 663.1 | |
| Interest expense and other, net | | — | | | — | | | (216.3) | | | (216.3) | |
| Income (loss) before income taxes | | $ | 642.9 | | | $ | 214.4 | | | $ | (410.5) | | | $ | 446.8 | |
| Depreciation and amortization | | $ | 330.4 | | | $ | 62.2 | | | $ | 8.8 | | | $ | 401.4 | |
| Capital expenditures | | 105.1 | | | 63.7 | | | 16.5 | | | 185.3 | |
| Segment assets | | 14,450.9 | | | 6,026.0 | | | (1,532.7) | | | 18,944.2 | |
| | | | | | | | | | | | | | | | | | | | | | | | | | |
| Segment financial information for 2018 is as follows: | | | | | | | | |
| In millions | | Freight Segment | | Transit Segment | | Corporate Activities and Elimination | | Total |
| Sales to external customers | | $ | 1,766.4 | | | $ | 2,597.1 | | | $ | — | | | $ | 4,363.5 | |
| Intersegment sales/(elimination) | | 52.8 | | | 11.3 | | | (64.1) | | | — | |
| Total sales | | $ | 1,819.2 | | | $ | 2,608.4 | | | $ | (64.1) | | | $ | 4,363.5 | |
| Income (loss) from operations | | $ | 334.3 | | | $ | 192.5 | | | $ | (53.4) | | | $ | 473.4 | |
| Interest expense and other, net | | — | | | — | | | (105.8) | | | (105.8) | |
| Income (loss) before income taxes | | $ | 334.3 | | | $ | 192.5 | | | $ | (159.2) | | | $ | 367.6 | |
| Depreciation and amortization | | $ | 41.6 | | | $ | 62.7 | | | $ | 5.0 | | | $ | 109.3 | |
| Capital expenditures | | $ | 24.6 | | | $ | 61.6 | | | $ | 7.1 | | | $ | 93.3 | |
The following geographic area data as of and for the years ended December 31, 2020, 2019 and 2018, respectively, includes net sales based on product shipment destination and long-lived assets, which consist of plant, property and equipment, net of depreciation, resident in their respective countries:
| | | | | | | | | | | | | | | | | | | | | | | | | | | | | | | | |
| | Net Sales | | Long-Lived Assets |
| In millions | | 2020 | | 2019 | | 2018 | | 2020 | | 2019 |
| United States | | $ | 3,160.7 | | | $ | 3,381.0 | | | $ | 1,460.3 | | | $ | 1,039.7 | | | $ | 1,089.8 | |
| Canada | | 372.4 | | | 733.3 | | | 279.0 | | | 9.4 | | | 13.2 | |
| Mexico | | 187.3 | | | 356.6 | | | 200.6 | | | 22.5 | | | 23.7 | |
| North America | | 3,720.4 | | | 4,470.9 | | | 1,939.9 | | | 1,071.6 | | | 1,126.7 | |
| | | | | | | | | | |
| South America | | 217.1 | | | 217.8 | | | 105.7 | | | 31.6 | | | 40.0 | |
| | | | | | | | | | |
| United Kingdom | | 314.0 | | | 376.2 | | | 395.8 | | | 51.4 | | | 55.5 | |
| Germany | | 350.5 | | | 340.0 | | | 314.7 | | | 81.8 | | | 77.7 | |
| France | | 251.8 | | | 294.3 | | | 247.8 | | | 58.5 | | | 57.7 | |
| Italy | | 172.3 | | | 206.3 | | | 189.8 | | | 31.0 | | | 29.3 | |
| Switzerland | | 83.0 | | | 88.6 | | | 59.8 | | | 2.1 | | | 1.9 | |
| Other Europe | | 405.1 | | | 386.5 | | | 354.5 | | | 59.8 | | | 56.6 | |
| Europe | | 1,576.7 | | | 1,691.9 | | | 1,562.4 | | | 284.6 | | | 278.7 | |
| | | | | | | | | | |
| India | | 441.1 | | | 504.2 | | | 178.5 | | | 164.3 | | | 159.2 | |
| Australia / New Zealand | | 366.2 | | | 300.7 | | | 176.2 | | | 11.9 | | | 12.0 | |
| China | | 225.0 | | | 290.4 | | | 170.3 | | | 30.4 | | | 33.4 | |
| | | | | | | | | | |
| Other Asia / Middle East | | 198.9 | | | 215.9 | | | 167.5 | | | 0.5 | | | 0.6 | |
| | | | | | | | | | |
| Egypt | | 359.8 | | | 227.6 | | | 0.6 | | | — | | | — | |
| Other Africa | | 138.4 | | | 105.8 | | | 46.8 | | | 4.4 | | | 3.8 | |
| | | | | | | | | | |
| Russia / CIS | | 312.5 | | | 174.8 | | | 15.6 | | | 2.3 | | | 1.4 | |
| | | | | | | | | | |
| Total | | $ | 7,556.1 | | | $ | 8,200.0 | | | $ | 4,363.5 | | | $ | 1,601.6 | | | $ | 1,655.8 | |
Net sales by product line are as follows:
| | | | | | | | | | | | | | | | | | | | |
| In millions | | 2020 | | 2019 | | 2018 |
| Freight Segment: | | | | | | |
| Equipment | | $ | 1,531.5 | | | $ | 1,699.7 | | | $ | — | |
| Components | | 818.7 | | | 1,073.5 | | | 1,169.1 | |
| Digital Electronics | | 664.0 | | | 677.1 | | | 474.1 | |
| Services | | 2,068.1 | | | 1,991.1 | | | 123.2 | |
| Total Freight Segment sales | | $ | 5,082.3 | | | $ | 5,441.4 | | | $ | 1,766.4 | |
| | | | | | |
| Transit Segment: | | | | | | |
| Original Equipment Manufacturer | | 1,138.6 | | | 1,286.6 | | | 1,194.0 | |
| Aftermarket | | 1,335.2 | | | 1,472.0 | | | 1,403.1 | |
| Total Transit Segment sales | | $ | 2,473.8 | | | $ | 2,758.6 | | | $ | 2,597.1 | |
21. OTHER INCOME, NET
The components of other income, net are as follows:
| | | | | | | | | | | | | | | | | | | | |
| | For the year ended December 31, |
| In millions | | 2020 | | 2019 | | 2018 |
| Foreign currency loss | | $ | (8.2) | | | $ | (13.5) | | | $ | (5.7) | |
| Equity income | | 9.7 | | | 8.1 | | | 1.9 | |
| Expected return on pension assets/amortization | | 10.0 | | | 9.9 | | | 9.0 | |
| Other miscellaneous (expense) income | | 0.1 | | | (1.7) | | | 1.2 | |
| Total other income, net | | $ | 11.6 | | | $ | 2.8 | | | $ | 6.4 | |
SCHEDULE II
WESTINGHOUSE AIR BRAKE TECHNOLOGIES CORPORATION
VALUATION AND QUALIFYING ACCOUNTS
For each of the three years ended December 31
| | | | | | | | | | | | | | | | | | | | | | | | | | | | | | | | |
| In millions | | Balance at
beginning
of period | | Charged/
(credited) to
expense | | Charged/ (credited) to
other
accounts (1) | | Deductions
from
reserves (2) | | Balance
at end of
period |
| 2020 | | | | | | | | | | |
| Allowance for doubtful accounts | | $ | 19.9 | | | $ | 18.3 | | | $ | 0.2 | | | $ | 1.9 | | | $ | 36.5 | |
| Valuation allowance-taxes | | 58.0 | | | (16.3) | | | — | | | — | | | 41.7 | |
| 2019 | | | | | | | | | | |
| Allowance for doubtful accounts | | $ | 16.9 | | | $ | 7.1 | | | $ | 0.2 | | | $ | 4.3 | | | $ | 19.9 | |
| Valuation allowance-taxes | | 41.8 | | | 16.2 | | | — | | | — | | | 58.0 | |
| 2018 | | | | | | | | | | |
| Allowance for doubtful accounts | | $ | 12.3 | | | $ | 9.5 | | | $ | (0.4) | | | $ | 4.5 | | | $ | 16.9 | |
| Valuation allowance-taxes | | 25.7 | | | 27.4 | | | — | | | 11.3 | | | 41.8 | |
(1)Reserves of acquired/(sold) companies; valuation allowances for state and foreign deferred tax assets; impact of fluctuations in foreign currency exchange rates.
(2)Actual disbursements and/or charges.
| | | | | |
| Item 16. | FORM 10-K SUMMARY |
Not applicable.
SIGNATURES
Pursuant to the requirements of Section 13 or 15(d) of the Securities Exchange Act of 1934, the Company has duly caused this report to be signed on its behalf by the undersigned, thereunto duly authorized.
| | | | | | | | | | | |
| | | |
| | | | |
| | | WESTINGHOUSE AIR BRAKE
TECHNOLOGIES CORPORATION |
| | | | |
| Date: | February 19, 2021 | By: | /S/ RAFAEL SANTANA |
| | | | Rafael Santana, |
| | | | President and Chief Executive Officer, and Director |
Pursuant to the requirements of the Securities Exchange Act of 1934, this report has been signed below by the following persons on behalf of the Company and in the capacities and on the dates indicated.
| | | | | | | | |
| | Signature and Title | Date |
| | | |
| By | /S/ ALBERT J. NEUPAVER | February 19, 2021 |
| | Albert J. Neupaver,
Chairman of the Board | |
| | |
| By | /S/ RAFAEL SANTANA | February 19, 2021 |
| | Rafael Santana
President and Chief Executive Officer and Director (Principal Executive Officer) | |
| | | |
| By | /S/ PATRICK D. DUGAN | February 19, 2021 |
| | Patrick D. Dugan, Executive Vice President Finance and Chief Financial Officer (Principal Financial Officer) | |
| | |
| By | /S/ JOHN A. MASTALERZ | February 19, 2021 |
| | John A. Mastalerz, Senior Vice President and Principal Accounting Officer | |
| | | |
| By | /S/ WILLIAM E. KASSLING | February 19, 2021 |
| | William E. Kassling, Lead Director | |
| | |
| By | /S/ LEE BANKS | February 19, 2021 |
| | Lee Banks,
Director | |
| | | |
| By | /S/ ERWAN FAIVELEY | February 19, 2021 |
| | Erwan Faiveley,
Director | |
| | |
| By | /S/ LEE B. FOSTER, II | February 19, 2021 |
| | Lee B. Foster, II, Director | |
| | | |
| By | /S/ LINDA A. HARTY | February 19, 2021 |
| | Linda A. Harty,
Director | |
| | |
| | | | | | | | |
| | Signature and Title | Date |
| By | /S/ BRIAN P. HEHIR | February 19, 2021 |
| | Brian P. Hehir, Director | |
| | | |
| By | /S/ MICHAEL W. D. HOWELL | February 19, 2021 |
| | Michael W. D. Howell, Director | |
| | |
| By | /S/ ANN R. KLEE | February 19, 2021 |
| Ann R. Klee,
Director | |