UNITED STATES
SECURITIES AND EXCHANGE COMMISSION
WASHINGTON, D.C. 20549
FORM
(Mark one)
☒ ANNUAL REPORT PURSUANT TO SECTION 13 OR 15(d) OF THE SECURITIES EXCHANGE ACT OF 1934
For the fiscal year ended
or
☐ TRANSITION REPORT PURSUANT TO SECTION 13 OR 15(d) OF THE SECURITIES EXCHANGE ACT OF 1934
For the transition period from____________ to ____________
Commission file number:
(Exact name of registrant as specified in its charter)
|
|
|
|
|
(State or Other Jurisdiction of Incorporation or Organization) |
|
(I.R.S. Employer Identification No.) |
|
|
|
|
|
|
|
|
|
|
|
|
|
(Address of Principal Executive Offices) |
|
(Zip Code) |
(Registrant’s telephone number, including area code)
Securities registered pursuant to Section 12(b) of the Act:
Title of each class Name of each exchange on which registered
|
|
|
|
Securities registered pursuant to Section 12(g) of the Act: None.
Indicate by check mark if the registrant is a well‑known seasoned issuer, as defined in Rule 405 of the Securities Act. Yes ☐
Indicate by check mark if the registrant is not required to file reports pursuant to Section 13 or 15(d) of the Act. Yes ☐
Indicate by check mark whether the registrant (1) has filed all reports required to be filed by Section 13 or Section 15(d) of the Securities Exchange Act of 1934 during the preceding 12 months (or for such shorter period that the registrant was required to file such reports) and (2) has been subject to such filing requirements for the past 90 days.
Indicate by check mark whether the registrant has submitted electronically every Interactive Data File required to be submitted pursuant to Rule 405 of Regulation S‑T during the preceding 12 months (or for such shorter period that the registrant was required to submit).
Indicate by check mark whether the registrant is a large accelerated filer, an accelerated filer, a non‑accelerated filer, a smaller reporting company, or an emerging growth company. See the definitions of “large accelerated filer,” “accelerated filer,” “smaller reporting company,” and "emerging growth company" in Rule 12b‑2 of the Exchange Act. (Check one):
|
|
Large accelerated filer ☐ |
|
| Accelerated filer ☐ |
||
|
|
☒ |
|
| ☒ | ||
| Emerging growth company |
If an emerging growth company, indicate by check mark if the registrant has elected not to use the extended transition period for complying with any new or revised financial accounting standards provided pursuant to Section 13(a) of the Exchange Act. ☐
Indicate by check mark whether the registrant has filed a report on and attestation to its management’s assessment of the effectiveness of its internal control over financial reporting under Section 404(b) of the Sarbanes-Oxley Act (15 U.S.C. 7262(b)) by the registered public accounting firm that prepared or issued its audit report. ☐
Indicate by check mark whether the registrant is a shell company (as defined in Rule 12b‑2 of the Act). Yes ☐ No
As of June 30, 2021, the aggregate market value of the registrant’s common stock held by non‑affiliates of the registrant was $
DOCUMENTS INCORPORATED BY REFERENCE
|
Document |
|
Parts Into Which Incorporated |
|
Proxy Statement for the 2022 Annual Meeting of Shareholders (Proxy Statement) |
|
Part III |
| i |
Reorganization
On July 21, 2021, a holding company reorganization was completed (the “Reorganization”) in which Image Sensing Systems, Inc. ("ISNS") became a wholly-owned subsidiary of the new parent company named “Autoscope Technologies Corporation” ("Autoscope"), which became the successor issuer to ISNS. As a result of the Reorganization, Autoscope replaced ISNS as the public company trading on the Nasdaq Stock Market under the ticker symbol “AATC,” and outstanding shares of ISNS’s common stock automatically converted into shares of common stock of Autoscope. As used in this Annual Report Form 10-K, the "Company", "we", "us" and "our" or its management or business at any time before the effective date of the Reorganization refer to those of ISNS as the predecessor company and its wholly-owned subsidiaries and thereafter to Autoscope and its wholly-owned subsidiaries, except as otherwise specified or to the extent the context otherwise indicates. The Reorganization is intended to be a tax-free transaction for U.S. federal income tax purposes for the Company’s shareholders. Autoscope was incorporated on April 23, 2021 under the laws of the State of Minnesota, and ISNS was incorporated in Minnesota on December 20, 1984.
General
Autoscope creates value through owning and supporting operating subsidiaries and investments, anchored by core investments in the fields of technology and engineering. Autoscope's main subsidiary is ISNS.
ISNS is a global company committed to providing above-ground detection technology products for advanced traffic management systems, traffic data collection applications, and related markets. ISNS pioneered video image processing, also known as machine vision, for vehicle detection and continues to be an industry leader today. ISNS's industry leading products include the Autoscope® video or video products, RTMS® radar or radar products (“RTMS”), and IntellitraffiQ®, or iQ products, which provide end users with the tools needed to optimize traffic flow and enhance driver safety. ISNS's technology analyzes signals from sophisticated sensors and transmits the information to management systems and controllers or directly to users. ISNS's products provide end users with complete solutions for the intersection and transportation markets.
ISNS's technology is a process in which software, rather than humans, examines outputs from various types of sophisticated sensors to determine what is happening in a field of view. In the Intelligent Transportation Systems ("ITS") industry, this process is a critical component of managing congestion and traffic flow. In many cities, it is not possible to build roads, bridges and highways quickly enough to accommodate the increasing congestion levels. During 2020, congestion levels decreased significantly as a result of COVID-19 related government lockdowns, although automobile travel has rebounded in many areas, causing congestion levels to begin returning to previous levels (per INRIX 2020 Global Traffic scorecard). In 2021, on average, United States commuters lost 36 hours a year in congestion, which cost an average of $564 per driver in wasted time (per INRIX 2021 Global Traffic scorecard). We believe this growing use of vehicles will make our ITS solutions increasingly necessary to complement existing and new roadway infrastructure to manage traffic flow and optimize throughput.
We believe ISNS's solutions are technically superior to those of our competitors because they have a higher level of accuracy, limit the occurrence of false detection, are generally easier to install with lower costs of ownership, work effectively in a multitude of light and weather conditions, and provide end users the ability to manage inputs from a variety of sensors for a number of tasks. It is our view that the technical advantages of ISNS's products make our solutions well suited for use in ITS markets.
We believe the strength of our distribution channels positions us to increase the penetration of our technology‑driven solutions in the marketplace. Autoscope video products are marketed in the United States, Mexico, Canada and the Caribbean through exclusive agreements with Econolite Control Products, Inc. (“Econolite”), which we believe is the leading distributor of ITS intersection control products in these markets.
RTMS radar systems are marketed to a network of distributors globally. On a limited basis, we may sell directly to the end user. Autoscope video products are marketed outside the United States, Mexico, Canada and the Caribbean through a combination of distribution and direct sales channels through our office in Spain. Our end users primarily include governmental agencies and municipalities.
With more than 140,000 installations in over 70 countries worldwide, ISNS remains dedicated to helping improve safety and efficiency for cities and highways by providing meaningful and reliable data through innovative technologies, applications, and solutions.
| 1 |
Industry Overview
The Intelligent Transportation Systems Market. ITS encompasses a broad range of information processing and control electronics technologies that, when integrated into roadway infrastructure, help monitor and manage traffic flow, reduce congestion and enhance driver safety. The ITS market has been built around the detection of conditions that impact the proper operation of roadway infrastructure. ITS applications include a wide array of traffic management systems, such as traffic signal control, tolling and variable messaging signs. ITS technologies include video vehicle detection, inductive loop detection, sensing technologies (such as radar), floating cellular data, computational technologies and wireless communications.
In traffic management applications, vehicle detection products are used for automated vehicle detection and are a primary data source upon which ITS solutions are built. Traditionally, automated vehicle detection is performed using inductive wire loops buried in the pavement. However, in‑pavement loop detectors are costly to install, difficult to maintain, expensive to repair and not capable of either wide‑area vehicle detection without installations of multiple loops.
Above‑ground detection solutions for ITS offer several advantages to in‑pavement loop detectors. Above‑ground detection solutions tend to have a lower total cost of ownership than in‑pavement loop detectors because above‑ground solutions are non‑destructive to road surfaces, do not require closing roadways to install or repair, and are capable of wide‑area vehicle detection with a single device, thus enabling one input device to do the work of many in‑pavement loops. Due to their location above-ground, these solutions have no exposure to the wear and tear associated with expanding and contracting pavement and generally less exposure to the vibration and compaction caused by traffic. Furthermore, in the event of malfunction or product failure, above‑ground detection solutions can be serviced and repaired without shutting down the roadway. Each of these factors results in greater up‑time and increased reliability of above‑ground detection solutions compared to in‑pavement loop detectors. These technology solutions also offer a broader set of detection capabilities and a wider field of view than in‑pavement loop detectors. In addition, a single unit video‑ or radar‑based system can detect and measure a variety of parameters, including vehicle presence, counts, speed, length, time occupancy, headway and flow rate as well as environmental factors and obstructions to the roadway. An equivalent installation using loops would require many installations per lane.
We believe that several trends are driving the growth in ITS and adjacent market segments:
Proliferation of Traffic. In many countries, there has been a surge in the number of vehicles on roadways. Due to the growth of emerging economies and elevated standards of living, more people desire and are able to afford automobiles. The number of vehicles utilizing the world’s roadway infrastructure is growing at a quicker pace than new roads, bridges and highways are being constructed. According to the Federal Highway Administration, American drivers put a record 3.28 trillion miles on public roads and highways in 2019, an increase of 0.6% from 3.26 trillion miles in 2018. However, we believe the effects of the COVID-19 pandemic caused traffic congestion in the U.S. to decrease in 2020, although it has been increasing as the pandemic subsides due to increased vaccination rates and the removal of stay-at-home and other restrictive mandates. Overall, the growth in roadway infrastructure is failing to match the surge in the number of vehicles using it. Above-ground detection-based traffic management and control systems address the problem by monitoring high traffic areas and analyzing data that can be used to mitigate traffic problems.
The Demographics of Urbanization. Accelerated worldwide urbanization drives the creation and expansion of middle classes and produces heightened demand for automobiles. Because automobiles can be introduced to a metropolitan area faster than roadway infrastructure can be constructed, the result is continuously worsening traffic. Expanding the roadway infrastructure is slow and costly to implement, and often environmentally undesirable, so government agencies are increasingly turning to technology‑based congestion solutions that optimize performance and throughput of existing and new roadway infrastructure. Detection is the requisite common denominator for any technology‑based solution.
| 2 |
The Melding of Large City Service Domains. Large cities require a wide range of service domains, including traffic. These cities are increasingly turning to centralized management of these service domains, employing a command and control model that requires sharing and integrating data across service domains to operate effectively and lower total cost. For example, data collected for the traffic management service domain is relevant to all of the other service domains. This means that each sensor can supply information to multiple domain services. In turn, the sharing of detection information across service domains should increase the level of sophistication required to process and interpret that information. Additionally, above-ground detection products are more capable of performing certain complicated tasks than humans. This results in the realization of "smart city" initiatives through above-ground detection solutions that are cost effective, which we believe will result in the extensive proliferation of sophisticated sensors and detection devices.
Solutions for Adjacent Markets. We believe that the adjacent markets of ITS, connected vehicles and security/surveillance are converging, and that this convergence will accelerate as above-ground detection systems become more cost effective now that a single sensor can be used for multiple purposes. Because the technologies involved are closely related, our sensor technology can be adapted to or is already capable of addressing these adjacent markets.
Our Competitive Strengths
We are a leading provider of above-ground detection products and solutions for the ITS industry. We have the following competitive strengths that we expect will continue to enhance our leadership position:
Leading Proprietary Technologies and Strong Global Brand Recognition. Over the last three decades, we have developed or acquired a proprietary portfolio of complex software algorithms and applications that we have continuously enhanced and refined. These algorithms, which include our advanced signal processing technologies, allow our video and radar products to capture and analyze objects in diverse weather and lighting conditions and to balance the accuracy of positive detection and the avoidance of false detections. Due to the strength of our proprietary technologies, we believe we command premium pricing. Above-ground detection technologies similar to ours are also difficult to develop and refine in a commercially viable manner. We are therefore well positioned to quickly introduce innovative next‑generation products to market.
Proven Ability to Develop, Enhance and Market New Products. We are continually developing and enhancing our product offerings. Over the last three decades, we have demonstrated our ability to lead the market with new products and product enhancements. For example, the Autoscope Solo system was the first fully integrated color camera, zoom lens and machine vision processor in the above-ground detection market. Our RTMS Radar was the first radar‑based technology solutions for ITS applications, and we continue to lead the market with technology enhancements and new products. Furthermore, in 2020 we introduced the RTMS Echo, an industry-leading, powerful IoT-ready device that has been built from the ground up to provide access to more actionable data than any radar on the market. We have successfully collaborated with our long‑term channel partners to market these products. We believe that developing, enhancing and marketing new products with our partners can translate into strong organic revenue growth and higher levels of profitability.
Leading Distribution Channel. Since 1991, we have maintained a relationship with Econolite, which has the exclusive right to manufacture, market and distribute our Autoscope video products in the United States, Mexico, Canada and the Caribbean. We believe that Econolite is one of the leading distributors of ITS control products in North America and the Caribbean. This relationship enhances our ability to commercialize and market new products and allows us to focus more resources on developing advanced signal processing software algorithms.
Broad Product Portfolio. Our product portfolio leverages our core software‑based algorithms to enable end users to detect and monitor objects in a designated field of view. We believe that our family of Autoscope video, RTMS radar, and IntellitraffiQ software products allows us to offer a broad product portfolio that meets the needs of our end users.
Experienced Management Team and Engineering Staff. Our management team and engineering staff are highly experienced in the ITS and software industries. Additionally, the continuity of our engineering staff should allow the uninterrupted development of new or improved products.
| 3 |
Our Growth Strategy
As part of our growth strategy, we seek to:
Enhance and Extend Our Technology Leadership in ITS. We believe we have established ourselves as a leading provider of technology in the ITS market segment. We believe that we continue to have an opportunity to accelerate our growth. We plan to do this by improving the accuracy and functionality of our products and opportunistically expanding our product offering into adjacent markets, as well as expanding our portfolio and channels through licensing. Having developed and introduced our next-generation RTMS radar product, we expect to take advantage of our technical leadership in ITS and further differentiate us from our competitors.
Expand into Adjacent Markets. One of our core competencies is the development and implementation of advanced above-ground detection platforms. While our focus has been on the application of this technology to the transportation market, we are now seeing more opportunities to deploy our highly accurate and ruggedized systems into adjacent markets. These adjacent opportunities are largely driven by the convergence of user needs and expectations within the transportation, safety, surveillance, and broader “smart-city” markets. We are continuously refining our technology road-map in response to emerging technology enablers and market needs. We believe our recent product introductions and near-term research and development initiatives will enable us to become a leading supplier of critical detection components that provide actionable data across incremental markets.
Increase the Scope of Our Distribution and Direct Sales. We have made substantial investments in product adjustments to tailor our solutions to the differing needs of our international end users and in new product acquisitions for both domestic and international markets. We have also invested in sales and marketing expansion, with a focus on our European subsidiaries. Markets in Eastern Europe, the Asia/Pacific region, the Middle East, Africa and South America, which have historically lagged North America and Western Europe in their use of above-ground detection, have begun to increase the adoption of detection technology in their traffic systems. We intend to take advantage of the accelerated pace of the adoption of above-ground detection throughout the developing world by increasing end user awareness of our products and applications as well as improving user aptitude.
Expand Through Strategic Acquisitions and Investments. We believe that we have the opportunity to create future value by focusing on high-return growth opportunities while seeking acquisitions which can leverage our existing assets and infrastructure. Over the past several years, we have seen improved bottom line profitability and cash flow, and by reorganizing and building on the success of the Autoscope video products, we will work on growing the business with a focus on organic opportunities while also examining acquisitions and partnerships that can leverage the reputation, assets and talents within the Company. We intend to transform the Company into a group of profitable business lines marketed to a diverse customer base that generates sustainably higher earnings.
Our Products and Solutions
Our vehicle and traffic detection products are critical components of many ITS applications. Our Autoscope video systems and RTMS radar systems convert sensory input collected by video and radar modules into vehicle detection and traffic data used to operate, monitor and improve the efficiency and safety of roadway infrastructure. At the core of each product line are proprietary digital signal processing algorithms and sophisticated embedded software that analyze sensory input and deliver actionable data to integrated applications. We invested approximately $2.2 million and $3.3 million on research and development in 2021 and 2020, respectively, to develop and enhance our product technology. Our digital signal processing software algorithms represent a foundation on which to support additional product development into the automatic incident detection (AID) market. A diagram displaying our fundamental product architecture is shown below.
| 4 |
The Image Sensing Product Architecture
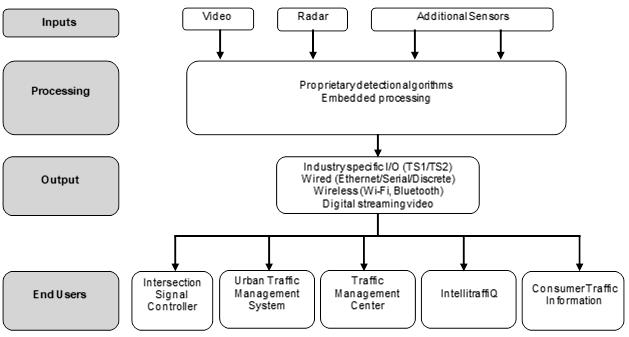
Autoscope Video. Our Autoscope video system processes video input from a traffic scene in real time and extracts the required traffic data, including vehicle presence, bicycle presence/differentiation, counts, speed, length, time occupancy (percent of time the detection zone is occupied), turning movements (quantifying the movement of vehicles) and flow rate (vehicles per hour per lane). Autoscope supports a variety of standard video cameras or can be purchased with an integrated high-definition video camera. For intersections, the system communicates with the intersection signal controller, which changes the traffic lights based on the data provided. The data may also be transmitted to a traffic management center via the internet or other standard communication means and processed in real time to assist in traffic management and stored for later analysis for traffic planning purposes.
The Autoscope system comes in two varieties. Autoscope Vision is our flagship integrated product that includes a color high-definition, zoom camera and a machine vision processing computer contained in a compact housing that is our leading offering in the North American market. Autoscope Pn-520 is our card-only machine vision processing computer that is located in an intersection signal controller, control hub, incident management center or traffic management center that receives video from a separate camera. The Pn-520 and its variants are our top selling Autoscope products in international markets. Autoscope rack-based products offer digital MPEG‑4 video streaming, high-speed Ethernet interface, web browser maintenance and data and video over power line communications. The Autoscope Vision product offers high definition streaming video, built-in WiFi for quick and easy setup, cost-effective three-wire cable, and full screen object detection and motion tracking algorithm technology for best in class detection accuracy.
RTMS Radar. Our RTMS radar systems use radar to measure vehicle presence, volume, occupancy, speed and classification information for roadway monitoring applications. Data is transmitted to a central computer at a traffic management center via standard communication means, including wireless. Data can be processed in real time to assist in traffic management and stored for later analysis for traffic planning purposes.
RTMS radar is an integrated radar transmitter/receiver and embedded processor contained in a compact, self‑contained unit. The unit is typically situated on roadway poles and side‑fired, making it especially well-suited for highway detection applications.
The RTMS radar system is available in different varieties which include the RTMS Sx-300 and the RTMS Echo. RTMS Sx-300 is a non-intrusive radar for the detection and measurement of traffic on roadways and is currently our leading offering in both North America and the Middle East. The RTMS Sx-300 HDCAM has a high-definition camera that provides the user with visual setup confirmation, data capture and real-time traffic surveillance. The Sx-300 HDCAM has been deployed in North America for various applications such as ramp metering and wrong way driver detection. We also offer a wrong way module that interfaces with the Sx-300 HDCAM digital video stream and leverages our video detection algorithms to detect occurrences of vehicles driving in the incorrect direction. The event is captured and sent to the end users via short message service (SMS) and email in parallel with actuation or roadside or in-pavement warning systems. The RTMS Echo we launched in 2020 is the culmination of a two-year development effort resulting in best in class per-vehicle speed calculation, Wi-Fi connectivity, the ability to store 1 million individual vehicle records, and a powerful application programming interface (API) that unlocks new insights and value for our customers. Designed and tested for global applicability, the Echo will become the flagship of the RTMS product portfolio for years to come.
| 5 |
IntellitraffiQ. Our IntellitraffiQ software provides traffic measurement and data collection across large and small areas. An enterprise-level system capable of monitoring traffic in hundreds of locations, IntellitraffiQ's simple yet powerful user interface helps traffic operation centers make decisions to keep traffic flowing smoothly.
IntellitraffiQ currently is available in an on-premise system that allows traffic managers the ability to monitor their network of sensors from one screen within the traffic management center. The IntellitraffiQ maps provide an interactive map of their sensor network, while displaying data coming directly from the sensors in the field.
Distribution, Sales and Marketing
We market and sell our products globally. Together with our partners, we offer a combination of high‑performance detection technology and experienced local support. Our end users primarily consist of federal, state, city and county departments of transportation, port, highway, tunnel and other transportation authorities. The decision‑makers within these entities typically are traffic planners and engineers, who in turn often rely on consulting firms that perform planning and feasibility studies. Our products sometimes are sold directly to system integrators or other suppliers of systems and services who are operating under subcontracts in connection with major road construction contracts.
Sales of Autoscope Video in the United States, Mexico, Canada and the Caribbean. We have granted Econolite an exclusive right to manufacture, market and distribute the Autoscope video system in the United States, Mexico, Canada and the Caribbean. The agreement with Econolite grants it a first refusal right that arises when we make a proposal to Econolite to extend the license to additional products in the United States, Mexico, Canada and the Caribbean and a first negotiation right that arises when we make a proposal to Econolite to include rights corresponding to Econolite’s rights under our current agreements in countries not in these territories. Econolite provides the marketing and technical support needed for its sales in these territories. Econolite pays us a royalty on the revenue derived from its sales of the Autoscope system. We provide second‑tier technical support for Autoscope and video products. We have the right to terminate our agreements with Econolite if it does not meet minimum annual sales levels or if Econolite fails to make payments as required by the agreements. In 2008, the term of the original agreement with Econolite, as amended, was extended to 2031. The agreement can be terminated by either party upon three years’ notice.
Sales of RTMS Radar in North America, the Caribbean and Latin America. We market the RTMS radar systems to a network of distributors covering countries in North America, the Caribbean and Latin America. On a limited basis, we sell directly to the end user. We provide technical support to these distributors from our various North American locations.
Sales in Europe, Asia, the Middle East and Africa. We market our Autoscope video and RTMS radar product lines of products to a network of distributors covering countries in Europe, the Middle East, Africa and Asia through our wholly‑owned subsidiary in Spain. On a limited basis, we sell directly to the end user. Technical support to these distributors is provided by our wholly‑owned subsidiary in Spain, with second‑tier support provided by our engineering groups. From time to time, we may grant exclusive rights to Econolite for markets outside of our significant markets for certain jurisdictions or product sales based on facts and circumstances related to the opportunities.
Competition
We compete with companies that develop, manufacture and sell traffic management devices using video and radar sensing technologies as well as other above‑ground detection technologies based on laser, infrared and acoustic sensors. For ITS applications, we also compete with providers of in‑pavement loop detectors and estimate that more than 60% of the traffic management systems currently in use in the U.S. use in‑pavement loop detectors. For competition with other above‑ground detection products, we typically compete on performance and functionality, and to a lesser extent on price. When competing against providers of loop detectors, we compete principally on ease of installation and the total cost of ownership over a multi‑year period, and to a lesser extent on functionality.
Among the companies that provide direct competition to Autoscope video worldwide are Iteris, Inc., Miovision Technologies Incorporated, Wavetronix, LLC, FLIR Systems, Inc., GRIDSMART, Signal Group Inc. (Peek), Citilog S.A., Sensys Inc., and Smartmicro Inc. Among the companies that provide direct competition to RTMS radar worldwide are Wavetronix, LLC, Houston Radar, LLC, MS Sedco Inc., and Smartmicro Sensors GmbH. In addition, there are smaller local companies providing direct competition to the Company in specific markets throughout the world. We are aware that these and other companies will continue to develop technologies for use in traffic management applications. One or more of these technologies could in the future provide increased competition for our systems.
| 6 |
Manufacturing
Autoscope video products for sale under the Econolite license agreement are manufactured through agreements with Econolite. Econolite is responsible for setting warranty terms and must provide all service required under this warranty. In Europe and Asia, we engage contract manufacturers to manufacture the Autoscope family of products.
We engage E.I. Microcircuits, Inc. ("E.I. Micro") to manufacture our radar products and perform warranty and post-warranty repairs for all radar units sold.
We typically provide a two- to three-year warranty on our products.
Most of the hardware components used to manufacture our products are standard electronics components that are available from multiple sources. Although some of the components used in our products are obtained from single‑source suppliers, we believe other component vendors are available should the necessity arise. The European Parliament has enacted a directive for the restriction of the use of certain hazardous substances in electrical and electronic equipment (“RoHS”). To our knowledge, our contract manufacturing and component vendors in Europe and Asia comply with the European directive on RoHS.
Intellectual Property
To protect our rights to our proprietary know‑how, technology and other intellectual property, it is our policy to require all employees and consultants to sign confidentiality agreements that prohibit the disclosure of our confidential information to any third parties. These agreements also require disclosure and assignment to us of any discoveries and inventions made by employees and consultants while they are devoted to our business activities. We also rely on trade secret, copyright and trademark laws to protect our intellectual property. We have also entered into exclusive and non‑exclusive license and confidentiality agreements relating to our own and third‑party technologies. We aggressively protect our processes, products, and strategies as proprietary trade secrets. Our efforts to protect intellectual property and avoid disputes over proprietary rights include ongoing review of third‑party patents and patent applications.
Environmental Matters
We believe our operations are in compliance with all applicable environmental regulations within the jurisdictions in which we operate.
Employees
As of December 31, 2021, we had 36 employees, consisting of 35 employees in North America and one employee in Europe. None of our employees are represented by a union.
Information Regarding Forward‑Looking Statements
This Annual Report on Form 10‑K contains forward‑looking statements within the meaning of Section 27A of the Securities Act of 1933, as amended, and Section 21E of the Securities Exchange of 1934, as amended. Forward‑looking statements represent our expectations or beliefs concerning future events and can be identified by the use of forward‑looking words such as “believes,” “may,” “will,” “should,” “intends,” “plans,” “estimates,” or “anticipates” or other comparable terminology. Forward‑looking statements are subject to risks and uncertainties that may cause our actual results to differ materially from the results discussed in the forward‑looking statements. Some factors that might cause these differences include the factors listed below. Although we have attempted to list these factors comprehensively, we wish to caution investors that other factors may prove to be important in the future and may affect our operating results. New factors may emerge from time to time, and it is not possible to predict all of these factors, nor can we assess the effect each factor or combination of factors may have on our business.
We further caution you not to unduly rely on any forward‑looking statements because they reflect our views only as of the date the statements were made. We undertake no obligation to publicly update or revise any forward‑looking statements whether as a result of new information, future events or otherwise.
| 7 |
Risks Related to Our Business
If governmental entities elect not to use our products due to budgetary constraints, project delays or other reasons, our revenue may fluctuate severely or be substantially diminished.
Our products are sold primarily to governmental entities. We expect that we will continue to rely substantially on revenue and royalties from sales of our systems to governmental entities. In addition to normal business risks, it often takes considerable time before governmental initiated projects are developed to the point at which a purchase of our systems would be made, and a purchase of our products also may be subject to a time‑consuming approval process. Additionally, governmental budgets and plans may change without warning. Other risks of selling to governmental entities include dependence on appropriations and administrative allocation of funds, changes in governmental procurement legislation, and regulations and other policies that may reflect political developments, significant changes in contract scheduling, competitive bidding and qualification requirements, performance bond requirements, government shutdowns, intense competition for government business, and termination of purchase decisions for the convenience of the governmental entity. Substantial delays in purchase decisions by governmental entities, or governmental budgetary constraints, could cause our revenue and income to drop substantially or to fluctuate significantly between fiscal periods.
A majority of our gross profit has been generated from sales of our Autoscope family of products, and if we do not maintain the market for these products, our business will be harmed.
Historically, a majority of our gross profit has been generated from sales of, or royalties from the sales of, our Autoscope products. Gross profit from Autoscope sales accounted for approximately 82% of our gross profit in 2021 and 81% in 2020. We anticipate that gross profit from the sale of Autoscope systems will continue to account for a substantial portion of our gross profit for the foreseeable future. Any significant decline in sales of our Autoscope system would have a material adverse impact on our business, financial condition and results of operations.
If Econolite’s sales volume decreases or if it fails to pay royalties to us in a timely manner or at all, our financial results will suffer.
We have agreements with Econolite under which Econolite is the exclusive distributor of the Autoscope video system in the United States, Mexico, Canada and the Caribbean. Our current agreements grant Econolite a first refusal right that arises when we make a proposal to Econolite to extend the license to additional products in the United States, Mexico, Canada and the Caribbean. In addition, the agreements grant Econolite a first negotiation right that arises when we make a proposal to Econolite to include rights corresponding to Econolite’s rights under our current agreements in countries not in these territories. In exchange for its rights under the agreements, Econolite pays us royalties for sales of the Autoscope video system. Since 2002, a substantial portion of our revenue has consisted of royalties resulting from sales made by Econolite, including 64% in 2021 and 63% in 2020. Econolite’s account receivable represented 60% of our accounts receivable at December 31, 2021 and 78% of our accounts receivable at December 31, 2020. We expect that Econolite will continue to account for a significant portion of our revenue for the foreseeable future. Any decrease in Econolite’s sales volume could significantly reduce our royalty revenue and adversely impact earnings. A failure by Econolite to make royalty payments to us in a timely manner or at all will harm our financial condition. In addition, we believe sales of our products are a material part of Econolite’s business, and any significant decrease in Econolite’s sales of the other products it sells could harm Econolite, which could have a material adverse effect on our business and prospects.
As a result of our continuing review of our business, we may have to undertake further restructuring plans that would require additional charges, including incurring facility exit and restructuring charges.
We continue to evaluate our business, which may result in restructuring activities. We may choose to divest certain business operations based on management's assessment of their strategic value to our business, consolidate or close certain facilities or outsource certain functions. Decisions to eliminate or limit certain business operations in the future could involve the expenditure of capital, consumption of management resources, realization of losses, transition and wind-up expenses, reduction in workforce, impairment of assets, facility consolidation and the elimination of revenues along with associated costs, any of which could cause our operating results to decline and may fail to yield the expected benefits. For more information regarding our restructuring and divestiture activities in 2021 and 2020, see the discussion in Note 13 of our Notes to Consolidated Financial Statements included elsewhere in this Annual Report on Form 10-K.
The features and functions in our products have not been as widely utilized as traditional products offered by our competitors, and the failure of our end users to accept the features and functions in our products could adversely affect our business and growth prospects.
Video and radar technologies have not been utilized in the traffic management industry as extensively as other more traditional technologies, mainly in‑pavement loop detectors. Our financial success and growth prospects depend on the continued development of the market for advanced technology solutions for traffic detection and management and the acceptance of our current Autoscope video and RTMS radar systems and also future systems we may develop as reliable, cost‑effective alternatives to traditional vehicle detection systems. We cannot assure you that we will be able to utilize our technology profitably in other products or markets. If our end users do not continue to increase their acceptance of the features and functions provided by our current systems or other systems we may develop in the future, our business and growth prospects could be adversely affected.
| 8 |
Our operating costs tend to be fixed, while our revenue tends to be seasonal, thereby resulting in operating results that fluctuate from quarter to quarter.
Our expense levels are based in part on our product development efforts and our expectations regarding future revenues and, in the short‑term, are generally fixed. Our quarterly revenues, however, have varied significantly in the past, with our first quarter historically being the weakest due to weather conditions in parts of North America, Europe and Asia that make roadway construction more difficult. Additionally, our international revenues have a significant large project component, resulting in a varying revenue stream. We expect the seasonality of our revenue and the fixed nature of our operating costs to continue in the foreseeable future. Therefore, we may be unable to adjust our spending in a timely manner to compensate for any unexpected revenue shortfall. As a result, if anticipated revenues in any quarter do not occur or are delayed, our operating results for the quarter would be disproportionately affected. Operating results also may fluctuate due to factors such as the demand for our products; product life cycle; the development, introduction and acceptance of new products and product enhancements by us or our competitors; changes in the mix of distribution channels through which our products are offered; changes in the level of operating expenses; end user order deferrals in anticipation of new products; competitive conditions in the industry; and economic conditions generally. No assurance can be given that we will be able to achieve or maintain profitability on a quarterly or annual basis in the future.
Increased competition may make it difficult for us to acquire and retain end users. If we are unsuccessful in developing new applications and product enhancements, our products may become noncompetitive or obsolete.
Competition in ITS is continuing to grow. Some of the companies that may compete with us in the business of developing and implementing traffic control, related security systems and connected vehicles have substantially more financial, technological, marketing, personnel and research and development resources than we have. Therefore, they may be able to respond more quickly than we can to new or changing opportunities, technologies, standards or end user requirements. If we are unable to compete successfully with these companies, the market share for our products will decrease, and competitive pressures may seriously harm our business.
Additionally, the market for vehicle detection is continuously seeking more advanced technological solutions to problems. Technologies such as embedded loop detectors, pressure plates, pneumatic tubes, radars, lasers, magnetometers, acoustics and microwaves that have been used as traffic sensing devices in the past are being enhanced for use in the traffic management industry, and new technologies may be developed. We are aware of several companies that are developing traffic management devices using machine vision technology or other advanced technology. Floating vehicle and/or radio frequency identification (RFID) tagged license plate initiatives are under consideration and may be implemented. We expect to face increasingly competitive product developments, applications and enhancements. New technologies or applications in traffic control systems from other companies or the development of new and emerging technologies and applications, including vehicle-to-vehicle (V2V) communications, mobile applications, and new algorithms or sensor technologies, may provide our end users with alternatives to our products and could render our solutions noncompetitive or obsolete. If we are unable to increase the number of our applications and develop and commercialize product enhancements and applications in a timely and cost-effective manner that respond to changing technology and satisfy the needs of our end users, our business and financial results will suffer.
We may not achieve our growth plans for the expansion of our business.
In addition to market penetration, our long‑term success depends on our ability to expand our business through new product development, mergers and acquisitions, and/or geographic expansion.
New product development would require that we maintain our ability to improve existing products, continue to bring innovative products to market in a timely fashion, and adapt products to the needs and standards of current and potential customers. Our products and services may become less competitive or eclipsed by technologies to which we do not have access or which render our solutions obsolete.
Geographic expansion would be primarily outside of the U.S. and hence will be disproportionately subject to the risks of international operations discussed in this Annual Report on Form 10-K.
Mergers and acquisitions would be accompanied by risks which may include:
● difficulties identifying suitable acquisition candidates at acceptable costs;
● unavailability of capital to conduct acquisitions;
● failure to achieve the financial and strategic goals for the acquired and combined businesses;
● difficulty assimilating the operations and personnel of the acquired businesses;
● disruption of our ongoing business and distraction of management from the ongoing business;
● dilution of existing shareholders and earnings per share;
● unanticipated, undisclosed or inaccurately assessed liabilities, legal risks and costs; and
● difficulties retaining our key vendors, customers or employees or those of the acquired business.
| 9 |
In addition, acquisitions of businesses having a significant presence outside the U.S. will increase our exposure to the risks of international operations discussed in this Annual Report on Form 10-K.
Our dependence on third parties for manufacturing and marketing our products may prevent us from meeting customers’ needs in a timely manner.
We do not have, and do not intend to develop in the near future, internal capabilities to manufacture our products. We have entered into agreements with Econolite to manufacture the Autoscope system and with E.I. Microcircuits, Inc. to manufacture the RTMS radar products and related products for sales in the United States, Mexico, Canada and the Caribbean. We work with suppliers, most of whom are overseas, to manufacture the rest of our products. Due to the coronavirus, or COVID-19, pandemic, which the World Health Organization declared in March 2020, some of our suppliers have expressed concern about lead times and availability of components, especially those components coming out of Asia. We have been assessing our inventory positions and taking actions to minimize any disruptions to our supply chain, although such actions may not be successful. There are a number of risks associated with our dependence on contract manufacturers, including reduced control over delivery schedules; reliance on the quality assurance procedures of third parties; potential uncertainty regarding manufacturing yields and costs; potential lack of adequate capacity during periods of high demand; limited warranties on components; potential misappropriation of our intellectual property; and potential manufacturing disruptions (including disruptions caused by geopolitical events, war or military actions, work stoppages, natural disasters or international health emergencies such as the COVID-19 pandemic). If Econolite, E.I. Microcircuits, Inc., or our other suppliers are unable to manufacture our products in the future, we may be unable to identify other manufacturers able to meet product and quality demands in a timely manner or at all. Our inability to find suitable manufacturers for our products could result in delays or reductions in product shipments, which in turn may harm our business reputation and results of operations. In addition, we have granted Econolite the exclusive right to market the Autoscope video system and related products in the United States, Mexico, Canada and the Caribbean. Consequently, our revenue depends to a significant extent on Econolite’s marketing efforts. Econolite’s inability to effectively market the Autoscope video system, or the disruption or termination of that relationship, could result in reduced revenue and market share for our products.
We and our third-party manufacturers may experience difficulty obtaining materials or components for our products, or the cost of materials or components may increase, either of which may prevent us from meeting customers’ needs in a timely manner and could therefore reduce our sales.
Although substantially all of the hardware components incorporated into our products are standard electronics components that are available from multiple sources, we and our third-party manufacturers obtain some of the components from a single source. Some materials or components may become scarce or difficult to obtain in the market or they may increase in price, especially with the inflationary pressures that have recently emerged in the global economies. This could force us or our manufacturers to identify new suppliers, which could increase our costs, affect the quality of materials, reduce our sales and profitability, or harm our customer relations by delaying product deliveries due to increased lead times, any of which could harm our business. For example, the COVID-19 pandemic and other factors have caused and may continue to cause disruptions of the global and more local supply chains for certain components necessary for our products, and we do not know the magnitude of or how long any such impact may continue.
Regulations related to the use of conflict‑free minerals may increase our costs and cause us to incur additional expenses.
The Dodd‑Frank Wall Street Reform and Consumer Protection Act contains provisions to improve the transparency and accountability of the use by public companies in their products of minerals mined in certain countries and to prevent the sourcing of such “conflict” minerals. As a result, the Securities and Exchange Commission enacted annual disclosure and reporting requirements for public companies who use these minerals in their products, which apply to us. Under the rules, we are required to conduct due diligence to determine the source of any conflict minerals used in our products. Although we expect to file the required report on a timely basis, our supply chain is broad‑based and complex, and we may not be able to easily verify the origins for all minerals used in our products. To the extent that any information furnished to us by our suppliers is inaccurate or inadequate, we could face reputational and enforcement risks. In addition, the conflict mineral rules could reduce the number of suppliers who provide components and products containing conflict‑free minerals and thus could disrupt our supply chain or that of our manufacturers and increase the cost of the components used in manufacturing our products and the costs of our products to us. Any increased costs and expenses could have a material adverse impact on our financial condition and results of operations.
Some of our products are covered by our warranties and, if the cost of fulfilling these warranties exceeds our warranty allowance, it could adversely affect our financial condition and results of operations.
Unanticipated warranty and other costs for defective products could adversely affect our financial condition and results of operations and our reputation. We generally provide a two- to three-year warranty on our product sales. These warranties require us to repair or replace faulty products, among other customary warranty provisions. Although we monitor our warranty claims and provide an allowance for estimated warranty costs, unanticipated claims in excess of the allowance could have a material adverse impact on our financial condition and results of operations. Additionally, we rely on our third-party manufacturers to fulfill our warranty repair obligations to our customers. Adverse changes in these parties’ abilities to perform these repairs could cause a delay in repairs or require us to source other parties to perform the repairs and could adversely affect impact our financial condition and results of operations. In addition, the need to repair or replace products with design or manufacturing defects could adversely affect our reputation.
| 10 |
We may face increased competition if we fail to adequately protect our intellectual property rights because of challenges to or misappropriations of our intellectual property rights, and any efforts to protect our intellectual property rights may result in costly litigation.
Our success depends in large measure on the protection of our proprietary technology rights. We rely on trade secret, copyright and trademark laws, confidentiality agreements with employees and third parties, and patents, all of which offer only limited protection. We cannot assure you that the scope of these protective measures will exclude competitors or provide competitive advantages to us. We also cannot assure you that we will become aware of all instances in which others develop similar products, duplicate any of our products, or reverse engineer or misappropriate our proprietary technology. If our proprietary technology is misappropriated, our business and financial results could be adversely affected. Litigation may be necessary in the future to enforce our intellectual property rights, to protect our trade secrets or to determine the validity and scope of the proprietary rights of others. In addition, we may be the subject of lawsuits by others who claim we violate their intellectual property rights.
Intellectual property litigation is very costly and could result in substantial expense and diversions of our resources, either of which could adversely affect our business and financial condition and results of operations. In addition, there may be no effective legal recourse against infringement of our intellectual property by third parties, whether due to limitations on enforcement of rights in foreign jurisdictions or as a result of other factors.
We have not applied for patent protection in all countries in which we market and sell our products. Consequently, our proprietary rights in the technology underlying our systems in countries other than the U.S. will be protected only to the extent that trade secret, copyright or other non‑patent protection is available and to the extent we are able to enforce our rights. The laws of other countries in which we market our products may afford little or no effective protection of our proprietary technology, which could harm our business.
We plan to continue introducing new products and technologies and may not realize the degree or timing of benefits we initially anticipated, which could adversely affect our business and results of operations.
We regularly invest substantial amounts in research and development efforts that pursue advancements in a range of technologies, products and services. Our ability to realize the anticipated benefits of these advancements depends on a variety of factors, including meeting development, production, certification and regulatory approval schedules; the execution of internal and external performance plans; the availability of supplier‑produced parts and materials; the performance of suppliers and vendors; achieving cost efficiencies; the validation of innovative technologies; and the level of end user interest in new technologies and products. These factors involve significant risks and uncertainties. We may encounter difficulties in developing and producing these new products and may not realize the degree or timing of benefits initially anticipated. In particular, we cannot predict with certainty whether, when or in what quantities our current or potential end users will have a demand for products currently in development or pending release. Moreover, as new products are announced, sales of current products may decrease as end users delay making purchases until such new products are available. Any of the foregoing could adversely affect our business and results of operations.
Our business could be adversely affected by product liability and commercial litigation.
Our products or services may be claimed to cause or contribute to personal injury or property damage to our customers’ employees or facilities. Additionally, we are, at times, involved in commercial disputes with third parties, such as customers, distributors, vendors and others. See Item 3 and Note 15 of our Notes to Consolidated Financial Statements included elsewhere in this Annual Report on Form 10-K. The ensuing claims may arise singularly, in groups of related claims, or in class actions involving multiple claimants. Such claims and litigation are frequently expensive and time‑consuming to resolve and may result in substantial liability to us, which liability and related costs and expenses may not be recoverable through insurance or any other forms of reimbursement.
Our business could be affected by various legal and regulatory compliance risks, including those involving antitrust, environmental, anti-bribery or anti-corruption laws and regulations.
We are subject to various legal and regulatory requirements and risks in the U.S. and other countries in which we have facilities or sell our products involving compliance with antitrust, environmental, anti-bribery and anti-corruption laws and regulations, including the U.S. Foreign Corrupt Practices Act and the U.K. Anti-Bribery Act. Although we have adopted internal policies and procedures with the intention of assuring compliance with these laws and regulations, our employees, contractors, agents and licensees involved in our international sales may take actions in violation of such policies. Any future adverse development, ruling or settlement could result in charges that could have an adverse effect on our results of operations or cash flows.
| 11 |
We price a segment of our product portfolio at a premium compared to other technologies. As such, we may not be able to quickly respond to emerging low‑cost competitors, and our inability to do so could adversely affect revenue and profitability.
We price a segment of our product portfolio at a premium as compared to products using less sophisticated technologies. As the technological sophistication of our competitors and the size of the market increase, competing low‑cost developers of machine vision products for traffic are likely to emerge and grow stronger. If end users prefer low‑cost alternatives over our products, our revenue and profitability could be adversely affected.
Our revenue could be adversely affected by the emergence of local competitors and local biases, especially in international markets.
Our experience indicates that local officials that purchase traffic management products in the international markets we serve often favor products that are developed and manufactured locally. As local competitors to our products emerge, local biases could erode our revenue in Europe, Asia and elsewhere and adversely affect our sales and revenue in those markets.
We sell our products internationally and are subject to various risks relating to such international activities, which could harm our international sales and profitability.
Sales outside of the United States, including export sales from our U.S. business locations, accounted for approximately 13% of our total revenue in 2021 and 16% of our total revenue in 2020. By doing business in international markets, we are exposed to risks separate and distinct from those we face in our U.S. operations. Our international business may be adversely affected by changing political and economic conditions in foreign countries. Additionally, fluctuations in currency exchange rates could affect demand for our products or otherwise negatively affect profitability. Engaging in international business inherently involves a number of other difficulties and risks, including:
• export restrictions and controls relating to technology;
• pricing pressure that we may experience internationally;
• exposure to the risk of currency value fluctuations where payment for products is denominated in a currency other than U.S. dollars;
• variability in the U.S. dollar value of foreign currency‑denominated assets, earnings and cash flows;
• required compliance with existing and new foreign regulatory requirements and laws, including the General Data Protection Regulation (GDPR) in the European Union and similar laws in other jurisdictions;
• evolving foreign events, including the effect of the United Kingdom's withdrawal from the European Union, may adversely affect our revenues and could subject us to new regulatory costs and challenges (including the transfer of personal data between the European Union and the United Kingdom and new customer requirements), in addition to other adverse effects that we are unable to effectively anticipate;
• laws and business practices favoring local companies;
• longer payment cycles;
• difficulty of enforcing agreements, including patent and trademarks, and collecting receivables through foreign legal systems;
• disputes with parties outside of the U.S., which may be more difficult, expensive and time-consuming to resolve than disputes with parties located in the U.S.;
• political and economic instability, including volatility in the economic environment of the United Kingdom and the European Union;
• tax rates in certain foreign countries that exceed those in the U.S. and the imposition of withholding requirements on foreign earnings;
• higher danger of terrorist activity, war or civil unrest compared to domestic operations;
| 12 |
• disruptions to our global and more local supply chains, including disruptions caused by geopolitical events, war and other military actions, work stoppages, natural disasters, or international health emergencies, such as the COVID-19 pandemic;
• difficulties and costs of staffing and managing foreign operations; and
• difficulties in enforcing intellectual property rights.
Our exposure to each of these risks may increase our costs, lengthen our sales cycle and require significant management attention. One or more of these factors may harm our business.
We are subject to certain data privacy regulations, which expose us to certain risks if we do not comply with these requirements.
As a U.S. entity with global business, we are subject to regulatory compliance requirements under the European Union GDPR that require our business to comply with security and privacy controls to protect personal data and privacy of European Union citizens for transactions that occur within European Union member states and similar laws in other countries. A failure to comply with these requirements could negatively impact our business and financial condition. In addition, similar regulations regarding data protection and privacy rights are emerging in the U.S., such as California, and have the potential to negatively impact our business and financial condition.
Changes in U.S. trade policies may adversely impact our business and financial results.
The Company’s operations and performance depend significantly on global, regional and U.S. economic and geopolitical conditions. In recent years, there have been significant changes to U.S. trade policies, legislation, treaties and tariffs, as well as trade policies and tariffs affecting China. These and any other changes to current policies by the U.S. government could affect our business, including potentially through increased import tariffs and other influences on U.S. trade relations with China and other countries. The imposition of tariffs or other trade barriers could increase our costs in certain markets and may cause our customers to find alternative sourcing. In addition, other countries may change their own policies on business and foreign investment in companies in their respective countries. Additionally, it is possible that U.S. policy changes and uncertainty about such changes could increase market volatility and currency exchange rate fluctuations. Market volatility and currency exchange rate fluctuations could have a material adverse effect on our business, financial condition, results of operations or cash flows.
Our inability to comply with European and Asian regulatory restrictions over hazardous substances and electronic waste could restrict product sales in those markets and reduce profitability in the future.
The European Union’s Waste Electrical and Electronic Equipment (“WEEE”) directive makes producers of electrical goods financially responsible for specified collection, recycling, treatment and disposal of past and future covered products. This directive must be enacted and implemented by individual European Union governments, and certain producers will be financially responsible under the WEEE legislation. This may impose requirements on us, which, if we are unable to meet them, could adversely affect our ability to market our products in European Union countries, and our sales revenues and profitability would suffer as a consequence. In addition, the European Parliament has enacted a directive for the restriction of the use of certain hazardous substances in electrical and electronic equipment. This RoHS legislation restricts the use of substances such as mercury, lead, cadmium and hexavalent cadmium. If we are unable to have our products manufactured in compliance with the RoHS directive, we would be unable to market our products in European Union countries, and our revenues and profitability would suffer. In addition, various Asian governments could adopt their own versions of environment‑friendly electronic regulations similar to the European directives, RoHS and WEEE. This could require new and unanticipated manufacturing changes, product testing and certification requirements, thereby increasing cost, delaying sales and lowering revenue and profitability.
Our inability to manage growth effectively could seriously harm our business.
Growth and expansion of our business could significantly strain our capital resources as well as the time and abilities of our management personnel. Our ability to manage growth effectively will require continued improvement of our operational, financial and management systems and the successful training, motivation and management of our employees. If we are unable to manage growth successfully, our business and operating results will suffer.
| 13 |
Our business operations will be severely disrupted if we lose key personnel or if we fail to attract and retain qualified personnel.
Our technology depends upon the knowledge, experience and skills of our key management and scientific and technical personnel. Additionally, our ability to continue technological developments and to market our products, and thereby develop a competitive edge in the marketplace, depends in large part on our ability to attract and retain qualified scientific and technical personnel. Competition for qualified personnel is intense, and we cannot assure you that we will be able to attract and retain the individuals we need, especially if our business expands and requires us to employ additional personnel. In addition, the loss of personnel or our failure to hire additional personnel could materially and adversely affect our business, operating results and ability to expand. The loss of key personnel, or our inability to hire and retain qualified personnel, would harm our business.
We may not be successful in integrating any acquired companies into our business, which could materially and adversely affect our financial condition and operating results.
Part of our business strategy has been to acquire or invest in companies, products or technologies that complement our current products, enhance our market coverage or technical capabilities or offer growth opportunities. For any acquisition, a significant amount of management’s time and financial resources may be required to complete the acquisition and integrate the acquired business into our existing operations. Even with this investment of management time and financial resources, an acquisition may not produce the revenue, earnings or business synergies anticipated. Acquisitions involve numerous other risks, including the assumption of unanticipated operating problems or legal liabilities; problems integrating the purchased operations, technologies or products; the diversion of management’s attention from our core businesses; restrictions on the manner in which we may use purchased companies or assets imposed by acquisition agreements; adverse effects on existing business relationships with suppliers and customers; incorrect estimates made in the accounting for acquisitions and amortization of acquired intangible assets that would reduce future reported earnings (such as goodwill impairments); ensuring acquired companies’ compliance with the requirements of the U.S. federal securities laws and accounting rules; and the potential loss of customers or key employees of acquired businesses. We cannot assure you that any acquisitions, investments, strategic alliances or joint ventures will be completed or integrated in a timely manner or achieve anticipated synergies, will be structured or financed in a way that will enhance our business or creditworthiness, or will meet our strategic objectives or otherwise be successful.
We may be required to recognize impairment charges for long‑lived assets.
As of December 31, 2021, the net carrying value of our long‑lived assets (property and equipment, deferred tax assets and other intangible assets) totaled approximately $10.0 million. In accordance with U.S. generally accepted accounting principles (GAAP), we periodically assess these assets to determine if they are impaired. Significant negative industry or economic trends, a significant and sustained decline in our stock price, disruptions to our businesses, significant unexpected or planned changes in our use of assets, divestitures and market capitalization declines may result in impairments to our goodwill and other long‑lived assets. Future impairment charges could significantly affect our results of operations in the periods recognized.
Our stock is thinly traded, and our stock price is volatile.
Our common stock is thinly traded, with 3,950,867 shares of our 5,378,857 outstanding shares held by non‑affiliates as of February 28, 2022. Based on the trading history of our common stock and the nature of the market for publicly traded securities of companies in evolving high‑tech industries, we believe there are several factors that have caused and are likely to continue to cause the market price of our common stock to fluctuate substantially. The fluctuations may occur on a day‑to‑day basis or over a longer period of time. Factors that may cause fluctuations in our stock price include announcements of large orders obtained by us or our competitors, substantial cutbacks in government funding of highway projects or of the potential availability of alternative technologies for use in traffic control and safety, quarterly fluctuations in our financial results or the financial results of our competitors, consolidation among our competitors, fluctuations in stock market prices and volumes, and the volatility of the stock market.
Rising interest rates may affect our ability to obtain financing and may cause us to suffer competitive disadvantages.
The Company’s exposure to changes in interest rates relates primarily to the Company’s ability to obtain financing in the future. If obtaining financing is adversely affected by rising interest rates or other factors, it could make it more difficult or expensive for us to obtain financing, which in turn would adversely affect our ability to take advantage of significant business opportunities and to react to changes in market or industry conditions.
| 14 |
The transition away from LIBOR may adversely affect our cost to obtain financing.
Central banks around the world, including the Board of Governors of the Federal Reserve, have commissioned working groups of market participants and official sector representatives with the goal of finding suitable replacements for the London Interbank Offered Rate (“LIBOR”) based on observable market transactions. The U.K. Financial Conduct Authority (FCA), which regulates LIBOR, has announced that it has commitments from panel banks to continue to contribute to LIBOR through the end of 2021, but that it will not use its powers to compel contributions beyond such date. In response, the Alternative Reference Rate Committee ("ARRC") convened to study potential replacement rates to be used as benchmarks. The ARRC has identified the Secured Overnight Financing Rate ("SOFR") as a potential successor rate to LIBOR and published its Paced Transition Plan to encourage the adoption of SOFR. However, there are some key technical and conceptual differences between LIBOR and SOFR.
At this time, there is no consensus as to which rates may become acceptable alternatives to LIBOR. The Federal Reserve Bank of New York and various other authorities have commenced the publication of reforms and actions relating to alternatives to U.S. dollar LIBOR. Although the full impact of such reforms and actions, together with the transition away from LIBOR, remains unclear, these changes may have a material adverse impact on the availability of financing to us and on our financing costs.
Difficult and volatile conditions in the capital, credit and commodities markets and in the overall economy could adversely affect our financial position, results of operations and cash flows, and we do not know if these conditions will improve in the near future.
Our financial position, results of operations and cash flows could be adversely affected by difficult conditions and significant volatility in the capital, credit and commodities markets and in the overall worldwide economy. The COVID-19 pandemic and resulting disruptions in supply chains, inflation, and rising interest rates are having a negative effect on economies and the performance of stock markets. Although certain economic conditions in the United States have improved, economic growth has been slow and uneven. During economic downturns, governmental entities in particular, which constitute most of our end users, reduce or delay their purchase of our products, which has had and may continue to have an adverse effect on our business. Any uncertainty about the federal budget in the U.S. could have a negative effect on the U.S. and global economy. The continuing impact that these factors might have on us and our business is uncertain and cannot be estimated at this time. Current economic conditions, including the intermittent volatility in the stock market caused by the COVID-19 pandemic, inflation, and rising interest rates, have accentuated each of these risks and magnified their potential effect on us and our business. The difficult conditions in these markets and the overall economy affect our business in a number of ways. For example:
| • | Although we believe we have sufficient liquidity to run our business, under extreme market conditions, there can be no assurance that financing, if needed, would be available or sufficient, and, in such a case, we may not be able to successfully obtain financing on favorable terms, or at all. | |
| • |
Continuing market volatility has exerted downward pressure on our stock price, which could make it more difficult or unfavorable for us to raise additional capital in the future. | |
| • |
Economic conditions could result in customers in our markets continuing to experience financial difficulties, including limited liquidity and their inability to obtain financing or electing to limit spending because of the economy which may result, for example, in customers’ inability to pay us at all or on a timely basis and in declining tax revenue for our customers that are governmental entities, which in turn could result in decreased sales and earnings for us. |
We do not know if market conditions or the state of the overall economy will improve in the near future, when improvement will occur or if any improvement will benefit our market segment.
Our operations may be adversely affected by cybersecurity risks, and we may incur increasing costs in an effort to minimize those risks.
Although we take steps to secure our management information systems, the security measures we have implemented may not be effective, and our systems may be vulnerable to theft, loss, damage and interruption from a number of potential sources and events, including unauthorized access or security breaches, natural or man-made disasters, cyberattacks, computer viruses, power loss, or other disruptive events. We may not have the resources or technical sophistication to anticipate or prevent rapidly evolving types of cyberattacks. Attacks may be targeted at us, our customers and suppliers, or others who have entrusted us with information.
Actual or anticipated attacks may cause us to incur increasing costs, including costs to deploy additional personnel and protection technologies, train employees and engage third-party experts and consultants, or in connection with the notifications to employees, suppliers or the general public as part of our notification obligations to the various governmental agencies that govern our business. Advances in computer capabilities, new technological discoveries, or other developments may result in the breach or compromise of technology used by us to protect transaction or other data. Our reputation, brand and financial condition could be adversely affected if, as a result of a significant cyber event or other security issues, our operations are disrupted or shut down; our confidential, proprietary information is stolen or disclosed; we must dedicate significant resources to system repairs or increased cyber security protection; or we otherwise incur significant litigation or other costs.| 15 |
Risks Related to the Coronavirus, or COVID-19, Pandemic
The coronavirus, or COVID-19, pandemic has caused, and could continue to cause, severe disruptions in the U.S., regional and global economies and could increase our costs and expenses and have a material adverse effect on our business, financial condition and results of operations.
In December 2019, the outbreak of a novel strain of coronavirus, called COVID-19, originated in Wuhan, China, and has since spread worldwide, including to the U.S. To date, the COVID-19 pandemic has caused widespread disruptions to the U.S. and global economy and has contributed to significant volatility and negative pressure in financial markets. The global impact of the outbreak is continually evolving and, as additional cases of the virus are identified, many countries, including the U.S., have reacted by instituting quarantines, restrictions on travel, and mandatory closures of businesses. Certain states and cities, including where we or the third parties with whom we engage operate, have also reacted by instituting quarantines, restrictions on travel, “stay at home” rules, restrictions on types of business that may continue to operate, and restrictions on the types of construction projects that may be undertaken.
Although the COVID-19 restrictions imposed have been eased in many cases, the extent to which the COVID-19 pandemic impacts our business, financial condition and results of operations will depend on future developments, which are highly uncertain and cannot be predicted with any confidence, including the scope, severity and duration of the pandemic; the actions taken to contain the pandemic or mitigate its impact, including the adoption, effectiveness, and availability of COVID-19 vaccines; the effect of any relaxation of current restrictions in the community and regions in which we, our customers and end users do business; the direct and indirect economic effects of the pandemic and containment measures; and the emergence of any additional COVID-19 variants. The rapid development and fluidity of this situation precludes any prediction as to the full adverse impact of the COVID-19 pandemic. Nevertheless, the COVID-19 pandemic has affected, and may continue to adversely affect, our business, financial condition and results of operations, and it has had, and probably will continue to have, the effect of exacerbating many of the risks described in this Annual Report on Form 10-K including, but not limited to, the following:
- We currently rely on third parties to, among other things, manufacture, supply and market our products and supply other goods and services to run our business. If any such third party is adversely impacted by restrictions resulting from the COVID-19 pandemic, including staffing shortages, production slowdowns, the closure of facilities, and disruptions in delivery systems, our supply chain may be disrupted, which could limit our ability to manufacture our products and conduct research and development.
- We have established a hybrid work-from-home policy for all employees, other than those who are performing or supporting business-critical operations or other essential activities. Our increased reliance on personnel working from home has not negatively impacted productivity or disrupted, delayed or otherwise adversely impacted our business.
- The trading price for our common stock have been highly volatile as a result of the COVID-19 pandemic. As a result, we may face difficulties raising capital through any sales of our common stock, or such sales may be on unfavorable terms. In addition, a recession, depression or other sustained adverse market event resulting from the COVID-19 pandemic or other factors could materially and adversely affect our business and the value of our common stock.
Provisions of our articles of incorporation and bylaws and applicable provisions of Minnesota law may delay or discourage transactions involving an actual or potential change in our control or change in our management, including transactions in which shareholders might otherwise receive a premium for their shares or transactions that our shareholders might otherwise deem to be in their best interests. These provisions:
| • | permit the Autoscope Board of Directors to issue up to 4,950,000 shares of preferred stock with any rights, preferences and privileges as it may designate, including the right to approve an acquisition or other change in our control; | |
| • |
provide that the authorized number of directors may be increased by resolution of the Board of Directors; | |
| • |
provide that all vacancies, including newly‑created directorships, may, except as otherwise required by law, be filled by the affirmative vote of a majority of directors then in office, even if less than a quorum; and | |
| • | eliminate cumulative voting rights, therefore allowing the holders of a majority of the shares of common stock entitled to vote in any election of directors to elect all of the directors standing for election, if they should so choose. |
| 16 |
Section 302A.671 of the Minnesota Business Corporation Act (“MBCA”) generally limits the voting rights of a shareholder acquiring a substantial percentage of Autoscope's voting shares in an attempted takeover or otherwise becoming a substantial shareholder of our company unless holders of a majority of the voting power of all outstanding shares and the disinterested shares approve full voting rights for the substantial shareholder. Section 302A.673 of the MBCA generally limits Autoscope's ability to engage in any business combination with certain persons who own 10% or more of our outstanding voting stock or any of Autoscope's associates or affiliates who at any time in the past four years have owned 10% or more of Autoscope's outstanding voting stock. These provisions of the MBCA may have the effect of entrenching our management team and may deprive shareholders of the opportunity to sell their shares to potential acquirers at a premium over prevailing market prices. This potential inability to obtain a control premium could reduce the price of Autoscope's common stock.
In addition, in June 2013, we adopted a shareholder rights plan and declared a dividend to our shareholders of one preferred share purchase right for each outstanding share of common stock. We adopted amendments to the shareholder rights plan, which were approved by our shareholders, to preserve the value of certain deferred tax benefits to the Company, including those generated by net operating losses, until June 4, 2022. In July 2021, as a result of the Reorganization, the Autoscope Board of Directors adopted an amended and restated shareholders rights plan. Effective March 1, 2022, the Board of Directors adopted an amendment to the shareholders rights plan to extend terms of the plan to June 4, 2024, which is subject to shareholder approval at the shareholder meeting, scheduled for May 2022. Generally, the shareholder rights plan, as amended, provides that if a person or group acquires 4.99% or more of the outstanding shares of common stock of Autoscope, subject to certain exceptions and under certain circumstances, the rights may be exchanged by Autoscope for common stock or the holders of the rights, other than the acquiring person or group, could acquire additional shares of Autoscope's capital stock at a discount of the then current market price. Such exchanges or exercise of rights could cause substantial dilution to a particular acquirer and discourage the acquirer from pursuing the Company. The mere existence of a shareholder rights plan often delays or makes a merger, tender offer or other acquisition more difficult to complete.
We can issue shares of preferred stock without shareholder approval, which could adversely affect the rights of common shareholders.
Our articles of incorporation permit the Autoscope Board of Directors to establish the rights, privileges, preferences and restrictions, including voting rights, of future series of Autoscope's preferred stock and to issue such stock without approval from Autoscope's shareholders. The rights of holders of our common stock may suffer as a result of the rights granted to holders of preferred stock that may be issued in the future. In addition, Autoscope could issue preferred stock to prevent a change in control of our Company, depriving common shareholders of an opportunity to sell their stock at a price in excess of the prevailing market price.
Although we commenced paying dividends on our common stock in May 2021, any future payment of dividends is subject to the approval and discretion of the Autoscope Board of Directors.
We began to pay cash dividends on our common stock in May 2021, and we currently anticipate declaring and paying cash dividends on our common stock in the foreseeable future. Any payment of cash dividends on our common stock will be subject to the approval of and at the discretion of the Autoscope Board of Directors and will depend upon our operating results, earnings, current and anticipated cash needs, capital requirements, financial condition, future prospects, any contractual restrictions and any other factors deemed relevant by the Board of Directors. Therefore, shareholders should not expect to receive regular dividend income from shares of our common stock.
| 17 |
None.
On August 27, 2021 ISNS and TJ&Z Family Limited Partnership, a Minnesota limited partnership ("TJ&Z"), entered into a Purchase Agreement (the "Original Agreement") under which ISNS purchased certain and real personal property (the "Property") from TJ&Z for a total purchase price of $2,050,000, subject to adjustment if certain conditions were not satisfied (the "Purchase Price"). The Property includes land and a building located at 1115 Hennepin Avenue, Minneapolis, Minnesota (the "Real Property"). The Original Agreement also provided for the sale by TJ&Z to ISNS of all TJ&Z's interest under a billboard lease for a billboard located on the Real Property, business records related to the Real Property, and certain personal property located on the Real Property, all as described in the Original Agreement. The Original Agreement gave ISNS 60 days after the effective date (the "Inspection Period") during which to undertake any studies, tests, and investigations of the Property. On November 4, 2021, ISNS and TJ&Z entered into the First Amendment to Purchase Agreement (the "First Amendment") that extended the Inspection Period from October 26, 2021 to November 26, 2021. (The Original Agreement, as amended by the First Amendment, is referred to as the "Purchase Agreement"). The First Amendment effectively extended the closing date to December 13, 2021 and required ISNS to pay $50,000 in earnest money in addition to the $50,000 in earnest money already paid by ISNS under the Original Agreement. On December 10, 2021, ISNS closed (the "Closing") on the purchase of the Property under the terms of the Purchase Agreement and a loan in the original principal amount of $1,742,500 (the "Loan") from Coulee Bank to ISNS to finance the purchase of the Property. In addition to the $100,000 in earnest money paid by ISNS as described above and the $1,742,500 in Loan proceeds, at the Closing, ISNS paid $230,119 to finance the purchase of the Property and the payment of Closing costs. ISNS fully occupied the Property in February 2022.
We continue to lease and partially occupy approximately 15,962 square feet in our former headquarters at 400 Spruce tree Centre, 1600 University Avenue West, St. Paul, Minnesota 55104. In July 2021, we entered into an amendment to the lease for this space which extended the term of the lease to March 2022. ISNS intends to terminate the lease for our St. Paul space in March 2022. We also lease smaller facilities in Canada and Spain.
We believe that our current space at 1115 Hennepin Avenue in Minneapolis, Minnesota and in Canada and Spain is generally adequate to meet our current expected needs.
We are involved from time to time in various legal proceedings arising in the ordinary course of our business, including primarily commercial, product liability, employment and intellectual property claims. In accordance with United States generally accepted accounting principles, we record a liability in our Consolidated Financial Statements with respect to any of these matters when it is both probable that a liability has been incurred and the amount of the liability can be reasonably estimated. With respect to any currently pending legal proceedings, we have not established an estimated range of reasonably possible additional losses either because we believe that we have valid defenses to claims asserted against us or the proceeding has not advanced to a stage of discovery that would enable us to establish an estimate. We currently do not expect the outcome of these matters to have a material effect on our consolidated results of operations, financial position or cash flows. Litigation, however, is inherently unpredictable, and it is possible that the ultimate outcome of one or more claims asserted against us could adversely impact our results of operations, financial position or cash flows. We expense legal costs as incurred.
Not applicable.
| 18 |
Market Information
Our common stock is traded on The Nasdaq Capital Market under the symbol “AATC.”
Shareholders
As of February 28, 2022, there were 25 holders of record of our common stock. The number of holders of record is based upon the actual number of holders registered at such date and does not include holders of shares in “street names” or persons, partnerships, associates, corporations, or other entities identified in security position listings maintained by depositories.
Dividends
On April 28, 2021, the Board of Directors of the Company approved a cash dividend of $0.12 per share to shareholders of record on the close of business on May 10, 2021, which was paid to shareholders on May 20, 2021.
On August 10, 2021, the Board of Directors of the Company approved a cash dividend of $0.12 per share to shareholders of record on the close of business on August 23, 2021, which was paid to shareholders on August 30, 2021.
On November 9, 2021, the Board of Directors of the Company approved a cash dividend of $0.12 per share to shareholders of record on the close of business on November 22, 2021, which is payable to shareholders on November 29, 2021.
On February 2, 2022, the Board of Directors of the Company approved a cash dividend of $0.12 per share to shareholders of record on the close of business on February 21, 2022, which was payable to shareholders on February 28, 2022.
| 19 |
The following discussion and analysis of our financial condition and results of operations should be read in conjunction with the Selected Financial Data and our Consolidated Financial Statements and the accompanying Notes to Consolidated Financial Statements included elsewhere in this Annual Report on Form 10-K. Our actual results could differ materially from those anticipated in the forward‑looking statements included in this discussion as a result of certain factors, including, but not limited to, those discussed in “Risk Factors” included elsewhere in this Annual Report on Form 10-K.
General. We are a leading provider of above-ground detection products and solutions for the intelligent transportation systems ("ITS") industry. Our family of products, which we market as Autoscope video or video products and RTMS radar or radar products ("RTMS"), provides end users with the tools needed to optimize traffic flow and enhance driver safety. Our technology analyzes signals from sophisticated sensors and transmits the information to management systems and controllers or directly to users. Our products provide users with complete solutions for the intersection and transportation markets.
Our technology is a process in which software, rather than humans, examines outputs from various types of sophisticated sensors to determine what is happening in a field of view. In the ITS industry, this process is a critical component of managing congestion and traffic flow. In many cities, it is not possible to build roads, bridges and highways quickly enough to accommodate the increasing congestion levels. During 2020, congestion levels decreased significantly as a result of COVID-19 related government lockdowns, although automobile travel has rebounded in many areas, causing congestion levels to begin returning to previous levels (per INRIX 2020 Global Traffic scorecard). In 2021, on average, United States commuters lost 36 hours a year in congestion, which costs an average of $564 per driver in wasted time (per INRIX 2021 Global Traffic scorecard). We believe this growing use of vehicles will make our ITS solutions increasingly necessary to complement existing and new roadway infrastructure to manage traffic flow and optimize throughput.
We believe our solutions are technically superior to those of our competitors because they have a higher level of accuracy, limit the occurrence of false detection, are generally easier to install with lower costs of ownership, work effectively in a multitude of light and weather conditions, and provide end users the ability to manage inputs from a variety of sensors for a number of tasks. It is our view that the technical advantages of our products make our solutions well suited for use in ITS markets.
We believe the strength of our distribution channels positions us to increase the penetration of our technology‑driven solutions in the marketplace. We market our Autoscope video products in the United States, Mexico, Canada and the Caribbean through an exclusive agreement with Econolite Control Products, Inc. ("Econolite"), which we believe is the leading distributor of ITS intersection control products in these markets.
We market the RTMS radar systems to a network of distributors in North America, the Caribbean and Latin America. On a limited basis, we sell directly to the end user in these geographic areas. We market our Autoscope video and RTMS radar products outside of the United States, Mexico, Canada and the Caribbean through a combination of distribution and direct sales channels through our office in Spain. Our end users primarily include governmental agencies and municipalities.
The following discussion of year-to-year trends in financial statement results under “Management’s Discussion and Analysis of Financial Condition and Results of Operations” aligns with the financial statement presentation described above.
Trends and Challenges in Our Business
We believe the expected growth in our business can be attributed primarily to the following global trends:
| • | worsening traffic caused by increased numbers of vehicles in metropolitan areas without corresponding expansions of road infrastructure and the need to automate safety, security and access applications for automobiles and trucks, which has increased demand for our products; | |
| • |
advances in information technology, which have made our products easier to market and implement; | |
| • |
the continued funding allocations for centralized traffic management services and automated enforcement schemes, which have increased the ability of our primary end users to implement our products; and | |
| • | general increases in the cost‑effectiveness of electronics, which make our products more affordable for end users. |
| 20 |
We believe our continued growth primarily depends upon:
| • | continued adoption and governmental funding of ITS and other automated applications for traffic control, safety and enforcement in developed countries; | |
| • |
a propensity by traffic engineers to implement lower cost technology‑based solutions rather than civil engineering solutions such as widening roadways; | |
| • | countries in the developing world adopting above‑ground detection technology, such as video or radar, instead of in‑pavement loop technology to manage traffic; | |
| • | our ability to develop new products that provide increasingly accurate information and enhance the end users’ ability to cost‑effectively manage traffic and environmental issues; and | |
| • | value created through strategic acquisitions and partnerships that can leverage the reputation, assets and talents within the Company. |
Because the majority of our end users are governmental entities, we are faced with challenges related to potential delays in purchase decisions by those entities and changes in budgetary constraints. These contingencies could result in significant fluctuations in our revenue between periods. The ongoing economic environment in Europe and the United States is further adding to the unpredictability of purchase decisions, creating more delays than usual and decreasing governmental budgets, and it is likely to continue to affect our revenue.
Key Financial Terms and Metrics
Revenue. We derive revenue from two sources: (1) royalties received from Econolite for sales of the Autoscope video systems in the United States, Mexico, Canada and the Caribbean and (2) revenue received from the direct sales of our RTMS radar systems and our Autoscope video systems in Europe and Asia. Autoscope video royalties are calculated using a profit sharing model where the gross profits on sales of product made through Econolite are shared equally with Econolite. This royalty arrangement has the benefit of decreasing our cost of revenues and our selling, marketing and product support expenses because these costs and expenses are borne primarily by Econolite. Although this royalty model has a positive impact on our gross margin, it also negatively impacts our total revenue, which would be higher if all the sales made by Econolite were made directly by us. The royalty arrangement is exclusive under a long‑term agreement.
Cost of Revenue. Software amortization is the sole cost of revenue related to royalties, as virtually all manufacturing, warranty and related costs are incurred by Econolite. Cost of revenue related to product sales consists primarily of the amount charged by our third party contractors to manufacture hardware platforms, which is influenced mainly by the cost of electronic components. The cost of revenue also includes logistics costs, estimated expenses for product warranties, restructuring costs and inventory reserves. The key metric that we follow is achieving certain gross margin percentages on product sales by geographic region and to a lesser extent by product line.
Operating Expenses. Our operating expenses fall into three categories: (1) selling, marketing and product support; (2) general and administrative; and (3) research and development. Selling, marketing and product support expenses consist of various costs related to sales and support of our products, including salaries, benefits and commissions paid to our personnel; commissions paid to third parties; travel, trade show and advertising costs; second‑tier technical support for Econolite; and general product support, where applicable. General and administrative expenses consist of certain corporate and administrative functions that support the development and sales of our products and provide an infrastructure to support future growth. These expenses include management, supervisory and staff salaries and benefits, legal and auditing fees, travel, rent and costs associated with being a public company, such as board of director fees, listing fees and annual reporting expenses. Research and development expenses consist mainly of salaries and benefits for our engineers and third party costs for consulting and prototyping. We measure all operating expenses against our annually approved budget, which is developed with achieving a certain operating margin as a key focus. Also included in operating expenses are any restructuring costs.
Non‑GAAP Operating Measure. We provide certain non-GAAP financial information as supplemental information to financial measures calculated and presented in accordance with U.S. GAAP (Generally Accepted Accounting Principles in the United States). This non-GAAP information excludes the impact of depreciating fixed assets and amortizing intangible assets and may exclude other non-recurring items. Management believes that this presentation facilitates the comparison of our current operating results to historical operating results. Management uses this non-GAAP information to evaluate short-term and long-term operating trends in our core operations. Non-GAAP information is not prepared in accordance with GAAP and should not be considered a substitute for or an alternative to GAAP financial measures and may not be computed the same as similarly titled measures used by other companies.
| 21 |
The table below reconciles non-GAAP income from income from operations, which is a non-GAAP financial measure, to comparable GAAP financial measures (in thousands):
|
Years Ended December 31, |
|||||
|
|
|||||
|
2021 |
2020 |
||||
|
Income from operations |
$ |
2,273 |
$ |
608 |
|
|
Adjustments to reconcile to non-GAAP income |
|||||
|
Amortization of intangible assets |
780 |
736 |
|||
|
Depreciation |
148 |
224 |
|||
|
Non-GAAP operating income |
$ |
3,201 |
$ |
1,568 |
|
Seasonality. Our quarterly revenues and operating results have varied significantly in the past due to the seasonality of our business. Our first quarter generally is the weakest due to weather conditions that make roadway construction more difficult in parts of North America, Europe and northern Asia. We expect such seasonality to continue for the foreseeable future. Additionally, our international revenues regularly contain individually significant sales. This can result in significant variations of revenue between periods. Accordingly, we believe that quarter‑to‑quarter comparisons of our financial results should not be relied upon as an indication of our future performance. No assurance can be given that we will be able to achieve or maintain profitability on a quarterly or annual basis in the future.
Segments. We currently operate in two reportable segments: Intersection and Highway. Autoscope video is our machine‑vision product line, and revenue consists of royalties (all of which are received from Econolite), as well as a portion of international product sales. Video products are normally sold in the Intersection segment. The RTMS radar is our radar product line, and revenue consists of sales to external customers. Radar products are normally sold in the Highway segment. As a result of business model changes and modifications in how we manage our business, we may reevaluate our segment definitions in the future.
The following tables set forth selected financial information for each of our reportable segments (in thousands):
|
For the year ended December 31, 2021 |
|||||||||
|
Intersection |
Highway |
Total |
|||||||
|
Revenue |
$ |
9,323 |
$ |
3,919 |
$ |
13,242 |
|||
|
Gross profit |
8,421 |
1,814 |
10,235 |
||||||
|
Amortization of intangible assets |
400 |
380 |
780 |
||||||
|
Intangible assets |
1,461 |
1,405 |
2,866 |
||||||
|
For the year ended December 31, 2020 |
|||||||||
|
Intersection |
Highway |
Total |
|||||||
|
Revenue |
$ |
9,301 |
$ |
3,872 |
$ |
13,173 |
|||
|
Gross profit |
8,401 |
1,987 |
10,388 |
||||||
|
Amortization of intangible assets |
367 |
369 |
736 |
||||||
|
Intangible assets |
1,376 |
1,785 |
3,161 |
||||||
| 22 |
The following table sets forth, for the periods indicated, certain consolidated statements of operations data as a percent of total revenue and gross profit on product sales and royalties as a percentage of international sales and royalties, respectively.
|
Years Ended December 31, |
|||||
|
2021 |
|
2020 |
|
||
|
Product sales |
35.6 |
% |
36.7 |
% |
|
|
Royalties |
64.4 |
63.3 |
|||
|
Total revenue |
100.0 |
|
100.0 |
|
|
|
Gross profit - product sales |
44.6 |
49.9 |
|||
|
Gross profit - royalties |
95.3 |
95.6 |
|||
|
Selling, marketing and product support |
16.1 |
19.3 |
|||
|
General and administrative |
27.2 |
29.6 |
|||
|
Research and development |
16.7 |
25.3 |
|||
|
Income from operations |
17.3 |
4.6 |
|||
|
Income tax expense (benefit) |
6.8 |
(3.5 |
) | ||
|
Net income |
17.4 |
|
8.1 |
|
|
Year Ended December 31, 2021 Compared to Year Ended December 31, 2020. Total revenue remained unchanged at $13.2 million in 2021 compared to 2020. Royalty income increased to $8.5 million in 2021 compared to $8.3 million in 2020, an increase of 2.3% Product sales decreased to $4.7 million in 2021 from $4.8 million in 2020, a decrease of 2.5%. The decrease in product sales was primarily the result of labor shortages causing installation delays and impacting project timing.
Revenue for the Intersection segment remained unchanged at $9.3 million in 2021 compared to 2020.
Revenue for the Highway segment remained unchanged at $3.9 million in 2021 compared to 2020.
Gross profit for product sales decreased to 44.6% in 2021 from 49.9% in 2020. Product sales gross profit in 2021 decreased $308,000 or 12.8% compared to the prior year. The decrease in product sales gross profit is primarily the result of COVID-19 related challenges that continued to impact regions throughout the year, as well as labor shortages that caused installation delays and impacted project timing. Product sales gross profit for the Highway product lines has historically been lower than gross profit for the Intersection product lines and therefore the mix of the product lines sold in any given period can result in varying gross profit. Additionally, the geographic sales mix of our product sales can influence margins, as products sold in some jurisdictions have lower margins.
Gross profit for royalty sales decreased to 95.3% in 2021 compared to 95.6% in 2020. Gross profit for royalties in 2021 increased $155,000 or 1.9% compared to the prior year. The decrease in royalty gross profit percent is primarily the result of increased amortization costs associated with the release of pedestrian detection software.
Selling, marketing and product support expense decreased to $2.1 million, or 16.1% of total revenue, in 2021 compared to $2.5 million, or 19.3% of total revenue, in 2020. The decrease in selling, marketing, and product support expense is primarily the result of decreased headcount.
General and administrative expense decreased to $3.6 million, or 27.2% of total revenue, in 2021 compared to $3.9 million, or 29.6% of total revenue, in 2020. A portion of expense during 2020 consisted of expenses for legal and outside consulting costs related to the efforts around exploring strategic alternatives to maximize shareholder value that we announced in January 2020. In light of then current market conditions, including the effects of the COVID-19 pandemic, the strategic review process was terminated in October 2020.
Research and development expense decreased to $2.2 million, or 16.7% of total revenue, in 2021, from $3.3 million, or 25.3% of total revenue, in 2020. The decrease is due to increased capitalized software development costs in 2021 of $485,000 compared to capitalized software costs of $22,000 in 2020. After normalizing for software development costs, overall research and development expenditures decreased in 2021 compared to 2020 due to decreased headcount.
Income tax expense of $905,000 was recorded for the year ended December 31, 2021 compared to income tax benefit of $462,000 for the year ended December 31, 2020. The increase in income tax expense is due to higher pre-tax income in 2021 compared to 2020 and increased research and development tax credits and other adjustments, recognized in 2020.
Consolidated net income was $2.3 million, or $0.43 per basic and diluted share, in 2021 compared to $1.1 million, or $0.20 per basic and diluted share, in 2020.
| 23 |
Liquidity and Capital Resources
At December 31, 2021, we had $8.2 million in cash and cash equivalents compared to $8.6 million at December 31, 2020.
Net cash provided by operating activities remained constant at $2.6 million in 2021 compared to 2020. Net cash provided by operating activities in 2021 remained unchanged compared to the prior year, primarily because the increase in net income was offset by increased inventory levels, forgiveness of our Paycheck Protection Program Loan (as described below), and a decrease in the accounts payable at December 31, 2021 compared to the prior year. To minimize any unforeseen supply chain delays, the Company built up finished goods inventory in 2021.
Net cash used for investing activities was $2.6 million in 2021, compared to net cash used for investing activities of $151,000 in 2020. The increase in the amount of net cash used for investing activities in 2021 compared to the prior year is primarily the result of increased capitalized internal software development costs when compared to 2020 and the increase in cash used to purchase property and equipment, including the purchase of the Property in December 2021.
Net cash used for financing activities was $229,000 in 2021 compared to net cash provided by financing activities of $918,000 in 2020. The decrease in net cash provided by financing activities is attributed to the funding of $924,000 we received from the United States Small Business Administration (SBA) in the form of the Paycheck Protection Program loan (the "PPP Loan") in 2020, as well as cash dividends paid to shareholders during 2021, offset by the $1,742,500 in Loan proceeds from financing the purchase of the Property in December 2021.
On December 10, 2021, in the Closing, ISNS closed on the purchase of the Property under the terms of the Purchase Agreement and the Loan in the original principal amount of $1,742,500 from Coulee Bank (the "Bank") to ISNS to finance the purchase of the Property.
The principal documents evidencing the Loan (the "Loan Documents"), all of which are dated as of December 10, 2021, and their principal terms are as follows:
- The Business Loan Agreement (the "Loan Agreement") contains standard representations and warranties by ISNS to the Bank, affirmative agreements and covenants by ISNS, and agreements by ISNS not to take certain actions. Upon the occurrence of an event of default under the Loan Agreement, all indebtedness of ISNS to the Bank immediately will become due and payable, all without notice of any kind to ISNS. In addition, upon a default, the Bank will have all the rights and remedies provided in the Loan Documents or available at law, in equity, or otherwise.
- The Loan is evidenced by a Promissory Note (the "Note") in the original principal amount of $1,742,500 with a term of five years and which bears interest at the fixed annual rate of 3.950% unless ISNS defaults under the terms of the Note, in which case a higher interest rate will go into effect calculated as provided in the Note. The Note is payable in 59 consecutive monthly payments of principal and interest of $10,566, with the first payment due on January 10, 2022 and one final payment consisting of the balance of the entire remaining principal amount together with all accrued and unpaid interest, estimated at $1,438,256, due and payable on December 10, 2026.
- Under the Mortgage granted by ISNS to the Bank (the "Mortgage"), ISNS mortgaged and conveyed to the Bank, with power of sale, all of ISNS's right, title, and interest in and to the Real Property.
- As provided in the Assignment of Rents between ISNS and the Bank (the "Assignment"), ISNS has granted to the Bank a continuing security interest in all of ISNS's right, title, and interest in and to the rents from the Real Property. The Assignment provides that unless and until the Bank exercises its right to collect the rents as provided in the Assignment and so long as there is no default under the Assignment, ISNS may remain in possession and control of and operate and manage the Real Property and collect the rents.
| 24 |
The events of default under all of the Loan Documents are similar. As of December 31, 2021, ISNS was in compliance with all of its applicable covenants under the Loan Documents.
The above description of the Loan Documents is qualified in its entirety by reference to the Loan Agreement, the Note, the Mortgage, and the Assignment which are filed as Exhibit 10.22, Exhibit 10.23, Exhibit 10.24, and Exhibit 10.25, respectively, with this Annual Report on Form 10-K and are incorporated herein by reference.
We believe that cash and cash equivalents on hand at December 31, 2021, along with the cash provided by operating activities, will satisfy our projected working capital needs, investing activities, and other cash requirements for the foreseeable future.
Off‑Balance Sheet Arrangements
We do not participate in transactions or have relationships or other arrangements with an unconsolidated entity, including special purpose and similar entities or other off‑balance sheet arrangements.
Critical Accounting Policies
Our Consolidated Financial Statements included elsewhere in this Annual Report on Form 10-K are prepared in accordance with U.S. generally accepted accounting principles (“GAAP”), which require us to make estimates and assumptions in certain circumstances that affect amounts reported. In preparing these financial statements, management has made its best estimates and judgments of certain amounts, giving due consideration to materiality. We believe that of our significant accounting policies, the following are particularly important to the portrayal of our results of operations and financial position, may require the application of a higher level of judgment by our management, and as a result, are subject to an inherent degree of uncertainty. For further information, see Note 1 of our Notes to the Consolidated Financial Statements included in Item 8 of this Annual Report on Form 10‑K
Revenue Recognition and Allowance for Doubtful Accounts. We are required to comply with a variety of technical accounting requirements in order to achieve consistent and accurate revenue recognition. Royalty income is recognized based on sales shipped or delivered to our customers as reported to us by Econolite. Revenue is recognized when both product ownership and the risk of loss have transferred to the customer and we have no remaining obligations. Allowances for doubtful accounts are estimated by management based on an evaluation of potential losses related to customer receivable balances. We determine the allowance based on historical write‑off experience in the industry, regional economic data, and an evaluation of specific customer accounts for risk of loss. We review our allowance for doubtful accounts monthly. Account balances are charged off against the allowance when we believe it is probable the receivable will not be recovered. We do not have any off‑balance sheet credit exposure related to our customers. The establishment of this allowance requires the use of judgment and assumptions regarding the potential for losses on receivable balances. Although management considers these balances adequate and proper, changes in economic conditions in specific markets in which we operate could have an effect on reserve balances required.
Warranty Liabilities. The estimated cost to service warranty and customer service claims is included in cost of sales. This estimate is based on historical trends of warranty claims. We regularly assess and adjust the estimate of accrued warranty claims by updating claims rates for actual trends and projected claim costs. Our warranty liability contains uncertainties because our warranty obligations cover an extended period of time. While these liability levels are based on historical warranty experience, they may not reflect the actual claims that will occur over the upcoming warranty period, and additional warranty reserves may be required. A revision of estimated claim rates or the projected cost of materials and freight associated with sending replacement parts to customers could have a material adverse effect on future results of operations.
| 25 |
Software Development Costs. We incur costs associated with the development of software to be sold, leased, or otherwise marketed. Software development costs are expensed as incurred until technological feasibility has been established, at which time future costs incurred are capitalized until the product is available for general release to the public. A significant amount of judgment and estimation is required to assess when technological feasibility is established as well as in the ongoing assessment of the recoverability of capitalized costs. In evaluating the recoverability of capitalized software costs, we compare expected product performance, utilizing forecasted revenue amounts, to the total costs incurred to date and estimates of additional costs to be incurred. If revised forecasted product revenue is less than, and/or revised forecasted costs are greater than, the previously forecasted amounts, the net realizable value may be lower than previously estimated, which could result in recognition of an impairment charge in the period in which such a determination is made.
Impairment of Long‑Lived Assets. We review the carrying value of long‑lived assets or asset groups, such as property and equipment and intangibles subject to amortization, when events or changes in circumstances such as asset utilization, physical change, legal factors, or other matters indicate that the carrying value may not be recoverable. When this review indicates the carrying value of an asset or asset group exceeds the sum of the undiscounted cash flows expected to result from the use and eventual disposition of the asset or asset group, we recognize an asset impairment charge against operations. The amount of the impairment loss recorded is the amount by which the carrying value of the impaired asset or asset group exceeds its fair value.
Our impairment loss calculations contain uncertainties because they require management to make assumptions and to apply judgment to identify events or changes in circumstances indicating the carrying value of assets may not be recoverable, estimate future cash flows, estimate asset fair values, and select a discount rate that reflects the risk inherent in future cash flows. Expected cash flows may not be realized, which could cause long‑lived assets to become impaired in future periods and could have a material adverse effect on future results of operations.
Income Taxes. We record a tax provision for the anticipated tax consequences of the reported results of operations. Deferred tax assets and liabilities are measured using the currently enacted tax rates that apply to taxable income in effect for the years in which those deferred tax assets and liabilities are expected to be realized or settled. We record a valuation allowance to reduce deferred tax assets to the amount that is believed more likely than not to be realized. We believe it is more likely than not that forecasted income, including income that may be generated as a result of certain tax planning strategies, together with the tax effects of the deferred tax liabilities, will be sufficient to fully recover the remaining net realizable value of our deferred tax assets. If all or part of the net deferred tax assets are determined not to be realizable in the future, an adjustment to the valuation allowance would be charged to earnings in the period such determination is made. In addition, the calculation of tax liabilities involves significant judgment in estimating the impact of uncertainties in the application of complex tax laws. Resolution of these uncertainties in a manner inconsistent with management’s expectations could have a material impact on our financial condition and operating results.
Foreign Currency Exchange Risk
Approximately 15% to 25% of our revenue has historically been derived from shipments to customers outside of the United States, and a large portion of this revenue is denominated in currencies other than the U.S. dollar. Our international subsidiaries have functional currencies other than our U.S. dollar reporting currency and, occasionally, transact business in currencies other than their functional currencies. These non‑functional currency transactions expose us to market risk on assets, liabilities and cash flows recognized on these transactions.
The strengthening of the U.S. dollar relative to foreign currencies decreases the value of foreign currency‑denominated revenue and earnings when translated into U.S. dollars. Conversely, a weakening of the U.S. dollar increases the value of foreign currency‑denominated revenue and earnings. A 10% adverse change in foreign currency rates, if we have not properly hedged, could have a material effect on our results of operations or financial position.
AUTOSCOPE TECHNOLOGIES CORPORATION
CONSOLIDATED BALANCE SHEETS
(in thousands, except share data)
|
|
December 31, |
||||||
|
|
2021 |
|
2020 |
||||
|
ASSETS |
|
|
|
|
|
|
|
|
Current assets: |
|
|
|
|
|
|
|
|
Cash and cash equivalents |
$ |
|
|
|
$ |
|
|
|
Accounts receivable, net of allowance for doubtful accounts of $ |
|
|
|
|
|
|
|
|
Inventories |
|
|
|
|
|
|
|
|
Prepaid expenses and other current assets |
|
|
|
|
|
|
|
|
Total current assets |
|
|
|
|
|
|
|
|
|
|
|
|
|
|
|
|
|
Property and equipment: |
|
|
|
|
|
|
|
|
Furniture and fixtures |
|
|
|
|
|
|
|
|
Leasehold improvements |
|
|
|
|
|
|
|
|
Equipment |
|
|
|
|
|
|
|
| Real property | |||||||
|
|
|
|
|
|
|
|
|
|
Accumulated depreciation |
|
|
|
|
|
|
|
|
|
|
|
|
|
|
|
|
|
|
|
|
|
|
|
|
|
|
Intangible assets, net |
|
|
|
|
|
|
|
|
Deferred income taxes |
|
|
|
|
|
|
|
| Operating lease asset, net | |
||||||
|
TOTAL ASSETS |
$ |
|
|
|
$ |
|
|
|
|
|
|
|
|
|
|
|
|
LIABILITIES AND SHAREHOLDERS' EQUITY |
|
|
|
|
|
|
|
|
Current liabilities: |
|
|
|
|
|
|
|
|
Accounts payable |
$ |
|
|
|
$ |
|
|
| Deferred revenue | |||||||
|
Warranty |
|
|
|
|
|
|
|
|
Accrued compensation |
|
|
|
|
|
|
|
| Operating lease obligation |
|
||||||
| Short-term debt | |||||||
|
Other current liabilities |
|
|
|
|
|
|
|
|
Total current liabilities |
|
|
|
|
|
|
|
| Non-current liabilities | |||||||
| Operating lease obligation | |||||||
| Long-term debt, net | |||||||
|
TOTAL LIABILITIES |
|
|
|
|
|
|
|
|
Commitments and contingencies (Note 16) |
|
|
|
|
|
|
|
|
Shareholders' equity |
|
|
|
|
|
|
|
|
Preferred stock, $ par value; |
|
|
|
|
|
|
|
|
Common stock, $ par value; |
|
|
|
|
|
|
|
|
Additional paid-in capital |
|
|
|
|
|
|
|
|
Accumulated other comprehensive loss |
|
( |
) |
|
|
( |
) |
|
Accumulated deficit |
|
( |
) |
|
|
( |
) |
|
Total shareholders' equity |
|
|
|
|
|
|
|
|
TOTAL LIABILITIES AND SHAREHOLDERS' EQUITY |
$ |
|
|
|
$ |
|
|
|
See accompanying notes to the consolidated financial statements. |
|
|
|
|
|
|
|
| 27 |
AUTOSCOPE TECHNOLOGIES CORPORATION
CONSOLIDATED STATEMENTS OF OPERATIONS
(in thousands, except per share data)
|
|
Years ended December 31, |
||||||
|
|
2021 |
|
2020 |
||||
|
Revenue: |
|
|
|
|
|
|
|
|
Product sales |
$ |
|
|
|
$ |
|
|
|
Royalties |
|
|
|
|
|
|
|
|
|
|
|
|
|
|
|
|
|
Cost of revenue: |
|
|
|
|
|
|
|
|
Product sales |
|
|
|
|
|
|
|
|
Royalties |
|
|
|
|
|
|
|
|
|
|
|
|
|
|
|
|
|
Gross profit |
|
|
|
|
|
|
|
|
|
|
|
|
|
|
|
|
|
Operating expenses: |
|
|
|
|
|
|
|
|
Selling, marketing and product support |
|
|
|
|
|
|
|
|
General and administrative |
|
|
|
|
|
|
|
|
Research and development |
|
|
|
|
|
|
|
|
|
|
|
|
|
|
|
|
|
Income from operations |
|
|
|
|
|
|
|
| Other income | |||||||
| Interest income (expense) | ( |
) | |||||
| Income from operations before income taxes | |||||||
|
Income tax expense (benefit) |
|
|
|
|
( |
) |
|
|
Net income |
$ |
|
|
|
$ |
|
|
|
Net income per share: |
|
|
|
|
|
|
|
|
Basic |
$ |
|
|
|
$ |
|
|
|
Diluted |
$ |
|
|
|
$ |
|
|
|
|
|
|
|
|
|
|
|
|
Weighted average number of common shares outstanding: |
|
|
|
|
|
|
|
|
Basic |
|
|
|
|
|
|
|
|
Diluted |
|
|
|
|
|
|
|
|
|
|
|
|
|
|
|
|
|
See accompanying notes to the consolidated financial statements. |
|
|
|
|
|||
| 28 |
AUTOSCOPE TECHNOLOGIES CORPORATION
CONSOLIDATED STATEMENTS OF COMPREHENSIVE INCOME
(in thousands)
|
|
|
|
|
|
|
|
|
|
|
Years ended December 31, |
||||||
|
|
2021 |
|
2020 |
||||
|
Net income |
$ |
|
|
|
$ |
|
|
|
Other comprehensive income: |
|
|
|
|
|
|
|
|
Foreign currency translation adjustment |
|
( |
) |
|
|
|
|
|
Comprehensive income |
$ |
|
|
|
$ |
|
|
|
|
|
|
|
|
|
|
|
|
|
|
|
|
|
|
|
|
|
See accompanying notes to the consolidated financial statements. |
|
|
|
||||
| 29 |
AUTOSCOPE TECHNOLOGIES CORPORATION
CONSOLIDATED STATEMENTS OF CASH FLOW
(in thousands)
|
|
Years ended December 31, |
||||||
|
|
2021 |
|
2020 |
||||
|
Operating activities: |
|
|
|
|
|
|
|
|
Net income |
$ |
|
|
|
$ |
|
|
|
|
|
|
|
|
|
|
|
|
Adjustments to reconcile net income to net cash provided by operating activities: |
|
|
|
|
|
|
|
|
Depreciation |
|
|
|
|
|
|
|
|
Software amortization |
|
|
|
|
|
|
|
|
Stock-based compensation |
|
|
|
|
|
|
|
|
Deferred income tax benefit |
|
|
|
|
( |
) |
|
| Forgiveness of PPP loan | ( |
) | |||||
|
Loss on disposal of assets |
|
|
|
|
|
|
|
|
Changes in operating assets and liabilities: |
|
|
|
|
|
|
|
|
Accounts receivable, net |
|
( |
) |
|
|
|
|
|
Inventories |
|
( |
) |
|
|
|
|
|
Prepaid expenses and other current assets |
|
|
|
|
( |
) | |
|
Accounts payable |
|
( |
) |
|
|
|
|
|
Accrued expenses and other current liabilities |
|
|
|
|
( |
) | |
|
Net cash provided by operating activities |
|
|
|
|
|
|
|
|
|
|
|
|
|
|
|
|
|
Investing activities: |
|
|
|
|
|
|
|
|
Capitalized software development costs |
|
( |
) |
|
|
( |
) |
|
Purchases of property and equipment |
|
( |
) |
|
|
( |
) |
|
Net cash used for investing activities |
|
( |
) |
|
|
( |
) |
|
|
|
|
|
|
|
|
|
|
Financing activities: |
|
|
|
|
|
|
|
| Dividends paid |
( |
) | |||||
| Proceeds from PPP loan |
|
|
|
|
|
||
|
Stock for tax withholding |
|
( |
) |
|
|
( |
) |
| Proceeds from long-term debt |
|
||||||
| Deferred finance fees | ( |
) | |||||
| Proceeds from stock options exercised |
|
|
|
|
|
||
|
Net cash provided by (used for) financing activities |
|
( |
) |
|
|
|
|
|
|
|
|
|
|
|
|
|
|
Effect of exchange rate changes on cash |
|
( |
) |
|
|
|
|
|
Increase (decrease) in cash and cash equivalents |
|
( |
) |
|
|
|
|
|
|
|
|
|
|
|
|
|
|
Cash and cash equivalents at beginning of period |
|
|
|
|
|
|
|
|
Cash and cash equivalents at end of period |
$ |
|
|
|
$ |
|
|
|
|
|
|
|
|
|
|
|
|
Non-Cash investing and financing activities: |
|
|
|
|
|
|
|
|
Purchase of property and equipment in accounts payable |
$ |
|
|
|
$ |
|
|
|
See accompanying notes to the consolidated financial statements. |
|
|
|
|
|
|
|
| 30 |
AUTOSCOPE TECHNOLOGIES CORPORATION
CONSOLIDATED STATEMENTS OF SHAREHOLDERS’ EQUITY
(in thousands, except share data)
|
|
|
|
|
|
|
|
|
|
|
|
Accumulated |
|
|
|
|
|
|
||||||
|
|
|
|
|
|
|
|
Additional |
|
Other |
|
|
|
|
|
|
||||||||
|
|
|
Shares |
|
Common |
|
Paid-In |
|
Comprehensive |
|
Accumulated |
|
|
|
||||||||||
|
|
|
Issued |
|
Stock |
|
Capital |
|
Loss |
|
deficit |
|
Total |
|||||||||||
|
|
|
|
|
|
|
|
|
|
|
|
|
|
|
|
|
|
|
|
|||||
|
Balance, December 31, 2019 |
|
|
|
|
$ |
|
|
|
$ |
|
|
|
$ |
( |
) |
|
$ |
( |
) |
|
$ |
|
|
|
|
|
|
|
|
|
|
|
|
|
|
|
|
|
|
|
|
|
|
|||||
|
Stock-based compensation |
|
|
|
|
|
|
|
|
|
|
— |
|
|
— |
|
|
|
|
|||||
| Stock for tax withholding |
|
( |
) |
|
— |
|
|
( |
) |
|
— |
|
|
— |
|
|
( |
) | |||||
|
Comprehensive income: |
|
|
|
|
|
|
|
|
|
|
|
|
|
|
|
|
|
|
|||||
|
Foreign currency translation adjustment |
|
— |
|
|
— |
|
|
— |
|
|
|
|
— |
|
|
|
|||||||
|
Net income |
|
— |
|
|
— |
|
|
— |
|
|
— |
|
|
|
|
|
|
|
|||||
|
Balance, December 31, 2020 |
|
|
|
|
$ |
|
|
|
$ |
|
|
|
$ |
( |
) |
|
$ |
( |
) |
|
$ |
|
|
|
|
|
|
|
|
|
|
|
|
|
|
|
|
|
|
|
|
|
|
|||||
|
Stock-based compensation |
|
|
|
|
— |
|
|
|
|
|
— |
|
|
— |
|
|
|
|
|||||
| Stock for tax withholding |
|
( |
) |
|
— |
|
|
( |
) |
|
— |
|
|
— |
|
|
( |
) | |||||
| Stock options exercised | — | — | — | ||||||||||||||||||||
| Dividend declared | — | — | — | — | ( |
) | ( |
) | |||||||||||||||
|
Comprehensive income: |
|
|
|
|
|
|
|
|
|
|
|
|
|
|
|
|
|
|
|||||
|
Foreign currency translation adjustment |
|
— |
|
|
— |
|
|
— |
|
|
( |
) |
|
— |
|
|
( |
) | |||||
|
Net income |
|
— |
|
|
— |
|
|
— |
|
|
— |
|
|
|
|
|
|
|
|||||
|
Balance, December 31, 2021 |
|
|
|
|
$ |
|
|
|
$ |
|
|
|
$ |
( |
) |
|
$ |
( |
) |
|
$ |
|
|
|
|
|
|
|
|
|
|
|
|
|
|
|
|
|
|
|
|
|
|
|||||
See accompanying notes to the consolidated financial statements.
| 31 |
Autoscope Technologies Corporation
Notes to Consolidated Financial Statements
December 31, 2021
1. DESCRIPTION OF BUSINESS AND SIGNIFICANT ACCOUNTING POLICIES
DESCRIPTION OF BUSINESS
On July 21, 2021, a holding company reorganization was completed (the “Reorganization”) in which Image Sensing Systems, Inc. ("ISNS") became a wholly-owned subsidiary of the new parent company named “Autoscope Technologies Corporation” ("Autoscope"), which became the successor issuer to ISNS. As a result of the Reorganization, Autoscope replaced ISNS as the public company trading on the Nasdaq Stock Market under the ticker symbol “AATC,” and outstanding shares of ISNS’s common stock automatically converted into shares of common stock of Autoscope. As used in this Annual Report Form 10-K, the "Company", "we", "us" and "our" or its management or business at any time before the effective date of the Reorganization refer to those of ISNS as the predecessor company and its wholly-owned subsidiaries and thereafter to Autoscope and its wholly-owned subsidiaries, except as otherwise specified or to the extent the context otherwise indicates.
The Company develops and markets video and radar processing products for use in applications such as intersection control, highway, bridge and tunnel traffic management and traffic data collection. We sell our products primarily to distributors and also receive royalties under a license agreement with a manufacturer/distributor for certain of our products. Our products are used primarily by governmental entities.
CONSOLIDATION
The Consolidated Financial Statements include the accounts of Autoscope Technologies Corporation and its wholly‑owned subsidiary ISNS and its following wholly-owned subsidiaries: Image Sensing Systems HK Limited (ISS HK) in Hong Kong; Image Sensing Systems (Shenzhen) Limited (ISS WOFE) in China; Image Sensing Systems Spain SLU (ISS Spain) in Spain; ISS Image Sensing Systems Canada Limited (ISS Canada) in Canada; and Autoscope Technologies India Private Limited (Autoscope India) in India. All significant inter‑company transactions and balances have been eliminated.
REVENUE RECOGNITION
We recognize revenue when control of the promised goods or services is transferred to customers in an amount that reflects the consideration we expect to be entitled to in exchange for those goods or services.
| We determine revenue recognition through the following steps: | |
| ● |
Identification of a contract, or contracts, with a customer; |
| ● |
Identification of performance obligations in the contract; |
| ● |
Determination of the transaction price; |
| ● |
Allocation of the transaction price to the performance obligations in the contract; and |
| ● |
Recognition of revenue when, or as, we satisfy a performance obligation. |
Revenue disaggregated by revenue source for the years ended December 31, 2021 and 2020 consists of the following (in thousands); revenue excludes sales and usage-based taxes where it has been determined that we are acting as a pass-through agent:
| Years Ended December 31, | |||||
| 2021 | 2020 | ||||
| Product sales | $ | $ | |||
| Royalties | |||||
| Total revenue | $ | $ | |||
| 32 |
Product Sales:
Product revenue is generated from the direct sales of our RTMS radar systems worldwide and our Autoscope video systems in Europe and Asia. Revenue is recognized when control of the promised goods or services is transferred to our customers in an amount that reflects the consideration we expect to be entitled to in exchange for those goods or services.
Certain product sales may contain multiple performance obligations for revenue recognition purposes. Multiple performance obligations may include the hardware, software, installation services, training, support, and extended warranties. In arrangements where we have multiple performance obligations, the transaction price is allocated to each performance obligation using the relative stand-alone selling price. We generally determine stand-alone selling prices based on the observable stand-alone prices charged to customers. For performance obligations without observable stand-alone prices charged to customers, we evaluate the adjusted market assessment approach and the expected cost plus margin approach to estimate the stand-alone selling prices.
Revenue for services such as maintenance, repair, and technical support is recognized either as the service is performed or ratably over the defined contractual period for service maintenance contracts. From time to time our payment terms may vary by the type and location of our customer and the products or services offered. Revenue for extended warranties is deferred until the coverage period and then recognized ratably over the extended warranty term.
We record deferred revenues when cash payments are received or due in advance of our performance, including amounts which are refundable. The term between invoicing and when payment is due is not significant. For certain products or services and customer types, we require payment before the products or services are delivered to the customer.
We record provisions against sales revenue for estimated returns and allowances in the period when the related revenue is recorded based on historical sales returns and changes in end user demand.
Royalties:
Econolite Control Products, Inc. (“Econolite”) is our licensee that sells our Autoscope video system products in the United States, Mexico, Canada and the Caribbean. The royalty of approximately
Practical Expedients and Exemptions:
We generally expense sales commissions when incurred because the amortization periods would have been
We do not disclose the value of unsatisfied performance obligations for (i) contracts with an original expected length of
SHIPPING AND HANDLING
Freight revenue billed to customers is reported within revenue on the Consolidated Statements of Operations, and expenses incurred for shipping products to customers are reported within cost of revenue on the Consolidated Statements of Operations.
CASH AND CASH EQUIVALENTS
We consider all highly liquid investments with an original maturity of three months or less when purchased to be cash equivalents. Cash equivalents, both inside and outside the United States, are invested in money market funds and bank deposits in local currency denominations. Cash located in foreign banks was $
ACCOUNTS RECEIVABLE
We grant credit to customers in the normal course of business and generally do not require collateral from domestic customers. When deemed appropriate, receivables from customers outside the United States are supported by letters of credit from financial institutions. Management performs on‑going credit evaluations of customers. The allowance for doubtful accounts is based on management’s assessment of the collectability of specific customer accounts and includes consideration of the credit worthiness and financial condition of those specific customers. We record an allowance to reduce receivables to the amount that is reasonably believed to be collectible and consider factors such as the financial condition of the customer and the aging of the receivables. If there is a deterioration of a customer’s financial condition, if we become aware of additional information related to the credit worthiness of a customer, or if future actual default rates on trade receivables in general differ from those currently anticipated, we may have to adjust our allowance for doubtful accounts, which would affect earnings in the period the adjustments were made.
| 33 |
INVENTORIES
Inventories are primarily electronic components and finished goods and are valued at the lower of cost or net realizable value determined under the first‑in, first‑out accounting method.
PROPERTY AND EQUIPMENT
Property and equipment are stated at cost. Additions, replacements, and improvements are capitalized at cost, while maintenance and repairs are charged to operations as incurred. Depreciation is recorded using the straight‑line method over the estimated useful lives of the assets and by accelerated methods for income tax purposes. Leasehold improvements are depreciated over the shorter of the estimated useful lives of the assets or the contractual term of the lease, with consideration of lease renewal options if renewal appears probable. Useful lives of the furniture and fixtures, leasehold improvements, and equipment range from to
On August 27, 2021 (the "Effective Date"), ISNS, and TJ&Z Family Limited Partnership, a Minnesota limited partnership ("TJ&Z"), entered into a Purchase Agreement (the "Original Agreement") under which ISNS purchased certain real and personal property (the "Property") from TJ&Z for a total purchase price of $
The foregoing description of the Original Agreement and the First Amendment does not purport to be complete and is qualified in its entirety by reference to the full text of the Purchase Agreement and First Amendment filed as Exhibit 10.17 and Exhibit 10.18, respectively, to this Annual Report on Form 10-K and incorporated herein by reference
INCOME TAXES
We record a tax provision for the anticipated tax consequences of the reported results of operations. Deferred tax assets and liabilities are measured using the currently enacted tax rates that apply to taxable income in effect for the years in which those deferred tax assets and liabilities are expected to be realized or settled. We record a valuation allowance to reduce deferred tax assets to the amount that is believed more likely than not to be realized. We believe it is more likely than not that forecasted income, including income that may be generated as a result of certain tax planning strategies, together with the tax effects of the deferred tax liabilities, will be sufficient to fully recover the remaining net realizable value of deferred tax assets. If all or part of the net deferred tax assets are determined not to be realizable in the future, an adjustment to the valuation allowance would be charged to earnings in the period such determination is made. In addition, the calculation of tax liabilities involves significant judgment in estimating the impact of uncertainties in the application of complex tax laws. Resolution of these uncertainties in a manner inconsistent with management’s expectations could have a material impact on our financial condition and operating results. We recognize penalties and interest expense related to unrecognized tax benefits in income tax expense.
INTANGIBLE ASSETS
We capitalize certain software development costs related to software to be sold, leased, or otherwise marketed. Capitalized software development costs include purchased materials, services, internal labor and other costs associated with the development of new products and services. Software development costs are expensed as incurred until technological feasibility has been established, at which time future costs incurred are capitalized until the product is available for general release to the public. Based on our product development process, technological feasibility is generally established once product and detailed program designs have been completed, uncertainties related to high-risk development issues have been resolved through coding and testing, and we have established that the necessary skills, hardware, and software technology are available for production of the product. Once a software product is available for general release to the public, capitalized development costs associated with that product will begin to be amortized to cost of sales over the product’s estimated economic selling life, using the greater of straight-line or a method that results in cost recognition in future periods that is consistent with the anticipated timing of product revenue recognition.
| 34 |
Capitalized software development costs are subject to an ongoing assessment of recoverability, which is impacted by estimates and assumptions of future revenues and expenses for these software products, as well as other factors such as changes in product technologies. Any portion of unamortized capitalized software development costs that are determined to be in excess of net realizable value have been expensed in the period in which such a determination is made. Subsequent to reaching technological feasibility for certain software products, we capitalized approximately $
Intangible assets with finite lives are amortized on a straight‑line basis over the expected period to be benefited by future cash flows and reviewed for impairment. At both December 31, 2021 and 2020, there were
IMPAIRMENT OF LONG‑LIVED ASSETS
We review the carrying value of long‑lived assets or asset groups, such as property and equipment and intangibles subject to amortization, when events or changes in circumstances such as asset utilization, physical change, legal factors, or other matters indicate that the carrying value may not be recoverable. When this review indicates the carrying value of an asset or asset group exceeds the sum of the undiscounted cash flows expected to result from the use and eventual disposition of the asset or asset group, we recognize an asset impairment charge against operations. The amount of the impairment loss recorded is the amount by which the carrying value of the impaired asset or asset group exceeds its fair value.
RESEARCH AND DEVELOPMENT
Research and development costs associated with new products are charged to operations in the period incurred.
WARRANTIES
We generally provide a - to -year warranty on product sales. We record estimated warranty costs at the time of sale and accrue for specific items at the time that their existence is known and the amounts are determinable. We estimate warranty costs using standard quantitative measures based on historical warranty claim experience and an evaluation of specific customer warranty issues. In addition, warranty provisions are recognized for certain nonrecurring product claims that are individually significant.
FOREIGN CURRENCY
The financial position and results of operations of our foreign subsidiaries are measured using local currency as the functional currency. Assets and liabilities are translated using fiscal period‑end exchange rates, and statements of operations are translated using average exchange rates applicable to each period, with the resulting translation adjustments recorded as a separate component of shareholders’ equity under “Accumulated other comprehensive loss.” Gains and losses from foreign currency transactions are recognized in the Consolidated Statements of Operations.
NET INCOME PER SHARE
Basic income per share excludes dilution and is computed by dividing net income attributable to common shareholders by the weighted‑average number of common shares outstanding during the period. Diluted income per share includes potentially dilutive common shares consisting of stock options and restricted stock using the treasury stock method. Under the treasury stock method, shares associated with certain stock options have been excluded from the diluted weighted average shares outstanding calculation because the exercise of those options would lead to a net reduction in common shares outstanding. As a result, stock options to acquire
LOSS CONTINGENCIES
We establish an accrual for loss contingencies when it is both probable that an asset has been impaired or a liability has been incurred and the amount of the loss can be reasonably estimated. When loss contingencies are not probable and cannot be reasonably estimated, we do not establish an accrual. However, when there is at least a reasonable possibility that a loss has been incurred, but it is not probable or reasonably estimated, we disclose the nature of the loss contingency and an estimate of the possible loss or range of loss as applicable. Any adjustment made to a loss contingency accrual during an accounting period affects the earnings of the period.
| 35 |
USE OF ESTIMATES
The preparation of financial statements in accordance with U.S. generally accepted accounting principles ("GAAP") requires management to make estimates and assumptions that affect the reported amounts of assets and liabilities, the disclosure of contingent assets and liabilities as of the date of the financial statements, and the reported amounts of revenue and expense during the reporting period. Predicting future events is inherently an imprecise activity and, as such, requires the use of judgment. Ultimate results could differ from those estimates. Changes in these estimates will be reflected in the financial statements in future periods. Significant estimates include warranty reserves, allowance for doubtful accounts, inventory reserves, and the valuation of deferred tax assets.
STOCK‑BASED COMPENSATION
We measure the cost of employee services received in exchange for the award of equity instruments based on the fair value of the award at the date of grant and recognize the cost over the period during which an employee is required to provide services in exchange for the award. Stock options or awards are granted at exercise prices equal to the closing market price of our stock on the day before the date of grant.
For purposes of determining the estimated fair value of stock options, we utilize a Black‑Scholes option pricing model, which requires the input of certain assumptions requiring management judgment. Because our employee stock option awards have characteristics significantly different from those of traded options, and because changes in the input assumptions can materially affect fair value estimates, existing models may not provide a reliable single measure of the fair value of employee stock options. Management will continue to assess the assumptions and methodologies used to calculate estimated fair value of stock‑based compensation. Circumstances may change and additional data may become available over time that could result in changes to these assumptions and methodologies and thereby materially impact the fair value determination of future grants of stock‑based payment awards. If factors change and we employ different assumptions in future periods, the compensation expense recorded may differ significantly from the stock‑based compensation expense recorded in the current period.
RECENT ACCOUNTING PRONOUNCEMENTS
Accounting pronouncements recently adopted
In August 2018, the Financial Accounting Standards Board ("FASB") issued ASU No. 2018-13, "Fair Value Measurements (Topic 820)" ("ASU 2018-13'). ASU 2018-13 eliminates, amends and adds disclosure requirements for fair value measurements. The standard is required to be adopted for annual periods beginning after December 15, 2019, including interim periods within that annual period, which is our fiscal year 2020. We adopted these changes as of January 1, 2020; however, there are no required changes that apply to our fair value measurements disclosures.
| 36 |
2. FAIR VALUE MEASUREMENTS
The guidance for fair value measurements establishes the authoritative definition of fair value, sets out a framework for measuring fair value, and outlines the required disclosures regarding fair value measurements. Fair value is the price that would be received to sell an asset or paid to transfer a liability (an exit price) in the principal or most advantageous market for the asset or liability in an orderly transaction between market participants at the measurement date. We use a three‑tier fair value hierarchy based upon observable and non‑observable inputs as follows:
|
• |
Level 1 – observable inputs such as quoted prices in active markets; |
| • | Level 2 – inputs, other than the quoted prices in active markets, that are observable either directly or indirectly; and |
| • | Level 3 – unobservable inputs in which there is little or no market data, which require the reporting entity to develop its own assumptions. |
Assets and Liabilities that are Measured at Fair Value on a Recurring Basis
The fair value hierarchy requires the use of observable market data when available. In instances in which the inputs used to measure fair value fall into different levels of the fair value hierarchy, the fair value measurement has been determined based on the lowest level input that is significant to the fair value measurement in its entirety. Our assessment of the significance of a particular item to the fair value measurement in its entirety requires judgment, including the consideration of inputs specific to the asset or liability.
Financial Instruments not Measured at Fair Value
Certain of our financial instruments are not measured at fair value and are recorded at carrying amounts approximating fair value, based on their short‑term nature or variable interest rate. These financial instruments include cash and cash equivalents, accounts receivable, accounts payable and other current financial assets and liabilities.
3. INVENTORIES
Inventories consisted of the following (in thousands):
| December 31, | |||||
| 2021 | 2020 | ||||
| Finished goods | $ | $ | |||
| Components | |||||
| Total | $ | $ | |||
| 37 |
The Company is subject to various non-cancelable operating leases for office space and IT equipment expiring at various dates through November 2022. These leases do not have significant rent escalation, holidays, concessions, leasehold improvement incentives, or other buildout clauses. Further, the leases do not contain contingent rent provisions.
Most of these leases include an option to renew. The exercise of lease renewal options is typically at our sole discretion; therefore, the majority of renewals to extend the lease terms are not included in our right-of-use ("ROU") assets and lease liabilities because they are not reasonably certain of exercise. We regularly evaluate the renewal options and, when they are reasonably certain of exercise, we include the renewal period in our lease term.
Because most of our leases do not provide an implicit rate, we use our incremental borrowing rate in determining the present value of the lease payments. The incremental borrowing rate represents an estimate of the interest rate we would incur at lease commencement to borrow an amount equal to the lease payments on a collateralized basis over the term of a lease. We used incremental borrowing rates as of January 1, 2019 for operating leases that commenced prior to that date. We have a centrally managed treasury function; therefore, based on the applicable lease terms and the current economic environment, we apply a portfolio approach for determining the incremental borrowing rate.
The cost components of our operating leases were as follows (in thousands) for the years ended December 31:
| 2021 | 2020 | ||||
|
Operating lease costs |
$ | $ | |||
| Variable lease costs |
|
||||
| Total | $ | $ |
Variable lease costs consist primarily of property taxes, insurance, and common area or other maintenance costs for our leased facilities and equipment, which are paid based on actual costs incurred by the lessor.
Maturities for our lease liabilities for all operating leases were as follows (in thousands) as of December 31, 2021:
|
|
|
Total |
|
|
2022 |
$ |
|
|
|
2023 and thereafter |
|
||
|
Total lease payments |
|
||
|
Less: Interest |
|
||
| Present value of lease liabilities | $ |
The weighted average remaining lease terms and discount rates for all of our operating leases were as follows as of December 31, 2021:
| December 31, 2021 | |||
| Remaining lease term and discount rate: | |||
| Weighted average remaining lease term (years) | |||
| Weighted average discount rate | % |
| 38 |
Cash paid for amounts included in the measurement of operating lease liabilities was $
On July 28, 2021, ISNS and Spruce Tree Centre L.L.P. entered into the Amendment, which amended the original Office Lease Agreement dated as of November 24, 1998 by and between ISNS and Spruce Tree (the "Original Lease"), as such Original Lease was subsequently amended (as so amended, the "Lease"). The Amendment was signed by Spruce Tree on July 28, 2021. The Lease term was to expire on July 31, 2021. The Amendment, which was effective August 1, 2021, extends the term of the Lease to March 31, 2022. In addition, the Amendment increases the monthly rent from $
The following is a schedule of minimum future rental income (in thousands) on the operating lease related to the billboard located on the Real Property as of December 31, 2021.
| Total | |||
|
2022 |
$ | ||
| 2023 | |||
| 2024 | |||
| 2025 | |||
| 2026 | |||
| 2027 and thereafter | |||
| Total minimum future rental income | $ |
| 39 |
5. INTANGIBLE ASSETS
Intangible assets include capitalized software development costs consisting of the following (dollars in thousands):
|
|
December 31, 2021 |
||||||||||||
|
|
|
|
|
|
|
|
|
|
|
Weighted |
|||
|
|
Gross |
|
|
|
|
Net |
|
Average |
|||||
|
|
Carrying |
|
Accumulated |
|
Carrying |
|
Useful Life |
||||||
|
|
Amount |
|
Amortization |
|
Value |
|
(in Years) |
||||||
|
Wrong Way development costs |
|
|
|
|
( |
) |
|
|
|
|
— |
||
|
Vision development costs |
|
|
|
|
( |
) |
|
|
|
|
|
||
|
Echo development costs |
|
|
|
|
( |
) |
|
|
|
|
|
||
| IntellitraffiQ development costs | ( |
) | |||||||||||
| Software development in process costs | — | ||||||||||||
|
|
$ |
|
|
$ |
( |
) |
|
$ |
|
|
|
||
|
|
December 31, 2020 |
||||||||||||
|
|
|
|
|
|
|
|
|
|
|
Weighted |
|||
|
|
Gross |
|
|
|
|
Net |
|
Average |
|||||
|
|
Carrying |
|
Accumulated |
|
Carrying |
|
Useful Life |
||||||
|
|
Amount |
|
Amortization |
|
Value |
|
(in Years) |
||||||
|
Wrong Way development costs |
$ |
|
|
$ |
( |
) |
|
$ |
|
|
— |
||
|
Vision development costs |
|
|
|
|
( |
) |
|
|
|
|
|
||
| Echo development costs |
( |
) | |||||||||||
| IntellitraffiQ development costs | ( |
) | |||||||||||
|
|
$ |
|
|
$ |
( |
) |
|
$ |
|
|
|
||
The estimated future amortization expense related to other intangible assets for the next five fiscal years is as follows (dollars in thousands):
|
|
|
|
Amortization |
|
|
|
|
Expense |
|
2022 |
|
$ |
|
|
2023 |
|
|
|
|
2024 |
|
|
|
|
2025 |
|
|
|
|
2026 |
|
|
|
| 2027 and thereafter |
The above amortization expense relates to various capitalized costs related to software development. Future amortization amounts presented above are estimates. Actual future amortization expense may be different due to future acquisitions, impairments, changes in amortization periods, or other factors.
In accordance with GAAP, we performed an assessment of recoverability on our software development costs, which is impacted by estimates and assumptions of future revenue and expenses for these products, as well as other factors such as changes in product technologies. We determined that the amount of the estimated undiscounted cash flows is greater than the asset carrying value, and there were no impairment triggers as of December 31, 2021.
| 40 |
6. WARRANTIES
Warranty liability and related activity consisted of the following (in thousands):
|
|
Years ended December 31, |
||||||
|
|
2021 |
|
2020 |
||||
|
|
|
|
|
|
|
|
|
|
Beginning balance |
$ |
|
|
|
$ |
|
|
|
Warranty provisions |
|
|
|
|
|
|
|
|
Warranty claims |
|
( |
|
|
( |
) |
|
|
Adjustments to preexisting warranties |
|
( |
|
|
( |
) | |
|
Ending balance |
$ |
|
|
|
$ |
|
|
|
|
|
|
|
|
|
|
|
7. INCOME TAXES
The components of income before income taxes were as follows (in thousands):
|
|
Years ended December 31, |
||||||
|
|
2021 |
|
2020 |
||||
|
|
|
|
|
|
|
|
|
|
Income from operations before income taxes |
|
|
|
|
|
|
|
|
Domestic |
$ |
|
|
|
$ |
|
|
|
Foreign |
|
|
|
|
( |
||
|
Total |
$ |
|
|
|
$ |
|
|
The components of income tax expense (benefit) were as follows (in thousands):
|
|
Years ended December 31, |
||||||
|
|
2021 |
|
2020 |
||||
|
|
|
|
|
|
|
|
|
|
Current: |
|
|
|
|
|
|
|
|
Federal |
$ |
|
|
|
$ |
|
|
|
State |
|
|
|
|
|
|
|
|
Foreign |
|
|
|
|
|
|
|
|
|
$ |
|
|
$ |
|
|
|
|
|
|
|
|
|
|
|
|
|
Deferred: |
|
|
|
|
|
|
|
|
Federal |
$ |
|
|
$ |
( |
) | |
|
State |
|
|
|
|
( |
) |
|
|
Foreign |
|
( |
) |
|
|
|
|
|
|
|
|
|
|
( |
) | |
|
Total income tax expense (benefit) |
$ |
|
|
$ |
( |
) | |
| 41 |
A reconciliation from the federal statutory income tax provision to our effective tax expense (benefit) is as follows (in thousands):
|
|
Years ended December 31, |
||||||
|
|
2021 |
|
2020 |
||||
|
|
|
|
|
|
|
|
|
|
United States federal tax statutory rate |
$ |
|
|
|
$ |
|
|
|
State taxes, net of federal benefit |
|
( |
) |
|
|
( |
) |
|
Changes in valuation allowances against deferred tax assets |
|
( |
) |
|
|
|
|
|
Research and development tax credits |
|
( |
) |
|
|
( |
) |
|
Foreign provision different than U.S. tax rate |
|
|
|
|
|
||
| PPP loan forgiveness | ( |
) | |||||
|
Nondeductible expenses |
|
|
|
|
( |
) | |
| Deferred true-up |
( |
) | |||||
|
Write off of attributes from disposed entity |
|||||||
|
Other |
|
( |
) |
|
|
( |
) |
|
Total |
$ |
|
|
$ |
( |
) | |
A summary of the deferred tax assets and liabilities is as follows (in thousands):
|
|
December 31, |
||||||
|
|
2021 |
|
2020 |
||||
|
|
|
|
|
|
|
|
|
|
Deferred tax assets (liabilities): |
|
|
|
|
|
|
|
|
Accrued compensation and benefits |
$ |
|
|
|
$ |
|
|
|
Inventory reserves |
|
|
|
|
|
|
|
|
Allowance for doubtful accounts |
|
|
|
|
|
|
|
| Prepaid expenses and other | ( |
) | ( |
) | |||
|
Warranty reserves |
|
|
|
|
|
|
|
|
Intangible and other assets |
|
( |
) |
|
|
( |
) |
|
Net operating loss carryforwards |
|
|
|
|
|
|
|
|
Property, equipment and other |
|
|
|
|
( |
) |
|
|
Research and development credit |
|
|
|
|
|
|
|
|
Total deferred tax asset: |
|
|
|
|
|
|
|
|
Less: valuation allowance |
|
( |
) |
|
|
( |
) |
| Total deferred tax assets: |
$ | $ | |||||
As of December 31, 2021, the Company had sustained a significant accumulated tax loss. The net operating loss (“NOL”) carry forward in the United States and Canada as of December 31, 2021 was $
On a quarterly basis, the Company evaluates all positive and negative evidence in determining if the valuation allowance is fairly stated. The valuation allowance of $
In accordance with Accounting Standards Codification ("ASC") 740‑30, Income Taxes, we have not recognized a deferred tax liability for the undistributed earnings of certain of our foreign operations because those subsidiaries have invested or will invest the undistributed earnings indefinitely. It is impractical for us to determine the amount of unrecognized deferred tax liabilities on these indefinitely reinvested earnings. Deferred taxes are recorded for earnings of foreign operations when we determine that such earnings are no longer indefinitely reinvested.
During 2021, the Company identified an error related to the 2020 income tax provision which resulted in the income tax benefit to be overstated by approximately $
| 42 |
The Company had recognized no material uncertain tax positions as of December 31, 2021. The Company files income tax returns in the U.S federal jurisdiction and various state and foreign jurisdictions. With few exceptions, the Company is no longer subject to U.S federal or state and local income tax examinations by tax authorities for years before 2018. It is difficult to predict the final timing and resolution of any particular uncertain tax position. Based on the Company's assessment of many factors, including past experience and complex judgments about future events, the Company does not currently anticipate significant changes in its uncertain tax positions over the next 12 months.
8. LICENSING
We have licensed the exclusive right to manufacture and market the Autoscope video technology in the United States, Mexico, Canada and the Caribbean to Econolite, and we receive royalties from Econolite on sales of systems in those territories as well as in non‑exclusive territories as allowed from time to time. We may terminate our agreement with Econolite if a minimum annual sales level is not met or if Econolite fails to make royalty payments as required by the agreement.
We recognized royalty income from this agreement of $
9. SIGNIFICANT CUSTOMERS AND CONCENTRATION OF CREDIT RISK
Royalty revenue from Econolite comprised
Product revenue from
10. RETIREMENT SAVINGS PLANS
Substantially all of our employees in the United States are eligible to participate in our qualified defined contribution 401(k) plan. Participants may elect to have a specified portion of their salary contributed to the plan, and we may make discretionary contributions to the plan. We made contributions totaling $
| 43 |
11. STOCK-BASED COMPENSATION
We compensate officers, directors, key employees and consultants with stock-based compensation under the Image Sensing Systems, Inc. 2014 Stock Option and Incentive Plan (the "2014 Plan"), which was approved by our shareholders and is administered under the supervision of our Board of Directors. The Image Sensing Systems, Inc. 2005 Stock Incentive Plan (the "2005 Plan") expired in 2015, although there are options to purchase 15,000 shares outstanding under the 2005 Plan that were issued before the 2005 Plan expired. The 2014 Plan and the 2005 Plan and awards granted under the 2014 Plan and the 2005 Plan were assumed by Autoscope in the Reorganization. Stock option awards are granted at exercise prices equal to the closing price of our stock on the day before the date of grant. Generally, options vest proportionally over periods of to
Compensation expense, net of estimated forfeitures, is recognized ratably over the vesting period. Stock-based compensation expense included in general and administrative expense for the years ended December 31, 2021 and 2020 was $
Stock Options
The following tables summarize stock option activity:
| For the year ended December 31, 2021 | ||||||||||||
| Number of Shares | Weighted Average Exercise Price per Share | Weighted Average Remaining Contractual Term (in years) | Aggregate Intrinsic Value | |||||||||
| Options outstanding at December 31, 2020 | $ | $ | ||||||||||
| Granted | $ | — | $ | |||||||||
| Exercised | ( |
) | $ | — | $ | |||||||
| Expired | $ | — | $ | |||||||||
| Forfeited | ( |
) | $ | — | $ | |||||||
| Options outstanding at December 31, 2021 | $ | $ | ||||||||||
| Options exercisable at December 31, 2021 | $ | $ | ||||||||||
| For the year ended December 31, 2020 |
||||||||||||
| Number of Shares | Weighted Average Exercise Price per Share | Weighted Average Remaining Contractual Term (in years) | Aggregate Intrinsic Value | |||||||||
| Options outstanding at December 31, 2019 | $ | $ | ||||||||||
| Granted | $ | — | $ | |||||||||
| Exercised | $ | — | $ | |||||||||
| Expired | $ | — | $ | |||||||||
| Forfeited | ( |
) | $ | — | $ | |||||||
| Options outstanding at December 31, 2020 | $ | $ | ||||||||||
| Options exercisable at December 31, 2020 | $ | $ | ||||||||||
| 44 |
We recognized
At December 31, 2021, there was
The fair value of stock options granted under stock‑based compensation programs has been estimated as of the date of each grant using the multiple option form of the Black‑Scholes valuation model, based on the grant price and assumptions regarding the expected grant life, stock price volatility, dividends, and risk‑free interest rates. Each vesting period of an option award is valued separately, with this value being recognized evenly over the vesting period.
Restricted Stock and Stock Awards
Restricted stock awards are granted under the 2014 Plan at the discretion of the Compensation Committee of our Board of Directors. We issue restricted stock awards to executive officers and key consultants. These awards may contain certain performance conditions or time-based vesting criteria.
We also issue stock awards as a portion of the annual retainer for each director on a quarterly basis. The stock awards are fully vested at the time of issuance. Compensation expense related to stock awards is determined on the grant date based on the publicly-quoted fair market value of our common stock and is charged to earnings on the grant date.
The following table summarizes restricted stock award activity for 2021 and 2020:
|
|
2021 |
2020 |
|||||||||
|
|
Number of Shares |
|
Weighted Average Grant Date Fair Value |
Number of Shares | Weighted Average Grant Date Fair Value | ||||||
|
Awards outstanding at beginning of year |
|
|
|
$ |
|
$ | |||||
|
Granted |
|
|
|
$ |
|
$ | |||||
|
Vested |
( |
) |
|
$ |
|
( |
) | $ | |||
|
Forfeited |
|
|
$ |
|
$ | ||||||
|
|
|
|
|
|
|
||||||
|
Awards outstanding at end of year |
|
|
|
$ |
|
$ | |||||
As of December 31, 2021, the total stock-based compensation expense related to non-vested awards not yet recognized was $
| 45 |
12. INCOME PER COMMON SHARE
Net income per share is computed by dividing net income by the daily weighted average number of common shares outstanding during the applicable periods. Diluted net income per share includes the potentially dilutive effect of common shares subject to outstanding stock options and restricted stock awards using the treasury stock method. Under the treasury stock method, shares subject to certain outstanding stock options and restricted stock awards have been excluded from the diluted weighted average shares outstanding calculation because the exercise of those options or the vesting of those restricted stock awards would lead to a net reduction in common shares outstanding. As a result, stock options to acquire
A reconciliation of net income per share is as follows (in thousands, except per share data):
| Years ended December 31, | ||||||||
| 2021 |
2020 | |||||||
| Numerator: | ||||||||
| Net income | $ | $ | ||||||
| Denominator: | ||||||||
| Weighted average common shares outstanding | |
|||||||
| Dilutive potential common shares | ||||||||
| Shares used in diluted net income per common share calculations | ||||||||
| Basic net income per common share | $ | $ | ||||||
| Diluted net income per common share | $ | $ | ||||||
13. RESTRUCTURING AND EXIT ACTIVITIES
In the third quarter of 2016, in order to streamline our operating and cost structure, we initiated the closure of our wholly-owned subsidiaries, Image Sensing Systems HK Limited (ISS HK) in Hong Kong; Image Sensing Systems (Shenzhen) Limited (ISS WOFE) in China. During 2020, we initiated the closure of Image Sensing Systems EMEA (ISS UK) and Image Sensing Systems Holdings Limited (ISS Holdings). At September 30, 2021, Image Sensing Systems (Shenzhen) Limited was fully closed. We incurred $
In the second quarter of 2021, the Company began the process of forming a subsidiary in Chennai, India. Autoscope Technologies India Private Limited ("Autoscope India") was legally formed on October 14, 2021. Autoscope India's operations will solely focus on research and development.
| 46 |
14. SEGMENT INFORMATION
The Company's Chief Executive Officer and management regularly review financial information for the Company's discrete operating segments. Based on similarities in the economic characteristics, nature of products and services, production processes, type or class of customer served, method of distribution and regulatory environments, the operating segments have been aggregated for financial statement purposes and categorized into
Autoscope video is our machine-vision product line, and revenue consists of royalties (all of which are received from Econolite), as well as a portion of international product sales. Video products are normally sold in the Intersection segment. RTMS is our radar product line, and revenue consists of international and North American product sales. Radar products are normally sold in the Highway segment. All segment revenues are derived from external customers.
Operating expenses and total assets are not allocated to the segments for internal reporting purposes. Due to the changes in how we manage our business, we may reevaluate our segment definitions in the future.
The following tables set forth selected financial information for each of our reportable segments (in thousands):
|
|
|
For the year ended December 31, 2021 |
|||||||
|
|
|
Intersection |
|
Highway |
|
Total |
|||
|
|
|
|
|
|
|
|
|
|
|
|
Revenue |
|
$ |
|
|
$ |
|
|
$ |
|
|
Gross profit |
|
|
|
|
|
|
|
|
|
|
Amortization of intangible assets |
|
|
|
|
|
|
|
|
|
|
Intangible assets |
|
|
|
|
|
|
|
|
|
|
|
|
|
|
|
|
|
|
|
|
|
|
|
|
|
|
|
|
|
|
|
|
|
|
For the year ended December 31, 2020 |
|||||||
|
|
|
Intersection |
|
Highway |
|
Total |
|||
|
|
|
|
|
|
|
|
|
|
|
|
Revenue |
|
$ |
|
|
$ |
|
|
$ |
|
|
Gross profit |
|
|
|
|
|
|
|
|
|
|
Amortization of intangible assets |
|
|
|
|
|
|
|
|
|
|
Intangible assets |
|
|
|
|
|
|
|
|
|
We derived the following percentages of our net revenues from the following geographic regions:
|
|
For the years ended December 31, |
||
|
|
2021 |
|
2020 |
|
Asia Pacific |
|
|
|
|
Europe and Middle East |
|
|
|
|
North America |
|
|
|
No countries other than the United States had revenue in excess of
| 47 |
15. LONG-TERM DEBT
Paycheck Protection Program Loan
Under the Paycheck Protection Program ("PPP"), the United States Small Business Administration ("SBA") approved the Company's application to receive a loan in the amount of $
The term of the PPP loan was
Under the terms of the CARES Act, PPP loan recipients can apply for and be granted forgiveness for all or a portion of loans made under the PPP after
The foregoing description of the Note does not purport to be complete and is qualified in its entirety by reference to the full text of the Note filed as Exhibit 10.14 to this Annual Report on Form 10-K and incorporated herein by reference.
Real Property Bank Loan
On December 10, 2021, ISNS entered into a Business Loan Agreement (the "Loan Agreement") with Coulee Bank (the "Bank") and issued a promissory note to the Bank (the "Note") in the original principal amount of $
The Note has a term of
Upon the occurrence of an event of default under the Loan Agreement, all indebtedness of ISNS to the Bank immediately will become due and payable, all without notice of any kind to ISNS, except that in the case of an event of default of the type described in the "Insolvency" subsection of the Loan Agreement, such acceleration will be automatic and not optional. In addition, upon a default, the Bank will have all the rights and remedies provided in the or available at law, in equity, or otherwise.
Under the Mortgage granted by ISNS to the Bank (the "Mortgage") dated as of December 10, 2021, ISNS mortgaged and conveyed to the Bank, with power of sale, all of ISNS's right, title, and interest in and to the Real Property, together with all existing or subsequently erected or affixed buildings and all improvements and fixtures; and all easements, rights of way, and appurtenances. The events of default under the Mortgage are similar to those under the Loan Agreement and the Note and are in addition to those under the Loan Agreement and the Note.
As provided in the Assignment of Rents between ISNS and the Bank (the "Assignment") dated as of December 10, 2021, ISNS granted to the Bank a continuing security interest in, and conveyed to the Bank, all of ISNS's right, title, and interest in and to the rents from the Real Property. The Assignment provides that unless and until the Bank exercises its right to collect the rents as provided in the Assignment and so long as there is no default under the Assignment, ISNS may remain in possession and control of and operate and manage the Real Property and collect the rents. The events of default under the Assignment are similar to those under the Loan Agreement, the Note, and the Mortgage and are in addition to those under the Loan Agreement, the Note, and the Mortgage. Other than the lease for the billboards on the Real Property, which TJ&Z assigned to ISNS, there are currently no tenants in the Real Property and no leases or other similar agreements with prospective tenants contemplated.
| 48 |
In connection with the Loan, the Company incurred and capitalized approximately $
Long-term Debt Maturities
Maturities of long-term debt, excluding deferred debt issuance costs, for the next five fiscal years are as follows (dollars in thousands):
| Long-term Debt | |||
| Maturities | |||
| 2022 | $ | ||
| 2023 | |||
| 2024 | |||
| 2025 | |||
| 2026 | |||
The above descriptions of the Loan Agreement, the Note, the Mortgage, and the Assignment do not purport to be complete and are qualified in their entirety by reference to the full text of the Loan Agreement, the Note, and Mortgage, and the Assignment filed as Exhibit 10.22, Exhibit 10.23, Exhibit 10.24, and Exhibit 10.25 to this Annual Report on Form 10-K and incorporated herein by reference.
| 49 |
Litigation
We are involved from time to time in various legal proceedings arising in the ordinary course of our business, including primarily commercial, product liability, employment and intellectual property claims. In accordance with GAAP, we record a liability in our Consolidated Financial Statements with respect to any of these matters when it is both probable that a liability has been incurred and the amount of the liability can be reasonably estimated. With respect to any currently pending legal proceedings, we have not established an estimated range of reasonably possible additional losses either because we believe that we have valid defenses to claims asserted against us or the proceeding has not advanced to a stage of discovery that would enable us to establish an estimate. We currently do not expect the outcome of these matters to have a material effect on our consolidated results of operations, financial position or cash flows. Litigation, however, is inherently unpredictable, and it is possible that the ultimate outcome of one or more claims asserted against us could adversely impact our results of operations, financial position or cash flows. We expense legal costs as incurred.
| 50 |
To the Board of Directors and
Shareholders of Autoscope Technologies Corporation
Opinion on the Consolidated Financial Statements
We have audited the accompanying consolidated balance sheets of Autoscope Technologies Corporation (the Company) as of December 31, 2021 and 2020, and the related consolidated statements of operations, comprehensive income, shareholders’ equity, and cash flows for each of the years in the two-year period ended December 31, 2021, and the related notes (collectively referred to as the consolidated financial statements). In our opinion, the consolidated financial statements present fairly, in all material respects, the financial position of the Company as of December 31, 2021 and 2020, and the results of its operations and its cash flows for each of the years in the two-year period ended December 31, 2021, in conformity with accounting principles generally accepted in the United States of America .
Basis for Opinion
These consolidated financial statements are the responsibility of the Company’s management. Our responsibility is to express an opinion on the Company’s consolidated financial statements based on our audits. We are a public accounting firm registered with the Public Company Accounting Oversight Board (United States) (PCAOB) and are required to be independent with respect to the Company in accordance with the U.S. federal securities laws and the applicable rules and regulations of the Securities and Exchange Commission and the PCAOB.
We conducted our audits in accordance with the standards of the PCAOB. Those standards require that we plan and perform the audit to obtain reasonable assurance about whether the consolidated financial statements are free of material misstatement, whether due to error or fraud. The Company is not required to have, nor were we engaged to perform, an audit of its internal control over financial reporting. As part of our audits, we are required to obtain an understanding of internal control over financial reporting but not for the purpose of expressing an opinion on the effectiveness of the Company’s internal control over financial reporting. Accordingly, we express no such opinion.
Our audits included performing procedures to assess the risks of material misstatement of the consolidated financial statements, whether due to error or fraud, and performing procedures that respond to those risks. Such procedures included examining, on a test basis, evidence regarding the amounts and disclosures in the consolidated financial statements. Our audits also included evaluating the accounting principles used and significant estimates made by management, as well as evaluating the overall presentation of the consolidated financial statements. We believe that our audits provide a reasonable basis for our opinion.
Critical Audit Matters
Critical audit matters are matters arising from the current period audit of the consolidated financial statements that were communicated or required to be communicated to the audit committee and that (1) relate to accounts or disclosures that are material to the financial statements and (2) involved our especially challenging, subjective, or complex judgments. We determined that there were no critical audit matters.
/s/
We have served as the Company's since 2016.
March 22, 2022
| 51 |
None.
Evaluation of disclosure controls and procedures
We maintain disclosure controls and procedures (as defined in Rules 13a‑15(e) and 15d‑15(e) under the Securities Exchange Act of 1934, as amended ("Exchange Act")), that are designed to reasonably ensure that information required to be disclosed by us in the reports we file or submit under the Exchange Act is recorded, processed, summarized and reported within the time periods specified in the rules and forms of the Securities and Exchange Commission and that such information is accumulated and communicated to our management, including our principal executive officer and principal financial officer, or persons performing similar functions, as appropriate to allow timely decisions regarding required disclosure. Under the supervision and with the participation of our management, including our Chief Executive Officer and Chief Financial Officer, we evaluated the effectiveness of the design and operation of our disclosure controls and procedures. Based upon that evaluation, the Chief Executive Officer and Chief Financial Officer concluded that, as of the end of the period covered by this Annual Report on Form 10-K, our disclosure controls and procedures were effective.
Management’s report on internal control over financial reporting
Our management is responsible for establishing and maintaining adequate internal control over financial reporting. Our internal control over financial reporting is a process designed to provide reasonable assurance regarding the reliability of financial reporting and the preparation of financial statements for external purposes in accordance with generally accepted accounting principles in the United States of America. Our internal control over financial reporting includes those policies and procedures that (i) pertain to the maintenance of records that, in reasonable detail, accurately and fairly reflect our transactions and dispositions of our assets; (ii) provide reasonable assurance that transactions are recorded as necessary to permit preparation of the financial statements in accordance with generally accepted accounting principles in the United States of America and that our receipts and expenditures are being made only in accordance with authorizations of our management and directors; and (iii) provide reasonable assurance regarding prevention or timely detection of unauthorized acquisition, use or disposition of our assets that could have a material effect on the financial statements.
Internal control over financial reporting cannot provide absolute assurance of achieving financial reporting objectives because of its inherent limitations. Internal control over financial reporting is a process that involves human diligence and is subject to lapses in judgment or breakdowns resulting from human failures. Internal control over financial reporting also can be circumvented by collusion or improper management override. Because of such limitations, there is a risk that material misstatements may not be prevented or detected on a timely basis by internal control over financial reporting. However, these inherent limitations are known features of the financial reporting process. Therefore, it is possible to design into the process safeguards to reduce, although not eliminate, these risks.
Because of its inherent limitations, internal control over financial reporting may not prevent or detect all misstatements. Further, projections of any evaluation of effectiveness to future periods are subject to the risk that controls may become inadequate because of changes in conditions or that the degree of compliance with the policies or procedures may deteriorate.
Management assessed the effectiveness of our internal control over financial reporting as of December 31, 2021. In making this assessment, management used the criteria set forth by the Committee of Sponsoring Organizations of the Treadway Commission (COSO) in “Internal Control—Integrated Framework 2013”. Based on this assessment, management has concluded that our internal control over financial reporting was effective as of December 31, 2021.
Changes in internal control over financial reporting
During the most recent fiscal quarter covered by this Annual Report on Form 10-K, there has been no change in our internal control over financial reporting (as defined in Rule 13a‑15(f) and 15d‑15(f) under the Exchange Act) that has materially affected, or is reasonably likely to materially affect, our internal control over financial reporting.
| 52 |
None.
Not Applicable.
| 53 |
We have adopted a Code of Ethics which applies to our principal executive, accounting and financial officers. The Code of Ethics is published on our website at www.imagesensing.com. Any amendments to the Code of Ethics and waivers of the Code of Ethics for our principal executive, accounting and financial officers will be published on our website.
The sections entitled “Proposal 1 ‑ Election of Directors,” “Audit Committee” and, if applicable, “Delinquent Section 16(a) Reports” in our definitive proxy statement for our 2022 annual meeting of shareholders are incorporated into this Annual Report on Form 10‑K by reference.
The sections entitled “Executive Compensation” and “Director Compensation - 2021” in our definitive proxy statement for the 2022 annual meeting of shareholders are incorporated into this Annual Report on Form 10‑K by reference.
Equity Compensation Plan Information
The following table provides information as of December 31, 2021 about our shares of common stock subject to outstanding awards or available for future awards under our equity compensation plans and arrangements.
|
|
|
|
|
|
|
Number of securities remaining |
|
|
|
|
Number of securities to |
|
Weighted-average exercise |
|
available for future issuance |
|
|
|
|
be issued upon exercise |
|
price of outstanding |
|
under equity compensation plans |
|
|
|
|
of outstanding options, |
|
options, warrants and |
|
(excluding securities reflected in |
|
|
Plan Category |
|
warrants and rights |
|
rights |
|
the first column)(1) |
|
|
|
|
|
|
|
|
|
|
|
Equity compensation plans approved by shareholders |
|
12,000 |
|
$ |
4.90 |
|
245,504 |
|
|
|
|
|
|
|
|
|
(1) The 245,504 shares available for grant under the 2014 Stock Option and Incentive Plan may become the subject of future awards in the form of stock options, stock appreciation rights, restricted stock, performance awards or other stock‑based awards.
The section entitled “Security Ownership of Certain Beneficial Owners and Management” in our definitive proxy statement for the 2022 annual meeting of shareholders is incorporated into this Annual Report on Form 10‑K by reference.
The section entitled “Certain Relationships and Related Transactions” in our definitive proxy statement for the 2022 annual meeting of shareholders is incorporated into this Annual Report on Form 10‑K by reference.
The sections entitled “Audit Fees,” “Audit‑Related Fees,” “Tax Fees,” “All Other Fees” and “Policy on Audit Committee Pre‑Approval of Audit and Permissible Non‑Audit Services Provided by Our Independent Registered Public Accounting Firm” in our definitive proxy statement for our 2022 annual meeting of shareholders are incorporated into this Annual Report on Form 10‑K by reference.
| 54 |
(a) Documents filed as part of this report:
1. Financial statements
The following Consolidated Financial Statements are included in Part II, Item 8. “Financial Statements and Supplementary Data”:
Consolidated Balance Sheets as of December 31, 2021 and 2020
Consolidated Statements of Operations for the years ended December 31, 2021 and 2020
Consolidated Statements of Comprehensive Income for the years ended December 31, 2021 and 2020
Consolidated Statements of Cash Flow for the years ended December 31, 2021 and 2020
Consolidated Statements of Shareholders’ Equity for the years ended December 31, 2021 and 2020
Notes to Consolidated Financial Statements
Report of Independent Registered Public Accounting Firm
2. Financial Statement Schedules:
All financial statement schedules have been omitted because they are not required.
3. Exhibits Required to be Filed by Item 601 of Regulation S-K:
The information called for by this item is incorporated herein by reference to the Exhibit Index in this Annual Report on Form 10-K.
None.
| 55 |
Pursuant to the requirements of Section 13 or 15(d) of the Securities Exchange Act of 1934, the registrant has duly caused this report to be signed on its behalf by the undersigned, thereunto duly authorized.
Autoscope Technologies Corporation
|
/s/ Andrew T. Berger |
Date: March 22, 2022 |
|
|
Andrew T. Berger President and Chief Executive Officer (Principal Executive Officer) |
Each person whose signature to this Annual Report on Form 10‑K appears below hereby constitutes and appoints Andrew T. Berger and Frank G. Hallowell, and each of them, as his true and lawful attorney‑in‑fact and agent, with full power of substitution, to sign on his behalf individually and in the capacity stated below and to perform any acts necessary to be done in order to file all amendments to this Annual Report on Form 10‑K, and any and all instruments or documents filed as part of or in connection with this Annual Report on Form 10‑K or any amendments hereto, and each of the undersigned does hereby ratify and confirm all that said attorney‑in‑fact and agent, or his substitutes, shall do or cause to be done by virtue hereof.
Pursuant to the requirements of the Securities Exchange Act of 1934, this report has been signed below by the following persons on behalf of the registrant and in the capacities and on the dates indicated:
|
/s/ Andrew T. Berger |
|
Date: March 22, 2022 |
|
Andrew T. Berger President and Chief Executive Officer (Principal Executive Officer) |
|
|
|
|
|
|
|
/s/ Frank G. Hallowell |
|
Date: March 22, 2022 |
|
Frank G. Hallowell Chief Financial Officer (Principal Financial Officer and Principal Accounting Officer) |
||
|
|
|
|
|
/s/ Andrew T. Berger |
|
Date: March 22, 2022 |
|
Andrew T. Berger Executive Chairman of the Board of Directors |
|
|
|
|
|
|
|
/s/ James W. Bracke |
|
Date: March 22, 2022 |
|
James W. Bracke Director |
|
|
|
|
|
|
|
/s/ Geoffrey C. Davis |
|
Date: March 22, 2022 |
|
Geoffrey C. Davis Director |
|
|
|
|
|
|
|
/s/ Joseph P. Daly |
|
Date: March 22, 2022 |
|
Joseph P. Daly Lead Independent Director of the Board of Directors |
|
|
|
|
|
|
| /s/ Ezekiel J. Kruglick | Date: March 22, 2022 | |
|
Ezekiel J. Kruglick Director |
||
| /s/ Brian J. VanDerBosch | Date: March 22, 2022 | |
|
Brian J. VanDerBosch Director |
| 56 |
|
Exhibit No. |
Description |
| 2.1 |
|
| 4.3 | Description of Registrant's Securities (filed herewith). |
|
10.1*** |
Form of Distributor Agreement, incorporated by reference to Exhibit 10.1 to the Registration Statement on Form SB-2 of Image Sensing Systems, Inc. (Registration No. 33-90298C) filed on March 15, 1995, as amended (the "Registration Statement"). |
| 57 |
|
10.4*** |
Manufacturing, Distributing and Technology License Agreement dated June 11, 1991 by and between Image Sensing Systems, Inc. and Econolite, incorporated by reference to Exhibit 10.1 to the Registration Statement. |
| 58 |
| 59 |
* Management contract or compensatory plan or arrangement.
** Portions of this exhibit are treated as confidential pursuant to a request for confidential treatment filed by Image Sensing Systems, Inc. with the SEC.
*** Paper filing
Copies of all exhibits not attached will be furnished without charge upon written request to the Company at the address set forth on the cover page of this Annual Report on Form 10-K.
| 60 |