REGISTRATION STATEMENT PURSUANT TO SECTION 12(b) OR (g) OF THE SECURITIES EXCHANGE ACT OF 1934 |
ANNUAL REPORT PURSUANT TO SECTION 13 OR 15(d) OF THE SECURITIES EXCHANGE ACT OF 1934 |
TRANSITION REPORT PURSUANT TO SECTION 13 OR 15(d) OF THE SECURITIES EXCHANGE ACT OF 1934 |
SHELL COMPANY REPORT PURSUANT TO SECTION 13 OR 15(d) OF THE SECURITIES EXCHANGE ACT OF 1934 |
Title of Class |
Trading Symbol |
Name of Each Exchange on Which Registered | ||
* |
||||
Representing One Ordinary Share, 25p per Ordinary Share |
| * |
Ordinary Shares, 25p par value |
☐ US GAAP |
☒ as Issued by the International Accounting Standards Board |
☐ Other |
| Auditor Firm Id: | 0 |
Auditor Name: | Auditor Location: |
|
|
Pearson Growth through strategic execution Annual report and accounts 2024

|
Growth through strategic execution Pearson is a strong, trusted and diversified business fuelled by a compelling purpose. By executing against our strategy we will continue to enable and enrich lifelong learning journeys while driving growth and delivering value for all our stakeholders. Omar Abbosh Chief Executive
|
Strategic report |
Governance report |
Financial statements |
Other information | |||||
|
|
||||||||

| Strategic report | ||||
| 2 | ||||
| 3 | ||||
| 6 | ||||
| 7 | ||||
| 8 | ||||
| 10 | ||||
| 12 | ||||
| 13 | ||||
| 17 | ||||
| 18 | ||||
| 24 | ||||
| 26 | ||||
| 33 | ||||
| 49 | ||||
| 57 | ||||
| Governance report | ||||
| 68 | ||||
| 113 | ||||
| 137 | ||||
| Financial statements | ||||
| Statement of Directors’ responsibilities | 141 | |||
| Independent auditor’s report to the members of Pearson plc | 142 | |||
| 150 | ||||
| 208 | ||||
| Other information | ||||
| 217 | ||||
| 219 | ||||
| Additional information for US listing purposes | 225 | |||
| 245 | ||||
The strategic report, up to and including page 67, was approved for issue by the Board on 13 March 2025 and signed on its behalf by:
Sally Johnson
Chief Financial Officer
Use this QR code to visit our Pearson plc website where you can find the online version of this report.
|
|
https://plc.pearson.com/en- GB/investors/2024-annual- report-accounts | |
| Annual report and accounts 2024 Pearson plc 1 |
|
Strategic report |
Governance report |
Financial statements |
Other information | |||||
| At a glance
Our purpose
We help people realise the life they imagine through learning. |
|
2024 highlights: Growth through strategic execution
| ||||||||
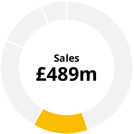
| Sales |
||||||||||
|
£3,552m |
|
|
Strong Group adjusted operating profit margin of 16.9%
| |||||||
|
(2023: £3,674m) headline decrease of 3%
|
||||||||||
|
Underlying sales growth increase of |
|
Strong cash performance, with free cash flow of £490m, and completed a multiyear £500m share buyback
| ||||||||
|
3%*
|
||||||||||
|
Free cash flow conversion** |
||||||||||
|
117% |
|
Scaled AI across our products and services, enhanced and extended the generative AI tools in our Higher Education courseware, and developed new AI tools in English Language Learning and Virtual Learning
| ||||||||
| increase year-on-year of 26%
|
||||||||||
|
Adjusted operating profit |
||||||||||
|
£600m |
||||||||||
| increase year-on-year of 10% |
|
Signed deals with ServiceNow, Degreed, Microsoft and AWS to help employees and organisations prepare for the future of work
| ||||||||
|
* Taking portfolio adjustments and FX into account and excluding the OPM and Strategic Review businesses. ** Free cash flow conversion calculated as free cash flow divided by adjusted earnings.
|
||||||||||
|
What we do |
||||||||||

|
Create and curate |

|
Distribute content digitally |

|
Build and verify | |||||
| Produce assessments Author Learning IP |
Deliver assessments Distribute lessons |
Score assessments Measure skills | ||||||||
| Annual report and accounts 2024 Pearson plc 2 |
|
Strategic report |
Governance report |
Financial statements |
Other information | |||||
| Business unit overviews |
||||||||

Assessment & Qualifications
We deliver world-class testing and certification solutions through four distinct hubs: Pearson VUE, Clinical Assessment, US Student Assessment, and UK & International Qualifications.
Pearson VUE excels as a global leader in scaled testing services, serving a range of industry sectors with an extensive test centre network and flexible delivery options. We meet the critical need for workforce reskilling and professional certification, underpinning professional development.
In Clinical Assessment, we provide high-quality, research-backed assessment products for mental health and learning evaluations, serving the healthcare and education sectors.
Our US Student Assessment business specialises in customised large-scale testing programmes for US K-12 education, focusing on state-specific criteria and providing insights to stakeholders. Outside the US, we offer globally recognised UK-curriculum-based qualifications, such as GCSEs and A levels, as well as courseware for English-speaking regions throughout the world, supporting foundational student progression worldwide. These qualifications, coupled with our content expertise and scale of delivery, make us a key player in shaping global education standards and students’ futures.
In 2024, Assessment & Qualifications continued to demonstrate strong financial performance, growth and overall customer retention. Pearson VUE is expanding its test prep offering and growing its enterprise assessment offering, while US Student Assessment is expanding into the formative assessment space.
In UK & International Qualifications, we are capitalising on the growing demand for international education, and Clinical Assessment is building out its international portfolio, creating new digitally-enabled business subscription models and providing solutions to be used in pharmaceutical trials.
In 2025, we will focus on maintaining our market-leading positions through contract renewals and new wins, while actioning emerging growth opportunities that include movement up the value chain, growth into adjacent market segments and geographic expansion.
Virtual Learning
We provide high-quality, highly accountable online learning solutions for K-12 students through two main offerings: Partner Schools (c.96% sales) and District Partnerships (c.3% sales).
Partner Schools provides tailored virtual school solutions to public K-12 districts in the US, combining Pearson’s courseware, instructional services and support for high-quality, flexible online learning.
District Partnerships offers customisable virtual education solutions for K-12 districts, focusing on smaller student cohorts with a more disaggregated approach than Partner Schools, ensuring access to quality, adaptable remote learning for various needs.
We scaled our career and college readiness programmes and enhanced curriculum in 2024, and will expand the offering portfolio-wide in 2025. We also piloted a new enrolment portal, cutting the average time to enrol in half and driving underlying enrolment growth. Our 2025 goals include scaling our career and college readiness programmes, and continuing to drive efficiencies in enrolment.

| Annual report and accounts 2024 Pearson plc 3 |
|
Strategic report |
Governance report |
Financial statements |
Other information | |||||
| Business unit overviews continued |
||||||||

Higher Education
We are the market leader in providing world-class learning experiences in the post-secondary market. We also compete in select disciplines for students in Secondary School Honours, Advanced Placement, International Baccalaureate, Dual Enrolment and Career and Technical Education (CTE) programmes.
We create teaching and learning experiences that are built on the front end of innovation to deliver positive outcomes at scale.
We bring learning to life for millions of students to help them succeed and create pathways to careers. We also leverage our strong relationships with educators to address their needs.
Our active learning is powered by features including AI study tools, formative assessments, audio and video media and practice modules. Our eText, MyLab and Mastering, and Revel products are created by expert authors, backed by learning science and personalised with interactive features.
In 2024, Higher Education returned to growth and grew adoption share, led by the expansion of AI study tools products in the US.
In 2025, we will focus on continuing to scale AI-enhanced offerings, winning adoption share and expanding our footprint in secondary education (e.g. Honours, Dual Enrolment, CTE), post-secondary and international markets – delivering exceptional value for learners and educators through continuous product innovation.

English Language Learning
We aim to become the world’s leading destination for language learners to build and prove their proficiency in English. Our comprehensive language learning and assessment solutions include institutional courseware, Wizard by Pearson and Mondly by Pearson, designed for varied learning environments. For individuals looking to demonstrate their English proficiency, we provide the Pearson Test of English (PTE), Versant by Pearson and institutional proficiency assessments. We blend pedagogical expertise in English language education with advanced technology to deliver personalised, scalable learning and assessment solutions for individuals pursuing personal, academic, or professional objectives. In 2024, we achieved significant milestones, including the launch of PTE Core, our newest test designed to meet Canada’s specific migration requirements. Wizard by Pearson in Brazil expanded, driven by its new online business and new government partnerships. During the year, we also developed two new AI products: one assisting teachers in generating lesson plans and another offering digital language tutoring. In 2025, we will continue to leverage AI and technology to enhance learning and assessment, with a focus on growth in key regions.

| * | Includes sales from the IT & Professional Learning (ITP) business which will move to the Enterprise Learning and Skills business from January 2025. |
| Annual report and accounts 2024 Pearson plc 4 |
|
Strategic report |
Governance report |
Financial statements |
Other information |

| * |
Excludes sales from the IT & Professional Learning (ITP) business which sat in the Higher Education business in 2024. |
| ** |
In January 2025, Workforce Skills evolved to become Enterprise Learning and Skills, bringing together Pearson’s enterprise sales capabilities globally (excluding those of Pearson VUE) and incorporating IT & Professional Learning (ITP). The Enterprise Learning and Skills business unit will be led by Vishaal Gupta. |
| *** |
Announced in February 2025. |
| **** |
Announced in January 2025. |

Workforce Skills**
We offer career-focused qualifications and enterprise talent solutions through two distinct offerings: Vocational Qualifications (VQ) and Workforce Solutions, which includes the General Education Development (GED) US High School certification alternative. Workforce Skills will evolve to become Enterprise Learning and Skills, incorporating IT & Professional Learning (ITP).
Our VQ business is a global leader in career-focused qualifications, offering programmes that are rooted in real-world work scenarios. These qualifications enable students, apprentices and workers in the UK and globally to develop and apply knowledge, skills and behaviours essential for employability. One in five working-age individuals in the UK holds a BTEC from Pearson, and its vocational qualifications are adopted by ministries of education globally to advance skills reform.
Workforce Solutions addresses the evolving needs of businesses for skilled talent in a rapidly changing economy, including responding to the opportunity and challenge of AI. We assist companies in understanding and bridging their skills gaps, through talent planning and sourcing and genuine skills development to deliver commercial objectives. Workforce Solutions will be renamed Enterprise Solutions from January 2025.
The GED helps individuals enter the workforce and pursue higher education, in addition to enabling employees to advance in their careers. It has over 20m graduates and is recognised across 90 countries.
In 2024, we delivered a strong performance, with our qualifications, learning and skills solutions performing well in institutional and corporate markets. We continued to acquire new customers and expand existing relationships, landing strategic partnerships with ServiceNow, AWS*** and Microsoft**** and expanding our partnership with Degreed.
In 2025, we will develop our talent planning, talent sourcing and talent development solutions, and drive market share by joining up Enterprise go-to-market (GTM) across Pearson and increasing customer value.

| Annual report and accounts 2024 Pearson plc 5 |
|
Strategic report |
Governance report |
Financial statements |
Other information | |||||
|
|
||||||||
Accelerating our AI capabilities
Pearson’s AI-driven innovation spans all our business units and corporate functions, each harnessing AI’s transformative power to enhance learning experiences and drive efficiency and growth.
Each of our AI initiatives has the appropriate strategies and infrastructure in place to ensure that AI is being embraced and utilised in a responsible way. By integrating AI thoughtfully across our products and services, we are positioning Pearson to lead the next generation of learning – where every student can achieve their full potential through intelligent, personalised experiences and every teacher can benefit from maximum support and efficiency, allowing them to focus on pedagogy and students.

|
| Higher Education |
|
We have significantly expanded our AI-powered study tools across Pearson+ eTextbooks, Pearson+ Channels, MyLab and Mastering (MLM). This includes growing the number of eTextbooks and MLM titles that use AI tooling capabilities, as well as adding AI instructor tools to assist educators across a number of MLM titles. Select new AI features include automated creation of content based on a professor’s curriculum, ‘ask the video’ capabilities and quiz-me study tools with AI-generated flashcards.
We have rolled out our AI study tools into global editions of leading higher education titles. |
| Virtual Learning |
|
We have embedded AI study tools into Biology and World History homework questions to provide high school students with step-by-step assistance when they are faced with tricky course material. For teachers, we’ve launched AI-generated custom assessments for high school English Language Arts. The goal is to expand both the student and teacher AI tools to additional grades, including more subjects, as well as adopt the AI study tools from Pearson eTextbooks. |
| English Language Learning |
|
We piloted Smart Lesson Generator, which leverages Pearson’s trusted IP with generative AI to simplify educators’ work and saves them time by creating customised lesson content and activities. In the 2024 pilot with selected institutions, 80% of activated users generated activities to support their lessons. In 2025, the focus will be on enabling educators to create personalised activities tailored to students’ diverse needs, from those requiring extra support to those ready for advanced challenges.
We have also launched an AI-powered Digital Language Tutor, as part of Mondly by Pearson solution bundles, specifically designed to help businesses improve English proficiency at scale and unlock employee potential. The AI-tutor offers highly realistic, personalised training underpinned by trusted learning science, and builds on a successful pilot programme conducted with corporate clients. |
| Group-wide |
|
We are deploying AI-driven code assistance to help the organisation develop and deploy code faster. Transitioning to a unified solution has resulted in consistent, secure coding practices and enhanced AI code generation capabilities. The result is a demonstrable increase in developer productivity and code quality.
Additionally, we are adopting a variety of data and analytical AI solutions to enable better data-driven decision making across our finance functions. Select initiatives include automating intelligent balance sheet reconciliation and adopting AI-enabled propensity to pay models to aid our cash conversion efforts. |

| Annual report and accounts 2024 Pearson plc 6 |
|
Strategic report |
Governance report |
Financial statements |
Other information | |||||
|
|
||||||||
Capitalising on the enterprise opportunity
| At Pearson, we help enterprises lead by enhancing workforce capability in the age of AI.
Organisations need flexible and connected solutions that can effectively prepare tomorrow’s talent and foster resilience. Our enterprise solutions enable people-leaders to plan for, source and develop critical future skills that drive business outcomes and help them remain competitive in today’s dynamic economy.
We help organisations unlock employee potential and trapped value, build agile teams and boost productivity. Our collaborations with global companies and industry leaders position Pearson as a trusted partner in enterprise upskilling.
As the skills landscape continues to shift as a result of transformational trends such as AI and demographic change, we will continue to refine and expand our enterprise capabilities to meet the evolving demands of businesses across multiple sectors.
|
Assessment & Qualifications | |||
|
In 2024, VUE secured several meaningful new enterprise customer contracts and renewals. One notable new customer is a Global Big Tech leader renowned for its comprehensive set of IT certification programmes in Customer Relationship Management (CRM) and Cloud Computing. The contract extends over five years, showcasing our focus on enterprise market expansion.
VUE’s comprehensive suite of services addresses the intricate requirements of multinational organisations, providing end-to-end testing and certification capabilities across diverse technological and geographical landscapes. From establishing sophisticated sponsor systems to creating integrated test administration programmes, we are meeting the rigorous demands of enterprise clients worldwide. Our offerings span both in-person and online testing platforms, proctoring models and web service integrations, enabling us to solve complex challenges for global enterprise customers with precision and technological innovation. | ||||

| Enterprise Learning and Skills |
|
ServiceNow
Pearson is collaborating with ServiceNow to supercharge workforce development and employee experiences in the age of AI. Pearson’s talent intelligence, credentialling and training solutions will allow ServiceNow to enhance learning for its teams and broader communities.
In the first phase of the engagement, ServiceNow will collaborate with Pearson on research and insights that analyse how emerging technologies will impact the workforce and will use Credly by Pearson to transform internal learning accreditation.
This multi-year deal will reshape how ServiceNow employees and professional communities develop critical skills for the AI era, enhancing workforce productivity, agility and adaptability.
Degreed
Pearson’s partnership with Degreed empowers organisations to adapt their workforce skills to rapidly evolving technologies and market dynamics, ensuring long-term business resilience.
We will leverage Faethm data sets into Degreed’s Skills dashboard to offer insights into trending and valuable skills across industries. With this capability, organisations will be able to compare their workforce’s skills to industry benchmarks to identify gaps and prioritise upskilling investments.
Further integration between our respective products holds the promise of improved creation of learning pathways for a new level of market responsiveness. |
| Microsoft
In January 2025, Pearson and Microsoft announced a strategic partnership to address one of the most pressing global challenges: preparing the workforce for the AI-driven economy. This collaboration focuses on equipping employers, workers and learners with innovative AI-powered products and services designed to support skilling and reskilling across industries.
Partnership initiatives centre on personalised learning at scale, expanding existing Microsoft credentials and developing new ones. They include powering Pearson content, assessment, upskilling and certification services with Microsoft Azure Cloud Computing and AI infrastructure, rolling out new AI credentials and certifications, and collaborating on AI-enabled tools to help people develop skills and identify skills gaps while they work.
The partnership also extends Microsoft’s relationship with Pearson VUE through 2029, emphasising a shared commitment to advancing skills development globally.
Amazon Web Services (AWS)
In February 2025, Pearson and AWS announced a global partnership to accelerate the delivery of AI-powered learning for millions of people around the world. As a strategic cloud provider to Pearson, AWS provides infrastructure and AI capabilities that enable Pearson to enhance the experience of its products and services and deliver them to learners at scale and speed. Building on a long-standing collaboration, AWS and Pearson are driving innovation in education and skills development to make learning more effective, efficient and accessible. |
| Annual report and accounts 2024 Pearson plc 7 |
|
Strategic report |
Governance report |
Financial statements |
Other information | |||||
|
|
||||||||
| Chair’s note
Pearson has come a long way in the short time that I have had the privilege of serving as its Chair, and I believe its best years lie ahead.
Omid Kordestani
Chair |
| |
| 2024 full year dividend growth 6%
Return on capital in 2024 10.5% |
Overview
I would like to start by thanking all of Pearson’s employees for their great contribution to another successful year under the guidance of Omar Abbosh, Pearson’s new Chief Executive. We have witnessed huge and unprecedented change in our external environment such as the rapid development of AI and the need for upskilling employees, as well as significant progress within Pearson. Our company’s purpose of helping people realise the life they imagine through learning is more relevant than ever, and the business continues to improve its ability to deliver on it.
A year of strong delivery
Pearson set three priorities for 2024: to deliver on market expectations, to sharpen its focus on the enterprise market and to increase the intensity with which it infuses products and services with a wide range of AI capabilities. I am pleased to say that by focusing on these priorities, Pearson has generated strong operational and financial outcomes across its five business units with a strategy to deliver long-term profitable growth.
This has resulted in a strong performance for shareholders, with distributions of £474m through dividends and the share buyback programme, and a total shareholder return for 2024 of 36%. I am confident in Pearson’s ability to continue to deliver attractive sales growth with improving margins and strong cash flows to support both investment and shareholder distributions.
Reflecting on Pearson’s robust performance in 2024, and the Board’s confidence in the outlook for the business, the Board is recommending a 6% increase in the final dividend, for a full-year dividend of 24.0p per share. This will be paid on 9 May 2025 to shareholders on the register on 21 March 2025.
Significant strategic progress
During 2024, the Board oversaw a comprehensive review of Pearson’s business and its markets. This process shone a light on the essence of Pearson and three core elements that span every market it serves: creating and curating content; distributing that content digitally and physically; and building and verifying skills.
| Annual report and accounts 2024 Pearson plc 8 |
|
Strategic report |
Governance report |
Financial statements |
Other information | |||||
|
|
||||||||

In a world that is being shaped by powerful demographic shifts and rapid advances in AI, the review has reinforced the Board’s conviction in Pearson’s vital role as a trusted provider of learning and assessment services and the relevance of our intellectual property. As a digital-first business, Pearson is accelerating its use of AI across the company and using it as a growth driver to improve efficiencies and to enhance learning and assessment services.
The review has also informed Pearson’s potential for growth, and it is re-orienting to take advantage of the growth opportunities in faster-growing adjacent markets in which it is well-positioned to succeed, with a particular focus on early careers and enterprise skilling.
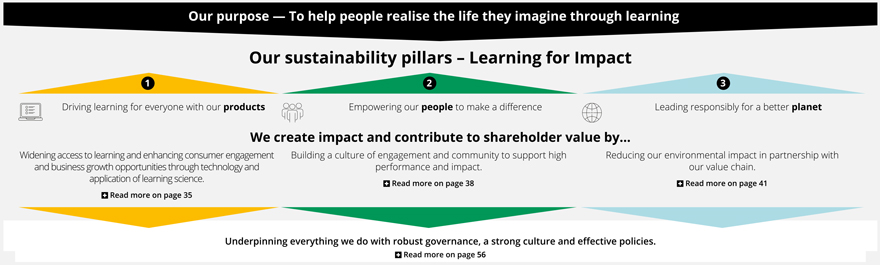
Learning for impact
We know that business success relies on talented employees, who are motivated to lead. Pearson is strengthening its culture of engagement through embedding performance-driven values and behaviours, and empowering people to make a difference, underpinned by our shared belief in the important role we all play in helping people realise the life they imagine through learning. This will support sustained performance over the longer term as we support learning for everyone. Pearson is fully committed to ensuring an ethical and responsible application of advanced technologies in its products and services. It continues to enhance processes and systems to ensure adherence to the highest standards of compliance and reporting.
The Board
Pearson has a strong, effective and highly experienced Board, which offers valuable perspective, insight and leadership. There was one change to the membership of the Board in 2024 as Tim Score stepped down in April from his role as Deputy Chair and Senior Independent Director. I would like to thank him again for his long-serving contribution to Pearson, and I am delighted that Graeme Pitkethly has taken over as Deputy Chair and Senior Independent Director.
Governance
We have interacted with shareholders over the past year on a range of topics including strategy, corporate governance, environmental and social issues, as well as operational and financial performance. As ever, we take on board their feedback and seek to enhance our disclosures in the Annual Report. This is a journey of continuous improvement, and I look forward to hearing how we can continue to develop our approach.
As a Board, we are also committed to ongoing dialogue with our shareholders on remuneration, and in 2024 our outreach covered shareholders representing over 80% of Pearson’s equity as well as certain proxy agencies and representative groups. We would like to thank all those who have participated in this engagement who provided us with constructive feedback. While there is a diverse range of views on this topic, a clear majority support our approach, which is designed to enable the business to attract and retain the talent required to drive Pearson’s success. A number of shareholders have suggested that it would be beneficial to provide more comprehensive narrative disclosure on our engagement activities, our response to feedback, and the talent markets that inform our remuneration policies. We have sought to do this in the Directors’ Remuneration Report on pages 113-136.
Outlook
The Board is pleased with Pearson’s performance in 2024. It is confident that the updates to Pearson’s strategy announced by Omar last year set the business up for sustained profitable growth that will continue to produce attractive returns for shareholders in 2025 and beyond. Pearson has come a long way in the short time that I have had the privilege of serving as its Chair, and I believe its best years lie ahead.
Omid Kordestani
Chair
| Annual report and accounts 2024 Pearson plc 9 |
|
Strategic report |
Governance report |
Financial statements |
Other information | |||||
|
|
||||||||
| Chief Executive’s review |
||
|
|
Pearson is a strong, trusted business that is well positioned to capitalise on emerging opportunities.
Omar Abbosh
Chief Executive
| |
| Adjusted operating profit in 2024
£600m increase year on year of 10% on an underlying basis | ||
Dear Shareholders,
After what has been a busy and exciting first year in my role as CEO, I have been able to dig deep into Pearson, its businesses and the opportunity ahead of us. I am pleased to report that my initial observations of Pearson still ring true. We are a strong business with a platform for growth. The strength of our high-quality content, assessments and qualifications, gives us a strong launch pad for our future aspirations. And, importantly, we are a trusted business and a brand seen as the gold standard in learning.
This year we once again delivered a strong financial performance with underlying sales growth of 3% (excluding OPM and the Strategic Review businesses) and adjusted operating profit of £600m, up 10% compared to 2023. Operating cash conversion was also strong at 110% and we achieved a free cash flow conversion of 117%.
Growth through strategic execution
These results reflect continued strategic progress against the priorities we set at the beginning of the year, along with the ongoing momentum we are seeing across the business. Our focus on execution in 2024 has resulted in a number of crucial wins and has laid the foundation for our future growth, specifically:
| • |
In Assessment & Qualifications, Pearson VUE continued to deliver good growth despite a particularly strong prior-year performance. It also won and renewed a number of key contracts, supporting pipeline growth. PDRI also delivered strong growth following the completion of its acquisition last year. In recognition of the need to better equip professionals and students with AI skills we launched a new Generative AI Foundations certification, to be delivered on Pearson VUE’s online testing platform (OnVUE) and in physical test centres. |
| • |
In English Language Learning (ELL), our Pearson Test of English continues to gain market share, despite challenging market dynamics. Additionally, ELL continues to be a leader in the use of AI across its products. In 2024, we piloted Smart Lesson Generator, to help educators create customised lesson content. And we launched our first AI-powered Digital Language Tutor in our Mondly product in the fourth quarter. |
| Annual report and accounts 2024 Pearson plc 10 |
|
Strategic report |
Governance report |
Financial statements |
Other information | |||||
|
|
||||||||
| • | Higher Education returned to growth this year. This is an important milestone, as the business continues to drive improved execution in sales, while enhancing and expanding the AI tools integrated into our courseware. |
| • | Within Enterprise Learning and Skills, we have signed strategic partnerships with ServiceNow, Degreed, Microsoft and AWS, all of which are designed to address issues that enterprises are facing in talent planning, sourcing and development. These significant, multi-year partnerships are an important part of our commitment to scale in the enterprise market. |
| • | In Virtual Learning, we opened three new schools and added a further 19 career programmes. This brings our total number of schools to 40, with 24 career programmes across 30 states for the 2024/25 academic year. Students now have access to expanded college and career readiness offerings, including through credentials via Credly. |
| • | Across the business, we have implemented and built AI powered tools supporting our efforts in customer service and content generation. We are now putting those into the hands of our people, with the goal of driving increased productivity and efficiencies supporting improved operational performance. |
| • | Finally, we have implemented the foundations of driving a performance culture, with work to distinguish clear career tracks for our people. We are also optimising organisational spans of control within our management structure which has identified additional operational efficiencies within the business. |
Closing the skills gap
As I’ve gotten to know the business and the environment in which we operate, I’ve been telling you about two seismic trends shaping learning and work: the breathtaking pace of AI change and massive demographic shifts. These are creating a global skills gap that, without intervention, risks becoming a global skills chasm. Pearson is uniquely placed to help solve this issue and create more opportunities for millions of people at all stages of their lives. This, in turn, creates opportunity for Pearson.
We see evidence of this as we increase our focus on the enterprise market and on our collaboration with partners who can help grow our business and solve important workforce challenges. Our multi-year deal with ServiceNow is aimed at accelerating the identification, development and validation of skills. As part of this, ServiceNow will collaborate with Pearson
on research and insights, while Pearson will use ServiceNow’s AI powered Now Platform to boost employee productivity, efficiency and talent retention.
Our renewed partnership with Microsoft extends the commercial relationship with Pearson VUE, drives incremental growth and provides an opportunity for us to enhance our AI and technology capabilities across the business. Importantly, it also addresses one of the key challenges facing organisations today: skilling in the age of AI. Together, we will launch a series of strategic, go-to-market collaborations aimed at helping people build AI proficiency. This way we drive joint innovation and growth for both companies.
Pearson also announced the expansion of the company’s long-standing strategic partnership with AWS, which will enhance the learner experience of Pearson products through cloud and AI tools. This partnership allows Pearson to further scale its learning experience products, reaching more learners globally, with more personalised experiences, equipping them with the tools they need to succeed. In addition, this partnership also includes opportunities to co-develop innovative go-to-market products to help propel growth.
You can expect us to continue building the roster of capabilities with some of the world’s leading players.
At the start of 2024, we set out to increase the intensity by which we infuse AI into our products and services. There are some wonderful examples across the business of how we’re integrating AI into our offerings to enhance and personalise experiences for learners and educators.
In Higher Education we have continued to evolve and expand the AI tools embedded into our courseware since launching them in September 2023. We have received very encouraging feedback from students, and early results show that those using the tools were more likely to engage in active studying methods such as note-taking or self-testing. In addition, new tools for higher education faculty are helping them automate time-consuming tasks such as lesson planning. We’ve also applied our AI technology in our Connections Academy schools, where we have embedded AI study tools into our content, providing step-by-step guidance to help high school students through tough material.
I’m particularly encouraged to see the growing commercial momentum of these AI enhanced offerings alongside the strategic enterprise partnerships that we have established.

As we look ahead, our priorities for 2025 won’t stray from what we already have set out to do. We will deliver on market expectations, continue to lead on the application of innovative technologies such as AI, and grow our business across the enterprise customer segment.
I am excited about what the future holds and I believe that Pearson – fuelled by our purpose of helping people to realise the life they imagine through learning – is well positioned to capitalise on the opportunities presented by the shifting dynamics within the worlds of education and work.
Omar Abbosh
Chief Executive
| Annual report and accounts 2024 Pearson plc 11 |
|
Strategic report |
Governance report |
Financial statements |
Other information | |||||
| Strategic framework |
||||||||
An integrated strategy
Overview summary
As the world’s lifelong learning company, we are committed to delivering on our mission of helping individuals realise the life they imagine, through learning. To do this, we are leveraging the strength of our brand and depth of our thought leadership to execute a simple but powerful strategy built on three interconnected pillars: (i) unlocking value from our core business, (ii) driving execution synergies, and (iii) capitalising on medium-term growth vectors.
We have a strong core business in Assessments & Verification, which is a significant part of our business today. By focusing on organic growth and performance management, we will continue to drive value by scaling our presence across multiple verticals and solution types. We are also prioritising targeted market expansion via capital allocation to faster growth segments and driving operational performance through areas ranging from sales, to sales operations, go-to-market execution and process optimisation, all leveraging the power of AI.
In addition to this focus, we will unlock additional value through execution-based synergies across all our business units, specifically from bundling products and services, a modern approach to software and product development, and a focus on strategic partnerships.
Finally, we will drive incremental growth by building on two critical growth vectors: demographic shifts and the expansion of AI, which we’ll capture through additional solutions for Early Careers and Enterprise Skilling.
In Early Careers, we see a strong need for new approaches and alliances for talent development, based around career and technical education and apprenticeships, along with partnerships with educational institutions and enterprises. We continue to see the Enterprise Skilling market as significant, and we have several relevant capabilities that will scale through expanded go-to-market capabilities.
We will support these strategies through several operational enhancements. First, we have established a capital allocation approach that will invest more quickly into higher-growth segments and contribute to a higher, more sustained growth rate for the business over time. Second, we will maintain a deep focus on product innovation and aggressive deployment of modern technology, built upon our robust data and AI capabilities. Finally, we will lean on the excellence of our people and increase our execution orientation through a performance-based culture that will drive increased customer centricity, investment in our leaders and external collaboration in pursuit of value.
Pearson’s Integrated Strategic Framework
| Why |
The World’s Lifelong Learning Company
Helping people realise the life they imagine through learning
| |||||||||||||
| What |
Core
|
Assessments & Verification | ||||||||||||
|
Synergies
|
Product Bundling |
| |
Product |
| |
Strategic | |||||||||
|
Growth Pillars
|
Early Careers |
| |
Enterprise Skilling | |||||||||||
|
How
|
Capital Allocation |
| |
Innovation |
| |
Performance Culture | |||||||||
| Annual report and accounts 2024 Pearson plc 12 |
|
Strategic report |
Governance report |
Financial statements |
Other information | |||||
|
|
||||||||

Our business model and value drivers [Graphic Appears Here] Strategic report Governance report Financial statements Other information A powerful why Helping People Realise The Life They Imagine Through Learning Brand Our brand stands as a symbol of trust, respect and excellence, embodying the quality that defines our company and strengthens our position in the marketplace. Thought Leadership Our industry and customer knowledge allows us to be a global thought leader. We develop deep, rigorous and analytical perspectives, share domain insights and shape the conversation on key trends. why Our stakeholders [Graphic Appears Here] Learning is a very human trait. Like sleep and nutrition, learning is vital in our lives, and we know that when we learn more, we get happier, we get healthier, we live longer and we can earn more. Economically Socially Purposefully Emotionally Physically Cognitively Learning * See pages 24 and 25 for our KPIs. Annual report and accounts 2024 Pearson plc 13
|
Strategic report |
Governance report |
Financial statements |
Other information | |||||
|
|
||||||||

Strategic report Governance report Financial statements Other information Our business model and value drivers continued What we’re doing to progress against our strategy Progress in FY24 We built on our strengths in Assessments & Verification by enhancing our AI tools and capabilities, exploring opportunities for geographic and vertical sector expansion, driving cross-selling and assembling dedicated product and sales teams to support key growth initiatives. These efforts were underpinned by our unwavering commitment to maintaining customer trust and delivering a consistently high level of operational excellence. We reconfigured our incentive schemes, encouraging sales teams to bundle products and make it easier for customers to purchase them. We targeted the enterprise sector, where we built bundled solutions to address hiring and skill development challenges, streamline badge issuance and simplify contracting, while also bundling formative and summative assessment products in the US Student Assessment space. We are adopting modern approaches to product design, development and deployment to drive sales and margin synergies. This includes platform modernisation, common services and data platforms, harmonised tech stacks and the adoption of tooling best practices, with an early achievement being the launch of our Digital Language Tutor. Our new ‘Product Excellence’ programme provides centralised oversight and governance, ensuring consistent quality and continued leadership in the application of innovative technology, like GenAI. We are distinguishing between transactional and strategic relationships, opening up possibilities for reciprocal trade, joint go-to-market and joint innovation, while simultaneously consolidating vendor spend. We’ve expanded several relationships, including those with Microsoft and AWS, which are set to drive transformative change across our business Plans for FY25 We plan to expand our market presence by strengthening our formative assessment capabilities, while broadening our enterprise customer base through pre-hire assessments that support talent acquisition and workforce development. We are also building a strategy around the future of assessment and exploring new expansion opportunities across new verticals and solution types. We will expand our focus in enterprise by taking modular, commercial bundles to market, helping companies accelerate skilling in the era of AI. Solutions will integrate into existing talent lifecycles and tech stacks, addressing core challenges for business executives and HR teams. We will also implement key account management processes to enable more seamless experiences for our top customers. We are extending our platform modernisation initiatives to the enterprise sector, leveraging AI to enhance learning and experience platforms. We will improve our data architecture, establish a robust, enduring product governance framework and align the organisation to a unified architecture. Our adaptive product roadmap review cycle will drive courseware evolution and an optimised product mix while we continue to implement AI and data-driven solutions for content generation, enablement and customer support. We will focus on maximising value from our recently announced partnerships with Microsoft and AWS, while also finalising agreements with new strategic partners. We intend to leverage the capabilities and expertise of our key partners to drive scale, enhance our go-to-market strategies and deliver customer solutions aligned with evolving market demands. Annual report and accounts 2024 Pearson plc 14
|
Strategic report |
Governance report |
Financial statements |
Other information | |||||
| What we’re doing to progress against our strategy continued | ||||||||

Strategic report Governance report Financial statements Other information What we’re doing to progress against our strategy continued Growth driver Early Careers Progress in FY24 We continued to build upon our unrivalled intellectual property and expertise in GED and vocational qualifications, grow our virtual career and technical education offering, and invest in our strong network of institutional and enterprise partners. We shared thought leadership focused on the future of work, implications of technological advancements and evolving roles of governments, educational institutions and enterprises. These efforts enabled us to support key stakeholders as they navigate the transformative impact of AI and demographic shifts on the future workforce. What Growth Pillars Enterprise Skilling We demonstrated our commitment to growth in the enterprise skilling space through dedicated efforts to address several enterprise needs, including pre-assessing new employees, identifying high-value skills and aptitudes for early careers, creating learning and upskilling pathways, and supporting the redesign of the future workforce. Our recent collaborations with ServiceNow and Degreed, as well as the creation of Faethm’s patented skill proficiency framework, further exemplify our commitment to impactful human capital investment. Plans for FY25 We are advancing our commitment to future workforce readiness, launching new learning solutions that leverage our extensive career, technical, and professional content and expertise. We are also expanding industry association and employer partnerships to address critical skill gaps and labour shortages, and expand the scope of education pathways to employability. The formation of Enterprise Learning and Skills as a dedicated business unit will enable a more focused execution model. We will continue to develop end-to-end enterprise skilling solutions that enable people-leaders to plan for, source, and develop future skills that drive business transformation and unlock employee potential. We will leverage our data analytics and insights capabilities to enable personalisation, while leveraging strategic partnerships and our new enterprise sales organisation to streamline go-to-market and enable flexible, cohesive offerings for our customers. strategy is evolving to drive value existing strengths while addressing emerging opportunities in order to deliver sustainable growth. Sue Kolloru Barger Chief Strategy Officer Annual report and accounts 2024 Pearson plc 15
|
Strategic report |
Governance report |
Financial statements |
Other information | |||||
|
|
||||||||

How we create long-term stakeholder value Our operational foundations People Our people are the driving force behind our mission, passionately dedicated to empowering learners worldwide. Their commitment and expertise form the foundation of our success, shaping who we are and what we achieve as a company. Performance Culture Partners Our partners share Pearson’s values and commitment to education. Our strong relationships with governments, customers, non-governmental organisations (NGOs) and other global organisations help us to amplify our positive impact on learners around the world. Data & Insight Through the effective and responsible use of data, we are able to know our customers better and serve them more effectively. We are further developing our capabilities in data analytics and insights to help identify skill gaps and provide compelling solutions to workforce challenges. How Innovation R&D and Product Innovation Our dedicated learning efficacy and product teams are committed to creating learning products that offer a great user experience and improved learning outcomes. Through ongoing innovation and Research and Development (R&D), we develop and incorporate the most advanced technologies, including generative AI, into our products and services. Artificial Intelligence We are integrating AI-driven tools across the company to enhance learning outcomes, personalise educational experiences and streamline operations. Our AI tools cater to both students and educators, enabling effective, impactful learning to take place at every stage of the educational journey. Capital Allocation Capital Allocation We align our investment priorities around where we see the best opportunities for growth and returns. Firstly, Assessments & Verification and then Enterprise Skills and Early Careers. English Language Learning is relevant to each of these areas of investment focus. We will remain committed to the needs, interests and development of our people and partners by continuing to invest in their growth, including in the evolution of our career architecture, pathways and internal mobility processes aimed at helping our people connect, learn and reskill. We will continue to explore new technologies and methodologies to enhance learning experiences and outcomes, while also leveraging our innovation architecture to systematically identify, experiment with, and scale innovations to build a strong foundation for long-term growth. Through this journey, we will remain committed to responsible AI and ethical data practices, ensuring transparency, fairness and impact in education. We will invest both organically and inorganically in high-growth segments to contribute to a higher, sustained growth rate over time, while keeping a net debt to EBITDA of around two times on average and upholding our dividend policy.
|
Strategic report |
Governance report |
Financial statements |
Other information | |||||
Evolving our brand

As the world’s lifelong learning company, our purpose is clear: to help people realise the life they imagine through learning. This isn’t just what we do, it’s who we are, and we must reflect this in how we show up every day. With a focused business strategy that positions us for growth, we’re seizing the moment to make our brand the driver it should be – a force that accelerates our ambitions and brings clarity and strength to everything we do.
We will launch our new brand in 2025, taking bold steps to strengthen our position as the leader in lifelong learning. We have developed a comprehensive brand strategy that not only differentiates us in a competitive marketplace but also amplifies the value we bring to our customers and stakeholders. We see a significant opportunity to reframe how people think about the role learning plays in their lives, elevating it to be as vital as sleep, nutrition and exercise. While achieving a specific grade, securing a new job or upskilling a workforce are significant outcomes, learning science has shown us that the effects are even more far-reaching. The research shows us that learning impacts us cognitively, physically, emotionally, purposefully, socially and economically. Our brand strategy is designed to highlight the true power of learning, its multi-faceted outcomes and our unique expertise, cementing our role as the partner of choice for learners and customers worldwide.
At the heart of this transformation is a new visual identity that unifies our portfolio under a modern, cohesive and impactful presence. Our refreshed brand will present us as a breakthrough leader, making it easier for our customers to understand and navigate the breadth of what we offer.
This clarity will drive deeper connections with our audiences, ensuring that we continue to stand out in the crowded landscape of learning and assessments.
We recognise that rolling out a new brand is a strategic journey, not an overnight change. To maximise its impact, we will implement this transformation in carefully planned phases, beginning with the areas that are most critical to our growth. This includes a focused emphasis on enabling key initiatives such as Enterprise Skilling and Early Careers – two segments where we see significant opportunities to expand our reach and deliver measurable value. By aligning our brand launch with these priorities, we are positioning ourselves to accelerate growth and enhance our impact on individual learners and organisations alike.
As we move forward, our new brand will be a powerful engine for progress, supporting our purpose and company behaviours. This evolution marks a significant milestone in our journey, underscoring our commitment to driving innovation and delivering meaningful outcomes for all those we serve.


| Annual report and accounts 2024 Pearson plc 17 |
|
Strategic report |
Governance report |
Financial statements |
Other information | |||||
| Stakeholder engagement |
||||||||
Engaging with our stakeholders
Pearson has a diverse network of trusted relationships with stakeholders, allowing us to leverage their insights and create real impact. All of these stakeholders – shareholders, educators, employers, business partners, consumers, governments, communities, and employees – can contribute to driving growth for the company while helping people realise the life they imagine through learning.

Why and how we engage
Our engagement with educators not only enables us to better understand the evolving needs of the teaching profession, but also provides unique insights on the needs of learners at all levels. We also draw from the experience of educators to inform the development of our digital tools, which are designed to enhance the teaching and learning experience.
In our Virtual Schools business, our annual teacher and school leader conferences bring together teachers, school staff and Pearson teams to attend sessions facilitated by experts across the learning and education industry.
In our US Student Assessment business, we hold working sessions with educator committees in customer states as assessments are being developed.
In our Higher Education business unit, we employ a full-time team of active faculty advisers dedicated to supporting instructors in the set-up and use of our products. We conducted two surveys with faculty in 2024, measuring and tracking educator sentiment on the use of generative AI in learning and other topics. The business unit delivered nearly one hundred professional development webinars, including some dedicated exclusively to AI, that were attended by thousands of college and university instructors.
In our English Language Learning business unit, we are shaping our AI-powered Smart Lesson Generator tool with input and feedback from educators as part of its development. This tool is designed to help create customised lesson content and activities.
In the UK, we released the third Pearson School Report in 2024, which brings together the perspectives of over 9,000 educators and 2,000 students. The most recent report expanded in size and scope to build an even richer snapshot of life in schools and to articulate how educators are rising to meet challenges while embracing opportunities such as digital innovation.
Outcome of engagement
Our strong relationships with educators act as a differentiator for Pearson and allow us to become a trusted partner to them. Our engagement nurtures a better understanding among educators of our market offering, while also providing us with insights on attitudes and engagement with our products.
Many of our Pearson authors are also educators, as well as experts in their fields. They give us valuable insights about how their own students use our products, and they help us test new ways of using digital tools in the courseware they author.
Our Virtual Schools conferences ensure that educators learn from one another in peer-to-peer engagement, tailoring solutions and exploring learnings that support the needs of students.
In our Higher Education business, our faculty engagement provides ongoing feedback on new AI product features and helps us understand how to best tailor those features to the needs of faculty and students, helping to enhance their learning experience.
The Pearson School Report is another example of how listening to and engaging with educators builds trust and visibility with this important customer group.

|
Strategic report |
Governance report |
Financial statements |
Other information | |||||
|
|
||||||||

Why and how we engage
Employers are a key stakeholder for Pearson, with their views becoming increasingly important as demographic shifts and AI drive demand for new skills and new pools of talent. As a result of these dynamic shifts, we have identified Enterprise as a medium-term growth vector for the business, and ongoing consultation and conversations with employers have helped shape our offering and realise the opportunities we see in this space. We also provide useful insights that help employers understand the evolving labour market and shifting skills demands linked to the impact of AI.
Our Enterprise Learning and Skills business unit helps workers gain the skills they need to boost their employability and open new career opportunities. We also help employers understand, maintain and enhance the value of their most important asset – their people. In our Vocational Qualifications unit, we design Pearson’s BTEC, Higher National and T Level qualifications with relevant sector experts and employers to ensure they cover the most relevant content.
We also provide employers with data, thought leadership and unique insights – shaping their business decisions and helping to raise the profile of Pearson as a leader in workforce upskilling, career learning and development.
This year Pearson VUE will launch its ‘2025 Value of IT Certification Candidate Report’, the ninth in an ongoing series, analysing the experiences of nearly 24,000 professionals worldwide who have earned IT certifications with Pearson VUE. This global study offers insights into why individuals pursue certifications, how they benefit personally and professionally, and the effect on their organisation’s performance.
The Pearson Skills Outlook reports, a thought leadership series that uses data to forecast skills trends, have become an important outreach and engagement tool with employers. Our Skills Outlook reports not only help with lead generation; they also provide data and information to employers and HR managers looking for a deeper understanding of in-demand skills and how they may change in the future.
English Language Learning has also published a large research report in 2024 that analyses the habits of English learners in five countries and explores how employers can better support them in the workplace.
Outcome of engagement
Engagement with employers helps us create offerings that meet the evolving needs of technology-driven labour markets and appeal to large enterprise customers. Specifically, engagement with our enterprise customers is helping us refine our offering and go-to-market approach. For example, we have signed a global multi-year deal with ServiceNow, the AI platform for business transformation, through which we aim to supercharge workforce development and employee experiences in the age of AI.

Why and how we engage
Working with partners that share our belief in doing business responsibly strengthens our supply chain relationships and reduces risk. This helps us to improve our product offerings and progress our commitments.
We continue to analyse the carbon performance of our major suppliers, including the use of language in our major supplier contracts. We regularly engage directly with a targeted pool of suppliers and encourage them to take steps to improve their maturity.
Outcome of engagement
These actions are having a direct impact on how we execute our procurement strategies and help grow our reputation as a responsible business.
We are investing in the success of high-performing organisations and contributing to the decarbonisation progress of those suppliers.
We are also seeking suppliers that enrich Pearson’s products and services with a wider range of perspectives, and further earn the trust of our learners, while also investing in communities

| Annual report and accounts 2024 Pearson plc 19 |
|
Strategic report |
Governance report |
Financial statements |
Other information | |||||
| Stakeholder engagement continued |
||||||||

Why and how we engage
With our efforts to engage more deeply with consumers, Pearson is bringing to life its mission to create vibrant and enriching learning experiences designed for real-life impact. Our interaction with consumers helps us better understand how they use our products, perceive our company and feel about the trends driving learning in an era where digital consumption and AI are shaping the landscape.
We research and engage with consumers holistically by studying how they use our products, how they think and the culture that shapes their behaviour. This includes conducting consumer focus groups and ethnographic research, trend and sentiment analysis, and competitive analysis. We also survey consumers directly to gain unique insights.
This kind of engagement has been used inside Pearson+ and in Mastering to gauge user opinions on the effectiveness of our generative AI study tools.
Our Product teams also engage indirectly with consumers by analysing layers of student usage data and testing enhancements.
Our Connections Academy programme conducted research in 2024 on the impact of school/life balance on career planning, with over 1,000 US K-12 students and over 1,000 US parents.
As part of research on the impact of strong English skills on job satisfaction and pay, Pearson interviewed 1,000 speakers of English as a second or additional language from Japan, Saudi Arabia, Brazil, Italy and Florida (USA). According to 85% of respondents, English is important for their work life, and 88% think it will grow in importance over the next five years.
We are also making a concerted effort to push consumer insights further into the company, through newsletters, employee learning sessions and other resources. This helps us cultivate an ‘outside-in’ approach to understand the people who buy and use our products and services and generates greater awareness of the culture and trends that are impacting our business.
Outcome of engagement
Understanding our consumers allows us to be more effective in how we design and create our products, along with go-to-market strategies and ongoing implementation.
Consumer feedback has been critical in the roll-out of our generative AI tools in our Higher Education Courseware, and we take it into consideration throughout all stages of the product innovation process, including design and development, roll-out and expansion into new titles and continued iteration and feature enhancement.
In autumn 2024, feedback was positive, with 75% of students using the AI study tools ranking them as ‘helpful’ or ‘very helpful’ in achieving their academic goals. Early results also suggest that students who use the study tools are four times as likely to also be regularly employing non-AI study methods in the eText, meaning they are engaging more holistically. Our product managers act on other user feedback to improve AI experiences in real time.

| Annual report and accounts 2024 Pearson plc 20 |
|
Strategic report |
Governance report |
Financial statements |
Other information | |||||
|
|
||||||||

Why and how we engage
Government policymakers across the world are charged with implementing policies to grow and sustain productive economies, ensuring that individuals have the educational and skill-development opportunities to achieve their life goals.
Pearson acts as an important partner to governments, schools, colleges, universities and the business sector to help achieve economic and educational goals within the countries in which we operate. The importance of our assessments means they often operate in highly regulated environments.
Governments everywhere are focused on how to position themselves for the future of work, and how to take advantage of technological advances to provide people with the requisite high-quality education and training that meets the needs of a rapidly evolving workforce.
Increasingly, the rise of AI use – particularly in the labour market – challenges governments to devise sound policies that take advantage of opportunities this technology brings, but also mitigate against risks to the labour force.
Governments need support as economies face labour shortages, particularly in high-demand sectors, and as students and workers seek accelerated learning opportunities and skill development. We engage with governments through meetings and presentations with elected and appointed government officials, and discuss key concepts including the impact of technological innovation on the local labour force, skills-based hiring, certifications and apprenticeships, which are all vital to economic growth in their region.
Outcome of engagement
Our engagement helps inform policy decisions and share best practice in focus areas related to education, training and recruitment. Countries from all regions are prioritising the critical topics of AI, digital transformation and energy transition when developing policies and allocating investment on education and skills.
Accordingly, we work with government leaders in key markets as they develop policies and programmes to meet their economic needs related to skills, training and education.

Why and how we engage
Pearson has a role in increasing access to education around the world through our products and services, as well as our participation in multi-stakeholder initiatives such as the UN Global Compact, WorldSkills UK and the Responsible Media Forum. Enabling more people to learn and develop skills empowers communities and drives socio- economic development.
We are supporting more learners through accessible, technology- enabled solutions. For example, in 2024 we provided immigrants with free access to our Pearson Test of English (PTE) in partnership with Talent Beyond Boundaries, and we offered free career planning and assessment support for girls in Afghanistan through online learning provider Victory Afghanistan.
Our employees engage with their local communities through volunteering, benefitting from five days of paid leave per year to support educational or charitable causes. Credly badges recognise the skills they develop through volunteering. We also piloted interactive sustainability learning sessions with our not-for-profit partners Fresk and Planet on Stage.
Outcome of engagement
Our engagement helps inform policy decisions and share best practice in focus areas related to education, training and recruitment. Countries from all regions are prioritising the critical topics of AI, digital transformation and energy transition when developing policies and allocating investment on education and skills.
In 2024, our employees volunteered over 33,000 hours in support of 360 causes. Employee participation in Learning for Impact activities increased in 2024 to 11%, exceeding the global average.
We also donated $90,360 in humanitarian aid to the American Red Cross for hurricane relief.
Read more about our community engagement initiatives in Learning for Impact on page 38.

|
Strategic report |
Governance report |
Financial statements |
Other information | |||||
| Stakeholder engagement continued |
||||||||


People and culture
We are committed to creating exceptional employee experiences, meaningful career opportunities and a high-performing culture that empowers our people to work in service to our customers. Our purpose is clear: we help people realise the life they imagine through learning.
This is the foundation that makes Pearson a great place to work. We strive to be a company where people bring our purpose to life, raise the bar and advance in their careers. When our people’s needs are met, we believe we can better meet the needs of our customers and drive sustainable growth.
Our business success and ability to positively impact society heavily rely on our people, who are Pearson’s greatest asset. We also know that managers account for as much as 70% of the variance in employee team engagement. We empower our managers with ongoing training and the right tools to foster a culture of engagement and drive performance, so our people can reach their full potential.
At the enterprise level, we regularly communicate with our people through interactive forums, town halls and newsletters.
Outcome of engagement
Throughout 2024, we encouraged managers to hold regular one-to-one meetings with their direct reports. Additionally, in 2024 88% of employees actively participated in our engagement survey with a Grand Mean score of 4.16 on a 5-point Likert scale, up from 82% and 4.09 respectively in 2023.

Why and how we engage
Our shareholders play an important role in both monitoring and safeguarding the governance of our company and in providing access to capital. Some shareholders are also employees, who have a critical role to play in the continued success of our business.
We have strong and constructive relationships with our key institutional investors and shareholders and regularly communicate with them on key issues, including at our financial results, our AGM and at investor meetings and conferences. We held nearly 400 meetings with over 200 institutions over 2024, both virtually and in person, and discussed financial, operational and strategic matters.
Outcome of engagement
Our investors appreciate the time we spend with them providing updates on our strategy and progress, and we continue to develop how to communicate effectively to investors across a range of formats.
Our 2024 AGM was held as a hybrid (combined physical and electronic) meeting, enabling shareholders to participate, ask questions and vote on resolutions via a live webcast, without being physically present.
We have sought to respond to shareholders’ requests to provide more comprehensive narrative disclosure on our engagement activities, our response to feedback, and the talent markets that inform our remuneration policies. You can read more in the Directors’ Remuneration Report on pages 113-136.
| Annual report and accounts 2024 Pearson plc 22 |
|
Strategic report |
Governance report |
Financial statements |
Other information | |||||
|
|
||||||||
| Directors’ duties statement
In accordance with Section 172 of the Companies Act 2006 (see box to the right), the Directors fulfil their duties to promote the success of the company through a well-established governance framework. Typically, in large and complex businesses such as Pearson, this framework includes delegation of day-to-day decision-making to employees of the Group.
This governance framework, summarised throughout this document, is far more than a simple delegation of financial authority, and includes the values and behaviours expected of our employees and business partners, including the standards to which they must adhere; how we engage with stakeholders, including understanding and taking into account their views and concerns; and how the Board ensures that we have a robust system of control and assurance processes in place.
In this annual report, we provide examples of how the Directors promote the success of Pearson while taking into account the consequences of decisions in the long term, building relationships with stakeholders (including our eight key stakeholder groups, as mentioned previously), and ensuring that business is conducted ethically and responsibly.
While there are many parts of this annual report that illustrate how the Directors do this, with the support of the wider business, the following sections in particular are relevant:
• Engaging with our stakeholders (pages 18-22), which outlines:
• How we serve and engage with each of our eight key stakeholder groups, listen to their key concerns and provide our responses.
• How we have adapted our business to meet their needs.
• How we have had regard to the need to foster the company’s business relationships with each of the stakeholder groups. |
• Understanding our stakeholders (pages 84-85), which summarises:
• How Directors have engaged with employees and shareholders, and had regard to their interests.
• Sustainability (pages 33-56), which describes:
• Initiatives through which we strive to enable more engaging learning experiences, that are accessible to more people, and with a smaller carbon footprint.
• Our commitment to creating a culture that prioritises our customers, employees and sustainable procurement practices.
• How we align with widely accepted Sustainability reporting frameworks including GRI, SASB and TCFD. For further details on TCFD reporting, please see pages 44-48.
A continued understanding of the key issues affecting stakeholders is an integral part of the Board’s decision-making process. The insights that the Board gains through its engagement mechanisms form an important part of the context for all the Board’s discussions and decision-making processes. For an insight into how the Board has considered the interests of various stakeholders in its decision-making, and the matters the Directors considered when balancing various stakeholder perspectives, please see our case study on page 86. | |
| Section 172 of the Companies Act
In summary, as required by Section 172 of the Companies Act 2006, a Director of a company must act in the way they consider, in good faith, would most likely promote the success of the company for the benefit of its shareholders as a whole. In doing this, the Director must have regard, among other matters, to:
a. the likely consequences of any decisions in the long term,
b. the interests of the company’s employees,
c. the need to foster the company’s business relationships with suppliers, customers and others,
d. the impact of the company’s operations on the community and environment,
e. the company’s reputation for high standards of business conduct, and
f. the need to act fairly as between members of the company. | ||
| Annual report and accounts 2024 Pearson plc 23 |
|
Strategic report |
Governance report |
Financial statements |
Other information | |||||
| Key performance indicators for 2024 |
||||||||
Monitoring progress

| a. | Measure definition has changed to number of government-funded student enrolments at partner schools within the US as of 30 September 2023. Excludes private-pay students at Pearson Online Academy and district partnerships. This is more closely aligned to business processes. |
| b. | VUE test volumes include PTE and GED tests but sales for each of these tests are reflected in the English Language Learning and Workforce Skills business units respectively. From 2024 Pearson VUE test volumes now include PDRI tests. |
| c. | Previously reported ‘Workforce Skills enterprise customer net retention rate’ which combined Credly and Faethm. Methodology change to only include Credly customer retention going forwardas Faethm is not a retention based business. |
| d. | The net emissions reduction figures have been assured by an independent third-party, SLR Consulting Ltd. % reduction in total tCO2e above is calculated using a location-based methodology. In 2024, we updated our 2018 and 2023 GHG emissions baselines to reflect recent acquisitions and disposals, and to align with changes in data methodology as a result of transitioning to a new emissions data management system. Annual reductions include a 5% reduction in total tCO2e in 2024 vs 2023. |
| “ | Please find further details on our Strategic KPIs here https://plc.pearson.com/en-GB/company/our-targets-kpis |
| Annual report and accounts 2024 Pearson plc 24 |
|
Strategic report |
Governance report |
Financial statements |
Other information | |||||
Delivering results

24 £3,552m 24 £600m 24 £541m 23 £3,674m 23 £573m 23 £498m 22 £3,841m 22 £456m 22 £271m 21 £3,428m 21 £385m 21 £183m 20 £3,397m 20 £313m 20 £411m This is our sales as reported in our income statement. A non-GAAP financial measure that enables management to consistently track the underlying operational performance of the Group. This is our operating profit as reported in our income statement. Operating cash flow R Net cash generated Dividend per share and cash conversiona from operationsb £662m £811m 24.0p 24 £662m (110%) 24 £811m 24 24.0p 23 £587m (102%) 23 £682m 23 22.7p 22 £401m (88%) 22 £527m 22 21.5p 21 £388m (101%) 21 £570m 21 20.5p 20 £315m (101%) 20 £450m 20 19.5p Operating cash flow is an adjusted measure and is presented in order to align the cash flows with corresponding adjusted operating profit measures. This is our net cash generated from operations as reported in our cash flow statement. This is the proposed full year dividend. Our dividend policy is to be progressive and sustainable. Strategic report Governance report Financial Net debt a Adjusted earnings per sharea £853m 62.1p 24 £853m 24 62.1p 23 £744m 23 58.2p 22 £557m 22 51.8p 21 £350m 21 34.9p 20 £463m 20 28.7p This is a non-GAAP financial A non-GAAP financial measure and is used by measure used to evaluate management to assess performance. the Group’s cash position. Total shareholder R Return on capitala R returnsc 36% 10.5% 1 year 36% 24 10.5% 3 year +125% 23 10.3% 5 year +130% 22 8.7% 21 7.9% This is a measure of financial performance of shares over time. A non-GAAP measure of how efficiently we are generating returns from our asset base. statements Other information per share Basic earnings b 64.5p 2464.5p 2353.1p 2232.8p 2123.5pd 2043.7pd A measure of the amount of profit that can be allocated to one share of our common stock. a. See pages [223]-[228] for an explanation and reconciliation of these alternative performance measures and non- GAAP measures. b. Statutory measure c. Source: LSEG Workspace Datastream d. Comparatives were restated in 2022 Note: See pages [223]-[228] for full reconciliation of the alternative performance measures to the equivalent statutory measure. R See how this aligns strategy to management reward: page [118]
| Annual report and accounts 2024 Pearson plc 25 |
|
Strategic report |
Governance report |
Financial statements |
Other information | |||||
|
|
||||||||
| Financial review
|

2024 was another year of good financial performance. The progress we have made over recent years shows real momentum in the business, which gives us confidence in delivering our guidance for 2025 and beyond.
Sally Johnson
Chief Financial Officer
Financial Summary
| £m | 2024 | 2023 | ||||
| Business performance | ||||||
| Sales | 3,552 | 3,674 | ||||
| Adjusted operating profit | 600 | 573 | ||||
| Operating cash flow | 662 | 587 | ||||
| Free cash flow | 490 | 387 | ||||
| Adjusted earnings per share | 62.1p | 58.2p | ||||
| £m | 2024 | 2023 | ||||
| Statutory results | ||||||
| Sales | 3,552 | 3,674 | ||||
| Operating profit | 541 | 498 | ||||
| Profit for the year | 435 | 380 | ||||
| Net cash generated from operations | 811 | 682 | ||||
| Basic earnings per share | 64.5p | 53.1p | ||||
Throughout this section: a) Growth rates are on an underlying basis unless otherwise stated. Underlying growth rates exclude currency movements and portfolio changes; b) The ‘business performance’ measures are non-GAAP measures, and reconciliations to the equivalent statutory heading under IFRS are included in the financial key performance indicators section on pages 219-224; c) Constant exchange rates are calculated by assuming the average FX in the prior year prevailed through the current year.
| Annual report and accounts 2024 Pearson plc 26 |
|
Strategic report |
Governance report |
Financial statements |
Other information | |||||
|
|
||||||||
Group Financial Expectations
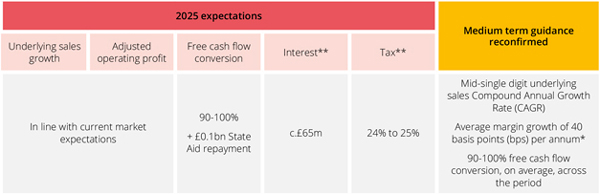
* Adjusted operating profit margins. ** As reflected in adjusted earnings.
NB: 2025 consensus on the Pearson website dated 27 January 2025; underlying sales growth 4.4%, adjusted operating profit of £656m at £:$ 1.23. For reference, each 1c move in USD FX rate equates to £5m of adjusted operating profit.
Operating results
On a headline basis, sales decreased by £122m or 3% from £3,674m in 2023 to £3,552m in 2024 and reported operating profit increased by £43m from £498m in 2023 to £541m in 2024. In addition, adjusted operating profit increased by £27m or 5% from £573m in 2023 to £600m in 2024 (for a reconciliation of this measure see page 28 and note 2 to the consolidated financial statements).
The reported operating profit of £541m in 2024 compares to an operating profit of £498m in 2023 due primarily to unfavourable FX movements, investment and inflation costs being offset by operating leverage on sales growth and cost efficiencies.
The headline basis simply compares the reported results for 2024 with those for 2023. We also present sales and profits on an underlying basis which excludes the effects of exchange, the effect of portfolio changes arising from acquisitions and disposals and the impact of adopting new accounting standards that are not retrospectively applied. Our portfolio change is calculated by excluding sales and profits made by businesses disposed in either 2024 or 2023 and by ensuring the contribution from acquisitions is comparable year on year. Portfolio changes mainly relate to the disposals of the Group’s interests in Pearson Online Learning Services (‘POLS’), Pearson College, our international courseware local publishing business in India and businesses within Higher Education in 2023, and the acquisition of PDRI in 2023.
On an underlying basis, sales increased by 2% in 2024 compared to 2023 and adjusted operating profit increased by 10%. Currency movements decreased sales by £104m and decreased adjusted operating profit by £26m. Portfolio changes decreased sales by £97m and decreased adjusted operating profit by £6m. There were no new accounting standards adopted in 2024 that impacted sales or statutory or adjusted operating profits.
| 2025 outlook
We expect Group underlying sales growth and adjusted operating profit will be in line with current market expectations. Our interest charge will be c.£65m reflecting the impact of the Education Bond and our intention to commence a £350m share buyback. We expect the effective tax rate on adjusted profit before tax to be between 24% and 25%. From January this year, Workforce Skills became Enterprise Learning and Skills, bringing together Pearson’s enterprise sales capabilities globally (excluding those of Pearson VUE).
• In Assessment & Qualifications we expect sales growth of low to mid-single digit.
• In Virtual Learning we expect to return to growth in H2 and the full year, driven by enrolment increases, partially from new school openings, for the 25/26 academic year.
• In Higher Education we expect sales growth in 2025 to be higher than in 2024 as we build on the successful results of our sales team transformation and product innovations, particularly using AI.
• In English Language Learning we expect that sales growth will moderate given the likely impacts of elections on immigration rates in 2025 affecting our PTE business.
• In Enterprise Learning and Skills we expect sales to grow high single digit with Vocational Qualifications seeing solid growth and the addition of several new contracts for Enterprise Solutions.
• Included within this guidance is new investment to support our strategy and drive growth, including brand and innovation spend, as well as transformation costs. This investment is more than offset by the margin on sales growth, and operational improvements which drive the Group’s margin expansion.
• We expect a free cash flow conversion of 90-100% plus the anticipated £0.1bn State Aid repayment in 2025. | ||
| Annual report and accounts 2024 Pearson plc 27 |
|
Strategic report |
Governance report |
Financial statements |
Other information | |||||
| Financial review continued |
||||||||
| All figures in £ millions | 2024 | 2023 | ||||||
| Operating profit |
541 | 498 | ||||||
| Add back: Cost of major reorganisation |
(2 | ) | – | |||||
| Add back: Property charges |
– | 11 | ||||||
| Add back: Intangible charges |
41 | 48 | ||||||
| Add back: UK pension discretionary increases |
13 | – | ||||||
| Add back: Other net gains and losses |
7 | 16 | ||||||
| Adjusted operating profit |
600 | 573 | ||||||
Adjusted operating profit includes the results from discontinued operations when relevant but excludes charges for acquired intangible amortisation and impairment, acquisition related costs, gains and losses arising from disposals, the cost of major reorganisation and associated property charges and one-off costs related to the UK pension scheme. A summary of these adjustments is included below and in more detail in note 2 to the consolidated financial statements.
In 2024, the costs of major reorganisation relate to a release of £2m for amounts previously accrued that are no longer required.
In 2024, there are no property charges. In 2023, charges of £11m relate to impairments of property assets arising from the impact of updates in 2023 to assumptions initially made during the 2022 and 2021 reorganisation programmes.
Intangible amortisation charges in 2024 were £41m compared to a charge of £48m in 2023. This is due to decreased amortisation from recent disposals partially offset by additional amortisation from recent acquisitions.
UK pension discretionary increases in 2024 relate to one-off pension increases awarded to certain cohorts of pensioners in response to the cost of living crisis.
Other net gains and losses in 2024 relate to costs arising from prior year acquisitions and disposals, partially offset by a gain on the partial disposal of an investment in an associate. In 2023, other net gains and losses relate largely to the gain on disposal of the Pearson Online Learning Services (POLS) business and gains relating to the releases of accruals and a provision related to previous acquisitions and disposals, which were more than offset by losses on the disposal of Pearson College and costs related to disposals and acquisitions.
Business Unit Results
| £m | 2024 | 2023 | Headline growth | CER Growth | Underlying growth |
|||||||||||||||
| Sales | ||||||||||||||||||||
| Assessment & Qualifications | 1,591 | 1,559 | 2% | 4% | 3% | |||||||||||||||
| Virtual Learning | 489 | 616 | (21)% | (19)% | (4)% | |||||||||||||||
| Higher Education | 826 | 855 | (3)% | (1)% | 1% | |||||||||||||||
| English Language Learning | 420 | 415 | 1% | 8% | 8% | |||||||||||||||
| Workforce Skills | 226 | 220 | 3% | 4% | 6% | |||||||||||||||
| Strategic Review | – | 9 | (100)% | (100)% | (100)% | |||||||||||||||
| Total | 3,552 | 3,674 | (3)% | 0% | 2% | |||||||||||||||
| Total, excluding OPM1 and Strategic Review2 |
3% | |||||||||||||||||||
| Adjusted operating profit/loss |
||||||||||||||||||||
| Assessment & Qualifications | 368 | 350 | 5% | 8% | 7% | |||||||||||||||
| Virtual Learning | 66 | 76 | (13)% | (9)% | (9)% | |||||||||||||||
| Higher Education | 108 | 110 | (2)% | 2% | 12% | |||||||||||||||
| English Language Learning | 50 | 47 | 6% | 30% | 30% | |||||||||||||||
| Workforce Skills | 8 | (8) | 200% | 188% | 200% | |||||||||||||||
| Strategic Review | – | (2) | 100% | 100% | 100% | |||||||||||||||
| Total | 600 | 573 | 5% | 9% | 10% | |||||||||||||||
| 1. | We completed the sale of the Pearson Online Learning Services (POLS) business in June 2023 and as such have removed it from underlying measures throughout. Within this specific measure we exclude our entire OPM business (POLS and ASU) to aid comparison to guidance. |
| 2. | Strategic Review is sales in international courseware local publishing businesses which have been wound down. As expected, there are no sales in these businesses in 2024. |
Assessment & Qualifications
In Assessment & Qualifications, sales increased 2% on a headline basis and 3% on an underlying basis. Adjusted operating profit increased 7% in underlying terms due to operating leverage on sales growth partially offset by inflation, and 5% in headline terms due to this and portfolio changes partially offset by currency movements.
Pearson VUE sales were up 3% in underlying terms driven by favourable mix, with PDRI seeing good growth. Pearson VUE test volumes remained stable year on year and we improved upon our already high contract renewal track record, reporting a rate of 99% across the business for 2024.
In US Student Assessment, sales increased 1% in underlying terms supported by several key contract renewals.
| Annual report and accounts 2024 Pearson plc 28 |
|
Strategic report |
Governance report |
Financial statements |
Other information | |||||
|
|
||||||||
In Clinical Assessment, sales increased 4% in underlying terms due to pricing, digital product growth and successful new product launches.
In UK and International Qualifications, sales increased 8% in underlying terms benefitting from volume, pricing, and International growth.
Virtual Learning
In Virtual Learning, sales decreased 21% on a headline basis primarily due to the final portion of the OPM ASU contract in the first half of 2023, the disposal of the POLS business and currency movements, and 4% on an underlying basis. Adjusted operating profit decreased 9% in underlying terms, with the prior year comparator benefitting from the ASU contract. Adjusted operating profit decreased 13% in headline terms due to this coupled with the disposal of the POLS business and currency movements.
Virtual Schools sales were down 1%, due to the previously announced partner school losses. Enrolments for the 2024/25 academic year were up 4% on a same school basis and we also opened 3 new schools in 2024 taking our total to 40.
Higher Education
In Higher Education, sales decreased 3% on a headline basis and grew 1% on an underlying basis. Adjusted operating profit increased 12% in underlying terms driven primarily by cost savings partially offset by inflation, restructuring charges and one off investment in building a K-12 direct sales channel, and decreased 2% in headline terms due to this, portfolio changes and currency movements.
In the US, sales grew 2% driven by continued gains in adoption share, enrolments, and pricing, partially offset by mix impacts. There was strong growth in Inclusive Access, up 24%, and we delivered 3% growth in US digital subscriptions. Pearson+ registered users increased 1% compared to the prior Fall semester, with paid subscriptions flat over the same period. In addition, we have been successful in monetising our Channels product.
English Language Learning
In English Language Learning, sales were up 1% on a headline basis due to strong growth in Institutional offset by currency movements and 8% on an underlying basis. Adjusted operating profit increased by 30% in underlying terms due to operating leverage on sales and increased 6% in headline terms as this was partially offset by currency movements.
PTE performed well against a tough market backdrop of tightening migration policies. While volumes declined 10% we grew the business and continued to gain market share. Our Institutional business continues to deliver a strong performance especially in the Middle East and Latin America markets. Our Online Self-Study business, Mondly, performed well with paid subscriptions increasing 14% versus the prior year.
Workforce Skills
In Workforce Skills, sales were up 3% on a headline basis and 6% on an underlying basis. The business unit turned profitable in 2024 delivering an adjusted operating profit of £8m due to trading and cost efficiencies.
Sales growth was driven by solid performances in both the Vocational Qualifications and Workforce Solutions businesses. The Vocational Qualifications business grew by 5% in underlying terms. The Workforce Solutions business grew by 6% in underlying terms with the Credly enterprise customer net retention rate increasing to 91%.
Net Finance Costs
Net finance costs increased on a headline basis from a net cost of £5m in 2023 to a net cost of £31m in 2024. The increase is primarily due to increased borrowings and losses on investments held at fair value through profit and loss (FVTPL) compared to gains in 2023, partially offset by gains arising from mark to market movements on derivatives compared to losses in 2023 and the recognition of interest related to the favourable decision on the State Aid matter (see Taxation section and note 7 to the consolidated financial statements for further details).
Adjusted net finance costs reflected in adjusted earnings in 2024 was £45m, compared to £33m in 2023. The difference is primarily due to increased interest costs on borrowings, partially offset by interest recognised in relation to the State Aid matter (see Taxation section and note 7 to the consolidated financial statements for further details).
Net finance income in respect of retirement benefits has been excluded from our adjusted earnings as we believe the income statement presentation does not reflect the economic substance of the underlying assets and liabilities. Also included in the net finance costs (but not in our adjusted measure) are interest costs relating to acquisition or disposal transactions as it is considered part of the acquisition cost or disposal proceeds rather than being reflective of the underlying financing costs of the Group. Foreign exchange, fair value movements on investments classified as FVTPL and other gains and losses on derivatives are excluded from adjusted earnings as they represent short-term fluctuations in market value and are subject to significant volatility. Other gains and losses may not be realised in due course as it is normally the intention to hold the related instruments to maturity. Interest on certain tax provisions is excluded from our adjusted measure in order to mirror the treatment of the underlying tax item. In 2024, the total of these items excluded from adjusted earnings was income of £14m compared to income of £28m in 2023.
| All figures in £ millions | 2024 | 2023 | ||||||
| Adjusted net finance costs |
(45 | ) | (33 | ) | ||||
| Finance income in respect of retirement benefits |
21 | 26 | ||||||
| Fair value movements on investments held at FVTPL |
(11 | ) | 13 | |||||
| Other net finance costs |
4 | (11 | ) | |||||
| Net finance costs |
(31 | ) | (5 | ) | ||||
| Annual report and accounts 2024 Pearson plc 29 |
|
Strategic report |
Governance report |
Financial statements |
Other information | |||||
| Financial review continued |
||||||||
Taxation
The reported tax charge on a statutory basis in 2024 was £75m (14.7%) compared to a £113m charge (23.0%) in 2023. The reduction in the statutory rate of tax in 2024 is principally due to the release of provisions held in relation to the State Aid matter. In September 2024, the Court of Justice of the European Union (‘CJEU’) handed down its decision, finding that no State Aid had been provided and as a consequence annulling the European Commission’s previous decision in full and setting aside the judgment of the EU General Court. In light of the CJEU decision, the Group has now fully released the £63m provision for tax and £5m provision for interest on tax held in relation to this matter, leaving on the balance sheet a receivable for the £97m tax and £8m interest on tax paid under the Charging Notices issued by HMRC in 2021. These receivables have now been reclassified as current assets. In addition, HMRC Guidance issued to facilitate these pending repayments confirms that interest will be paid on the tax element of the amounts previously collected and a £9m interest accrual has also therefore been recorded as mentioned in net finance costs sections above.
The tax on adjusted earnings in 2024 was a charge of £136m (2023: £124m), corresponding to an adjusted effective tax rate on adjusted profit before tax of 24.4% (2023: 23.0%). The increase in the effective rate from the prior year is primarily due to reduced availability of tax credits in key jurisdictions. For a reconciliation of the adjusted measure see the financial key performance indicators section on pages 219-224.
In 2024, there was a net tax payment of £119m (2023: £97m). The overall amount increased due to an increase in profits and a reduction in the level of tax credits available in key territories.
A net deferred tax liability of £11m is recognised in 2024 compared to a net deferred tax liability of £11m in 2023. The current tax creditor principally consists of provisions for tax uncertainties.
Earnings per share
Basic earnings per share is 64.5p in 2024 compared to 53.1p in 2023. The increase in 2024 is mainly due to increased operating profits, decreased tax charges and a decrease in the number of shares following the share buy back, partially offset by increased interest charges.
Adjusted earnings includes adjusted operating profit and adjusted finance and tax charges. The reconciling items between the statutory inputs to earnings per share and the adjusted inputs are discussed in the previous sections.
Adjusted earnings per share is 62.1p in 2024 compared to 58.2p in 2023 reflecting adjusted operating profit growth and the reduction in issued shares as a result of share buybacks, partially offset by increased interest and tax charges.
Other comprehensive income
Included in other comprehensive income are the net exchange differences on translation of foreign operations. The loss on translation of £35m in 2024 compares to a loss in 2023 of £177m. The loss in 2024 arises from an overall weakening of the majority of currencies to which the Group is exposed, partially offset by a slight strengthening of the US dollar. A significant proportion of the Group’s operations are based in the US and the US dollar strengthened in 2024 from an opening rate of £1:$1.27 to a closing rate at the end of 2024 of £1:$1.25. At the end of 2023, the US dollar had weakened from an opening rate of £1:$1.21 to a closing rate of £1:$1.27. The loss in 2023 was driven by this movement in the US dollar.
Also included in other comprehensive income in 2024 is an actuarial gain of £5m in relation to the retirement benefit obligations of the Group. The gain arises mainly from a decrease in liabilities driven by higher discount rates, largely offset by losses on assets and experience losses. The actuarial gain in 2024 of £5m compares to an actuarial loss in 2023 of £85m.
Fair value losses of £2m (2023: gain of £1m) have been recognised in other comprehensive income and relate to movements in the value of investments in listed and unlisted securities held at fair value through other comprehensive income (FVOCI).
In 2023, a gain of £122m was recycled from the currency translation reserve to the income statement in relation to the disposal of the POLS business.
Cash flow and working capital
Net cash generated from operations, was £811m in 2024 compared to £682m in 2023. The increase is largely explained by the drop-through of increased trading profits, a reduction in reorganisation cash outflow and favourable working capital movements.
Our operating cash flow measure is an adjusted measure used to align cash flows with our adjusted profit measures. Compared to net cash generated from operations, this measure excludes reorganisation costs and acquisition costs but includes regular dividends from associates. It also includes capital expenditure on property, plant, equipment and software, and additions to right-of-use assets as well as disposal proceeds from the sale of property, plant, equipment and right-of-use assets (including the impacts of transfers to/from investment in finance lease receivable). In 2024, reorganisation cash outflow was £8m compared to £63m in 2023.
Operating cash flow increased on a headline basis by £75m from £587m in 2023 to £662m in 2024. The increase is largely explained by the drop-through of increased trading profits and favourable working capital.
Free cash flow increased on a headline basis by £103m from £387m in 2023 to £490m in 2024. When compared to operating cash flow, free cash flow includes tax paid, net finance costs paid and net costs paid for major reorganisation.
| Annual report and accounts 2024 Pearson plc 30 |
|
Strategic report |
Governance report |
Financial statements |
Other information | |||||
|
|
||||||||
In 2024, there was an overall £234m increase in cash and cash equivalents compared to a decrease of £234m in 2023. The increase in 2024 is primarily due to the cash inflow from operations of £811m and net proceeds from borrowings of £344m, offset by payments for acquisitions of subsidiaries of £39m, dividends paid of £156m, share buyback programme payments of £318m, other own share purchases of £40m, tax paid of £119m, net interest payments of £45m, capital expenditure on property, plant and equipment and intangibles of £124m, and repayments of lease liabilities of £78m.
| All figures in £ millions | 2024 | 2023 | ||||||
| Net cash generated from operations |
811 | 682 | ||||||
| Dividends from joint ventures and associates |
2 | – | ||||||
| Purchase / disposal of PPE and software |
(118 | ) | (121 | ) | ||||
| Net addition of right-of-use assets |
(46 | ) | (41 | ) | ||||
| Net costs paid for major reorganisation |
8 | 63 | ||||||
| Other net gains and losses |
5 | 4 | ||||||
| Operating cash flow |
662 | 587 | ||||||
| Tax paid |
(119 | ) | (97 | ) | ||||
| Net finance costs paid |
(45 | ) | (40 | ) | ||||
| Net cost paid for major reorganisation |
(8 | ) | (63 | ) | ||||
| Free cash flow |
490 | 387 | ||||||
Liquidity and capital resources
The Group’s net debt increased from £744m at the end of 2023 to £853m at the end of 2024. The increase is largely due to free cash flow being more than offset by the share buy back programme and dividend payments.
In 2024, the Group issued a new £350m 5.375% GBP denominated 10 year Education Bond. The bond was admitted to trading on the London Stock Exchange. The proceeds from the bond will be used to finance or refinance projects or expenditure that meets the Eligible categories set out in the Group’s Social Bond Framework.
At 31 December 2024, the Group had available liquidity of £1.2bn comprising central cash balances and its undrawn $1bn Revolving Credit Facility (RCF) which matures in February 2028, but which has options to extend the maturity to February 2030. In assessing the Group’s liquidity and viability, the Board analysed a variety of downside scenarios including a severe but plausible downside scenario, where the Group is impacted by a combination of all principal risks, as well as reverse stress testing to identify what would be required to either breach covenants or run out of liquidity. The Group would maintain comfortable liquidity headroom and sufficient headroom against covenant requirements during the period under assessment in the severe but plausible scenario, even before modelling the mitigating effect of actions that management would take in the event that these downside risks were to crystallise.
In all scenarios it is assumed that the Revolving Credit Facility is available.
At 31 December 2024, the Group was rated BBB (stable outlook) with Fitch and Baa2 (stable outlook) with Moody’s.
Net debt
| All figures in £ millions | 2024 | 2023 | ||||||
| Cash and cash equivalents (excluding overdrafts) |
543 | 312 | ||||||
| Overdrafts |
– | (3 | ) | |||||
| Investment in finance lease |
83 | 100 | ||||||
| Derivative financial instruments |
(7 | ) | 5 | |||||
| Bonds |
(955 | ) | (611 | ) | ||||
| Lease liabilities |
(517 | ) | (547 | ) | ||||
| Net debt |
(853 | ) | (744 | ) | ||||
Post-retirement benefits
Pearson operates a variety of pension and post-retirement plans. The UK Group pension plan has by far the largest defined benefit section. The Group has some smaller defined benefit sections in the US and Canada but, outside the UK, most of the companies operate defined contribution plans.
The charge to profit in respect of worldwide pensions and post-retirement benefits amounted to £60m in 2024 (2023: £45m), of which a charge of £81m (2023: £71m) was reported in operating profit and income of £21m (2023: £26m) was reported in other net finance costs. In 2024, a charge of £13m related to one-off discretionary pension increases has been excluded from adjusted operating profit.
The overall surplus on UK Group pension plans of £491m at the end of 2023 has decreased to a surplus of £484m at the end of 2024. The decrease has arisen principally due to the one-off discretionary pension increases granted in the year, partially offset by the actuarial gain noted in the other comprehensive income section above. In total, the worldwide net position in respect of pensions and other post-retirement benefits decreased from a net asset of £455m at the end of 2023 to a net asset of £450m at the end of 2024.
| Annual report and accounts 2024 Pearson plc 31 |
|
Strategic report |
Governance report |
Financial statements |
Other information | |||||
| Financial review continued |
||||||||
Businesses acquired and disposed
There were no material acquisitions of subsidiaries in 2024. In March 2023, the Group completed the acquisition of 100% of the share capital of Personnel Decisions Research Institutes, LLC (“PDRI”) for cash consideration of £152m ($187m).
The cash outflow in 2024 relating to acquisitions of subsidiaries was £39m, arising from the payment of deferred consideration in respect of prior year acquisitions, mainly Credly and Mondly, which were acquired in 2022. There were also £5m of acquisition related costs. In addition, there were £7m of cash outflows relating to the acquisition of investments. The cash outflow in 2023 relating to acquisitions of subsidiaries was £171m plus £4m of acquisition costs. In addition, there were cash outflows relating to the acquisition of associates of £5m and investments of £8m.
There were no disposals of subsidiaries in 2024. In 2023, the Group disposed of its interests in its POLS businesses in the US, UK, Australia and India, Pearson College and the international courseware local publishing business in India. In 2024 and 2023, the cash outflow from the disposal of businesses of £7m (2023: £38m) mainly relates to the businesses disposed in 2023.
Dividends
The dividend accounted for in our 2024 financial statements totalling £156m represents the final dividend in respect of 2023 (15.7p) and the interim dividend for 2024 (7.4p). We are proposing a final dividend for 2024 of 16.6p bringing the total paid and payable in respect of 2024 to 24.0p. This final 2024 dividend, which was approved by the Board in February 2025, is subject to approval at the forthcoming AGM. For 2024, the dividend is covered 2.6 times by adjusted earnings.
Share buyback
On 20 September 2023, the Board approved a £300m share buyback programme in order to return capital to shareholders, with a £200m extension being announced by the Group on 1 March 2024. This programme and the extension completed in 2024. During 2024, approximately 32m (2023: 20m) shares were bought back and cancelled at a cost of £318m (2023: £186m). The nominal value of these shares, £8m (2023: £5m), was transferred to the capital redemption reserve, and the remainder of the purchase price was recorded within retained earnings. At 31 December 2024, no further liability remains (2023: £118m) for shares contracted to be repurchased but where the repurchases are still outstanding.
On 27 February 2025, the Board approved a £350m share buyback programme in order to return capital to shareholders.
Climate change
The Group has assessed the impacts of climate change on the Group’s financial statements. The assessment did not identify any material impact on the Group’s significant judgements or estimates, the recoverability of the Group’s assets at 31 December 2024 or the assessment of going concern for the period to June 2026.
Conclusion
2024 performance was in line with expectations, with excellent margin expansion. We saw strong free cashflow and this, combined with our strong balance sheet, means we are announcing a further £350m share buyback.
Our confidence in the future and the strength of the business is reflected in our guidance for 2025 and beyond.

|
Strategic report |
Sustainability
Learning for Impact
Why sustainability matters for Pearson
Significant demographic shifts and rapid advances in AI are increasingly important growth drivers for education and work. There is a growing demand and pressing need for high-quality learning that is available for people of all ages and circumstances.
As the world’s lifelong learning company, enabling transformative learning journeys is fundamental to everything we do. With a constant focus on learner needs and accessibility, we combine content and technology responsibly to improve operational performance and productivity, minimise our environmental impact and ensure that we remain a key player in our industry. This enables us to create engaging products that fuel a desire to learn.
Learning for Impact framework
Our approach to sustainability is founded on our Learning for Impact framework and deeply rooted in our strategy. We strive for impact across three pillars:
| • | Driving learning for everyone with our products. |
| • | Empowering our people to make a difference. |
| • | Leading responsibly for a better planet. |
We continually review and refine our approach, ensuring we prioritise the areas of greatest impact for our business, our learners and other stakeholders – including developing the skills of learners and employees, protecting our consumers’ data and decarbonising our business.
Strong governance and effective policies underpin our approach. Our Reputation & Responsibility Committee (RRC) monitors our environmental and social impact topics, reporting to the Board on our sustainability progress. We keep our governance approach under continuous review to ensure it remains fit for purpose. Read more about our governance structure on pages 96-98.
We measure our progress against material topics and our Learning for Impact framework through our corporate non-financial KPIs (see page 24). Stakeholder engagement ensures we are delivering on our purpose to help people realise the life they imagine through learning. Independent ratings and rankings validate that we are improving shareholder value, while
contributing to a more equitable world. Our KPIs are subject to regular Board review and are linked to Directors’ remuneration (see page 113).
Expanding our impact and outlook
During 2024, we made substantial progress towards our Learning for Impact objectives and laid the foundations to deliver our social and environmental ambitions in 2025 and beyond. Key highlights include:
| • | Actively preparing our business for compliance with the Corporate Sustainability Reporting Directive (CSRD) and additional mandatory reporting requirements. We are finalising our double materiality assessment. |
| • | Increasing use of AI across our portfolio to unlock additional learning opportunities. Pearson remains deeply committed to the responsible use of AI. We focused on further strengthening our policy framework and building partnerships to define best practice and establish common standards. |
| • | Ongoing improvements in employee engagement. Our development programmes have empowered managers and helped them effectively support their teams to drive performance. |
| • | Significant expansion of learning opportunities for all employees, focusing on advanced technologies, leadership and development, helping employees grow their careers and play their part in delivering our strategy. |
| • | Opening up additional employee communication channels, giving our people more opportunities to provide feedback and help shape the future of our business. |
| • | Continuing to use our learning and credentialling platforms to develop the skills individuals in our communities need to thrive, including on AI. |
| • | 5.3% reduction in greenhouse gas (GHG) emissions (since 2023, location-based), moving us even closer to our short-term decarbonisation goals and updating our Climate Action Plan, setting out our long-term path to decarbonisation. |
| • | Launching an Education Bond to support eligible projects targeting hard-to-reach learners and communities. |

We are proud of our 2024 achievements. The following sections expand on our progress and demonstrate how we create value for stakeholders, grow our business and contribute to the UN Sustainable Development Goals (SDGs) through our business model and Learning for Impact framework.
Our main areas of focus in 2025 are:
| • | Ongoing stakeholder engagement to shape the evolution of our Learning for Impact framework and how we measure progress towards our ambitions. |
| • | Establishing new career and performance management frameworks to transform talent development at Pearson, enhancing productivity and career development opportunities and driving growth. |
| • | Developing innovative partnerships that align with our brand and purpose and further benefit learners. |
| • | Enhancing our long-term environmental strategy to reflect our increased use of AI and evolving our technology platforms to continue to run on renewable energy. |
| Annual report and accounts 2024 Pearson plc 33 |
|
Strategic report |
Governance report |
Financial statements |
Other information | |||||
| Sustainability continued |
||||||||
| Measuring progress on our commitments
| ||||||
| Contributing to sustainable development globally
The UN SDGs exist to achieve a better and more sustainable future for all. Through our Learning for Impact framework, we contribute to the following SDGs:
|
Rankings and recognition
Independent rankings help our investors evaluate our performance and management of sustainability risks and opportunities. In 2024, we received the following recognition:
• Sustainalytics. Included in the Global Top 50 list. Again classified as Negligible Risk, ranking as the leading company in our industry.
• S&P CSA (Dow Jones Sustainability Indices). Achieved the best score in our industry and a listing in the S&P Sustainability Yearbook.
• FTSE4Good Index. Constituent of the FTSE4Good Index Series in the top 1% of our sector.
• ISS. Improved our score to B-. | |||||

|
SDG 4 — Quality education. With our focus on lifelong learning, we recognise that Pearson can play a unique role in increasing access to education around the world. We monitor our progress on extending our product reach through our consumer engagement metrics. See page 24. | |||||

|
SDG 8 — Decent work and economic growth. We work closely with governments, educators and employers around the world to build the skills needed for tomorrow’s workforce. For example, over one million professionals have completed AI-related learning on Credly. See page 35. | |||||

|
SDG 10 — Reduced inequalities. We strive to develop inclusive products that support every learner’s needs. Our collaboration with Saint Louis University to develop Inclusio — an AI-powered solution for the visually impaired — is making science, technology, engineering and mathematics more accessible to blind learners. See page 36. | |||||
| Annual report and accounts 2024 Pearson plc 34 |
|
Strategic report |
Governance report |
Financial statements |
Other information | |||||

|
Driving learning for everyone with our products |
The development and adoption of AI and digital technologies rapidly increased in 2024. If applied responsibly, these new technologies can transform access to learning and acquisition of knowledge. At Pearson, we combine technology and best-in-class learning science to bring positive change to the way people learn throughout their lives. We maintain a constant focus on making learning more accessible and engaging to reach more people, from schools to workplaces.
Over 80% of our products are digital or digitally enabled, contributing to overall sales growth in 2024 of 4% (excluding the OPM and Strategic Review businesses).
Access powered by technology
Learning fuels the critical breakthroughs needed to resolve societal challenges and realise personal goals. New technologies can spur more effective learning and remove obstacles that learners face, accelerating progress for individuals, businesses, and wider society. As discussed throughout this report, and summarised on pages 6 and 7, we continue to infuse AI into more products, guided by learning science and our Learning Design Principles, and we are committed to incorporating technology responsibly to enhance learning outcomes.
Pearson is spearheading research into the use of AI in education, sharing our findings and insights on an ongoing basis. Our early studies published in 2024 have revealed that AI study tools may encourage more effective study habits, such as note-taking and self-testing. The research also indicated that students using Pearson’s AI tools engage in more sessions with their eTextbooks than those not using the technology. We presented this research to more than 5,000 registrants at the ED.tech Symposium in October 2024, as part of Pearson’s ongoing efforts to upskill teachers on AI in education. In September 2024, our English Language Learning business ran a webinar series on AI in language teaching. As members of the TeachAI Advisory Committee, we contribute to developing policy resources that help education leaders to mitigate the risks and realise the benefits of AI. We have also started collaborating with TeachAI on a new AI literacy framework.

|
Case study: Building the skills of tomorrow
We are committed to helping learners adapt to workforce changes and supporting businesses to build skills for future success. Our Skills Outlook series explores future skills needs, as well as how AI can increase individual productivity. A dedicated Skills Map of the US explores automation, AI and demographic shifts to help businesses and policymakers prepare for the future.
As more businesses integrate AI into their operations, employees will need to upskill. In 2024, Credly issued its one millionth badge for AI-related learning. We also offer Certiport Gen AI certification and an Extended Project Qualification for young people on AI. Our partnership with Degreed helps businesses identify AI skills gaps and prioritise training needs. Our strategic collaboration with Microsoft will expand learning opportunities, accelerate AI proficiency in the workforce and enable organisations to realise the full value of AI.
English is a critical skill for the global workforce, but it is challenging to accurately define the level of proficiency required for individual roles. Based on Pearson’s Global Scale of English (GSE) framework, GSE Job Profiles set accurate English language benchmarks for nearly 1,400 job roles. This helps to improve candidate matching and reduce time to hire.
|
| Annual report and accounts 2024 Pearson plc 35 |
|
Strategic report | ||
| Sustainability continued | ||
At a national level, policymakers are looking to regulate AI to ensure it is deployed responsibly and ethically. We welcome these initiatives and remain committed to working with policymakers and using our expertise — directly and through forums like TeachAI — to inform debate for the benefit of all learners. Read more about our approach and guidance for employees and business partners on political activity in our Global Government Relations Policy and our Code of Conduct available on our corporate policy hub (https://plc.pearson.com/ en-GB/corporate-policies).
Technology already enables more individuals to learn remotely, and offers opportunities for new and valuable early careers experiences that are essential for a smooth transition into work. We have increased internship and mentoring opportunities for students in our Connections Academy Virtual Schools programme. Our new partnerships with Future Business Leaders of America and SEMI Foundation will give more students an insight into IT and technical careers, providing learners with career direction, confidence and connections, and encouraging them to pursue the jobs in core sectors that are fuelling economic growth.
Responsible and sustainable content
Every day, people trust Pearson to provide learning content that is engaging, credible and supports their development goals. They will only continue to do this if we provide products that are accessible and accurate.
Our Global Content Policy provides clear and consistent guidance for employees and third-party contributors to develop content that is ethical, accurate and adheres to legal requirements. From 2024, the policy includes guidelines for authoring content using AI, including the appropriate tools to use and the processes for reviewing content.
We recognise that with increased digitalisation comes a growing digital divide. As we continue our digital transformation, our priority will be to assess how we bridge this gap and ensure that learners have the resources they need and are not left behind.
Designing accessibility requirements into our products and services
Accessibility is core to our mission to drive lifelong learning for all. We apply best practice from learning and measurement sciences to design and develop products, and to open up education for all. Working with CAST, we have embedded Universal Design for Learning in our Learning Design Principles. We also offer specialist clinical assessments that help to improve diagnosis and treatment for people with cognitive, behavioural and speech conditions, enabling them to access the right support and enjoy lifelong learning.
We have enhanced our accessibility framework in 2024, providing increased guidance on building products to reflect learners’ needs. This will form part of our Global Content Policy from early 2025.
One example of our commitment to accessibility is the work our Braille Services team is undertaking to meticulously transcribe school assessments into Braille to improve accessibility for blind learners. In 2024, we delivered 400,000 pages of tests and examinations. We partnered with Saint Louis University to develop Inclusio, using AI to improve product design and deliver Pearson’s content to blind learners so they can study science, technology, engineering and mathematics.
We are also making science more accessible wherever students are based through our Pearson Interactive Labs — an immersive experience simulating practical laboratory work. Students receive guided feedback as they master new techniques. In 2024, we expanded our offering, with labs for Microbiology and Anatomy & Physiology. For parents from a wide variety of backgrounds, we are enabling them to play an active role in their child’s education. In the US, Spotlight translates student progress reports into multiple languages or user-friendly videos for parents. In 2024, it was named a ‘Cool Tool’ in the EdTech Digest Awards.

|
Case study: Supporting people with ADHD
With an estimated 17 million children and adults with attention deficit hyperactivity disorder (ADHD) in the US alone, there is a growing need to understand the condition. Our ADHD Virtual Summit in October 2024 updated almost 4,000 attendees on the latest ADHD related research and featured practical insights from social media influencers advocating for better ADHD support.
In 2024, Pearson acquired Revibe Technologies, which uses third-party smartwatches to gather insights on behaviours and enables clinicians to tailor therapy. Vibration and text reminders help improve focus, supporting ADHD management. We plan to incorporate Revibe’s technology into Pearson’s clinical assessment tools and resources to improve outcomes for those with ADHD.
|
| Annual report and accounts 2024 Pearson plc 36 |
|
Strategic report |
Governance report |
Financial statements |
Other information | |||||
|
|
||||||||
|
Case study: Education Bond Framework
In September 2024, we launched a £350m education bond to finance initiatives aligned with our Education Bond Framework. The net proceeds will support initiatives that advance UN SDG 4 (Quality education) by:
• Providing access to education and advancing socio- economic development.
• Supporting underserved learners and communities, including people living below the poverty line, those with disabilities and the unemployed.
Potential programmes identified include:
• Delivering teaching, technology, student materials and curriculum development to help provide free online education services through, for example, the Connections Academy.
• Product development for alternative secondary education credentials and foundational learning to enable progress in post-secondary education through, for example, the General Education Development programme.
• Initiatives for those requiring testing for special needs and underserved learners with special needs.
We commit to reporting the allocation and impact of our contributions annually. More information on the Education Bond and future reporting can be found on our website.
|
Data privacy and cyber security
We are committed to ensuring learners can access content safely and securely. This means applying the highest standards to minimise the risk of attacks and to protect the personal information that is entrusted to us.
In 2024, we continued to strengthen our approach, aligning more closely with the National Institute of Standards and Technology (NIST) frameworks for cyber security and data privacy, and met the industry average NIST Cybersecurity Framework score. We have deployed the Cyturus platform to improve management of governance, risk and compliance. In 2025, we will launch a new Trust and Safety Centre, providing greater information to suppliers, business partners and end users on our risk management approach. It will help us demonstrate the protections built into our services and afforded to our learners.
Training on Pearson’s AI, data privacy and cyber security principles is mandatory for all employees. From 2025, we plan to introduce regular short modules, keeping employees up to date as technology and regulations evolve. Through ongoing employee training and our 2024 ‘See Something, Say Something’ campaign, more employees can identify phishing emails, helping to improve our phishing test results and enhance business security.
We have integrated AI into our trust and safety governance framework, ensuring consistent standards across AI, data privacy and cyber security. Our AI guidance supports responsible technology use, while maintaining flexibility to experiment and create the best user experience. It replicates our product development playbook, which supports consistently high data management standards across Pearson.
The playbook is part of our ongoing effort to evolve and strengthen our data management approach to maintain product quality and integrity while making learning safe, affordable and accessible for all.

|
Case study: Empowering the next generation of cyber security professionals
For the last five years, our UK employees have been mentoring students aged 14 and 15 from disadvantaged backgrounds on cyber security and technology, including internationally recognised principles, frameworks and risk management approaches. The mentorships involved a visit to Pearson’s headquarters to put their new knowledge into practice. The programme has inspired students to further their technology careers, with several going on to study at leading UK universities.
|

|
Strategic report |
Governance report |
Financial statements |
Other information | |||||
| Sustainability continued |
||||||||
|
|
Empowering our people to make a difference
|
We aim to foster a culture of performance where everyone can leverage their strengths to create impactful learning and assessment solutions.
Our people strategy has three focus areas:
| • | Employee engagement: driving better employee engagement and high performance |
| • | Investing in talent: providing continuous learning, growth and progress for our employees |
| • | Culture of community: driving a culture of community and aiming for a welcoming culture throughout the company |
These areas are reflected in our non-financial KPIs on page 24, which highlight our annual progress in driving sustainable growth and shareholder value while contributing to a more equitable world. Key human resources policies, including our Human Rights Statements and Modern Slavery Statement, are available on our corporate policy hub (https://plc.pearson.com/en-GB/corporate-policies).
|
Our purpose
We help people realise the life they imagine through learning.
To achieve this, we set out the following essential behaviours that all Pearson employees should embody:
1. Customer centricity
2. Raising the performance bar
3. Exceptional collaboration for value
4. Our leaders inspire
|
Employee engagement
Engaging our employees is essential to ensure they feel heard and valued. We believe empowered employees are more productive and help to create more innovative learning experiences for our consumers. In 2024, we continued prioritising employee engagement across Pearson. We have improved our mean scores for every question in our engagement survey conducted by Gallup, and our overall engagement Grand Mean score increased to 4.16 out of 5 (2023: 4.09). We now rank in the 79th percentile for engagement against similar-sized companies in Gallup’s overall company database.
Communicating across our workforce
With most of our workforce based in the UK and US, we engage with our employees through multiple channels to keep them connected with our growing business. Employees receive updates about Pearson from business unit leaders and the CEO through regular communications, virtual and in-person town halls and the corporate intranet, The Hub. You can learn more about how the Board engages with employees on page 85.
Our nine voluntary and employee-led Employee Resource Groups (ERGs) are open to everyone and help foster a supportive workplace culture at Pearson, as well as promote collaboration and community. We renewed our focus on working with ERGs to increase network opportunities, offer support to communities in times of need and provide the business with valuable insights and data.
Our workforce consists of regular and limited-term employees (full-time and part-time), casual/seasonal employees (primarily for test scoring) and contingent workers (individual contractors, consultancy workers, and agency workers).
We follow local labour and human rights regulations, including having work councils where needed by regulation.

Employee volunteering
Through our Learning for Impact volunteering programme, we have increased opportunities for employees to foster relationships with educational non-profits and community organisations that align with our mission to provide world-class learning solutions. We now have more targeted events and programmes, both virtual and in-person, which leverage employee skills and resources (skills-based volunteering) to make a meaningful impact within communities. During 2024, we were pleased to note a significant upward trend in volunteer hours, with more than 33,000 hours spent supporting 360 organisations. We also increased our volunteer participation to 11% this year — above the global average of 9.2% according to a recent report.
| Annual report and accounts 2024 Pearson plc 38 |
|
Strategic report |
Governance report |
Financial statements |
Other information | |||||
|
|
||||||||
Investing in talent
Effective employee engagement starts with upskilling our managers, who are essential in ensuring that employees feel heard and valued. We invest heavily in developing our managers and leaders, empowering them to support our transformation into a digital business with a high-performance culture. In 2024, we continued building manager and leadership capabilities through multiple initiatives:
| • | Coaching for Performance series: 770 employees participated in our peer-led, highly practical events, focused on developing our managers as coaches. |
| • | Leadership Uplift: We introduced new talent assessments using the Pearson Leadership model for Directors and above. Individuals received feedback and are able to access self- paced support and learning or additional coaching. |
| • | Internal forums: We initiated internal leadership forums and manager meet-ups that occur monthly and quarterly, respectively. There are approximately 2,500 line managers and approximately 120 leaders involved in these meetings. |
We measure our progress towards building our managers’ capabilities to act as performance coaches using Gallup’s Coaching Index, combining two questions into an index to assess the extent to which managers exhibit key coaching behaviours. Our Coaching Index score has improved to 4.08 from 3.95 in 2023 (out of 5).
As we transition to a digital-first business, we must continue to encourage our entire workforce to upskill responsibly and attract new talent with diverse skills to fuel our growth. In 2024, we focused on evolving our career architecture, guiding employees to plan their career paths and support learning, aligning their career development with the skills necessary to drive Pearson’s strategy and equipping them for the future of work.
In 2024, we emphasised the importance of technological skills to our employees for future-proofing Pearson. There were over 12,000 attendees at our 2024 Technology Summit across 74 sessions led by external experts and Pearson leaders. We rolled out our Generative AI channel, which enables a broader proportion of our workforce to understand how to use AI in their work to create impactful learning solutions. Since it launched, the channel has had over 5,000 visits and employees have completed over 3,700 modules of learning content.
We continue to develop the next generation of Pearson employees by expanding our opportunities for young people. We have created an Early Careers team in the UK that supports our apprenticeships and internships. These pathways are an investment not only in our employees, but also in the future of our business. We currently have 75 individuals enrolled in our apprenticeship programme. As a result of our efforts, we were finalists for Best Apprenticeship Programme at the 2024 Investors in People Awards.
Our work in continuous employee development is reflected in the increased percentage of employees who agree or strongly agree in our Gallup engagement survey that they have ‘had opportunities to learn and grow’, which rose to 77% from 76% in 2023.
In 2025, we will continue to evolve our people strategy to ensure our employees advance our purpose in an even safer and more uplifting environment.
Culture of engagement
We continue to cultivate an environment of community where everyone at Pearson can thrive. We believe that bringing people from different backgrounds and experiences together helps us create more innovative, effective products for our consumers.
In 2024, we continued to meet the FTSE Women Leaders Review target of 40% of women in leadership roles (defined as the Executive Committee and their direct reports). Our Board diversity reporting is on page 54.
Following the 2023 Parker Review Committee’s ruling for FTSE 350 companies to establish ethnic minority targets by 2027, we continue progressing our goal of 20% ethnic diversity for the Executive Management team and the senior leaders who report to them. Currently, 23% of our Executive Management team and senior leaders in the US and UK self-identify as ethnically diverse.
We are committed to fostering an open and accessible environment where all employees, including those with disabilities, feel supported. In 2024, we revised our reasonable accommodations and accessibility guidelines for employees. We also give full and fair consideration to all applicants and support the continued employment of disabled people, making reasonable adjustments to address individual needs. Recruitment, promotion and training are conducted based on merit, against objective criteria that avoid discrimination.
Our suppliers
Pearson has a long history of working with a broad range of suppliers. The varied perspectives they bring to our products and services help foster innovation and create more robust learning experiences.
|
|
Case study: Volunteering for impact
In 2024, we commissioned Impact Genome to provide an Employee Volunteering Impact Report. The report highlights our commitment to advancing the SDGs through offering dedicated volunteering hours. Our efforts influenced youth development by enhancing educational persistence, fostering essential social-emotional skills, and ensuring access to basic needs, thereby improving overall wellbeing and community engagement:
| |||

|
SDG 4 – Quality education: Employees volunteered 1,855 hours with at least 75 organisations focused on improving educational outcomes, resulting in increased school attendance. | |||

|
SDG 3 – Good health and wellbeing: Employees contributed 1,025 volunteering hours with at least 41 organisations that help young people improve their social-emotional skills, provide access to quality healthcare, and improve mental and physical wellbeing. | |||

|
SDG 2 – Zero hunger: Volunteers invested 771 hours with at least 34 organisations tackling hunger, improving food distribution and access to nutritious meals. | |||
| Annual report and accounts 2024 Pearson plc 39 |
|
Strategic report |
Governance report |
Financial statements |
Other information | |||||
| Sustainability continued |
||||||||
Rewards and benefits
Ensuring our employees feel supported and recognised is a big part of maintaining our high-performance culture. We pride ourselves on our extensive rewards, benefits and wellbeing packages that help us attract and retain the world’s best talent.
We are committed to providing fair and equitable pay and benefits for all our employees. We offer a holistic Total Reward package, underpinned by our guiding pay principles, so that our employees know how pay and benefits are managed and understood at Pearson. As part of our offering, we have consistent and robust reward structures and clear guidelines for determining and rewarding individuals’ contributions.
Our employees are the reason that we continue to be a successful global learning provider, and we want them to share in the value they help create. We encourage employees to become shareholders and owners of Pearson. Around one in five eligible employees choose to save to purchase Pearson shares via our savings-related employee share plans (‘Save for Shares’ and the ‘Employee Stock Purchase Plan’).

Health and wellbeing
Having a positive state of mind and body ensures our employees can thrive at work. To continue providing strong wellbeing benefits we are focused on improving mental health at work and outside of it. We recently launched Pearson’s Global WELL – a digital therapy and wellbeing platform, supported by Unmind and designed by psychologists. The platform is completely confidential. All employees have access to a comprehensive suite of mental health services to help them lead a stress-free and more fulfilling life. We have also launched a global network of wellbeing champions, who led a series of talks for World Mental Health Day on topics including ‘Crafting workplaces where mental health can flourish’.
Our employee health and safety KPIs are reflected in the nine standards in our Global Health and Safety Policy, and performance on those standards is reported to the Board’s Reputation & Responsibility Committee. Our strategy is modelled on best practice and internationally recognised standards, including ISO 45001. Our UK headquarters maintains ISO 45001 certification. In 2024, we commissioned a review of our global occupational health provision to better understand our impacts and provide solutions for our workforce. We are evaluating the findings to assess next steps.

| Annual report and accounts 2024 Pearson plc 40 |
|
Strategic report |
Governance report |
Financial statements |
Other information | |||||

|
Leading responsibly for a better planet |
|
Learning is essential to help people adapt to the realities of climate change. Pearson has an important role to play in supporting global sustainability solutions, and we’re working to position the business to create maximum impact. This year, we aligned our long-term net zero target with the latest climate science, which will support us to drive more meaningful change for our communities and the planet.
Cinthia Nespoli
General Counsel and Executive Leader for Sustainability
|
Our environmental strategy supports us to manage and mitigate negative environmental impacts within our operations and across our value chain. The alignment between our business and environmental strategies provides an exciting opportunity for us across our operations and value chain to achieve our commitments.
Building on a steep decarbonisation journey so far, we have refined our climate targets to better reflect the nature of an increasingly digitally-led business, and align with global milestones. In 2024, our new long-term targets were approved by the Science Based Targets initiative (SBTi), setting us on an externally-validated course to become a net zero organisation by 2050. The following targets drive our strategy:
| • | Achieve a 50% reduction in greenhouse gas (GHG) emissions across our operations and value chain by 2030 from a 2018 baseline. This target was historically approved by the SBTi since its adoption. |
| • | Achieve a 90% reduction in GHG emissions across our value chain and meet our science-based (SBTi approved) net zero target by 2050. |
Our updated Climate Action Plan guides our approach to deliver on our goals. The plan is underpinned by three focus areas, aligned with the three interrelated action areas of the UK Transition Plan Taskforce’s disclosure framework:
| • | Decarbonising our business |
| • | Contributing to an economy-wide transition |
| • | Responding to climate risks and opportunities |
Read more about our journey to net zero in our Climate Action Plan.
(https://plc.pearson.com/en-GB/sustainability/our-sustainability-reporting).
Decarbonising our business and our value chain
Pearson’s business transformation is changing the profile of our environmental impacts. As we build our digital learning capabilities, Pearson will continue to shift away from physical products and services, continuing a path of decarbonisation.
With increased use of AI and other advanced technologies in education, renewable and alternative sources of energy will play an important role in our industry and critically for our technology-based suppliers. We will continue to work with our larger suppliers to align our mutual objectives and encourage their decarbonisation progress.
| 2018 previously reported |
2023 previously reported |
2018 rebaselined figures |
2023 re-stated figures |
2024 |
||||||||||||||||
| Location-based | 584,648 | 321,285 | 425,932 | 265,677 | 251,508 | |||||||||||||||
| Market-based | 548,452 | 307,247 | 399,780 | 253,991 | 238,926 | |||||||||||||||
| Emission reduction (location-based) | -45% | -38% | -41% | |||||||||||||||||
| Emission reduction (market-based) | -44% | -36% | -40% | |||||||||||||||||
During the year, business transformation activities such as changes in our property portfolio, limitations on air travel, adjustments to the talent base and reductions in some key areas of procurement spend, including emission-intensive paper, resulted in marked carbon efficiencies throughout the business.
| Annual report and accounts 2024 Pearson plc 41 |
|
Strategic report |
Governance report |
Financial statements |
Other information | |||||
| Sustainability continued |
||||||||
In 2024, these trends resulted in a 5.3% reduction in location-based GHG emissions compared to 2023. Additionally, there was a 5.9% reduction in market-based GHG emissions compared to 2023. Overall, this amounts to a total reduction of 41% since 2018 for location-based emissions and 40% for market-based emissions, against our 2018 baseline, positioning us to achieve our target of halving our emissions by 2030.
We have already achieved our 2030 target for direct (scope 1) and market-based GHG emissions (scope 2 – emissions from purchased electricity), driven by downsizing our property portfolio, decommissioning emissions-intensive buildings and dismantling our company vehicles fleet.
Reducing our value chain (scope 3) GHG emissions remains a challenge, but is essential to meeting our long-term net zero target. Since 2018, scope 3 emissions have decreased by 39%, reflecting our transition from paper-based to digital supply chains, reduced business travel and adopting a hybrid working model.
In 2024, we updated our 2018 baseline and re-stated our 2023 GHG emissions data to reflect recent acquisitions and disposals, and to align with changes in data methodology as a result of transitioning to a new emissions data management system. This process will improve our data accuracy moving forward.
Our own operations
Ensuring we manage our own operations responsibly is essential to managing our direct impacts.
Process management
We manage our impacts and reduction activities through a ‘Plan – Do – Check – Act’ approach, and in some instances, we use formalised management systems. In 2024, we re-certified our four main UK sites to the ISO 14001 framework (Environmental Management). In addition, our VUE test centres are certified to ISO 22301 standards (Security and Resilience), which have been amended to integrate climate risk analysis. This robust approach allows us to deliver our climate strategy more effectively.
Energy
Energy is a critical resource for Pearson’s future as we minimise our reliance on direct natural resources. Since our scope 1 and 2 GHG emissions primarily come from our buildings, we are improving the energy efficiency of our sites and re-aligning our property portfolio to our business needs. We are focused on having smaller and more shared office spaces globally, which has led to a 10% reduction in our physical footprint in 2024 compared to 2023.
We have also developed stringent environmental requirements for the selection of new buildings, enforceable in 2025, including environmental risk assessments, accessibility requirements, resource efficiency and management of environmental data collection. We purchase 100% of our electricity through green tariffs, on-site generation or Energy Attribute Certificates (EACs).
Since 2022, Pearson has worked to consolidate our data centres, improve their energy efficiency and move to cloud-based data centres, which are more resource efficient. This year, we have shut down three data centres and opened a new, more energy- efficient data centre. The outcomes of our 2024 consolidation actions will impact reporting in 2025.
We will continue to push for industry-wide change by establishing partnerships that support decarbonisation, particularly in the technology sector as we advance our digital transition. We recognise that as part of the shift to renewables, new jobs will require us to upskill not only our existing workforce but also wider stakeholders.
Waste and water
Though our office-based operations have a limited impact on overall water use and waste generation, we are encouraging teams at our largest offices to reduce water and waste at a local level.
Logistics and operations
We continue to increase investment in print-on-demand services instead of holding paper-based inventory, to reduce the risk of overproduction and holding out-of-date content, as well as minimising waste and operational costs.
Moving towards an inventory-free system has reduced our need for warehouse space and freight carriers. We selected our two transport partners due to their strong sustainability credentials, among other business and cost-driven factors. Together, we are working to further optimise our logistics routes.
We are committed to expanding print service agreements where vendors can use local printers, reducing the distance that books are transported (book miles). In 2024, we achieved a reduction of nearly eight million book miles, mainly from air freight.

|
Strategic report |
Governance report |
Financial statements |
Other information | |||||
|
|
||||||||
Our value chain
We believe in doing business with partners who share our commitment to human rights and the environment, as collaborating with our supply chain is essential to leading sustainably and managing any associated risks. We outline our expectations for suppliers in our Responsible Procurement Policy. We also conduct detailed risk assessments of our larger suppliers through the third-party sustainability ratings platform EcoVadis. We continuously monitor our highest-risk suppliers through the EcoVadis IQ tool, covering 90% of our supply chain in 2024.
Supplier engagement
We purchased £1.2bn of goods and services in 2024, with around 80% of our global spend represented by 350 large-scale suppliers. As 93% of our total location-based GHG emissions occur indirectly within our value chain, we see a huge opportunity to support our suppliers to improve their sustainability performance and efficiency. Our Global Procurement team is dedicated to strengthening our ethical, sustainable and efficient procurement practices. It works with our business units to implement an end-to-end supplier engagement process, including assessing performance, driving growth and increasing accountability to accelerate value-chain decarbonisation and efficiency.
Stakeholder engagement
We have an important role to play in delivering the knowledge and skills required for a more sustainable future.
In the UK, Pearson was a co-signatory with other RE100 companies to lobby the UK Government to increase transparency and effectiveness of Renewable Energy Guarantee of Origin (REGO) certificates.
Where applicable, we incorporate sustainability language into our supplier contracts, ensuring continuous improvement and greater transparency in costs and other factors. We have directly engaged with a number of suppliers through one-on-one coaching sessions, supporting them to reduce their environmental impact and future-proof their own workforces. We continue to consolidate our supply chain to ensure we work with the right suppliers that share our purpose and are committed to collaborating on our sustainability and product goals.
Paper sourcing and nature-related impacts
In 2024, our overall paper consumption decreased to 19,255 tonnes (2023: 22,859 tonnes) due to continued digitalisation. We continue to manage the use of paper and print production to
minimise any potential associated environmental impacts in our supply chain.
We remain committed to procuring 100% of our paper from certified sources (FSC, PEFC and SFI) that set standards for sustainable forest management including banning deforestation, enhancing biodiversity and protecting nature – achieving 92% in 2024. We are on track to achieve our target by the end of 2025.
Our Manufacturing Terms of Trade detail our requirements for print suppliers. In 2024, we updated our trade terms for print suppliers to strengthen provisions on piracy, AI tools, carbon maturity, third-party sustainability audits and data protection.
We maintain strong due diligence procedures in our direct supply chain through Book Chain – a tool designed to help companies identify labour and environmental risks in the supply chain. We use Book Chain’s Forest Sourcing and Chemicals & Materials tools to reduce the likelihood of purchasing paper from sources associated with endangered species, reduce our exposure to deforestation and ensure our suppliers are complying with safety legislation. In 2024, we strengthened our process by asking printers to submit an environmental questionnaire through the platform to improve supplier-specific insights and prioritise areas for risk mitigation.
In 2024, we assessed our paper supply chain for human rights and nature-related risks. The results highlighted the importance of robust supply chain data. We see opportunities to drive improvement in this area moving forward, particularly as our supply chain becomes increasingly tech-focused.
Looking ahead, we are focused on further quantifying GHG emissions associated with the use of our digital products, though additional work is required to fully incorporate these emissions into our reduction roadmap.
Contributing to an economy-wide transition
To shape a better tomorrow for people, planet and our company, we must continue collaborating with a wider range of stakeholders to promote collective sustainability action – both within our value chain and beyond. We are active members of the Responsible Media Forum, a partnership of leading media companies dedicated to identifying and addressing our industry’s social and environmental challenges.
We are also looking to build a long-term plan for beyond our value chain mitigation activities. As a lifelong learning company, we have a unique opportunity to develop educational programmes that raise awareness about climate change and support the development of adaptation mechanisms.
Our full set of environmental data and the methodology used for calculations can be found in the sustainability performance tables on page 53.

|
Strategic report |
Governance report |
Financial statements |
Other information | |||||
|
Sustainability continued |
||||||||
Task Force on Climate-related
Financial Disclosures
The following sets out our climate-related financial disclosures in alignment with the four Task Force on Climate-related Financial Disclosures (TCFD) recommendations and the 11 recommended disclosures featured in the ‘Recommendations of the TCFD’ report, together with its subsequent annex and implementation guidelines. We engage with TCFD recommendations to minimise business risk and ensure our continued financial performance and growth.
Governance
Board oversight
The Board has ultimate oversight of Pearson’s climate change strategy, climate-related risks and opportunities and achieving our targets. Responsibility for managing Pearson’s sustainability strategy sits with the Board’s Reputation & Responsibility Committee (RRC). It meets three times a year to develop plans for delivering and embedding the Responsible Business Strategy across the Group (including the climate strategy); to monitor and track progress against plans; to provide support to management, Group leadership and functions on sustainability-related matters; and to discuss recommendations for the wider Board. The RRC receives updates on our greenhouse gas (GHG) emissions twice a year.
Members of the RRC include two Non-Executive Directors who have a deep understanding of climate and sustainability and their impact on our business. The Group Chief Executive is a standing attendee. For information on the Board’s composition and skills profile, see page 70.
Pearson’s other Board Committees work alongside the RRC on several sustainability topics; for example, the link between climate and remuneration or in relation to reporting compliance and audit. Read more about our governance structure and approach, including our organisational structure on climate governance, on pages 97-98.
Strategy management and implementation
Responsibility for identifying, assessing and managing climate-related risks and opportunities is shared across Pearson. Our General Counsel is the Executive sponsor for our sustainability strategy and chairs the Environmental Steering Group, which includes our Chief Financial Officer, Chief Strategy Officer and Head of Procurement. The Environmental Steering Group meets quarterly to review and update our strategy, communicating revised objectives to the rest of the Executive Management team for approval. It also oversees the implementation of our overall carbon reduction plan.
Each business unit has appointed senior representatives to lead sustainability actions and ensure that risks and business opportunities are embedded into planning and business unit management. Pearson’s central sustainability function meets quarterly with business unit management to provide expertise and guidance on implementing carbon reduction activities at both a central and individual business unit level. The Sustainability team is also responsible for monitoring and reporting on our goals, and for representing Pearson in wider partnerships aimed at achieving transformational change.
Throughout our business, we have subject matter experts on specific areas of our climate-related plan. For example, our Global Procurement team engages with our suppliers on a regular basis and ensures relevant policies and procedures exist to enable a transition to a green economy.
Strategy and risk management
Identified risks and management approach
In 2022, we worked with a specialist consultancy, ERM to undertake a group-level climate risk assessment to identify and quantify the potential impacts of climate change risks and opportunities on our business, strategy and financial planning. We refreshed the process in 2024 through an internal review, and included a range of alternative scenarios.
In total, we identified 113 individual climate-related risks and opportunities. We then assigned cross-cutting criteria to each, enabling effective comparison and ensuring coverage of the full business model. We evaluated business impacts and shortlisted the most meaningful risks using an evidence-based approach, drawing on climate scenarios and Pearson’s financial data, to assess their materiality, likelihood and velocity. Finally, we identified Pearson’s management responses and mitigation actions for each of the key risks identified. The shortlist of risks is detailed in Table 1 on page 45.
As part of the 2024 refresh, we updated ERM’s assessment to take into account changes in our Responsible Business Strategy. We also discussed each risk with management to ensure we focus on risks that are most important to Pearson. The conclusion of this exercise was that the risks remain consistent with 2023, as described in Table 1 on page 45.
These risks are integrated into our various risk management processes, depending on the nature of the risk. For example: physical risks are integrated into business continuity planning by the Central Workplace team; the Centralised Procurement team oversees the costs and availability of paper; and other transition risks, such as changes in regulations, are managed by regulatory alert systems held in the legal function. Management of wider stakeholder expectations and stakeholder engagement is a shared responsibility between the Sustainability team and the relevant Communications team.
We have assessed climate-related impacts on the Group’s financial statements, including our commitment to achieve net zero by 2050 and the actions we intend to take to achieve those targets. Our climate risk assessment did not identify any material impact on the Group’s significant judgements or estimates at 31 December 2024, or on the assessment of going concern for the period to June 2026 and the Group’s viability over the next five years.
| Annual report and accounts 2024 Pearson plc 44 |
|
Strategic report |
Governance report |
Financial statements |
Other information | |||||
|
|
||||||||
| Table 1 — Key risks identified | ||||
| Risk description | Scale* | Pearson mitigation actions | ||
| Physical risks | ||||
| Facility damage due to acute hazards:
Two assets included in the physical risk screening have relevant exposure to acute hazards. — Melbourne has present day exposure to a flood; and — Manila experiences a hurricane once every three years on average, with a maximum observed wind speed of 127mph. |
Time frame – short Likelihood – possible Magnitude of impact before any mitigation action – low Magnitude of impact with mitigation actions – low |
We have insurance policies in place that would cover the costs of structural damage and some lost sales. Therefore, the impact is expected to be minimal. | ||
| Wildfire interruption to Assessment & Qualifications:
Wildfire has the potential to trigger widespread disruption to transportation and prevent access to facilities. Our Assessment & Qualifications business unit is not fully digitalised and relies on physical locations for provision of its instruction and examinations. Under a pessimistic warming scenario, wildfire risk may increase across the US, Canada and Australia. |
Time frame – medium Likelihood – likely Magnitude of impact before any mitigation action – low Magnitude of impact with mitigation actions – low |
We have insurance policies in place that would cover the costs of structural damage. Therefore, the impact is expected to be partially mitigated. | ||
| Increased water scarcity:
According to data from WRI Aqueduct, Pearson has a relatively low number of properties with exposure to water scarcity across its portfolio of operating locations. |
Time frame – medium Likelihood – likely Magnitude of impact before any mitigation action – low Magnitude of impact with mitigation actions – low |
We expect water usage to remain minimal, and any increased costs or consumption will be offset by property upgrades (e.g. taps automatically switching off). | ||
| Increased paper costs:
The global paper market is inherently exposed to physical risk, such as exposure to potential increased destruction from thunderstorms, wildfires, hurricanes and flooding. These events can also cause logistical disruptions that further impact the paper market. Accordingly, paper costs may increase. |
Time frame – long Likelihood – likely Magnitude of impact before any mitigation action – moderate Magnitude of impact with mitigation actions – low |
In the short term, pricing changes will be reflected in operational and strategic plans. In the medium term, we expect digital product/service alternatives to be widely available, reducing the need for paper. | ||
| Increased use of cloud services:
Data centres use increasing quantities of electricity and water to cool their systems. As Pearson increases its reliance on digital products and services, exposure to the physical risks of data centres owned by cloud service providers may materialise. For example, this could be increased costs to use services, should data centre owners face increased costs to run and cool their systems. |
Time frame – short Likelihood – likely Magnitude of impact before any mitigation action – low Magnitude of impact with mitigation actions – low |
Mitigation actions would include shifting services to alternative locations or servers. Any incremental increase in costs would be reflected in operational and strategic plans. | ||
| * | Impact scales: |
| Time frame |
Likelihood: | Magnitude of impact | ||
| Short: within 5 years |
Possible | Low: below £5m | ||
| Medium: between 5 – 10 years |
Likely | Moderate: £5m – £20m | ||
| Long: more than 10 years |
High: £20m or above |
| Annual report and accounts 2024 Pearson plc 45 |
|
Strategic report |
Governance report |
Financial statements |
Other information | |||||
| Sustainability continued |
||||||||
| Risk description | Scale* | Pearson mitigation actions | ||
| Transition risks | ||||
| Building efficiency standards:
Buildings efficiency and performance standards are becoming more stringent and are being imposed by regulation. |
Time frame – short Likelihood – likely Magnitude of impact before any mitigation action – low Magnitude of impact with mitigation actions – low |
We continuously update our property strategy, and our selection criteria for newly leased properties is well above minimum building efficiency requirements. | ||
| Procurement of sustainably-certified paper:
There have been issues relating to procurement prices and supply chain shortages during and following the COVID-19 pandemic. |
Time frame – short Likelihood – likely Magnitude of impact before any mitigation action – low Magnitude of impact with mitigation actions – low |
We expect to reduce paper use based on our ongoing digitalisation strategy and the increased availability of digital alternatives. Impact will also be decreased through improved product design and appropriate pricing strategies. Therefore, the impact is expected to be minimal. | ||
| Increased cost EU ETS certificates for mills in Belgium, Germany, Italy and Sweden:
As a result of the Paris Climate Agreement and the resulting Nationally Determined Contributions (NDCs) framework, there will be an increase in cost of EU Emissions Trading System (ETS) certificates as more EU countries work to meet their decarbonisation commitments. This is due to the limited supply of, and growing demand for, ETS certificates. |
Time frame – medium Likelihood – likely Magnitude of impact before any mitigation action – low Magnitude of impact with mitigation actions – low |
The risk of impact is decreased through digitalisation, which assumes a lower ETS exposure level through product design. | ||
| * | Impact scales: |
| Time frame |
Likelihood: | Magnitude of impact | ||
| Short: within 5 years |
Possible | Low: below £5m | ||
| Medium: between 5 – 10 years |
Likely | Moderate: £5m – £20m | ||
| Long: more than 10 years |
High: £20m or above |
| Annual report and accounts 2024 Pearson plc 46 |
|
Strategic report |
Governance report |
Financial statements |
Other information | |||||
|
|
||||||||
Opportunities
There are significant contributions Pearson can make to an economy-wide transition in order to best position the company and our products. In the short and medium term, this includes promoting the use and production of renewable energy. We will ensure our purchase of Energy Attribute Certificates (EACs) is genuinely supporting generation of new or additional renewable energy, and we are working in partnership with our value chain to promote renewable energy consumption. We are also looking to build a long-term plan for beyond our value chain mitigation activities. As a lifelong learning company, we are well-placed to increase awareness about climate change and support the development of adaptation mechanisms through education.
Resilience to climate change
Our climate risk analysis covers multiple time periods up to 2050 to help us assess if and when various scenarios might impact our business model and reflect the critical future dates for reducing GHG emissions. The articulation of short-, medium- and long-term time horizons aligns with our goals and processes. The short-term horizon reflects our risk forecasting process, including our going concern and viability statements. The medium-term horizon to 2030 alludes to the date of our reduction targets, and the long-term horizon marks societal goals for achieving net zero by 2050.
The physical risks to our business were assessed using both the RCP 2.6 scenario (low GHG emissions that keep the world below 2°C warming by 2100, aligned to current commitments under the Paris Climate Agreement), and the RCP 7 scenario (high GHG emissions with average warming greater than 3°C by 2100). Our financial quantification in Table 1 on page 45 was based on a pessimistic scenario such as RCP 7 and IEA Beyond 2°C.
Six physical assets were assessed for exposure to material physical risk. These were chosen because they represent a sample of assets and provide a range of critical Pearson services. Disruption caused or aggravated by climate physical risks could result in delivery failures. Each physical hazard was mapped on a materiality matrix and changes in materiality from 2023 to 2050 were projected.
The analysis concluded that Pearson’s business is moderately vulnerable to climate change from physical risks in the medium and long term. The main areas of exposure are climate change-driven extreme heat and water scarcity, which may affect the operations of cloud-based data centres that play a central role in our business strategy.
Some of Pearson’s physical locations, such as testing centres, are also moderately vulnerable to wildfires or flooding that could impact normal business operations. However, we have business contingency plans, including insurance, in place to reduce our potential financial exposure to such impacts.
The transition risks on Pearson’s business were also assessed using four scenarios from the IEA’s World Energy Outlook 2021 (WEO-2021). The analysis concludes that Pearson is minimally vulnerable to transition risk in the 2030 time frame, but risk increases for longer time horizons across all risk categories.
The main transition risk in the original analysis related to the reputational risk associated with having a net zero target for 2030, which was heavily reliant on offsetting unabated GHG emissions and had not been approved by the Science Based Targets initiative (SBTi). We have since aligned our climate targets with the latest climate science. Our approach is now focused on achieving a 50% reduction in GHG emissions across our operations and supply chain by 2030 from a 2018 baseline, and cutting emissions by 90% across all scopes. Our new long-term net zero target was approved by the SBTi in 2024, setting us on an externally-validated course to becoming a true net zero organisation by 2050.
The transition risks identified in the table on page 46 are mitigated by the opportunities identified in our analysis, including the ongoing digitalisation of our business, developing climate-related educational content and services, and adopting more ambitious reduction plans (see pages 41-43 of this report).
Impacts of climate-related risks and opportunities
The Board of Directors has undertaken a robust assessment of the current risks facing Pearson, as disclosed in the risk section on pages 57–67 of this report. This assessment identifies principal risks as well as several emerging risks and risks that, while modest, could have a significant near-term impact. The corporate risk register reflects these conclusions:
| • | Climate change overall does not represent a principal risk for Pearson. The financial impact of climate change-related risks and opportunities individually and in aggregate are well below the threshold for an item to be considered a principal risk for the company. |
| • | The physical and transition risk assessment above highlighted no significant material risks arising from climate change in the short term (within the next five years). |
| • | There are no substantial transition risks identified in the short to medium term. |
| • | There are no material short-term substantial physical risks identified once the impact of mitigating activities is taken into account. In the medium to longer term, the most significant physical risk is water scarcity. In addition, while certain sites were identified as having exposure to impacts from wildfire, such as potential temporary closure of VUE test centres, or from storms, the impact of these is currently expected to be mitigated through insurance policies and business continuity insurance. |
In making this assessment, we considered the actions needed to achieve our commitments, as well as the strategic and financial impact of potential risks and opportunities. We concluded that these did not have a material impact on the carrying value of any assets and liabilities as of 31 December 2024, as we explain in further detail in note 1c to the financial statements.
Strategic outlook
Our business model places the end user at the heart of everything we do, reaching learners across all their life stages. As we build out our digital learning capabilities, we will continue to shift away from physical paper-based products and services in line with our growth strategy, and, in turn, accelerate our decarbonisation trajectory. In addition, we continue to reduce our property footprint by improving the energy efficiency of our sites, which also contributes to reducing our risk exposure to physical and transitional risks. We expect these trends to continue.
With the increased use of AI and other advanced technologies in education, renewable and alternative energy solutions will play an important role in our industry, and, more importantly, for our technology-based suppliers. We will continue to work on driving industry-wide change by establishing partnerships and actively engaging our suppliers to ensure alignment of our values and support progress in their decarbonisation journeys.
Nonetheless, Pearson is well-poised to achieve our goals. Our Climate Action Plan identifies key actions to further decarbonise our own operations, value chain and through our products and services.
| Annual report and accounts 2024 Pearson plc 47 |
|
Strategic report |
Governance report |
Financial statements |
Other information | |||||
| Sustainability continued |
||||||||
Metrics and targets
Our primary target is to reduce our absolute scope 1, 2 and 3 GHG emissions by 50% by 2030 (validated by the SBTi) from a 2018 baseline. We have made good progress this year, achieving a 41% reduction in GHG emissions since 2018. More detailed information on our performance can be found on page 53.
Climate-related metrics
In addition to our carbon reduction targets, Pearson has business-relevant non-financial KPIs that address the climate-related risks and opportunities discussed throughout this report, namely:
| Metric category |
Metrics | Page | ||
| GHG emissions |
Responsible Business Strategy
Progress against achieving our near-term emission reduction target of 50% by 2030. |
41 | ||
| Strategy |
Digital growth
Drive digital sales growth |
24 | ||
| Governance |
Remuneration
Sustainability-related weighting |
129 | ||
Our GHG emissions data
Our full set of environmental data and the methodology used for calculations can be found in the sustainability performance tables on page 53. The most material categories of scope 3 GHG emissions represented in our figures include: Purchased goods and services; Upstream transportation and distribution; Business travel and Employee commuting. These categories represent more than 90% of our scope 3 emissions. A breakdown of data for each category can be found in the external assurance report on our website: https://plc.pearson.com/en-GB/sustainability. Our emissions data is calculated following the GHG Protocol Corporate Accounting and Reporting Standard and can be summarised as follows:
| tCO2e | 2024 | 2023 (restated figures*) |
||||||
| Scope 1 | 4,095 | 4,683 | ||||||
| Scope 2 location-based | 13,942 | 14,004 | ||||||
| Scope 2 market-based | 11 | 1,719 | ||||||
| Scope 3 location-based | 233,471 | 246,990 | ||||||
| Scope 3 market-based | 234,820 | 247,590 | ||||||
| Total location-based | 251,508 | 265,677 | ||||||
| Total market-based | 238,926 | 253,991 | ||||||
| Intensity ratio – tCO2e/£m sales revenue (market-based methodology) |
67 | 69 | ||||||
| * | Figures have been restated to reflect acquisitions, disposals and data methodology improvements, assured by an independent third party, SLR Consulting Ltd. The statement can be found on our website: https:// plc.pearson.com/en-GB/sustainability. |
TCFD Index
| Section |
Section | Page Reference | ||
| Governance |
Board’s oversight of climate-related risks and opportunities | 44-48 | ||
| Management’s role in assessing and managing climate-related risks and opportunities | 44 | |||
| Strategy |
Climate-related risks and opportunities over the short, medium and long term | 44-47 | ||
| Impact of climate-related risks and opportunities | 47 | |||
| Pearson’s resilience taking into consideration different climate-related scenarios | 47 | |||
| Risk management |
Processes for identifying and assessing climate-related risks | 44 | ||
| Processes for managing climate-related risks | 44 | |||
| Integration of climate-related risks into the organisation’s overall risk management | 44 | |||
| Metrics and targets |
Metrics used to assess climate-related risks and opportunities | 48 | ||
| Scope 1, 2, and 3 GHG emissions | 48 | |||
| Performance against targets | 48 | |||
| Annual report and accounts 2024 Pearson plc 48 |
|
Strategic report |
Governance report |
Financial statements |
Other information | |||||
|
Sustainability data |
||||||||
Our performance
About our reporting
This report provides a summary of Pearson’s business and sustainability strategy and performance for the calendar year ended 31 December 2024. The Board’s Reputation & Responsibility Committee has reviewed progress against our key topic areas as disclosed throughout this report.
Global Reporting Initiative (GRI)
Our report is in accordance with the GRI standards, using the GRI 1: Foundation 2021 guidance. There is no relevant GRI sector standard for our industry.
Sustainability Accounting Standards Board (SASB)
We continue to report in line with the SASB’s standards to provide industry-based insights into the most relevant sustainability-related risks and opportunities for the media and professional services sectors.
UN Global Compact (UNGC) and the UN Sustainable Development Goals (SDGs)
We were proud to participate in the Early Adopter Programme of the UN Global Communication on Progress (CoP) designed to add value and streamline sustainability reporting for all participating companies of the UNGC. Our CoP is publicly available on our participant profile.
Lifelong learning and education have an important role to play in achieving all the UN SDGs, but we focus our efforts on those where we have the greatest impact. Our priority SDGs are: 4 (Quality education), 8 (Decent work and economic growth), and 10 (Reducing inequalities).
Sustainability material issues reporting against GRI and SASB
| Material issues |
GRI | SASB | Page/web reference | Comments/omissions | ||||
| Product effectiveness |
GRI 203-2: significant indirect impacts | Risks, opportunities and management approach: Pages 35-37 Performance: Page 24 |
||||||
| Consumer engagement |
GRI 203-2: significant indirect impacts | Risks, opportunities and management approach: Pages 35-37 Performance: Page 24 |
||||||
| Digital growth |
GRI 203-2: significant indirect impacts | Risks, opportunities and management approach: Pages 35-37 Performance: Page 24 |
||||||
| Employee learning and development |
GRI 404-1: average hours of training per year, per employee GRI 404-2: programmes for upgrading employee skills and transition assistance programmes GRI 404-3: percentage of employees receiving regular performance and career development reviews |
Risks, opportunities and management approach: Pages 38-40 Performance: Pages 24 |
We do not report on average hours of training, or % of employees receiving reviews. | |||||
| Annual report and accounts 2024 Pearson plc 49 |
|
Strategic report |
Governance report |
Financial statements |
Other information | |||||
|
Sustainability data continued |
||||||||
| Material issues |
GRI | SASB | Page/web reference | Comments/omissions | ||||
| Employee engagement |
401-1 New employee hires and employee turnover | SV-PS-330a.2. (1) Voluntary and (2) involuntary turnover rate for employees SV-PS-330a.3. Employee engagement % | Risks, opportunities and management approach: Page 38-39 Performance: Page 55 |
|||||
| Inclusion and diversity |
405-1 Diversity of governance bodies and employees | SV-PS-330a.1. & SV-ME-260a.1. Percentage of gender and racial/ethnic group representation for: (1) Executive Management (2) professionals (3) all other employees |
Risks, opportunities and management approach: Page 38-39 Performance: Pages 24, 39, 54-55 |
|||||
| Reducing our environmental impact |
GRI: GHG emissions scope 1, 2 and 3. Baseline and methodology. Any offsets including type, amount, criteria | Risks, opportunities and management approach: Pages 33, 41-43 TCFD Report: Pages 44-48 Performance: Pages 24, 41-43, 53 |
||||||
| Data privacy and cyber security |
GRI 418-1 Substantiated complaints received concerning breaches of customer privacy and losses of customer data | SV-PS-230a.1. Description of approach to identifying and addressing data security risks SV-PS-230a.2. Description of policies and practices relating to collection, usage and retention of customer information SV-PS-230a.3. Number of data breaches percentage involving customers’ confidential business information or personally identifiable information number of customers affected |
The following sections of our report detail: — Our approach to data security risks: Page 102 — Governance of data privacy, cyber security and technology resilience: Pages 100, 102 — Approach to customer data and safeguarding and training provided, data privacy and cyber security: Page 37 — Responsible Security Disclosure Policy (https://www.pearson.com/en-gb/legal- — Safeguarding statement (https://plc.pearson.com/ — Data security and protection schedule for suppliers (https://www.pearson.com/content/dam/one-dot- — Consumer-facing privacy centre explaining how Pearson uses personal information (https://www.pearson.com/en-gb/privacy-center/ |
In the event of a reportable breach, we would disclose information about the incident and commit to contact any affected data subjects in a timely way. In line with regulations, we will disclose material lapses to the relevant regulators. To the extent that any relevant regulator should find fault with our data management and/or data security practices, they will publish their findings/sanctions. | ||||
| Journalistic integrity & sponsorship identification |
SV-ME-270a.3. Description of approach for ensuring journalistic integrity of news programming related to: (1) truthfulness, accuracy, objectivity, fairness and accountability, (2) independence of content and/or transparency of potential bias, and (3) protection of privacy and limitation of harm | — Business Partner Global Content Policy (https://plc.pearson.com/sites/pearson-corp/files/ |
Pearson does not engage in journalism but we have a publicly available Global Content Policy . | |||||
| Annual report and accounts 2024 Pearson plc 50 |
|
Strategic report |
Governance report |
Financial statements |
Other information | |||||
|
|
||||||||
| GRI General Disclosures Index | ||||
| Disclosure |
Page | Comments/omissions | ||
| 2-1 Organisational details |
156 | Headquarters location: Pearson plc, 80 Strand, London, WC2R 0RL, UK | ||
| 2-5 | At a Glance – What we do, Highlights Business unit overviews – Assessment & Qualifications, Virtual Learning, Higher Education, English Language Learning and Enterprise Learning and Skills (formerly Workforce Skills). | |||
| 234 | Property, plant and equipment | |||
| 2-2 Entities included in the organisation’s sustainability reporting |
213-216 | All entities within Pearson plc are included in the sustainability-related disclosures within this annual report, across all material topics and data. External assurance of data is based on Group-wide data consolidation and reporting as noted in the 2024 assurance statement, found on our corporate website: https://plc.pearson.com/ en-GB/sustainability. | ||
| 2-3 Reporting period, frequency and contact point |
Qualitative and quantitative disclosures in the Sustainability section refer to the calendar year 1 January 2024 to 31 December 2024 in alignment with our financial reporting period. Reporting frequency is annual. Publication date: 14 March, 2025 Contact point: sustainability@pearson.com | |||
| 2-4 Restatements of information |
42, 48, 53 |
2018 GHG emissions data has been rebaselined 2023 GHG emissions consequently re-stated to reflect acquisitions, disposals and data improvements (see footnote, page 48). New figures are disclosed in data tables. | ||
| 2-5 External assurance |
2024 ISAE 3000 (2020) independent assurance statement covering Pearson’s GHG emissions, energy use and social data can be found on our corporate website: https://plc. pearson.com/en-GB/sustainability. | |||
| 2-6 Activities, value chain and other business relationships |
12-16 | An integrated strategy | ||
| 18-22 | Stakeholder engagement | |||
| Disclosure |
Page | Comments/omissions | ||
| 2-7 Employees |
22 | Stakeholder engagement (Employees) | ||
| 38-40 | Empowering our people to make a difference | |||
| 54-55 | Social data tables – Our employees | |||
| 82 | Talent and culture | |||
| 2-8 Workers who are not employees |
We do not currently report on workers who are not employees. The most common type of workers are regular and limited term employees (17,116) and the most common type of work performed is in testing centres, technology, sales, customer services, and professional development. | |||
| 2-9 Governance structure and composition |
39, 54-55 44, 96-98 |
Gender and ethnicity composition of the Board
Sustainability governance is explained in the TCFD disclosure and the Reputation & Responsibility Committee report. | ||
| 68-141 | Governance report | |||
| 2-10 Nomination and selection of the highest governance body |
44, 96-98 |
Sustainability governance is explained in the TCFD disclosure and the Reputation & Responsibility Committee report. | ||
| 68-141 | Governance report | |||
| 2-11 Chair of the highest |
70 | Board of Directors | ||
| 2-12 Role of the highest governance body in overseeing the management of impacts |
70 | Board of Directors | ||
| 77 | Division of responsibilities | |||
| 78-80 | Board activities | |||
| 2-13 Delegation of responsibility for managing impacts |
70 | Board of Directors | ||
| 77 | Division of responsibilities | |||
| 78-80 | Board activities | |||
| 2-14 Role of the highest governance body in sustainability reporting |
44, 96-98 |
Sustainability governance is explained in the TCFD disclosure and the Reputation & Responsibility Committee report. | ||
| 2-15 Conflicts of interest |
73 | Independence of Directors | ||
| 79 | Board activities | |||
| 81 | How the Board is kept informed | |||
| 236 | Additional information for US listing purposes | |||
| Annual report and accounts 2024 Pearson plc 51 |
|
Strategic report |
Governance report |
Financial statements |
Other information | |||||
|
Sustainability data continued |
||||||||
| Disclosure |
Page | Comments/omissions | ||
| 2-16 Communication of critical concerns |
81-82 | How the Board is kept informed | ||
| 2-17 Collective |
44 | TCFD disclosure, Governance section | ||
| knowledge of the highest governance body |
70-72 | Board of Directors | ||
| 2-18 Evaluation of the performance of the highest governance body |
89-91 | Board performance review | ||
| 2-19 Remuneration policies |
113-136 | Director’s Remuneration Report | ||
| 2-20 Process to determine remuneration |
113-136 | Director’s Remuneration Report | ||
| 2-21 Annual total compensation ratio |
113-136 | Director’s Remuneration Report | ||
| 2-22 Statement on sustainable development strategy |
33-34 | Learning for Impact framework | ||
| 2-23 Policy commitments |
33-48 | Sustainability section, policy commitments and approaches noted across all content covering our Learning for Impact framework Corporate policies (https://plc.pearson.com/en-GB/ corporate-policies) | ||
| Disclosure |
Page | Comments/omissions | ||
| 2-24 Embedding policy commitments |
33-48 | Sustainability section, policy commitments and approaches noted across all content covering our Learning for Impact framework | ||
| 2-25 Processes to remediate negative impacts |
Corporate policies (https://plc.pearson.com/en-GB/ corporate-policies) | |||
| 2-26 Mechanisms for seeking advice and raising concerns |
Raising concerns and anti-retaliation policy (https://plc.pearson.com/sites/pearson-corp/files/2023-08/ raising-concerns-and-anti-retaliation-policy/raising- concerns-and-anti-retaliation-policy-english.pdf) | |||
| 2-27 Compliance with |
64 | Risk management | ||
| laws and regulations |
65 | Accountability for principal risks | ||
| 99-109 | Audit Committee report | |||
| 2-28 Membership associations |
Pearson is a member of a number of associations, including the Responsible Media Forum, TeachAI, the American Association of Publishers, the Software Information Industry Association and the Publishers Association. | |||
| 2-29 Approach to |
18-22 | Engaging with our stakeholders | ||
| stakeholder engagement |
84-85 | Understanding our stakeholders | ||
| 2-30 Collective bargaining agreements |
235 | Additional information for US listing purposes (Employees) | ||
| Annual report and accounts 2024 Pearson plc 52 |
|
Strategic report |
Governance report |
Financial statements |
Other information | |||||
|
|
||||||||
Sustainability performance tables
Environment
Methodology: We follow the requirements from the greenhouse gas (GHG) Protocol Corporate Accounting and Reporting Standard (revised edition) to calculate our GHG emissions.
For scope 2 and 3, we use the dual reporting methodology (location and market-based approach), together with some of the latest emission factors from recognised public sources, including, but not limited to, the UK Department for Business, Energy and Industrial Strategy (BEIS), the International Energy Agency, the US Energy Information Administration, the US Environmental Protection Agency, and the Intergovernmental Panel on Climate Change (IPCC). Energy use includes combustion of fuel as well as purchase of electricity, heat, steam or cooling consumption in MWh, and vehicle fuel use converted from mileage into MWh using BEIS conversion factors. We are also using the latest global warming potential from the IPCC’s Fourth Assessment Report.
Following our re-baselining policy, in line with best practice standards, we have re-stated our emissions to reflect the change in reporting scope and categories, as well as reviewed and updated calculation methodologies for the reporting years 2018 and 2023. This process has been verified and assured, alongside our environmental and social KPIs (unless otherwise noted) by a third-party auditor, SLR Consulting.
For more information, see our SLR Consulting assurance statement on our corporate website – https://plc.pearson.com/en-GB/sustainability/.
Greenhouse gas (GHG) (carbon dioxide equivalent) emissions overview (metric tons CO2e)
| 2024 | 2023 re-stated figures |
|||||||
| Scope 1 | 4,095 | 4,683 | ||||||
| Scope 2 (location-based1) | 13,942 | 14,004 | ||||||
| Scope 2 (market-based2) | 11* | 1,719 | ||||||
| Scope 3 (location-based1) | 233,471 | 246,990 | ||||||
| Scope 3 (market-based2) | 234,820 | 247,590 | ||||||
| Total – location-based1 | 251,508 | 265,677 | ||||||
| Total – market-based2 | 238,926 | 253,991 | ||||||
| Total scope 1 and 2 (location-based)1 | 18,037 | 18,687 | ||||||
| Total scope 1 and 2 (market-based)2 | 4,106 | 6,401 | ||||||
| UK scope 1 | 559 | 693 | ||||||
| UK scope 2 (location-based1) | 831 | 1,177 | ||||||
| UK scope 2 (market-based2) | 5 | 7 | ||||||
| Total UK scope 1 and 2 (location-based1) | 1,390 | 1,871 | ||||||
| Total UK scope 1 and 2 (market-based2) | 564 | 700 | ||||||
| 2024 | 2023 re-stated figures |
|||||||
| Intensity ratio | ||||||||
| tCO2e/£m sales revenue (market-based methodology) | 67 | 69 | ||||||
| Energy | ||||||||
| % electricity from renewable sources | 100 | 89 | ||||||
| Total electricity consumption from renewable sources only (MWh) | 36,777 | 33,066 | ||||||
| Total electricity consumption from non-renewable sources only (MWh) | 0 | 3,953 | ||||||
| On-site generated electricity (MWh) | 216 | 177 | ||||||
| Total gas consumption (MWh) | 14,369 | 17,215 | ||||||
| Total fuel oil consumption (MWh) | 501 | 585 | ||||||
| Vehicles (MWh) | 4 | 1 | ||||||
| Total energy consumption (gas, fuel, electricity, transport and other sources) (MWh) | 51,726 | 54,960 | ||||||
| Total energy consumption UK (gas, fuel, electricity, transport and other sources) (MWh) | 6,056 | 8,313 | ||||||
| Resource use | ||||||||
| Paper used (t) | 19,255 | 22,859 | ||||||
| % Forest Stewardship Council (FSC)** | 59 | 50 | ||||||
| % Programme for the Endorsement of Forest Certification (PEFC)** | 4 | 6 | ||||||
| % Sustainable Forestry Initiative (SFI)** | 30 | 13 | ||||||
| Waste | ||||||||
| Total waste generated (t) | 1,749 | 1,371 | ||||||
| % waste recycled in office space | 32.6 | 14.6 | ||||||
| Water | ||||||||
| Total water consumption (m3) | 127,014 | 137,954 | ||||||
| 1. | The location-based approach reflects emissions from purposefully sourced electricity. It derives emission factors from a contract for the sale and purchase of energy. |
| 2. | The market-based approach reflects the average emissions intensity of grids on which energy consumption occurs. |
| * | We purchase renewable electricity in countries of consumption. For American Samoa, North Mariana Islands, US Virgin Islands, Guam, South Korea and Romania, Pearson was not able to purchase country-specific Energy Attribute Certificates and we had to buy from neighbouring countries/regions such as the United States, the European Union and China. For the Philippines, we purchased hydro technology as the only available in-country option. However, this represents only 0.8% of Pearson’s total electricity consumption. |
| ** | These data points were not included in SLR Consulting’s assurance scope. |
| Annual report and accounts 2024 Pearson plc 53 |
|
Strategic report |
Governance report |
Financial statements |
Other information | |||||
|
Sustainability data continued |
||||||||
Social
All employee figures, with the exception of total average number of employees (as noted below), are based on employee volumes as at 31 December 2024. We will review data provided in future years, in alignment with evolving reporting regulations.
Our employees
| 2024 |
2023 | |||||||
| Total average number of employees for the year† | 17,024 | 18,360 | ||||||
| Employees by geography (regional representation) | 17,116 | 17,612 | ||||||
| US as of 31 December | 8,821 | 9,241 | ||||||
| UK as of 31 December | 3,394 | 3,359 | ||||||
| Rest of world as of 31 December | 4,901 | 5,012 | ||||||
| Gender diversity breakdown | ||||||||
| % permanent, regular employees | 98 | 97 | ||||||
| Male | 40 | 40 | ||||||
| Female | 59 | 59 | ||||||
| Non-binary | 0 | 0 | ||||||
| No data | 1 | 1 | ||||||
| % temporary, limited-term employees | 2 | 3 | ||||||
| Male | 31 | 36 | ||||||
| Female | 67 | 63 | ||||||
| Non-binary | 0 | 0 | ||||||
| No data | 2 | 1 | ||||||
| % full-time, regular employees | 79 | 79 | ||||||
| Male | 44 | 44 | ||||||
| Female | 56 | 56 | ||||||
| Non-binary | 0 | 0 | ||||||
| Not disclosed | 1 | 1 | ||||||
| % part-time, regular employees | 21 | 21 | ||||||
| Male | 28 | 27 | ||||||
| Female | 71 | 72 | ||||||
| Non-binary | 0 | 0 | ||||||
| Not disclosed | 0 | 1 | ||||||
† Total average number of employees is calculated using a Full-time Equivalent (FTE) methodology, as an average across the reporting period. Seasonal/temporary staff are excluded from the calculation. All other data in this table is calculated using a headcount methodology.
Board and Executive Management team’s gender identity or sex
| Number |
Percentage of the Board |
Number of senior positions on the Board (CEO, CFO, SID and Chair) |
Number in Executive Management* |
Percentage Management |
||||||||||||||||
| Male | 4 | 40% | 3 | 7 | 58% | |||||||||||||||
| Female | 6 | 60% | 1 | 5 | 42% | |||||||||||||||
| Other categories | 0 | 0% | 0 | 0 | 0% | |||||||||||||||
| Not specified/prefer not to say | 0 | 0% | 0 | 0 | 0% | |||||||||||||||
| Board and Executive Management team’s ethnic background |
| |||||||||||||||||||
| White British or other White | ||||||||||||||||||||
| (including minority-white groups) | 6 | 60% | 3 | 8 | 67% | |||||||||||||||
| Mixed/Multiple ethnic groups | 2 | 20% | 0 | 1 | 8% | |||||||||||||||
| Asian/Asian British | 1 | 10% | 0 | 2 | 17% | |||||||||||||||
| Black/African/Caribbean/Black British | 0 | 0% | 0 | 0 | 0% | |||||||||||||||
| Other ethnic group | 1 | 10% | 1 | 1 | 8% | |||||||||||||||
| Not specified/prefer not to say | 0 | 0% | 0 | 0 | 0% | |||||||||||||||
| * | Prepared in accordance with UK Listing Rule 6.6.6R(10) as at 31 December 2024. As prescribed by this rule and for the purpose of this disclosure, the Executive Management includes the Company Secretary. The data contained in the tables above was collected as part of the annual declaration process, whereby the Board and the Executive Management team received declaration forms for self-completion. The declaration forms included, for all individuals whose data is being reported, the same questions relating to ethnicity and gender. The data is used for statistical reporting purposes and is provided with consent. |
Female leadership breakdown (%)
| 2024 | 2023 | |||||||
| Senior leadership | 49 | 47 | ||||||
| VP and Director | 49 | 47 | ||||||
| Manager | 51 | 51 | ||||||
| Employee racial and ethnic diversity breakdown (%) | ||||||||
| 2024 | 2023 | |||||||
| Total workforce (US and UK) | 32 (US)/18 (UK) | 32 (US)/17 (UK) | ||||||
| Senior leadership (US and UK) | 17 (US)/17 (UK) | 15 (US)/14 (UK) | ||||||
| VP and Director (US and UK) | 19 (US)/16 (UK) | 18 (US)/16 (UK) | ||||||
| Manager (US and UK) | 27 (US)/19 (UK) | 27 (US)/18 (UK) | ||||||
| Annual report and accounts 2024 Pearson plc 54 |
|
Strategic report |
Governance report |
Financial statements |
Other information | |||||
|
|
||||||||
| 2024 | 2023 | |||||||||||
| Employee racial and ethnic diversity breakdown – US (%) |
|
|||||||||||
| Total workforce |
32 | 32 | ||||||||||
| Asian |
11 | 11 | ||||||||||
| Black or African American |
11 | 11 | ||||||||||
| Hispanic or Latino |
9 | 9 | ||||||||||
| Other |
2 | 2 | ||||||||||
| White |
68 | 68 | ||||||||||
| Not stated |
0 | 0 | ||||||||||
| Employee racial and ethnic diversity breakdown – UK (%) |
|
|||||||||||
| Total workforce |
18 | 17 | ||||||||||
| Asian |
10 | 10 | ||||||||||
| Black |
3 | 4 | ||||||||||
| Hispanic or Latino |
0 | 0 | ||||||||||
| Other |
4 | 4 | ||||||||||
| White |
63 | 64 | ||||||||||
| Not stated |
20 | 18 | ||||||||||
| Total management workforce (US and UK) (%) |
|
|||||||||||
| Asian |
12 | 12 | ||||||||||
| Black or African American |
4 | 4 | ||||||||||
| Hispanic or Latino |
3 | 4 | ||||||||||
| Other |
2 | 2 | ||||||||||
| White |
76 | 76 | ||||||||||
| Not stated |
2 | 2 | ||||||||||
| Turnover |
|
|||||||||||
| Turnover rate, total average for the year1 |
3,331/19% | 6,446/34% | ||||||||||
| Voluntary turnover |
2,309/13% | 3,037/16% | ||||||||||
| Involuntary turnover |
1,022/6% | 3,409/18% | ||||||||||
| Turnover by gender |
|
|||||||||||
| Total female |
2,052/12% | 3,840/20% | ||||||||||
| Total male |
1,239/7% | 2,475/13% | ||||||||||
| Non-binary |
8/0% | 21/0% | ||||||||||
| Not disclosed |
32/0% | 110/1% | ||||||||||
| Turnover by age group |
|
|||||||||||
| Under 30 years old |
901/5% | 1,693/9% | ||||||||||
| 30-50 years old |
1,462/8% | 3,324/18% | ||||||||||
| Over 50 years old |
961/6% | 1,414/7% | ||||||||||
| No data |
7/0% | 15/0% | ||||||||||
| 2024 | 2023 | |||||||||||
| New hires |
|
|||||||||||
| Total number and rate of new employee hires (number of hires/ average headcount)2 | 2,799/16% | 3,770/20% | ||||||||||
| Total number of new hires – female | 1,710/61% | 2,289/61% | ||||||||||
| Total number of new hires – male | 1,018/36% | 1,374/36% | ||||||||||
| Total number of new hires – non-binary | 13/0% | 19/1% | ||||||||||
| Total number of new hires – not disclosed | 58/2% | 88/2% | ||||||||||
| New hires by age group |
|
|||||||||||
| Under 30 years old | 893/32% | 1,444/38% | ||||||||||
| 30-50 years old | 1248/45% | 1,642/44% | ||||||||||
| Over 50 years old | 647/23% | 674/18% | ||||||||||
| No data | 11/0% | 10/0% | ||||||||||
| Employee engagement measures3 |
|
|||||||||||
| Engagement^ | 4.16 | 4.09 | ||||||||||
| Inclusion^ | 4.24 | 4.21 | ||||||||||
| Progress | 78% | 73% | ||||||||||
| Learning and growth | 77% | 76% | ||||||||||
| Volunteering hours | 33,130 | 20,694 | ||||||||||
| Governance |
|
|||||||||||
| Total number of concerns raised and investigated | 115 | 92 | ||||||||||
| Percentage of employees completing Code of Conduct certification or training* | 100% | 100% | ||||||||||
| 1. | % calculated using average 2024 headcount of 17,024, not 2024 year-end position. Both voluntary and involuntary turnover is reducing, the latter was significantly down compared with 2023 as there were no major divestiture activities in 2024. |
| 2. | % calculated using average 2024 headcount of 17,024, not 2024 year-end position. |
| 3. | Sourced from Gallup Access. |
| ^ | Grand Mean on a 5-point Likert scale. |
| * | This data point was not included in SLR Consulting’s assurance scope. |
| Annual report and accounts 2024 Pearson plc 55 |
|
Strategic report |
Governance report |
Financial statements |
Other information | |||||
|
|
||||||||
Non-financial and sustainability
information statement
In accordance with Sections 414CA and 414CB of the Companies Act 2006, which outline requirements for non-financial reporting, the table below signposts to content in this trategic report, relevant to the management, performance and position of the company, and the impact of our activities in specific non-financial areas.
| Non-financial matter and relevant sections of annual report | Page/link reference | |
| Business model |
Business model: Pages 13-16 Stakeholders: Pages 18-22 | |
| Environmental matters Climate Resource use |
Corporate policies: (https://plc.pearson.com/en-GB/corporate-policies) Position and performance: Pages 41-43 Risks/opportunities: Pages 45-47 KPIs: Page 24 Climate-related financial disclosure as defined in Section 414CB(2a) Companies Act 2006: Governance – (a) on page 44; Strategy – (d), (e) and (f) on pages 44-47; Risk management – (b) and (c) on pages 44-47; Metrics and targets – (g) and (h) on page 48. | |
| Social and community matters Driving learning for everyone with our products Social engagement |
Corporate policies: (https://plc.pearson.com/en-GB/corporate-policies) Position and performance: Pages 35-37 Risks/opportunities: (https://plc.pearson.com/sites/pearson-corp/files/pearson/materiality-2024.pdf) KPIs: Page 24 | |
| Employee matters Employee engagement Investing in talent |
Corporate policies: (https://plc.pearson.com/en-GB/corporate-policies) Position and performance: Pages 38-40 Risks/opportunities: (https://plc.pearson.com/sites/pearson-corp/files/pearson/materiality-2024.pdf) KPIs: Page 24 | |
| Human rights matters Customer welfare (data privacy, security and safeguarding) Empowering our people to make a difference |
Corporate policies: (https://plc.pearson.com/en-GB/corporate-policies) Position and performance: Page 102 Risks/opportunities: (https://plc.pearson.com/sites/pearson-corp/files/pearson/materiality-2024.pdf) | |
| Anti-corruption and bribery matters |
Corporate policies: (https://plc.pearson.com/en-GB/corporate-policies) Position and performance: Pages 105 and 232 Risks/opportunities: Pages 103-105 | |
Pearson has a wide range of policies that underpin our sustainability commitments, including:
| • | Pearson Code of Conduct |
| • | Pearson Business Partners’ Code of Conduct (Partner Code) |
| • | Responsible Procurement Policy and our Modern Slavery and Human Rights Statement |
| • | Anti-Bribery and Corruption (ABC) Policy; Raising Concerns and Anti-Retaliation Policy |
| • | Pearson’s safeguarding principles (include data privacy/security) |
| • | Global Content Policy |
The implementation of these policies is discussed throughout this report and on our website.
| Annual report and accounts 2024 Pearson plc 56 |

|
Strategic report |
Governance report |
Financial statements |
Other information | |||||
| Risk continued |
||||||||
Risk oversight
Risks are managed by members of the Pearson Executive Management team (PEM), either on a business unit basis or by function (as set out in the Accountability for principal risks section on page 65).
Risk owners conduct regular risk reviews with their leadership teams, consulting others where appropriate, including technical specialists, within their business unit or operating in one of the centres of expertise. Risk reports are shared with key stakeholders, including the Enterprise Risk Management team, and are discussed at PEM meetings.
The Audit Committee has the delegated responsibility for reviewing the effectiveness of our procedures for identifying, assessing, managing and reporting risk.
Each business unit is expected to present an overview of its risk register to the Board at least annually, and to provide an annual deep dive on key risks, supported by central risk team experts as required. Deep-dive sessions are also held at the Audit Committee with enterprise-wide functions such as tax, treasury and cyber security.
The Board uses these deep-dive sessions to understand the rigour of management’s risk scanning and to challenge any judgements in response to risks.
The internal audit team provides independent assurance to the Audit Committee on the design and effectiveness of internal processes, to mitigate strategic, financial, operational and compliance risks. Internal audit plans are aligned to the principal risks but also consider other key risk areas and other assurances available. Plans are agreed in advance with the PEM team and the Audit Committee.
Risk environment
We operate in markets in learning, content, assessment and qualifications where we have held leading positions over several years as businesses and markets have become more digital.
Factors affecting the markets in which we operate include our position as an accredited provider of high-stakes tests, organisational capability, competitive dynamics, learner preferences and delivery methods, including the growing adoption of AI tools and the reputation of companies operating in the market. We seek to maximise the opportunities arising from these changing market conditions, balanced with appropriate monitoring and understanding of associated risks.
Further information on our business units and key markets are in the Strategy section on pages 12-16.
Risk identification and monitoring
Our risk identification processes follow a dual approach. Firstly, we take a top-down view that considers strategic risks across Pearson. We then take a bottom-up approach at a business unit or functional level, to identify and assess a complete list of each business unit’s risks, with key risks highlighted in management reporting and in each business unit’s long-range plan.
We conduct detailed interviews throughout the year with each business unit to assist with risk assessment and management. We then rank risks according to their likely impact as principal risks, significant near-term risks, emerging risks or other risks.
Classification as principal risks, significant near-term risks and emerging risks
We define our principal risks as those that could have a significant and ongoing effect on the Group’s valuation by reducing the demand for, or profitability of, our products and services. Our Group assessment considers multiple dynamics including the duration, velocity and size of the potential impact. Effective management of these risks is essential to executing our strategy, achieving sustainable shareholder value, maintaining our reputation and ensuring good governance. However, these risks do not comprise all risks associated with our business and are not set out in priority order. Additional risks that are as yet unknown to management, or currently deemed to be less material, may also have an adverse effect on our business.
Significant near-term risks are risks that could have a significant near-term cash impact or affect our short-term results but would not be expected to have a significant ongoing effect on the Group’s valuation.
Emerging risks are risks that we believe are well mitigated in the short term but may represent a significant future opportunity or threat. These include company-specific risks and risks affecting the macro economy.
Principal risks
The Board has undertaken a robust assessment of the current risks facing Pearson, in accordance with Provision 28 of the 2018 UK Corporate Governance Code. This assessment identified the following principal risks, as well as a number of emerging risks and risks that, while more modest, could have a significant near-term impact. For each of our principal risks, the tables on pages 59-64 identify:
| • | change in the risk over the last 12 months |
| • | movement and outlook for that risk |
| • | management actions |
| • | link between the risk and Group strategy |
| • | our risk tolerance |
| • | examples of the risk |
| • | risk ‘contagion’, i.e. the extent to which issues in one area could increase the risk in other areas |
| • | assessed risk ‘velocity’, i.e. an indication of the speed at which a risk could materially impact the Group |
| Annual report and accounts 2024 Pearson plc 58 |
|
Strategic report |
Governance report |
Financial statements |
Other information | |||||
| Accreditation risk | ||
| Description |
Termination or modification of accreditation due to policy changes or failure to maintain the accreditation of our courses and assessments by states, countries, and professional associations, reducing their eligibility for funding or attractiveness to learners. Awarding bodies may also require modification of tests to continue to receive accreditation which may reduce the convenience to learners or increase the cost of delivery. | |
| Movement and outlook |
The risk has reduced from a high to a moderate-high level. There is still uncertainty around political outcomes with recent elections in the UK and US, and upcoming elections in Canada and Australia, which could affect many of our business units. However, no major policy changes have been proposed that would significantly affect our business in the near term. Furthermore, significant reforms in US and UK school assessments have not recently occurred and we have successfully retained a high level of Assessment & Qualifications’ contracts in 2024. International expansion is a key focus for many of the business units and assumptions are made that there are no major geopolitical situations, or government policy changes, in key growth areas. Despite concerns about lower federal funding post-COVID-19, Clinical Assessment sales have grown in 2024 due to pricing strategies, digital product growth and new product launches.
The risk is expected to remain at an elevated level for the foreseeable future. | |
| Management actions |
1. Focus on creating a culture where learners and awarding bodies can depend on Pearson and know that we will meet their standards. We recognise our obligations, particularly in the testing space, to ensure prompt and accurate exam grading, and take actions accordingly.
2. Continuing to evolve and enhance our security, data and governance standards to ensure we continue to meet and exceed required standards to be an accredited provider.
3. Broadening the range of services we offer and our range of stakeholders.
4. Continue to grow a full-service offering. This helps to ensure our products cater for customers’ many needs, especially in the global assessment market.
5. Focus on flawless or near-flawless execution of marking and delivering assessment results. | |
| Link to strategy |
Assessments & Verifications is at the core of our strategy. | |
| Risk tolerance |
Low – We seek to operate in stable, well-regulated markets with known requirements to be accredited, and have a low tolerance for taking risks that may jeopardise that accreditation. | |
| Examples of risks |
• Political and regulatory | |
| Risk contagion |
Accreditation risks are likely to have a financial impact but have limited risk of contagion. | |
| Risk velocity |
Changes in regulation or loss of contracts could occur within a 12-month period. | |
| Annual report and accounts 2024 Pearson plc 59 |
|
Strategic report |
Governance report |
Financial statements |
Other information | |||||
| Risk continued |
||||||||
| Artificial Intelligence (AI), content and channel risks | ||
| Description |
The risk that our intellectual property is harder to protect as a result of increased content generation through AI, and that our content and method of delivery (channel) is, or is perceived to be, insufficiently differentiated in terms of outcomes or learner experience. This could lead to lost sales and a significant decline in our market value. | |
| Movement and outlook |
The risk remains at a moderate-high level. Significant progress has been made in our use of large language models. We have successfully integrated AI tools into courses, and have continued to develop AI tools across all business units, seeing evidence of it driving commercial success. In 2024, we made a number of new hires including Chief Technology Officer and Chief Marketing Officer, to strengthen our technology and innovation leadership.
We have taken a proactive approach in leveraging advanced AI technology positions, with our ongoing developments likely to sustain this momentum. | |
| Management actions |
1. Establishing a centralised data and AI solutions hub for governance and oversight, as well as forming AI delivery squads to drive a cohesive Pearson-wide AI approach.
2. Embedding AI into content creation products and services, creating efficiencies and helping us reach the market more quickly, as well as enabling us to align to individual learning needs: for example, creating an AI tutor in Pearson+ Channels and Connections Academy.
3. Driving innovation: infusing AI into our English Language Learning business unit with the development of Smart Lesson Generator, an AI-powered tool designed to simplify educators’ work by creating customised lesson content and activities, leveraging our trusted IP.
4. Reducing piracy and managing and enforcing intellectual property rights including legal enforcement, where appropriate.
5. Targeted approach to capital allocation focused on opportunities in the higher growth segments of the markets which we serve and a deep focus on product innovation. | |
| Link to strategy |
AI has been identified as a key seismic trend providing growth opportunity. | |
| Risk tolerance |
Medium – this is a strategic risk, and we should be rewarded for successfully developing and delivering products and services that consumers value. Some risk is accepted to ensure the consumer remains at the centre of what we do. | |
| Examples of risks |
• Intellectual property protection
• Method of delivery
• Speed of innovation | |
| Risk contagion |
Failure to deliver high-quality and engaging products and services may have an impact on our reputation and responsibility risks and on meeting customer expectations. | |
| Risk velocity |
Significant short-term impacts are less likely due to our 2024 product strategy using AI as a growth driver and scaling AI across our products and services. Due to longer-term contracts or the time required for educators or consumers to learn how to use new products and services, it is more likely that any impact will be felt over years. | |
| Annual report and accounts 2024 Pearson plc 60 |
|
Strategic report |
Governance report |
Financial statements |
Other information | |||||
|
|
||||||||
| Capability risk | ||
| Description |
Inability to meet our contractual obligations or to transform as required by our strategy, due to infrastructure, systems or organisational challenges. | |
| Movement and outlook |
This risk has increased from moderate to moderate-high due to the need to shift to execution against an evolved strategy. In October, Higher Education began to directly distribute our proprietary Advanced Placement (AP ®), Dual Enrolment and Career Technical Education (CTE) materials into states and school districts, which were previously distributed by a third party, investing in an in-house dedicated sales team. Our performance is contingent on how our existing customers respond to the shift from the third party and our ability to establish a robust go-to-market strategy and high-quality customer service.
We have been successful in the migration of a number of data centres and have developed our relationships with a number of key technology companies. Higher Education’s return to growth demonstrates our product and sales strategies have been effective.
We have made improvements in data and cyber governance and resilience during 2024. Capability remains a fundamental requirement for achieving our objectives, with heightened risk when we enter new markets or develop new products and services. However, we have effectively managed talent costs and workforce investment will support capability growth and operational resilience over the next few years. | |
| Management actions |
1. Risk ratings are assigned to each system, with plans to ensure system uptime. Recovery strategies are established to minimise disruption, enabling customers to maintain functionality or resume operations as quickly as possible in the event of downtime.
2. Regular patching, employee training and security measures, such as multi-factor authentication, help to ensure the stability and security of our key systems.
3. Migration of servers for platform products to the cloud to enhance resilience.
4. Dedicated resources to focus on testing and developing AI products and to understand evolving market capabilities.
5. Business continuity planning to ensure that we are able to respond should a key customer or supplier fail. | |
| Management actions continued |
6. Enhanced focus on developing products that serve new markets and user groups, and cross-selling between business units, as well as product bundling.
7. Monitoring employee engagement and investing in our leaders to support key talent retention and effective succession planning.
8. Increasing clarity on our performance expectations for every role across the company, driving collaboration in pursuit of value.
9. Regularly reviewing our cost base to ensure competitiveness and identifying options for efficiencies.
10. A focus on the remediation of technical debt, supporting platform consolidation, and creating a unified user profile, providing an integrated view of Pearson for users across multiple products. | |
| Link to strategy |
Core performance has been identified as a key strategic growth opportunity. | |
| Risk tolerance |
Medium – we aim to ensure we have the capability to deliver strategic objectives, requiring strong coordination and planning, without stifling innovation. | |
| Examples of risks |
• Business resilience
• Business transformation and change
• IT resilience
• Safety and corporate security
• Talent | |
| Risk contagion |
Failures in capability could result in increased reputation and responsibility risk and failures to meet customer expectations. | |
| Risk velocity |
Failures of capability could impact within six to twelve months. | |
| Annual report and accounts 2024 Pearson plc 61 |
|
Strategic report |
Governance report |
Financial statements |
Other information | |||||
| Risk continued |
||||||||
| Competitive marketplace | ||
| Description |
Significant changes in our target markets could make those markets less attractive. This could be due to significant changes in demand or in supply, which impact the addressable market, market share and margins (e.g. changes in enrolments, in-sourcing of learning and assessment by customers, open educational resources, a shift from in-person to virtual learning or vice versa, or innovations in areas such as generative AI). | |
| Movement and outlook |
The risk has increased to high from moderate-high driven by tighter migration policies in key markets affecting the market size for Pearson Test of English.
The Higher Education International business has suffered sales declines, notably in Canada, Australia and New Zealand, and there has been market pressure in English institutional sales, especially in Europe. Meanwhile, the content space faces ongoing risk of price compression due to the rise of open education resources, especially those powered by large language models.
US Higher Education has seen a significant improvement in sales, driven by enhanced sales team capabilities, stability and improved product offerings. Recent contract retention rates for Assessment & Qualifications have been encouraging.
In Virtual Learning, we anticipate favourable trends in retention as part of operational improvements, and have invested in growth drivers such as career and custom curriculum.
The risk is expected to remain elevated for the next 12 months, due to the risk of continuing tight migration rules, demographic factors and potential for price compression and disruption in the content space. | |
| Management actions |
1. Working in partnership with customers, including IP owners, at our Assessment & Qualifications and Virtual Learning business units, to ensure that our customers’ needs are being met, resulting in high retention rates on the long-term contracts in place.
2. Progressing in Enterprise: signed a new multi-year enterprise deal with ServiceNow, a multi-year strategic Enterprise AI partnership with Microsoft and the expansion of the company’s long-standing strategic partnership with AWS. Leadership and sales team changes are propelling this momentum.
3. Our Higher Education strategy has prioritised reducing dependence on channel partners by building an in-house salesforce team to strengthen and streamline our go-to-market abilities.
4. Undertaking competitive analysis to monitor and respond to competitive threats, with decentralised teams able to mobilise quickly to maximise opportunities and manage risk.
5. Monitoring our pipeline of contracts by renewal date and business unit, and building relationships with our customers to ensure proactive renewal management. | |
| Link to strategy |
Targeted market expansion has been identified as a key strategic growth opportunity. | |
| Risk tolerance |
Medium – this is a strategic risk associated with successfully selecting attractive global opportunities and seizing them. We seek to lead the shift to digital ways of learning and consequently to maintain strong market positions. | |
| Examples of risks |
• Substitutes
• Market pricing
• Product differentiation
• Consumer learning preferences | |
| Risk contagion |
Changes in the competitive marketplace could increase portfolio change. | |
| Risk velocity |
We expect changes in the global learning market over our five-year planning horizon, but the timing and pace of such changes is uncertain. Assessment & Qualifications and Virtual Learning benefit from long-term contracts, which reduce potential velocity in these business units. | |
| Annual report and accounts 2024 Pearson plc 62 |
|
Strategic report |
Governance report |
Financial statements |
Other information | |||||
|
|
||||||||
| Customer expectations | ||
| Description |
Rising end-user expectations increase our need to offer differentiated value propositions, risking margin pressure to meet these expectations and potential loss of sales if not successful. | |
| Movement and outlook |
The risk has remained at a moderate level. We have met customer expectations across business units. Higher Education is experiencing growth, with positive reception for new products. We have retained all major contracts in US Student Assessment. Our NPS score in Virtual Learning remains strong and Pearson VUE has shown positive performance with strong retention rates.
Enhancing the reporting and use of proactive metrics will improve engagement and customer experience across digital products, and we expect the outlook to be similar for the next 12 months. | |
| Management actions |
1. Monitoring and targeting strong NPS scores, responding to customer feedback.
2. The Group’s direct to consumer offerings such as Mondly, Pearson+Channels provide valuable insights about usage.
3. Our service businesses conduct regular reviews with customers to ensure that their expectations are well understood and met and, where gaps arise, we are taking steps to address these concerns.
4. A unified global enterprise sales team sharpens our focus and enables us to better meet enterprise customers’ needs.
| |
| Link to strategy |
Focus on delighting our customers and meeting their expectations. | |
| Risk tolerance |
Medium – This is a strategic risk, and we should be rewarded for successfully developing and delivering products and services that consumers value. Some risk is accepted to ensure the customer remains at the centre of what we do. | |
| Examples of risks |
• Customer experience
• Data architecture and usage
• Accessibility | |
| Risk contagion |
Failure to produce products and services meeting customer expectations could also impact reputation and responsibility risks. | |
| Risk velocity |
Typically, one to three years, as long-term contracts run off. | |
| Portfolio change | ||
| Description |
Failure to effectively execute desired or required portfolio changes to promote scale or capability and increase focus on key business units and geographic markets, due to either execution failures or inability to secure transactions at appropriate valuations. | |
| Movement and outlook |
The risk remains low-moderate as recent acquisitions are integrated and disposals have been successfully executed.
The risk level will remain at a similar level until further portfolio activity is undertaken. | |
| Management actions |
1. Including investment plans in our strategic plans, aligning requirements with business unit structure.
2. A capital committee governance structure is in place with an executive committee for the review, analysis and approval of M&A transactions, as well as reviewing integration of acquisitions.
3. An experienced Corporate Finance team to execute transactions, supported by a dedicated post-deal Operations team.
4. Pearson Ventures allows us to take stakes in companies in early funding rounds supporting growth through innovation.
5. Clear rules of engagement for any M&A activity. | |
| Link to strategy |
Capital allocation is a core element of our strategy. | |
| Risk tolerance |
Medium – we seek to carefully balance the opportunity to achieve growth through increasing capability and/or scale with the execution risk of portfolio change. | |
| Examples of risks |
• Identification of requirements
• Achieving value on acquisitions/disposals
• Integration of acquisitions | |
| Risk contagion |
Failures in managing portfolio change could impact capability and the ability to meet customer expectations. | |
| Risk velocity |
The speed of achieving the full benefits of an acquisition will vary depending on the size and scope of the acquisition, but typically from six months for a simple small acquisition, to two years for a larger complex transaction. | |
| Annual report and accounts 2024 Pearson plc 63 |
|
Strategic report |
Governance report |
Financial statements |
Other information | |||||
| Risk continued |
||||||||
| Reputation and responsibility | ||
| Description |
Reputational and responsibility risks involve failing to meet obligations and demands of key stakeholders, including legal, regulatory, ethical and behavioural expectations. These risks extend beyond direct consequences to include broader societal and cultural perceptions. Risks arise not only from our actions, but also from being perceived as misaligned with societal expectations or ideological divides, especially in a polarised environment. | |
| Movement and outlook |
This risk remains at moderate-high. There are high ongoing cyber security threats and reputational risks, including data privacy and biometric risks, and the complexity of navigating different regional regulatory environments.
We aim to operate in a highly reputable and responsible manner and so we intend to maintain strong mitigations to reputation and responsibility risks. However, numerous threats exist including from those who seek to do harm to the Group or to its customers, including nation-state actors, organised criminal rings and ransomware attackers, so constant vigilance is required. We are undertaking initiatives that will enhance our capabilities in cyber and data governance, ensuring robust protection against emerging threats. | |
| Management actions |
1. Dedicated risk management teams throughout Pearson monitor and respond to key risks. These teams provide regular updates to senior management and report to the Reputation & Responsibility Committee or Audit Committee as relevant.
2. Mandatory training for all employees covers key reputational risks including cyber and data risks.
3. Insurance cover, where available, supports the Group financially in the event of major incidents.
4. Significant investment to ensure high levels of IT resilience, including enforcement of multi-factor authentication for all critical systems. Tools are in place to repel cyber threats and safeguard customer information.
5. A trust and safety governance framework is in place that covers data privacy, security and risk, assessing business impacts and ensuring accountability. We also conduct several industry assessments to benchmark against security best practices, namely National Institute of Standards and Technology Cyber Security Framework (NIST CSF), The NIST Privacy Framework (NIST PF) and Security Scorecard.
6. Strong financial controls are in place and monitored by the Controls Steering Committee and Compliance teams, as well as local management. | |
| Management actions continued |
7. An Incident Management Framework for effective incident management across a wide range of events and concerns. We undertake reviews after incidents and significant near-misses to allow lessons to be learned and any remedial actions to be put in place.
8. A going concern model is reviewed by senior management and is completed twice a year, or more often if there is a material event. We have a comprehensive treasury policy that addresses key financial risks, including capital risk, liquidity risk, foreign exchange risk and interest rate risk, with measurable targets and regular reporting to the Audit Committee.
9. Fraud assessments completed by business units annually.
10. Comprehensive steps to safeguard students including staff vetting, training and escalation processes. Staff sign an annual code of conduct.
11. Our Government Relations team fosters constructive partnerships with policymakers and regulatory bodies to ensure we are aware of and have appropriate safeguards against emerging policy and political risks. It reports regularly to our Reputation & Responsibility Committee. | |
| Link to strategy |
Our reputation and commitment to behaving responsibly underpin our strategy to be a trusted partner. | |
| Risk tolerance |
Low – We seek to be a highly trusted education and learning brand. Any significant failures could negatively affect our relationship with customers today and in the future. | |
| Examples of risks |
• Compliance with laws and regulations
• Cyber security
• Data privacy
• Fraud
• Insolvency
• Safeguarding
• Test failure
• Use of third parties
• Culture wars/polarisation of political views | |
| Risk contagion |
Significant failures in this area could increase our capability and accreditation risks, and weaken our position in the competitive marketplace. | |
| Risk velocity |
Reputational risks could have a significant impact in a short period in the event of a significant issue. | |
| Annual report and accounts 2024 Pearson plc 64 |
|
Strategic report |
Governance report |
Financial statements |
Other information | |||||
|
|
||||||||
Accountability for principal risks
For each of our principal risks (shown in bold), the table below lists the accountable senior executive(s) for each sub-risk. In 2024, we added three new sub-risks, and we created a new position of Chief Technology Officer which has led to changes in accountability (marked in the table below).
| Risks |
Accountability | Change since 2023 | ||
| Accreditation risk |
||||
| Political and regulatory |
General Counsel and Business Unit Presidents | No | ||
| Artificial Intelligence, Content and Channel risk | ||||
| Effective method of delivery (podcast, video, test, in-person, online) |
Chief Product Officer and Business Unit Presidents | No | ||
| Intellectual property protection |
General Counsel and Business Unit Presidents | No | ||
| Products and services – effective investment in own and third-party content |
Chief Product Officer and Business Unit Presidents | No | ||
| Balance of content creation vs content purchased |
Chief Product Officer and Business Unit Presidents | No | ||
| Speed of innovation |
Chief Executive Officer, Chief Product Officer, Chief Strategy Officer, Chief Technology Officer and Business Unit Presidents | Yes | ||
| Capability risk | ||||
| Business resilience |
General Counsel and Business Unit Presidents | No | ||
| Business transformation and change |
Chief Executive Officer and Business Unit Presidents | No | ||
| IT resilience |
Chief Information Officer and Business Unit Presidents | No | ||
| Safety and corporate security |
General Counsel and Business Unit Presidents | No | ||
| Talent |
Chief Human Resources Officer and Business Unit Presidents | No | ||
| Failure to attract talent/succession planning |
Chief Human Resources Officer | Yes | ||
| Competitive marketplace risk | ||||
| Consumer learning preferences |
Business Unit Presidents | No | ||
| Market pricing |
Business Unit Presidents | No | ||
| Risks |
Accountability | Change since 2023 | ||
| Product differentiation |
Business Unit Presidents | No | ||
| Substitutes |
Business Unit Presidents | No | ||
| Customer expectations risk | ||||
| Customer experience |
Chief Product Officer and Business Unit Presidents | No | ||
| Accessibility |
Chief Human Resources Officer, Chief Product Officer and Business Unit Presidents | No | ||
| Data architecture and usage |
Chief Information Officer, Chief Technology Officer and Business Unit Presidents | Yes | ||
| Portfolio change risk | ||||
| Achieving value on acquisitions/disposals |
Chief Financial Officer and Chief Strategy Officer | No | ||
| Identification of requirements |
Chief Executive Officer, Chief Financial Officer and Chief Strategy Officer | No | ||
| Integration of acquisitions |
Chief Financial Officer | No | ||
| Reputation and responsibility risk | ||||
| Compliance with laws and regulations |
General Counsel and Business Unit Presidents | No | ||
| Cyber security |
Chief Information Officer | No | ||
| Safeguarding |
General Counsel and Business Unit Presidents | No | ||
| Test failure |
Assessment & Qualifications, English Language Learning and Enterprise Learning and Skills Business Unit Presidents | No | ||
| Data privacy |
General Counsel and Business Unit Presidents | No | ||
| Use of third parties |
Chief Financial Officer and Business Unit Presidents | No | ||
| Polarisation of political views/cultural wars |
General Counsel and Business Unit Presidents | Yes | ||
| Annual report and accounts 2024 Pearson plc 65 |
|
Strategic report |
Governance report |
Financial statements |
Other information | |||||
| Risk continued |
||||||||
Significant near-term and emerging risks
The main near-term and emerging risks are shown in the table below, which also notes accountabilities and where the risk represents a change since the previous year.
| Risks |
Description | Accountability | Classification and | |||
| change since 2023 | ||||||
| Climate transition |
Risks relating to sustainability and climate are outlined in pages 45-46. Expectations around climate change commitments and measurements change on a regular basis. | General Counsel and Business Unit Presidents | Emerging risk. No change. | |||
| Economic changes |
Economic changes including high global inflation risks, recessions in global markets, high interest rates and supply change disruption could increase the cost of production for Pearson and put pressure on school, enterprise and consumer budgets, reducing demand for our products and services. | Chief Financial Officer, Chief Executive Officer and Business Unit Presidents |
Significant near-term risk. No change. | |||
| Tax |
The outcome of tax decisions relating to prior year transactions in Brazil and the UK could lead to significant cash costs. In 2024, the EU State Aid case was successfully settled in the Group’s favour. | Chief Financial Officer | Significant near-term risk. No change. | |||
| Sanctions and geopolitics |
High levels of geopolitical volatility have led to the increased use of sanctions, which could inhibit our ability to trade or, if inadvertently breached, could lead to fines, penalties and actions against officers.
We have offices in Israel, which could be affected by the ongoing conflict in the region and further new conflicts also pose risks.
|
Chief Executive Officer and General Counsel | Significant near-term risk. No change. | |||
| Annual report and accounts 2024 Pearson plc 66 |
|
Strategic report |
Governance report |
Financial statements |
Other information | |||||
|
|
||||||||
Risk assessment of prospects and viability
Corporate planning process
The Board assessed the prospects of the Group using the Group’s five-year plan, reviewing going concern over the period to 30 June 2026 and viability to 31 December 2029. The five-year period corresponds with Pearson’s strategic planning process which is discussed by the Board at least annually and represents the time over which the Group can reasonably predict market dynamics and the impact of additions to the product portfolio.
The strategic plan takes account of a range of factors including market conditions, the likely impact of principal risks to the Group, product and capital investment levels, as well as available funding. Pearson’s strategy and business model is discussed in more detail on pages 12-16.
Viability assessment approach and outputs
Base case five-year plan
In considering going concern and the viability of the Group, the five-year plan was used as the base case model for assessment. Sales, profits and cash are forecast to grow in the base case. The company’s subsidiary Pearson Funding plc has a debt maturity of €300m due within the going concern assessment period and it is assumed that this is repaid with available liquidity.
Severe but plausible downside model
A severe but plausible model was prepared based on the base case adjusted for the probability weighted impact of all principal risks as well as other significant risks. The net impact of the risks modelled was to reduce free cashflow by around 30% per year.
At 31 December 2024, the Group had available liquidity of £1.2bn comprising central cash balances and its undrawn $1bn Revolving Credit Facility (RCF) which matures in February 2028. The RCF can be extended by a further year in November 2025, extending the maturity to February 2029 and a further year in November 2026, extending the maturity to February 2030. While the current extension options allow for a potential maturity in 2030, consistent with historical practice, Pearson anticipates refinancing the facility within the next five years to ensure liquidity beyond the testing period.
Under the severe but plausible downside case, the Group would maintain comfortable liquidity headroom and sufficient headroom against covenant requirements during the period under assessment before considering mitigating actions.
Reverse stress tests
Two reverse stress tests were modelled to determine the reduction in profit versus the plan that would be required to exhaust liquidity.
In the case of the going concern assessment, the profit reduction needed before 30 June 2026 was calculated. The model showed that significant profit declines in excess of the severe but plausible scenario were required in both 2025 and 2026 to exhaust liquidity.
For viability, the profit reduction and consequent reduction in cashflow needed to exhaust liquidity in 2029 was calculated, requiring a cumulative reduction in excess of those identified in the severe but plausible downside case.
In each case, the downside required to exhaust liquidity exceeds the downside in the severe but plausible scenario, before allowing for any mitigation.
Conclusion
Based on the results of these procedures, and considering the Group’s strong balance sheet, the Directors have a reasonable expectation that Pearson will be able to continue in operation and to meet its liabilities as they fall due over the five-year period ending 31 December 2029. Further details of the Group’s liquidity are shown in the “Financial Review” on pages 26-32
Below are the major inputs included in the severe but plausible scenario:
Accreditation
| • | Loss of accreditation for Pearson Test of English in a major market |
| • | Risks associated with potential political and regulatory changes in US Student Assessment, UK & International Qualifications and Virtual Learning |
| • | Migration policy changes in key markets and the effect they may have on demand and market size of Pearson Test of English |
Capability
| • | Capability challenges in sales and technology reduce sales and result in increased costs |
| • | Strategic initiatives affecting short term capability risk |
Competitive Marketplace
| • | Sales declines in Higher Education due to demographic shifts as well as the general competitive environment |
| • | Enrolment growth declines in Virtual Learning |
| • | Long term competitive pressure on US Student Assessment contracts |
AI, Content and Channel
| • | Loss of sales due to AI related risks and poor choice of content and/or channel |
Customer Expectations
| • | Additional costs to provide higher than planned functionality and levels of user experience |
| • | Failure to achieve desired growth in Channels sales |
Portfolio Change
| • | Not applicable: no recent disposals or acquisitions |
Reputation and Responsibility
| • | Potential cyber and data breaches negatively impacting reputation on an ongoing basis |
| • | Potential safeguarding incidents negatively impacting reputation on an ongoing basis |
Recession and inflation
| • | Potential for increased costs and lower sales because of a weak macro environment |
| Annual report and accounts 2024 Pearson plc 67 |
|
Strategic report |
Governance report |
Financial statements |
Other information | |||||
| Chair’s letter |
||||||||

Dear fellow shareholders,
It is a pleasure to introduce our Governance report for 2024. This was an exciting year, with Omar Abbosh joining the Board as Chief Executive and the development of our strategic goals, in which the Board played an important role, and which you can read more about throughout this annual report.
Strategy and performance
The Board has been heavily engaged with the management team in the development and implementation of our strategic goals, including participation in workshops with staff during the strategic planning initiatives, as well as formal Board meetings as part of the comprehensive review of Pearson’s business and its markets led by Omar during the year.
Since his appointment at the beginning of the year, the Board and I have been highly impressed with Omar’s energy and systematic analysis of the company’s opportunities and his plans to capture those over the coming years. The Board has been delighted to welcome Omar to Pearson and to support his strategic and operational evolution of the company.
The Board continued to pay close attention to maintaining a strong financial position, which enabled us to increase the dividend again in 2024, in line with our progressive and sustainable dividend policy. We also launched an extension of our share buyback programme to repurchase a further £200m of shares to return capital to shareholders. On 28 February 2025, we announced our intention to launch a £350m share buyback programme during 2025, in line with the priorities and discipline embodied in our capital allocation policy, which enables Pearson to create sustainable, long-term value for every stakeholder. You can read more about our capital allocation approach on page 16.
As part of monitoring execution and performance, the Board regularly receives a dashboard that allows Directors to monitor progress on Pearson’s financial and strategic priorities, supported by agreed indicators and milestones identified as key measures of performance. You can read more about those KPIs on pages 24-25 of this annual report.
The Board’s oversight of performance and risk is underpinned by the excellent work of our Audit Committee, which you can read more about on pages 99-112. This includes a number of strategic risk deep dives and a continued focus on data privacy and cyber security, as well as overseeing our financial controls and internal audit programmes, together with the delivery of the external audit plan, and planning for the changes relating to audit, risk and internal control matters in the revised UK Corporate Governance Code. Board members have found the strategic risk deep dives to be hugely valuable in gaining insight into the operations of the business, therefore these have been given more prominence by being integrated into the full Board meeting agendas with effect from late 2024.
Sustainability, stakeholder engagement and culture
As the world’s lifelong learning company, Pearson recognises its enormous potential to make a positive impact on people and the planet, as outlined in our Learning for Impact framework, which you can learn more about on page 33. The Reputation & Responsibility Committee has primary responsibility for monitoring and inputting into Pearson’s sustainability strategy and initiatives on behalf of the Board, with more on this described in the Committee’s report starting on page 96.
Understanding the views and priorities of all our stakeholders is key to running a successful, sustainable company that meets the needs of learners, educators, governments and employers. You can read more about the Board’s engagement activities in the Stakeholder engagement section on page 18.
During the year, the Board held engagement sessions with employees in our major employee hubs in London and in the US in Hoboken, New Jersey, and Durham, North Carolina, to hear employee views. Read more about this engagement, and plans for Board engagement with the workforce in 2025, on page 85. Promoting a culture of community in the workforce environment throughout Pearson remains a Board priority, and relevant KPIs form part of the regular dashboard reviewed by the Board. We have continued our focus on fostering community in our workforce. More information on our community can be found on page 38.
| Annual report and accounts 2024 Pearson plc 68 |
|
Strategic report |
Governance report |
Financial statements |
Other information | |||||
|
|
||||||||
Talent development and succession planning are also ongoing themes in the work of the Board and its Committees. The Board has continued to work with Ali Bebo, Pearson’s Chief Human Resources Officer, to assess our culture and employee engagement levels, through analysing the results of the engagement survey and annual deep dives into succession and the talent pipeline. During the year, we introduced a ‘Leadership Uplift’ programme, which is a valuable enhancement to our leadership and talent review process and will enable us to have more meaningful discussions about talent across the organisation and sharpen our ability to identify and prioritise leadership development opportunities that align with the evolving needs of our business. You can read more on page 39. The Board is also supporting the Executive Management team to drive a culture of performance and accountability throughout the organisation, which is covered in more detail on page 39.
Board composition, succession and evaluation
We have a fully engaged Board, with varied backgrounds, perspectives and skill sets, whose range of expertise includes technology, education and workforce learning, and leadership of global, complex organisations. You can read more about the Board’s skills and experience on page 70.
During the year, Tim Score stepped down after serving nine years on the Board, having held several key roles, including as Deputy Chair and Senior Independent Director, and I would like to thank him again for his long-serving contribution to Pearson. I am pleased that Graeme Pitkethly has taken over as Deputy Chair and Senior Independent Director.
During 2024, we commenced a Non-Executive Director search process and on 7 March 2025 we were delighted to announce the appointment of Arden Hoffman as an independent Non-Executive Director, who will join the Board on 1 June 2025. Arden brings strong expertise and business perspective on workforce and talent development in an era of innovation and AI and her insights will prove invaluable as Pearson continues to execute against its strategy. We will continue to monitor the Board’s composition to ensure we maintain the range of skills, experience and perspectives needed to support the company’s strategy and complement our succession planning. More detail about the Board’s search process and succession planning can be found in the Nomination & Governance Committee report on pages 92-95.
In order to maintain continuity on the Board and to support a smooth transition of his particular knowledge and expertise to our new Non-Executive Director, we will be recommending to shareholders that Lincoln Wallen, who has served for nine years on the Pearson Board, is re-elected for a further period until the end of 2025. Lincoln is a valuable member of the Audit and Reputation & Responsibility Committees, and a steady and knowledgeable voice on the Board, particularly bringing his deep expertise in the areas of technology and AI. The Board is confident in Lincoln’s continued independence, while the opportunity for him to support our new Board member for a period of handover will be invaluable.
The annual Board performance review in 2024 was internally facilitated by the Deputy Chair and Senior Independent Director, Graeme Pitkethly. The review demonstrated that our Board is highly engaged, with a strong relationship between the Non-Executive Directors and the Executive Directors, and operates a robust governance approach that will support Pearson in driving our strategy forwards. Good progress has also been made on the recommendations from the 2023 review. You can read more about the 2024 performance review, and how the Board implemented recommendations from the previous performance review, on pages 89-91.
Conclusion
I hope this report explains clearly to you how Pearson is run and how we align governance and our Board agenda with our strategic direction. Shareholders are always welcome to put their questions or feedback to us, either via our website (www.pearsonplc.com) or at our AGM. Once again this year, shareholders will be able to join us and vote at our AGM either in person or virtually. Details will be included in the forthcoming AGM notice.
It only remains for me to thank our shareholders for their continued support and interest in this fantastic company. I look forward to maintaining our stakeholders’ confidence as we seek to capture Pearson’s enormous growth potential as a lifelong digital partner for learners everywhere.
Omid Kordestani
Chair
| Compliance with the UK Corporate Governance Code
For 2024, we are reporting against the 2018 edition of the UK Corporate Governance Code (the Code). The principles set out in the Code emphasise the value of good corporate governance to the long-term sustainable success of listed companies. The Pearson Board is responsible for ensuring that the Group has in place appropriate frameworks to comply with the Code’s requirements, or otherwise for explaining any instances of non-compliance. This Governance report and the Strategic report set out how Pearson has applied the principles of the Code throughout the year.
The Board believes that during 2024 the company was in full compliance with all applicable principles and provisions of the Code.
The Board is mindful of the revisions made to the UK Corporate Governance Code in 2024, which will apply to our 2025 financial year (with the exception of Provision 29, which will apply to our 2026 financial year). You can read more about our preparations on page 93 and page 106.
A copy of the Code can be found on the Financial Reporting Council’s (FRC) website, www.frc.org.uk.
|
| Annual report and accounts 2024 Pearson plc 69 |
|
Strategic report |
Governance report |
Financial statements |
Other information | |||||
| Board of Directors |
||||||||
|
Leading the way
All Board members have strong leadership experience at global businesses and institutions. Our Board members’ biographies illustrate the contribution each Director makes to the Board by way of their individual experience.
Key to Committees
Current notable commitments reflect other listed company directorships and full-time or executive roles. |
Omid Kordestani
Chair Age: 61
|
Omar Abbosh
Chief Executive Age: 58 |
Sally Johnson
Chief Financial Officer Age: 51 | |||
| Appointment | ||||||
|
First appointed to the Board 1 March 2022 Chair since 29 April 2022
|
Chief Executive since 8 January 2024 |
Chief Financial Officer since 24 April 2020 | ||||
| Skills and experience
|
||||||
|
Omid is an international businessman who serves on the boards of Klarna Bank AB and Klarna Holding AB and is a Council Member for Balderton Capital. He was Executive Chair of Twitter, Inc. between October 2015 and May 2020, and a Board Member until October 2022. From August 2014 to August 2015, Omid served as Senior Vice President and Chief Business Officer at Google and previously from May 1999 to April 2009 as Senior Vice President of Global Sales and Business Development.
From 1995 to 1999, Omid served as Vice President of Business Development at Netscape Communications Corporation. Prior to joining Netscape Communications Corporation, Omid held positions in business development, product management and marketing at The 3DOCompany, Go Corporation and Hewlett-Packard Company. |
Omar has a career spanning more than 30 years driving growth and transformation for leading multinational companies. He joined Pearson with a background steeped in technology and innovation, and with a deep understanding of how to shape and execute successful strategies in a world of disruption.
Most recently, Omar was the President of Microsoft Industry Solutions with responsibility for driving sales, service and solutions across Microsoft’s largest customers. While there he led industry and technical business units, including strategy, engineering, partnering and sales teams that shaped product roadmaps and strategic campaigns. Prior to Microsoft, Omar spent three decades at Accenture where he helped to orchestrate the company’s digital transformation, and led a large and highly successful business unit. He served in numerous senior leadership roles at Accenture, including Chief Strategy Officer and ultimately as Chief Executive of the global Communications, Technology and Media business.
Omar was previously a Non-Executive Director of Zuora, Inc., an enterprise SaaS company. He holds a degree in electronic engineering and information sciences from the University of Cambridge and a Master’s degree in business administration from INSEAD. |
Sally joined Pearson in 2000 and has held various finance and operations roles across the business, both at a corporate level and within the business units, including The Penguin Group. She brings to the Board extensive commercial and strategic finance experience, as well as expertise in transformation, treasury, tax, risk management, business and financial operations, investor relations and mergers & acquisitions.
Sally is a Non-Executive Director of Rentokil Initial plc and Chair of its Audit Committee, a member of the Institute of Chartered Accountants in England and Wales and trained at PricewaterhouseCoopers. She was also a Trustee for the Pearson Pension Plan from 2012 to 2018.
Current notable commitments
Rentokil Initial plc (Non-Executive Director) | ||||
| Annual report and accounts 2024 Pearson plc 70 |
|
Strategic report |
Governance report |
Financial statements |
Other information | |||||
|
|
||||||||

|

|

|

| |||
| Sherry Coutu, CBE | Alison Dolan | Alex Hardiman | Esther Lee | |||
| Non-Executive Director Age: 61 |
Non-Executive Director Age: 55 |
Non-Executive Director Age: 43 |
Non-Executive Director Age: 66 | |||
| Appointment | ||||||
| Non-Executive Director since 1 May 2019 |
Non-Executive Director since 1 June 2023 |
Non-Executive Director since 1 June 2023 |
Non-Executive Director since 1 February 2022 | |||
| Skills and experience | ||||||
| Sherry is an experienced non-executive director, having held numerous senior leadership positions, including Chair, Senior Independent Director and Chief Executive Officer in the financial services, technology and education sectors.
She is Non-Executive Director and Senior Independent Director of Raspberry Pi Holdings plc, the world’s largest single-board computer company, and she also chairs its Remuneration Committee. She is a Trustee of Founders4Schools, the UK’s largest transition-to-work charity.
Sherry’s previous directorships include the London Stock Exchange Group plc, DCMS, Zoopla plc, RM plc, The Scaleup Institute, Cambridge University Press and Cambridge Assessment (2006–2019). She has also acted as an adviser to LinkedIn, the National Gallery, the Royal Society and NESTA.
Prior to her portfolio career, Sherry founded several technology companies and invested in 70 tech start-up companies and five venture capital firms.
Current notable commitments
Raspberry Pi Holdings plc (Non-Executive Director and Senior Independent Director) |
Alison brings to the Board extensive commercial and operational finance experience, specifically in digital businesses. In January 2025, she joined the Board of Marks and Spencer Group plc as Chief Financial Officer. Prior to this, she was the Chief Financial Officer of Rightmove plc between September 2020 and September 2024 and she held several senior financial positions at Sky plc, including Group Treasurer, Director of Finance and was the Deputy Managing Director at Sky Business. She later moved to News UK to serve as Chief Strategy Officer at the forefront of the business’s digital transformation. Alison has a master’s in Finance from University College Dublin.
Current notable commitments
Marks and Spencer Group plc (Chief Financial Officer) |
With more than 15 years of experience in media and technology, Alex brings to the Board deep expertise in consumer product strategy and growth, scaling subscription and digital advertising businesses, and high-quality journalism and content.
Alex currently serves as Chief Product Officer at The New York Times, where she oversees the company’s News, Cooking, Games and Audio products that power its digital business. She also leads its enterprise-wide approach to generative AI. Alex previously spent a decade at The New York Times in several leadership roles before leaving for Facebook in 2016 where she served as Head of News Products, overseeing news experiences for Facebook consumers and publishers. Alex also spent time at The Atlantic as its Chief Business and Product Officer where she relaunched the company’s consumer offerings and subscription model.
Current notable commitments
The New York Times (Chief Product Officer) |
Esther brings significant experience to the Pearson Board through her prior executive management roles in developing customer strategies to drive growth, global marketing and branding, driving digital transformation and building high-performance teams.
She has a long track record of senior leadership roles working for global consumer-facing brands. Most recently, she served as Executive Vice President – Global Chief Marketing Officer at MetLife Inc. Previously, Esther served as Senior Vice President – Brand Marketing, Advertising and Sponsorships for AT&T, and she has served as CEO of North America and President of Global Brands for Euro RSCG Worldwide. Prior to that, she served for five years as Global Chief Creative Officer for The Coca-Cola Company.
Esther is a Board member at The Clorox Company where she chairs the Nomination & Governance Committee and is a Non-Executive Director of Experian plc.
Current notable commitments
The Clorox Company (Non-Executive Director)
Experian plc (Non-Executive Director) | |||
| Annual report and accounts 2024 Pearson plc 71 |
|
Strategic report |
Governance report |
Financial statements |
Other information | |||||
| Board of Directors continued |
||||||||

|

|

|
||||
| Graeme Pitkethly | Annette Thomas | Lincoln Wallen | ||||
| Deputy Chair and Senior Independent Director Age: 58 |
Non-Executive Director Age: 59 |
Non-Executive Director Age: 64 |
||||
| Appointment | ||||||
| Non-Executive Director since 1 May 2019 |
Non-Executive Director since 1 October 2021 |
Non-Executive Director since 1 January 2016 |
||||
| Skills and experience | ||||||
| Graeme was Chief Financial Officer and a Board member of Unilever plc until December 2023. He joined Unilever in 2002 and, prior to his appointment as the CFO, was responsible for its UK and Ireland business. He also held a number of senior financial and commercial roles within Unilever and spent the earlier part of his career in senior corporate finance roles in the telecommunications industry. Graeme served as Vice President of Financial Planning and Vice President of Corporate Development at FLAG Telecom and started his career at PricewaterhouseCoopers.
Graeme is a Non-Executive Director of Sandoz Group AG and Chair of its Audit, Risk and Compliance Committee. He is also a Trustee of The Leverhulme Trust, a charitable trust funding academic research in the UK, a member of the Strathclyde University Centre for Sustainable Development and a chartered accountant.
Current notable commitments
Sandoz Group AG (Non-Executive Director) |
Annette has a 25-year track record in leading global publishing and data analytics businesses, across academic, educational and consumer media verticals. Most recently, she served as CEO of Guardian Media Group, a position she held until June 2021. Prior to that, Annette was CEO of the Web of Science Group at Clarivate Analytics, a data, analytics and software business focused on research and higher education. She has also served as CEO of Macmillan Publishers and led the digital and global transformation of Nature Publishing Group.
She is a Non-Executive Director of Schroders plc and currently serves as Senior Advisor to General Atlantic. Her previous non-executive experience includes serving as a Trustee of Yale University, Non-Executive Director at Clarivate Analytics (2017), and as a board member for Cambridge University Press and Cambridge Assessment (2019-2020). She has also previously acted as an adviser to Creative Commons and Bain Capital.
Current notable commitments
Schroders plc (Non-Executive Director) |
Lincoln has extensive experience in the technology and media industries, and is a Non-Executive Director of Improbable MV, which governs the MSquared Network of Web2 and Web3 services, and Chief Technology Officer (CTO) of Framestore Company 3, a global visual effects and media production company.
He was previously CTO of Improbable Worlds, a technology start-up supplying cloud hosting, networking and technology services to the video game industry, and CEO of DWA Nova, a Software-as-a-Service spin-out of DreamWorks Animation Studios in Los Angeles. He worked at DreamWorks Animation for nine years in a variety of leadership roles including CTO and Head of Animation Technology. He was formerly CTO at Electronic Arts Mobile, leading their entry into the mobile gaming business internationally. Lincoln is a Non-Executive Director of the Smith Institute for Industrial Mathematics and Systems Engineering, and Varjo, a manufacturer of XR/VR headsets for professional markets. His early career involved 20 years of IT and mathematics research, including as a Reader in Computer Science at Oxford. Lincoln holds a PhD in AI.
Current notable commitments
Framestore Company 3 (Chief Technology Officer) |
||||
| Annual report and accounts 2024 Pearson plc 72 |
|
Strategic report |
Governance report |
Financial statements |
Other information | |||||
|
|
||||||||
Board composition
Gender

Nationality

Ethnicity1

| 1. | Ethnicity categories are based on the UK’s Office for National Statistics classification. |
Tenure

This data reflects Directors in office as at 31 December 2024. To learn more about Board demographics, please see page 95. For diversity data in the format prescribed by UK Listing Rule 6.6.6R(10), please see page 54.
Independence of Directors
All of the Non-Executive Directors who served during 2024 were considered by the Board to be independent for the purposes of the UK Corporate Governance Code (the Code) and the listing standards of the New York Stock Exchange (NYSE). The Board reviews the independence of each of the Non-Executive Directors annually. This includes reviewing their external appointments and any potential conflicts of interest, as well as assessing their individual circumstances in order to ensure that there are no relationships or matters likely to affect their judgement. In addition to this review, each of the Non-Executive Directors is asked to provide confirmation of their independence on an annual basis as defined by the NYSE listing rules and the Code.
In January 2025, Lincoln Wallen reached nine years’ service on the Pearson Board. In view of the upcoming changes to the Board through the appointment of a new Non-Executive Director in June 2025, the Board believes that it is in the company’s interests for Mr Wallen to remain on the Board until the end of 2025 to ensure a smooth transition of knowledge and expertise. Upon attainment of nine years’ service by any Non-Executive Director, the Board undertakes an assessment to satisfy itself as to the continuing independence of that Director. In February 2025, ahead of formalising a recommendation to the Board regarding Mr Wallen’s proposed re-appointment at the 2025 AGM, the Nomination & Governance Committee assessed Mr Wallen’s independence. In doing so, the Committee assessed the degree of objective judgement and constructive challenge demonstrated by Mr Wallen, and confirmed that his skills, experience and knowledge contribute to productive Board discussions. Accordingly, the Board is satisfied that Mr Wallen remains independent and that he continues to provide constructive challenge and hold management to account.
In accordance with the Code, Omid Kordestani was considered to be independent upon his appointment as Chair on 29 April 2022.
The Directors can obtain independent professional advice, at the company’s expense, in the performance of their duties. All Directors have access to the advice and services of the Company Secretary, whose appointment and removal is a matter reserved for the full Board.

| Annual report and accounts 2024 Pearson plc 73 |
|
Strategic report |
Governance report |
Financial statements |
Other information | |||||
| Pearson Executive Management (PEM) |
||||||||

| ||||||

|

|

|

| |||
|
Chief Human Resources Officer Age: 56 |
Chief Marketing Officer Age: 57 |
President – Enterprise Learning and Skills Age: 52 |
President – English Language Learning Age: 54 | |||
| Appointment | ||||||
| Joined Pearson 13 December 2021
Appointed to the PEM 13 December 2021
|
Joined Pearson 29 July 2024
Appointed to the PEM 29 July 2024 |
Joined Pearson 15 April 2024
Appointed to the PEM 15 April 2024 |
Joined Pearson 10 January 2000
Appointed to the PEM 3 March 2025 | |||
| Skills and experience | ||||||
| Ali is a seasoned C-suite executive with over 25 years of experience building culture for transformative business performance across multiple industries. Prior to joining Pearson, she was an executive officer and CHRO for Hologic, Inc., a global medical technology company. Prior to Hologic, she held various HR leadership roles with the speciality retail company, ANN INC. | With more than 30 years of experience leading large-scale, global marketing and communications strategies, Ginny has a proven track record of scaling businesses, forging valuable partnerships and catapulting global brands to the top of their markets. Ginny has guided some of the world’s biggest brands such as HP, IBM, Intuit, Microsoft, MIT,NCR, Philips, Sun and Xerox.
Before joining Pearson, Ginny served as Chief Marketing Officer for Accenture North America and was a member of the Global Leadership Council. Ginny earned a BA in Modern Languages & Literature from the University of Bristol. Ginny serves as chair of strategic planning, executive board director and VP of marketing for San Francisco Opera Guild, which provides K-12 arts education programs to 64,000 children in Bay Area schools. |
Vishaal is an accomplished business leader with 29 years of global experience in enterprise technology. He has a track record of scaling digital businesses and building high-performance teams.
He joined Pearson from Accenture, where he was Senior Managing Director and a member of the Global Leadership Council. During his tenure at Accenture, he held several leadership roles such as Europe Technology Sales, Solutions and Ecosystem lead and Global Technology Industry lead for Telecoms and Media. Previously, Vishaal worked with Tech Mahindra, MindTree and HCL Technologies. |
Sharon has 25 years of assessment and qualifications experience. Additionally, she started her career teaching geography in secondary schools in the UK and taught for eight years. Sharon is a resilient business leader with deep experience operating in a media sensitive, highly regulated environment. She has worked extensively with governments, schools and partners to provide teaching, learning and assessment services that help children and young people make progress through learning. Sharon is an elected representative on the Council of the UK Publishing Association and has previously chaired the Joint Council for Qualifications. She graduated from Oxford University with a BA in Geography and PGCE. | |||
| PEM composition
|
||||
| Gender
|
Ethnicity1
|
These figures reflect the Executive Management team, excluding the Company Secretary, as at the date of this annual report. The Chief Executive and Chief Financial Officer have been excluded and are counted in the Board metrics on page 73. For diversity data in the format prescribed by UKLR 6.6.6R(10), please see page 54. | ||
| 1. Ethnicity categories are based on the UK’s Office for National Statistics classification. |
||||
| Annual report and accounts 2024 Pearson plc 74 |
|
Strategic report |
Governance report |
Financial statements |
Other information | |||||
|
|
||||||||

|

|

|

| |||
| Chief Strategy Officer Age: 49 |
General Counsel Age: 44 |
Chief Product Officer Age: 52 |
President – Higher Education and Virtual Learning Age: 46 | |||
| Appointment | ||||||
| Joined Pearson 16 May 2022
Appointed to the PEM 16 May 2022 |
Joined Pearson 1 February 2014
Appointed to the PEM 21 May 2020 |
Joined Pearson 1 May 2023
Appointed to the PEM 1 May 2023 |
Joined Pearson 1 December 2004
Appointed to the PEM 1 April 2021 | |||
| Skills and experience | ||||||
| Sue has more than 25 years of global strategy and corporate experience. Additionally, she held engineering roles at technology companies. Sue holds an MBA from The Wharton School at the University of Pennsylvania and a BSc in electrical engineering from the University of Ottawa in Canada. She has served on several non-profit boards and councils focused on diversity and STEM. | Cinthia has over 20 years of international legal and compliance experience. Before joining Pearson, she held leadership roles in legal and compliance at multinational companies. Cinthia was admitted to the Brazilian bar in 2004 and earned her law degree from Pontifícia Universidade Católica de Campinas as well as a post-graduate degree in tax law from Pontifícia Universidade Católica de São Paulo. | Tony has more than 25 years of experience in consumer-led product management in companies including Sema4, American Express, and Starbucks. He brings extensive expertise in strategic product development and consumer marketing. He holds an MBA from Columbia Business School and a BS in Mechanical Engineering from Cornell University. | Tom has 20 years of international business and finance experience. At Pearson, he has led the Virtual Schools business, worked in finance for the emerging markets businesses and led M&A activity in the US. Previously, he worked in investment banking at RW Baird. Tom holds an MA in Economics and Politics from the University of Edinburgh. | |||
| Nationality | External/Internal appointment | |||||

|

|
| Annual report and accounts 2024 Pearson plc 75 |
|
Strategic report |
Governance report |
Financial statements |
Other information | |||||
| Pearson Executive Management (PEM) continued |
||||||||
|
| ||||||

|

|

|

| |||
| Chief Technology Officer Age: 50 |
Chief Business Officer Age: 53 |
President – Assessment & Qualifications Age: 60 |
Chief Information Officer Age: 62 | |||
| Appointment | ||||||
| Joined Pearson 2 July 2024
Appointed to the PEM 2 July 2024 |
Joined Pearson 13 January 2025
Appointed to the PEM 13 January 2025 |
Joined Pearson 23 January 2006
Appointed to the PEM 1 February 2022 |
Joined Pearson 14 July 2014
Appointed to the PEM 16 March 2022 | |||
| Skills and experience | ||||||
| Dave has over 25 years of experience in technology, innovation and strategic business transformation. He joined Pearson from Accenture where he served as a Senior Managing Director. Dave helped to found and has served on several technology and industry boards including the Linux Hyperledger Foundation, Linux Open Wallet Foundation, Digital Dollar Project and the Global Business Blockchain Council. Dave earned a master’s degree in Higher Education Administration from the University of Michigan and a degree in Psychology from the University of Pennsylvania. | Naseem has over 30 years of leadership experience in sales and international and market development. Prior to joining Pearson, he was Chief Growth Officer of global advertising technology firm The Trade Desk. He has also served in a variety of go-to-market leadership roles during his long career at Microsoft, most recently as Head of Sales for the company’s Modern Work businesses. Naseem serves on the board of several non-profit organisations dedicated to providing medical relief to children in underserved areas, and holds a degree in Economics from Harvard University. | Art has more than 30 years of leadership experience in assessments, testing and technology. Prior to his 19 years at Pearson serving as a senior leader of Pearson VUE and as Managing Director of Pearson Clinical Assessment, Art worked at global technology organisations including Accenture and Promissor, which was acquired by Pearson in 2006. Art earned his BS in Mathematical Science/Computer Science from the University of North Carolina Chapel Hill. | Marykay has over 30 years of strategic planning and large, global technology transformation experience. Prior to joining Pearson, Marykay had CIO roles at Nortel, Tekelec (acquired by Oracle) and Extreme Networks. Marykay holds a BS degree in Computer Information Science from Clarkson University and is a member of the Salesforce CIO Advisory Board, MGT Board of Directors, and is a Board Member of the non-profit Rewriting the Code (advancing Women in Tech). | |||
| Annual report and accounts 2024 Pearson plc 76 |
|
Strategic report |
Governance report |
Financial statements |
Other information | |||||
| Division of responsibilities |
||||||||
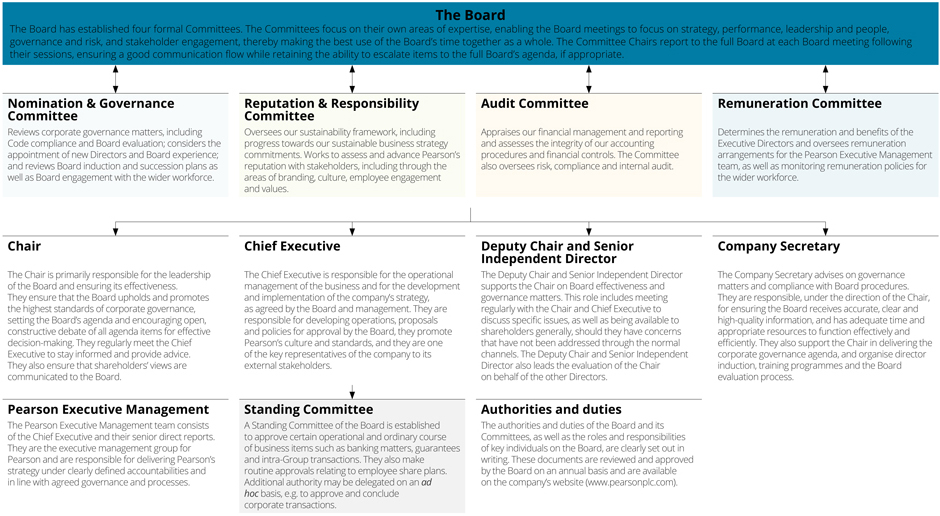
| Annual report and accounts 2024 Pearson plc 77 |
|
Strategic report |
Governance report |
Financial statements |
Other information | |||||
| Board activities |
||||||||
The Board is deeply engaged in developing and measuring the company’s long-term strategy, performance, culture and values. We believe that Board members provide a valuable and varied set of external perspectives and that robust, open debate about significant business issues brings an additional discipline to major decisions.
The role and business of the Board
The key responsibilities of the Board include:
| • | Overall leadership of the company and setting the company’s values and standards, including monitoring culture, performance and engagement. |
| • | Reviewing and determining the company’s strategy, in consultation with management, assessing performance against the strategy and overseeing management’s execution of it. |
| • | Supervising major changes to the company’s corporate, capital, management and control structures. |
| • | Approval of all transactions or financial commitments in excess of the authority limits delegated to the Chief Executive and other Executive Management. |
| • | Oversight of the risk management approach and determining the company’s risk appetite (see page 57 for more information on risk management). |
| • | Assessment of management performance, Board and executive succession planning and talent pipeline. |
| • | Effective engagement with key stakeholders. |
Strategic planning and decision-making
The Board spends time assessing whether any proposed action aligns with the strategy and future direction of the business, while taking into consideration sustainability and impact on our stakeholders. In addition, the Board regularly holds strategy discussions, whether in relation to the specific strategies of Pearson’s five business units or the vision and execution of the wider company strategy as a whole, both of which enhance the Board’s decision-making in shaping the company’s strategic and financial plans.
The Board and Committees receive timely, regular and necessary financial, management and other information to discharge their duties. Comprehensive papers are circulated to Board and Committee members approximately one week in advance of each meeting.
The Board receives a regular performance dashboard and key milestones report, together with updates from the Chief Executive and Chief Financial Officer. In addition to meeting papers, a library of current and historical corporate information is made available to Directors to support the Board’s decision-making process. For items that require significant consideration and review in advance of a decision, such as the update to the company’s strategic priorities during 2024, the Board’s discussions can take place over a number of sessions.
The Directors recognise their duties towards the shareholders and other stakeholders as set out in Section 172 of the Companies Act 2006, and a continued understanding of the key issues affecting stakeholders is an integral part of the Board’s decision-making process. You can read more on pages 86-87 about how the Board engages with stakeholders and takes their views into account when making decisions.
Portfolio changes
The Board regularly reviews updates on portfolio and corporate finance activities throughout the year, including regular updates on live transactions (disposals, acquisitions and corporate joint venture activity), outputs of periodic portfolio reviews and reviews of potential pipeline opportunities. These updates can take the form of presenting key summaries of information in Board packs, or oral updates on key matters. These discussions are typically led by management, supported by the Corporate Development team and, where necessary, external advisers, with Board input collated and, where necessary, providing its formal approval. Subsequently, once portfolio transactions have closed, the Board is also kept informed of the integration or transition progress, including post-acquisition reviews conducted to assess transaction success and any learnings to be taken for future projects.
Board meetings
The Board held seven scheduled meetings in 2024, with discussions and debates focusing on the ongoing development and execution of the company’s markets, customer and people strategies, as well as other strategic drivers for the company. Major items covered by the Board in 2024 are shown in the table on page 79. In addition to its scheduled meetings, the Board convenes as necessary to consider matters of a time-sensitive nature.
Reflecting on the level and quality of engagement by the Board in 2024, the Board is satisfied that each Director contributed to Board discussions and demonstrated sufficient commitment to be able to meet their responsibilities. In addition, the Nomination & Governance Committee confirmed in its annual assessment that each Director demonstrates the requisite level of commitment and contribution in accordance with Principle H and Provision 18 of the Code.
| Annual report and accounts 2024 Pearson plc 78 |
|
Strategic report |
Governance report |
Financial statements |
Other information | |||||
|
|
||||||||
Board attendance
Directors are expected to attend all Board and Committee meetings, but in certain situations, such as pre-existing business or personal commitments or certain unforeseen circumstances, it is recognised that Directors may be unable to attend. In these circumstances, the Directors receive relevant papers and, wherever possible, will communicate any comments and observations in advance of the meeting for raising as appropriate during the meeting. They are updated on any developments after the meeting by the Chair of the Board or Committee, as appropriate.
Individuals’ attendance at Board and Committee meetings is considered as part of the formal review of their performance. There was a high level of attendance by the Directors at Board and Committee meetings in 2024, as shown in the table on page 80 and in the Committee reports that follow.
The exceptions to this in 2024 were Esther Lee, who was unable to attend the meeting in February due to a pre-existing commitment and the meeting in July due to a family medical emergency, and Lincoln Wallen, who was unable to attend the meeting in October due to unforeseen personal circumstances.
Directors’ commitments and conflicts of interest
Under the Companies Act 2006, the Directors have a statutory duty to avoid conflicts of interest with the company. The company’s Articles of Association allow the Directors to authorise conflicts of interest. The company has an established procedure to identify actual and potential conflicts of interest, including all directorships or other appointments to, or relationships with, companies that are not part of the Pearson Group and which could give rise to actual or potential conflicts of interest.
Additionally, in response to Provision 15 of the UK Corporate Governance Code and the FRC’s accompanying guidance on Board effectiveness, Pearson has developed internal guidance to be taken into account when considering changes to a Director’s commitments, or when appointing a new Director, as well as formalising the Board approval process for such matters.
Once notified to the company, any potential conflicts and commitments are considered for authorisation by the Board at its next scheduled meeting or, where necessary in the interests of timeliness, by a committee comprising the Chair, the Deputy Chair and Senior Independent Director, and the Company Secretary. In particular, the Board or committee considers the type of role, expected time commitment and any impact this may have on the Director’s duties to Pearson, as well as any relationships between Pearson and the external organisation.
| Board meeting focus 2024
| ||||||||
| Strategy | Performance | Leadership and people |
Governance and risk | Shareholder engagement | ||||
| • Oversight of strategic planning process, including market overviews and growth opportunities, approval of the evolution of the company’s strategy and oversight of strategy execution, including deep dives on the progress of specific strategic initiatives.
• Consideration and approval of the 2025 annual operating plan and updated long-range plan.
• M&A pipeline and post-acquisition reviews. |
• Approving 2023 preliminary results and annual report and accounts.
• Approving 2024 performance expectations and guidance to the market.
• Approving the 2024 interim results and Q1 and Q3 trading statements.
• Monitoring 2024 operating plan performance.
• Regular dashboard and milestone reports.
• Strategic and non-financial KPIs reviews.
• Continuing review of forecasts.
• Final and interim dividend approvals and other capital allocation considerations, including share buyback. |
• Talent review, pipeline development and succession planning process.
• Culture.
• Employee engagement sessions with Board.
• Employee engagement survey assessments. |
• Reports on Committees’ activities and considerations.
• Legal, regulatory and governance matters.
• Board and Committees’ performance review.
• Regular review and annual confirmation of Directors’ commitments and/or potential conflicts of interest.
• Annual assessment and re-approval of Committees’ terms of reference.
• Risk management report.
• Board learning and development through deepening operational understanding. |
• Investor relations strategy and updates, share price performance and value creation considerations.
• Shareholder issues and voting.
• AGM and related shareholder interactions.
• Feedback from Board member meetings with shareholders.
• Major shareholders and share register analysis. | ||||
| Annual report and accounts 2024 Pearson plc 79 |
|
Strategic report |
Governance report |
Financial statements |
Other information | |||||
| Board activities continued |
||||||||
The interested Director is not permitted to vote on, or be counted in the quorum for, any resolution relating to their proposed commitments, conflict or potential conflict. The Board further reviews any authorisations previously granted on an annual basis. When making new appointments, the Board considers other demands on the proposed Director’s time.
The Board believes that the experience gained by Directors through their other commitments brings valuable perspectives to the Pearson Board. During the year, the Board approved the following new commitments:
| • | On 30 April 2024, Graeme Pitkethly was appointed to the Board of Sandoz Group AG as Non-Executive Director and Chair of its Audit, Risk and Compliance Committee. When considering this new commitment, the Board assessed any potential conflicts of interest and the time commitment required, noting that Mr Pitkethly had recently stepped down from a full-time executive role as Chief Financial Officer of Unilever plc. |
| • | On 2 June 2024, Sherry Coutu was appointed to the Board of Raspberry Pi Holdings plc, which was admitted to the main market of the London Stock Exchange on 14 June 2024, as Non-Executive Director and Senior Independent Director and is also Chair of its Remuneration Committee. When considering this new commitment, the Board assessed any potential conflicts of interest and the time commitment required, noting that Ms Coutu has been associated with Raspberry Pi since 2012 and that this appointment reflected their new status as a listed company, rather than being a significant new commitment in its own right. |
| • | On 6 January 2025, Alison Dolan joined the Board of Marks and Spencer Group plc as Chief Financial Officer. When considering this new commitment, the Board assessed any potential conflicts of interest and the time commitment required, noting that Ms Dolan had stepped down from her previous full-time executive role as Chief Financial Officer of Rightmove plc on 15 September 2024. |
When considering these new commitments, the Board also took into consideration the requirements under Provision 15 of the UK Corporate Governance Code and the FRC’s accompanying guidance on Board effectiveness. The Board agreed that these new commitments would not have a negative impact on their roles at Pearson.
| Scheduled meetings attended |
||||
| Chair | ||||
| Omid Kordestani |
7/7 | |||
| Executive Directors | ||||
| Omar Abbosh |
7/7 | |||
| Andy Bird1 |
0/0 | |||
| Sally Johnson |
7/7 | |||
| Non-Executive Directors | ||||
| Sherry Coutu CBE |
7/7 | |||
| Alison Dolan |
7/7 | |||
| Alex Hardiman |
7/7 | |||
| Esther Lee2 |
5/7 | |||
| Graeme Pitkethly |
7/7 | |||
| Tim Score3 |
3/3 | |||
| Annette Thomas |
7/7 | |||
| Lincoln Wallen4 |
6/7 | |||
| 1. | Andy Bird retired from the Board on 7 January 2024. |
| 2. | Esther Lee was unable to attend the Board meeting on 28 February 2024 due to a pre-existing commitment. Ms Lee was unable to attend the Board meeting on 25 July 2024 due to a family medical emergency. On each occasion, she reviewed the papers and provided her perspectives to the Chair outside the meetings. |
| 3. | Tim Score retired from the Board on 26 April 2024. |
| 4. | Lincoln Wallen was unable to attend the Board meeting on 9 and 10 October 2024 due to unforeseen personal circumstances. He reviewed the papers and provided his perspectives to the Chair outside the meeting. |

| Annual report and accounts 2024 Pearson plc 80 |
|
Strategic report |
Governance report |
Financial statements |
Other information | |||||
| How the Board is kept informed |
||||||||
The application of our Board and governance processes ensures that our Directors receive accurate, timely and clear information from a range of sources. This allows the Board and Committees to monitor and provide feedback on matters of importance, as well as to make informed decisions in the best interests of the company and its stakeholders.
The Board’s oversight of AI at Pearson
As a digital-first business, Pearson is accelerating its use of AI across the business and using it as a growth driver to improve efficiencies and to enhance learning and assessment services. We expect generative AI to create significant positive opportunities for Pearson, due to our unrivalled depth of content and data.
We believe that the rapid advances in AI will be an important driver of growth in education and the workforce over the coming years. The rapid development of increasingly powerful AI models will significantly change the world of work and skills requirements. Employers will need to find new pools of talent and continuously develop and verify the skills of their workforces to keep pace with and benefit from technology and AI advancements. Learners and educators place enormous trust in us, so we have a responsibility to be thoughtful and considered in how we use this technology, while continuing to move at pace to enhance our products with the customer in mind. AI plays an important role across Pearson’s product portfolio, more information on which can be found in the Strategic report. With AI skills becoming increasingly important in the job market and helping humans be more productive, the need for AI learning is growing and we are always exploring opportunities to continue to leverage innovative AI technology to drive further efficiencies and cost savings.
During the past year, the Board, the Audit Committee, the Reputation & Responsibility Committee and the Executive Management team have kept up to date with AI developments both within Pearson and across the wider landscape, considering both opportunities and implications of the technology for Pearson. Specific activities undertaken by the Board and Committees during the year have included:
| • | During 2024 an extensive strategic review process was undertaken by the business, with the Board’s participation, to define the strategic priorities that will guide Pearson’s trajectory over the next decade. As part of this process, we identified a number of targeted market expansion opportunities and updated our strategy to drive higher performance in the core business and unlock new synergies. |
The opportunities for Pearson are supported by the infusion of AI into our products and services.
| • | One of the three priorities we set as a company for 2024 was to increase the intensity with which we infuse our products and services with a wide range of AI capabilities. The Board considered the specific initiatives, priorities and opportunities of AI, in terms of product capabilities, potential application for companies and workforces, and internal back-office efficiencies leveraging AI technology for content and process engineering. This included a deep dive on AI enhancements being applied to the company’s customer services capabilities. The Board was updated on progress with the new meaningful multi-year enterprise deal with ServiceNow, on progress with the new AI features integrated into products in Higher Education and English Language Learning, and the Board reviewed and approved the new multi-year strategic Enterprise AI partnership with Microsoft. |
| • | The Audit Committee was provided with updates on ongoing work being undertaken to understand potential risks and opportunities with evolving AI technology. Data privacy and cyber security remain important parts of the Audit Committee’s remit and our robust practices in these spaces underpin our approach to AI governance. |

| • | The Audit Committee considered the risks associated with generative AI and reviewed its status as part of the Group risk review. In addition, as part of the business unit strategic risk deep dives, the Audit Committee discussed: |
| • | In Assessment & Qualifications, an overview of risks associated with AI and the competitive marketplace, as well as perspectives on the use of AI in that business, drawing a distinction between the AI techniques that had been in use for some time and the recent developments in generative AI. |
| • | In Higher Education, an overview of how Pearson’s generative AI capabilities were driving content production efficiencies and personalisation of materials, as well as consideration of a roadmap to release meaningful new AI-powered capabilities and actions taken to invest in features and capabilities that had already been enabled by the emergence of generative AI platforms. |
| • | In Virtual Learning, an overview of the work to add AI tooling to our content ecosystem and programming to enhance our college and career readiness offering. |
| • | The Reputation & Responsibility Committee considered the AI landscape from a regulatory, policy and media perspective, including: |
| • | An update on the significant regulatory and policy focus on this topic, including the EU AI Act, which passed in April 2024, cementing the first comprehensive regulatory scheme for the development and use of AI in the world and the US state action on passing AI-related laws. |
| • | Noting the advocacy work conducted by the company in this field. |
| • | The alignment of Pearson’s safeguarding and online trust and safety programmes with the company’s broader AI, data privacy and cyber security governance frameworks. |
You can read more about how we manage AI from a risk perspective on page 60.
| Annual report and accounts 2024 Pearson plc 81 |
|
Strategic report |
Governance report |
Financial statements |
Other information | |||||
| How the Board is kept informed continued |
||||||||
Talent and culture
Ensuring that we have both a talented, engaged workforce that is focused on delivering our strategy and an organisational culture that enables and encourages that delivery is critical to Pearson’s success. During the past year, the Board and Executive Management team have continued to lead our focus on making sure Pearson offers a culture and environment that is high-performing, and in which our people can leverage their strengths. We track Group-wide progress through our ‘Culture of engagement & community’ non-financial KPI (see page 24 for more details on our KPIs). Pearson’s purpose (set out on page 2) is key to developing our culture to support our strategic vision, particularly in driving a culture of performance.
The Board has a particular focus on embedding our desired culture, with the current and future leaders of Pearson being essential to the successful embedding of our purpose and culture of performance. Our strategic priorities are underpinned by our commitment to provide a vibrant work environment, unparalleled career opportunities, open communication and tailored feedback, exceptional leadership and a clear definition of success for our employees. In connection with this, the Board was provided with an overview of the new career architecture and the execution plan ahead of its launch in January 2025.
The Board has also been attentive to our talent pipeline for leadership and other pivotal roles and, during the year, Pearson introduced a ‘Leadership Uplift’ programme for senior employees which includes alignment on the behaviours we expect in our leaders, assessment of these behaviours and investment in tools, resources and coaching. This programme is a valuable enhancement to our leadership and talent review process. By providing a consistent framework and an objective perspective, it facilitates more meaningful discussions about talent across the organisation and sharpens our ability to identify and prioritise leadership development opportunities that align with the evolving needs of our business. Our objective was to build something that fits our purpose, builds trust over time and can be an asset to our leaders, our managers and our people. The Board received a detailed overview of the programme, including the process for building the leadership assessments and the key themes and insights from the completed assessments. The Board also reviewed the Executive Management team’s leadership profiles, which provide a deeper understanding of the Executive Management team’s strengths and potential, in order to ensure that we place the right talent in critical roles and build a leadership pipeline capable of driving sustainable growth, fostering innovation and delivering on our strategic priorities.
The Board monitors culture and organisational health, together with its Committees, and receives regular updates from the Chief Executive and Chief Human Resources Officer on how this is being embedded within the business. The Board monitors other Group-wide initiatives that underpin our culture, including employee engagement, the Code of Conduct programme, compliance, health and safety and talent attraction and retention (see table below for further information).
During the year, the Board also conducted a review of the results of Pearson’s employee engagement survey, to discuss the key themes and indicators.
The Reputation & Responsibility Committee’s remit includes oversight of culture, increasing the Board-level focus on this matter. The Chief Human Resources Officer is a frequent attendee at Board meetings, as well as a standing attendee at the Reputation & Responsibility, Remuneration, and Nomination & Governance Committees. Their attendance and contributions, together with the Board’s own direct engagement with the workforce, ensure that our Directors are attuned to our culture and employee-related considerations through multiple lenses, including in strategic decision-making (see our case study on page 86), and in conducting their business more broadly.
Read more on page 38.
| Cultural indicator |
How it is overseen | Board-level responsibility | ||
| Employee engagement |
The Board ensures engagement through multiple channels, including the employee engagement survey, town hall sessions and in-person engagement events, such as listening sessions with employees in London, Hoboken, New Jersey, and Durham, North Carolina. Read more on page 85. | Board | ||
| Code of Conduct and training |
The Audit Committee is briefed on our annual Code of Conduct programme, including development of the Code, completion rates, training and certification methods. Certification of the Code is mandatory and we achieved a 100% employee completion rate for 2024. We also have mandatory training for all employees on cyber security and data privacy, with targeted training for employees in certain roles, business units or geographies. | Audit | ||
| Compliance, including whistleblowing and investigations |
The Associate General Counsel – Employment, Ethics & Compliance reports to the Audit Committee at every meeting on new and ongoing investigations, including matters raised through our SpeakUp process. The Audit Committee considers the programme’s effectiveness annually, including periodic peer benchmarking. The Audit Committee Chair ensures the Board has visibility on matters of note. The Board is free to request further information to support its oversight. | Audit | ||
| Internal audit |
Insights into elements impacting our culture and cultural behaviours are provided where necessary by internal audit to the Audit Committee as part of the findings and recommendations in its reports. | Audit | ||
| Health and safety (H&S) |
The Reputation & Responsibility Committee receives an annual H&S report, so Directors can monitor the key strands of our H&S framework, including oversight of how Pearson is enabled through awareness, competency, resources and guidance to allow for agile and effective management of H&S risk, while also receiving comfort that we have controls for compliance and assurance purposes. | Reputation & Responsibility | ||
| Remuneration practices and rewarding the workforce |
The Remuneration Committee monitors the wider Employee Reward framework, including incentive target setting for Group plans, fair pay analysis, Chief Executive pay ratios and alignment of Directors’ pension contributions to the workforce. It also oversees integration of sustainability measures into incentive targets. This suite of activity provides insights into the roles that remuneration and setting performance goals play in promoting the right behaviours, particularly in driving a culture of performance, and how incentives and rewards align with culture. | Remuneration | ||
| Talent attraction and retention |
The Chief Human Resources Officer regularly updates the Remuneration Committee on talent considerations, including trends on recruitment, retention and staff turnover. Talent attraction and retention plays into our ability to execute our strategy, so it is considered in strategic discussions by the Board and Executive Management team. Recognising the importance of our people, Talent is a sub-category of our Capability principal risk. Read more about our risk management approach starting on page 57. | Remuneration | ||
| Annual report and accounts 2024 Pearson plc 82 |
|
Strategic report |
Governance report |
Financial statements |
Other information | |||||
|
|
||||||||
Sustainability
Pearson has a strong governance structure through which the Board and its Committees monitor and oversee the company’s Learning for Impact framework.
| Indicative sustainability duties falling within remits of Board Committees
|

|
The company’s Learning for Impact framework includes three pillars: ‘Driving learning for everyone with our products’, ‘Empowering our people to make a difference’, and ‘Leading responsibly for a better planet’. These pillars represent the areas where Pearson can make the biggest positive impact and where our responsibilities lie towards communities and the environment.
The Reputation & Responsibility Committee leads the Board’s oversight of sustainability matters; however, given the breadth of topics that feed into our Learning for Impact pillars, as well as the increasingly complex external landscape around these matters, the other Committees each have a role to play in supporting the Board’s oversight of sustainability.
The graphic above illustrates how the Committees work together to support the Board in overseeing sustainability at Pearson.
You can read more on the sustainability matters covered during 2024 throughout this Governance report, in particular in the Reputation & Responsibility Committee’s report on pages 96-98.
| Annual report and accounts 2024 Pearson plc 83 |
|
Strategic report |
Governance report |
Financial statements |
Other information | |||||
| Understanding our stakeholders |
||||||||
A strong understanding of all our stakeholders and their perspectives is integral to our strategic planning and operational delivery. Our Board strategy sessions are informed by the views and needs of our eight stakeholder groups: shareholders, educational institutions and educators, employers, business partners and institutions, consumers, governments and regulators, communities and employees.
|
As required by the UK Corporate Governance Code, the Board ensures Pearson engages effectively with, and encourages participation from, its key stakeholders. The Board maintains its oversight through a variety of direct and indirect mechanisms, and the Reputation & Responsibility Committee monitors our stakeholder engagement framework.
The Board recognises that stakeholder views are integral to decision-making and setting the company’s strategy. More information on Pearson’s key stakeholders, including the outcomes of our engagement throughout 2024, is in the Strategic report on pages 18-22. Further information on how the Directors discharge their duties under Section 172 of the Companies Act 2006 is on page 23.
|
A number of Non-Executive Directors were involved in workshops for the strategic review process where they engaged with employees as part of the strategic planning process.
A key factor in any decision-making is listening to and considering the interests of stakeholders. We have set out below examples of the key employee and shareholder engagement activities undertaken by the Board and by individual Directors over 2024.
Shareholders
Shareholders are a key consideration in the Board’s decision-making. We have continued our focus on driving shareholder engagement through in-person and virtual meetings and events.
The Board is committed to fostering shareholder engagement and recognises that AGMs represent an opportunity for shareholders to interact with the Board and share their views, concerns and feedback. We successfully held our third hybrid AGM in 2024, which again took place at our 80 Strand office in London, with shareholders able to attend the meeting, vote and ask questions of the Board either in-person or virtually.
We will be holding a hybrid AGM in 2025 and look forward to welcoming our shareholders. Further details will be shared in our notice of the 2025 AGM.
|
The Board ensured a continued shareholder dialogue throughout the year. In accordance with the UK Corporate Governance Code, following a significant minority vote against our Directors’ Remuneration Report and the re-appointment of Remuneration Committee Chair, Sherry Coutu, at our 2024 AGM, a subsequent engagement exercise with shareholders was conducted and reported back to the market on the major themes of the feedback received. Further information on the shareholder engagement prior to and after our 2024 AGM is included in the Directors’ Remuneration Report starting on page 113.
The Board also receives updates and analysis on shareholder sentiment from Pearson’s corporate brokers, as part of a regular investor relations update and when considering certain corporate matters.
Employees
The Board recognises that our employees are one of our most important assets and are integral to our business and is committed to continuing to ensure they inform the Board’s decision-making. Examples of how the Board engaged with employees in 2024 to ensure that they are listened to, supported and rewarded, are illustrated on page 85. | ||||
|
Engagement in 2024
Throughout the year, the Board ensured that it was kept informed of stakeholder views, concerns and commentary through a variety of engagement methods. These included in-person and virtual meetings, reports and presentations at Board or Committee meetings, feedback from members of the Executive Management team and other employee groups, and interactions with different functions, teams and advisers, both inside and outside Pearson. |
| with |
||||||
| Shareholder engagement at a glance
Over 2024, our Chief Executive, Chief Financial Officer and Business Unit Presidents, as well our Investor Relations team, participated in Over meetings with both buy-side and sell-side analysts, conferences, roadshows, salesforce teach-ins and events across the world. |

|

| ||||
| Annual report and accounts 2024 Pearson plc 84 |
|
Strategic report |
Governance report |
Financial statements |
Other information | |||||
|
|
||||||||
Board and employee engagement
The central role of the Board is to support and oversee Pearson’s long-term strategy. As part of that, it is vital that the Board engages with employees, to strengthen the employee voice in the boardroom enabling the Board to hear first-hand the employees’ perspectives on Pearson’s strategy, performance and culture. During the year, the Board’s approach to employee engagement included in-person, structured sessions, which complemented existing executive employee engagement and expanded opportunities for direct engagement by Non-Executive Directors. The Board held three in-person sessions with employees in our major employee hubs in London and in the US in Hoboken, New Jersey and Durham, North Carolina, facilitating meaningful interactions between Board members and various groups of employees to hear their thoughts, feedback and questions. Board members engaged on a variety of topics, including the strategic review process and the clarity of our strategic priorities, the plans for execution and the pace of transformation required, and the importance of company culture.

These events were received very positively by employees, and the Board spent time after each session discussing what they had heard from employees.
Looking ahead, the Board intends to hold similar in-person and structured sessions in 2025 to ensure we continue to be authentic and representative of our entire employee base. The Board is also invited to join a number of Executive Management sponsored events with each business unit in 2025, including Assessment & Qualification’s global sales meetings, English Language Learning’s annual franchisee meeting and Higher Education’s annual sales conference.
Town halls
Throughout 2024, the Chief Executive, Chief Financial Officer and the Executive Management team held in-person and virtual town hall meetings. Pearson employees were invited to attend and given the opportunity to ask questions. These discussions took place at significant points in the year, such as following key strategic announcements.
Surveys
During 2024, we conducted a further Pearson employee engagement survey, following the launch of a refreshed approach in 2022. We heard from c.14,000 employees, with an overall response rate of 88% compared with 82% in 2023. The Board received a detailed update on the survey results, including additional insights on the culture of inclusion, coaching effectiveness and opportunities to increase engagement. Further information on the outcomes of the Pearson employee engagement survey is on page 38.


| Annual report and accounts 2024 Pearson plc 85 |
|
Strategic report |
Governance report |
Financial statements |
Other information | |||||
| Our Board’s decision-making in action | ||||||||
This case study should be read in conjunction with the Directors’ duties statement on page 23.
During the year, the Board oversaw a company-wide strategic review process, which involved a comprehensive review of Pearson’s business and its markets, to position the company for growth and ensure our continued success. Led by the Chief Executive, approximately 60 employees came together in a series of intensive workshops - including current and potential future business leaders, subject matter experts in areas such as data, AI, legal and HR, and sales and operational employees. This process was a unique opportunity to evolve our strategic priorities in order to be the leader in shaping the future of next-gen education and work in the era of AI. This case study on the Board’s involvement in the strategic review process over the year illustrates how the Directors considered the various aspects of their statutory duties when considering the strategic review process and approving its implementation, and the implications for stakeholders.
The Board reviewed the proposal for the strategic review process in January 2024, where the Chief Executive confirmed that he would be initiating the project to build towards a strategic update to the market as part of Pearson’s interim results in July 2024. The Board considered an update on progress in February 2024, including endorsing the criteria for the employees that had been selected to be involved in the strategic review process, and the process itself commenced in March 2024.
At its subsequent meeting in April 2024, the Board considered an overview of the process to date, including assessments of the company’s assets, industry trends and competitive strengths. Representatives from the project joined this Board meeting to provide deep dives into certain key topics, including addressable market areas, key customer challenges and solutions, and identifying foundational capabilities in data and AI, to showcase the progress being made and to provide the Board with an opportunity to challenge and ask questions. The Board was also provided with a detailed overview of the activity that had taken place at the project sessions and an indication of the goals and priorities for future sessions.
A majority of the Board attended the project sessions held in April and May 2024, to see the process in-person. The sessions they attended were focused on topics including competitors’ products, the anatomy of a deal, brand and purpose, as well as an innovation panel and a product development workshop.
In June 2024, the Board dedicated a specially arranged additional meeting to discussing the outcome of the strategic review process, the proposal for the overall corporate strategy and the strategic priorities over the next two to three years, and how this would be presented to the market in July 2024. This meeting was an opportunity for the Board to dive deeper into the process outcomes, the rationale for the proposed strategic priorities and the management levers that would drive performance; provide challenge to management on the proposals and execution plans; and consider the impact of the proposed strategic priorities on the company’s stakeholders.
Management framed the strategic priorities by describing Pearson’s external and internal context, as well as noting the company’s stakeholders and considerations made for them in preparing the overall corporate strategy.
Ahead of the strategic update to the market in July 2024, the Board reviewed the proposed communications plan and provided feedback on the themes and their perspectives on the potential market reaction.
Following the presentation of the strategy to the market in July 2024, the Board’s focus has pivoted to monitoring implementation, particularly a collection of projects that were commenced in the second half of the year, focused on strategic partnerships, such as with Microsoft, and developing our people and culture strategy, and will continue to monitor the key milestones and checkpoints of the strategy’s implementation.
Stakeholders
In its consideration of the strategic review, the Board considered Pearson’s key stakeholders in the following ways:
Customers
In considering the proposal for the strategic direction of the company, the Board was focused on ensuring that the customer was front of mind in the work that had been conducted and the considerations being made. We want to be a trusted partner for our customers, driving positive outcomes through democratised, intuitive, high-quality and personalised solutions. Customers were interviewed as part of the preparation for the project sessions and the Board received key data on the pressures facing our customer groups, including institutions, governments, educators, employers, employees and students. The Board agreed that the proposed strategic priorities would aim to address these pressures. This includes tackling cumbersome course management and teaching effectiveness for educators, supporting students with poor engagement and navigating their futures, and helping external workforces to prove their skills and support their career paths.
| Annual report and accounts 2024 Pearson plc 86 |
|
Strategic report |
Governance report |
Financial statements |
Other information | |||||
Shareholders
Our priority is to provide diversified coverage of education and learning markets with sales growth and margin opportunities, fuelled by technology and AI development, alongside highly rated sustainability credentials. As part of its oversight of the process, the Board ensured that our strategic priorities were underpinned by an aim to provide our shareholders with long-term value creation. This is achieved through strong growth opportunities, including with AI, a diversified portfolio, a strong balance sheet, a progressive and sustainable dividend and a sound capital allocation policy.
When reviewing the proposal, the Board considered our shareholders’ interests. As part of this, the Board provided input to ensure that the strategic update to the market included sufficient information on the growth opportunities and execution plans.
Communities
We strive to make a positive and meaningful impact in the communities in which we operate, and the Board was cognisant that this ambition was woven into the strategic priorities so that we can have a positive impact on people globally in supporting their ambitions and helping people realise the life they imagine through learning. Our strategic priorities support strong societal benefits and maintain our net carbon commitment.
Employees
At Pearson, we offer career opportunities that make a real-world positive impact. In considering the execution of our strategic priorities, there was a clear focus from the Board on our employees and how we will raise the bar for our people, with a focus on an improved performance culture, instilling essential behaviours, and enhancements in performance management. The Board was also clear on the importance of how this would be communicated to employees, particularly the development of the new career architecture framework, and provided feedback on the change management aspects of the people and culture initiatives.
Employers
The Board was cognisant of the importance of Pearson’s relationship with employers and the trust they have in Pearson to deliver high-quality products and services, which has fostered stable long-term relationships which underpin our business. As part of the review of the pressures facing our customer groups, the Board noted how our strategic priorities aimed to address the pressures facing employers and would particularly focus on talent availability and the skills gap for employers.

|
Strategic report |
Governance report |
Financial statements |
Other information | |||||
| Directors’ induction |
||||||||

Omar Abbosh
Chief Executive
| On joining the Board, each Director completes a bespoke induction programme that is guided by the Chair or Deputy Chair and Senior Independent Director, supported by the Company Secretary, and overseen by the Nomination & Governance Committee. Every programme builds on the particular skill set, attributes and background of the joining Director, their interests in Board or Committee roles, and the company’s recommendations.
In addition to background information on the company, every induction covers a range of topics, including Board procedures, recent operational performance and strategic direction of the company, purpose and values, key areas of the business, as well as directors’ duties and responsibilities. The Directors also receive a comprehensive introduction to the activities of each of the Board’s Committees, including their objectives and priorities, and cover various governance-related issues and their legal obligations, including procedures for dealing in Pearson shares. |
Each induction typically includes a series of meetings with the members of the Board, the Executive Management team, external advisers and brokers, and other senior management. Directors receive a walk-through of the business from senior executives and a briefing on Pearson’s investor relations programme.
A newly appointed Director will have met some, if not all, fellow Board members as part of the original search and appointment process, but additional meetings may nevertheless occur with the same Board members as part of a rich and thorough induction.
Omar Abbosh joined the Board as Chief Executive on 8 January 2024. In addition to the typical induction programme detailed below, Omar conducted comprehensive and engaging meetings with key individuals in the business. |
Typical Board induction programme
| Induction programme participants | Meeting purpose | |
| Chair, Deputy Chair and Senior Independent Director |
Introductory meetings to cover the company’s governance structure, the Board’s priority areas and ways of working, meeting cadence and ongoing matters considered by the Board. | |
| Chairs and members of the Board’s Committees |
Overview of the responsibilities and composition of the Board’s Committees, their governance, regular attendees and advisers. | |
| Executive Directors; Business Unit Presidents |
Overview of the strategic priorities of the company and each business unit, key performance indicators, financial performance and projections, and competitive landscape. | |
| Heads of Corporate Functions |
Introductions with leadership team members, covering an overview of their business area(s), subject matter expertise, organisational structure, company culture and values. | |
| Company Secretary; legal advisers |
Induction planning, governance framework, Board and Committee matters, duties and responsibilities of a company director, the company’s policies and procedures, and other legal and regulatory considerations. | |
| Annual report and accounts 2024 Pearson plc 88 |
|
Strategic report |
Governance report |
Financial statements |
Other information | |||||
| Board performance review | ||||||||
The Board employs a variety of methodologies for performance reviews to ensure the most effective results.
Following an internally facilitated review in 2022, led by the Chair, and an externally facilitated review in 2023, conducted by Manchester Square Partners, the 2024 review was internally facilitated and led by the Deputy Chair and Senior Independent Director.
Typical performance review methodologies
| Methodology | Last undertaken | |
| Questionnaire, tailored to specific needs of the business | 2018 | |
| Internally facilitated interviews, to be led by the Chair, Senior Independent Director and/or Company Secretary as appropriate | 2019, 2021, 2022, 2024 | |
| In-depth evaluation, externally facilitated | 2020, 2023 | |
Approach and methodology
The 2024 performance review was carried out by Graeme Pitkethly, Deputy Chair and Senior Independent Director, through a series of one-to-one conversations with each Director and the Company Secretary.
Discussion areas included matters that are relevant to Pearson in particular, as well as those items laid down in the Code and associated guidance, including:
| • | The effectiveness of the organisation and dynamics of the Board, including composition, leadership, agendas, meeting cadence, quality of information provided, governance and decision-making. |
| • | Relationships between the Board and senior leaders, and between members of the Board itself, including the remits of and interaction among the respective Committees and with the Board. |
| • | Articulation and implementation of strategy. |
| • | Succession planning and talent pipeline for Executive Directors and other senior leaders. |
| • | Understanding of risks facing the company, including likelihood and mitigation. |
| • | Understanding of stakeholder views, products and markets. |
| • | The Board’s monitoring of organisational culture, behaviours and employee sentiment. |
The full Board reviewed the findings from the performance review at its meeting in December 2024. In reporting back to the Board, the Deputy Chair and Senior Independent Director reported that conversations with Board members were positive, with unanimous agreement that the Board operates effectively. The Board will develop an action plan to address areas for improvement, and the Nomination & Governance Committee will monitor progress during the year.
| Board performance review process
| ||||

| ||||
| Annual report and accounts 2024 Pearson plc 89 |
|
Strategic report |
Governance report |
Financial statements |
Other information | |||||
| Board performance review continued | ||||||||
Key findings included
| • | Directors are highly engaged, with a good balance of relevant and recent experience. The Board further acknowledged the constructive nature of Board meetings. |
| • | The Board acknowledged the quality of the relationship between the Non-Executive Directors and the Executive Directors, noting that Mr Abbosh had quickly established strong relationships with the Non-Executive Directors. Directors noted his clear and structured approach, which will allow the Board to further focus on the pace of execution. |
| • | The Board recognised the improvements that had been made to the structure of Board meetings to create more space for discussion and agreed that the cadence of Board and Committee meetings was correct. The Board is appreciative of the continued improvements to the quality and clarity of meeting papers and materials, and would like to see this continue. |
| • | The Board welcomed the opportunity to engage with employees and the improvements made to the engagement events, in particular the ability to have deeper conversations with employees. |
| • | Directors provided positive feedback on the strategic review process. |
| • | Directors would like to harness the opportunity to work on the talent pipeline for the Executive Management team. |
| • | The Board welcomed the opportunity, following articulation of the evolved strategy, to focus on developing multi-year strategic KPIs and implementing the right incentive structures to deliver the strategy. |
| • | The Board recognised their effective role in navigating the transition and repositioning of the company. |
| • | Positive feedback was noted on the performance and effectiveness of the Committees. |
There was unanimous agreement that the Chair leads the Board in an effective manner, fulfilling Principle F of the Code. The Directors agreed that Mr Kordestani has a distinctive and thoughtful style, demonstrates objective judgement, promotes a culture of openness and debate, and facilitates constructive Board relations and the effective contribution of all Non-Executive Directors. The Directors further noted their appreciation of Mr Kordestani’s critical role in managing the successful Chief Executive appointment process and the energy given in the development of the relationship between Mr Kordestani and the Chief Executive. This, in turn, supports the Non-Executive Directors in fulfilling the requirements of Principle H of the Code in providing constructive challenge and strategic guidance, offering specialist advice and holding management to account.
The main areas identified by the Board for particular focus during 2025 were:
| • | Continued focus on open and honest reflections and candid conversations at Board level, to ensure that we are consistently providing constructive challenge. |
| • | Ongoing focus on applying customer, product and competitor lenses to Board discussions, and ensuring that key themes of technology and AI are consistently discussed. |
| • | Continued development of M&A radar scanning for the Board to ensure a clear, long-term view of inorganic growth opportunities. |
| • | Continued attention to succession planning and talent pipeline at Executive Management level. |
In addition to the annual performance review exercise, the Chair meets regularly with the Non-Executive Directors and these sessions include reciprocal feedback on the functioning of the Board.
Individual performance review
In addition to the performance review of the Board as a whole, Executive Directors are evaluated each year on their overall performance against goals agreed by the Board, and in respect of strategic measures under the company’s annual incentive plan. These goals are linked to the key financial and strategic objectives of the company. Progress against each of these metrics is reviewed by the Board on a regular basis, as part of a dashboard of KPIs.
The Chair engages with individual Non-Executive Directors on their performance and contributions, and encourages open channels of communication with Directors on an ongoing basis. In the Board’s opinion, these ongoing lines of communication, combined with a Group-wide culture which allows and encourages feedback at any time, provide the most effective means for review of performance. In assessing the contribution of each Non-Executive Director, the Chair, with the support of the Nomination & Governance Committee, has confirmed that each continues to make a significant contribution to the business and deliberations of the Board. The Non-Executive Directors also conduct an annual review of the Chair’s performance, with the Deputy Chair and Senior Independent Director leading this review and providing feedback to the Chair.
Committee performance review
All Committees undertake a review of their performance and effectiveness on an annual basis. For 2024, the Committee performance review process comprised two elements:
| • | Feedback relating to Committees was sought from Directors as part of the wider Board effectiveness review led by the Deputy Chair and Senior Independent Director. |
| • | Committee members and other key contributors to the Committees were invited to provide their views by way of questionnaires tailored to the specific remit of each Committee. |
The findings from this process were considered by each Committee at its December 2024 meeting. The Committees were considered by Directors to be working well. Read more in the Committee reports on the pages that follow.
| Annual report and accounts 2024 Pearson plc 90 |
|
Strategic report |
Governance report |
Financial statements |
Other information | |||||
|
|
||||||||
Progress on findings of previous performance review
A number of actions were taken during the year in response to findings from the 2023 performance review, as set out below. The Board has confirmed that these items were addressed to its satisfaction, with recommendations having been put into practice or a clear action plan identified for each to be taken forward in 2025.
| Finding or focus area | Response or action taken | |
| Continue to evolve Pearson’s strategic direction, building on the optionality that has been created through recent work on the strategy and vision. |
In addition to earlier updates on the formulation and running of the process, the Board discussed the key outcomes from the strategic review process at a specially convened additional meeting in June 2024, ahead of the announcement to the market as part of the interim results announcement in July 2024. | |
| Ongoing development of the Board’s meeting and agenda roadmap to ensure the topics are aligned with Pearson’s strategic goals and given adequate discussion time. |
The Company Secretary and Chief Executive’s office jointly developed a more in-depth roadmap and forward planner, aligned to the implementation of the strategy, which was introduced in 2024 and will be a standing item for the Board’s information at each meeting moving forward. | |
| Continued development of customer and marketplace insights shared with the Board. |
The Board received:
• Updates on the Chief Executive’s meetings with customers during his initial months and their perspectives on Pearson.
• A session on the anatomy of a deal at the April 2024 Board meeting, where colleagues provided insight into Pearson’s large tender process contracts, clients and marketplaces.
• Insights into the customer and marketplace at the June 2024 Board meeting as part of the briefing on the strategic review process.
• Insights as part of the business unit strategic risk deep dives submitted to the Audit Committee (and made available to the Board) during the year. | |
| Ongoing focus on succession planning, talent review and the culture of the company at executive level, as well as more broadly. |
The Board considered the talent succession pipeline at the December 2024 Board meeting. | |
| Continued focus on the Board having the right mix of skills and experience as the company continues to transform and evolve, and ensuring strong stakeholder relationships are maintained. |
The Chair and Chief Executive discussed the future priorities for the Board’s skills and experience, to complement its evolving strategic direction, together with a wider discussion with the Nomination & Governance Committee and the full Board. In particular, the Chief Executive’s early thoughts on Board skills and experience priorities were presented to the Board at the February 2024 meeting, and these informed the Non-Executive Director search process launched during the year. | |
| Ensure there continue to be formal and informal channels for feedback between the Chair and the Directors, especially at a time of transition in senior Board roles. |
The Chair has continued to engage with Board members in one-to-one discussions, in addition to wider Board discussions, to gather feedback, both as part of formal Board meetings and informally. Feedback provided as part of this year’s performance review process led by the Deputy Chair and Senior Independent Director, who took up that role in April 2024, indicated that these formal and informal channels for feedback are present and working well. | |
| Annual report and accounts 2024 Pearson plc 91 |
|
Strategic report |
Governance report |
Financial statements |
Other information | |||||
| Nomination & Governance Committee report |
||||||||

Omid Kordestani
Committee Chair
Principal Committee responsibilities
Appointments
Identifying and nominating candidates for Board vacancies.
Balance
Ensuring that the Board and its Committees have the appropriate balance of skills, experience, independence and knowledge to operate effectively.
Succession
Reviewing the company’s leadership needs with a view to ensuring the continued ability of the organisation to compete in the marketplace.
Governance
Reviewing and overseeing Pearson’s corporate governance framework, Board performance review and training plans, and the Board Diversity Policy.
Terms of reference
The Committee has written terms of reference which clearly set out its authority and duties. These are reviewed annually and can be found on our website (www.pearsonplc.com).
Committee members and attendance
Attendance by Directors at scheduled Nomination & Governance Committee meetings throughout 2024:
| Committee members | Meetings attended |
|||
| Sherry Coutu CBE |
4/4 | |||
| Omid Kordestani |
4/4 | |||
| Esther Lee1 |
3/4 | |||
| Graeme Pitkethly2 |
3/3 | |||
| Tim Score3 |
1/1 | |||
| Annette Thomas |
4/4 | |||
| 1. | Esther Lee was unable to attend the meeting held in February 2024 due to a pre-existing commitment. She reviewed the papers and provided her perspectives to the Committee Chair outside the meeting. |
| 2. | Graeme Pitkethly joined the Nomination & Governance Committee on 26 April 2024. |
| 3. | Tim Score stepped down from the Board and his role as Chair of the Nomination & Governance Committee on 26 April 2024. |
| Annual report and accounts 2024 Pearson plc 92 |
|
Strategic report |
Governance report |
Financial statements |
Other information | |||||
|
|
||||||||
Role and composition of the Committee
I am pleased to present my first report as Chair of the Nomination & Governance Committee, having been appointed to the position in April 2024 following Tim Score stepping down from the Board. I offer my thanks to Tim for his substantial contributions to the Committee’s work, most particularly in ensuring we have a strong and effective Board in place to lead our company.
The Committee monitors the composition and balance of the Board and of its Committees, identifying and recommending to the Board the appointment of new Directors and/or Committee members. The Committee has oversight of the company’s compliance with, and approach to, all applicable regulation and guidance related to corporate governance matters. The Committee is also available to support the Board as needed in relation to talent and succession plans for senior roles.
The Committee currently has five members, including me as Chair. The Chief Executive, Chief Financial Officer and other senior management, including the Chief Human Resources Officer, attend Committee meetings by invitation.
As Committee Chair, I am available to engage with any shareholders who would like to discuss the work of the Committee and look forward to taking any shareholder questions at our forthcoming AGM in May 2025.
Board succession planning, skills and expertise
A key element of the Committee’s remit is to lead the process for Board appointments in line with appropriate succession plans. The matter of Chief Executive succession is a regular item for discussion and is reviewed by the Board on an annual basis. The company also has contingency plans in place for the temporary absence of the Chief Executive for health or other reasons. Succession planning for the Board as a whole is considered at least annually by the full Board, and on an ongoing basis by the Committee.
The Committee has defined a set of specific criteria for potential new Non-Executive Directors, in particular giving consideration to the skills, experience, knowledge and aptitude required in any candidates. Pearson expects all Non-Executive Directors to demonstrate the highest level of integrity and credibility, independence of judgement, maturity, collegiality and also a commitment to devote the necessary time to the company’s business.
As part of the Committee’s regular succession planning activity, all Board members are asked periodically to complete a self-assessment of the skills and experience which they believe they each bring to the Board. The assessment focuses on those categories of skills and experience which are relevant to Pearson’s strategy, business model and particular organisational characteristics. When mapped against expected retirement dates, the assessment helps the Committee to identify the areas where it may need to focus any future search activity.
The results of the most recent assessment (shown on page 94) demonstrate that Pearson has a strong spread of skills across all areas identified as being of particular importance. Looking ahead to anticipated Board retirements, the Committee agreed to commence a Non-Executive Director search process in the latter part of 2024. In preparing for this search, the Committee agreed that it was particularly interested to identify one or more candidates who would collectively bring a combination of skills and expertise in the following areas:
| • | A senior executive with operating experience at scale and in a company or sector with insight into what such enterprise customers would look for or how they would benefit from Pearson’s products and solutions. |
| • | An active or recently retired executive leader of a publicly traded company and a track record of success leading a company at scale and with a global footprint commensurate to Pearson. |
| • | Proven experience developing innovative products and/ or driving digital business transformation through the development of game-changing, customer-centric strategies. |
| • | A strong understanding of the latest advancements in AI, machine learning and relevant emerging technologies to ensure the organisation remains at the forefront of innovation. |
Taking into account the agreed specification, the Committee engaged Spencer Stuart to undertake a search process for new Non-Executive Directors, who ensured that the search process had due regard to our regulatory obligations and Provision 23 of the UK Corporate Governance Code.
On 7 March 2025, we were pleased to announce the appointment of Arden Hoffman as an independent Non-Executive Director, with effect from 1 June 2025. Arden is the Chief People Officer at General Motors (GM). She is responsible for leading GM’s talent management and organisational development, as well as helping to shape workforce strategy, fostering a culture of innovation, and ensuring that the company attracts, retains, and develops top talent in a rapidly evolving sector. Arden’s expertise will prove invaluable as Pearson continues to execute against its strategy and will further enhance the skill set of our Board. Arden will seek election at the 2026 AGM, being the first AGM following her appointment.
In addition to the Non-Executive Director search process, Spencer Stuart also undertakes broader executive search activity for the Group and is a signatory to the Voluntary Code of Conduct for Executive Search Firms. Spencer Stuart has no connection with Pearson or members of the Board beyond its expertise in board and executive search.
Executive succession planning
Succession planning for key positions at Executive Management level is primarily overseen by the full Board, with support provided by the Committee in respect of particular initiatives. The Executive Management team has a key role to play in our strategic planning process, in the ongoing development of our talent pipeline and in fostering the culture and values required to continue to deliver on our strategy. In December 2024 the Board conducted a review of talent and succession planning.
Preparation for the revised UK Corporate Governance Code
The Committee oversees the company’s compliance with the UK Corporate Governance Code and reviews a status tracker to enable it to consider the appropriateness and maturity of various elements of our governance framework and to monitor any areas of qualified or non-compliance. Learn more about Pearson’s compliance with the 2018 Code on page 69.
| Annual report and accounts 2024 Pearson plc 93 |
|
Strategic report |
Governance report |
Financial statements |
Other information | |||||
| Nomination & Governance Committee report continued |
||||||||
The revised UK Corporate Governance Code 2024 applies to Pearson from the 2025 financial year, with the exception of Provision 29 which will apply from the 2026 financial year. To ensure appropriate preparations were made in advance of the effective date, the Nomination & Governance Committee received briefings from the Company Secretary on the key themes and main areas of change and how the company was addressing the changes. The most significant changes, set out in Section 4 of the Code, relate to audit, risk and internal control matters and therefore the response to these elements is being overseen by the Audit Committee – more information on this can be found on page 106.
We will report in accordance with the 2024 UK Corporate Governance Code in the 2025 annual report.
Other areas of focus during 2024
Other areas of focus for the Committee during the year included: oversight of the composition of the Board’s Committees, assessment of the independence of Lincoln Wallen prior to making a recommendation for his re-election at the 2024 AGM (recognising his length of service on the Board), oversight of the approach to the Board’s annual effectiveness review, Board diversity reporting, and the annual review of the contribution of each Director to the Board.
Committee performance review
The Committee undertakes an annual process to review its performance and effectiveness. For 2024, feedback relating to the Committee was sought from Directors as part of the wider Board performance review led by the Deputy Chair and Senior Independent Director. Topics covered included the effectiveness and dynamics of the Committee, oversight of key areas within the Committee’s remit, the quality of papers and meeting discussions, and the relationships between the Committee and management.
The findings of the 2024 review indicated that the Committee is considered to be working well with appropriate agendas, papers produced to a good standard and high-quality discussions. You can read more about the Board performance review on page 89.
Committee aims for 2025
The Committee’s priorities for the coming year will be to oversee the successful onboarding and induction of our new fellow Board member and, together with our colleagues on the Audit Committee, oversee the company’s response to and compliance with the revised UK Corporate Governance Code.
Omid Kordestani
Chair of Nomination & Governance Committee
| Skills matrix | ||
| This matrix represents the Directors with skills or experience in areas that are relevant to Pearson’s strategy, business model and organisational characteristics. Directors have assessed themselves against each theme and, for those which they bring to the Board, have identified whether they believe each to be one of their core or supplemental capabilities. |
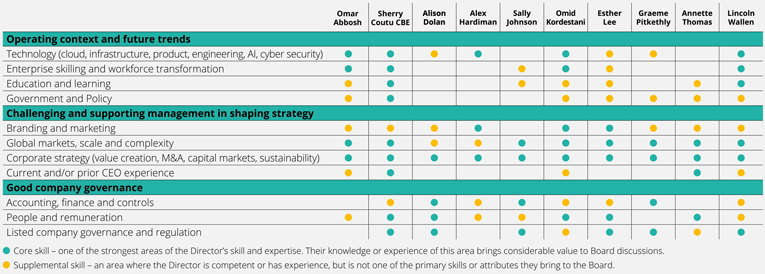
| |
| Annual report and accounts 2024 Pearson plc 94 |
|
Strategic report |
Governance report |
Financial statements |
Other information | |||||
|
|
||||||||
A representative Board
The Board embraces the UK Corporate Governance Code’s underlying principles with regard to Board balance and its principle of promoting diversity, inclusion and equal opportunity. Research indicates that high-performing boards provide an increased competitive advantage and wider perspectives, while the needs for greater inclusion continue to influence global trends.
We are determined that, as a Board, we must be representative of our employee base and wider society, including the countries in which we operate.
The Nomination & Governance Committee ensures that the Directors of Pearson demonstrate a broad balance of skills, background and experience, to support our strategic development and reflect the global nature of our business. In accordance with Principle J of the UK Corporate Governance Code, our Board search processes always consider a wide range of candidates, with varied skills, thought, experience and background, all of whom are evaluated on the basis of merit. In any Non-Executive Director search processes, the Nomination & Governance Committee encourages the retained search firms to place an emphasis on putting forward candidates from a range of backgrounds and we prioritise the use of search firms which adhere to the Voluntary Code of Conduct for Executive Search Firms.
The Nomination & Governance Committee reviews and monitors the company’s progress against the objectives which underpin the Board Diversity Policy.
The objectives that support the Board Diversity Policy, and which underpin Pearson’s commitment to creating a more equitable and inclusive company, are in line with and reflect the requirements under the Financial Conduct Authority’s UK Listing Rules and include:
| • | at least 40% female directors |
| • | at least two directors from an ethnic minority background |
| • | at least one of the Chair, Chief Executive, Deputy Chair and Senior Independent Director or Chief Financial Officer is a woman |
The Committee is pleased to confirm that all three of these targets have been met. In accordance with UK Listing Rule 6.6.6R(9), as at 31 December 2024, 60% of Directors were women (2023: 55%), the Board included four Directors from an ethnic minority background and the Chief Financial Officer role was, and is currently, held by a woman.
The Nomination & Governance Committee adopts a principles-based approach to diversity on the Board’s Committees. It is recognised that it is not necessarily practical to set meaningful metrics or targets for diverse membership of Committees due to the notably smaller membership of each of the Committees compared to the size of the Board. Accordingly, our principles-based approach endorses the importance of bringing varied perspectives to all areas of the Board and Committees’ work. As an example of this principles-based approach in practice, as part of its regular Committee succession planning activity, the Nomination & Governance Committee considers the gender and ethnic balance on each Committee when assessing its composition and future needs.
The Board will continue to adopt best practice, as appropriate, in response to the Financial Conduct Authority requirements, FRC Board Director Effectiveness Review, Parker Review and FTSE Women Leaders Review.
During its performance review conducted in 2024, the Board considered the effectiveness of the organisation and dynamics of the Board. The results and feedback of the performance review indicated that the Directors believe the Board’s effectiveness is strong.
Talent at executive level
As at 31 December 2024, five members of our Executive Management team of 11, excluding the Chief Executive and Chief Financial Officer who are counted in the Board’s metric, were women (45%) (2023: 50%). Including the Chief Executive and Chief Financial Officer, this ratio was 46% (six women out of 13 members) (2023: 50%). As of 31 December 2024, the group comprising the senior management team (as specified by the UK Corporate Governance Code, i.e. the Executive Management team and the Company Secretary) and the Executive Management team’s direct reports contained 52 women, representing 52% of that group (2023: 47%). These figures are reported as at 31 December 2024, in accordance with s414C of the Companies Act 2006. For figures as at the date of this report, please see page 74.
In response to the Parker Review’s requirement for listed companies to set an ethnic diversity target in respect of senior management positions, the Committee approved a target of 20% of Pearson’s senior management positions to be occupied by ethnic minority individuals by December 2027. As at 31 December 2024, the senior management team, as defined above and based in the UK, contained nine individuals who identify as minority ethnic, representing 24% of that group, who have provided the company with ethnicity data.
For diversity data in the format prescribed by UKLR 6.6.6R(10), please see page 54.
| Annual report and accounts 2024 Pearson plc 95 |
|
Strategic report |
Governance report |
Financial statements |
Other information | |||||
| Reputation & Responsibility Committee report |
||||||||

Annette Thomas
Commitee Chair
Principal Committee responsibilities
Stakeholders
Monitoring reputational issues that could significantly affect Pearson’s reputation with stakeholders, including shareholders, customers, employees, educational institutions and educators, employers, governments and regulators, communities and business partners. Overseeing Pearson’s approach to thought leadership in respect of important issues, and attention to political and cultural perspectives in the landscape in which Pearson operates.
Sustainability
Overseeing Pearson’s sustainability framework including: targets and public commitments; regulatory landscape, reporting and ratings; sustainability due diligence in our supply chains and business partnerships; and assisting the Board in monitoring progress towards climate targets and the three pillars of the sustainability framework.
Responsible AI
Overseeing Pearson’s application of AI with a focus on: the identification of AI-related risks (e.g. biases, IP protection); managing transparency and accountability in AI systems; creation and implementation of Responsible AI principles and promotion of AI ethics across the organisation; monitoring of AI practices; and Pearson’s response to external regulatory requirements.
Communications and regulatory matters
Overseeing Pearson’s communications, strategies, policies and plans related to reputational issues and the people, processes and policies that are in place to manage them.
Branding
Overseeing the way in which the company’s brands are managed and promoted to ensure that their value and the company’s reputation are maintained and enhanced.
Risk
Monitoring Pearson’s approach to the reputation aspects of the risk register and ensuring that clear roles have been assigned for the management of these, including in relation to the company’s material sustainability risks and opportunities.
Terms of reference
The Committee has written terms of reference that clearly set out its authority and duties. These are reviewed annually and can be found in the Governance section of our website (www.pearsonplc.com).
Committee members and attendance
Attendance by Directors at scheduled Reputation & Responsibility Committee meetings throughout 2024:
| Committee members | Meetings attended |
|||
| Andy Bird1 |
0/0 | |||
| Alex Hardiman |
3/3 | |||
| Graeme Pitkethly |
3/3 | |||
| Annette Thomas |
3/3 | |||
| Lincoln Wallen |
3/3 | |||
| 1. | Mr Bird stepped down from the Committee with effect from 7 January 2024 |
| Annual report and accounts 2024 Pearson plc 96 |
|
Strategic report |
Governance report |
Financial statements |
Other information | |||||
|
|
||||||||
Reputation & Responsibility Committee role
The Committee works to assess and advance Pearson’s reputation across the range of its stakeholders and to maximise the company’s positive impact on the communities in which we work and serve.
We are the main governance body for responsible and ethical business practices at Pearson and we assess progress towards the company’s sustainability priorities and commitments. As part of this work, we provide ongoing oversight and scrutiny across all reputational matters, including climate change considerations, branding, government relations and safeguarding. Additionally, in late 2024, we refreshed our remit to increase and codify our focus on thought leadership and Responsible AI, reflective of Pearson’s commitment to these areas. We also conducted a thorough review of our own terms of reference. The Committee’s principal responsibilities, as revised, are summarised on page 96 and you can read more about our overall Board framework for sustainability governance, including the related work of other Committees, on page 83.
The full Board is kept abreast of the Committee’s work through reports I make following each of our sessions. These reports include highlighting any material discussion points or areas of concern and offering specific recommendations for the Board’s action.
As Committee Chair, I am available at any time to engage with any shareholders who would like to discuss the work of the Committee, and particularly look forward to taking any shareholder questions at our forthcoming AGM in May 2025.
Committee composition and attendees
The Committee currently has four members, including me as Chair. Together, Committee members bring a range of expertise across key areas of our remit, including sustainability, product, stakeholder management, AI, and policy and government relations. You can read more about the Committee members’ skills and experience on pages 70-72.
Pearson’s Chief Executive, Omar Abbosh, is a standing attendee at every meeting of the Committee, and we welcomed his and management’s support in refreshing our remit in late 2024.
In addition, we benefit from the regular attendance of other senior executives whose work is central to the remit of the Committee. These include the General Counsel, who is the executive leader responsible for the development, monitoring and execution of Pearson’s sustainability strategy; the Chief Marketing Officer; the Chief Human Resources Officer; the Chief Strategy Officer; and SVP - Global Corporate Communications.
Sustainability activities in 2024
Throughout the year, the Committee paid particular attention to the continued evolution of our sustainability strategy, including how it aligns to our greatest areas of opportunity and challenge as a business, and how to communicate its tenets to all our stakeholders in a clear and impactful way.
As described in greater detail in our Sustainability report starting on page 33, our Learning for Impact framework comprises three pillars that drive value for our stakeholders and represent the areas where we can make the biggest positive impact:
| • | Driving learning for everyone with our products |
| • | Empowering our people to make a difference |
| • | Leading responsibly for a better planet |
These areas are materially influential on Pearson’s long-term success as a business. The sustainability strategy is supported by Pearson’s robust corporate governance, strong corporate culture and a range of effective policies to ensure we achieve our ambitions. You can read more about how the pillars are reflected in our 2024 non-financial KPIs on page 24.
The Committee receives regular updates from management on progress against the priorities of the sustainability strategy and initiatives that support its delivery. Over the past year, key activities of the Committee in relation to our three Learning for Impact pillars included the following:
| • | At each meeting, we received a report on recent incidents and issues that could have an impact on Pearson’s reputation, including those relating to our products and business partners. We considered the company’s responses to coverage on social media and in traditional media, including paying particular attention to our protocols for responding to questions about our content, |
| the integrity with which we handle such situations and any lessons learned. |
| • | We continue to monitor long-term climate targets, progress against short-term decarbonisation activities, and an increased focus on energy efficiency and renewable electricity consumption. |
| • | We discussed with management their focus on successful delivery of the 2024 UK summer exams and results season, considering operational activity, proactive stakeholder engagement, and incident mitigation and response plans. |
| • | We conducted our annual review of health and safety (H&S) at Pearson, reviewing a report on the key principles underpinning our H&S programme, the model through which our H&S practices are delivered and assured, incident data, future legislative developments, and priorities for the H&S programme in 2025. |
| • | We undertook our annual safeguarding review, which had a particular focus on online trust and safety in our digital products and services in light of rapid change in the technology and legislative landscape affecting these areas. |
| • | We noted the progress being made to increase employee participation in Learning for Impact activities. We are encouraged by the significant increase in colleague participation during the year and are supportive of management’s focus on further strengthening involvement in citizenship activities. Read more on page 38. |
Sustainability governance and policies
The Committee recognised that robust governance, a strong culture and effective policies are essential to the successful delivery of our sustainability framework.
During the year, we focused on preparing for mandatory reporting requirements which take effect for the 2025 financial year and on which we will first report in 2026. We continue to work with our Audit Committee colleagues on this topic, and our activity in this area included:
| • | Completing a comprehensive assessment of Pearson’s applicability for upcoming reporting regulations across the UK, EU and US. We discussed Group-level reporting to maximise efficiency. |
| Annual report and accounts 2024 Pearson plc 97 |
|
Strategic report |
Governance report |
Financial statements |
Other information | |||||
| Reputation & Responsibility Committee report continued |
||||||||
| • | Reviewing the company’s double materiality assessment as required by the EU’s Corporate Sustainability Reporting Directive and IFRS Sustainability Disclosure Standards. We provided input and challenge on the methodology and approach to stakeholder mapping and noted the potential material impacts, risks and opportunities identified through the assessment. |
| • | Reviewing the proposed sustainability operating model and budget for 2025, including those areas where additional specialist resource would be needed to fulfil assurance and reporting obligations, and we provided our perspectives on the proposals. |
You can read more about this topic in the Sustainability report starting on page 33.
In addition to our oversight of regulatory change and preparedness, we:
| • | Considered the actions being taken in relation to climate reporting, including the development of our Climate Action Plan, and the focus on decarbonisation planning in the short, medium and long term. |
| • | Reviewed a snapshot of the latest analyst rankings and ratings of Pearson’s sustainability performance and credentials, alongside opportunity areas for further improvement. Read more on page 34. |
| • | Reviewed the annual Modern Slavery Statement with management prior to recommending that the Board approve the statement for publication. (https://plc.pearson.com/en-GB/ corporatepolicies). |
Other key areas of focus during 2024
In addition to the work relating to the three pillars of our Learning for Impact framework, we spent time considering a broader range of matters relating to Pearson’s reputation and key stakeholders, including the following: With the UK general election and US presidential election taking place during 2024, we discussed the key areas of focus for the incoming UK and US governments relating to learning, education and skills, considered their broader policy priorities, and received an update on engagement with the key political parties led by Pearson’s government relations team.
| • | We considered the evolving regulatory landscape on AI, noting in particular the comprehensive EU AI Act which passed into law during 2024 and which will apply to certain Pearson products. |
| • | We conducted a horizon-scanning exercise to identify key reputational risks and trends facing Pearson, including business and operational issues and a range of socio-political themes, and considered the way in which Pearson positions itself proactively with customers, partners, policymakers and the media. This exercise, which we conduct periodically, helps to ensure that the Committee and our Board are alert to external factors that may impact our business and how we are mitigating potential risks. |
| • | Following the appointment in July 2024 of Pearson’s new Chief Marketing Officer, Ginny Cartwright Ziegler, we spent time understanding Ginny’s perspectives on Pearson’s marketing, brand and communications model, and we considered her proposals to refresh this model to unlock growth for Pearson. We also endorsed a new issue management framework which guides the company’s communication flows in the event of an internal or external incident with the potential to impact Pearson’s stakeholders or reputation. |
You can read more about stakeholder engagement at Pearson starting on page 18.
Committee evaluation
The Committee undertakes an annual evaluation to review its performance and effectiveness. For our evaluation in 2024, Committee members and other key contributors to the Committee were invited to provide their views by way of a tailored questionnaire. As Committee Chair, I then reviewed the anonymised findings of the questionnaire and conducted one-to-one conversations with members and contributors to discuss their perspectives in greater detail.
Topics covered in the evaluation process included the effectiveness and dynamics of the Committee, oversight of key areas within the Committee’s remit, the quality of papers and meeting discussions, and the relationships between the Committee and management.
The Committee considered the findings from this process at its December 2024 meeting and concluded that:
| • | The Committee is functioning well with appropriate agendas, papers produced to a good standard, and high-quality discussions. |
| • | There is an appropriate level of focus on the key topics within the Committee’s remit, however it is important for the Committee to remain focused on ’move the dial’ topics in our work. |
| • | Some refreshing of the Committee’s remit was warranted to specify explicitly that Responsible AI is part of the Committee’s remit, as well as increased focus on thought leadership, including the roles of government relations and marketing in this area. This feedback aligned with the revisions to the terms of reference review undertaken in late 2024. |
| • | It would remain important to ensure continued alignment between the work of this Committee and that of the Audit Committee on the themes of non-financial disclosure, reporting and assurance. |
Committee aims for 2025
Our priorities for the coming year include:
| • | Continued attention to the impact of AI, including Pearson’s policy position on responsible use and application of AI to add value to our customers, enhancing trust in Pearson. |
| • | Overseeing the company’s enhanced approach to thought leadership, through which Pearson builds deeper connections with stakeholders. |
| • | We will stay attuned to government policies relating to education and other public policy matters affecting Pearson and ensure that the company remains well placed to support a breadth of learners and customers. |
| • | Continuing our close attention to sustainability matters, including an updated climate risk analysis. |
Annette Thomas
Chair of Reputation & Responsibility Committee
| Annual report and accounts 2024 Pearson plc 98 |
|
Strategic report |
Governance report |
Financial statements |
Other information | |||||
| Audit Committee report |
||||||||

| Graeme Pitkethly
Committee Chair |
Principal Committee responsibilities
Financial reporting
The quality and integrity of Pearson’s financial reporting and statements and related disclosures, including significant reporting judgements.
Policy
Group financial policies, including accounting and treasury policies and practices.
External audit
External audit, including the appointment, qualification, independence and effectiveness of the external auditors.
Internal audit, risk and internal control
Risk management systems and the internal control environment, including oversight of the work and effectiveness of the internal audit function.
Compliance and governance
Legal and regulatory requirements in relation to financial reporting and accounting matters, and oversight of compliance programmes and investigations.
Terms of reference
The Committee has written terms of reference which clearly set out its authority and duties. These are reviewed annually and can be found in the Governance section of our website (www.pearsonplc.com).
Committee members and attendance
Attendance by Directors at scheduled Audit Committee meetings throughout 2024:
| Committee members |
Meetings attended |
|||
| Alison Dolan1 |
3/4 | |||
| Alex Hardiman |
4/4 | |||
| Graeme Pitkethly |
4/4 | |||
| Tim Score2 |
2/2 | |||
| Lincoln Wallen |
4/4 | |||
| 1. | Ms Dolan was unable to attend the February 2024 meeting due to a pre-existing commitment that had been notified to Pearson at the time of her appointment. Ms Dolan discussed her views on the papers and the business of the meeting with the Committee Chair in advance of the meeting. |
| 2. | Mr Score stepped down from the Committee with effect from 26 April 2024. |
| Members
As at the date of this report, the Committee comprises four independent Non-Executive Directors, all of whom have financial and/or related business experience due to the senior positions they hold or have held in other listed or publicly traded companies and/or large organisations. The Committee possesses a good balance of skills and knowledge with competence and experience covering all aspects of the sectors in which Pearson operates and the company’s key markets. Each member is ‘financially literate’ for the purposes of the NYSE listing standards.
Graeme Pitkethly, Chair of the Committee since August 2022, is the Committee’s designated financial expert within the meaning of the applicable rules and regulations of the SEC, having recent and relevant financial experience as required by the Code, and is a Chartered Accountant. From 2015 to 2024, Graeme was Chief Financial Officer of Unilever plc and since April 2024 has been a Non-Executive Director of Sandoz Group AG and Chair of its Audit, Risk and Compliance Committee. Graeme’s full biography is shown on page 72.
The qualifications and relevant experience of the other Committee members are detailed on pages 70-72. You can read more on page 73 about the process through which the Board assesses the independence of Non-Executive Directors. |
| Annual report and accounts 2024 Pearson plc 99 |
|
Strategic report |
Governance report |
Financial statements |
Other information | |||||
| Audit Committee report continued | ||||||||
Audit Committee role and composition
The Committee has been established by the Board primarily for the purpose of overseeing the accounting, financial reporting, internal control and risk management processes of the company and the external audit of the Group’s financial statements. As a Committee, we are responsible for assisting the Board’s oversight of the quality and integrity of the company’s external financial reporting and statements, and the company’s accounting policies and practices, and we work to create a culture – both within the Committee’s work and Pearson more broadly – which recognises the work of, and encourages challenge by, the external auditors.
Pearson’s Vice President – Internal Audit & Controls Compliance has a dual reporting line to the Chief Financial Officer and to me, and both she and the external auditors have direct access to the Committee to raise any matters of concern and to report on the results of work directed by the Committee. As Audit Committee Chair, I ensure that the full Board is kept abreast of the business of the Committee in a timely manner, including highlighting any areas of concern or specific recommendations. I also work closely with the Chief Financial Officer and senior financial, risk, legal and internal audit personnel outside the formal meeting schedule to ensure robust oversight and challenge in relation to financial control, compliance, investigations and risk management.
As Committee Chair, I am available to engage with any shareholders who would like to discuss the work of the Committee, including the scope or effectiveness of the external audit. There were no requests from shareholders during the year for any specific matters to be covered in the audit. I look forward to taking any shareholder questions at our forthcoming AGM in May 2025.
Audit Committee meetings and activities
At every meeting, the Committee considers reports on the activities of the internal audit and compliance functions, including the results of internal audits, project assurance reviews and fraud and whistleblowing reports. We also monitor the company’s financial reporting and risk management procedures, discuss the Group’s control environment, review the work undertaken by the external auditors and consider any significant legal claims and regulatory issues in the context of their impact on financial reporting, each on a regular basis.
Other prominent themes in the Committee’s work throughout 2024 included:
| • | Oversight of progress with the audit action plan, a programme of work that sought to enact recommendations that arose through our 2022 review of effectiveness of the external auditors, with this second phase building on strong progress made during 2023 (read more on page 108). |
| • | Responding to the requirements of the FRC minimum standard for audit committees, published in 2023, we reviewed our methodology for the oversight and assessment of external auditor effectiveness (read more on page 107). |
| • | Following publication of the revised UK Corporate Governance Code (the Code) in January 2024, we considered the impacts relevant to the Committee’s work, particularly those relating to Pearson’s risk management and internal control framework (read more on page 106). |
| • | Continued attention to the application of Pearson’s accounting policies, key judgements and key areas of estimation as described in the financial statements. |
| • | Oversight of the accounting treatment relating to the EU State Aid matter and the reversal of certain historical impairments against investments in subsidiaries recorded in the parent company accounts. |
| • | Oversight of management’s approach towards risk identification and monitoring, including through a series of business-focused risk deep dives and periodic reviews of group-wide risk trends and mitigation (read more on pages 101-102). |
| • | Review of important areas such as data privacy, cyber security and business and technology resilience, as well as generative AI. In addition to their importance at a macro level, these are key factors in the success of Pearson’s strategy and in ensuring we maintain trusted relationships with stakeholders. |
The Committee also receives technical updates at each meeting, including on matters such as accounting standards and the audit and governance landscape, and members are able to request specific or personal training as appropriate.
You can view the key activities of the Committee and read more about our work in these areas on the pages that follow.
The Committee’s focus areas for 2025 will include:
| • | Continuing to oversee work to ensure the company is ready for implementation of the new Code requirements relating to risk management and internal control with effect from the 2026 financial year. |
| • | In the first year of applicability of the EU Corporate Sustainability Reporting Directive (CSRD) to certain entities within the Group, we will work closely with our colleagues on the Reputation & Responsibility Committee to oversee assurance and reporting arrangements, as well as remaining abreast of other global developments in non-financial reporting. |
Additional meeting attendees
The Chief Executive, Chief Financial Officer, Deputy Chief Financial Officer, General Counsel, Chief Information Officer, other executives and senior managers from across the business also attended meetings during the year, either as regular invitees of the Committee or to discuss particular items of business.
This direct contact with key leadership augments the Committee’s understanding of the issues facing the business as well as helping to develop Pearson’s talent pipeline through facilitation of Board-level engagement opportunities for those leaders and managers below executive level. We also meet regularly in private with the external auditors and with the Vice President – Internal Audit & Controls Compliance.
In addition to the Committee’s formal meeting schedule, I meet regularly with the external auditors, Chief Financial Officer, Deputy Chief Financial Officer, General Counsel, Vice President – Internal Audit & Controls Compliance, Associate General Counsel – Employment, Ethics & Compliance and Director of Risk and Insurance in order to keep abreast of all relevant matters within the Committee’s remit.
| Annual report and accounts 2024 Pearson plc 100 |
|
Strategic report |
Governance report |
Financial statements |
Other information | |||||
Committee evaluation
The Committee undertakes an annual evaluation process to review its performance and effectiveness. For 2024, the Committee evaluation process was conducted by way of a tailored questionnaire. The process sought views on an anonymous basis from Committee members, Chief Executive and Chair of the Board together with other key contributors to the Committee, including the lead external audit partner, the Chief Financial Officer, Deputy Chief Financial Officer, the General Counsel, the Vice President – Internal Audit & Controls Compliance, and senior financial, risk and compliance management.
Topics covered in the evaluation included the effectiveness and dynamics of the Committee, the Committee’s oversight of key areas within its remit, the quality of papers and meeting discussions, and the relationships between the Committee and management. Reflecting the requirements of the FRC’s Minimum Standard, the evaluation sought more extensive views on the Committee’s role in overseeing the external auditors, including the Committee’s role in assessing the quality and effectiveness of the external audit and creating a culture which encourages challenge.
The Committee considered the findings from the evaluation at its December 2024 meeting, including the following key points:
| • | The Committee is considered by Directors and other contributors to be performing effectively with appropriate agendas, papers produced to a good standard, and open, candid discussions at the meetings. |
| • | The composition of the Committee is appropriate and includes the necessary skills. |
| • | A high quality of debate and challenge is demonstrated by the Committee, including in respect of complex accounting matters or judgements, and the Committee is effective at reviewing the quality and integrity of the Group’s financial reporting and at holding management to account in this area. |
| • | The Committee provides effective oversight of the quality and effectiveness of the external audit process and of the external auditors themselves, and creates a culture which recognises the work of and encourages challenge by the external auditors. |
You can read more about the review of audit quality and effectiveness and the FRC Minimum Standard on pages 107-108.
Looking ahead to 2025, it will be important for the Committee to continue to work with the Reputation & Responsibility Committee to ensure adequate oversight of non-financial reporting and assurance requirements and to continue to scrutinise follow-up activity arising from the findings of the internal audit team.
Fair, balanced and understandable reporting
In response to the Code’s Principle N, the Committee considered whether the 2024 annual report is fair, balanced and understandable. In making this assessment, we considered the following areas:
| • | The process for preparing the report, including the contributors, the internal review process and how feedback is addressed throughout the process. |
| • | The business review narratives presented for each business area. |
| • | The discussion of reported and underlying results throughout the report. |
The Committee was satisfied that, taken as a whole, the annual report is fair, balanced and understandable. We reported this conclusion to the Board.
Learn more about fair, balanced and understandable reporting on page 140.
Financial reporting and policies
In February 2025, the Committee considered the 2024 preliminary results announcement and annual report and accounts, including the financial statements, Strategic report and Directors’ report. The significant issues considered by the Committee relating to the 2024 financial statements are set out on pages 110-112.
Risk assessment, assurance and integrity
A key role of the Committee is to provide oversight and support to the Board with regard to the integrity of the company’s procedures for the identification, assessment, management and reporting of risk. In fulfilling its remit, the Committee remains mindful that effective risk management is essential to executing Pearson’s strategy, achieving sustainable shareholder value, protecting the brand and ensuring good governance.
During 2024, the Committee had oversight of management’s approach towards risk identification and monitoring. Pearson’s enterprise risk management programme aligns with the structure of the business, which is managed through five global business units supported by Group-wide corporate functions. Through a series of business-focused risk deep dives, the President of each business unit provides an overview of its risk register to the Committee at least annually and leads a session on the key risks facing their particular business. The process is supported by central risk team experts as required, providing the Committee with a clear and consistent framework within which to evaluate the strategic and business risks to the company, based upon the principal, emerging and significant near-term risk categories described on pages 58-66.
The Committee uses these deep-dive sessions to understand the rigour of management’s risk scanning and to challenge judgements being made in response to risks. The Committee considers that Pearson’s enterprise risk management approach is robust and proportionate and facilitates a culture of accountability and ownership among business leaders. The business unit risk deep dives provide a strategic and increasingly data-driven lens to the risk management process that is valued by the Committee and management alike.
| Annual report and accounts 2024 Pearson plc 101 |
|
Strategic report |
Governance report |
Financial statements |
Other information | |||||
| Audit Committee report continued | ||||||||
Feedback from Committee members on these deep dives, which were first introduced in 2022, has been consistently strong, with the additional insights provided by these sessions being well received by the Committee. Accordingly, with effect from the December 2024 meeting, the business unit risk deep dives have been elevated to the full Board. This change allows all Directors to participate in the valuable discussions and will increase alignment with the Board’s wider remit on strategic planning at both Group and business unit levels.
At least twice a year, the Committee considers a Group-wide risk management report which highlights risk trends and themes that exist at an enterprise-wide level. This is further supported by a number of deep dives which the Committee conducts with selected Group functions including data privacy, cybersecurity, tax, treasury, anti-bribery and corruption, and business resilience. You can read more on some of these themes elsewhere in this report.
Additionally, following its introduction in 2023, the Committee reviewed the enterprise risk framework and approved its continued use. This framework brings together Pearson’s principles, processes and methodology for risk management and aims to consistently embed such activity and practice within the organisation.
Data privacy, cybersecurity and technology resilience
Prudent management of data privacy, cybersecurity and Pearson’s technology estate are fundamental to our success and to maintaining trust with our customers. The Committee oversees these matters on behalf of the Board from a risk and assurance perspective and monitors the maturity of Pearson’s associated governance frameworks. It does this through regular deep dives, as well as through oversight of the risk-based internal audit programme, in which these topics are key areas of focus. We recognise the interlinked nature of these topics and typically invite the senior leaders for each area to participate in all strands of these discussions, providing holistic perspectives on the important and complex themes.
During the year, the Committee:
| • | Received an update on the work of the Trust & Safety Committee which operates at senior leadership level and serves as a forum for data privacy, security and business leaders to understand risk profiles, assess business impacts and ensure accountability. As the legal landscape continues to evolve and threats and opportunities emerge in connection with generative AI, we continue to adapt our governance processes to ensure that we are protecting our customers and our business, and the Trust & Safety Committee has an increased role to play in ensuring the business has the right level of focus on data and AI matters. |
| • | Considered the progress that continues to be made through implementing security processes, leveraging industry-leading tools and the ongoing modernisation of the technology estate, as well as investing in defences against increasingly sophisticated threats. We also noted how management is continuing to reinforce a culture of security across Pearson’s employees, partners and seasonal workers through mandatory cybersecurity and data privacy training and the use of phishing simulations to drive awareness and understanding of security protocols. |
| • | Reviewed Pearson’s performance against the NIST Cybersecurity Framework, which provides the Committee and management with clear visibility into the current status of Pearson’s cybersecurity programme and areas of improvement. The framework is underpinned by industry-leading standards and facilitates Pearson’s compliance with FedRAMP requirements in delivering certain US federal commitments. In 2024, Pearson’s data privacy programme was also aligned with the NIST Privacy Framework which is increasingly recognised in Pearson’s largest markets. |
| • | Noted the increase in stabilisation across our digital and technology platforms driven by our transition to cloud-based infrastructure, technical debt reduction and increased standardisation and unification of processes. These improvements have been underpinned by foundational resiliency created through greater adoption of core shared technology services (known as ‘paved road services’), and overall have contributed to increased reliability in critical customer-facing or front-line products. |
| • | Reviewed Pearson’s integrated approach to incident management – the incident management framework – which is utilised in response to technology, data or cyber-related incidents as well as operational issues in the business or wider challenges to which Pearson needs to respond. |
| • | As part of the agreed audit plan, considered the findings of internal audits of various elements of our data, cyber and technology practices including: IT system discovery and vulnerability tracking; the design of data privacy controls in certain internal and external-facing applications; governance of Pearson’s web estate; and our approach to technology asset management. We track the closure rate for agreed actions arising through these audits, as we do with all internal audit findings. |
You can read more about Pearson’s approach to data privacy and cybersecurity on page 37.
| Annual report and accounts 2024 Pearson plc 102 |
|
Strategic report |
Governance report |
Financial statements |
Other information | |||||
| Audit Committee meeting focus during 2024 | ||||||||
| Area of Committee remit | ||||||||||
| Financial and non-financial reporting |
Policy and finance operations |
External audit | Internal audit, risk and internal control |
Compliance and governance | ||||||
| Matters considered |
— Significant issues reporting (p110) — Fair, balanced and understandable reporting (p101) — Going concern and viability statements including supporting analysis (p67 and p137) — Impact of legal claims and regulatory issues on financial reporting — Annual report and accounts: preliminary announcement and financial statements — Review of interim results — Form 20-F and related disclosures, including annual Sarbanes-Oxley Act Section 404 attestation of financial reporting internal controls — Accounting and technical updates — CSRD assurance planning |
— Accounting matters and Group accounting policies — Treasury Policy and reporting — Tax update |
— Report on half-year review procedures — 2024 external audit plan (p108) — Review of the effectiveness of external auditors (p107) — Receipt of external auditors’ report on annual report and Form 20-F — EY findings on internal controls over financial reporting (ICFR) — Oversight of audit action plan — Confirmation of auditors’ independence (p109) — Provision of non-audit services by external auditors – approval of policy and regular reporting (p109) — Re-appointment of external auditors — Remuneration and engagement letter of external auditors |
— Internal audit activity reports and review of key findings (p105) — 2024 and 2025 internal audit plans including resourcing — Assessment of the effectiveness of internal audit function — Assessment of the effectiveness of internal control environment and risk management systems (p106) — Risk management including Group’s principal and emerging risks and risk framework (p57-67) — Strategic risk reviews led by business unit Presidents (p101-102) — Group-wide risk deep dives on cybersecurity; technology resilience; data privacy; treasury and insurance; and corporate security and incident management (p101-102) — Controls Centre of Excellence updates, including on ICFR and 2024 work plan (p106) |
— Fraud, whistleblowing reports and ethics and compliance investigations (p105) — Anti-bribery and corruption and sanctions programmes (p105) — Compliance with accounting and audit-related aspects of the UK Corporate Governance Code (p106) — Audit Committee and internal audit function terms of reference — Oversight of Group’s schedule of delegated financial authority — Regulatory briefings, including monitoring FRC proposals on audit and corporate governance reform — Review of minutes of the Verification Committee’s meetings | |||||
| Annual report and accounts 2024 Pearson plc 103 |
|
Strategic report |
Governance report |
Financial statements |
Other information | |||||
| Audit Committee report continued |
||||||||
| Audit Committee meeting focus during 2024 continued
|
| Area of Committee remit | ||||||||||
| Financial and non-financial reporting |
Policy and finance operations |
External audit | Internal audit, risk and internal control |
Compliance and governance | ||||||
| Selected key actions and outcomes |
— The Committee reviewed the annual report and Form 20-F, and the company’s annual and interim financial statements, and received reports from both the VP – Group Reporting and the external auditors on the significant financial reporting judgements relating to each — The Committee reviewed the going concern analysis and the viability statement for recommendation to the Board — The Committee reviewed quarterly reports of all material litigation and disputes provided by the General Counsel — The Committee received an update on preparations for mandatory sustainability disclosure requirements, including monitoring regulatory developments, considering the applicability to Pearson Group entities, enhanced internal data and reporting practices and initial considerations relating to assurance planning |
— The Committee considered the application of Pearson’s accounting policies and practices in reviewing the financial statements and significant accounting matters — The Committee considered the adoption of FRS 101 for the parent company accounts and recommended this for Board approval — The Committee reviewed Pearson’s tax strategy, receiving updates on anticipated effective tax rate and developments in the global tax regulatory landscape — The Committee considered plans for the £350m Education Bond ahead of its formal approval and launch, reviewed quarterly treasury compliance reports and approved the updated Group treasury policy |
— The Committee considered the audit strategy for the 2024 audit, including the audit approach, significant risks and areas of audit focus, scope and level of materiality — The Committee received reports from EY on the results of (i) their review of the interim financial statements, and (ii) their audit of the annual financial statements and ICFR. The Committee reviewed the respective letters of representation and recommended them for approval by the Board — The Committee considered formal communications by the external auditors, including disclosures relating to their independence as required by the FRC, SEC and PCAOB — The Committee reviewed the effectiveness of the external auditors to ensure the independence, objectivity, quality, rigour and challenge of the audit process was maintained. The Committee concluded that the external auditors and the audit process were effective |
— The Committee considered the conclusions and themes emerging from Internal Audit reviews conducted during the year and approved the Internal Audit Plan for 2025 — The Committee discussed the outcome of Internal Audit investigations, including the most significant issues raised in Internal Audit reports, and received updates on the status of resolution of issues raised — The Committee received regular updates on the status of Pearson’s internal controls programme, including controls related to financial reporting, business and IT, and considered reports from both the Senior Director – Controls Operations and the external auditors. This included discussion of design and operating effectiveness and any identified deficiencies — The Committee considered the Group risks and actions to enhance their measurement, monitoring and mitigation, including recommending to the Board the approval of the principal and emerging risks disclosed in the annual report. This oversight was supported by deep dives into selected risk areas |
— The Committee reviewed regular reports on fraud, whistleblowing and compliance matters, led by the Associate General Counsel – Employment, Ethics & Compliance, considering investigations, metrics, controls and initiatives — The Committee considered an in-depth analysis of compliance with the FRC’s Minimum Standard — The Committee approved changes to the Group’s schedule of delegated financial authority, all changes being below the threshold requiring full Board approval — The Committee undertook the annual review of its own effectiveness and that of the internal audit function, including considering the results of an external quality assessment of the latter | |||||
| Annual report and accounts 2024 Pearson plc 104 |
|
Strategic report |
Governance report |
Financial statements |
Other information | |||||
|
|
||||||||
Compliance, fraud and whistleblowing
The Associate General Counsel (AGC) – Employment, Ethics & Compliance oversees compliance with our Code of Conduct and works with senior legal, HR and other relevant personnel to investigate any reported incidents, including ethical, corruption and fraud allegations. The Committee receives an update at each meeting on all significant investigations as well as reviewing data regarding matters raised through our whistleblowing reporting system. If applicable, any findings of the external auditors with respect to a particular matter are also considered as part of these discussions. The Committee may also meet in private if required with the AGC – Employment, Ethics & Compliance. On behalf of the Board, the Committee considers an annual review of the effectiveness of the whistleblowing system including through benchmarking against peers and by monitoring progress against previous years’ findings. The Committee Chair’s regular reports to the Board include a review of investigations or whistleblowing matters of note.
The Pearson anti-bribery and corruption (ABC) and sanctions compliance programmes provide the framework to support our compliance with various regulations such as the UK Bribery Act 2010 and the US Foreign Corrupt Practices Act. The Committee uses this framework to conduct a deep dive into the ABC and sanctions compliance programmes on an annual basis. Pearson and the Committee remain attentive to opportunities to further enhance the company’s practices and protocols in this space and we noted the introduction during the year of a new, centralised process for sanctions screening and third-party ABC due diligence checks.
In 2024, in addition to our regular review of ethics, compliance and employee relations investigations, we noted the following enhancements made to the compliance programme, including:
| • | Launch of a new social media policy which builds on Pearson’s Code of Conduct and provides employees with clear guidance on the standards expected of them when posting online on both personal and Pearson accounts. |
| • | Introduction of updated sanctions and due diligence policies, procedures and guidance to align with a new screening process. |
| • | Implementation of new control measures related to purchasing and expenses reporting following a comprehensive review of practices in these areas. |
| • | A review of, and proposals to enhance, the advice and support provided to employees who are required to obtain business visas for international Pearson travel. |
| • | Noting management’s response to legislative and regulatory changes in the areas of fraud, compliance and whistleblowing, including guidance published by the US Department of Justice and the UK Serious Fraud Office. |
Internal audit
The internal audit function is responsible for providing independent assurance to management and the Committee on the design and effectiveness of internal controls to mitigate strategic, financial, operational and compliance risks. The Vice President – Internal Audit & Controls Compliance reports jointly to the Chair of the Committee and the Chief Financial Officer and is responsible for the day-to-day operations of internal audit and execution of the annual internal audit plan. The internal audit mandate is approved annually by the Committee.
Internal audit plan and activity
The audit plan and any changes thereto are reviewed and approved by the Committee throughout the year, and the Committee is attentive to the resourcing of the internal audit function. The internal audit plan is aligned to Pearson’s greatest areas of risk, as identified by the enterprise risk management process (see graphic below), and the Committee considers issues and risks arising from internal audits.
Management action plans to improve internal controls and to mitigate risks are agreed with the business area after each audit. Internal audit has a robust process in place for the implementation of audit actions, which also includes review and testing of evidence to corroborate action implementation.
Progress of management action plans is reported to the Committee at each meeting. Internal audit has a formal
collaboration process in place with the external auditors to ensure efficient sharing of insights and outcomes. Opportunities for reliance by the external auditors on internal audit outcomes are limited due to strict rules set by the external regulator. Regular reports on the findings and emerging themes identified through internal audits are provided to Executive Management and, via the Committee, to the Board.
In 2024, internal audit carried out engagements across Pearson’s business units and corporate functions, as well as Group-wide thematic audits, covering all principal risks. The audit plan changes throughout the year based on changes in Pearson’s risk profile. Key themes in 2024 related to compliance with laws and regulations, information security and data privacy, business transformation and IT resilience, and operational delivery.
Internal audit evaluation
The International Standards for the Professional Practice of Internal Auditing published in 2017 by the Institute of Internal Auditors (the IIA Standards) require an independent external assessment of internal audit to be conducted at least once every five years by a qualified, independent assessor or assessment team from outside the organisation.
At its December 2024 meeting, the Audit Committee considered the findings of an external quality assessment (EQA) of internal audit, which was undertaken by PricewaterhouseCoopers LLP (PwC) during the second half of the year.
The objectives of the EQA were to assess conformance with the IIA Standards, to assess the effectiveness of internal audit within the context of its mandate and stakeholder expectations, and to provide recommendations to internal audit on improvement opportunities and emerging practices. The process also included a high-level review of the function’s operations against the new 2024 IIA Standards (effective from January 2025).
2024 internal audit activity – coverage of principal risks and audit themes:


| Annual report and accounts 2024 Pearson plc 105 |
|
Strategic report |
Governance report |
Financial statements |
Other information | |||||
| Audit Committee report continued |
||||||||
The independent assessor’s findings indicated an effective internal audit function that conforms to the IIA Standards and compares favourably to other large, listed companies in terms of skills, coverage and quality of deliverables, with Pearson’s internal audit function ranking in the top quartile compared to other EQAs performed by PwC in the past three years.
Based on the findings of the EQA, and on our own ongoing assessment of the effectiveness of the internal audit function, the Committee is of the opinion that the quality, experience and expertise of the function are appropriate for the business.
Internal control and risk management
The Board has overall responsibility for Pearson’s systems of internal control and risk management, which are designed to manage, and where possible mitigate, the risks facing Pearson, as well as to safeguard assets and provide reasonable, but not absolute, assurance against material financial misstatement or loss. The Board agrees risk management requirements and, in assessing the effectiveness of the risk management effort, reviews a range of inputs as described elsewhere in this report. The Board can and does challenge the reporting it receives and will request further information as needed to make its assessment.
The Committee monitors the effectiveness of the company’s risk management and internal control systems on behalf of the Board. The Committee oversees a risk-based internal audit programme which includes assessing risk mitigations and controls in the areas under audit. It provides assurance on the management of risk (including via risk deep dives, as described on pages 101-102), and receives reports at each meeting on the effectiveness and efficiency of internal controls with input from the Vice President – Internal Audit & Controls Compliance, the Senior Director – Controls Operations and the external auditors. In 2024, internal audit provided assurance over all principal risk areas, as described on page 105.
Each business area maintains internal controls and procedures appropriate to its structure, business environment and risk profile, while complying with company-wide policies, standards and guidelines. The financial and IT controls and associated procedures are monitored and certified through the Group-wide Controls Centre of Excellence and are subject to testing as part of both the internal and external audit processes.
The Controls Centre of Excellence team took a number of steps in 2024 to further enhance Pearson’s control environment. This included updating the risk and controls matrix, further improving standardised testing scripts, reviewing control materiality and frequency, and increasing the efficiency of control walkthroughs.
The Committee, acting on behalf of the Board, confirms that it has reviewed, and continues throughout the year to review, the effectiveness of Pearson’s systems of risk management and internal control in accordance with Provision 29 of the Code and the FRC Guidance on Risk Management, Internal Control and Related Financial and Business Reporting (‘FRC Guidance’). In making its assessment as to the effectiveness of these systems for 2024, the Committee had regard to an assurance opinion from the internal audit function. Factors considered in this process included:
| • | the outcomes of internal audits completed during the year |
| • | significant changes in Pearson’s strategy, processes and systems |
| • | the wider Pearson risk management and assurance framework, which includes other assurance activities by first and second line of defence teams, including enterprise risk management, the Controls Centre of Excellence, business unit and technology assurance teams |
| • | work conducted by the external auditors |
| • | the organisation’s response to internal audit actions |
| • | whether any fundamental or significant actions have not been accepted by management and the consequent risk |
| • | whether any limitations have been placed on the scope of internal audit work or remit |
The Committee reviewed the detail underpinning these factors as part of the 2024 year-end process. The Committee also reviewed all internal financial control deficiencies identified during the year and noted that the majority were remediated during 2024. The impact of any unremediated deficiencies on the financial statements was considered. Following these reviews, the Committee confirmed that Pearson’s systems of risk management and internal control operated satisfactorily throughout the year.
The Board is ultimately accountable for effective risk management in Pearson and determines our strategic approach to risk. It confirms our enterprise risk management framework as well as our risk appetite targets. The involvement of the Board and Committee in the design, implementation, identification, monitoring and review of risks (including setting risk appetite and reviewing how risk is being embedded in our culture) is outlined in more detail in the Risk management section on page 57.
Response to Code changes
In January 2024, the FRC published a revised version of the Code. The most significant changes relate to Provision 29, which governs the Board’s duties in relation to the company’s risk management and internal control framework and introduces the requirement for an explicit declaration by the Board of the effectiveness of material controls as at the balance sheet date.
The Committee has been attentive to Pearson’s proposals to address these new Code requirements, with specific focus on: (i) the identification of ‘material controls’ including financial, operational, reporting and compliance controls; and (ii) the assurance which is already, or will need to be, in place to provide sufficient comfort to the Board in making the required declaration.
As part of this work, we are challenging ourselves to concentrate on the controls that truly impact Pearson’s success or failure, in line with the FRC’s guidance on the new Code.
We will continue to monitor progress during the coming year ahead of the new requirement taking effect on 1 January 2026.
External audit
The Committee is responsible for overseeing and assessing Pearson’s external audit and its auditors. Ernst & Young LLP (EY) were first appointed as Pearson’s external auditors by shareholders at the AGM in April 2022 following a tender process. Pearson’s 2024 audit was the third undertaken by both EY and Ben Marles as lead audit partner. As required by regulation, Pearson will put the external audit contract out to tender at least every 10 years, with the next tender being in respect of the 2032 financial year at the latest. The decision to undertake such a process will be a matter for the Committee.
| Annual report and accounts 2024 Pearson plc 106 |

Strategic report Governance report Financial statements Other information Pearson confirms that it was in compliance with the provisions of The Statutory Audit Services for Large Companies Market Investigation (Mandatory Use of Competitive Tender Processes and Audit Committee Responsibilities) Order 2014 during the financial year ended 31 December 2024. Appointment of external auditors The Committee reviews and makes recommendations to the Board in respect of the appointment and compensation of the external auditors. These recommendations are typically made by the Committee after considering the external auditors’ performance during the year, reviewing external auditor fees, conducting an effectiveness review, considering the annual report on audit quality of the external audit firm and confirming the independence, objectivity, qualifications and experience of the external auditors. Audit quality and effectiveness In conducting our 2024 review of the effectiveness of the external auditors and making our recommendation to re-appoint EY for 2025, the Committee had regard to factors such as those set out in the FRC Minimum Standard (see also page 108). We considered our own observations and interactions with the external auditors, the quality of the audit, the auditors’ independence, the programme of work conducted by the auditors and their reports on that work. To support our assessment, we utilise a bespoke questionnaire to gather views from Pearson colleagues most familiar with the external audit process. We refreshed this questionnaire ahead of our 2024 process to ensure we consider all factors described in the FRC Minimum Standard. We also consider a range of other inputs in making our assessment. A key additional input which has been adopted from 2024 is a suite of audit quality indicators (at both a firm-wide and engagement-specific level) that have been agreed by the Committee with the external auditors and against which they now report to the Committee on a regular basis. The diagram to the right illustrates the main inputs to our assessment, the colleagues from whom we sought views, the themes covered in our survey and the outcomes of our work. Inputs to the external audit effectiveness review: EY’s annual audit quality report including discussion of issues raised by the FRC Audit quality indicators Risks to audit quality identified by the external auditors and how these were addressed Observations and interactions between the Committee and external auditors Review of mandatory communications by the external auditors, including relating to their independence Bespoke survey of Pearson colleagues Who we surveyed to inform our assessment of effectiveness: Members of the Committee Chief Financial Officer General Counsel Chief Information Officer Senior corporate financial management Finance business partners for business units Senior internal audit and controls management Themes covered in the external audit effectiveness survey: Professional scepticism, integrity and willingness to challenge management Commitment to audit quality, including mindset and culture Independence and objectivity Partners and the audit team – resourcing, qualifications, skills, knowledge and experience Management and organisation of the audit process Planning and scoping of the audit Delivery and execution of the agreed audit plan Communication and reporting with the Committee and management – transparency, timeliness, clarity, conciseness, relevance Commentary on systems of internal control and other recommendations Technical specialism and use of experts Use of technology and data analytics Results and conclusion: Results of the survey were anonymised and analysed by the Committee Secretary and presented to the Committee and EY. The responses to the survey indicated that the external auditors operate with independence and objectivity, demonstrate open lines of communication with the Committee, exhibit professional scepticism and appropriate levels of challenge, possess the requisite technical expertise and apply it appropriately to the business and any issues and judgements. Following its review of the relevant inputs, including the responses to the survey, the Committee confirmed that the audit process was effective and that it was satisfied with the quality of the audit.
|
Strategic report |
Governance report |
Financial statements |
Other information | |||||
| Audit Committee report continued |
||||||||
The Committee monitors the independence and objectivity of the external auditors on an ongoing basis and will continue to formally evaluate their overall performance and effectiveness and the quality of the external audit on an annual basis, taking account of all appropriate guidelines.
Building on the audit action plan described in our 2023 report, the Committee oversaw an additional set of initiatives throughout 2024 to bring further incremental enhancements to both the delivery of the external audit and Pearson’s internal control processes. This programme of work was co-owned by the lead external audit partner and the Chief Financial Officer and primarily focused on efficiency, effectiveness and the use of technology.
FRC Minimum Standard
In May 2023, the FRC introduced the ‘Audit Committees and the External Audit: Minimum Standard’ (the ‘FRC Minimum Standard’ or ‘Standard’). During 2024, the Standard operated on a standalone ‘comply or explain’ basis. From January 2025, the Standard is incorporated into the latest edition of the UK Corporate Governance Code.
As indicated in last year’s report, in order to achieve full compliance for 2024, the Committee refreshed the methodology for our external audit effectiveness review ahead of the 2024 process to give full consideration to the factors described in provisions 15 to 23 of the Standard. You can read more about our assessment of effectiveness, and how we considered the required factors, on page 107.
Having reviewed an analysis of Pearson’s approach to the FRC Minimum Standard, the Committee confirms that it was in full compliance with all provisions for the financial year ended 31 December 2024.
The Committee received a progress report from management and EY at each meeting during the year, and we are satisfied that all 2024 initiatives were successfully completed and, further, that the enhancements from 2023 have now been embedded into routine practices. We are pleased to see the tangible improvements that have resulted from the efforts of Pearson colleagues and the external audit team alike. We expect to continue to see incremental improvements resulting from Pearson and EY’s ongoing focus on audit quality and effectiveness as part of business as usual.
Review of the external audit
During the year, the Committee discussed the planning, conduct and conclusions of the external audit as it proceeded.
At its July 2024 meeting, the Committee discussed and approved the external audit plan and reviewed EY’s assessment of risks of material misstatement of Pearson’s financial statements.
The external auditors provided an update to the risk assessment at the December 2024 Committee meeting, explaining to the Committee their conclusion that the uncertain tax provision in respect of EU State Aid no longer represented a significant audit risk following the conclusion of the appeal in the EU courts in favour of the taxpayer.
The table on pages 110-112 sets out the significant issues considered by the Committee together with details of how these items have been addressed and the ways in which the external auditors challenged management’s assumptions. The Committee discussed these issues with the auditors throughout the 2024 audit process.
In December 2024, the Committee discussed with the auditors the status of their work, focusing in particular on internal controls and Sarbanes-Oxley testing.
As the auditors concluded their audit, they explained to the Committee:
| • | The work they had conducted over revenue and in particular the specific risk of fraud in revenue recognition. This included work over contracts in certain of the Group’s businesses in the US and UK that span the year end, where revenue is recognised using an estimated percentage of completion based on costs and work over manual adjustments to revenue. In addition, they explained their use of data analytics to cover entire populations of data with procedures such as correlating revenue with receivable and cash entries. |
| • | Their work over retirement benefit obligations including procedures undertaken over assumptions used in determining the defined benefit obligations and their work over the valuation of the related pension assets. |
| • | Their work in evaluating management’s goodwill impairment exercise, on a value-in-use basis, including assessing assumptions around operating cash flow forecasts, perpetuity growth rates and discount rates and their views on the sensitivity of CGU headroom to downside scenarios. |
| • | The work performed over the nature and presentation of adjusting items, focusing on subjective judgements and the transparency and prominence with which related adjusted measures are presented. |
| • | Their work in assessing management’s judgements and assumptions regarding provisions for uncertain tax positions, in particular the release of the provision made in relation to the EU state aid tax matter. |
| • | The work performed over the recognition of the bond issued in September, including the effective interest rate calculations. |
| • | Their work in assessing management’s judgements and assumptions regarding the reversal of certain historical impairments against investments in subsidiaries in the parent company. |
| • | The results of their controls testing for Sarbanes-Oxley Act Section 404 (SOx 404) reporting purposes and in particular their findings in relation to information provided by the entity (IPE), controls over key IT systems and other relevant internal control over financial reporting (ICFR) matters. |
| • | Their work to address the specific pervasive risk of management override of controls, including their view on the potential sources or indicators of bias and override of controls and their response to those indicators, including procedures such as review of Board and Committee minutes, journal entry testing, review of non-routine transactions and the use of data analytics. |
| Annual report and accounts 2024 Pearson plc 108 |
|
Strategic report |
Governance report |
Financial statements |
Other information | |||||
|
|
||||||||
| • | The results of their work over the company’s going concern assessment and viability statement. |
| • | Their work in relation to other matters which are not classified as key audit matters, but which are considered important financial reporting matters, key areas of judgement or estimation, or which may give rise to additional disclosure requirements. This includes the recognition of provisions and assets related to legal matters and asset capitalisation. |
The auditors also reported to the Committee the unadjusted misstatements that they had found in the course of their work, which were immaterial, and the Committee confirmed that there were no material items remaining unadjusted in these financial statements.
Auditors’ independence
In line with best practice, our relationship with EY is governed by our policy on external auditors, which is typically reviewed annually to ensure it remains effective and appropriate and is approved by the Committee. The policy establishes procedures to ensure that the auditors’ independence is not compromised, as well as defining those non-audit services that external auditors may or may not provide to Pearson.
Scope of the policy on external auditors
| • | The policy applies to all Pearson businesses globally, including associate companies. |
| • | Any identified threats to independence arising from services provided by the external auditors to a company that is then acquired by Pearson must be addressed within three months of the acquisition date. |
| • | The policy applies to all audit firms used by Pearson including those undertaking statutory audits only. |
| • | In the event of a change in the Group auditor, it also applies to the outgoing firm until they have discharged their Group audit responsibilities and for any periods in which they are required to be independent in order to undertake any specific audit responsibilities. |
Governance of audit and non-audit related services
| • | The Committee approves all audit and non-audit services provided by the external auditors. |
| • | Any allowable services are in accordance with relevant UK and US legislation and auditor standards. |
| • | Our policy on the use of the external auditors for non-audit services was revised during the year to ensure compliance with the FRC’s Ethical Standard published in January 2024. The policy also complies with all relevant SEC independence rules. |
| • | The FRC’s Ethical Standard applies restrictions on certain non-audit services and applies a cap on the level of permitted non-audit services fees which can be billed in any year. More particularly, our policy provides that only non-audit services which are required to be carried out by the external auditors or where the work is closely linked to the audit work are permitted, and only if also permitted by the FRC and SEC. |
| • | The policy reflects the restriction on the use of pre-approval in the 2016 FRC Guidance on Audit Committees and, accordingly, all non-audit services, except those considered to be ‘clearly trivial’, are required to be approved by the Committee. |
| • | We review non-audit services on a case-by-case basis. Non-audit services below a value of £25,000 are defined as ‘clearly trivial’ from a materiality perspective and can be pre-approved following review by the Group Finance team. Any such pre-approved services are presented for noting by the Committee at its next meeting. |
| • | We expressly prohibit the provision of certain tax, HR and other services by the external auditors. |
The Committee receives regular reports summarising the amount of fees paid to the auditors. During 2024, Pearson spent a similar amount on non-audit fees when compared with 2023. For 2024, non-audit fees (excluding fees related to SOx 404 attestation) represented 3% of external audit fees (2% in 2023). Non-audit fees including those related to SOx 404 attestation represent 12% of audit fees (9% in 2023).
For all non-audit work in 2024, EY was selected only after consideration that it was best able to provide the services we required at a reasonable fee and within the terms of our policy on external auditors. Where EY is selected to provide audit-related services, we take into account its existing knowledge and experience of Pearson. Where appropriate, services are tendered prior to a decision being made as to whether to award work to the auditors.
Significant non-audit work performed by EY during 2024 included:
| • | half-year review of interim financial statements |
| • | bond issuance comfort letter and bond proceeds limited assurance |
| • | SOx 404 attestation of financial reporting controls |
A full statement of the fees for audit and non-audit services is provided in note 4 to the financial statements on page 174.
Graeme Pitkethly
Chair of Audit Committee
| Annual report and accounts 2024 Pearson plc 109 |
|
Strategic report |
Governance report |
Financial statements |
Other information | |||||
| Audit Committee report continued |
||||||||
Significant issues considered by the Audit Committee
| Issue | Action taken by Audit Committee | Outcome | ||
| Going concern and viability | ||||
| • The assessment of the Group’s viability and the appropriateness of the going concern assumption. |
• The Committee reviewed future budgets and cash flow forecasts to understand the Group’s available liquidity and ability to continue as a going concern. The Committee reviewed and challenged the risks to the forecasts identified. The Committee reviewed the outcome of the severe but plausible scenario modelling and stress testing.
• EY challenge:
EY challenged the appropriateness of the assumptions used to calculate the cash forecasts under base and severe but plausible downside case scenarios, including whether the downside scenarios were sufficiently severe. |
• The Committee is satisfied with the modelling process and the risks identified. In addition, the Committee is satisfied with the stress testing performed and the severe but plausible scenario modelling. The Committee noted that in all scenarios the Group had a high level of liquidity headroom and sufficient headroom against covenant requirements.
• The Committee is satisfied with the adequacy of the Group’s viability and is satisfied that the Group is a going concern.
• The Committee is satisfied with the disclosures related to going concern and viability. | ||
| Revenue recognition | ||||
| • Pearson has a number of revenue streams with different revenue recognition models. For some revenue streams, judgements and estimates are required in order to determine the amount and timing of revenue recognition. |
• The Committee regularly reviews and challenges revenue recognition practices and the underlying assumptions and estimates. In addition, the Committee has visibility of the internal control framework over revenue and the results of the monitoring and certification work performed by the Controls Centre of Excellence over those controls. In addition, the Committee has visibility of internal audit findings relating to revenue recognition controls and processes. The Committee routinely monitors the views of the external auditor on revenue recognition issues. This includes review of their data analytics testing of revenue and understanding any exceptions that do not follow the expected process path as well as testing of one off or judgemental items.
|
• The Committee is satisfied that revenue is being recognised appropriately | ||
| • EY challenge:
EY specifically challenged areas where there is manual intervention in the revenue recognition process, in particular where revenue is recognised over time and assumptions are used to determine the timing of recognition. |
||||
| Annual report and accounts 2024 Pearson plc 110 |
|
Strategic report |
Governance report |
Financial statements |
Other information | |||||
|
|
||||||||
| Issue | Action taken by Audit Committee | Outcome | ||
| Recoverability of non-current assets | ||||
| • Pearson (the Group) holds significant non-current assets including right-of-use assets (in relation to leased properties); property, plant and equipment; goodwill and intangible assets.
• Pearson plc (the Company) holds significant investments in subsidiaries, some of which were impaired in previous years. During 2024, historical impairments of £1.3bn have been reversed.
• There are significant estimates and assumptions used in the impairment reviews. |
• The Committee monitored the Group’s property strategy during the year to determine if there were impairment triggers. The Committee considered the results of the Group’s property impairment reviews with specific focus on the 80 Strand property. Updates to key assumptions were reviewed and challenged. The Committee considered the adequacy of related disclosures.
• The Committee monitored the Group’s plans and forecasts during the year to determine if there were impairment triggers. The Committee considered the results of the Group’s goodwill impairment reviews which were undertaken in December and refreshed post year end. Key assumptions – including cash flows derived from strategic and operating plans, long-term growth rates and the weighted average cost of capital – were reviewed and challenged. The Committee considered the sensitivities to changes in assumptions and the adequacy of disclosures required by IAS 36 ‘Impairment of Assets’.
• The Committee considered the valuation of the investments in subsidiaries held in Pearson plc the company. The Committee specifically considered the application of the Group goodwill impairment model to the investments and also the existence of indicators of impairment reversal.
• EY challenge:
EY challenged the judgement in respect of the identification of the impairment reversal trigger in parent company investments. EY also challenged the assumptions included in the prospective financial information used for the value in use calculation. |
• The Committee is satisfied with the results of the property impairment reviews and the subsequent impairment charges recognised in the income statement.
• The Committee noted the reduction in risk related to the recoverability of right-of-use assets and is comfortable that it is no longer considered a key area of estimation.
• The Committee is satisfied with the results of the annual goodwill impairment review.
• The Committee is satisfied with the disclosures relating to non-current asset impairments and concurs with management’s view that the recoverability of goodwill is not a key area of estimation.
• The Committee is satisfied that there is enough headroom and an appropriate trigger for reversing impairments on subsidiaries in the parent company. The Committee is satisfied with the disclosures related to the impairment reversal. | ||
| Annual report and accounts 2024 Pearson plc 111 |
|
Strategic report |
Governance report |
Financial statements |
Other information | |||||
| Audit Committee report continued |
||||||||
| Issue | Action taken by Audit Committee | Outcome | ||
| Tax | ||||
| • Pearson holds provisions in relation to uncertain tax positions.
• In 2021, Pearson paid £105m (including interest) in relation to the EU state aid matter and at that time the amount was recognised as an asset as it was expected to be recovered in due course. In 2022, the EU General Court dismissed the appeal made by the UK Government in relation to this matter, with Pearson establishing a provision of £63m in 2022 representing an estimate of the expected liability. In 2024, following a further appeal, the Court of Justice of the European Union (CJEU) issued its final judgement in favour of the taxpayer and annulled the 2019 European Commission State Aid decision in full. Pearson now expects to recover the monies paid in due course and has reversed the associated provisions which were made in 2022.
• Changes to, and the application of, tax legislation continues to be a complex and judgemental area. |
• The Committee considered various developments during the year, including the CJEU’s final judgement in relation to the European Commission’s decision that the UK’s Finance Company Partial Exemption rules constituted state aid (‘EU state aid’), ongoing tax audits and the appropriateness of the associated provisions.
• The Committee also considered the impact of changes in tax legislation, including ‘Pillar 2’ of BEPS 2.0 now effective for Pearson from 1 January 2024.
• EY challenge:
EY specifically challenged the inputs and assumptions used in the calculation of provisions for uncertain tax positions. They also challenged the classification of the receivable in relation to EU State Aid as a current asset, considering the expected settlement date as well as the appropriateness of the interest accrued for interest that will be paid on the tax element of the amounts previously collected based on HMRC guidance. |
• The Committee is satisfied with Pearson’s approach to the EU state aid matter including the reversal of provisions, the presentation of the associated debtors and the recognition of related interest amounts.
• The Committee is satisfied with the appropriateness of provisions held in relation to other uncertain tax positions
• The Committee is satisfied with Pearson’s approach to managing the impact of tax legislation changes. The Committee is satisfied with the disclosures relating to the expected impact of Pillar 2. | ||
| Retirement benefits | ||||
| • Pearson holds a significant obligation in relation to the Group’s defined benefit pension schemes. The UK Group Pension Plan is in a significant net surplus position after the recognition of the related assets. During 2024, discretionary increases were agreed for certain cohorts of pensioners in the UK Group Pension Plan. |
• The Committee considered developments related to the triennial valuation of the UK Group Pension Plan and the impacts on the IAS 19 accounting.
• The Committee considered the treatment of discretionary increases for certain cohorts of pensioners in the UK Group Pension Plan, including the presentation of the related past service.
• EY challenge:
EY specifically challenged the assumptions used in determining the defined benefit obligations, taking into account both market practice as well as the specifics of the Pearson pension schemes. |
• The Committee is satisfied with the IAS 19 accounting, and related disclosures, for the Group’s pension obligations and assets.
• The Committee is satisfied with the presentation of past service costs related to discretionary pension increases. | ||
| Annual report and accounts 2024 Pearson plc 112 |
|
Strategic report |
Governance report |
Financial statements |
Other information | |||||
|
|
||||||||
Directors’ Remuneration Report

Sherry Coutu CBE
Chair of Remuneration Committee
Key to Committees
 Audit
Audit
 Nomination & Governance
 Reputation & Responsibility
 Remuneration
 Committee Chair
Key messages from the Remuneration Committee
| • | Shareholder input remains very important to the Committee as we keep remuneration policy and practice under continuous review. Following the 2024 AGM vote, and as part of our long-standing commitment to an ongoing and transparent dialogue with shareholders and their advisers, we undertook another extensive shareholder engagement exercise in 2024. Consequently, we have refined our disclosure in response to the feedback we received, particularly with respect to benchmarking. |
| • | The Committee considered performance outcomes for 2024. The annual incentive outcome for Executive Directors is 64% of maximum, reflecting another year of strong financial and strategic progress. The long-term incentive award granted in 2022 will vest at 75.3% of maximum, reflecting strong earnings and Net Return on Invested Capital (‘Net ROIC’) performance, combined with upper quartile Total Shareholder Return (‘TSR’) performance over the three-year performance period. |
| • | For 2025, we have updated the strategic performance metrics within the incentive plans to ensure they continue to appropriately support Pearson’s forward-looking strategic transformation. We will introduce metrics based on renewal rates in Assessments & Verification and growth in enterprise customers in the 2025 Annual Incentive Plan (‘AIP’). In the 2025 Long-Term Incentive Plan (‘LTIP’), the current strategic measures will be replaced with a metric measuring new business growth in Assessments & Verification, recognising that enabling even more transformative learning journeys will result in the greatest positive social impact. |
| • | The Committee approved a salary increase of 2.2% for the Chief Executive, aligned with the wider UK workforce, and an increase of 8% for the CFO, recognising that her salary level had fallen below a sufficiently market competitive level for an individual of her skills, experience and track record in similarly sized companies. |
| • | The Committee remains focused on ensuring that remuneration policies and practice for all Pearson’s colleagues are consistent with our need to attract and retain extra-ordinary talent to drive Pearson’s forward-looking strategy, aligned with our purpose, and values which will deliver continued value creation for our shareholders. |
Terms of reference
The Committee’s terms of reference are in line with the UK Corporate Governance Code and are available on the Governance page of the Company website at pearsonplc.com. A summary of the Committee’s responsibilities is on page 135.
Board Committee attendance
There were six scheduled meetings of the Remuneration Committee in 2024. Attendance by Directors was as follows:
| Meetings | ||||||||
| Committee members | attended | |||||||
| Sherry Coutu CBE1
|
5/6 | |||||||
| Alison Dolan2
|
3/3 | |||||||
| Esther Lee
|
5/6 | |||||||
| Tim Score3 |
4/4 | |||||||
| Annette Thomas
|
6/6 | |||||||
| 1. | Sherry Coutu was unable to attend one ad hoc additional committee meeting due to a pre-existing commitment. |
| 2. | Alison Dolan joined the Committee on 1 April 2024. |
| 3. | Tim Score stepped down on 26 April 2024. |
Dear Shareholder
On behalf of the Board, I am pleased to present Pearson’s 2024 Directors’ Remuneration Report.
Pearson once again delivered a strong financial performance with underlying sales growth of 3% (taking portfolio adjustments and FX into account and excluding the OPM and Strategic Review businesses) and adjusted operating profit of £600m, up 10% on an underlying basis compared to 2023. Free cash flow performance was also strong at £490m, up 27% with a free cash flow conversion rate of 117%. These results reflect continued strategic progress against the priorities we set at the beginning of the year, which has laid the foundation for future growth. Pearson has delivered a 36% Total Shareholder Return over this period (and a return of 125% over the three-year period to 31 December 2024).
| Annual report and accounts 2024 Pearson plc 113 |
|
Strategic report |
Governance report |
Financial statements |
Other information | |||||
| Directors’ Remuneration Report continued |
||||||||
Reflecting the Board’s confidence in the outlook for the business, we completed a multiyear share buyback of £500m in 2024, announced a further £350m buyback and are recommending a 6% increase in the final dividend, for a full-year dividend of 24.0p per share. Our strong balance sheet and excellent cash flows also enable investment in opportunities to drive growth to create further value for our stakeholders.
The Board is pleased with Pearson’s performance in 2024 and is confident that the updates to Pearson’s strategy announced by our Chief Executive, Omar Abbosh, in July 2024 sets us on the path for sustained growth that will continue to produce attractive returns for shareholders in 2025 and beyond.
Context for remuneration at Pearson
At Pearson, we broadly do three things:
| • | We create and curate content. This involves producing assessments, author learning IP, designing courses and writing curriculum standards. |
| • | We distribute content physically and digitally including delivering assessments, distributing lessons and facilitating teaching. |
| • | We build and verify skills. This involves scoring assessments, assessing gaps, credentials and evaluating talent. |
Over the last five years, Pearson has transformed in terms of global breadth, scope, scale and performance. The business has grown from Pearson the company to Pearson the brand.
| • | From a holding company into an operating company. |
| • | From analogue to digital |
| • | From a content publisher to a learning & assessment company |
| • | From legacy to a modern, high-performance culture |
Against this backdrop, there is a significant step-change in our talent requirements. Pearson is a heavily tech-oriented organisation with c.17,000 employees operating across over 40 countries, competing for senior leadership talent on a global basis. As set out on page 122, 85% of the Pearson Executive Management team and over 80% of our employees are based outside of the UK.
At the heart of Pearson’s transformation has been the executive team assembled under Andy Bird’s and Omar Abbosh’s leadership. The ambitious strategy developed and executed by our executive team has strengthened the company, positioning it to grow and succeed, while creating significant sustainable long-term shareholder value. For example, since Andy Bird’s appointment as CEO on 19 October 2020, and continuing with Omar Abbosh’s appointment as CEO on 6 January 2024, we have:
| • | Generated Total Shareholder Return of 164% and created over £4.4bn in shareholder value (19 October 2020 – 31 December 2024); |
| • | Increased Adjusted EPS by 116% from 28.7p to 62.1p (31 December 2020 – 31 December 2024); |
| • | Increased our Dividend Per Share 23% from 19.5p to 24.0p (31 December 2020 – 31 December 2024); |
Uppermost in our mind, as a Committee, is the responsibility to ensure that the Remuneration Policy reflects the quantum and flexibility required to retain and attract exceptional talent in an extremely competitive global market.
The principles that have supported our approach to talent attraction and retention are outlined on page 120. In transitioning from a UK-based holding company to a global platform that serves institutional, educational, and corporate clients, we benchmarked compensation against companies of similar complexity and scale to Pearson. In consideration of this data when developing the 2023 Policy, the Committee purposefully avoided relying on a single market reference point. Instead, we considered diverse benchmarks drawn from FTSE 41-100 companies, comparable US-listed firms, and a talent market group (CEO-1 roles in large technology, communications, and consumer discretionary companies, in particular those that are at the forefront of transformative, innovative plays within technology and digital, based on the Nasdaq 100 Index). Further information on our approach and the data points, expanded from disclosure in previous years, is set out on page 123.
The revisions to the Directors’ Remuneration Policy also addressed the Committee’s desire to reinforce Pearson’s pay-for-performance philosophy, by rebalancing the package to favour ‘at risk’ performance base pay. The Committee considered this to create better alignment with the interests of Pearson’s shareholders, further detail is set out on page 124.
Shareholder engagement
The Committee welcomed the support received from over two-thirds of our shareholders for the Directors’ Remuneration Report (‘DRR’) at the 2024 AGM, and were also pleased to receive support from IVIS and Glass Lewis. It was naturally disappointing that a significant minority voted against the DRR. We noted that the resolution was opposed by ISS, which we believe influenced a significant portion of the vote against, in particular from smaller institutional holders who may follow this recommendation for their voting.
Our established commitment to an ongoing dialogue with our shareholders on executive pay means we have engaged extensively in recent years, as described in more detail on page 121.
As a result, we have a good understanding of how our shareholders view our approach, which reflects a truly global business with many shareholders and most of its staff and revenues in the US.
Nevertheless, in light of the outcome at the 2024 AGM, a further engagement exercise was pursued. This helped ensure we captured as much feedback about the voting outcomes as possible, and extended the opportunity for shareholders to provide new or further feedback on Pearson’s approach to remuneration more generally. We also expanded the coverage of our engagement from previous programmes, writing out to our largest 100 shareholders, representing c.83% of the share register. We have also met with certain proxy agencies and other representative groups.
We received written feedback from 11 shareholders and the Committee Chair participated in eight meetings. A number of shareholders’ responses indicated that they felt there was no need for engagement given the extensive previous consultations on Pearson’s current remuneration arrangements.
The feedback we received reconfirmed that while there is a diverse range of views in our shareholder base with respect to executive pay, the majority of those we engaged with during this most recent exercise supported our overall approach and recognised that a disconnect between pay and performance,
pay and market position, and pay and calibre of talent, created a substantial risk around talent attraction and retention at Pearson.
Some shareholders, as well as ISS, retained concerns around the implementation of the increases to variable incentive opportunities introduced under the Directors’ Remuneration Policy approved by shareholders at the 2023 AGM. In addition, there was a perception from ISS that implementing the new Policy immediately after shareholder approval at the 2023 AGM, represented a failure to adequately engage with and listen to shareholders, in light of that vote in 2023.
While acknowledging this view, the Committee notes that we had consulted widely in developing the Policy in early 2023 and had refined the final proposals in response to the feedback received. We were aware, at that time, and as recognised in the Directors’ Remuneration Report for that year, that there remained a range of views among our shareholder base, such that a significant vote against the Policy was a possibility.
Following shareholder approval at the 2023 AGM, the Policy was implemented—not only because it garnered majority support, but also because the Board maintained that aligning compensation with performance, market position, and talent calibre was essential for competing in the global talent market.
| Annual report and accounts 2024 Pearson plc 114 |
|
Strategic report |
Governance report |
Financial statements |
Other information | |||||
|
|
||||||||
This strategic decision ultimately serves the best interests of the company and its diverse stakeholders.
Critically, that view was subsequently reaffirmed later in 2023 when the new Policy allowed us to appoint Omar Abbosh as our new Chief Executive. Without the new Policy, we do not believe we would have been able to compete to hire a leader of Omar’s calibre.
During the most recent shareholder engagements, a number of investors informed us that as a result of this engagement, they fully understand the talent markets Pearson competes in (and by extension the rationale underpinning the current Remuneration Policy) but had a desire to see greater detail on the markets we look at. To reflect this feedback, we have further expanded information on our talent markets and approach to pay positioning (see page 123). Some shareholders also wished to better understand the shareholder engagement we have undertaken and how this influenced the Policy proposals, which is discussed in more detail on page 121.
Finally, our engagement revealed that some investors held ongoing concerns over the legacy Co-Investment Plan for the previous Chief Executive and did not vote in favour of the Directors’ Remuneration Report because of this. The Co-Investment Plan has now concluded, there are no further tranches to vest and no new awards will be made (because it was not retained as part of the current Directors’ Remuneration Policy we introduced in 2023).
Pearson remains committed to a constructive and positive relationship with all its shareholders and their advisers and will continue to engage widely going forward, including later this year in respect of the development of our next Remuneration Policy.
Incentive outcomes for 2024
2024 AIP
The strong financial and strategic progress delivered in 2024 resulted in a formulaic AIP outcome for Executive Directors of 64% of maximum, with outperformance against the stretching targets for adjusted operating profit and free cash flow, and achievement between threshold and target on sales. Overall, the Committee was satisfied that the formulaic outcome was reflective of the performance achieved.
2022 LTIP
The LTIP granted in 2022 will vest in 2025 at 75.3% of maximum, principally reflecting strong underlying performance in earnings per share (‘EPS’) and Net ROIC as well as exceptional upper quartile TSR over the three-year performance period. The shares vesting will remain subject to a two-year holding period.
Further details of the performance outcome for both incentive awards are set out on page 128.
Looking forward to 2025
Salaries for 2025
Salary increases for the Executive Directors are reviewed by the Committee using a framework consistent with that used in the wider business. For 2025, the CEO’s salary will increase by 2.2%, in line with the average increase in the wider UK workforce, and noting his recent appointment. For the CFO, the Committee reflected on Sally Johnson’s continued strong performance since her appointment in 2020, the broad remit of her role which extends into key operational areas of the business, and the critical role she played in supporting a highly successful CEO transition last year. Sally has played a key part in Pearson’s strong and sustained performance (referred to earlier), growing the market capitalisation of the business above £8.6bn, with Pearson now positioned within the top 50 largest companies by market capitalisation in the UK. Against this performance backdrop, the Committee noted that the salary level had fallen below a sufficiently market competitive level for an individual of Sally’s skills, experience and track record, in similarly sized companies. Taking all of the above into account, the Committee agreed that the CFO’s salary should be increased to £620k. We recognise that this increase of 8% is above the average workforce increase, but it is appropriate to reflect the factors above and is consistent with the framework used to take into account performance and market relativity for salary reviews in the wider business. Salary increases will take effect from 1 April 2025.
Performance framework
Each year, the Committee carefully reviews the performance measure framework to ensure it optimally aligns with key priorities from the forward looking strategy which will drive long-term shareholder value. Having undertaken this review for 2025, the Committee is proposing to update the strategic metrics within both the AIP and LTIP to directly align with our new Integrated Strategic Framework outlined in detail on page 12. In particular, growing value in our core business (Assessments & Verification), while also delivering on our strategic growth pillars and delivering the greatest positive social impact by enabling even more transformative learning journeys.
In the AIP, we will update the 10% strategic component to include 5% which is based on renewal rates within Assessments & Verification and 5% based on growth in our enterprise customer base. These are core annual priorities for the Group as we execute on the strategic framework.
For the LTIP, 10% will be based on driving long-term growth in our core business, with a metric based on new business growth in Assessments & Verification.
These new strategic metrics will replace measures on representation and carbon reduction. Our strong and sustained progress in these areas means we are comfortable in re-prioritising the strategic metrics in our incentives. We will continue to keep the metrics and weightings under regular annual review. No other changes will be made to the AIP or LTIP metrics, which remain closely aligned to financial performance and shareholder value.
Target-setting for 2025
One of Pearson’s key remuneration principles, which applies across the whole organisation, centres on pay for performance, and this is actively considered by the Committee when determining targets. For 2025, in line with established practice, a robust target-setting process has been followed considering Pearson’s strategic plan as well as other relevant factors such as analyst consensus, to reflect market expectations.
As reflected by our past track record, the Committee has a very strong focus on paying only when performance is delivered and setting truly stretching performance targets. The approach taken this year is no different. For both EPS and return on capital (‘ROC’), the stretch of the performance ranges has been increased compared to last year’s awards. For maximum vesting, performance must be well in excess of current market guidance, with shareholder returns in the upper quartile against both the FTSE 100 and the S&P 500.
Remuneration across Pearson
Pearson’s remuneration principles are consistent across the organisation and designed to support our culture and to attract and retain talent to execute our strategy. Many of the features of our Directors’ Remuneration Policy apply more broadly; for example, over half of all Pearson employees (c.10,000 employees) participated in the AIP during 2024, which was funded based on similar performance measures as those used for Executive Directors. The Committee receives regular updates on talent matters and wider workforce considerations and rigorously considers the approach to reward throughout the organisation when determining executive remuneration.
Pearson is committed to a transparent and positive relationship with all its stakeholders and will continue to engage widely as appropriate going forward. I would like to thank shareholders for their continued support at the 2025 AGM in relation to our 2024 Directors’ Remuneration Report.
Sherry Coutu CBE
Chair of Remuneration Committee
| Annual report and accounts 2024 Pearson plc 115 |
|
Strategic report |
Governance report |
Financial statements |
Other information | |||||
|
|
||||||||
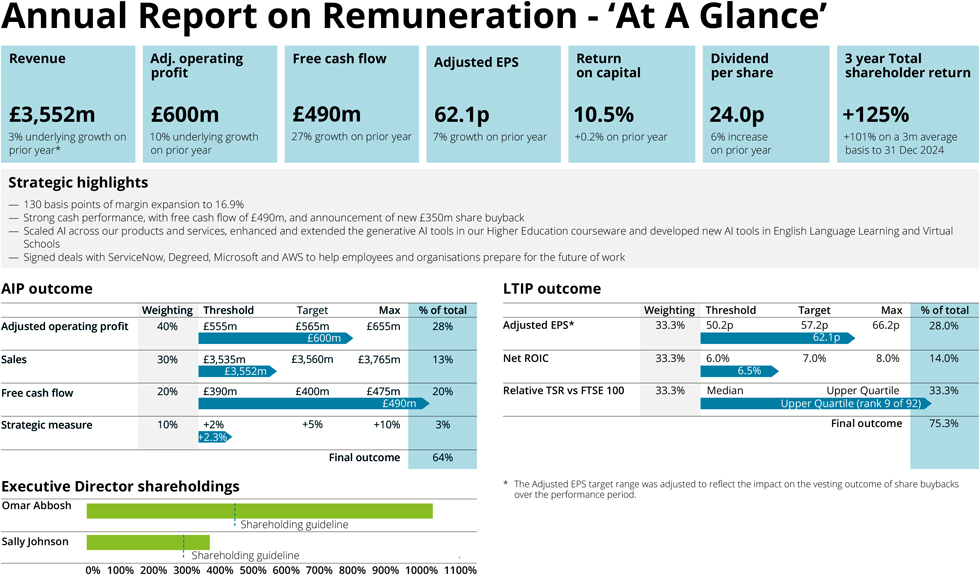
| * | Excluding the OPM and Strategic Review businesses. |
Revenue Adj profit . operating Free cash flow Adjusted EPS on Return capital Dividend per share 3 shareholder year Total return 3,552m* 600m 490m 62.1p 10.5% 24.0p +125% 3% underlying growth on 10% underlying growth 27% growth on prior year 7% growth on prior year +0.2% on prior year 6% increase +101% on a 3m average prior year on prior year on prior year basis to 31 Dec 2024 Strategic highlights 130 basis points of margin expansion to 16.9% Strong cash performance, with free cash flow of 490m, and announcement of new 350m share buyback Scaled AI across our products and services, enhanced and extended the generative AI tools in our Higher Education courseware and developed new AI tools in English Language Learning and Virtual Schools Signed deals with ServiceNow, Degreed, Microsoft and AWS to help employees and organisations prepare for the future of work AIP outcome LTIP outcome Weighting Threshold Target Max % of total Weighting Threshold Target Max % of total Adjusted operating pro?t 40% 555m 565m 655m 28% Adjusted EPS (33%) 50.2p 57.2p 66.2p 28.0% 600m 62.1p Sales 30% 3,535m 3,560m 3,765m 13% Net ROIC (33%) 6.0% 7.0% 8.0% 14.0% 3,552m 6.5% Free cash ?ow 20% 390m 400m 475m 475m 20% Relative TSR vs FTSE 100 (33%) Median Upper Quartile 75.3% 492m Upper Quartile (rank 9 of 92) Strategic measure 10% +2% +5% +10% 3% Final outcome 75.3% +2.3% Final outcome 64% Executive Director shareholdings Omar Abbosh Shareholding guideline Sally Johnson Shareholding guideline 0% 100% 200% 300% 400% 500% 600% 700% 800% 900% 1000% 1100%
| Annual report and accounts 2024 Pearson plc 116 |
|
Strategic report |
Governance report |
Financial statements |
Other information | |||||
|
|
||||||||
Summary of our Directors’ Remuneration Policy
The table below provides a summary of our Directors’ Remuneration Policy. The full Directors’ Remuneration Policy, as approved at the 2023 AGM, is available on the Governance page of the company’s website at https://plc.pearson.com/sites/pearson-corp/files/pearson/our-company/Governance/governance-downloads/remuneration-policy-2023.pdf
| Base salary |
• | Base salaries reflect level, role, skills, experience, the competitive market and individual contribution. | ||
| • | Base salaries are normally reviewed annually, consistent with the framework used to take into account performance and market relativity for salary reviews in the wider business, with any increases normally in line with typical increases awarded to other Group employees. | |||
| Allowances and benefits |
• | Reflects the local competitive market and may include travel-related, health-related and risk-related benefits as well as any other benefits provided to the majority of employees. | ||
| • |
The Committee may introduce other benefits if it is considered appropriate to do so. | |||
| Retirement benefits |
• | Employees in the UK, including Executive Directors, are eligible to join the Money Purchase 2003 Section of the Pearson Pension Plan. | ||
|
• |
The Committee has discretion to put in place retirement benefit arrangements in line with local market practice. | |||
| • | Executive Directors, who opt out of the pension, can receive a cash allowance of up to 16% of base salary, in line with the maximum company contribution as a percentage of salary that UK employees of a similar age are eligible to receive. | |||
| Annual incentive plan |
• | Maximum opportunity of 300% of salary. | ||
|
• |
Based on the achievement of annual business goals and strategic objectives, with financial metrics accounting for at least 75% of total opportunity. | |||
| • | Payout of 25% of maximum for threshold performance with 50% payable for on-target performance. | |||
| • | Discretion to adjust formulaic outcome where this does not reflect underlying performance. | |||
| • | Awards paid fully in cash except where shareholding guidelines have not been met where a bonus deferral applies. | |||
| • | Malus and clawback provisions apply. | |||
| Long-term incentive plan |
• | Maximum opportunity of 450% of base salary. | ||
|
• |
Based on the achievement of financial targets (e.g. earnings per share and a return measure), shareholder returns (e.g. relative total shareholder return) and strategic objectives. | |||
| • | Payout of 20% of maximum for threshold performance. | |||
| • | Discretion to adjust formulaic outcome where this does not reflect underlying performance. | |||
| • | Awards are subject to a post-vesting holding period of two years. | |||
| • | Malus and clawback provisions apply. | |||
| Shareholding guidelines |
• | Current in-employment guidelines of: | ||
|
• 450% for the Chief Executive | ||||
|
• 300% for the Chief Financial Officer | ||||
| • | Post-employment shareholding guidelines apply. | |||
| Chair and NED fees |
• | To attract and retain high-calibre individuals, with appropriate or industry-relevant skills, by offering market-competitive fee levels. | ||
|
• |
The Chair and Deputy Chair are paid a single fee for all responsibilities. | |||
| • | The Non-Executive Directors are paid a basic fee, with Committee Chairs, members of the main Board Committees, and, if relevant, the Senior Independent Director paid an additional fee to reflect their extra responsibilities. | |||
| • | The Chair, Deputy Chair and Non-Executive Directors receive no other pay or benefits, except for reimbursement of expenses, and do not participate in incentive plans. | |||
| • | A minimum of 25% of the Chair, Deputy Chair and Non-Executive Directors’ basic fee is paid in shares. | |||
| Annual report and accounts 2024 Pearson plc 117 |
|
Strategic report |
Governance report |
Financial statements |
Other information | |||||
| Implementation in 2025 |
||||||||
Base salary
Salaries with effect from 1 April 2025:
| • | Omar Abbosh – £1,022,000 (2.2% increase) |
| • | Sally Johnson – £620,000 (8% increase) |
Salary increases for the Executive Directors are reviewed by the Committee using a framework consistent with that used in the wider business. The CEO’s salary will increase in line with the average increase in the wider UK workforce, and noting his recent appointment. For the CFO, the Committee reflected on Sally Johnson’s continued strong performance since her appointment in 2020, the broad remit of her role which extends into key operational areas of the business, and the critical role she played in supporting a highly successful CEO transition last year. Sally has played a key part in Pearson’s strong and sustained performance, growing the market capitalisation of the business above £8.6bn, with Pearson now positioned within the top 50 largest companies by market capitalisation in the UK. Against this performance backdrop, the Committee noted that the salary level had fallen below a sufficiently market competitive level for an individual of Sally’s skills, experience and track record in similarly sized companies. Taking all of the above into account, the Committee agreed that the CFO’s salary should be increased to £620k. We recognise that this increase of 8% is above the average workforce increase, but it is appropriate to reflect the factors above and is consistent with the framework used to take into account performance and market relativity for salary reviews in the wider business.
Annual Incentive Plan
Maximum opportunities of:
| • | 300% of base salary for the Chief Executive |
| • | 200% of base salary for the Chief Financial Officer |
For 2025, the following balanced mix of financial and strategic measures will be used to determine any payout. As in previous years, we will apply a financial underpin to the strategic measures. The performance targets are considered commercially sensitive and will be disclosed in full retrospectively in next year’s report.
| Adjusted operating profit | Sales | Free cash flow | Strategic measures* | |||
| 40% | 30% | 20% | 10% | |||
| * | Split equally between ‘Enterprise Skilling – number of key enterprise customers’ & ‘Assessments & Verification – rates of renewal’. |
In line with the Policy, a third of any bonus paid will be deferred into shares for two years if an Executive Director has not met their shareholding guideline.
Benefits
| • | Travel, health and risk-related benefits in line with Policy |
| • | Pension cash allowance of 16% of base salary |
Long-term incentive Plan
Awards will be made as follows:
| • | 450% of base salary for the Chief Executive |
| • | 300% of base salary for the Chief Financial Officer |
Performance will be measured over the three-year period to 31 December 2027, with any shares vesting subject to an additional two-year holding period. Performance measures and targets for the 2025 award are as follows:
| % of total | Threshold | Maximum | ||||||||||
| Adjusted EPS | 30% | 67.0p | 85.0p | |||||||||
| Return on Capital | 30% | 10.5% | 14.0% | |||||||||
| Relative TSR | 30% | Median | Upper quartile | |||||||||
| Strategic Measure – Assessments & Verification: New Business Growth | 10% | £90m | £105m | |||||||||
Note 1: Vesting is on a straight-line basis between Threshold and Maximum.
Note 2: 2025 LTIP targets have been set at a USD:GBP exchange rate of 1.25.
Note 3: Relative TSR will be assessed half against the FTSE 100 and half against the S&P 500. Companies within financial services, energy, basic materials, utilities and healthcare sectors will be excluded from both TSR groups.
Chair and NED fees
Fees remain unchanged and will be as follows:
| • | £500,000 for the Chair |
| • | £175,000 for the Deputy Chair and Senior Independent Director |
| • | £70,000 as the base fee for Non-Executive Directors |
| Audit Committee | Remuneration Committee |
Nomination & Governance Committee |
Reputation & Responsibility Committee |
|||||||||||||
| Committee Chair | £27,500 | £27,500 | £15,000 | £15,000 | ||||||||||||
| Committee member | £15,000 | £10,000 | £8,000 | £8,000 | ||||||||||||
| Annual report and accounts 2024 Pearson plc 118 |
|
Strategic report |
Governance report |
Financial statements |
Other information | |||||
| Alignment of performance framework to Pearson’s strategy |
||||||||
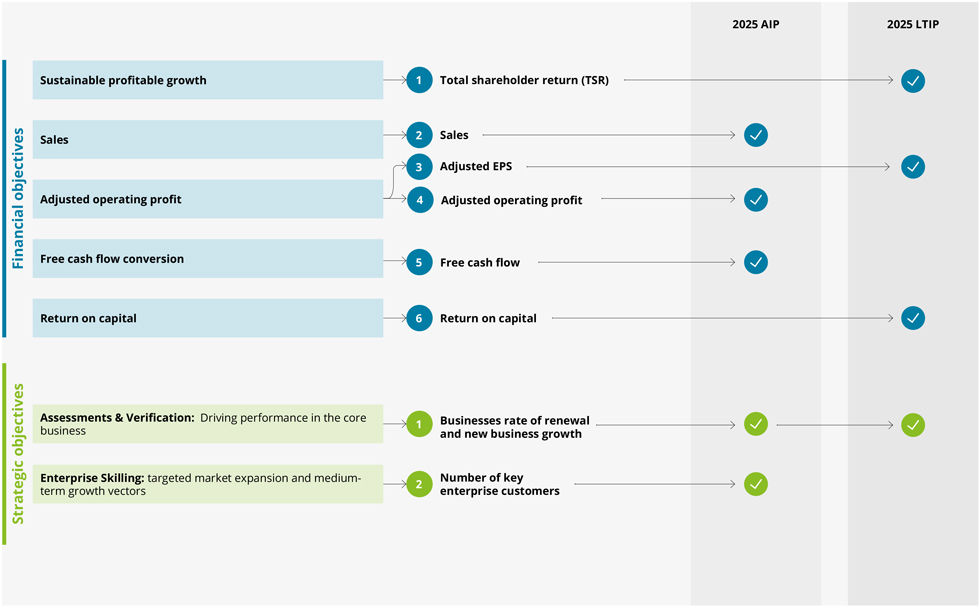
2025 AIP 2025 LTIP Sustainable profitable growth 1 Total shareholder return (TSR) Sales 2 Sales objectives 3 Adjusted EPS Adjusted operating profit 4 Adjusted operating profit Financial Free cash flow conversion 5 Free cash flow Return on capital 6 Return on capital Assessments & Verification: Driving performance in the core 1 Businesses rate of renewal objectives business and new business growth Enterprise Skilling: targeted market expansion and medium- 2 Strategic term growth vectors enterprise customers Annual report and accounts 2024 Pearson plc 119
| Annual report and accounts 2024 Pearson plc 119 |
|
Strategic report |
Governance report |
Financial statements |
Other information | |||||
| Directors’ Remuneration Report continued |
||||||||
Remuneration principles
Pearson’s remuneration principles govern pay for the whole organisation. We have developed remuneration arrangements for our Executive Directors with these principles in mind.

Our Directors’ Remuneration Policy and its implementation supports our company purpose of ‘helping people realise the life they imagine through learning’, our strategy and ultimately the delivery of long-term sustainable value for all stakeholders, including our shareholders.
In developing the Directors’ Remuneration Policy, the Committee had due regard to the principles outlined within the UK Corporate Governance Code as it applied to 2024:
| • | Pearson’s remuneration principles, as set out above, align with our culture and position us as an employer of choice, so we can continue to attract and retain the right talent, and support our strategy. We recognise that remuneration is only one part of Pearson’s employee value proposition |
| • | Our executive remuneration framework is designed to be simple, with total remuneration made up of fixed and performance-linked elements, supporting different strategic objectives |
| • | Our remuneration framework and outcomes are designed to be aligned with performance: |
| • | Performance measures for the AIP and LTIP are key to achieving the Group’s strategic objectives. The Committee reviews performance measures annually to ensure they incentivise appropriate management behaviours and goals |
| • | The Committee carries out a robust target-setting process each year, considering Pearson’s strategic plan, as well as analyst consensus to reflect market expectations. This results in stretching, yet achievable, AIP and LTIP targets |
| • | Maximum awards under the AIP and LTIP are capped and clearly disclosed in our Directors’ Remuneration Policy alongside indications of how the Directors’ Remuneration Policy may apply in various performance scenarios |
| • | When determining payouts, the Committee considers whether the outcome reflects overall company performance and the experience of stakeholders over the period, including shareholders and colleagues. If not, it has the discretion to adjust outcomes |
| • | The Committee is mindful of reputational and other risks when implementing the Directors’ Remuneration Policy and determining outcomes for Executive Directors and senior management. Pearson has safeguards in place, such as malus and clawback provisions and a two-year LTIP holding period, as well as robust shareholding guidelines, which extend post-employment. |
| • | Before signing off the Directors’ Remuneration Report, the Committee reviews drafts and inputs to clarify our disclosures. As described on page 121, the Committee engaged extensively with shareholders on the current Directors’ Remuneration Policy to give them the opportunity to feed into the decision-making process. |

| Annual report and accounts 2024 Pearson plc 120 |
|
Strategic report |
Governance report |
Financial statements |
Other information | |||||
|
|
||||||||
Shareholder engagement
We have a well-established commitment to ongoing dialogue with our shareholders on executive compensation. The following table summarises the extensive engagement we have undertaken in recent years in support of the development and implementation of our current Remuneration Policy:
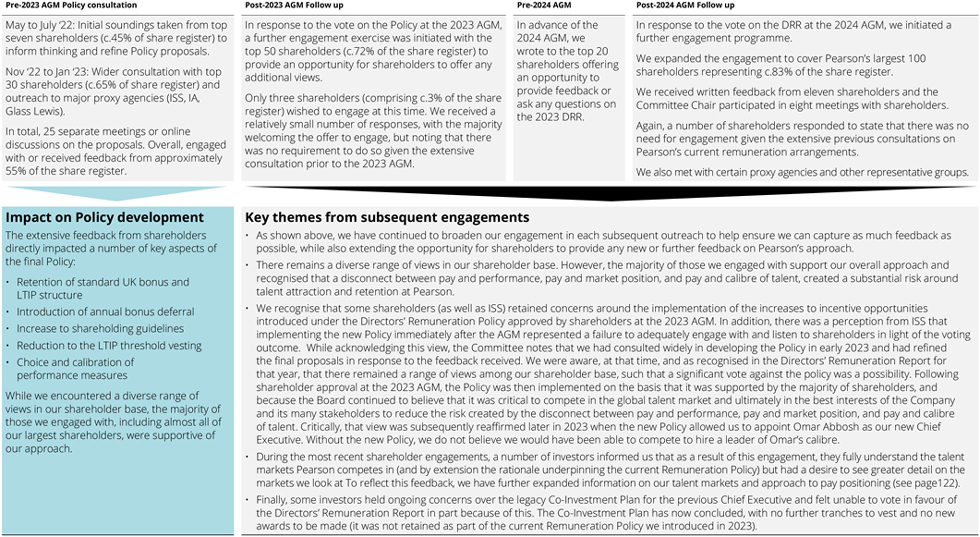
The Committee would like to thank all those shareholders that have engaged with us during this period. We are committed to an open and ongoing dialogue. Our next Directors’ Remuneration Policy will be submitted for approval at the 2026 AGM, and we look forward to engaging again on our proposals in advance of that.
Pre-2023 AGM Policy consultation May to July ‘22: Initial soundings taken from top seven shareholders (c.45% of share register) to inform thinking and refine Policy proposals. Nov ‘22 to Jan ‘23: Wider consultation with top 30 shareholders (c.65% of share register) and outreach to major proxy agencies (ISS, IA, Glass Lewis). In total, 25 separate meetings or online discussions on the proposals. Overall, engaged with or received feedback from approximately 55% of the share register. Post-2023 AGM Follow up In response to the vote on the Policy at the 2023 AGM, a further engagement exercise was initiated with the top 50 shareholders (c.72% of the share register) to provide an opportunity for shareholders to offer any additional views. Only three shareholders (comprising c.3% of the share register) wished to engage at this time. We received a relatively small number of responses, with the majority welcoming the offer to engage, but noting that there was no requirement to do so given the extensive consultation prior to the 2023 AGM. Pre-2024 AGM In advance of the 2024 AGM, we wrote to the top 20 shareholders offering an opportunity to provide feedback or ask any questions on the 2023 DRR. Post-2024 AGM Follow up In response to the vote on the DRR at the 2024 AGM, we initiated a further engagement programme. We expanded the engagement to cover Pearson’s largest 100 shareholders representing c.83% of the share register. We received written feedback from eleven shareholders and the Committee Chair participated in eight meetings with shareholders. Again, a number of shareholders responded to state that there was no need for engagement given the extensive previous consultations on Pearson’s current remuneration arrangements. We also met with certain proxy agencies and other representative groups. Impact on Policy development The extensive feedback from shareholders directly impacted a number of key aspects of the final Policy: • Retention of standard UK bonus and LTIP structure • Introduction of annual bonus deferral • Increase to shareholding guidelines • Reduction to the LTIP threshold vesting • Choice and calibration of performance measures While we encountered a diverse range of views in our shareholder base, the majority of those we engaged with, including almost all of our largest shareholders, were supportive of our approach. Key themes from subsequent engagements • As shown above, we have continued to broaden our engagement in each subsequent outreach to help ensure we can capture as much feedback as possible, while also extending the opportunity for shareholders to provide any new or further feedback on Pearson’s approach. • There remains a diverse range of views in our shareholder base. However, the majority of those we engaged with support our overall approach and recognised that a disconnect between pay and performance, pay and market position, and pay and calibre of talent, created a substantial risk around talent attraction and retention at Pearson. • We recognise that some shareholders (as well as ISS) retained concerns around the implementation of the increases to incentive opportunities introduced under the Directors’ Remuneration Policy approved by shareholders at the 2023 AGM. In addition, there was a perception from ISS that implementing the new Policy immediately after the AGM represented a failure to adequately engage with and listen to shareholders in light of the voting outcome. While acknowledging this view, the Committee notes that we had consulted widely in developing the Policy in early 2023 and had refined the final proposals in response to the feedback received. We were aware, at that time, and as recognised in the Directors’ Remuneration Report for that year, that there remained a range of views among our shareholder base, such that a significant vote against the policy was a possibility. Following shareholder approval at the 2023 AGM, the Policy was then implemented on the basis that it was supported by the majority of shareholders, and because the Board continued to believe that it was critical to compete in the global talent market and ultimately in the best interests of the Company and its many stakeholders to reduce the risk created by the disconnect between pay and performance, pay and market position, and pay and calibre of talent. Critically, that view was subsequently reaffirmed later in 2023 when the new Policy allowed us to appoint Omar Abbosh as our new Chief Executive. Without the new Policy, we do not believe we would have been able to compete to hire a leader of Omar’s calibre. • During the most recent shareholder engagements, a number of investors informed us that as a result of this engagement, they fully understand the talent markets Pearson competes in (and by extension the rationale underpinning the current Remuneration Policy) but had a desire to see greater detail on the markets we look at To reflect this feedback, we have further expanded information on our talentmarkets and approach to pay positioning (see page122). • Finally, some investors held ongoing concerns over the legacy Co-Investment Plan for the previous Chief Executive and felt unable to vote in favour of the Directors’ Remuneration Report in part because of this. The Co-Investment Plan has now concluded, with no further tranches to vest and no new awards to be made (it was not retained as part of the current Remuneration Policy we introduced in 2023). Pearson plc 121
| Annual report and accounts 2024 Pearson plc 121 |
|
Strategic report |
Governance report |
Financial statements |
Other information | |||||
| Directors’ Remuneration Report continued |
||||||||
Market context for remuneration at Pearson – our talent markets
Our approach to executive reward is shaped by the characteristics of our business and the talent markets in which we operate.
Pearson is a global company and over two-thirds of our revenue comes from the US, which remains a key growth market. This gives us greater US exposure than almost all other UK-listed companies.
Additionally, more than half of Pearson’s employees and over 60% of the Pearson Executive Management team (PEM) are based in the US. A relatively small proportion of our employees and executive team are based in the UK (just 15% of the PEM as of 31 December 2024, down from over half five years prior to that).
As the world’s lifelong learning company, we are committed to delivering on our mission of helping individuals realise the life they imagine, through learning. To do this, we are leveraging the strength of our brand and depth of our thought leadership to execute a simple but powerful strategy built on three interconnected pillars: (i) unlocking value from our core business, (ii) driving execution synergies, and (iii) capitalising on medium-term growth vectors.
The expertise we require to implement our strategy is increasingly found within principally US-based large tech companies, EdTech companies or Fortune 500 companies. Our ability to recruit and retain talent from this North American market is therefore a critical ingredient if we are to continue to successfully deliver our strategy.
Since 2020, we have refreshed and strengthened our senior management team, with almost all of the senior hires in that period coming from US companies or global companies that offer ‘US style’ packages. For example, in this period we have recruited PEM talent from companies such as Accenture, Delta Air Lines, Hologic Inc, SEMA4, The Trade Desk and Warner Media.
The same theme can be seen at Executive Director level. We recruited Omar Abbosh from Microsoft, one of the world’s largest multinational technology companies. Our previous Chief Executive had led the transformation of the Walt Disney’s international business into a digital-first business, and was based in the US.
In addition to talent market considerations, the composition of our shareholder base is also changing. North American shareholders now account for around a quarter of our share register, a proportion which has nearly doubled since 2017.
Proportion of revenue from US geographic segment (FTSE 100)

Based on the publicly disclosed geographic revenue segment, which covers the US or Americas as a proportion of disclosed Group revenue. Data for Pearson is based on the year ending 31 December 2024. Data is shown for the FTSE 100 excluding investment trusts, and was sourced from Datastream and published annual reports as at January 2025.
Data as of 31 December 2024

| Annual report and accounts 2024 Pearson plc 122 |
|
Strategic report |
Governance report |
Financial statements |
Other information | |||||
|
|
||||||||
Market reference points
As disclosed previously, the Committee’s approach to market data which informed the development of the current Remuneration Policy was to consider multiple reference points to provide a rounded view of overall positioning, reflecting both the talent markets described above and our status as a UK-listed company. In calibrating the current Policy, the Committee did not seek to align with any one specific market reference point and was mindful of the need to ensure an appropriate balance. The three reference points considered were:
| 1. | FTSE 41-100. UK-listed companies of a broadly similar financial size to Pearson, represented by companies ranked between 41 and 100 in the FTSE 100 using 12-month average market capitalisation (Pearson is ranked 57th on this basis). The group recognises Pearson’s status as a constituent of the FTSE 100 index, but has no direct relevance to our primary talent markets. |
| 2. | US-listed companies of a broadly similar financial size and sector. This group includes US-listed companies of comparable revenue to Pearson (c.$3-4bn) in the broadcasting, interactive media and software sectors. It represents what Executive Directors would be paid in broadly similar US-listed companies, although again it does not directly align to Pearson’s talent market. |
| 3. | Talent market group. This group comprises companies which are more closely aligned to our key talent market and strategic ambitions – large technology, communications and consumer discretionary companies, in particular those that are at the forefront of transformative, innovative plays within technology and digital, based on the Nasdaq 100 Index. This group was only used for the Chief Executive role at Pearson and, recognising that many of these companies are materially larger than Pearson, the market data considered was for roles reporting into the CEO (primarily heads of business units or subsidiary businesses) and not the CEO role itself. This is analogous to Omar Abbosh’s previous executive role at Microsoft. |
The constituent companies within each reference point are shown in the table on page 124.
The market data for these three reference points is summarised in the charts below for the Chief Executive and for each key element of remuneration. The data highlights the stark difference in pay practices between the UK and US markets. While it is acknowledged that the package for the Chief Executive is positioned towards the upper end of market practice from a UK perspective, it remains materially below the market range for CEO roles in US-listed companies of broadly similar size and sector. The Pearson package allows us to be competitive in Pearson’s primary talent market, as reaffirmed by our appointment of Omar Abbosh in 2024.
We will continue to refine and evolve our approach to market data as we head into the next Remuneration Policy review. We are committed to transparently sharing our approach with shareholders, both in consultation and in the relevant Directors’ Remuneration Report, and always welcome feedback.
Chief Executive – positioning of total target compensation (£) against each reference point

| Annual report and accounts 2024 Pearson plc 123 |
|
Strategic report |
Governance report |
Financial statements |
Other information | |||||
| Directors’ Remuneration Report continued |
||||||||

1. FTSE 41-100 Admiral, Airtel Africa, AutoTrader, B & M Retail, Beazley, Berkeley Holdings, British Land, Bunzl, Centrica, Coca Cola HBC, ConvaTec, Croda International, DCC, Diploma, DS Smith, EasyJet, Endeavour Mining, Entain, Frasers Group, Fresnillo, Halma, Hargreaves Lansdown, Hikma Pharmaceuticals, Hiscox, Howden Joinery, IMI, Informa, International Consolidated Airlines, Intertek, J Sainsbury, JD Sports Fashion, Kingfisher, Land Securities, Londonmetric Property, M&G, Marks & Spencer, Melrose Industries, Mondi, Persimmon, Phoenix Group, Rentokil Initial, Rightmove, Sage, Schroders, Severn Trent, Smith & Nephew, Smiths Group, Spirax Sarco, Taylor Wimpey, Unite, United Utilities, Vistry, Weir, Whitbread, and WPP. 2 size .US and -listed sector companies of a broadly similar financial AMC Networks, Electronic Arts, Graham Holdings, IAC/ InterActiveCorp, IHeartMedia, Lionsgate Entertainment corp, Match Group, Nexstar Media, Nortonlifelock, Peloton Interactive, Pinterest, Roku, Sinclair Broadcast Group, Sirius XM Holdings, and Snap inc. 3. Talent market group (CEO-1 roles)* Adobe Inc, Advanced Micro Devices Inc, Airbnb Inc, Alphabet Inc, Amazon.com Inc, Analog Devices Inc, Applied Materials Inc, ASML Holding NV, Automatic Data Processing Inc, Broadcom Inc, Cadence Design Systems Inc, Cognizant Technology Solutions Corp, Comcast Corp, Fiserv Inc, Intel Corp, Intuit Inc, KLA Corp, Lam Research Corp, Marvell Technology Inc, MercadoLibre Inc, Microchip Technology Inc, Microsoft Corp, Okta Inc, Qualcomm Inc, Tesla Inc, T-Mobile US Inc. *This group was only used for the Chief Executive role at Pearson and, recognising that many of these companies are materially larger than Pearson, the market data considered was for roles reporting into the CEO (primarily heads of business units or subsidiary businesses) and not the CEO role itself.
| Evolution of CEO Pay Mix
The revisions to the Directors’ Remuneration Policy addressed the Committee’s desire to reinforce Pearson’s pay-for-performance philosophy, by rebalancing the package to favour ‘at risk’ performance based pay.
The Committee considered this to create better alignment with the interests of Pearson’s shareholders: |
Evolution of CEO pay mix
Notes:
Current CEO’s base salary has been applied to the 2020 Policy for comparability.
Target performance assumes 50% payout for AIP and LTIP under both the 2020 and 2023 Policies.
No share price growth assumptions are included in any scenarios. | |||
| At Maximum
• The CEO’s fixed pay reduced from 19% to 13% of the overall pay mix
• Variable pay increased from 81% to 87% of the overall pay mix and is earned only for delivering against stretching performance targets.
• 52% of the package is delivered through share based pay, with a five year time horizon (from date of grant to the end of the post-vesting holding periods). |
At Target
• The CEO’s fixed pay reduced from 29% to 21% of the overall pay mix
• Variable pay increased from 71% to 79% of the overall pay mix and is earned only for delivering against stretching performance targets.
• 52% of the package is delivered through share based pay, with a five year time horizon (from date of grant to the end of the post-vesting holding periods). | |||
| Annual report and accounts 2024 Pearson plc 124 |
|
Strategic report |
Governance report |
Financial statements |
Other information | |||||
|
|
||||||||
Workforce remuneration at Pearson
The Committee takes seriously its responsibilities concerning the oversight of remuneration policies and practices for the wider organisation. Our remuneration principles as set out on page 120 are consistent for all our colleagues, and applied depending on business need, level and geography.
The key difference in our executive remuneration, compared to the approach to remuneration across our workforce, is that remuneration for our Executive Directors is more heavily weighted towards variable pay and linked to delivering strategic objectives.
Approach to remuneration across Pearson
| Base salary |
Set considering economic factors, competitive market rates, roles, skills, experience and individual performance. | |||||
| Allowances and benefits |
Reflect the local labour market in which colleagues are based and may include healthcare and well-being benefits. | |||||
| Retirement benefits |
Reflect local market practice.
|
|||||
| Pearson colleagues in the UK may participate in the same underlying pension arrangements as the Executive Directors, subject to certain age bands and legacy arrangements. The main contribution plan (Money Purchase 2003) allows employees to pay in between 3% and 8% of their basic salary, depending on their age. Pearson then contributes double that amount, paying in between 6% and 16% of salary. | ||||||
| Annual incentives |
Over half of all Pearson employees, around 10,000 colleagues, participate in an Annual Incentive Plan, which is funded based on similar performance measures to the Executive Directors. Several other colleagues (c. 1,700) participate in alternative cash-based annual bonuses, such as sales incentive and commission plans, based on performance targets and profit-shares where required for legislative reasons. | |||||
| Share incentives |
We believe in the importance of aligning the interests of management and our shareholders by delivering a significant proportion of total remuneration in the form of share incentives.
| |||||
| Approximately 700 colleagues (4% of all employees) participate in the annual Long-Term Incentive Plan grant, selected based on their role, performance and potential; with other awards being made from time to time on an ad hoc basis to certain roles based on market need. | ||||||
| Awards for our Executive Directors are made solely in the form of performance shares. However, our SVPs and Executive Management team have an equal mix of both performance shares (subject to broadly the same performance conditions as the Executive Directors) and restricted shares, recognising prevailing practice in the markets in which we compete for talent. At other levels, awards are typically made in restricted shares only.
| ||||||
| In addition to our Long-Term Incentive Plan, all colleagues have the opportunity to become shareholders and owners of the Company and share in the value they help to create through participation in savings-related share acquisition programmes. Under our ‘Save For Shares’ plan and ‘Employee Stock Purchase Plan’, employees can buy Pearson shares at a discount (20% discount for ‘Save For Shares’ and a 15% discount for the ‘Employee Stock Purchase Plan’, in line with the maximum discounts permitted by HMRC and the IRS respectively). Around one in five eligible employees currently save to purchase Pearson shares via our employee share plans, contributing to a strong culture of share ownership. | ||||||
| Annual report and accounts 2024 Pearson plc 125 |
|
Strategic report |
Governance report |
Financial statements |
Other information | |||||
| Directors’ Remuneration Report continued |
||||||||
|
|
||||||||
During the year, the Committee received reports from the Chief Executive and Chief Human Resources Officer on pay and conditions across Pearson, and on the recruitment and retention experience. We took these into account when determining executive remuneration. We have established channels in place to inform our colleagues and help them understand how executive remuneration and wider pay policies are aligned. Views and sentiment expressed by colleagues around matters relating to reward and culture are taken into consideration by the Remuneration Committee when determining pay for senior management. In order to give more colleagues the opportunity to meet the Board, including the members of the Remuneration Committee, three in-person sessions with employees in our major employee hubs in London and in the US in Hoboken, New Jersey and Durham, North Carolina, were held.
These facilitated meaningful interactions between Board members and various groups of employees to hear their thoughts, feedback and questions.
Board members engaged on a variety of topics, including the strategic review process and the clarity of our strategic priorities, the plans for execution and the pace of transformation required, and the importance of company culture. See page 85 for more on how the Board engages with employees.
The Committee also considers Pearson’s gender pay gap and ethnicity pay gap in Great Britain in light of our reporting requirements, as well as Pearson’s CEO pay ratio. Pearson continues to review and update its policies and practices relating to the hiring, retention, and development of women, in line with market practices and applicable UK rules.
|
Sharing in success
Pearson’s remuneration principles are consistent across the organisation and are designed to support our culture, and to make Pearson an employer of choice, able to attract and retain talent to execute our digital-first strategy. Many of the features of our Directors’ Remuneration Policy apply more broadly, and we believe that all our people should have the opportunity to benefit when the Company does well. In particular:
— 2024 was another year of solid performance for the business and this was reflected in the level of funding under the AIP. As noted on page 125, over half of all Pearson employees (c.10,000 employees) benefitted from participating in an AIP during 2024. — Similarly, all eligible colleagues, including Executive Directors, can participate in savings-related share acquisition programmes that are not subject to any performance conditions. Around one in five of eligible employees save to purchase discounted Pearson shares via our employee share plans. At the most recent maturity of our ‘Save For Shares’ plan in 2024, the average gain for a participant was c.£3,400 – allowing those who participated to benefit from the shareholder value they have helped to create over the previous three years.
|
| Annual report and accounts 2024 Pearson plc 126 |
|
Strategic report |
Governance report |
Financial statements |
Other information | |||||
|
|
||||||||
Remuneration Report for 2024
Certain parts of this report have been audited, as required by the Large and Medium-sized Companies and Groups (Accounts and Reports) Regulations 2008 as amended. The tables subject to audit are marked with an asterisk.
Executive Director ‘single-figure’ remuneration*
The remuneration received by Executive Directors for the financial years ended 31 December 2024 and 31 December 2023 is set out below. The Committee considers that the Directors’ Remuneration Policy operated as intended during 2024.
| Omar Abbosh1 £000s |
Sally Johnson £000s |
Andy Bird2 $000s |
||||||||||||||||||||||
| 2024 | 2023 | 2024 | 2023 | 2024 | 2023 | |||||||||||||||||||
| Base salary | 982 | – | 570 | 552 | 25 | 1,282 | ||||||||||||||||||
| Allowances and benefits | 37 | – | 16 | 16 | 9 | 466 | ||||||||||||||||||
| Retirement benefits | 157 | – | 91 | 88 | 4 | 205 | ||||||||||||||||||
| Total fixed pay | 1,176 | – | 677 | 656 | 38 | 1,953 | ||||||||||||||||||
| Annual incentives | 1,878 | – | 735 | 947 | 48 | 3,299 | ||||||||||||||||||
| Long-term incentives | – | – | 1,565 | 1,373 | 3,223 | 3,669 | ||||||||||||||||||
| Buy-out award3 | 13,276 | – | – | – | – | – | ||||||||||||||||||
| Co-investment award | – | – | – | – | – | 5,298 | ||||||||||||||||||
| Total variable pay | 15,154 | – | 2,300 | 2,320 | 3,271 | 12,266 | ||||||||||||||||||
| Total remuneration | 16,330 | – | 2,977 | 2,976 | 3,309 | 14,219 | ||||||||||||||||||
| 1. | Omar Abbosh was appointed Chief Executive on 8 January 2024. |
| 2. | Andy Bird stepped down as Chief Executive and as an Executive Director on 7 January 2024 and retired from Pearson on 31 March 2024. The amounts shown above for fixed pay and annual incentive in respect of 2024 reflect his services as an Executive Director. Andy Bird was paid in USD. |
| 3. | The full value of Omar Abbosh’s buy-out award is included in the single-figure of remuneration for 2024 as required by the disclosure regulations. However it comprises elements that will not be recieved until 2025 and 2026, therefore a total remuneration figure including only those elements received in respect of 2024 has also been included below for greater transparency. See page 129 for full detail of Omar Abbosh’s buy-out awards. |
Supplementary Disclosure - Omar Abbosh’s 2024 Remuneration
The single-figure table above reflects the statutory basis for disclosure, but the figure set out below better represents Omar Abbosh’s 2024 remuneration, including the awards that he has received to date.
| Omar Abbosh £000s |
||||
| Total remuneration (excl. buy-out only receivable in 2025 and 2026) | 7,645 | |||
Notes to single-figure table*
Allowances and benefits
Travel benefits comprise car allowance and reimbursements of a taxable nature resulting from business travel and engagements. Health benefits comprise healthcare, health assessment and dental care. Risk-related benefits comprise life and other insurance policies. Accommodation benefits for Andy Bird relate to a contribution towards the rental costs of an apartment in New York used for business purposes. In addition to these allowances and benefits, Executive Directors may also participate in company benefit or policy arrangements that have no taxable value and/or are available to all other colleagues in the same location. Sally Johnson’s life cover is arranged under an excepted policy on a similar basis to other employees who were affected by the lifetime allowance and have opted out of the Pearson Pension Plan.
Retirement benefits and entitlements*
Omar Abbosh and Andy Bird (until his retirement) received a payment in lieu of pension at 16% of their base salary, in line with the pension provision for UK employees of a similar age.
From 1 October 2022, Sally Johnson began receiving payments in lieu of pension at 16% of her base salary, in line with the pension provision for UK employees of a similar age. Prior to October 2022, Sally Johnson was a member of the Final Pay section of the Pearson Pension Plan, where the pension accrual rate was 1/60th of pensionable salary per annum, restricted to the Plan’s earnings cap. No further accrual will apply.
Details of the Executive Directors’ pension-related benefits in 2024 are as follows:
| Omar Abbosh £000s |
Sally Johnson £000s |
Andy Bird $000s |
||||||||||||||||||
| Other allowances in lieu of pension | 157 | 91 | 4 | |||||||||||||||||
| Accrued pension at 31 December 2024 | – | 69 | – | |||||||||||||||||
Note 1: Other allowances in lieu of pension represent the cash allowances paid.
Note 2: The accrued pension at 31 December 2024 is the deferred pension at 30 September 2022 (the date accrual for the pension ceased) revalued to 31 December 2024 in line with the Plan rules. It relates to the pension payable from the UK Plan. Normal retirement age is 62.
| Annual report and accounts 2024 Pearson plc 127 |
|
Strategic report |
Governance report |
Financial statements |
Other information | |||||
| Directors’ Remuneration Report continued |
||||||||
Annual Incentive Plan (AIP) – outcome for 2024*
The 2024 AIP was based on a mix of financial (90% weighting) and strategic measures (10% weighting). The following table summarises the performance targets (presented on a consistent basis to the actual results, considering portfolio and currency movements) and performance against these targets, which resulted in a 64% of maximum payout.
| Performance range | Payout | |||||||||||||||||||||||
| % of total | Threshold (25%) |
Target (50%) |
Maximum (100%) |
Actual results | % of max bonus opportunity |
|||||||||||||||||||
| Adjusted operating profit | 40% | £555m | £565m | £655m | £600m | 28% | ||||||||||||||||||
| Sales | 30% | £3,535m | £3,560m | £3,765m | £3,552m | 13% | ||||||||||||||||||
| Free cash flow | 20% | £390m | £400m | £475m | £490m | 20% | ||||||||||||||||||
| Strategic measures | 10% | See below | 3% | |||||||||||||||||||||
| 100% | 64% | |||||||||||||||||||||||
The targets and outcomes for the strategic measure are shown in the table below.
| Strategic priority | Weighting | Threshold | Target | Maximum | Outcome | |||||
| Invest in diverse pipeline and increase BIPOC/BAME representation at all manager levels |
10% | 2% increase + maintain overall gender parity as an underpin |
5% increase |
10% increase | Achieved 2.3% increase & maintained overall gender parity | |||||
Note 1: Internal Audit provided an independent assessment of the result for the Committee.
For Omar Abbosh and Andy Bird, their maximum AIP opportunity for 2024 was pro-rated to reflect the period of service during the bonus year. For Andy Bird, the value shown in the single-figure table represents the portion of the year for which he served as an Executive Director.
Long-term Incentive Plan (LTIP) – vesting outcome for 2024*
The 2022 LTIP award was subject to performance conditions assessed to 31 December 2024. Performance targets were partially met, resulting in the award vesting at 75.3% of maximum. Vested shares are subject to an additional two-year holding period.
The targets and performance against these targets are as follows:
| Performance range | Vesting | |||||||||||||||||||||||||||||||||||||||
| % of total |
Threshold | Stretch | Maximum | Payout at threshold |
Payout at stretch |
Payout at maximum |
Actual | Percentage achievement |
Percentage of total award |
|||||||||||||||||||||||||||||||
| Adjusted EPS | 33.3% | 50.2p | 57.2p | 66.2p | 15% | 65% | 100% | 62.1p | 84.1% | 28.0% | ||||||||||||||||||||||||||||||
| Net ROIC | 33.3% | 6.0% | 7.0% | 8.0% | 15% | 65% | 100% | 6.5% | 41.9% | 14.0% | ||||||||||||||||||||||||||||||
| Relative TSR | 33.3% | Median | – | |
Upper quartile |
|
25% | – | 100% | |
Ranked 9 out of 92 |
|
100% | 33.3% | ||||||||||||||||||||||||||
| 100% | Total | 75.3% | ||||||||||||||||||||||||||||||||||||||
The Adjusted EPS target range was adjusted to reflect the impact on the vesting outcome of share buybacks over the performance period.
Relative TSR was measured against the constituents of the FTSE 100 at the start of the performance period.
Omar Abbosh did not participate in the 2022 LTIP. For Andy Bird, as described in last year’s report, his award was reduced pro-rata to reflect time served during the performance period. The value shown in the single-figure table represents the proportion of the vested award for which he served as an Executive Director.
The 2022 LTIP award was granted on 3 May 2022, based on a share price of 779.4p (five-day average to 3 May 2022). The value of the 2022 LTIP included in the single-figure table is based on a three-month average ADR / share price to 31 December 2024 of $14.91 / 1166p. The LTIP values include dividend equivalent amounts of $225k and £86k for Andy Bird and Sally Johnson respectively. The proportion of the 2022 LTIP attributable to share price growth is $880k for Andy Bird and £490k for Sally Johnson. The Remuneration Committee did not exercise discretion in respect of this share price appreciation.
The value of the 2021 LTIP reported in last year’s report for Andy Bird ($3,482k) and Sally Johnson (£1,310k) were estimates based on the three-month average ADR / share price to 31 December 2023 ($11.63 / 937.0p). The actual values of the 2021 LTIP on the 1 May 2024 vesting date were $3,669k and £1,373k, respectively, based on a closing ADR / share price of $12.07 / 967.4p.
| Annual report and accounts 2024 Pearson plc 128 |
|
Strategic report |
Governance report |
Financial statements |
Other information | |||||
|
|
||||||||
Long-term incentives awarded in 2024*
The following LTIP awards were granted during the year:
| Director | Date of award |
Vesting date |
Number of shares |
Face value |
Face value (% of base salary) |
Value for threshold performance (% of maximum)1 |
Performance period |
|||||||||||||||||||||
| Omar Abbosh |
1 May 2024 | 1 May 2027 | 455,614 | £ | 4,500,008 | 450% | 20% | |
1 Jan 24 – 31 Dec 26 |
| ||||||||||||||||||
| Sally Johnson |
1 May 2024 | 1 May 2027 | 174,348 | £ | 1,722,000 | 300% | 20% | |
1 Jan 24 – 31 Dec 26 |
| ||||||||||||||||||
The face value was determined using a share price of 987.68p, representing the five-day average up to and including 30 April 2024, which is the same as the approach used for the wider employee population.
The performance measures and targets for this award are as follows:
| % of total | Threshold (20% vesting) |
Maximum (100% vesting) | ||||
| Adjusted EPS (in FY26) |
30% | 63p | 82p | |||
| Return on Capital |
30% | 10.3% | 13.0% | |||
| Relative TSR |
30% | Median | Upper quartile | |||
| ESG – Gender diversity |
5% | Improve gender representation at leadership levels overall vs 2023 (VP and above) | Achieve gender parity at leadership levels in aggregate (VP and above) | |||
| ESG – Carbon reduction |
5% | 4% reduction vs 2023 | 13% reduction vs 2023 | |||
Note 1: Vesting is on a straight-line basis between Threshold and Maximum.
Note 2: 2024 LTIP targets have been set at an USD:GBP exchange rate of 1.27.
Note 3: Relative TSR will be assessed half against the FTSE 100 and half against the S&P 500. Companies within financial services, energy, basic materials, utilities and healthcare sectors will be excluded from both TSR groups.
Note 4: The carbon reduction targets are based on the long-term trajectory required to meet (Threshold) or substantially exceed (Maximum) our 2030 carbon reduction ambitions. Performance will be measured from a baseline of 2023, therefore requiring incremental performance to that delivered to date.
The Committee reserves the right to adjust pay-outs up or down before they are released, if it believes the vesting outcome does not reflect underlying financial or non-financial performance, or for other exceptional factors. In making any adjustments, the Committee are guided by the principle of aligning shareholder and management interests.
Any shares vesting based on performance to 31 December 2026 will be subject to an additional two-year holding period to 1 May 2029.
Chief Executive buy-out awards*
As disclosed in last year’s report, a buy-out was required to compensate Omar Abbosh for remuneration he forfeited as a result of resigning from his previous role at Microsoft. The buy-out was made on a ‘like-for-like’ basis in accordance with Pearson’s Remuneration Policy.
The buy-out consisted of two elements:
| • | A cash payment in lieu of his forfeited annual cash bonus covering the six months between the end of his prior employer’s financial year end and the beginning of his eligibility for Pearson’s AIP in 2024; and |
| • | Awards of restricted shares of equivalent value to the forfeited Microsoft shares which vest annually in three equal tranches aligned with the timing of the forfeited awards. The vesting of each tranche is conditional on continued employment as at each vesting date. Any shares which vest will be subject to a holding period lasting up to the vesting date of the final tranche (31 December 2026). The award also attracts dividend equivalent awards. |
| Director | Date of award |
Number of shares |
Face value | Vesting date | End of holding period for vested awards | |||||
| One-third on 31 December 2024 | ||||||||||
| Omar Abbosh – |
9 April | One-third on 31 December 2025 | 31 December | |||||||
| buy-out award |
2024 | 1,378,942 | £13,026,724 | One-third on 31 December 2026 | 2026 | |||||
The face value in the table was determined using a Pearson share price of 944.69p.
The value disclosed in the single-figure table therefore comprises the following:
| Cash payment in respect of forfeited annual cash bonus |
£249k | |||
| Grant date value of the restricted share awards |
£13,027k | |||
| Value disclosed in single-figure table |
£13,276k | |||
The Committee acknowledges the relative size of the buy-out award in the context of the UK market, but notes that it is equivalent to the value Omar would have received had he continued in his previous role at Microsoft, which is reflective of the quantum of remuneration packages (particularly long-term equity) for global leaders of Omar’s calibre in companies in our key talent markets. Additionally, the restricted share award creates immediate alignment with shareholders and fulfils Omar’s shareholding guidelines.
| Annual report and accounts 2024 Pearson plc 129 |
|
Strategic report |
Governance report |
Financial statements |
Other information | |||||
| Directors’ Remuneration Report continued |
||||||||
Directors’ interests in shares and value of shareholdings*
Shareholding guidelines
Executive Directors are expected to build up a substantial shareholding in Pearson, in line with our policy of encouraging widespread employee share ownership, and to align the interests of Executive Directors and shareholders.
Following the significant increases introduced by the current Directors’ Remuneration Policy, the current shareholding guideline is 450% of base salary for the Chief Executive and 300% of base salary for the Chief Financial Officer.
Shares that count towards these guidelines include any shares held unencumbered by an Executive Director, their spouse and/or dependent children, plus any shares vested but held pending release under a share plan, and any shares unvested but not subject to future performance conditions (on a net of tax basis). Executive Directors have five years from their date of appointment to the Board to reach the guideline. Once the guideline is met, it is not re-tested, other than when shares are sold.
As part of the year-end process, the Committee assessed the level of shareholding against the guideline in accordance with our shareholding policy and confirmed that the guideline was met for both Omar Abbosh and Sally Johnson. At the point of standing down from the Board, Andy Bird had also met his shareholding guideline.
Executive Directors are expected to retain their current shareholding guideline (or actual shareholding if lower) for two years following stepping down as an Executive Director. This guideline does not apply to shares purchased by the Executive Director.
Shareholding guidelines do not apply to the Chair, Deputy Chair and Senior Independent Director and Non-Executive Directors. However, a minimum of 25% of the Chair, Deputy Chair and Senior Independent Director and Non-Executive Directors’ basic fee is paid in Pearson shares, which the Chair, Deputy Chair and Senior Independent Director and Non-Executive Directors have committed to retain for the period of their directorships.
Directors’ interests
The share interests of the Directors and their connected persons are:
| Director | Current shareholding (ordinary shares) |
Conditional shares subject to performance |
Conditional shares subject to employment only |
Total number of ordinary and conditional shares |
Shareholding as % of salary |
Shareholding requirement met? |
||||||||||||||||||
| Executive Directors |
|
|||||||||||||||||||||||
| Omar Abbosh |
384,853 | 458,780 | 925,681 | 1,769,314 | 1021% | Yes | ||||||||||||||||||
| Sally Johnson |
178,482 | 554,285 | – | 732,767 | 363% | Yes | ||||||||||||||||||
| Andy Bird* |
1,010,568 | 1,316,087 | – | 2,326,655 | 1165% | Yes | ||||||||||||||||||
| Non-Executive Directors |
|
|||||||||||||||||||||||
| Omid Kordestani |
91,857 | – | – | – | - | n/a | ||||||||||||||||||
| Sherry Coutu CBE |
18,891 | – | – | – | - | n/a | ||||||||||||||||||
| Alison Dolan |
1,678 | – | – | – | - | n/a | ||||||||||||||||||
| Alex Hardiman |
2,124 | – | – | – | - | n/a | ||||||||||||||||||
| Esther Lee |
5,083 | – | – | – | - | n/a | ||||||||||||||||||
| Graeme Pitkethly |
17,248 | – | – | – | - | n/a | ||||||||||||||||||
| Tim Score* |
81,102 | – | – | – | - | n/a | ||||||||||||||||||
| Annette Thomas |
5,568 | – | – | – | - | n/a | ||||||||||||||||||
| Lincoln Wallen |
20,561 | – | – | – | - | n/a | ||||||||||||||||||
Note 1: Share interests are shown as at 31 December 2024 or where marked with an asterisk at the date of stepping down from the Board.
Note 2: Ordinary shares include both ordinary shares listed on the London Stock Exchange and American Depositary Receipts (ADRs) listed on the New York Stock Exchange.
Note 3: Conditional shares subject to performance means unvested shares, which are subject to performance conditions and continuing employment for a pre-defined period. This includes the LTIP awards granted in 2022, 2023 and 2024. For Andy Bird, these shares were pro-rated for time served on cessation of his employment.
Note 4: Conditional shares subject to employment only means unvested shares, which are subject to a holding period and / or continued employment only.
Note 5: There have been no other changes in the interests of any Director between 31 December 2024 and 7 March 2025, being the latest practicable date prior to the publication of this report.
Note 6: Shareholding as a % of salary is based on a three-month average ADR / share price to 31 December 2024 of $14.91 / 1166p.
| Annual report and accounts 2024 Pearson plc 130 |
|
Strategic report |
Governance report |
Financial statements |
Other information | |||||
|
|
||||||||
Chair, Deputy Chair and Senior Independent Director and Non-Executive Director remuneration in 2024*
The remuneration paid to the Chair, Deputy Chair and Senior Independent Director and Non-Executive Directors for the financial years ended 31 December 2024 and 31 December 2023 is set out below.
| 2024 | 2023 | |||||||||||||||||||||||
| Director £000s |
Total fees | Taxable benefits |
Total | Total fees | Taxable benefits | Total | ||||||||||||||||||
| Omid Kordestani |
500 | 22 | 522 | 500 | 34 | 534 | ||||||||||||||||||
| Tim Score |
57 | 3 | 60 | 175 | 5 | 180 | ||||||||||||||||||
| Sherry Coutu CBE |
106 | 8 | 114 | 106 | 11 | 116 | ||||||||||||||||||
| Alison Dolan |
92 | 1 | 93 | 47 | - | 47 | ||||||||||||||||||
| Alex Hardiman |
93 | 9 | 102 | 45 | 8 | 54 | ||||||||||||||||||
| Esther Lee |
88 | 7 | 95 | 88 | 16 | 104 | ||||||||||||||||||
| Graeme Pitkethly |
152 | 6 | 158 | 105 | 5 | 110 | ||||||||||||||||||
| Annette Thomas |
103 | 6 | 109 | 101 | 12 | 113 | ||||||||||||||||||
| Lincoln Wallen |
93 | 6 | 99 | 93 | 15 | 108 | ||||||||||||||||||
| Total |
1,284 | 68 | 1,352 | 1,260 | 106 | 1,367 | ||||||||||||||||||
Note 1: A minimum of 25% of the Chair, Deputy Chair and Senior Independent Director and Non-Executive Directors’ basic fee is paid in shares.
Note 2: Taxable benefits refer to travel, accommodation and subsistence expenses incurred while attending Board meetings during the period that were paid or reimbursed by the company, and which HMRC deems taxable in the UK.
Note 3: Tim Score stepped down from the Board on 26 April 2024.
Note 4: Some figures and subtotals add up to different amounts than the totals due to rounding.
Payments to former Directors*
As disclosed last year, Andy Bird was entitled to be paid for all accrued, unused paid time off upon his retirement, which amounted to $179,000. There were no other payments to former Directors in 2024, other than those set out in the single-figure table and disclosed in a previous Directors’ Remuneration Report.
Payments for loss of office*
Andy Bird stepped down as Chief Executive and as an Executive Director of Pearson plc on 7 January 2024 and retired from Pearson on 31 March 2024. The remuneration arrangements in respect of his retirement were disclosed in detail in last year’s report. There were no other payments for loss of office made to or agreed for Directors in 2024.
Service contracts
Terms and conditions of our Directors’ appointments are available for inspection at our registered office during normal business hours and at the AGM. So that appropriate arrangements can be made for shareholders wishing to inspect documents, we request that shareholders contact the Company Secretary by email at companysecretary@pearson.com in advance of any visit to ensure that access can be arranged.
The Executive Directors have notice periods in their service contracts of 12 months from the company and six months from the Executives.
The Deputy Chair and Senior Independent Director and Non-Executive Directors serve Pearson under letters of appointment, which are renewed annually and do not have service contracts. The Deputy Chair and Senior Independent Director and Non-Executive Directors’ letters of appointment do not contain provision for notice periods or for compensation if their appointments are terminated. The Chair’s appointment may be terminated on 12 months’ notice.
Executive Directors’ Non-Executive directorships
Our current Executive Directors hold the following external commitments: Sally Johnson is a Non-Executive Director of Rentokil Initial plc and Chair of its Audit Committee.
| Annual report and accounts 2024 Pearson plc 131 |
|
Strategic report |
Governance report |
Financial statements |
Other information | |||||
| Directors’ Remuneration Report continued |
||||||||
Historical performance and remuneration
Total shareholder return performance
Set out below is Pearson’s total shareholder return (TSR) performance, relative to the FTSE All-Share index, on an annual basis over the 10-year period 1 January 2015 to 31 December 2024. We chose this comparison because the FTSE All-Share represents the broad market index within which Pearson shares are traded. TSR is a measure of returns a company provides for shareholders, reflecting share price movements and assuming reinvestment of dividends. Opposite this is a summary of the single figure of total remuneration, and variable pay outcomes, for the Chief
Executive over the same 10-year period.
For additional context, the same data is presented over the period from 1 January 2020, broadly corresponding with Pearson’s transformation from an analogue to a digital-first business.
Total Shareholder Return since 2014

LSEG Workspace Datastream

Source: LSEG Workspace Datastream
This graph shows the value, by 31 December 2024, of £100 invested in Pearson on 1 January 2020, compared with the value of £100 invested in the FTSE All-Share on the same date
| John | Andy | Omar | ||||||||||||||||||||||||||||||||||||||||||||||||||||||
| Fallon | Bird | Abbosh | ||||||||||||||||||||||||||||||||||||||||||||||||||||||
| 2015 | 2016 | 2017 | 2018 | 2019 | 2020 | 2020 | 2021 | 2022 | 2023 | 2024 | 2024 | |||||||||||||||||||||||||||||||||||||||||||||
| Total remuneration (single figure, £000s) |
1,263 | 1,518 | 1,758 | 3,094 | 1,616 | 855 | 334 | 5,167 | 6,856 | 11,419 | 2,588 | 16,330 | ||||||||||||||||||||||||||||||||||||||||||||
| Annual incentive (% of maximum) |
Nil | 24% | 44% | 45% | Nil | Nil | N/A | 63% | 76% | 85% | 64% | 64% | ||||||||||||||||||||||||||||||||||||||||||||
| Long-term incentive (% of maximum) |
Nil | Nil | Nil | 42% | 33% | Nil | N/A | N/A | N/A | 85% | 75% | – | ||||||||||||||||||||||||||||||||||||||||||||
Note 1: Total remuneration is as reflected in the single-total figure of remuneration table.
Note 2: Annual incentive is the actual annual incentive received by the incumbent as a percentage of maximum opportunity.
Note 3: Long-term incentive is the payout of performance-related share awards where the year shown is the final year of the performance period for the purposes of calculating the single total figure of remuneration.
Note 4: The single-figure remuneration for Andy Bird has been converted using the average USD:GBP exchange rate for the relevant period.
Dilution and use of equity
Awards under Pearson’s various share plans can be satisfied using existing shares bought in the market, treasury shares or newly issued shares. For restricted stock awards under the LTIP, we would expect to use market-purchased shares. There are limits on the amount of new-issue equity that can be used: In any rolling 10-year period, no more than 10% of Pearson equity will be issued, or be capable of being issued, under all Pearson’s share plans, and no more than 5% of Pearson equity will be issued, or be capable of being issued, under executive or discretionary plans.
The current dilution from all Pearson plans, executive or discretionary, and shares held in trust is as follows:
| Dilution | 2024 | |||
| All Pearson plans | 2.4% | |||
| Executive or discretionary plans | 0.4% | |||
| Shares held in trust | 0.1% | |||
| Annual report and accounts 2024 Pearson plc 132 |
|
Strategic report |
Governance report |
Financial statements |
Other information | |||||
|
|
||||||||
Comparative information
The following information provides additional context regarding Directors’ total remuneration.
Relative percentage change in remuneration of Directors and employees
The following table sets out the year-on-year percentage change in base salary/fees, allowances and benefits and annual incentives in respect of all Directors during the year, compared to the average percentage change for all employees of Pearson. The figures for all Directors are calculated based on remuneration received in the relevant year as set out in the tables on page 127 and page 131. For base salary/fees, we have annualised part-year figures for this disclosure. Part-year allowances and benefits are not annualised and are excluded from the table.
While the Committee reviews base pay for the Executive Directors relative to Pearson’s broader employee population, local practices drive our approach to benefits, and we determine eligibility depending on level and individual circumstances, which do not lend themselves to comparison.
| 2024 | 2023 | 2022 | 2021 | 2020 | ||||||||||||||||||||||||||||||||||||||||||||||||||||||||
| Base | Allowances | Annual | Base | Allowances | Annual | Base | Allowances | Annual | Base | Allowances | Annual | Base | Allowances | Annual | ||||||||||||||||||||||||||||||||||||||||||||||
| salary/fees | and benefits | Incentives | salary/fees | and benefits | Incentives | salary/fees | and benefits | Incentives | salary/fees | and benefits | Incentives | salary/fees | and benefits | Incentives | ||||||||||||||||||||||||||||||||||||||||||||||
| Average employee1 |
5% | 12% | -5% | 2% | 6% | 22% | 4% | 8% | 16% | 4% | 17% | 38% | 1% | 6% | 9% | |||||||||||||||||||||||||||||||||||||||||||||
| Executive Directors |
||||||||||||||||||||||||||||||||||||||||||||||||||||||||||||
| Omar Abbosh |
– | – | – | – | – | – | – | – | – | – | – | – | – | – | – | |||||||||||||||||||||||||||||||||||||||||||||
| Sally Johnson |
3% | 0% | -22% | 4% | 1% | 37% | 2.5% | 0% | 24% | 1% | – | – | – | – | – | |||||||||||||||||||||||||||||||||||||||||||||
| Andy Bird |
0% | – | – | 3% | 4% | 74% | 0% | 20% | 21% | 0% | – | – | – | – | – | |||||||||||||||||||||||||||||||||||||||||||||
| Chair and Non-Executive Directors2 |
|
|||||||||||||||||||||||||||||||||||||||||||||||||||||||||||
| Omid Kordestani |
0% | -35% | – | 0% | 78% | – | – | – | – | – | – | – | – | – | – | |||||||||||||||||||||||||||||||||||||||||||||
| Tim Score |
2% | -51% | – | 7% | 73% | – | 25% | – | – | 13% | – | – | 0% | -20% | – | |||||||||||||||||||||||||||||||||||||||||||||
| Sherry Coutu CBE |
0% | -24% | – | 6% | 119% | – | 9% | – | – | 5% | – | – | 5% | – | – | |||||||||||||||||||||||||||||||||||||||||||||
| Alison Dolan |
14% | – | – | – | – | – | – | – | – | – | – | – | – | – | – | |||||||||||||||||||||||||||||||||||||||||||||
| Alex Hardiman |
19% | -39% | – | – | – | – | – | – | – | – | – | – | – | – | – | |||||||||||||||||||||||||||||||||||||||||||||
| Esther Lee |
0% | -52% | – | 3% | 122% | – | – | – | – | – | – | – | – | – | – | |||||||||||||||||||||||||||||||||||||||||||||
| Graeme Pitkethly |
44% | 22% | – | 8% | 23% | – | 5% | – | – | 1% | – | – | 8% | – | – | |||||||||||||||||||||||||||||||||||||||||||||
| Annette Thomas |
2% | -51% | – | 12% | 102% | – | 7% | – | – | – | – | – | – | – | – | |||||||||||||||||||||||||||||||||||||||||||||
| Lincoln Wallen |
0% | -60% | – | 0% | 154% | – | 0% | – | – | 1% | – | – | 1% | -97% | – | |||||||||||||||||||||||||||||||||||||||||||||
Note 1: The average employee pay figure is impacted by changes in headcount (17,024 employees for 2024 vs 18,360 in 2023). Actual merit increase budgets for 2024 were 3% in the UK and 3.5% in the US.
Note 2: Changes in Non-Executive Director fees during the year are a result of changes in Committee Chairs and membership. Allowances and benefits for the Chair and Non-Executive Directors refer to travel, accommodation and subsistence expenses incurred while attending Board meetings that were paid or reimbursed by the company, and which HMRC deems taxable in the UK. In 2020 and 2021, the impact of the coronavirus pandemic meant that there were very few in-person Board meetings, and as such the benefits figures for these years were negligible. This also meant that for 2022 there is no comparative percentage, as the value in the prior year was zero.
| Annual report and accounts 2024 Pearson plc 133 |
|
Strategic report |
Governance report |
Financial statements |
Other information | |||||
| Directors’ Remuneration Report continued |
||||||||
Chief Executive to employee pay ratio
The table below illustrates the ratio of Chief Executive to employee pay for 2024. We use the single total figure of remuneration, compared to the full-time equivalent total reward of employees whose pay is ranked at the 25th, 50th and 75th percentiles (as identified by the gender pay gap methodology) in Great Britain’s (GB) workforce.
| Chief Executive pay ratio | ||||||||
| Year | Method | 25th percentile | 50th percentile | 75th percentile | ||||
| 2024 | B: Gender pay gap methodology | 534.3 | 354.9 | 228.4 | ||||
| B. Gender pay gap methodology | ||||||||
| 2024 | (Omar Abbosh 2024 remuneration) | 289.0 | 192.0 | 123.5 | ||||
| 2023 | B: Gender pay gap methodology | 304.0 | 209.9 | 148.5 | ||||
| 2022 | B: Gender pay gap methodology | 214.3 | 181.3 | 117.2 | ||||
| 2021 | B: Gender pay gap methodology | 150.1 | 145.0 | 88.4 | ||||
| 2020 | B: Gender pay gap methodology | 42.5 | 31.9 | 19.5 | ||||
| 2019 | B: Gender pay gap methodology | 65.9 | 47.2 | 36.0 | ||||
| • | We used GB gender pay gap data from April 2024 to identify employees at the 25th, 50th and 75th percentiles, and analysed data for employees around each quartile figure to ensure there were no anomalies. |
| • | Using the gender pay gap data to identify the employees at each pay quartile gives a general representation of the relevant employee population at the year end, and is the most practicable methodology given the timing of the disclosure and determination of remuneration outcomes for the wider workforce. |
| • | For the employees at each pay quartile, we calculated total remuneration on a similar basis to the Chief Executive’s single figure. We based base salary, pension and benefits on full-year figures taken from payroll. Annual bonus figures are based on the relevant manager recommendations and relate to performance in 2023. None of the employees at the 25th, 50th or 75th percentile had share awards vesting in 2024. |
| • | Total remuneration figures for the 25th, 50th and 75th percentile employees are: £35,407, £53,304 and £82,835. The respective base salaries are: £32,000, £43,000 and £61,800. |
| • | We compared total remuneration for each of the identified employees, calculated with reference to 31 December 2024, compared to the sum of Omar Abbosh and Andy Bird’s 2024 remuneration as per the single-figure table on page 127. |
| • | For 2024, in order to maximise the comparability of the figures, we have also provided the single-figure for Omar Abbosh, with only the value of the buy-out award released to him in 2024 included. As the full value of the buy-out award is required to be included in the single-figure for 2024 (despite awards only being released to Omar Abbosh over the three-year period from 2024 to 2026), using the headline sIngle-figure numbers necessarily results in a higher pay ratio than if calculated by reference to the remuneration actually received by the CEO in respect of 2024. In addition, the statutory basis for the 2024 pay ratio requires the figure for CEO remuneration to be the sum of Omar Abbosh and Andy Bird’s 2024 remuneration, which is not representative of the pay received by any single individual. |
| • | A significant proportion of the Chief Executive’s pay is linked to performance and, in respect of any LTIP award, share price performance. Therefore, the Chief Executive’s pay can vary significantly year-on-year, based on company performance. The increase in the pay ratio for 2024 is driven by the requirement to add the remuneration received by Andy Bird and Omar Abbosh together, along with the inclusion of the full grant date value of Omar Abbosh’s buy-out award in the 2024 single-figure, which, as noted above is not reflective of remuneration actually received. |
| • | The median pay ratio is consistent with our wider policies on employee pay, reward and progression. The Committee is focused on ensuring that remuneration for all Pearson colleagues reflects our need to attract and retain the right talent for our digital future. |
Relative importance of pay spend
The Committee considers Directors’ remuneration in the context of the company’s allocation and disbursement of resources to different stakeholders. Adjusted operating profit measures Pearson’s ability to reinvest, and dividends are an important element of our return to shareholders.
| 2024 |
Headline change | |||||||||||||||
| All figures in £ | 2023 | £m | % | |||||||||||||
| Adjusted operating profit | 600 | 573 | 27 | 5% | ||||||||||||
| Dividends | 156 | 155 | 1 | 1% | ||||||||||||
| Dividend per share | 24.0p | 22.7p | 1.3p | 6% | ||||||||||||
| Share buybacks1 | 318 | 186 | 132 | 71% | ||||||||||||
| Total wages and salaries2 | 1,188 | 1,252 | (64) | (5)% | ||||||||||||
Note 1: The Board approved a £300m share buyback programme in September 2023 with an extension of £200m announced 1 March 2024.
Note 2: Wages and salaries include continuing operations only and include Directors. Average employee numbers for continuing operations for 2024 were 17,024 (2023:18,360), hence the year-on-year negative movement in overall spend. Further details are set out in Note 5 to the financial statements on page 174.
| Annual report and accounts 2024 Pearson plc 134 |
|
Strategic report |
Governance report |
Financial statements |
Other information | |||||
|
|
||||||||
The Remuneration Committee in 2024
| Role | Name | Title | ||
| Chair | Sherry Coutu CBE | Independent Non-Executive Director | ||
| Members | Alison Dolan* | Independent Non-Executive Director | ||
| Esther Lee | Independent Non-Executive Director | |||
| Tim Score* | Deputy Chair and SID | |||
| Annette Thomas | Independent Non-Executive Director | |||
| Internal attendees | Omid Kordestani | Chair | ||
| Omar Abbosh | Chief Executive | |||
| Sally Johnson | Chief Financial Officer | |||
| Ali Bebo | Chief Human Resources Officer | |||
| Paul Christian | Senior Vice President, Reward | |||
| Graeme Baldwin | Company Secretary | |||
| External advisers | Alvarez & Marsal | |||
*Alison Dolan joined the Committee on 1 April 2024 and Tim Score stepped down on 26 April 2024.
No individual is present when their own remuneration is discussed.
Advisers to the Remuneration Committee
During 2024, the Remuneration Committee received advice from Alvarez & Marsal (“A&M”), our independent Remuneration Committee advisers. A&M were appointed by the Committee in 2023, following a formal tender process. A&M advises the Committee on market trends and developments, incentive plan design and target setting, investor engagement and other general executive remuneration matters. For provision of these services in 2024, A&M were paid fees of £102,250 (excluding VAT), based on time spent. A&M does not provide any other services to Pearson. A&M is a member of the Remuneration Consultants’ Group and adheres to its Code of Conduct. The Committee is satisfied that A&M’s advice was objective and independent. The Committee believes that the A&M engagement partner and team do not have any connections with Pearson or its Directors that may impair its independence.
Terms of reference
The Committee’s full charter and terms of reference are available on the Governance page of our website. A summary of the Committee’s responsibilities is set out on the right of this page. The terms of reference reflect the provisions of the UK Corporate Governance Code.
Committee responsibilities
Determine and review policy
Determine and regularly review the remuneration policies for the Executive Directors, Presidents and other members of Pearson’s Executive Management team who report directly to the Chief Executive. These policies include base salary, annual and long-term incentives, pension arrangements, any other benefits and termination of employment. When setting the Remuneration Policy, the Committee considers remuneration practices and related policies for all employees.
Shareholder engagement
Ensure Pearson engages with its shareholders and shareholder representative bodies on the Remuneration Policy and its implementation.
Review and approve implementation
Regularly review the implementation and operation of the Remuneration Policy, and approve the individual remuneration and benefits packages of Pearson’s Executive Management team, including Executive Directors.
Approve performance-related plans
Approve the design of, and determine targets for, any performance-related pay plans operated by the Group for Pearson’s Executive Management team, and approve total payments to be made under such plans.
Set termination arrangements
Advise and decide on general and specific remuneration arrangements in connection with the termination of employment of Pearson’s Executive Management team, including Executive Directors.
Determine Chair’s remuneration
Delegated responsibility for determining the Chair’s remuneration and benefits package.
Appoint remuneration consultants
Appoint and set the terms of engagement for any remuneration consultants who advise the Committee, and monitor the cost of such advice.
Talent, retention and gender pay gap
Review updates from management on talent, retention and gender pay gap.
Workforce remuneration
Have oversight of workforce remuneration, policies and practice for the wider organisation.
| Annual report and accounts 2024 Pearson plc 135 |
|
Strategic report |
Governance report |
Financial statements |
Other information | |||||
| Directors’ Remuneration Report continued |
||||||||
Remuneration Committee meeting focus during 2024
During the year, the Committee undertook the following activities:
| • | Reviewed and approved annual and long-term performance and payouts to Executive Directors and senior management for 2023 |
| • | Reviewed and approved incentive arrangements for Pearson, and how these will apply to Executive Directors and senior management in 2024. |
| • | Approved the 2023 Directors’ Remuneration Report. |
| • | Engaged extensively with shareholders in advance of and following the 2024 AGM to understand the views of shareholders (further detail on this is set out on page 121). |
| • | Reviewed and considered all feedback received from shareholder engagement exercises as part of the Committee’s discussions and considered ongoing shareholder engagement strategy. |
| • | Received updates on Pearson’s financial performance and progress against strategic measures. Noted and reviewed the status of in-flight incentives. |
| • | Received updates on pay and conditions across Pearson, and took these into account when determining executive remuneration. |
| • | Noted updates on corporate governance, including a review of the 2024 AGM remuneration reporting season, and anticipated areas of focus in 2025. |
| • | Reviewed Pearson’s UK gender and ethnicity pay gap disclosures and noted actions to address the respective gaps. |
| • | Noted the activity of the Standing Committee on operating Pearson’s equity-based reward programmes and noted Pearson’s use of equity for employee share plans. |
| • | Evaluated the Remuneration Committee’s effectiveness and reviewed the Committee’s Terms of Reference. |
Committee performance review
The Committee undertakes an annual process to review its performance and effectiveness. For 2024, the Committee performance review was conducted by way of a tailored questionnaire. The process sought views on an anonymous basis from Committee members, the Chief Executive and Chair of the Board, together with other key contributors to the Committee, including the Chief Financial Officer, Chief Human Resources Officer, SVP Reward and external adviser. Topics covered in the performance review included the effectiveness of the Committee, the Committee’s oversight of key areas within its remit, the quality of papers and meeting discussions and the relationships between the Committee and management.
Overall, the Committee was considered to be operating effectively with appropriate meeting focus, papers produced to a good standard and an open atmosphere for high quality discussions, challenge and debate. The composition of the Committee is appropriate and includes the necessary skills. The review recognised the quality of the process to appoint Alvarez & Marsal as independent advisers to the Committee and the positive impact they have on meeting discussions and the development of the remuneration strategy. There was acknowledgement of the ongoing focus needed on the evolution of the company’s strategy and business model and how this impacts remuneration discussions and decisions. In 2025, the Committee will continue to focus on ensuring remuneration arrangements for senior management and the wider workforce support the attraction and retention of key talent as well as the delivery of Pearson’s strategy. The Committee assesses how its activities support and enable Pearson’s progress.
The Directors’ Remuneration Report has been approved by the Board on 13 March 2025 and signed on its behalf by:
Sherry Coutu, CBE
Chair of Remuneration Committee
Voting on remuneration resolutions
The following table summarises votes cast for remuneration resolutions:
| % of votes | % of votes | Votes | ||||||||||||||||||
| Votes cast for | cast for | Votes cast against | cast against | withheld | ||||||||||||||||
| Annual Report on Remuneration (2024 AGM) |
371,925,459 | 69.83% | 160,714,355 | 30.17% | 211,473 | |||||||||||||||
| Directors’ Remuneration Policy (2023 AGM) |
299,899,081 | 53.63% | 259,251,476 | 46.37% | 223,851 | |||||||||||||||
| Annual report and accounts 2024 Pearson plc 136 |
|
Strategic report |
Governance report |
Financial statements |
Other information | |||||
| Additional disclosures |
||||||||
The Directors’ report for the year ended 31 December 2024 is on pages 68-141 of this document.
Set out below is other statutory and regulatory information that Pearson is required to disclose in its Directors’ report.
Going concern
The Directors have confirmed that there are no material uncertainties that cast doubt on the Group’s going concern status and that they have a reasonable expectation that the Group has adequate resources to continue in operational existence beyond 30 June 2026. The consolidated financial statements have therefore been prepared on a going concern basis.
Further details on the procedures undertaken may be found on page 164.
Viability statement
The Board assessed the prospects of the company using the company’s long-range plan. Viability was assessed by considering downside scenarios. Based on the result of these procedures and considering the company’s strong balance sheet, the Directors have a reasonable expectation that Pearson will be able to continue in operation and to meet its liabilities as they fall due over the five-year period ending 31 December 2029. Further details may be found on page 67.
Share capital
Details of share issues and cancellations are given in note 27 to the financial statements on page 199. The company has a single class of shares which is divided into ordinary shares of 25p each. The ordinary shares are in registered form. As at 31 December 2024, 666,264,831 ordinary shares were in issue. At the AGM held on 26 April 2024, the company was authorised, subject to certain conditions, to acquire up to 68,659,005 ordinary shares by market purchase and to issue up to 457,726,702 ordinary shares. Shareholders will be asked to renew these authorities, subject to revised caps, at the AGM on 2 May 2025.
As at 10 March 2025, 2,211 record holders with registered addresses in the United States held 27,880,480 ADRs which represented 4.18% of the company’s outstanding ordinary shares. Some of these ADRs are held by nominees and so these numbers may not accurately represent the number of shares beneficially owned in the United States.
Share buyback
On 21 September 2023, the company launched a £300m share buyback programme, while a further £200m extension was announced by the company on 1 March 2024. The £300m programme completed on 7 March 2024 and approximately 32m shares were bought back and cancelled at a cost of £300m. The nominal value of these shares, approximately £8m, was transferred to the capital redemption reserve. The £200m extension commenced on 8 March 2024 and completed on 8 August 2024. Under the £200m extension, approximately 20m shares were bought back and cancelled at a cost of £200m. The nominal value of these shares, approximately £5m, was transferred to the capital redemption reserve.
On 28 February 2025, the company announced its intention to launch a £350m share buyback programme during 2025. The repurchased shares will be cancelled and the nominal value of the shares will be transferred to the capital redemption reserve.
The Board believes that the company’s strategic priorities, combined with the disciplined approach to capital allocation, will enable Pearson to create sustainable, long-term value for every stakeholder.
We have set out clear capital allocation priorities as follows:
| • | Maintaining a strong balance sheet and solid investment-grade credit ratings through an appropriate capital structure. |
| • | Focused and disciplined approach to investing in the business to accelerate growth opportunities. |
| • | Delivering shareholder returns through a progressive and sustainable dividend policy. |
| • | Returning surplus cash to shareholders as and when appropriate through buybacks or special dividends. |
Major shareholders
Information provided to the company pursuant to the Financial Conduct Authority’s Disclosure Guidance and Transparency Rules (DTR) is published on a Regulatory Information Service and on the company’s website.
As at 31 December 2024, the company had been notified under DTR 5 of the following holders of significant voting rights in its shares.
| Number of voting rights |
Percentage as at date of notification |
|||||||
| Cevian Capital II GP Limited | 85,202,977 | 12.02% | ||||||
| BlackRock, Inc.1 | 69,580,016 | 9.69% | ||||||
| Ameriprise Financial, Inc. and its group | 33,879,475 | 5.08% | ||||||
| Artisan Partners Limited Partnership | 33,783,078 | 5.04% | ||||||
| Artemis Investment Management LLP | 35,207,368 | 5.00% | ||||||
| Libyan Investment Authority2 | 24,431,000 | 3.01% | ||||||
| 1. | Includes 10,034,738 (1.38%) qualifying financial instruments to which voting rights are attached. |
| 2. | Based on notification to the company dated 7 June 2010. We have not been notified of any change to this holding since that date. Assets belonging to, or owned, held or controlled on 16 September 2011 by the Libyan Investment Authority and located outside Libya on that date, are frozen in accordance with The Libya (Sanctions) (EU Exit) Regulations 2020. |
Between 31 December 2024 and 10 March 2025, being the latest practicable date before the publication of this report, the company received a further notification under DTR 5, with the most recent position being as follows:
| Number of voting rights |
Percentage as at date of notification |
|||||||
| Ameriprise Financial, Inc. and its group | 32,863,820 | <5.00% | ||||||
Annual general meeting
The notice convening the AGM, to be held at 10:30am on Friday,
2 May 2025 at 80 Strand, London WC2R 0RL, is contained in a circular to shareholders to be dated 27 March 2025.
Registered auditors
In accordance with section 489 of the Companies Act 2006 (the Act), a resolution proposing the re-appointment of Ernst & Young LLP as auditors to the company will be proposed at the AGM, at a level of remuneration to be agreed by the Audit Committee.
| Annual report and accounts 2024 Pearson plc 137 |
|
Strategic report |
Governance report |
Financial statements |
Other information | |||||
| Additional disclosures continued |
||||||||
Amendment to Articles of Association
Any amendments to the Articles of Association of the company (the Articles) may be made in accordance with the provisions of the Act by way of a special resolution.
Rights attaching to shares
The rights attaching to the ordinary shares are defined in the
Articles. A shareholder whose name appears on the company’s register of members can choose whether their shares are evidenced by share certificates (i.e. in certificated form) or held electronically (i.e. uncertificated form) in CREST (the electronic settlement system in the UK).
Subject to any restrictions below, shareholders may attend any general meeting of the company and, on a show of hands, every shareholder (or his/her representative) who is present at a general meeting has one vote on each resolution and, on a poll, every shareholder (whether an individual or a corporation) present in person or by proxy shall have one vote for every 25p of nominal share capital held. A resolution put to the vote at a general meeting held partly by means of electronic facility or facilities shall, unless the chair of the meeting determines that it shall be decided on a show of hands, be decided on a poll. Subject to this, at any general meeting, a resolution put to the vote at the meeting shall be decided on a show of hands, unless before, or on the declaration of the result of, a vote on a show of hands, a poll is demanded. A poll can be demanded by the chair of the meeting, or by at least three shareholders (or their representatives) present in person and having the right to vote, or by any shareholders (or their representatives) present in person having at least 10% of the total voting rights of all shareholders, or by any shareholders (or their representatives) present in person holding ordinary shares on which an aggregate sum has been paid up of at least 10% of the total sum paid up on all ordinary shares. At this year’s AGM, voting will again be conducted on a poll, consistent with best practice.
Shareholders can declare a final dividend by passing an ordinary resolution but the amount of the dividend cannot exceed the amount recommended by the Board. The Board can pay interim dividends on any class of shares of the amounts and on the dates and for the periods they decide. In all cases, the distributable profits of the company must be sufficient to justify the payment of the relevant dividend.
The Board may, if authorised by an ordinary resolution of the shareholders, offer any shareholder the right to elect to receive new ordinary shares, which will be credited as fully paid, instead of their cash dividend.
Any dividend which has not been claimed for eight years after it became due for payment will be forfeited and will then belong to the company, unless the Directors decide otherwise.
If the company is wound up, the liquidator can, with the sanction of a special resolution passed by the shareholders, divide among the shareholders in specie all or any part of the assets of the company and can value assets and determine how the division shall be carried out as between the shareholders or different classes of shareholders.
The liquidator can also, with the same sanction, transfer the whole or any part of the assets to trustees upon such trusts for the benefit of the shareholders.
Voting at general meetings
Any form of proxy sent by the shareholders to the company in relation to any general meeting must be delivered to the company (via its registrars), whether in written or electronic form, not less than 48 hours before the time appointed for holding the meeting or adjourned meeting at which the person named in the appointment proposes to vote.
The Board may decide that a shareholder is not entitled to attend or vote either personally or by proxy at a general meeting or to exercise any other right conferred by being a shareholder if they or any person with an interest in shares has been sent a notice under section 793 of the Act (which confers upon public companies the power to require information with respect to interests in their voting shares) and they or any interested person failed to supply the company with the information requested within 14 days after delivery of that notice.
The Board may also decide, where the relevant shareholding comprises at least 0.25% of the nominal value of the issued shares of that class, that no dividend is payable in respect of those default shares and that no transfer of any default shares shall be registered unless the shareholder is not themself in default as regards supplying the information requested and the transfer, when presented for registration, is accompanied by a certificate from the shareholder in such form as the Board of Directors may require to the effect that after due and careful inquiry, the shareholder is satisfied that no person in default
is interested in any of the ordinary shares which are being transferred, or the transfer is an approved transfer as defined in the Articles, or the registration of the transfer is required by the Uncertificated Securities Regulations 2001.
Pearson operates an employee benefit trust to hold shares, pending employees becoming entitled to them under the company’s employee share plans. There were 678,659 shares held as at 31 December 2024. The trust has an independent trustee which has full discretion in relation to the voting of such shares. A dividend waiver operates on the shares held in the trust.
Pearson also operates nominee shareholding arrangements which hold shares on behalf of employees. As at 31 December 2024, there were 1,967,965 shares held in the Corporate Sponsored Nominee account administered by Computershare Investor Services PLC (Computershare). The beneficial owners of shares held in the Corporate Sponsored Nominee are invited to submit voting instructions online at http://www.investorcentre.co.uk/eproxy. If no instructions are given by the beneficial owner by the date specified, the trustees holding these shares will not exercise the voting rights.
Transfer of shares
The Board may refuse to register a transfer of a certificated share which is not fully paid, provided that the refusal does not prevent dealings in shares in the company from taking place on an open and proper basis. The Board may also refuse to register a transfer of a certificated share unless: (i) the instrument of transfer is lodged, duly stamped (if stampable) or duly certified or otherwise shown to the satisfaction of the Board to be exempt from stamp duty, at the registered office of the company or any other place decided by the Board, and is accompanied by the certificate for the share to which it relates and such other evidence as the Board may reasonably require to show the right of the transferor to make the transfer; (ii) it is in respect of only one class of shares; and (iii) it is in favour of not more than four transferees.
| Annual report and accounts 2024 Pearson plc 138 |
|
Strategic report |
Governance report |
Financial statements |
Other information | |||||
|
|
||||||||
Transfers of uncertificated shares must be carried out using CREST and the Board can refuse to register a transfer of an uncertificated share in accordance with the regulations governing the operation of CREST.
Variation of rights
If at any time the capital of the company is divided into different classes of shares, the special rights attaching to any class may be varied or revoked either:
| i. | with the written consent of the holders of at least 75% in nominal value of the issued shares of the relevant class; or |
| ii. | with the sanction of a special resolution passed at a separate general meeting of the holders of the shares of the relevant class. |
Without prejudice to any special rights previously conferred on the holders of any existing shares or class of shares, any share may be issued with such preferred, deferred or other special rights, or such restrictions, whether in regard to dividend, voting, return of capital or otherwise as the company may from time to time by ordinary resolution determine.
Appointment and replacement of Directors
The Articles contain the following provisions in relation to Directors.
Directors shall be no less than two in number. Directors may be appointed by the company by ordinary resolution or by the Board.
A Director appointed by the Board shall hold office only until the next AGM and shall then be eligible for re-appointment. The Board may from time to time appoint one or more Directors to hold Executive office with the company for such period (subject to the provisions of the Act) and upon such terms as the Board may decide and may revoke or terminate any appointment so made.
The Articles provide that, at every AGM of the company, every Director shall retire from office and, unless not willing to act, be eligible for re-appointment.
If a Director is not re-appointed, they shall, subject to the Articles, retain office until the meeting appoints someone in their place, or, if it does not do so, until the end of the meeting, or, if the meeting is adjourned, the end of the adjourned meeting. Where a Director has been appointed after notice of the annual general meeting has been given, that Director shall retire at the next annual general meeting of which notice is first given after their appointment as Director.
If there is an insufficient number of appointed or re-appointed Directors at any of the company’s annual general meetings thus rendering the Board inquorate, all Directors shall be automatically re-appointed only for the purposes of filling vacancies and convening general meetings of the company and to perform such duties as are appropriate to maintain the company as a going concern and to enable it to comply with its legal and regulatory obligations. The Directors are required to convene a further general meeting of the company as soon as reasonably practicable to allow new Directors to be appointed, and such Directors who were not appointed at the original general meeting shall subsequently retire.
The company may by ordinary resolution remove any Director before the expiration of their term of office. In addition, the Board may terminate an agreement or arrangement with any Director for the provision of their services to the company.
Powers of the Directors
Subject to the Articles, the Act and any directions given by special resolution, the business of the company will be managed by the Board who may exercise all the powers of the company, including powers relating to the issue and/or buying back of shares by the company (subject to authorisation, and any statutory restrictions or restrictions imposed by shareholders in a general meeting).
Directors’ indemnities
A qualifying third-party indemnity (QTPI), as permitted by the Articles and sections 232 and 234 of the Act, has been granted by the company to each of its Directors. Under the provisions of the QTPI, the company undertakes to indemnify each Director against liability to third parties (excluding criminal and regulatory penalties) and to pay Directors’ costs as incurred, provided that they are reimbursed to the company if the Director is found guilty, the court refuses to grant the relief sought or, in an action brought by the company, judgement is given against the Director.
The indemnity has been in force for the financial year ended 31 December 2024 and is currently in force. The company has purchased and maintains Directors’ and Officers’ insurance cover against certain legal liabilities and costs for claims in connection with any act or omission by such Directors and Officers in the execution of their duties.
Significant agreements
The following significant agreements contain provisions entitling the counterparties to exercise termination or other rights in the event of a change of control of the company.
As at 31 December 2024, the Group’s principal bank facility, the $1bn Revolving Credit Facility (RCF) agreement, allowed that upon a change of control of the company, any participating bank may require its outstanding advances, together with accrued interest and any other amounts payable in respect of such facility, and its commitments, to be cancelled, each within 55 days of notification to the banks by the agent. The facility was undrawn at year end. The Group’s outstanding fixed rate notes (see note 18 Borrowings for more information) also contain a provision requiring that, in the event of a change of control which leads to a downgrade in credit rating below Baa3 (Moody’s) or BBB- (Fitch Ratings), the company is required to make an offer to investors to repurchase outstanding instruments at par plus accrued interest, which investors are not obliged to accept.
For these purposes, a ‘change of control’ occurs if the company becomes a subsidiary of any other company, or one or more persons acting either individually or in concert obtains control (as defined in section 1124 of the Corporation Tax Act 2010) of the company.
Shares acquired through the company’s employee share plans rank pari passu with shares in issue and have no special rights. For legal and practical reasons, the rules of these plans set out the consequences of a change of control of the company.
Other statutory information
Other information that is required by the Act and by the Large and Medium-sized Companies and Groups (Accounts and Reports) Regulations 2008 (as amended) to be included in the Directors’ report, and which is incorporated by reference, can be located as follows:
| Annual report and accounts 2024 Pearson plc 139 |
|
Strategic report |
Governance report |
Financial statements |
Other information | |||||
| Additional disclosures continued |
||||||||
| Summary disclosures index | See more | |||
| Dividend recommendation |
page 32 | |||
| Financial instruments and financial risk management |
page 188 | |||
| Important events since year end |
page 206 | |||
| Future development of the business |
pages 10-11 | |||
| Research and development activities |
page 16 | |||
| Employment of disabled persons |
page 39 | |||
| Employee involvement |
page 38 | |||
| Greenhouse gas emissions and energy consumption data |
page 53 | |||
| Statement describing employee engagement |
page 22 | |||
| Statement describing regard to suppliers, customers and other stakeholders’ interests |
page 23 | |||
With the exception of the dividend waiver described on page 138 there is no information to be disclosed in accordance with UK Listing Rule 6.6.1.
No political donations or contributions were made or expenditure incurred by the company or its subsidiaries during the year.
Our disclosures are consistent with the recommendations of the Task Force on Climate-related Financial Disclosures (TCFD) and are set out on pages 44-48.
Fair, balanced and understandable reporting and disclosure of information
As required by the UK Corporate Governance Code, we have established arrangements to ensure that all information we report to investors and regulators is fair, balanced and understandable. In making its assessment, the Board pays particular attention to a set of criteria recommended by the Financial Reporting Council, including the use of straightforward language, focus on content that is important to investors and exclusion of irrelevant information.
A process and timetable for the production and approval of this year’s annual report and accounts was agreed by the Board at its meeting in December 2024. The full Board then had the opportunity to review and comment on the report as it progressed.
The Audit Committee is available to advise the Board on certain aspects of the annual report and accounts, to enable the Directors to fulfil their responsibility in this regard. As part of supporting the Board in this regard, the Audit Committee considers a report evidencing how the fair, balanced and understandable criteria are satisfied throughout the annual report and accounts.
Following their review, and taking into account a recommendation by the Audit Committee, the Directors consider that the annual report and accounts, taken as a whole, are fair, balanced and understandable and provide the information necessary for shareholders to assess the company’s position, performance, business model and strategy.
Representatives from the Financial Reporting, Strategy, Investor Relations, Corporate Affairs, Sustainability, Company Secretarial, Legal, Internal Audit, Risk, HR and Reward teams are involved in the preparation and review of the annual report to ensure a cohesive and balanced approach and, as with all of our financial reporting, a thorough verification of narrative and financial statements is conducted. We also have procedures in place to ensure the timely release of inside information, through our Market Disclosure Committee.
The Directors also confirm that, for each Director in office at the date of this report:
| • | so far as the Director is aware, there is no relevant audit information of which the Group and company’s auditors are unaware |
| • | they have taken all the steps that they ought to have taken as Directors to make themselves aware of any relevant audit information and to establish that the Group and the company’s auditors are aware of that information |
Streamlined Energy and Carbon Reporting (SECR)
In line with the requirements set out in the UK Government’s guidance on Streamlined Energy and Carbon Reporting, the following data points representing Pearson’s energy use and associated GHG emissions from electricity and fuel can be found on page 53 in the Sustainability section of this report:
| • | Annual global and UK GHG emissions from activities for which the company is responsible, including combustion of fuel and operation of any facility, and the annual emissions from the purchase of electricity, heat, steam or cooling by the company for its own use. |
| • | Underlying global and UK energy use. |
| • | Energy use and GHG emissions figures from previous year. |
| • | Emissions intensity ratio. |
| • | Energy efficiency measures taken throughout the year. |
Our performance metrics have been calculated with reference to the Greenhouse Gas Protocol, and externally verified. The external verification statement can be found here: https://plc.pearson.com/en-GB/sustainability/our-esg-reporting.
Directors in office
The following Directors were in office during the year and up to the date of approval of these financial statements:
| O P Abbosh – appointed on 8 January 2024 |
| A Bird – retired on 7 January 2024 |
| S L Coutu |
| A Dolan |
| A Hardiman |
| S K M Johnson |
| O Kordestani |
| E S Lee |
| G D Pitkethly |
| T Score – retired on 26 April 2024 |
| A C Thomas |
| L A Wallen |
The Directors’ report has been approved by the Board on 13 March 2025 and signed on its behalf by:
Graeme Baldwin
Company Secretary
| Annual report and accounts 2024 Pearson plc 140 |
|
Strategic report |
Governance report |
Financial statements |
Other information | |||||
|
Statement of Directors’ responsibilities in respect of the financial statements |
||||||||
Statement of Directors’ responsibilities
The Directors are responsible for preparing the annual report and accounts and the financial statements in accordance with applicable law and regulation.
Company law requires the Directors to prepare financial statements for each financial year. Under that law, the Directors have prepared the consolidated financial statements in accordance with UK-adopted international accounting standards. In preparing the consolidated financial statements, the Directors have also elected to comply with IFRS Accounting Standards as issued by the International Accounting Standards Board (IFRS Accounting Standards as issued by IASB). The Directors have elected to prepare the individual Company financial statements in accordance with Financial Reporting Standard 101 Reduced Disclosure Framework.
Under company law, the Directors must not approve the financial statements unless they are satisfied that they give a true and fair view of the state of affairs of the Group and company and of the profit or loss of the Group for that period.
In preparing the consolidated financial statements, the Directors are required to:
| • | Select suitable accounting policies and then apply them consistently. |
| • | State whether applicable UK-adopted international accounting standards and IFRS Accounting Standards as issued by IASB have been followed, subject to any material departures disclosed and explained in the financial statements. |
| • | Make judgements and accounting estimates that are reasonable and prudent. |
| • | Prepare the financial statements on the going concern basis unless it is inappropriate to presume that the Group will continue in business. |
In preparing the company financial statements, the Directors are required to:
| • | Select suitable accounting policies and then apply them consistently. |
| • | State whether Financial Reporting Standard 101 Reduced Disclosure Framework has been followed, subject to any material departures disclosed and explained in the financial statements. |
| • | Make judgements and accounting estimates that are reasonable and prudent. |
| • | Prepare the financial statements on the going concern basis unless it is inappropriate to presume that the company will continue in business. |
The Directors are responsible for safeguarding the assets of the Group and company and hence for taking reasonable steps for the prevention and detection of fraud and other irregularities.
The Directors are responsible for keeping adequate accounting records that are sufficient to show and explain the Group and company’s transactions, and disclose with reasonable accuracy at any time the financial position of the Group and company and enable them to ensure that the financial statements and the Directors’ Remuneration Report comply with the Companies Act 2006.
The Directors are responsible for the maintenance and integrity of the company’s website. Legislation in the United Kingdom governing the preparation and dissemination of financial statements may differ from legislation in other jurisdictions.
Directors’ confirmations
Each of the Directors, whose names and functions are listed in the Governance report, confirms that, to the best of their knowledge:
| • | The Group financial statements, which have been prepared in accordance with UK-adopted international accounting standards and IFRS Accounting Standards as issued by the IASB, give a true and fair view of the assets, liabilities and financial position of the Group, and of the profit of the Group. |
| • | The company financial statements, which have been prepared in accordance with Financial Reporting Standard 101 Reduced Disclosure Framework, give a true and fair view of the assets, liabilities and financial position of the company, and of the profit of the company. |
| • | The Strategic report includes a fair review of the development and performance of the business and the position of the Group and company, together with a description of the principal risks and uncertainties that it faces. |
This responsibility statement has been approved by the Board on 13 March 2025 and signed on its behalf by:
Sally Johnson
Chief Financial Officer
| Annual report and accounts 2024 Pearson plc 141 |
|
Strategic report |
Governance report |
Financial statements |
Other information | |||||
|
Page intentionally left blank |
||||||||
| Annual report and accounts 2024 Pearson plc 142 |
|
Strategic report |
Governance report |
Financial statements |
Other information | |||||
|
Page intentionally left blank |
||||||||
| Annual report and accounts 2024 Pearson plc 143 |
|
Strategic report |
Governance report |
Financial statements |
Other information | |||||
|
Page intentionally left blank |
||||||||
| Annual report and accounts 2024 Pearson plc 144 |
|
Strategic report |
Governance report |
Financial statements |
Other information | |||||
|
Page intentionally left blank |
||||||||
| Annual report and accounts 2024 Pearson plc 145 |
|
Strategic report |
Governance report |
Financial statements |
Other information | |||||
|
Page intentionally left blank |
||||||||
| Annual report and accounts 2024 Pearson plc 146 |
|
Strategic report |
Governance report |
Financial statements |
Other information | |||||
|
Page intentionally left blank |
||||||||
| Annual report and accounts 2024 Pearson plc 147 |
|
Strategic report |
Governance report |
Financial statements |
Other information | |||||
|
Page intentionally left blank |
||||||||
| Annual report and accounts 2024 Pearson plc 148 |
|
Strategic report |
Governance report |
Financial statements |
Other information | |||||
|
Page intentionally left blank |
||||||||
| Annual report and accounts 2024 Pearson plc 149 |
| Strategic report |
Governance report |
Financial statements |
Other information | |||||
| Consolidated income statement |
||||||||
Year ended 31 December 2024 |
||||||||
| All figures in £ millions |
Notes |
2024 |
2023 |
2022 |
||||||||||||
| Continuing operations |
||||||||||||||||
| Sales |
2,3 | |||||||||||||||
| Cost of goods sold |
4 | ( |
) |
( |
) | ( |
) | |||||||||
| Gross profit |
||||||||||||||||
| Operating expenses |
4 | ( |
) |
( |
) | ( |
) | |||||||||
| Other net gains and losses |
4 | ( |
) |
( |
) | |||||||||||
| Share of results of joint ventures and associates |
12 | |||||||||||||||
| Operating profit |
2 | |||||||||||||||
| Finance costs |
6 | ( |
) |
( |
) | ( |
) | |||||||||
| Finance income |
6 | |||||||||||||||
| Profit before tax |
||||||||||||||||
| Income tax |
7 | ( |
) |
( |
) | ( |
) | |||||||||
| Profit for the year |
||||||||||||||||
| Attributable to: |
||||||||||||||||
| Equity holders of the company |
||||||||||||||||
| Non-controlling interest |
||||||||||||||||
| Earnings per share attributable to equity holders of the company during the year (expressed in pence per share) |
||||||||||||||||
| —basic |
8 | p |
||||||||||||||
| —diluted |
8 | p |
||||||||||||||
| Strategic report |
Governance report |
Financial statements |
Other information | |||||
| Consolidated statement of comprehensive income |
||||||||
Year ended 31 December 2024 |
||||||||
| All figures in £ millions |
Notes |
2024 |
2023 |
2022 |
||||||||||||
| Profit for the year |
||||||||||||||||
| Items that may be reclassified to the income statement |
||||||||||||||||
| Net exchange differences on translation of foreign operations |
( |
) |
( |
) | ||||||||||||
| Currency translation adjustment disposed |
31 | ( |
) | ( |
) | |||||||||||
| Attributable tax |
7 | |||||||||||||||
| Items that are not reclassified to the income statement |
||||||||||||||||
| Fair value (losses)/gains on other financial assets |
15 | ( |
) |
|||||||||||||
| Attributable tax |
7 | |||||||||||||||
| Remeasurement of retirement benefit obligations |
25 | ( |
) | |||||||||||||
| Attributable tax |
7 | ( |
) |
( |
) | |||||||||||
| Other comprehensive (expense)/income for the year |
29 | ( |
) |
( |
) | |||||||||||
| Total comprehensive income for the year |
||||||||||||||||
| Attributable to: |
||||||||||||||||
| Equity holders of the company |
||||||||||||||||
| Non-controlling interest |
||||||||||||||||
| Strategic report |
Governance report |
Financial statements |
Other information | |||||
| Consolidated balance sheet |
||||||||
As at 31 December 2024 |
||||||||
| All figures in £ millions |
Notes |
2024 |
2023 |
|||||||||
| Assets |
||||||||||||
| Non-current assets |
||||||||||||
| Property, plant and equipment |
10 | |||||||||||
| Investment property |
10 | |||||||||||
| Intangible assets |
11 | |||||||||||
| Investments in joint ventures and associates |
12 | |||||||||||
| Deferred income tax assets |
13 | |||||||||||
| Financial assets – derivative financial instruments |
16 | |||||||||||
| Retirement benefit assets |
25 | |||||||||||
| Other financial assets |
15 | |||||||||||
| Income tax assets |
7 | |||||||||||
| Trade and other receivables |
22 | |||||||||||
| Current assets |
||||||||||||
| Intangible assets – product development |
20 | |||||||||||
| Inventories |
21 | |||||||||||
| Trade and other receivables |
22 | |||||||||||
| Financial assets – derivative financial instruments |
16 | |||||||||||
| Income tax assets |
7 | |||||||||||
| Cash and cash equivalents (excluding overdrafts) |
17 | |||||||||||
| Assets classified as held for sale |
32 | – |
||||||||||
| Total assets |
||||||||||||
| Liabilities |
||||||||||||
| Non-current liabilities |
||||||||||||
| Financial liabilities – borrowings |
18 | ( |
) |
( |
) | |||||||
| Financial liabilities – derivative financial instruments |
16 | ( |
) |
( |
) | |||||||
| Deferred income tax liabilities |
13 | ( |
) |
( |
) | |||||||
| Retirement benefit obligations |
25 | ( |
) |
( |
) | |||||||
| Provisions for other liabilities and charges |
23 | ( |
) |
( |
) | |||||||
| Other liabilities |
24 | ( |
) |
( |
) | |||||||
( |
) |
( |
) | |||||||||
| All figures in £ millions |
Notes |
2024 |
2023 |
|||||||||
| Current liabilities |
||||||||||||
| Trade and other liabilities |
24 | ( |
) |
( |
) | |||||||
| Financial liabilities – borrowings |
18 | ( |
) |
( |
) | |||||||
| Financial liabilities – derivative financial instruments |
16 | ( |
) |
( |
) | |||||||
| Income tax liabilities |
7 | ( |
) |
( |
) | |||||||
| Provisions for other liabilities and charges |
23 | ( |
) |
( |
) | |||||||
( |
) |
( |
) | |||||||||
| Liabilities classified as held for sale |
32 | – |
– | |||||||||
| Total liabilities |
( |
) |
( |
) | ||||||||
| Net assets |
||||||||||||
| Equity |
||||||||||||
| Share capital |
27 | |||||||||||
| Share premium |
27 | |||||||||||
| Treasury shares |
28 | ( |
) |
( |
) | |||||||
| Capital redemption reserve |
||||||||||||
| Fair value reserve |
( |
) |
( |
) | ||||||||
| Translation reserve |
||||||||||||
| Retained earnings |
||||||||||||
| Total equity attributable to equity holders of the company |
||||||||||||
| Non-controlling interest |
||||||||||||
| Total equity |
||||||||||||
| Strategic report |
Governance report |
Financial statements |
Other information | |||||
| Consolidated statement of changes in equity |
||||||||
Year ended 31 December 2024 |
||||||||
| Equity attributable to equity holders of the company |
||||||||||||||||||||||||||||||||||||||||
| All figures in £ millions |
Share capital |
Share premium |
Treasury shares |
Capital redemption reserve |
Fair value reserve |
Translation reserve |
Retained earnings |
Total |
Non- controlling interest |
Total equity |
||||||||||||||||||||||||||||||
| At 1 January 2024 |
( |
) |
( |
) |
||||||||||||||||||||||||||||||||||||
| Profit for the year |
– |
– |
– |
– |
– |
– |
||||||||||||||||||||||||||||||||||
| Other comprehensive (expense)/income |
– |
– |
– |
– |
( |
) |
( |
) |
( |
) |
– |
( |
) | |||||||||||||||||||||||||||
| Total comprehensive (expense)/income |
– |
– |
– |
– |
( |
) |
( |
) |
||||||||||||||||||||||||||||||||
| Equity-settled transactions 1 |
– |
– |
– |
– |
– |
– |
– |
|||||||||||||||||||||||||||||||||
| Taxation on equity-settled transactions |
– |
– |
– |
– |
– |
– |
– |
|||||||||||||||||||||||||||||||||
| Issue of ordinary shares under share option schemes |
– |
– |
– |
– |
– |
– |
– |
|||||||||||||||||||||||||||||||||
| Buyback of equity |
( |
) |
– |
– |
– |
( |
) |
( |
) |
– |
( |
) | ||||||||||||||||||||||||||||
| Purchase of treasury shares |
– |
– |
( |
) |
– |
– |
– |
– |
( |
) |
– |
( |
) | |||||||||||||||||||||||||||
| Release of treasury shares |
– |
– |
– |
– |
– |
( |
) |
– |
– |
– |
||||||||||||||||||||||||||||||
| Dividends |
– |
– |
– |
– |
– |
– |
( |
) |
( |
) |
– |
( |
) | |||||||||||||||||||||||||||
| At 31 December 2024 |
( |
) |
( |
) |
||||||||||||||||||||||||||||||||||||
| 1. | Equity-settled transactions are presented net of withholding taxes that the Group is obligated to pay on behalf of employees. The payments to the tax authorities are accounted for as a deduction from equity for the shares withheld. |
Equity attributable to equity holders of the company |
||||||||||||||||||||||||||||||||||||||||
| All figures in £ millions |
Share capital |
Share premium |
Treasury shares |
Capital redemption reserve |
Fair value reserve |
Translation reserve |
Retained earnings |
Total |
Non- controlling interest |
Total equity |
||||||||||||||||||||||||||||||
| At 1 January 2023 |
( |
) | ( |
) | ||||||||||||||||||||||||||||||||||||
| Profit for the year |
– | – | – | – | – | – | ||||||||||||||||||||||||||||||||||
| Other comprehensive (expense)/income |
– | – | – | – | ( |
) | ( |
) | ( |
) | ( |
) | ( |
) | ||||||||||||||||||||||||||
| Total comprehensive (expense)/income |
– | – | – | – | ( |
) | ||||||||||||||||||||||||||||||||||
| Equity-settled transactions |
– | – | – | – | – | – | – | |||||||||||||||||||||||||||||||||
| Taxation on equity-settled transactions |
– | – | – | – | – | – | – | |||||||||||||||||||||||||||||||||
| Issue of ordinary shares under share option schemes |
– | – | – | – | – | – | – | |||||||||||||||||||||||||||||||||
| Buyback of equity |
( |
) | – | – | – | – | ( |
) | ( |
) | – | ( |
) | |||||||||||||||||||||||||||
| Purchase of treasury shares |
– | – | ( |
) | – | – | – | – | ( |
) | – | ( |
) | |||||||||||||||||||||||||||
| Release of treasury shares |
– | – | – | – | – | ( |
) | – | – | – | ||||||||||||||||||||||||||||||
| Dividends |
– | – | – | – | – | – | ( |
) | ( |
) | ( |
) | ||||||||||||||||||||||||||||
| At 31 December 2023 |
( |
) | ( |
) | ||||||||||||||||||||||||||||||||||||
| Strategic report |
Governance report |
Financial statements |
Other information | |||||
| Consolidated statement of changes in equity continued |
||||||||
Year ended 31 December 2024 |
||||||||
| Equity attributable to equity holders of the company | ||||||||||||||||||||||||||||||||||||||||
All figures in £ millions |
Share capital |
Share premium |
Treasury shares |
Capital redemption reserve |
Fair value reserve |
Translation reserve |
Retained earnings |
Total | Non- controlling interest |
Total equity |
||||||||||||||||||||||||||||||
| At 1 January 2022 |
( |
) | ( |
) | ||||||||||||||||||||||||||||||||||||
| Profit for the year |
– | – | – | – | – | – | ||||||||||||||||||||||||||||||||||
| Other comprehensive income/(expense) |
– | – | – | – | ||||||||||||||||||||||||||||||||||||
| Total comprehensive income/(expense) |
– | – | – | – | ||||||||||||||||||||||||||||||||||||
| Equity-settled transactions |
– | – | – | – | – | – | – | |||||||||||||||||||||||||||||||||
| Taxation on equity-settled transactions |
– | – | – | – | – | – | – | |||||||||||||||||||||||||||||||||
| Issue of ordinary shares under share option schemes |
– | – | – | – | – | – | – | |||||||||||||||||||||||||||||||||
| Buyback of equity |
( |
) | – | – | – | – | ( |
) | ( |
) | – | ( |
) | |||||||||||||||||||||||||||
| Purchase of treasury shares |
– | – | ( |
) | – | – | – | – | ( |
) | – | ( |
) | |||||||||||||||||||||||||||
| Release of treasury shares |
– | – | – | – | – | ( |
) | – | – | – | ||||||||||||||||||||||||||||||
| Transfer of gain on disposal of FVOCI investment |
– | – | – | – | ( |
) | – | – | – | – | ||||||||||||||||||||||||||||||
| Dividends |
– | – | – | – | – | – | ( |
) | ( |
) | ( |
) | ( |
) | ||||||||||||||||||||||||||
| At 31 December 2022 |
( |
) | ( |
) | ||||||||||||||||||||||||||||||||||||
| Strategic report |
Governance report |
Financial statements |
Other information | |||||
| Consolidated cash flow statement |
||||||||
Year ended 31 December 2024 |
||||||||
| All figures in £ millions |
Notes | 2024 |
2023 | 2022 | ||||||||||||
Cash flows from operating activities |
||||||||||||||||
| Profit before tax | ||||||||||||||||
| Net finance costs/(income) | ( |
) | ||||||||||||||
| Depreciation and impairment – PPE, investment property and assets held for sale | ||||||||||||||||
| Amortisation and impairment – software | ||||||||||||||||
| Amortisation and impairment – acquired intangible assets | ||||||||||||||||
| Other net gains and losses | ( |
) | ||||||||||||||
| Product development capital expenditure | ( |
) |
( |
) | ( |
) | ||||||||||
| Amortisation and impairment – product development | ||||||||||||||||
| Share-based payment costs | ||||||||||||||||
| Change in inventories | ( |
) | ||||||||||||||
| Change in trade and other receivables | ( |
) | ||||||||||||||
| Change in trade and other liabilities | ( |
) |
( |
) | ( |
) | ||||||||||
| Change in provisions for other liabilities and charges | ( |
) |
( |
) | ||||||||||||
| Other movements | ( |
) | ||||||||||||||
| Net cash generated from operations | ||||||||||||||||
| Interest paid | ( |
) |
( |
) | ( |
) | ||||||||||
| Tax paid | ( |
) |
( |
) | ( |
) | ||||||||||
Net cash generated from operating activities |
||||||||||||||||
Cash flows from investing activities |
||||||||||||||||
| Acquisition of subsidiaries, net of cash acquired | 30 | ( |
) |
( |
) | ( |
) | |||||||||
| Acquisition of joint ventures and associates | ( |
) | ( |
) | ||||||||||||
| Purchase of investments | ( |
) |
( |
) | ( |
) | ||||||||||
| Purchase of property, plant and equipment and investment property | ( |
) |
( |
) | ( |
) | ||||||||||
| Purchase of intangible assets | ( |
) |
( |
) | ( |
) | ||||||||||
| Disposal of subsidiaries, net of cash disposed | 31 | ( |
) |
( |
) | |||||||||||
| Proceeds from disposal of investments | ||||||||||||||||
| Proceeds from disposal of property, plant and equipment | ||||||||||||||||
| Lease receivables repaid including disposals | ||||||||||||||||
| Interest received | ||||||||||||||||
| Dividends received | – | |||||||||||||||
Net cash (used in)/generated from investing activities |
( |
) |
( |
) | ||||||||||||
| All figures in £ millions |
Notes |
2024 |
2023 |
2022 |
||||||||||||
Cash flows from financing activities |
||||||||||||||||
| Proceeds from issue of ordinary shares | 27 | |||||||||||||||
| Buyback of equity | 27 | ( |
) |
( |
) | ( |
) | |||||||||
| Settlement of share-based payments | 28 | ( |
) |
( |
) | ( |
) | |||||||||
| Proceeds from borrowings | – | |||||||||||||||
| Repayment of borrowings | ( |
) |
( |
) | ( |
) | ||||||||||
| Repayment of lease liabilities | ( |
) |
( |
) | ( |
) | ||||||||||
| Dividends paid to company’s shareholders | 9 | ( |
) |
( |
) | ( |
) | |||||||||
| Dividends paid to non-controlling interest |
– |
– | ( |
) | ||||||||||||
Net cash used in financing activities |
( |
) |
( |
) | ( |
) | ||||||||||
| Effects of exchange rate changes on cash and cash equivalents | ( |
) |
( |
) | ||||||||||||
Net increase/(decrease) in cash and cash equivalents |
( |
) | ( |
) | ||||||||||||
| Cash and cash equivalents at beginning of year | ||||||||||||||||
Cash and cash equivalents at end of year |
17 | |||||||||||||||
Strategic report |
Governance report |
Financial statements |
Other information | |||||
Notes to the consolidated financial statements continued |
||||||||
| — | Amendments to IAS 21 ’Lack of exchangeability’; |
| — | Amendment to IFRS 9 and IFRS 7 ‘Classification and measurement of financial instruments’ (not yet endorsed; |
| — | IFRS 18 ‘Presentation and disclosure in financial statements’ (not yet endorsed); and |
| — | IFRS 19 ’Subsidiaries without Public Accountability: Disclosures (not yet endorsed). |
| — | Taxation; and |
| — | Employee benefits: pensions. |
Strategic report |
Governance report |
Financial statements |
Other information | |||||
 Key judgements Key judgements |
||||||
— The application of tax legislation in relation to provisions for uncertain tax positions. See notes 7 and 34. |
||||||
— The Group is eligible to receive the surplus associated with the UK Group Pension Plan in recognising a pension asset. See note 25. |
||||||
 Key areas of estimation Key areas of estimation |
||||||
— The level of provisions required in relation to uncertain tax positions is complex and each matter is separately assessed. The estimation of future settlement amounts is based on a number of factors including the status of the unresolved matter, clarity of legislation, range of possible outcomes and the statute of limitations. See notes 7 and 34. |
||||||
— The determination of the pension cost and defined benefit obligation of the Group’s defined benefit pension schemes depends on the selection of certain assumptions, which include the discount rate, inflation rate, salary growth and longevity. See note 25. |
||||||
| — | Financial instruments and hedge accounting; and |
| — | Translation methodologies. |
| Strategic report |
Governance report |
Financial statements |
Other information | |||||
| Notes to the consolidated financial statements continued |
||||||||
| — | Assets and liabilities are translated at the closing rate at the date of the balance sheet; |
| — | Income and expenses are translated at average exchange rates; and |
| — | All resulting exchange differences are recognised as a separate component of equity. |
| Buildings (freehold): | ||||
| Buildings (leasehold): | ||||
| Plant and equipment: | ||||
| Strategic report |
Governance report |
Financial statements |
Other information | |||||
| |
||||||||
Strategic report |
Governance report |
Financial statements |
Other information | |||||
Notes to the consolidated financial statements continued |
||||||||
Strategic report |
Governance report |
Financial statements |
Other information | |||||
Typical reason for designation |
Reporting of gains and losses on effective portion of the hedge |
Reporting of gains and losses on disposal | ||
Net investment hedge |
||||
| The derivative creates a foreign currency liability which is used to hedge changes in the value of a subsidiary which transacts in that currency. | Recognised in other comprehensive income. | On the disposal of foreign operations or subsidiaries, the accumulated value of gains and losses reported in other comprehensive income is transferred to the income statement. | ||
Fair value hedges |
||||
| The derivative transforms the interest profile on debt from fixed rate to floating rate. Changes in the value of the debt as a result of changes in interest rates and foreign exchange rates are offset by equal and opposite changes in the value of the derivative. When the Group’s debt is swapped to floating rates, the contracts used are designated as fair value hedges. | Gains and losses on the derivative are reported in finance income or finance costs. However, an equal and opposite change is made to the carrying value of the debt (a ‘fair value adjustment’) with the benefit/cost reported in finance income or finance costs. The net result should be a zero charge on a perfectly effective hedge. | If the debt and derivative are disposed of, the value of the derivative and the debt (including the fair value adjustment) are reset to zero. Any resultant gain or loss is recognised in finance income or finance costs. | ||
Non-hedge accounted contracts |
||||
| These are not designated as hedging instruments. Typically, these are short-term contracts to convert debt back to fixed rates or foreign exchange contracts where a natural offset exists. | Recognised in the income statement. No hedge accounting applies. | |||
Strategic report |
Governance report |
Financial statements |
Other information | |||||
Notes to the consolidated financial statements continued |
||||||||
Strategic report |
Governance report |
Financial statements |
Other information | |||||
| Strategic report |
Governance report |
Financial statements |
Other information | |||||
| Notes to the consolidated financial statements continued |
||||||||
| — | The impact on the Group’s future cash flows, and the resulting impact that such adjustments to our future cash flows would have on the outcome of the annual impairment testing of our goodwill balances (see note 11 for further details), the recognition of deferred tax assets and our assessment of going concern; |
| — | The carrying value of the Group’s assets, in particular the recoverable amounts of inventories, product development assets, intangible assets and property, plant and equipment; and |
| — | Any changes to our estimates of the useful economic lives of product development assets, intangible assets and property, plant and equipment. |
| — | Assessment & Qualifications – Pearson VUE, US Student Assessment, Clinical Assessment, UK GCSE and A Levels and International academic qualifications and associated courseware including the English-speaking Canadian and Australian K-12 businesses, and PDRI; |
| — | Virtual Learning – Virtual Schools and Online Program Management (up to the point of disposal); |
| — | English Language Learning – Pearson Test of English, Institutional Courseware and English Online Solutions; |
| — | Workforce Skills – BTEC, GED, TalentLens, Faethm, Credly, Pearson College and Apprenticeships; and |
| — | Higher Education – US, Canadian and International Higher Education Courseware businesses. |
| Strategic report |
Governance report |
Financial statements |
Other information | |||||
| |
||||||||
| Sales |
Adjusted operating profit |
|||||||||||||||||||||||||||
| 2024 |
2023 |
2022 |
2024 |
2023 |
2022 |
|||||||||||||||||||||||
| Assessment & Qualifications |
||||||||||||||||||||||||||||
| Virtual Learning |
||||||||||||||||||||||||||||
| English Language Learning |
||||||||||||||||||||||||||||
| Workforce Skills |
( |
) | ( |
) | ||||||||||||||||||||||||
| Higher Education |
||||||||||||||||||||||||||||
| Strategic Review |
( |
) | ||||||||||||||||||||||||||
| Total |
||||||||||||||||||||||||||||
| A reconciliation of the operating segments’ measure of profit to profit for the year is provided below: |
||||||||||||||||||||||||||||
| 2024 |
2023 |
2022 |
||||||||||||||||||||||||||
| Adjusted operating profit |
||||||||||||||||||||||||||||
| Cost of major reorganisation |
( |
) | ||||||||||||||||||||||||||
| Property charges |
( |
) | ||||||||||||||||||||||||||
| Intangible charges |
( |
) |
( |
) | ( |
) | ||||||||||||||||||||||
| UK pension discretionary increases |
( |
) |
( |
) | ||||||||||||||||||||||||
| Other net gains and losses |
( |
) |
( |
) | ||||||||||||||||||||||||
| Operating profit |
||||||||||||||||||||||||||||
| Finance costs |
6 | ( |
) |
( |
) | ( |
) | |||||||||||||||||||||
| Finance income |
6 | |||||||||||||||||||||||||||
| Profit before tax |
||||||||||||||||||||||||||||
| Income tax |
7 | ( |
) |
( |
) | ( |
) | |||||||||||||||||||||
| Profit for the year |
||||||||||||||||||||||||||||
| Amortisation, depreciation, and impairment |
||||||||||||||||||||||||||||
All figures in £ millions |
2024 |
2023 |
2022 |
|||||||||||||||||||||||||
| Assessment & Qualifications |
||||||||||||||||||||||||||||
| Virtual Learning |
||||||||||||||||||||||||||||
| English Language Learning |
||||||||||||||||||||||||||||
| Workforce Skills |
||||||||||||||||||||||||||||
| Higher Education |
||||||||||||||||||||||||||||
| Strategic Review |
||||||||||||||||||||||||||||
| Total |
||||||||||||||||||||||||||||
| Strategic report |
Governance report |
Financial statements |
Other information | |||||
| Notes to the consolidated financial statements continued |
||||||||
| Sales |
Non-current assets |
|||||||||||||||||||||||
| All figures in £ millions |
2024 |
2023 |
2022 |
2024 |
2023 |
|||||||||||||||||||
| UK |
||||||||||||||||||||||||
| Other European countries |
||||||||||||||||||||||||
| US |
||||||||||||||||||||||||
| Canada |
||||||||||||||||||||||||
| Asia Pacific |
||||||||||||||||||||||||
| Other countries |
||||||||||||||||||||||||
| Total |
||||||||||||||||||||||||
| Strategic report |
Governance report |
Financial statements |
Other information | |||||
| |
||||||||
| 2024 |
||||||||||||||||||||||||||||
All figures in £ millions |
Assessment & Qualifications |
Virtual Learning |
English Language Learning |
Workforce Skills |
Higher Education |
Strategic Review |
Total |
|||||||||||||||||||||
| Courseware |
||||||||||||||||||||||||||||
| Products transferred at a point in time |
||||||||||||||||||||||||||||
| Products and services transferred over time |
||||||||||||||||||||||||||||
| Assessments |
||||||||||||||||||||||||||||
| Products transferred at a point in time |
||||||||||||||||||||||||||||
| Products and services transferred over time |
||||||||||||||||||||||||||||
| Services |
||||||||||||||||||||||||||||
| Products transferred at a point in time |
||||||||||||||||||||||||||||
| Products and services transferred over time |
||||||||||||||||||||||||||||
| Total |
||||||||||||||||||||||||||||
| 2023 |
||||||||||||||||||||||||||||
All figures in £ millions |
Assessment & Qualifications |
Virtual Learning |
English Language Learning |
Workforce Skills |
Higher Education |
Strategic Review |
Total |
|||||||||||||||||||||
| Courseware |
||||||||||||||||||||||||||||
| Products transferred at a point in time |
||||||||||||||||||||||||||||
| Products and services transferred over time |
||||||||||||||||||||||||||||
| Assessments |
||||||||||||||||||||||||||||
| Products transferred at a point in time |
||||||||||||||||||||||||||||
| Products and services transferred over time |
||||||||||||||||||||||||||||
| Services |
||||||||||||||||||||||||||||
| Products transferred at a point in time |
||||||||||||||||||||||||||||
| Products and services transferred over time |
||||||||||||||||||||||||||||
| Total |
||||||||||||||||||||||||||||
| Strategic report |
Governance report |
Financial statements |
Other information | |||||
| Notes to the consolidated financial statements continued |
||||||||
| 2022 |
||||||||||||||||||||||||||||
| All figures in £ millions | Assessment & Qualifications |
Virtual Learning |
English Language Learning |
Workforce Skills |
Higher Education |
Strategic Review |
Total |
|||||||||||||||||||||
| Courseware |
||||||||||||||||||||||||||||
| Products transferred at a point in time |
||||||||||||||||||||||||||||
| Products and services transferred over time |
||||||||||||||||||||||||||||
| Assessments |
||||||||||||||||||||||||||||
| Products transferred at a point in time |
||||||||||||||||||||||||||||
| Products and services transferred over time |
||||||||||||||||||||||||||||
| Services |
||||||||||||||||||||||||||||
| Products transferred at a point in time |
||||||||||||||||||||||||||||
| Products and services transferred over time |
||||||||||||||||||||||||||||
| Total |
||||||||||||||||||||||||||||
| Strategic report |
Governance report |
Financial statements |
Other information | |||||
| |
||||||||
| Strategic report |
Governance report |
Financial statements |
Other information | |||||
| Notes to the consolidated financial statements continued |
||||||||
| Strategic report |
Governance report |
Financial statements |
Other information | |||||
| |
||||||||
| 2024 |
||||||||||||||||||||||||||||
| All figures in £ millions | Sales |
Deferred income |
Committed sales |
Total remaining transaction price |
2025 |
2026 |
2027 and later |
|||||||||||||||||||||
| Courseware |
||||||||||||||||||||||||||||
| Products transferred at a point in time |
||||||||||||||||||||||||||||
| Products and services transferred over time |
||||||||||||||||||||||||||||
| Assessments |
||||||||||||||||||||||||||||
| Products transferred at a point in time |
||||||||||||||||||||||||||||
| Products and services transferred over time |
||||||||||||||||||||||||||||
| Services |
||||||||||||||||||||||||||||
| Products transferred at a point in time |
||||||||||||||||||||||||||||
| Products and services transferred over time – subscriptions |
||||||||||||||||||||||||||||
| Products and services transferred over time – other |
||||||||||||||||||||||||||||
| Total |
||||||||||||||||||||||||||||
| 2023 |
||||||||||||||||||||||||||||
All figures in £ millions |
Sales |
Deferred income |
Committed sales |
Total remaining transaction price |
2024 |
2025 |
2026 and later |
|||||||||||||||||||||
| Courseware |
||||||||||||||||||||||||||||
| Products transferred at a point in time |
||||||||||||||||||||||||||||
| Products and services transferred over time |
||||||||||||||||||||||||||||
| Assessments |
||||||||||||||||||||||||||||
| Products transferred at a point in time |
||||||||||||||||||||||||||||
| Products and services transferred over time |
||||||||||||||||||||||||||||
| Services |
||||||||||||||||||||||||||||
| Products transferred at a point in time |
||||||||||||||||||||||||||||
| Products and services transferred over time – subscriptions |
||||||||||||||||||||||||||||
| Products and services transferred over time – other |
||||||||||||||||||||||||||||
| Total |
||||||||||||||||||||||||||||
| Strategic report |
Governance report |
Financial statements |
Other information | |||||
| Notes to the consolidated financial statements continued |
||||||||
| 2022 |
||||||||||||||||||||||||||||
| All figures in £ millions | Sales |
Deferred income |
Committed sales |
Total remaining transaction price |
2023 |
2024 |
2025 and later |
|||||||||||||||||||||
| Courseware |
||||||||||||||||||||||||||||
| Products transferred at a point in time |
||||||||||||||||||||||||||||
| Products and services transferred over time |
||||||||||||||||||||||||||||
| Assessments |
||||||||||||||||||||||||||||
| Products transferred at a point in time |
||||||||||||||||||||||||||||
| Products and services transferred over time |
||||||||||||||||||||||||||||
| Services |
||||||||||||||||||||||||||||
| Products transferred at a point in time |
||||||||||||||||||||||||||||
| Products and services transferred over time – subscriptions |
||||||||||||||||||||||||||||
| Products and services transferred over time – other |
||||||||||||||||||||||||||||
| Total |
||||||||||||||||||||||||||||
| Strategic report |
Governance report |
Financial statements |
Other information | |||||
| |
||||||||
| All figures in £ millions |
2024 |
2023 |
2022 |
|||||||||
| By function: |
||||||||||||
| Cost of goods sold |
||||||||||||
| Operating expenses |
||||||||||||
| Distribution costs |
||||||||||||
| Selling, marketing and product development costs |
||||||||||||
| Administrative and other expenses |
||||||||||||
| Reorganisation costs |
( |
) |
– | |||||||||
| Other income |
( |
) |
( |
) | ( |
) | ||||||
Total net operating expenses |
||||||||||||
| Other net gains and losses |
( |
) | ||||||||||
Total |
||||||||||||
| All figures in £ millions |
Notes |
2024 |
2023 |
2022 |
||||||||||||
| By nature: |
||||||||||||||||
| Royalties expensed |
||||||||||||||||
| Other product costs |
||||||||||||||||
| Employee benefit expense |
5 | |||||||||||||||
| Contract labour |
||||||||||||||||
| Employee-related expense |
||||||||||||||||
| Promotional costs |
||||||||||||||||
| Depreciation and impairment of property, plant and equipment and investment property and assets held for sale | 10 | |||||||||||||||
| Amortisation and impairment of intangible assets – product development | 20 | |||||||||||||||
| Amortisation and impairment of intangible assets – software | 11 | |||||||||||||||
| Amortisation and impairment of intangible assets – other | 11 | |||||||||||||||
| Property and facilities |
||||||||||||||||
| Technology and communications |
||||||||||||||||
| Professional and outsourced services |
||||||||||||||||
| Other general and administrative costs |
||||||||||||||||
| Costs capitalised |
( |
) |
( |
) | ( |
) | ||||||||||
| Other net gains and losses |
( |
) | ||||||||||||||
| Other income |
( |
) |
( |
) | ( |
) | ||||||||||
Total |
||||||||||||||||
Strategic report |
Governance report |
Financial statements |
Other information | |||||
Notes to the consolidated financial statements continued |
||||||||
All figures in £ millions |
2024 |
2023 |
2022 |
|||||||||
The audit of parent company and consolidated financial statements |
||||||||||||
The audit of the company’s subsidiaries |
||||||||||||
Total audit fees* |
||||||||||||
Audit-related and other assurance services |
||||||||||||
Other non-audit services |
||||||||||||
Total other services |
||||||||||||
Total non-audit services |
||||||||||||
Total |
||||||||||||
All figures in £ millions |
2024 |
2023 |
2022 |
|||||||||
Group audit fees including fees for attestation under section 404 of the Sarbanes-Oxley Act |
||||||||||||
Non-audit fees |
||||||||||||
Total |
||||||||||||
| * | Includes fees in connection with the interim review, preliminary announcement and elements of the controls audit required under Section 404 of the Sarbanes Oxley Act. In total this amounted to £1m in each of the years presented. |
| All figures in £ millions | Notes | 2024 |
2023 | 2022 | ||||||||||||
Employee benefit expense |
||||||||||||||||
Wages and salaries (including termination costs) |
||||||||||||||||
Social security costs |
||||||||||||||||
Share-based payment costs |
26 |
|||||||||||||||
Retirement benefits – defined contribution plans |
25 |
|||||||||||||||
Retirement benefits – defined benefit plans |
25 |
|||||||||||||||
Total |
||||||||||||||||
| Average number employed | 2024 |
2023 | 2022 | |||||||||
Employee numbers |
||||||||||||
UK |
||||||||||||
Other European countries |
||||||||||||
US |
||||||||||||
Canada |
||||||||||||
Asia Pacific |
||||||||||||
Other countries |
||||||||||||
Total |
||||||||||||
Strategic report |
Governance report |
Financial statements |
Other information | |||||
All figures in £ millions |
Notes |
2024 |
2023 |
2022 |
||||||||||||
| Interest payable on financial liabilities at amortised cost and associated derivatives | ( |
) |
( |
) | ( |
) | ||||||||||
Interest on lease liabilities |
35 | ( |
) |
( |
) | ( |
) | |||||||||
Interest on deferred and contingent consideration |
( |
) |
( |
) | ( |
) | ||||||||||
| Fair value movements on investments held at fair value | 15 | ( |
) |
|||||||||||||
Net foreign exchange losses |
( |
) |
||||||||||||||
Interest on provisions for uncertain tax positions |
( |
) |
( |
) | ||||||||||||
Fair value movement on derivatives |
( |
) |
( |
) | ( |
) | ||||||||||
Finance costs |
( |
) |
( |
) | ( |
) | ||||||||||
| Interest receivable on financial assets at amortised cost | ||||||||||||||||
Interest on lease receivables |
35 | |||||||||||||||
Net finance income in respect of retirement benefits |
25 | |||||||||||||||
| Fair value movements on investments held at fair value | 15 | |||||||||||||||
| Net foreign exchange gains | ||||||||||||||||
Interest on provisions for uncertain tax positions |
||||||||||||||||
Fair value movement on derivatives |
||||||||||||||||
Finance income |
||||||||||||||||
Net finance (costs)/income |
( |
) |
( |
) | ||||||||||||
| All figures in £ millions | Notes | 2024 |
2023 | 2022 | ||||||||||||
Current tax |
||||||||||||||||
Charge in respect of current year |
( |
) |
( |
) | ( |
) | ||||||||||
Adjustments in respect of prior years |
||||||||||||||||
Total current tax charge |
( |
) |
( |
) | ( |
) | ||||||||||
Deferred tax |
||||||||||||||||
In respect of temporary differences |
( |
) | ||||||||||||||
Other adjustments in respect of prior years |
( |
) |
( |
) | ||||||||||||
Total deferred tax credit/(charge) |
13 | ( |
) |
( |
) | |||||||||||
Total tax charge |
( |
) |
( |
) | ( |
) | ||||||||||
| All figures in £ millions | 2024 |
2023 | 2022 | |||||||||
Profit before tax |
||||||||||||
Tax calculated at UK rate (2024: |
( |
) |
( |
) | ( |
) | ||||||
Effect of overseas tax rates |
( |
) |
( |
) | ( |
) | ||||||
Effect of UK rate change |
( |
) | ||||||||||
Net expense not subject to tax |
( |
) | ( |
) | ||||||||
Gains and losses on sale of businesses not subject to tax |
||||||||||||
Unrecognised tax losses |
||||||||||||
State Aid provision release |
||||||||||||
Movement in provisions for tax uncertainties – current year |
( |
) |
( |
) | ( |
) | ||||||
| Adjustments in respect of prior years – movement in provisions for tax uncertainties | ( |
) |
||||||||||
Adjustments in respect of prior years – other |
( |
) |
||||||||||
Total tax charge |
( |
) |
( |
) | ( |
) | ||||||
UK |
( |
) | ( |
) | ||||||||
Overseas |
( |
) |
( |
) | ( |
) | ||||||
Total tax charge |
( |
) |
( |
) | ( |
) | ||||||
Tax rate reflected in earnings |
||||||||||||
Strategic report |
Governance report |
Financial statements |
Other information | |||||
Notes to the consolidated financial statements continued |
||||||||
|
Key judgements |
||||||
— The application of tax legislation in relation to provisions for uncertain tax positions. |
||||||
|
Key areas of estimation |
||||||
— The level of provisions required in relation to uncertain tax positions is complex and each matter is separately assessed. The estimation of future settlement amounts is based on a number of factors including the status of the unresolved matter, clarity of legislation, range of possible outcomes and the statute of limitations. |
||||||
All figures in £ millions |
2024 |
2023 |
2022 |
|||||||||
Net exchange differences on translation of foreign operations |
||||||||||||
Fair value gains on other financial assets |
||||||||||||
| Remeasurement of retirement benefit obligations | ( |
) |
( |
) | ||||||||
| ( |
) | |||||||||||
Strategic report |
Governance report |
Financial statements |
Other information | |||||
All figures in £ millions |
2024 |
2023 |
2022 |
|||||||||
Earnings for the year |
||||||||||||
Non-controlling interest |
( |
) |
( |
) | ( |
) | ||||||
Earnings attributable to equity shareholders |
||||||||||||
Weighted average number of shares (millions) |
||||||||||||
Effect of dilutive share options (millions) |
||||||||||||
Weighted average number of shares (millions) for diluted earnings |
||||||||||||
Earnings per share (in pence per share) |
||||||||||||
Basic |
||||||||||||
Diluted |
||||||||||||
All figures in £ millions |
2024 |
2023 |
2022 |
|||||||||
Final paid in respect of prior year 2022: |
||||||||||||
Interim paid in respect of current year 2022: |
||||||||||||
Owned assets |
||||||||||||||||||||||||
All figures in £ millions |
Investment property |
Right-of-use assets |
Land and buildings |
Plant and equipment |
Assets in the course of construction |
Total |
||||||||||||||||||
Cost |
||||||||||||||||||||||||
| At 1 January 2023 | ||||||||||||||||||||||||
| Exchange differences | ( |
) | ( |
) | ( |
) | ( |
) | ( |
) | ||||||||||||||
| Additions | ||||||||||||||||||||||||
| Disposals of businesses | ||||||||||||||||||||||||
| (see note 31) | ( |
) | ( |
) | ( |
) | ( |
) | ||||||||||||||||
| Disposals and retirements | ( |
) | ( |
) | ( |
) | ( |
) | ||||||||||||||||
| Reclassifications and transfers | ( |
) | ||||||||||||||||||||||
At 31 December 2023 |
||||||||||||||||||||||||
| Exchange differences | ||||||||||||||||||||||||
| Additions | ||||||||||||||||||||||||
| Disposals of businesses | ||||||||||||||||||||||||
| (note 31) | ||||||||||||||||||||||||
| Disposals and retirements | ( |
) |
( |
) |
( |
) |
( |
) | ||||||||||||||||
| Reclassifications and transfers | ( |
) |
||||||||||||||||||||||
At 31 December 2024 |
||||||||||||||||||||||||
Strategic report |
Governance report |
Financial statements |
Other information | |||||
Notes to the consolidated financial statements continued |
||||||||
| Owned assets | ||||||||||||||||||||||||||||
| All figures in £ millions | Investment property |
Right-of-use assets |
Land and buildings |
Plant and equipment |
Assets in the course of construction |
Total | ||||||||||||||||||||||
Depreciation and impairment |
||||||||||||||||||||||||||||
At 1 January 2023 |
( |
) |
( |
) |
( |
) |
( |
) |
( |
) | ||||||||||||||||||
Exchange differences |
||||||||||||||||||||||||||||
Charge for the year |
( |
) |
( |
) |
( |
) |
( |
) |
( |
) | ||||||||||||||||||
Disposals of businesses |
||||||||||||||||||||||||||||
(note 31) |
||||||||||||||||||||||||||||
Disposals and retirements |
||||||||||||||||||||||||||||
Reclassifications and transfers |
||||||||||||||||||||||||||||
Impairment |
( |
) |
( |
) | ||||||||||||||||||||||||
At 31 December 2023 |
( |
) |
( |
) |
( |
) |
( |
) |
( |
) | ||||||||||||||||||
Exchange differences |
( |
) |
( |
) |
( |
) |
( |
) | ||||||||||||||||||||
Charge for the year |
( |
) |
( |
) |
( |
) |
( |
) |
( |
) | ||||||||||||||||||
Disposals of businesses |
||||||||||||||||||||||||||||
(note 31) |
||||||||||||||||||||||||||||
Disposals and retirements |
||||||||||||||||||||||||||||
Reclassifications and transfers |
||||||||||||||||||||||||||||
Impairment |
( |
) |
( |
) | ||||||||||||||||||||||||
At 31 December 2024 |
( |
) |
( |
) |
( |
) |
( |
) |
( |
) | ||||||||||||||||||
Carrying amounts |
||||||||||||||||||||||||||||
At 1 January 2023 |
||||||||||||||||||||||||||||
At 31 December 2023 |
||||||||||||||||||||||||||||
At 31 December 2024 |
||||||||||||||||||||||||||||
Strategic report |
Governance report |
Financial statements |
Other information | |||||
All figures in £ millions |
Goodwill |
Software |
Acquired customer lists, contracts and relationships |
Acquired trademarks and brands |
Acquired publishing rights |
Other intangibles acquired |
Total |
|||||||||||||||||||||
Cost |
||||||||||||||||||||||||||||
| At 1 January 2023 | ||||||||||||||||||||||||||||
| Exchange differences | ( |
) | ( |
) | ( |
) | ( |
) | ( |
) | ( |
) | ( |
) | ||||||||||||||
| Additions – internal development | – | – | – | – | ||||||||||||||||||||||||
| Additions – purchased | – | – | – | – | ||||||||||||||||||||||||
| Disposals and retirements | – | ( |
) | ( |
) | ( |
) | ( |
) | |||||||||||||||||||
| Acquisition of business (note 30) | – | |||||||||||||||||||||||||||
| Disposal of businesses (note 31) | ( |
) | ( |
) | ( |
) | – | ( |
) | |||||||||||||||||||
| Transfers | – | ( |
) | – | – | – | – | ( |
) | |||||||||||||||||||
At 31 December 2023 |
||||||||||||||||||||||||||||
| Exchange differences | ( |
) |
( |
) |
( |
) | ||||||||||||||||||||||
| Additions – internal development | ||||||||||||||||||||||||||||
| Additions – purchased | ||||||||||||||||||||||||||||
| Disposals and retirements | ( |
) |
( |
) |
( |
) |
( |
) | ||||||||||||||||||||
| Acquisition of business (note 30) | ||||||||||||||||||||||||||||
| Disposal of businesses (note 31) | ||||||||||||||||||||||||||||
| Transfers | ( |
) |
( |
) | ||||||||||||||||||||||||
At 31 December 2024 |
||||||||||||||||||||||||||||
All figures in £ millions |
Goodwill |
Software |
Acquired customer lists, contracts and relationships |
Acquired trademarks and brands |
Acquired publishing rights |
Other intangibles acquired |
Total |
|||||||||||||||||||||
Amortisation and impairment |
||||||||||||||||||||||||||||
| At 1 January 2023 | – | ( |
) | ( |
) | ( |
) | ( |
) | ( |
) | ( |
) | |||||||||||||||
| Exchange differences | – | |||||||||||||||||||||||||||
| Charge for the year | – | ( |
) | ( |
) | ( |
) | ( |
) | ( |
) | ( |
) | |||||||||||||||
| Disposals and retirements | – | – | – | |||||||||||||||||||||||||
| Disposal of businesses (note 31) | – | – | ||||||||||||||||||||||||||
| Transfers | – | – | – | – | – | |||||||||||||||||||||||
At 31 December 2023 |
( |
) |
( |
) |
( |
) |
( |
) |
( |
) |
( |
) | ||||||||||||||||
| Exchange differences | ( |
) |
( |
) |
||||||||||||||||||||||||
| Charge for the year | ( |
) |
( |
) |
( |
) |
( |
) |
( |
) | ||||||||||||||||||
| Disposals and retirements | ||||||||||||||||||||||||||||
| Disposal of businesses (note 31) | ||||||||||||||||||||||||||||
| Transfers | ||||||||||||||||||||||||||||
At 31 December 2024 |
( |
) |
( |
) |
( |
) |
( |
) |
( |
) |
( |
) | ||||||||||||||||
Carrying amounts |
||||||||||||||||||||||||||||
| At 1 January 2023 | ||||||||||||||||||||||||||||
| At 31 December 2023 | ||||||||||||||||||||||||||||
At 31 December 2024 |
||||||||||||||||||||||||||||
| Strategic report |
Governance report |
Financial statements |
Other information | |||||
| Notes to the consolidated financial statements continued |
||||||||
| At 31 December 2024 |
||||
Useful economic life |
||||
| Class of intangible asset |
||||
| Acquired customer lists, contracts and relationships |
||||
| Acquired trademarks and brands |
||||
| Acquired publishing rights |
||||
| Other intangibles acquired |
||||
| At 31 December 2024 |
||||||||||||||||||||
| All figures in £ millions | One to five years |
Six to ten years |
Eleven to fifteen years |
Sixteen to twenty years |
Total |
|||||||||||||||
| Class of intangible asset |
||||||||||||||||||||
| Acquired customer lists, contracts and relationships | ||||||||||||||||||||
| Acquired trademarks and brands |
||||||||||||||||||||
| Acquired publishing rights |
||||||||||||||||||||
| Other intangibles acquired |
||||||||||||||||||||
| All figures in £ millions | 2024 Goodwill |
2023 Goodwill |
||||||
| Assessment & Qualifications |
||||||||
| Virtual Learning |
||||||||
| English Language Learning |
||||||||
| Workforce Skills |
||||||||
| Higher Education |
||||||||
| Total |
||||||||
| Strategic report |
Governance report |
Financial statements |
Other information | |||||
| |
||||||||
2024 |
2023 | |||||||||||||||||||
| Discount rate | Perpetuity growth rate |
Discount rate |
Perpetuity growth rate |
|||||||||||||||||
| Assessment & Qualifications |
||||||||||||||||||||
| Virtual Learning |
||||||||||||||||||||
| English Language Learning |
||||||||||||||||||||
| Workforce Skills |
||||||||||||||||||||
| Higher Education |
||||||||||||||||||||
| All figures in £ millions | 2024 |
2023 | ||||||||||
| Associates |
||||||||||||
| Total |
||||||||||||
| All figures in £ millions | 2024 |
2023 | ||||||||||
| Deferred income tax assets |
||||||||||||
| Deferred income tax liabilities |
( |
) |
( |
) | ||||||||
| Net deferred income tax liability |
( |
) |
( |
) | ||||||||
| Strategic report |
Governance report |
Financial statements |
Other information | |||||
| Notes to the consolidated financial statements continued |
||||||||
Gross |
Tax effected |
|||||||||||||||||||||||||||||||
Year ended 31 December 2024 |
UK | US | Other | Total | UK | US | Other | Total | ||||||||||||||||||||||||
| Tax losses expiring: |
||||||||||||||||||||||||||||||||
| Within 10 years |
||||||||||||||||||||||||||||||||
| Within 10-20 years |
||||||||||||||||||||||||||||||||
| Available indefinitely |
||||||||||||||||||||||||||||||||
| Total |
||||||||||||||||||||||||||||||||
Gross |
Tax effected |
|||||||||||||||||||||||||||||||
Year ended 31 December 2023 |
UK | US | Other | Total | UK | US | Other | Total | ||||||||||||||||||||||||
| Tax losses expiring: |
||||||||||||||||||||||||||||||||
| Within 10 years |
||||||||||||||||||||||||||||||||
| Within 10-20 years |
||||||||||||||||||||||||||||||||
| Available indefinitely |
||||||||||||||||||||||||||||||||
| Total |
||||||||||||||||||||||||||||||||
| All figures in £ millions | Trading losses |
Accruals and other provisions |
Retirement benefit obligations |
Deferred revenue |
Goodwill and intangibles |
Interest limitations |
Other | Total | ||||||||||||||||||||||||
Deferred income tax assets/(liabilities) |
||||||||||||||||||||||||||||||||
| At 1 January 2023 | ( |
) | ( |
) | ||||||||||||||||||||||||||||
| Exchange differences | ( |
) | ( |
) | ( |
) | ( |
) | ( |
) | ||||||||||||||||||||||
| Acquisitions and disposals of subsidiaries | ( |
) | ( |
) | ( |
) | ||||||||||||||||||||||||||
| Income statement benefit/(charge) | ( |
) | ( |
) | ( |
) | ( |
) | ( |
) | ( |
) | ( |
) | ||||||||||||||||||
| Tax charge in OCI/equity | ||||||||||||||||||||||||||||||||
At 31 December 2023 |
( |
) |
( |
) |
( |
) | ||||||||||||||||||||||||||
| Exchange differences | ( |
) |
( |
) |
( |
) | ||||||||||||||||||||||||||
| Acquisitions and disposals of subsidiaries | ||||||||||||||||||||||||||||||||
| Income statement benefit/(charge) | ( |
) |
( |
) |
( |
) |
( |
) | ||||||||||||||||||||||||
| Tax charge in OCI/equity | ( |
) |
||||||||||||||||||||||||||||||
At 31 December 2024 |
( |
) |
( |
) |
( |
) | ||||||||||||||||||||||||||
Strategic report |
Governance report |
Financial statements |
Other information | |||||
2024 |
2023 |
|||||||||||||||||||||||||||||||||||||||||||||||||||
Fair value |
Amortised cost |
Fair value |
Amortised cost |
|||||||||||||||||||||||||||||||||||||||||||||||||
All figures in £ millions |
Notes |
Fair value through other comprehensive income |
Fair value through profit and loss |
Fair value – hedging instrument |
Financial assets |
Total carrying value |
Fair value through other comprehensive income |
Fair value through profit and loss |
Fair value – hedging instrument |
Financial assets |
Total carrying value |
|||||||||||||||||||||||||||||||||||||||||
| Investments in listed and unlisted securities | 15 | |||||||||||||||||||||||||||||||||||||||||||||||||||
| Cash and cash equivalents | 17 | |||||||||||||||||||||||||||||||||||||||||||||||||||
| Derivative financial instruments | 16 | |||||||||||||||||||||||||||||||||||||||||||||||||||
| Trade receivables | 22 | |||||||||||||||||||||||||||||||||||||||||||||||||||
| Contract assets - unbilled | 22 | |||||||||||||||||||||||||||||||||||||||||||||||||||
| Investment in finance lease receivable | 22 | |||||||||||||||||||||||||||||||||||||||||||||||||||
| Other receivable | ||||||||||||||||||||||||||||||||||||||||||||||||||||
Total financial assets |
||||||||||||||||||||||||||||||||||||||||||||||||||||
2024 |
2023 |
|||||||||||||||||||||||||||||||||||||||||||||||||||||||
Fair value Fair value – hedging instrument |
Amortised cost Other financial liabilities |
Fair value |
Amortised cost |
|||||||||||||||||||||||||||||||||||||||||||||||||||||
All figures in £ millions |
Notes |
Fair value through profit and loss |
Total carrying value |
Total market value |
Fair value through profit and loss |
Fair value – hedging instrument |
Other financial liabilities |
Total carrying value |
Total market value |
|||||||||||||||||||||||||||||||||||||||||||||||
| Derivative financial instruments | 16 | ( |
) |
( |
) |
( |
) |
( |
) |
( |
) | ( |
) | ( |
) | ( |
) | |||||||||||||||||||||||||||||||||||||||
| Trade payables | 24 | ( |
) |
( |
) |
( |
) |
( |
) | ( |
) | ( |
) | |||||||||||||||||||||||||||||||||||||||||||
| Deferred and contingent consideration | 24 | ( |
) |
( |
) |
( |
) |
( |
) |
( |
) | ( |
) | ( |
) | |||||||||||||||||||||||||||||||||||||||||
| Borrowings due within one year | 18 | ( |
) |
( |
) |
( |
) |
( |
) | ( |
) | ( |
) | |||||||||||||||||||||||||||||||||||||||||||
| Borrowings due after more than one year | 18 | ( |
) |
( |
) |
( |
) |
( |
) | ( |
) | ( |
) | |||||||||||||||||||||||||||||||||||||||||||
Total financial liabilities |
( |
) |
( |
) |
( |
) |
( |
) |
( |
) |
( |
) | ( |
) | ( |
) | ( |
) |
( |
) | ||||||||||||||||||||||||||||||||||||
Strategic report |
Governance report |
Financial statements |
Other information | |||||
Notes to the consolidated financial statements continued |
||||||||
2024 |
2023 |
|||||||||||||||||||
| All figures in £ millions | Other receivable |
Investments in unlisted securities |
Total |
Total | ||||||||||||||||
| At 1 January | ||||||||||||||||||||
| Exchange differences | ( |
) | ||||||||||||||||||
| Acquisition of investments and other receivable | ||||||||||||||||||||
| Repayments | ( |
) | ||||||||||||||||||
| Disposal of investments | ( |
) | ||||||||||||||||||
| Reclassification out of level 3 | ( |
) |
( |
) |
||||||||||||||||
| Fair value movements – OCI | ( |
) |
( |
) |
||||||||||||||||
| Fair value movements – income statement | ( |
) |
( |
) |
||||||||||||||||
At 31 December |
||||||||||||||||||||
All figures in £ millions |
2024 |
2023 |
||||||
| At 1 January | ( |
) |
( |
) | ||||
| Exchange differences | ||||||||
| Acquisitions | ( |
) |
||||||
| Fair value movements – income statement | ( |
) |
( |
) | ||||
| Repayments | ||||||||
At 31 December |
( |
) |
( |
) | ||||
| All figures in £ millions | 2024 |
2023 |
||||||
| At 1 January | ||||||||
| Exchange differences | ( |
) | ||||||
| Acquisition of investments | ||||||||
| Disposal of investments | ( |
) | ||||||
| Fair value movements – OCI | ( |
) |
||||||
| Fair value movements – income statement | ( |
) |
||||||
At 31 December |
||||||||
| Strategic report |
Governance report |
Financial statements |
Other information | |||||
| |
||||||||
| 2024 |
2023 |
|||||||||||||||||||||||||||
| All figures in £ millions | Gross notional amounts |
Assets |
Liabilities |
Gross notional amounts |
Assets | Liabilities | ||||||||||||||||||||||
| Interest rate derivatives – in a fair value hedge relationship | ( |
) |
( |
) | ||||||||||||||||||||||||
| Interest rate derivatives – not in a hedge relationship | ( |
) |
( |
) | ||||||||||||||||||||||||
| Cross-currency rate derivatives – in a hedge relationship | ( |
) |
( |
) | ||||||||||||||||||||||||
| Cross-currency rate derivatives – not in a hedge relationship | ( |
) |
( |
) | ||||||||||||||||||||||||
| FX derivatives – in a hedge relationship | ( |
) |
||||||||||||||||||||||||||
| FX derivatives – not in a hedge relationship | ( |
) | ||||||||||||||||||||||||||
Total |
( |
) |
( |
) | ||||||||||||||||||||||||
Analysed as expiring: |
||||||||||||||||||||||||||||
| In less than one year | ( |
) |
( |
) | ||||||||||||||||||||||||
| Later than one year and not later than five years | ( |
) |
( |
) | ||||||||||||||||||||||||
| In greater than five years | ( |
) |
||||||||||||||||||||||||||
Total |
( |
) |
( |
) | ||||||||||||||||||||||||
| — | Where interest rate and cross-currency interest rate swaps are used to convert fixed rate debt to floating and we expect to receive inflows equal to the fixed rate debt interest, these are classified as fair value hedges; |
| — | Where derivatives are used to create a future foreign currency exposure to provide protection against currency movements affecting the foreign currency movements of an overseas investment, these are designated as a net investment hedge; |
| — | All other derivatives are not designated in a hedge relationship. |
Receive Notional |
Receive coupon |
FX rate |
Notional |
Pay coupon | ||||
€ |
GBPEUR: |
£ |
||||||
€ |
GBPUSD: |
$ |
||||||
€ |
GBPUSD: |
$ |
SOFR+ | |||||
| Strategic report |
Governance report |
Financial statements |
Other information | |||||
| Notes to the consolidated financial statements continued |
||||||||
| 2024 |
||||||||||||
| All figures in £ millions | Carrying amount of hedging instruments |
Change in fair value of hedging instrument used to determine hedge ineffectiveness |
Nominal amounts of hedging instruments |
|||||||||
| Derivative financial instruments for interest rate risk |
( |
) |
||||||||||
| Derivative financial instruments for currency risk | ( |
) |
||||||||||
| 2023 |
||||||||||||
| All figures in £ millions | Carrying amount of hedging instruments |
Change in fair value of hedging instrument used to determine hedge ineffectiveness |
Nominal amounts of hedging instruments |
|||||||||
| Derivative financial instruments for interest rate risk | ( |
) | ||||||||||
| Derivative financial instruments for currency risk | ( |
) | ||||||||||
2024 |
||||||||||||||||||||
| All figures in £ millions | Carrying amount of hedged items |
Accumulated amount of fair value hedge adjustments on the hedged item included in the carrying amount |
Change in fair value of hedged item used to determine hedge ineffectiveness |
Hedge ineffectiveness |
Line item in profit or loss that includes hedge ineffectiveness |
|||||||||||||||
| Interest rate risk |
||||||||||||||||||||
| Financial liabilities – borrowings | ( |
) |
( |
) |
Finance costs |
|||||||||||||||
| Currency risk |
||||||||||||||||||||
| Financial liabilities – borrowings | ( |
) |
n/a |
Finance costs |
||||||||||||||||
| 2023 | ||||||||||||||||||||
| All figures in £ millions | Carrying amount of hedged items |
Accumulated amount of fair value hedge adjustments on the hedged item included in the carrying amount |
Change in fair value of hedged item used to determine hedge ineffectiveness |
Hedge ineffectiveness |
Line item in profit or loss that includes hedge ineffectiveness |
|||||||||||||||
Interest rate risk |
||||||||||||||||||||
| Financial liabilities – borrowings | ( |
) | Finance costs |
| ||||||||||||||||
Currency risk |
||||||||||||||||||||
| Financial liabilities – borrowings | ( |
) | ||||||||||||||||||
| 2024 |
||||||||||||||||||||
| All figures in £ millions | Carrying amount of hedging instruments |
Change in value of hedging instrument used to determine hedge ineffectiveness |
Nominal amounts of hedging instruments |
Hedging gains/(losses) recognised in OCI |
Hedge ineffectiveness recognised in profit or loss |
|||||||||||||||
| Derivative financial instruments | ( |
) |
( |
) |
( |
) |
||||||||||||||
| Financial liabilities – borrowings | ||||||||||||||||||||
| Strategic report |
Governance report |
Financial statements |
Other information | |||||
| |
||||||||
| 2023 |
||||||||||||||||||||
| All figures in £ millions | Carrying amount of hedging instruments |
Change in value of hedging instrument used to determine hedge ineffectiveness |
Nominal amounts of hedging instruments |
Hedging gains/(losses) recognised in OCI |
Hedge ineffectiveness recognised in profit or loss |
|||||||||||||||
| Derivative financial instruments | ( |
) | ||||||||||||||||||
| Financial liabilities – borrowings | ||||||||||||||||||||
| 2024 |
2023 | |||||||||||||||||||||||||||
| All figures in £ millions | Gross derivative assets |
Gross derivative liabilities |
Net derivative assets/ liabilities |
Gross derivative assets |
Gross derivative liabilities |
Net derivative assets/ liabilities |
||||||||||||||||||||||
| Counterparties in an asset position | ( |
) |
( |
) | ||||||||||||||||||||||||
| Counterparties in a liability position | ( |
) |
( |
) |
( |
) | ( |
) | ||||||||||||||||||||
Total as presented in the balance sheet |
( |
) |
( |
) |
( |
) | ||||||||||||||||||||||
| All figures in £ millions | 2024 |
2023 | ||||||
| Cash at bank and in hand |
||||||||
| Short-term bank deposits |
||||||||
| Cash and cash equivalents |
||||||||
| All figures in £ millions | 2024 |
2023 | ||||||
| Cash and cash equivalents |
||||||||
| Bank overdrafts |
( |
) | ||||||
| Cash and cash equivalents in the cash flow statement |
||||||||
| All figures in £ millions | 2024 |
2023 | ||||||
| Non-current |
||||||||
| € |
||||||||
| |
||||||||
| |
||||||||
| Lease liabilities (see note 35) |
||||||||
| Current (due within one year or on demand) |
||||||||
| € |
||||||||
| Lease liabilities (see note 35) |
||||||||
| Overdrafts |
||||||||
| Total borrowings |
||||||||
| Strategic report |
Governance report |
Financial statements |
Other information | |||||
| Notes to the consolidated financial statements continued |
||||||||
| All figures in £ millions | 2024 |
2023 | ||||||
| Between one and two years |
||||||||
| Between two and five years |
||||||||
| Over five years |
||||||||
| 2024 |
2023 |
|||||||||||||||||||||||||||
| All figures in £ millions | Effective interest rate |
Carrying value |
Market value |
Effective interest rate |
Carrying value |
Market value |
||||||||||||||||||||||
| 1.375% Euro notes 2025 |
||||||||||||||||||||||||||||
| 3.75% GBP notes 2030 |
||||||||||||||||||||||||||||
| 5.375% GBP notes 2034 |
||||||||||||||||||||||||||||
| Overdrafts |
n/a |
n/a | ||||||||||||||||||||||||||
| All figures in £ millions | 2024 |
2023 | ||||||
| US dollar |
||||||||
| Sterling |
||||||||
| Euro |
||||||||
| Other |
||||||||
| — | To maintain a strong balance sheet and a solid investment grade rating; |
| — | To continue to invest in the business organically and through acquisitions; and |
| — | To have a sustainable and progressive dividend policy. |
| All figures in £ millions | 2024 |
2023 | ||||||
| Cash and cash equivalents |
||||||||
| Overdrafts |
( |
) | ||||||
| Derivative financial instruments |
( |
) |
||||||
| Bonds |
( |
) |
( |
) | ||||
| Investment in finance lease receivable |
||||||||
| Lease liabilities |
( |
) |
( |
) | ||||
| Net debt |
( |
) |
( |
) | ||||
| Strategic report |
Governance report |
Financial statements |
Other information | |||||
| |
||||||||
| 2024 |
||||||||||||||||||||
| All figures in £ millions | Carrying value |
Impact of 1% increase in interest rates |
Impact of 1% decrease in interest rates |
Impact of 10% strengthening in sterling |
Impact of 10% weakening in sterling |
|||||||||||||||
| Investments in listed and unlisted securities | ( |
) |
||||||||||||||||||
| Other receivable | ( |
) |
||||||||||||||||||
| Cash and cash equivalents | ( |
) |
||||||||||||||||||
| Derivative financial instruments | ( |
) |
( |
) |
( |
) | ||||||||||||||
| Bonds | ( |
) |
( |
) | ||||||||||||||||
| Other borrowings | ( |
) |
( |
) | ||||||||||||||||
| Investment in finance lease receivable | ( |
) |
||||||||||||||||||
| Deferred and contingent consideration | ( |
) |
( |
) | ||||||||||||||||
| Other net financial assets | ( |
) |
||||||||||||||||||
| Total |
( |
) |
( |
) |
( |
) |
||||||||||||||
| 2023 |
||||||||||||||||||||
| All figures in £ millions |
Carrying value |
Impact of 1% increase in interest rates |
Impact of 1% decrease in interest rates |
Impact of 10% strengthening in sterling |
Impact of 10% weakening in sterling |
|||||||||||||||
| Investments in unlisted securities | ( |
) | ||||||||||||||||||
| Other receivable | ( |
) | ||||||||||||||||||
| Cash and cash equivalents | ( |
) | ||||||||||||||||||
| Derivative financial instruments | ( |
) | ( |
) | ||||||||||||||||
| Bonds | ( |
) | ( |
) | ( |
) | ||||||||||||||
| Other borrowings | ( |
) | ( |
) | ||||||||||||||||
| Investment in finance lease receivable | ( |
) | ||||||||||||||||||
| Deferred and contingent consideration | ( |
) | ( |
) | ||||||||||||||||
| Other net financial assets | ( |
) | ||||||||||||||||||
| Total |
( |
) | ( |
) | ( |
) | ||||||||||||||
| Strategic report |
Governance report |
Financial statements |
Other information | |||||
| Notes to the consolidated financial statements continued |
||||||||
Analysed by maturity |
Analysed by currency |
|||||||||||||||||||||||||||||||
All figures in £ millions |
Greater than one month and less than one year |
Later than one year but less than five years |
Five years or more |
Total |
USD |
GBP |
Other |
Total |
||||||||||||||||||||||||
| At 31 December 2024 |
||||||||||||||||||||||||||||||||
| Bonds |
||||||||||||||||||||||||||||||||
| Rate derivatives – inflows |
( |
) |
( |
) |
( |
) |
( |
) |
( |
) |
( |
) |
( |
) |
( |
) | ||||||||||||||||
| Rate derivatives – outflows |
||||||||||||||||||||||||||||||||
| FX forwards – inflows |
( |
) |
( |
) |
( |
) |
( |
) | ||||||||||||||||||||||||
| FX forwards – outflows |
||||||||||||||||||||||||||||||||
| Total |
( |
) |
( |
) |
||||||||||||||||||||||||||||
| At 31 December 2023 |
||||||||||||||||||||||||||||||||
| Bonds |
||||||||||||||||||||||||||||||||
| Rate derivatives – inflows |
( |
) | ( |
) | ( |
) | ( |
) | ( |
) | ( |
) | ( |
) | ||||||||||||||||||
| Rate derivatives – outflows |
||||||||||||||||||||||||||||||||
| FX forwards – inflows |
( |
) | ( |
) | ( |
) | ( |
) | ||||||||||||||||||||||||
| FX forwards – outflows |
||||||||||||||||||||||||||||||||
| Total |
( |
) | ||||||||||||||||||||||||||||||
| Strategic report |
Governance report |
Financial statements |
Other information | |||||
| |
||||||||
| All figures in £ millions | 2024 |
2023 | ||||||
| Cost |
||||||||
| At 1 January |
||||||||
| Exchange differences |
( |
) | ||||||
| Additions |
||||||||
| Disposals and retirements |
( |
) |
( |
) | ||||
| Disposal of businesses (note 31) |
( |
) | ||||||
| Transfers |
( |
) | ||||||
| At 31 December |
||||||||
| Amortisation |
||||||||
| At 1 January |
( |
) |
( |
) | ||||
| Exchange differences |
( |
) |
||||||
| Charge for the year |
( |
) |
( |
) | ||||
| Impairment |
( |
) |
( |
) | ||||
| Disposals and retirements |
||||||||
| Disposal of businesses (note 31) |
||||||||
| Transfers |
( |
) |
||||||
| At 31 December |
( |
) |
( |
) | ||||
| Carrying amounts at 31 December |
||||||||
| All figures in £ millions | 2024 |
2023 | ||||||
| Raw materials |
||||||||
| Work in pro gress |
||||||||
| Finished goods |
||||||||
| Returns asset |
||||||||
| All figures in £ millions | 2024 |
2023 | ||||||
| Current |
||||||||
| Trade receivables |
||||||||
| Contract assets - unbilled 1 |
||||||||
| Investment in finance lease receivable |
||||||||
| Prepayments and other receivables |
||||||||
| Non-current |
||||||||
| Trade receivables |
||||||||
| Contract assets - unbilled 1 |
||||||||
| Investment in finance lease receivable |
||||||||
| Prepayments and other receivables |
||||||||
| 1. | In 2024, contract assets - unbilled have been shown separately from trade receivables. The 2023 comparative has not been restated on the grounds of materiality. |
| Strategic report |
Governance report |
Financial statements |
Other information | |||||
| Notes to the consolidated financial statements continued |
||||||||
| All figures in £ millions | 2024 |
2023 |
||||||
| At 1 January |
( |
( |
) | |||||
| Exchange differences |
||||||||
| Income statement movements |
( |
|||||||
| Utilised |
||||||||
| Disposal of businesses |
||||||||
| At 31 December |
( |
( |
) | |||||
| All figures in £ millions | 2024 |
2023 |
||||||
| Contract assets – unbilled 1 |
||||||||
| Within due date and one month past due date |
||||||||
| One to three months past due date |
||||||||
| Three to six months past due date |
||||||||
| Six to nine months past due date |
||||||||
| Nine to 12 months past due date |
||||||||
| More than 12 months past due date |
||||||||
| Gross trade receivables |
||||||||
| 1. | In 2024, contract assets - unbilled have been shown separately from trade receivables. The 2023 comparative has not been restated on the grounds of materiality. |
| All figures in £ millions |
Property | Legal and other |
Total | |||||||||
| At 1 January 2024 |
||||||||||||
| Provisions made during the year |
||||||||||||
| Provisions reversed during the year |
( |
) |
( |
) |
( |
) | ||||||
| Provisions used during the year |
( |
) |
( |
) |
( |
) | ||||||
| At 31 December 2024 |
||||||||||||
| 2024 |
||||||||||||
| All figures in £ millions | Property | Legal and other |
Total | |||||||||
| Current |
||||||||||||
| Non-current |
||||||||||||
| 2023 | ||||||||||||
| Current |
||||||||||||
| Non-current |
||||||||||||
| Strategic report |
Governance report |
Financial statements |
Other information | |||||
| |
||||||||
| All figures in £ millions | 2024 |
2023 | ||||||
| Current |
||||||||
| Trade payables |
||||||||
| Sales return liability |
||||||||
| Deferred income |
||||||||
| Interest payable |
||||||||
| Accruals and other liabilities |
||||||||
| Non-current |
||||||||
| Deferred income |
||||||||
| Accruals and other liabilities |
||||||||
| All figures in % | Active | Deferred | Pensioners | Total | ||||||||||||
| Defined benefit |
||||||||||||||||
| Defined contribution |
||||||||||||||||
| Total |
||||||||||||||||
|
|
Key judgements | |||||
| — |
Whether the Group will be eligible to receive the surplus associated with the UK Group Pension Plan in recognising a pension asset. |
|||||
|
|
Key areas of estimation | |||||
| — | The determination of the pension cost and defined benefit obligation of the Group’s defined benefit pension schemes depends on the selection of certain assumptions, which include the discount rate, inflation rate, salary growth and longevity. |
|||||
| Strategic report |
Governance report |
Financial statements |
Other information | |||||
| Notes to the consolidated financial statements continued |
||||||||
2024 |
2023 | 2022 | ||||||||||||||||||||||||||||||||||||
| All figures in % | UK Group plan |
Other plans |
PRMB |
UK Group plan |
Other plans |
PRMB | UK Group plan |
Other plans |
PRMB | |||||||||||||||||||||||||||||
| Inflation | ||||||||||||||||||||||||||||||||||||||
| Rate used to discount plan liabilities | ||||||||||||||||||||||||||||||||||||||
| Expected rate of increase in salaries | ||||||||||||||||||||||||||||||||||||||
| Expected rate of increase for pensions in payment and deferred pensions | |
|
||||||||||||||||||||||||||||||||||||
| Initial rate of increase in healthcare rate | ||||||||||||||||||||||||||||||||||||||
| Ultimate rate of increase in healthcare rate | ||||||||||||||||||||||||||||||||||||||
| UK | US | |||||||||||||||||||||||||
| All figures in years | 2024 |
2023 | 2022 | 2024 |
2023 | 2022 | ||||||||||||||||||||
| Male | ||||||||||||||||||||||||||
| Female | ||||||||||||||||||||||||||
| UK | US | |||||||||||||||||||||||||
| All figures in years | 2024 |
2023 | 2022 | 2024 |
2023 | 2022 | ||||||||||||||||||||
| Male | ||||||||||||||||||||||||||
| Female | ||||||||||||||||||||||||||
| Strategic report |
Governance report |
Financial statements |
Other information | |||||
| |
||||||||
2024 |
||||||||||||||||||||||||
| All figures in £ millions | UK Group plan |
Defined benefit other |
Sub-total |
Defined contribution |
PRMB |
Total |
||||||||||||||||||
| Current service cost | ||||||||||||||||||||||||
| Past service cost | ||||||||||||||||||||||||
| Settlements | ||||||||||||||||||||||||
| Administration expenses | ||||||||||||||||||||||||
Total operating expense |
||||||||||||||||||||||||
| Interest on plan assets | ( |
) |
( |
) |
( |
) |
( |
) | ||||||||||||||||
| Interest on plan liabilities | ||||||||||||||||||||||||
Net finance (income)/expense |
( |
) |
( |
) |
( |
) | ||||||||||||||||||
Net income statement charge |
||||||||||||||||||||||||
| 2023 |
||||||||||||||||||||||||
| All figures in £ millions | UK Group plan |
Defined benefit other |
Sub-total |
Defined contribution |
PRMB | Total | ||||||||||||||||||
| Current service cost | ||||||||||||||||||||||||
| Past service cost | ||||||||||||||||||||||||
| Settlements | ||||||||||||||||||||||||
| Administration expenses | ||||||||||||||||||||||||
Total operating expense |
||||||||||||||||||||||||
| Interest on plan assets | ( |
) | ( |
) | ( |
) | ( |
) | ||||||||||||||||
| Interest on plan liabilities | ||||||||||||||||||||||||
Net finance (income)/expense |
( |
) | ( |
) | ( |
) | ||||||||||||||||||
Net income statement charge |
( |
) | ||||||||||||||||||||||
| |
|
|
|
|
|
2022 |
||||||||||||||||||
| All figures in £ millions | UK Group plan |
Defined benefit other |
Sub-total |
Defined contribution |
PRMB | Total | ||||||||||||||||||
| Current service cost | ||||||||||||||||||||||||
| Past service cost | ||||||||||||||||||||||||
| Settlements | ||||||||||||||||||||||||
| Administration expenses | ||||||||||||||||||||||||
Total operating expense |
||||||||||||||||||||||||
| Interest on plan assets | ( |
) | ( |
) | ( |
) | ( |
) | ||||||||||||||||
| Interest on plan liabilities | ||||||||||||||||||||||||
Net finance (income)/expense |
( |
) | ( |
) | ( |
) | ||||||||||||||||||
Net income statement charge |
||||||||||||||||||||||||
| 2024 |
|
|
|
|
2023 |
|||||||||||||||||||||||||||||
| All figures in £ millions | UK Group plan |
Other funded plans |
Other unfunded plans |
Total |
|
UK Group plan |
Other funded plans |
Other unfunded plans |
Total | |||||||||||||||||||||||||
| Fair value of plan assets | ||||||||||||||||||||||||||||||||||
| Present value of defined benefit obligation | ( |
) |
( |
) |
( |
) |
( |
) |
( |
) | ( |
) | ( |
) | ( |
) | ||||||||||||||||||
Net pension asset/ (liability) |
( |
) |
( |
) | ||||||||||||||||||||||||||||||
| Other post-retirement medical benefit obligation | ( |
) |
( |
) | ||||||||||||||||||||||||||||||
| Other pension accruals | ( |
) |
( |
) | ||||||||||||||||||||||||||||||
Net retirement benefit asset |
||||||||||||||||||||||||||||||||||
Analysed as: |
||||||||||||||||||||||||||||||||||
| Retirement benefit assets | ||||||||||||||||||||||||||||||||||
| Retirement benefit obligations | ( |
) |
( |
) | ||||||||||||||||||||||||||||||
| Strategic report |
Governance report |
Financial statements |
Other information | |||||
| Notes to the consolidated financial statements continued |
||||||||
| All figures in £ millions |
2024 |
2023 |
2022 |
|||||||||
| Amounts recognised for defined benefit plans | ( |
) | ||||||||||
| Amounts recognised for post-retirement medical benefit plans | ||||||||||||
Total recognised in year |
( |
) | ||||||||||
| 2024 |
2023 |
|||||||||||||||||||||||||
| All figures in % | UK Group plan |
Other funded plans |
Total |
UK Group plan |
Other funded plans |
Total | ||||||||||||||||||||
| Insurance | ||||||||||||||||||||||||||
| Equities | ||||||||||||||||||||||||||
| Fixed interest securities | ||||||||||||||||||||||||||
| Property | ||||||||||||||||||||||||||
| Pooled asset investment funds (including LDI) | ||||||||||||||||||||||||||
| Infrastructure | ||||||||||||||||||||||||||
| Cash and cash equivalents | ||||||||||||||||||||||||||
| Other | ||||||||||||||||||||||||||
| |
2024 |
|
|
2023 |
||||||||||||||
| All figures in % | Quoted market price |
No quoted market price |
|
Quoted market price |
No quoted market price |
|||||||||||||
| Insurance | ||||||||||||||||||
| Equities | ||||||||||||||||||
| Fixed-interest securities | ||||||||||||||||||
| Property | ||||||||||||||||||
| Pooled asset investment funds (including LDI) | ||||||||||||||||||
| Infrastructure | ||||||||||||||||||
| Cash and cash equivalents | ||||||||||||||||||
| Other | ||||||||||||||||||
Total |
||||||||||||||||||
| All figures in % |
2024 |
2023 |
||||||
| Liquid – call <1 month | ||||||||
| Less liquid – call 1–3 months | ||||||||
| Illiquid – call >3 months | ||||||||
| Strategic report |
Governance report |
Financial statements |
Other information | |||||
| |
||||||||
| 2024 |
2023 |
|||||||||||||||||||||||||||
| All figures in £ millions | UK Group plan |
Other plans |
Total |
UK Group plan |
Other plans |
Total | ||||||||||||||||||||||
Fair value of plan assets |
||||||||||||||||||||||||||||
| Opening fair value of plan assets | ||||||||||||||||||||||||||||
| Exchange differences | ( |
) |
( |
) |
( |
) | ( |
) | ||||||||||||||||||||
| Interest on plan assets | ||||||||||||||||||||||||||||
| Return on plan assets excluding interest | ( |
) |
( |
) |
( |
) | ( |
) | ||||||||||||||||||||
| Contributions by employer | ||||||||||||||||||||||||||||
| Contributions by employees | ||||||||||||||||||||||||||||
| Benefits paid | ( |
) |
( |
) |
( |
) |
( |
) | ( |
) | ( |
) | ||||||||||||||||
| Settlements | ( |
) |
( |
) |
( |
) | ( |
) | ||||||||||||||||||||
Closing fair value of plan assets |
||||||||||||||||||||||||||||
Present value of defined benefit obligation |
||||||||||||||||||||||||||||
| Opening defined benefit obligation | ( |
) |
( |
) |
( |
) |
( |
) | ( |
) | ( |
) | ||||||||||||||||
| Exchange differences | ||||||||||||||||||||||||||||
| Current service cost | ( |
) |
( |
) |
( |
) |
( |
) | ( |
) | ( |
) | ||||||||||||||||
| Past service cost | ( |
) |
( |
) |
||||||||||||||||||||||||
| Administration expenses | ( |
) |
( |
) |
( |
) | ( |
) | ||||||||||||||||||||
| Interest on plan liabilities | ( |
) |
( |
) |
( |
) |
( |
) | ( |
) | ( |
) | ||||||||||||||||
| Actuarial losses – experience | ( |
) |
( |
) |
( |
) | ( |
) | ( |
) | ||||||||||||||||||
| Actuarial gains – demographic | ||||||||||||||||||||||||||||
| Actuarial gains/(losses) – financial | ( |
) | ( |
) | ( |
) | ||||||||||||||||||||||
| Contributions by employees | ( |
) |
( |
) |
( |
) | ( |
) | ||||||||||||||||||||
| Benefits paid | ||||||||||||||||||||||||||||
| Settlements | ||||||||||||||||||||||||||||
Closing defined benefit obligation |
( |
) |
( |
) |
( |
) |
( |
) | ( |
) | ( |
) | ||||||||||||||||
| All figures in £ millions | 2024 |
2023 |
||||||
| Opening defined benefit obligation | ( |
) |
( |
) | ||||
| Exchange differences | ||||||||
| Interest on plan liabilities | ( |
) |
||||||
| Actuarial gains – experience | ||||||||
| Actuarial losses – financial | ( |
) | ||||||
| Benefits paid | ||||||||
Closing defined benefit obligation |
( |
) |
( |
) | ||||
| Strategic report |
Governance report |
Financial statements |
Other information | |||||
| Notes to the consolidated financial statements continued |
||||||||
| 2024 |
||||||||
| All figures in £ millions | ||||||||
| Effect: |
||||||||
| (Decrease)/increase in defined benefit obligation – UK Group plan | ( |
) |
||||||
| (Decrease)/increase in defined benefit obligation – US plan |
( |
) |
||||||
| 2024 |
||||||||
| All figures in £ millions | decrease |
|||||||
| Effect: |
||||||||
| Increase/(decrease) in defined benefit obligation – UK Group plan | ( |
) | ||||||
| Increase/(decrease) in defined benefit obligation – US plan | ( |
) | ||||||
| 2024 |
||||||||
| All figures in £ millions | ||||||||
| Effect: |
||||||||
| Increase/(decrease) in defined benefit obligation – UK Group plan | ( |
) | ||||||
| Increase/(decrease) in defined benefit obligation – US plan | ||||||||
| All figures in £ millions |
2024 |
2023 | 2022 | |||||||||
| Pearson plans | ||||||||||||
| Strategic report |
Governance report |
Financial statements |
Other information | |||||
| |
||||||||
2024 |
2023 | |||||||||||||||
| Number of shares 000s |
Weighted average fair value £ |
Number of shares 000s |
Weighted average fair value £ |
|||||||||||||
| Long-Term Incentive Plan | ||||||||||||||||
| Number of shares 000s |
Share capital £m |
Share premium £m |
||||||||||
| At 31 December 2022 | ||||||||||||
| Issue of ordinary shares – share option schemes | ||||||||||||
| Buyback of equity | ( |
) | ( |
) | ||||||||
At 31 December 2023 |
||||||||||||
| Issue of ordinary shares – share option schemes | ||||||||||||
| Buyback of equity | ( |
) |
( |
) |
||||||||
At 31 December 2024 |
||||||||||||
| Strategic report |
Governance report |
Financial statements |
Other information | |||||
| Notes to the consolidated financial statements continued |
||||||||
| Number of shares 000s |
£m | |||||||
| At 1 January 2022 | ||||||||
| Purchase of treasury shares | ||||||||
| Release of treasury shares | ( |
( |
||||||
At 31 December 2023 |
||||||||
| Purchase of treasury shares | ||||||||
| Release of treasury shares | ( |
( |
||||||
At 31 December 2024 |
||||||||
| 2024 |
||||||||||||||||||||||||
Attributable to equity holders of the company |
||||||||||||||||||||||||
| All figures in £ millions | Fair value reserve |
Translation reserve |
Retained earnings |
Total |
Non- controlling interest |
Total |
||||||||||||||||||
Items that may be reclassified to the income statement |
|
|
|
|
|
|
|
|
|
|
|
|
|
|
|
|
|
| ||||||
| Net exchange differences on translation of foreign operations | – |
( |
) |
– |
( |
) |
– |
( |
||||||||||||||||
| Currency translation adjustment disposed | – |
– |
– |
– |
– |
– |
||||||||||||||||||
| Attributable tax | – |
– |
– |
|||||||||||||||||||||
Items that are not reclassified to the income statement |
|
|
|
|
|
|
|
|
|
|
|
|
|
|
|
|||||||||
Fair value losses on other financial assets |
( |
) |
– |
– |
( |
) |
– |
( |
||||||||||||||||
| Attributable tax | – |
– |
– |
– |
– |
– |
||||||||||||||||||
| Remeasurement of retirement benefit obligations | – |
– |
– |
|||||||||||||||||||||
| Attributable tax | – |
– |
( |
) |
( |
) |
– |
( |
||||||||||||||||
Other comprehensive income/(expense) for the year |
( |
) |
( |
) |
( |
) |
– |
( |
||||||||||||||||
| Strategic report |
Governance report |
Financial statements |
Other information | |||||
| |
||||||||
| |
|
|
|
|
|
2023 |
||||||||||||||||||
| |
Attributable to equity holders of the company |
|
|
|||||||||||||||||||||
| All figures in £ millions | Fair value reserve |
Translation reserve |
Retained earnings |
Total | Non- controlling interest |
Total | ||||||||||||||||||
Items that may be reclassified to the income statement |
|
|
|
|
|
|
|
|
|
|
|
|
|
|
|
|
|
| ||||||
| Net exchange differences on translation of foreign operations | – | ( |
) | – | ( |
) | ( |
) | ( |
) | ||||||||||||||
| Currency translation adjustment disposed | – | ( |
) | – | ( |
) | – | ( |
) | |||||||||||||||
| Attributable tax | – | – | – | – | – | – | ||||||||||||||||||
Items that are not reclassified to the income statement |
|
|
|
|
|
|
|
|
|
|
|
|
|
|
|
|
|
| ||||||
| Fair value gain on other financial assets | – | – | – | |||||||||||||||||||||
| Attributable tax | – | – | – | – | – | – | ||||||||||||||||||
| Remeasurement of retirement benefit obligations | – | – | ( |
) | ( |
) | – | ( |
) | |||||||||||||||
| Attributable tax | – | – | – | |||||||||||||||||||||
Other comprehensive income/(expense) for the year |
( |
) | ( |
) | ( |
) | ( |
) | ( |
) | ||||||||||||||
| |
|
|
|
|
|
2022 |
||||||||||||||||||
| |
Attributable to equity holders of the company |
|
|
|||||||||||||||||||||
| All figures in £ millions | Fair value reserve |
Translation reserve |
Retained earnings |
Total | Non- controlling interest |
Total | ||||||||||||||||||
Items that may be reclassified to the income statement |
|
|
|
|
|
|
|
|
|
|
|
|
|
|
|
|
|
| ||||||
| Net exchange differences on translation of foreign operations | – | – | ||||||||||||||||||||||
| Currency translation adjustment disposed | – | ( |
) | – | ( |
) | – | ( |
) | |||||||||||||||
| Attributable tax | – | – | – | |||||||||||||||||||||
Items that are not reclassified to the income statement |
|
|
|
|
|
|
|
|
|
|
|
|
|
|
|
|
|
| ||||||
| Fair value gain on other financial assets | – | – | – | |||||||||||||||||||||
| Attributable tax | – | – | – | |||||||||||||||||||||
| Remeasurement of retirement benefit obligations | – | – | – | |||||||||||||||||||||
| Attributable tax | – | – | ( |
) | ( |
) | – | ( |
) | |||||||||||||||
Other comprehensive income/(expense) for the year |
||||||||||||||||||||||||
| Strategic report |
Governance report |
Financial statements |
Other information | |||||
| Notes to the consolidated financial statements continued |
||||||||
| All figures in £ millions | 2024 Total |
2023 Total |
2022 Total |
|||||||||
| Intangible assets | ||||||||||||
| Deferred tax asset | ||||||||||||
| Trade and other receivables | ||||||||||||
| Cash and cash equivalents | ||||||||||||
| Trade and other liabilities | ( |
) | ( |
) | ||||||||
| Deferred tax liabilities | ( |
) | ( |
) | ||||||||
Net assets acquired |
||||||||||||
| Goodwill | ||||||||||||
Total |
||||||||||||
Satisfied by: |
||||||||||||
| Cash consideration | ||||||||||||
| Contingent or deferred consideration | ||||||||||||
| Fair value of existing investment | ||||||||||||
Total consideration |
||||||||||||
| All figures in £ millions | 2024 Total |
2023 Total |
2022 Total |
|||||||||
Cash flow on acquisitions |
|
|
|
|
|
|
|
|
| |||
| Cash – current year acquisitions | ( |
) |
( |
) | ( |
) | ||||||
| Cash and cash equivalents acquired | ||||||||||||
| Deferred payments for prior year acquisitions and other items | ( |
) |
( |
) | ( |
) | ||||||
Net cash outflow |
( |
) |
( |
) | ( |
) | ||||||
| Strategic report |
Governance report |
Financial statements |
Other information | |||||
| |
||||||||
| All figures in £ millions |
|
2024 |
2023 |
2022 |
||||||||||||
Disposal of subsidiaries and associates |
|
|
|
|
|
|
|
|
|
|
|
| ||||
| Intangible assets, including goodwill | |
|
|
( |
) | ( |
) | |||||||||
| Property, plant and equipment | |
|
|
( |
) | ( |
) | |||||||||
| Intangible assets – product development | |
|
|
( |
) | ( |
) | |||||||||
| Inventories | |
|
|
( |
) | ( |
) | |||||||||
| Trade and other receivables | |
|
|
( |
) | ( |
) | |||||||||
| Deferred tax | |
|
|
( |
) | |||||||||||
| Current tax receivable | |
|
|
( |
) | |||||||||||
| Cash and cash equivalents (excluding overdrafts) | |
|
|
( |
) | ( |
) | |||||||||
| Provisions for other liabilities and charges | |
|
|
|||||||||||||
| Retirement benefit obligations | |
|
|
|||||||||||||
| Trade and other liabilities | |
|
|
|||||||||||||
| Financial liabilities – borrowings | ||||||||||||||||
Net assets disposed |
|
|
|
( |
) | ( |
) | |||||||||
| Cumulative currency translation adjustment | |
|
|
|||||||||||||
| Cash proceeds | |
|
|
|||||||||||||
| Deferred proceeds | |
|
|
|||||||||||||
| Costs of disposal | ( |
) |
( |
) | ( |
) | ||||||||||
(Loss)/gain on disposal |
( |
) |
( |
) | ||||||||||||
| All figures in £ millions |
|
2024 |
2023 |
2022 |
||||||||||||
Cash flow from disposals |
|
|
|
|
|
|
|
|
|
|
|
| ||||
| Proceeds – current year disposals | |
|
|
|||||||||||||
| Proceeds – prior year disposals | |
|
|
|||||||||||||
| Cash and cash equivalents disposed | |
|
|
( |
) | ( |
) | |||||||||
| Costs and other disposal liabilities paid | ( |
) |
( |
) | ( |
) | ||||||||||
Net cash (outflow)/inflow |
( |
) |
( |
) | ||||||||||||
Strategic report |
Governance report |
Financial statements |
Other information | |||||
Notes to the consolidated financial statements continued |
||||||||
All figures in £ millions |
|
2024 |
2023 | |||||||||
Net book amount |
||||||||||||
| Profit/(loss) on sale of property, plant and equipment | ( |
) | ||||||||||
Proceeds from sale of property, plant and equipment |
||||||||||||
| All figures in £ millions | 2023 | Fair value and other movements |
Foreign exchange movements |
Financing cash flows |
Transfer from non- current to current |
New leases/ disposal of leases |
2024 |
|||||||||||||||||||||
Financial liabilities |
||||||||||||||||||||||||||||
Non-current borrowings |
( |
) |
( |
) |
||||||||||||||||||||||||
| Current borrowings | ( |
) |
||||||||||||||||||||||||||
Total |
||||||||||||||||||||||||||||
| All figures in £ millions | 2022 | Fair value and other movements |
Foreign exchange movements |
Financing cash flows |
Transfer from non- current to current |
New leases/ disposal of leases |
2023 | |||||||||||||||||||||
Financial liabilities |
||||||||||||||||||||||||||||
Non-current borrowings |
( |
) | ( |
) | ( |
) | ||||||||||||||||||||||
| Current borrowings | ( |
) | ( |
) | ( |
) | ||||||||||||||||||||||
Total |
( |
) | ( |
) | ||||||||||||||||||||||||
|
Key judgements |
||||||
— The application of tax legislation in relation to provisions for uncertain tax positions. |
||||||
|
Key areas of estimation |
||||||
— The level of provisions required in relation to uncertain tax positions is complex and each matter is separately assessed. The estimation of future settlement amounts is based on a number of factors including the status of the unresolved matter, clarity of legislation, range of possible outcomes and the statute of limitations. |
||||||
Strategic report |
Governance report |
Financial statements |
Other information | |||||
All figures in £ millions |
Note |
2024 |
2023 |
2022 |
||||||||||||
| Interest on lease liabilities | ( |
) |
( |
) | ( |
) | ||||||||||
| Expenses relating to short-term leases | – | |||||||||||||||
| Depreciation of right-of-use |
10 | ( |
) |
( |
) | ( |
) | |||||||||
| Impairment of right-of-use |
10 | ( |
) | ( |
) | |||||||||||
All figures in £ millions |
2024 |
2023 |
||||||||||
| Less than one year | ||||||||||||
| One to five years | ||||||||||||
More than five years |
||||||||||||
Total undiscounted lease liabilities |
||||||||||||
Lease liabilities included in the balance sheet |
||||||||||||
| Analysed as: | ||||||||||||
| Current | ||||||||||||
Non-current |
||||||||||||
All figures in £ millions |
2024 |
2023 | 2022 | |||||||||
| Total cash outflow for leases as a lessee | ||||||||||||
All figures in £ millions |
2024 |
2023 | 2022 | |||||||||
| Interest on lease receivables | ||||||||||||
| Income from subleasing right-of-use |
||||||||||||
All figures in £ millions |
2024 |
2023 | 2022 | |||||||||
| Total cash inflow for leases as a lessor | ||||||||||||
| Strategic report |
Governance report |
Financial statements |
Other information | |||||
| Notes to the consolidated financial statements continued |
||||||||
| All figures in £ millions |
Operating leases |
Finance leases |
2024 Total |
2023 Total |
2022 Total |
|||||||||||||||
| Less than one year | ||||||||||||||||||||
| One to two years | ||||||||||||||||||||
| Two to three years | ||||||||||||||||||||
| Three to four years | ||||||||||||||||||||
| Four to five years | ||||||||||||||||||||
| More than five years | ||||||||||||||||||||
| Total undiscounted lease payments receivable | ||||||||||||||||||||
| Unearned finance income | ( |
) |
||||||||||||||||||
| Net investment in finance lease receivable | ||||||||||||||||||||
| All figures in £ millions |
2024 |
2023 | 2022 | |||||||||
| Short-term employee benefits | ||||||||||||
| Retirement benefits | ||||||||||||
| Share-based payment costs | ||||||||||||
Total |
||||||||||||
| Strategic report |
Governance report |
Financial statements |
Other information | |||||
| |
||||||||
| |
Company number |
|||
| |
Company number |
|||
|
Strategic report |
Governance report |
Financial statements |
Other information | |||||
| Page intentionally left blank |
||||||||
Annual report and accounts 2024 Pearson plc 208
|
Strategic report |
Governance report |
Financial statements |
Other information | |||||
| Page intentionally left blank |
||||||||
Annual report and accounts 2024 Pearson plc 209
|
Strategic report |
Governance report |
Financial statements |
Other information | |||||
| Page intentionally left blank |
||||||||
Annual report and accounts 2024 Pearson plc 210
|
Strategic report |
Governance report |
Financial statements |
Other information | |||||
| Page intentionally left blank |
||||||||
Annual report and accounts 2024 Pearson plc 211
|
Strategic report |
Governance report |
Financial statements |
Other information | |||||
| Page intentionally left blank |
||||||||
Annual report and accounts 2024 Pearson plc 212
|
Strategic report |
Governance report |
Financial statements |
Other information | |||||
| Page intentionally left blank | ||||||||
| Annual report and accounts 2024 Pearson plc 213 |
|
Strategic report |
Governance report |
Financial statements |
Other information | |||||
| Page intentionally left blank |
||||||||
| Annual report and accounts 2024 Pearson plc 214 |
|
Strategic report |
Governance report |
Financial statements |
Other information | |||||
| Page intentionally left blank | ||||||||
| Annual report and accounts 2024 Pearson plc 215 |
|
Strategic report |
Governance report |
Financial statements |
Other information | |||||
| Page intentionally left blank |
||||||||
| Annual report and accounts 2024 Pearson plc 216 |
|
Strategic report |
Governance report |
Financial statements |
Other information | |||||
| Five-year summary |
||||||||
| All figures in £ millions | 2024 | 2023 | 2022 | 2021 | 2020 | |||||||||||||||
| Sales: By operating segment |
||||||||||||||||||||
| Assessment & Qualifications |
1,591 | 1,559 | 1,444 | 1,238 | 1,118 | |||||||||||||||
| Virtual Learning |
489 | 616 | 820 | 713 | 692 | |||||||||||||||
| English Language Learning |
420 | 415 | 321 | 238 | 218 | |||||||||||||||
| Workforce Skills |
226 | 220 | 204 | 172 | 163 | |||||||||||||||
| Higher Education |
826 | 855 | 898 | 849 | 956 | |||||||||||||||
| Strategic review |
– | 9 | 154 | 218 | 250 | |||||||||||||||
| Total sales |
3,552 | 3,674 | 3,841 | 3,428 | 3,397 | |||||||||||||||
| Adjusted operating profit: By operating segment |
||||||||||||||||||||
| Assessment & Qualifications |
368 | 350 | 258 | 219 | 147 | |||||||||||||||
| Virtual Learning |
66 | 76 | 70 | 32 | 29 | |||||||||||||||
| English Language Learning |
50 | 47 | 25 | 15 | 1 | |||||||||||||||
| Workforce Skills |
8 | (8 | ) | (3 | ) | 27 | 26 | |||||||||||||
| Higher Education |
108 | 110 | 91 | 73 | 93 | |||||||||||||||
| Strategic review |
– | (2 | ) | 15 | 19 | 16 | ||||||||||||||
| Penguin Random House |
– | – | – | – | 1 | |||||||||||||||
| Total adjusted operating profit |
600 | 573 | 456 | 385 | 313 | |||||||||||||||
| Operating margin – continuing |
16.9% | 15.6% | 11.9% | 11.2% | 9.2% | |||||||||||||||
| Adjusted earnings |
||||||||||||||||||||
| Total adjusted operating profit |
600 | 573 | 456 | 385 | 313 | |||||||||||||||
| Net finance costs |
(45 | ) | (33 | ) | (1 | ) | (57 | ) | (61 | ) | ||||||||||
| Income tax |
(136 | ) | (124 | ) | (71 | ) | (64 | ) | (35 | ) | ||||||||||
| Non-controlling interest |
(1 | ) | (2 | ) | (2 | ) | (1 | ) | – | |||||||||||
| Adjusted earnings |
418 | 414 | 382 | 263 | 217 | |||||||||||||||
| Weighted average number of shares (millions) |
673.0 | 711.5 | 738.1 | 754.1 | 755.4 | |||||||||||||||
| Adjusted earnings per share |
62.1p | 58.2p | 51.8p | 34.9p | 28.7p | |||||||||||||||
Annual report and accounts 2024 Pearson plc 217
|
Strategic report |
Governance report |
Financial statements |
Other information | |||||
| Five-year summary continued |
||||||||
| All figures in £ millions | 2024 | 2023 | 2022 | 2021 | 2020 | |||||||||||||||
| Cash flow |
||||||||||||||||||||
| Operating cash flow |
662 | 587 | 401 | 388 | 315 | |||||||||||||||
| Operating cash conversion |
110% | 102% | 88% | 101% | 101% | |||||||||||||||
| Free cash flow |
490 | 387 | 222 | 133 | 229 | |||||||||||||||
| Free cash flow per share |
72.8p | 54.4p | 30.0p | 17.6p | 30.3p | |||||||||||||||
| Net assets |
4,053 | 3,988 | 4,415 | 4,280 | 4,134 | |||||||||||||||
| Net debt |
853 | 744 | 557 | 350 | 463 | |||||||||||||||
| Return on invested capital |
||||||||||||||||||||
| Total adjusted operating profit |
600 | 573 | 456 | 385 | 313 | |||||||||||||||
| Operating tax paid |
(119 | ) | (96 | ) | (95 | ) | (60 | ) | (10 | ) | ||||||||||
| Return |
481 | 477 | 361 | 325 | 303 | |||||||||||||||
| Net basis: |
||||||||||||||||||||
| Average invested capital |
7,358 | 7,711 | 7,896 | 7,161 | 7,708 | |||||||||||||||
| Return on invested capital |
6.5% | 6.2% | 4.6% | 4.5% | 3.9% | |||||||||||||||
| Return on capital |
||||||||||||||||||||
| Total adjusted operating profit |
600 | 573 | 456 | 385 | 313 | |||||||||||||||
| Adjusted income tax charge |
(136 | ) | (124 | ) | (71 | ) | (64 | ) | (35 | ) | ||||||||||
| Return |
464 | 449 | 385 | 321 | 278 | |||||||||||||||
| Capital |
4,433 | 4,380 | 4,439 | 4,086 | 4,196 | |||||||||||||||
| Return on capital |
10.5% | 10.3% | 8.7% | 7.9% | 6.6% | |||||||||||||||
| Dividend per share |
24.0p | 22.7p | 21.5p | 20.5p | 19.5p | |||||||||||||||
Annual report and accounts 2024 Pearson plc 218
|
Strategic report |
Governance report |
Financial statements |
Other information | |||||
| Financial key performance indicators |
||||||||
The following tables and narrative provide further analysis of the financial key performance indicators which are described in the financial review of the annual report on pages 26-32, shown within the key performance indicators on page 25 of the annual report and shown in note 2 of the notes to the consolidated financial statements.
Adjusted performance measures
The annual report and accounts reports results and performance on a headline basis which compares the reported results both on a statutory and on a non-GAAP (non-statutory) basis. The Group’s adjusted performance measures are non-GAAP (non-statutory) financial measures and are also included in the annual report as they are key financial measures used by management to evaluate performance. The measures also enable investors to more easily, and consistently, track the underlying operational performance of the Group and its business segments by separating out those items of income and expenditure relating to acquisition and disposal transactions, major reorganisation programmes and certain other items that are also not representative of underlying performance.
The Group’s definition of adjusted performance measures may not be comparable to other similarly titled measures reported by other companies. A reconciliation of the adjusted measures to their corresponding statutory measures is shown within this section.
Sales
Underlying sales movements exclude the effect of exchange, the impact of portfolio changes arising from acquisitions and disposals and the impact of adopting new accounting standards that are not retrospectively applied. Portfolio changes are calculated by taking account of the additional sales (at constant exchange rates) from acquisitions made in both the current year and the prior year. For acquisitions made in the prior year, the additional sales excluded is calculated as the sales made in the period of the current year that corresponds to the pre-acquisition period in the prior year. Sales made by businesses disposed in either the current year or the prior year are also excluded. Constant exchange rates are calculated by assuming the average exchange rates in the prior year prevailed throughout the current year. These non-GAAP measures enable management and investors to track more easily, and consistently, the underlying sales performance of the Group.
| All figures in £ millions |
Assessment & Qualifications |
Virtual Learning |
English Language Learning |
Workforce Skills |
Higher Education |
Strategic Review |
Total | |||||||||||||||||||||
| Statutory sales 2024 | 1,591 | 489 | 420 | 226 | 826 | – | 3,552 | |||||||||||||||||||||
| Statutory sales 2023 | 1,559 | 616 | 415 | 220 | 855 | 9 | 3,674 | |||||||||||||||||||||
| Statutory sales increase/(decrease) | 32 | (127 | ) | 5 | 6 | (29 | ) | (9 | ) | (122 | ) | |||||||||||||||||
| Comprising: |
||||||||||||||||||||||||||||
| Portfolio changes | 13 | (92 | ) | – | (4 | ) | (10 | ) | (4 | ) | (97 | ) | ||||||||||||||||
| Exchange differences | (35 | ) | (13 | ) | (30 | ) | (2 | ) | (24 | ) | – | (104 | ) | |||||||||||||||
| Underlying increase/(decrease) | 54 | (22 | ) | 35 | 12 | 5 | (5 | ) | 79 | |||||||||||||||||||
| Remove OPM and Strategic | ||||||||||||||||||||||||||||
| Review from underlying | – | 19 | – | – | – | 5 | 24 | |||||||||||||||||||||
| Underlying increase/ (decrease) excluding OPM and Strategic Review | 54 | (3 | ) | 35 | 12 | 5 | – | 103 | ||||||||||||||||||||
| Statutory sales increase/ (decrease) | 2 | % | (21) | % | 1 | % | 3 | % | (3) | % | (100) | % | (3) | % | ||||||||||||||
| Constant exchange rate increase/(decrease) | 4 | % | (19) | % | 8 | % | 4 | % | (1) | % | (100) | % | – | % | ||||||||||||||
| Underlying increase/(decrease) | 3 | % | (4 | )% | 8 | % | 6 | % | 1 | % | (100 | )% | 2 | % | ||||||||||||||
| Underlying increase/ (decrease) excluding OPM and Strategic Review | 3 | % | (1 | )% | 8 | % | 6 | % | 1 | % | – | % | 3 | % | ||||||||||||||
Adjusted operating profit
Adjusted operating profit excludes the cost of major reorganisation, certain property charges, other net gains and losses on the sale or closure of subsidiaries, joint ventures, associates and other financial assets, and intangible charges, including impairment, relating only to goodwill and intangible assets acquired through business combinations or relating to associates. Other net gains and losses also includes costs related to business closures and acquisitions. Further details are given below under ‘Adjusted earnings per share’. Underlying adjusted operating profit movements exclude the effect of exchange, the impact of portfolio changes arising from acquisitions and disposals and the impact of adopting new accounting standards that are not retrospectively applied. Portfolio changes are calculated by taking account of the additional contribution (at constant exchange rates) from acquisitions made in both the current year and the prior year.
Annual report and accounts 2024 Pearson plc 219
|
Strategic report |
Governance report |
Financial statements |
Other information | |||||
| Financial key performance indicators continued |
||||||||
Adjusted operating profit continued
For acquisitions made in the prior year, the additional contribution excluded is calculated as the operating profit made in the period of the current year that corresponds to the pre-acquisition period in the prior year. Operating profit made by businesses disposed in either the current year or the prior year is also excluded. Constant exchange rates are calculated by assuming the average exchange rates in the prior year prevailed throughout the current year. This non-GAAP measure enables management and investors to track more easily, and consistently, the underlying operating profit performance of the Group.
| All figures in £ millions | 2024 | 2023 | 2022 | |||||||||
| Operating profit |
541 | 498 | 271 | |||||||||
| Cost of major reorganisation |
(2 | ) | – | 150 | ||||||||
| Property charges |
– | 11 | – | |||||||||
| Other net gains and losses |
7 | 16 | (24 | ) | ||||||||
| Intangible charges |
41 | 48 | 56 | |||||||||
| UK pension discretionary increase |
13 | – | 3 | |||||||||
| Adjusted operating profit |
600 | 573 | 456 | |||||||||
| All figures in £ millions | Assessment & Qualifications |
Virtual Learning |
English Language Learning |
Workforce Skills |
Higher Education |
Strategic Review |
Total | |||||||||||||||||||||
| Adjusted operating profit increase/ (decrease) | 18 | (10 | ) | 3 | 16 | (2 | ) | 2 | 27 | |||||||||||||||||||
| Comprising: | ||||||||||||||||||||||||||||
| Exchange differences | (9 | ) | (3 | ) | (11 | ) | 1 | (4 | ) | – | (26 | ) | ||||||||||||||||
| Portfolio changes | 4 | – | – | 1 | (10 | ) | (1 | ) | (6 | ) | ||||||||||||||||||
| Underlying increase/(decrease) | 23 | (7 | ) | 14 | 14 | 12 | 3 | 59 | ||||||||||||||||||||
| Constant exchange rate increase/ (decrease) | 8 | % | (9 | )% | 30 | % | 188 | % | 2 | % | 100 | % | 9 | % | ||||||||||||||
| Underlying increase/(decrease) | 7% | (9)% | 30 | % | 200% | 12 | % | 100 | % | 10 | % | |||||||||||||||||
Adjusted operating profit translated at year-end closing rates would be £7m higher (2023: £10m lower) than the reported figure of £600m (2023: £573m) at £607m (2023: £563m).
Adjusted earnings
Adjusted earnings includes adjusted operating profit and adjusted finance and tax charges. Adjusted earnings is included as a non-GAAP measure as it is used by management to evaluate performance and by investors to more easily, and consistently, track the underlying operational performance of the Group over time.
| All figures in £ millions | 2024 | 2023 | 2022 | |||||||||
| Profit for the year |
435 | 380 | 244 | |||||||||
| Non-controlling interest |
(1 | ) | (2 | ) | (2 | ) | ||||||
| Cost of major reorganisation |
(2 | ) | – | 150 | ||||||||
| Property charges |
– | 11 | – | |||||||||
| Other net gains and losses |
7 | 16 | (24 | ) | ||||||||
| Intangible charges |
41 | 48 | 56 | |||||||||
| UK pension discretionary increase |
13 | – | 3 | |||||||||
| Other net finance income |
(14 | ) | (28 | ) | (53 | ) | ||||||
| Income tax |
(61 | ) | (11 | ) | 8 | |||||||
| Adjusted earnings |
418 | 414 | 382 | |||||||||
The following items are excluded from adjusted earnings:
Cost of major reorganisation – In 2024, there is a release of £2m relating to amounts previously accrued. In 2023, there were no costs of major reorganisation. In 2022, the reorganisation costs of £150m mainly related to staff redundancies and impairment of right of use property assets. The 2022 charge includes the impact of updated assumptions related to the recoverability of right-of-use assets made in 2021. The costs of these reorganisation programmes are significant enough to exclude from the adjusted operating profit measure so as to better highlight the underlying performance (see note 4).
Property charges – In 2024, there were no property charges. In 2023, charges of £11m related to impairments of property assets arising from the impact of updates in 2023 to assumptions initially made during the 2022 and 2021 reorganisation programmes.
Other net gains and losses – These represent profits and losses on the sale of subsidiaries, joint ventures, associates and other financial assets and are excluded from adjusted operating profit in order to show the performance of the Group on a more comparable basis year on year. Other net gains and losses also includes costs related to business closures and acquisitions. Other net gains and losses in 2024 relate to costs related to prior year acquisitions and disposals, partially offset by a gain on the partial disposal of our investment in an associate. Other net gains and losses in 2023 relate to the gain on the disposal of the POLS business and gains related to the release of accruals and a provision related to historical acquisitions, offset by losses on the disposal of Pearson College and costs related to current and previous year disposals and acquisitions. In 2022, they related to the gains on the disposal of our international courseware local publishing businesses in Europe, French-speaking Canada and Hong Kong and a gain arising on a decrease in the deferred consideration payable on prior year acquisitions, offset by a loss on disposal of our international courseware local publishing businesses in South Africa due to recycling of currency translation adjustments and costs related to disposals and acquisitions.
| Annual report and accounts 2024 Pearson plc 220 |
|
Strategic report |
Governance report |
Financial statements |
Other information | |||||
|
|
||||||||
UK pension discretionary increases – Charges in 2024 and 2022 relate to one-off pension increases awarded to certain cohorts of pensioners in response to the cost of living crisis. There were no such awards in 2023.
Intangible charges – These represent amortisation relating to intangibles acquired through business combinations. These amortisation charges are excluded as they reflect past acquisition activity and do not necessarily reflect the current year performance of the Group. Intangible amortisation charges in 2024 were Ł41m compared to a charge of Ł48m in 2023. This is due to decreased amortisation from disposals partially offset by additional amortisation from recent acquisitions. In 2022, intangible charges were Ł56m. In all three years, there were no impairment charges. Other net finance income/costs – These include finance costs in respect of retirement benefits, finance costs of deferred consideration, fair value movements in relation to financial assets held at fair value through profit and loss and foreign exchange and other gains and losses. Finance income relating to retirement benefits is excluded as management does not believe that the consolidated income statement presentation under IAS 19 reflects the economic substance of the underlying assets and liabilities. Finance costs relating to acquisition transactions are excluded as these relate to future earn-outs or acquisition expenses and are not part of the underlying financing. Foreign exchange and other gains and losses are excluded as they represent short-term fluctuations in market value and are subject to significant volatility. Other gains and losses may not be realised in due course as it is normally the intention to hold the related instruments to maturity.
| All figures in £ millions | 2024 | 2023 | 2022 | |||||||||
| Net finance (costs)/income |
(31 | ) | (5 | ) | 52 | |||||||
| Net finance income in respect of retirement benefits |
(21 | ) | (26 | ) | (9 | ) | ||||||
| Interest on deferred and contingent consideration |
2 | 4 | 5 | |||||||||
| Fair value movements on investments |
11 | (13 | ) | (28 | ) | |||||||
| Net foreign exchange losses/(gains) |
3 | (3 | ) | (1 | ) | |||||||
| Fair value movement on derivatives |
(7 | ) | 10 | (25 | ) | |||||||
| Interest on provisions for uncertain tax positions |
(2 | ) | – | 5 | ||||||||
| Net interest payable in adjusted earnings |
(45 | ) | (33 | ) | (1 | ) | ||||||
Tax – Tax on the above items is excluded from adjusted earnings. Where relevant the Group also excludes the benefit from recognising previously unrecognised pre-acquisition and capital losses. The tax benefit from tax deductible goodwill and intangibles is added to the adjusted income tax charge as this benefit more accurately aligns the adjusted tax charge with the expected rate of cash tax payments.
The tax rate reflected in adjusted earnings is calculated as follows:
| All figures in £ millions | 2024 | 2023 | 2022 | |||||||||
| Profit before tax |
510 | 493 | 323 | |||||||||
| Adjustments: |
||||||||||||
| Cost of major reorganisation |
(2 | ) | – | 150 | ||||||||
| Property charges |
– | 11 | – | |||||||||
| Other net gains and losses |
7 | 16 | (24 | ) | ||||||||
| Intangible charges |
41 | 48 | 56 | |||||||||
| UK Pension discretionary increases |
13 | – | 3 | |||||||||
| Other net finance income |
(14 | ) | (28 | ) | (53 | ) | ||||||
| Adjusted profit before tax |
555 | 540 | 455 | |||||||||
| Total tax charge |
(75 | ) | (113 | ) | (79 | ) | ||||||
| Adjustments: |
||||||||||||
| Tax on cost of major reorganisation |
1 | – | (37 | ) | ||||||||
| Tax on property charges |
– | (3 | ) | – | ||||||||
| Tax on other net gains and losses |
– | (10 | ) | 10 | ||||||||
| Tax on intangible charges |
(10 | ) | (11 | ) | (11 | ) | ||||||
| Tax on UK pensions discretionary increases |
(3 | ) | – | (1 | ) | |||||||
| Tax on other net finance costs |
5 | 7 | 13 | |||||||||
| Tax on goodwill and intangibles |
4 | 4 | 16 | |||||||||
| Tax benefit on UK tax rate change |
– | 1 | (1 | ) | ||||||||
| State Aid provision release |
(63 | ) | – | – | ||||||||
| Movement in provision for tax uncertainties |
6 | – | – | |||||||||
| Other tax items |
(1 | ) | 1 | 19 | ||||||||
| Adjusted tax charge |
(136 | ) | (124 | ) | (71 | ) | ||||||
| Tax rate reflected in adjusted earnings |
24.4% | 23.0% | 15.6% | |||||||||
| Annual report and accounts 2024 Pearson plc 221 |
|
Strategic report |
Governance report |
Financial statements |
Other information | |||||
| Financial key performance indicators continued |
||||||||
Adjusted earnings per share
Adjusted earnings per share is calculated as adjusted earnings divided by the weighted average number of shares in issue on an undiluted basis.
| All figures in £ millions | 2024 | 2023 | 2022 | |||||||||
| Adjusted operating profit |
600 | 573 | 456 | |||||||||
| Adjusted net finance costs |
(45 | ) | (33 | ) | (1 | ) | ||||||
| Adjusted profit before tax |
555 | 540 | 455 | |||||||||
| Adjusted income tax |
(136 | ) | (124 | ) | (71 | ) | ||||||
| Adjusted profit for the year |
419 | 416 | 384 | |||||||||
| Non-controlling interest |
(1 | ) | (2 | ) | (2 | ) | ||||||
| Adjusted earnings |
418 | 414 | 382 | |||||||||
| Weighted average number of shares (millions) |
673.0 | 711.5 | 738.1 | |||||||||
| Weighted average number of shares (millions) for diluted earnings | 684.0 | 717.3 | 742.0 | |||||||||
| Adjusted earnings per share |
||||||||||||
| Basic |
62.1p | 58.2p | 51.8p | |||||||||
| Diluted |
61.1p | 57.7p | 51.5p | |||||||||
Return on invested capital
Return on invested capital (ROIC) is included as a non-GAAP measure as it is used by management to help inform capital allocation decisions within the business. ROIC is calculated as adjusted operating profit less operating cash tax paid expressed as a percentage of average invested capital. Invested capital includes the original unamortised goodwill and intangibles. Average values for total invested capital are calculated as the average monthly balance for the year. ROIC is also presented on a net basis after removing impaired goodwill from the invested capital balance. The net approach assumes that goodwill which has been impaired is treated consistently to goodwill disposed as it is no longer being used to generate returns. We have removed the gross measure as it is no longer used in managing the business.
| All figures in £ millions | 2024 Net |
2023 Net |
||||||
| Adjusted operating profit |
600 | 573 | ||||||
| Operating tax paid |
(119 | ) | (96 | ) | ||||
| Return |
481 | 477 | ||||||
| Average goodwill |
3,432 | 3,530 | ||||||
| Average other non-current intangibles |
1,635 | 1,826 | ||||||
| Average intangible assets – product development |
937 | 967 | ||||||
| Average tangible fixed assets and working capital |
1,354 | 1,388 | ||||||
| Average invested capital |
7,358 | 7,711 | ||||||
| Return on invested capital |
6.5% | 6.2% | ||||||
| Annual report and accounts 2024 Pearson plc 222 |
|
Strategic report |
Governance report |
Financial statements |
Other information | |||||
Return on capital
Return on capital (ROC) is included as a non-GAAP measure of how efficiently we are generating returns from our asset base. ROC is calculated as adjusted operating profit less adjusted income tax as a proportion of capital, where capital adjusts net statutory assets for net debt, retirement benefit assets, other post-retirement medical obligations and other non-operating items. The other non-operating items in 2023 include the liability recorded for the remainder of the 2023 share buyback scheme. These adjustments to net statutory assets have been made to better reflect the asset base that generates returns.
| All figures in £ millions | 2024 | 2023 | ||||||
| Adjusted operating profit |
600 | 573 | ||||||
| Adjusted income tax charge |
(136 | ) | (124 | ) | ||||
| Return |
464 | 449 | ||||||
| Net statutory assets |
4,053 | 3,988 | ||||||
| Adjustments for: |
||||||||
| Net debt |
853 | 744 | ||||||
| Retirement benefit assets |
(491 | ) | (499 | ) | ||||
| Other post-retirement medical benefit obligation |
19 | 21 | ||||||
| Other non-operating assets |
(1 | ) | 126 | |||||
| Capital |
4,433 | 4,380 | ||||||
| Return on capital |
10.5% | 10.3% | ||||||
Subsequent to the release of the 2024 unaudited preliminary results, an adjustment has been made which reduces net statutory assets by £10m. As a result of this adjustment, ROC has increased from 10.4% to 10.5%.
Operating cash flow
Operating cash flow is calculated as net cash generated from operations before the impact of items excluded from the adjusted income statement plus dividends from joint ventures and associates (less the re-capitalisation dividends from Penguin Random House); less capital expenditure on property, plant and equipment (including additions to right-of-use assets) and intangible software assets; plus proceeds from the sale of property, plant and equipment (including the impacts of transfers to/from investment in finance lease receivable) and intangible software assets; plus special pension contributions paid; and plus costs of major reorganisation paid. Operating cash flow is included as a non-GAAP measure in order to align the cash flows with the corresponding adjusted operating profit measures.
| All figures in £ millions | 2024 | 2023 | ||||||
| Net cash generated from operations |
811 | 682 | ||||||
| Dividends received |
2 | – | ||||||
| Purchase/disposal of PPE and software |
(118 | ) | (121 | ) | ||||
| Net addition of right-of-use assets |
(46 | ) | (41 | ) | ||||
| Net costs paid for major reorganisation |
8 | 63 | ||||||
| Other net gains and losses |
5 | 4 | ||||||
| Operating cash flow |
662 | 587 | ||||||
Cash conversion, calculated as operating cash flow as a percentage of adjusted operating profit, is also shown as a non-GAAP measure as this is used by management and investors to measure cash generation by the Group.
| All figures in £ millions | 2024 | 2023 | ||||||
| Adjusted operating profit |
600 | 573 | ||||||
| Operating cash flow |
662 | 587 | ||||||
| Cash conversion |
110% | 102% | ||||||
| Annual report and accounts 2024 Pearson plc 223 |
|
Strategic report |
Governance report |
Financial statements |
Other information | |||||
| Financial key performance indicators continued |
||||||||
Operating cash flow continued
Operating cash flow, operating free cash flow and total free cash flow, which are non-GAAP measures, are commonly used by investors to measure the cash performance of the Group.
The table below reconciles operating cash flow to net debt:
| All figures in £ millions | 2024 | 2023 | 2022 | |||||||||
| Operating cash flow | 662 | 587 | 401 | |||||||||
| Tax paid | (119 | ) | (97 | ) | (109 | ) | ||||||
| Net finance costs paid | (45 | ) | (40 | ) | (35 | ) | ||||||
| Net costs paid for major reorganisation | (8 | ) | (63 | ) | (35 | ) | ||||||
| Free cash flow | 490 | 387 | 222 | |||||||||
| Dividends paid (including to non-controlling interests) | (156 | ) | (154 | ) | (157 | ) | ||||||
| Net movement of funds from operations | 334 | 233 | 65 | |||||||||
| Acquisitions and disposals | (58 | ) | (219 | ) | 105 | |||||||
| Disposal of lease liabilities | – | – | 8 | |||||||||
| Net equity transactions | (351 | ) | (212 | ) | (383 | ) | ||||||
| Other movements on financial instruments | (34 | ) | 11 | (2 | ) | |||||||
| Movement in net debt | (109 | ) | (187 | ) | (207 | ) | ||||||
| Opening net debt | (744 | ) | (557 | ) | (350 | ) | ||||||
| Closing net debt | (853 | ) | (744 | ) | (557 | ) | ||||||
Net cash generated from operations is translated at an exchange rate approximating the rate at the date of cash flow. The difference between this rate and the average rate used to translate profit gives rise to a currency adjustment in the reconciliation between net profit and net cash generated from operations. This adjustment reflects the timing difference between recognition of profit and the related cash receipts or payments.
Net debt and adjusted earnings before interest, tax, depreciation and amortisation (EBITDA)
For information, the net debt/adjusted EBITDA ratio is shown as a non-GAAP measure as it is commonly used by investors to measure balance sheet strength. Adjusted EBITDA is calculated as adjusted operating profit less depreciation on property, plant and equipment, and amortisation on intangible software assets.
| All figures in £ millions | 2024 | 2023 | ||||||
| Adjusted operating profit |
600 | 573 | ||||||
| Depreciation (excluding items included in ‘cost of major reorganisation’ and ‘property charges’) | 76 | 79 | ||||||
| Amortisation on intangible software assets (excluding items included in ‘cost of major reorganisation’) | 117 | 123 | ||||||
| Adjusted EBITDA |
793 | 775 | ||||||
| Cash and cash equivalents |
543 | 312 | ||||||
| Overdrafts |
– | (3 | ) | |||||
| Investment in finance lease receivable |
83 | 100 | ||||||
| Derivative financial instruments |
(7 | ) | 5 | |||||
| Bonds |
(955 | ) | (611 | ) | ||||
| Lease liabilities |
(517 | ) | (547 | ) | ||||
| Net debt |
(853 | ) | (744 | ) | ||||
| Net debt/adjusted EBITDA ratio |
1.1x | 1.0x | ||||||
Adjusted EBITDA translated at year-end closing rates would be Ł10m higher (2023: £13m lower) than the reported figure of £793m (2023: £775m) at £803m (2023: £762m).
| Annual report and accounts 2024 Pearson plc 224 |
|
Strategic report |
Governance report |
Financial statements |
Other information (unaudited) | |||||
Additional information for US listing purposes
Cross Reference Table:
| Item | Form 20-F Caption | Location in this Document | Page Reference | |||
| Item 1 | Identity of Directors, Senior Management and Advisers | Not applicable | n/a | |||
| Item 2 | Offer Statistics and Expected Timetable | Not applicable | n/a | |||
| Item 3 | Key Information | |||||
| A. Reserved | Not applicable | n/a | ||||
| B. Capitalisation and indebtedness | Not applicable | n/a | ||||
| C. Reasons for the offer and use of proceeds | Not applicable | n/a | ||||
| D. Risk factors | Additional Information: Risk factors | 228-233 | ||||
| Strategic Report: Risk management | 57-67 | |||||
| Item 4 | Information on the Company | |||||
| A. History and development of the Company | Strategic Report: At a Glance | 2 | ||||
| Information on the Company | 233 | |||||
| Shareholder Information | 245-246 | |||||
| Strategic Review: Financial Review | 26-32 | |||||
| Note 18: Borrowings | 187-188 | |||||
| Note 19: Financial Risk Management | 188-191 | |||||
| Note 30: Business Combinations | 202 | |||||
| Note 31: Disposals | 203 | |||||
| Note 35: Leases | 205-206 | |||||
| B. Business overview | Strategic Report | 2-67 | ||||
| Note 2: Segmental Information | 164-166 | |||||
| Additional Information: Certain additional information on the Company | 233-235 | |||||
| C. Organisational structure | Exhibit 8.1 |
213-216 | ||||
| Item | Form 20-F Caption | Location in this Document | Page Reference | |||
| D. Property, plant and equipment | Note 10: Property, plant and Equipment and Investment Property |
177-178 | ||||
| Additional Information: Property, plant and equipment |
235 | |||||
| Strategic Report: Sustainability | 33-56 | |||||
| Additional Information: Risk Factors | 228-233 | |||||
| Item 4A | Unresolved staff comments | None | n/a | |||
| Item 5 | Operating and Financial Review and Prospects | |||||
| A. Operating results | Additional Information: Operating and Financial Review |
235 | ||||
| Strategic Report: Key performance indicators |
24-25 | |||||
| Strategic Report: Financial review | 26-32 | |||||
| Strategic Report: Risk management (including Viability Statement) | 57-67 | |||||
| Financial Statements | 150-216 | |||||
| B. Liquidity and capital resources | Strategic Report: Financial review | 26-32 | ||||
| Note 16: Derivatives and Hedge Accounting |
185-187 | |||||
| Note 18: Borrowings | 187-188 | |||||
| Note 19: Financial Risk Management | 188-191 | |||||
| Note 35: Leases | 205-206 | |||||
| C. Research and development, patents and licenses etc |
Not applicable | n/a | ||||
| D. Trend information | Strategic Report: Key performance indicators |
24-25 | ||||
| Strategic Report: Financial review | 26-32 | |||||
| E. Critical Accounting Estimates | Note 1: Accounting Policies | 156-164 | ||||
Annual report and accounts 2024 Pearson plc 225
|
Strategic report |
Governance report |
Financial statements |
Other information (unaudited) | |||||
| Additional information for US listing purposes continued |
||||||||
| Item | Form 20-F Caption | Location in this Document | Page Reference | |||
| Item 6 | Directors, Senior Management and Employees | |||||
| A. Directors and senior management | Corporate Governance: Board of Directors |
70-72 | ||||
| Corporate Governance: Pearson Executive Management |
74-76 | |||||
| B. Compensation | Directors’ Remuneration Report | 113-136 | ||||
| C. Board practices | Corporate Governance: Board of Directors |
70-72 | ||||
| Directors’ Remuneration Report | 113-136 | |||||
| Corporate Governance: Audit Committee report |
99-112 | |||||
| D. Employees | Note 5: Employee Information | 174 | ||||
| E. Share ownership | Directors’ Remuneration Report | 113-136 | ||||
| Note 26: Share Based Payments | 198-199 | |||||
| F. Disclosure of a registrant’s action to recover erroneously awarded compensation | None | n/a | ||||
| Item 7 | Major Shareholders and Related Party Transactions | |||||
| A. Major shareholders | Additional Disclosures | 137 | ||||
| B. Related party transactions | Note 12: Investments in Joint Ventures and Associates | 181 | ||||
| Note 36: Related Party Transactions | 206 | |||||
| C. Interests of experts and counsel | Not applicable | n/a | ||||
| Item 8 | Financial Information | |||||
| A. Consolidated statements and other financial information | Financial Statements | 150-216 | ||||
| B. Significant changes | None | n/a | ||||
| C. Interests of experts and counsel | Not applicable | n/a | ||||
| Item | Form 20-F Caption | Location in this Document | Page Reference | |||
| Item 9 | The Offer and Listing | |||||
| A. Offer and listing details | Additional Information: Listing | 235 | ||||
| B. Plan of distribution | Not applicable | n/a | ||||
| C. Markets | Additional Information: Listing | 235 | ||||
| D. Selling shareholders | Not applicable | n/a | ||||
| E. Dilution | Not applicable | n/a | ||||
| F. Expenses of the issue | Not applicable | n/a | ||||
| Item 10 | Additional Information | |||||
| A. Share capital | Not applicable | n/a | ||||
| B. Articles of association | Additional Information: Articles of Association | 236-239 | ||||
| C. Material contracts | Additional Information: Material Contracts | 239 | ||||
| D. Exchange controls | Additional Information: Exchange Controls | 239 | ||||
| E. Taxation | Additional Information: Tax Considerations | 239-241 | ||||
| F. Dividends and paying agents | Not applicable | n/a | ||||
| G. Statement by experts | Not applicable | n/a | ||||
| H. Documents on display | Additional Information: Documents on Display | 241 | ||||
| I. Subsidiary information | Exhibit 8.1 |
213-216 | ||||
| J. Annual report to Security Holders | Not applicable | n/a | ||||
| Item 11 | Quantitative and Qualitative Disclosures about Market Risk | Note 19: Financial Risk Management | 188-191 | |||
| Note 14: Classification of Financial Instruments | 183-184 | |||||
| Note 16: Derivative Financial Instruments and Hedge Accounting | 185-187 | |||||
Annual report and accounts 2024 Pearson plc 226
|
Strategic report |
Governance report |
Financial statements |
Other information (unaudited) | |||||
|
|
||||||||
| Item | Form 20-F Caption | Location in this Document | Page Reference | |||
| Item 12 | Description of Securities other than Equity Securities | |||||
| A. Description of debt securities | Not applicable | n/a | ||||
| B. Description of warrants and rights | Not applicable | n/a | ||||
| C. Description of other securities | Not applicable | n/a | ||||
| D. American Depository Shares | Additional Information: Description of Securities Other than Equity Securities | 241-242 | ||||
| D. 1 Name of depositary and address of principal executive office | Not applicable | n/a | ||||
| D. 2 Title of ADRs and brief description of provisions | Not applicable | n/a | ||||
| D. 3 Depositary fees and charges | Additional Information: Description of Securities Other than Equity Securities | 241-242 | ||||
| D. 4 Depositary payments | Additional Information: Description of Securities Other than Equity Securities | 241-242 | ||||
| Item 13 | Defaults, Dividend Arrearages and Delinquencies | Not applicable | n/a | |||
| Item 14 | Material Modifications to the Rights of Security Holders and Use of Proceeds | Not applicable | n/a | |||
| Item 15 | Controls and Procedures | Additional Information: Controls and Procedures | 242-243 | |||
| Item 16 | Reserved | |||||
| A. Audit Committee Financial Expert | Additional Information: Audit Committee Financial Expert | 243 | ||||
| B. Code of Ethics | Additional Information: Code of Ethics | 243 | ||||
| C. Principal Accountant Fees | Note 4: Operating Expenses | 173-174 | ||||
| Principal accountant fees and services | 243 | |||||
| D. Exemptions from The Listing Standards for Audit Committees | Not applicable | n/a | ||||
| Item | Form 20-F Caption | Location in this Document | Page Reference | |||
| E. Purchases of Equity Securities by the Issuer and Affiliated Purchasers | Additional Information: Purchases of Equity Securities by the Issuer and Affiliated Purchases | 243 | ||||
| F. Change in Registrants Certifying Accountant | Not applicable | n/a | ||||
| G. Corporate Governance | Additional Information: Corporate Governance | 68-140 | ||||
| H. Mine Safety Disclosures | Not applicable | n/a | ||||
| I. Disclosure regarding foreign jurisdiction that prevent inspections | Not applicable | n/a | ||||
| J. Insider Trading Policies | Additional Information: Insider Trading Policies | 243 | ||||
| K. Cyber security | Additional Information: Cyber security; Strategic Report: Data privacy and cyber security | 244, 37, 50 | ||||
| Item 17 | Financial Statements | Not applicable | n/a | |||
| Item 18 | Financial Statements | Financial Statements | 150-216 | |||
| Item 19 | Exhibits | Refer to Exhibits list immediately following the signature page for this document as filed with the SEC | n/a | |||
Annual report and accounts 2024 Pearson plc 227
|
Strategic report |
Governance report |
Financial statements |
Other information (unaudited) | |||||
| Additional information for US listing purposes continued |
||||||||
Risk Factors
You should carefully consider the risk factors described below, as well as the other information included in the rest of this document. The Group’s business, financial condition or results from operations could be materially adversely affected by any or all of these risks, or by other risks that it presently cannot identify. Any forward-looking statements are made subject to the Forward-Looking Statement section located on page 247.
Risks relating to regulation, including accreditation
Changes in government policy and/or regulations have the potential to affect the Group’s business model and/or decisions across all markets.
The Group’s educational services, assessment and qualifications businesses may be affected by shifts in government funding and regulation due to external factors beyond its control, including general economic conditions, changes in education funding, policy decisions, legislation, or procurement processes. This also includes potential amendments to, or suspensions, or cancellations of high-stakes testing, which could affect our assessments businesses, including but not limited to our Pearson Test of English business or our UK or International qualifications businesses, or result in the loss of schools and/or a decrease in the number of students engaged in our Virtual Learning business.
In 2025, a large number of contracts are up for renewal, especially within US Student Assessment, with the financial plan assuming successful renewals. The loss of any of these contracts, whether or not as a result of changes in policy or processes described above, would lead to lower sales and profits in the future unless replaced by other contract wins.
The performance and growth of the Group’s US educational services and assessment businesses rely on federal and state education funding, which depends on state financial health and budget allocations for education. Pressures on state and local funding, competition from low-cost or disruptive new business models, and the promotion of open-source materials to cut costs may impact the Group’s sales. Additionally, changes in state leadership and education policy can alter funding priorities, while shifts in procurement processes, curriculum changes, and delays in textbook adoptions or testing procedures may also affect the size of the market. Any of these factors could negatively impact the Group’s financial results and growth prospects in the US education sector.
The Group has businesses in a variety of geographies globally and is subject to numerous different regulatory regimes and uncertain international environments and regulatory changes which could impact the Group’s operations and financial condition.
The Group faces risks related to government restrictions on market access for non-local companies and limitations on profit repatriation. Operating across multiple geographies also exposes the Group to regulatory hurdles and tariffs including in respect of trade tensions, changes to foreign trade policies, and evolving sentiment towards multinational companies following changes in the governments of the countries in which we operate or trade. The Group has a central compliance team and a network of local compliance representatives within the legal function to ensure that the Group meets its obligations. However, we are subject to evolving laws, international accords and policies or the changing of their interpretation or application, including those on environmental sustainability, human capital and governance topics.
The political, regulatory, economic, and currency risks, along with the risk of compliance failures (e.g., fraud, sanctions, bribery), or conflicting legislation or regulation across countries and states, including its interpretation or application, have in the past, and could in the future, affect the realisation or the results of our objectives, as well as possibly reducing investment returns and impact the Group’s ability to reinvest or distribute profits.
Sanctions against specific countries or entities may require the Group to exit certain markets. Regulatory investigations related to sanctions have in the past and could in the future be costly, consume management resources, harm the Group’s reputation, and lead to legal and financial consequences. We have in the past, and could in the future, face scrutiny from stakeholders, including from multiple domestic or international governmental authorities who may have different or conflicting views on our business practices and activities, which could lead to fines or other costs, reputational damage, legal issues, enforcement actions, or operational changes and, which could therefore have an adverse effect on our business, operations and financial condition.
Risks relating to Artificial Intelligence, Content & Channel
The Group could face additional cost and diversion of personnel (i) to meet any new regulation or law applicable to its use of Artificial Intelligence (AI) in its products and services and/or (ii) to protect any of its intellectual property developed using AI.
The Group has a history of utilising AI in its products and services, and incorporation is expected only to increase as AI technologies (including generative AI) continue to develop. Our ability to do this successfully depends in part on the public willingness to use AI in the learning sector. If the content that AI applications assist us in producing are or are perceived or alleged to be deficient or inaccurate, our reputation may be adversely affected, and/or the effectiveness of the Group’s products may be undermined.
In 2024, there was development of AI features in many products, for example, the embedding of AI study tools into Virtual Learning content and the development of an AI-powered tool designed to assist educators in generating lesson content and activities in English Language Learning. Although these developments have shown encouraging signs, an inability to sustain the positive momentum would result in lower sales and profit. In addition, if our competitors incorporate AI into their products more quickly or more successfully than us, our ability to compete effectively could be impaired.
The increasing interest in AI by governments and regulators around the world and the different approaches they are taking continue to bring a level of regulatory uncertainty which may increase costs and liabilities in a manner that is beyond the Group’s control and could result in conflicting legal requirements, potentially further increasing costs and/or adversely impacting the Group’s ability to operate.
In addition, there remains uncertainty regarding existing or evolving legal protections that are afforded to the Group’s intellectual property developed (in whole or in part) with the use of AI (or software including any AI).
Annual report and accounts 2024 Pearson plc 228
|
Strategic report |
Governance report |
Financial statements |
Other information (unaudited) | |||||
If the Group fails to successfully invest in and deliver the right products and services and to respond to government concerns and/or competitive threats, its sales and profits could be adversely impacted.
A common trend facing all the Group’s businesses is the digitisation of content and proliferation of distribution channels, either over the internet, or via other electronic means, replacing traditional print formats. The digital migration has led to changes in consumers’ perception of value and the publisher’s position between consumers, retailers, and authors, and has required the Group to make changes in product and content distribution.
A proliferation of available supply routes for content, in addition to buying or subscribing to the Group’s content, means that the Group is not guaranteed to be rewarded for its investment in developing and distributing this content. Alternatives such as second hand and rental copies, open educational resources, online discounters, file sharing and use of pirated copies all offer either lower or no financial returns to the Group. Where the purchaser is a school or institution, they will typically use educational funding to purchase our materials or assessments.
However, there are multiple competing demands for educational funds and there is no guarantee that new courseware or testing or training programmes will be funded, or that the Group will win or retain this business.
If the Group does not adapt rapidly to such and other market trends, it may lose business to ‘faster’ and more ‘agile’ competitors, who increasingly are non-traditional competitors, making their identification all the more difficult. The Group may be required to invest significant resources to further adapt to the changing competitive environment, which requires continued development of both content and the method of delivery to be able to provide differentiated products and services and can result in competitive disadvantage and missed opportunity for sales and growth.
An example of this is where the Group’s products and services may potentially face competition from those developed by non-traditional competitors using advanced Generative AI tools. Generative AI in particular offers new ways of creating content which could disrupt the sectors in which the Group focuses and failure to adapt could in the future lead to adverse impact for its businesses.
Failure to use the Group’s data effectively to enhance the quality and scope of current products and services in order to improve learning outcomes could adversely affect the Group’s business.
The Group seeks to maximise data to enhance the quality and scope of current products and services to improve learning outcomes while managing associated risks. The Group’s ability to continue to do so may be subject to factors beyond the Group’s control. In addition, the lack of availability of timely, complete, and accurate data limits informed decision-making and increases the risk of non-compliance with legal, regulatory, and reporting requirements. Business change and transformation success is dependent on migration of a significant number of datasets and our inability to effectively accomplish this could adversely affect the Group’s results.
If the Group does not adequately protect its intellectual property and proprietary rights, its competitive position and results may be adversely affected and its ability to grow restricted.
Some of the Group’s products and services comprise intellectual property delivered through a variety of print and digital media, online software applications and platforms. The Group relies on trademark, patent, copyright and other intellectual property laws to establish and protect its proprietary rights in these products and services. Reference is made to the section above regarding the risk of the evolving AI legal and regulatory framework globally and the applicability and interpretation of the existing legal protection of intellectual property. The Group also faces uncertainty on its ability to adequately protect its content from its unauthorised use in training Large Language Models and other AI Models, for example, those on which generative AI Tools are built.
Failure, or an inability, to adequately manage, procure, register or protect intellectual property rights (including trademarks, patents, trade secrets and copyright) in the Group’s brands, content and technology, may (1) prevent the Group from enforcing its rights, and (2) increase the risk that others will infringe the Group’s rights (print and digital counterfeit, digital piracy), which may reduce sales and/or erode sales.
The Group’s intellectual property rights (IPR) in brands and content – historically its core assets – are generally well established in key markets. As technology and digital delivery of content have become an increasingly critical component of the Group’s business strategy, the Group has grown its patent portfolio to expand its protection of high value technology in the US and key international markets.
Online copying and security circumvention have become increasingly sophisticated and resistant to available countermeasures. Advancements in technology, including advancements in generative AI technology, have made unauthorised copying and wide dissemination of unlicensed content more accessible. At the same time, detection of unauthorised use of our intellectual property and enforcement of our intellectual property rights has become more challenging, in part due to the increasing volume and sophistication of attempts at unauthorised use of our intellectual property through the use of generative AI. Notably, in recent years ‘digital counterfeit’ websites have offered or attempted to offer unprotected PDF files of many of Pearson’s titles, at scale, using modern and sophisticated ecommerce methods, with a professional or legitimate appearance. Additionally, such websites may have acted as potential sources of data for Large Language Models. From an IPR perspective, increasing the Group’s digital business continues to expose it to evolving trademark, copyright, and patent infringement risks.
The Group’s forward-looking IPR strategy includes efforts to maintain a broad footprint of intellectual property rights in key markets outside the US. However, the Group also conducts business in other countries where its intellectual property protection efforts have been limited or where legal protection for intellectual property may be uncertain and these limitations could affect future growth.
Where the Group has registered or otherwise established its IPR, it cannot guarantee that such rights will provide competitive advantages due to: the challenges and costs of monitoring and enforcement in jurisdictions where competition may be intense; the limited and/or ineffective IPR protection and enforcement mechanisms available to it in many countries; the potential that its IPR may lapse, be invalidated, circumvented, challenged, or abandoned, or that it may otherwise lose the ability to assert its intellectual property rights against others. The loss or diminution in value of these proprietary rights or the Group’s intellectual property could have a material adverse effect on the Group’s business and financial performance.
Annual report and accounts 2024 Pearson plc 229
|
Strategic report |
Governance report |
Financial statements |
Other information (unaudited) | |||||
| Additional information for US listing purposes continued |
||||||||
Risks relating to Capability
The Group’s strategy involves significant change, including moving into new markets. This increases the risk of failure to realise anticipated benefits or of costs being higher than anticipated, or that the Group’s business as usual activities are adversely impacted.
The Group’s strategy aims, among other things, to achieve significant growth in markets in which Pearson has less experience, including enterprise sales. The Group’s financial plan assumes that the costs associated with such new market strategies will be successfully managed in all business units, but should this cost management not be successful, the Group is likely to report lower than anticipated profits.
If the Group fails to attract, retain and develop appropriately skilled employees, it may limit its ability to achieve its strategic and operational goals and its business may be harmed.
The Group’s success depends on the skill, experience and engagement of its employees. Their expertise has allowed the Group to demonstrate agility, notably in how the Group has been able to develop and deploy beta tests of products using large language models (including, in the areas of AI and machine learning). Training and development of staff is a focus area for managers throughout the organisation, but there is no guarantee that workers will continue to have the required skills prospectively.
The Group has a key dependency on the Chief Executive and certain other key employees. If it is unable to attract, retain and develop sufficiently experienced and capable staff, especially in technology, product development, sales and leadership, its business and financial results may suffer. When talented employees leave, the Group may have difficulty replacing those skills, and its business may suffer. There can be no assurance that the Group will be able to successfully attract and retain the skills that it needs.
Failure to develop robust go-to-market strategies could negatively impact the Group’s financial performance.
In October, Higher Education began to directly distribute our proprietary Advanced Placement (AP®), Dual Enrolment, and Career and Technical Education (CTE) materials into states and school districts, which were previously distributed by a third party, investing in an in-house dedicated sales team. Our performance is contingent on how our existing customers respond to the shift from the third party and our ability to establish a robust go-to-market strategy and high-quality customer service. Failure of this new distribution model to succeed could negatively impact the Group’s sales, financial results and prospects.
All the Group’s businesses depend on Information Technology (IT) systems and technological change. Failure to maintain and support customer facing services, systems, and platforms, including addressing quality issues and execution on time of new products and enhancements, could negatively impact the Group’s sales and reputation.
All the Group’s businesses, to a greater or lesser extent, are dependent on IT. It either provides software and/or internet services to its customers or uses complex IT systems and products to support its business activities, including customer-facing systems, back-office processing and infrastructure. The Group migrated several key data centres to the cloud during the year and further migrations are scheduled in 2025.
Nevertheless, the Group faces several technological risks associated with such migration as well as software product development (including risks associated with the use of AI in the Group’s products and services) and service delivery, information technology security (including viruses and cyberattacks), e-commerce, enterprise resource planning system implementation and upgrades. Although plans and procedures are in place to reduce such risks, as well as training and security measures with further progress made during 2024 in this area, from time to time the Group has experienced and could in future experience verifiable impact or disruption on the Group services, including by attacks on its systems by unauthorised parties. To date, such impacts and disruptions have not resulted in any material damage, but the Group’s businesses could be adversely affected if its systems and infrastructure experience a significant failure or interruption.
Operational disruption to its business, including that caused by third-party providers and partners, a major disaster, and/or external threats, could restrict the Group’s ability to supply products and services to its customers.
Across all its businesses, the Group manages complex operational and logistical arrangements including, but not limited to, distribution centres, data centres, cloud computing, and educational and office facilities, as well as relationships with third-party print sites and with other third-party partners. It has outsourced some support functions, including elements of information technology, warehousing and logistics to third-party providers, and it has also partnered with third-parties including in relation to joint go-to-market models or otherwise.
The failure of the partnerships, third parties to whom it has outsourced business functions or who manage directly or indirectly the Group’s information and operations, could adversely affect its reputation or financial condition. Failure to recover from a major disaster, (e.g., fire, flood, etc.) at a key facility and/or a major failure of a key facility, system or platform, such as a data centre outage or cloud computing or the disruption of supply from a key third-party vendor or partner (e.g. due to bankruptcy) could restrict the Group’s ability to service its customers and meet the terms of its contractual relationships with both government agencies and commercial customers. Penalty clauses and/or the failure to retain these contracts at the end of the contract term could adversely impact future sales and/or operations.
Risks Related to the Competitive Marketplace
Global economy and cyclical market factors may adversely impact the Group’s financial performance.
With continued pressure and uncertainty in worldwide economies, particularly in the Group’s major markets in the US and UK, there is a risk of a weakening in trading conditions, which could adversely impact the Group’s future financial performance. The effect of continued deterioration or lack of recovery in the global economy will vary across different businesses and will depend on the depth, length and severity of any economic downturn. The education market can be affected by cyclical factors which, although they can have a positive impact for some of the Group’s businesses, could for others lead to a reduction in demand for the Group’s products and services.
Increased competitive pressure, reduced demand due to changing consumer learning preferences, structural market headwinds due to demographic decline, and limits on international study, may adversely impact the Group’s financial performance and reduce the expected return on investment.
The Group faces a number of large value contract renewals each year and the long-range plan assumes that these are successfully retained. The loss of any of these contracts would lead to lower sales and profits in the future unless replaced by other contract wins.
Annual report and accounts 2024 Pearson plc 230
|
Strategic report |
Governance report |
Financial statements |
Other information (unaudited) | |||||
The Group competes in a highly competitive market that is subject to rapid change in some areas. The Group also faces competitive threats both from large media players and from smaller businesses, online and mobile portals and operators in the digital arena that provide alternative sources of content. The content space continues to face the risk of price compression, driven by the growing prevalence of open educational resources, particularly those enhanced by large language models and generative AI technologies. Alternative distribution channels, such as digital format, the internet, online retailers, and growing delivery platforms, pose both threats to and opportunities for traditional publishing business models, potentially impacting both sales volumes and pricing.
In addition, new competitive entrants, increased price competition or shifts in learners away from educational institutions (as seen previously in reduced Higher Education enrolments) as well as demographic decline and limits on international study may lead to lower profitability and cash flow performance. The level of competition is placing financial strain on some of Higher Education’s channel partners and the failure of one of these companies would risk the loss of any outstanding debtor balances.
Despite sales declines in the Higher Education International business, particularly in Canada, Australia, and New Zealand, enhanced product offerings and improvements in sales capabilities have stabilised market share in the Higher Education US market and led to a return to growth.
In Virtual Learning, we expect positive trends in retention, driven by operational improvements and investments in initiatives such as career and technical curriculum for schools.
Notwithstanding the above, there is no guarantee that these measures will be sufficient in the future to prevent loss of sales and profit in any of those businesses, which could negatively impact the Group’s financial performance and prospects.
The Group’s investment in new markets may deliver returns that are lower than anticipated.
The Group has invested in, and has plans to continue to invest in, new markets such as workforce and enterprise learning experiences, of which the Group has less experience, and which is a very competitive market. Failure to achieve our planned outcomes may lead to lower than expected sales and profitability.
A significant deterioration in the Group’s profitability and/or cash flows caused by prolonged economic instability or recession could reduce its liquidity and/or impair its financial ratios and trigger a need to raise additional funds from the capital markets and/or renegotiate its banking covenants.
A significant deterioration in the Group’s profitability and/or cash flows caused by prolonged economic instability or recession could reduce its liquidity and/or impair its financial ratios and trigger a need to raise additional funds from the capital markets and/or renegotiate its banking covenants.
To the extent that worldwide economic conditions materially deteriorate, the Group’s sales, profitability and cash flows could be significantly reduced as customers could be unable to purchase products and services in the expected quantities and/or pay for them within normal agreed terms.
Disruption in capital markets or potential concerns about the Group’s credit rating, for instance manifested in downgrades or negative outlooks by the credit rating agencies, may mean that this capital may not be available on favourable terms or may not be available at all.
Risks Related to Customer Expectations
Failure to meet our customers’ rapidly changing expectations in our products and services and not being able to anticipate new customer demands could result in reduced market share, profitability, and brand erosion.
We continue to adjust our business model in an effort to keep a pace with the increasing end user demands. The Group may not be able to adapt, change and succeed in a rapidly changing and uncertain environment, resulting in competitive disadvantage, higher costs and brand erosion. This could result from failing to identify changes in learner preferences or from failing to create products and services which meet these revised expectations.
With the launch of new products, we risk that the customer experience expectations which increasingly vary from country to country are not met with regard to how the products and services are delivered e.g. quality and timeliness, impacting the customer’s brand loyalty and propensity to purchase; resulting in customer complaints, less favourable social media sentiment, bad reviews, low recommendations, and/or customer attrition.
There is also the risk that our technology and data dependent products and services do not meet accessibility requirements in respect of customers’ and prospective customers’ ability to access the products and services, and this could result in increased costs, restrictions, fines and/or legal claims.
Risks Related to the Group’s Portfolio of Businesses
The Group’s failure to generate anticipated sales growth, synergies and/or cost savings from acquisitions, mergers and other business combinations, could lead to goodwill and intangible asset impairments.
The Group periodically acquires and disposes of businesses to achieve its strategic objectives, and will continue to consider both as a means to pursue its strategic priorities.
Acquisitions may involve significant risks and uncertainties, including difficulties in integrating acquired businesses to realise anticipated sales growth, synergies and/or cost savings; diversion of management attention from other business concerns or resources; and diversion of resources that are needed in other parts of our business. If these risks are not managed, acquisitions could result in goodwill and intangible asset impairments.
Divestitures also involve risks and uncertainties that could adversely affect our business, results of operations and financial condition including, among others, the inability to find potential buyers on favourable terms, disruption to our business and/or diversion of management attention from other business concerns, loss of key employees and possible retention of certain liabilities related to the divested business.
Risks Related to the Group’s Responsibility & Reputation
The Group’s business depends on a strong brand, and any failure to maintain, protect and enhance its brand would hurt its ability to retain or expand its business.
Protecting the Group’s brands and reputation is critical to maintaining and expanding the Group’s business and will depend largely on its ability to maintain its customers’ trust in its solutions and in the quality and integrity of its products and services, including how it protects the data and privacy of customers and users.
Annual report and accounts 2024 Pearson plc 231
|
Strategic report |
Governance report |
Financial statements |
Other information (unaudited) | |||||
| Additional information for US listing purposes continued |
||||||||
The Group must also navigate the increasing divergence of stakeholder perspectives in some of our largest markets and ensure that our brand continues to reflect shifting views on certain matters, while maintaining our key values and objectives. If the Group does not successfully maintain a strong brand, its business could be harmed. Beyond protection, strengthening the Pearson brand will enable the Group to engage with governments, administrators, teachers, learners, and influencers more effectively.
Security breaches involving our information technology systems could harm our ability to run our business and expose us to potential liability and loss of sales.
While we believe the monitoring and security measures we have in place are robust, the Group still faces some risks from malicious attacks on its systems. These attacks have, in the past, and could in the future, lead to temporary loss of system availability or breaches of sensitive information. Such incidents have previously impacted customer experience and the Group’s reputation and could result in financial loss. Despite our best efforts, unauthorised disclosures of personal information have occurred and may happen again, often due to software malfunctions affecting IT controls.
Information security and cyber risk are constantly evolving, influenced by factors such as increasing customer demand for strong security, compliance requirements, the digital revolution, greater use of the cloud, larger data volumes, and more sophisticated attack strategies, which among others also use generative AI in an effort to defeat security measures. The Group manages large volumes of personal data, including that of employees, customers, students, and citizens, as well as other sensitive business-critical data like financial information and intellectual property. Despite our security measures, threat actors, including individuals, criminal organisations and state-sponsored operatives, have occasionally gained unauthorised access to the Group’s data and may do so in the future.
Any perceived or actual unauthorised disclosure of personal data or confidential information, whether through a breach of the Group’s network, a third-party partner, unauthorised access, employee theft, misuse, or error, could harm the Group’s reputation, affect its ability to attract and retain customers, disrupt business operations, or lead to regulatory investigations and/or claims or litigation. Additionally, the Group could incur significant costs in complying with relevant laws and regulations regarding the protection of personal data and confidential information, payments due to cyber extortion, or responding to regulatory investigations.
Changes to data privacy legislation must also be monitored and acted upon to ensure the Group remains in compliance across different markets, many of which are taking increasingly divergent approaches to the protection of personal information in the age of AI. This will require the Group to adapt further to accommodate jurisdictional variations, including by developing our products in a more flexible way to meet such requirements, which may result in additional cost and/or investments Countries where the Group operates or serves customers continue to adopt data protection legislation, with enforcement increasingly emphasising transparency and customer choice. This includes AI-driven personalised services and data breach management, reflecting customers’ growing awareness and sophistication regarding data protection.
Failure to provide the appropriate level of transparency and control in the Group’s products could increase the regulatory, commercial and/or reputational risks that the Group faces with any or all of its various stakeholders.
A control breakdown or service failure in the Group’s testing businesses could result in financial loss and reputational damage.
The Group’s testing businesses, including those in Assessment & Qualifications, Workforce and English Language Learning involve complex contractual relationships with both government agencies and commercial customers for the provision of various testing services. The Group’s financial results, growth prospects and/or reputation may be adversely affected if these contracts and relationships are poorly managed or face increased competitive pressures.
There are inherent risks associated with the Group’s testing businesses, both in the US and the UK. A service failure caused by a breakdown in testing and assessment processes could lead to a mis-grading of student tests and/or late delivery of test results to students and their schools. The failure to meet expected service standards and/or a late or erroneous delivery of qualification results have in the past and/or could in the future leave the Group subject to regulatory sanctions (including fines), legal claims, penalty charges under contracts, non-renewal of contracts and/or suspension or withdrawal of its accreditation to conduct tests. It is possible that any such events described above would result in adverse publicity, which may affect the Group’s ability to retain existing contracts and/ or obtain new customers.
Risks associated with identity verification could lead to financial losses.
The Group is often contractually required to take measures to validate the identity of learners, especially those completing assessments. In certain jurisdictions, companies, including Pearson, have faced legal claims for the collection of or use of information obtained, particularly in relation to biometric information, which have resulted and could in the future result in settlements. The Group takes steps to comply with evolving legal requirements but there is no guarantee that its efforts will be sufficient to protect the Group from all potential issues, which could result in potential fines, penalties, judgements or settlements for the Group, especially if not covered by the Group’s insurance cover.
Failure to effectively manage risks associated with compliance with global and local anti-bribery and corruption (ABC) legislation could result in costly legal investigations and/or adversely impact the Group’s reputation.
The Group is committed to an effective compliance programme in keeping with changing regulatory expectations, and it is also committed to conducting business in a legal and ethical manner in compliance with local and international statutory requirements and standards applicable to its business. Despite those commitments, there is a risk that the Group’s management, employees or representatives may take actions that violate applicable laws and regulations, including regarding accurate keeping of books and records or prohibiting the making of improper payments for the purposes of obtaining or keeping business, including laws such as the US Foreign Corrupt Practices Act or the UK Bribery Act. Any regulatory inquiry or investigations could be costly, require a significant amount of management’s time and attention, adversely impact the Group’s reputation, or lead to litigation and financial impacts.
Annual report and accounts 2024 Pearson plc 232
|
Strategic report |
Governance report |
Financial statements |
Other information (unaudited) | |||||
|
|
||||||||
Failure to comply with antitrust and competition legislation and/or legal or regulatory proceedings could result in substantial financial cost and/or adversely impact the Group’s reputation.
The Group is subject to global and local antitrust and competition law and although it is committed to conducting business in compliance with local and international laws, there is a risk that management, employees or representatives may act in a way that violates applicable antitrust or competition laws. Further, the Group and its subsidiaries have been and may in the future be subject to legal and regulatory investigation and proceedings in the countries in which the Group operates. These proceedings could result in greater scrutiny of the Group’s operations in other countries for anti-competitive behaviour and, in the worst case, incur a substantial financial cost. This would also have an adverse impact on the Group’s reputation.
Failure to adequately protect the health, safety and well-being of the Group’s employees, learners and other stakeholders could adversely impact the Group’s reputation, profitability, and future growth.
Although the Group has invested in global policies, procedures and controls to safeguard the health, safety and wellbeing of its employees, learners and other stakeholders, accidents or incidents have occurred and could still occur due to unforeseen risks, causing injury or harm to individuals and impacting the Group’s business operations. This has the potential to lead to legal impact, including criminal and civil litigation, reputational impact and/or business disruption leading to operational loss for, and reduction in the profitability of the Group.
Failure to ensure security for the Group’s staff, learners, and assets, due to increasing numbers of, and variety of, local and global threats, could impact the Group’s operations, financial performance and reputation.
Pearson is a global business with locations in diverse, sometimes high-risk, locations worldwide. Although it has protective measures in place to secure its staff, learners and assets, the Group could still be impacted by external threats, such as localised incidents, terrorist attacks, strikes or extreme weather. Future occurrences could cause harm to individuals and/or disrupt business operations. These have the potential to lead to operational loss, a reduction in profitability and impact on the Group’s global reputation.
Other Significant Near-term and Emerging Risks
Sustainability risks may adversely impact the Group’s business, if not managed appropriately
The Group considers sustainability risks no differently to the way it manages any other business risk. Expectations around climate commitments and measurements change on a regular basis. A failure to comply with relevant standards, or other sustainability-related laws or regulations, whether in the UK or elsewhere, could adversely affect the Group’s reputation and have a negative impact on its relations with employees, customers and/or business partners. Costs associated with climate-transition which cannot be fully managed by decarbonisation activities may lead to decreased margins.
Financial markets disruption – A lack of sufficient capital resources could adversely impact the Group’s ability to operate.
Financial crises impact financial markets periodically, which could result in bank failures and loss of capital for the Group, or an inability to access debt capital markets as planned.
Inflation – High levels of global inflation could increase costs and adversely impact the Group’s profits and financial performance.
High ongoing global inflation factors have increased and could further increase the cost of production for Pearson, particularly through wage inflation. There is no guarantee that the Group would be able to manage cost or generate sales successfully to mitigate the effects of inflation, which could lead to reduced earnings and ability to invest in future growth.
Geopolitical conflict – Conflict could negatively affect Pearson’s operations.
Pearson has staff and offices globally, which could be impacted by conflict or blockades as a result of geopolitical issues. Notably, Pearson has offices in Israel which support Pearson’s digital products, which if affected by conflict could negatively impact the pace of innovation or the quality of Pearson’s products and thereby adversely impact the Group’s operations, sales and financial performance.
Certain additional information on the Company
Information on the Company
Pearson was incorporated and registered in 1897 under the laws of England and Wales as a limited company and re-registered under the UK Companies Act as a public limited company in 1981. The Group conducts its operations primarily through its subsidiaries and other affiliates. Its principal executive offices are located at 80 Strand, London WC2R 0RL, United Kingdom (telephone: +44 20 7010 2000) and its website address is https://plc.pearson.com/. The Company is registered in England and Wales under the company number 00053723. The SEC maintains an Internet site that contains reports, proxy and information statements, and other information regarding issuers that file electronically with the SEC. The address of that site is http://www.sec.gov.
Operating cycles
The Group determines a normal operating cycle separately for each entity/cash generating unit with distinct economic characteristics. The ‘normal operating cycle’ for each of the Group’s businesses is primarily based on the expected period over which content or services will generate cash flows. The Higher Education courseware market is primarily driven by an adoption cycle, with colleges and professors typically refreshing their courses and selecting revised programs on a regular basis, often in line with the release of new content or new technology offerings. The Company renews its product development assets to reflect new content and capabilities which enhance the attractiveness of its offering to both educators and learners.
Analysis of historical data shows that the typical life cycle of Higher Education content is up to five years but varies by product. In addition to content, the Group also develops technology platforms for products and the life cycle for these platforms can be in excess of the five years cycle for content. Again, the operating cycle for content and platforms mirrors the market cycle.
Historically for a major content refresh a development phase of typically 12 to 18 months for Higher Education precedes the period during which the Company receives and delivers against orders for the products it has developed for the programme.
The operating cycles in respect of the Group’s professional and clinical content are more specialised in nature as they relate to educational or heavy reference products released into smaller markets (e.g. the financial training and IT sectors).
Annual report and accounts 2024 Pearson plc 233
|
Strategic report |
Governance report |
Financial statements |
Other information (unaudited) | |||||
| Additional information for US listing purposes continued |
||||||||
Nevertheless, in these markets, there is still a regular cycle of product renewal, in line with demand which management monitor. Typically, the life cycle is five years for Professional content and seven years for Clinical content. Elsewhere in the Group, operating cycles are typically less than one year.
Competition
The Group’s businesses operate in highly competitive markets. The Group faces competitive threats both from large media players and from smaller businesses, online and mobile portals and operators in the digital arena that provide alternative sources of content. Alternative distribution channels, e.g. digital format, the internet, online retailers, growing delivery platforms (e.g. e-readers or tablets), pose both threats and opportunities to traditional publishing business models, potentially impacting both sales volumes and pricing.
In Assessment & Qualifications, the Group competes with other companies offering test development and administration including Cambium, Data Recognition Corp (DRC), Educational Testing Service (ETS), and NWEA, and others. The Professional Certification business competes with companies such as Prometric PSI and Meazure Learning, as well as a number of other modular players. The Clinical Assessment business competes with companies such as MHS and WPS. The UK and International qualifications business competes with companies such as AQA, Cambridge Assessment and OCR, as well as a number of specialised players.
In Virtual Learning, the Group competes with companies such as Stride in virtual schools, alongside players that specialise in a particular academic discipline or focus on a learning technology.
In Institutional English Language Learning, the Group competes with Oxford University Press, Macmillan and other publishers. In English High Stakes Assessments, Pearson Test of English competes with alternative tests including iELTS and TOEFL. In the online language learning market, the Group competes with businesses such as Duolingo, Babbel and Busuu, as well as a number of smaller players.
In Enterprise Learning and Skills (formerly Workforce Skills), the vocational qualifications business competes with companies such as City & Guilds, alongside other niche and local market providers and the assessments businesses compete with companies such as HiSET in high school equivalency and SHL in skills and ability testing. In addition, the business of content/courseware creation for enterprises competes with providers such as Skillsoft, and the enterprise data, technology and learning businesses compete with Learning platforms such as Guild in education-as-a-benefit, credential platforms such as Accredible, talent management platforms such as Eightfold.ai, and data services such as Emsi.
In Higher Education, the Group competes with other publishers and creators of educational materials and services. These companies include publishers such as Cengage Learning and McGraw-Hill Education, as well as non-mainstream publishers.
Competition is based on the ability to deliver quality products and services that address the specified curriculum needs and appeal to the student, organisations, school boards, educators, employers and government officials making purchasing decisions.
Intellectual property
The Group’s principal intellectual property assets consist of its:
| • | trademarks and other rights via its brands (including corporate and business unit brands and imprints, as well as product and service brands); |
| • | copyrights for its textbook and related educational content and software code; and |
| • | patents and trade secrets related to the innovative methods deployed in its key technologies. |
The Group believes it has taken reasonable legal steps to protect its key brands in its major markets and copyright in its content and has taken appropriate steps to develop a comprehensive patent programme to ensure appropriate protection of emerging inventions that are critical to its new business strategies.
Licenses, patents and contracts
The Group is not dependent upon any particular licenses, patents or new manufacturing processes that are material to its business or profitability. Notwithstanding the foregoing, the Group’s education business is dependent upon licensed rights since most textbooks and digital learning tools include content and/or software that is licensed to it by third parties (or assigned subject to royalty arrangements). In addition, some software products in various business lines rely upon patents licensed from third parties.
The Group is not materially dependent upon any particular contracts with suppliers or customers, including contracts of an industrial, commercial or financial nature. The Group’s sales are diversified, no individual customer comprised more than 5% of sales in 2024.
Raw materials
Paper remains the principal raw material used by the Group although its use is declining given the shift to digital products. The bulk of the paper used by Pearson is supplied by its printers. The Group has not experienced and does not anticipate difficulty in obtaining adequate supplies of paper for its operations, with sourcing available from numerous suppliers. While prices fluctuate depending upon local market conditions, the Group has not experienced extensive volatility in fulfilling paper requirements. In the event of a sharp increase in paper prices, including those driven by tariffs, the Group has a number of alternatives to minimise the impact on its operating margins, which include modifying the grades of paper used in production.
Government regulation
The manufacture of certain products in various markets is subject to governmental regulation relating to the discharge of materials into the environment. Operations are also subject to the risks and uncertainties attendant to doing business in numerous countries. Some of the countries in which the Group conducts these operations maintain controls on the repatriation of earnings and capital and restrict the means available for hedging potential currency fluctuation risks.
The operations that are affected by these controls, however, are not material. Accordingly, these controls have not significantly affected the Group’s international operations. Regulatory authorities may have enforcement powers that could have an impact. The Group believes, however, that in light of the nature of its business the risk of these sanctions does not represent a material threat.
Legal proceedings
The Group and its subsidiaries are from time to time the subject of legal proceedings incidental to the nature of its and their operations, including private litigation or arbitrations, governmental proceedings and investigations by regulatory bodies.
Annual report and accounts 2024 Pearson plc 234
|
Strategic report |
Governance report |
Financial statements |
Other information (unaudited) | |||||
|
|
||||||||
Property, plant and equipment
The Group’s headquarters are located at leasehold premises in London, England. As at 31 December 2024, it owned or leased approximately 700 properties, including approximately 534 testing/teaching centres in over 55 countries worldwide, the majority of which are located in the United Kingdom and the United States. The other properties owned and leased by the Group consist mainly of offices and distribution centres. In some cases properties leased by the Group are then sublet to third parties.
The vast majority of printing is carried out by third-party suppliers. The Group operates a small digital print operation as part of its Pearson Assessment & Testing businesses which provides short-run and print-on-demand products, typically custom client applications.
The Group owns the following principal properties at 31 December 2024:
| General use of property | Location | Area in square feet | ||||
| Office |
Iowa City, Iowa, USA* | 314,538 | ||||
| Warehouse/office |
Cedar Rapids, Iowa, USA | 205,000 | ||||
| Testing |
Owatonna, Minnesota, USA | 126,450 | ||||
| * | Property is recorded as held for sale at 31 December 2024. |
The Group leased the following principal properties at 31 December 2024:
| General use of property | Location | Area in square feet | ||||
| Office |
Hudson, New York, USA* | 313,285 | ||||
| Office |
Westminster, London, UK* | 274,488 | ||||
| Office |
Hoboken, New Jersey, USA* | 216,273 | ||||
| Office |
Bloomington, Minnesota, USA* | 147,159 | ||||
| Warehouse/office |
Cedar Rapids, Iowa, USA* | 119,682 | ||||
| * | Properties have either been fully or partially sublet or are being marketed for sublet. |
Off-balance sheet arrangements
The Group does not have any off-balance sheet arrangements, as defined by the SEC for the purposes of the Form 20-F, that have or are reasonably likely to have a material current or future effect on the Group’s financial position or results of operations.
Operating and financial review
The financial review for the year ended 31 December 2024 compared to the year ended 31 December 2023 can be found on pages 26-32 of the Strategic report. The financial review for the year ended 31 December 2023 compared to the year ended 31 December 2022 can be found on pages 26-33 of our 2023 Annual Report and Accounts on Form 20-F filed with the United States Securities and Exchange Commission on 14 March 2023.
Directors, senior management and employees
Board practices
As at 28 February 2025, the Group’s Board comprises the Chair, two Executive Directors and seven Non-Executive Directors. The Articles of Association (as defined below) provide that all the Directors at the date of the notice convening the Annual General Meeting (AGM) shall retire from office at the meeting. A retiring Director shall, if willing to act, be eligible for re-appointment. If they are not reappointed, they shall retain office until the meeting appoints someone in their place, or if it does not do so, until the end of the meeting or, if the meeting is adjourned, the end of the adjourned meeting. The Articles of Association also provide that every Director appointed by the Board be subject to reappointment by shareholders at the next AGM following their appointment.
On 7 March 2025, the company announced the appointment of an independent Non-Executive Director with effect from 1 June 2025.
Pearson is listed on the New York Stock Exchange (NYSE). As a listed non-US issuer, the Group is not required to comply with some of the NYSE’s corporate governance rules, but must disclose on its website any significant ways in which its corporate governance practices differ from those followed by US companies under the NYSE listing standards. At this time, the Group believes that it is in compliance in all material respects with all the NYSE rules except that the Nomination & Governance Committee is not composed entirely of independent Directors as the Chair, who is not considered independent under NYSE rules, is a member of this Committee in addition to independent Directors.
Employees
Through its subsidiaries, the Group has entered into collective bargaining agreements with employees in various locations. The Group’s management has no reason to believe that it would not be able to renegotiate any such agreements on satisfactory terms. The Group encourages employees to contribute actively to the business in the context of their particular job roles and believes that the relations with its employees are generally good.
Significant changes
Other than those events described in note 37 in the consolidated financial statements, and seasonal fluctuations in borrowings, there has been no significant change to the Group’s financial condition or results of operations since 31 December 2024. The Group’s borrowings fluctuate by season due to the effect of the school year on working capital requirements. Assuming no share buyback programmes, acquisitions or disposals, the maximum level of net debt normally occurs in the third quarter, and the minimum level of net debt normally occurs in December.
Listing
The principal trading market for the Group’s ordinary shares is the London Stock Exchange which trade under the symbol ‘PSON’. Its ordinary shares also trade in the United States in the form of ADSs evidenced by ADRs under a sponsored ADR facility with JPMorgan Chase Bank, as depositary. The Group established this facility in March 1995 and amended it in August 2014 in connection with its NYSE listing, and in January 2025 in connection with the appointment of JPMorgan Chase Bank as depositary thereunder. Each ADS represents one ordinary share.
The ADSs trade on the New York Stock Exchange under the symbol ‘PSO’.
Annual report and accounts 2024 Pearson plc 235
|
Strategic report |
Governance report |
Financial statements |
Other information (unaudited) | |||||
| Additional information for US listing purposes continued |
||||||||
Articles of Association
The Group summarises below the material provisions of its articles of association, as amended (the ‘Articles of Association’), which have been filed as an exhibit to this annual report on Form 20-F for the year ended 31 December 2024. The summary below is qualified entirely by reference to the Articles of Association. In conformity with the UK Companies Act 2006 (the Act), the Group has multiple business objectives and purposes and is authorised to do such things as the Board may consider fit to further its interests or incidental or conducive to the attainment of its objectives and purposes.
Directors’ powers
The Group’s business shall be managed by the Board of Directors and the Board may exercise all such of its powers as are not required by law or by the Articles of Association or by any directions given by the Company by special resolution, to be exercised in a general meeting.
Interested Directors
For the purposes of section 175 of the Act, the Board may authorise any matter proposed to it which would, if not so authorised, involve a breach of duty by a Director under that section, including, without limitation, any matter which relates to a situation in which a Director has, or can have, an interest which conflicts, or possibly may conflict, with the interests of the Company. Any such authorisation will be effective only if:
| a. | any requirement as to quorum at the meeting at which the matter is considered is met without counting the Director in question or any other interested Director; and |
| b. | the matter was agreed to without their voting or would have been agreed to if their votes had not been counted. |
The Board may (whether at the time of the giving of the authorisation or subsequently) make any such authorisation subject to any limits or conditions it expressly imposes but such authorisation is otherwise given to the fullest extent permitted. The Board may vary or terminate any such authorisation at any time.
Provided that he or she has disclosed to the Board the nature and extent of his or her interest (or else that the Director is not aware of the interest or not aware of the transaction or arrangement in question, or else that the interest cannot be reasonably regarded to give rise to a conflict of interest), a Director notwithstanding his or her office:
| a. | may be a party to, or otherwise interested in, any transaction or arrangement with the Company or in which the Company is otherwise (directly or indirectly) interested; |
| b. | may act by himself or herself or his or her firm in a professional capacity for the Company (otherwise than as auditor) and he or she or his or her firm shall be entitled to remuneration for professional services as if he or she were not a Director; |
| c. | may be a Director or other officer of, or employed by, or a party to a transaction or arrangement with, or otherwise interested in, any body corporate in which the Company is otherwise (directly or indirectly) interested. |
A Director shall not, by reason of his or her office, be accountable to the Company for any remuneration or other benefit which he or she derives from any office or employment or from any transaction or arrangement or from any interest in any body corporate:
| a. | the acceptance, entry into or existence of which has been approved by the Board (subject, in any such case, to any limits or conditions to which such approval was subject); or |
| b. | which he or she is permitted to hold or enter into by virtue of paragraph (a), (b) or (c) above; |
nor shall the receipt of any such remuneration or other benefit constitute a breach of his or her duty under section 176 of the Act. A Director shall be under no duty to the Company with respect to any information which he or she obtains or has obtained otherwise than as a Director of the Company and in respect of which he or she owes a duty of confidentiality to another person. However, to the extent that his or her relationship with that other person gives rise to a conflict of interest or possible conflict of interest, the preceding sentence only applies if the existence of such relationship has been approved by the Board. In such circumstances, the Director shall not be in breach of the general duties he or she owes to the Company by virtue of sections 171 to 177 of the Act because he or she fails:
| a. | to disclose any such information to the Board or to any Director or other officer or employee of the Company; and/or |
| b. | to use or apply any such information in performing his or her duties as a Director of the Company. |
Where the existence of a Director’s relationship with another person has been approved by the Board and his or her relationship with that person gives rise to a conflict of interest or possible conflict of interest, the Director shall not be in breach of the general duties he or she owes to the Company by virtue of sections 171 to 177 of the Act because he or she:
| a. | absents himself or herself from meetings of the Board at which any matter relating to the conflict of interest or possible conflict of interest will or may be discussed or from the discussion of any such matter at a meeting or otherwise; and/or |
| b. | makes arrangements not to receive documents and information relating to any matter which gives rise to the conflict of interest or possible conflict of interest sent or supplied by the Company and/or for such documents and information to be received and read by a professional adviser, for so long as he or she reasonably believes such conflict of interest or possible conflict of interest subsists. |
Except as stated below, a Director shall not vote in respect of any contract or arrangement or any other proposal whatsoever in which he or she has an interest which is, to his or her knowledge, a material interest, otherwise than by virtue of his or her interests in shares or debentures or other securities of or otherwise in or through the Company. A Director shall not be counted in the quorum at a meeting of the Board in relation to any resolution on which he or she is debarred from voting.
Notwithstanding the foregoing, a Director will be entitled to vote, and be counted in the quorum, on any resolution concerning any of the following matters:
| • | the giving of any guarantee, security or indemnity in respect of money lent or obligations incurred by him or her or by any other person at the request of or for the benefit of the Company or any of its subsidiaries; |
Annual report and accounts 2024 Pearson plc 236
|
Strategic report |
Governance report |
Financial statements |
Other information (unaudited) | |||||
|
|
||||||||
| • | the giving of any guarantee, security or indemnity to a third party in respect of a debt or obligation of the Company or any of its subsidiaries for which he himself or she herself has assumed responsibility in whole or in part and whether alone or jointly with others under a guarantee or indemnity or by the giving of security; |
| • | any proposal relating to the Company or any of its subsidiary undertakings where it is offering securities in which offer a Director is or may be entitled to participate as a holder of securities or in the underwriting or sub-underwriting of which a Director is to participate; |
| • | any proposal relating to another Company in which he or she and any persons connected with him or her do not to his or her knowledge hold an interest in shares (as that term is used in sections 820 to 825 of the Act) representing one percent or more of either any class of the equity share capital, or the voting rights, in such Company; |
| • | any proposal relating to an arrangement for the benefit of the employees of the Company or any of its subsidiary undertakings which does not award him or her any privilege or benefit not generally awarded to the employees to whom such arrangement relates; and |
| • | any proposal concerning insurance that the Company proposes to maintain or purchase for the benefit of Directors or for the benefit of persons, including Directors. |
Where proposals are under consideration concerning the appointment of two or more Directors to offices or employment with us or any Company in which the Group is interested, these proposals may be divided and considered separately and each of these Directors, if not prohibited from voting under the provisions of the eighth paragraph before this one, will be entitled to vote and be counted in the quorum with respect to each resolution except that concerning his or her own appointment.
Retirement and re-appointment of Directors
At every AGM, all the Directors at the date of the notice convening the AGM shall retire from office. A retiring Director shall, if willing to act, be eligible for re-appointment. If he or she is not re-appointed, he or she shall retain office until the meeting appoints someone in his or her place, or if it does not do so, until of the end of the meeting, or until the end of the adjourned meeting if the meeting is adjourned.
Where a Director has been reappointed after notice of the AGM has been given, that Director shall retire at the next AGM of which notice is first given after his or her appointment as Director.
If there is an insufficient number of appointed or re-appointed Directors at any of the Company’s AGMs rendering the Board inquorate, all Directors shall be automatically re-appointed only for the purposes of filling vacancies and convening general meetings of the Company and to perform such duties as are appropriate to maintain the Company as a going concern and to enable it to comply with its legal and regulatory obligations. The Directors are required to convene a further general meeting of the Company as soon as reasonably practicable to allow new Directors to be appointed, and such Directors who were not appointed at the original general meeting shall subsequently retire.
Borrowing powers
The Board of Directors may exercise all powers to borrow money and to mortgage or charge the Group’s undertaking, property and uncalled capital and to issue debentures and other securities, whether outright or as collateral security for any of its or any third party’s debts, liabilities or obligations.
The Board of Directors must restrict the borrowings in order to secure that the aggregate amount of undischarged monies borrowed by the Group (and any of its subsidiaries), but excluding any intra-group debts, shall not at any time (without the previous sanction of the Company in the form of an ordinary resolution) exceed a sum equal to twice the aggregate of the adjusted capital and reserves.
Other provisions relating to Directors
Under the Articles of Association, Directors are paid out of the Group’s funds for their services as it may from time to time determine by ordinary resolution and, in the case of Non-Executive Directors, up to an aggregate of Ł1,000,000 per year or such other amounts as resolved by the shareholders at a general meeting. Any Director who is not an Executive Director and who performs special services which in the opinion of the Board are outside the scope of the ordinary duties of a Director, may be paid such extra remuneration by way of additional fee, salary, commission or otherwise as the Board may determine in accordance with the Group’s remuneration policy. Under the Articles of Association, Directors currently are not required to hold any share qualification. However, the remuneration policy mandates a shareholding guideline for Executive Directors which they are expected to build towards over a specified period.
General meetings
Pursuant to the Act, the Company must hold an AGM (within six months beginning with the day following its accounting reference date) at a place and time determined by the Board. The following matters are usually considered at an AGM:
| • | approval of final dividend; |
| • | consideration of the Company’s annual accounts together with associated reports of the Board of Directors and auditors; |
| • | appointment or re-appointment of Directors; |
| • | appointment or re-appointment of the auditors, and authorisation for the Audit Committee to determine and fix the remuneration of the auditors; and |
| • | renewal, limitation, extension, variation or grant of any authority to the Board in relation to the allotment and repurchase of securities. |
The Board may call a general meeting whenever it thinks fit. If at any time there are not within the United Kingdom sufficient Directors capable of acting to form a quorum, any Director or any two members may convene a general meeting in the same manner as nearly as possible as that in which meetings may be convened by the Board.
No business shall be dealt with at any general meeting unless a quorum is present when the meeting proceeds to business. Three members present in person or by proxy and entitled to vote shall be a quorum for all purposes. A corporation being a member shall be deemed to be personally present if represented by its duly authorised representative.
If a quorum for a meeting convened at the request of shareholders is not present within 15 minutes of the appointed time (or if during a meeting such a quorum ceases to be present), the meeting will be dissolved. In any other case, the general meeting will be adjourned to such time and with such means of attendance and participation as the Chair of the meeting may determine. If at that rescheduled meeting a quorum is not present within fifteen minutes from the time appointed for holding the meeting, the shareholders present in person or by proxy will be a quorum.
Annual report and accounts 2024 Pearson plc 237
|
Strategic report |
Governance report |
Financial statements |
Other information (unaudited) | |||||
| Additional information for US listing purposes continued |
||||||||
The Chair or, in his or her absence, the Deputy Chair or any other Director nominated by the Board, will preside as Chair at every general meeting. If no Director is present at the general meeting or no Director consents to act as Chair, the shareholders present shall elect one of their number to be Chair of the meeting.
The Board may resolve to enable persons entitled to attend and participate in a general meeting to do so by simultaneous attendance and participation by means of electronic facility or facilities and determine the means, or all different means, of attendance and participation used in relation to a general meeting. The members present in person or by proxy by means of electronic facility or facilities shall be counted in the quorum for, and entitled to participate in the general meeting in question. That meeting shall be duly constituted and its proceedings valid if the Chair of the meeting is satisfied that adequate facilities are available throughout the meeting to ensure that members attending the meeting by all means (including by means of electronic facility or facilities) are able to:
| c. | participate in the business for which the meeting has been convened; |
| d. | hear all persons who speak at the meeting; and |
| e. | be heard by all persons present at the meeting. |
A member seeking to be present in person or by proxy at a general meeting by means of electronic facility or facilities is responsible for ensuring they have access to and can use the facility or facilities. The meeting shall be duly constituted and its proceedings valid notwithstanding the inability of the member to gain access to use the facility or facilities, or the loss of access to or use of the facility or facilities during the meeting.
Share certificates
Every person whose name is entered as a member in the Company’s Register of Members shall be entitled to one certificate in respect of each class of shares held (the law regarding this does not apply to stock exchange nominees). Subject to the terms of issue of the shares, certificates are issued following allotment or receipt of the relevant transfer by the Group’s registrar, Computershare Investor Services PLC, The Pavilions, Bridgwater Road, Bristol, BS99 6ZY, United Kingdom.
Share capital
Any share may be issued with such preferred, deferred or other special rights or other restrictions as may be determined by way of a shareholders’ vote in a general meeting. Subject to the Act, any shares may be issued which are to be redeemed or are liable to be redeemed at the option of the Company or the shareholders.
There are no provisions in the Articles of Association which discriminate against any existing or prospective shareholder as a result of such shareholder owning a substantial number of shares.
Subject to the terms of the shares which have been issued, the Directors may from time to time make calls upon the shareholders in respect of any moneys unpaid on their shares, provided that (subject to the terms of the shares so issued) no call on any share shall be payable at less than 14 clear days from the last call. The Directors may, if they see fit, receive from any shareholder willing to advance the same, all and any part of the moneys uncalled and unpaid upon any shares held by him or her.
Changes in capital
The Group may, from time to time by ordinary resolution subject to the Act:
| • | consolidate and divide all or any of its share capital into shares of a larger nominal amount than its existing shares; or |
| • | sub-divide all of or any of its existing shares into shares of smaller nominal amounts. |
The Group may, from time to time, increase its share capital by allotting new shares in accordance with the prescribed threshold authorised by shareholders at the last AGM and subject to the consents and procedures required by the Act. The Group may also, by special resolution, reduce its share capital.
Voting rights
Every holder of ordinary shares present in person or by proxy at a meeting of shareholders has one vote on a vote taken by a show of hands. On a poll, every holder of ordinary shares who is present in person or by proxy has one vote for every 25 pence of nominal share capital (being one ordinary share) of which he or she is the holder. Voting at any meeting of shareholders is usually on a poll rather than by show of hands. Voting on a poll is more transparent and equitable because it includes the votes of all shareholders, including those cast by proxies, rather than just the votes of those shareholders who attend the meeting. A poll may also be demanded by:
| • | the Chair of the meeting; |
| • | at least three shareholders present in person or by proxy and entitled to vote; |
| • | any shareholder or shareholders present in person or by proxy representing not less than one- tenth of the total voting rights of all shareholders having the right to vote at the meeting; or |
| • | any shareholder or shareholders present in person or by proxy holding shares conferring a right to vote at the meeting being shares on which the aggregate sum paid up is equal to not less than one-tenth of the total sum paid up on all shares conferring that right. |
Dividends
Holders of ordinary shares are entitled to receive dividends out of Group profits that are available by law for distribution, as the Group may declare by ordinary resolution, subject to the terms of issue thereof.
However, no dividends may be declared in excess of an amount recommended by the Board of Directors. The Board may pay interim dividends on the shares of any class as it deems fit. It may invest or otherwise use all dividends left unclaimed for six months after having been declared for its benefit, until claimed. All dividends unclaimed for a period of eight years after having been declared will be forfeited and revert to the Group.
The Directors may, with the sanction of an ordinary resolution of the shareholders, offer any holders of ordinary shares the right to elect to receive ordinary shares credited as fully paid, in whole or in part, instead of cash in respect of such dividend.
The Directors may deduct from any dividend payable to any shareholder all sums of money (if any) presently payable by that shareholder to the Group on account of calls or otherwise in relation to its shares.
Annual report and accounts 2024 Pearson plc 238
|
Strategic report |
Governance report |
Financial statements |
Other information (unaudited) | |||||
|
|
||||||||
Dividends may be paid by such method or combination of methods as the Board, in its absolute discretion, may decide. Different methods of payment may apply to different holders or groups of holders.
Liquidation rights
In the event of the Group’s liquidation, after payment of all liabilities, its remaining assets would be used to repay the holders of ordinary shares the amount they paid for their ordinary shares. Any balance would be divided among the holders of ordinary shares in proportion to the nominal amount of the ordinary shares held by them.
Other provisions of the Articles of Association
Whenever the Group’s capital is divided into different classes of shares, the special rights attached to any class may, unless otherwise provided by the terms of the issue of the shares of that class, be varied or abrogated, either with the written consent of the holders of 75% of the issued shares of the class (excluding any issued as treasury shares) or with the sanction of a special resolution passed at a separate meeting of these holders. Conditions set out in the Articles of Association with respect to the variation of rights are subject to the provisions of the Act. In the event that a shareholder or other person appearing to the Board of Directors to be interested in ordinary shares fails to comply with a notice requiring him or her to provide information with respect to their interest in voting shares pursuant to section 793 of the Act, the Board may serve that shareholder with a notice of default. After service of a default notice, that shareholder shall not be entitled to attend or vote at any general meeting or at a separate meeting of holders of a class of shares or on a poll until he or she has complied in full with the Group’s information request.
If the shares described in the default notice represent at least a quarter of 1% in nominal value of the issued ordinary shares, then the default notice may additionally direct that in respect of those shares:
| • | the Group will not pay dividends (or issue shares in lieu of dividends); and |
| • | the Group will not register transfers of shares unless (i) the shareholder is not itself in default as regards supplying the information requested and the transfer, when presented for registration, is accompanied by a certificate from the shareholder in such form as the Board of Directors may require to the effect that, after due and careful inquiry, the shareholder is satisfied that no person in default is interested in any of the ordinary shares which are being transferred; (ii) the transfer is an approved transfer, as defined in the Articles of Association; or (iii) the registration of the transfer is required by the Uncertificated Securities Regulations 2001. |
No provision of the Articles of Association expressly governs the ordinary share ownership threshold above which shareholder ownership must be disclosed. Under the Disclosure Guidance and Transparency Rules of the Financial Conduct Authority, any person who acquires, either alone or, in specified circumstances, with others an interest in the Company’s voting share capital equal to or in excess of 3% comes under an obligation to disclose prescribed particulars to the Company in respect of those ordinary shares. A disclosure obligation also arises where a person’s notifiable interests fall below 3%, or where, at or above 3%, the percentage of the Company’s voting share capital in which a person has a notifiable interest reaches, exceeds or falls below 3%, 4%, 5%, 6%, 7%, 8%, 9%, 10%, and each 1% threshold thereafter up to 100%.
Limitations affecting holders of ordinary shares or ADSs
Under English law and Articles of Association, persons who are neither UK residents nor UK nationals may freely hold, vote and transfer ordinary shares in the same manner as UK residents or nationals.
Material contracts
The Group is not currently party to any contracts outside the ordinary course of business, other than the Trust Deed entered into with respect to the (i) €300.0 million aggregate principal amount of 1.375% guaranteed notes due 2025, (ii) £350.0 million aggregate principal amount of 3.750% guaranteed notes due 2030 and (iii) £350.0 million aggregate principal amount of 5.375% guaranteed notes due 2034, in each case issued by a subsidiary of, and guaranteed by, Pearson, which are filed as Exhibit 2.1, Exhibit 2.2 and Exhibit 2.3 to the annual report on Form 20-F for the year ended 31 December 2024, respectively.
Executive employment contracts
The Group has entered into agreements with each of its Executive Directors pursuant to which such Executive Director is employed by the Group. These agreements describe the duties of such Executive Director and the compensation to be paid by us.
It is the Group’s policy that it may terminate the Executive Directors’ service agreements by giving no more than 12 months’ notice. As an alternative, the Group may at its discretion pay in lieu of that notice. Payment-in-lieu of notice may be made in equal monthly instalments from the date of termination to the end of any unexpired notice period. In the case of Executive Directors, payment-in-lieu of notice in instalments may also be subject to mitigation and reduced, taking into account earnings from alternative employment. For Executive Directors, pay in lieu of notice comprises 100% of the annual salary at the date of termination and the annual cost to the Company of providing pension and all other benefits. The Group may, depending on the circumstances of the termination, determine that it will not pay the Director in lieu of notice and may instead terminate a Director’s contract in breach and make a damages payment, taking into account as appropriate the Director’s ability to mitigate their loss.
Exchange controls
There are no UK Government laws, decrees, regulations or other legislation which restrict or which may affect the import or export of capital, including the availability of cash and cash equivalents for use by us or the remittance of dividends, interest or other payments to non-resident holders of the Group’s securities, except as otherwise described under ‘Tax Considerations’ below.
Tax considerations
The following is a discussion of the material US federal income tax considerations and UK tax considerations arising from the acquisition, ownership and disposition of ordinary shares and ADSs by a US holder. A US holder is:
| • | an individual citizen or resident of the US, or |
| • | a corporation created or organised in or under the laws of the US or any of its political subdivisions, or |
| • | an estate or trust the income of which is subject to US federal income taxation regardless of its source. |
Annual report and accounts 2024 Pearson plc 239
|
Strategic report |
Governance report |
Financial statements |
Other information (unaudited) | |||||
| Additional information for US listing purposes continued |
||||||||
This discussion deals only with ordinary shares and ADSs that are held as capital assets by a US holder, and does not address tax considerations applicable to US holders that may be subject to special tax rules, such as:
| • | dealers or traders in securities or currencies, |
| • | financial institutions or other US holders that treat income in respect of the ordinary shares or ADSs as financial services income, |
| • | insurance companies, |
| • | tax-exempt entities, |
| • | persons acquiring shares or ADSs in connection with employment, |
| • | US holders that hold the ordinary shares or ADSs as a part of a straddle or conversion transaction or other arrangement involving more than one position, |
| • | US holders that own, or are deemed for US tax purposes to own, 10% or more of the total combined voting power of all classes of the Group’s voting stock, |
| • | US holders that have a principal place of business or ‘tax home’ outside the United States, or |
| • | US holders whose ‘functional currency’ is not the US dollar. |
For US federal income tax purposes, holders of ADSs will be treated as the owners of the ordinary shares represented by those ADSs. In practice, HM Revenue & Customs (HMRC) will also regard holders of ADSs as the beneficial owners of the ordinary shares represented by those ADSs, although case law has cast some doubt on this. The discussion below assumes that HMRC’s position is followed.
In addition, the following discussion assumes that JP Morgan Chase Bank will perform its obligations as depositary in accordance with the terms of the depositary agreement and any related agreements.
Because US and UK tax consequences may differ from one holder to the next, the discussion set out below does not purport to describe all of the tax considerations that may be relevant to you and your particular situation. Accordingly, you are advised to consult your own tax adviser as to the US federal, state and local, UK and other, including foreign, tax consequences of investing in the ordinary shares or ADSs. Except where otherwise indicated, the statements of US and UK tax law set out below are based on the laws, interpretations and tax authority practice in force or applicable as of 28 February 2025 and are subject to any changes occurring after that date, possibly with retroactive effect.
UK income taxation of distributions
The UK does not impose dividend withholding tax on dividends paid by the Company.
A US holder that is not resident in the UK for UK tax purposes and does not carry on a trade, profession or vocation in the UK through a branch or agency (or in the case of a company a permanent establishment) to which the ordinary shares or ADSs are attributable will not generally be liable to pay UK tax on dividends paid by the Company.
US income taxation of distributions
Distributions that the Group makes with respect to the ordinary shares or ADSs, other than distributions in liquidation and distributions in redemption of stock that are treated as exchanges, will be taxed to US holders as ordinary dividend income to the extent that the distributions do not exceed the Group’s current and accumulated earnings and profits. The amount of any distribution will equal the amount of the cash distribution. Distributions, if any, in excess of the Group’s current and accumulated earnings and profits will constitute a non-taxable return of capital to a US holder and will be applied against and reduce the US holder’s tax basis in its ordinary shares or ADSs. To the extent that these distributions exceed the tax basis of the US holder in its ordinary shares or ADSs, the excess generally will be treated as capital gain.
Dividends that the Group pays will not be eligible for the dividends received deduction generally allowed to US corporations under Section 243 of the Code.
In the case of distributions in pounds sterling, the amount of the distributions generally will equal the US dollar value of the pounds sterling distributed, determined by reference to the spot currency exchange rate on the date of receipt of the distribution by the US holder in the case of shares or by JP Morgan Chase Bank in the case of ADSs, regardless of whether the US holder reports income on a cash basis or an accrual basis. The US holder will realise separate foreign currency gain or loss only to the extent that this gain or loss arises on the actual disposition of pounds sterling received. For US holders claiming tax credits on a cash basis, taxes withheld from the distribution are translated into US dollars at the spot rate on the date of the distribution; for US holders claiming tax credits on an accrual basis, taxes withheld from the distribution are translated into US dollars at the average rate for the taxable year.
A distribution by the Company to non-corporate shareholders will be taxed as net capital gain at a maximum rate of 20%, provided certain holding periods are met, to the extent such distribution is treated as a dividend under US federal income tax principles. In addition, a 3.8% Medicare tax will generally be imposed on the net investment income, which generally would include distributions treated as dividends under US federal income tax principles, of non-corporate taxpayers whose adjusted gross income exceeds a threshold amount.
UK taxation of capital gains
A US holder that is not resident in the UK for UK tax purposes and does not carry on a trade, profession or vocation in the UK through a branch or agency (or in the case of a company a permanent establishment) to which the ordinary shares or ADSs are attributable will not generally be liable for UK taxation on capital gains or eligible for relief for allowable losses, realised on the sale or other disposal of the ordinary shares or ADSs.
A US holder who is an individual who has been resident for tax purposes in the UK but who ceases to be so resident or becomes regarded as resident outside the UK for the purposes of any double tax treaty (‘Treaty Non-resident’) and continues to not be resident in the UK, or continues to be Treaty Non-resident, for a period of five years or less and who disposes of his ordinary shares or ADSs during that period may also be liable on his return to the UK to UK tax on capital gains, subject to any available exemption or relief, even though he or she is not resident in the UK, or is Treaty Non-resident, at the time of the disposal.
Annual report and accounts 2024 Pearson plc 240
|
Strategic report |
Governance report |
Financial statements |
Other information (unaudited) | |||||
|
|
||||||||
US income taxation of capital gains
Upon a sale or exchange of ordinary shares or ADSs to a person other than Pearson, a US holder will recognise gain or loss in an amount equal to the difference between the amount realised on the sale or exchange and the US holder’s adjusted tax basis in the ordinary shares or ADSs. Any gain or loss recognised will be capital gain or loss and will be long-term capital gain or loss if the US holder has held the ordinary shares or ADSs for more than one year. Long-term capital gain of a non-corporate US holder is generally taxed at a maximum rate of 20%. In addition, a 3.8% Medicare tax will generally be imposed on the net investment income, which generally would include capital gains, of non-corporate taxpayers whose adjusted gross income exceeds a threshold amount.
The gain or loss realised by a US holder on the sale or exchange of ordinary shares or ADSs generally will be treated as US-source gain or loss for US foreign tax credit purposes.
Estate and gift tax
The current Estate and Gift Tax Convention (referred to in this paragraph as the ‘Convention’), between the US and the UK generally relieves from UK inheritance tax (the equivalent of US estate and gift tax) the transfer of ordinary shares or of ADSs where the transferor is domiciled in the US for the purposes of the Convention. This relief will not apply if the ordinary shares or ADSs are part of the business property of an individual’s permanent establishment in the UK or pertain to the fixed base in the UK of a person providing independent personal services. If no relief is given under the Convention, inheritance tax may be charged on death and also on the amount by which the value of an individual’s estate is reduced as a result of any transfer made by way of gift or other gratuitous or undervalue transfer, in general within seven years of death, and in certain other circumstances. In the unusual case where ordinary shares or ADSs are subject to both UK inheritance tax and US estate or gift tax, the Convention generally provides for tax paid in the UK to be credited against tax payable in the US or for tax paid in the US to be credited against tax payable in the UK based on priority rules set forth in the Convention.
Stamp duty
No stamp duty or stamp duty reserve tax (SDRT) will generally be payable in the UK on the purchase or transfer of an ADS, provided that the ADS, and any separate instrument or written agreement of transfer, remain at all times outside the UK and that the instrument or written agreement of transfer is not executed in the UK.
There is, however, a charge to SDRT or stamp duty at the rate of 1.5% of the amount or value of the consideration or, in some circumstances, the value of the ordinary shares (rounded up to the next multiple of Ł5 in the case of stamp duty), where ordinary shares are transferred to a person whose business is or includes issuing depositary receipts (or to a nominee or agent for such a person), or to a person whose business is or includes the provision of clearance services (or to a nominee or agent for such a person). Such 1.5% charge is subject to exceptions, including for (i) transfers which are made in the course of ‘capital-raising arrangements’ (as defined in sections 72ZA and 97AB of the Finance Act 1986), and (ii) transfers which are made in the course of ‘qualifying listing arrangements’ (as defined in sections 72ZB and 97AC of the Finance Act 1986) and which do not affect the beneficial ownership of the ordinary shares in question. Specific professional advice should be sought in any case where the 1.5% SDRT or stamp duty charge may be applicable.
A transfer for value of the underlying ordinary shares will generally be subject to either stamp duty or SDRT, normally at the rate of 0.5% of the amount or value of the consideration (rounded up to the next multiple of Ł5 in the case of stamp duty). A transfer of ordinary shares from a nominee to its beneficial owner, including the transfer of underlying ordinary shares from the depositary to an ADS holder, under which no beneficial interest passes will not be subject to stamp duty or SDRT.
Close company status
The Group believes that the close company provisions of the UK Corporation Tax Act 2010 do not apply to it.
Documents on display
Copies of the Group’s Memorandum and Articles of Association are filed as exhibits to its annual report on Form 20-F for the year ended 31 December 2024. We also file reports and other information with the SEC. These materials, including this annual report and the accompanying exhibits, are available on the Investors page of the Company’s website at pearsonplc.com (the contents of which are not incorporated by reference herein). In addition, shareholders may request a copy of certain documents referred to in this annual report by writing to us at the following address: Pearson plc, c/o the Company Secretary, 80 Strand, London WC2R 0RL.
Description of securities other than equity securities
American Depositary Shares
The Group’s ordinary shares trade in the form of ADSs evidenced by ADRs under a sponsored ADR facility with JPMorgan Chase Bank, as depositary. Each ADS represents one ordinary share.
The principal executive office of JPMorgan Chase Bank is located at 383 Madison Avenue, Floor 11, New York, New York 10179.
Annual report and accounts 2024 Pearson plc 241
|
Strategic report |
Governance report |
Financial statements |
Other information (unaudited) | |||||
| Additional information for US listing purposes continued |
||||||||
Fees paid by ADR holders
The depositary collects its fees for delivery and surrender of ADSs directly from investors depositing shares or surrendering ADSs for the purpose of withdrawal, or from intermediaries acting for them. The depositary collects fees for making distributions to investors by deducting those fees from the amounts distributed or by selling a portion of distributable property to pay the fees. The depositary may collect its annual fee for depositary services by deductions from cash distributions or by directly billing investors or by charging the book-entry system accounts of participants acting for them. The depositary may generally refuse to provide fee-attracting services until its fees for those services are paid.
The following table summarises various fees currently charged by JPMorgan Chase Bank:
| Person depositing or withdrawing shares must pay to the depositary: | For: | |
| $5.00 (or less) per 100 ADSs (or portion of 100 ADSs) |
• Issuance of ADSs, including issuances resulting from a distribution of shares or rights or other property | |
| • Cancellation of ADSs for the purpose of withdrawal, including if the deposit agreement terminates | ||
| $.05 (or less) per ADS |
• Any cash distribution to ADS registered holders | |
| A fee equivalent to the fee that would be payable if securities distributed had been shares and the shares had been deposited for issuance of ADSs |
• Distribution of securities by the depositary to ADS registered holders of deposited securities | |
| $.05 (or less) per ADS per calendar year |
• Depositary services | |
| Registration of transfer fees |
• Transfer and registration of shares on the share register to or from the name of the depositary or its agent when shares are deposited or withdrawn | |
| Expenses of the depositary |
• Cable, telex and facsimile transmissions (when expressly provided in the deposit agreement) | |
| • Converting foreign currency to US dollars | ||
| Taxes and other governmental charges the depositary or the custodian have to pay on any ADS or share underlying an ADS, for example, stock transfer taxes, stamp duty or withholding taxes |
• As necessary | |
| Any charges incurred by the depositary or its agents for servicing the deposited securities |
• As necessary | |
Fees incurred in past annual period and fees to be paid in the future
The depositary reimburses the Company for certain expenses it incurs in relation to the ADS programme. The depositary also pays the standard out-of-pocket maintenance costs for the registered ADSs, which consist of the expenses for the mailing and printing of proxy materials, distributing dividend cheques, electronic filing of US federal tax information, mailing required tax forms, stationery, postage, facsimile and telephone calls. It also reimburses the Company for certain investor relationship programmes or special investor relations promotional activities. There are limits on the amount of expenses for which the depositary will reimburse the Company, but the amount of reimbursement is not necessarily tied to the amount of fees the depositary collects from investors. The Company received $50,000 as reimbursement from the depositary, The Bank of New York Mellon, for 2024.
Controls and procedures
Disclosure controls and procedures
An evaluation of the effectiveness of the Group’s disclosure controls and procedures as of 31 December 2024 was carried out by management, under the supervision and with the participation of the Chief Executive Officer and Chief Financial Officer. Based on that evaluation, the Chief Executive Officer and Chief Financial Officer concluded that the Company’s disclosure controls and procedures (as defined in Rules 13a-15(e) and 15d-15(e) under the Securities Exchange Act of 1934, as amended) were effective as at 31 December 2024 at a reasonable assurance level. A controls system, no matter how well designed and operated, cannot provide absolute assurance to achieve its objectives.
Management’s annual report on internal control over financial reporting
Management is responsible for establishing and maintaining adequate internal control over financial reporting for the Company. Internal control over financial reporting is a process designed by, or under the supervision of, the Chief Executive Officer and Chief Financial Officer, or persons performing similar functions, and effected by the Company’s Board of Directors, management and other personnel to provide reasonable assurance regarding the reliability of financial reporting and the preparation of financial statements for external purposes in accordance with generally accepted accounting principles. Management has assessed the effectiveness of internal control over financial reporting as of 31 December 2024 based on the framework in Internal Control – Integrated Framework (2013) issued by the Committee of Sponsoring Organizations of the Treadway Commission (COSO). Based on this evaluation, management has concluded that the Company’s internal control over financial reporting was effective as of 31 December 2024 based on criteria in Internal Control – Integrated Framework (2013) issued by the COSO.
Ernst & Young LLP, an independent registered public accounting firm, has audited the effectiveness of the Company’s internal control over financial reporting as of 31 December 2024, as stated in their report.
Annual report and accounts 2024 Pearson plc 242
|
Strategic report |
Governance report |
Financial statements |
Other information (unaudited) | |||||
|
|
||||||||
Change in internal control over financial reporting
There have been no significant changes in our internal control over financial reporting during the year ended 31 December 2024 that have materially affected, or are reasonably likely to materially affect, the Company’s internal control over financial reporting.
Audit Committee financial expert
The members of the Board of Directors of Pearson plc have determined that Graeme Pitkethly is an Audit Committee financial expert within the meaning of the applicable rules and regulations of the SEC.
Code of ethics
Pearson has adopted a code of ethics (the Pearson Code of Conduct) which applies to all employees including the Chief Executive Officer and Chief Financial Officer and other senior financial management. This code of ethics is available on the Group’s website (www.pearson.com/corporate/ code-of-conduct.html). The information on this website is not incorporated by reference into this report.
Principal accountant fees and services
In line with best practice, the Group’s relationship with Ernst & Young LLP (EY) is governed by its external auditor policy, which is reviewed and approved annually by the Audit Committee. The policy establishes procedures to ensure the auditors’ independence is not compromised as well as defining those non-audit services that EY may or may not provide to Pearson. These allowable services are in accordance with relevant UK and US legislation.
The Audit Committee approves all audit and non-audit services provided by EY, unless clearly trivial. Where appropriate, services will be tendered prior to awarding this work to the auditor.
No fees were incurred in relation to taxation, including tax compliance, tax advice and tax planning.
Purchases of equity securities by the issuer and affiliated purchases
| Period | Total number of shares purchased |
Average price paid per share |
Total number of units purchased as part of publicly announced plans or programmes |
Approximate maximum value of shares that may yet be purchased under the plans or programmes |
||||||||||||
| 1 April 2022 – 30 April 2022 |
11,176,349 | £7.77 | 9,885,524 | £275m | ||||||||||||
| 1 May 2022 – 31 May 2022 |
4,518,993 | £7.55 | 4,518,993 | £241m | ||||||||||||
| 1 June 2022 – 30 June 2022 |
7,203,444 | £7.52 | 5,363,132 | £201m | ||||||||||||
| 1 July 2022 – 31 July 2022 |
2,897,074 | £7.57 | 2,897,074 | £179m | ||||||||||||
| 1 August 2022 – 31 August 2022 |
2,567,366 | £8.75 | 2,567,366 | £156m | ||||||||||||
| 1 September 2022 – 30 September 2022 |
5,496,817 | £8.91 | 5,496,817 | £107m | ||||||||||||
| 1 October 2022 – 31 October 2022 |
6,315,733 | £9.03 | 6,315,733 | £50m | ||||||||||||
| 1 November 2022 – 30 November 2022 |
3,017,726 | £9.72 | 3,017,726 | £21m | ||||||||||||
| 1 December 2022 – 31 December 2022 |
3,587,362 | £9.46 | 2,205,695 | – | ||||||||||||
| 1 March 2023 – 31 March 2023 |
1,757,098 | £8.54 | – | £301m | ||||||||||||
| Period | Total number of shares purchased |
Average price paid per share |
Total number of units purchased as part of publicly announced plans or programmes |
Approximate maximum value of shares that may yet be purchased under the plans or programmes |
||||||||||||
| 1 May 2023 – 31 May 2023 |
1,191,462 | £8.39 | – | £301m | ||||||||||||
| 1 September 2023 – 30 September 2023 |
2,459,066 | £8.69 | 2,459,066 | £280m | ||||||||||||
| 1 October 2023 – 31 October 2023 |
11,239,824 | £9.03 | 11,239,824 | £178m | ||||||||||||
| 1 November 2023 – 30 November 2023 |
3,108,579 | £9.48 | 3,108,579 | £149m | ||||||||||||
| 1 December 2023 – 31 December 2023 |
4,479,186 | £9.44 | 3,436,047 | £117m | ||||||||||||
| 1 January 2024 – 31 January 2024 |
4,522,458 | £10.48 | 4,522,458 | £69m | ||||||||||||
| 1 February 2024 – 29 February 2024 |
5,115,720 | £9.56 | 5,115,720 | £20m | ||||||||||||
| 1 March 2024 – 31 March 2024 |
4,622,468 | £10.22 | 4,622,468 | £173m | ||||||||||||
| 1 April 2024 – 30 April 2024 |
9,172,818 | £10.10 | 6,810,586 | £105m | ||||||||||||
| 1 May 2024 – 31 May 2024 |
6,472,448 | £9.71 | 6,472,448 | £42m | ||||||||||||
| 1 June 2024 – 30 June 2024 |
811,773 | £9.62 | 241,083 | £39m | ||||||||||||
| 1 July 2024 – 31 July 2024 |
2,128,176 | £10.08 | 2,128,176 | £18m | ||||||||||||
| 1 August 2024 – 31 August 2024 |
1,706,435 | £10.46 | 1,706,435 | – | ||||||||||||
| 1 November 2024 – 30 November 2024 |
330,409 | £12.11 | – | – | ||||||||||||
On 20 September 2023, the Board approved a £300m share buyback programme in order to return capital to shareholders, with a £200m extension being announced by the Group on 1 March 2024. This programme and the extension completed in 2024. During 2024, approximately 32m (2023: 20m) shares were bought back and cancelled at a cost of £318m (2023: £186m). The nominal value of these shares, £8m (2023: £5m), was transferred to the capital redemption reserve, and the remainder of the purchase price was recorded within retained earnings. At 31 December 2024, no further liability remains (2023: £118m) for any shares contracted to be repurchased but where the repurchases are still outstanding.
On 24 February 2022, the Board approved a £350m share buyback programme in order to return capital to shareholders. During the year, all of the shares were bought back and cancelled at a cost of £353m. The nominal value of these shares, £10m, was transferred to the capital redemption reserve, and the remainder of the cost is recorded within retained earnings.
Shares were also purchased and held in Trust for the satisfaction of employee share schemes. All purchases were made in open-market transactions in London in accordance with applicable law. Pearson did not structure such purchases to fall within the safe harbour provisions of the US SEC’s Rule 10b-18.
Insider trading policies
We have adopted an Insider Trading Policy, which, among other things, governs the purchase, sale and other dispositions of Pearson securities by our Directors, executive officers and employees. Our Insider Trading Policy aims to promote compliance with applicable insider trading laws, rules and regulations and the NYSE listing standards. A copy of our Insider Trading Policy is filed as Exhibit 11.1 and 11.2 to the annual report on Form 20-F for the year ended 31 December 2024.
Annual report and accounts 2024 Pearson plc 243
| Strategic report |
Governance report |
Financial statements |
Other information (unaudited) | |||||
| Additional information for US listing purposes continued |
||||||||
|
Strategic report |
Governance report |
Financial statements |
Other information | |||||
| Shareholder Information |
||||||||
Shareholder information
Pearson ordinary shares are listed on the London Stock Exchange and on the New York Stock Exchange in the form of American Depositary Receipts.
Corporate website
The investors’ section of our corporate website www.pearsonplc.com/investors provides a wealth of information for shareholders. It is also possible to sign up to receive email alerts for reports and press releases relating to Pearson at www.pearsonplc.com.
Shareholder information online
Shareholder information can be found on our website at www.pearsonplc.com/investors.
Our registrar, Computershare, also provides a range of shareholder information online. You can check your holding and find practical help on transferring shares or updating your details at www.investorcentre.co.uk. For more information, please contact our registrar, Computershare, The Pavilions, Bridgwater Road, Bristol, BS99 6ZZ. Telephone 0370 889 3250*.
Information about the Pearson share price
The company’s share price can be found on our website at www.pearsonplc.com/investors/performance/share-price-dividend. It also appears in the financial columns of the national press.
2024 dividends
| Payment Date | Amount per share | |||
| Interim | 16 September 2024 | 7.4 pence | ||
| Final1 | 9 May 2025 | 16.6 pence |
1. Subject to approval by shareholders at the 2025 Annual General Meeting.
| 2025 financial calendar |
||
| Ex-dividend date | 20 March 2025 | |
| Record date | 21 March 2025 | |
| Last date for dividend reinvestment election | 15 April 2025 | |
| Annual General Meeting | 2 May 2025 | |
| Payment date for dividend and share purchase date for dividend reinvestment | 9 May 2025 |
Payment of dividends to mandated accounts
Should you elect to have your dividends paid through BACS, this can be done directly into a bank or building society account, with the dividend confirmation voucher sent to the shareholder’s registered address. Computershare can be contacted for information on 0370 889 3250*.
Dividend reinvestment plan (DRIP)
The DRIP gives shareholders the right to buy the company’s shares on the London stock market with their cash dividend. For further information, please contact Computershare on 0370 889 3250*.
Individual Savings Accounts (ISAs)
Computershare offers a Flexible Stocks and Shares ISA (other providers are available). For more information, please visit www.investorcentre.co.uk or call customer services on 0370 889 3250*.
Share dealing facilities
Computershare offers telephone and internet services for dealing in Pearson shares (other providers are available). For further information, please contact their telephone dealing helpline on 0370 889 3250* or, for online dealing, log on to www.investorcentre.co.uk. You will need your shareholder reference number as shown on your share certificate.
A postal dealing service is also available through Computershare. Please telephone 0370 889 3250* for details or log on to www.investorcentre.co.uk to download a form.
ShareGift
Shareholders with small holdings of shares, whose value makes them uneconomic to sell, may wish to donate them to ShareGift, the share donation charity (registered charity number 1052686).
Further information about ShareGift and the charities it has supported may be obtained from their website, www.ShareGift.org, or by contacting them at ShareGift, 6th Floor, 2 London Wall Place, London, EC2Y 5AU.
American Depositary Receipts (ADRs)
Pearson’s ADRs are listed on the New York Stock Exchange and traded under the symbol PSO. Each ADR represents one ordinary share. For enquiries regarding registered ADR holder accounts and dividends, please contact JP Morgan via their Transfer Agent, EQ Shareowner Services, P.O. Box 64504, St. Paul, MN 55164-0504, telephone 1 (800) 990 1135 (toll free within the US) or 001 651 453 2128 (outside the US). Alternatively, you may email via www.shareowneronline.com/ informational/contact-us/.
Voting rights for registered ADR holders can be exercised through JP Morgan, and for beneficial ADR holders (and/or nominee accounts) through your US brokerage institution. Pearson will file with the Securities and Exchange Commission a Form 20-F.
* Lines open 8.30 am to 5.30 pm Monday to Friday (excluding UK public holidays).
Annual report and accounts 2024 Pearson plc 245
|
Strategic report |
Governance report |
Financial statements |
Other information | |||||
| Shareholder information continued |
||||||||
Share register fraud: protecting your investment
Pearson does not contact its shareholders directly to provide recommendations or investment advice and neither does it appoint third parties to do so. As required by law, our shareholder register is available for public inspection, but we cannot control the use of information obtained by persons inspecting the register. Please treat any approaches purporting to originate from Pearson with caution.
For more information, please log on to our website at www.pearsonplc.com/en-GB/investors/ shareholders/shares-shareholding
Tips on protecting your shares
| • | Keep any documentation that contains your shareholder reference number in a safe place and shred any unwanted documentation. |
| • | Inform our registrar, Computershare, promptly when you change address. |
| • | Be aware of dividend payment dates and contact the registrar if you do not receive your dividend cheque or, better still, make arrangements to have the dividend paid directly into your bank account. |
| • | Consider holding your shares electronically in a CREST account via a nominee. |
Annual report and accounts 2024 Pearson plc 246
|
Strategic report |
Governance report |
Financial statements |
Other information | |||||
|
|
||||||||
|
Reliance on this document
The intention of this document is to provide information to shareholders and is not designed to be relied upon by any other party or for any other purpose.
Forward-looking statements
This document includes forward-looking statements concerning Pearson’s financial condition, business and operations and its strategy, plans and objectives, including but not limited to the way in which forward-looking statements are defined under Section 27A of the U.S. Securities Act of 1933, as amended, and Section 21E of the Securities Exchange Act of 1934, as amended. Readers are cautioned not to place undue reliance on such forward-looking statements. In some cases, you can identify forward-looking statements by terms such as “may”, “will”, “should”, “expect”, “intend”, “plan”, “anticipate”, “believe”, “estimate”, “predict”, “potential”, “continue” or the negative of these terms or other comparable terminology.
By their nature, forward-looking statements involve known and unknown risks and uncertainties and other factors that may cause Pearson or its industry’s actual results, levels of activity, performance or achievements to be materially different from any future results, levels of activity, performance or achievements expressed or implied by the forward-looking statements. This is because they relate to events and depend on circumstances that may occur in the future. They are based on numerous expectations, assumptions and beliefs regarding Pearson’s present and future business strategies and the environment in which it will operate in the future. Pearson believes that the expectations reflected in the forward-looking statements are reasonable, although it cannot guarantee future results, levels of activity, performance or achievements.
There are various factors which could cause Pearson’s actual financial condition, results and development to differ materially from the plans, goals, objectives and expectations expressed or implied by these forward-looking statements, many of which are outside Pearson’s control. These include international, national and local conditions, as well as the impact of competition. Such risks and other risks and uncertainties are detailed from time to time in Pearson’s publicly-filed documents and, in particular, the risk factors set out in this document, which you are advised to read.
Any forward-looking statements speak only as of the date they are made and, except as required by law, Pearson gives no undertaking to update any forward-looking statements in this document, whether as a result of new information, future developments, changes in its expectations or otherwise.
Finally, as an example, all statements that express forecasts, expectations and projections, including trends in results of operations, margins, growth rates, overall market trends, the impact of interest or exchange rates, the availability of financing, anticipated cost savings and synergies and the execution of Pearson’s strategy, are forward-looking statements. The forward-looking statements, specifically the margin target, financial expectations, 2025 outlook and 2026 ambition information, included on page 27 of this document have been prepared by, and is the responsibility of, Pearson’s management. Ernst & Young LLP has not audited, reviewed, examined, compiled nor applied agreedupon procedures with respect to these forward-looking statements and, accordingly, Ernst & Young LLP does not express an opinion or any other form of assurance with respect thereto. |
Annual report and accounts 2024 Pearson plc 247
Report of Independent Registered Public Accounting Firm
To the Shareholders and the Board of Directors of Pearson plc
Opinion on Internal Control Over Financial Reporting
We have audited Pearson plc’s internal control over financial reporting as of December 31, 2024, based on criteria established in Internal Control—Integrated Framework issued by the Committee of Sponsoring Organizations of the Treadway Commission (2013 framework), (the COSO criteria). In our opinion, Pearson plc (the Company) maintained, in all material respects, effective internal control over financial reporting as of December 31, 2024, based on the COSO criteria.
We also have audited, in accordance with the standards of the Public Company Accounting Oversight Board (United States) (PCAOB), the consolidated balance sheets of the Company as of December 31, 2024 and 2023, the related consolidated statements of income, comprehensive income, changes in equity and cash flows for each of the three years in the period ended December 31, 2024, and the related notes and our report dated March 13, 2025 expressed an unqualified opinion thereon.
Basis for Opinion
The Company’s management is responsible for maintaining effective internal control over financial reporting and for its assessment of the effectiveness of internal control over financial reporting included in the accompanying Management’s Annual Report on Internal Control over Financial Reporting. Our responsibility is to express an opinion on the Company’s internal control over financial reporting based on our audit. We are a public accounting firm registered with the PCAOB and are required to be independent with respect to the Company in accordance with the U.S. federal securities laws and the applicable rules and regulations of the Securities and Exchange Commission and the PCAOB.
We conducted our audit in accordance with the standards of the PCAOB. Those standards require that we plan and perform the audit to obtain reasonable assurance about whether effective internal control over financial reporting was maintained in all material respects.
Our audit included obtaining an understanding of internal control over financial reporting, assessing the risk that a material weakness exists, testing and evaluating the design and operating effectiveness of internal control based on the assessed risk, and performing such other procedures as we considered necessary in the circumstances. We believe that our audit provides a reasonable basis for our opinion.
Definition and Limitations of Internal Control Over Financial Reporting
A company’s internal control over financial reporting is a process designed to provide reasonable assurance regarding the reliability of financial reporting and the preparation of financial statements for external purposes in accordance with generally accepted accounting principles. A company’s internal control over financial reporting includes those policies and procedures that (1) pertain to the maintenance of records that, in reasonable detail, accurately and fairly reflect the transactions and dispositions of the assets of the company; (2) provide reasonable assurance that transactions are recorded as necessary to permit preparation of financial statements in accordance with generally accepted accounting principles, and that receipts and expenditures of the company are being made only in accordance with authorizations of management and directors of the company; and (3) provide reasonable assurance regarding prevention or timely detection of unauthorized acquisition, use, or disposition of the company’s assets that could have a material effect on the financial statements.
Because of its inherent limitations, internal control over financial reporting may not prevent or detect misstatements. Also, projections of any evaluation of effectiveness to future periods are subject to the risk that controls may become inadequate because of changes in conditions, or that the degree of compliance with the policies or procedures may deteriorate.
/s/ Ernst & Young LLP
London, United Kingdom
March 13, 2025
Report of Independent Registered Public Accounting Firm
To the Shareholders and the Board of Directors of Pearson plc
Opinion on the Financial Statements
We have audited the accompanying consolidated balance sheets of Pearson plc (the Company) as of December 31, 2024 and 2023, the related consolidated statements of income, comprehensive income, changes in equity and cash flows for each of the three years in the period ended December 31, 2024, and the related notes (collectively referred to as the “consolidated financial statements”). In our opinion, the consolidated financial statements present fairly, in all material respects, the financial position of the Company at December 31, 2024 and 2023, and the results of its operations and its cash flows for each of the three years in the period ended December 31, 2024, in accordance with IFRS accounting standards as issued by the International Accounting Standards Board (IASB).
We also have audited, in accordance with the standards of the Public Company Accounting Oversight Board (United States) (PCAOB), the Company’s internal control over financial reporting as of December 31, 2024, based on criteria established in Internal Control-Integrated Framework issued by the Committee of Sponsoring Organizations of the Treadway Commission (2013 framework) and our report dated March 13, 2025 expressed an unqualified opinion thereon.
Basis for Opinion
These financial statements are the responsibility of the Company’s management. Our responsibility is to express an opinion on the Company’s financial statements based on our audits. We are a public accounting firm registered with the PCAOB and are required to be independent with respect to the Company in accordance with the U.S. federal securities laws and the applicable rules and regulations of the Securities and Exchange Commission and the PCAOB.
We conducted our audits in accordance with the standards of the PCAOB. Those standards require that we plan and perform the audit to obtain reasonable assurance about whether the financial statements are free of material misstatement, whether due to error or fraud. Our audits included performing procedures to assess the risks of material misstatement of the financial statements, whether due to error or fraud, and performing procedures that respond to those risks. Such procedures included examining, on a test basis, evidence regarding the amounts and disclosures in the financial statements. Our audits also included evaluating the accounting principles used and significant estimates made by management, as well as evaluating the overall presentation of the financial statements. We believe that our audits provide a reasonable basis for our opinion.
Critical Audit Matter
The critical audit matter communicated below is a matter arising from the current period audit of the financial statements that was communicated or required to be communicated to the Audit Committee and that: (1) relates to accounts or disclosures that are material to the financial statements and (2) involved our especially challenging, subjective or complex judgments. The communication of the critical audit matter does not alter in any way our opinion on the consolidated financial statements, taken as a whole, and we are not, by communicating the critical audit matter below, providing a separate opinion on the critical audit matter or on the account or disclosures to which it relates.
United Kingdom Defined Benefit Obligation
| Description of the Matter | At December 31, 2024 the present value of the United Kingdom (UK) Group Pension Plan defined benefit pension obligation was £2,443 million. As disclosed in Notes 1 and 25 to the consolidated financial statements, the obligation for these plans is actuarially determined and affected by significant assumptions, including discount rate, inflation rate and mortality rates.
Auditing the present value of the UK Group Pension Plan defined benefit obligation is complex and required the involvement of our actuarial specialists due to the highly judgmental nature of actuarial assumptions including discount rate, inflation rate and mortality rates and application of IAS 19, Employee Benefits, on those assumptions used in the valuation and measurement process. These assumptions have a significant effect on the present value of the UK defined benefit pension obligation.
| |
| How We Addressed the Matter in Our Audit | We obtained an understanding, evaluated the design and tested the operating effectiveness of controls that address the measurement and valuation of the present value of the UK Group Pension Plan defined benefit pension obligation. This included management’s review of the application of IAS 19 and the significant actuarial assumptions used by management, including discount rate, inflation rate and mortality rates.
To test the present value of the UK Group Pension Plan defined benefit pension obligation, we performed audit procedures that included, among others, evaluating the application of IAS 19 on those significant actuarial assumptions described above. We involved our actuarial specialists to assist with our audit procedures specific to the valuation and measurement of the defined benefit obligation. We compared the actuarial assumptions used by management to external market data and market practice and the requirements of IAS 19. We assessed the individual impact that changes in the significant actuarial assumptions (discount rate, inflation rate and mortality rates) at year end has on the UK Group Pension Plan defined benefit pension obligation. As part of this evaluation, we compared management’s selected discount rate and inflation rate to an independently developed range. To evaluate the mortality rates assumption, we compared the information with recent publicly available mortality base tables, and assessed the approach to developing the mortality assumption against prior year. |
/s/ Ernst & Young LLP
We have served as the Company’s auditor since 2022.
London, United Kingdom
March 13, 2025
| I | Incorporated by reference from the Form 20-F of Pearson plc for the year ended December 31, 2021 and filed March 30, 2022. |
| O | Incorporated by reference from the Form 20-F of Pearson plc for the year ended December 31, 2015 and filed March 23, 2016. |
| K | Incorporated by reference from the Form 20-F of Pearson plc for the year ended December 31, 2020 and filed April 1, 2021. |
| M | Incorporated by reference from the Form 20-F of Pearson plc for the year ended December 31, 2023 and filed March 14, 2024. |
SIGNATURES
The registrant hereby certifies that it meets the requirements for filing a Form 20-F and that it has caused and authorized the undersigned for sign this annual report on its behalf.
| Pearson plc |
| /s/ Sally Johnson |
| Sally Johnson |
| Chief Financial Officer |
Date: March 13, 2025


 Read more on pages 26-32