00009379662021FYFALSE☒FALSEFALSEFALSEhttp://fasb.org/us-gaap/2021-01-31#OtherLiabilitiesCurrenthttp://fasb.org/us-gaap/2021-01-31#OtherLiabilitiesCurrenthttp://fasb.org/us-gaap/2021-01-31#OtherLiabilitiesCurrenthttp://fasb.org/us-gaap/2021-01-31#OtherLiabilitiesCurrenthttp://fasb.org/us-gaap/2021-01-31#OtherLiabilitiesNoncurrenthttp://fasb.org/us-gaap/2021-01-31#OtherLiabilitiesNoncurrenthttp://fasb.org/us-gaap/2021-01-31#OtherLiabilitiesNoncurrenthttp://fasb.org/us-gaap/2021-01-31#OtherLiabilitiesNoncurrenthttp://fasb.org/us-gaap/2021-01-31#OtherLiabilitieshttp://fasb.org/us-gaap/2021-01-31#OtherLiabilities2575502000009379662021-01-012021-12-310000937966dei:BusinessContactMember2021-01-012021-12-3100009379662021-12-31xbrli:sharesasml:numberOfNationalities0000937966us-gaap:ProductMember2019-01-012019-12-31iso4217:EUR0000937966us-gaap:ProductMember2020-01-012020-12-310000937966us-gaap:ProductMember2021-01-012021-12-310000937966asml:ServiceAndFieldOptionsMember2019-01-012019-12-310000937966asml:ServiceAndFieldOptionsMember2020-01-012020-12-310000937966asml:ServiceAndFieldOptionsMember2021-01-012021-12-3100009379662019-01-012019-12-3100009379662020-01-012020-12-31iso4217:EURxbrli:shares00009379662020-12-310000937966us-gaap:CommonStockMember2021-12-310000937966us-gaap:CommonStockMember2020-12-310000937966asml:CarlZeissSMTHoldingGmbHCo.KGMember2021-12-310000937966asml:CarlZeissSMTHoldingGmbHCo.KGMember2020-12-310000937966us-gaap:CommonStockMember2018-12-310000937966us-gaap:AdditionalPaidInCapitalMember2018-12-310000937966us-gaap:TreasuryStockMember2018-12-310000937966us-gaap:RetainedEarningsMember2018-12-310000937966us-gaap:AccumulatedOtherComprehensiveIncomeMember2018-12-3100009379662018-12-310000937966us-gaap:RetainedEarningsMember2019-01-012019-12-310000937966us-gaap:AccumulatedOtherComprehensiveIncomeMember2019-01-012019-12-310000937966us-gaap:CommonStockMember2019-01-012019-12-310000937966us-gaap:TreasuryStockMember2019-01-012019-12-310000937966us-gaap:AdditionalPaidInCapitalMember2019-01-012019-12-310000937966us-gaap:CommonStockMember2019-12-310000937966us-gaap:AdditionalPaidInCapitalMember2019-12-310000937966us-gaap:TreasuryStockMember2019-12-310000937966us-gaap:RetainedEarningsMember2019-12-310000937966us-gaap:AccumulatedOtherComprehensiveIncomeMember2019-12-3100009379662019-12-310000937966us-gaap:RetainedEarningsMember2020-01-012020-12-310000937966us-gaap:AccumulatedOtherComprehensiveIncomeMember2020-01-012020-12-310000937966us-gaap:CommonStockMember2020-01-012020-12-310000937966us-gaap:TreasuryStockMember2020-01-012020-12-310000937966us-gaap:AdditionalPaidInCapitalMember2020-01-012020-12-310000937966us-gaap:CommonStockMember2020-12-310000937966us-gaap:AdditionalPaidInCapitalMember2020-12-310000937966us-gaap:TreasuryStockMember2020-12-310000937966us-gaap:RetainedEarningsMember2020-12-310000937966us-gaap:AccumulatedOtherComprehensiveIncomeMember2020-12-310000937966us-gaap:RetainedEarningsMember2021-01-012021-12-310000937966us-gaap:AccumulatedOtherComprehensiveIncomeMember2021-01-012021-12-310000937966us-gaap:CommonStockMember2021-01-012021-12-310000937966us-gaap:TreasuryStockMember2021-01-012021-12-310000937966us-gaap:AdditionalPaidInCapitalMember2021-01-012021-12-310000937966us-gaap:CommonStockMember2021-12-310000937966us-gaap:AdditionalPaidInCapitalMember2021-12-310000937966us-gaap:TreasuryStockMember2021-12-310000937966us-gaap:RetainedEarningsMember2021-12-310000937966us-gaap:AccumulatedOtherComprehensiveIncomeMember2021-12-310000937966asml:FundingprovidedfortoolingequitymethodinvestmentMember2021-01-012021-12-310000937966asml:FundingprovidedfortoolingequitymethodinvestmentMember2020-01-012020-12-310000937966asml:FundingprovidedfortoolingequitymethodinvestmentMember2019-01-012019-12-310000937966srt:MinimumMember2021-12-31asml:employeeasml:continentxbrli:pure0000937966asml:EuvMember2021-01-012021-12-31asml:Unit0000937966asml:ArfiMember2021-01-012021-12-310000937966asml:ArfDryMember2021-01-012021-12-310000937966asml:KrfMember2021-01-012021-12-310000937966asml:IlineMember2021-01-012021-12-310000937966asml:MetrologyandinspectionMember2021-01-012021-12-310000937966asml:EuvMember2020-01-012020-12-310000937966asml:ArfiMember2020-01-012020-12-310000937966asml:ArfDryMember2020-01-012020-12-310000937966asml:KrfMember2020-01-012020-12-310000937966asml:IlineMember2020-01-012020-12-310000937966asml:MetrologyandinspectionMember2020-01-012020-12-310000937966asml:EuvMember2019-01-012019-12-310000937966asml:ArfiMember2019-01-012019-12-310000937966asml:ArfDryMember2019-01-012019-12-310000937966asml:KrfMember2019-01-012019-12-310000937966asml:IlineMember2019-01-012019-12-310000937966asml:MetrologyandinspectionMember2019-01-012019-12-310000937966asml:LogicMemberus-gaap:ProductMember2021-01-012021-12-310000937966asml:MemoryMemberus-gaap:ProductMember2021-01-012021-12-310000937966asml:LogicMemberus-gaap:ProductMember2020-01-012020-12-310000937966asml:MemoryMemberus-gaap:ProductMember2020-01-012020-12-310000937966asml:LogicMemberus-gaap:ProductMember2019-01-012019-12-310000937966asml:MemoryMemberus-gaap:ProductMember2019-01-012019-12-3100009379662022-01-012021-12-3100009379662021-01-012020-12-31asml:Segment0000937966us-gaap:ProductMemberasml:NewSystemsMember2019-01-012019-12-310000937966us-gaap:ProductMemberasml:NewSystemsMember2020-01-012020-12-310000937966us-gaap:ProductMemberasml:NewSystemsMember2021-01-012021-12-310000937966asml:UsedSystemsMemberus-gaap:ProductMember2019-01-012019-12-310000937966asml:UsedSystemsMemberus-gaap:ProductMember2020-01-012020-12-310000937966asml:UsedSystemsMemberus-gaap:ProductMember2021-01-012021-12-310000937966country:JP2021-01-012021-12-310000937966country:JP2021-12-310000937966country:KR2021-01-012021-12-310000937966country:KR2021-12-310000937966country:SG2021-01-012021-12-310000937966country:SG2021-12-310000937966country:TW2021-01-012021-12-310000937966country:TW2021-12-310000937966country:CN2021-01-012021-12-310000937966country:CN2021-12-310000937966asml:RestofAsiaMember2021-01-012021-12-310000937966asml:RestofAsiaMember2021-12-310000937966country:NL2021-01-012021-12-310000937966country:NL2021-12-310000937966asml:RestofEuropeandMiddleEastMember2021-01-012021-12-310000937966asml:RestofEuropeandMiddleEastMember2021-12-310000937966country:US2021-01-012021-12-310000937966country:US2021-12-310000937966country:JP2020-01-012020-12-310000937966country:JP2020-12-310000937966country:KR2020-01-012020-12-310000937966country:KR2020-12-310000937966country:SG2020-01-012020-12-310000937966country:SG2020-12-310000937966country:TW2020-01-012020-12-310000937966country:TW2020-12-310000937966country:CN2020-01-012020-12-310000937966country:CN2020-12-310000937966asml:RestofAsiaMember2020-01-012020-12-310000937966asml:RestofAsiaMember2020-12-310000937966country:NL2020-01-012020-12-310000937966country:NL2020-12-310000937966asml:RestofEuropeandMiddleEastMember2020-01-012020-12-310000937966asml:RestofEuropeandMiddleEastMember2020-12-310000937966country:US2020-01-012020-12-310000937966country:US2020-12-310000937966country:JP2019-01-012019-12-310000937966country:JP2019-12-310000937966country:KR2019-01-012019-12-310000937966country:KR2019-12-310000937966country:SG2019-01-012019-12-310000937966country:SG2019-12-310000937966country:TW2019-01-012019-12-310000937966country:TW2019-12-310000937966country:CN2019-01-012019-12-310000937966country:CN2019-12-310000937966asml:RestofAsiaMember2019-01-012019-12-310000937966asml:RestofAsiaMember2019-12-310000937966country:NL2019-01-012019-12-310000937966country:NL2019-12-310000937966asml:RestofEuropeandMiddleEastMember2019-01-012019-12-310000937966asml:RestofEuropeandMiddleEastMember2019-12-310000937966country:US2019-01-012019-12-310000937966country:US2019-12-310000937966us-gaap:CustomerConcentrationRiskMemberus-gaap:SalesRevenueNetMember2021-12-31asml:customer0000937966us-gaap:CustomerConcentrationRiskMemberus-gaap:SalesRevenueNetMember2021-01-012021-12-310000937966us-gaap:CustomerConcentrationRiskMemberasml:TwoCustomersMemberus-gaap:SalesRevenueNetMember2021-01-012021-12-310000937966us-gaap:CustomerConcentrationRiskMemberus-gaap:SalesRevenueNetMember2020-12-310000937966us-gaap:CustomerConcentrationRiskMemberus-gaap:SalesRevenueNetMember2020-01-012020-12-310000937966us-gaap:CustomerConcentrationRiskMemberus-gaap:SalesRevenueNetMemberasml:ThreeCustomersMember2020-01-012020-12-310000937966us-gaap:CustomerConcentrationRiskMemberus-gaap:SalesRevenueNetMember2019-01-012019-12-310000937966us-gaap:CustomerConcentrationRiskMemberus-gaap:SalesRevenueNetMemberasml:ThreeCustomersMember2019-01-012019-12-310000937966srt:MinimumMember2021-01-012021-12-310000937966srt:MaximumMember2021-01-012021-12-310000937966us-gaap:BankTimeDepositsMember2020-12-310000937966us-gaap:BankTimeDepositsMember2021-12-310000937966us-gaap:FairValueMeasurementsRecurringMember2020-12-310000937966us-gaap:FairValueMeasurementsRecurringMember2021-12-310000937966us-gaap:InterestBearingDepositsMember2020-12-310000937966us-gaap:InterestBearingDepositsMember2021-12-310000937966asml:CarlZeissSMTHoldingGmbHCo.KGMember2021-01-012021-12-310000937966asml:CarlZeissSMTHoldingGmbHCo.KGMemberasml:CarlZeissSMTHoldingGmbHCo.KGMember2021-12-310000937966asml:CarlZeissSMTHoldingGmbHCo.KGMember2017-06-292017-06-290000937966asml:CarlZeissSMTHoldingGmbHCo.KGMemberasml:ShareofnetincomelossafteraccountingpolicyalignmentMember2021-01-012021-12-310000937966asml:CarlZeissSMTHoldingGmbHCo.KGMemberasml:ShareofnetincomelossafteraccountingpolicyalignmentMember2020-01-012020-12-310000937966asml:CarlZeissSMTHoldingGmbHCo.KGMemberasml:DeferredIncomeTriggeredByContractModificationMember2021-01-012021-12-310000937966asml:CarlZeissSMTHoldingGmbHCo.KGMemberasml:BasisdifferenceamortizationrelatedtointangibleassetsMember2021-01-012021-12-310000937966asml:CarlZeissSMTHoldingGmbHCo.KGMemberasml:BasisdifferenceamortizationrelatedtointangibleassetsMember2020-01-012020-12-310000937966asml:IntercompanyprofiteliminationMemberasml:CarlZeissSMTHoldingGmbHCo.KGMember2021-01-012021-12-310000937966asml:IntercompanyprofiteliminationMemberasml:CarlZeissSMTHoldingGmbHCo.KGMember2020-01-012020-12-310000937966asml:BerlinerGlasMember2020-10-300000937966asml:BerlinerGlasMember2020-10-302020-10-300000937966asml:MedicalApplicationsAndSwissOpticBusinessMember2021-11-300000937966asml:MedicalApplicationsAndSwissOpticBusinessMember2021-01-012021-12-31asml:Reporting_Unit0000937966asml:RuAsmlMember2021-12-310000937966asml:RuAsmlMember2020-12-310000937966asml:RuClsMember2021-12-310000937966asml:RuClsMember2020-12-310000937966asml:BrandMember2021-01-012021-12-310000937966srt:MinimumMemberus-gaap:IntellectualPropertyMember2021-01-012021-12-310000937966srt:MaximumMemberus-gaap:IntellectualPropertyMember2021-01-012021-12-310000937966us-gaap:TechnologyBasedIntangibleAssetsMembersrt:MinimumMember2021-01-012021-12-310000937966us-gaap:TechnologyBasedIntangibleAssetsMembersrt:MaximumMember2021-01-012021-12-310000937966srt:MinimumMemberus-gaap:CustomerRelationshipsMember2021-01-012021-12-310000937966us-gaap:CustomerRelationshipsMembersrt:MaximumMember2021-01-012021-12-310000937966us-gaap:OtherIntangibleAssetsMembersrt:MinimumMember2021-01-012021-12-310000937966us-gaap:OtherIntangibleAssetsMembersrt:MaximumMember2021-01-012021-12-310000937966asml:BrandMember2019-12-310000937966us-gaap:IntellectualPropertyMember2019-12-310000937966us-gaap:DevelopedTechnologyRightsMember2019-12-310000937966us-gaap:CustomerRelationshipsMember2019-12-310000937966us-gaap:OtherIntangibleAssetsMember2019-12-310000937966asml:BerlinerGlasMemberasml:BrandMember2020-01-012020-12-310000937966asml:BerlinerGlasMemberus-gaap:IntellectualPropertyMember2020-01-012020-12-310000937966us-gaap:DevelopedTechnologyRightsMemberasml:BerlinerGlasMember2020-01-012020-12-310000937966us-gaap:CustomerRelationshipsMemberasml:BerlinerGlasMember2020-01-012020-12-310000937966us-gaap:OtherIntangibleAssetsMemberasml:BerlinerGlasMember2020-01-012020-12-310000937966asml:BerlinerGlasMember2020-01-012020-12-310000937966asml:BrandMember2020-01-012020-12-310000937966us-gaap:IntellectualPropertyMember2020-01-012020-12-310000937966us-gaap:DevelopedTechnologyRightsMember2020-01-012020-12-310000937966us-gaap:CustomerRelationshipsMember2020-01-012020-12-310000937966us-gaap:OtherIntangibleAssetsMember2020-01-012020-12-310000937966asml:BrandMember2020-12-310000937966us-gaap:IntellectualPropertyMember2020-12-310000937966us-gaap:DevelopedTechnologyRightsMember2020-12-310000937966us-gaap:CustomerRelationshipsMember2020-12-310000937966us-gaap:OtherIntangibleAssetsMember2020-12-310000937966us-gaap:IntellectualPropertyMember2021-01-012021-12-310000937966us-gaap:DevelopedTechnologyRightsMember2021-01-012021-12-310000937966us-gaap:CustomerRelationshipsMember2021-01-012021-12-310000937966us-gaap:OtherIntangibleAssetsMember2021-01-012021-12-310000937966asml:BrandMember2021-12-310000937966us-gaap:IntellectualPropertyMember2021-12-310000937966us-gaap:DevelopedTechnologyRightsMember2021-12-310000937966us-gaap:CustomerRelationshipsMember2021-12-310000937966us-gaap:OtherIntangibleAssetsMember2021-12-310000937966asml:AccumulatedAmortizationMemberasml:BrandMember2020-01-012020-12-310000937966asml:AccumulatedAmortizationMemberus-gaap:IntellectualPropertyMember2020-01-012020-12-310000937966us-gaap:DevelopedTechnologyRightsMemberasml:AccumulatedAmortizationMember2020-01-012020-12-310000937966us-gaap:CustomerRelationshipsMemberasml:AccumulatedAmortizationMember2020-01-012020-12-310000937966us-gaap:OtherIntangibleAssetsMemberasml:AccumulatedAmortizationMember2020-01-012020-12-310000937966asml:AccumulatedAmortizationMember2020-01-012020-12-310000937966asml:AccumulatedAmortizationMemberasml:BrandMember2021-01-012021-12-310000937966asml:AccumulatedAmortizationMemberus-gaap:IntellectualPropertyMember2021-01-012021-12-310000937966us-gaap:DevelopedTechnologyRightsMemberasml:AccumulatedAmortizationMember2021-01-012021-12-310000937966us-gaap:CustomerRelationshipsMemberasml:AccumulatedAmortizationMember2021-01-012021-12-310000937966us-gaap:OtherIntangibleAssetsMemberasml:AccumulatedAmortizationMember2021-01-012021-12-310000937966asml:AccumulatedAmortizationMember2021-01-012021-12-310000937966us-gaap:CostOfSalesMember2019-01-012019-12-310000937966us-gaap:CostOfSalesMember2020-01-012020-12-310000937966us-gaap:CostOfSalesMember2021-01-012021-12-310000937966us-gaap:ResearchAndDevelopmentExpenseMember2019-01-012019-12-310000937966us-gaap:ResearchAndDevelopmentExpenseMember2020-01-012020-12-310000937966us-gaap:ResearchAndDevelopmentExpenseMember2021-01-012021-12-310000937966us-gaap:SellingGeneralAndAdministrativeExpensesMember2019-01-012019-12-310000937966us-gaap:SellingGeneralAndAdministrativeExpensesMember2020-01-012020-12-310000937966us-gaap:SellingGeneralAndAdministrativeExpensesMember2021-01-012021-12-310000937966srt:MinimumMemberus-gaap:BuildingAndBuildingImprovementsMember2021-01-012021-12-310000937966srt:MaximumMemberus-gaap:BuildingAndBuildingImprovementsMember2021-01-012021-12-310000937966srt:MinimumMemberus-gaap:MachineryAndEquipmentMember2021-01-012021-12-310000937966srt:MaximumMemberus-gaap:MachineryAndEquipmentMember2021-01-012021-12-310000937966us-gaap:LeaseholdImprovementsMembersrt:MinimumMember2021-01-012021-12-310000937966us-gaap:LeaseholdImprovementsMembersrt:MaximumMember2021-01-012021-12-310000937966srt:MinimumMemberus-gaap:FurnitureAndFixturesMember2021-01-012021-12-310000937966srt:MaximumMemberus-gaap:FurnitureAndFixturesMember2021-01-012021-12-310000937966asml:LandBuildingsAndConstructionsMember2019-12-310000937966us-gaap:MachineryAndEquipmentMember2019-12-310000937966us-gaap:LeaseholdImprovementsMember2019-12-310000937966us-gaap:OtherMachineryAndEquipmentMember2019-12-310000937966asml:BerlinerGlasMemberasml:LandBuildingsAndConstructionsMember2020-01-012020-12-310000937966asml:BerlinerGlasMemberus-gaap:MachineryAndEquipmentMember2020-01-012020-12-310000937966us-gaap:LeaseholdImprovementsMemberasml:BerlinerGlasMember2020-01-012020-12-310000937966us-gaap:OtherMachineryAndEquipmentMemberasml:BerlinerGlasMember2020-01-012020-12-310000937966asml:LandBuildingsAndConstructionsMember2020-01-012020-12-310000937966us-gaap:MachineryAndEquipmentMember2020-01-012020-12-310000937966us-gaap:LeaseholdImprovementsMember2020-01-012020-12-310000937966us-gaap:OtherMachineryAndEquipmentMember2020-01-012020-12-310000937966asml:LandBuildingsAndConstructionsMember2020-12-310000937966us-gaap:MachineryAndEquipmentMember2020-12-310000937966us-gaap:LeaseholdImprovementsMember2020-12-310000937966us-gaap:OtherMachineryAndEquipmentMember2020-12-310000937966asml:LandBuildingsAndConstructionsMember2021-01-012021-12-310000937966us-gaap:MachineryAndEquipmentMember2021-01-012021-12-310000937966us-gaap:LeaseholdImprovementsMember2021-01-012021-12-310000937966us-gaap:OtherMachineryAndEquipmentMember2021-01-012021-12-310000937966asml:LandBuildingsAndConstructionsMember2021-12-310000937966us-gaap:MachineryAndEquipmentMember2021-12-310000937966us-gaap:LeaseholdImprovementsMember2021-12-310000937966us-gaap:OtherMachineryAndEquipmentMember2021-12-310000937966asml:PropertiesMember2020-12-310000937966asml:PropertiesMember2021-12-310000937966asml:CarsMember2020-12-310000937966asml:CarsMember2021-12-310000937966us-gaap:EquipmentMember2020-12-310000937966us-gaap:EquipmentMember2021-12-310000937966asml:WarehousesMember2020-12-310000937966asml:WarehousesMember2021-12-310000937966asml:OtherMember2020-12-310000937966asml:OtherMember2021-12-310000937966asml:PropertiesMember2019-01-012019-12-310000937966asml:PropertiesMember2020-01-012020-12-310000937966asml:PropertiesMember2021-01-012021-12-310000937966asml:CarsMember2019-01-012019-12-310000937966asml:CarsMember2020-01-012020-12-310000937966asml:CarsMember2021-01-012021-12-310000937966us-gaap:EquipmentMember2019-01-012019-12-310000937966us-gaap:EquipmentMember2020-01-012020-12-310000937966us-gaap:EquipmentMember2021-01-012021-12-310000937966asml:WarehousesMember2019-01-012019-12-310000937966asml:WarehousesMember2020-01-012020-12-310000937966asml:WarehousesMember2021-01-012021-12-310000937966asml:OtherMember2019-01-012019-12-310000937966asml:OtherMember2020-01-012020-12-310000937966asml:OtherMember2021-01-012021-12-310000937966asml:ZeroPointSixTwoFivePercentSeniorNotesDueTwoThousandTwentyTwoMember2016-07-310000937966asml:ZeroPointSixTwoFivePercentSeniorNotesDueTwoThousandTwentyTwoMember2020-12-310000937966asml:ZeroPointSixTwoFivePercentSeniorNotesDueTwoThousandTwentyTwoMember2021-12-310000937966asml:ThreePointThreeSevenFivePercentSeniorNotesDueTwoThousandTwentyThreeMember2013-09-300000937966asml:ThreePointThreeSevenFivePercentSeniorNotesDueTwoThousandTwentyThreeMember2020-12-310000937966asml:ThreePointThreeSevenFivePercentSeniorNotesDueTwoThousandTwentyThreeMember2021-12-310000937966asml:OnePointThreeSevenFivePercentSeniorNotesDueTwoThousandTwentySixMember2016-07-310000937966asml:OnePointThreeSevenFivePercentSeniorNotesDueTwoThousandTwentySixMember2020-12-310000937966asml:OnePointThreeSevenFivePercentSeniorNotesDueTwoThousandTwentySixMember2021-12-310000937966asml:OnePointSixTwoFivePercentSeniorNotesDueTwoThousandTwentySevenMember2016-11-300000937966asml:OnePointSixTwoFivePercentSeniorNotesDueTwoThousandTwentySevenMember2020-12-310000937966asml:OnePointSixTwoFivePercentSeniorNotesDueTwoThousandTwentySevenMember2021-12-310000937966asml:SeniorNotesDueFebruary25th20300250Member2020-02-290000937966asml:SeniorNotesDueFebruary25th20300250Member2020-12-310000937966asml:SeniorNotesDueFebruary25th20300250Member2021-12-310000937966asml:SeniorNotesDueMay7th20290625Member2020-05-310000937966asml:SeniorNotesDueMay7th20290625Member2020-12-310000937966asml:SeniorNotesDueMay7th20290625Member2021-12-310000937966asml:DebtAssumedInBerlinerGlasAcquisitionMember2020-12-310000937966asml:DebtAssumedInBerlinerGlasAcquisitionMember2021-12-310000937966asml:AmortizedCostsEurobondsMemberasml:EurobondsMember2020-12-310000937966asml:AmortizedCostsEurobondsMemberasml:EurobondsMember2021-12-310000937966asml:FairValueAdjustmentInterestRateSwapsMemberasml:EurobondsMember2020-12-310000937966asml:FairValueAdjustmentInterestRateSwapsMemberasml:EurobondsMember2021-12-310000937966asml:EurobondsMember2020-12-310000937966asml:EurobondsMember2021-12-310000937966asml:BerlinerGlasMember2021-12-310000937966srt:MinimumMemberasml:BerlinerGlasMember2021-01-012021-12-310000937966srt:MaximumMemberasml:BerlinerGlasMember2021-01-012021-12-31asml:Options0000937966us-gaap:LongTermDebtMember2021-12-310000937966asml:OperatingLeaseObligationsMember2021-12-310000937966asml:PurchaseObligationsMember2021-12-310000937966asml:CustomerSupportSectorMember2019-12-310000937966asml:CustomerSupportSectorMember2020-12-310000937966asml:CustomerSupportSectorMember2021-12-310000937966asml:ManufacturingAndLogisticsMember2019-12-310000937966asml:ManufacturingAndLogisticsMember2020-12-310000937966asml:ManufacturingAndLogisticsMember2021-12-310000937966asml:StrategicSupplyManagementSectorMember2019-12-310000937966asml:StrategicSupplyManagementSectorMember2020-12-310000937966asml:StrategicSupplyManagementSectorMember2021-12-310000937966asml:GeneralAndAdministrativeSectorMember2019-12-310000937966asml:GeneralAndAdministrativeSectorMember2020-12-310000937966asml:GeneralAndAdministrativeSectorMember2021-12-310000937966asml:SalesSectorMember2019-12-310000937966asml:SalesSectorMember2020-12-310000937966asml:SalesSectorMember2021-12-310000937966asml:ResearchAndDevelopmentSectorMember2019-12-310000937966asml:ResearchAndDevelopmentSectorMember2020-12-310000937966asml:ResearchAndDevelopmentSectorMember2021-12-310000937966asml:TemporaryNumberofFTEsMember2019-12-310000937966asml:TemporaryNumberofFTEsMember2020-12-310000937966asml:TemporaryNumberofFTEsMember2021-12-310000937966asml:NumberofPayrollEmployeesMember2019-12-310000937966asml:NumberofPayrollEmployeesMember2020-12-310000937966asml:NumberofPayrollEmployeesMember2021-12-310000937966asml:BoMMember2019-01-012019-12-310000937966asml:BoMMember2020-01-012020-12-310000937966asml:BoMMember2021-01-012021-12-310000937966asml:FormerBoardOfManagementMember2019-01-012019-12-310000937966asml:FormerBoardOfManagementMember2020-01-012020-12-310000937966asml:FormerBoardOfManagementMember2021-01-012021-12-310000937966asml:OtherEmployeesMember2019-01-012019-12-310000937966asml:OtherEmployeesMember2020-01-012020-12-310000937966asml:OtherEmployeesMember2021-01-012021-12-31asml:Plan0000937966asml:NetherlandsMultiemployerUnionPlanMember2021-01-012021-12-31asml:Personasml:Companyutr:Rate0000937966asml:NetherlandsMultiemployerUnionPlanMember2020-01-012020-12-310000937966asml:NetherlandsMultiemployerUnionPlanMember2019-01-012019-12-310000937966asml:NetherlandsMultiemployerUnionPlanMember2021-12-310000937966asml:NetherlandsMultiemployerUnionPlanMember2020-12-310000937966asml:TotalShareholderReturnMember2021-12-310000937966asml:ROAICMember2021-12-310000937966asml:TechnologyLeadershipIndexMember2021-12-310000937966asml:SustainabilityMember2021-12-310000937966asml:ASMLMember2019-01-012019-12-310000937966asml:ASMLMember2020-01-012020-12-310000937966asml:ASMLMember2021-01-012021-12-310000937966exch:XPHL2019-01-012019-12-310000937966exch:XPHL2020-01-012020-12-310000937966exch:XPHL2021-01-012021-12-310000937966asml:EurozoneMember2019-01-012019-12-310000937966asml:EurozoneMember2020-01-012020-12-310000937966asml:EurozoneMember2021-01-012021-12-310000937966asml:EURDominatedAwardsMember2019-01-012019-12-310000937966asml:EURDominatedAwardsMember2020-01-012020-12-310000937966asml:EURDominatedAwardsMember2021-01-012021-12-310000937966asml:USDenominatedAwardsMember2019-01-012019-12-310000937966asml:USDenominatedAwardsMember2020-01-012020-12-310000937966asml:USDenominatedAwardsMember2021-01-012021-12-31iso4217:USDxbrli:shares0000937966asml:EURdenominatedConditionalAwardsMember2020-12-310000937966asml:USdenominatedConditionalAwardsMember2020-12-310000937966asml:EURdenominatedConditionalAwardsMember2021-01-012021-12-310000937966asml:USdenominatedConditionalAwardsMember2021-01-012021-12-310000937966asml:EURdenominatedConditionalAwardsMember2021-12-310000937966asml:USdenominatedConditionalAwardsMember2021-12-310000937966asml:EmployeeStockOptionPlanMember2021-01-012021-12-310000937966asml:EURdenominatedOptionAwardsMember2019-01-012019-12-310000937966asml:EURdenominatedOptionAwardsMember2020-01-012020-12-310000937966asml:EURdenominatedOptionAwardsMember2021-01-012021-12-310000937966asml:USdenominatedOptionAwardsMember2019-01-012019-12-310000937966asml:USdenominatedOptionAwardsMember2020-01-012020-12-310000937966asml:USdenominatedOptionAwardsMember2021-01-012021-12-31iso4217:USD0000937966asml:EURdenominatedOptionAwardsMember2019-12-310000937966asml:EURdenominatedOptionAwardsMember2020-12-310000937966asml:EURdenominatedOptionAwardsMember2021-12-310000937966asml:USdenominatedOptionAwardsMember2019-12-310000937966asml:USdenominatedOptionAwardsMember2020-12-310000937966asml:USdenominatedOptionAwardsMember2021-12-310000937966asml:EURdenominatedOptionAwardsMembercurrency:EUR2020-12-310000937966asml:USdenominatedOptionAwardsMembercurrency:USD2020-12-310000937966asml:EURdenominatedOptionAwardsMembercurrency:EUR2021-01-012021-12-310000937966asml:USdenominatedOptionAwardsMembercurrency:USD2021-01-012021-12-310000937966asml:EURdenominatedOptionAwardsMembercurrency:EUR2021-12-310000937966asml:USdenominatedOptionAwardsMembercurrency:USD2021-12-310000937966asml:EURdenominatedOptionAwardsMemberasml:PriceRangeOneMember2021-01-012021-12-310000937966asml:EURdenominatedOptionAwardsMemberasml:PriceRangeOneMember2021-12-310000937966asml:USdenominatedOptionAwardsMemberasml:PriceRangeOneMember2021-01-012021-12-310000937966asml:USdenominatedOptionAwardsMemberasml:PriceRangeOneMember2021-12-310000937966asml:PriceRangeTwoMemberasml:EURdenominatedOptionAwardsMember2021-01-012021-12-310000937966asml:PriceRangeTwoMemberasml:EURdenominatedOptionAwardsMember2021-12-310000937966asml:USdenominatedOptionAwardsMemberasml:PriceRangeTwoMember2021-01-012021-12-310000937966asml:USdenominatedOptionAwardsMemberasml:PriceRangeTwoMember2021-12-310000937966asml:PriceRangeThreeMemberasml:EURdenominatedOptionAwardsMember2021-01-012021-12-310000937966asml:PriceRangeThreeMemberasml:EURdenominatedOptionAwardsMember2021-12-310000937966asml:PriceRangeThreeMemberasml:USdenominatedOptionAwardsMember2021-01-012021-12-310000937966asml:PriceRangeThreeMemberasml:USdenominatedOptionAwardsMember2021-12-310000937966asml:PriceRangeFourMemberasml:EURdenominatedOptionAwardsMember2021-01-012021-12-310000937966asml:PriceRangeFourMemberasml:EURdenominatedOptionAwardsMember2021-12-310000937966asml:USdenominatedOptionAwardsMemberasml:PriceRangeFourMember2021-01-012021-12-310000937966asml:USdenominatedOptionAwardsMemberasml:PriceRangeFourMember2021-12-310000937966asml:PriceRangeFiveMemberasml:EURdenominatedOptionAwardsMember2021-01-012021-12-310000937966asml:PriceRangeFiveMemberasml:EURdenominatedOptionAwardsMember2021-12-310000937966asml:PriceRangeFiveMemberasml:USdenominatedOptionAwardsMember2021-01-012021-12-310000937966asml:PriceRangeFiveMemberasml:USdenominatedOptionAwardsMember2021-12-310000937966asml:PriceRangeSixMemberasml:EURdenominatedOptionAwardsMember2021-01-012021-12-310000937966asml:PriceRangeSixMemberasml:EURdenominatedOptionAwardsMember2021-12-310000937966asml:USdenominatedOptionAwardsMemberasml:PriceRangeSixMember2021-01-012021-12-310000937966asml:USdenominatedOptionAwardsMemberasml:PriceRangeSixMember2021-12-310000937966asml:PriceRangeSevenMemberasml:EURdenominatedOptionAwardsMember2021-01-012021-12-310000937966asml:PriceRangeSevenMemberasml:EURdenominatedOptionAwardsMember2021-12-310000937966asml:PriceRangeSevenMemberasml:USdenominatedOptionAwardsMember2021-01-012021-12-310000937966asml:PriceRangeSevenMemberasml:USdenominatedOptionAwardsMember2021-12-310000937966asml:PriceRangeEightMemberasml:EURdenominatedOptionAwardsMember2021-01-012021-12-310000937966asml:PriceRangeEightMemberasml:EURdenominatedOptionAwardsMember2021-12-310000937966asml:PriceRangeEightMemberasml:USdenominatedOptionAwardsMember2021-01-012021-12-310000937966asml:PriceRangeEightMemberasml:USdenominatedOptionAwardsMember2021-12-310000937966us-gaap:EmployeeStockMember2021-01-012021-12-310000937966asml:DeferredTaxAssetsNoncurrentMember2020-12-310000937966asml:DeferredTaxAssetsNoncurrentMember2021-12-310000937966asml:DeferredTaxLiabilitiesNoncurrentMember2020-12-310000937966asml:DeferredTaxLiabilitiesNoncurrentMember2021-12-310000937966asml:BerlinerGlasMember2020-12-310000937966asml:DeferredTaxAssetsNoncurrentMember2019-12-310000937966asml:DeferredTaxLiabilitiesNoncurrentMember2019-12-310000937966asml:NoExpirationDateMember2021-12-310000937966asml:WithExpirationDateMember2021-12-310000937966asml:WithExpirationDateMember2021-12-310000937966us-gaap:CumulativePreferredStockMember2021-12-310000937966us-gaap:CommonClassBMember2021-12-31asml:registeredHolderasml:depositoryReceipt0000937966srt:ScenarioForecastMember2021-04-292022-10-2900009379662021-11-012021-11-300000937966asml:ShareBuybackProgram20212023Membersrt:ScenarioForecastMember2021-07-212023-12-310000937966asml:ShareBuybackProgram20202022Membersrt:ScenarioForecastMember2020-01-222022-12-310000937966asml:ShareBuybackProgram20212023Member2021-01-012021-12-310000937966asml:ShareBuybackProgram20202022Member2021-01-012021-12-3100009379662021-01-212021-01-3100009379662020-01-232021-01-3100009379662021-02-012021-02-2800009379662020-01-232021-02-2800009379662021-03-012021-03-3100009379662020-01-232021-03-3100009379662021-04-012021-04-3000009379662021-01-232021-04-3000009379662021-05-012021-05-3100009379662020-01-232021-05-3100009379662021-06-012021-06-3000009379662020-01-232021-06-3000009379662021-07-012021-07-3100009379662020-01-232021-07-3100009379662021-08-012021-08-3100009379662020-01-232021-08-3100009379662021-09-012021-09-3000009379662020-01-232021-09-3000009379662021-10-012021-10-3100009379662020-01-232021-10-3100009379662020-01-232021-11-3000009379662021-12-012021-12-2300009379662020-01-232021-12-230000937966srt:ScenarioForecastMember2021-04-292022-10-220000937966srt:MaximumMember2021-12-310000937966asml:NetincomeMembercurrency:USD2020-12-310000937966currency:USDus-gaap:EquityMember2020-12-310000937966asml:NetincomeMembercurrency:USD2021-12-310000937966currency:USDus-gaap:EquityMember2021-12-310000937966currency:JPYasml:NetincomeMember2020-12-310000937966currency:JPYus-gaap:EquityMember2020-12-310000937966currency:JPYasml:NetincomeMember2021-12-310000937966currency:JPYus-gaap:EquityMember2021-12-310000937966currency:TWDasml:NetincomeMember2020-12-310000937966currency:TWDus-gaap:EquityMember2020-12-310000937966currency:TWDasml:NetincomeMember2021-12-310000937966currency:TWDus-gaap:EquityMember2021-12-310000937966currency:XXXasml:NetincomeMember2020-12-310000937966currency:XXXus-gaap:EquityMember2020-12-310000937966currency:XXXasml:NetincomeMember2021-12-310000937966currency:XXXus-gaap:EquityMember2021-12-310000937966asml:NetincomeMember2020-12-310000937966us-gaap:EquityMember2020-12-310000937966asml:NetincomeMember2021-12-310000937966us-gaap:EquityMember2021-12-310000937966us-gaap:ForeignExchangeForwardMember2021-12-31iso4217:JPYiso4217:TWDiso4217:KRWiso4217:CNY0000937966us-gaap:ForeignExchangeForwardMember2020-12-310000937966us-gaap:CostOfSalesMember2021-12-310000937966us-gaap:CostOfSalesMember2020-12-310000937966us-gaap:CostOfSalesMember2019-12-310000937966us-gaap:SalesMember2021-12-310000937966us-gaap:SalesMember2020-12-310000937966us-gaap:SalesMember2019-12-310000937966us-gaap:InterestRateSwapMember2021-12-310000937966us-gaap:InterestRateSwapMember2020-12-310000937966us-gaap:FairValueHedgingMemberus-gaap:InterestRateSwapMember2020-12-310000937966us-gaap:FairValueHedgingMemberus-gaap:InterestRateSwapMember2021-12-310000937966us-gaap:CashFlowHedgingMemberus-gaap:ForeignExchangeForwardMember2020-12-310000937966us-gaap:CashFlowHedgingMemberus-gaap:ForeignExchangeForwardMember2021-12-310000937966asml:OtherHedgesMemberus-gaap:ForeignExchangeForwardMember2020-12-310000937966asml:OtherHedgesMemberus-gaap:ForeignExchangeForwardMember2021-12-31asml:eurobond0000937966asml:FourOutstandingEurobondsMember2021-12-310000937966us-gaap:FairValueMeasurementsRecurringMemberus-gaap:FairValueInputsLevel1Member2021-12-310000937966us-gaap:FairValueMeasurementsRecurringMemberus-gaap:FairValueInputsLevel2Member2021-12-310000937966us-gaap:FairValueMeasurementsRecurringMemberus-gaap:FairValueInputsLevel3Member2021-12-310000937966us-gaap:FairValueMeasurementsRecurringMemberus-gaap:FairValueInputsLevel1Member2020-12-310000937966us-gaap:FairValueMeasurementsRecurringMemberus-gaap:FairValueInputsLevel2Member2020-12-310000937966us-gaap:FairValueMeasurementsRecurringMemberus-gaap:FairValueInputsLevel3Member2020-12-310000937966asml:CarlZeissSMTGmbHMemberasml:CarlZeissSMTHoldingGmbHCo.KGMember2021-12-310000937966asml:CarlZeissSMTGmbHMembersrt:MaximumMember2021-12-310000937966asml:CarlZeissSMTGmbHMember2021-01-012021-12-310000937966srt:MinimumMemberasml:CarlZeissSMTGmbHMember2021-12-310000937966asml:ZeissHighNAFundingCommitmentMember2016-01-012020-12-310000937966asml:ResearchanddevelopmentsupportprovidedMemberasml:ZeissHighNAFundingCommitmentMember2016-01-012020-12-310000937966asml:ZeissHighNAFundingCommitmentMemberasml:CapitalexpendituresupportprovidedMember2016-01-012020-12-31asml:element0000937966asml:ResearchanddevelopmentsupportprovidedMemberasml:ZeissHighNAFundingCommitmentMember2021-01-012021-12-310000937966asml:ResearchanddevelopmentsupportprovidedMemberasml:ZeissHighNAFundingCommitmentMember2020-01-012020-12-310000937966asml:ResearchanddevelopmentsupportprovidedMemberasml:ZeissHighNAFundingCommitmentMember2019-01-012019-12-310000937966asml:CarlZeissSMTGmbHMemberasml:ZeissHighNAFundingCommitmentMember2021-09-290000937966asml:CarlZeissSMTGmbHMemberasml:ZeissHighNAFundingCommitmentMember2020-01-012020-12-310000937966asml:CarlZeissSMTGmbHMemberasml:ZeissHighNAFundingCommitmentMember2019-01-012019-12-310000937966asml:CarlZeissSMTHoldingGmbHCo.KGMemberus-gaap:OtherAssetsMember2020-12-310000937966asml:CarlZeissSMTHoldingGmbHCo.KGMemberus-gaap:OtherAssetsMember2021-12-310000937966asml:CarlZeissSMTHoldingGmbHCo.KGMemberasml:MaximumExposureToLossMemberus-gaap:OtherAssetsMember2021-12-310000937966asml:CarlZeissSMTHoldingGmbHCo.KGMemberus-gaap:PropertyPlantAndEquipmentMember2020-12-310000937966asml:CarlZeissSMTHoldingGmbHCo.KGMemberus-gaap:PropertyPlantAndEquipmentMember2021-12-310000937966asml:CarlZeissSMTHoldingGmbHCo.KGMemberasml:MaximumExposureToLossMemberus-gaap:PropertyPlantAndEquipmentMember2021-12-310000937966asml:CarlZeissSMTHoldingGmbHCo.KGMemberasml:MaximumExposureToLossMember2021-12-310000937966asml:MaximumExposureToLossMember2021-12-310000937966asml:CarlZeissSMTHoldingGmbHCo.KGMember2019-01-012019-12-310000937966asml:CarlZeissSMTHoldingGmbHCo.KGMember2020-01-012020-12-310000937966asml:CarlZeissSMTHoldingGmbHCo.KGMember2021-01-012021-12-310000937966asml:AnyDirectorOrOfficerOfAsmlOrAnyAssociateThereofMember2021-01-012021-12-310000937966asml:AnyDirectorOrOfficerOfAsmlOrAnyAssociateThereofMember2021-12-310000937966asml:AnyDirectorOrOfficerOfAsmlOrAnyAssociateThereofMemberus-gaap:SubsequentEventMember2022-02-09
United States
Securities and Exchange Commission
Washington, D.C. 20549
Form 20-F
ANNUAL REPORT PURSUANT TO SECTION 13 OR 15(d)
OF THE SECURITIES EXCHANGE ACT OF 1934
for the fiscal year ended December 31, 2021
Commission file number 001-33463
ASML HOLDING NV
(Exact Name of Registrant as Specified in Its Charter)
The Netherlands
(Jurisdiction of incorporation or organization)
De Run 6501, 5504 DR Veldhoven, The Netherlands
(Address of principal executive offices)
Skip Miller
Telephone: +1 480 235 0934 E-mail: skip.miller@asml.com
2650 W Geronimo Place, Chandler, AZ 85224, USA
(Name, Telephone, E-mail, and / or Facsimile number and Address of Company Contact Person)
Securities registered or to be registered pursuant to Section 12(b) of the Act:
Title of each class Trading Symbol Name of each exchange on which registered
Ordinary Shares ASML The NASDAQ Stock Market LLC
(nominal value €0.09 per share)
Securities registered or to be registered pursuant to Section 12(g) of the Act:
None
Securities for which there is a reporting obligation pursuant to Section 15(d) of the Act:
None
Indicate the number of outstanding shares of each of the issuer’s classes of
capital or common stock as of the close of the period covered by the annual report.
402,601,613 Ordinary Shares
(nominal value €0.09 per share)
Indicate by check mark if the registrant is a well-known seasoned issuer, as defined in Rule 405 of the Securities Act.
Yes ☒ No ☐
If this report is an annual or transition report, indicate by check mark if the registrant
is not required to file reports pursuant to Section 13 or 15(d) of the Securities Exchange Act of 1934.
Yes ☐ No ☒
Indicate by check mark whether the registrant: (1) has filed all reports required to be filed by Section 13 or 15(d) of the
Securities Exchange Act of 1934 during the preceding 12 months (or for such shorter period that the registrant
was required to file such reports), and (2) has been subject to such filing requirements for the past 90 days.
Yes ☒ No ☐
Indicate by check mark whether the registrant has submitted electronically
every Interactive Data File required to be submitted pursuant to Rule 405 of Regulation S-T (§232.405 of this chapter) during the
preceding 12 months (or for such shorter period that the registrant was required to submit such files).
Yes ☒ No ☐
Indicate by check mark whether the registrant is a large accelerated filer, an accelerated filer, a non-accelerated filer, or an emerging growth company.
See definition of "large accelerated filer,” “accelerated filer," and “emerging growth company" in Rule 12b-2 of the Exchange Act.:
Large accelerated filer ☒ Accelerated filer ☐ Non-accelerated filer ☐ Emerging growth company ☐
If an emerging growth company that prepares its financial statements in accordance with U.S. GAAP, indicate by check mark if the registrant has elected not to use the extended transition period for complying with any new or revised financial accounting standards provided pursuant to Section 13(a) of the Exchange Act. ☐
† The term “new or revised financial accounting standard” refers to any update issued by the Financial Accounting Standards Board to its Accounting Standards Codification after April 5, 2012.
Indicate by check mark whether the registrant has filed a report on and attestation to its management’s assessment of the effectiveness of its internal control over financial reporting under Section 404(b) of the Sarbanes-Oxley Act (15 U.S.C. 7262(b)) by the registered public accounting firm that prepared or issued its audit report.
Yes ☒ No ☐
Indicate by check mark which basis of accounting the registrant has used to prepare
the financial statements included in this filing:
U.S. GAAP ☒ International Financial Reporting Standards as issued by the
International Accounting Standards Board ☐ Other ☐
If "Other" has been checked in response to the previous question, indicate by check mark
which financial statement item the registrant has elected to follow.
Item 17 ☐ Item 18 ☐
If this is an annual report, indicate by check mark whether the registrant is a
shell company (as defined in Rule 12b-2 of the Exchange Act)
Yes ☐ No ☒
Name and address of person authorized to receive notices and communications from the Securities and Exchange Commission:
James A. McDonald
Skadden, Arps, Slate, Meagher & Flom (UK) LLP
40 Bank Street, Canary Wharf London E14 5DS England
ASML ANNUAL REPORT 2021 1
Contents
| | | | | | | | | | | |
| 2021 at a glance | | Supervisory Board |
| Message from the CEO | | Message from the Chair of our Supervisory Board |
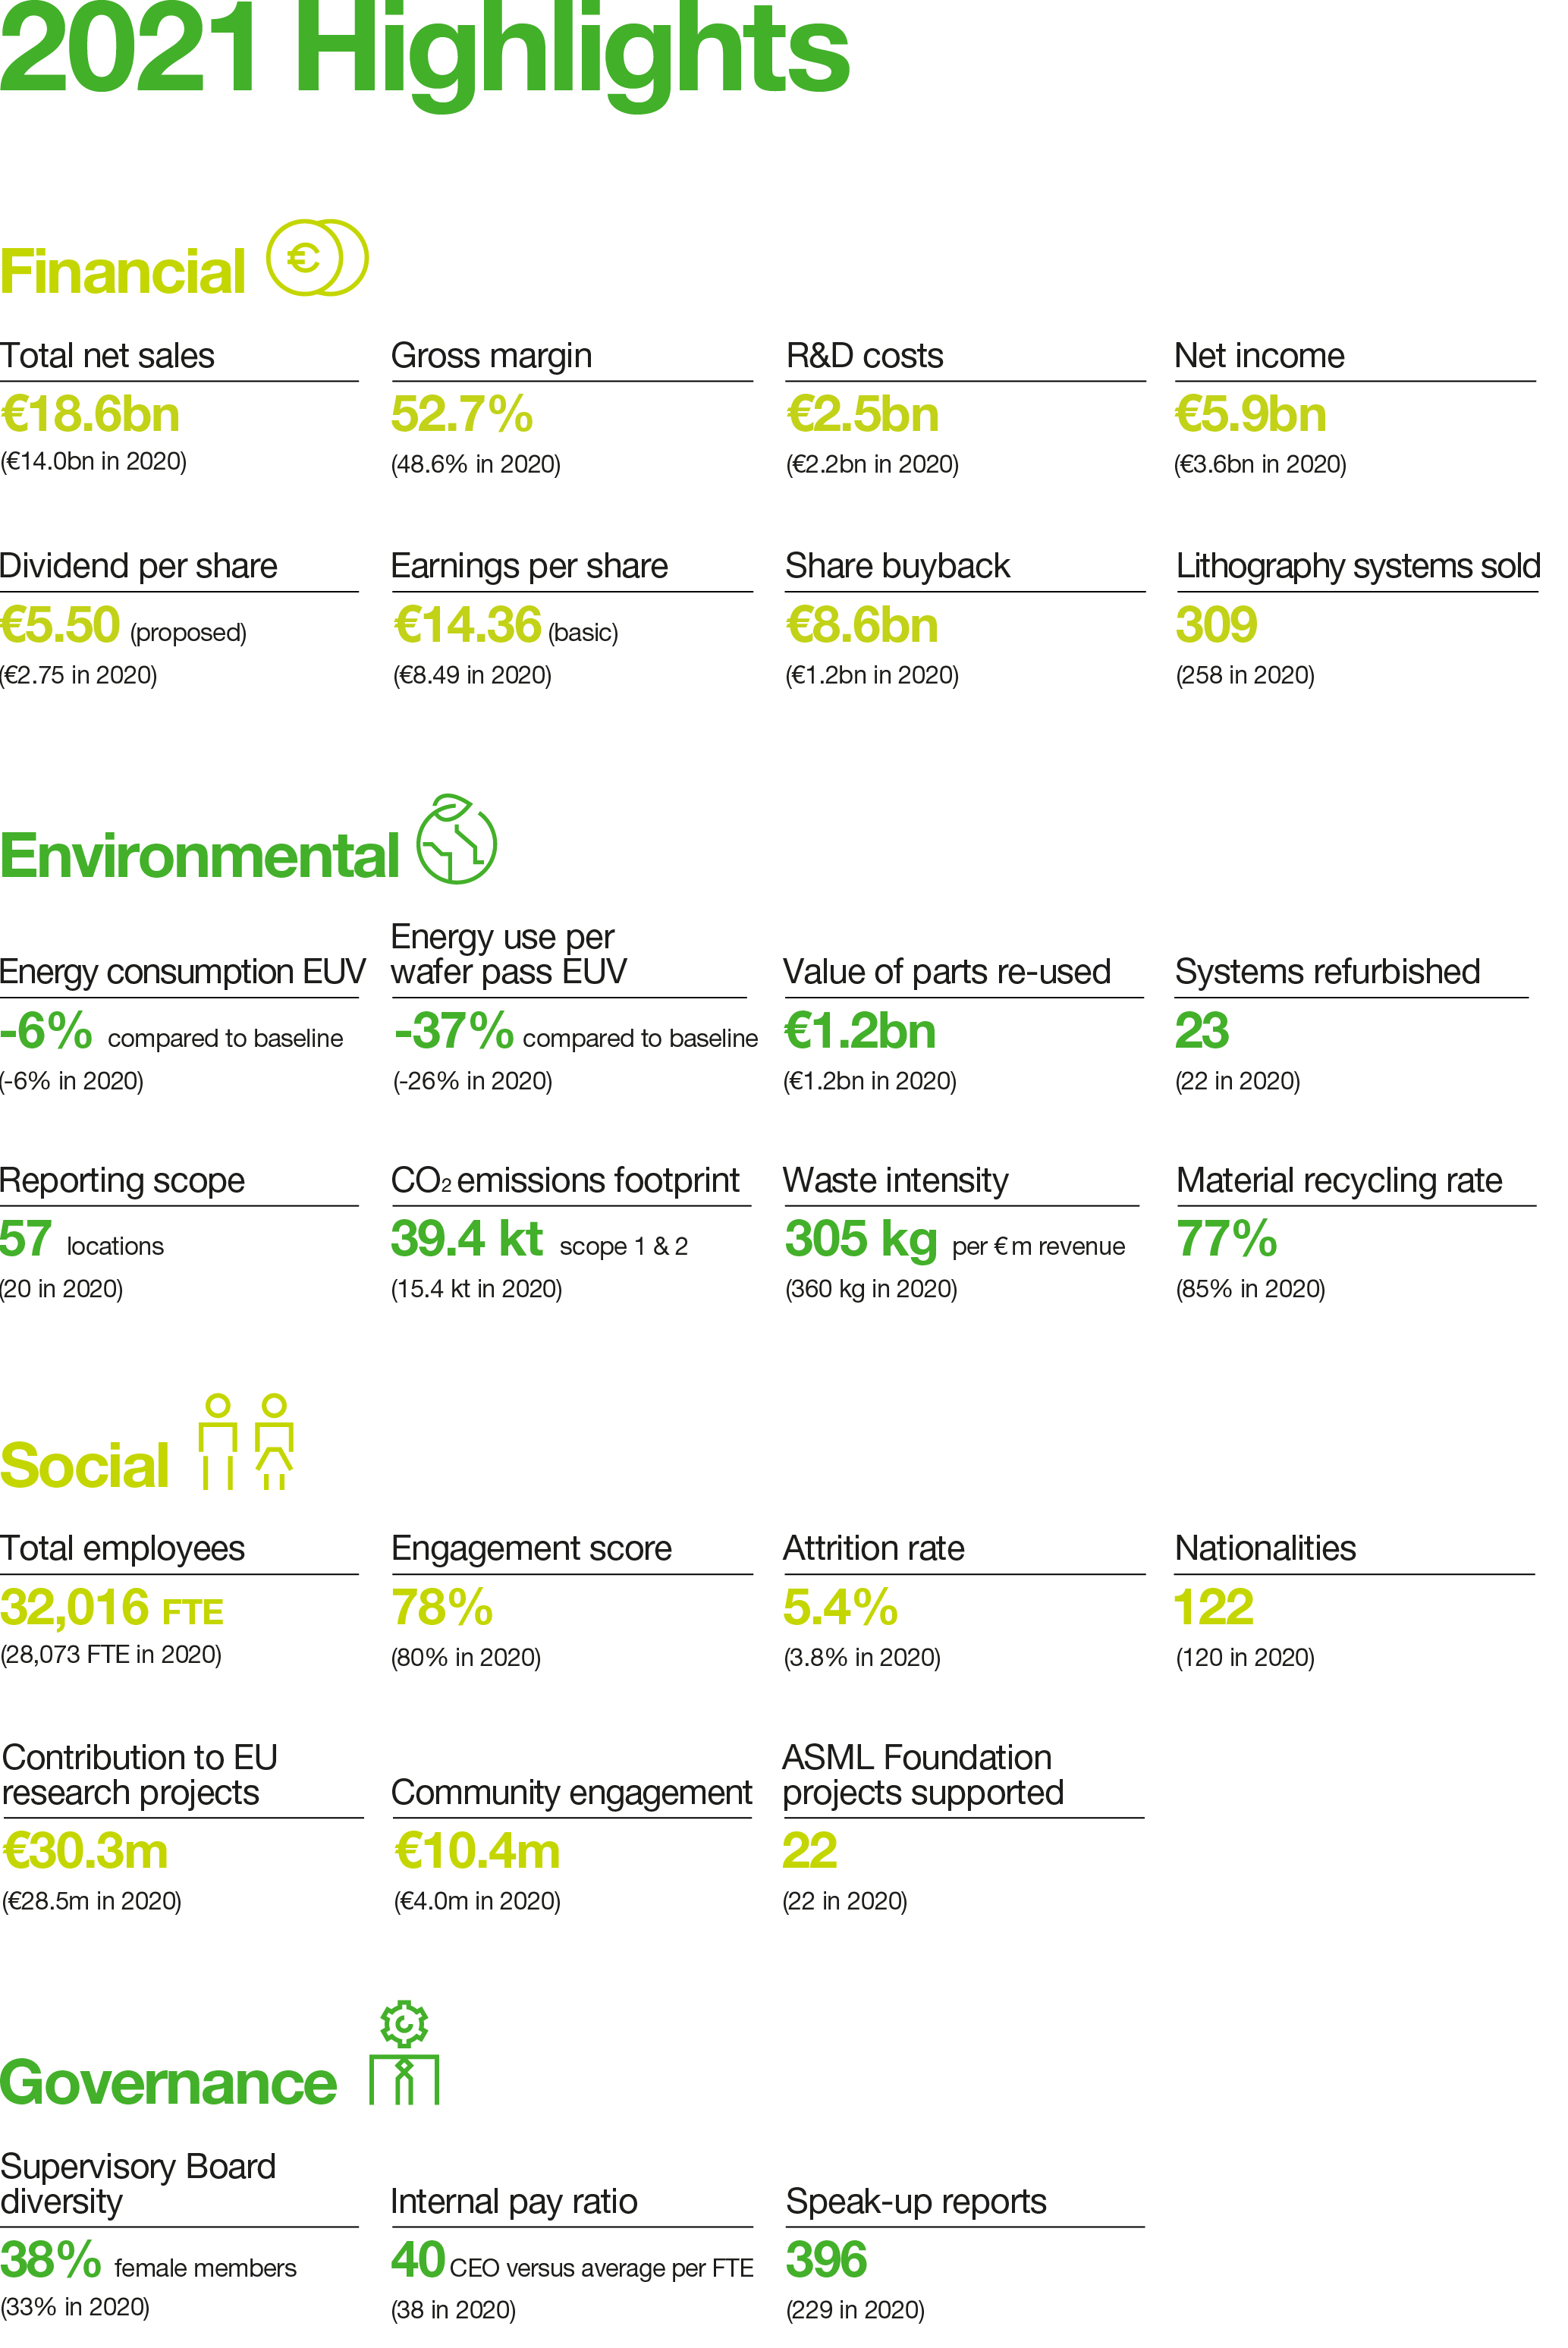
| 2021 Highlights | | Supervisory Board report |
| | | Remuneration report |
| Who we are and what we do | | |
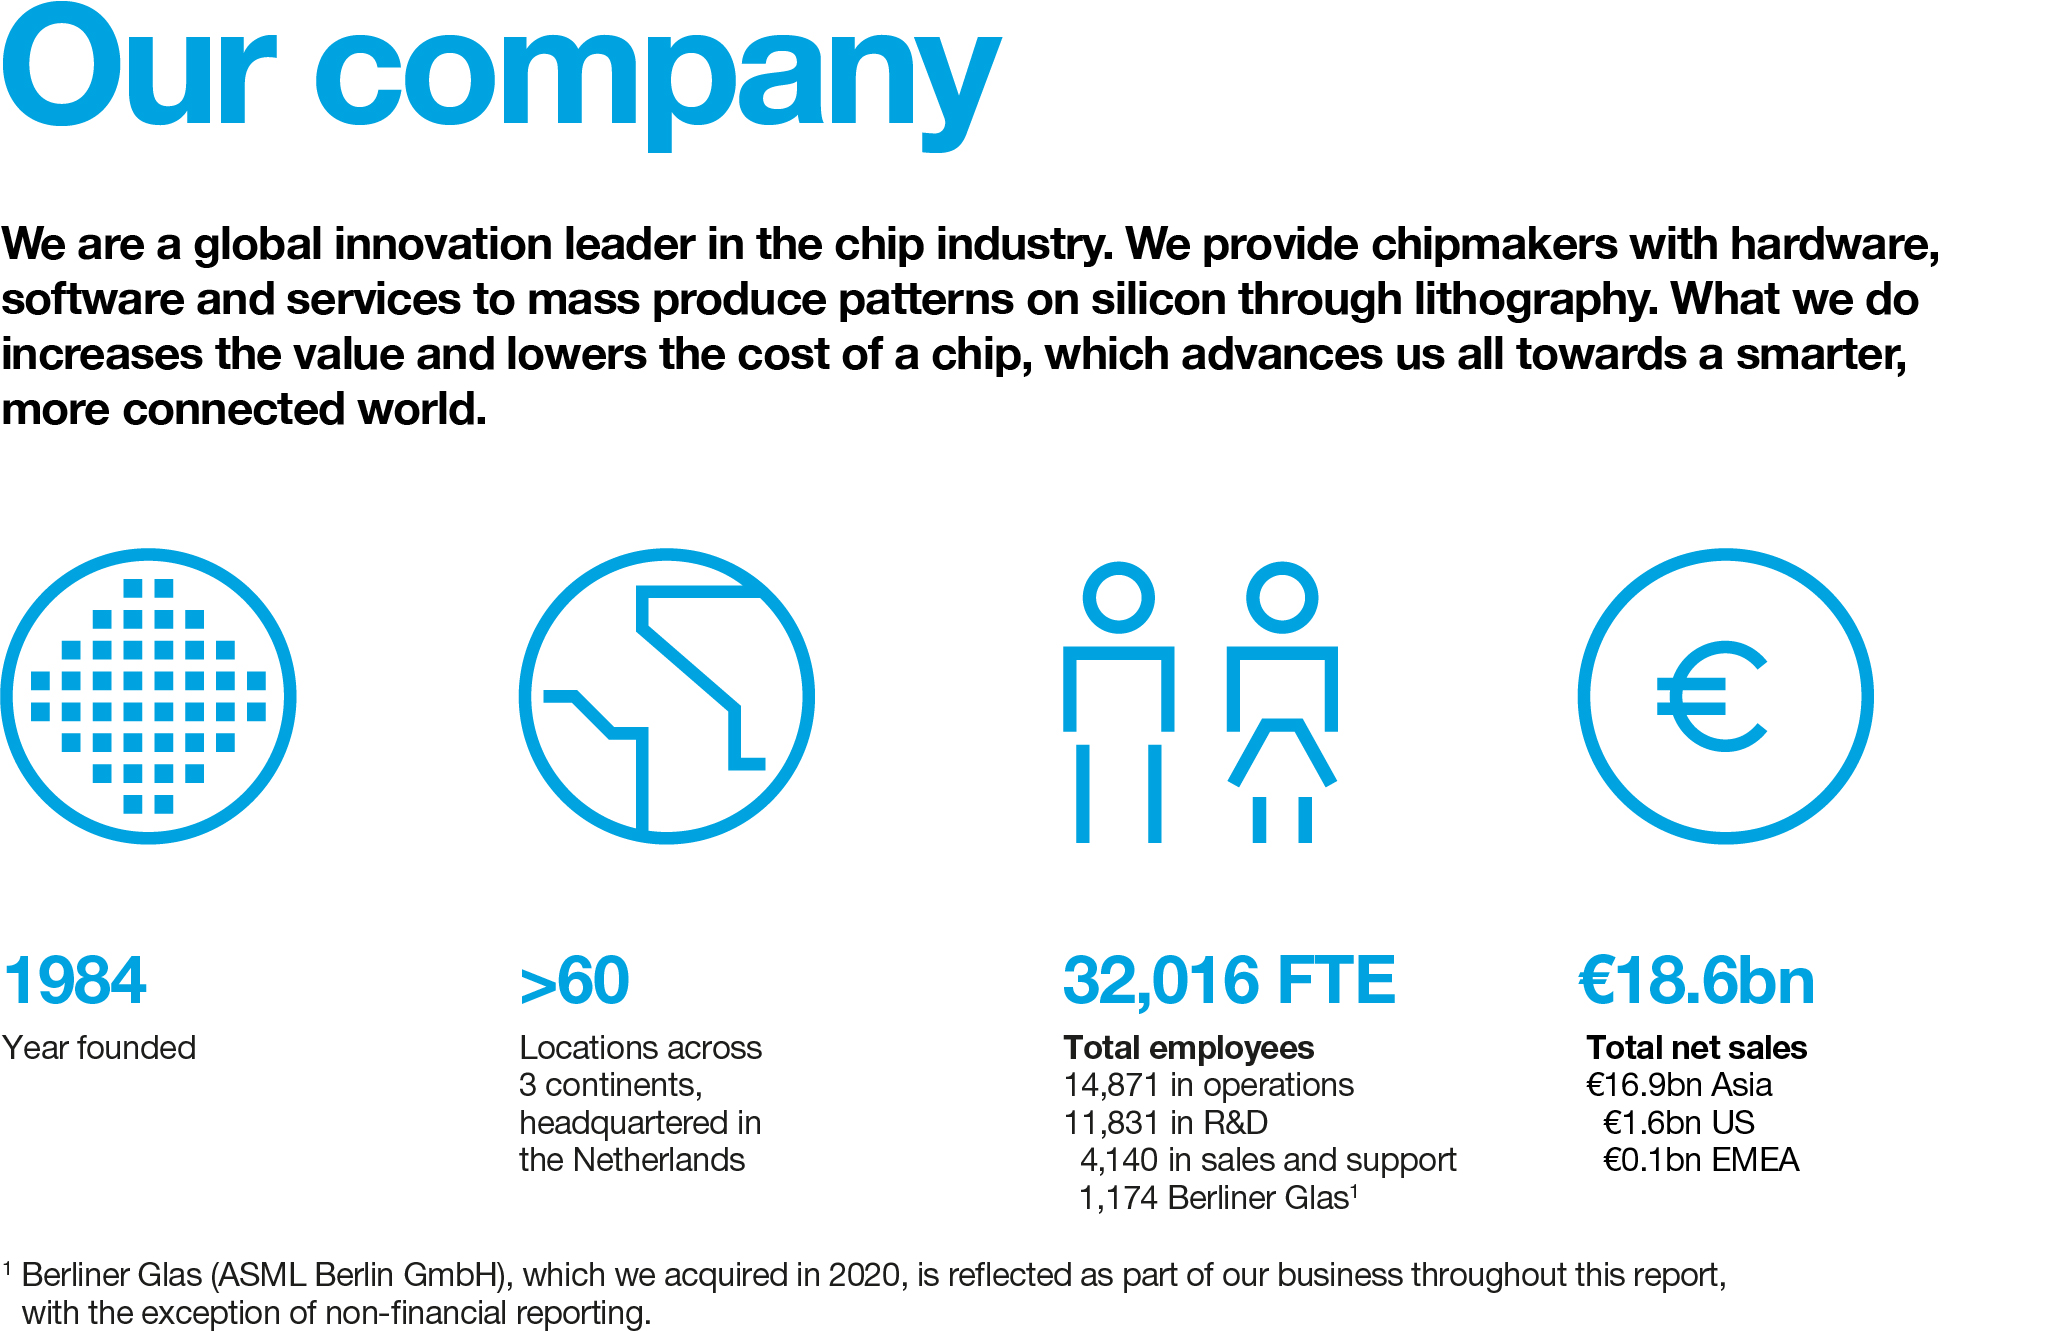
| Our company | | Consolidated Financial Statements |
| Message from the CTO | | Report of Independent Registered Public Accounting Firm |
| How we innovate | | Consolidated Statements of Operations |
| Customer intimacy | | Consolidated Statements of Comprehensive Income |
| Our products and services | | Consolidated Balance Sheets |
| | | Consolidated Statements of Shareholders’ Equity |
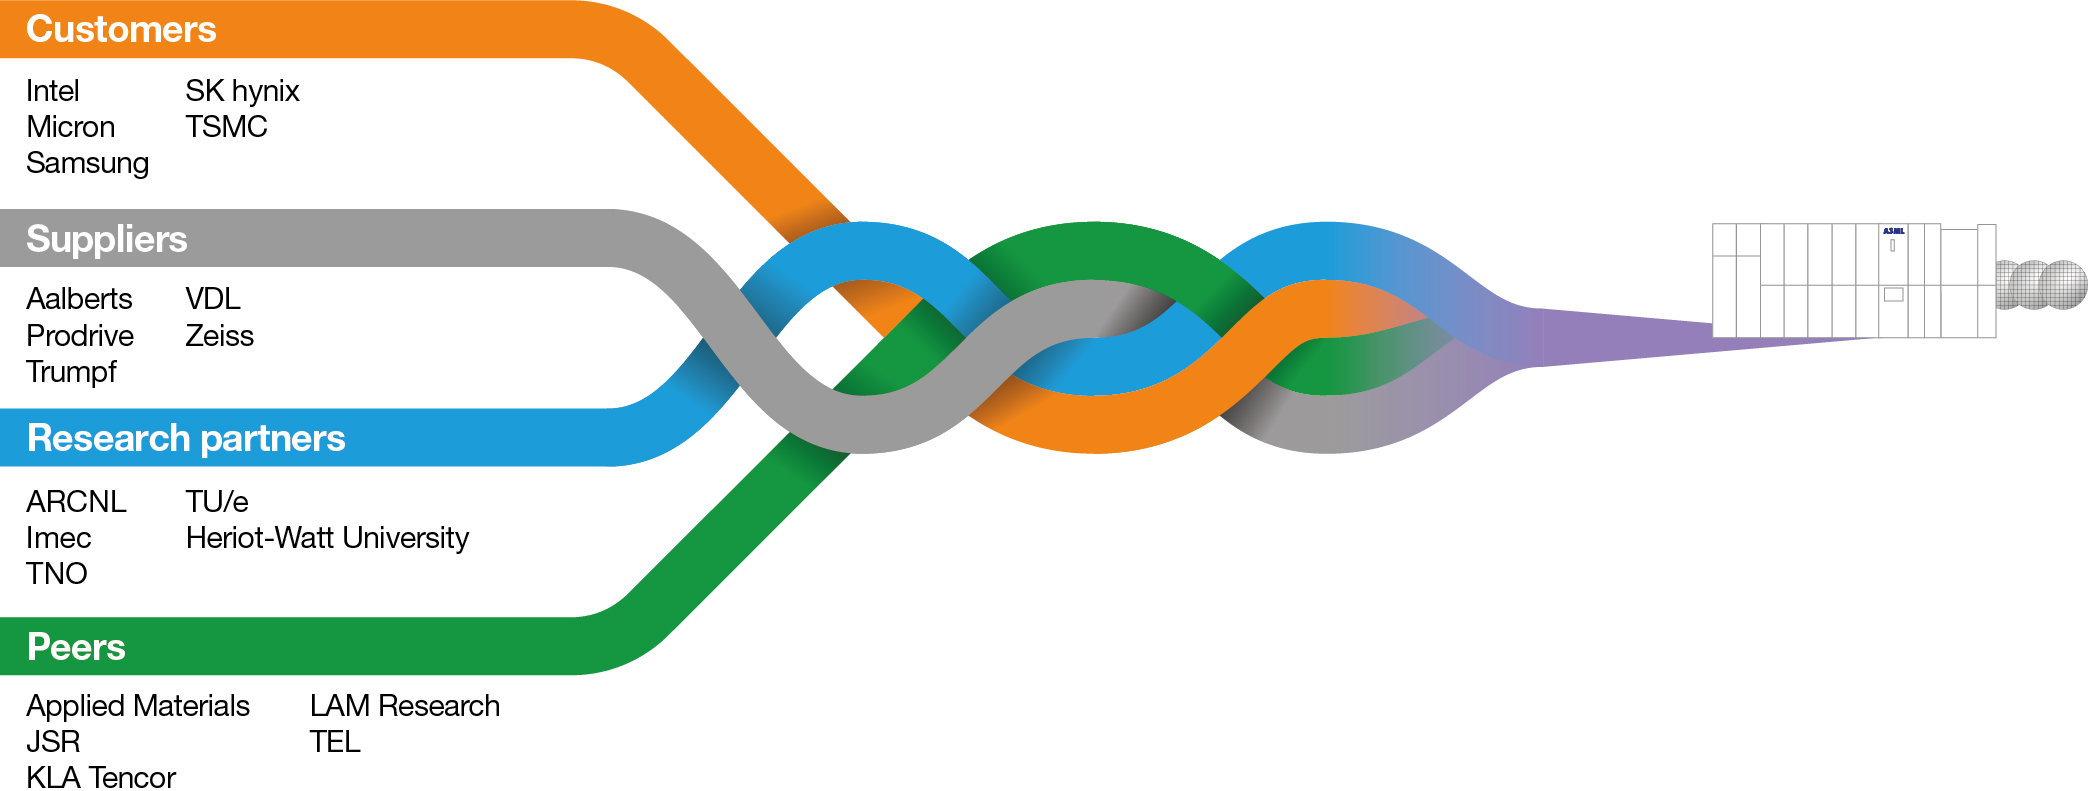
| Our position in the semiconductor value chain | | Consolidated Statements of Cash Flows |
| Our markets | | Notes to the Consolidated Financial Statements |
| Semiconductor industry trends and opportunities | | |
| Our strategy | | Non-financial statements |
| | | Assurance Report of the Independent Auditor |
| Our performance in 2021 | | About the non-financial information |
| How we create value | | Non-financial indicators |
| Financial | | Materiality assessment |
| Message from the CFO | | Stakeholder engagement |
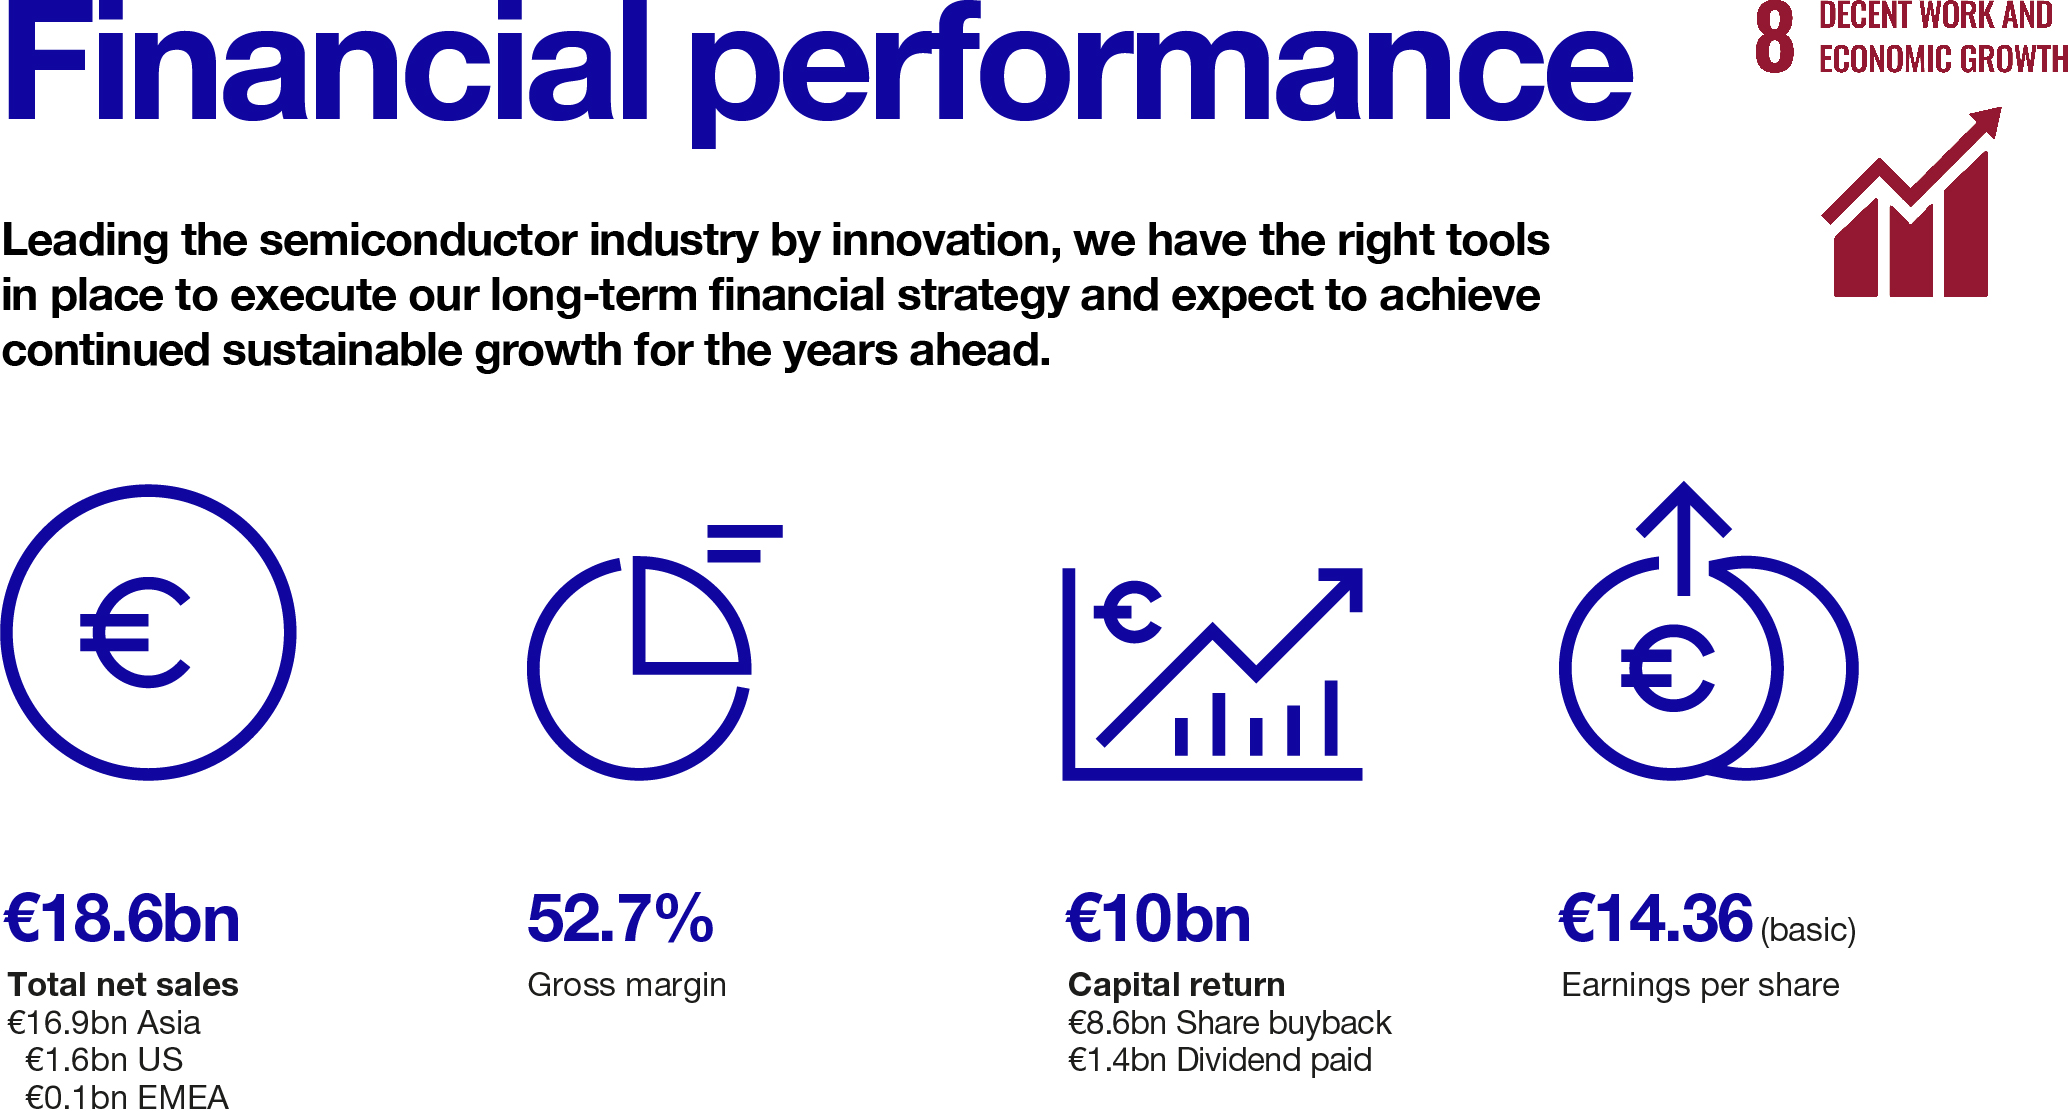
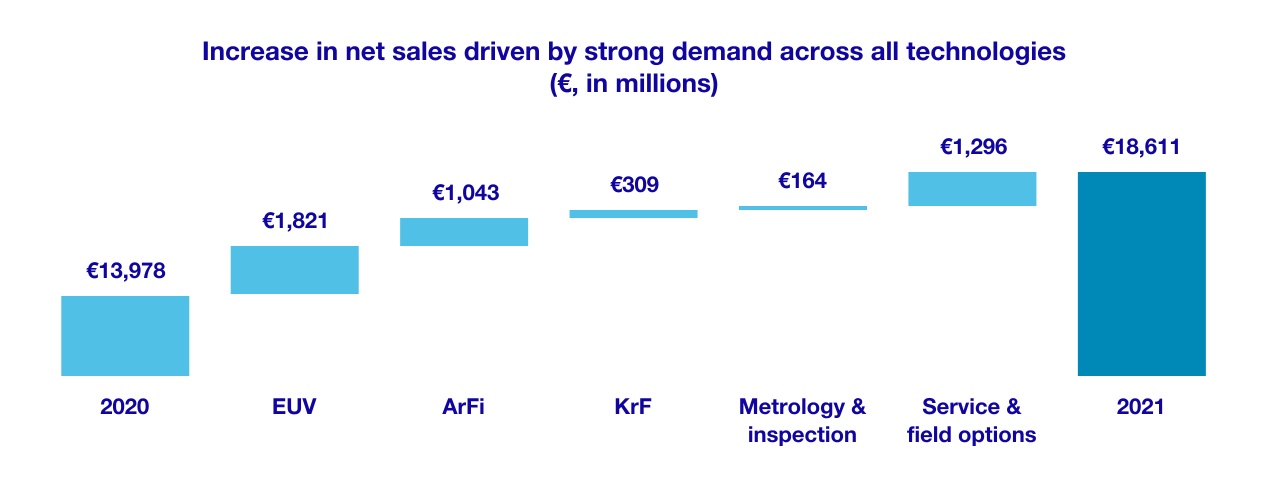
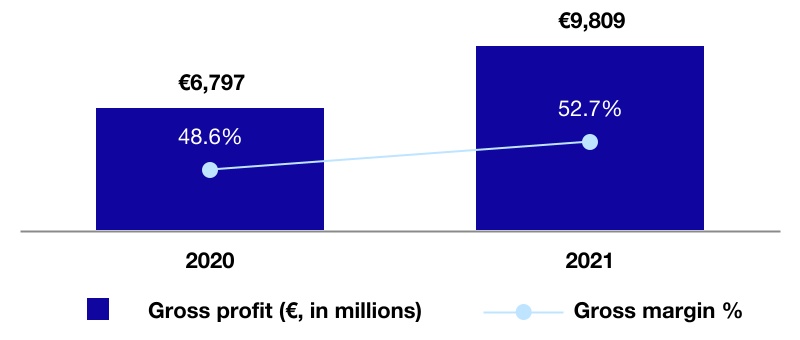
| Financial performance | | |
| Long-term growth opportunities | | Other appendices |
| Environmental | | Definitions |
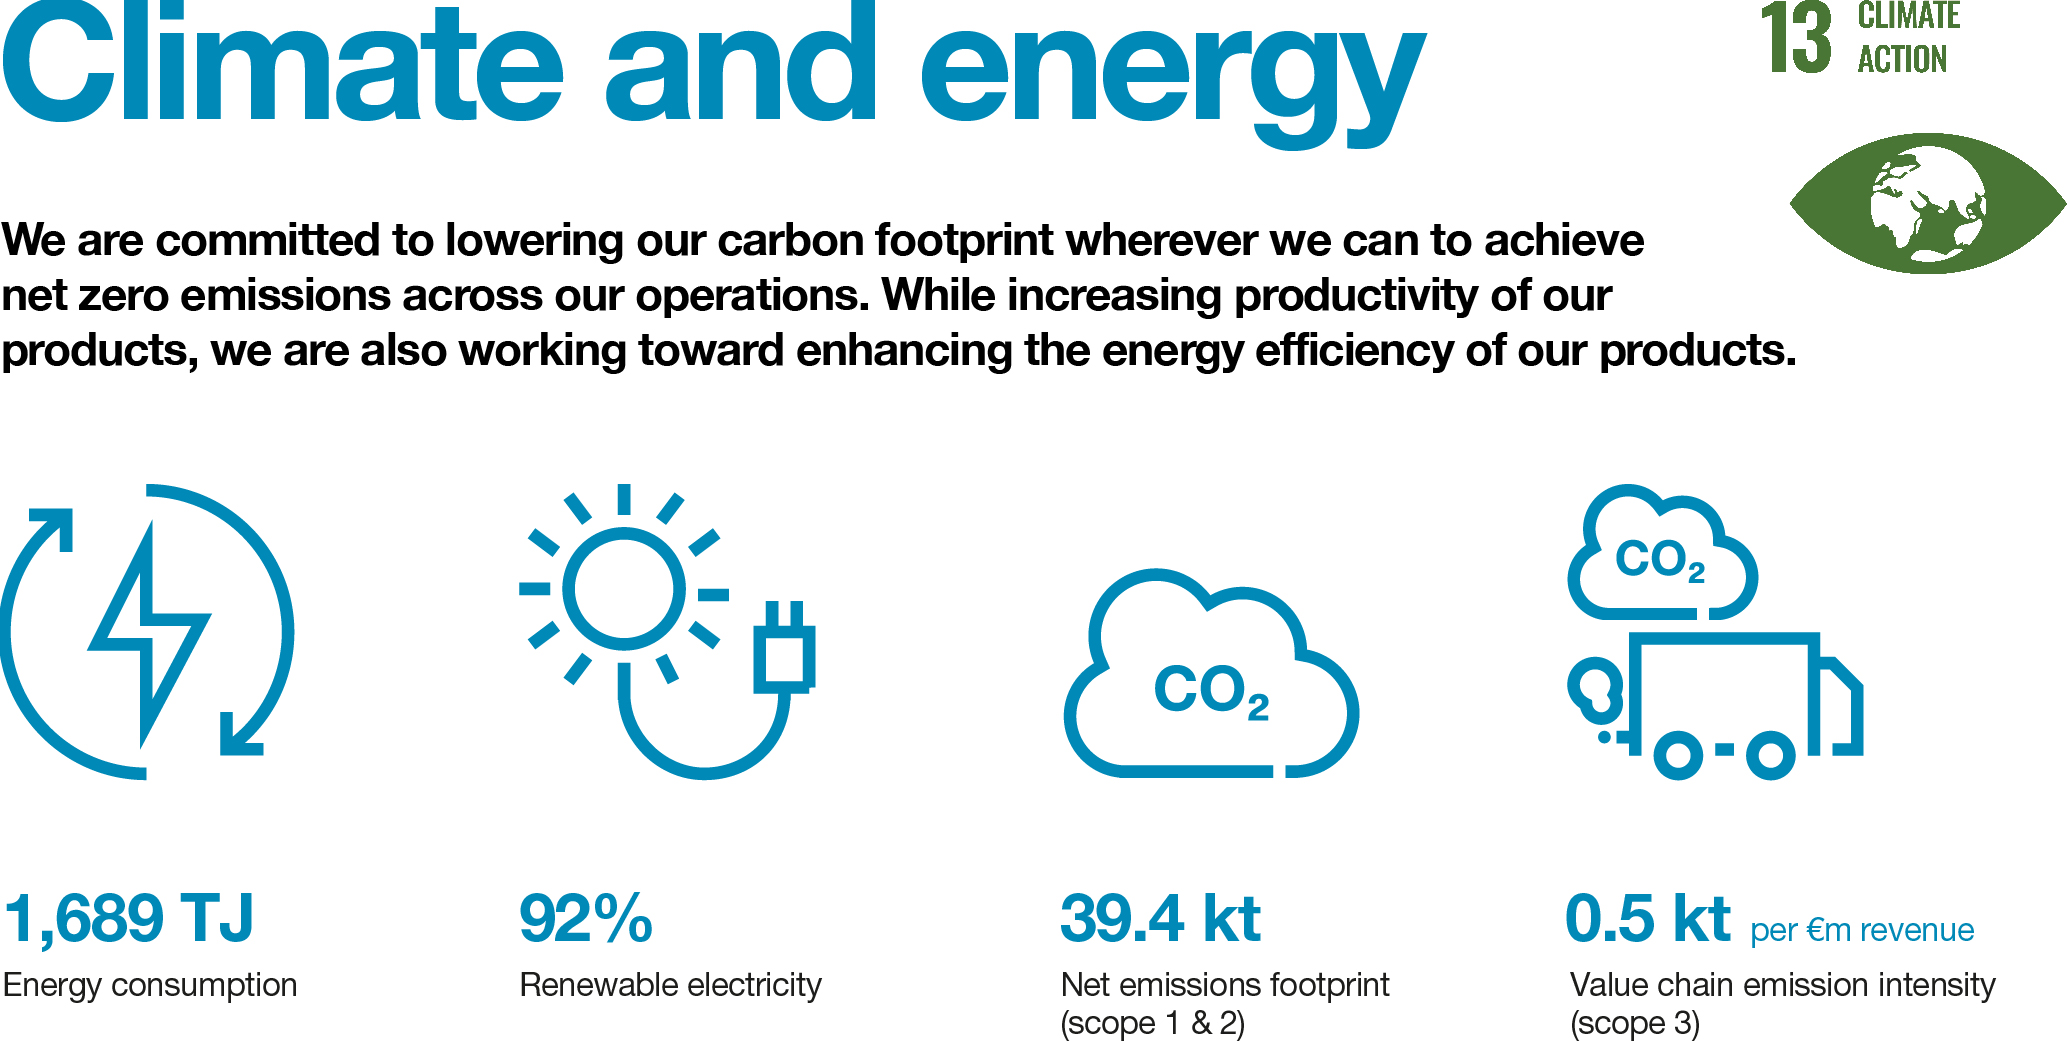
| Climate and energy | | Exhibit index |
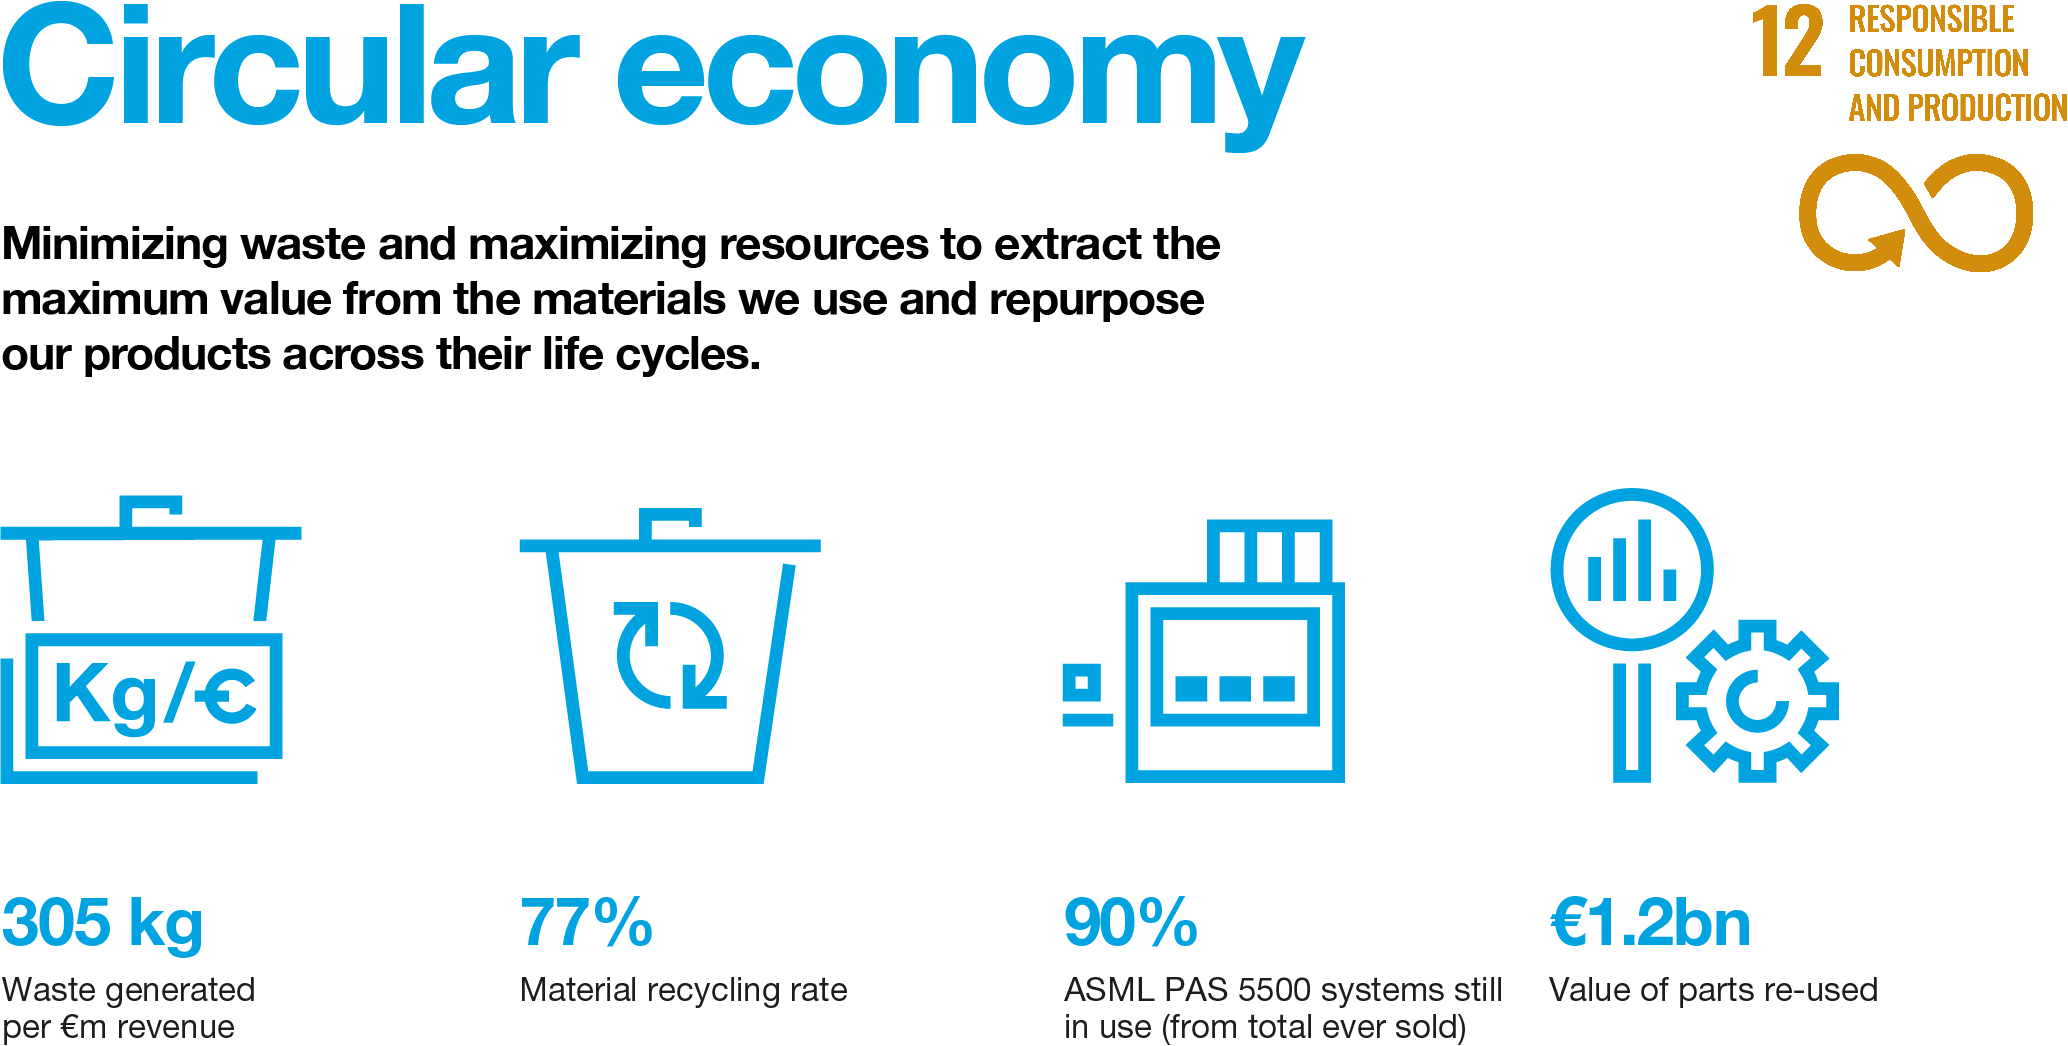
| Circular economy | | |
| Social | | |
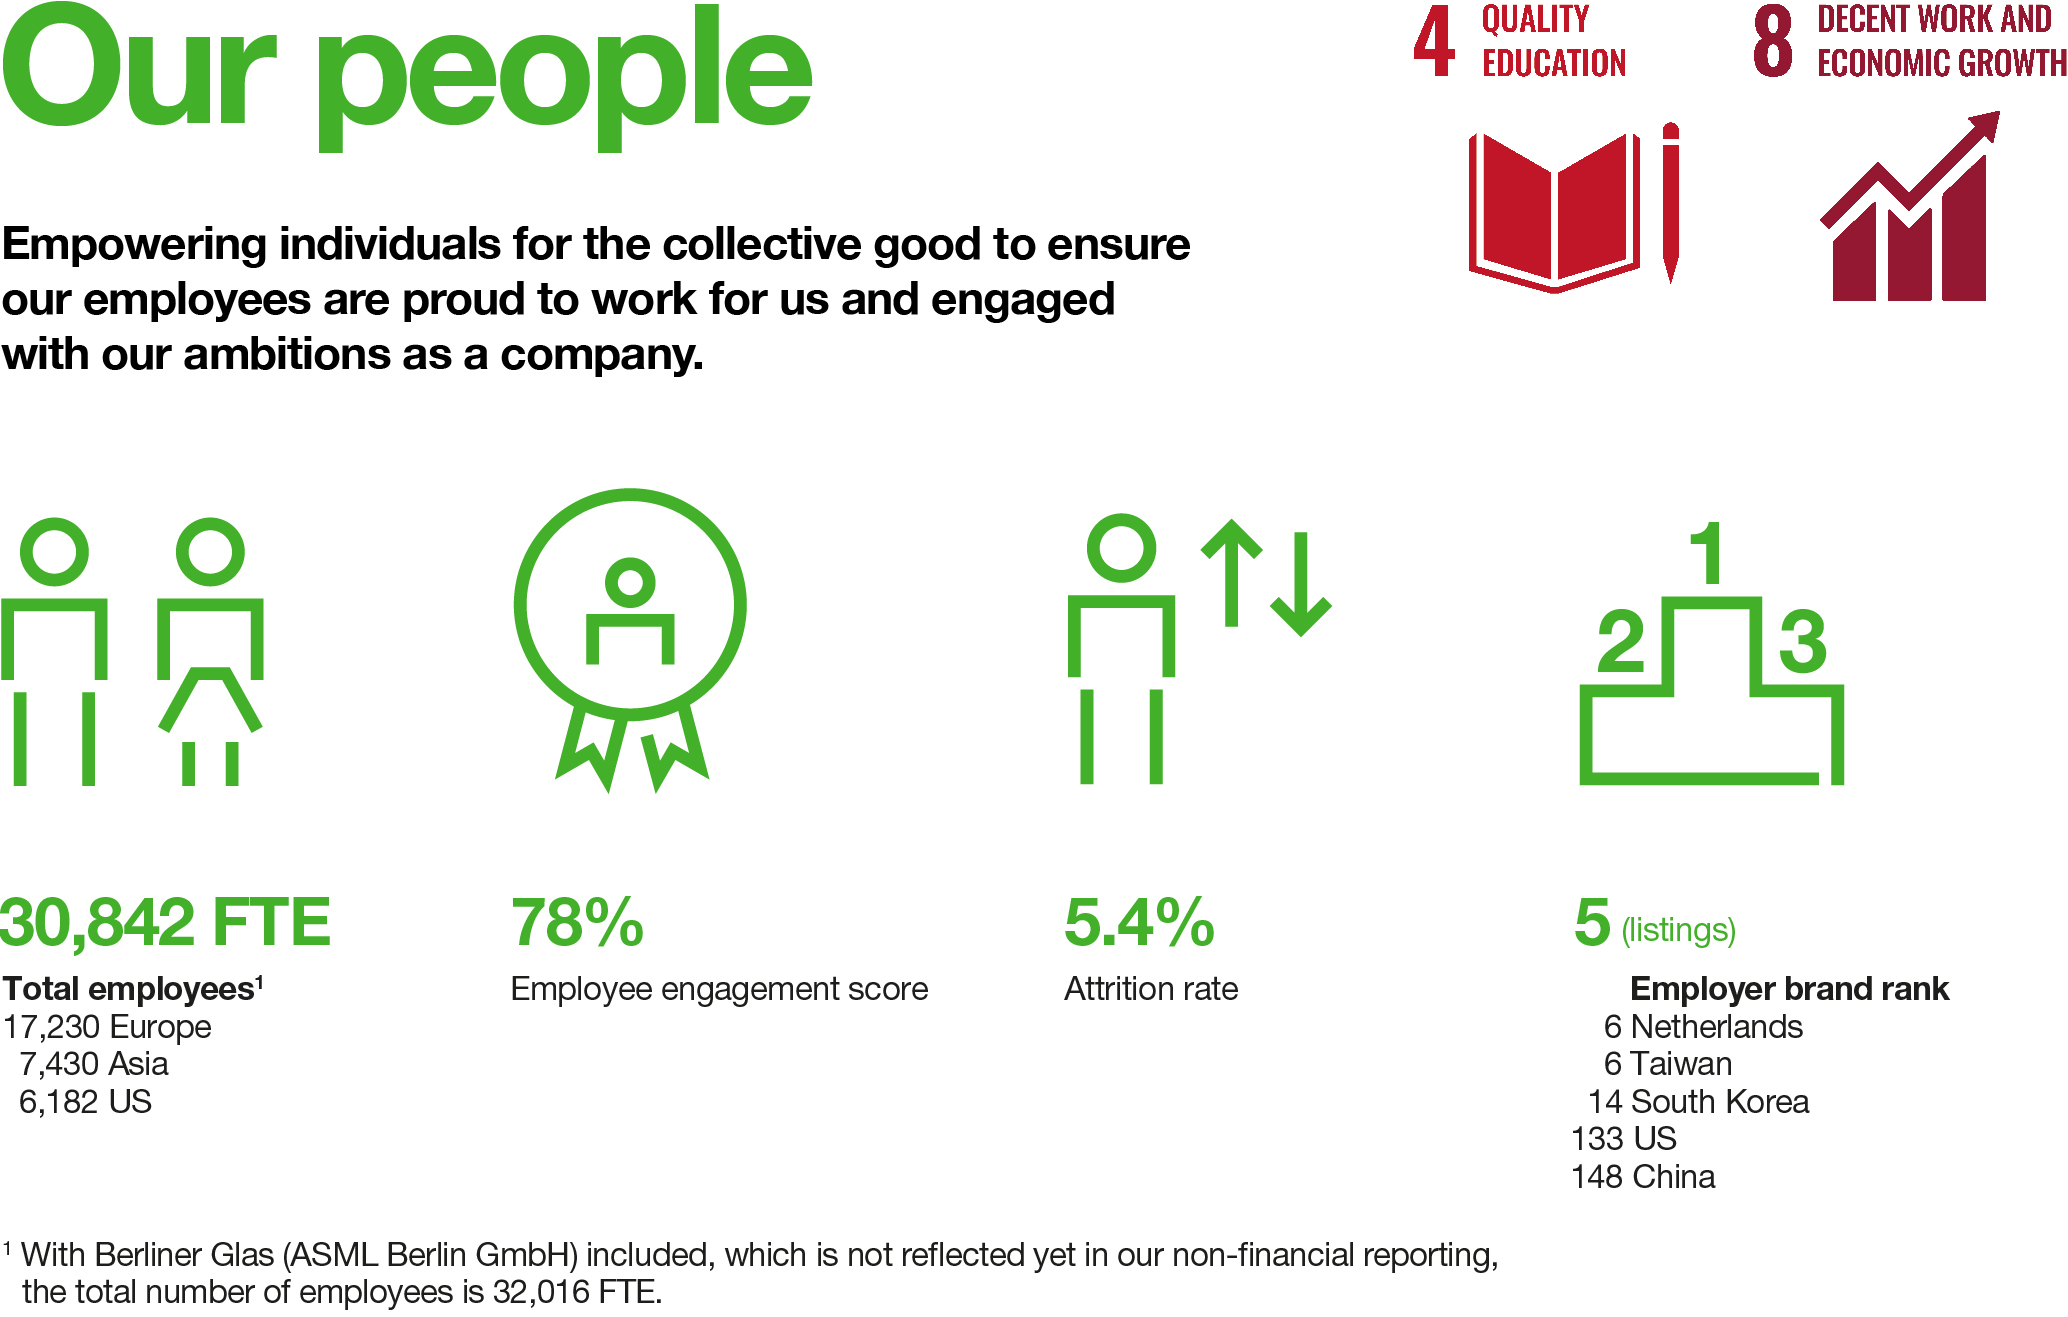
| Our people | | |
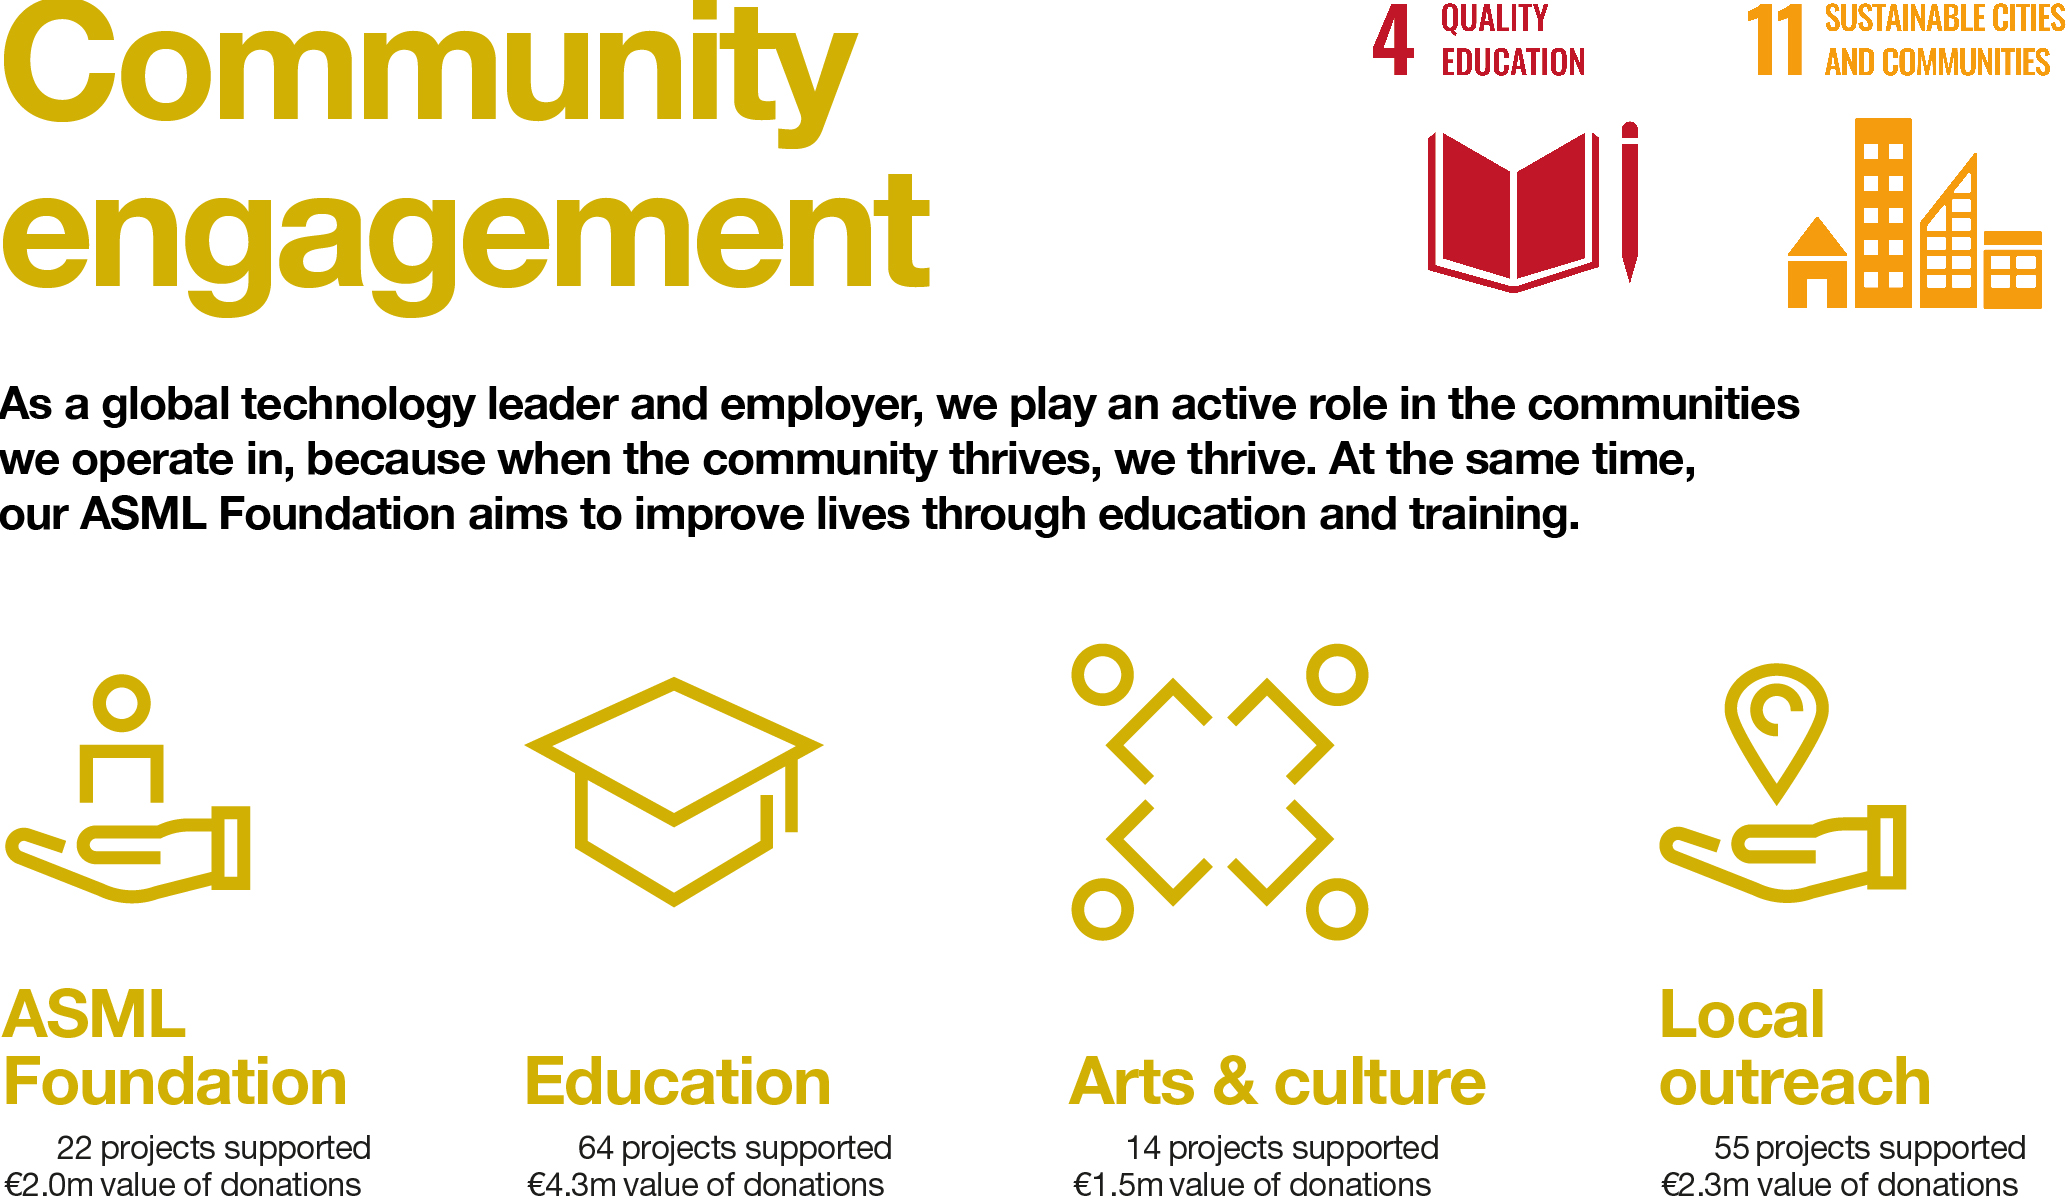
| Community engagement | | |
| Innovation ecosystem | | |
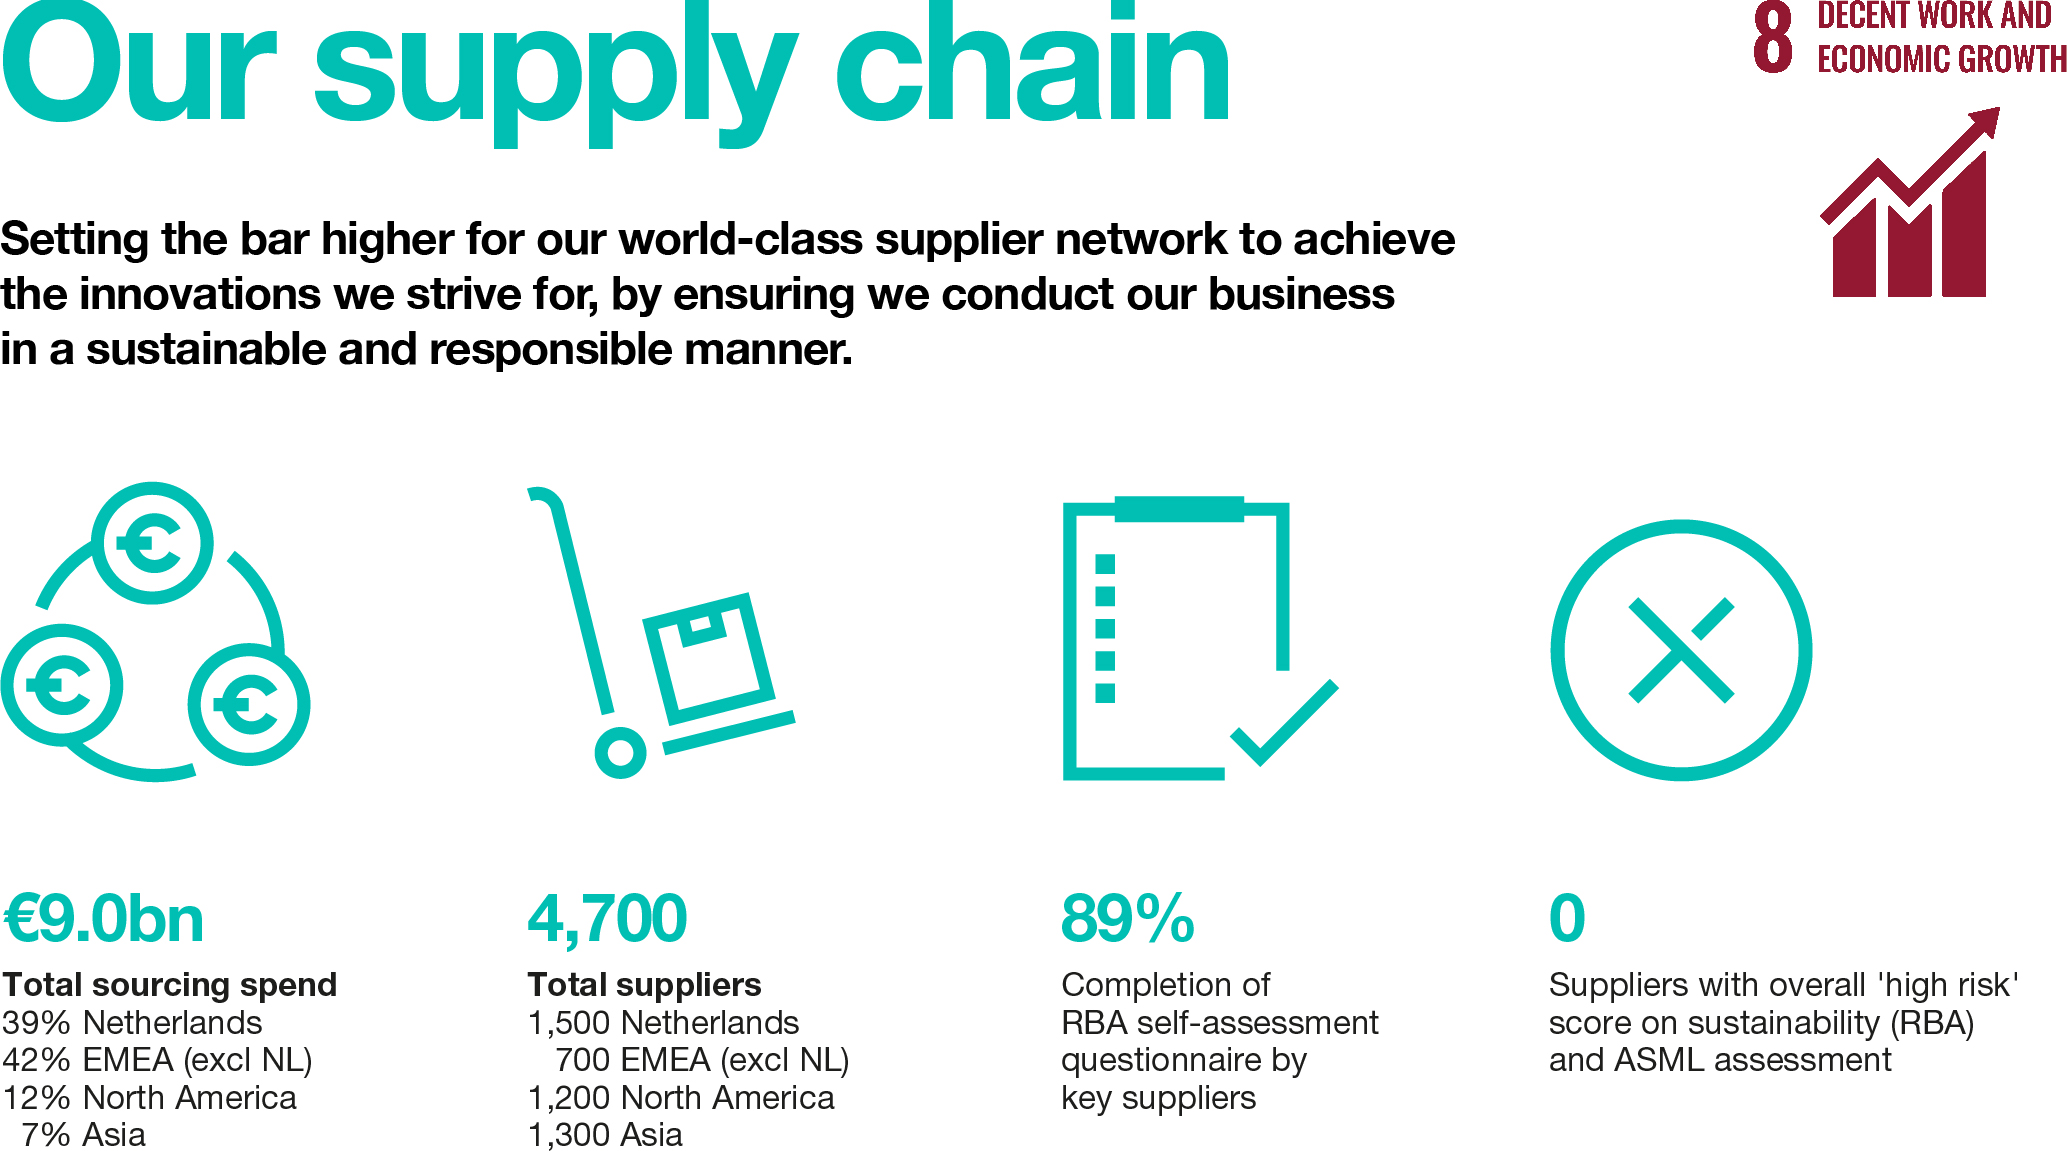
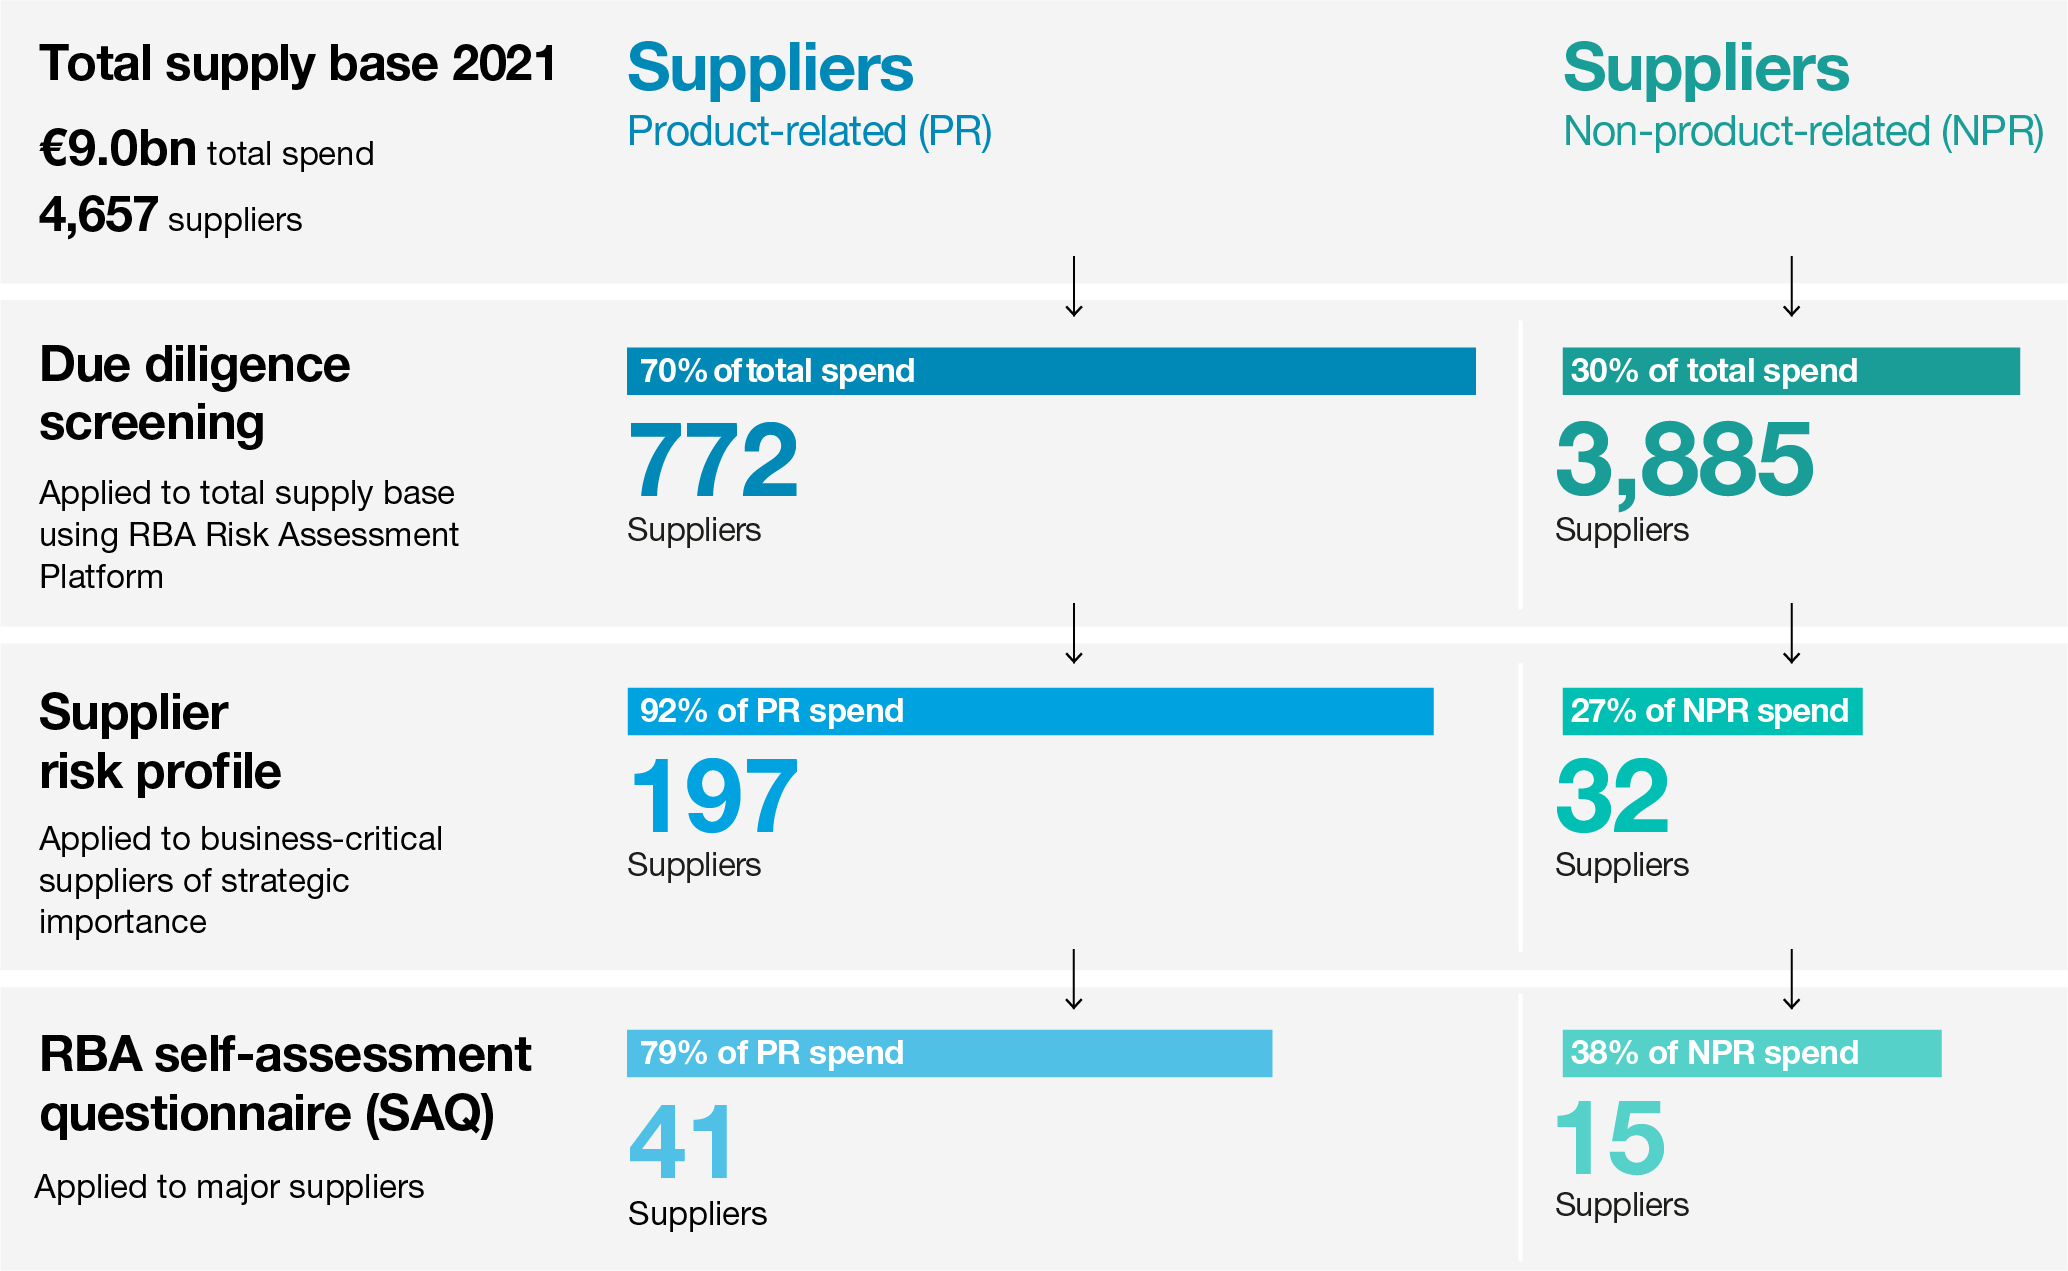
| Our supply chain | | |
| Governance | | |
| Corporate governance | | |
| How we manage risk | | |
| Risk factors | | |
| Responsible business | | |
| | | |
| | | |
A definition or explanation of abbreviations, technical terms and other terms used throughout this Annual Report can be found in the chapter Definitions. In some cases numbers have been rounded for readers' convenience.
This report comprises regulated information within the meaning of articles 1:1 and 5:25c of the Dutch Financial Markets Supervision Act (Wet op het Financieel Toezicht).
In this report the name ‘ASML’ is sometimes used for convenience in contexts where reference is made to ASML Holding N.V. and/or any of its subsidiaries, as the context may require.
References to our website in this Annual Report are for reference only and none nor any portion thereof are incorporated by reference in this report.
© 2022, ASML Holding N.V. All Rights Reserved.
ASML ANNUAL REPORT 2021 3
Special note regarding forward-looking statements
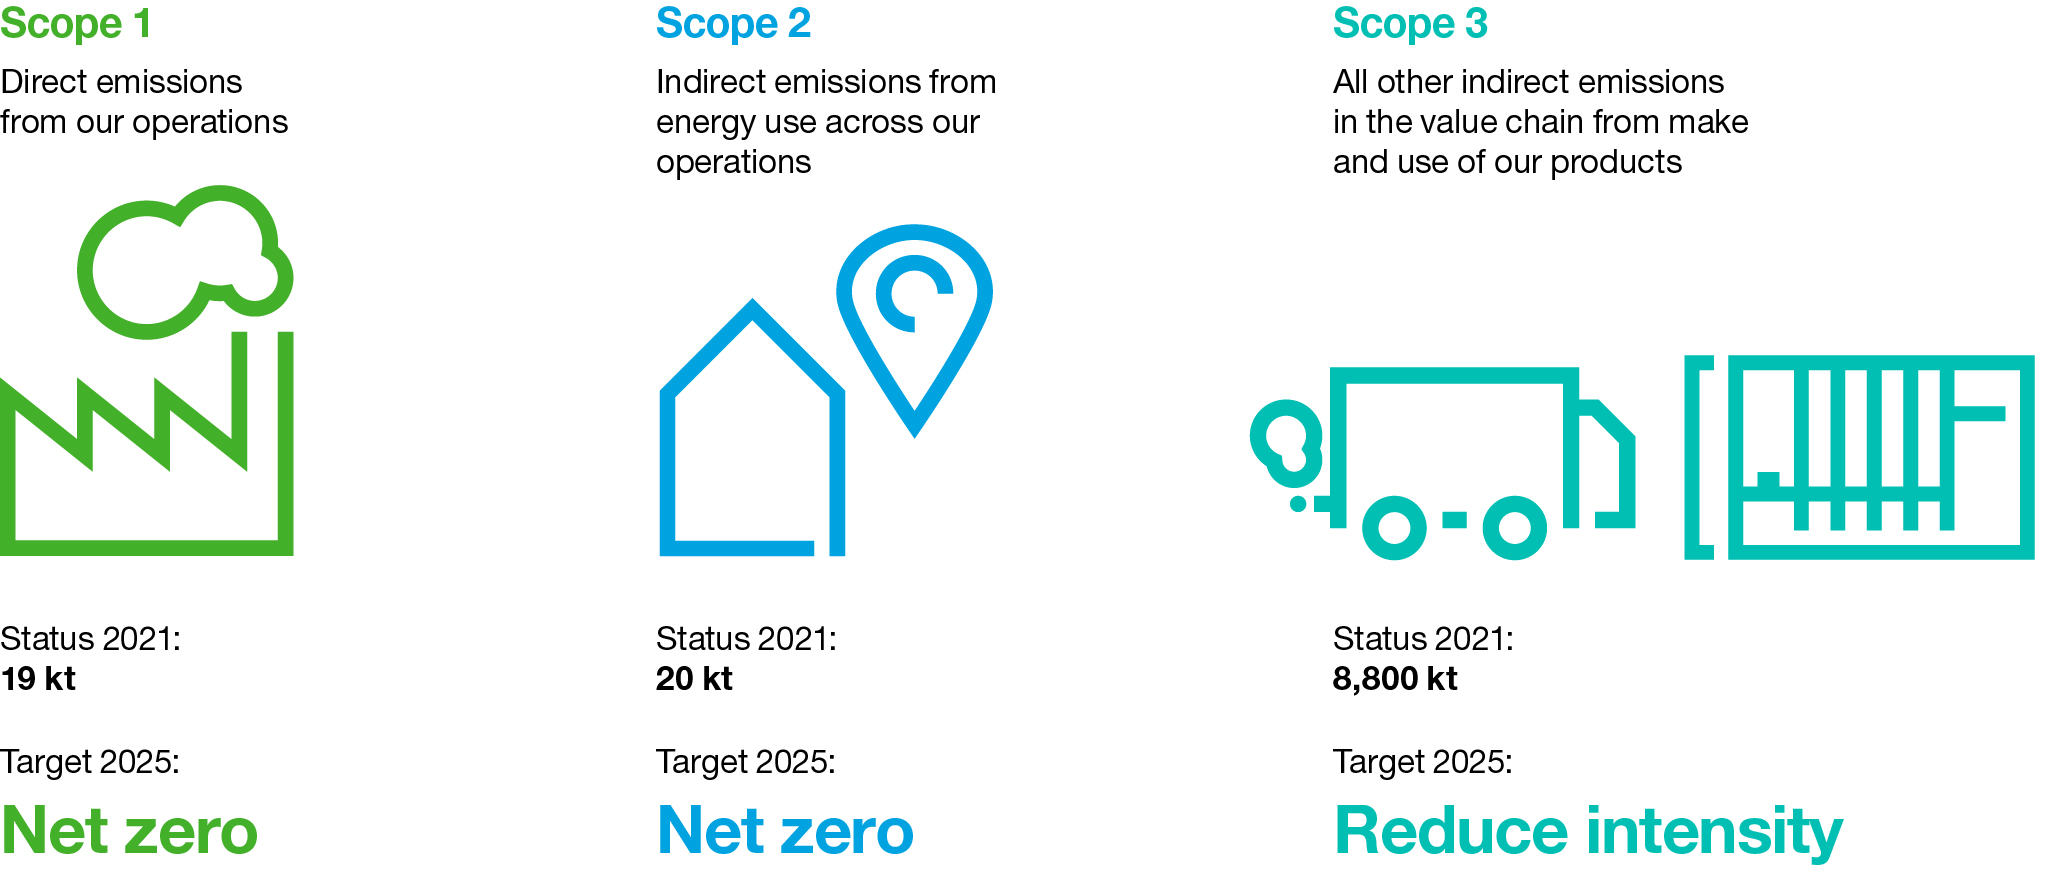
In addition to historical information, this Annual Report contains statements relating to our expected business, results projections, business trends and other matters that are "forward-looking" within the meaning of the Private Securities Litigation Reform Act of 1995. You can generally identify these statements by the use of words like "may", "will", "could", "should", "project", "believe", "anticipate", "expect", "plan", "estimate", "forecast", "potential", "intend", "continue" and variations of these words or comparable words. They appear in a number of places throughout this Annual Report and include statements with respect to our expected trends and outlook, strategies, corporate priorities, expected semiconductor industry trends, R&D and capital expenditures and 2030 market opportunities and roadmap and revenue potential and other statements under the section titled “Semiconductor industry trends and opportunities”, expected trends in markets served by our customers, expected market growth and drivers of such trends and growth, expected financial results, including expected sales, service revenue, expected trends in working capital, gross margin, expected capital expenditures, R&D and SG&A expenses, cash conversion cycle, target and expected effective annualized tax rate, sales targets and outlook for 2022 and other statements under "-Trend Information", annual revenue opportunity and potential and growth outlook for 2025, expected growth in 2022, outlook for 2025 and 2030 and other statements under the section titled “Long-term growth opportunities”, expected continued growth in free cash flow generation, investments in the future and cash returned to shareholders, our Strengths, Weaknesses, Opportunities and Threats (SWOT), expected demand for upgrades, semiconductor industry dynamics and industry opportunities, expected trends in customer demand and demand for particular systems and upgrades and expected trends in end markets, including Memory, Logic and Foundry, including the continuation of investment by Logic customers in ramping new nodes and stronger lithography demand from memory customers, expected benefits of High-NA and planned target to start shipment of High-NA systems and high-volume production of systems using High-NA by 2025-2026, market opportunities for semiconductor industry end markets, expected innovation drivers, expected drivers of long-term stakeholder value, expected trends in DUV systems revenue, expected DUV sales and the expectation that DUV will continue to drive value for our customers and be used in production in most layers of their chips, expected benefits of Holistic Lithography and expected installed based management revenues, our supply chain strategies and goals, customer, partner and industry roadmaps, ASML’s applications business, expected development of High-NA and its benefits, including the expected timing for development of future generation EUV systems, expected growth in EUV sales compared to sales of DUV, expected benefits of the indirect interest in Carl Zeiss SMT GmbH and the acquisition of Berliner Glas, expected EUV adoption, expected EUV margins and margin improvement in our systems and service via cost reduction and value delivery, expected productivity and benefits of our tools, systems, and projects, EUV productivity targets and goals, potential future innovations and system performance, expected shipments of our tools and systems, including demand for and timing of shipments, statements with respect to DUV and EUV competitiveness, the development of EUV technology and EUV industrialization, expected productivity upgrade releases, enabling high-volume production of next generation chips and expected designs of such chips and their benefits, and revenue recognition, predicted growth in wafer production, sustainability targets, goals and strategies, shrink being a key driver supporting innovation and providing long-term industry growth, lithography enabling affordable shrink and delivering value to customers, environmental, diversity and sustainability strategy, ambitions, goals and targets, including circular procurement goals, targeted greenhouse gas emission and waste reduction, recycling and refurbishment initiatives, investments and goals and energy-saving strategies and targets, including statements on targeting zero carbon emissions and indirect emissions from energy use across operations and reducing intensity of all other emissions in the value chain from the making and use of ASML’s products by 2025, charity goals, the impact of the fire at our facility in Berlin on our production, repair center expansion and targets, our expectation of the continuation of Moore’s Law and that EUV will continue to enable Moore’s Law and drive long-term value for ASML well beyond the current decade, tax strategy, capital allocation policy, dividend policy, our expectation to continue to return cash to our shareholders through share buybacks and dividends including our proposed dividend for 2021 and statements relating to our share buyback program for 2021-2023, and statements with respect to the expected impact of accounting standards.
These forward-looking statements are not historical facts, but rather are based on current expectations, estimates, assumptions and projections about the business and our future financial results and readers should not place undue reliance on them. Forward-looking statements do not guarantee future performance, and actual results may differ materially from projected results as a result of certain risks, and uncertainties. These risks and uncertainties include, without limitation, those described under How we manage risk - Risk factors. These forward-looking statements are made only as of the date of this Annual Report. We do not undertake to update or revise the forward-looking statements, whether as a result of new information, future events or otherwise.
ASML ANNUAL REPORT 2021 4
Message from the CEO
Peter Wennink (President, Chief Executive Officer and Chair of the Board of Management)
Dear Stakeholder,
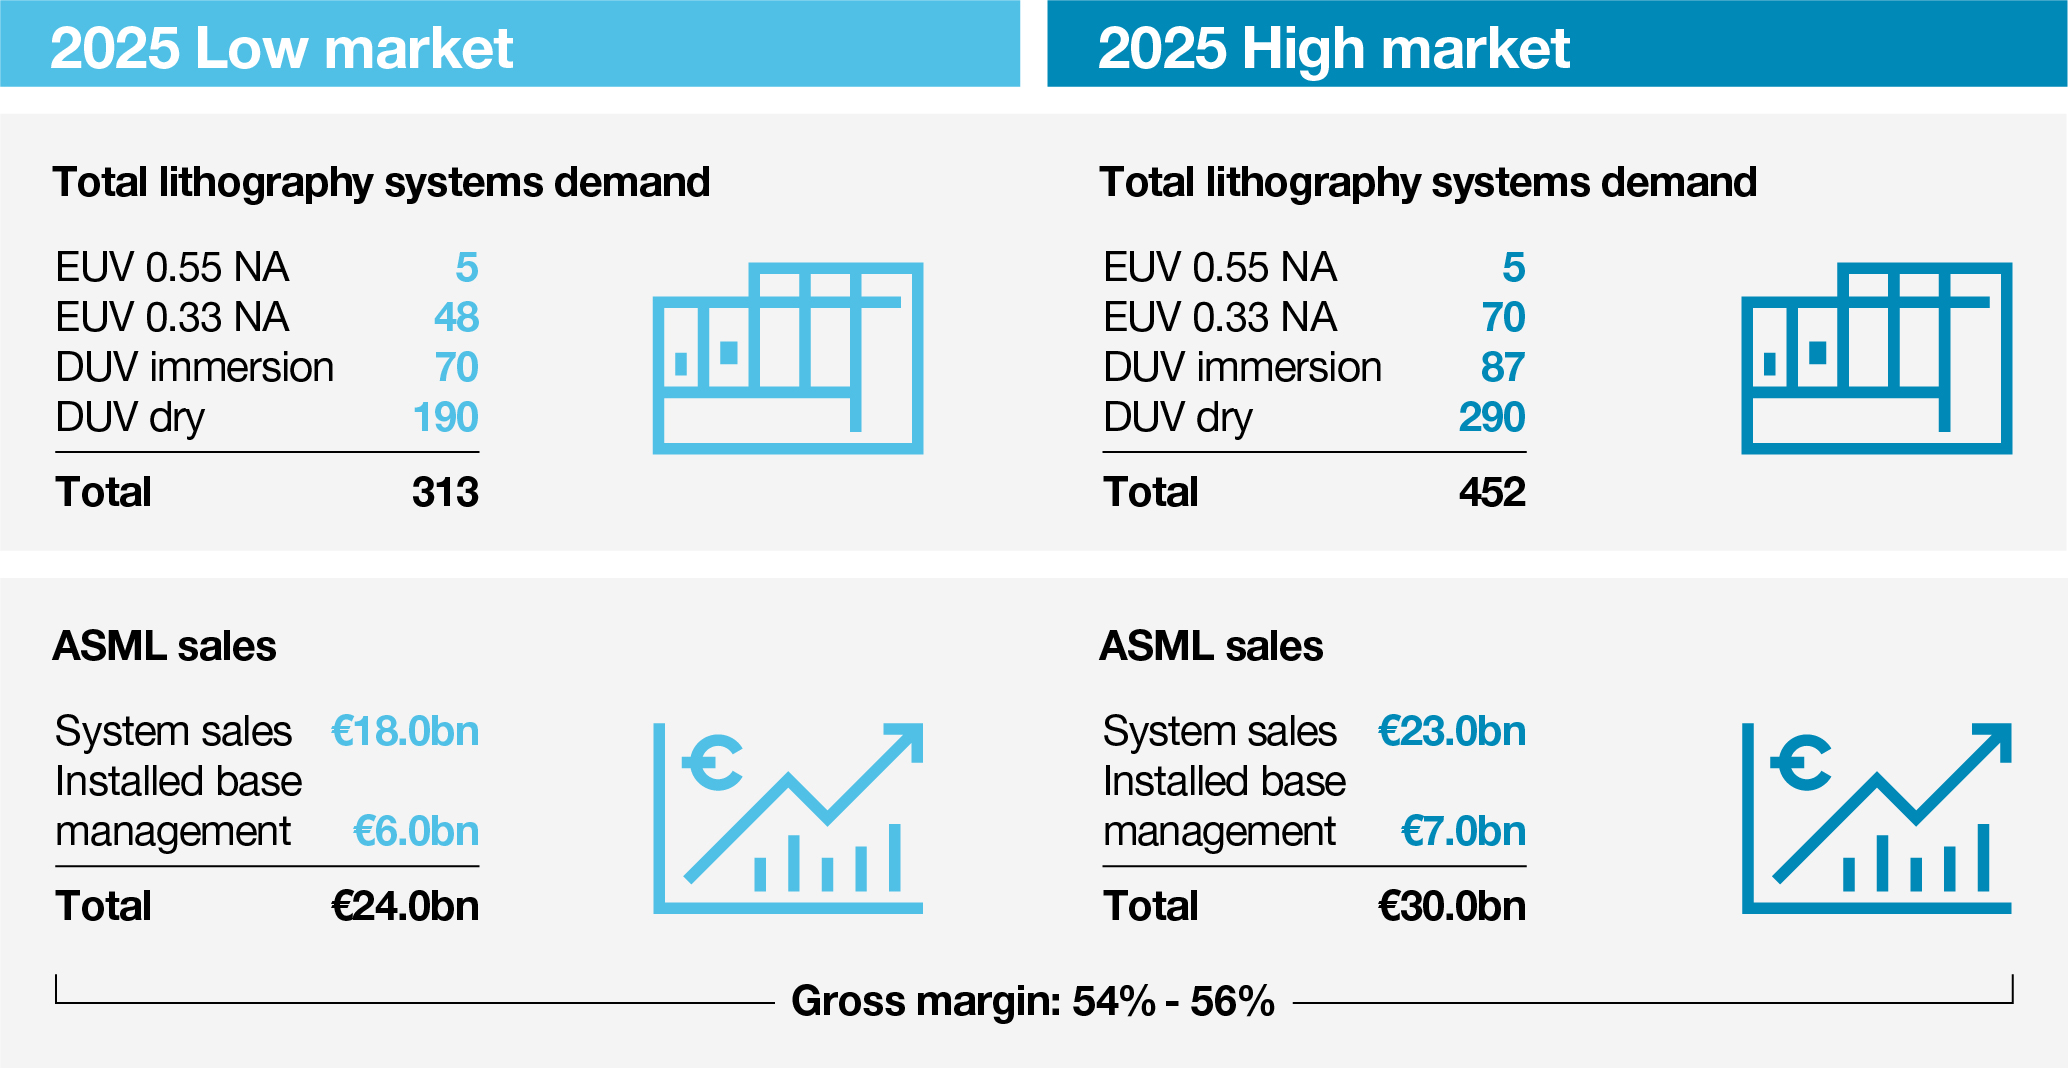
2021 was a very challenging year, with strong growth in a dynamic environment. The semiconductor industry has reached new records of output and sales amid an ongoing global pandemic while still being unable to satisfy the demand for semiconductors. Industries around the world are severely affected by this lack of supply. And despite these challenging circumstances, I’m proud to say that at ASML we continued to grow and have welcomed many new colleagues. ASML reached €18.6 billion in net sales, and we welcomed our 30,000th employee in Giheung, South Korea. By now we’re at over 32 thousand people, and we expect that growth to continue. This is all due to the significant continued growth of our industry, driven by the accelerated digital transformation, of course partly due to the effects of the pandemic and the transition to working from home. In addition to this, we are witnessing a stronger-than-expected growth of Internet of Things (IoT) applications fueling the need for more and more distributed computing solutions. This global trend made us take another look at our future potential scenarios and as a result, we see an opportunity to achieve a step-up in our previously communicated revenue potential, which is now at €30 billion based on a high-market scenario in 2025.
None of this would be possible without the people at ASML and our partners. First of all our people – with their creativity, perseverance, resilience and ingenuity in difficult times, they are crucial to the success of our business. In addition, we rely on partnerships with our customers as well as partnerships with our dedicated suppliers, despite the setbacks they faced during the COVID-19 crisis. We rely on national and local governments to facilitate a social and economic infrastructure that allows us to be successful. We value our partnerships with research institutions who, like us, understand the importance of innovation and education. And not to forget our shareholders, who provide us with the backing to keep executing our technology innovation roadmap, and finally, our partnerships with the communities around us, without whom we would not thrive.
Global megatrends are driving growth in the semiconductor industry
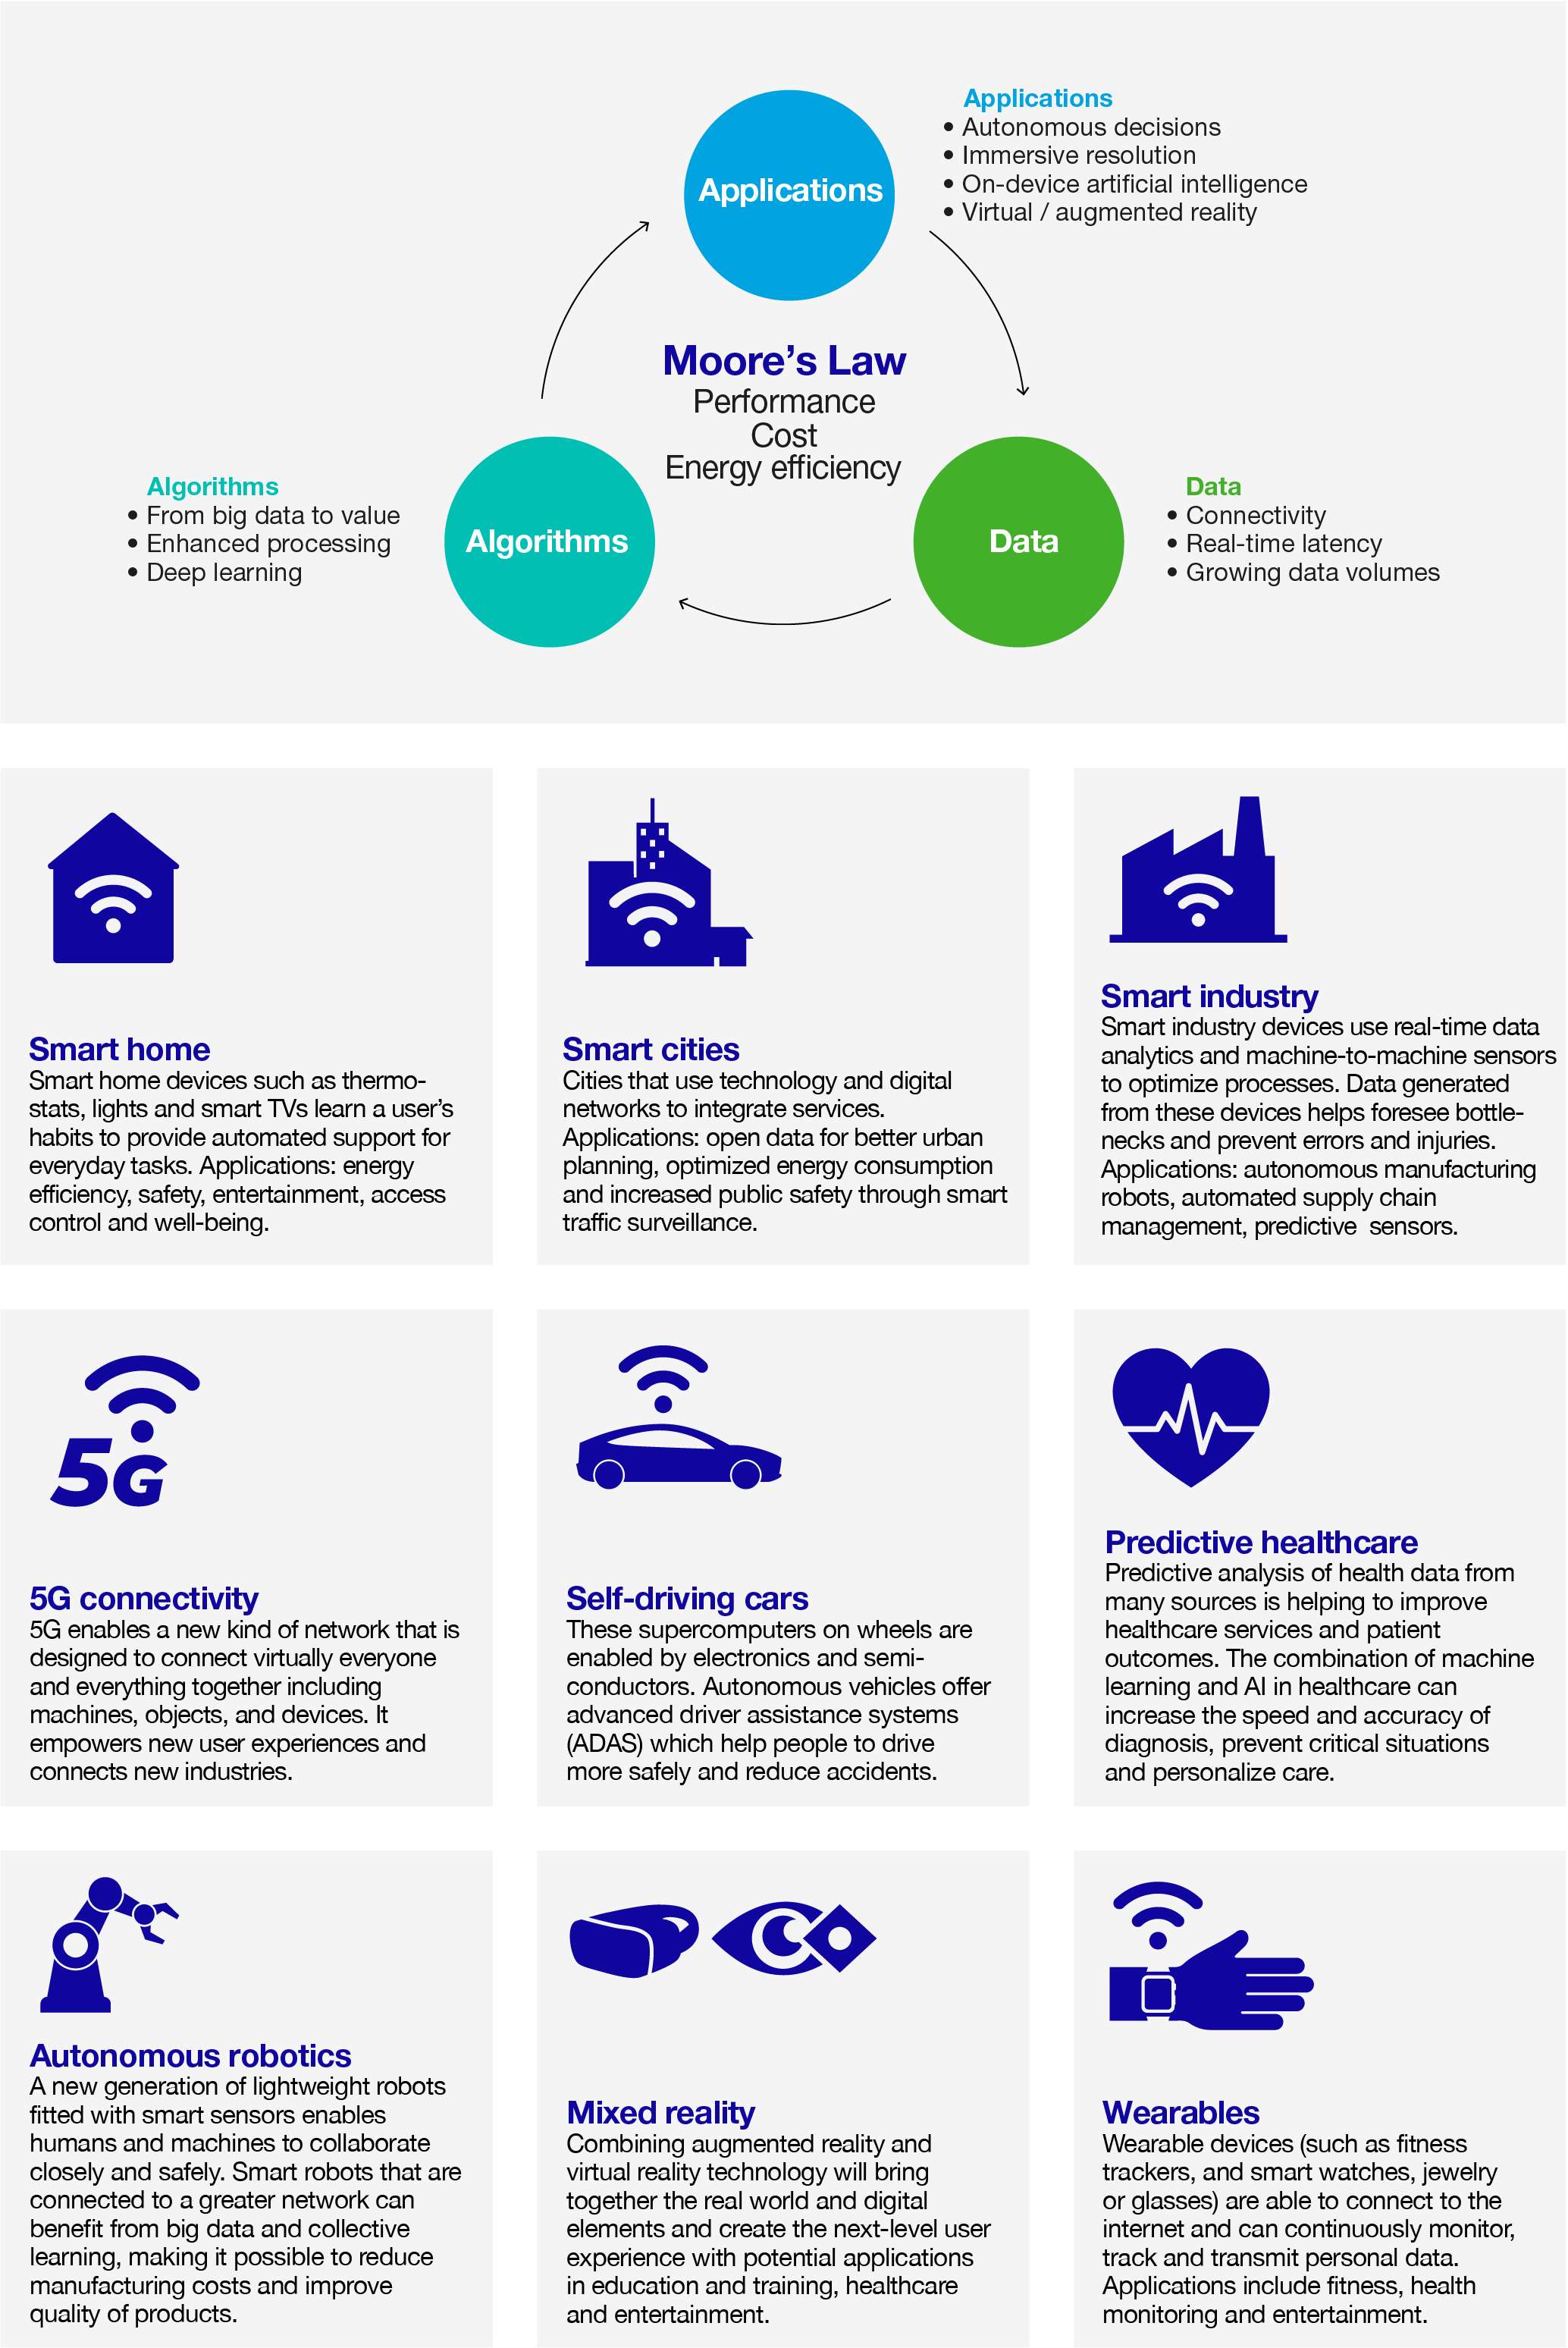
There are several megatrends in the electronics industry that are shaping our digital, connected world and are expected to continue to fuel growth across the semiconductor market, such as artificial intelligence, 5G, virtual reality, gaming, simulation and visualization applications, and the intelligent cloud and edge. With a growing number of mobile and sensor-enabled applications and services, our society will rely more and more heavily on distributed computing and storage solutions. The electronics industry is booming – there are around 40 billion connected devices in use today, and that number is expected to grow to 350 billion in the next ten years based on external source data.
The most important end markets driving ASML’s growth are the smartphone market and the data center, server and storage market, but at the same time we are also seeing a huge increase in microchip demand in the automotive and industrial electronics markets.
Mature solutions are in demand
Another aspect of the growth we’re seeing today is that it’s not only in the most advanced nodes – a lot of the distributed computing and storage solutions I mentioned above require mature lithography technology to manufacture. We expect that by 2025, about two-thirds of our total system sales will be EUV and the rest will be DUV and metrology and inspection. This expected EUV percentage is lower than what we predicted in 2018, but that doesn't mean that the EUV market has shrunk – as a matter of fact, it is expected to grow. But the DUV and metrology and inspection markets are expected to grow even faster.
Countries are pushing for technological sovereignty
The global pandemic has alerted governments around the world that global supply chains can create significant geographical dependencies on services, raw materials and end products. Governments increasingly realize that this now also turns out to be true
ASML ANNUAL REPORT 2021 6
for semiconductors. Since semiconductors play an increasingly important role in the growth and continuity of large industrial complexes and the importance of the semiconductor industry is likely only going to increase, governments have turned their attention to securing sufficient semiconductor supply to support their local industries, creating higher levels of technological sovereignty and planning significant investments in the semiconductor industry. The US, China and the EU, as well as Japan and South Korea, are expected to nearly double the industry’s (2021) annual capital expenditures (CAPEX) of $150 billion based on external source data.
We are aware that this has created concerns about potential oversupply. However, we believe that the significant growth prospects of the semiconductor industry do require substantially more capacity and that given the high levels of capital expenditure to support all this, industry partners will apply sufficient effort to sustain an accessible and efficient innovation ecosystem.
Growing into the next decade
We believe that the advantages of scaling as expressed by Moore’s Law will continue throughout this decade and beyond. We will therefore relentlessly invest in innovation. In addition, we strive to ensure that ASML and its supply chain will be able to fulfill the increasing demand for more wafers to support advanced and mature technology. We will do this by increasing the productivity of all our machine types and by adding more manufacturing capacity.
To increase our own production capacity, we will focus on building more machines by driving down cycle time for both EUV and DUV, on adding more people and tooling, and on increasing our production space. Together with our supply chain partners, we are actively adding capacity to meet future customer demand.
Our product portfolio is very much aligned with our customers’ roadmaps. We will continue to deliver cost-effective solutions that provide value in EUV, in DUV, in applications, metrology and inspection, and in installed base management.
With great influence comes great responsibility
ASML operates in an industry that has considerable innovation power. Digital technology itself can help drive societal progress and has the potential to help cut global greenhouse gas emissions. ASML’s increasingly advanced lithography technology helps our customers to continue to produce microchips – with fewer materials and less energy consumption – that are three times more energy-efficient every two years.
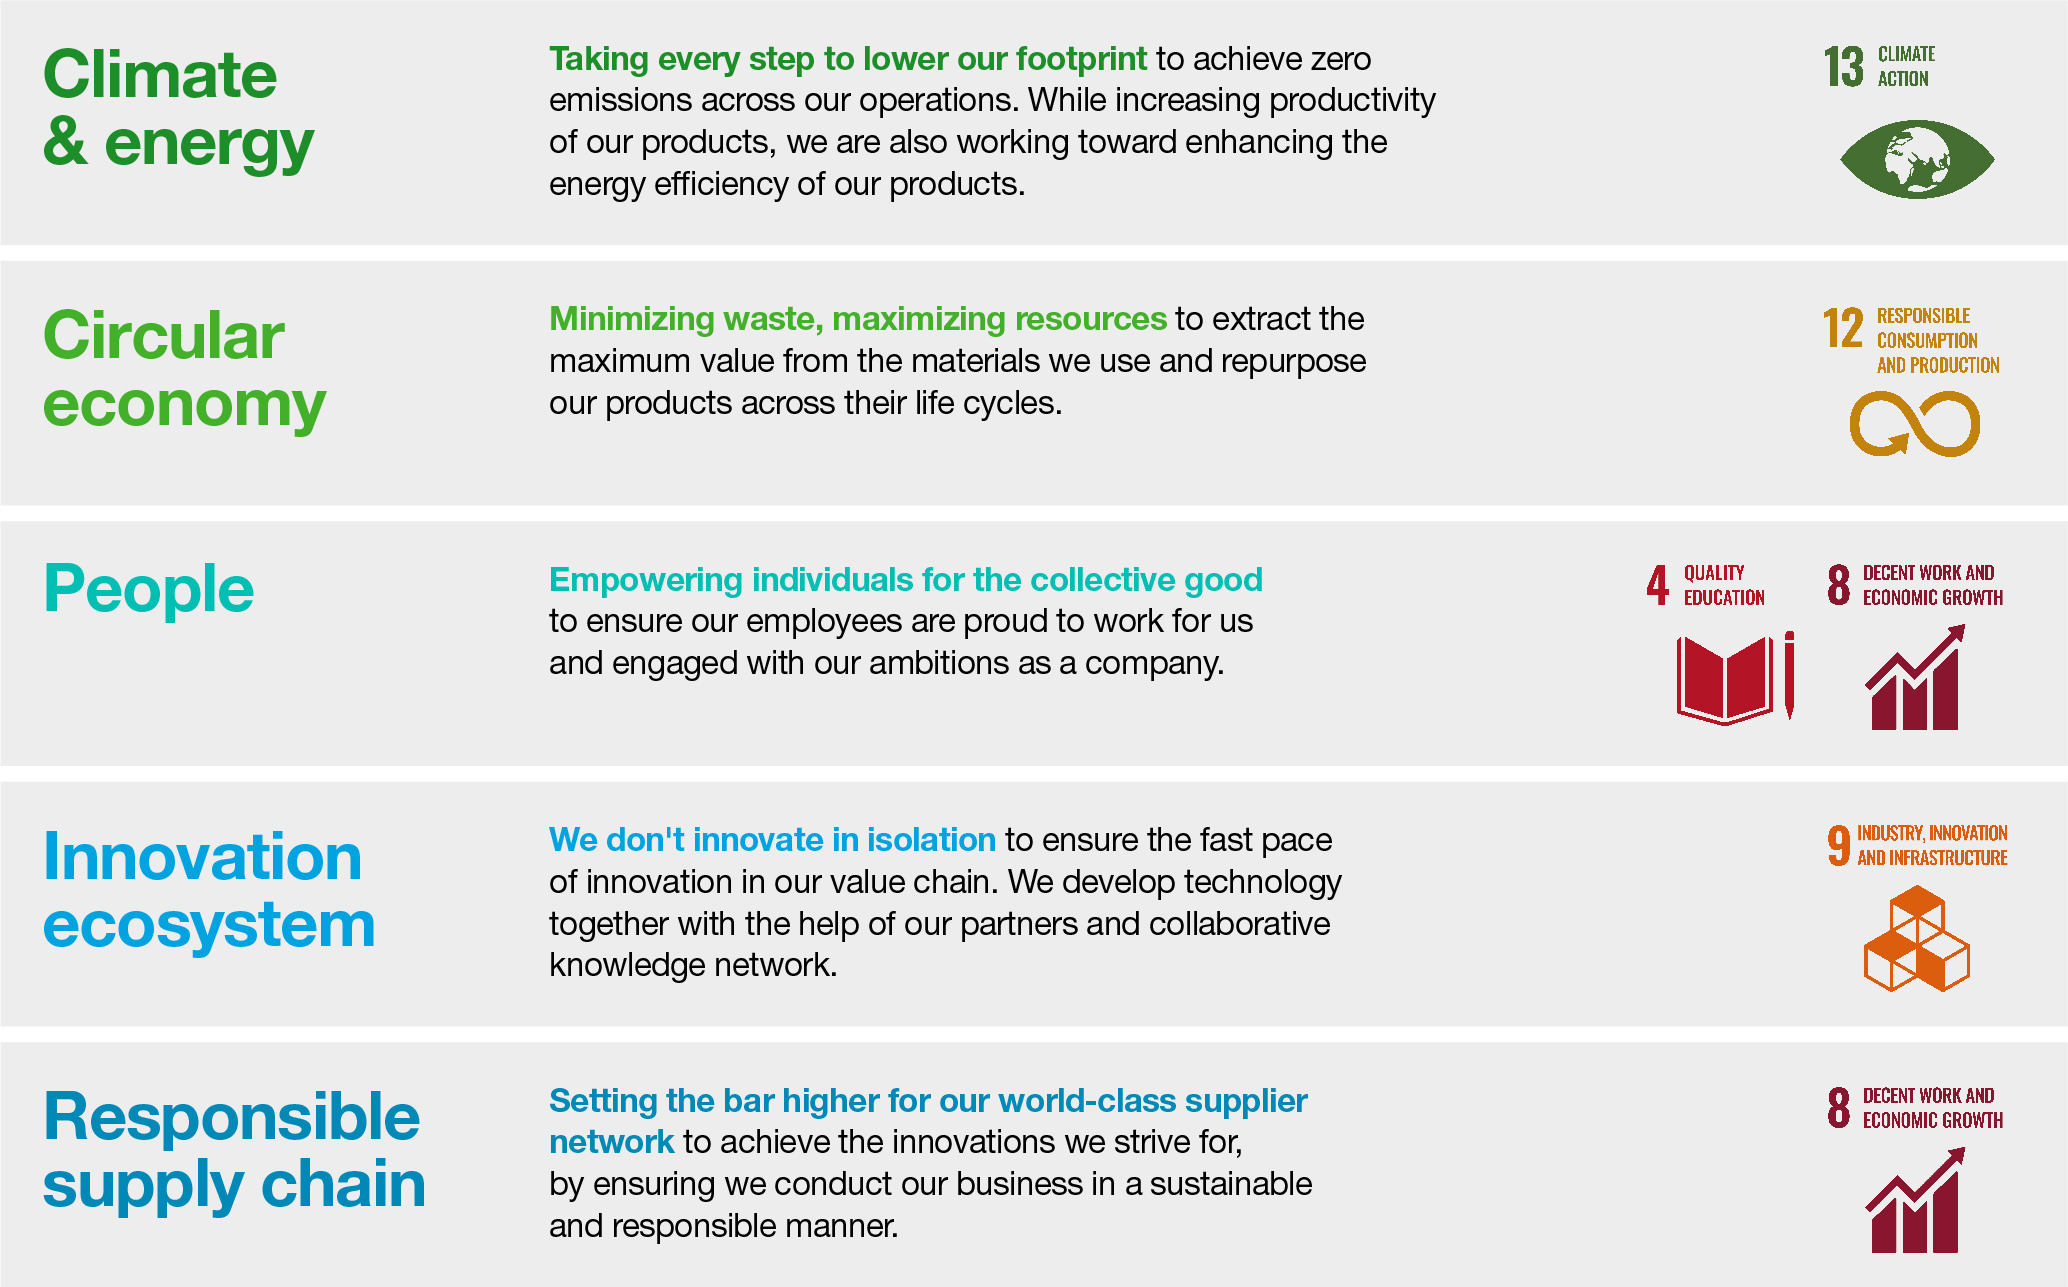
We clearly recognize that climate change is a global challenge that requires urgent action by everyone, including us. That is why we are stepping up our focus on ESG (environmental, social and governance) sustainability, which we have expanded from five focus areas to a nine-part strategy aimed at contributing to the United Nations’ Sustainable Development Goals. We’re doing this because we recognize ESG’s increasing importance to all our stakeholders, but first and foremost because it’s simply the right thing to do.
Driven by our values and commitment to corporate responsibility, we want to have a positive role in society – for our employees, the communities around us, and everyone involved in our innovation ecosystem and supply chain. We are expanding on our community engagement, and with our new diversity and inclusion strategy, we want to improve our performance in this regard.
Building on our achievements so far, we have increased our environmental ambitions. Our climate goal is to strive toward zero waste disposal by 2030 and net zero value chain emissions by 2040, focusing on our manufacturing and buildings, business travel and commuting, and on our supply chain and product use.
Again, we won’t be able to achieve this alone, but will rely on strong and successful ongoing collaboration with our partners, suppliers and customers.
Thank you
The last couple of years have posed new challenges to all of us that have required agility, patience and perseverance to overcome. As a global society we are faced with unparalleled challenges, but with its great workforce, partnerships and innovative power, ASML is looking toward the future with confidence, preparing for even more sustainable growth. We can only do that by continuing to be a trusted partner for all our stakeholders – we would like to thank them for their commitment and support. As I have said many times before, we are looking at a bright future, but we cannot do this alone.
Peter Wennink
Chief Executive Officer
ASML ANNUAL REPORT 2021 7
ASML ANNUAL REPORT 2021 8
Our purpose
For all the ways we have moved forward as a society, the world still faces crucial challenges for the future. We must change how we think and act on themes that impact everyone, such as energy use, climate change, mobility and access to healthcare and nutrition.
At ASML, we believe that the microchip industry is in a unique position to help tackle these challenges. From artificial intelligence (AI) to a vast internet of things (IoT), microchips are at the heart of modern technology. So whether it’s transitioning to sustainable energy, improving global health, increasing the safety and efficiency of transport, tackling pollution, bridging the digital divide, or feeding eight billion people without exhausting the earth’s resources, our vision is that we will enable the groundbreaking technology that will help solve some of humanity’s toughest challenges.
As the innovation leader that makes vital systems for chip manufacturing, we are proud to play our role as technology enabler in the innovation ecosystem of the semiconductor industry. We can only do this if we continue to challenge the status quo, tap into the collective knowledge of our global ecosystem and create an environment where people can contribute, learn and grow. At ASML, we believe our purpose is to unlock the potential of people and society by pushing technology to new limits.
The long-term growth of the semiconductor industry is based on the principle that the energy, cost and time required for electronic computations can be reduced by shrinking transistors on microchips. One of the main drivers of shrink is the resolution that lithography systems can achieve, which is mainly determined by the wavelength of the light used and the numerical aperture of the optics. A shorter wavelength – like a finer brush used for painting – can print smaller features. A larger numerical aperture can focus the light more tightly, which also leads to better resolution. To enable shrink, what we do – lithography – is key.
We are a focused supplier of holistic lithography solutions to all of the world’s major chipmakers. Our mission, together with our partners, is to provide leading patterning solutions that drive the advancement of microchips. Through our sustained investment in and dedication to research and development, we seek to innovate at least at the same pace as our customers. We put our innovations in the hands of chipmakers as quickly as possible by engineering in parallel, not sequentially, while ensuring their quality, reliability, manufacturability, and serviceability.
Our core values
To help solve humanity’s toughest challenges while at the same time addressing our own, we must continue to amplify ASML's core values that created our success – challenge, collaborate and care.
We challenge
We challenge boundaries, question the status quo and stand up for the ideas we believe in. We’re comfortable with discussion and debate, because it is often inherent to stress-testing and championing an idea. This is what enables us to push technology forward,
ASML ANNUAL REPORT 2021 10
keep things simple and do things with care and attention. We continue to challenge ourselves to add value for our customers, ensuring that we continually improve across key aspects, such as safety, quality, efficiency and cost.
We collaborate
As a system architect and system integrator, we collaborate to tap into our collective potential. Together with our partners in our ecosystem, we expand our knowledge and skills, learn from each other, and share approaches to deliver the best results. What we do is unique, and we need each other to make it possible. As we continue to grow and our ecosystem of partners expands, this collaborative mindset becomes even more essential to success.
We care
As we push technology further together, we have to do so with care. As an industry leader, we realize that our impact extends from people, to society, to the planet. We care not only for those we work with, but for our customers, suppliers, the world we live in, and the communities where we do business. We believe in integrity and respect for people and their human rights. We take personal responsibility to create a safe, inclusive and trusting environment where people from all backgrounds are encouraged and enabled to speak up, contribute, learn, make mistakes, and grow. We also seek to be clear in how we organize ourselves to achieve our goals, making sure we have a clear framework for what we do and how we do it.
We believe that these values will help our company and our employees to make smart decisions that will benefit all stakeholders. Our purpose and values, together with the great responsibility we have as an industry leader, make us optimistic for the future.
Where we come from
Our company was founded in 1984 in Eindhoven under the name of ASM Lithography, a joint venture between Philips and ASM International. As they moved into their new space near the Philips factories at Strijp-T in Eindhoven, our first employees could never have imagined that in just three decades, ASML would be a global innovation leader.
We’ve grown from our humble beginnings to a global force through relentless focus on innovation, sheer customer focus through tough times, and a willingness to rely on others to come to a better result.
Although we’re constantly looking to the future, where we have come from is just as important to us as we evolve. These pioneering behaviors have been key to our success over the past 37 years, and they’ve become even more important to us as we continue to define our purpose and articulate the values that underpin everything we do. Understanding what made us successful in the past will help us maintain our success in the future.
What guides us
Innovation is rarely a straight line. We've always known that it takes laser focus, multidisciplinary teamwork and a keen eye for how we can best help our customers. And even then, we've had to show grit. It took a decade of tenacity to get our technology off the ground. We've all cared for this company unconditionally and are proudly committed to its success. We believed then as we do now that even the biggest challenge can be overcome through perseverance, if necessary with thousands of people over many years.
We also learned to rely on others to come to a better result – without losing focus. That meant expanding our own knowledge and skills by building an ecosystem of expert suppliers, strategic partners, academia and service providers. We also acquired leading companies with unique technologies that strengthened our ability to deliver better solutions to our customers. We started to see ourselves as architects and integrators, inspiring our partners to innovate on the cutting edge of engineering while sharing risk and reward. And like us, some of our earliest customers are now leaders in the chip industry.
We are geared towards providing long-term value to our customers and other stakeholders. Our direct value chain consists of our R&D partners, supply chain and customers, as well as our own manufacturing and service activities. Together we enable product and service manufacturers, so-called Original Equipment Manufacturers (OEMs), and Original Design Manufacturers (ODMs) to create end-use devices and services for the consumer market.
ASML ANNUAL REPORT 2021 11
Our position in the semiconductor industry
The role of lithography
Lithography is a driving force in the creation of more powerful, faster and cheaper chips. Today’s most advanced processors, based on the Logic N5 node, contain billions of transistors. Shrinking transistors further is becoming increasingly difficult, but we aren’t as close to the fundamental limits of physics as some would think. Next-generation chip designs will include more advanced materials, new packaging technologies, and more complex 3D designs, which will create the electronics of the future.
The manufacturing of chips becomes increasingly complex as semiconductor feature sizes shrink, while the imperative to mass produce at the right cost remains. Our holistic lithography product portfolio helps to optimize production and enable affordable shrink by integrating lithography systems with computational modeling, as well as metrology and inspection solutions. Our computational models enable our customers to optimize their mask design and tape-out time (the time to send the final design to the manufacturer for production). This works through mask-correction software to prepare and modify the design for optimized exposures, while the metrology and inspection solutions help in analyzing and controlling the manufacturing process in real time.
A lithography system is essentially a projection system. Light is projected through a blueprint of the pattern that will be printed (known as a ‘mask’ or ‘reticle’). With the pattern encoded in the light, the system’s optics shrink and focus the pattern onto a photosensitive silicon wafer. After the pattern is printed, the system moves the wafer slightly and makes another copy on the wafer.
This process is repeated until the wafer is covered in patterns, completing one layer of the wafer’s chips. To make an entire microchip, this process is repeated layer after layer, stacking the patterns to create an integrated circuit (IC). The simplest chips have around 40 layers, while the most complex can have over 150 layers. The size of the features to be printed varies depending on the layer, which means that different types of lithography systems are used for different layers – our latest-generation EUV systems for the most critical layers with the smallest features, and ArFi, ArF, KrF and i-line systems for less critical layers with larger features.
Taking a closer look inside a fab
A semiconductor fabrication plant, commonly known as a ‘fab’, is a factory where microchips are manufactured. The making of a microchip involves a multiple-step sequence including lithography to create a pattern in the photoresist and chemical processing steps such as deposition, photoresist coating, ion implantation and etching, during which electronic circuits are gradually created on a silicon wafer.
Microchips are made of layers about 50 to 150 nm thick that are built on the semiconductor substrate one layer at a time. Some microchips can have up to 150 or more layers of varying complexity. Typically, the most complex layers are at the bottom and the least complex at the top. The most advanced chips require EUV and DUV immersion lithography tools to make them. Simpler microchips, such as sensors for IoT applications, can be produced using DUV dry machines.
After adding material for a new layer during deposition, the desired pattern is exposed onto it, which after development leaves lines and geometric shapes positioned precisely in the desired locations. Then the layer is etched, making these designs permanent on the wafer. The entire manufacturing process of microchips – from start to tested and packaged device, ready for shipment – can take between 18 and 26 weeks, depending on their complexity.
The heart of a fab is the cleanroom. All fabrication steps take place here, so the environment is controlled to eliminate dust on a nanoscale. Under the cleanroom floor is the so-called sub fab, which contains auxiliary equipment such as the drive laser. The utility fab – where the pumping and abatement systems for vacuum and cooling are located – is usually found one floor below this.
ASML ANNUAL REPORT 2021 12
Semiconductor manufacturing process
The Rayleigh criterion that drives Moore’s Law
Moore’s Law, a prediction made over half a century ago, sets the pace for our industry. Gordon Moore predicted that computing would dramatically increase in power, and decrease in relative cost, at an exponential pace. In other words, the number of transistors (tiny electrical switches) on an integrated circuit will double every two to three years at the same cost. This opens up two options to make microchips faster and more powerful: by using the same number of transistors on a chip at half the cost, or by doubling the number of transistors at the same cost. Even today, the power of this prediction is the fundamental principle of the semiconductor industry and the driving force for innovations that benefit our daily lives.
ASML ANNUAL REPORT 2021 13
At ASML, our job is to help the industry continue Moore’s Law. Our goal has always been to reduce the critical dimension (CD) – the smallest structure that a lithography system can print. This is defined by the Rayleigh criterion, the equation on which all our innovations are based:
•CD is the critical dimension, a measure of how small the smallest structures are that the lithography system can print.
•λ (lambda) is the wavelength of the light source used and the smaller the wavelength the smaller the structures that can be printed. Our deep ultraviolet (DUV) lithography systems, known as the industry workhorse, dive deep into the UV light spectrum to print the tiny features that form the basis of the microchip. Over the years, ASML made several wavelength steps and our DUV lithography systems range from 365 nm (i-line), 248 nm (KrF) to 193 nm (ArF). With the extreme ultraviolet (EUV) systems, we provide highest-resolution lithography in high-volume manufacturing as these systems make a major step in wavelength. With EUV tin plasma, we generate EUV light which has a wavelength of just 13.5 nm.
•NA is the numerical aperture, indicating the entrance angle of the light – with larger NA lenses/mirrors, smaller structures can be printed. Besides larger lenses, ASML increased the NA of our ArF systems by maintaining a thin film of water between the last lens element and the wafer, using the breaking index of the water to increase the NA (so-called immersion systems). After the wavelength step to EUV, ASML is developing the next-generation EUV systems, called EUV 0.55 NA (High-NA) where we push the numerical aperture from 0.33 to 0.55.
•k1 is a factor relating to optical and process optimizations. Together with our computational lithography and patterning control software solutions, we provide the control loops for our customers to optimize their mask designs and illumination conditions.
ASML's goal has always been to reduce the critical dimension. By reducing the wavelength and increasing the numerical aperture, our systems can print IC structures in increasingly smaller feature sizes. If our customers can print smaller structures, the chips can be smaller and the costs per transistor become cheaper, which in turn makes it more profitable for our customers.
Extending Moore’s Law is becoming increasingly complex and costly. What will always be needed is a way to mass produce IC designs at the right cost. That’s where the full scope of ASML’s product portfolio will continue to play a big role to ensure affordable transistor shrink. We continue to push our entire system portfolio to new productivity levels and imaging performance. We believe that our EUV 0.33 and 0.55 NA lithography will help enable tomorrow’s most advanced chips. In our computational lithography solutions, we’re bringing machine learning and big data to the forefront in predicting both lithography and metrology processes, striving for 100% accuracy. We have developed an entirely new class of e-beam inspection systems to help our customers control defectivity in manufacturing in next-generation chip nodes, as those smaller structures can hardly be detected with optical inspection.
ASML ANNUAL REPORT 2021 14
Message from the CTO
Martin van den Brink (President, Chief Technology Officer and Vice Chair of the Board of Management)
Dear Stakeholder,
I’ve been asked the question many times, but let me assure you: Moore’s Law is still alive and well. And we believe it will stay with us for quite some time.
Over the past 40 years, we have gradually evolved from the era of PCs and mobile devices into the cloud era, where almost every aspect of our lives is now stored and managed online. The next step of our digital future will be about distributed intelligence, driven by the seamless integration of communication, computation and artificial intelligence (AI). All these trends require more computing power, which in turn is accelerating the demand for more powerful and energy-efficient microchips.
With our customers, we share a commitment to increase the energy efficiency performance of microchips. Together, we have a vision of the next 20 years to improve energy efficiency three-fold every two years, through system scaling including ongoing improvements in the resolution of our lithography systems, and through microchip device, material and transistor innovations. Moore’s Law has evolved and it is not only about printing the smallest lines.
System scaling is driving innovation
Over the last 15 years, the main driver of innovation in the semiconductor industry has expanded from pure lithography-enabled shrink (dimensional scaling) to microchip system scaling. This is achieved through new transistor structures and associated materials (device-level scaling), optimized circuit designs (circuit scaling) and innovative microchip architectures – such as 3D structures (architectural scaling) – as well as shrinking the microchip device footprint.
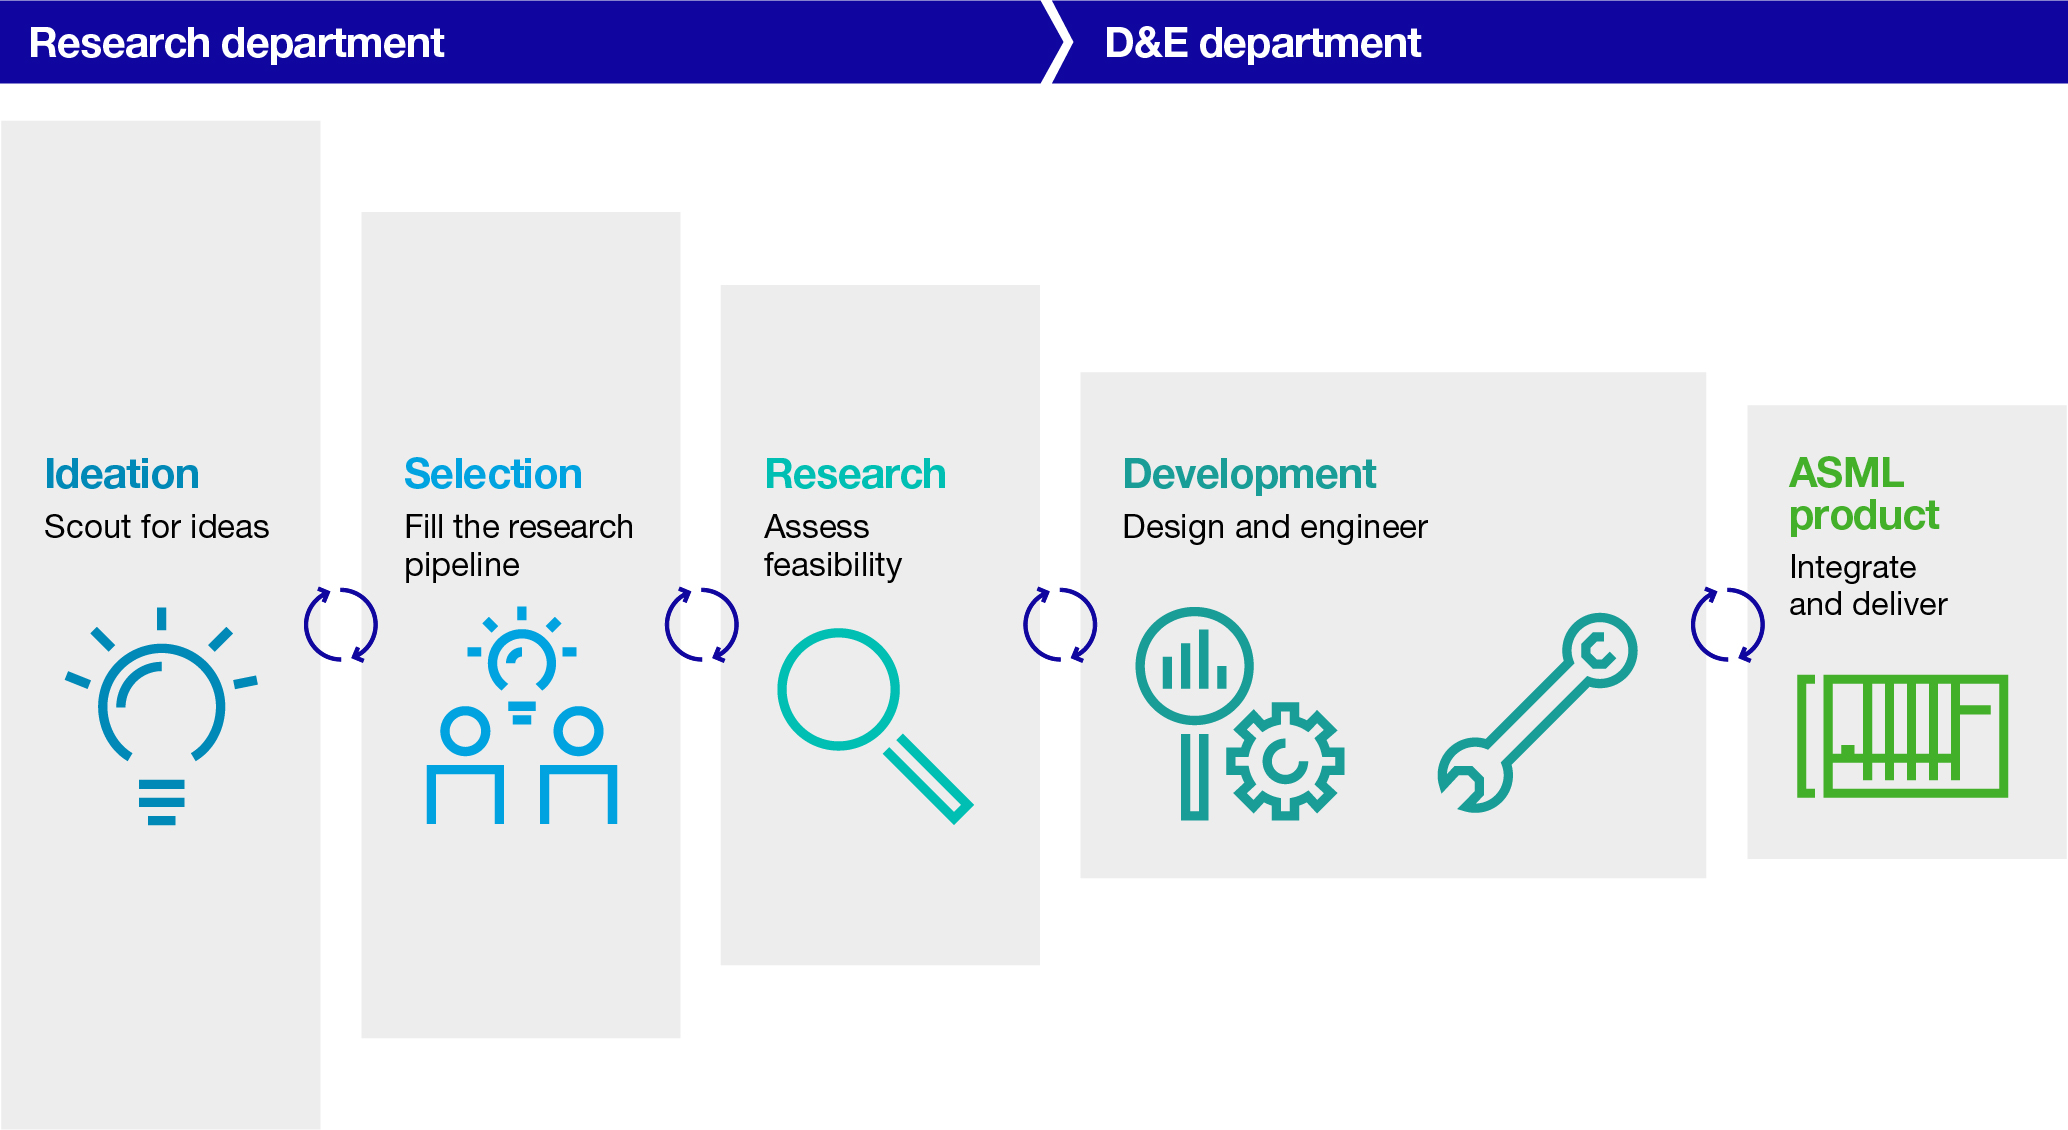
Advancing holistic lithography
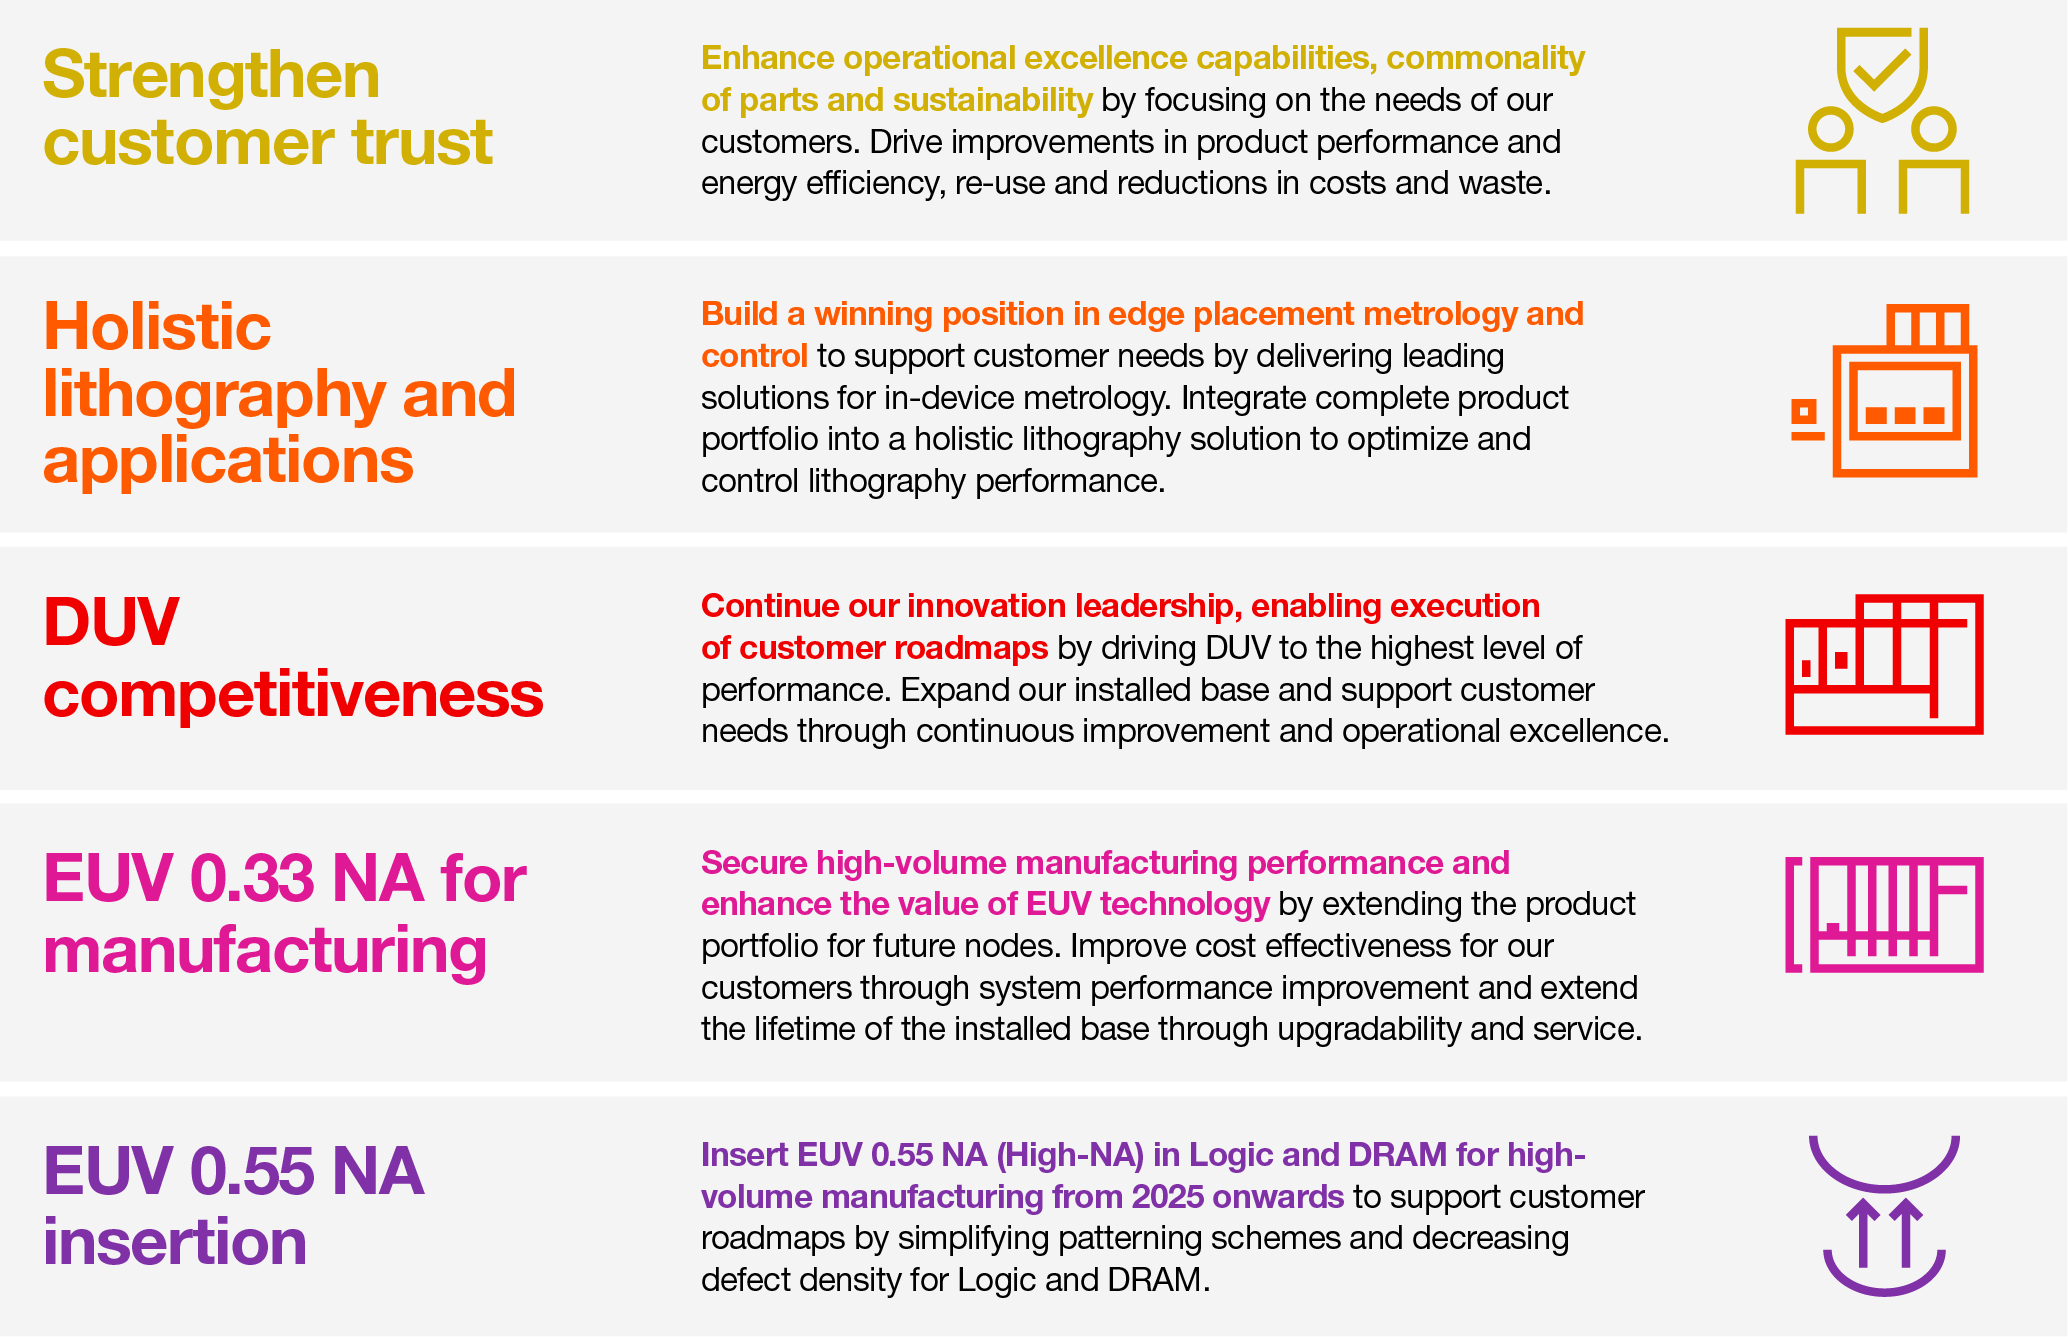
ASML remains focused on enabling system scaling through shrink. We are integrating our complete product portfolio into a holistic lithography solution to optimize and control the lithography process. We do this through optimizing litho parameters, overlay, critical dimension (CD) and optical proximity correction (OPC), and by reducing the edge placement error (EPE) as well as improving our defect inspection capabilities.
We are uniquely able to help our customers find, measure, and correct for patterning variations. Our main focus is on improving EPE (the difference between the intended and the printed feature edge of a microchip layout), which is one of the keys to improving yield. This is because the lithography systems at our customers not only measure every single wafer that goes through the fab, but they also expose every single field on every single wafer and die individually. This allows our customers to set the actuation values of all of the control knobs that they have on our lithography systems in an optimal way.
How do we achieve that? We use scanner metrology, optical metrology, e-beam metrology and inspection to bring data from every relevant step in the process flow together. By analyzing all data in a single framework, our applications can then provide a feedback loop to the lithography system to make the required corrections, thereby delivering real value for our customers.
DUV innovation continues
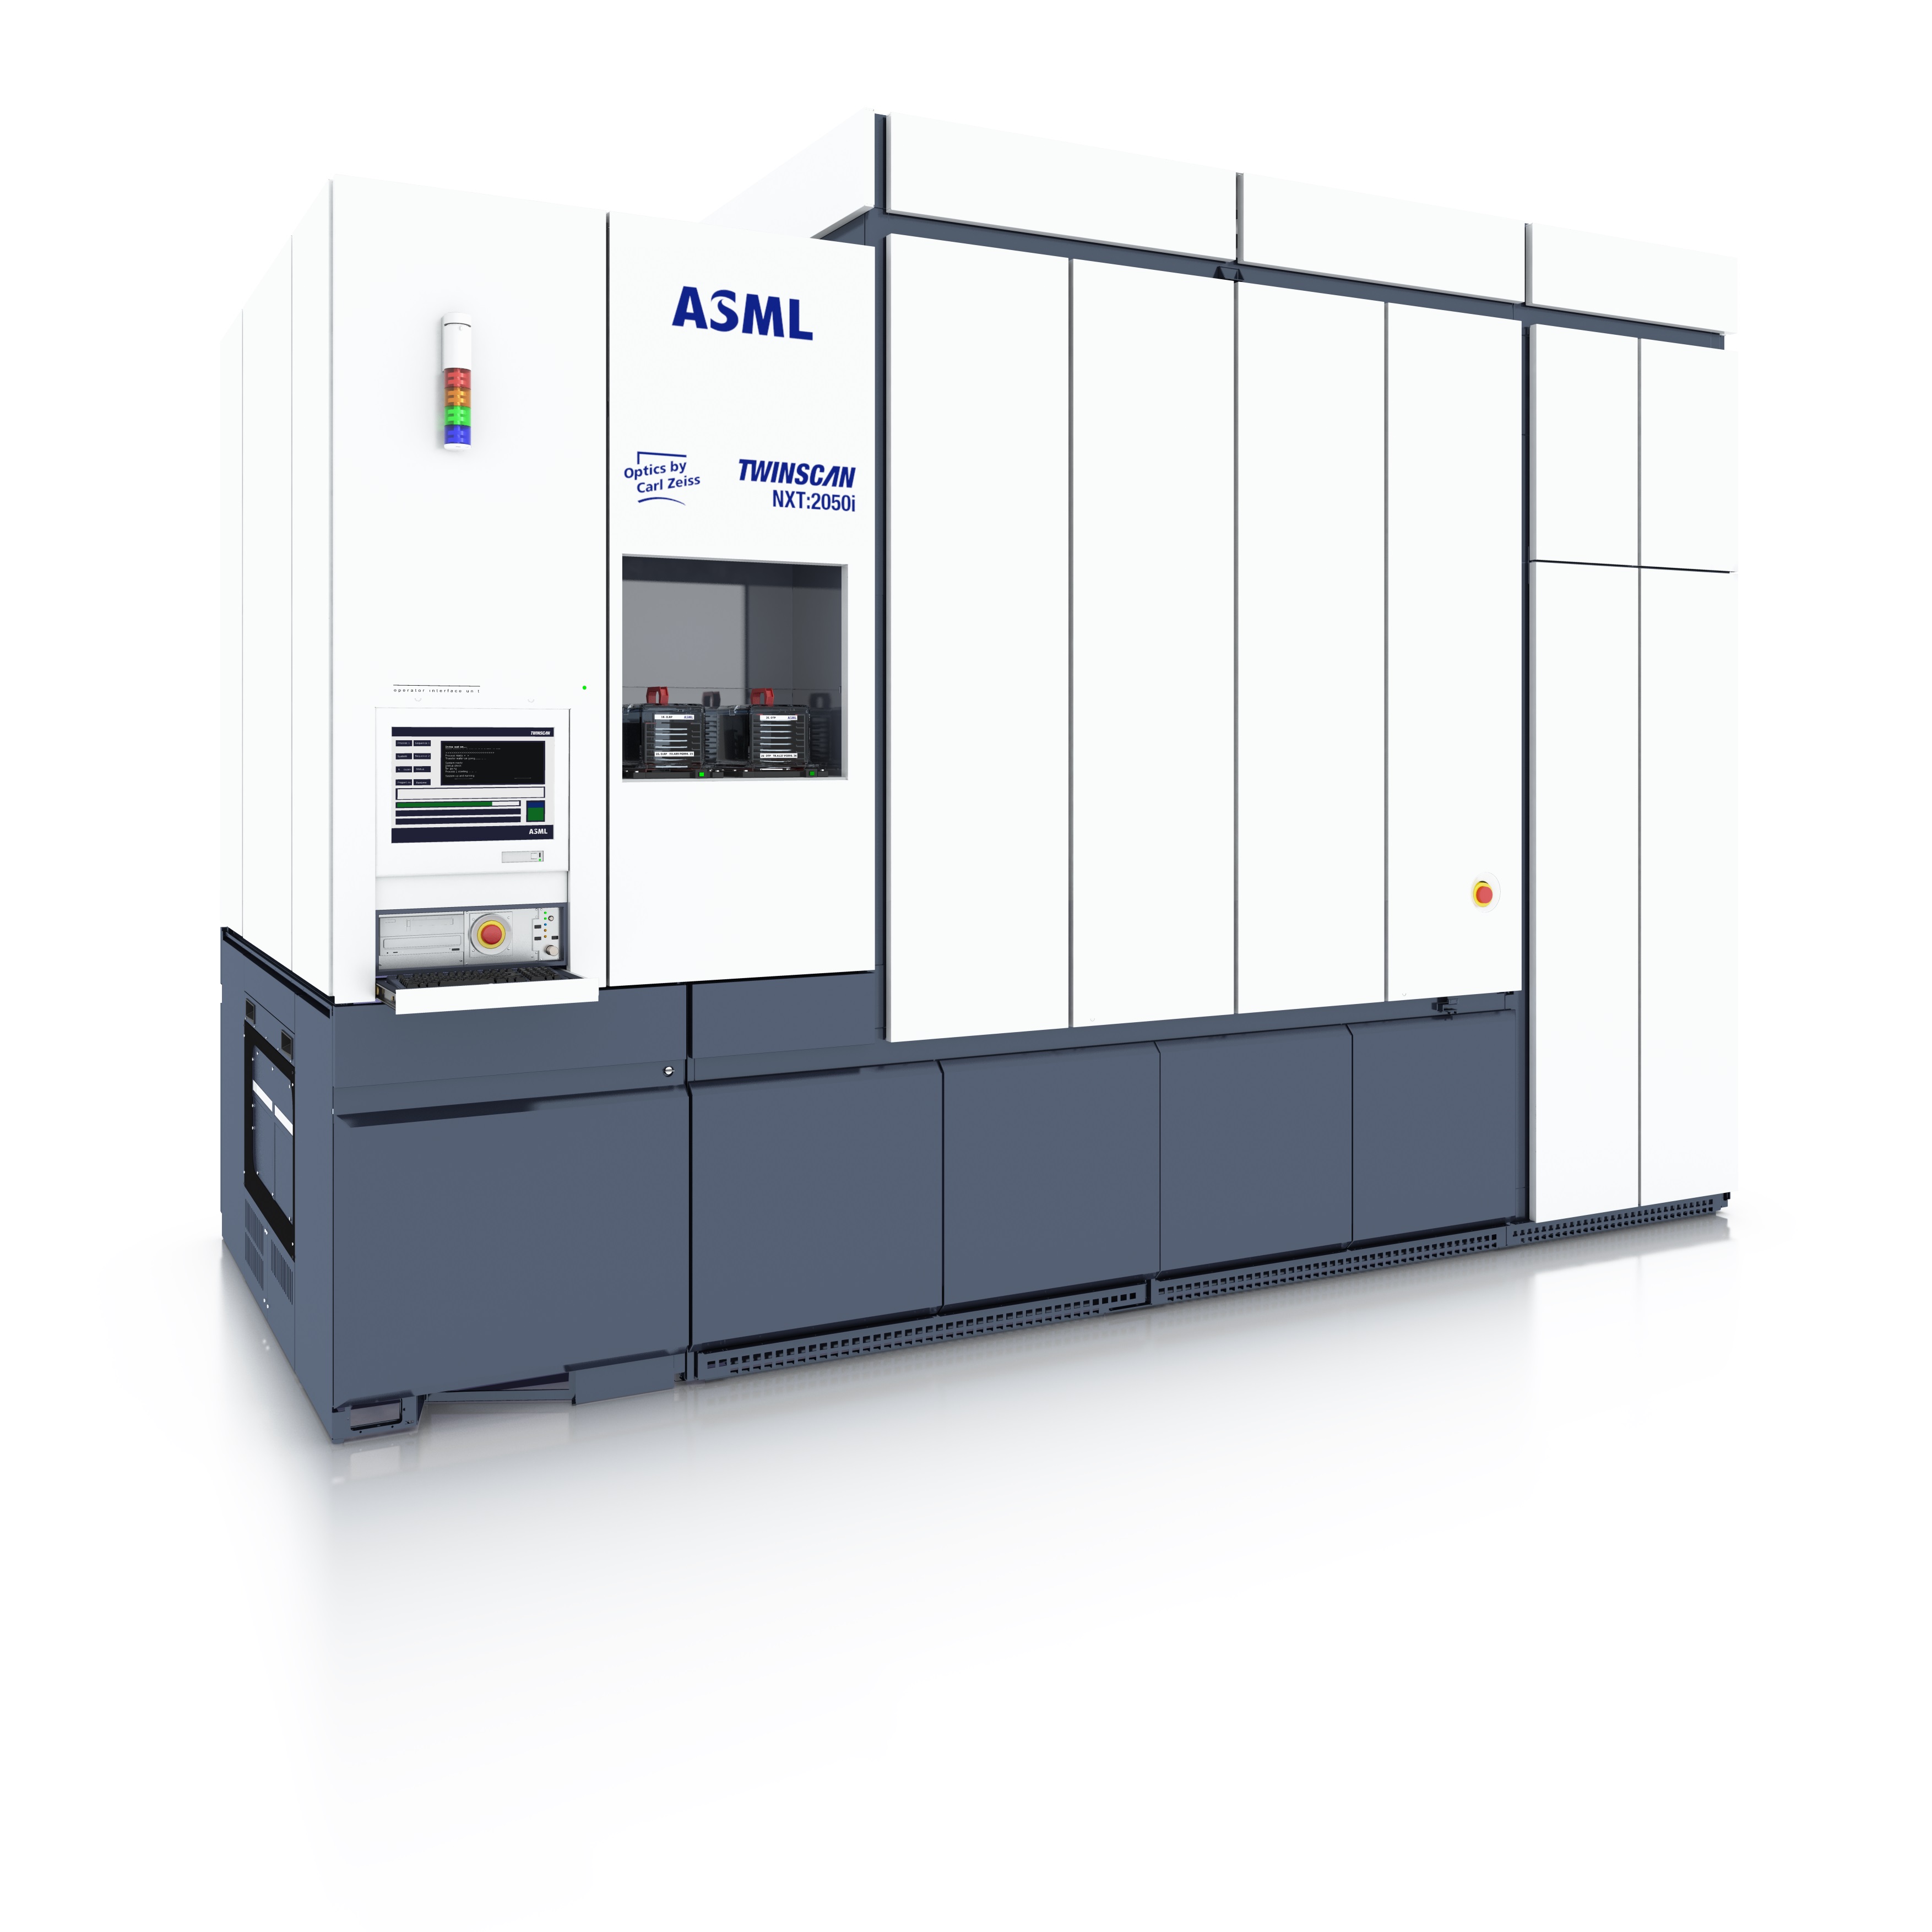
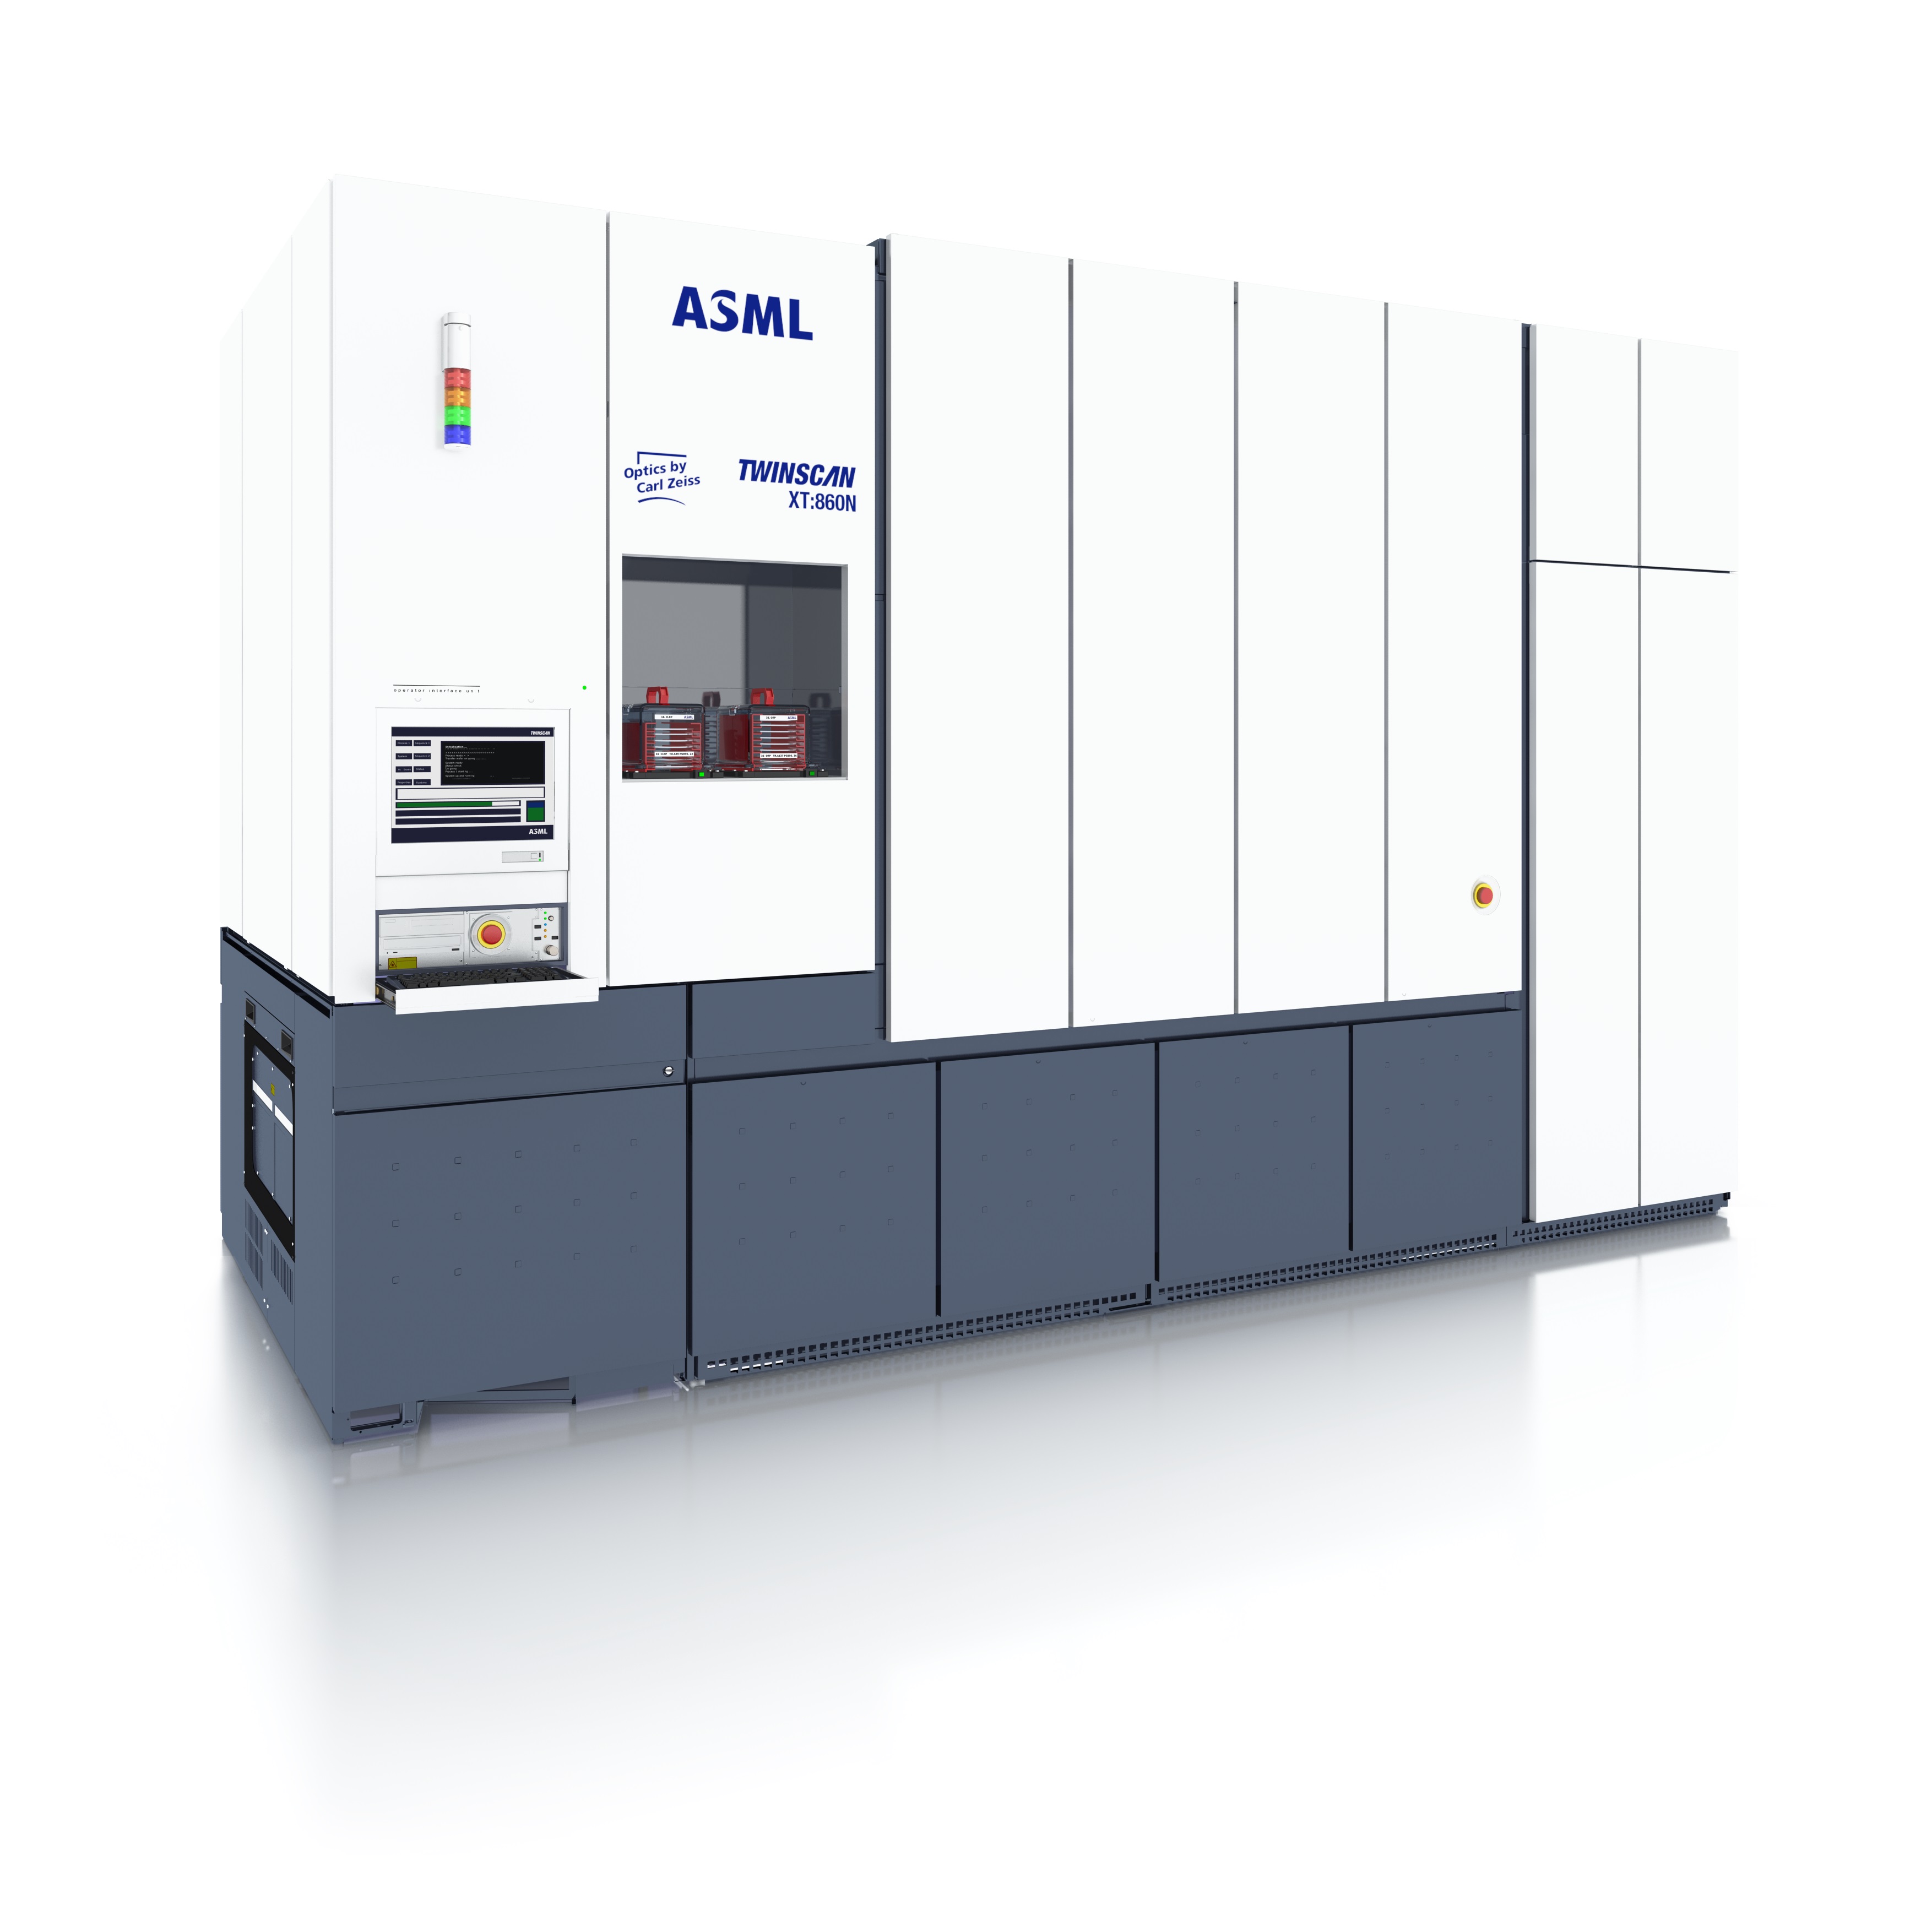
Our deep ultraviolet (DUV) products are the industry backbone, supporting all semiconductor market segments. We keep innovating on all wavelengths. Our immersion and dry systems lead the industry in productivity, imaging and overlay performance for the high-volume manufacturing of the most advanced Logic and Memory chips.
We continue to systematically develop our product portfolio to optimize the installed base for our customers, while increasing our focus on productivity and performance upgrades and additional services to support our customers’ wafer demand.
ASML ANNUAL REPORT 2021 15
Cost-efficient scaling with EUV
Our extreme ultraviolet (EUV) product roadmap will help us drive affordable scaling well into the next decade. Our EUV 0.33 NA platform extends our customers’ Logic and DRAM roadmaps.
Chip manufacturing with EUV helps reduce the amount of critical lithography masks (-40%) and process steps (-30%) when compared to non-EUV manufacturing. This results in significant defect, cost and cycle time reductions for our customers. We expect that adoption of EUV will continue to grow, with all advanced node chipmakers expected to use EUV in production by 2024.
With our next-generation EUV 0.55 NA platform, we will continue to enable cost-efficient scaling for future nodes. The novel optics design with a higher numerical aperture will enable 60% smaller features and increase microchip density by a factor of almost 3 times. Our first early-access system is expected to be available in 2023 and we expect our customers will start their R&D in the 2024-2025 timeframe. High-volume manufacturing is projected to start in 2025-2026.
Customers first
In everything we do, a trusted relationship with our customers is key. Our comprehensive product portfolio is therefore aligned with our customers' roadmaps to deliver cost-effective solutions in support of all their applications, from advanced to mature nodes. We are aware that commonality across our DUV and EUV platforms allows faster and more cost-effective innovation, production and maintenance. That is why we increasingly focus on using common technology across our portfolio.
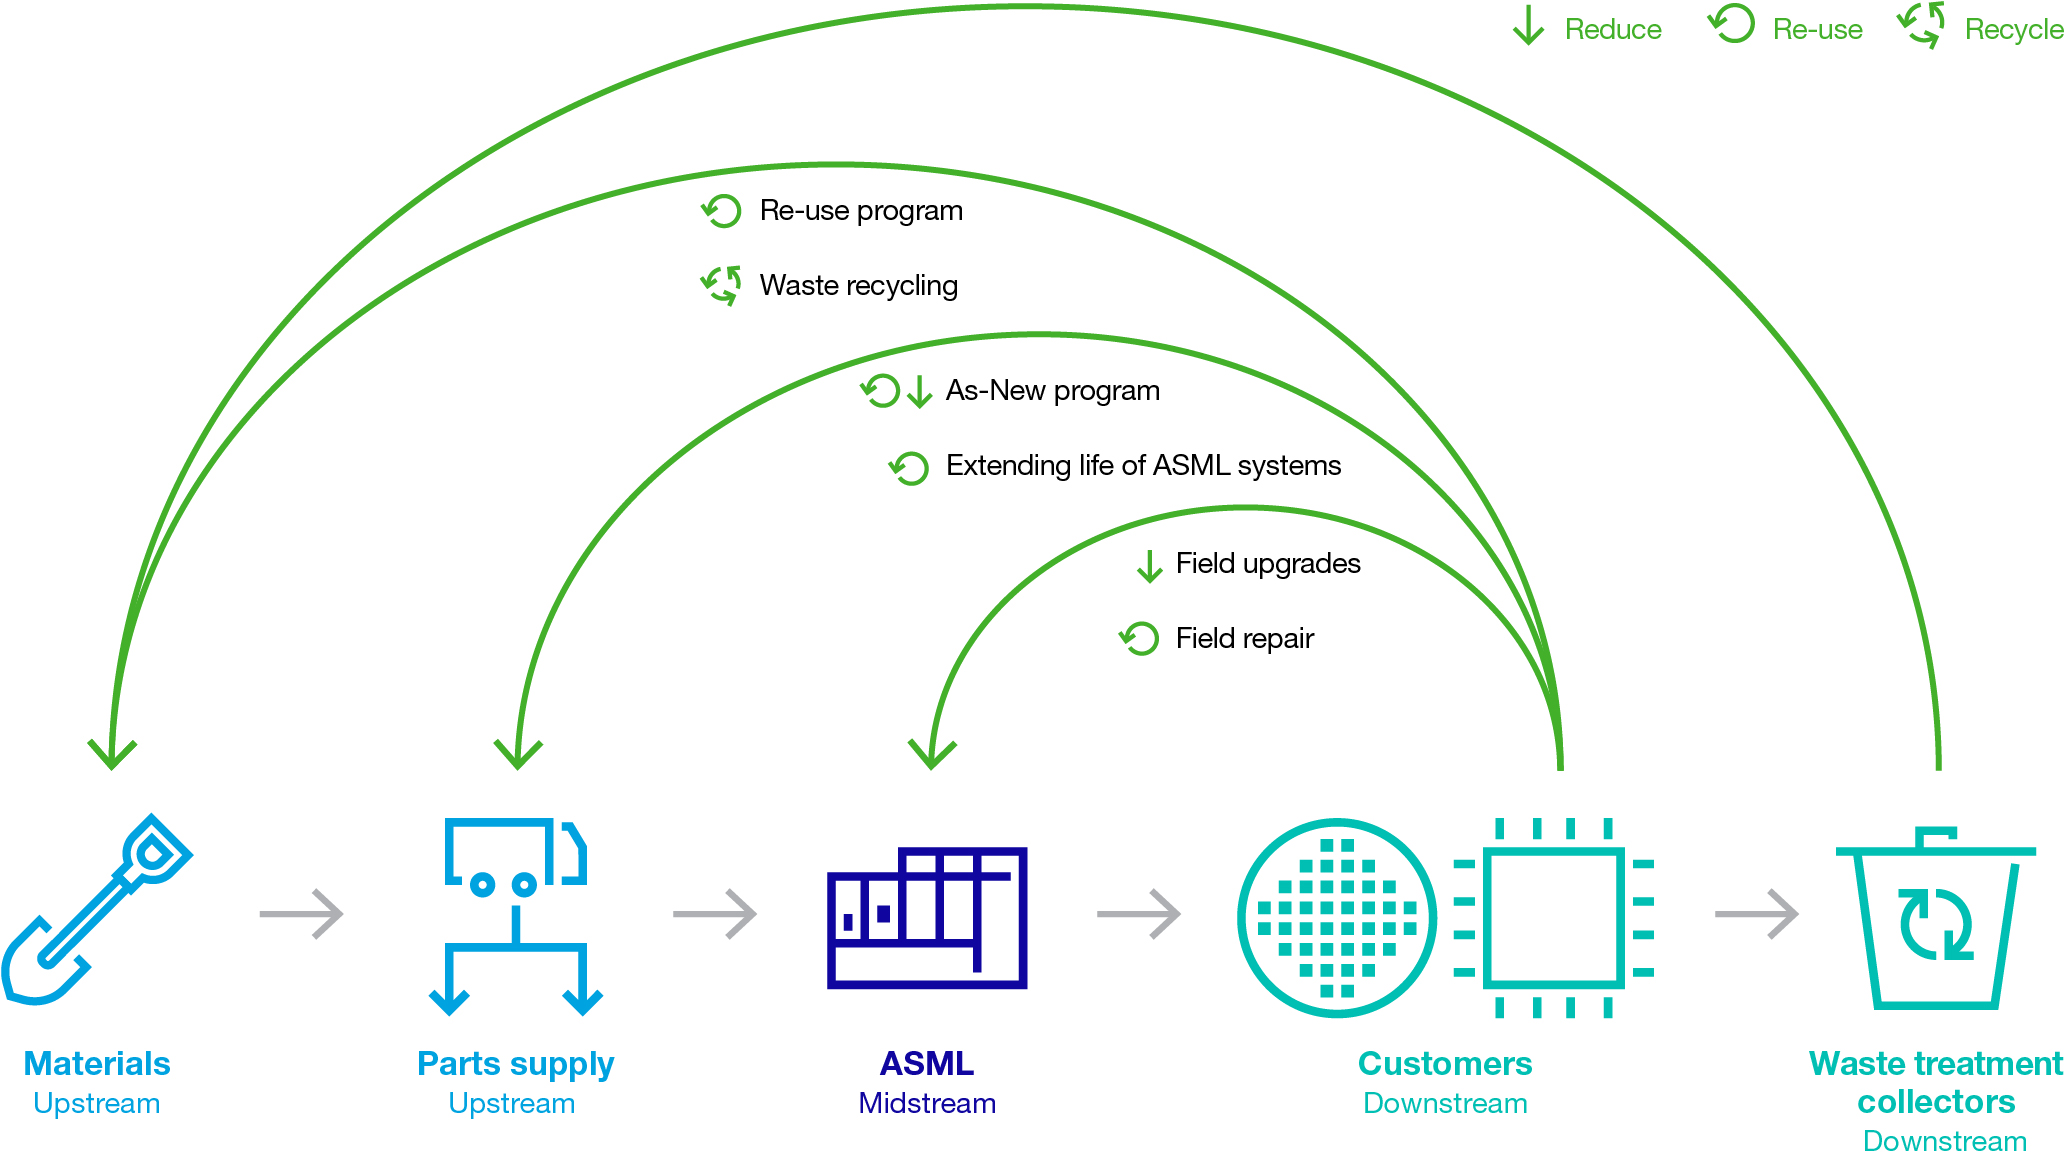
We are investing in the energy efficiency of our products to help reduce the energy needed to produce a wafer. In addition, we have a strong roadmap to reduce waste. We are committed to re-using parts, tools and packaging whenever possible in our value chain. We are working together with our customers and suppliers to remanufacture used system parts, re-using them as new parts to prevent unnecessary waste.
I strongly believe that we have a solid roadmap for the coming 10 years that will drive the continuation of Moore’s Law. Enabled by shrink, ongoing system scaling on all levels – on device, circuit, dimensional and architectural level – will require substantial innovation across our whole portfolio. This will be key to increasing the circuit density and energy efficiency of microchips while lowering their cost for many years to come.
Martin van den Brink
Chief Technology Officer
ASML ANNUAL REPORT 2021 16
How we innovate
A tiny microchip, a global ecosystem
At almost every moment of every day, all of us make use of technology that contains microchips: small but mighty devices. A microchip is a unique product – fabricating the layers on even the simplest chip requires an elaborate process that few companies in the world have mastered.
During this process, which can take months from start to finished product, the silicon wafer travels through dozens of different machines in a chipmaker’s fab (semiconductor fabrication plant), before it finds its way into electronic products.
This multifaceted production process has led, over decades, to the semiconductor industry becoming a global ecosystem. This ecosystem includes companies specialized in chip design, equipment and infrastructure suppliers, and chipmakers themselves.
As a crucial manufacturer of lithography equipment, ASML is a vital part of this ecosystem chain. A critical step in the chip manufacturing process is the fabrication of the circuitry patterns on silicon wafers, made possible by our lithography systems which can be found in the factories of every major chipmaker in the world.
But our systems are just one part of the process involving numerous suppliers and chip-making equipment. Every step and every machine in the process is important. That’s why collaboration and innovation are key. From academics who help us understand and bend the laws of physics, to customers who identify new possibilities and suppliers that translate our ideas into products and technology – we collaborate to succeed. This huge collaborative network that we call the semiconductor industry is at the cutting edge of our digital future.
Examples of our ecosystem partners
Product development
Product development in the semiconductor industry is managed through so-called ‘roadmaps’, which is essentially planning product development. When an idea has become a more specific definition, this transforms into a roadmap giving guidelines on how the product development should proceed during the next couple of years. By combining the roadmap of our customers and the technological feasibility, we design a product roadmap that outlines the specifications and functionalities of new types of machines that are feasible for us to produce and that meet our customers’ demands.
Product development at ASML is exposed to multiple complexities. Some of our products consist of more than 300,000 parts delivered by more than 700 suppliers, and 50 unique functions that need to be integrated to create a fully functioning system. We need more than 80 specialized disciplines to support successful product and process development. Moreover, we are part of the semiconductor value chain, working closely together with numerous customers, partners and suppliers.
ASML's success depends on the timely delivery of innovative and complex products. This brings uncertainty and risk, and the positive and negative impact of decisions made throughout product development can be huge. Compare it to a sailing race: The goal is clear, but the route is not. There are numerous variables to be managed, at high speed. Every piece of information is crucial to plan and reach the goal.
For more than a decade, we have applied our tailor-made modular innovation and product development process, which we call the Product Generation Process (PGP). PGP describes the way we develop products at ASML, how we introduce these products to the market, and eventually how we phase them out. PGP is a decision-based process. There are 15 sequenced Key Decisions that
ASML ANNUAL REPORT 2021 17
determine the main stream of the product development. This means that PGP enables decisions to be made as to whether or not the development of a product should continue.
The modular design of our products allows us to work out solutions to technological challenges independently of projects. This independent work enables us to consistently improve our solutions and it leads to an efficiency in development through reuse of system design and architecture.
Our ecosystem partners
We innovate through partnerships. Our innovation philosophy is one where we see ourselves as architects and integrators, working with partners in an innovation ecosystem. We develop our technology in close collaboration with our customers to ensure we build today what they need tomorrow. Our machines are developed based on their input, and we engage closely with them to help achieve technology and cost roadmaps. Read more in: Customer intimacy.
In the same way, we work closely with our suppliers, trusting them to manufacture parts and modules for our systems. Many of them are deeply involved in developing new technology and achieving the innovations we seek. With some of these so-called ‘farmout suppliers’, we work as co-investors. Read more in: Our performance in 2021 - Social - Our supply chain.
We have been in a partnership with Carl Zeiss SMT Holding GmbH & Co. KG for over three decades and we also hold an interest in the company. This partnership runs according to the principle of ‘two companies, one business’ working together to drive operational excellence in innovation and technology. Read more in: Our performance in 2021 - Social - Our supply chain.
We co-develop expertise within a wide network of technology partners, such as universities and research institutions. Some of our partners include imec in Belgium, the technical universities in Twente, Delft and Eindhoven in the Netherlands, and the Advanced Research Center for Nanolithography (ARCNL), also in the Netherlands. Read more in: Our performance in 2021 - Social - Innovation ecosystem.
Managing innovation
Every day at ASML, more than 11,000 of the brightest minds in R&D take on the exciting challenge to innovate the most advanced lithography systems in the world. We manage this process by balancing our customers’ needs, product capabilities and technology solutions. To stay ahead, we invest heavily in R&D. In 2021, we spent €2.5 billion on R&D, compared to €2.2 billion in 2020.
Our Research department’s focus is to generate and explore ideas and demonstrate their feasibility in the long term. The department also helps to find technological solutions to challenges in our products and applications that have moved into development.
Our researchers continuously scout for technological innovations and solutions – within the semiconductor industry and beyond – to assess if they can be applied in ASML’s technology roadmap to support our customers to drive the semiconductor device roadmap. We encourage our experts to build a wide network in the broader technology space.
The constant stream of new ideas is crucial to fill our technology pipeline that flows through the so-called ‘innovation funnel’. Here we select new ideas that have the potential to advance our products and customer application. Ideas that successfully pass the ‘proof of concept’ stage in our Research department are transferred to the Development & Engineering (D&E) department. D&E takes them on into our Product Generation Process (PGP) for product development. We then build and test system prototypes in the necessary environments. Prototypes that pass these tests may eventually lead to new product releases.
ASML ANNUAL REPORT 2021 18
Innovation funnel
Our D&E engineers drive our machines forward by creating new components or subsystems, integrating them into the functional system, or developing new applications to help move the industry forward.
In D&E, we work on a multitude of advanced optical and mechatronic modules, along with application software, data science and operating systems. D&E innovates with a strong focus on time-to-market, often starting new system development before the previous generation has even reached the customer. Teams in D&E have extensive contact with leading research institutes, keeping up to date with the latest developments in their respective fields.
Innovation achievements
Every day, our teams take on the exciting challenge of building and driving innovation forward to maintaining the most advanced lithography systems in the world. To do this, we apply concurrent engineering, often starting new system development before the previous generation has even reached the customer. At the same time we continuously seek to improve our products capabilities, while guarding our products’ reliability, manufacturability and serviceability.
In 2021, our research and D&E teams showed great achievements. A few examples are provided below.
Berthold Leibinger Stiftung’s 2021 Innovation Prize
A prestigious honor granted every two years, the Berthold Leibinger Innovation Prize is an international award that recognizes excellence in research and development work on the application or generation of laser light.
EUV technology is now the core technology for making modern computer and smartphone chips. A team of ASML scientists – Daniel Brown, Alexander Schafgans, and Yezheng Tao from ASML, in the Netherlands and the US – have been awarded the Berthold Leibinger Stiftung’s 2021 Innovation Prize for a “breakthrough in laser-produced plasma source for Extreme Ultraviolet Lithography scanner enabling high-volume manufacturing”.
The prize is for unprecedented advancement and research in EUV light source power scaling using a CO2 laser architecture. The team's work in the area of laser-produced plasma physics aided greater stability and robustness to EUV light source power, removing performance limitations and enabling greater scaling in high-volume manufacturing. This significant contribution was recognized by a jury of experts from science and industry across the globe.
For more information, please visit www.asml.com
Modular wafer clamp
We don’t say 'no' to a challenge. Our global research and D&E teams were challenged to create a new wafer clamp design that could be manufactured faster while meeting tighter specifications. After two years of research, design and engineering, our team launched the first full-scale prototype of the modular wafer clamp, ready for qualification in an EUV scanner. This achievement is a true testimony of cross-continental challenge and collaboration.
Wafer table coating
Unlike any other module in the scanner, the wafer table is the only scanner part in direct contact with the wafer during exposure. The requirements for flatness and surface stability are therefore rigorous. Thousands of wafers with different shapes and process
ASML ANNUAL REPORT 2021 19
characteristics are clamped to it on a daily basis as it moves under high acceleration forces, leading to unwanted drift and leaving behind a clamping fingerprint which affects the overlay performance.
Our teams sought a solution to these fundamental issues affecting wafer table performance and found a more effective coating solution which ensures stability and also has substantial lifetime improvement benefits.
Water-cooled EUV mirrors
EUV systems use several mirrors instead of lenses to guide the EUV light to the wafer, shrinking the reticle pattern by a factor of four. When EUV light travels through the machine, part of it is absorbed into each reflecting mirror. This gives rise to so-called mirror heating, which influences imaging and overlay performance.
Our researchers and engineers investigated new ways of thermal conditioning for the mirrors. Simulation and modelling showed good results on water-cooled mirrors. Testing of bonded substrates with water channels is underway, with encouraging results.
ASML ANNUAL REPORT 2021 20
Customer intimacy
As one of the world’s leading manufacturers of chip-making equipment, we enable our customers to create the patterns that define the electronic circuits on a chip. Our customers are the world’s leading microchip manufacturers, and our success is inextricably linked with theirs.
We collaborate with our customers to understand how our technology best fits their needs and challenges. For this reason, we engage with our customers at all levels: building partnerships, sharing knowledge and risks, and aligning our investments in innovation. We develop our solutions based on their input, engage in helping them achieve their technology and cost roadmaps, and work together, often literally in the same team, to make sure our solutions match.
Despite continued travel restrictions and mandatory quarantine and workforce constraints, thanks to our collaborative efforts across the company and our business partners, we were able to maintain a high level of engagement with our customers and prevent any major impact on their business requirements. Customers around the world have recognized our additional support efforts and interventions during the pandemic. We were presented with several ‘customer awards’ in recognition of our rapid response to their needs and good overall customer service.
In 2021, the demand for chips substantially increased driven by market fundamentals such as distributed computing, sensor technology, 5G, AI and digitalization accelerated by the pandemic. This also meant that the need for our customers to increase their capacity was at a record high. Rapidly increasing the number of systems shipped is challenging in our business, requiring seamless coordination with our suppliers who are also experiencing their own supply constraints. While we still managed to produce significantly more systems in 2021, we continued to work in close collaboration with our customers to weather the supply and delivery challenges by optimizing the installed base productivity.
Achieving customer intimacy
To us, customer intimacy is about the entire customer relationship across all channels, from the early stages of innovation onwards. We aim to foster loyalty, advocacy and continuous engagement with the goal of achieving complete customer satisfaction.
We aim to leverage our innovation leading to more sophisticated solutions and interactions with our customers. As customer requirements become more complex, it takes longer to align, so we need to start earlier. Transparency is key in this process, and our customer intimacy strategy supports this.
It’s crucial to be in a true partnership with our customers, to share in the risks and rewards of what we do. Trust and a shared vision are at the heart of this.
Staying close to our customers
To support and sustain our partnerships with customers, we have a structure of customer interactions across various channels in the organization, including, for example, customer alignment meetings. Here, members of our Board of Management, senior managers and customer representatives come together to make sure our product development plans are in line with our customers' business goals and needs.
We run regular customer alignment meetings with our key customers. These meetings include our Executive Review Meetings, at which members of our senior management team and Board of Management discuss business and strategies with customers; Technology Review Meetings, at which our senior technology experts and our Chief Technology Officer discuss technology roadmaps and requirements with customers; and Operational Review Meetings, where we review topics related to our customers’ operational activities.
We have a dedicated Sales and Customer Management department, which is responsible for building and maintaining our customer relationships and ensuring all relevant ASML departments contribute to meeting their needs. We market and sell our products directly to our customers, without agencies or other intermediaries. Our account managers, field and application engineers, and service and technical support specialists are located close to our customer locations throughout Asia, the US and Europe.
Another focus area is training – boosting the capabilities of the local customer service teams as well as enhancing local technical expertise. The travel restrictions, among others, highlighted just how essential the need is for well-trained engineers in the regions where we operate. With the help of remote control capabilities, we were able to increase the self-sufficiency of the local field engineers.
Measuring our approach
Our Voice of the Customer program helps ensure our employees hear firsthand about our customers’ needs and challenges. This is especially important for employees without direct access to customers. To reach as many of our people as possible, the program makes use of different channels of communication: live presentations and Q&As with senior customer representatives, recorded customer interviews, online articles, and personal engagement with customer representatives.
ASML ANNUAL REPORT 2021 21
In 2021, travel restrictions and other mitigation measures related to COVID-19 continued to limit our in-person interactions to a large extent. Our account teams adapted quickly, introducing alternative solutions such as more local Voice of the Customer initiatives and remote customer interviews. Local account and support teams visited our customers at their locations, interviewed them on video, and then shared feedback with teams at ASML. Except for live presentations with large audiences, we were able to adhere to our regular schedule of interactions throughout the year.
Another valuable customer feedback tool is our biennial Customer Feedback Survey, which asks our customers to rate our performance. We also use this opportunity to collect open feedback. The direct ratings and frank comments provide valuable insight into customers’ successes and challenges. We carefully analyze the results per customer, check our gained insights with the customer, and then define targeted, continuous improvement plans together with them, taking their priorities into account. Key elements in this process are: truly understanding what customers need from us, validating that we are on the right track with the right improvements, and updating our customers regularly on progress being made. In 2021, we continued deploying the improvement actions identified from the survey results of 2020. The next survey will be sent out in September 2022.
We also set ourselves a target of achieving a VLSI top-three ranking among large suppliers of semiconductor equipment. The VLSI research annual Customer Satisfaction Survey benchmarks the performance of suppliers across the semiconductor industry based on three key factors: supplier performance, customer service and product performance. We moved up to second place in the 2021 VLSI research Customer Satisfaction ranking of the ’10 Best Large Suppliers of Chip Making Equipment’. We've maintained our position in the top three overall ‘Large Suppliers of Chipmaking Equipment’ and also in the top three individual categories: number one in ‘Best Suppliers of Fab Equipment’, ‘Wafer to Foundation Chipmakers’, and ‘Wafer Fabrication Equipment to Specialty Chipmakers’.
In line with our business strategy, we continued in 2021 to work towards securing our full product portfolio that will sustain our company into the future. This includes working with our customers to increase the adoption of EUV in high-volume manufacturing environment, engaging with our customers to introduce EUV 0.55 NA platform, securing our products in mature markets and optimizing the installed base for our customers.
Our product portfolio is aligned with industry trends and our customers’ detailed product roadmaps, which require lithography-enabled solutions. Our customers are showing their trust in us by investing in our newest technology, supporting the industry driver of shrink beyond the current decade.
ASML ANNUAL REPORT 2021 22
Our products and services
The semiconductor industry is driven by affordable scaling (the ability to make smaller more energy efficient transistors at the right price). Our holistic lithography product portfolio is geared toward lithography-enabled shrink far beyond the current decade, to allow our customers to generate the greatest value per silicon wafer.
Our product offerings in our holistic product portfolio provide patterning solutions for every possible wavelength – from the most advanced 13.5 nm EUV wavelength to the industry’s workhorse DUV wavelengths of 193 nm, 248 nm and 365 nm. This comprehensive portfolio supports customers across the semiconductor industry from mass-producing advanced Logic and Memory chips to creating novel ‘More than Moore’ applications or cost-effective manufacturing of mature chip technologies.
To make sure that every individual pattern on an integrated circuit is connected flawlessly, we provide advanced process control solutions through our metrology and inspection systems and computational lithography solutions. In addition, we support our growing installed base with best-in-class customer support. Our highly differentiated solutions provide unique value drivers for our customers and ASML, working together to enable affordable shrink well into the next decade.
Extreme ultraviolet (EUV) lithography systems
More than two decades ago, we started developing EUV technology. It was "no walk in the park" and, since the start, we have invested billions in R&D, acquired Cymer to accelerate EUV source technology, and helped solve several technical challenges to enable the EUV infrastructure that our customers need for high-volume manufacturing. We succeeded by innovating in close cooperation with our customers and suppliers. This partially explains why ASML is the world’s only manufacturer of EUV lithography systems. Since its introduction, our EUV installed based produced more than 59 million wafers by end of 2021, compared to 26 million wafers produced by end of 2020.
EUV 0.33 NA
Our EUV platform extends our customers’ Logic and Memory roadmaps by delivering resolution improvements, state-of-the-art overlay performance and year-on-year cost reductions. EUV lithography uses light with a wavelength of just 13.5 nm and a numerical aperture of 0.33. This is a wavelength reduction of almost 15 times compared to the next most advanced lithography solution used in advanced chipmaking – deep ultraviolet (DUV) argon fluoride (ArF) lithography with its 193 nm light. This allows our customers to use EUV in a single exposure, rather than complex multiple patterning strategies with ArF immersion, and allows them to further shrink microchip structures. Our EUV product roadmap is intended to drive affordable scaling to 2030 and beyond.
The TWINSCAN NXE:3600D is our latest-generation EUV 0.33 NA lithography system. It combines the highest resolution with 15-20% increased productivity and around 30% better overlay compared to its predecessor the TWINSCAN NXE:3400C, while also improving system availability.
TWINSCAN NXE:3600D
EUV 0.55 NA (High-NA)
After five years of engineering, we have started to build the next generation of EUV lithography systems that further improves resolution with a higher numerical aperture (NA) of 0.55 compared to the 0.33 NA of our current EUV platform. To reduce technological introduction risk and R&D costs, the EUV 0.55 NA (High-NA) platform maximizes commonality with the EUV 0.33 NA platform.
The capabilities of our EUV 0.55 NA system, called EXE:5000, bring considerable benefits to our customers by enabling lithography simplification for future nodes, higher yield and decreased defect density for both Logic and DRAM. With its larger optics, it can print smaller features with higher density, reducing patterning costs for customers significantly. EUV 0.55 NA helps our customers to extend their shrink roadmap and minimize double or triple patterning compared to 0.33 NA, leading to reduced patterning complexity, lower risk of defects and a shorter cycle time.
ASML ANNUAL REPORT 2021 23
We believe this technology will enable affordable geometric scaling well into the next decade as EUV 0.55 NA offers higher resolution that enables 1.7x smaller features and 2.9x increased density compared to EUV 0.33 NA. EUV 0.55 NA is expected to enter high-volume manufacturing at our customers in 2025–2026.
Deep ultraviolet (DUV) lithography systems
DUV lithography systems are the workhorses of the industry. Supporting numerous market segments, DUV systems produce the majority of layers in a customer device today and will remain important for future devices. We offer immersion as well as dry lithography solutions for all DUV wavelengths currently used in the semiconductor industry – i-line using 365 nm wavelength, KrF using 248 nm and ArF using 193 nm. These systems help manufacture a broad range of semiconductor nodes and technologies, and support the industry’s cost- and energy-efficient scaling.
Our DUV immersion and dry systems lead the industry in productivity, imaging and overlay performance for high-volume manufacturing of the most advanced Logic and Memory chips in combination with EUV, while continuing to deliver value for mature nodes and lower-volume applications.
Immersion systems
ArF immersion lithography maintains a thin film of water between the lens and the wafer, increasing NA and improving resolution to support further shrink. Our immersion systems are suitable for both single-exposure and multiple-patterning lithography, and can be used in seamless combination with EUV systems to print different layers of the same chip.
The TWINSCAN NXT:2050i is our current state-of-the-art immersion system and is being used in high-volume manufacturing of the 5 nm Logic and fourth generation of 10 nm DRAM nodes. The NXT:2050i is based on a new version of the NXT platform, which includes new developments in the reticle stage, wafer stage, projection lens, and exposure laser. Thanks to these innovations, the system delivers better overlay control at higher productivity than its predecessor.
TWINSCAN NXT:2050i
Dry systems
Not every layer on a chip necessarily needs the latest and greatest immersion lithography systems to produce them. There may be more complicated layers that are made using more advanced lithography systems, but the rest can often be printed using ‘older’ technology such as dry lithography systems. Our dry systems product portfolio offers more cost-effective solutions for all types of wavelengths for our customers.
The TWINSCAN NXT:1470 is our latest dry ArF lithography system, offering a record productivity of 300 wafers per hour with a 4 nm overlay capability. It is also the first dry NXT system, building on our successful immersion platform, and delivers improvements in matched machine overlay, productivity and its fab space.
With an 0.80 NA, the TWINSCAN XT:860N is our new-generation KrF system, supporting high-volume 200 mm and 300 mm wafer production at and below 110 nm resolution. The XT:860N features the new Large Range Level Sensor that allows customers to measure high topology 3D NAND wafers at increased productivity of 260 wafers per hour – up from the 240 wafers per hour capability of the XT:860M. For more critical KrF layers, the 0.93 NA TWINSCAN XT:1060K is our most advanced KrF lithography system, and offers best-in-class resolution at and below 80 nm and overlay.
ASML ANNUAL REPORT 2021 24
XT:860N
The TWINSCAN XT:400L is our latest i-line lithography system, which can print features down to a resolution of 220 nm for 200 mm and 300 mm wafer production.
Mature products and services
Before EUV, before immersion, and even before our TWINSCAN systems, there was the PAS. In 1991, seven years after the company was founded, we launched the PAS 5500, which turned out to be our breakthrough platform. This system was able to dramatically reduce manufacturing times for our customers, and its modular design enabled them to produce multiple generations of advanced chips using the same system.
Our refurbished products business, known as Mature Products and Services (MPS), refurbishes and upgrades our older lithography systems to extend their lives and offer associated services. MPS’s customer base is wide and active in a variety of markets, especially in the 'More than Moore' space.
ASML systems have a very long operational lifetime that often exceeds their role at the initial customer. As a result, many customers are able to generate value by selling off systems that are no longer required. To support this sustainable product use and ensure used systems deliver the quality that ASML stands for, ASML is actively involved in the used system market through our refurbishment and associated services. Over 90% of the PAS systems ASML has ever sold are still in use.
We offer refurbished systems of the PAS 5500 and first-generation AT, XT and NXT systems. Through our refurbishment and associated services, we extend the lifespan of our customers' installed base, drawing value from their capital and contributing to sustainable product use. Read more in: Our performance in 2021 - Environmental - Circular economy - Recycle mature products through refurbishment.
Metrology and inspection systems
Our metrology and inspection systems allow chipmakers to measure the patterns that they actually print on the wafer to see how well they match the pattern intended. Our portfolio covers every phase of bringing a chip to market, from R&D to mass production, and each step of the manufacturing process – allowing them to assess the performance of the entire process. The systems offer the speed and accuracy to create automated control loops via our process control solutions, optimizing the lithography system settings for each exposure to reduce edge placement error (EPE), enlarge the process window and achieve the highest yield and best performance in mass production.
Optical metrology
Our YieldStar optical metrology solutions allow chipmakers to assess the quality of patterns on the wafer in volume production, through fast and accurate overlay measurements. Overlay, or how well one layer of a chip is aligned with the previous one, is an important measure of lithography performance and a key contribution to EPE. As structures on microchips get smaller and smaller, overlay and EPE become more and more important.
The YieldStar 385H offers the latest in-resist post-lithography (pre-etch) overlay and focus metrology, with enhanced throughput and accuracy. Compared to previous systems, key enhancements include a faster stage and faster wavelength changing. This enables highly accurate overlay measurements and tool matching using multiple wavelengths without impacting throughput.
Our latest model, the YieldStar 1385H, provides the ability to measure after-etch device patterns enabling extended yield control capability for our customers. The YieldStar 1385H delivers improved accuracy and around 50% productivity improvement capability over the previous model YieldStar 1375F. The YieldStar 1385H is the optical tool on the market for fast, accurate in-device overlay and metrology and has the capability of measuring multiple layers at once which helps customers to improve yield through post-etch process control.
ASML ANNUAL REPORT 2021 25
YieldStar 1385H
E-beam metrology and inspection
Our HMI e-beam solutions allow customers to locate and analyze individual chip defects amid billions of printed features, extending the possibilities for process control. Historically, e-beam solutions were too slow to monitor volume production processes. However, ASML has made progress in various methods for increasing the throughput of e-beam systems.
ASML continues to extend market leadership in voltage contrast inspection and physical defect inspection with the widely adopted single-beam platform. The eScan 430 is our latest single-beam inspection system, delivering more than 35% throughput improvement across various applications in logic, DRAM and 3D NAND.
Our high-resolution e-beam metrology system eP5 offers world-class 1 nm resolution with large field-of-view capabilities at more than 10 times the speed of existing technologies. It outputs critical dimension (CD) and edge placement error (EPE) data in high volume with a quality level that customers need for monitoring and control. EPE is becoming more critical for device patterning and yield with shrinking design rules and the adoption of EUV lithography. We also released an EPE metrology application software product on eP5. It is capable of local and global EPE measurements on device, both intralayer and interlayer.
Our innovation did not stop after we launched our breakthrough multibeam inspection tool HMI eScan 1000, with a 3x3 image, a year ago. We added the next generation HMI eScan 1100 to our product portfolio. With a 5x5 image, it demonstrates successful multibeam operation, simultaneously scanning with 25 beams. The 5x5 system has higher sensitivity for detecting voltage contrast defects and physical defects while substantially increasing inspection throughput. At this stage, our customers are evaluating our multibeam systems.
eScan 1100
System and process control
Our system and process control software products enable automated control loops to keep lithography processes operating optimally. Using powerful algorithms, they analyze metrology and inspection data and calculate necessary corrections for each individual exposure that can be fed back to the lithography system to minimize edge placement error in subsequent wafer lots. In this way they enable the creation of ever more advanced microchips with maximum yield and performance. Our system and process control roadmap aims to take increasing advantage of the huge flexibility of our lithography systems and apply more powerful algorithms with higher-order corrections to support our customers own roadmaps for increasing EPE performance.
Computational lithography
ASML ANNUAL REPORT 2021 26
Our computational lithography solutions are used in the development of new chips to optimize reticle patterns and the setup of the lithography system to ensure robust, manufacturable designs that deliver high yields. Insight from computational lithography solutions is also increasingly being used to guide metrology and inspection, increasing throughput and enabling more precise process monitoring and control in high-volume manufacturing.
These products are based on accurate computer simulations of the lithography system and process, representing a wide variety of physical and chemical effects. Machine learning techniques are also increasingly used to further speed development. We are continually developing our computational lithography offering to increase the range and accuracy of models and reduce the computational time and cost.
Visit www.asml.com for more product details and specifications.
Managing our installed base systems
The installed base of ASML systems continues to grow, with many systems finding second or even third lives at new owners in new markets and applications. To provide all our customers with the best possible value proposition, we offer an extensive installed base management portfolio, including a wide range of service and upgrade options.
We develop and sell product options and enhancements designed to improve throughput, patterning performance and overlay. Through field-upgrade packages, it is possible to upgrade older systems to improved models in the field. This enables customers to optimize their cost of ownership over the system’s lifetime.
Customer support
We support our customers with a broad range of applications, services, and technical support products to maintain and enhance our systems' performance. We have almost 7,000 customer support employees, who work to ensure the systems in our customers’ fabs run at the highest levels of predictability and availability. We offer 24/7 support, next-day parts delivery, an easy, centralized customer portal, and training for customer engineers. In 2021, our customer support organization has provided nearly 5,000,000 hours of customer support, up from 4,500,000 hours in 2020.
ASML ANNUAL REPORT 2021 27
Our markets
Our customers are the world’s leading microchip manufacturers, and our success is inextricably linked with theirs. We design our machines based on their input, engage in helping them achieve their technology and cost roadmaps, and work together to make sure our machines are running smoothly in their fabs.
Our customers can be grouped into Memory and Logic chipmakers.
Memory chips can store a large amount of data in a very small area. They are used in an increasing variety of electronic products like servers, data centers, smartphones, high-performance computing, automotive or personal computers, and other communication devices. There are two main classes of Memory: NAND and DRAM.
With NAND chips, data can be stored even when a device is powered off. DRAM memory is used to efficiently provide data to the processor. These DRAM and NAND chips are typically made in dedicated Memory-chip factories.
Logic chips, which process information in electronic devices, are produced by two groups of manufacturers. The first group, known as integrated device manufacturers (IDMs), designs and manufactures Logic chips. The second group comprises contract manufacturers known as foundries. Foundry manufacturers produce chips for ‘fabless’ companies, which focus only on chip design and distribution, but do not manufacture microchips themselves.
Both Logic and Memory chips can vary greatly in complexity and capability. For example, the most advanced chips are powering leading-edge technology in artificial intelligence (AI), big data and automotive technology, while the simpler, low-cost chips are integrating sensing capabilities in everyday technology to create a vast IoT.
The chip market (worldwide semiconductor revenues) has grown by 5% per year in revenue on average over the past 20 years, and is projected to grow even stronger. The factors driving this growth have radically changed. In the 1990s, personal computers (PCs), both desktops and later laptops, drove chip demand. In the 2000s, the market driver evolved from PCs to smartphones. These in turn produced new market drivers, data centers and (edge) cloud solutions, where data from PCs and smartphones is routed, processed and stored with the extensive use of specialized Logic chips, in combination with DRAM, NAND and HDD storage.
ASML ANNUAL REPORT 2021 29
Semiconductor industry trends and opportunities
Technology is evolving fast, and the next level of computing is dawning. The era of mobile computing – where you bring the computer with you – is evolving towards immersive ‘ubiquitous computing’, with computing power available wherever you go.
The transition to ubiquitous computing is enabled by what has been termed the ‘artificial intelligence of things’ (AIoT). AIoT is a smart and connected network of devices that seamlessly communicate over powerful 5G networks, allowing us to unleash the power of data better and faster than ever. This combination of artificial intelligence (AI) technologies with the internet of things (IoT) infrastructure will achieve more efficient IoT operations, improve human-to-machine interactions, and enhance data management and analytics. The potential of AIoT will gradually open up as AI and IoT increasingly intertwine, facilitated by 5G. The vast amount of data that people can access, and the insights this provides, will fuel semiconductor business growth and digital transformation.
There are around 40 billion connected devices currently in use, with more being added every second. This number is expected to increase to 350 billion devices by 2030. Connected IoT devices are expected to create up to 175 ZB (zettabytes) of data per year by 2025 based on external research. In other words, one zettabyte (1021 byte) equals a trillion gigabytes, and to download 175 ZB of data with an average current internet connection speed would take one person 1.8 billion years. This big data will need to become fast data to allow for ubiquitous computing as we move towards ‘edge’ computing, where processing is brought as close to the source of data as possible, rather than in the cloud.
Semiconductor-enabled computing trends
Moore's Law is the guiding principle for the semiconductor industry, the motor driving the industry to transit from mobile computing to ubiquitous computing. This transition continues to expand, facilitating three major trends in computing: applications, data and algorithms.
Semiconductor industry market opportunities
In 2020, more than 953 billion chips were manufactured around the world, feeding a $440 billion industry. In 2021 the semiconductor industry increased the output to over 1.1 trillion chips, turning to a $590 billion market. Growth is set to continue, with market analysts predicting the industry could reach a nearly $700 billion market by 2025.
Semiconductor technology plays a crucial part in shaping the interconnected and intelligent network future, and end markets continue to grow. The overview below shows an outlook on the current market size and market opportunity for the entire industry based on external research.
| | | | | | | | | | | | | | | | | | | | |
| Market | Key driver | 2020 market size ($bn) | 2025 market opportunity ($bn) | 2030 estimation1 ($bn) | Outlook CAGR 2020-2025 (%) | Previous outlook CAGR 2019-2024 (%) |
| Smartphone | Continued refresh of all semiconductor content including image sensors | 116 | 162 | 210 | 7.0 | % | 7.9 | % |
| Personal computing | High-end compute and Memory, fast conversion to SSD | 100 | 121 | 132 | 3.9 | % | 2.8 | % |
| Consumer electronics | Legacy products and packaged ICs, advanced ICs in add-ons | 48 | 74 | 98 | 8.8 | % | 7.7 | % |
| Automotive | Strong IC content growth: GPU, sensors, V2X communication sensing | 39 | 82 | 131 | 16.3 | % | 9.5 | % |
| Industrial electronics | High-end compute for AI on big data and sensors | 50 | 82 | 119 | 10.5 | % | 7.8 | % |
| Wired and wireless infrastructure | Devices for fast data processing, modem, base-station infrastructure refresh | 38 | 53 | 63 | 7.0 | % | 5.5 | % |
| Servers, data centers and storage | High processor and Memory growth, hardware accelerations including GPU | 76 | 119 | 187 | 9.2 | % | 10.6 | % |
| | 466 | 693 | 940 | 8.2 | % | 7.3 | % |
1. ASML extrapolation of data to 2030 using ’15-’25 Compound Annual Growth Rate (CAGR)
ASML ANNUAL REPORT 2021 30
ASML ANNUAL REPORT 2021 31
Semiconductor industry dynamics
Several factors are shaping the semiconductor industry landscape. These are some of the major trends driving industry development, both today and tomorrow.
Rising consumer demand
The convergence of wireless communication, telecom, media and cloud via connected devices continues to drive demand for advanced semiconductors across the globe. Growing populations and urbanization are creating increasing demand for advanced consumer electronic devices. Microchips are at the heart of these devices. Significant growth drivers of the emerging technologies are demanding new and advanced chips that are specifically designed for a wave of new applications. Read more in: Semiconductor industry trends and opportunities and Customer intimacy.
Global race for talent
Highly skilled people with a technical background are scarce in the labor market and competition is growing. Top-tier talent select their employer of choice, not the other way around. The global race for talent is becoming more crucial as the industry competes for a small pool of scientists, engineers and software developers with the skill set to develop innovative solutions.
Companies are trying to staff up for growth, but the high-tech resource pool is shallow. The number of STEM jobs is projected to grow significantly, but it is challenging to fill these given the shortage of qualified candidates. Retaining talent has become crucial for tech companies. Read more in: Our people.
Global geopolitics
The current trade environment presents significant challenges for the global semiconductor industry, and trade tensions and increased protectionism are likely to continue. The global pandemic has alerted governments around the world that global supply chains can create significant geographical dependencies on services, raw materials and end products. Semiconductors play an increasingly important role in the growth and continuity of large industrial complexes and the importance of the semiconductor industry is likely only going to increase. Governments have turned their attention to securing sufficient semiconductor supply to support their local industries, creating higher levels of technological sovereignty and planning significant investments in the semiconductor industry.
The industry is being forced to manage trading costs. Ultimately, this could be passed on to the end market resulting in an increase of prices of devices. Besides the financial implication, trade tensions and protectionism also introduce significant complexity throughout the supply chain and its processes. This is forcing the industry to relook at its global supply chain. Read more in: Our supply chain, How we manage risk and Risk factors.
Expanding R&D investments
In the rapidly evolving semiconductor industry, access to the latest technologies, chip designs and manufacturing processes is the basis for competition. R&D is an ever bigger priority and expense. Chipmakers are faced with supporting applications and end markets that are becoming increasingly complex. Traditional semiconductor companies are challenged to diversify their portfolio, due to the rise of tech platform companies moving toward in-house chip design.
In addition, the incremental costs of executing innovation are rising, requiring higher levels of R&D investments to achieve the same goals. Getting products to the market faster is essential – or the chipmakers risk missing the boat. As a result, there is increased pressure to get solutions to the customers early. Read more in: Innovation ecosystem, Risk factors and Financial performance.
Changing landscape
To capitalize the convergence of megatrends such as AI, IoT, 5G and autonomous vehicles, the industry is investing significant amounts in assets that can unlock value across the portfolio.
The global semiconductor industry has shown tremendous growth in recent years and this is expected to continue. The industry is refocusing on increasing scale and proficiency in core competencies as well as expanding into new capabilities and new markets. Mergers, acquisitions and joint ventures are expected to be key parts of the chip market strategy, with deals focusing on emerging technologies. Read more in: Semiconductor industry trends and opportunities, Our supply chain and Risk factors.
Taking action on climate change
Climate change is an urgent matter around the world. It is a global challenge that requires global responsibility to limit a temperature rise to well below 2°C. The industry has a role to play.
The semiconductor manufacturing process consumes large volumes of energy and water resources. Driving Moore’s Law in enabling shrink and, at the same time, improving computing power and storage capacity, fuels the demand for these resources. New architectures and a new way of looking at the entire ecosystem will be required to enhance energy and water resource efficiency. To meet these challenges, the semiconductor industry has to reduce power consumption. Read more in: Climate and energy.
ASML ANNUAL REPORT 2021 32
SWOT analysis
Acting on the global trends and developments in the semiconductor industry and in society is an important factor in the success of our business, as well as in creating value for our stakeholders. Using these external and internal factors, as well as current and future potential, we have evaluated our company's competitive position in the environment we operate in. The following table provides a brief overview of our strengths, weaknesses, opportunities and threats (SWOT). More information on how we manage the topic can be found in the reference sections.
| | | | | |
| Strengths + | Weaknesses – |
• Technology leadership (Read more in: Our products and services, Innovation ecosystem)
• Market leadership (Read more in: Our products and services, Our markets, Customer intimacy)
• Collaborative & enduring innovation (Read more in: Innovation ecosystem)
• World-class workforce with 'can-do' mentality (Read more in: Our core values, Our people)
• Strong financial position (Read more in: 2021 Highlights, Financial performance)
| • Maturity of resources and processes to support rapid growth (Read more in: Our people, How we manage risk)
• Limited cost leadership advantage (Read more in: Operational excellence, CFO financial review, How we manage risk)
• Increasing complexity of our products and technology (Read more in: How we manage risk)
|
Opportunities ä | Threats æ |
• Riding the tech megatrends (Read more in: Semiconductor industry trends and opportunities, Our strategy)
• Holistic lithography portfolio expansion (Read more in: Our products and services, Our strategy)
• Emergence of new customers in semiconductor industry (Read more in: Semiconductor industry dynamics)
• Raising brand awareness (Read more in: Our people)
• Increasing sustainability drive (Read more in: Our strategy, Circular economy, Climate and energy)
| • Geopolitical tensions (Read more in: Semiconductor industry dynamics, How we manage risk)
• Supply chain disruption (Read more in: Our supply chain, How we manage risk)
• IP technology leadership pressure (Read more: in How we manage risk)
• Intense competition in certain markets (Read more in: How we manage risk)
• Competition for talent (Read more in: Semiconductor industry dynamics, Our people, How we manage risk)
• Outbreaks and the consequences of climate change (Read more in: How we manage risk, Climate and energy)
|
ASML ANNUAL REPORT 2021 33
Our strategy
The long-term growth of the semiconductor industry is based on the principle that the power, cost and time required for every computation on a digital electronic device are continuously reduced by a combination of shrinking – increasing the density of transistors on microchips – and system scaling – improving microchip design, materials and architecture.
For the next decade, we believe that Moore’s Law will continue to evolve from cost of power and time, through system scaling, to measuring energy and time efficiency combined. This means that the semiconductor roadmap will continue to drive scaling in four areas:
•Device-level scaling through new transistor structures and associated materials
•Circuit scaling through optimizing microchip circuit designs
•Dimensional scaling through shrink
•Architectural scaling through 3D-integrated circuits
Scaling fuels the need for advanced semiconductor solutions, where dimensional scaling (shrink) is key to improving circuit density and cost. To drive affordable scaling into the next decade, chip manufacturers’ roadmaps require continued shrink. Lithography is the key enabler for shrink, since it is the process used to pattern the structures on a microchip.
We invest in a technology-based innovation roadmap that enables the continued shrink of microchips by enhancing resolution with EUV, together with the holistic scaling of overlay and pattern fidelity control. Furthermore, we also invest in continued innovations in DUV and metrology and inspection technology, which supplement the power of EUV-led shrink. This is how we pursue our long-term strategic vision.
We innovate across our entire product portfolio at the same pace as our customers through large and sustained investment in research and development. To accelerate our product development, we engineer in parallel, not sequentially, all the while guarding the product’s quality, reliability, manufacturability and serviceability. This enables us to get our innovations into the hands of chipmakers faster. We collaborate with chipmakers to understand how our technology best fits their needs, including their challenges and visions of the future. It is through this collaboration and trust that we can build for today and develop for tomorrow.
Five pillars of our core strategy
To realize our long-term strategic vision within the semiconductor industry, we continue to drive our core strategy, which we define around five major pillars: strengthen customer trust, holistic lithography and applications, DUV competitiveness, EUV 0.33 NA for manufacturing and EUV 0.55 NA insertion.
ASML ANNUAL REPORT 2021 34
Our sustainability strategy
Through our sustainability strategy that comprises five strategic areas – Climate & energy, Circular economy, People, Innovation ecosystem and Responsible supply chain – we continue to advance our corporate responsibility to create long-term value for our stakeholders as well as contribute to the United Nations’ Sustainable Development Goals (SDGs).
We want to ensure sustainable impact while providing the best value for our stakeholders today and in the future. Staying focused on what matters for our business and stakeholders, is the cornerstone of our strategy. Through a materiality assessment, we identify and assess the topics that are most relevant to our stakeholders and sustain ASML's long-term business growth. Read more in: Non-financial statements - Materiality assessment.
For more than a decade, we have been committed to sustainability through multifaceted sustainability programs. We aim to address the issues that are most relevant to us and our stakeholders as part of our duty towards corporate responsibility.
ASML ANNUAL REPORT 2021 35
Our current sustainability strategy was launched in 2018 for the time period 2019–2025, focusing on five strategic sustainability areas. Over the past years, we have shown continuous improvement and consistent performance while gradually expanding our scope. However, the evolution of our company and the increasing demand for transparent reporting on environmental, social and governance (ESG) aspects of sustainability have made us re-assess our sustainability strategy in 2021.
To this end, we have updated our materiality assessment for the remaining period of 2022–2025, based on major sustainability topics and their relative importance to our business operations. The outcome of this assessment served as the basis for ASML to reshape and reformulate our long-term sustainability ambition and targets for 2025 and beyond to strengthen the correlation between our stakeholder expectations and our sustainability strategies.
Raising the bar on ESG sustainability
At ASML, we aim to make positive contributions to a digital and sustainable future with lithography products and services that enable further shrink. As a responsible organization, we want to do more to become a leader in sustainability, using our innovation strengths to get there.
We believe digital technologies are the cornerstone of a sustainable society. Enabled by microchips, they form the heart of tools and solutions that can help society make progress and address global challenges, such as tackling climate change by reducing energy consumption and greenhouse gas (GHG) emissions.
Our products continue to support the continuation of Moore's Law, which makes computation, communication and countless aspects of our lives more energy efficient. Pursuing our vision, we develop lithography technology to continue to produce microchips that are three times more energy efficient every two years. In addition, we are helping our customers to minimize the use of materials and energy required to produce advanced microchips.
We have defined a roadmap to get us to net zero waste disposal to landfill by 2030 and net zero value chain emissions by 2040. We aim to achieve this with a diverse, engaged and talented workforce and a strong network of innovation partners, all with a keen eye for the needs of a more sustainable society. To be successful, we need to embed this ESG ambition into our corporate culture, mindset and everyday operations.
Our ESG sustainability roadmap 2022–2025
Building on our current sustainability strategy and the progress we have made, we have re-assessed and are currently enriching our roadmaps toward 2025. We look at our impact at various levels, from society at large to our own operations. As a result of this extensive re-assessment, we have consolidated the material issues and our impact areas to nine sustainability themes categorized by the environmental, social and governance (ESG) aspects of our company, business and operations.
ASML ANNUAL REPORT 2021 36
| | | | | |
| Category | Themes |
| Environmental | Energy efficiency & climate action
Circular economy |
| Social | Attractive workplace for all
Innovation ecosystem
Responsible supply chain
Valued partner for our communities |
| Governance | Integrated governance
Stakeholder engagement
Transparent reporting |
Environmental
We develop lithography technology to continue to produce microchips that are more energy efficient with each new generation, replacing many energy-inefficient technologies, products and services. Reducing our environmental footprint and managing our waste – both from our operations and the use of our products and services – is key to our circular economy approach and sustainability practices.
We maintain our ambition to achieve carbon neutrality with net zero emissions in our operations (scope 1 and 2) by 2025. At the same time, we raise our ambition on scope 3 emissions. Through close collaboration with our tier-1 suppliers we aim to achieve net zero emissions in our supply chain by 2030. In addition, through industry collaboration on a joint roadmap, we strive toward net zero emissions for our products’ use at our customers (scope 3) by 2040.
Social
As a multinational technology company, we impact many people’s lives, both directly and indirectly. Driven by our values and commitment to corporate responsibility, we want to have a positive role in society – for our employees, the communities around us, and everyone involved in our innovation ecosystem and supply chain.
We aim to provide the best possible employee experience, wanting the talent we need to choose to work for us and want to stay with us for the long run. We foster a culture where different identities, backgrounds, talents and passions are valued and celebrated, and we enable our leadership to bring out the best in people – leading through trust, empowerment and accountability. We also play an active role in the communities around us. We aim to be a valued and trusted partner, improving the quality of life for all, with a special focus on people in underserved communities.
We strengthen innovation and nurture young entrepreneurship in our industry and innovation ecosystem. We collaborate closely with our customers and partners in our value chain to help them achieve their goals and realize new technology and applications. We strive to meet industry social, ethical and environmental standards, and we require our suppliers to meet them as well.
Governance
With the growth of the company, organizational structures have become more complex. We champion good integrated corporate governance, of which independence, accountability and transparency are the most significant elements. These are also the elements on which a relationship of trust, respect and mutual benefit between us and our stakeholders – shareholders, customers, suppliers, employees and society – can be built. Continuous stakeholder engagement, in which we embrace open dialogue and knowledge-sharing through various channels and at a variety of levels, is important in our innovation-driven industry and helps us to identify areas of improvement.
To achieve our ambitions within the timeframe set, we focus on strengthening our organization’s governance structure to ensure that each project on our ESG sustainability roadmap is embedded in operational business plans and is best-equipped to meet its targets.
Reader’s guidance on ESG topics in this annual report
The 2021 Annual Report outlines ASML’s strategy, programs and performance during the 2021 calendar year. In terms of sustainability performance, we refer to the five strategic areas of sustainability – Climate & energy, Circular economy, People, Innovation ecosystem and Responsible supply chain – consistent with our disclosure since 2019.
While we have launched our updated ESG focus areas on ASML’s Investor Day on September 29, 2021, the process of defining the metrics to measure our performance and success was underway and implementation will start in 2022. We will report on our updated ESG ambitions using this set of metrics per our 2022 Annual Report.
ASML ANNUAL REPORT 2021 37
ASML ANNUAL REPORT 2021 39
How we create value
The success of our business depends on strong, sustainable relationships with all stakeholders in the value chain to achieve the desired innovations in semiconductor technology. We use input from stakeholders and trends in our industry and society to develop our strategy, our products and services. We define our stakeholders as our shareholders, customers, suppliers, employees and the society we operate in.
We are committed to creating long-term value for our stakeholders and generating broader impact towards the UN's Sustainable Development Goals (SDGs). We base our value creation model on the framework developed by the International Integrated Reporting Council (IIRC), in which we modeled the capital resources we use for our business activities in the executing of our strategy, to the financial, environmental, social and governance topics. Each capital resource is interrelated, and business activities often require a mix of capital. For each topic we developed performance indicators that measure progress on the outcomes against the capital resources used. We aim to use our capital resources in the most effective way by maximizing their potential value and minimizing their negative impact as part of our continuous drive to improve and to generate long-term value for all of our stakeholders.
Stakeholder value
Our purpose and strategy is aimed at creating both short- and long-term value through our financial, environmental, social and governance focus areas and topics. The short-term value – time horizon of one year – is expressed in the 2021 outcome performance indicators. More information on our progress can be found in subsequent sections of this annual report. The long-term value – time horizon of five to ten years – is described below, which is categorized in the value created per stakeholder. Lastly we have linked our long-term impact along the entire value chain to the SDGs set by the United Nations. We focus on five SDGs where we can make the greatest impact: SDG 4 Quality education, SDG 8 Decent work and economic growth, SDG 9 Innovation and infrastructure, SDG 12 Responsible production and consumption, and SDG 13 Climate action.
Long-term stakeholder value
Our core values – challenge, collaborate and care – are a key contributor to our culture aimed at long-term value creation and as such an important enabler in the execution of our strategy. We define our long-term value for all our stakeholders as follows:
Shareholder value
Our large and sustained investments in research and development to execute our business strategy enable us to maintain our position as a leader in holistic lithography. Our innovations contribute to the long-term growth of the semiconductor industry, which contributes to our solid financial performance and capital return policy.
Customer value
As one of the world’s leading manufacturers of chip-making equipment, we invest in innovations that enable the continued shrink of microchips. With EUV 0.33 NA and the next-generation EUV 0.55 NA platform, we pursue the continuation of Moore’s Law. This allows our customers to develop ever-more powerful chips for new applications and devices. At the same time, we help our customers to reduce their costs and environmental footprint by embedding circularity principles in our products.
Supplier value
As we grow and our innovations enter ever-higher levels of complexity, we want our suppliers to grow with us. We innovate together with our supplier network, sharing knowledge and tapping into each other’s technology expertise. Long-term relations, close cooperation and transparency with our suppliers are key to our success.
Employee value
Our workforce has grown steeply in recent years, almost doubling from around 16,500 FTE in 2016 to over 32,000 FTE in 2021. For example, with 16,727 employees at our headquarters in Veldhoven, the Netherlands, we are a major employer in the community. We are a proud employer of 122 nationalities, allowing for diverse points of view in our quest to develop the best ideas. Developing our people is crucial to the sustained success of our business, so we invest in their career development and well-being.
Societal value
With our continuous innovations, we enable new technology that supports the growth and transformation of the semiconductor industry, using artificial intelligence to offer new applications and services to address society’s needs. Through our innovation ecosystem we nurture innovation by giving back to society, such as by sharing our expertise with universities and research institutes, supporting young tech companies, and promoting STEM education worldwide. We also develop groundbreaking technology to reinforce our innovation footprint and minimize our environmental footprint. We do this by seeking to minimize waste and maximize the value of material we use, and execute our carbon footprint strategy and product energy efficiency strategy.
Sustainable impact
We believe the chip industry is in a unique position to tackle socioeconomic and environmental challenges. We focus on the challenges and sustainability areas that are most relevant to our stakeholders and where we believe ASML can have the greatest
ASML ANNUAL REPORT 2021 40
impact in the long term. Read more in: Non-financial statements - Materiality assessment and Semiconductor industry trends and opportunities - SWOT analysis). We focus on those United Nations Sustainable Development Goals on which ASML can make a real difference.
ASML ANNUAL REPORT 2021 41
Message from the CFO
Roger Dassen (Executive Vice President and Chief Financial Officer)
Dear Stakeholder,
Strong growth in semiconductor end markets, driven by the acceleration of the digital infrastructure, and increasing lithography intensity on future advanced nodes fuel demand for our products and services. These dynamics drive the growth of our company, in terms of sales, our workforce and the investments we make to increase our capability in support of our customers’ wafer demand. With our continued investments in technology leadership we have created significant value for all our stakeholders and we have the right tools in place to achieve continued sustainable growth for the years ahead.
Record net sales in 2021
This was another growth year for ASML, setting a record with €18.6 billion in net sales, an increase of €4.6 billion. The COVID-19 crisis has accelerated digitalization worldwide, which has led to a strong increase in demand from our customers across all market segments from both advanced and mature nodes.
Logic system sales grew by €2.2 billion, or 30%. This was due to customers continuing to see strong demand for both advanced and mature nodes in support of the ongoing digital transformation, which includes secular growth drivers, such as 5G, AI, virtual reality, gaming, simulation and visualization applications, and the intelligent cloud and edge that will be an integral part of the growing digital infrastructure. Memory system sales grew by €1.1 billion, or 39%, as a result of strong end-market demand for servers and smartphones.
In EUV we see an increased layer adoption by customers in Logic and DRAM. Adoption is expected to continue to grow to reduce patterning complexity and cost and support our customers' surging demand. This led to EUV system revenue of €6.3 billion in 2021, an increase of €1.8 billion compared to 2020. We successfully shipped and recognized 42 EUV systems in 2021, including our first NXE:3600D for use in high-volume manufacturing. In total we shipped 26 NXE:3600Ds in 2021. Compared to the NXE:3400C the NXE:3600D has around 30% better performance in product overlay and offers 15% to 20% increased throughput productivity.
Net service and field option sales grew by €1.3 billion, or 35%, driven by an increase in the sales of productivity, overlay and focus upgrade packages, in combination with a growing installed base. With the global chip shortage, our customers have pulled forward demand for our productivity enhancement packages, which provide the most effective and efficient way to increase wafer output as they can be installed quickly.
Challenges in our supply chain
To meet the strong demand across our entire product portfolio, we have been driving down our manufacturing cycle times and we are working with our supply chain to increase our output capability for EUV as well as DUV. In the process of increasing capacity to meet the increased demand, the after-effects of the COVID-19 crisis were felt in the form of some materials shortages in our supply chain. We worked closely with our suppliers and customers to address the materials shortages to support the increased worldwide demand across all our business lines, but these shortages did result in the late start on the assembly of a number of systems. In addition, we experienced issues in the start-up of our new logistics center. As a consequence of these factors and the high-demand environment, our customers are more frequently requesting fast shipments, where we expedite the delivery of systems by shipping before completion of the normal Factory Acceptance Tests (FAT), in order to bring systems into production as quickly as possible. This resulted in revenue recognition being delayed from shipment until after formal customer acceptance tests are completed in the field.
ASML ANNUAL REPORT 2021 43
As a result of the start-up issues at our new logistics center in Veldhoven and the materials shortages in our supply chain, we experienced delays in shipments. In order to address our customers' needs for additional wafer capacity, we expedited delivery of productivity upgrades. Overall, our capabilities to support the strong customer demand has contributed to total net sales growing by 33% in 2021.
Outlook
The ongoing digital transformation and current chip shortage further fuel the need to increase our capacity to meet the current and expected future demand. We expect continued growth in our Logic business assuming that customer demand remains strong for both advanced and mature nodes. For Memory this year's growth is expected to continue into 2022 as lithography tool utilization remains very high, while customers indicate they see strong demand growth for DRAM and NAND. To meet demand for this expected bit growth, customers will need to add capacity as well as continue to make node migrations. As customers migrate to more advanced nodes we also expect to see an increase in EUV demand for Memory. Our services and upgrades business will continue to scale as our installed base grows, and we expect significant demand for upgrades, with increasing contribution from EUV service revenue as this technology ramps in volume production.
Strong gross profit, net income and cash provided by operating activities
Gross profit as a percentage of net sales increased from 48.6% in 2020 to 52.7% in 2021, mainly attributable to the NXE 3600D and DUV immersion systems value proposition and continued growth in our installed base business. We continue to drive profitability of our EUV systems, and as a result, we achieved 50% system gross margin in 2021. Looking ahead, we will continue to seek improvements in the margins in both systems and service via cost reduction and delivering more value, leading to higher selling prices.
Our effective tax rate increased to 15.2% mainly due to an increase in the innovation box tax rate in the Netherlands as of 2021. We expect our effective tax rate to be approximately 16% in the coming years.
Our strong net income and continued working capital improvement initiatives resulted in Net cash provided by operating activities increasing by €6.2 billion in 2021. The significant growth allowed us to return record amounts to our shareholders through dividends and our share buyback programs. In 2021 we repurchased shares for a total consideration of €8.6 billion and paid dividends totaling €1.4 billion. We expect continued strong cash returns to shareholders for next year.
Overall, it was another record year for ASML, driven by the ongoing digital transformation and current chip shortage. The secular growth trends, as part of the digital transformation to a more connected world, and countries pushing for technological sovereignty are fueling future demand across all market segments at both the advanced and mature nodes.
Roger Dassen
Chief Financial Officer
ASML ANNUAL REPORT 2021 44
ASML operations update on key performance indicators
The following table presents the KPIs used by our Board of Management and senior management to measure performance.
| | | | | | | | | | | | | | |
| Year ended December 31 (€, in millions, unless otherwise indicated) | 2020 | %1 | 2021 | %1 |
| Sales | | | | |
| Total net sales | 13,978.5 | | | 18,611.0 | | |
| Year-over-year increase in total net sales (%) | 18.3 | | | 33.1 | | |
| Net system sales | 10,316.6 | | | 13,652.8 | | |
| Net service and field option sales | 3,661.9 | | | 4,958.2 | | |
Sales of lithography systems (in units) 2 | 258 |
| 309 |
|
| Immersion systems recognized (in units) | 68 | | | 81 | | |
| EUV systems recognized (in units) | 31 | | | 42 | | |
| Profitability | | | | |
| Gross profit | 6,797.2 | | 48.6 | | 9,809.0 | | 52.7 | |
| Income from operations | 4,051.5 | | 29.0 | | 6,750.1 | | 36.3 | |
| Net income | 3,553.7 | | 25.4 | | 5,883.2 | | 31.6 | |
| Liquidity | | | | |
| Cash and cash equivalents | 6,049.4 | | | 6,951.8 | | |
| Short-term investments | 1,302.2 | | | 638.5 | | |
| Net cash provided by operating activities | 4,627.6 | | | 10,845.8 | | |
Free cash flow 3 | 3,626.8 | | | 9,905.5 | | |
1.As a percentage of total net sales.
2.Lithography systems do not include metrology and inspection systems.
3.Free cash flow is a non-GAAP measure and is defined as net cash provided by operating activities (2021: €10,845.8 million and 2020: €4,627.6 million) minus purchase of property, plant and equipment (2021: €900.7 million and 2020: €962.0 million) and purchase of intangible assets (2021: €39.6 million and 2020: €38.8 million). We believe that free cash flow is an important liquidity metric for our investors, reflecting cash that is available for acquisitions, to repay debt and to return money to our shareholders by means of dividends and share buybacks. Purchase of property, plant and equipment and purchase of intangible assets are deducted from net cash provided by operating activities in calculating Free cash flow because these payments are necessary to support the maintenance and investments in our assets to maintain the current asset base.
ASML ANNUAL REPORT 2021 45
Operating results of 2021 compared to 2020
| | | | | | | | | | | | | | | | | |
| Year ended December 31 (€, in millions) | 2020 | %1 | 2021 | %1 | % Change |
| Net system sales | 10,316.6 | | 73.8 | | 13,652.8 | | 73.4 | | 32.3 | |
| Net service and field option sales | 3,661.9 | | 26.2 | | 4,958.2 | | 26.6 | | 35.4 | |
| Total net sales | 13,978.5 | | 100.0 | | 18,611.0 | | 100.0 | | 33.1 | |
| | | | | |
| Cost of system sales | (5,169.3) | | (37.0) | | (6,482.9) | | (34.8) | | 25.4 | |
| Cost of service and field option sales | (2,012.0) | | (14.4) | | (2,319.1) | | (12.5) | | 15.3 | |
| Total cost of sales | (7,181.3) | | (51.4) | | (8,802.0) | | (47.3) | | 22.6 | |
| | | | | |
| Gross profit | 6,797.2 | | 48.6 | | 9,809.0 | | 52.7 | | 44.3 | |
| | | | | |
| Research and development costs | (2,200.8) | | (15.7) | | (2,547.0) | | (13.7) | | 15.7 | |
| Selling, general and administrative costs | (544.9) | | (3.9) | | (725.6) | | (3.9) | | 33.2 | |
| Other income | — | | — | | 213.7 | | 1.1 | | N/A |
| Income from operations | 4,051.5 | | 29.0 | | 6,750.1 | | 36.3 | | 66.6 | |
| | | | | |
| Interest and other, net | (34.9) | | (0.2) | | (44.6) | | (0.2) | | 27.8 | |
| Income before income taxes | 4,016.6 | | 28.7 | | 6,705.5 | | 36.0 | | 66.9 | |
| | | | | |
| Income tax expense | (551.5) | | (3.9) | | (1,021.4) | | (5.5) | | 85.2 | |
| Income after income taxes | 3,465.1 | | 24.8 | | 5,684.1 | | 30.5 | | 64.0 | |
| | | | | |
| Profit from equity method investments | 88.6 | | 0.6 | | 199.1 | | 1.1 | | 124.7 | |
| Net income | 3,553.7 | | 25.4 | | 5,883.2 | | 31.6 | | 65.6 | |
1.As a percentage of total net sales.
For a comparison of ASML’s operating results for the year ended December 31, 2020 with the year ended December 31, 2019, please see CFO financial review - Financial performance - Operating results of 2020 to 2019 of ASML’s annual report on Form 20-F for the year ended December 31, 2020.
Total net sales and gross profit
We achieved another record year in 2021, with Total net sales increasing by €4,632.5 million, 33.1%, reflecting an increase in Net system sales of 32.3%, and an increase in Net service and field options sales of 35.4% compared to 2020.
We saw growth in both Logic and Memory markets, which is a reflection of our customers' drive to innovate and continue to invest in future technology nodes to facilitate the acceleration of the digital infrastructure and the push for ‘technological sovereignty’, and increase manufacturing capacity to address the global chip shortage. Logic demand for both advanced and mature nodes continues to be strong, driven by the digital transformation and distributed computing. Memory demand continues to grow, fueled by end-market demand for servers and smartphones.
ASML ANNUAL REPORT 2021 46
The increase in Net sales was driven by a strong increase in demand from our customers across all technologies. Our DUV and EUV sales volumes increased to keep up with customer demand driven by the ongoing digital transformation and current chip shortage. We recognized revenue for 42 EUV systems in 2021 compared to 31 EUV systems in 2020. Our system sales across our DUV technologies increased from 227 units in 2020 to 267 units in 2021.
In addition to the growth in EUV and DUV, Service and field options sales were also a key driver for our overall growth in net sales. The increase is driven by an increase in the sales of productivity, overlay and focus upgrade packages, which provide the most effective and efficient way to increase wafer output quickly, supported by a growing installed base. EUV continues to contribute in a more meaningful way to net service and field option sales as our installed base continues to grow and our customers continue to run more EUV systems in their high-volume production.
Gross profit
Gross profit increased as a result of both an increase in sales and profitability. Gross profit as a percentage of net sales increased from 48.6% in 2020 to 52.7% in 2021, mainly attributable to improvement in our EUV profitability as we deliver more value to our customers, DUV product mix and improved profitability in our installed base business through a ramp in production and an increase in the number of productivity upgrades.
Research and development costs
R&D costs were €2,547.0 million in 2021 as compared to €2,200.8 million in 2020. The increase is across each of our EUV, DUV and Applications programs supporting our holistic lithography solutions, with the most significant investments going toward our roadmap to continue enhancing EUV high-volume manufacturing, as well as our development of EUV 0.55 NA (High-NA). In 2021, R&D activities mainly related to:
•EUV – Continued investments in EUV high-volume manufacturing, finalizing the development of the NXE:3600D, investments in the development of the NXE:3800E, and further improving availability and productivity of our installed base systems. In addition, our roadmap includes High-NA, our next-generation EUV 0.55 NA systems, to support our customers with future nodes for both Logic and DRAM.
•DUV – Ramp-up of our latest-generation immersion system NXT:2050i and introduction of the dry system XT:860N. Continued developments for the next generation of scanners shipping in 2022, NXT:2100i for the most critical DUV layers, and NXT:870 for break-through productivity in the KrF dry market. Productivity improvements continue to be developed to boost wafer-per-day at customers' installed base.
•Applications – Continued investment in Single Beam Inspection, E-Beam Metrology and Optical Metrology (Yieldstar ADI and IDM solutions). In addition, securing our Multibeam Inspection roadmap and continuously expanding our investment in the holistic software applications space.
ASML ANNUAL REPORT 2021 47
Selling, general and administrative costs
SG&A costs increased by 33.2% from 2020 to 2021 due to an increase in the number of employees, as well as investments in digitalization and cybersecurity to support our growth. Our selling, general and administrative costs as a percentage of net sales in 2021 remained at 3.9% (in 2020 3.9%).
Income taxes
The effective tax rate increased to 15.2% in 2021, compared to 13.7% in 2020. The higher rate is mainly due to an increase in the innovation box rate in the Netherlands changing from 7% to 9% as of 2021.
Net income
Net income in 2021 amounted to €5,883.2 million, or 31.6% of total net sales, representing €14.36 basic net income per ordinary share, compared to net income in 2020 of €3,553.7 million, or 25.4% of total net sales, representing €8.49 basic net income per ordinary share.
ASML ANNUAL REPORT 2021 48
Cash flow analysis
This year we achieved a record setting cash flow performance. Our Net cash provided by operating activities increased to €10.8 billion (2020: €4.6 billion) driven by the strong worldwide demand from our customers and our working capital initiatives. We also continued our efforts to return cash to our shareholders. We were able to return a record amount of cash to our shareholders through our share buyback program and growing dividends. In 2021 we purchased €8.6 billion (2020: €1.2 billion) of shares and paid out a total dividend of €1.4 billion (2020: €1.1 billion).
We continue to heavily invest in our next-generation technologies in order to secure future growth opportunities which requires significant cash investment in net working capital, capital expenditures and R&D. However, our capital allocation policy remains unchanged.
| | | | | | | | |
| Year ended December 31 (€, in millions) | 2020 | 2021 |
| Cash and cash equivalents, beginning of period | 3,532.3 | | 6,049.4 | |
| | | |
| Net cash provided by (used in) operating activities | 4,627.6 | | 10,845.8 | |
| Net cash provided by (used in) investing activities | (1,352.2) | | (72.0) | |
| Net cash provided by (used in) financing activities | (753.0) | | (9,891.7) | |
| Effect of changes in exchange rates on cash | (5.3) | | 20.3 | |
| Net increase (decrease) in cash and cash equivalents | 2,517.1 | | 902.4 | |
| | | |
| Cash and cash equivalents, end of period | 6,049.4 | | 6,951.8 | |
| Short-term investments, end of period | 1,302.2 | | 638.5 | |
| Cash and cash equivalents and short-term investments | 7,351.6 | | 7,590.3 | |
| | | |
| Purchases of property, plant and equipment and intangible assets | (1,000.8) | | (940.3) | |
| | |
Free cash flow 1 | 3,626.8 | | 9,905.5 | |
1.Free cash flow is a non-GAAP measure and is defined as net cash provided by operating activities (2021: €10,845.8 million and 2020: €4,627.6 million) minus purchase of property, plant and equipment (2021: €900.7 million and 2020: €962.0 million) and purchase of intangible assets (2021: €39.6 million and 2020: €38.8 million).
Net cash provided by (used in) operating activities
The significant increase in Net cash provided by operating activities of €6.2 billion compared to 2020, is mainly due to an increase in Net income of €2.3 billion and increase in down payments from our customers in connection with our continued working capital improvement initiatives.
Net cash provided by (used in) investing activities
The decrease in Net cash used in investing activities of €1.3 billion compared to 2020, is mainly due to the maturity of most of our short-term investments offset with limited purchases of new short-term investments as significant cash was used for our share buyback program. In 2021 we sold the non-core business acquired as part of the Berliner Glas acquisition for €0.3 billion, while Berliner Glas was acquired for total consideration of €0.3 billion in 2020.
Net cash provided by (used in) financing activities
The significant increase in Net cash used in financing activities of €9.1 billion compared to 2020, is mainly due to an increase of €7.4 billion in the shares purchased through our share buyback program resulting in a total of €8.6 billion purchased shares. Additionally, we were able to increase our dividend by €0.3 billion to a total of €1.4 billion. In 2020, we had net proceeds from issuances of notes of €1.5 billion, with no issuance in 2021.
As of December 31, 2021, management has determined that ASML has sufficient working capital for the company’s present requirements.
ASML ANNUAL REPORT 2021 49
Long-term growth opportunities
Trend information
We expect 2022 to be another growth year with an expected net sales increase of around 20% compared to 2021 driven by healthy Logic demand and growth in the Memory market. The expected growth is driven by increasing sales on all platforms, as well as growth in our installed base business. The positive industry momentum around innovation and expanding new markets further strengthen our confidence in the 2022 outlook and our 2025 growth scenarios.
In Logic, we see the digital transformation that is underway as we move to a more connected world. The broadening application space and secular growth drivers translate to very strong demand for both advanced and mature nodes. With this continued strong demand, we expect Logic system revenue to be up more than 20% year-on-year.
In Memory, we also expect continued growth of our business this year. Customers have indicated systems are operating at higher utilization levels. As customers are making the technology transition to support projected growth, additional capacity additions are expected to be required. Subsequently, this is expected to trigger equipment demand. As a result, it seems likely that we will see strong lithography equipment demand from the Memory market in 2022 with a system revenue to be up around 25% year-on-year.
Customers adopted EUV, and with increasing customer confidence in EUV, this is translating into more layers in their next nodes, for Logic production as well as the adoption in Memory. We expect to ship around 55 systems of which we expect revenue from 6 systems to be deferred to 2023 due to fast shipments. Despite this shift, we expect 25 percent growth in our EUV system revenue in 2022.
In our DUV and Applications business, we expect growth in both immersion and dry systems, as well as continued demand for metrology and inspection systems. We expect revenue growth of over 20% for non-EUV shipment revenue.
We expect further growth in our Installed Base Management business to around 10% year-on-year as the demand for services will continue to expand as our installed base grows. Additionally, we anticipate an increased contribution to service sales from EUV as more and more systems start running wafers in volume manufacturing, as well as expect significant demand for upgrades, particularly in EUV, as customers utilize upgrades as a quick way to increase capacity.
Our expectations and guidance for the first quarter of 2022 can be summarized as follows:
•Total net sales between €3.3 billion and €3.5 billion
•Gross margin of around 49%
•R&D costs of around €760 million
•SG&A costs of around €210 million
•Annualized effective tax rate between 15% and 16%
The trends discussed above are subject to risks and uncertainties. Read more in: Special note regarding forward-looking statements.
Outlook 2025 and 2030
This decade is all about distributed computing, bringing the cloud closer to devices at the edge, and through connectivity the computing power will be available to all of us ‘on device’ enabling a connected world. These global megatrends in the electronics industry, supported by a highly profitable and fiercely innovative ecosystem, are expected to continue to fuel growth across the semiconductor market. This translates to increased wafer demand at both advanced and mature nodes.
The push of countries around the globe for technological sovereignty is expected to drive increased capital intensity. This means that the industry is expected to make significant investments in wafer capacity, with increasing lithography spending. The semiconductor end markets, such as automotive, data centers, industrial and consumer electronics, are expected to grow more than 7% year on year until at least 2025, fueling the strong growth of our business based on an increased mix of EUV while the demand for DUV is expected to remain strong across all wavelengths. To achieve this, we and our supply chain partners are actively adding and improving capacity to meet future customer demand.
On September 29, 2021 we presented at our Investor Day, our upward revised long-term growth opportunity for 2025 in which we re-modeled our previous sales scenarios in a low and high market due to the rapid evolution of digitalization we have seen in the past two years. Customers’ strong capital expenditure growth is expected to continue, translating to an expected lithography capex CAGR of 13.8% (2017-2025). This compares to previous expected CAGR estimate of 7.5% over the same period, as shown at our Investor Day 2018.
ASML ANNUAL REPORT 2021 50
Based on the different market scenarios, we believe we have an opportunity to reach annual sales in 2025 between approximately €24 billion and €30 billion, with a gross margin between approximately 54% and 56%.
Moving beyond 2025, we also announced that we see that the growth opportunities will continue and that we expect our Systems and Installed Base Management to provide an annual sales growth rate of around 11% for the period 2020-2030, based on third-party research and our assumptions.
Our sales potential is primarily based on assumed organic growth. We continuously review our product roadmap and have, from time to time, made focused acquisitions or equity investments to enhance the industrial synergy of our product offering. Based on such reviews and the assessment of clear potential product and value synergies, we may also evaluate and pursue focused merger and acquisition activities in the future. Within this growth ambition, we expect to continue to return significant amounts of cash to our shareholders through a combination of growing annualized dividends and share buybacks.
Lastly, we seek to continuously improve our performance on ESG Sustainability KPIs and upgrade the KPIs in 2022 based on our ESG Sustainability strategy roadmap update to accelerate progress in close collaboration with our partners. Read more in: Our position in the semiconductor value chain - Our strategy.
ASML ANNUAL REPORT 2021 51
Climate change is a global challenge that requires urgent action by everyone, including us. The challenge to limit the temperature rise to well below 2°C is a global responsibility. At ASML, we’re committed to reducing our carbon footprint. In terms of carbon footprint, we identify three impact areas: the direct emissions from fossil fuels (scope 1) used on our premises, the indirect emissions from the electricity consumption (scope 2) on our premises, and the indirect emissions in our value chain (scope 3) from upstream supply chain and downstream use of our products by customers.
In our carbon footprint strategy, we have determined our ambition and set targets in all three areas. We are taking direct responsibility over the CO2 emissions from our own operations (scope 1 and 2), for which we aim to achieve net zero CO2 emissions by 2025. We also recognize that our footprint extends beyond this to our value chain (scope 3). Our main influence on scope 3 emissions is the carbon footprint of our products which we aim to reduce by enhancing their energy efficiency while increasing their productivity.
We identify and assess the impact of climate-related risks and opportunities using the assessment guidelines of the Task Force on Climate-related Financial Disclosures (TCFD). Read more in: Our TCFD Recommendations: climate-related disclosure, available on www.asml.com.
Carbon footprint strategy
Over the past years, we have made significant steps in our performance and achievements with regard to reducing our scope 1 and 2 carbon footprint and energy consumption, as well as maturing our scope 3 calculation. Although we see many positive results and are making progress, we also realize that we are not there yet.
Our scope 1 and 2 carbon footprint strategy is built on three principles: reducing energy consumption wherever we can, using only green renewable energy, unless no other solution is possible or reasonably feasible, and compensating for the residual emissions.
Our target is to achieve scope 1 carbon neutrality by 2025, we aim to do this by direct energy saving of 100 TJ (or 2.5 kt) by executing the more than 25 projects we have defined in our master plan, adding renewable production of energy on our sites, optimizing the use of our m2 and relocating our employees to more energy-efficient offices (BREEAM certified) and implementing an off-setting strategy for the remaining emissions. The main components of the energy-saving master plan are improving the energy efficiency of technical installations, improving energy management of our operations, and increasing the production of our own renewable energy. The table below, includes the top three key projects.
| | | | | | | | | | | |
| Key projects | Total estimated energy saving - annual (in TJ) | Estimated scope 1 reduction: neutral gas (in TJ) | Estimated scope 2 reduction: electricity (in TJ) |
| Energy grid | 50 | -40 | -10 |
| Implement adiabatic humidification and elimination of steam generation | 12 | -12 | 0 |
| Air change reduction (feasibility study) | 20 | 0 | -20 |
With regard to scope 2, our ambition is to increase the share of direct green energy purchases (so-called bundled renewable electricity) from renewable electricity produced close to our premises in the Netherlands, and to reduce the share of certificates. For the US and Asia, our ambition is to purchase renewable energy attribute certificates (respectively RECs and IRECs) and monitor
ASML ANNUAL REPORT 2021 53
the evolution of renewable energy in those countries. Our scope 1 and 2 emissions reduction targets are consistent with reductions required to keep warming to 1.5°C and are approved by the Science Based Targets initiative (SBTi) – under category 'near-term'.
We recognize that environmental impact goes beyond our operations. In general, most of the environmental impact of energy consumption in our value chain (scope 3) comes from the greenhouse gas emissions of our suppliers (upstream) and the use of our products at our customers (downstream). Results show that the indirect emissions (scope 3) from upstream and downstream value chains account for around 98% of the total emissions footprint (scope 1, 2 and 3). Of this, indirect emissions in the value chain, the category ‘downstream' – use of sold products at our customers’ sites – accounts for nearly 65%, and the category ‘upstream' – emissions related to the goods and services we buy – accounts for 30%. The remaining 5% of our scope 3 emissions relates to, among other things, activities linked to transportation, business travel, and commuting.
Our scope 3 target for 2025 is to reduce the intensity level compared to our 2019 baseline of 0.55. The intensity is measured by the total scope 3 emissions (in kilotonnes) normalized to the total revenues (in € million). Taking into account the change in product mix (an increase in the number of EUV systems sold) and the fact that our output in terms of product units manufactured is expected to increase, the overall emissions in the entire value chain are expected to rise. Our supplier sustainability program is a key enabler to reduce the upstream footprint. Read more in: Our performance in 2021 - Social - Our supply chain. And by executing our product energy efficiency strategy, we can reduce our downstream footprint. Read more in: Product energy efficiency strategy.
What we achieved in 2021
In 2021, we expanded our environmental reporting scope to 57 locations – covering more than 95% of our worldwide CO2 emissions – up from the 20 locations in the previous reporting scope, which covered around 90% of our emissions. The extended scope gets us ready for reporting against science-based targets principles in the near future. The combination of our growth and increase in reporting scope has resulted in an increase of our gross scope 1 and 2 emissions by around 19% compared to 2020. In terms of using renewable electricity, we also need to take the expanded environmental reporting scope into account, therefore the share of renewable electricity decreased to 92% compared to the 100% in 2020. Our ambition remains unchanged – for emissions resulting from our operations (scope 1 and 2), we aim to achieve carbon net neutrality (scope 1 and 2) by 2025.
Scope 1 emissions
Compared to our peers in the semiconductor industry, our energy consumption and related carbon footprint is relatively low. As a manufacturer of lithography equipment, our main direct CO2 emissions come from fossil fuels – mainly natural gas. The vast majority of the natural gas consumption is used for heating of our buildings and humidification of the cleanroom to keep them at set temperature and humidity levels. For more information, see the scope 1 breakdown chart.
ASML ANNUAL REPORT 2021 54
Over the 2010–2021 timeframe, we executed nearly 100 energy-saving projects that have resulted in a cumulative reduction of over 260 TJ. Over the same period, our natural gas consumption remained stable, despite significant growth in the number of cleanrooms and offices (over 10,000 m2 added since 2010).
Energy grid
In 2021 we started with a multi-year project to implement an energy grid to re-use waste heat for offices on our site in Veldhoven, the Netherlands. The energy grid is a two-pipe loop that makes waste heat available for heating in winter and energy-efficient cooling in summer. This project, together with the implementation of adiabatic humidification in two of our cleanrooms, is expected to lead to a reduction of around 1.7 million m3 of natural gas which equals 52 TJ.
Energy savings
Energy savings are mainly achieved by using more energy-efficient technical installations and improving our overall production processes. Our efforts focused on recovery of exhaust heat and reduction of the energy consumption of our cleanrooms, where maintaining the right conditions is energy intensive.
In 2021, we saved 13 TJ per year of energy thanks to projects executed in the Netherlands and in Taiwan. In the Netherlands, the largest project was completed and led to nearly 8 TJ savings in 2021 and will lead to around 11 TJ per year onwards. In Hsinchu, Taiwan, we managed to save 3 TJ energy in 2021 by optimizing the use of air-conditioning systems through time-outs.
Continuing our drive to reduce energy consumption even further, we want to achieve direct energy savings of 100 TJ by 2025 by executing around 25 projects in five different sites worldwide, as defined in our energy savings master plan.
Real-estate portfolio
As we grow as a company, we strive to optimize our real estate portfolio. Optimizing the use of every square meter in our portfolio contributes to reducing our environmental footprint – each square meter saved is a square meter we don’t need to heat, cool, ventilate or light up.
When building new offices and manufacturing sites, we take the opportunity to make our buildings as environmentally sound as possible. With an eye on future growth, for example, our new campus in Veldhoven, the Netherlands, is designed with a strong sustainability focus. Its design and use of materials will be assessed on sustainability performance using BREEAM guidelines with score of ‘excellent’. For 2025, we strive to implement the most suitable green building certifications in new constructions – such as BREEAM, LEED and G-SEED – in the countries where we operate.
Scope 2 emissions
Electricity accounts for nearly 80% of the energy we use at ASML. Most of our electricity consumption relates to the manufacturing of chipmaking equipment – from assembly to testing lithography and other systems – and maintaining consistent climate conditions, such as constant temperature, humidity and air quality.
ASML ANNUAL REPORT 2021 55
In 2021, we secured a 10-year purchase agreement for green electricity for our installations in the Netherlands which will enable us to achieve our goal of using 100% renewable electricity in the Netherlands. For our electricity consumption in the US, we also achieved 100% renewable energy. The renewable market situation in Asia is slightly different and more challenging – we are investigating various options to meet our ambitions there as well.
In 2021, we operationalized the 3,700m2 solar panels installed on our campus in Veldhoven, the Netherlands, which are expected to provide the equivalent of around 2.3 TJ per year. We plan to expand the share of solar panels on our sites in the coming years in Europe, the US and Asia.
ASML signs 10-year green power purchase agreement with RWE
In 2020. ASML and RWE, one of the world’s leading renewable energy companies and a major player in global energy trading, signed a power purchase agreement (PPA). Under the terms of the 10-year agreement, ASML will be provided with 263 GWh of green electricity per year from RWE. This agreement brings ASML closer to its objective of carbon neutral electricity by 2025.
The power will be delivered from a portfolio of various renewable energy sources across different technologies: three new RWE onshore wind farms in the Netherlands, a Belgian offshore wind farm and a Dutch solar plant. The two Dutch RWE wind farms Oostpolderdijk and Westereems are located near Eemshaven. The offshore wind farm Noordwester 2 is located off the coast of Zeebrugge in Belgium. The third wind farm and the solar plant are both situated near Borssele in the Netherlands.
Scope 3 emissions
We calculate our scope 3 emissions using guidance from the Greenhouse Gas Protocol – the organization that provides widely used international standards for emissions reporting. We are continuously seeking to improve the data quality of our scope 3 calculations. In 2021 we made another step by requesting CO2 emission data directly from our suppliers through our Suppliers Sustainability program. Recognizing that we depend on our suppliers, we also encourage our value chain partners to work with us to jointly reduce our carbon footprint. Read more in: Our performance in 2021 - Social - Our supply chain.
ASML ANNUAL REPORT 2021 56
Our environmental management system
We have an environmental management system (EMS) in place that helps us monitor our energy and emissions, improve performance, and enhance efficiency. Our EMS is integrated into our combined environmental, health and safety (EHS) management system. All our facilities operate on the basis of this EHS management system – the former HMI locations in Tainan (Taiwan) and San Jose (US) have been successfully integrated. Our EHS management system is ISO:14001 certified and structured in accordance with ISO:45001 requirements. This certification gives our stakeholders confidence in our commitment to achieving our environmental goals.
We measure progress in our emissions reductions by monitoring our scope 1, 2 and 3 emissions, representing three key performance indicators. Our participation in the annual assessment by the Carbon Disclosure Project (CDP), a non-profit global disclosure program, also helps steer our environmental initiatives. Our score in the most recent CDP Climate Change 2021 assessment is C, which is the same level as the sector average.
ASML ANNUAL REPORT 2021 57
Product energy efficiency strategy
With a growing demand for enhanced chip functionality, the complexity and energy consumption of the overall microchip patterning process, including from our lithography systems, is also increasing. A major benefit of the wider adoption of our EUV lithography systems is the ability to simplify patterning schemes to create the most critical layers of a microchip, which reduces the need for applying difficult multiple patterning schemes – this translates into less overall fab energy and materials use to fully process a wafer when compared to a multi-patterning process. However, the laser light plasma technology of EUV requires high electrical power input, therefore our product energy efficiency strategy is focused on EUV. Our challenge is to increase the energy efficiency of our products.
We have set ourselves the target to reduce the overall energy consumption of our future-generation EUV systems by 10% compared to the 2018 baseline model – NXE:3400B – by 2025, in spite of a increasing productivity. Our second target is at the same time to reduce the energy use per exposed wafer pass by 60%, as compared to the NXE:3400B (baseline 2018). To achieve this, we have developed and are executing an EUV energy efficiency roadmap.
Reducing overall energy use
The EUV light source is the key focus area of our current engineering efforts to reduce energy consumption because it requires the larger portion of an EUV system’s total energy consumption. The roadmap includes optimizing the sequence of the CO2 laser to produce the plasma for creating EUV light, for example by turning the CO2 fire off when the system is in idle mode and reducing the CO2 firing between exposures. Our longer-term goal is eventually to cut the CO2 fire between exposures altogether. This requires a feasibility study from our research team and our suppliers, to make sure that the laser beam path remains stable.
Another area for energy reduction is the cooling water strategy. We identified ways, together with our suppliers, to use cooling water of a higher temperature to remove the heat in the EUV source and electronics cabinets. This will reduce the amount of energy needed to cool the system, through recirculated process cooling water. To make this happen, we need to make sure that modules such as the drive laser can operate at a higher temperature, which we are currently developing together with our suppliers.
Creating EUV light
The larger portion of an EUV system’s energy consumption is used to operate the laser-produced plasma source to create EUV light. Molten tin droplets of around 25 microns in diameter are ejected from a generator. As they move, the droplets are hit first by a lower-intensity laser pulse. Then a more powerful laser pulse vaporizes and ionizes the flattened droplet to create a plasma that emits EUV light. This conversion process from laser to EUV light using tin droplets takes place 50,000 times per second, and is the most energy-intensive step. By increasing conversion efficiency, we can decrease an EUV system’s energy consumption at constant wafer output. Making this happen, while making sure that this will not negatively affect other functionalities of the EUV system, is a key challenge for our R&D teams.
Other challenges include developing materials and coatings that can deal with higher EUV intensities, and improving the heat management of optical components – this includes the wafer itself, which heats up through the exposure to EUV light during the production process. Tackling these challenges requires ongoing innovation and collaboration within our innovation ecosystem of customers, suppliers and knowledge institutions.
Reducing energy use per exposed wafer
By reducing the total energy consumption by 10% in absolute terms and at the same time doubling the productivity compared to the baseline model NXE:3400B, we aim to reduce the energy use per exposed wafer pass by 60%. To increase the productivity in number of wafers produced, we are continuously working on improving the conversion efficiency of wall-plug power to EUV light and on optimizing sequences, control schemes and other components, such as higher reflectivity mirrors and faster stages.
Most of our product efficiency enhancements are also offered as upgrades for the installed base of our lithography systems. For our customers, this helps to improve the economic value of the installed base, increase productivity and reduce the lithography energy use per wafer.
Our progress in 2021
In 2021, we measured the energy efficiency of our NXE:3600D system. Power consumption compared to its predecessor (NXE:3400C) was the same at 1.3 MW, but productivity at 30 mJ/cm2 dose increased from 136 wafers per hour (wph) to 160 wph. We achieved this higher throughput by improving the transmission of the optical column and by improving wafer management, reducing the so-called scanner overhead. Compared to our baseline model, we achieved 6% reduction system energy consumption. At the same time, the energy use per exposed wafer pass has reduced by 37%. This shows that we are on track in achieving our target of 10% EUV system energy consumption reduction by 2025 and 60% reduction in energy use per exposed wafer pass.
In 2021, we installed dilution systems aimed at simplifying and reducing energy use of the hydrogen abatement system. Our EUV systems need hydrogen for protecting the optics in the EUV scanner and source. For newer production cabins we chose to dilute and vent hydrogen after use, instead of combusting it. This saves energy and emissions both from methane combustion – for keeping the hydrogen flame stable – and from lowering cooling water needs.
In 2021, we continued our investigation on the use of warmer cooling water. We studied how it can be applied in the drive laser and started to engage with our customers and with SEMI (the global industry association representing semiconductor manufacturing
ASML ANNUAL REPORT 2021 58
supply chain), by taking the lead in an extensive update of the S23 energy standard. As this involves significant changes to the hardware both of our suppliers and of the facility installations in our customers’ fabs, this project is part of our long-term plan to reduce the wall-plug power needed per wafer pass by 60% by 2025 (baseline year 2018).
The tables below provide an overview of the system achievements in terms of output and energy usage to achieve this output.
| | | | | | | | | | | | | | | | | | | | |
Platform1 | DUV
Immersion | |
| System | NXT:1980Di | NXT:2000i | NXT:2050i | NXT:1980Ei | NXT:1960Bi + PEP-B | |
| Year of energy measurement | 2015 | 2017 | 2020 | 2021 | 2021 | |
| Energy consumption (in MW) | 0.14 MW | 0.14 MW | 0.13 MW | 0.14 MW | 0.13 MW | |
| Throughput (wph) | 275 | 275 | 295 | 295 | 250 | |
| Energy use per exposed wafer pass (in kWh) | 0.51 kWh | 0.51 kWh | 0.45 kWh | 0.48 kWh | 0.51 kWh | |
| Wafers per year | 2,409,000 | 2,409,000 | 2,584,200 | 2,584,200 | 2,190,000 | |
| | | | | | | | | | | | | | | | | | | | |
Platform1 | DUV
Dry | YieldStar |
| System | XT:860M | XT:1460 | NXT:1470 | YS350E | YS375F | YS-380 |
| Year of energy measurement | 2017 | 2020 | 2020 | 2017 | 2019 | 2021 |
| Energy consumption (in MW) | 0.07 MW | 0.06 MW | 0.11 MW | 0.01 MW | 0.01 MW | 0.01 MW |
| Throughput (wph) | 240 | 209 | 277 | n/a | n/a | n/a |
| Energy use per exposed wafer pass (in kWh) | 0.28 kWh | 0.27 kWh | 0.38 kWh | n/a | n/a | n/a |
| Wafers per year | 2,102,400 | 1,830,840 | 2,435,280 | n/a | n/a | n/a |
| | | | | | | | | | | | | | | | | | | | |
Platform1 | EUV 20 mJ/cm2 dose | EUV 30 mJ/cm2 dose | | |
| System | NXE:3350B | NXE:3400B | NXE:3400C | NXE:3600D | | |
| Year of energy measurement | 2015 | 2018 | 2020 | 2021 | | |
| Energy consumption (in MW) | 1.15 MW | 1.40 MW | 1.31 MW | 1.32 MW | | |
| Throughput (wph) | 59 | 107 | 136 | 160 | | |
| Energy use per exposed wafer pass (in kWh) | 19.49 kWh | 13.08 kWh | 9.64 kWh | 8.27 kWh | | |
| Wafers per year | 516,840 | 937,320 | 1,191,360 | 1,401,600 | | |
1.Dose energy in mJ' refers to the energy required per expose per cm2. The number of 'wafers per year' calculated assumes 100% uptime and 100% utilization according to the SEMI S23 standard.
Advanced patterning with EUV helps to limit growth in energy and water use and GHG emissions
More advanced microchips mean smaller features, which need shorter wavelengths in lithography to manufacture them. With a single exposure of DUV light at 193 nm, for example, the smallest feature of the image of a microchip pattern reaches its physical limit around 40 nm. However, by using two or more exposures of the same pattern – so-called multiple patterning – it is possible to image details at 20 nm with 2 or 10 nm by 4 exposures and additional process steps.
Over the past decades, multiple patterning with DUV has become mainstream in semiconductor manufacturing, at the cost of having to go through the same process steps multiple times, which increases production cycle time and environmental impact.
As compared to DUV, EUV at 13.5 nm enables a more efficient chip-manufacturing process – because of the higher resolution of an EUV system, several exposures and process steps can be replaced by a single exposure and fewer process steps to do patterning of a chip. According to a study conducted by imec1, with EUV the number of non-lithography processing steps for some critical layers can be reduced by up to three to five times – this reduces production cycle time significantly. The fab also benefits from reduced energy and water usage, resulting from the lower number of deposition, etching and cleaning steps.
With increasing productivity of our EUV systems – which allows creating more advanced and more energy-efficient microchips faster – the energy consumption of the total patterning process per wafer will thus be lower using EUV lithography, as compared to complex multi-patterning strategies with DUV.
Our next-generation EUV systems, EUV 0.55 NA (High-NA), will enable further shrink and partly eliminate double exposure schemes, again replacing multiple 0.33 NA exposures with a single 0.55 NA exposure. With EUV 0.55 NA, the number of non-lithography processing steps can therefore again be reduced. This will effectively limit the total energy consumption of the patterning process per wafer even further.
1 Source: M. Garcia Bardon et al, DTCO including Sustainability: Power-Performance-Area-Cost-Environmental score (PPACE) Analysis for Logic Technologies, IEDM2020
ASML ANNUAL REPORT 2021 59
Climate and energy KPIs
The table below shows the key performance indicators (KPIs) and the related 2025 targets. Read more in: Non-financial statements - Non-financial indicators - Climate and energy for our performance indicators (PIs) and related results. The non-financial data may include a degree of uncertainty, because of limitations in measurement method and assumptions applied. Read more in: Non-financial statements - About the non-financial information - Reporting indicators .
| | | | | | | | | | | | | | |
| KPI | 2019 | 2020 | 2021 | Target 2025 |
System energy efficiency NXE:3x00 1 | | | | |
| System | - | NXE:3400C | NXE:3600D | |
| Energy consumption (reduction in % of baseline 2018) | - | -6 | % | -6 | % | Reduction 10% from baseline 2018 (1.40 MW) |
| Throughput (wph) | - | 136 | 160 | |
| Energy use per exposed wafer pass (reduction in % of baseline 2018) | - | -26 | % | -37 | % | Reduction 60% from baseline 2018 (13.1 kWh) |
| Wafers per year | - | 1,191,360 | 1,401,600 | |
| | | | | |
| Renewable electricity (of total electricity purchased) | 97 | % | 100 | % | 92 | % | 100 | % |
| Renewable energy attributes (in kton) | 137 | 140 | 145 | |
Fossil fuels consumed (in TJ) by location2 | | | | |
| Veldhoven | 159 | 141 | 184 | |
| Wilton | 111 | 112 | 127 | |
| Linkou | 0 | 0 | 0 | |
| San Diego | 46 | 40 | 43 | |
| San Jose | 0 | 0 | 5 | |
| Tainan | 0 | 0 | 0 | |
| Other | 0 | 0 | 8 | |
| Total | 316 | 293 | 367 | |
| | | | | |
CO2 footprint (in kt) - Gross 3 | 2019 | 2020 | 2021 | Target 2025 |
| Scope 1 - Direct emissions from fossil fuels in our operations | 16.9 | 15.4 | 19.3 | |
| Scope 2 - Indirect emissions from energy consumption | 141.4 | 139.8 | 165.1 | |
| Scope 3 - Indirect emissions from total value chain | 6,500.0 | 8,400.0 | 8,800.0 | |
| Total footprint (in kt) - Gross | 6,658.3 | 8,555.2 | 8,984.4 | |
| | | | | |
CO2 footprint (in kt) - Net 3 | 2019 | 2020 | 2021 | Target 2025 |
| Scope 1 - Direct emissions from fossil fuels in our operations | 16.9 | 15.4 | 19.3 | Net zero |
| Scope 2 - Indirect emissions from energy consumption | 5.3 | 0 | 20.1 | Net zero |
| Scope 3 - Indirect emissions from total value chain | 6,500.0 | 8,400.0 | 8,800.0 | Reduce intensity rate from baseline |
| Total footprint (in kt) - Net | 6,522.2 | 8,415.4 | 8,839.4 | |
1.System-energy efficiency is measured according to the SEMI S23 standard and scaled to 100% productivity of our systems.
2.San Jose, Tainan and 'other' have been in scope for this indicator since 2021. 'Other' includes the locations with more than 250 FTE combined.
3.The guidance from the Greenhouse Gas Protocol – the organization that provides widely used international standards for emissions reporting – is used for the calculation of the emission scope. Market-based conversion factors are used to calculate the scope 1 and scope 2 CO2 emissions in kt.
Contributing to the UN's Sustainable Development Goals
Our ambitions, commitments and programs as described in this chapter contribute to the following SDGs. For further information on the performance, read more in: Non-financial statements - Non-financial indicators - Climate and energy.
| | | | | |
| SDG target | How we measure our performance |
SDG target 13.1 - Strengthen resilience and adaptive capacity to climate-related hazards and natural disasters in all countries
| •Energy efficiency of our products measured per wafer pass •Renewable electricity strategy •Scope 1 and 2 emissions •Optimize real estate to enhance energy efficiency |
ASML ANNUAL REPORT 2021 60
We are committed to a circular economy and ensuring that any materials we use retain and generate as much value as possible for us and for our partners in the ecosystem. To minimize waste and maximize resources, we focus on three core strategies:
•Reduce waste in our operations
•Re-use parts and materials from the installed base
•Recycle mature products through refurbishment
The cornerstone of our circular approach is the modular design of our products. It enables us to upgrade a system to a higher performance level at a customer site rather than having to replace the entire product. We can further extend the lifetime of our products by refurbishing systems after they have been used in the most advanced chipmaking factories, repurposing them for other customers and semiconductor environments. As a result of our approach, nearly 94% of the lithography systems we’ve ever sold across our whole portfolio, are still in use at customer sites, highlighting our ability to contribute to a circular economy.
Our circular economy approach
ASML ANNUAL REPORT 2021 61
Reduce waste in our operations
Within our operations, the main waste streams are:
•Non-hazardous waste, such as packaging material, product-related waste from parts resulting from upgrades or defects, and general waste. This category also includes construction waste, which results from building activities.
•Hazardous waste, for example the chemicals we use in our manufacturing processes
We have set ourselves two targets to reduce our waste footprint. The first target is to reduce our waste intensity – the amount of waste generated in kg per € million revenue – by 50% in 2025 compared to baseline year 2019. The second target is to increase our material recycling to 85% by 2025. These targets include hazardous and non-hazardous waste.
To achieve these targets, we are focusing on circular procurement, driving awareness across our company, implementing (process) efficiency and improvement projects and supporting employee initiatives. We prioritize solutions to reduce, re-use and recycle our waste as much as possible, rather than sending it to an incineration plant or landfill.
Our results and progress
Managing waste from our operations is a complex issue and relies on having detailed and accurate insight into waste streams to and from ASML. We manage our waste through proper classification, separation and safe disposal. Although we’ve developed procedures to monitor and measure waste that leaves our premises, it’s much harder to gain insight on the waste streams of our customers.
In 2021, we generated 5,878 tonnes of waste from the activities on our sites and 77% of this was recycled (from 85% in 2020). Compared to 2020, the total amount of waste increased by nearly 12% (from 5,257 tonnes), mainly due to both the increase of our reporting scope from 20 locations in 2020 to 57 locations in 2021 and the growth of the company. Waste reduction programs for the expanded scope need to be defined and implemented, aiming at 2022.
Non-hazardous waste
Non-hazardous waste accounted for 93% (5,483 tonnes) of our total waste in 2021, of which the vast majority was diverted through recycling. We reduced non-hazardous waste through several ongoing programs, such as:
•Circular IT life cycle: After four years of use, we give all functioning computers and laptops a second life. In the case of defective computers, we recycle clean, separated streams of recycled plastic, iron, steel, copper, aluminum, glass and precious metals. This has led to over 30,000 kg of materials recycled, which is a sharp increase of 25% compared to 24,000 kg recycled in 2020.
•Flexible cleanrooms: These are cleanrooms that can be moved between locations and assembled quickly, while providing the same standards and performance as our current fixed cleanrooms. More than 95% of the materials used in the flexible cleanroom set-up are re-usable with a lifespan of more than 30 years. In 2021 we used the flexible cleanroom concept for five service warehouses.
•Other examples are local waste reduction initiatives initiated by our employees, such as plastic recycling and working with re-usable gloves in cleanrooms.
•Construction waste: As we expand our operations, we try to make sure that waste from construction activities are recycled wherever we can. Construction waste accounted for 3% (199 tonnes) of our total waste generated in 2021 (compared to 4% in 2020), of which 85% was recycled. In 2021, we added three work centers and one logistics warehouse to our Veldhoven campus. In our real-estate portfolio management we apply BREEAM standards which emphasize sustainability through the circular use of materials. For example, almost all of the material from a demolished sprinkler basin was re-used in our new buildings and we recycled ‘old’ cleanroom suits into acoustic wall panels for our meeting rooms.
ASML ANNUAL REPORT 2021 62
Hazardous waste
To produce and operate our products and systems, we need to make use of hazardous substances. In 2021, hazardous waste accounted for nearly 7% (395 tonnes) of our total waste generated. Of this, nearly 88% was recycled. Hazardous waste can include lamps, batteries, hazardous liquids, empty packaging from hazardous materials, and cleaning wipes and filters. Liquids, including acetone and sulfuric acid, are the majority of our hazardous waste streams.
The use of hazardous substances makes us subject to a variety of governmental regulations relating to environmental protection (as well as employee and product health and safety). These include transport, use, storage, discharge, handling, emission, generation, and disposal of hazardous substances.
Re-use parts and materials from installed base
We are committed to re-using system parts, tools, packaging and other materials, whenever practical in our value chain to reduce and prevent waste and reduce costs. We believe that re-use is a learning opportunity for all of us in the value chain, so we work closely on this with our customers and suppliers. Our target is to increase our rate of re-use to 95% of defective parts in ASML factories and in the field by 2025.
To achieve this ambition, we focus on:
•Design for re-use through more robust and repairable designs at an early stage of development
•Return for re-use of transportation packaging and materials for shipments to our customers
•Repair at local repair centers to improve parts repair yields by reducing cycle-time of root-cause analysis and repairs
•Remanufacture modules and parts that return from the field to as-new quality
•Harvesting of end-of-life parts through disassembly to re-use subcomponents
Progress and results in 2021
We accelerated our efforts on re-use, formalizing and structuring many parts of the process. Our Re-use Board, chaired by our Chief Operations Officer and Chief Technology Officer, signed off on a field repair strategy that promotes the repair of parts in local supply chains where possible, driven by our local repair centers. We extended our re-use policy to all product-related packaging, parts, materials and tools, and created a dedicated cross-sector Re-use department to drive this change on a global scale. Whether parts returning from the field are well-functioning, defective or unused, we are working hard to get them back into action in as-good-as- or better-than-new condition.
We further embedded our re-use commitment by enhancing our Supplier Sustainability Program. Read more in: Our performance in 2021 - Social - Our supply chain.
ASML ANNUAL REPORT 2021 63
We have started a life cycle assessment of the NXE:3400 EUV system to gain relevant insights into designing, developing and manufacturing our lithography systems with a lower carbon footprint. In this assessment we applied the life cycle assessment model for calculating the impact of waste and waste-reduction activities, which we developed in 2020. Similar assessment of our NXT and EXE lithography systems is planned for 2022.
In 2021, our re-use rate of defective parts was 85% (from around 86% in 2020).
Saving materials through reclaim
Our Reclaim program in San Diego (US) focuses on re-using a constant flow of returned parts. This program includes design for reclaim, improving the ability to re-use and recondition the assemblies to enable further increase of circularity of parts and materials, so that they can either be re-used for spare parts or incorporated into new system builds. This program has been running successfully for more than a decade. In 2021, we achieved over 375,000 kg material savings.
Design for re-use
In 2021, we integrated re-use into our Product Generation Process (PGP), as a key element of preventing waste that will help us meet our long-term goals. Our design for re-use methodology contains five elements – reliability, accessibility, replaceability, repairability and re-manufacturability – to enable the re-use of parts throughout the entire product life cycle. This means that re-use requirements are now part of the product design strategy and specifications. For example, through the modular design of our products and their components, we make sure that future upgrades, wear parts and components can be replaced as a single unit. Through commonality in designing a part, it can be used in multiple contexts in the product and even in future product generations.
The Re-use department’s focus for 2021 was on embedding re-use into our New Product Implementation (NPI) programs and driving waste reduction in our ‘reverse flows’ (materials coming back to us or to our suppliers from the field). Work continues to resolve bottlenecks in the execution of re-use and to clarify direction, guidelines and ‘re-use rules’ across the business. We are also looking to further mature our waste reporting data.
Return for re-use of transportation materials
When modules and systems are shipped, either from our suppliers to our factories, or from our factories to our customers, many transportation materials are used, such as packaging, locking and parts, to ensure that the products arrive safely. These so-called auxiliary parts (plugs, caps, clamps, cover plates, flanges, auxiliary brackets, etc.) are removed on arrival. Instead of throwing them away, these are re-used at use level (the highest level of re-use), so preventing them from ending up as waste. Before sending these parts back for re-use, they go through an identification process and quality check, followed by logistic and financial processes required to sell them back to the original module suppliers or to ASML.
We are improving the re-use of packing, locking and transport materials from the field and factory, aiming to return and re-use 80% or more in the next installation or relocation. In 2021, over 4,300 tonnes of transportation materials were re-used, up from nearly 4,000 tonnes in 2020.
Repair centers
We are extending local repair centers for service parts and materials, and setting up global repair centers for factory materials. There are currently local repair centers in South Korea, Taiwan and China, with plans for all our customer regions to eventually have one or more in place. Global repair centers will also be set up at each of our factory hubs in Wilton and San Diego (US), Linkou (Taiwan) and Veldhoven (the Netherlands).
By enabling repair and re-use activities and taking ownership of repairs in the field, we are able to reduce logistics time, stocking of parts and our environmental impact.
Remanufacture ‘As-New’ quality
When a part is re-used, our customers expect it to be as good as, or better than, the original new part. We set high-quality standards on ‘As-New’ parts and expect suppliers to be involved to meet these standards. This qualification standard and requirement is identical to the one for new parts, meaning that the same specifications, performance requirements, warranty, and so on, apply.
We now have over 75 ‘As-New’ release projects ongoing at over 25 suppliers. Our ambition is to increase the use of As-New modules in our systems to prevent unnecessary scrapping of well-functioning parts and modules.
Re-use challenges and roadmap
We made good strides on re-use and are committed to continuing to reduce waste streams. Building a re-use mindset and adopting it into normal ways of working is critical to achieving re-use and preventing scrap. For example, by replacing scrap bins in our factories with what we now call ‘re-use collection corners’, we encourage employees to think of used parts as having potential rather than being seen as waste.
To fully embed our re-use vision, however, there are several challenges to overcome and processes to be defined. These include:
•Configuration control: To re-use As-New parts in a system requires traceability of those parts. This means we need to be able to trace its history, where it comes from, and know how many times it was used and repaired.
ASML ANNUAL REPORT 2021 64
•Organization: Across our operations, there are a variety of separate processes related to return and re-use. We need to align those to an overall end-to-end re-use process flow.
•Repair engineering and processes: Part of our new focus is creating awareness on design for re-use, and defining processes around how to include re-use in redesigns and engineering changes.
In 2021, under configuration control we reduced the risk of what we call ‘broken life cycles’ by improving the traceability of parts. We intend to finish this improvement by the end of Q2 2022, solving the broken life cycle issues we now have in 4% of our parts. We also delivered some new re-use execution processes, such as ‘harvesting at the supplier’, enabling us to send purchase orders to harvest parts to suppliers, embedded in our sourcing and logistics process.
As next steps, we have defined five priorities. These include planning of re-use before new, supplier re-use incentives and autonomy, high-quality reverse logistics, further embedding re-use in our Product Generation Process (PGP), and launching re-use change and communication campaigns across ASML and suppliers.
Recycle mature products through refurbishment
A well-maintained ASML lithography system can last for decades and can be used by more than one fab. Many ASML lithography systems start out in cutting-edge fabs – once that fab needs to upgrade, the lithography systems are given a new lease of life in a fab where the manufacturer requires comparatively less sophisticated chips, such as accelerometers or radio frequency chips.
Our Mature Products and Services (MPS) business focuses on the refurbishment of the following product families: the PAS 5500 (with around 1,800 systems at customer sites worldwide), the TWINSCAN XT systems, and, as of 2021, the NXT:1950-1980 systems.
Our refurbishment strategy focuses on buying back systems that are not operational in the field, harvesting parts from decommissioned systems, and managing the continued availability of spare parts, which is key to the extended lifetime service we offer for our systems. We provide our customers with a guaranteed service roadmap until at least 2030. This means that all support and the necessary services and spare parts they need to maintain their systems is expected to be available through at least 2030 and beyond.
For the TWINSCAN AT systems that are still in operation, we focus on measures to proactively manage their end of life by guaranteeing the availability of spare parts as long as possible on a best-effort basis.
Our performance and progress in 2021
Thirty years after its introduction, ASML’s PAS 5500 platform is still alive and kicking. Currently, 90% of the PAS 5500 systems we have ever built are still in use, whether as refurbished tools or in its original configuration. The PAS platform is used for a wide variety of niche applications, from sensors to power chips and even life-changing implantable medical devices.
Until 2021, we have refurbished and resold well over 500 lithography systems. In 2021, we celebrated the 100th refurbished TWINSCAN, which also marked the 20th anniversary of our TWINSCAN refurbishment program.
New challenge – refurbishing and upgrading first-generation NXTs
In 2021, the Mature Products and Services (MPS) business line embarked on a new challenge to refurbish and upgrade first-generation NXT lithography machines, in addition to the PAS 5500 and XT systems. With the NXT platform having established its position as the workhorse of the semiconductor industry, there are more than 200 first-generation NXTs still running production at customer sites around the world.
To support the steep growth in semiconductor manufacturing capacity, especially in ‘More-than-Moore’ markets with less advanced requirements, ASML buys back these systems, refurbishes them to the specifications of later-generation systems, and sells them to customers that do not need the specs offered by more advanced machines. This enables customers to purchase an attractively-priced tool that will support their required cost of ownership targets, while contributing to ASML’s commitment to minimize waste and maximize resources.
Securing parts availability
We are making significant investments to ensure continued supply of more than 2,000 service parts for our PAS platform, either through redesigns, a parts harvesting strategy or by finding an alternative with the same form, fit and function. If this does not work, we are generally able to secure components through Last Time Buy – a supplier's 'last call' for a part or component before production switches to its successor. Over time, when a part is no longer available, we redesign parts.
We track the spare parts we have in our portfolio, see how they are being used, and identify when we expect to run out of these parts. For the PAS systems, we use this information to update our priorities for redesigning parts. For the AT systems, we try to continue supplying parts by harvesting them from systems that are decommissioned by our customers.
To secure the availability of spare parts into the next decade, we need to replace many unavailable parts that were designed with technology from the 1980s and 1990s with parts based on state-of-the-art technology. This involves a complete overhaul of these parts. For the coming years, we have identified and plan to execute more than 100 redesign projects for nearly 300 parts. This is especially relevant for electronic parts, for which the evolution of technology has gone faster than in any other field.
Roll-out of MPS Customer Portal in Asia
ASML ANNUAL REPORT 2021 65
A web-based parts ordering portal has been instrumental to the business model of Mature Products and Services (MPS), keeping costs under control while providing an optimal customer experience. In June 2021, following its success in the US and Europe, the online MPS Customer Portal went live in Asia.
The portal is designed to facilitate Billable and Volume Parts Contract (VPC) parts sales for ASML. Paired with a regional hub-based logistical service, it creates an efficient and valuable sales channel for our customers that minimizes manual steps and potential delays. Depending on the location, customers can expect their parts to be delivered within a few days or even – in the case of expedited orders in Taiwan and South Korea – within a few hours.
Circular economy KPIs
The table below shows the key performance indicators (KPIs) and the related 2025 targets. Read more in: Non-financial statements - Non-financial indicators - Circular economy for our performance indicators (PIs) and related results. The non-financial data may include a degree of uncertainty, because of limitations in measurement method and assumptions applied. Read more in: Non-financial statements - About the non-financial information - Reporting indicators .
| | | | | | | | | | | | | | |
| KPI | 2019 | 2020 | 2021 | Target 2025 |
Total waste generated normalized to revenue (kg/Million €) 1 | 417 | 360 | 305 | -50% of 2019 baseline |
Material recycling (% of total waste) 1 | 80 | % | 85 | % | 77 | % | 85 | % |
ASML PAS5500 systems sold still in use (in %) 2 | 90 | % | 90 | % | 90 | % | n/a |
| Value of parts re-used (€, in millions) | n/a | 1,151 | 1,236 | |
1.Construction waste is excluded from the calculation of this indicator, because this waste is not resulting from the daily operations of ASML. The amount of construction waste tends to fluctuate over the years and can therefore make the trend of the indicator unclear.
2.Due to a definition change in 2020, the KPI is based on PAS5500 systems sold. For other PAS systems it is not possible to determine the status of use mainly because service contracts have been terminated.
Contributing to the UN's Sustainable Development Goals
Our ambitions, commitments and programs as described in this chapter contribute to the following SDGs. For further information on the performance, read more in: Non-financial statements - Non-financial indicators - Circular economy.
| | | | | |
| SDG target | How we measure our performance |
| SDG target 12.2 - By 2030, achieve the sustainable management and efficient use of natural resources | •Material recovery •Promote circular procurement |
| SDG target 12.4 - By 2020, achieve the environmentally sound management of chemicals and all wastes throughout their life cycle, in accordance with agreed international frameworks, and significantly reduce their release to air, water and soil in order to minimize their adverse impacts on human health and the environment | •RoHS / REACH compliance of parts used |
| SDG target 12.5 - By 2030, substantially reduce waste generation through prevention, reduction, recycling and re-use | •Waste reduction •Increase re-use of parts and modules in our products •Lifetime extension of used systems •Re-use of packaging |
ASML ANNUAL REPORT 2021 66
Pushing the limits of technology would not be possible without our engaged, diverse and highly competent workforce. Our employees are critical to the performance of our organization and our long-term success as a company. As well as working hard to attract the world’s top talent, we need to focus on helping them all reach their full potential, in an environment where they are proud to work for us and engaged with our ambitions as a company.
We continue to experience strong growth at ASML. Our workforce nearly doubled in size in the last five years. And in spite of the ongoing pandemic, we had an extraordinary year in 2021, with an over 16% increase in employees (in FTE), a revenue increase of more than 30%, and over 20% more product output. This rapid growth also brings challenges. Our organization has become more complex, our workforce is more diverse, and the expectations of our customers and stakeholders are growing.
Our people vision
The needs of our growing workforce are changing, which requires an environment and tools that support collaboration, knowledge sharing and autonomy in more diverse and interdependent teams. At the same time, we must also continue to deliver on our commitments to our stakeholders and manage our day-to-day challenges to attract, onboard, develop and retain our talent.
We’ve already created a strong foundation by articulating our purpose, vision, mission, values and leadership expectations. To stay successful in the future, we examined how our strengths translate to our current reality. Hence, we define our people vision as follows: We empower each other to thrive, fueling our growth, happiness and business success. ASML’s people vision sets out our ambition for the future, supporting our values and what we stand for. Everyone throughout the organization has an important role in this vision.
Our pathway to realizing our long-term people vision is captured in our people strategy. For the next five years, our roadmap focuses on three key areas:
•Inspiring a unified culture, with our values as our compass to guide our decisions and behavior to deliver on our strategy
•Providing the best possible employee experience, enabling us to attract, develop and retain the best talent
•Enabling our leadership to bring out the best in people, by leading through trust, empowerment and accountability
Collaborating closely with the business on a day-to-day basis, we drive several key programs, designed to provide people with more autonomy in steering their development and career aspirations and enabling our leaders to support the growth of the company.
Unified culture
More than ever, we need to pay attention to anchoring ASML’s identity deep in the organization, to help our people embrace our values and provide a unified direction to familiarize themselves with our company strategy and purpose.
ASML ANNUAL REPORT 2021 68
Our company values – challenge, collaborate and care – ensure we are all working from a commonly understood base that can be applied across our organization, helping us make choices that keep us true to ourselves. They also allow teams to discuss the natural areas of friction where these values overlap. For example, by ensuring that the founders’ traits that brought us this far (persistence, a ‘can do’ mentality and a belief that anything is possible), are balanced by the right degree of care. Embedding our values is an ongoing journey, but we aim to succeed by applying them every day.
Building on our core values, we apply six people principles – clarity and accountability, continuous learning, inclusion, enabling environment, personal growth, and trust – to guide and inspire us in our people decisions to bring the best out of our employees.
Our progress
In addition to ongoing initiatives deployed earlier to make our values tangible now and in the future, we launched the ‘Values in action’ program in 2021. As opposed to previous independent annual events, such as ‘Have a safe day’, ‘Ethics week’, ‘Sustainability week’ and the ‘Volunteer fair’ we developed an ongoing program with a series of events that explored the values through the lens of environmental, social and governance (ESG) topics. At every event we ask our senior leaders to outline their plans, ambitions and commitments to ensure we live up to our values.
In 2021, we executed several 'Values in action' events around the topics of mental health safety, the ASML Foundation, 5 life-saving rules, Speak Up and green energy.
Employee experience
We believe a diverse and inclusive workforce provides the necessary mix of voices and points of view required to innovate and drive our business forward. We foster a culture where different identities, backgrounds, talents and passions are valued and celebrated. Therefore, we want to offer our people the best possible employee experience at all our sites, enabling them to develop their talent, feel respected and work to the best of their abilities and allows us to attract and retain the best talent.
Employee experience is the sum of all experiences an employee gains through the interactions with the company at each stage of the employee life cycle, from attracting and onboarding talent to attrition. To this end we focus on employer branding and employee engagement.
Employee engagement depends on a wide variety of factors and activities, such as talent attraction and retention, onboarding experience, learning and development, diversity & inclusion, labor practices such as fair remuneration and labor conditions, and leadership. The overall impact of these programs on the total employee experience is measured by our we@asml employee engagement survey.
Employer branding
With the demand for top-tier talent increasing year-on-year, employer branding is a vital strategy to ensure ASML gets its share of this talent. Our strong growth means we need to hire large numbers of employees. Highly skilled people with a technical background are scarce in the labor market and competition is growing. We see that top-tier talent selects their employer of choice, not the other way around. This is a general development of employees choosing their future employer, and it’s important for employees that a potential employer has a proper value proposition.
We view recruitment as an ongoing process, and continuously seek to improve and professionalize how we go about it. We use this information to fine-tune our target audiences and recruitment efforts.
Our performance and progress
We measure our employer brand for the main locations where we operate – the Netherlands, the US, China, Taiwan and South Korea. We do this by measuring how ASML is perceived by external audiences – and potential employees in particular – by monitoring our position in an independent external employer-branding ranking. We have defined targets for the different local labor markets on our positioning by 2025. We continue to improve our employer brand and values on our corporate website, creating a better understanding of what we do and what we stand for as an employer.
In 2021, we saw good improvement in nearly every main location compared to 2020, except for the US, which can be explained by the mix of respondents in terms of field of study, university and location. However, our operations in the US were included in the 2021 Most Loved Workplaces - top 100 ranking by Newsweek in collaboration with the Best Practice Institute (BPI). The ranking is focused squarely on the degree to which employees have a positive feeling about their employer. We are pleased to receive this recognition for our efforts to create best possible employee experience for our employees. Read more in: Our people KPIs
In 2021, restrictions on travel and large group gatherings limited our ability to meet future talent in person. Various planned activities were either postponed or adapted to a virtual space. More than ever, the internet is the optimal platform to communicate. Our labor market communications team is continuously working to optimize how we reach, inform and engage our target audiences online. To leverage recruitment efforts, we facilitate job postings and manage ASML’s presence on online social network channels. We also promote the ASML employer brand through online advertising.
ASML ANNUAL REPORT 2021 69
Boosting recruitment and sharing innovation in Taiwan
ASML continues to expand operations in Taiwan to provide the best support services to a growing base of customers and optimize R&D support capabilities of measurement and inspection products. To enable ASML’s ambitious roadmap, it’s crucial to attract the best talent from the market.
In March and April 2021, ASML's Innovation Experience Truck took to the road in a tour across major college campuses of Taiwan to boost recruitment of engineers, extending our client and research support team capabilities. Through augmented reality technology and interactive experiences, upcoming engineers could familiarize themselves with advanced lithography technology and high-tech EUV lithography machines.
Employee engagement
Employee engagement is critical to the performance of our organization and our long-term success as a company. We measure the overall impact of our activities on the total employee experience using our we@ASML employee engagement survey.
we@ASML survey
Our annual we@ASML survey is a crucial tool for collecting and measuring employee feedback. It provides insights that enable us to improve the employee experience and work on our policies and processes. We set ourselves the target of achieving an employee engagement score that is at least on a par with our peers.
Throughout the COVID-19 pandemic, employees across ASML have done admirable work to continue our business, serve our customers and secure our roadmap. We knew they experienced pressure from pandemic fatigue, hybrid working and the rapid growth in our employee base on top of increasing customer demand and we expected this to impact our employee engagement score.
To understand these effects and allow us to set improvement actions, the 2021 survey featured additional questions about well-being topics. To measure the degree to which our values are embedded in the organization, the survey also included questions about our culture and values that go beyond the ‘what’ to the ‘how’.
Our performance and progress
We succeeded in creating a positive working environment amid challenging circumstances, but did not make measurable progress in our key improvement areas.
In our 2021 we@ASML employee engagement survey, we again saw good results and received valuable feedback for improvement. The engagement survey score was 78% in 2021 (80% in 2020) – 2 percentage points above our external global benchmark of 76%. Overall, we conclude that ASML still has a highly engaged population. People are proud to work for ASML. Other areas where we score high are, for example, a good working environment, good team spirit with respect and open communication, and opportunities to learn and grow. However, as expected the engagement score decreased due to the dynamics of 2021. Defining action plans to prevent further decline is a priority for us.
Despite our continuous focus and improvement actions executed, we still see the three areas from the 2020 and 2019 surveys, namely: enabling processes, cross-team collaboration and clarity of expectations are lagging behind as we still score well below the external benchmark. The 2021 results also show that we need to pay more attention to well-being. Addressing these four areas is our key priority in 2022.
Talent attraction and retention
We hired 4,373 new payroll employees in 2021, growing our workforce to 30,842 FTEs at year-end. Our workforce more than doubled compared to the 14,681 FTEs we employed at the end of 2015.
While attrition can open up a knowledge gap in the company, we also view it as an opportunity to bring in new talent and enhance existing talent. We strive for a healthy attrition rate (the percentage of employees leaving our company), aiming for an annual attrition rate of 3.0–8.0%. For high performers, our target is to have a rate that is at least 50% lower than the overall attrition rate target.
With the overall attrition rate of 5.4% and the attrition rate of our high performers of 2.6% in 2021, both are well within our target range and is below the industry average in every country we operate in. In 2021, we saw an increase in the attrition rate to 5.4%, from 3.8% in 2020, a year that was shaped by the COVID-19 pandemic, when people were less inclined to look for other jobs. We attribute the increase to the effects of the pandemic, the global shortage of employees across many industries, and the booming semiconductor industry that is providing plenty of job opportunities. Nevertheless, we view that our efforts to create a unique employee experience, our employee engagement programs, and our onboarding of new employees are paying off.
ASML ANNUAL REPORT 2021 70
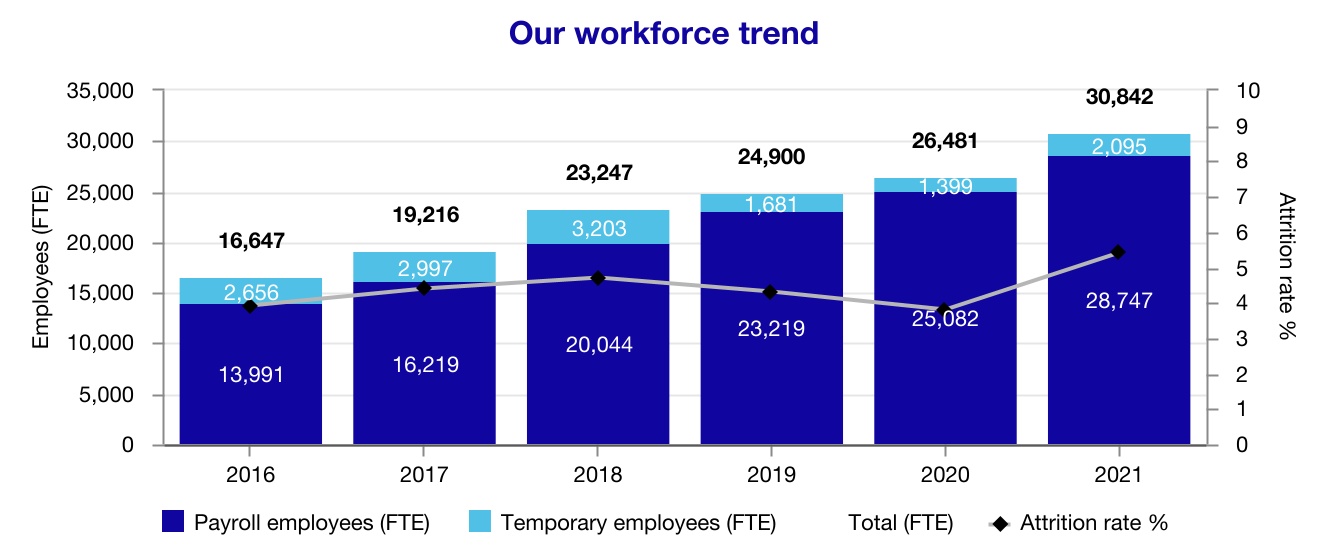 The 2020 and 2021 FTEs in the chart above do not include the FTEs acquired through the acquisition of Berliner Glas (ASML Berlin GmbH).
Onboarding
As our global workforce grows exponentially, onboarding is one of our key priorities. In 2021, we welcomed our 30,000th employee. A positive onboarding experience builds a sense of connection, helps employees fit in quickly, and boosts retention. We believe onboarding is a joint effort, driven by everyone.
With the COVID-19 pandemic continuing in 2021, our new employee onboarding remained virtual to give new colleagues the best possible start. For example, the ASML onboarding event is a half-day introduction event organized by HR to make new colleagues feel welcome, learn more about ASML and connect with other new colleagues. In small groups, new colleagues work together to learn about ASML products, technology, organization, customers and programs. Business sectors and functions continue to build on our global onboarding initiatives, making sure we’re providing one consistent experience across the company, further tailored to the various departments.
To measure how new hires rate their onboarding experience, we conduct pulse surveys in each phase of their onboarding journey from feeling welcome, engaged, equipped, to feel part of ASML. On average, 89% of new hires indicated that they had a positive experience. They also perceive the support they get from their manager during onboarding as very positive. We are proud that our managers took extra efforts to guarantee a positive onboarding experience while working remotely.
Learning and development
In an innovative, high-tech, fast-changing industry, it’s vital to strengthen and continuously invest in our talent pool to anticipate evolving business requirements and developments in the labor market. We empower our employees to develop their talent, pursue their career ambitions and to thrive. We strongly believe that personal development works best when our employees can invest in themselves. At ASML, we give employees the time, opportunity and support, while they put in the effort, passion and drive needed to enhance their development. We offer tailor-made training and development programs to help grow the highly skilled professionals we employ at ASML.
Training
To maintain our technological leadership and pace of innovation, we need to ensure the right knowledge is available to our people at the right time. To do this, we have our own technical development centers in-house for our D&E, customer support, and manufacturing employees to tailor training to the specific technical needs of these departments.
Most of our trainings take place on the job, given the nature of our collaborative innovative business. Overall, we are promoting the 70-20-10 approach for learning interventions, meaning that 70% is on-the-job learning, 20% is through coaching, and 10% is learning through training courses. In 2021, the average number of training hours in this last category, including development programs, was 29 hours per FTE.
In 2021 we continued adding virtual trainings where possible. We had to postpone some of the development activities that have a strong networking component to them with the need to bring different sectors and countries together. Due to travel restrictions and different time zones, these activities were not viable. In addition, we continued working on redesigning specific development programs to establish an effective mix between remote and in-person training, bringing people from different locations together, and making training more digestible for online purposes.
Career development opportunities
We are continuously looking into ways to improve how we can help employees identify opportunities for professional development within ASML. We offer various career paths and have various tools in place to support our employees’ career navigation.
ASML ANNUAL REPORT 2021 71
Two years ago, we started the discussion and thinking process around how our performance management approach and philosophy can better align with our culture and values. This forms part of a broader look at the future of performance management in the company. Together with our executive committee, we started defining how to do this more fundamentally. In 2021, we worked hard on re-shaping performance management processes and to embed them in the new tooling, which went live as of January 2022.
Diversity and inclusion
We're proud to be a culturally diverse organization, with employees from 122 different nationalities. Diversity and inclusion enhance our ability to innovate, to be creative, problem solve, and provide an environment where employees feel valued, challenged to grow professionally, and contribute to our common goals.
Since 2020, we have been developing and formalizing our approach to diversity and inclusion. We assembled a Global Diversity & Inclusion Council in 2021 that consists of senior leaders who act on behalf of ASML to provide thought leadership. The Council, chaired by a member of the Board of Management, proposes the Diversity & Inclusion strategy to the Board of Management, sets, promotes and monitors diversity and inclusion initiatives, and drives company-wide accountability towards its goals.
Our diversity and inclusion strategy includes the following:
•Engaging a larger talent pool by making opportunities more visible and accessible
•Creating shared metrics to more clearly evaluate progress
•Ensuring inclusive leadership behaviors are embedded in our culture
•Including diverse perspectives in our talent practices
•Providing employees more ways to engage and drive their careers
Our aim is to be representative of the available skilled workforce. Creating an environment where all feel welcome, know they belong and see a career path in front of them requires diversity at all levels of the organization.
We aim to increase the diversity of our workforce by fostering a culture that is inclusive of all. We@ASML, our employee survey, measures inclusion levels each year. In 2021 our Inclusion score was 83% compared to 82% of top performing global companies. Our goal is to meet or increase this level of inclusion among our employees on an ongoing basis. To do this, we set a target to score on par +/- 3% with the top 25% of this comparison company list in 2024.
In 2021, we made progress in gender diversity among all employees and senior management. Female employees now make up 18% of our workforce worldwide. This improvement has increased by 1% compared to last year. We aim to increase this trend as we move toward 2024.
We believe the most effective way to address this is by focusing on the growth of our existing team members and expanding the diversity of our talent pool. We’ve set goals to increase the hiring of women from 20% in 2021 to 23% by 2024.
We still have work to do in this area and have set specific goals focused on female leadership levels. The current representation of women at this level is 8% today and our ambition is to reach 12% by 2024. To make this tangible, we’ve set a goal to raise the hiring of female leaders, from 12% in 2021 to 20% in 2024. We believe this talented pool will be role models, paving a path for more to follow. Our ambition is to have more diversity in our workforce because we believe it is one of the best ways to attract and retain smart talented people to help us drive technological innovations forward to meet our customers’ needs.
Overall, the global STEM (science, technology, engineering and math) talent pool is scarce and it is even more challenging to recruit female talent. Our R&D workforce is 15% female. Nearly 90% of job positions are STEM related, whereas peers in the high-tech industry have more diverse, non-STEM related job positions. ASML is highly motivated to see more women pursuing careers in engineering and science now and in the future. The highly specialized nature of our industry means achieving this balance is a long-term process. We are actively engaged with multiple educational programs to grow the pipeline, deploy multiple initiatives to promote STEM education among the future female talent pool and continue to foster an environment where our current workforce can thrive.
Achievements in the US
Established in 2020, the ASML US Diversity Council serves as an advisory board and governs diversity and inclusion (D&I) programs, such as employee networks, diversity events, and recognition and education programs across the US. In 2021, the Diversity Events and Education Workstreams and US Diversity Council sponsored numerous external speakers to generate broader awareness and understanding of culturally significant holidays and observances, including Black History Month, PRIDE Month, Hispanic Heritage Month and Veteran’s Day. Over 3,000 employees cumulatively participated in over 15 diversity events. The Council also supported the development of two new employee networks in the US: SHADES for Black, Indigenous and People of Color (BIPOC) and their allies, along with a new veteran’s group.
Fair remuneration
We want our remuneration to be fair and balanced. In our remuneration policy, we are committed to gender equality and we strive for global consistency while respecting what is common practice in local markets. We continuously review how our remuneration compares to the market benchmark for technology professionals in each region where we operate and, where necessary, make changes to our remuneration policies and levels. Each year, we analyze paid salaries for gender disparity. In 2021, as in previous years, we found no major differences in these salaries. Read more in: Non-financial statements - Non-financial indicators - Our people.
ASML ANNUAL REPORT 2021 72
Living wage
At ASML, we are committed to meeting adequate living-wage requirements, meaning that employees earn salaries that meet their and their families' basic needs, but also provide some discretionary income. Our company has a predominantly highly educated workforce with relatively high levels of remuneration. In 2020, as part of a two-year cycle, we conducted an analysis of how our lowest base salary compared to the local minimum wage and local ‘living wage’ in the countries and regions where we operate. We did not detect any gaps. On average, our salaries are significantly above local living wage. An update of the analysis is planned for 2022.
Labor relations
We want to provide fair labor conditions and social protection for all our employees, regardless of their location and whether they are on a fixed or temporary contract. We support the principles of the International Labor Organization (ILO) and we respect the rights of all employees to form and join trade unions of their own choosing, to bargain collectively and to engage in peaceful assembly.
We strive to comply with the relevant legislations in every country we operate in. In those countries where we have employee representation, we engage in regular dialogue with the different organizations representing our employees. In these conversations, topics are put forward and discussed by both the company and the employee representatives.
We do not have operations in countries where the freedom of association and collective bargaining for ASML employees is restricted.
In the Netherlands, we have requested dispensation from the Metalektro Collective Labor Agreement (CLA) in order to develop our own CLA. Our unique position in the global market, our size and growth as well as our very unique group of employees and the large range of competencies and activities we bring together to deliver our products have created a need for our own direction in labor conditions. The purpose of a future ASML CLA is to offer a set of labor conditions that match the diversity and needs of all our employees.
In 2021, following an intensive period of consultations, the negotiations with the trade unions began. The new CLA will be developed in close collaboration with the unions represented in the Metalektro. Once we have our new CLA in place, we will continue to work with the unions regarding labor conditions within the framework of our own CLA and maintain our active membership in various labor organizations, such as FME and PME.
Remote Working Policy
We want to have a positive impact on people’s well-being, their productivity and work-life balance. Working from the office and meeting each other face-to-face stimulates innovation and optimal collaboration within and across teams, and it is the starting point of our way of working. During the pandemic, teams expressed the need to meet in person to tackle problems together and to stay aligned toward common goals. We also recognize that a busy office may not be the best place for focused work, so quiet work in a remote office may be much better for some tasks.
Fundamentally, ASML is convinced that employees themselves can best manage their own work. On the other hand, managers are responsible for efficiently organizing the way the team is working and the organization. This means that both employees and managers have joint responsibility for the choices to be made under our Remote Working Policy.
We aim to provide ASML employees and their managers with clear guidance and help to make the right choices between working remotely and working in the office. Remote working is neither mandatory nor an entitlement. As a global guideline, employees may work up to two working days per week remotely, if the job allows. There may be exceptions for certain jobs or departments.
Strong leadership
To remain a market leader, we must provide unified direction. This means we need authentic leadership to give our people a clear picture of where ASML is heading. This offers great opportunities for all of us to contribute to ASML’s success and make an impact, which is also quite a challenging job for our leaders. As our company grows, so does the need for clarity around roles and expectations. Leaders need to play a part here in providing role clarity for employees, as well as being clear about their own roles and responsibilities. We continue to strive to formulate and capture this more clearly so our people can understand what is expected of them.
Launched in 2020, our Leadership Framework outlines and clarifies a leader’s role in business leadership, role-modeling the values within the company, and what it means to be a people manager and coach for employees. Leadership is all about people.
ASML ANNUAL REPORT 2021 73
Leadership framework
In 2021, we continued deploying behavioral competencies training, coaching programs and a practical guide to inspire and enable personal development. We have leadership programs where we fast-track the careers of our most promising managers through our Potential Acceleration Program. These programs ensure our managers are aware of what’s expected of them, and help them to develop the skills and competencies they need to become better leaders.
The effects of these programs are most visible in our employees' responses from our 2021 we@ASML survey, where 74% of our employees stated that they see their manager role modelling the three ASML values – challenge, collaborate, care – in a balanced way.
Ensuring employee safety
At ASML, safety is not just a priority – it is a prerequisite. It is an integral part of our daily work and the way we lead others. We do everything in our power to provide injury-free and healthy working conditions for everyone on our premises and ensure all our operations are safe and secure. This includes employees, contractors, suppliers, customers, and visitors. We count on each other – every one of us working at and for ASML – to share this commitment, because together, we keep each other safe.
In 2021, the persistent effects of the COVID-19 pandemic still reached into every corner, affecting people globally and across every aspect of our business. Our priorities remained unchanged: Our primary focus has always been to ensure our colleagues and their families around the world stayed safe. Our second goal was to make sure we upheld exceptional service to our customers.
We follow all government guidelines and safety measures. The corporate crisis management team provides our employees with frequent updates about the COVID-19 situation and our response to it. In 2021, we rolled out numerous well-being programs worldwide to address the physical, mental and emotional well-being of people working from home.
Our employee safety strategy
We believe that all work-related injuries and occupational illnesses are preventable. As such, we are working toward a long-term ambition of zero injuries and work-related illnesses.
It’s impossible to completely eradicate risk, but we can work proactively at all levels to identify potential issues or concerns in the workplace and develop measures toward reducing these. We do everything we can to minimize risk, and it is our responsibility to provide our people with the right protection, procedures and processes to keep them safe.
Our goal is to prevent occupational health and safety incidents. To benchmark our performance against industry standards, we use a targeted recordable incident rate of 0.20, which represents world-class performance. But our ongoing ambition is zero, and this drives our continuous improvement in processes, working conditions and employee behavior. To achieve this, we focus on an EHS management system, safety culture and training. An example is the ‘Safety Gemba Walks’, where managers visit the employees’ workplace. This helps us to increase safety performance and to strengthen a safety culture.
New global lifting training
Trend analyses and past lifting (near-miss) incidents and good catches formed the foundation of a new, soft-skill-focused, gamified training for future lifting team members worldwide. This human-focused and effective trend-based setup contributes to a safe work environment in an efficient and attractive way, by using blended-learning methodologies, timely workplace learning and modern technology.
ASML ANNUAL REPORT 2021 74
This EHS lifting training will be enriched with a more in-depth specialist safety training framework of lifting tools for lifting operators and awareness of lifting activities for others involved in the lifting action. The outcomes of lessons learned through incident reporting and incident investigation improve the quality and impact of our EHS training solutions, helping to take safety culture within ASML to the next level.
Managing a safe workplace
We are committed to a well-established EHS management system. We use the highest possible professional standards, and continuous improvement is a key principle of our management system. Our EHS management system is based on the ISO 45001 standards and complies with its requirements.
We have established a Corporate EHS Committee, chaired by our Chief Operations Officer, to oversee and approve ASML’s EHS strategy and lead the EHS management system. Our line managers are responsible for day-to-day EHS management. Our EHS Competence Center gathers best practices and defines the EHS standards for ASML, helping our managers to implement these standards in the workplace.
Our employee and product safety commitment is captured in our Sustainability Policy, which applies to ASML worldwide. In addition, our ASML EHS Guide aims to provide practical, useful and essential information for our employees, contractors, and any other parties working for us. The guide – designed to create awareness and ownership – explains our aims and objectives, and clearly describes the rules and policies we follow.
Incident and risk management are key elements of our EHS management system. We record and investigate all incidents and near-misses to determine the root cause and take corrective action to prevent them from recurring or occurring in the future.
We conduct regular hazard and risk evaluations, with a focus on preventing employees’ potential exposure to hazards such as chemicals, fire, radiation, mechanical handling, and ergonomic risks. These provide us with further insights into the main hazard and risk areas at ASML. We can then take appropriate action to mitigate these risks. We ensure continuous improvement through internal EHS audits.
Strengthening a safety culture
In 2020, we introduced five life-saving safety rules to create a safer workplace and enhance our safety performance. Respecting and adhering to these rules could not only save lives, but also make us collectively more aware of safety risks across our organization. Active and consistent deployment of these rules in 2021 led to increased awareness, better insights and actions for improvement, such as improved procedures, tools and education. At ASML, it is standard practice to inform our employees and anyone else accessing our premises and customer sites independently – including contractors and suppliers – about our safety culture and to raise awareness around these. Training is one of the ways we prepare and inform our people about this.
Our results and progress
We register EHS-related incidents in line with the US Occupational Health and Safety Act. Our recordable incident rate decreased from 0.18 in 2020 to 0.17 in 2021, outperforming the electronic industry benchmark of 0.20. The recordable incident rate is the number of recordable cases beyond first aid in a year per 100 FTE. As in previous years, we did not record any work-related fatalities or permanent disabilities.
Safety goes beyond procedures, rules and the right equipment to human mindset, behavior, attitude and habits. Following the five safety rules, we deployed various department specific awareness programs. For example, we have been rolling out the hein® safety campaign in D&E which helps us develop a common safety language and dialogue. Workshops and trainings took place in many clusters with many interesting discussions and insights into our safety behaviors.
In 2021, we extended the EHS Fundamentals program with a new safety training module. As of September 2021, new hires expected to work in a cleanroom will have to complete EHS Cleanroom Fundamentals, a training module designed to prepare new employees to safely enter, leave and work in a cleanroom at ASML. By year end 2021, 95% of eligible candidates had completed this mandatory training. We are also planning a company-wide reassessment of the safety culture in our company in early 2022, to validate if our safety culture transformation program has the right effect, and to create insights into where we need to step up.
To improve our EHS performance, we encourage our employees to speak up whenever they encounter safety risks. Every employee is empowered to stop working if they feel unsafe. Together with their manager and EHS expert, a safe way of working will be defined, so the work can resume.
ASML ANNUAL REPORT 2021 75
Our people KPIs
The table below shows the key performance indicators (KPIs) and the related 2025 targets. Read more in: Non-financial statements - Non-financial indicators - Our people for our performance indicators (PIs) and related results. The non-financial data may include a degree of uncertainty, because of limitations in measurement method and assumptions applied. Read more in: Non-financial statements - About the non-financial information - Reporting indicators .
| | | | | | | | | | | | | | |
| KPI | 2019 | 2020 | 2021 | Target 2025 |
| Engagement score We@ASML survey | 77 | % | 80 | % | 78 | % | Be on par with peers |
Employer brand ranking1 | | | | |
| Netherlands | 10 | | 10 | | 6 | | Top 10 |
| US | — | | 99 | | 133 | | Top 75 |
| China | — | | 168 | | 148 | | Top 100 |
| Taiwan | — | | 22 | | 6 | | Top 20 |
South Korea2 | 19 | | 24 | | 14 | | Top 20 |
1.Employer brand ranking from Universum: engineering students.
2.As of 2021, overall ranking for South Korea is no longer conducted by Universum. The result reported for 2021 is based on a customized ranking report. The target 2025 refers to the overall ranking. Going forward we need to define our target based on the customized ranking.
Contributing to the UN's Sustainable Development Goals
Our ambitions, commitments and programs as described in this chapter contribute to the following SDGs. For further information on the performance, read more in: Non-financial statements - Non-financial indicators - Our people.
| | | | | |
| SDG target | How we measure our performance |
| SDG target 4.3 - By 2030, ensure equal access for all women and men to affordable and quality technical, vocational and tertiary education, including university | •Employee training and development indicators •Diversity indicators |
| SDG target 4.4 - By 2030, substantially increase the number of youth and adults who have relevant skills, including technical and vocational skills, for employment, decent jobs and entrepreneurship | •Community involvement and technology promotions •Scholarships granted |
| SDG target 4.5 - By 2030, eliminate gender disparities in education and ensure equal access to all levels of education and vocational training for the vulnerable, including persons with disabilities, indigenous peoples and children in vulnerable situations | •ASML Foundation projects |
| SDG target 8.1 - Sustain per capita economic growth in accordance with national circumstances and, in particular, at least 7% gross domestic product growth per annum in the least developed countries | •Financial performance |
| SDG target 8.2 - Achieve higher levels of economic productivity through diversification, technological upgrading and innovation, including through a focus on high value-added and labor-intensive sectors | •Human capital return on investment •Employee engagement score |
| SDG target 8.5 - By 2030, achieve full and productive employment and decent work for all women and men, including for young people and persons with disabilities, and equal pay for work of equal value | •Workforce data including diversity and inclusion •Fair remuneration pay ratio |
| SDG target 8.6 - By 2020, substantially reduce the proportion of youth not in employment, education or training | •Employee attrition rate •New hires |
| SDG target 8.8 - Protect labor rights and promote safe and secure working environments for all workers, including migrant workers, in particular women, migrants, and those in precarious employment | •Employee safety indicators |
ASML ANNUAL REPORT 2021 76
Being part of a community means not only caring for our own employees, but also looking out for those beyond our organization. We foster close community ties and encourage our employees to get involved and do their part as well. ASML needs the support of the community to be successful and will earn that support if ASML lets the community benefit from its presence and is considerate of the community's needs.
We aim to be a valued and trusted partner in our communities, improving the quality of life for all, with a special focus on disadvantaged communities. We support skills development for young people under the age of 18 to prepare them for an increasingly digital future, as well as community services for disadvantaged people, and local arts and culture initiatives.
We benefit from each other’s presence and support each other’s development. For ASML it is important to create a healthy foundation for long-term sustainable strategy execution by motivated employees. For the community, success means that we are able to close the divide, so that citizens and their environment thrive.
Our community engagement program, which falls under our CEO's area of responsibility, is built on three pillars where ASML has competence and can create impact:
1.Education
2.Arts & culture
3.Local outreach
The total amount of cash commitments and in-kind support that ASML spent on charities, community engagement, organizations, and our own ASML Foundation in 2021 was approximately €10.4 million. Our corporate citizenship activities stretch beyond community support to in-kind contribution to startups and scaleups aiming to nurture innovation by future young-tech. In addition, we also support the European innovation ecosystem through our R&D across public-private partnerships. Read more in: Innovation ecosystem.
ASML ANNUAL REPORT 2021 77
Education
We contribute to SDG 4 Quality education and SDG 5 Gender equality
ASML recognizes the need to prepare people of all ages for an increasingly digital future. STEM (science, technology, engineering and mathematics) competencies are important in helping children to reach their potential, particularly in disadvantaged communities. We organize and sponsor many initiatives that aim to share our enthusiasm for and expertise in technology to inspire all generations. We also partner with multiple organizations and educational events that promote careers in technology. Our employees act as role models and guides for these initiatives.
We execute our education programs through the following:
1.The Education team works closely with schools and education programs in the communities where ASML has operations. The Education team provides hands-on support and coordinates a network of ASML volunteers (our so-called ASML ambassadors) who visit schools and events, and support children and schools in their curricula, some as part-time ('hybrid') teachers, some as tutors of disadvantaged children, and some as technology and STEM promoters. Our intensive STEM education program aims to boost interest in technology among young people and increase the local and regional talent pool. We also raise awareness of career prospects in a sector offering many development opportunities.
2.The ASML Foundation is an independent foundation, but has strong ties to ASML. It operates at arm’s length and has its own board and budget. It aims to increase the self-sufficiency of disadvantaged children around the world through educational initiatives that develop their talent and help unlock their potential. Read more in: ASML Foundation.
Projects supported in 2021
In 2021, we supported a total of 64 education projects across the regions where we operate (Netherlands, US and Asia). The total value of these projects amounted to €4.3 million.
Below we provide examples of a few highlights. For more information, please visit www.asml.com - community engagement
TU/e (Netherlands)
As one of Eindhoven University of Technology’s (TU/e) most important partners, ASML took the opportunity to celebrate the university’s 65th birthday by donating four high-tech presents with a value of around €3.5 million. These will mainly be used by researchers of the university’s new Eindhoven Hendrik Casimir Institute. For more information, please see section Innovation ecosystem - Partnerships with research institutes and universities.
Children’s Discovery Museum (US)
There was fun for the whole family to enjoy during Science and Engineering Day on Tuesday, July 20, 2021, put on by the San Diego Children’s Discovery Museum. ASML sponsored the virtual event, which was free to the public and included multiple interactive educational activities hosted on the Museum’s Facebook page. Activities included coding robots to follow a path, solving environmental science challenges and experimenting with chemistry. ASML San Diego sponsored the event for $5,000.
Science education in Taiwan (Asia)
In Taiwan, ASML joined hands with Yuan T. Lee Science Education to implement a three-year seed teacher training program called the 'Taiwan Science Rooting Project'. More than 70 seed teachers will be trained and 300 students will learn basic scientific knowledge through hands-on experience. In addition to this project, ASML also sponsors four science experience camps each year.
Wikimedia (Global)
ASML made a donation of €50,000 to the Wikimedia Foundation. This is the first of what will be an annual donation to the organization behind Wikipedia, to ensure their continuity and support their cause to remain a resource for free and open knowledge for everyone. This annual donation will increase over time with ASML's employee growth, in accordance with Wikimedia's guidelines.
Partnerships
•Together with Spectrum Brabant, we launched the tutoring program ‘Equal opportunities’, a free program for secondary students in the Brainport Eindhoven region aimed at tackling educational disadvantage.
•We entered a partnership with the National Foundation for the Elderly, VodafoneZiggo and Samsung to support digital inclusion of older people through the Welcome Online digital educational program, which aims to help older people in the region become digitally self-reliant.
ASML ANNUAL REPORT 2021 78
Arts & culture
We contribute to SDG 11 Sustainable cities and communities
Culture is the invisible bond that ties the people of a community together, whereas the arts are culture made visible. To strengthen that bond, ASML supports initiatives and organizations that are vital for the community’s culture and help open them up for newcomers and the underprivileged. We focus on cultural icons in our communities – organizations and initiatives that have an impact beyond the local community.
Projects supported in 2021
In 2021, we supported a total of 14 arts and culture projects across the regions where we operate (Netherlands, US and Asia). The total value of these projects amounted to €1.5 million.
Below we provide examples of a few highlights. For more information, please visit www.asml.com - community engagement
Partnerships with the Van Gogh Museum and Van Gogh Brabant (Netherlands and global)
Uniting science and art, we have long-term partnerships with the Van Gogh Museum and Van Gogh Brabant to help ensure the artist’s work and cultural heritage, rooted in the Dutch region of Brabant, can be enjoyed for many generations to come. Through this partnership we support several programs, including:
•Preserve the paintings: In collaboration with the Cultural Heritage Agency of the Netherlands, the University of Amsterdam and the conservators of the Van Gogh Museum, a team of ASML engineers is investigating how external factors, such as light, affect the paint that Van Gogh used. By using this knowledge to optimize display conditions and minimize further degradation of the collection, we help to preserve his masterpieces for future generations. For more information, please visit www.asml.com/en/news/stories/2021/preserving-van-gogh.
•Vincent's Lightlab: We have initiated the realization of 'Vincent's Lightlab' within the planned expansion of Museum Vincentre in Nuenen, the Netherlands. Visitors will be able to learn more about light and how Van Gogh experimented with it in his paintings. The renewed Museum Vincentre will open its doors in 2023.
•ASML Gallery: We support the Van Gogh Museum's 2021 autumn exhibition 'The Potato Eaters: Mistake or Masterpiece'. This exhibition is a tribute to Van Gogh's masterpiece, The Potato Eaters, as well as to his time in Brabant.
•Masterminds & Masterpieces: Together with the Van Gogh Museum, we developed educational materials for students in primary and secondary schools. The artist’s curiosity was key to his craftsmanship, and together with the museum, we encourage students to follow in his footsteps – and, like in our partnership, connect science with art. More than 200 online classes were taught, reaching more than 8,000 children in Europe and Asia.
GLOW light art festival (Netherlands)
Light is key to our work, which is why we partner with the annual GLOW light art festival in Eindhoven, the Netherlands. In 2021, we showcased a special art object at the festival, created in collaboration with local artist Gijs van Bon. The object was an ode to ASML’s technology and was one of the highlights of the free festival, connecting art with science. More than 580,000 people visited the festival.
Local outreach
We contribute to SDG 11 Sustainable cities and communities
As a responsible company, we want to play our part in the communities we operate in. By partnering with businesses and organizations in the regions around the world where ASML is located, we build trust and give back.
We support local initiatives and organizations that are vital for our communities and that connect the people in our communities. Together with ASML employees, we contribute and make these initiatives attractive and accessible, and we pay special attention to stimulate integration, promote diversity and empower the underprivileged.
We are spread over 60 locations across Europe, the US and Asia. With such a widespread presence, it’s important that we engage with and support the communities where we are based. Our passionate employees contribute to local projects and organizations that make a difference in their community. And as a company, we provide sponsorship and donate funds to local non-profit organizations.
Through our global volunteering program, we encourage employees to become more involved in their local communities. Everyone is able to use one day a year as a paid volunteering day with the event, charity or activity of their choice. Employees can also volunteer with ASML Foundation projects. The ASML Foundation is a key partner of our local outreach activities, supporting many of these activities through programming and funding. Read more in: ASML Foundation.
ASML ANNUAL REPORT 2021 79
Projects supported in 2021
In 2021, we supported a total of 55 local outreach projects across the regions where we operate (Netherlands, US and Asia). The total value of these projects amounted to €2.3 million.
Below we provide examples of a few highlights. For more information, please visit www.asml.com - community engagement.
Partnership with PSV (Netherlands)
In 2019, together with five other partners from the region, we became the main sponsor of our local soccer club: PSV. This club sits at the heart of our local community and is a uniting force for the health and social well-being of our local community. By joining forces, we can collaborate and do more together. Through this partnership, we support several programs, including:
•ASML Community Lounge (in the Philips Stadium): This aims to make soccer accessible to everyone, to help newcomers find their place in our region and to enable people lacking the means to enjoy an evening of top-class sport. We welcomed volunteers and clients from groups like Food Bank, NEOS, Severinus, The Salvation Army and other aid agencies in the venue, totaling more than 1,500 guests in 2021.
•Online vitality platform: Brainport Eindhoven and PSV jointly launched an online platform aimed at inspiring and motivating everyone in the Brainport Eindhoven region in the area of health and well-being, creating a vital and healthy region for all. We shared our knowledge and expertise around seven well-being themes.
•PSV Analytics: A collaboration project between PSV Sport performance and ASML BAS Big Data. The project was started with the intent to help the Dutch premier top soccer club unlock, use and optimize the large amounts of data it has collected, and translate them into dynamic images analyzing the game plan. The work inspires our ASML technologists as we collaborate and support the club to compete with its much bigger (and richer) rivals.
Moores Cancer Center (US)
Every year, ASML San Diego employees surf for a cure at the Luau & Legends of Surfing Invitational, which raises funds to support research and patient care at UC San Diego Moores Cancer Center. While the event looked a little bit different this year due to COVID-19 precautions, it still raised $500,000. ASML was an event sponsor, donating $15,000 to help make it happen.
ASML ANNUAL REPORT 2021 80
ASML Foundation
We contribute to SDG 4 Quality education, SDG 5 Gender equality, SDG 10 Reduced inequalities and SDG 17 Partnerships for the goals
The ASML Foundation is our charity of choice primarily focusing on impactful, inclusive education and training programs for young people in need. Improving lives through inclusive and quality education and training, is how we view our mission. We want to enable inclusive and equitable participation in society through lifelong learning and education in 21st century and entrepreneurial skills. By doing this, the Foundation aims to make a sustainable impact on SGD 4 (Quality Education), and contribute to SDG 5 (Gender Equality), SDG 10 (Reduce Inequalities) and SDG 17 (Partnerships for the goals).
We believe that all people deserve to receive a quality education, allowing them to be self-sufficient in our increasingly digital world. Our goal is to help people who participate in the programs we support to improve their chances of a better life. Through funding and partnerships, the ASML Foundation aims to unlock the potential of young people in need by enabling inclusive and equitable participation in society through education. Diversity in terms of our project selection does not only indicate the inclusion of women, but also the disadvantages our target groups may face: little access to education, special education needs, or a lack of vocational training.
The ASML Foundation wants to make a difference in the community in the locations where ASML operates. As such, it mainly supports projects and initiatives in Europe, the US and Asia that address specific needs in that region. In the Brainport Eindhoven region in the Netherlands, for example, tackling illiteracy has become a key focus area for the ASML Foundation in 2021. In the US, projects focus mainly on preventing school dropouts in less-privileged areas, and on promoting science, technology, engineering and mathematics (STEM), especially for girls. Projects in Asia differ per country. In developing areas in Asia, for example, there is a focus on education for girls to reduce inequality and also to prevent child marriages. In China, the focus is on STEM for girls in rural areas.
In 2021, the Foundation donated around €2 million (€1 million in 2020), supporting 22 projects in 8 countries. With these committed donations, the Foundation aims to reach about 775,000 young people.
Employee volunteering
ASML employees support the ASML Foundation financially when they purchase goods from the ASML employee store and through donations. The ASML Foundation is also responsible for ASML’s volunteering program: It coordinates the volunteering activities and keeps track of the volunteering hours that ASML employees contribute to education initiatives and other causes. ASML employees are allowed to take eight hours per year to do volunteer work that aligns with the volunteering policy; many volunteers also donate their own time.
Examples of projects supported in 2021
For more information, please visit www.asmlfoundation.org
Eindhoven Basic Skills City Plan (Netherlands)
In the Netherlands, the number of people with low literacy is increasing – for example, in the Eindhoven region, 7% of people aged between 16–65 years is having trouble reading and writing. Overall, 25% of youth aged 15 does not have the literacy level required to be able to function adequately in society. Eindhoven municipality, the local library, the local Area Health Authority (GGD) and other partners have developed a plan to strengthen the basic skills – reading, writing, calculating and digital skills – of a total of around 10,000 people with low literacy in the Eindhoven region by 2023. As part of this Eindhoven Basic Skills City Plan, the ASML Foundation supports an initiative to prevent illiteracy in an early stage, aimed at children between 0–4 years old.
STEM - Girls Can Do It (Asia)
The STEM - Girls Can Do It project aims to promote more gender-balanced STEM education for young people, age between 10 to 14 years – especially girls – in rural China, near ASML’s offices in Chengdu and Xi’an. Employees from the local ASML offices have been actively involved in the partnership as volunteers, hosting in-person events at ASML’s offices, and involving female engineers as role models
Discovery Education (US)
The Equity & Access to Digital Educational Resources Initiative supports high-quality digital content and impactful on-demand professional development for under-resourced schools throughout the US to combat the learning loss in the wake of COVID-19. In Bridgeport near Wilton in the US, the ASML Foundation supports this initiative by providing funding for the National Afterschool Association, which enables them to use digital learning materials from Discovery Education, Inc.
ASML ANNUAL REPORT 2021 81
We innovate through partnerships. Our innovation philosophy is one where we see ourselves as architects and integrators, working with partners in an innovation ecosystem. In our innovation ecosystem, long-term collaboration is based on trust. We share both risk and reward while driving innovation. While sharing our expertise with the ecosystem, it also provides us with access to a large leading-edge knowledge base across a wide range of technologies. Together we build a strong knowledge network to create technological solutions that society can tap into. This collaborative approach allows us to accelerate innovation.
We innovate through partnerships. To this end, we focus on collaboration with research centers, fueling the innovation pipeline through partnerships with research institutes and universities, and collaboration with R&D partners through EU public-private partnerships. In addition, we believe that we can create greater impact in the ecosystem by nurturing future young tech by supporting startups and scaleups.
Partnerships with research institutes and universities
We co-develop expertise within a wide network of technology partners, such as universities and research institutions. Some of our partners include imec in Belgium, the technical universities in Twente, Delft and Eindhoven in the Netherlands, and the Advanced Research Center for Nanolithography (ARCNL), also in the Netherlands. ARCNL conducts fundamental research, focusing on the physics and chemistry that are important in current and future key technologies within nanolithography and its application within the semiconductor industry.
In 2021, as in previous years, these partnerships delivered positive results.
Our progress and achievements
In 2021, imec demonstrated a breakthrough in printing narrow 24 nm pitch lines in a single exposure. Using ASML’s NXE:3400B system and combining advanced imaging schemes, innovative resist and optimized settings in its cleanroom, imec demonstrated how our system is capable of printing lines at 24 nm pitch in a single exposure step. This innovation will enable imec and its partners that specialize in resist and patterning to help develop and test resist materials that will support the introduction of our next-generation EUV lithography systems, our EUV 0.55 NA (High-NA) platform.
We collaborate with, among others, Tokyo Electron, a fellow semiconductor equipment company in Japan to further enhance scaling solutions for our EUV technology. In 2021, Tokyo Electron joined our partnership with imec and introduced its leading-edge Coater/Developer to the imec-ASML joint High-NA EUV research laboratory (joint High-NA lab). This Coater/Developer will feature advanced capabilities that are not only compatible with widely used chemically amplified resists and underlayers, but are also compatible with spin-on metal-containing resists. Spin-on metal-containing resists have demonstrated high resolution and high etch resistance, and are expected to enable finer patterning. Combined with the new process modules, this will enable flexible fab operation, while also realizing increased productivity and high availability.
We continued our close involvement in the High Tech Systems Center (HTSC), set up by Eindhoven University of Technology (TU/e) to facilitate fundamental research with a focus on understanding the needs of the mechatronics and mechanical engineering industry. Since its launch three and a half years ago, the HTSC has supported the start of several new projects broadening the scope of our cooperation with TU/e toward electrostatic fundamentals and new developments in optical design. To celebrate the TU/e's 65th anniversary and our appreciation for the collaboration, we donated a set of high-tech nanotechnology machines and services for the new institute and for the student labs, with a total value of €3.5 million.
ASML ANNUAL REPORT 2021 82
In 2021, we joined forces with the Jheronimus Academy of Data Science (JADS), based in 's-Hertogenbosch, the Netherlands, to collaborate in the field of data science. Data science is increasingly important for the semiconductor industry as a whole and for ASML technology in particular. This collaboration provides us access to the latest academic knowledge and fresh perspectives from young talent, while also helping us develop the skills of our employees through professional education programs.
New partnership with Heriot-Watt University (UK)
We established a new partnership with a world-leading academic team from the UK’s Heriot-Watt University (HWU) to drive the advancement of new light source technologies. The five-year collaboration aims to accelerate the industrialization of fundamental physics research and create a direct route from lab to market for new laser technologies.
ASML has a long tradition of partnerships with academia, while HWU is renowned for its pioneering research informed by business and industry needs. This partnership will address specific real-world engineering challenges, such as the fact that the sensors in ASML’s machines must work at multiple wavelengths due to the various materials they encounter (each of which absorbs light in different ways). The team’s current focus is on new broad bandwidth light sources for optical metrology and builds on their impressive track record of innovation.
Collaboration with R&D partners
We cooperate with private partners in research and innovation projects subsidized by the European Union and its member states. We run collaborative subsidy projects aimed at advancing IC technology for the next node connected to the industry roadmap following Moore’s law. The Horizon Europe program, a public-private partnership, facilitates collaboration and strengthens the impact of research and innovation in developing, supporting and implementing EU policies while tackling global challenges.
By collaborating in European projects, ASML and its partners play a role in giving the region a degree of sovereignty by driving and accelerating fundamental research and groundbreaking innovation in Europe. This collaboration also generates significant business value, fuels job creation, and creates knowledge. This is borne out of, for example, the increasing number of patent requests per year, both for ASML and the other members in the various consortia, which reflects the success of the collaborations.
Our progress and achievements
In 2021, we continued coordinating the efforts in three EU projects – TAPES3, PIN3S and IT2, all with a duration of three years – securing timely reporting to the connected public partners, as well as organizing online consortium meetings to exchange ideas and knowledge.
Our own contribution in R&D across these public-private partnerships in 2021 was €30.3 million, and the total value of our investment for the full three-year duration of the projects is €93 million of the total project funding of €448 million. In all of these projects, we work with universities, research and technology institutes and other high-tech companies across Europe – varying from 20 to 80 partners from 10 different European countries – to help enable the industry to move toward next-generation technology.
In 2021, ASML started coordinating a new EU collaboration project, called ID2PPAC. In this three-year project, the technology solutions for the 2 nm node, as identified in the preceding IT2 project, will be consolidated and integrated with the objective to demonstrate that Performance Power Area and Cost (PPAC) requirements for this next generation of leading-edge Logic technology can be achieved.
To continue Moore’s Law trajectory to the 2 nm node, while meeting PPAC requirements, further advancements are required in EUV lithography and masks, 3D device structures, and materials and metrology. The ID2PPAC project brings together the R&D capabilities of 28 leading expert partners to tackle these challenges – it is valued at more than €107 million in R&D cost and unlocks €48.9 million in public funding for the ecosystem. In terms of geography, the project connects people from Austria, Belgium, the Czech Republic, France, Germany, Israel, Spain and the Netherlands.
Partnering in EU research projects
Solmates is a partner in the EU project ID2PPAC, led by ASML. Matthijn Dekkers, CTO of Solmates: "Solmates is a vibrant innovative company of 45 FTE located in the Netherlands that supplies equipment to the semiconductor market. Our thin-film Pulsed Laser Deposition hard- and software is changing the future of thin film materials. Within the ID2PPAC consortium, Solmates is responsible for the development and installation of a 300 mm Pulsed Laser Deposition system at imec. The system will be used for semi-damascene material development. Collaboration with project partners imec and ASML, among others, helps Solmates to test newly developed hardware in in a production-relevant environment. The ID2PPAC consortium network enables Solmates to tap into the expertise of partners in the semiconductor market. The project significantly contributes to the company's strategic roadmap and ambition to become a relevant player in the high-tech equipment segment.”
Supporting startups and scaleups
To nurture innovation by new generations of technological talents, we also provide valuable expertise to support entrepreneurs and startups. We make use of our experts’ in-depth competencies and knowledge to develop and support startups and scaleups. By fostering entrepreneurship, we aim to help these young enterprises excel and grow. What we share is based on what we are good at, such as building complex manufacturing systems. This is where we can play a role and make a difference.
Sharing our expertise is a way to strengthen our regional high-tech ecosystem, particularly around our headquarters in Veldhoven, the Netherlands. This region has a competitive edge globally, and we need to make sure we maintain this position. Building a
ASML ANNUAL REPORT 2021 83
strong regional foundation benefits not just ASML and associated partners, but also other companies and organizations. It also helps attract a broad base of talent to the region.
Through HighTechXL, we build and accelerate impactful startups by combining high-tech entrepreneurial talent and relevant technologies. With the Make Next Platform, we aim to support young innovative high-tech scaleups.
In 2021, ASML provided nearly €1 million in-kind support to high-tech startups and scaleups. This amount consists of 2,100 hours of support and €0.4 million in cash.
ASML as a venture builder
ASML is one of the main shareholders of HighTechXL, together with other tech-minded partners in the region such as Philips, TNO, the Brabant Development Agency (BOM) and High Tech Campus Eindhoven. Through HighTechXL, we build and accelerate impactful startups by combining high-tech entrepreneurial talent and relevant technologies from reputable tech partners such as ESA, CERN, Fraunhofer, imec and TNO, with the goal of solving main global societal challenges.
Through HighTechXL, a venture-building accelerator that builds teams of entrepreneurs and tech talents around the most advanced technology in the world, we have supported startups and scaleups in their various stages over the years in collaboration with other tech-minded peers from our region. We monitor and assess their maturity through objective assessment and a set of deliverables per KPI, such as business model, finance, technology, sustainability and execution skills.
Insights we’ve gained in recent years show that our past successes were based on working with scaled-up startups with a ‘deep tech’ component, and that these were difficult to find. The solution was to build our own in partnership with other technology providers. Since 2020, we have further developed our involvement in accelerating existing startups and mapped out a new focus area, which is building our own deep-tech ventures.
Up to now, 18 new deep-tech ventures have completed the program and are already getting global attention. Moreover, five new ventures are currently still in the accelerator program, making good progress, and new cohorts are already planned for.
In 2021, most of HighTechXL’s activities still had to be held online due to the COVID-19 pandemic. We had to organize ourselves offline as well, with associated challenges around communications and logistics. And while the spend rate of startup companies is relatively low, some ran into financial difficulty. ASML helped to arrange funding and subsidies for some of these.
Another issue that became more apparent during the COVID-19 crisis was the need for early-stage funding, especially for deep-tech startups. Deep tech is often perceived as complex, requires high-risk capital and is therefore less attractive for typical early-phase venture capital funds. ASML has committed financial contributions to address the needs for startups, particularly in the early phase of their existence, when there is a need for funding the often relatively high costs associated with building technology demonstrators, prototypes, etc. Together with other HighTechXL shareholders, ASML intends to build a deep-tech seed fund.
Carbyon enables capture of CO2 from the atmosphere
A sustainable solution to extract CO2 from the air has been, until now, a crucial missing piece of the puzzle for converting green hydrogen into clean fuels. Solving this puzzle will make it possible to convert renewable electricity into chemicals and fuels, closing the organic fuel combustion cycle using only water, air and clean electricity.
Technical experts from both ASML and Carbyon, a spin-off company of TNO, joined forces to develop a technical concept for a very complex machine to extract CO2 from the air in an economically profitable way. In particular the elaboration of a ‘gas-flushing’ concept for the transition from air to CO2 and vice versa was developed in more detail based on technical experience from ASML. With ASML's active support, Carbyon has accelerated the design and realization of its proof-of-concept. It is moving toward becoming a scaleup company with €2.5 million in financing raised, and is in talks with various venture capitalists for capital growth. Thanks to Carbyon, we are one step closer to creating a sustainable future.
Make Next Platform
To support young innovative high-tech scaleups, ASML founded The Make Next Platform in 2016 together with Huisman, Vanderlande and the non-profit Stichting Technology Rating. Thales NL joined as a co-founder in 2019. The Make Next Platform puts the partners' network, competencies, expertise, and experience to work in answering questions that these scaleups encounter in their development. We help them grow into a sustainable company.
The Make Next Platform aims to help young technology companies that have moved beyond the startup phase and are ready to expand. These companies, so-called scaleups, face challenges such as finding the funding needed to grow, knowing how to target new customer groups, and recruiting new employees with the right skills. Through exchange of best practices, business experience and coaching from corporate experts, the Make Next Platform partners aim to support them in their development to become global players by giving them access to their inside networks.
Up to now, the Make Next Platform has screened more than 200 companies and engaged with the management teams of more than 50 of these. So far, seven scaleups have been adopted and more than 10 are currently in the pipeline.
ASML ANNUAL REPORT 2021 84
Innovation ecosystem KPIs
The table below shows the key performance indicators (KPIs) and the related 2025 targets. The non-financial data may include a degree of uncertainty, because of limitations in measurement method and assumptions applied. Read more in: Non-financial statements - About the non-financial information - Reporting indicators .
| | | | | | | | | | | | | | |
| KPI | 2019 | 2020 | 2021 | Target 2025 |
| R&D expenses (€, in billions) | 2.0 | | 2.2 | 2.5 | n/a |
| | | | |
| Number of R&D partner agencies | 144 | | 130 | 121 | n/a |
| Startups reached Star level from total startups supported (in %) | 17 | % | 16 | % | 15 | % | > 20% |
| Number of scale up companies supported (in #) | 5 | | 7 | 7 | 14 |
| Start-ups and scaleups in-kind support hours | 1,300 | | 1,550 | 2,100 | n/a |
Contributing to the UN's Sustainable Development Goals
Our ambitions, commitments and programs as described in this chapter contribute to the following SDGs.
| | | | | |
| SDG target | How we measure our performance |
| SDG target 9.1 - Develop quality, reliable, sustainable and resilient infrastructure, including regional and transborder infrastructure, to support economic development and human well-being, with a focus on affordable and equitable access for all. | •Supporting startups to Star level •Supporting scaleup projects •Collaboration in EU projects |
| SDG target 9.4 - By 2030, upgrade infrastructure and retrofit industries to make them sustainable, with increased resource-use efficiency and greater adoption of clean and environmentally sound technologies and industrial processes, with all countries taking action in accordance with their respective capabilities. | •Collaboration with research partners •Energy efficiency of our products measured per wafer pass |
| SDG target 9.5 - Enhance scientific research, upgrade technological capabilities of industrial sectors in all countries, in particular developing countries. For developing countries, this includes, by 2030, encouraging innovation and increasing the number of research and development workers per one million people, as well as public and private research and development spending. | •Investments in R&D •Collaboration with R&D partner agencies |
ASML ANNUAL REPORT 2021 85
At ASML, we rely heavily on our supplier network to achieve the innovations we strive for. Our suppliers are a critical extension of our value chain. With around 4,700 suppliers in our total supplier base, we distinguish between product-related and non-product-related suppliers.
Product-related suppliers provide materials, equipment, parts and tools used directly to produce our systems. This category comprises 800 suppliers and represents the highest percentage of our procurement volume, accounting for 70% of our total spend. From this total number of product-related suppliers, around 200 suppliers are critical suppliers, accountable for roughly 92% of the product-related spend.
Non-product-related suppliers are goods and services suppliers, providing products and services supporting our operations, varying from temporary labor to logistics and from cafeteria services to IT services. With around 3,900 suppliers, this group represents nearly 85% of our total supplier base.
Sourcing and supply chain strategy
We invest considerable resources to develop and introduce new systems and system enhancements, such as EUV lithography and e-beam metrology. As these are complex technologies involving thousands of specialized parts, we focus on high value-added system integration.
ASML’s supply chain strategy is centered on long-term relationships and close cooperation with our suppliers and partners. Our goal is to ensure we get the products, materials and services we need to meet our short- and long-term needs, to support our operations from the earliest moment of development to the end-of-life stages of our systems. To make sure that this runs smoothly, we bring in our suppliers at the earliest possible phase in the Product Generation Process (PGP). This also enables us to increase product performance and ensure manufacturability and serviceability.
Operating in a niche market characterized by producing high-value products in small quantities, fast development cycles and business volatility requires several key performance requirements for the supply base. Continuously improving our suppliers’ capabilities and performance is at the heart of our sourcing and supply chain strategy. We require the following from our suppliers:
1.Enable our product roadmap through the development and maintenance of best-in-class competencies and capabilities to secure the most advanced technology and fast time-to-market
2.Drive cost reductions, quality and capability improvements through efficient and dedicated operations
3.Build a sufficiently broad customer base and scale to share and spread the risks of volatile market cycles and to increase flexibility and cost competitiveness
4.Make active contributions to our sustainability strategy
To drive a sustainable and resilient supply chain, we emphasize supplier performance management, supply chain risk management, and a responsible supply chain.
ASML ANNUAL REPORT 2021 86
Future-proof business relationship ASML and ZEISS
Since the 1990s, when ZEISS and ASML formed a strategic partnership under the banner 'two companies – one business', we have been incredibly successful together. We mastered technical challenges: immersion lithography was and continues to be a massive success, we brought EUV 0.33 NA lithography into volume chip production, and we now are developing the next generation, EUV 0.55 NA (High-NA).
ASML and ZEISS have signed a new framework agreement, taking a long and successful relationship to the next level in collaboration and alignment. The new framework agreement is based on three pillars. The first is a Behavior & Interaction Model that fosters mutual respect and understanding between ASML and ZEISS. The second is a Governance Model that enables both companies to become more effective and aligned in their decision-making and the execution of the strategy in the business. The third pillar is a Commercial Model that covers the entire business relationship between the two companies, allowing the product and engineering teams to now focus completely on collaborating to serve our customers. Our mutual intent is to deliver better products to our customers faster, to grow the business, and to share the overall responsibility of this business toward the end customers.
Supplier performance management
ASML's continued growth, in combination with our ambitions, requires us to significantly improve our key business processes. Tight risk control and continuous supply chain improvement are key to ensuring quality, long-term business continuity and sustainability.
We invest in developing and monitoring our supply landscape to help suppliers meet our requirements with regard to quality, logistics, technology, cost and sustainability (QLTCS). Our supplier profiling methodology helps us to measure supplier performance, supplier capability and risk profile in all of these fields.
We have a framework in place to communicate process requirements and compliance expectations to our suppliers. This framework outlines our approach to supplier management and development toward the desired ASML supplier landscape. It also provides an enhanced knowledge base to improve our dialogue with suppliers around their performance and development potential. We conduct regular operational and performance review meetings to ensure suppliers continue to improve their performance and processes. When supplier performance drops below annually set thresholds and does not recover upon request and within a reasonable time frame, ASML will take action to secure reliable future supplies.
In addition, we have a structural audit program in place to assess supply chain risks and identify areas of improvements to mitigate or reduce those risks.
In 2021, we launched various suppliers improvement initiatives, in areas such as N-tier (indirect) supplier change management, product safety and repair. These cross-sectoral improvement projects aim to accelerate learning for our suppliers and improve overall supplier performance.
Suppliers join the capacity drive
As the chip shortage continues, customers are under pressure to ramp up production, and all eyes are on ASML to help them do that. But with the vast majority of ASML’s products dependent on parts from suppliers, our eyes turn to them to match the capacity increase needed. This was the focus of the virtual Supplier Ramp-Up Day on May 18, 2021. It included two successful live streams with over 320 suppliers participating from Asia, Europe and the US.
Key speakers included our CEO and senior management from DUV and Operations. Their message was clear – with every bit of ASML’s manufacturing capacity currently utilized, we need our suppliers to ramp up quickly with us, with quality and delivery performance being critical. It was a positive call to action – working together, we can deliver what our customers need and ensure the sustainability of our industry, to the benefit of all.
Supply chain risk management
Due to the highly specialized nature of many of our parts and modules, as well as the low volume, it is not always economical to source from more than one supplier. Our sourcing strategy therefore (in many cases) prescribes 'single sourcing, dual competence', which requires us to proactively manage supplier performance and risk.
In our risk management framework, we asses six risk domains – calamity, ownership, finance, intellectual property and information security, and compliance. Since suppliers operating in the same industry or market are typically exposed to similar risks, we evaluate suppliers’ risk and performance within the context of their supply market category. We will adjust our category strategies where required to meet ASML's short- and long-term business needs. In cases where risk exceeds the agreed threshold, mitigation measures are taken. For example, we have long-term supplier agreements (LTSAs) and/or continuous supply agreements in place, or ensure the availability of intellectual property in escrow. Read more in: Our performance in 2021 - Governance - How we manage risk.
Our performance and progress
We conduct continuous performance and risk management of our supply base with the purpose to assure and improve performance, and prevent reputational damage. To this end, we deploy two key programs: a suppliers business continuity program aimed at securing continuity of supply and suppliers information security, and an information security and cyber resilience program to protect our intellectual property and maintain a leading technology position.
Business continuity program
ASML ANNUAL REPORT 2021 87
In 2021, we continued to focus on improving business recovery capabilities through a review of business continuity plans to be sure that suppliers can re-establish deliveries within the shortest possible timeframe in case a disruptive event occurs. We require suppliers to have business recovery capabilities in line with the ISO 22301 standard. Supplier recovery plans are requested, evaluated and, where needed, improved to prevent potential business disruptions. For example, suppliers might be required to put their inventory in separate locations, implement fire prevention controls, or increase buffer stock. In 2021, we included 197 business-critical product-related suppliers in our business continuity program, and extended the scope with 32 non-product-related suppliers.
Information security and cyber resilience program
We continued to expand our information security and cyber resilience program in 2021, leading to a current scope of 202 suppliers compared to 143 in 2020. Suppliers with access to top-secret information or with privileged access to our IT systems were asked to raise their cyber resilience through the ISO 27001 standard. To support our suppliers and other ecosystem partners in this effort, we established a Security Circle of Trust together with Cyber Weerbaarheid (resilience) Brainport in the Netherlands. Read more in: Our performance in 2021 - Governance - Responsible business - Information security.
Responsible supply chain
We actively pursue sustainable development of our supply chain designed to ensure that our tier-1 suppliers and contractors conduct their business in a caring and accountable manner, and that they act as a responsible business partner. As we seek to ensure a responsible supply chain, we deploy several programs that focus on Responsible Business Alliance (RBA) commitment and standards, due diligence, and our Supplier Sustainability Program.
RBA Code of Conduct commitment
We are a member of the Responsible Business Alliance (RBA) and have adopted the RBA Code of Conduct, which is a standard intended to ensure that working conditions in the electronics industry, or industries in which electronics is a key component, and its supply chains are safe, that workers are treated with respect and dignity, and that business operations are environmentally responsible and conducted ethically.
We expect our key suppliers and their suppliers to acknowledge and comply with the RBA Code of Conduct as well. This requirement is included in our long-term product-related suppliers’ contracts. We also encourage our suppliers to develop their own sustainability strategies, policies and processes, and we actively pursue our suppliers’ adherence to this code.
Due diligence
With over 4,700 tier-1 suppliers in our supplier base, it is important for us to identify and prioritize suppliers at risk. We apply a risk-based approach to determine which suppliers are in scope for our more detailed due diligence process, which consists of three layers:
a.Determine inherent risk level by screening our full supplier base on ethics, labor, health and safety and environment risk using the RBA Risk Platform.
b.Apply supplier risk profiling to business-critical suppliers. For these suppliers we conduct risk assessment of QLTCS capability elements.
c.Apply an RBA self-assessment questionnaire (SAQ) to major suppliers, in which we consider the type of supplier, leverage and geographical location of the supplier. We focus on our product-related suppliers covering 80% of our annual spend, business-critical suppliers including non-product-related suppliers, and suppliers deemed high risk from our annual RBA risk screening.
With regard to the suppliers in scope for these detailed procedures, we expect them to complete the RBA SAQ each year to validate their compliance with the RBA Code of Conduct and to determine any potential gaps in relation to the RBA Code of Conduct standards. We review all RBA SAQ results, evaluate high risk findings (if any) and determine severity of the finding. It is our policy to discuss all high-risk findings with the supplier to evaluate the risk and to determine if an improvement plan is needed.
A key performance indicator of our approach to ensuring a sustainable supply chain is the percentage of suppliers in scope who complete the RBA SAQ. Our target is to achieve a 90% completion rate by 2025. Our second key performance indicator is to have 100% improvement plans in place for high-risk suppliers, as identified by the RBA self-assessment.
Our performance and progress
The graphic below provides an overview of the scoping resulted from our due diligence procedure.
ASML ANNUAL REPORT 2021 88
We have asked a total of 56 suppliers to complete the detailed RBA SAQ. In general, the RBA SAQ results show a relatively low risk level in our supply base, as most of our suppliers operate in countries which we believe generally have a strong rule of law. In 2021, 89% of the suppliers in scope have completed the RBA SAQ (88% in 2020). From this total, the RBA SAQ indicated an overall high risk for two suppliers.
We evaluated these potential gaps and we engaged with these suppliers. Based on our evaluation, we determined that the risks did not relate to an actual breach or incident – we concluded that the high risks were overrated, that no improvement plan was needed, and we adjusted the scoring. With regard to human rights risks, the RBA SAQ indicated a high risk on labor for one supplier. Based on our evaluation, we concluded that this risk was related to management systems rather than actual breaches of human rights. More details can be found in the table below.
| | | | | | | | | | | | | | | | | |
| | Number of high risks identified from RBA SAQ |
| Standard | RBA Commitment | 2020 | 2021 | | Main findings |
| Labor | To uphold the human rights of all workers (direct and indirect), and to treat them with dignity and respect as understood by the international community, including the International Labor Organization's (ILO) eight fundamental conventions. | 1 | 0 | | •Own management system, but not third-party verified •No public reporting of labor metrics |
| Health and Safety | To minimizing the incidence of work-related injury and illness and to ensure a safe and healthy working environment. Communication and education is essential to identifying and solving health and safety issues in the workplace. | 0 | 0 | |
|
| Environment | Environmental responsibility is integral to producing world-class products and services. Adverse effects on the community, environment and natural resources are to be minimized while safeguarding the health and safety of the public. | 0 | 0 | |
|
| Ethics | To meet social responsibilities and to achieve success in the industry, the highest standards of ethics should be upheld, including but not limited to business integrity, anti-bribery and corruption, antitrust and competition, protecting privacy. | 1 | 0 | | •Own management system, but not third-party verified •No public reporting of ethics-related metrics |
Members and participants are committed to establishing a management system to ensure: |
•compliance with applicable laws, regulations and customer requirements •conformance with the Code standards •identification and mitigation of operational risks •facilitation of continuous improvement. |
ASML ANNUAL REPORT 2021 89
Amid travel restrictions and other COVID-19 measurements, we have not conducted on-site supplier audits. We view this as an area of improvement and have reviewed our previous audit approach. We are considering whether to involve third-party auditors. We will complete the review and start implementation in 2022.
Supplier Sustainability Program
Our Supplier Sustainability Program addresses labor, human rights, safety, ethics and environmental risks in our tier-1 supply chain by focusing on seven building blocks – Supplier Code of Conduct (RBA), RBA self-assessment, responsible minerals sourcing, reducing carbon footprint, increase re-use capabilities and reducing waste, information security, and business continuity.
An important element in our Supplier Sustainability Program is the ‘Letter of Intent’. By signing this Letter of Intent, suppliers agree to continue adhering to the latest version of the RBA Code of Conduct, measure and share their CO2 emission data with ecosystem partners, set ambitious targets to reduce CO2 emissions, and collaborate with ASML and ecosystem partners to remanufacture used system parts, tools, packaging and other materials to maximize the re-use of materials.
Our performance and progress
By year end 2021, more than 50% of the suppliers in scope for the first phase roll-out signed the Letter of Intent, exceeding our initial target of onboarding 20%. Through the Letter of Intent, our suppliers acknowledge the joint responsibility and commitment to reduce the collective environmental footprint, in particular on CO2 emissions contributing to our scope 3 reduction and waste contributing to our re-use ambitions. Read more in: Our performance in 2021 - Environmental - Circular economy - Re-use parts and materials from installed base.
Reduction of CO2 emissions and waste
In 2021, we made a significant step up in our Supplier Sustainability Program with the ambition to join forces to achieve the global goal of net zero emissions by 2030. We launched this program to our top 60 suppliers, with the intent to gradually increase the scope over time. We recognize that our suppliers are in different phases of maturity with regard to CO2 emissions and waste reduction ambitions, varying from advanced target setting and performances to not having yet started to measure their environmental footprint. Using the CO2 emissions data from our suppliers, we aim to set a baseline in 2022 and agree on emission reduction targets with them.
Conflict minerals
Like many companies in the electronics industry, our products contain minerals and metals necessary to the functionality or production of our products. Such minerals and metals include tantalum, tungsten, tin and gold, which are 3TG minerals, or so-called ‘conflict minerals’. We do not use a significant amount of these 3TG minerals in the manufacturing of our products. However, certain 3TG minerals are needed to develop our products and for them to function. Gold, for example, is used in coating critical electronic connectors, and tin is used for welding electronic components and creating EUV light.
We have adopted a series of compliance measures based on the legal requirements and guidelines of the five-step framework set forth by the OECD Due Diligence Guidance from Responsible Supply Chains of Minerals from Conflict-Affected and High-Risk Areas (OECD Guidance). As part of our responsible sourcing program we conduct a reasonable country of origin inquiry. To this end we focus on five areas, covering a robust management system, risk identification, risk mitigation, industry collaboration with the Responsible Minerals Initiative (RMI) organization, and public reporting.
Despite continuous efforts, we are unable to determine the precise origin of all of the 3TG minerals included in our products. This is due to several reasons: 3TG supply chain complexity, the number of tiers of suppliers to trace the source, and the limited number of certified conflict-free smelters for all conflict minerals. To obtain correct data from our supply chain is a challenge, but we continue our efforts in this regard. We continue to encourage our suppliers to trace the origins of the 3TG minerals within their supply chain in accordance with applicable conflicts minerals rules and regulations. Furthermore, we request our suppliers to report smelters who are not listed or identified on the RBA smelters list to the RBA for audit. For more information, please see our Conflict Minerals report available on www.asml.com.
ASML ANNUAL REPORT 2021 90
Our supply chain KPIs
The table below shows the key performance indicators (KPIs) and the related 2025 targets. Read more in: Non-financial statements - Non-financial indicators - Our supply chain for our performance indicators (PIs) and related results. The non-financial data may include a degree of uncertainty, because of limitations in measurement method and assumptions applied. Read more in: Non-financial statements - About the non-financial information - Reporting indicators .
| | | | | | | | | | | | | | |
| KPI | 2019 | 2020 | 2021 | Target 2025 |
RBA self-assessment completed (in %)1 | 78 | % | 88 | % | 89 | % | 90 | % |
Suppliers with high risk on sustainability elements evaluated and follow-up agreed (in %) 2 | 25 | % | 0 | % | 100 | % | 100 | % |
1.This indicator shows the percentage of major suppliers in scope that completed the annual RBA self-assessment questionnaire (SAQ).
2.Zero suppliers were identified with a high risk on sustainability elements.
Contributing to the UN's Sustainable Development Goals
Our ambitions, commitments and programs as described in this chapter contribute to the following SDGs. For further information on the performance, read more in: Non-financial statements - Non-financial indicators - Our supply chain.
| | | | | |
| SDG target | How we measure our performance |
SDG target 8.8 - Protect labor rights and promote safe and secure working environments for all workers, including migrant workers, in particular women migrants, and those in precarious employment
| •Compliance with RBA Code of Conduct •RBA self-assessment questionnaire completion •Suppliers with high risk on sustainability elements evaluated and follow-up agreed |
| SDG target 12.2 - By 2030, achieve the sustainable management and efficient use of natural resources | •Promote circular procurement |
ASML ANNUAL REPORT 2021 91
Corporate governance
We endorse the importance of good corporate governance, of which independence, accountability and transparency are the most significant elements. These are also the elements on which a relationship of trust between us and our stakeholders can be built.
ASML Holding N.V. is a public limited liability company operating under Dutch law. ASML’s shares are listed on Euronext Amsterdam and NASDAQ.
We have a two-tier board structure, consisting of a Board of Management responsible for managing the company, and an independent Supervisory Board which supervises and advises the Board of Management. For the fulfillment of their duties, the two Boards are accountable to the General Meeting, the corporate body representing our shareholders.
Our governance structure is based on ASML’s articles of association, Dutch corporate and securities laws and the Dutch Corporate Governance Code. Because we are listed on NASDAQ, we are also required to comply with applicable provisions of the Sarbanes-Oxley Act, the NASDAQ Listing Rules, and the rules and regulations promulgated by the US Securities and Exchange Commission.
We are subject to the relevant provisions of Dutch law applicable to large corporations (structuurregime). These provisions have the effect of concentrating control over certain corporate decisions and transactions in the hands of the Supervisory Board. Procedures for the appointment and dismissal of Board of Management and Supervisory Board members are based on the structuurregime.
This section of the Annual Report addresses our corporate governance structure and the way ASML applies the principles and best practices of the Dutch Corporate Governance Code. It also provides information required by the Decree adopting further rules related to the content of the management report and the Decree implementing Article 10 of the Takeover Directive.
In accordance with the Dutch Corporate Governance Code (https://www.mccg.nl/english), other parts of this Annual Report address our strategy and culture aimed at long-term value creation, our values and Code of Conduct, as well as the main features of our internal control and risk management systems. Read more in: Who we are and what we do - Our company, Our position in the semiconductor value chain - Our strategy, Our performance in 2021 - How we create value and Our performance in 2021 - Governance - How we manage risk.
ASML corporate governance structure
ASML ANNUAL REPORT 2021 93
Board of Management
ASML’s Board of Management is responsible for managing ASML. Its responsibilities include establishing a position on the relevance of long-term value creation for ASML and its business, defining and deploying ASML’s strategy, establishing and maintaining effective risk management and control systems, managing the realization of ASML’s operational and financial objectives and the corporate social responsibility aspects relevant to ASML. In fulfilling its management tasks and responsibilities, the Board of Management is guided by the interests of ASML and its business and takes into consideration the interests of our stakeholders.
The current Board of Management is comprised of five members. It has a dual leadership structure, under the chairmanship of the President and Chief Executive Officer, and the vice chairmanship of the President and Chief Technology Officer. The Board of Management has adopted a division of tasks, charging individual members with a specific part of the managerial tasks, but the Board of Management remains collectively responsible for the management of ASML.
The Board of Management is supervised and advised by the Supervisory Board. The Board of Management provides the Supervisory Board with all the information, in writing or otherwise, necessary for the Supervisory Board to properly carry out its duties. Besides the information provided in the regular meetings, the Board of Management provides the Supervisory Board with regular updates on developments relating to our business, financials, operations, and industry developments in general. Certain important decisions of the Board of Management require the approval of the Supervisory Board, see the Supervisory Board section of this Corporate Governance chapter.
Further information regarding the general responsibilities of the Board of Management, the relationship with the Supervisory Board and various stakeholders, the decision-making process within the Board of Management, and the logistics surrounding the meetings can be found in the Board of Management’s rules of procedure. These are published in the Governance section on our website.
Appointments
Members of the Board of Management are appointed by the Supervisory Board on the recommendation of the Selection and Nomination Committee and upon notification to the General Meeting. Members of the Board of Management are appointed for a term of four years. Reappointment for consecutive four-year terms is possible.
In line with Dutch law, all members of the Board of Management are engaged by means of a management services agreement for the duration of their appointment.
The management services agreements between ASML and the Board of Management members contain specific provisions regarding severance payments. If ASML terminates the agreement for reasons which are not exclusively or mainly found in acts or omissions of the Board of Management member, a severance payment not exceeding one year’s base salary will be paid. Furthermore, current agreements stipulate that a member of the Board of Management, when giving notice of termination pursuant to a change of control, will be entitled to a severance amount. Given that such a resignation is specifically linked to a change of control, ASML does not consider this provision a deviation from the Dutch Corporate Governance Code.
The Supervisory Board may suspend and dismiss members of the Board of Management, but this can only be done after consulting the General Meeting.
More information about changes to the Board of Management during 2021 can be found in the Supervisory Board Report included in this Annual Report.
Peter T.F.M. Wennink (1957, Dutch)
President, Chief Executive Officer and Chair of Board of Management
Term expires 2022
ASML ANNUAL REPORT 2021 94
Peter Wennink became President and CEO in 2013, having served as Executive VP, CFO and member of the Board of Management since 1999. Peter was previously a partner at Deloitte Accountants, focusing on the semiconductor industry. He has an extensive background in finance and is a member of the Dutch Institute of Registered Accountants. Peter was a member of the Advisory Board of the Investment Committee of Stichting Pensioenfonds ABP until December 31, 2021. He serves as vice-chairman on the board of the FME-CWM, Peter is also a member of the board of Captains of Industry Eindhoven Region and is Chair of the Eindhovensche Fabrikantenkring and of the Supervisory Board of the Eindhoven University of Technology. Furthermore, Peter is council member of Topconsortium voor 'Kennis en Innovatie' TKI HTS&M, member of the Advisory Committee of the Dutch National Growth Fund and a member of the Circle of Influence of Startup Delta.
Martin A. van den Brink (1957, Dutch)
President, Chief Technology Officer and Vice Chair of Board of Management
Term expires 2022
Martin van den Brink has been President and CTO of ASML since 2013. He joined ASML at its founding in 1984, and for the next 11 years held various positions in engineering. In 1995 he became Vice President Technology, and in 1999 was appointed Executive Vice President Product & Technology and member of the Board of Management. Martin holds a degree in Electrical Engineering from HTS Arnhem (HAN University), as well as a degree in Physics (1984) from the University of Twente. In 2012, the University of Amsterdam awarded him an honorary doctorate in physics.
Roger J.M. Dassen (1965, Dutch)
Executive Vice President and Chief Financial Officer
Term expires 2022
Roger Dassen joined ASML in June 2018 and was appointed Executive Vice President and CFO and member of the Board of Management at the AGM the same year. He previously served as Global Vice Chair and member of the Executive Board of Deloitte Touche Tohmatsu Limited, having been CEO of Deloitte Holding B.V. Roger holds a master’s in Economics and Business Administration, a post-master’s in Auditing, and a PhD in Business Administration, all from the University of Maastricht. He is Professor of Auditing at Vrije Universiteit Amsterdam, and sits on the Supervisory Board of the Dutch National Bank. He is also the Chair of the Supervisory Board of Maastricht University Medical Center+.
ASML ANNUAL REPORT 2021 95
Christophe D. Fouquet (1973, French)
Executive Vice President EUV
Term expires 2022
Christophe Fouquet was appointed Executive Vice President EUV and member of the Board of Management in 2018. Since joining ASML in 2008, he has held several positions, including Senior Director Marketing, Vice President Product Management, and Executive Vice President Applications, a position he held from 2013 until 2018. Prior to joining ASML, he worked for semiconductor equipment peers KLA Tencor and Applied Materials. Christophe holds a master’s degree in Physics from the Institut Polytechnique de Grenoble.
Frédéric J.M. Schneider-Maunoury (1961, French)
Executive Vice President and Chief Operations Officer
Term expires 2022
Frédéric Schneider-Maunoury has been Executive Vice President and Chief Operations Officer since he joined ASML in 2009. He was appointed to the Board of Management in 2010. Prior to joining ASML, Frédéric was Vice President Thermal Products Manufacturing at power generation and rail transport equipment group Alstom, having previously served as General Manager of the worldwide Hydro Business of Alstom. Before joining Alstom, Frederic held various positions at the French Ministry of Trade and Industry. He is a graduate of Ecole Polytechnique (1985) and Ecole Nationale Supérieure des Mines (1988) in Paris.
ASML ANNUAL REPORT 2021 96
Supervisory Board
Our Supervisory Board supervises the Board of Management and the general course of affairs of ASML and its subsidiaries. The Supervisory Board also supports the Board of Management with advice. In fulfilling its role and responsibilities, the Supervisory Board takes into consideration the interests of ASML and its subsidiaries, as well as the relevant interests of its stakeholders. In the two-tier structure, the Supervisory Board is a separate and independent body from the Board of Management and from ASML. No member of the Supervisory Board personally maintains a business relationship with ASML, other than as a member of the Supervisory Board.
The Supervisory Board currently consists of eight members, with the minimum being three.
In performing its task, the Supervisory Board focuses on, inter alia, ASML’s corporate strategy aimed at long-term value creation and the execution thereof, the staffing of and succession planning for the Board of management, the management of risks inherent to ASML's business activities, the financial reporting process, compliance with applicable legislation and regulations, ASML’s culture and the activities of the Board of Management in that regard, the relationship with shareholders and other stakeholders, and corporate social responsibility issues important for ASML.
Important management decisions, such as setting the operational and financial objectives, the strategy designed to achieve these objectives and the parameters to be applied in relation thereto, major investments, budget and the issue, repurchase and cancellation of shares, require the Supervisory Board’s approval.
The Supervisory Board is governed by its rules of procedure. Items covered in these rules include the responsibilities of the Supervisory Board and its committees, the composition of the Supervisory Board and its committees, logistics surrounding the meetings, the meeting attendance of members of the Supervisory Board, the rotation schedule for these members and the Committee charters. The Supervisory Board’s rules of procedure and the committee charters are regularly reviewed and, if needed, amended. The Audit Committee charter is reviewed annually to confirm that the charter still complies with applicable rules and regulations, especially those relating to the Sarbanes-Oxley Act.
Read more information on the meetings and activities of the Supervisory Board in 2021 in: Supervisory Board - Supervisory Board report - Meetings and attendance.
Appointments
The members of the Supervisory Board are appointed by the General Meeting based on binding nominations proposed by the Supervisory Board. When nominating persons for (re)appointment, the Supervisory Board checks whether the candidates fit the Supervisory Board's profile. The profile is available in the Governance section of our website. The General Meeting may reject binding nominations of the Supervisory Board by way of a resolution adopted with an absolute majority of the votes cast, representing at least one-third of ASML’s outstanding share capital. If the votes cast in favor of such a resolution do not represent at least one-third of the total outstanding capital, a new shareholders’ meeting can be convened, at which the nomination can be overruled by an absolute majority.
The Supervisory Board generally informs the General Meeting and the Works Council about upcoming retirements by rotation at the Annual General Meeting of Shareholders (AGM) in the year preceding the actual retirement(s) by rotation. This ensures they have sufficient opportunity to recommend candidates for the upcoming vacancies. The Supervisory Board has the right to reject the proposed recommendations. Furthermore, the Works Council has an enhanced right to make recommendations for one-third of the members of the Supervisory Board. This enhanced recommendation right implies that the Supervisory Board may only reject the Works Council’s recommendations in limited circumstances: (i) if the relevant person is unsuitable or (ii) if the Supervisory Board would not be duly composed if the recommended person were appointed as Supervisory Board member.
Members of the Supervisory Board serve for a maximum term of four years or a shorter period as per the Supervisory Board’s rotation schedule. Supervisory Board members are eligible for reappointment for another maximum term of four years. After that, members may be reappointed again for a maximum period of two years. This appointment may be extended for a final term of no more than two years. The rotation schedule is available in the Governance section on our website.
If the General Meeting loses confidence in the Supervisory Board, it may, by an absolute majority of the votes representing at least one-third of the total outstanding capital, withdraw its confidence in the Supervisory Board. This resolution shall result in the immediate dismissal of the entire Supervisory Board. In such case, the Enterprise Chamber of the Amsterdam Court of Appeal shall appoint one or more members to the Supervisory Board at the request of the Board of Management.
Supervisory Board committees
The Supervisory Board, while retaining overall responsibility, has assigned some of its tasks and responsibilities to four committees: the Audit Committee, the Remuneration Committee, the Selection and Nomination Committee and the Technology Committee. Further information on the Supervisory Board committees can be found in the Supervisory Board report and in the charters of the committees as posted on our website.
ASML ANNUAL REPORT 2021 97
Gerard J. Kleisterlee (1946, Dutch)
Member of the Supervisory Board since 2015; second term expires in 2023
Chair of the Supervisory Board, Chair of the Selection and Nomination Committee and member of the Technology Committee
Gerard Kleisterlee joined the Supervisory Board in 2015, and has been its Chair since 2016. He was President and CEO of the Board of Management of Royal Philips NV from 2001 until 2011, having worked at the company since 1974. From 2011 to 2022 Gerard was the Chairman of the Board of Vodafone Group Plc. From 2010 until May 2020, he was a Non-Executive Director of Royal Dutch Shell Plc. Currently, Gerard is an independent board member at IBEX Limited.
Antoinette (Annet) P. Aris (1958, Dutch)
Member of the Supervisory Board since 2015; third term expires in 2024
Vice Chair of the Supervisory Board since 2021, Member of Remuneration Committee, Technology Committee and Selection and Nomination Committee
Annet Aris has been a member of the Supervisory Board since 2015. She is Senior Affiliate Professor of Strategy at INSEAD business school, France, a position she has held since 2003. From 1994 to 2003 she was a partner at McKinsey & Company in Germany and until 2019 she was the Non-Executive Director of Thomas Cook Group. She also sits on the supervisory boards of Jungheinrich AG, Randstad Holding NV and the Cooperatieve Rabobank U.A.
Johannes (Hans) M.C. Stork (1954, American)
Member of the Supervisory Board since 2014; second term expires in 2022
Member of the Technology Committee and the Remuneration Committee
ASML ANNUAL REPORT 2021 98
Hans Stork joined the Supervisory Board in 2014. He is Senior Vice President and CTO of ON Semiconductor Corporation, a position he has held since 2011. Prior to that, Hans held a range of senior positions, including Senior Manager at IBM Corporation, Director of ULSI Research Lab at Hewlett Packard Company, Senior Vice President and CTO of Texas Instruments, Inc and Group Vice President and CTO of Applied Materials, Inc. He has also been a member of the Board of Sematech, and currently sits on the Scientific Advisory Board of imec.
Mark. M.D. Durcan (1961, American)
Member of the Supervisory Board since 2020; first term expires in 2024
Chair of the Technology Committee, member of the Selection and Nomination Committee
Mark Durcan was appointed as a member the Supervisory Board in 2020. From 2012 to 2017, he was CEO of Micron Technology, Inc, having joined the company in 1984, and held various management positions before being appointed as CEO. Furthermore, Mark was director at Freescale Semiconductor and MWI Veterinary Supply. Mark is a Non-Executive Director at Advanced Micro Devices, Inc and Veoneer, a member of the board of AmerisourceBergen Corporation, member of the Board of Trustees for Rice University (Texas), director at St. Luke's Health System (Idaho) and Director at Natural Intelligence Systems CA private AI. Startup Company.
Terri L. Kelly (1961, American)
Member of the Supervisory Board since 2018; first term expires in 2022
Chair of the Remuneration Committee, member of the Selection and Nomination Committee
Terri Kelly has been a member of the Supervisory Board since 2018. Previously, she was President and Chief Executive Officer at W.L. Gore & Associates from 2005 until 2018, having worked at Gore since 1983 in various management roles. She also served on Gore’s Board of Directors through July 2018. Terri is a Trustee of the Nemours Foundation, Vice-Chair of the University of Delaware, and a Trustee of the Unidel Foundation. She is also a member of the Board of Directors of United Rentals, Inc.
ASML ANNUAL REPORT 2021 99
Rolf-Dieter Schwalb (1952, German)
Member of the Supervisory Board since 2015; second term expires in 2023
Chair of the Audit Committee and member of the Remuneration Committee
Rolf-Dieter Schwalb has been a member of the Supervisory Board since 2015. He was CFO and member of the Board of Management of Royal DSM NV from 2006 to 2014. Prior to that, he was CFO and member of the Executive Board of Beiersdorf AG. He also held a variety of management positions in Finance, IT and Internal Audit at Beiersdorf AG and Procter & Gamble Co.
Warren D.A. East (1961, British)
Member of the Supervisory Board since 2020; first term expires in 2024
Member of the Audit Committee
Warren East became a member of the Supervisory Board in 2020. Warren has been CEO of Rolls-Royce Group Plc since 2015. He spent his early career at Texas Instruments Ltd from 1985 to 1994. He then joined ARM Holdings, Plc, where he held various management positions and was appointed as its CEO from 2001 to 2013.
Birgit Conix (1965, Belgian)
Member of the Supervisory Board since 2021; first term expires in 2025
Member of the Audit Committee
Birgit Conix became a member of the Supervisory Board in 2021. Birgit has been CFO and a member of the Management Board of Sonova Holding AG since June 2021. From 2018 until January 1, 2021, Birgit was a member of the Executive Board and CFO of TUI AG. Prior to that, she was the CFO of the Belgian media, cable and telecommunications company Telenet Group NV. Prior to that, she held various management positions in finance at Johnson & Johnson, Heineken, Tenneco and Reed Elsevier.
ASML ANNUAL REPORT 2021 100
Other Board-related matters
The section below addresses a number of topics that apply to both the Board of Management and the Supervisory Board.
Remuneration and share ownership
The remuneration of the Board of Management is determined by the Supervisory Board, on recommendation of the Remuneration Committee, in accordance with the Remuneration Policy adopted by the General Meeting. The current Remuneration Policy was adopted by the General Meeting in 2021.
The remuneration of the Supervisory Board is based on the Remuneration Policy. The current Remuneration Policy was adopted by the General Meeting in 2021. The remuneration of the Supervisory Board is not dependent on our (financial) results. The members of the Supervisory Board do not receive ASML shares, or rights to acquire ASML shares, as part of their remuneration.
Board of Management and Supervisory Board members who acquire or have acquired ASML shares or rights to acquire ASML shares must intend to keep these for long-term investment only. In concluding transactions in ASML shares, members of the Board of Management and the Supervisory Board must comply with our Insider Trading Rules. Any transactions in ASML shares performed by members of the Board of Management and the Supervisory Board are reported to the Dutch AFM. No member of the Supervisory Board currently has any ASML shares or rights to acquire ASML shares.
We will not and have not granted any personal loans, guarantees, or the like to members of the Board of Management and the Supervisory Board.
Our Articles of Association provide for the indemnification of the members of the Board of Management and the Supervisory Board against claims that are a direct result of their tasks, provided that such claims are not attributable to willful misconduct or intentional recklessness of the respective member. We have also implemented the indemnification of the members of the Board of Management and the Supervisory Board by means of separate indemnification agreements for each member.
Detailed information on the Board of Management’s and the Supervisory Board’s remuneration can be found in Supervisory Board - Remuneration report.
Diversity
On August 6, 2021, the US Securities and Exchange Commission approved the Nasdaq Stock Market’s proposal to amend its listing standards to encourage greater board diversity and to require board diversity disclosures for Nasdaq-listed companies. Pursuant to the amended listing standards, ASML, as a foreign private issuer, is required to have at least two diverse Supervisory Board members or explain the reasons for not meeting this objective. Furthermore, a Board diversity matrix is required to be included in the Annual Report on Form 20-F, containing certain demographic and other information regarding members of the Supervisory Board. ASML currently complies with the diversity requirement, as we currently have three female and five male members on our Supervisory Board. The Board diversity matrix is set out below.
Board Diversity Matrix (status per December 31, 2021)
| | | | | | | | | | | | | | |
| Country of Principal Executive Offices | The Netherlands |
| Foreign Private Issuer | Yes |
| Disclosure Prohibited under Home Country Law | No |
| Total Number of Supervisory Board members | 8 (2020: 9) |
| Female | Male | Non-Binary | Did Not Disclose |
| Part I: Gender Identity |
| Directors | 3 (2020: 3) | 5 (2020: 6) | 0 (2020: 0) | 0 (2020: 0) |
| Part II: Demographic Background |
| Underrepresented Individual in Home Country Jurisdiction | 0 (2020: 0) | 0 (2020: 0) | 0 (2020: 0) | 0 (2020: 0) |
| LGBTQI+ | 0 (2020: 0) | 0 (2020: 0) | 0 (2020: 0) | 0 (2020: 0) |
| Did Not Disclose Demographic Background | 0 (2020: 0) | 0 (2020: 0) | 0 (2020: 0) | 0 (2020: 0) |
On September 28, 2021, a gender diversity bill was adopted by Dutch Parliament, introducing a quota for the supervisory boards of Dutch listed companies pursuant to which the composition of the supervisory board should comprise at least one-third of both men and women. New appointments will be declared null and void in the event of non-compliance with this requirement. Also, the bill introduced a requirement to set ambitious gender balance targets for boards of management and senior management of large listed and non-listed Dutch NVs and BVs. This gender diversity bill has entered into force on January 1, 2022. Annually, as of the 2022 reporting year, companies will have to report on their progress made in achieving the gender balance targets to the Dutch Social and Economic Council and in the management report.
Currently, the Supervisory Board meets the gender criterion of the Dutch gender diversity bill, since both men and women are represented in the Supervisory Board with at least three out of eight members.
ASML ANNUAL REPORT 2021 101
We recognize the importance of diversity and inclusion: a diverse and inclusive workforce provides the necessary mix of voices and points of view required to continue to innovate and drive our business forward. Ensuring balanced gender representation has proven to be challenging in a technology environment such as the one ASML operates in. Overall, the global STEM (science, technology, engineering and math) talent pool is scarce and it is even more challenging to recruit female talent. Our R&D workforce is 15% female. Nearly 90% of job positions are STEM related, while peers in the high-tech industry have more diverse, non-STEM related job positions. ASML is highly motivated to see more women pursuing careers in engineering and science now and in the future, thereby increasing our future talent pool, so that more women will be available in the future for technical positions and (senior) management positions, including the Board of Management. The highly-specialized nature of our industry means achieving this balance is a long-term process. We are actively engaged with multiple educational programs to grow the pipeline, deploy multiple initiatives to promote STEM education among the future female talent pool and continue to foster an environment where on our current workforce can thrive.
Since 2020, we have been developing and formalizing our approach to diversity and inclusion. We assembled a Global Diversity & Inclusion Council in 2021 that consists of senior leaders who act on behalf of ASML to provide thought leadership. The Council, chaired by a member of the Board of Management, creates strategic accountability for results, provides governance and oversight on diversity and inclusion initiatives, and promotes company-wide accountability to goals. Our diversity and inclusion strategy includes the following:
•Engaging a larger talent pool by making opportunities more visible and accessible
•Creating shared metrics to more clearly evaluate progress
•Ensuring inclusive leadership behaviors are embedded in our culture
•Including diverse perspectives in our talent practices
•Providing employees more ways to engage and drive their careers
Our aim is to be representative of the available skilled workforce. Creating an environment where all feel welcome, know they belong and see a career path in front of them requires diversity at all levels of the organization.
We aim to increase the diversity of our workforce by fostering a culture that is inclusive of all. We@ASML, our employee survey, measures inclusion levels each year. In 2021 our Inclusion score was 83% compared to 82% of top performing global companies. Our goal is to meet or increase this level of inclusion among our employees on an ongoing basis. To do this, we set a target to score on par +/- 3% with the top 25% of this comparison company list in 2024.
In 2021, we made progress in gender diversity among all employees and senior management. Female employees now make up 18% of our workforce worldwide. This improvement has increased by 1% compared to last year. We aim to increase this trend as we move toward 2024.
We believe the most effective way to address this is by focusing on the growth of our existing team members and expanding the diversity of our talent pool. We’ve set goals to increase the hiring of women from 20% in 2021 to 23% by 2024.
We still have work to do in this area and have set specific goals focused on female leadership levels. The current representation of women at this level is 8% today and our ambition is to reach 12% by 2024. To make this tangible, we’ve set a goal to raise the hiring of female leaders, from 12% in 2021 to 20% in 2024. We believe this talented pool will be role models, paving a path for more to follow. Our ambition is to have more diversity in our workforce because we believe it is one of the best ways to attract and retain smart talented people to help us drive technological innovations forward to meet our customers’ needs. Read more information on our diversity and inclusion strategy, initiatives, women in leadership and performance data in: Our performance in 2021 - Social - Our people - Employee experience and Non-financial statements - Non-financial indicators - Our people.
Conflicts of interest and related party transactions
Conflicts of interest procedures are incorporated in both the Board of Management’s and the Supervisory Board’s rules of procedure. These procedures reflect Dutch law and the principles and best practice provisions of the Code with respect to conflicts of interest.
There have been no transactions in 2021, nor are there currently any transactions, between ASML or any of ASML’s subsidiaries, or any significant shareholder and any member of the Board of Management, officer, Supervisory Board member or any relative or spouse thereof, other than ordinary course compensation arrangements. Furthermore, ASML has not granted any personal loans, guarantees, or the like to members of the Board of Management or Supervisory Board.
Outside positions
Pursuant to Dutch legislation, a member of the Board of Management may not be a Supervisory Board member in more than two other large companies or large foundations, as defined in Dutch law. A member of the Board of Management may never be the Chairperson of a Supervisory Board of a large company. Board of Management members require prior approval from the Supervisory Board before accepting a position of another large company or foundation. Members of the Board of Management are also required to notify the Supervisory Board of other important functions held or to be held by them.
ASML ANNUAL REPORT 2021 102
Dutch law stipulates that a Supervisory Board member may not hold more than five Supervisory Board positions in large companies or large foundations as defined in Dutch law, with chairmanships counting double.
During the financial year 2021, all members of the Board of Management and the Supervisory Board complied with the requirements described above.
General Meeting
A General Meeting (AGM) is held at least once a year and generally takes place in Veldhoven, the Netherlands. However, due to the COVID-19 pandemic and in accordance with the Temporary Act COVID-19 Justice and Safety, in 2021 the AGM was held fully virtually. The agenda for the AGM typically includes the following topics:
•Discussion of the management report and the adoption of the financial statements over the past financial year;
•Discussion of the dividend policy and approval of any proposed dividends;
•Advisory vote on the Remuneration Report over the past financial year;
•The discharge from liability of the members of the Board of Management and the Supervisory Board for the performance of their responsibilities in the previous financial year;
•The limited authorization for the Board of Management to issue (rights to) shares in ASML’s capital, and to exclude preemptive rights for such issuances, as well as to repurchase shares and to cancel shares; and
•Any other topics proposed by the Board of Management, the Supervisory Board or shareholders in accordance with Dutch law and the articles of association.
Proposals placed on the agenda by the Supervisory Board, the Board of Management, or by shareholders, provided that they have submitted the proposals in accordance with the applicable legal provisions, are discussed and resolved upon. Shareholders representing at least 1.0% of ASML’s outstanding share capital or representing a share value of at least €50 million are entitled to place items on the agenda of a General Meeting at the latest 60 days before the date of the meeting.
Extraordinary general meetings may be held when considered necessary by the Supervisory Board or Board of Management. In addition, an extraordinary general meeting must be held if one or more ordinary or cumulative preference shareholders, who jointly represent at least 10% of the issued share capital, make a written request to that effect to the Supervisory Board and the Board of Management. The request must specify in detail the business to be dealt with.
Shareholders’ meetings are convened by public announcement via the website of ASML no later than 42 days prior to the meeting, as stipulated by Dutch law. The record date is set at the 28th day prior to the day of the AGM. Persons who are registered as shareholders on the record date are entitled to attend the meeting and to exercise other shareholder rights.
The Board of Management and Supervisory Board provide the shareholders with the information relevant to the topics on the agenda by means of an explanation to the agenda and other documents necessary or helpful for this purpose. The agenda indicates which agenda items are voting items, and which items are for discussion only. All documents related to the General Meeting, including the agenda with explanations, are posted on our website.
ASML shareholders may appoint a proxy who can vote on their behalf at the AGM. We also use an internet proxy voting system, facilitating shareholder participation without having to attend in person. We also provide the option for shareholders to issue voting proxies or voting instructions to an independent civil law notary prior to the AGM. We do not solicit from or nominate proxies for our shareholders.
Virtual AGM
In view of the COVID-19 pandemic, we organized a fully virtual AGM in 2021, accommodating virtual attendance of the AGM by enabling shareholders to follow the proceedings of the meeting via video webcast and to vote electronically during the meeting. The opportunity to participate in the AGM virtually was offered in addition to the opportunity to vote in advance via written or electronic proxy. As we highly value the interaction with our shareholders, we invited shareholders to submit questions about the agenda items prior to the AGM and we provided holders of shares traded on Euronext Amsterdam the opportunity to ask live questions in writing through the virtual meeting platform or verbally via a video connection. We received a total of 19 questions before and during the meeting. All questions were answered during the AGM.
ASML ANNUAL REPORT 2021 103
Resolutions are adopted by the General Meetings by an absolute majority of the votes cast (except where a different proportion of votes are required by the Articles of Association or Dutch law), and there are generally no quorum requirements applicable to such meetings.
Voting results from the AGM are made available on our website within 15 days of the meeting. The draft report of the AGM is made available on our website or on request no later than three months after the meeting. Shareholders have the opportunity to provide comments in the subsequent three months, after which the report is adopted by the Chairman and the Secretary of the meeting. The adopted report is also available on our website and on request.
Powers
In addition to the items submitted annually at the AGM, the General Meeting also has other powers, with due observance of the statutory provisions. These include resolving:
•To amend the articles of association;
•To issue shares if and insofar as the Board of Management has not been designated by the General Meeting for this purpose; and
•To adopt the Remuneration Policies for the members of the Board of Management and the Supervisory Board.
(Proposed) amendments of the Articles of Association require the approval of the Supervisory Board. A quorum requirement applies for the General Meeting at which an amendment of the Articles of Association is proposed: more than half of the issued share capital is required to be represented; the proposal requires a voting majority of at least three-fourths of the votes cast. If the quorum requirement is not met, a subsequent General Meeting shall be convened, to be held within four weeks of the first meeting. At this second meeting, the resolution can be adopted with at least three-fourths of the votes cast, irrespective of the share capital represented. If a resolution to amend the Articles of Association is proposed by the Board of Management, the resolution will be adopted with an absolute majority of votes cast irrespective of the represented share capital at the General Meeting.
A brief summary of the most significant provisions of our Articles of Association is included as Exhibit 99.1 to our form 6-K furnished to the SEC on February 8, 2013 (the ‘Articles of Association’), which is incorporated by reference herein.
Share capital
ASML's authorized share capital amounts to €126.0 million and is divided into:
| | | | | | | | | | | |
| Type of shares | Amount of shares | Nominal value | Votes per share |
| Cumulative preference shares | 700,000,000 | €0.09 per share | 9 |
| Ordinary shares | 699,999,000 | €0.09 per share | 9 |
| Ordinary shares B | 9,000 | €0.01 per share | 1 |
ASML ANNUAL REPORT 2021 104
The issued and fully paid up ordinary shares with a nominal value of €0.09 each were as follows:
| | | | | | | | | | | |
| Year ended December 31 | 2019 | 2020 | 2021 |
| Issued ordinary shares with nominal value of €0.09 | 419,810,706 | | 416,514,034 | | 402,601,613 | |
| Issued ordinary treasury shares with nominal value of €0.09 | 5,848,998 | | 2,983,454 | | 3,873,663 | |
| Total issued ordinary shares with nominal value of €0.09 | 425,659,704 | | 419,497,488 | | 406,475,276 | |
82,915,935 ordinary shares were held by 286 registered holders with a registered address in the US. Since certain of our ordinary shares were held by brokers and nominees, the number of record holders in the US may not be representative of the number of beneficial holders, or of where the beneficial holders are resident.
Each ordinary share consists of 900 fractional shares. Fractional shares entitle the holder thereof to a fractional dividend, but do not give entitlement to voting rights. Only those persons who hold shares directly in the share register in the Netherlands, held by us at our address at 5504 DR Veldhoven, de Run 6501, the Netherlands, or in the New York share register, held by JP Morgan Chase Bank, N.A., P.O. Box 64506, St. Paul, MN 55164-0506, United States, can hold fractional shares. Shareholders who hold ordinary shares through the deposit system under the Dutch Securities Bank Giro Transactions Act maintained by the Dutch central securities depository Euroclear Nederland or through the Depository Trust Company cannot hold fractional shares.
No ordinary shares B and no cumulative preference shares have been issued.
Special voting rights, limitation voting rights and transfers of shares
There are no special voting rights on the issued shares in our share capital.
In 2012, we issued shares to three key customers – Intel, TSMC and Samsung – as part of the customer co-investment program (CCIP) to accelerate ASML’s development of EUV. Under this program, the participating customers funded certain development programs and invested in ASML’s ordinary shares. Currently, only one participating customer still holds (directly or indirectly) ordinary shares. Certain voting restrictions apply in respect of ordinary shares issued in connection with the CCIP. These voting restrictions in respect of these ordinary shares are set out in the underlying agreement between ASML and the relevant customer. The shares issued in the CCIP were held by foundations which issued depository receipts to participants in the CCIP. A total of 96,566,077 depository receipts for ordinary shares were issued at the launch of the CCIP. This number has since decreased with the sell-down by the relevant customers following expiry of the lock-up.
There are currently no limitations, either under Dutch law or in ASML’s Articles of Association, on the transfer of ordinary shares in the share capital of ASML. Pursuant to ASML’s Articles of Association, the Supervisory Board’s approval shall be required for every transfer of cumulative preference shares.
Issue and repurchase of (rights to) shares
Our Board of Management has the power to issue ordinary shares and cumulative preference shares insofar as it has been authorized to do so by the General Meeting. The Board of Management requires approval of the Supervisory Board for such an issue. The authorization by the General Meeting can only be granted for a certain period not exceeding five years and may be extended for no longer than five years on each occasion. If the General Meeting has not authorized the Board of Management to issue shares, the General Meeting will be authorized to issue shares on the Board of Management’s proposal, provided that the Supervisory Board has approved such proposal.
Holders of ASML’s ordinary shares have a preemptive right, in proportion to the aggregate nominal amount of the ordinary shares held by them. This preemptive right may be restricted or excluded. Holders of ordinary shares do not have preemptive right with respect to any ordinary shares issued for consideration other than cash or ordinary shares issued to employees. If authorized for this purpose by the General Meeting, the Board of Management has the power, subject to approval of the Supervisory Board, to restrict or exclude the preemptive rights of holders of ordinary shares.
2021 authorization to issue shares
At our 2021 AGM, the Board of Management was authorized from April 29, 2021 through October 29, 2022, subject to the approval of the Supervisory Board, to issue shares and / or rights thereto representing up to a maximum of 5% of our issued share capital at April 29, 2021, plus an additional 5% of our issued share capital at April 29, 2021 that may be issued in connection with mergers, acquisitions and / or (strategic) alliances. Our shareholders also authorized the Board of Management through October 29, 2022, subject to approval of the Supervisory Board, to restrict or exclude preemptive rights with respect to holders of ordinary shares up to a maximum of 5% of our issued share capital in connection with the general authorization to issue shares and/ or rights to shares, plus an additional 5% in connection with the authorization to issue shares and/ or rights to shares in connection with mergers, acquisitions and / or (strategic) alliances.
We may repurchase our issued ordinary shares at any time, subject to compliance with the requirements of Dutch law and our Articles of Association. Any such repurchases are subject to the approval of the Supervisory Board and the authorization by the General Meeting, which authorization may not be for more than 18 months.
2021 authorization to repurchase shares
ASML ANNUAL REPORT 2021 105
At the 2021 AGM, the Board of Management was authorized, subject to Supervisory Board approval, to repurchase through October 29, 2022, up to a maximum of two times 10% of our issued share capital at April 29, 2021, at a price between the nominal value of the ordinary shares purchased and 110% of the market price of these securities on Euronext Amsterdam or NASDAQ.
Read more details on our share buyback program in: Consolidated Financial Statements - Notes to the Consolidated Financial Statements - Note 22 Shareholders’ equity.
ASML Preference Shares Foundation
The ASML Preference Shares Foundation (Stichting Preferente Aandelen ASML), a foundation organized under Dutch law, has been granted an option right to acquire preference shares in the share capital of ASML. The Foundation may exercise the Preference Share Option in situations where, in the opinion of the Foundation’s Board of Directors, ASML’s interests, ASML’s business or the interests of ASML’s stakeholders are at stake. This may be the case if:
•A public bid for ASML’s shares is announced or made, or there is a justified expectation that such a bid will be made without any agreement having been reached with ASML in relation to such a bid; or
•In the opinion of the Foundation’s Board of Directors, the (attempted) exercise of the voting rights by one shareholder or more shareholders, acting in concert, is materially in conflict with ASML’s interests, ASML’s business or ASML’s stakeholders.
Objectives of the Foundation
The Foundation’s objectives are to look after the interests of ASML and the enterprises maintained by and/or affiliated in a group with ASML, in such a way that the interests of ASML, of those enterprises and of all parties concerned are safeguarded in the best possible way, and that influences in conflict with these interests, which might affect the independence or the identity of ASML and those companies, are deterred to the best of the Foundation’s ability, and everything related to the above or possibly conducive thereto. The Foundation aims to realize its objects by acquiring and holding cumulative preference shares in the capital of ASML and by exercising the rights attached to these shares, particularly the voting rights.
The Preference Share Option
The Preference Share Option gives the Foundation the right to acquire such number of cumulative preference shares as the Foundation will require, provided that the aggregate nominal value of such number of cumulative preference shares shall not exceed the aggregate nominal value of the ordinary shares issued at the time of exercise of the Preference Share Option. The subscription price will be equal to their nominal value. Only one-fourth of the subscription price would be payable at the time of initial issuance of the cumulative preference shares, with the other three-fourths of the nominal value only being payable when ASML calls up this amount. Exercise of the preference share option could effectively dilute the voting power of the outstanding ordinary shares by one-half.
Cancellation of cumulative preference shares
Cancellation and repayment of the issued cumulative preference shares by ASML requires authorization by the General Meeting, on a proposal to this effect made by the Board of Management and approved by the Supervisory Board. If the Preference Share Option is exercised and as a result cumulative preference shares are issued, ASML will initiate the repurchase or cancellation of all cumulative preference shares held by the Foundation on the Foundation’s request. In that case, ASML is obliged to effect the repurchase and respective cancellation as soon as possible. A cancellation will result in a repayment of the amount paid and exemption from the obligation to pay up on the cumulative preference shares. A repurchase of the cumulative preference shares can only take place when such shares are fully paid up.
If the Foundation does not request ASML to repurchase or cancel all cumulative preference shares held by the Foundation within 20 months of issuance of these shares, we will be required to convene a General Meeting for the purpose of deciding on a repurchase or cancellation of these shares.
Board of Directors
The Foundation is independent of ASML. The Board of Directors of the Foundation is composed of four independent members from the Netherlands’ business and academic communities. The Foundation’s Board of Directors is composed per December 31, 2021 of the following members: Mr. A.P.M. van der Poel, Mr. S. Perrick, Mr. A.H. Lundqvist and Mr. J. Streppel.
Other than the arrangements made with the Foundation as described above, ASML has not established any other anti-takeover devices.
ASML ANNUAL REPORT 2021 106
Major shareholders
The Dutch Act on the supervision of financial markets and US securities laws contain requirements regarding the disclosure of capital interests and voting rights in listed companies. The following table sets forth the total number of ordinary shares owned by each shareholder that reported to the Dutch AFM or the US SEC a beneficial ownership of ordinary shares that is at least 3.0% (5.0%, in the case of the SEC) of our ordinary shares issued and outstanding. Also included in the table below is the total number of ordinary shares owned by our members of the Board of Management as of December 31, 2021. The information set out below with respect to shareholders is based on public filings with the SEC and AFM as of January 31, 2022.
| | | | | | | | |
| Shares | % of Class6 |
Capital Research and Management Company 1 | 63,658,826 | 15.81 | % |
BlackRock Inc. 2 | 32,024,422 | 7.95 | % |
Baillie Gifford & Co 3 | 18,262,995 | 4.54 | % |
Members of ASML’s current Board of Management (5 persons) 4,5 | 89,892 | 0.02 | % |
1.As reported to the AFM on February 28, 2020, Capital Research & Management Company ("CRMC") reports 572,929,434 voting rights, corresponding to 63,658,826 ordinary shares (based on 9 votes per share), but do not report ownership rights related to those shares. Capital World Investors reported on a Schedule 13-G/A filed with the SEC on February 14, 2020, that it is the beneficial owner of 34,865,768 shares of our ordinary shares as a result of its affiliation with CRMC. Capital World Investors, which is a division of Capital Research and Management Company, as well as its investment management subsidiaries and affiliates Capital Bank and Trust Company, Capital International, Inc., Capital International Limited, Capital International Sarl and Capital International K.K. (reported on a Schedule 13-G/A filed with the SEC on February 16, 2021) that it is the beneficial owner of 28,032,968 of our ordinary shares. We believe that some or all of these shares are included within the shares reported to be owned by Capital Research and Management Company, as set forth above.
2.Based solely on the Schedule 13-G/A filed by BlackRock Inc. with the SEC on January 29, 2021; BlackRock reports voting power with respect to 28,755,630 of these shares. A public filing with the AFM on May 10, 2021 shows an aggregate indirect capital interest of 5.95% and voting rights of 5.81%, based on the total number of issued shares and voting rights at that time.
3.A public filing with the AFM on October 1, 2019 shows Baillie Gifford & Co have 147,694,140 voting rights, corresponding to 18,262,995 shares (based on 9 votes per share), but no ownership rights related to those shares.
4.Does not include unvested shares granted to members of the Board of Management. For further information see Leadership and governance - Remuneration report.
5.No shares are owned by members of the Supervisory Board.
6.As a percentage of the total number of ordinary shares issued and outstanding 402,601,613 as of December 31, 2021, which excludes 3,873,663 ordinary shares which have been issued but are held in treasury by ASML. The share ownership percentages reported to the AFM are expressed as a percentage of the total number of ordinary shares issued (including treasury stock) and accordingly, percentages reflected in this table may differ from percentages reported to the AFM.
ASML ANNUAL REPORT 2021 107
Financial Reporting and Audit
ASML publishes, among others, the following annual reports regarding the financial year 2021:
•The statutory Annual Report, prepared in accordance with the requirements of Dutch law. The financial statements included therein are prepared in accordance with Part 9 of Book 2 of the Dutch Civil Code and EU-IFRS;
•The Annual Report on Form 20-F, prepared in accordance with the requirements of the Exchange Act. The financial statements included therein are prepared in conformity with US GAAP.
Both reports have the same qualitative base and describe the same risk factors that are specific to the semiconductor industry, ASML and ASML’s shares. We also provide sensitivity analyses by providing:
•A narrative explanation of ASML’s financial statements;
•The context within which financial information should be analyzed;
•Information about the quality, and variability, of our earnings and cash flow.
With respect to the process of creating the Annual Report, we have extensive guidelines for the content and layout of our report. These guidelines are primarily based on the applicable laws and regulations referred to above. With respect to the preparation process of these and the other financial reports, we apply internal procedures to safeguard the completeness and accuracy of such information as part of its disclosure controls and procedures. The Disclosure Committee assists the Board of Management in overseeing ASML’s disclosure activities and ensures compliance with applicable disclosure requirements arising under Dutch and US law, and other regulatory requirements. These internal procedures are frequently discussed by the Audit Committee and the Supervisory Board. Read more in: Our performance in 2021 - Governance - How we manage risk - Enterprise Risk Management where ASML’s internal risk management and control systems are discussed.
The Supervisory Board has reviewed and approved, and all Supervisory Board members signed, ASML’s 2021 financial statements as prepared by the Board of Management. KPMG has duly examined our financial statements, and the Auditor’s Report is included in the Consolidated Financial Statements.
External Audit
In accordance with Dutch law, our external auditor is appointed by the General Meeting, based on a nomination for appointment by the Supervisory Board. The Supervisory Board bases its nomination on the advice from the Audit Committee and the Board of Management, who annually provide a report to the Supervisory Board on the performance of and relationship with the external auditor, as well as its independence. ASML’s current external auditor, KPMG, was first appointed by the General Meeting in 2015 for the reporting year 2016, and has been reappointed on a yearly basis since then. At the 2020 AGM, KPMG was appointed as the external auditor for the reporting year 2021.
The Audit Committee reviews and approves the external auditor’s audit plan for the audits planned during the financial year. The audit plan also includes, among others, the activities of the external auditor with respect to their limited procedures on the quarterly results other than the annual accounts. Proposed services may be preapproved at the beginning of the year by the Audit Committee (annual pre-approval) or may be pre-approved during the year by the Audit Committee in case of a particular engagement (specific pre-approval). The annual pre-approval is based on a detailed, itemized list of services to be provided, which is designed to ensure there is no management discretion in determining whether a service has been approved, and to ensure the Audit Committee is informed of each service it is pre-approving.
Dutch rules require strict separation of audit and advisory services for Dutch public-interest entities and US regulations restrict services that can be provided by an auditor of a US listed company. Dutch law prohibits the acceptance by the external auditor of other services when an audit is performed. The Audit Committee monitors compliance with Dutch and US rules on services provided by the external auditor.
The remuneration of external auditor is approved by the Audit Committee on behalf of the Supervisory Board, and after consulting the Board of Management. As the Audit Committee has the most relevant insight and experience in this area, the Supervisory Board has delegated these responsibilities to the Audit Committee. Read more information on principal accountant fees and services in: Other appendices - Appendix - Principal accountant fees and services.
In principle, the external auditor attends all the Audit Committee meetings. The external auditor’s findings are discussed at these meetings. The Audit Committee reports to the Supervisory Board on the topics discussed with the external auditor, including the external auditor’s reports with regards to the audit of the annual reports as well as the content of the annual reports. Furthermore, the external auditor may attend the Supervisory Board meeting in which the annual external audit report is discussed. The external auditor may also attend Supervisory Board meetings in which the quarterly financial results are discussed.
The Audit Committee is informed by the external auditor without delay in case the external auditor would discover irregularities in the content of the audit of the financial reports.
The external auditor is present at our AGM to respond to questions, if any, from the shareholders about the auditor’s report on the Consolidated Financial Statements.
ASML ANNUAL REPORT 2021 108
Internal Audit
The role of our Internal Audit function is to assess our systems of internal controls by performing independent procedures such as risk-based operational audits, IT audits and compliance audits. The Internal Audit department reports directly to the Audit Committee and the Board of Management. The yearly Internal Audit plan is discussed with and approved by the Audit Committee, the Board of Management and the Supervisory Board. The follow-up on the Internal Audit findings and progress made compared to the plan are discussed on a quarterly basis with the Audit Committee. The external auditor and Internal Audit department have meetings on a regular basis.
Corporate Information
ASML Holding N.V. is a holding company that operates through its subsidiaries. We have operating subsidiaries in the Netherlands, the United States, Italy, France, Germany, the United Kingdom, Ireland, Belgium, South Korea, Taiwan, Singapore, China, Hong Kong, Japan, Malaysia and Israel. Read more in: Exhibit index - Exhibit 8.1 - List of main subsidiaries.
US Listing Requirements
As ASML's New York Shares are listed on NASDAQ Stock Market LLC (‘NASDAQ’), NASDAQ corporate governance standards in principle apply to us. However, NASDAQ rules provide that foreign private issuers may follow home country practice in lieu of the NASDAQ corporate governance standards subject to certain exceptions. Our corporate governance practices are primarily based on Dutch requirements. The table below sets forth the practices followed by ASML in lieu of NASDAQ rules based upon the exception as described above.
| | | | | |
| Quorum | ASML does not follow NASDAQ’s quorum requirements applicable to meetings of ordinary shareholders. In accordance with Dutch law and generally accepted Dutch business practice, ASML’s Articles of Association provide that there are no quorum requirements generally applicable to general meetings of shareholders. |
| Solicitation of proxies | ASML does not follow NASDAQ’s requirements regarding the solicitation of proxies and the provision of proxy statements for general meetings of shareholders. ASML does furnish proxy statements and solicit proxies for the General Meeting. Dutch corporate law sets a mandatory (participation and voting) record date for Dutch listed companies at the 28th day prior to the date of the General Meeting. Shareholders registered at such record date are entitled to attend and exercise their rights as shareholders at the General Meeting, regardless of sale of shares after the record date. |
| Distribution Annual Report | ASML does not follow NASDAQ’s requirement regarding distribution to shareholders of copies of an annual report containing audited Financial Statements prior to our AGM. The distribution of our Annual Reports to shareholders is not required under Dutch corporate law or Dutch securities laws, or by Euronext Amsterdam. Furthermore, it is generally accepted business practice for Dutch companies not to distribute annual reports. In part, this is because the Dutch system of bearer shares has made it impractical to keep a current list of holders of the bearer shares in order to distribute the annual reports. Instead, we make our Annual Report available at our corporate head office in the Netherlands (and at the offices of our Dutch listing agent as stated in the convening notice for the meeting) no later than 42 days prior to convocation of the AGM. In addition, we post a copy of our Annual Reports on our Website prior to the AGM. |
Equity compensation arrangements | ASML does not follow NASDAQ’s requirement to obtain shareholder approval of stock option or purchase plans or other equity compensation arrangements available to officers, directors or employees. It is not required under Dutch law or generally accepted practice for Dutch companies to obtain shareholder approval of equity compensation arrangements available to officers, directors or employees. The General Meeting adopts the Remuneration Policy for the Board of Management, approves equity compensation arrangements for the Board of Management and approves the remuneration for the Supervisory Board. The Remuneration Committee evaluates the achievements of individual members of the Board of Management with respect to the short and long-term quantitative performance, the full Supervisory Board evaluates the quantitative performance criteria. Equity compensation arrangements for employees are adopted by the Board of Management within limits approved by the General Meeting. |
Compliance with the Corporate Governance Code
We closely follow the developments in the area of corporate governance and the applicability of the relevant corporate governance rules for ASML. Any substantial changes to ASML’s corporate governance structure or application of the Corporate Governance Code will be submitted to the General Meeting for discussion.
We are of the opinion that ASML fully complies with the Dutch Corporate Governance Code.
The Board of Management and the Supervisory Board,
Veldhoven, February 9, 2022
ASML ANNUAL REPORT 2021 109
How we manage risk
ASML manages risks through an Enterprise Risk Management (ERM) framework that integrates risk management into our daily business activities and strategic planning.
Enterprise Risk Management
We deploy our ERM framework through a well-defined governance structure and a robust ERM process. The Risk and Business Assurance function drives the ERM process and associated activities across ASML and its affiliates. It takes a systematic approach to identify, manage and monitor risks in pursuit of our business objectives by setting standards and enabling management to make ASML's governance, risk management, internal control and compliance more efficient and effective. The framework also helps to identify opportunities that allow us to achieve our objectives and enable continuous sustainable growth.
ERM is a continuous process. Its related activities are periodically repeated to identify and address risks in a timely fashion, and its results remain relevant for decision-making purposes. Our Vice President of Risk and Business Assurance, reporting to ASML's CFO, is responsible for leading the development and maintenance of the ERM framework and makes sure the ERM process is carried out. ASML has adopted the ISO 31000:2018 standard as the foundation of its enterprise risk management. In addition, the Vice President of Risk and Business Assurance is responsible for leading the security, and internal control function and for the development and maintenance of the compliance process.
Risk management governance structure
Supervisory Board and Audit Committee
The Supervisory Board provides independent oversight on management’s response to identifying and mitigating critical risk areas based on regular risk reviews. The Supervisory Board’s Audit Committee provides independent oversight on the ERM process and the timely follow-up on priority actions based on quarterly progress updates.
Board of Management
The Board of Management is responsible for managing the internal and external risks related to our business activities and for making sure we comply with applicable laws and regulations. The Board of Management has delegated its risk oversight to ASML’s Corporate Risk Committee.
Corporate Risk Committee
The Corporate Risk Committee is a central risk oversight body that reviews, manages and controls risks in the ASML risk universe, including information security. It also approves the risk appetite, risk-management policies and risk-mitigation strategies. The Corporate Risk Committee is chaired by the CFO and comprises senior management representatives from all sectors at ASML, including the CEO and COO.
Disclosure Committee
The Disclosure Committee assists the Board of Management in overseeing ASML’s disclosure activities and compliance with applicable disclosure requirements arising under Dutch and US law and applicable stock exchange regulations, and other regulatory requirements.
ASML ANNUAL REPORT 2021 110
Internal Control Committee
The Internal Control Committee, which includes members of the Disclosure Committee, advises the Disclosure Committee and the CEO and CFO in their assessment of our internal control over financial reporting and disclosures, under section 404 of the Sarbanes-Oxley Act. The Chair of the Internal Control Committee updates the Audit Committee, the CEO and CFO on the progress of this assessment. The Chair also includes this update in the report to the Audit Committee.
Risk owners
Risk owners monitor the development of risks in the ASML risk universe and drive risk response across the ASML organization according to requirements that are defined by the Corporate Risk Committee.
ASML risk universe
The ASML risk universe is a consolidated overview of the risks that may have a material adverse effect in achieving our business objectives. It consists of 38 risk categories grouped into six risk types. This allows us to have a consistent approach across ASML when assessing risks.
We take into account a broad range of internal and external information sources such as macroeconomic and industry trends, relevant guidelines and legislation, and stakeholders’ needs and expectations in all areas. The risk universe is reviewed, updated and approved on a yearly basis, or more frequently in case of significant internal and/or relevant external developments.
Enterprise Risk Management process
Our ERM process provides a holistic approach combining both top-down (company-level) and bottom-up (organization- and process-level) perspectives. This helps us to ensure that risk identification, evaluation, and management are performed at the right level. Our ERM process is subject to continuous improvement. For example, in 2021 we started to implement key risk indicators.
The results of periodic risk assessments and the potential impact of external trends and emerging risks are captured in the ASML risk landscape. As we operate in a dynamic environment, risk exposures are subject to change. The ASML risk landscape is reviewed, updated and discussed by the Corporate Risk Committee each quarter. The execution of the risk assessments is done according to the risk management plan and any additional engagement approved by the Corporate Risk Committee. We define strategies to address relevant risks and take these into account when we define the corporate priorities. ASML defines risk responses with the aim to mitigate the risks up to the level defined by the risk appetite.
ASML ANNUAL REPORT 2021 111
Risk management process
Risk appetite
Our risk appetite depends on the nature of the risk. ASML’s risk appetite – the level of risk ASML is willing to accept to achieve its objectives – may vary based on the specific risk and is divided into five levels: Averse, Prudent, Moderate, High and Extensive. Our approach is geared toward mitigating the risks to the level defined in our risk appetite.
Risk developments
The table below presents examples of external developments that have affected the exposure of a series of risk categories in 2021, including examples of our responses. The list of risks and risk responses below is not exhaustive.
| | | | | |
| Challenges to meet demand | Risk category |
There is an increasing demand across all market segments and our product portfolio which is an opportunity for us that also brings challenges. Our systems are critical in this surge in demand. We notice a stretch to increase production capacity in our end-to-end supply chain to meet this demand. This is amplified by chip and material shortages.
In addition, stepping up in hiring and retaining the workforce in the current competitive market is increasingly challenging. The growth in our business could also lead to well-being issues, increasing use of workarounds and in some cases the risk of non-compliance with internal processes and/or controls. Our processes and systems may not be able to adequately support our growth and development.
The demand increase we have been and are continuing to experience could change customers' sourcing strategy to get less dependent on ASML. This can impact our market share in certain segments. | •Supplier strategy and performance •Supply chain disruption •Product industrialization •Human resource •Product and service quality •Competition •Industry cycle •Political •Legal liability •Process effectiveness and efficiency •Violations of laws and regulations |
| Risk response |
•Increase of manufacturing capabilities and utilization rate on short and long term •Cycle time reduction •Supplier support to increase move rate and mitigate chip- and material shortages •Improve compensation offering and enhance recruiting activities •Execute well-being program •Increase training programs and onboarding experience •Internal control framework and assessments |
ASML ANNUAL REPORT 2021 112
| | | | | |
| IP technology leadership pressure | Risk category |
There is increased pressure on know-how and IP protection for ASML and its open innovation partners. ASML’s existence is based on people and knowledge. Unauthorized disclosure of information of ASML, its customers or suppliers may benefit competitors, negatively affect ASML’s ability to file patents or affect cooperation with customers and suppliers.
We are experiencing cyberattacks on our information technology systems and our suppliers, customers and other service providers also experience such cyberattacks.
We are committed to protect our information assets and those of our partners.
We observe that risk exposure in 2021 remains high. | •Information security •Intellectual property rights •Competition
|
| Risk response |
•Information security function and information security policy to implement controls to ensure authorized use of information •Significant increase of our information security investments (people, systems) and security roadmap to increase security of our processes and systems •Cyber Defense Center •Security incident response procedure in place and tested at least annually •Awareness and training programs •IP rights management •Patents and relevant technical publications monitoring |
| | | | | |
| Geopolitical tensions | Risk category |
Export restrictions are rising, and global trade is shifting from globalization to regionalization, particularly between China and the US and countries that strive for technological sovereignty. This may lead to a decoupled ecosystem and - in the longer term – overcapacity. Trade and export barriers have impacted our ability to sell and maintain systems to certain customers and impact our business by limiting our ability to sell our products and services in certain jurisdictions or to certain customers.
Geopolitical tensions also result in movement restrictions of the employees across countries. Protectionism and bureaucracy are increasing, as well as restrictions impacting international knowledge workers from certain countries, (e.g. restricted technology access, visa/travel restrictions).
We aim to serve and support all our customers around the world to the best of our ability, while being compliant with laws and regulations set by the jurisdictions where we operate.
Risk exposure with regard to political tensions, protectionism and restriction remains high in 2021. | •Political •Continuity of own operations •Human resources •Business model •Industry cycle •Violations of laws and regulations
|
| Risk response |
•Monitor geopolitical developments •Apply for export licenses as required •Comply with (existing and new) regulations •Collaborate with peers in global advocacy |
| | | | | |
| COVID-19 pandemic | Risk category |
COVID-19 has spread globally, leading to quarantines, travel and workplace restrictions, business shutdowns and restrictions, supply chain interruptions, labor shortages, changes of legislation and overall economic and financial market instability.
The pandemic has an impact on the global economy. Going forward, there is still uncertainty on how the situation will develop, and what the impact on global GDP development, (end) markets, and our manufacturing capability and supply chain will be.
In 2021, the COVID-19 pandemic had limited impact on our operations – risk exposure is more controlled compared to 2020. | •Continuity of own operations •Supply chain disruption •Environment, Health and Safety •Human resources •Process effectiveness and efficiency •Roadmap execution •Information security |
| Risk response |
•Set health and safety of our employees as our first priority and implement preventive measures globally •Strong financial capabilities to react to a downturn •Activation of business continuity management plan •Active engagement with our critical suppliers and increased inventory •Implementation of virtual remote support solution on customer sites •Implementation of measures to facilitate (secure) remote working and to support the well-being of our employees |
ASML ANNUAL REPORT 2021 113
Risk factors
In conducting our business, we face many risks that may interfere with our business objectives. It is important to understand the nature of these risks. We assess our risks by using the ASML risk universe, consisting of six risk types (Strategy and Products, Finance and reporting, Partners, People, Operations, Legal and compliance). The risk factors below are classified under these six risk types. Any of these risks and events or circumstances described therein may have a material adverse effect on our business, financial condition, results of operations and reputation. These risks are not the only ones that we face. Some risks may not yet be known to us, and certain risks we do not currently believe to be material could become material in the future.
Strategy and products
Our future success depends on our ability to respond timely to commercial and technological developments in the semiconductor industry
Risk category: Business model, Innovation
Our success in developing new technologies and products, and in enhancing our existing products, depends on a variety of factors. These include the success of our and our suppliers’ R&D programs and the timely and successful completion of product development and design relative to competitors. Our business will suffer if the technologies we pursue to assist our customers in producing smaller and more energy-efficient chips are not as effective as those developed by competitors, or if our customers do not adopt technologies that we develop or adopt new technological architectures that are less focused on lithography products. The success of our EUV 0.55 NA (High-NA) technology, which we believe is critical for keeping pace with Moore’s Law, remains dependent on continuing technical advances by us and our suppliers. We invest considerable financial and other resources to develop and introduce new technologies, products and product enhancements. If we are unsuccessful in developing (or if our customers do not adopt) new technologies, products and product enhancements such as EUV 0.55 NA and multibeam inspection, or if competitors successfully introduce alternative technologies or processes, our competitive position and business may suffer.
In addition, we make significant investments into development of new products and product enhancements, and we may be unable to recoup some or all the investments that we have made. We may also incur costs related to inventory obsolescence, as a result of technological changes. Such costs may increase as the complexity of technology increases.
Due to the highly complex nature and costs of our systems, including newer technologies, our customers may purchase existing technology systems rather than new leading-edge systems, or may delay their investment in new technology systems to the extent that such investment is not economical or required given their product cycles. Global economic conditions affect our customers’ investment decisions, leading to uncertainties on the timing around the introduction of and demand for new leading-edge systems. Some of our customers have experienced and may continue to experience delays in implementing their product roadmaps. This increases the risk of slowing down the overall transition period (or cadence) for the introduction of new nodes, and therefore new systems.
We are also dependent on our suppliers to maintain their development roadmaps to enable us to introduce new technologies on a timely basis. If they are unable to keep pace, whether due to technological factors, lack of financial resources, or otherwise, this could prevent us from meeting our development roadmaps.
The success of new product introductions is uncertain and depends on our ability to successfully execute our R&D programs
Risk category: Roadmap execution, Innovation
Our lithography systems and applications have become increasingly complex, and accordingly, the costs and time period to develop new products and technologies have increased. We expect such costs and time periods to continue to increase. In particular, developing new technology, such as EUV 0.55 NA (High-NA) and multibeam, requires significant R&D investments from us and our suppliers to meet our and our customers’ technology demands. Our suppliers may not have, or may not be willing to invest the resources necessary to continue the (co-)development of the new technologies to the extent that such investments are necessary. This may result in ASML contributing funds to such R&D programs or limiting the R&D investments that we can undertake. Furthermore, if our R&D programs are not successful in developing the desired new technology on time or at all, we may be unsuccessful in introducing new products and unable to recoup our R&D investments.
We face intense competition
Risk category: Competition
The lithography equipment industry is highly competitive. Our competitiveness depends upon our ability to develop new and enhanced lithography equipment, related applications and services that are competitively priced and introduced on a timely basis, as well as our ability to protect and defend our intellectual property rights. We compete primarily with Canon and Nikon in respect of DUV systems. Both Canon and Nikon have substantial financial resources and broad patent portfolios. Each continues to offer
ASML ANNUAL REPORT 2021 114
products that compete directly with our DUV systems, which may impact our sales or business. In addition, adverse market conditions, industry overcapacity or a decrease in the value of the Japanese yen in relation to the euro, could further intensify price-based competition, resulting in lower prices, and lower sales and margins.
We may also face competition from new competitors with substantial financial resources, as well as from competitors driven by the ambition of self-sufficiency in the geopolitical context. Furthermore, we face competition from alternative technological solutions or semiconductor manufacturing processes, particularly if we are unsuccessful in developing new EUV technology, products and product enhancements in a timely and cost-competitive manner.
We also compete with providers of applications that support or enhance complex patterning solutions, such as Applied Materials Inc. and KLA-Tencor Corporation. These applications effectively compete with our Applications offering, which is a significant part of our business. The competition we face in our applications business may be higher than for our systems, as there are more competitors and potential competitors in this market.
The semiconductor industry can be cyclical and we may be adversely affected by any downturn
Risk category: Industry cycle risk
As a supplier to the global semiconductor industry, we are subject to the industry’s business cycles, of which the timing, duration and volatility are difficult to predict. The semiconductor industry has historically been cyclical. Newer entrants in the industry, including Chinese semiconductor manufacturers, could increase the risk of cyclicality in the future. Certain key end-market customers – Memory and Logic – exhibit different levels of cyclicality and different business cycles. Sales of our lithography systems, services and other holistic lithography products depend in large part upon the level of capital expenditures by semiconductor manufacturers. These in turn are influenced by industry cycles, the drive for technological sovereignty and a range of competitive and market factors, including semiconductor industry conditions and prospects. The timing and magnitude of capital expenditures of our customers also impact the available production capacity of the industry to produce chips, which can lead to imbalances in the supply and demand of chips. Reductions or delays in capital expenditures by our customers, or incorrect assumptions by us about our customers’ capital expenditures, could adversely impact our business. In addition, industry trends that are currently positively impacting our business such as increasing capital expenditures by our customers may not continue.
Our ability to maintain profitability in an industry downturn will depend substantially on whether we are able to lower our costs and break-even level, which is the level of sales that we must reach in a year to have positive net income. If sales decrease significantly as a result of an industry downturn and we are unable to adjust our costs over the same period, our net income may decline significantly, or we may suffer losses. Furthermore, as the value per system increases and we have grown, and continue to grow, in terms of employees, facilities and inventories, it may be more difficult for us to reduce our costs to respond to an industry downturn.
We derive most of our revenues from the sale of a relatively small number of products
Risk category: Business model, Product portfolio
We derive most of our revenues from the sale of a relatively small number of lithography systems (309 units in 2021 and 258 units in 2020). As a result, the timing of shipments, including any delays, and recognition of system sales for a particular reporting period from a small number of systems may have a material adverse effect on our business, financial condition and results of operations in that period. This risk is increasing due to the higher average sales price of EUV systems as compared to DUV systems.
In addition, we derive significant revenue from servicing and upgrading our installed base. However, we may not be able to increase revenues to the extent we planned as, for example, customers may perform more of these services themselves or find other third-party suppliers for that service.
Failure to adequately protect the intellectual property rights, trade secrets or other confidential information could harm our business
Risk category: Intellectual property rights
We rely on intellectual property rights such as patents and copyrights to protect our proprietary technology and applications. However, we face the risk that such measures could prove to be inadequate, and we could suffer material harm because, among other things:
•Intellectual property laws may not sufficiently support our proprietary rights or may change in the future in a manner adverse to us;
•Our confidentiality and licensing agreements with our customers, employees and technology development partners and others to protect our IP rights may not be sufficient or may be breached or terminated;
•Patent rights may not be granted or interpreted as we expect;
•Patents rights will expire which may result in key technology becoming widely available that may harm our competitive position;
•The steps we take to prevent misappropriation or infringement of our proprietary rights may not be successful;
•Intellectual property rights are difficult to enforce in countries where the application and enforcement of the laws governing such rights may not have reached the same level as compared to other jurisdictions where we operate; and
ASML ANNUAL REPORT 2021 115
•Third parties may be able to develop or obtain patents for similar competing technology.
In addition, legal proceedings may be necessary to enforce our intellectual property rights and the validity and scope may be challenged by others. Any such proceedings may result in substantial costs and diversion of management resources, and, if decided unfavorably to us, could result in significant costs or have a significant impact on our business.
We are subject to attempted misappropriation attacks, including theft of our trade secrets, proprietary customer data, intellectual property or other confidential information by third parties or our own employees. It is also possible that unauthorized third parties may obtain, copy, use or disclose our proprietary technologies, our products, designs, processes and other intellectual property despite our efforts to protect our intellectual property.
In 2021, we became aware of reports that a company associated with XTAL Inc., DongFang JingYuan Electron (“DFJY”) was actively marketing products in China that could potentially infringe on ASML's IP rights. Read more in: Our performance in 2021 - Governance - Responsible business - Intellectual Property protection.
Defending against intellectual property claims brought by others could harm our business
Risk category: Intellectual property rights
In the course of our business, we are subject to claims by third parties alleging that our products or processes infringe upon their intellectual property rights. If successful, such claims could limit or prohibit us from developing our technology, manufacturing and selling our products.
In addition, our customers or suppliers may be subject to claims of infringement from third parties, alleging that our products used by such customers in the manufacturing of semiconductor products and / or the processes relating to the use of our products infringe on one or more patents issued to such third parties. If such claims are successful, we could be required to indemnify our customers or suppliers for some or all of any losses incurred or damages assessed against them as a result of such infringement.
We also may incur substantial licensing or settlement costs to settle claims or to potentially strengthen or expand our intellectual property rights or limit our exposure to intellectual property claims of third parties.
Patent litigation is complex and may extend for a protracted period of time, giving rise to the potential for both substantial costs and diverting the attention of key management and technical personnel. Potential adverse outcomes from patent litigation may include payment of significant monetary damages, injunctive relief prohibiting our manufacturing, exporting or selling of products, and / or settlement involving significant costs to be paid by us.
We are exposed to economic and political developments in our international operations
Risk category: Political
Global trade issues and changes in and uncertainties with respect to multilateral and bilateral treaties and trade policies, and international trade disputes, trade sanctions, export controls, tariffs and similar regulations, impact our ability to deliver our systems and services internationally. In particular, our ability to deliver systems in certain countries such as China has been and continues to be impacted by our ability to obtain required licenses and approvals.
The US government has enacted trade measures, including import tariffs, national security regulations and restrictions on conducting business with certain Chinese entities, restricting our ability to provide certain products and services to such entities without a license. The list of Chinese entities impacted by trade restrictions, as well as the export regulation requirements and the implementation and enforcement of such regulations are subject to change. Our business involves the sale of systems and services to customers in a number of countries, including China, where our business has grown in recent years, and includes sensitive technologies that may be the subject of increased export regulations, policies or practices. These and further developments in multilateral and bilateral treaties, national regulation, and trade, national security and investment policies and practices have affected and may further affect our business, and the businesses of our suppliers and customers. Such developments have impacted and continue to impact our ability to obtain necessary licenses, including permits for use of US technology and for employees producing and developing such technology. Such developments including the drive for technological sovereignty could also lead to long-term changes in global trade, competition and technology supply chains, which could adversely affect our business and growth prospects.
Certain of our manufacturing facilities as well as customers are located in Taiwan. Customers in Taiwan represented 39.4% of our 2021 total net sales and 33.8% of our 2020 total net sales. Taiwan has a unique international political status. The People’s Republic of China asserts sovereignty over Taiwan and does not recognize the legitimacy of the Taiwanese government. Changes in relations between Taiwan and the People’s Republic of China, Taiwanese government policies, and other factors affecting Taiwan’s political, economic or social environment could have a material adverse effect on our business, financial condition and results of operations. Furthermore, certain of our facilities as well as customers are located in South Korea. Customers in South Korea represented 33.4% of our 2021 total net sales and 29.7% of our 2020 total net sales. There are tensions with the Democratic People’s Republic of Korea (North Korea), which have existed since the division of the Korean Peninsula following World War II. A worsening of relations between those countries or the outbreak of war on the Korean Peninsula could have a material adverse effect on our business, financial condition or results of operations.
ASML ANNUAL REPORT 2021 116
We may be unable to make desirable acquisitions or to integrate successfully any businesses we acquire
Risk category: Mergers & acquisitions
From time to time we may acquire, businesses or technologies to complement, enhance or expand our current business or products or that might otherwise offer us growth opportunities. Any such acquisitions could lead to failure to achieve our financial or strategic objectives, to perform as we plan or disrupt our ongoing business and adversely impact our results of operations. Furthermore, our ability to complete such transactions may be hindered by a number of factors, including potential difficulties in obtaining government approvals.
Any acquisition that we make could pose risks related to the integration of the new business or technology with our business and organization. We cannot be certain that we will be able to achieve the benefits we expect from a particular acquisition investment. Such transactions may also strain our managerial and operational resources, as the challenge of managing new operations may divert our management from day-to-day operations. Furthermore, we may be unable to retain key personnel of acquired businesses or may have difficulty integrating employees, business systems, and technology. The controls, processes and procedures of acquired businesses may also not adequately ensure compliance with laws and regulations, and we may fail to identify compliance issues or liabilities.
In connection with acquisitions, anti-trust and national security regulators have in the past and may in the future impose conditions on us, including requirements to divest assets or other conditions that could make it difficult for us to integrate the businesses that we acquire. Furthermore, we may have difficulty in obtaining or be unable to obtain anti-trust and national-security clearances, which could inhibit future desired acquisitions.
As a result of acquisitions, we have recorded, and may continue to record, a significant amount of goodwill and other intangible assets. Current accounting guidelines require, at least annually and potentially more frequently, assessment of whether there are indicators that the value of goodwill or other intangible assets has been impaired.
We may not be able to achieve our Environmental, Social, Governance (ESG) objectives or adapt and respond timely to emerging ESG expectations and regulations
Risk Category: Climate change, Product stewardship
Companies across all industries are facing increasing scrutiny relating to their ESG policies. Investors and other stakeholders are increasingly focused on ESG practices and, in recent years, have placed increasing importance on the implications and social cost of their investments. In particular, within the semiconductor industry, there is focus on contribution to society and minimizing environmental and social impacts of products throughout all life cycle stages. Failure to achieve our ESG objectives, meet the emerging ESG expectations of our stakeholders and/or timely respond to enhanced regulations could negatively affect our brand and reputation.
Climate change contributes to increasing severity and frequency of extreme weather events, rising sea levels and droughts that can impact continuity of our operations and/or our supply chain. Climate change concerns and the potential resulting environmental impact may result in new laws and regulations that may affect us, our suppliers, and our customers. Such laws or regulations could cause us to incur additional direct costs for compliance, as well as increased indirect costs resulting from our customers and suppliers. Furthermore, the ability to reduce our product-related environmental performance (such as energy efficiency) may be affected by the complexity of our technology and products. We are also dependent on our suppliers and their ability to reduce the ecological footprint.
A global transition to a lower carbon economy has resulted in the imposition of increased regulations that could lead to technology restrictions, modification of product designs, an increase in energy prices and energy or carbon taxes, restrictions on pollution, required remediation equipment, or other requirements. A variety of regulatory developments have been introduced that focus on restricting or managing the emission of carbon dioxide and other greenhouse gases. This could result in a need to redesign products and/or purchase at higher costs new equipment or materials with lower carbon footprints.
Finance and reporting
We are exposed to treasury risks, including liquidity risk, interest rate risk, credit risk and foreign exchange risk
Risk category: Liquidity, Interest rate, Counterparty credit, Foreign exchange
We are a global company and are exposed to a variety of financial risks, including liquidity risk, interest rate risk, credit risk foreign exchange risk, inflation risk.
Liquidity risk: We are exposed to liquidity risks. Negative developments in our business or global capital markets could affect our ability to meet our financial obligations or to raise or re‐finance debt in the capital or loan markets. In addition, we might be unable to repatriate cash from a country immediately for use elsewhere due to legal restrictions or required formalities.
Interest rate risk: We are exposed to interest rate risks. Our Eurobonds bear interest at fixed rates. Our cash and investments as well as our revolving credit facility bear interest at a floating rate. Failure to effectively hedge this risk could impact our financial
ASML ANNUAL REPORT 2021 117
condition and results of operation. In addition, we could experience an increase in borrowing costs due to a ratings downgrade (or expectation of a downgrade), developments in capital and lending markets or developments in our businesses.
Counterparty credit risk: We are exposed to counterparty credit risks, in particular with respect to financial counterparties with whom we hold our cash and investments as well as our customers. As a result of our limited number of customers, credit risk on our receivables is concentrated. Our three largest customers (based on total net sales) accounted for €3,855.2 million, or 83.7%, of accounts receivable and finance receivables at December 31, 2021, compared with €2,757.0 million, or 80.1%, at December 31, 2020. Accordingly, business failure or insolvency of one of our main customers could result in significant credit losses.
Currency risk: We are exposed to currency risks. Our Financial Statements are expressed in euros. Accordingly, our results of operations are exposed to fluctuations in exchange rates between the euro and other currencies. Changes in currency exchange rates can result in losses in our Financial Statements. We are particularly exposed to fluctuations in the exchange rates between the US dollar and the euro, and to a lesser extent to the Japanese yen, the South Korean won, the Taiwanese dollar and Chinese yuan, in relation to the euro. We incur costs of sales predominantly in euros with portions also denominated in US and Taiwanese dollars. A small portion of our operating results are driven by movements in currencies other than the euro, US dollar, Japanese yen, South Korean won, Taiwanese dollar or Chinese yuan.
In general, our customers run their businesses in US dollars and therefore a weakening of the US dollar against the euro might impact the ability or desire of our customers to purchase our products at quoted prices.
Inflation risk: We are exposed to inflation for costs of goods, transport and wages as a result of supply shortages which may impact our profitability. Currently supply chain constraints has resulted in higher-than-normal inflation.
Partners
Our success is highly dependent on the performance of a limited number of critical suppliers of single-source key components
Risk category: Supply chain disruption, Supplier strategy and performance
We rely on outside vendors for components and subassemblies used in our systems, including the design thereof. These components and subassemblies are obtained from a single supplier or a limited number of suppliers. As our business has grown, our dependence on single suppliers or a limited number of suppliers has grown, as the highly specialized nature of many of our components, particularly for EUV systems, means it is not economical to source from more than one supplier. Our sourcing strategy therefore (in many cases) prescribes 'single sourcing, dual competence'. Our reliance on a limited group of suppliers involves several risks, including a potential inability to obtain an adequate supply of required components or subassemblies, in a timely manner or at all, additional costs resulting from switching to alternate suppliers and reduced control over pricing and quality. Delays in supply of these components and subassemblies, which could occur for a variety of reasons, such as disruptions experienced by our suppliers, including work stoppages, fire, energy shortages, pandemic outbreaks, flooding, cyberattacks, sabotage or other disasters, natural and otherwise can lead to delays in delivery of our products which would impact our business. For example, certain of our suppliers experienced disruptions in their operations as a result of chip and material shortages. A prolonged inability to obtain adequate deliveries of components or subassemblies, or any other circumstance that requires us to seek alternative sources of supply, could significantly hinder our ability to deliver our products in a timely manner, which could damage relationships with our customers and materially impact our business.
The number of lithography systems we are able to produce may be limited by the production capacity of one of our key suppliers, Carl Zeiss SMT GmbH, which is our sole supplier of lenses, mirrors, illuminators, collectors and other critical optical components (which we refer to as optics). We have an exclusive arrangement (see related parties’ paragraph in our annual report) with Carl Zeiss SMT GmbH and if they are unable to maintain and increase production levels, we could be unable to fulfill orders, which could have a material impact on our business and damage relationships with our customers. If Carl Zeiss SMT GmbH were to terminate its supply relationship with us or if Carl Zeiss SMT GmbH is unable to maintain production of optics over a prolonged period, we would effectively cease to be able to conduct our business.
From time to time, we experience supply constraints which can impact our production, particularly during periods of increasing demand as we have experienced in 2021 and which we continue to experience. In 2021, we experienced some delays and shortages in our supply chain, resulting in a late start on the assembly of a number of systems. Also, in 2021, due to high demand, we have been reducing cycle time in our factory to ship more systems. One way to reduce cycle time is through a fast shipment process that skips some of the testing in our factory. Final testing and formal acceptance then takes place at the customer site. This leads to a deferral of revenue recognition for those shipments until formal customer acceptance, but does provide our customers with earlier access to wafer output capacity. We and our suppliers are investing in additional capacity to meet this demand however to increase capacity takes time and we may be unable to meet the full demand of our customers for a few years. Further, we face the risk that demand may not continue to increase which could result in overcapacity and loss of investment in increasing capacity.
In addition, some of our key suppliers, including Carl Zeiss SMT GmbH, have a limited number of manufacturing facilities, the disruption of which may significantly and adversely affect our production capacity.
ASML ANNUAL REPORT 2021 118
Lead times in obtaining components have increased as our products have become more complex, and a failure by us to adequately predict demand for our systems or any delays in the shipment of components can result in insufficient supply of components, which can lead to delays in delivery of our systems and can limit our capabilities to react quickly to changing market conditions. Conversely, a failure to predict demand could lead to excess and obsolete inventory.
We are also dependent on suppliers to develop new models and products and to meet our development roadmaps. To the extent our suppliers do not meet our requirements or timetable in product development, our business could suffer.
A high percentage of net sales is derived from a few customers
Risk category: Customer dependency
Historically, we have sold a substantial number of lithography systems to a limited number of customers. Customer concentration can increase because of continuing consolidation in the semiconductor manufacturing industry. In addition, although the applications part of our holistic lithography solutions constitutes an increasing portion of our revenue, a significant portion of those customers are the same customers as those of our systems. Consequently, while the identity of our largest customers may vary from year to year, sales may remain concentrated among relatively few customers in any particular year. The recognized total net sales to our largest customer from each year accounted for €6,881.1 million, or 37.0% of total net sales in 2021, compared with €4,394.8 million, or 31.4% of total net sales in 2020. In 2021, 66.3% of total net sales were made to two customers. The loss of any significant customer or any significant reduction or delay in orders by a significant customer may have a material adverse effect on our business, financial condition and results of operations.
People
Our business and future success depend on our ability to manage the growth of our organization and attract and retain a sufficient number of adequately educated and skilled employees
Risk category: Human resources, Knowledge management, Organizational effectiveness
Our business and future success significantly depends upon our employees, including a large number of highly qualified professionals, as well as our ability to attract and retain employees. Competition for such personnel is intense and has intensified in the last year. Despite our ability to grow our employee base significantly, attracting sufficient numbers of qualified employees to meet our growing needs will remain a challenge. This risk of not being able to attract and retain qualified personnel increases as our business grows.
Our R&D programs require a significant number of qualified employees. If we are unable to attract sufficient numbers of qualified employees, this could affect our ability to conduct our R&D on a timely basis. Also, the loss of key employees for unexpected reasons like illness a risk.
Moreover, as a result of the uniqueness and complexity of our technology, qualified engineers capable of working on our systems are scarce and generally not available (e.g. from other industries or companies). As a result, we must educate and train our employees to work on our systems. Retention of those key employees is a critical success factor for us as a company.
Furthermore, the increasing complexity of our products results in a longer learning curve for new and existing employees and suppliers leading to an inability to decrease cycle times and may result in the occurrence of significant additional costs. Our suppliers face similar risks in attracting qualified employees, including attracting employees in connection with programs that will support our R&D programs and technology developments. To the extent that our suppliers are unable to attract qualified employees, this could impact our R&D programs or deliveries of components to us.
In recent years, our organization has grown significantly. As a result of this growth in a short period of time, we may be unable to effectively manage, monitor and control our employees, facilities, operations and other resources. Consistent pressure on our organization and people as a result of our growth may lead to wellbeing issues of our employees.
Operations
We may face challenges in managing the industrialization of our products and bringing them to high-volume production
Risk category: Product industrialization
Bringing our products to high-volume production at a value-based price and in a cost-effective manner, depends on our ability to manage the industrialization of our products and our ability to manage costs. Customer acceptance of our products depends on performance of our products in the field. As our products become more complex, we face an increasing risk that products that we develop may not meet development milestones or specifications and that our products may not perform according to specifications, including quality standards. If our products do not perform according to specifications and performance criteria or if quality or performance issues arise, this may result in additional costs, reduced demand for our products, and our customers being unable to meet planned wafer capacity.
ASML ANNUAL REPORT 2021 119
Transitioning our newly developed products to full-scale production requires the expansion of our infrastructure, including enhancing our manufacturing capabilities, increasing supply of components and training qualified personnel, and may also require our suppliers to expand their infrastructure capabilities. If we or our suppliers are unable to expand infrastructure as necessary, we may be unable to introduce new technologies, products or product enhancements or reach high-volume production of newly developed products on a timely basis or at all.
In addition, when we are successful in industrializing new products, it can take years to reach profitable margins, as was the case for EUV.
New technologies might not have the same margins as existing technologies and we might not be able to adjust value-based pricing and or cost in an effective manner. In addition, the introduction of new technologies, products or product enhancements also impacts ASML’s liquidity, as new products may have higher cycle times to produce resulting in increased working capital needs. This impact on liquidity increases as our products become more complex and expensive.
The capability, capacity and costs associated with providing the required customer support function to cover the increasing number of shipments and servicing a growing number of EUV systems that are operational in the field could affect the timing of shipments, and the efficient execution of maintenance, servicing and upgrades, which is key to the systems continuing to achieve the required productivity.
We are dependent on the continued operation of a limited number of manufacturing facilities
Risk category: Continuity of own operation
All of our manufacturing activities, including subassembly, final assembly and system testing, take place in cleanroom facilities in Veldhoven, the Netherlands, in Berlin, Germany, in Wilton, Connecticut, US and in San Diego and San Jose, California, US, in Pyeongtaek, South Korea, in Beijing, China, and in Linkou and Tainan, Taiwan. These facilities may be subject to disruption for a variety of reasons, including work stoppages, fire, energy shortages, pandemic outbreaks, flooding, cyberattacks, sabotage or other disasters, natural and otherwise. We cannot ensure that alternative production capacity would be available if a major disruption were to occur.
As our organization grows, we are not able to fully insure our risk exposure. In addition, not all disasters are insurable. As we are unable to duly insure against potential losses, we are subject to the financial impact of uninsured losses, which can have an adverse impact on our financial condition and results of operation.
The nature of our operations exposes us to health, safety, and environment risks
Risk category: Environment, health and safety
Hazardous substances are used in the production and operation of our products and systems, which subjects us to a variety of governmental regulations relating to environmental protection, and employee and product health and safety, including the transport, use, storage, discharge, handling, emission, generation, and disposal of toxic or other hazardous substances. In addition, operating our systems (which use lasers and other potentially hazardous systems) can be dangerous and can result in injury. The failure to comply with current or future regulations could result in substantial fines being imposed on us, suspension of production, alteration of our manufacturing and assembly and test processes, damage to our reputation, and/or restrictions on our operations or sale or other adverse consequences. Additionally, our products have become increasingly complex. The increasing complexity requires us to invest in continued risk assessments and development of appropriate preventative and protective measures for health and safety for both our employees (in connection with the production and installation of our systems and field options and performance of our services) and our customers’ employees (in connection with the operation of our systems). Our health and safety practices may not be effective in mitigating all health and safety risks. Failing to comply with applicable regulations or the failure of our implemented practices for customer and employee health and safety could subject us to significant liabilities.
Cybersecurity and other security incidents, or other disruptions in our processes or information technology systems, could materially adversely affect our business operations
Risk category: Information security, Information technology, Process effectiveness and efficiency, Safeguarding of assets
We rely on the accuracy, availability and security of our information technology systems. Despite the measures that we have implemented, including those related to cybersecurity, our systems could be breached or damaged by computer viruses and systems attacks, natural or man-made incidents, disasters or unauthorized physical or electronic access.
We are experiencing an increasing number of cyberattacks on our information technology systems as well as the information technology systems of our suppliers, customers and other service providers, whose systems we do not control. These attacks include malicious software (malware), attempts to gain unauthorized access to data, and other electronic security breaches of our information technology systems. They also include the information technology systems of our suppliers, customers and other service providers that have led and could lead, for us, our customers, suppliers or other business partners - including R&D partners - to disruptions in critical systems, unauthorized release, misappropriation, corruption or loss of data or confidential information (including confidential information relating to our customers, employees and suppliers). Further, we depend on our employees and the employees of our suppliers to appropriately handle confidential and sensitive data and deploy our IT resources in a safe and
ASML ANNUAL REPORT 2021 120
secure manner that does not expose our network systems to security breaches or the loss of data. However, there is always a risk that inadvertent disclosure or actions or internal malfeasance by our employees or those of our suppliers could result in a loss of data or a breach or interruption of our IT systems.
In addition, any system failure, accident or security breach could result in business disruption, theft of our intellectual property, trade secrets (including our proprietary technology), unauthorized access to, or disclosure of, customer, personnel, supplier or other confidential information, corruption of our data or of our systems, reputational damage or litigation. Furthermore, computer viruses or other malware may harm our systems and software and could be inadvertently transmitted to our customers' systems and operations, which could result in loss of customers, litigation, government investigation and proceedings that could expose us to civil or criminal liabilities and significant management attention and resources to remedy the damages that result. We may also be required to incur significant costs to protect against or repair the damage caused by these disruptions or security breaches in the future, including, for example, rebuilding internal systems, implementing additional threat protection measures, providing modifications to our products and services, defending against litigation, responding to regulatory inquiries or actions, paying damages, or taking other remedial steps with respect to third parties. Further, remediation efforts may not be successful and could result in interruptions, delays or cessation of service, unfavorable publicity, damage to our reputation, customer allegations of breach-of-contract, possible litigation, and loss of existing or potential customers that may impede our sales or other critical functions.
Cybersecurity threats are constantly evolving. We remain potentially vulnerable to additional known or yet unknown threats, as in some instances, we, our customers, and our suppliers may be unaware of an incident or its magnitude and effects. We also face the risk that we expose our customers to cybersecurity attacks through the systems we deliver to our customers, including in the form of malware or other types of attacks as described above, which could harm our customers. Furthermore, the COVID-19 pandemic has increased the level of remote working within our organization, which increases the risks of cybersecurity incidents.
ASML visibility and importance for the semiconductor industry keeps on growing. There is a risk that this may lead to actions that may adversely impact the security of ASML or the safety of its employees.
In addition, processes and systems may not be able to adequately support the growth. From time to time, we implement updates to our information technology systems and software, which can disrupt or shutdown our information technology systems. We may not be able to successfully launch and integrate these new systems as planned without disruption to our operations. For example, we are currently implementing a new ERP system and infrastructure (ONE program). As a result of this system implementation or otherwise, we have and could continue to experience disruptions in our operations. In 2021, we experienced delays of operations after the launch of a new logistics center, which resulted in a delay in production of some products.
Legal and compliance
We are subject to increasingly complex regulatory and compliance obligations
Risk category: Violation of laws and regulations
In recent years, our business has grown significantly in terms of sales, operations, employees and our business infrastructure. As a result, the complexity of complying with rules and regulations has increased. Furthermore, as we have expanded our business in countries where we did not previously operate, we have become increasingly subject to compliance with additional rules and regulations in such jurisdictions, including but not limited to anti-corruption, anti-bribery and anti-trust standards, which can be complex. We are also subject to investigations, audits and reviews by authorities in such jurisdictions regarding compliance with rules and regulations, including tax laws.
Furthermore, the existing rules and regulations that we are subject to, including regulations relating but not limited to trade, national security, tax, exchange controls, reporting, product compliance, anti-corruption laws, anti-trust, data protection, are becoming more complex and the trade and national security environment has resulted in increasing restrictions. We also face the risk that trade, and security regulations could limit our ability to sell our products and services in certain jurisdictions. We have experienced delays in shipments permits and may experience restrictions on shipping products to certain customers.
Such changes in the regulation that applies to our business can increase compliance costs and the risk of non-compliance. Non-compliance can result in fines and penalties as well as reputational damages. Furthermore, additional regulations could impact or limit our ability to sell our products and services in certain jurisdictions.
Changes in taxation could affect our future profitability
Risk category: Violation of laws and regulations
We are subject to income taxes in the Netherlands and the other countries in which we are active. Our effective tax rate has fluctuated in the past and may fluctuate in the future.
Changes in our business environment can affect our effective tax rate. The same applies for changes in tax legislation in the countries where we operate, developments as driven by global organizations as the OECD, as well as the change in approach to tax-by-tax authorities. All these initiatives have already resulted in and may result in further increased compliance obligations for ASML. Additionally, this may result in increase of our effective tax rate in future years.
ASML ANNUAL REPORT 2021 121
Changes in tax legislation of jurisdictions we operate in, may adversely impact our tax position and consequently our net income. Our worldwide effective tax rate is heavily impacted by R&D incentives included in tax laws and regulations in the countries we operate in. Examples in this regard are the so-called innovation box tax legislation in the Netherlands and the Foreign Derived Intangible Income deduction / R&D credits we obtain in the US. In case jurisdictions alter their tax policies in this respect, this may have an adverse effect on our worldwide effective tax rate. In addition, jurisdictions levy corporate income tax at different rates. The mix of our sales over the various jurisdictions in which we operate may vary from year to year, resulting in a different mix of corporate income tax rates applicable to our profits, which can affect our worldwide effective tax rate and adversely impact our net income.
Other risk factors
The COVID-19 or other pandemics may impact our operations
The COVID-19 pandemic and the measures implemented to address this pandemic globally continue to impact our business and our suppliers and customers. The pandemic has already had a significant impact on the global economy, which can potentially impact our end markets.
The COVID-19 pandemic has increased the level of remote working within our organization, which impacts productivity, may delay our roadmap, increase the risks of cybersecurity incidents and may impact our control environment. In addition, we are dependent on our suppliers, so disruptions to their operations as a result of the COVID-19 pandemic impact us and our ability to produce, deliver and service tools. Market demand for semiconductors and therefore our products and services can also be impacted by the COVID-19 pandemic and measures taken to address it. Also, an important part of our business involves installing and servicing tools at customer premises around the globe, and travel restrictions and vaccination requirements impact that activity.
There is uncertainty about how the COVID-19 pandemic will impact global GDP development, end markets, our manufacturing capability and supply chain, and the longer this pandemic lasts the greater are the risks. The continuing impact of this pandemic on ASML will depend on future developments, including continued severity of the COVID-19 pandemic, and the actions from the Dutch and other foreign governments to contain the outbreak or address its impact which are outside of our control.
Restrictions on shareholder rights may dilute voting power
Our Articles of Association provide that we are subject to the provisions of Dutch law applicable to large corporations, called 'structuurregime'. These provisions have the effect of concentrating control over certain corporate decisions and transactions in the hands of our Supervisory Board. As a result, holders of ordinary shares may have more difficulty in protecting their interests in the face of actions by members of our Supervisory Board than if we were incorporated in the US or another jurisdiction.
Our authorized share capital also includes a class of cumulative preference shares and we have granted Stichting Preferente Aandelen ASML, a Dutch foundation, an option to acquire, at their nominal value of €0.09 per share, such cumulative preference shares. Exercise of the Preference Share Option would effectively dilute the voting power of our outstanding ordinary shares by one-half, which may discourage or significantly impede a third party from acquiring a majority of our voting shares.
Read more in: Our performance in 2021 - Governance - Corporate governance - Board of Management and Supervisory Board, and Consolidated Financial Statements - Notes to the Consolidated Financial Statements - Note 22 Shareholders’ equity.
We may not declare cash dividends and conduct share buyback programs at all or in any particular amounts in any given year
We aim to pay a semi-annual dividend that is growing (on an annualized basis) over time, and we conduct share buyback programs from time to time. The dividend proposal and amount of share buybacks in any given year will be subject to the availability of distributable profits, retained earnings and cash, and may be affected by, among other factors, the Board of Management’s views on our potential future liquidity requirements, including for investments in production capacity and working capital requirements, the funding of our R&D programs and for acquisition opportunities that may arise from time to time, and by future changes in applicable income tax and corporate laws. We may also suspend buyback programs from time to time, which would reduce the amount of cash we are able to return to shareholders. Accordingly, the Board of Management may decide to propose not to pay a dividend or pay a lower dividend and may suspend, adjust the amount of or discontinue share buyback programs or we may otherwise fail to complete buyback programs.
ASML ANNUAL REPORT 2021 122
Responsible business
We are a global leader in the semiconductor industry. As the innovator that makes vital systems for the chip industry, we have a responsibility to lead by example. Our purpose is clear, "to unlock the potential of people and society by pushing technology to new limits", and we want our values to reflect in everything we do to pursue our purpose.
Besides the material focus areas in our strategy, we need to make sure that we conduct our business in a responsible manner. Anywhere we operate, we believe that conducting our business with honesty and acting with the highest standards of integrity is essential to our value creation for our stakeholder groups, and the long-term success of our company.
We have corporate policies and procedures in place detailing our principles and compliance, guiding us in making the right decisions and living up to our values. In the next sections, more information can be found on topics such as our business ethics and Code of Conduct, compliance, our responsibility to respect human rights, protection of information, and tax.
Business ethics and Code of Conduct
We are committed to conducting our business in compliance with applicable laws and regulations in all the countries we operate in. We promote and uphold ethical behavior, fostering a culture where speaking up is encouraged and appreciated.
We seek to continuously improve and professionalize our Ethics and Compliance organization to the highest standards. In 2021, we continued to grow our network of Ethics Liaisons, updated our Speak Up & Non-Retaliation Policy in line with the new requirements of the EU Whistleblower Directive, and launched our refreshed Gifts & Entertainment Policy as well as our internal Competition Law Compliance Policy. We continued our training programs and focused on raising awareness across our entire organization. Our next Global Ethics Survey will take place in 2022.
Our values – challenge, collaborate and care – guide us in our everyday dealings with colleagues, customers, suppliers, shareholders and the communities we serve. These values are reflected in our Code of Conduct (hereafter: Code). It sets clear expectations and guiding principles for the way we conduct our business and serves to foster a culture of integrity, ethics and respect. Together with a set of practical guidelines, it puts integrity at the center of what we do.
ASML relies heavily on the skills, commitment and behavior of its employees for its continued success, and for its positive contribution to society. That’s why we expect all employees to fully live up to the company’s values and to act with integrity and respect at all times. We ask all our employees and our business partners to abide by our Code.
For a decade, we have been a member of the Responsible Business Alliance (RBA), the world’s largest industry coalition dedicated to corporate social responsibility in global electronics industry. As a member of the RBA, we have adopted the RBA Code of Conduct, which is a common set of social, environmental and ethical industry standards. Our Code is in line with the RBA Code of Conduct. To reinforce our commitment to the supplier network, we expect our key suppliers (representing around 80% of our total spend) and their suppliers to comply with the RBA Code of Conduct and to develop their own strategies, policies and processes to follow it. This requirement is included in our long-term product-related suppliers’ contracts. Read more in: Our performance in 2021 - Social - Our supply chain.
Our ethics governance consists of several levels, which include:
1.Our Ethics Board, chaired by our CEO, is reporting to the Audit Committee and Board of Management. The Ethics Board is responsible for policy-making and the supervision of ASML’s compliance with legal and ethical requirements. The Ethics Board meets regularly to give guidance on relevant issues.
2.Our Ethics Committee investigates significant notifications about potential breaches of ASML's Code of Conduct worldwide.
3.Our Ethics Office is responsible for overseeing and implementing our Ethics program. All reports of a possible breach of ASML's Code of Conduct are screened by one of the Ethics Officers and all significant reports are discussed with the Ethics Committee.
4.Our ethics organization includes employees who, in addition to their regular roles at ASML, act as Ethics Liaisons in all the countries we operate in. They serve as trusted representatives, and act as the first local point of contact for employees with questions and concerns related to ethics.
ASML ANNUAL REPORT 2021 123
Our Code of Conduct principles
| | | | | |
| Our commitment |
| We respect people | ASML is committed to maintaining a safe and healthy working environment, respecting human rights in line with international laws and regulations and industry standards such as the RBA Code of Conduct. Diversity of cultures, education and talent makes us a stronger, more creative and innovative company. By working together and using these values to guide us, we create an environment based on mutual respect – one that leads to better results than any of us can achieve alone. |
| We operate with integrity | A strong culture of integrity and compliance underpins ASML’s business success. We define ‘integrity’ as acting with honesty, sincerity, care and reliability. Compliance not only means complying with laws and regulations, but also with our high ethical standards. Our reputation for integrity is a valuable asset. It is essential for us to demonstrate personal and business integrity at all times. |
| We commit to safety and social responsibility | Technology reaches all parts of society. By helping to make chips more affordable and more powerful, ASML has an important role to play – not only by reputation and results but also in relation to the environment too. This is why ASML is committed to conducting business responsibly, enabling sustainable growth while fulfilling legal and moral obligations. We aim to achieve our business objectives in a caring and responsible manner as outlined in the key principles. |
| We protect our assets | ASML’s most valuable assets are its people and knowledge, both of which are highly valued and protected. Our ‘assets’ include intellectual property (IP), which refers to intangible assets such as technical know-how, products data, business data, and personal data, as well as physical assets such as products, tooling, funds and computers for conducting ASML business. Our company expects anyone entrusted with ASML assets to keep them safe from loss, damage, misuse or theft. |
| We encourage you to communicate and Speak Up | To fulfill our commitment to upholding the high standards of integrity described in this Code, communication is key. We strive for a working environment that encourages open dialogue among employees, as well as between employees and third parties, where employees feel comfortable and respected, and that they can trust each other to do the right thing. If you observe or suspect a violation, we encourage you to speak up. |
Our Code is available for all our stakeholders on our website (www.asml.com), our intranet and in our Employee app.
Promoting ethical behavior
We provide a dedicated Ethics and Compliance Program, which offers the necessary support, advice, training and communication to enable employees and others to understand and follow our Code. It does this by building awareness through various communication channels to foster a culture of high integrity. It also helps create an open and honest culture that fosters compliance with the law and ASML policies across the organization.
In 2021, we continued to extend our ethics training curriculum, by introducing two new modules – ‘We respect people’ and ‘Gifts and entertainment’ – along with the launch of updated policies. We aim to have all six modules ready for all employees over the course of the coming year.
In addition to generic modules, available to all employees, the curriculum will include manager specific modules – to be completed by 2022. The curriculum aims to support management in decision-making and promoting our Code and other compliance-related topics, and to raise awareness around the importance of ethical behavior and our Speak Up & Non-Retaliation Policy. It also provides information and guidance on dealing with topics such as personal relationships at work, conflicts of interest, navigating cultural differences, and ethical aspects around ancillary activities or other positions outside of ASML. In our training program we particularly focused on all new employees; within the first three months of starting at ASML they receive an invitation to complete the first module of the curriculum.
In 2021, we changed our approach from having a dedicated Ethics Awareness Week to participating in a series of various interactive topic discussions throughout the year. We had two ‘Our values in action’ sessions, during which leaders of a number of our Corporate Functions explained how ASML’s values – challenge, collaborate and care – connect to the work they're doing, and employees around the company shared how they have actually experienced the values in action.
Encouraging people to speak up
A key insight gained from the last Global Ethics Survey was that employees occasionally may feel reluctant to report harmful, discriminatory or unethical behavior, due to fear for the consequences of doing so. In 2021, we therefore updated our Speak-up & Non-retaliation policy, which was launched at the end of October 2021, and we implemented amendments to address the requirements of the EU Whistleblower Directive. In this process, our focus was on integrating the concept of non-retaliation at the core of the policy. We strongly believe that employees should feel safe to express their concerns with the company without apprehension due to the fear of retaliation. These policies and procedures reassure employees that they can report a breach without fear of repercussions. ASML has zero tolerance for retaliation.
The policy includes, among others, our Ethics Investigation procedure, which outlines the investigation phases of an ethics complaints, from intake to remedy action and final closure.
For more information on speaking up, non-retaliation, our ethics investigation procedure, anonymity and privacy, please see our Speak Up & Non-Retaliation Policy publicly available on www.asml.com.
We encourage everyone, including external business partners, such as suppliers, contractors and other workers, to express any concerns they might have regarding possible violations of our Code, our company’s policies, the law and our values. We promote an open culture of trust and honest communication where violations of the Code are not tolerated. We have several different
ASML ANNUAL REPORT 2021 124
channels within the Speak-Up service to report such concerns including an online reporting tool(hosted by an independent, external service company), phone numbers for each country in which we operate, a dedicated email address, and via our Ethics Liaisons. For employees or external stakeholders who prefer to remain anonymous, the Speak-Up service is available to report breaches anonymously. The role of the Ethics Office is to assess each Speak-Up report and take appropriate action to address the report so that any appropriate remediation actions can be taken by the appropriate body.
We review and assess all Speak-Up messages and follow up on all of them by providing feedback to the reporting party if possible. If necessary, we engage with the reporting party and/or counterpart to understand the nature of the Speak-Up message, and to conduct more detailed analysis and/or investigation. When required, we implement remedy actions to prevent recurrence.
We registered 396 ethics related reports in 2021 (229 in 2020). We view this increase as a sign that our employees and external business partners feel comfortable and protected to report their concern. We attribute this result to the improvements implemented, but we also noted high number of reports related to COVID-19, such as travel restrictions, vaccination, quarantine and country specific measurements. The vast majority of the number of reports relates to questions, rather than concerns of potential misconduct. Another area of increase relates to conflict of interest questions.
Among these Speak-Up reports, ten complaints were filed. These follow a formal investigation procedure. At the time of publication of this annual report, the investigation procedure of five complaints were completed. From this total, four complaints were deemed unsubstantiated – no violation with the Code – and for one complaint disciplinary measure – termination of employment – was taken. The remaining five complaints are still in formal investigation process.
We did not incur any fines for breaches of ethical regulations in 2021.
Legal Compliance
Our Legal Compliance function oversees adherence to a wide variety of regulatory compliance-related areas and advises management about the regulatory framework, including changes in legislation and regulations, seeking to ensure that we conduct business in compliance with all relevant national and international laws and regulations, as well as professional standards, accepted business practices and our own internal standards. Examples of such regulatory compliance areas are our securities and insider trading, competition law (antitrust), and anti-bribery and anti-corruption. When needed, our Legal Department takes charge of any regulatory investigations.
Anti-bribery and anti-corruption
ASML does not tolerate bribery or corruption or any form of improper influence on others or ourselves. We are committed to the highest standards of personal and business integrity. Our Anti-Bribery & Anti-Corruption Policy, as updated in 2020, details our commitment to strong ethics and integrity and the measures we take to prevent bribery and corruption at ASML. It also requires compliance with applicable anti-bribery and anti-corruption laws as well as the ASML Code of Conduct. For more information or to download of the policy, please visit www.asml.com.
In April 2021, we launched our revised Gifts & Entertainment Policy, which details the behavior expected of all ASML employees with regard to giving and accepting gifts or entertainment (including business meals) and supports our commitment to doing business in a professional, ethical and transparent manner. The policy is also a key element in our compliance and anti-bribery & anti-corruption program. We require our employees to always comply with this policy, use common sense and, if needed, seek guidance or support as outlined in this policy. An important new element of the policy is the request for prior approval for certain categories of third-party gifts or entertainment. This enables us to capture registration of both given and accepted gifts and entertainment in these categories, which supports us in complying with the policy, as well as with laws and regulations. Giving and accepting gifts and entertainment should never influence, or appear to influence, the integrity of our business decisions and transactions, or the loyalty of the parties involved. ASML does not allow employees to accept or provide facilitation payments or to make political contributions on behalf of the company.
In 2021, we revised and updated our training curriculum regarding anti-bribery and anti-corruption topics, mostly as part of the updated ethics training curriculum and by providing additional classroom trainings to specific stakeholder groups. We are further strengthening our global third-party due diligence program.
There were no regulatory fines or actions toward ASML in the area of bribery and corruption in the reporting year 2021.
Competition Law Compliance policy
ASML considers compliance with competition law an essential part of its business. Competition law (also known as ‘antitrust law’) protects effective competition in order to ensure the optimal functioning of the market. Competition law impacts many areas of ASML’s day-to-day business. It affects our dealings and interactions with customers, suppliers, co-developers and other business partners.
We are committed to the principles of fair competition and fairness in dealing with our business partners, including suppliers, codevelopers, customers and other industry peers. As such, ASML does not condone any form of conduct that is considered illegal
ASML ANNUAL REPORT 2021 125
under applicable competition laws or is contrary to our Code of Conduct, and we will not engage in business or cooperate with business partners who resort to anticompetitive behavior or suggest entering into illegal conduct.
To this end, ASML has general and specific control measures in place to prevent, detect and disclose potential competition law issues, including the following:
Competition law compliance risk assessment:
ASML regularly performs risk assessments of relevant competition law focus areas. This assessment identifies and takes into account risks that may be present from a competition law perspective, which controls have been put into place, what the remaining risks are, and which measures will be taken in order to mitigate any remaining risks.
Policy review:
Our Competition Law Compliance Policy demonstrates our ongoing commitment to ensuring compliance with applicable competition laws and our Code of Conduct. Any act of an Employee or business partner contrary to this Policy will be considered a significant breach of ASML’s Code of Conduct. Consequently, this may lead to appropriate disciplinary measures, including dismissal. ASML reviews this Policy periodically. We published a public version of the Policy in 2020, and released an updated version of the internal Policy in 2021.
Training and awareness:
ASML’s competition law training program consists of a combination of different methods; computer-based training sessions and in-person training sessions. Awareness of relevant topics and issues relating to competition law is also promoted by periodic communications through, for example, presentations and articles on ASML’s intranet or by email communications.
Contacts with business partners:
ASML expects its business partners (such as customers, suppliers, consultants, contractors, intermediaries, etc.) to demonstrate high standards of ethical behavior that are consistent with our own. ASML will not engage in business or cooperate with business partners that resort to anticompetitive behavior or suggest entering into illegal conduct. ASML firmly condemns any anticompetitive behavior by its business partners.
Reporting and resolving an issue, violation or complaint:
ASML will support its employees and business partners who refuse to enter into anticompetitive conduct or who report potential violations of our policy, as clearly stated in our Speak Up & Non-Retaliation Policy. ASML does not tolerate any form of retaliation or other form of adverse consequences against employees who practice strict adherence to competition law rules or against those who Speak Up, even if ASML loses business as a result.
For more information or download of ASML’s public competition law compliance policy, please visit www.asml.com.
Privacy protection
We are committed to respecting and protecting the privacy rights of employees, customers, suppliers and everyone we do business with. Personal data is managed in a professional, lawful and ethical way, in line with our Code of Conduct and in compliance with applicable laws and regulations.
We have technical and organizational measures in place to prevent the accidental or unlawful destruction, loss, alteration, unauthorized disclosure of, or access to personal data. Our Privacy Policy sets the minimum requirements from the perspective of ASML as a global organization. The policy is binding for all ASML employees and applies to the processing of personal data of our staff, job applicants and business partners such as customers, suppliers, visitors and other individuals.
A dedicated privacy and personal data protection program ensures we adhere to high personal data protection standards. Our privacy program includes, among others, the following elements:
•Governance: At the senior management level, the Corporate Risk Committee is responsible for oversight of the topic of privacy, while the Privacy Office manages the privacy framework and provides assistance and guidance. Each employee is responsible for reading and understanding the content and implications of the Privacy Policy.
•Systems and procedures: The Privacy Controls framework consist of 130 privacy activities including privacy impact assessments and data protection impact assessments. The Privacy Controls framework is included in our ERM process.
•Disciplinary actions: We investigate all incidents, concerns and registered reports of potential breaches that are registered in our Privacy portal as outlined in our personal data breach procedure. We take appropriate control measures and disciplinary actions to prevent reoccurrence.
•Audit: Privacy is included in our internal audit program. Our privacy notices for both business partners and recruitment are derived from our Privacy Policy. They explain why personal data is collected and how ASML uses it.
In 2021, we updated our Global Privacy Notices for workers, job applicant, business partners and visitors. The new privacy notices reflect the latest processing of personal data within ASML, and meet the requirements of the applicable Privacy laws and regulations, for example GDPR (EU) and CCPA (US).
ASML ANNUAL REPORT 2021 126
Respecting human rights
We conduct business on the basis of fairness, good faith, and integrity and we expect the same from all those we work with. To this end, we also believe that we have the responsibility to respect human rights and contribute to positive impact.
We are committed to respecting universal human rights and honoring the value of ethics as expressed in our Code of Conduct. We support the principles laid down in the OECD Guidelines for Multinational Enterprises, United Nations Guiding Principles (UNGP) on Business and Human Rights and those in the International Labor Organization’s (ILO) Tripartite Declaration of Principles concerning Multinational Enterprises and Social Policy. We have established a Human Rights Policy, which is publicly available on www.asml.com.
Our Human Rights Policy complements our ASML Code of Conduct and the RBA Code of Conduct we adhere to. It expresses our commitment to human rights and responsible labor practice in our operations and our supply chain. The Human Rights Policy applies to ASML and its subsidiaries anywhere in the world. The overall responsibility for identifying and managing human rights issues in our direct operations falls under the remit of our Executive Vice President HR. Responsibility for human rights in our supply chain falls under the remit of our Executive Vice President Sourcing and Supply Chain.
Defining salient human rights issues
Salient human rights issues are those human rights that are at risk of the most severe negative impact through a company's activities or business relationships. We assessed possible impacts on people’s human rights across our value chain. We focused our efforts on seeking stakeholder input on the one hand and performing due diligence in relation to our initial salient issues on the other hand. Our commitments to address and engage actively in our salient human rights issues are highlighted in our Code of Conduct, Human Rights Policy and RBA Code of Conduct for suppliers. We identify and manage human rights issues in various ways, for example stakeholder engagement, internal human rights assessment in our operations, and suppliers' due diligence and sustainability risk management. Read more in: Our supply chain.
We received no grievances about breaches of human rights in 2021.
Our operations
In 2019, we conducted a risk assessment to identify the inherent risks related to human rights within our own operations. The results of our analysis showed that the inherent risk of human rights vulnerabilities in ASML's own operations are working hours and overtime, health and safety, and workplace harassment. The vulnerable rights-holder groups identified within ASML are contractors, ethnic minorities and migrant workers. An update of this assessment is planned for 2022. In addition, we also conduct internal EHS audits regularly. Read more in: Ensuring employee safety.
Working hours and overtime
The standard weekly working hours in the locations where we operate are on average 40 hours. Our company standards are based on the International Labor Standards of the International Labor Organization (the Forty-Hour Week Convention) and the RBA norms. A workweek must not exceed the maximum set by local law and a workweek should not be more than 60 hours per week, including overtime, except in an emergency or unusual situation. We pay constant attention to protecting our employees from working overtime during peak periods. As overtime remains an important attention point for management, we keep monitoring the use of overtime and take appropriate measures to manage the situation.
Health and safety
It is our obligation to provide safe and healthy working conditions for all our employees and others working on our premises. In our products and processes, we think about how to make ASML a safe place to work. We put significant effort into creating awareness and to have a proactive safety culture within ASML. Read more in: Ensuring employee safety.
Workplace harassment
We are a global company with operations in more than 60 locations in 16 countries and regions. We have a culturally diverse workforce, employing 122 nationalities. This leads to a higher inherent risk around the issue of workplace harassment in human rights. Read more in: Business ethics and Code of Conduct. Through our Ethics program, we raise awareness around the importance of ethical behavior and our Speak Up & Non-Retaliation Policy. It also provides information and guidance on dealing with topics such as personal relationships at work, conflict of interest, dealing with cultural differences, and ethical aspects around ancillary activities or other positions outside of ASML.
Our supply chain
We assess risks related to human rights in our supply chain through a risk-based approach. In our due diligence process, we use the RBA Risk Assessment Platform to identify inherent risks in labor (including human rights), ethics, health and safety and environmental standards across our full supply base. In the event that a medium or high risk relating to labor is identified, we engage with the supplier and conduct a more detailed analysis. For strategic suppliers covering around 80% of our product-related spend, we expect them to complete the annual RBA SAQ. This SAQ covers more than 400 risk elements related to labor (including human rights), ethics, environmental and safety factors, control elements and management systems, including their performance. It helps us to determine a supplier’s risk profile on sustainability. When we identify compliance gaps, we engage with the supplier to determine corrective action plan(s).
ASML ANNUAL REPORT 2021 127
The salient issues we have defined relate to working conditions (forced and bonded labor), health and safety, and trade union rights. However, operating in the high-tech industry the majority of our suppliers operate in countries with a strong rule of law and are law abiding. We view this inherent risk as low. Read more in: Our supply chain.
Information security
Like other companies, ASML is increasingly subject to cyberattacks. These attacks can potentially have an adverse effect on our business, reputation, revenues, operations or financial health, especially when they breach data protection rules and jeopardize confidential information of our customers or partners. With ASML’s unique position and growing exposure in the semiconductor industry, we see increasing security risk trends, ranging from ransomware and phishing attacks to insider threats and infiltration attempts to acquire our leading intellectual property (IP) or disrupt business continuity.
In 2021, ASML encountered around 20,000 security incidents, most predominantly from phishing attacks with minor impact. According to an external research report '2021 Data Breach Investigations Report (DBIR)' conducted by Verizon, the incidence of phishing attacks in data breaches went up from 25% in 2020 to 36% in 2021. With the increase of exposure to cyberattacks over the past years, we have also strengthened our resources and capabilities, coming from 10 FTEs around 10 years ago to around 250 FTEs in 2021 dedicated to security matters.
Security – like safety and quality – is a prerequisite for trust in the ASML brand. Our customers and partners must be able to rely on the security, safety and quality of our products and services. ASML's existence is based on people and knowledge. Our specific knowledge and intellectual property are what give us a leading edge over our competitors and they are therefore vital to protect.
As ASML innovates together with its ecosystem partners, these partners need access to our systems. As the chain is as strong as the weakest link, we need to make sure that our partners access our systems in a secure way. ASML's Security Circle of Trust is intended to certify and assist our ecosystem partners to increase their information security maturity.
Our security governance consists of three levels:
1.Our Corporate Risk Committee (CRC) is a central risk oversight body, which reviews, manages and controls risk in the ASML Risk Universe, including information security. It also approves the risk appetite, risk management policies and risk mitigation strategies. The CRC, which reports to the Audit Committee and the Board of Management on a regular basis, is chaired by the Chief Financial Officer (CFO) and comprises top senior management representatives from all sectors at ASML.
2.Our Security Committee, a sub-committee of the CRC, validates the risk appetite related to information security and validated policies and roadmaps. It closely monitors mitigation of security risks across the company.
3.The central security department, led by the Chief Information Security Officer (CISO) as the owner of the information security risk, aided by security risk management teams in the sectors. The CISO is in the second line of defense, and is empowered to drive policy through the security roadmap building the controls, and monitors the effective execution of controls in the sectors as the first line of defense.
Information security resilience framework
Our vision on security is that it needs to be embedded in the DNA of our people, processes and technologies. To ensure this, we have created a dedicated security function in order to prevent and manage security risks. Our mission is to enable ASML to have control over the protection of information and assets of the company, its customers and suppliers, by applying risk-based and efficient measures for people, processes and technology that support our business goals. To realize this vision and mission, we pursue and deploy our security strategy to achieve the highest level of maturity.
We developed our information security framework by applying the ISO27001 Information Security Standard across its 14 domains and by driving security maturity – from policy setting, asset management and access control to incident management and more. For each of these domains, we have tailored controls in place, which are assessed routinely to ensure compliance and effectiveness. In addition, we have an incident reporting tool in place to make sure that all IT and information security issues can be reported, correlated, and investigated.
People and knowledge are key to the business success of ASML. Unauthorized disclosure of information of ASML, or information of its customers or suppliers in its innovation ecosystem, could benefit competitors, negatively affect ASML’s ability to file patents, or negatively affect cooperation with customers and suppliers. At the same time, ASML’s operations are dependent on reliable information processing, and unauthorized changes to the information content of these assets can damage the ability to perform business. Therefore, it is critical to guarantee confidentiality and integrity of information. To make sure that our employees understand the security policy and know how to act, we provide mandatory security awareness training and host an annual security awareness week, during which we provide additional information and share learnings.
In our supply chain network, we use a single model for risk assessment of our partners, which they also use in order to screen their suppliers. We are also in close contact with peers, partners and best-in-class security solution providers, and have our security solutions tested regularly through penetration testing (ethical hacking) to identify exploitable issues so that effective security controls can be implemented.
ASML ANNUAL REPORT 2021 128
Creating Security Circles of Trust
At ASML, we develop our technology in close collaboration with partners inside and outside our company in an innovation ecosystem based on trust. Innovating and collaborating in a connected ecosystem requires secure information sharing beyond corporate boundaries, as the vulnerability to cyberattacks is extended to the perimeter of the total ecosystem.
Therefore, in 2021 ASML started the Security Circles of Trust initiative to protect our innovation ecosystem in the Brainport Eindhoven region in the Netherlands. The 'circle of trust' is a network of suppliers who jointly embrace the same information security standards and raise their performance against these standards. The network also drives the exchange of knowledge and best practices between ASML, suppliers and ecosystem partners.
We share best practices and information about cyber incidents to help our innovation partners develop and reinforce security maturity. The goals are to protect intellectual property and guard the industry and the region against cybercrime such as ransomware, to share relevant threat intelligence, to collaborate on security topics, and to become more secure together.
In 2021, we held master classes with our top 10 key suppliers and more than 50 of our neighbor companies to increase information security awareness and knowledge in the region, and to share practical tips, tricks and strategies, for example about combating ransomware.
Intellectual Property protection
Our company is based on people and knowledge. Our specific knowledge gives us a leading edge and a head start over competitors. To stay in business, it is key to protect our own knowledge as well as information entrusted to ASML by our customers and business partners. Patents are a way to protect ASML's research and development investments from use by ASML's competitors, but also from exploitation by ASML's customers, suppliers, and co-developers. We innovate and develop our technology with our ecosystem partners consisting of many different firms and institutions, each of which requires a dedicated way of dealing with intellectual property (IP) matters.
ASML's general intellectual property strategy has three objectives:
•Build and maintain a solid intellectual property portfolio by protecting ASML's inventions.
•Prevent situations where ASML infringes the intellectual property rights of third parties.
•Prevent the disclosure of confidential information including know-how and trade secrets to the outside world, in accordance with ASML's Knowledge Protection Program.
Our Corporate Intellectual Property department is tasked to strengthen our global patent portfolio as well as protecting our patents. The mission of this department is to maximize ASML's intellectual property value to execute and support ASML's overall objectives and to preserve ASML's freedom of operation. To protect our technology leadership and our R&D in leading-edge technology, the Corporate Intellectual Property department is involved in the product generation process with the aim of ensuring that ASML's products are not at risk of infringing on third-party intellectual property rights. The department assesses new products to determine whether they would potentially infringe any relevant rights of third parties.
Our significant investment in complex research and development justifies a strong intellectual property portfolio. We have developed an IP Rights management mechanism to safeguard our IP rights and to respect the IP of other parties. This includes, among others, a dedicated knowledge protection program, restricted access to Engineering Top Secrets, an information security program, mandatory information classification, and a training and awareness program. Read more in: Responsible business - Information security.
Early in 2021, we became aware of reports that a company associated with XTAL Inc., against which ASML had obtained a damage award for trade secret misappropriation in 2019 in the USA, was actively marketing products in China that could potentially infringe on ASML's IP rights. In response, we reached out to certain customers urging them not to aide or abet this company, DongFang JingYuan Electron ('DFJY') in any such potential infringement. Furthermore, we shared our concerns with the Chinese authorities. ASML is monitoring the situation closely and is ready to take legal action if appropriate.
ASML ANNUAL REPORT 2021 129
Product safety
We want to innovate, but always with safety at the top of mind. It’s our duty to provide a safe work environment at all times. We focus on safety at every stage of a product lifecycle: research, development, production, transport, installation, maintenance, upgrades and decommissioning. And we make sure we cover all our stakeholder groups, including employees, customers, suppliers, contractors and visitors.
How we manage product safety
Safe products start with good design. The first step is to eliminate risk by product design, and since human factors play an important role in the safe operation of a product, we try to guard against them becoming a risk factor as much as possible. One example of this is the way we interlock laser beam activities to limit our employees' exposure to dangerous laser beams. This helps prevent workplace activities from turning into potential accidents.
We focus on safety by design in hardware followed by safety by procedure – prevention is key. We seek to ensure all the products and tools we develop comply with the world’s most stringent product safety regulations, and with legislation applicable to the countries where we do business. In cases where there are no safety precautions available to address potential hazards, we develop our own.
We have clear systems and processes in place to support our approach to product safety. When we start designing our systems, our safety engineers conduct an initial Safety Risk Assessment (SRA). They take into account nine key risk areas that we have identified, and alert risk experts if they believe designs might pose a human safety risk. Our product designers are trained to identify any safety issues in the early stages of the design process. The SRA is evaluated during the entire product development process.
In each subsequent stage of the product lifecycle, we evaluate product safety. We track any reported product-related incidents – including supply chain incidents – through our incident-reporting system. Every year, we provide management with a product-safety review, where we report any product safety incidents of the past year. In 2021, as in previous years, we are proud to say that there were no recordable incidents caused by our equipment.
Inside our in-house testing lab
As the technological complexity of our systems increases, so does the need for testing to prevent field failures. Our test labs provide hardware testing capabilities to root out potential risks and flaws in design as early as possible. Testing early in the design process prevents part failures down the line, at customer fabs, and also supports D&E's drive toward more robust product design, from risk to result.
Over the years, we have developed modular test platforms to decrease the mean time between testing (MTBT) and to standardize test lab equipment. In the Modular Vacuum Test platform, for example, around 80% of vacuum-related part risks can be characterized and tested, and additional test environments can be flexibly added, such as gases, high voltage and temperature, using standardized hardware and software interfaces.
Our Veldhoven facility has 24 labs with a total lab space of around 1,500 m2. These labs provide a high-tech test environment for up to 100 test setups, ranging from standard bolt friction tests to tailor-made actuator tests.
As we have grown, so has our product complexity and the number of geographical locations we operate in, and therefore it is becoming more complex to assess which safety legislation and regulations apply to our products and tools. At the same time, it is also more complex to determine the rules and procedures we need to follow to demonstrate this compliance. Some of our technology is so innovative and new that it is not always immediately clear which regulatory regime applies.
In 2021, we established a Corporate Regulatory and Compliance Office, tasked to ensure that our products are compliant with the product safety policy. The Regulatory Board is responsible for the decision-making on ASML product safety compliance and the strategy to eliminate non-compliance, monitors compliance status and drives risk mitigation. During its monthly meetings, the Regulatory Board discusses the non-compliance cases and takes decisions based on the mitigation plan presented. This allows us to further improve our ability to assess which legislation and regulations – including Restriction of Hazardous Substances (RoHS) and Registration, Evaluation, Authorization and Restriction of Chemicals (REACH) – apply in each country we operate in, how to interpret them, and whether our products and tools comply. As always, we provide safety documents for our machines – including the results of the safety tests of parts and the machines’ functioning – taking regulatory requirements into account.
In 2021, we investigated if the use of a Teflon coating on our wafer stages is compliant with international regulations with regard to persistent organic pollutants (POPs). Teflon – the name of a synthetic chemical called polytetrafluoroethylene (PTFE) – is considered a persistent organic pollutant. Results of our analysis show that the Teflon concentration is 0.027 ppb (worst-case scenario), which is far below the 25 ppb limit.
Ensuring safety compliance
Our D&E safety competence leads are at hand to provide thorough knowledge about the way of working and design rules for specific safety hazards. The products and tools we develop comply with the EU Safety Directives and semiconductor industry guidelines (SEMI S2) to ensure product safety is taken into account at all times. These guidelines are incorporated in the Safety System Performance Specification (Safety SPS). We also take into account customer-specific safety guidelines.
ASML ANNUAL REPORT 2021 130
We are SEMI S2 compliant for every product type shipped. In 2021, a report confirming SEMI S2 compliance was available for every product type we shipped. We also have a CE declaration of conformity for all ASML products and tools.
Increasing product safety in the supply chain
Ensuring product safety does not end at our facilities. A large portion of our innovation and development happens at our suppliers’ sites. Safety is a key priority for ASML, and we want to be sure that all the products that we ship comply with the most stringent legislation, including the designs that are made by our customers and partners in the value chain. That is why we have started the 'Product Safety in the Supply Chain project’. Our goal is to ensure that our colleagues and partners have the capability to deliver a safe and compliant product, so that we can avoid safety accidents or incidents, safety-related non-compliance issues or delayed shipments.
In order to achieve these goals, we have defined an end-to-end process in close cooperation with our suppliers to ensure that the products and tools that we purchase through them meet our safety requirements. We have added product safety requirements and competencies to the Supplier Profile, which is our methodology to communicate with our suppliers and measure performance. We screen suppliers to assess how they are meeting specific safety requirements, starting with a supplier self-assessment survey, followed by a site audit as required and then a gap closure review. We expect our suppliers to also provide safety-related data and supporting documentation for the parts or tools they make for us. This process enables supplier capability assessments as a proactive approach to mitigating possible safety risks.
Dangerous goods
We completed phase one of the 'Dangerous Goods' project successfully in 2020, which resulted in, among other things, the appointment of a specialist dedicated to the technical competence handling ‘dangerous goods’, and the adoption of best practices related to shipping of dangerous goods. With the baseline in place in the standing organization, in 2021 we focused on further improving the process. The second phase of the project will focus on three aspects – introducing relevant (hazardous properties) attributes in Teamcenter (our knowledge sharing database), connecting to the processes with knowledge on hazardous properties at the front end (materials database and hazardous substance management), and including hazardous properties / dangerous goods information in the vendor component design process. By identifying at an early stage which materials are hazardous, we can take measures for their safe handling and transportation in time and with more efficiency.
RoHS and REACH
We are committed to complying with EU guidelines for handling hazardous materials and chemicals, the so-called RoHS directive and the REACH regulation, even though the products we manufacture are currently excluded from the RoHS directive. Wherever possible, we aim to reduce and eliminate any use of hazardous substances and replace non-compliant parts with RoHS-compliant alternatives.
REACH regulations are ever changing, which presents a potential challenge. Each year, new additions are made to the hazardous substances list. As ASML machines consist of thousands of parts not manufactured at ASML locations, we need to keep in very close communication with our suppliers to identify the Substances of Very High Concern (SVHC) content of our products. However, our huge supplier portfolio and six-monthly updates of the SVHC list means this process is challenging. Currently, there are 75 substances and groups of substances, of which some contains more than 10 individual substances, that need to be assessed.
In 2021, we have updated our REACH policy and further embedded REACH compliance in D&E’s operations at all our locations and in our global supply chain. In parallel, we also aligned our procedures with the new EU legislation and the EU ‘SCIP’ database of hazardous materials.
Water management
Semiconductor manufacturing processes use a lot of water. Due to climate change, droughts have become more extreme and more unpredictable, which may lead to water becoming a scarce resource in specific locations. Although water is an essential resource in our customers' semiconductor manufacturing process, water use in our own operations is limited. ASML’s products are designed to use water according to a ‘closed-loop’ (recycling) system. The aim of using water in our manufacturing process is to keep the system cool against the heat released during the exposure process.
Water consumption at ASML is only a fraction of the water consumption of most companies in the semiconductor industry. Nevertheless, we promote the responsible use of water throughout our company. Our water consumption in 2021 increased to 1,041,000 cubic meters, up from 860,000 cubic meters in 2020, an increase that can be attributed to the expansion of the manufacturing facility in Veldhoven, an increase in product output and the extension of our reporting scope from 20 locations previously to 57 locations as of 2021. We use water from the municipal water supply. In 2021, we implemented separation of rain water from other types of waste water in the Netherlands and we are exploring ways to re-use the water.
While disruptions in access to water may represent a significant risk for some of our customers, water-related risk for ASML is limited. We have seven manufacturing sites, of which the four main facilities are Veldhoven (Netherlands), San Diego (US), Wilton (US) and Linkou (Taiwan). Read more in: Our TCFD Recommendations: climate-related disclosure, available on www.asml.com.
Operational excellence
ASML ANNUAL REPORT 2021 131
ASML has achieved strong growth over the past few years, thanks to groundbreaking innovations and technology leadership. We’ve introduced several generations of cutting-edge chipmaking systems and built a strong market position in the semiconductor equipment manufacturing industry. As we mature as a company and build on this position, we are putting effort into ways to continuously improve the customer experience and help customers reduce the cost of ownership. Customers look at both the cost of the systems and running costs. As such, improving quality requires an end-to-end approach. We need to look at the whole chain to identify the real issues and find solutions. We seek to combine our innovation power with operational excellence.
Our New Enterprise program
The strong growth in our business operations and the evolution of the company drove us to review our work practices and determine where we can increase efficiency in our operational processes to improve the customer experience and unlock business value. We put ample effort into reshaping our processes and IT landscape. The Our New Enterprise (ONE) program is centered on improving our business processes and IT enterprise management system. It builds on the steps taken in recent years to improve our IT systems, which were built in the 1990s and were not optimized for tailored customer solutions. This is a multi-year program, with the rollout being done in phases.
The ONE program addresses the complex processes that have resulted from a fragmented application landscape with numerous customized applications. The aim is to ensure flexibility while introducing standardization. ONE will enable ASML to function in a more unified and efficient way by simplifying processes to ensure a future-proof and more sustainable system. The program adopts a cross-sector, company-wide, and end-to-end approach that will enable us to deliver higher business value for our stakeholders, which we define as:
•Shareholders: Increased competitiveness of our products and services
•Customers: Increased performance and reliable product life-cycle management of our products and services
•Suppliers: Stable and clear requirements on parts, tools, and timing through decoupled planning
•Employees: Empowered through simplified, standardized, and cross-sector operations
Quality culture
ASML is committed to providing a high level of customer satisfaction by delivering top-quality, sustainable products and services that consistently meet or exceed our customers’ expectations. Quality and operational excellence are essential elements of our technology leadership. This leadership is reinforced by a company-wide quality culture that creates an environment to excel. Together with our suppliers and partners, we ensure high-level performance for our products and services. As a learning organization, we continuously improve our offerings and processes.
The aim of our quality culture is to shorten Time to Mature Yield and ensure end-to-end quality of our products and services in several ways:
•First Time Right: Apply risk management processes on products and execution to minimize the impact for our customers.
•Zero defect: Embed controls to guarantee adherence to our policies, processes and procedures.
•Zero repeat: Learn from failures and prevent reoccurrence, driving structural improvement in our products, services and processes.
We have established a Quality Program Review Board, chaired by our Chief Operations Officer (COO), tasked with steering and monitoring on quality. We are also committed to internationally recognized quality management systems and standards. Our quality management system complies with the ISO 9001:2015 standard and is third-party certified. This demonstrates our robust quality governance, effective quality management system, and quality compliance across the company.
Quality Day 2021: the power of learning
With a record number of over 7,500 participants worldwide, the Quality Day's theme put the spotlight on the habit of learning, by showing that 'Learning is caring' – caring for our products, our customers, our colleagues and our business partners. More than 150 workshops, trainings, best practice sharing sessions, poster sessions and simulations were held in online, live and hybrid formats.
For example, in D&E, a Root Cause Analysis escape room experience exposed the participants to contrast thinking, a process that can be used to solve complex technical problems. Another example was a simulation of a cost decision meeting among several departments, where engineers could experience, for instance, what it is like to be a customer support manager in those given circumstances.
In addition to these quality market programs, this year we also introduced cross-sector HaQathons, organized by the business lines, which tackled business quality challenges in areas such as in re-use, diagnostics, supplier workmanship, and the customer journey. Colleagues from all sectors were invited to collaborate and come up with new insights and ideas to address these challenges and create value for the business and our customers.
ASML ANNUAL REPORT 2021 132
Financing policy
We continue to hold on to our long-held prudent financing policy, which is based on three foundational elements:
•Liquidity: Maintain financial stability with a target to keep our cash and cash equivalents, together with short-term investments, above a minimum range of €2.0 to €2.5 billion
•Capital structure: Maintain a capital structure that targets a solid investment grade credit rating
•Cash return: Provide a sustainable dividend per share that will grow over time, paid semi-annually, while returning excess cash to shareholders through share buybacks or capital repayment
Liquidity
Our principal sources of liquidity consist of cash and cash equivalents, short-term investments and available credit facilities. In addition, we may from time to time raise additional funding in debt and equity markets. We seek to ensure that our principal sources of liquidity will be sufficient to satisfy our liquidity requirements at all times.
Our liquidity needs are affected by many factors, some of which are based on the normal ongoing operations of the business, and others by the uncertainties of the global economy, the bulky character of our business and the specific characteristics of the semiconductor industry. Although our cash requirements fluctuate based on the timing and extent of these factors, we believe that cash generated from operations, together with our other sources of liquidity are sufficient to satisfy our expected requirements, including our expected capital expenditures, research and development expenses and debt servicing.
We invest our cash and cash equivalents and short-term investments in short-term deposits with financial institutions, governments and government-related bodies that have investment grade credit ratings and in money market and other investment funds that invest in high-rated short- and medium-term debt securities. Our investments are mainly denominated in euros and to some extent in US dollars, Taiwanese dollars and Chinese Yuan.
| | | | | | | | |
| Year ended December 31 (€, in millions) | 2020 | 2021 |
| Deposits with financial institutions, governments and government related bodies | 1,545.3 | | 2,131.7 | |
| Investments in money market funds | 3,841.9 | | 2,928.3 | |
| Bank accounts | 662.2 | | 1,891.8 | |
| Cash and cash equivalents | 6,049.4 | | 6,951.8 | |
| | | |
| Deposits with financial institutions, governments and government related bodies | 1,302.2 | | 638.5 | |
| Short-term investments | 1,302.2 | | 638.5 | |
We maintain an available committed credit facility, with a group of banks, of €700.0 million, under which no amounts were outstanding at the end of 2021 and 2020. This facility has a maturity date of July 2026. We further maintain a local uncommitted credit facility with a bank in China ensuring local liquidity and operational requirements are met at all times, also given existing regulatory restrictions regarding flexible intercompany funding.
Capital structure
Our objectives when managing our capital structure are to safeguard our ability to satisfy our capital providers by maintaining a capital structure that ensures liquidity and supports a solid investment grade credit rating. The capital structure includes both debt and the components of equity, in accordance with both US GAAP and EU-IFRS. The capital structure is mainly altered by, among other things, adjusting the amount of dividends paid to shareholders, the amount of share buybacks or capital repayment, and any changes in the level of debt. Our capital structure is formally reviewed with the Supervisory Board each year in connection with our updated long-term financial plan and relevant scenarios. The outcome of this year’s review confirmed to maintain our existing financing policy in relation to our capital structure.
Our current credit rating from Moody’s is A2 (Stable). This rating was upgraded in September 2021 from A3. Our current credit rating from Fitch is A- (stable), which is consistent with the rating on December 31, 2020.
ASML ANNUAL REPORT 2021 133
We have Eurobonds outstanding with an aggregate principal amount of €4.5 billion, having the following maturities:
Cash return policy
ASML aims to distribute a dividend that will be growing over time, paid semi-annually. On an annual basis, the Board of Management, upon prior approval from the Supervisory Board, submits a proposal to the AGM with respect to the amount of dividend to be declared with respect to the prior year, taking into account any interim dividend distributions. The dividend proposal in any given year will be subject to availability of distributable profits, retained earnings and cash, and may be affected by, among other things, our view of potential future liquidity requirements including for investments in production capacity, working capital requirements, the funding of our R&D programs and acquisition opportunities that may arise from time to time. In addition to dividend payments, we intend to return cash to our shareholders on a regular basis through share buybacks or capital repayment, subject to our actual and anticipated level of liquidity requirements and other relevant factors.
ASML intends to declare a total dividend in respect of 2021 of €5.50 per ordinary share. Recognizing the interim dividend of €1.80 per ordinary share paid in November 2021, this leads to a final dividend proposal to the General Meeting of €3.70 per ordinary share. The total 2021 dividend is a 100% increase compared to the 2020 total dividend of €2.75 per ordinary share.
On July 21, 2021 we announced a new share buyback program to be executed by 31 December 2023. As part of this program, ASML intends to repurchase shares up to an amount of €9 billion, of which we expect a total of up to 0.45 million shares will be used to cover employee share plans. ASML intends to cancel the remainder of the shares repurchased. The new program has replaced the previous €6 billion share buyback program 2020-2022 which has not been completed for the full amount in light of the new share buyback program.
In 2021 we repurchased 14,358,838 shares (2020: 3,908,429 shares) for a total consideration of €8,560.3 million (2020: €1,207.5 million) of which 6,601,699 shares for a consideration of €4,560.3 million were purchased under the new program.
ASML ANNUAL REPORT 2021 134
ASML ANNUAL REPORT 2021 135
This section in the Annual Report outlines the highlights from our Tax Policy. For more information and the full Tax Policy document, please visit www.asml.com. Additionally please note that in below text 'tax' and 'taxes' include customs duties.
Our leading principle is that our tax position is a reflection of our business operations, being the sale of lithography systems and related products and services, supported by our manufacturing and R&D activities. Since the start of the company, ASML has a straightforward operating model, with our campus in Veldhoven, the Netherlands, at the heart of our global operations.
The operating model described below is critical in understanding ASML’s tax position.
Of ASML’s global work force, 55% is located in the Netherlands, 20% in the US region, 24% in Asia and 1% in EMEA (excl. the Netherlands). Of all senior management roles 70% is based in the Netherlands. This reflects the fact that ASML Netherlands is actively leading and controlling the group’s activities, performance and risks.
With regard to R&D activities, 72.5% of our R&D employees are located in the Netherlands. The remaining part is mainly employed by our legal entities in the US and the rest is scattered over other locations. The costs of our US and other foreign R&D organizations are borne by ASML in the Netherlands, and 95% of our patents is owned by ASML Netherlands. During the 2000-2020 period, ASML Netherlands bore approximately €16.7bn of R&D costs, an average of more than 15% of our yearly revenue in that period.
All our lithography machines are assembled in Veldhoven, whereas a significant percentage of the parts are being supplied by our ecosystem of suppliers in the Netherlands, Europe and the US. Some modules and metrology systems are manufactured by our factories in the US and Taiwan. Generally our new lithography machines are shipped directly from the Netherlands to our customers once they are ready.
Currently, our customers are mainly based in four locations: Taiwan, South Korea, China and the US. Our operations in those countries contribute to our sales and customer service efforts. In general the leading roles for our sales and customer services activities are based in Veldhoven.
The compensation of the ASML activities in the countries where we are active is a fair reflection of the operating model in line with local laws and international standards. Where possible we have agreed (or are in the process of agreeing) the level of remuneration of our activities with local tax authorities. Furthermore we have processes and controls in place to monitor various taxes, such as customs, value-added tax (VAT), corporate income tax (CIT) and withholding tax (WHT). Our approach to tax is regularly discussed with senior management. Training is provided within ASML on a regular basis to emphasize the importance of compliance with laws and regulations.
Our tax principles
The following principles guide us in how we report and pay tax in the countries we operate in:
ASML ANNUAL REPORT 2021 136
1.We act in accordance with the letter and the spirit of tax laws and regulations.
2.We report taxable income in a jurisdiction commensurate with the added value of the business activities in that jurisdiction.
3.ASML’s profit allocation methods are based on internationally accepted standards as published by the OECD, as well as relevant rules and regulations in the local jurisdictions we operate in.
4.We pursue an open and constructive dialogue with the tax authorities in the jurisdictions we operate in, based on mutual respect, transparency and trust, disclosing all relevant facts and circumstances. We do not use tax structures intended for tax avoidance, nor will we engage in the artificial transfer of profits to low tax jurisdictions.
5.We do not operate in tax havens (as defined by the European Commission’s ‘blacklist’) other than for ASML business purposes.
6.We make tax disclosures in accordance with reporting requirements, US GAAP and IFRS.
Our tax strategy
ASML’s tax strategy is based on our tax principles and is closely aligned to our business strategy and our sustainability goals. It is approved by the Board of Management and is aligned with our accountability for ASML’s Tax & Customs affairs.
We focus on:
•Our role in managing all our stakeholders. From an external perspective with tax authorities and regulators, but also investor communication. Internally, in supporting our business in managing risks, being in control and at the same time remain efficient in its administrative procedures and way of working. We work in an integrated way with other experts within ASML.
•The future of taxation, which includes developments in ESG (including Tax Transparency) and Tax technology.
•Compliance & Control: This includes the development, implementation and monitoring of processes and controls for appropriate tax risk management and reporting purposes. Furthermore through the timely and accurate fulfillment of tax compliance obligations in line with applicable tax laws and regulations (incl. timely payment of taxes due).
•Projects: Every year our business changes and the regulatory environment in which we operate changes. We work on projects that deal with these changes to ensure the solutions implemented are compliant and efficient. Likewise we continuously strive for simplification and review existing business models for compliancy.
•The ASML Tax & Customs organization. In this fast changing world it is important to have a diverse team, which can handle change and are more than just good tax and customs experts. Communication, digital and project management skills are becoming increasingly important. We strive to work together and develop each other in line with the ASML values (Collaborate, Challenge and Care).
Tax governance
Our globally organized tax department is responsible for daily tax management. It falls under the supervision of our Board of Management, which is ultimately responsible for ASML's approach to tax. Our integrated global tax department is spread across three regional hubs where ASML operates and aligns on cross-border tax matters. ASML’s global tax department is well connected to ASML’s operations worldwide. This helps to ensure compliance with applicable local tax laws and regulations. Tax filing obligations are monitored via a central tax compliance dashboard. Controls are implemented and executed via our SOx and Internal Control Frameworks. Automation is used in various areas to support operational tax processes as well as tax risk management.
The Audit Committee of the Supervisory Board (SB) reviews our tax strategy and annually confers with our tax professionals to discuss tax policies and the impact of tax laws and regulations on ASML.
Training programs are in place in order to ensure that global tax department members stay aligned and up to date with latest developments in the global tax landscape. Additionally, tax department members regularly provide tax awareness sessions for stakeholders from business and other finance departments.
We aim to be clear about all aspects of our tax position and to share these in a transparent manner, fostering a relationship of honesty, transparency and trust with tax authorities in the countries we operate in. ASML’s approach to tax is aimed at maintaining a low tax-risk appetite. This is reflected, for example, in the number of bilateral advance pricing agreements (BAPA) we have with the tax authorities in our significant jurisdictions.
Tax contribution
ASML’s technology is driving our profitability. Around 90% of our income is taxable in the Netherlands as most of our value creation through R&D, design and manufacturing activities is based there. The income from other activities, such as regional equipment sales and customer support activities, is subject to taxation in the countries where these activities take place – the main ones being Taiwan, South Korea, China and the US.
To foster innovation, we make use of incentives that have been introduced in the countries we operate in – the Dutch innovation box and the US Foreign Derived Intangible Income regulation being the most significant ones. Use of these incentives has beneficial impact on our consolidated effective tax rate. For more information on the financial impact of these regulations we refer to note 21 in the Consolidated financial statements.
ASML ANNUAL REPORT 2021 137
We pro-actively participate in discussions about the future development of these incentives as these significantly support the level of R&D activities we are able to perform and the ability to create job opportunities for people in the countries in which we operate. Abolishment or legislative changes on these or other tax regulations (e.g. Pillar 1 and Pillar 2 developments) could have impact on our consolidated future effective tax rate.
Disclosures are provided in our financial statements and cover tax payments/taxes collected in our main markets. Income Taxes paid include withholding taxes that classify as an income tax under ASC 740. We provide country-by-country tax reporting in a transparent and accurate manner to the tax authorities. Below we have included key data for our most significant countries (which represent 97% of the total group).
Income tax profile per significant country
| | | | | | | | | | | | | | | | | |
| (€, in millions) | Netherlands | US | Taiwan | South -Korea | China |
| Total net external sales | 69 | | 1,635 | | 7,355 | | 6,256 | | 2,673 | |
| Total net internal sales | 19,388 | | 2,213 | | 1,651 | | 571 | | 266 | |
| Income before income taxes | 5,983 | | 297 | | 56 | | 183 | | 39 | |
Income tax expense (actual)1 | 894 | | (54) | | 17 | | 60 | | 14 | |
Income tax paid2 | 818 | | 215 | | 93 | | 41 | | 24 | |
1.Income tax expense (actual) concerns the total current & deferred tax expense/benefit accrued
2.Income tax paid concerns the actual income tax paid in 2021
ASML ANNUAL REPORT 2021 138
Message from the Chair of our Supervisory Board
Gerard Kleisterlee (Chair of the Supervisory Board)
Dear Stakeholder,
In 2021, ASML had stellar performance – driven by strongly surging demand for microchips, it was a record year, again under adverse circumstances. We still had to cope with COVID-19 and some supply issues, but we saw fantastic growth, making 2021 an even better year than 2020 with record turnover, cash flow and profitability.
Impressive technological progress
Success of the company starts with the success that ASML has with its customers. We have seen great progress with the wide adoption of ASML’s EUV 0.33 NA platform in high-volume manufacturing, and growing commitment to the next-generation EUV 0.55 NA (High-NA) platform, where good technical advances have been made. At the start of Q4, the Supervisory Board's Technology Committee made a visit to ZEISS in Germany, where preparations for assembly of the first new system are being executed, and we were impressed by the great achievements of the teams working on this.
Dealing with surging demand
We continue to see surging demand, not only for our leading-edge EUV lithography systems, but also for DUV, the workhorse of the semiconductor industry in mature nodes. To meet this strong demand across our entire product portfolio, we are first of all driving down our manufacturing cycle times and are working with our supply chain to increase our output capability across our product portfolio. In 2021, we have seen some tension in our operations as well as in ASML’s supply chain, which caused some delays in system shipments at the end of the year. However, with ASML’s typical ‘let’s just do it’ mentality, these issues have been addressed with the highest priority.
Aligning with customers
In the context of being a trusted partner in the semiconductor ecosystem, ASML has seen great progress in dialogues with leading customers on EUV 0.33 NA and EUV 0.55 NA (High-NA). Particularly in EUV, it is important for ASML to be totally transparent toward its customers, because they have no alternative. Instead of just selling equipment, ASML works with its customers toward achieving a specific wafer output – this requires total alignment with customers’ objectives, which may be different depending on how they run their factories. ASML always needs to adapt to that, thinking from its customers’ perspective and being fully aligned to address their needs with its products and services.
Maintaining a well-functioning global semiconductor ecosystem
ASML operates in a world that is getting more complex. Also in 2021, with chips being at the core of modern digital life, ASML has been a topic in the ongoing trade discussions between the world’s superpowers. ASML takes up a neutral position in this. The starting point here has been and will be that ASML aims to work with its customers in a way that allows the company to continue to serve all of them, wherever they are, within all applicable rules and regulations. We strongly believe that it is in the interest of all stakeholders in the semiconductor and electronics industry to avoid fragmentation and maintain a well-functioning global ecosystem, based on cooperation, fair competition and trust.
Increasing focus on ESG sustainability
ASML takes today’s increasing focus on ESG (environment, social and governance) sustainability very seriously. We take responsibility for what we do and can control. On the social and governance aspects – we are taking care of our employees and the communities that we are in, and we are well governed. The environmental aspect is primarily about addressing climate change,
ASML ANNUAL REPORT 2021 140
which is a global challenge that requires urgent action by everyone, including us. We have to take care of our own environmental footprint, the footprint of our suppliers and the potential negative effects of the products and services that we supply. We ask our suppliers to show us their environmental programs, and we work with them on joint programs in areas such as re-use. On our side, it is our responsibility to minimize the energy consumption, greenhouse gas emissions and use of materials of our lithography solutions, for which we have programs in place.
Strong growth comes with challenges
As a fast-growing organization, ASML’s focus on people and leadership development is critical to its success. Every new ASML employee should feel welcome, become part of this dynamic environment quickly and be able to contribute and develop their skills. This requires a well-organized set of processes and controls as well as a strong culture of caring. Hiring the numbers of people as we did in 2021 comes with responsibility to foster their talents. In addition, we need to prepare and adapt for the future. With the broad range of advanced lithography solutions and services, and with a strongly growing installed base, we have to carefully balance our focus on cost, quality and output in our mature business with our continuous drive for innovation at the leading edge of technology.
Confident outlook for 2022
The Supervisory Board proudly recognizes the great efforts made by ASML’s workforce – at the end of the day, the employees and their partners in the supply chain and innovation ecosystem make it all happen under the challenging circumstances that we are still in. ASML has done an amazing job in managing its way through the COVID-19 crisis while continuing to deliver outstanding, advanced and mature products and services.
We are looking forward with confidence, and we strongly believe that ASML is on a clear path to continue enabling groundbreaking technology to solve some of humanity’s toughest challenges. The company also has the right strategy to support the global electronics ecosystem in a sustainable way and deliver value to all its stakeholders.
Gerard Kleisterlee
Chairman of the Supervisory Board
ASML ANNUAL REPORT 2021 141
The Supervisory Board supervises and advises the Board of Management in performing its management tasks and setting the direction for ASML. The Supervisory Board focuses on long-term and sustainable value creation, with the goal to ensure that the Board of Management pursues a strategy that secures its leading position as a supplier of holistic lithography solutions to the semiconductor industry. As Supervisory Board, we uphold an appropriate system of checks and balances, provide oversight, evaluate performance and give advice where required or requested. Through good governance, we help to ensure that ASML acts in the best interests of the company and its stakeholders. In this Supervisory Board Report, we report on our activities in 2021.
During 2021, the semiconductor industry as a whole grew by 17.3% worldwide, while the COVID-19 pandemic still had impact. ASML continued to grow and welcomed new colleagues, while safeguarding health, safety and business continuity. Increasing customer demand and growth of the company have resulted in additional challenges in 2021. We are pleased to see that ASML has been able to realize fantastic growth, making 2021 an even better year than 2020 with record turnover, cash flow and profitability.
Our activities in 2021
In exercising our task in 2021, the Supervisory Board agenda was centered around the strategy and its execution, financial and operational performance, business developments, risk management, and people and organization. Based on the strategic priorities for ASML as agreed in the annual strategy review, several topics were extensively discussed by means of deep dives, allowing a focused and in-depth review.
Strategy and long-term value creation
During 2021, the Supervisory Board devoted a considerable amount of time discussing strategic topics. We performed the recurring annual review of ASML's corporate strategy, the long-term financial plan and the long-term plans of EUV, DUV and Applications. The Supervisory Board fully supports ASML strategy, which continues to be centered around the five pillars strengthen customer trust, holistic lithography and applications, DUV competitiveness, EUV 0.33 NA for manufacturing and EUV 0.55 NA (High-NA) insertion. With the strong demand for ASML's products in combination with the company’s focus on execution of its strategic priorities, the Supervisory Board has confidence in ASML’s long-term growth opportunities and the continued delivery of value to its stakeholders.
As part of the annual strategy review, we held dedicated workshops focused on long-term semiconductor market developments and external global forces, including geopolitics and ESG sustainability. Other workshops concerned challenges related to strategy execution, zooming in on the end-to-end supply chain and on the installed base and services strategy. These workshops enable an engaged and focused discussion between the Supervisory Board and Board of Management on key strategic matters, and as a Supervisory Board we highly value this way of contributing to the strategic decision-making process.
Besides the annual strategy review, strategic topics were addressed throughout the year by means of deep dives, allowing focused, in-depth review by the Supervisory Board.
ASML ANNUAL REPORT 2021 142
DEEP DIVE: Strategic cooperation with Carl Zeiss SMT
With respect to the strategic cooperation with Carl Zeiss SMT, the Board of Management and the Supervisory Board discussed the new overall framework agreement covering the entire spectrum of the relationship between the two companies. In the review, we looked in depth at the three – strongly interrelated and mutually supportive – pillars of the agreement: behavior and culture, governance and commercial, as well as on the renewed arrangement with respect to IP. We consider the new framework agreement as a step forward, especially in the relationship and cooperation between the two companies, as well as in the opportunities to simplify the operational execution.
Financial and operational performance
We reviewed the annual and interim financial statements, including non-financial information, the quarterly results and accompanying press releases, as well as the outcomes of the year-end US GAAP and EU-IFRS audits.
As part of the financial updates, the Supervisory Board, assisted by the Audit Committee, reviewed ASML's financing and capital return policies. The Supervisory Board approved the Board of Management’s proposals for the final and interim dividend to be paid in 2021. Furthermore, the Supervisory Board approved the 2021-2023 share buyback program and discussed the execution of the program with the Board of Management on a quarterly basis.
One special Supervisory Board meeting was held to discuss the messaging around the 2021 Investor Day, during which investors and other key stakeholders were updated about our long-term strategy and financial model. We are confident that ASML is well positioned to continue to deliver long-term growth and stakeholder value in a sustainable manner.
Business developments
In 2021 we witnessed increased wafer demand at both advanced and mature nodes driven by global megatrends in the electronics industry as well as countries pushing for technological sovereignty. This surging demand came with challenges both in our own operations and in our supply chain. The Supervisory Board closely monitored the developments in this regards and saw management address these challenges with the highest priority.
As a technology leader in the semiconductor industry, technological progress is one of ASML's top priorities. The Supervisory Board is pleased to see the ever-wider adoption of ASML’s EUV 0.33 NA scanner platform in high-volume manufacturing, and growing commitment to the next-generation EUV 0.55 NA (High-NA) platform, where great progress has been made by the teams working on this program.
DEEP DIVE: Applications and holistic lithography strategy
An in-depth review of the applications and holistic lithography strategy was performed. We looked at the growth opportunities arising from technology shifts in key market segments and the technological roadmap and how it can support ASML’s business. Key drivers of growth were looked into in detail, including applications such as multi-beam inspection, optical and e-beam metrology, and computational litho and scanner application software. The Supervisory Board is pleased with the applications and holistic lithography strategy and is confident that ASML is well-positioned to create value by executing on its roadmap.
People and organization
Given the significant growth of ASML in recent years, the topics of people and organization continued to be an area of focus for the Supervisory Board in 2021, as we believe that these are of critical importance for the future success of ASML. On several occasions, we were provided with updates from Human Resources and Organization (HR&O). Topics covered included the ASML leadership framework and the results of the annual employee engagement survey. Furthermore, the Supervisory Board, assisted by the Selection and Nomination Committee, extensively discussed and provided advice in respect of ASML's talent management and people development programs as well as succession planning for the Board of Management and senior management. The Supervisory Board is pleased to see the effort being put into the onboarding of new employees, enabling them to develop and contribute as quickly as possible.
Furthermore, it is important that business processes are fit for growth. We oversaw various transformation programs such as ONE. ONE is ASML’s transformation program dedicated to securing configuration integrity over the life cycle of our customer offerings while enhancing the business processes and maintaining flexibility, with the support of its upgraded backbone information system. We paid special attention to the sub-roadmaps of the program where progress had been less than planned, looking at the challenges and mitigating actions. We will continue to closely follow the developments.
DEEP DIVE: ESG sustainability strategy
We discussed the step-up in focus on ESG sustainability with the Board of Management and we reviewed ASML's new ESG sustainability strategy based on nine themes in the areas of environment, social and governance. We are pleased with the further increasing focus within ASML on ESG sustainability, which includes topics such as the energy efficiency of our products, re-use, diversity and inclusion and a responsible supply chain. We intend to connect remuneration targets for the Board of Management to the new ESG sustainability strategy and to increase the weight of the ESG performance measure as part of a revision of the Remuneration Policy for the Board of Management, which we intend to submit to the General Meeting in 2022.
Risk management
As risk management is a key element of the Supervisory Board’s responsibilities, we received periodic risk management updates during the year. Attention was paid to the risk landscape and the developments in that area, the risk appetite and the measures put in place by the Board of Management to mitigate the critical risks. Particular area of attention in 2021 were the challenges created
ASML ANNUAL REPORT 2021 143
by the strong increase in demand for ASML's products across the entire product portfolio, which impacts multiple risks in ASML's risk landscape. Another recurring point of attention was the risk related to rapid growth of the organization. During the year, specific risk areas were reviewed in deep dive sessions. Topics covered in 2021 were IT and IT security risks, intellectual property risks and political risks in light of the global trade situation. For further information on ASML's risk management, read more in: Our performance in 2021 - Governance - How we manage risk.
Relationship with stakeholders
The Supervisory Board regularly discussed ASML’s relationship with its shareholders and members of the Supervisory Board engaged with shareholders throughout the year on topics such as ASML’s strategy and performance, governance and ESG. The Remuneration Committee held engagement meetings with a variety of ASML shareholders and other stakeholders regarding Board of Management remuneration. More information about this topic can be found in the Remuneration Report.
A Supervisory Board delegation held two formal meetings with the Works Council in 2021. In the first meeting, time was spent on getting to know each other, as the composition of the Works Council changed significantly after the Works Council elections held in December 2020. We exchanged views on ASML's strategy and priorities, ASML's performance and challenges, in particular related to the growth and increased complexity of ASML's business. Other topics of discussion were climate change, leadership at ASML and the COVID-19 pandemic, and in particular the challenges related to working from home and the potential impact on innovation and on the mental and physical health of ASML employees. The composition of the Supervisory Board and the Board of Management was discussed, in particular the changes which took effect per the 2021 AGM. The Works Council and Supervisory Board also discussed the Remuneration Policies for the Board of Management and Supervisory Board.
In October 2021, the Technology Committee paid a visit to one of our key suppliers, ZEISS, where the committee met with ZEISS management and discussed the cooperation between ASML and ZEISS, especially given the new framework agreement concluded in 2021.
Additional topics
Other topics that were relevant during Supervisory Board meetings in 2021 included:
•IT and Security: We reviewed the IT strategy, renewed in Q4 2020, and looked into the key objectives centered around the objectives Running IT as a Business, Business Relevance, IT Art of the Possible and Employee Engagement. Particular attention was paid to the increased risk profile on security and business continuity and how the comprehensive IT strategy brings business relevance, value delivery and risk management together.
•Divestment of the non-semiconductor activities of Berliner Glas: The sale of the technical glass activities to Glas Trösch Group in Q2 2021 and the medical applications and SwissOptic activities to Jenoptik in Q4 2021.
•Compliance with rules and regulations: The Supervisory Board monitored compliance with rules and regulations including the Dutch Corporate Governance Code and was kept informed on key legal matters.
•Supervisory Board composition, profile and functioning: We extensively discussed our own composition, profile and functioning, the composition and functioning of its committees as well as the composition and functioning of the Board of Management. More information can be found in the report of the Selection and Nomination Committee.
•Board of Management performance: We also monitored the performance of the Board of Management and decided on the Board of Management's remuneration targets and target achievements. More information can be found in the report of the Remuneration Committee.
An overview of topics discussed during the year can be found in the table below.
ASML ANNUAL REPORT 2021 144
| | | | | | | | | | | |
| Q1 | •2020 Annual Results and Annual Report •2020 external audit report •Final dividend 2020 •Remuneration Board of Management and Supervisory Board, •Risk Management incl deep-dive: IP risk •Market & Customer deep-dive: logic segment •Outcome Supervisory Board evaluation •Legal update •Composition Supervisory Board •Legal Issues Report •AGM agenda | Q2 | •Business priorities update •Strategy deep dive: Geopolitics •Strategy deep dive: Zeiss •AGM update |
| Q3 | •2021 statutory interim report •Share buyback program •Business priorities update •HR&O Update •Risk Management: update Risk Landscape & deep-dive: IT strategy and IT Security •Strategy deep-dive: Applications and Holistic Lithography incl. HMI lessons learned •Strategy deep-dive: ESG •Composition SPAA Board per January 1, 2022 •Capital Markets Day messaging | Q4 | •2021 Interim Dividend proposal •Business priorities update 2021 and 2022 •Update geopolitical developments •Semiconductor Market & Global Forces / ESG (incl. breakout sessions) •Factory Tour •From technology trends to ASML product strategy •Long-term end-to-end supply chain setup / Installed Base Management & Services (incl, breakout sessions) •Topline growth, Costs & Capital allocation 2020-2030 •Supply chain shortages •Output capability challenges •Physical security •Long-term financial plan and Annual Plan 2022 •Financing policy incl. capital return & dividend policy •HR&O update: Leadership framework •ONE Program
|
Meetings and attendance
The Supervisory Board meets at least four times per year in accordance with an annual meeting schedule and whenever the Chairman, one or more of its members, or the Board of Management requests a meeting.
In 2021, the Supervisory Board held six meetings. Of these meetings, four were held virtually and two were held at ASML's headquarters in Veldhoven. In addition to these meetings, there were several informal meetings and telephone calls among Supervisory Board and/or Board of Management members.
The Supervisory Board meetings and the Supervisory Board committee meetings are held over several days, ensuring there is time for review and discussion. At each meeting, the Supervisory Board members discuss among themselves the goals and outcome of
ASML ANNUAL REPORT 2021 145
the meeting, as well as topics such as the functioning and composition of the Supervisory Board and the Board of Management. Also discussed during each meeting are the reports from the different Committees of the Supervisory Board.
Virtual and in-person meetings
Like in 2020, the majority of the Supervisory Board and Supervisory Board committees meetings in 2021 were held virtually due to the COVID-19 pandemic. To address the challenges resulting from meeting virtually, we continued to apply various measures: we planned shorter meeting sessions spread over more days, we held break-out sessions in smaller groups to optimize interaction, and we also made use of video as a means for meeting preparation, in addition to providing written meeting documents. The Supervisory Board is very positive about these new solutions and continued to use them during the meetings that were held in person in 2021.
The Supervisory Board meetings and the meetings of the four Supervisory Board committees were well attended, as is shown in the table below.
In addition to the Supervisory Board members, the members of the Board of Management are invited to the Supervisory Board meetings. All Board of Management members were present for the Supervisory Board meetings in 2021. Members of senior management are regularly invited to provide updates on topics within their area of expertise. This gives the Supervisory Board the opportunity to get acquainted with a variety of ASML managers, which the Supervisory Board considers very useful in connection with its talent management and succession planning activities.
Supervisory Board meeting attendance overview
| | | | | | | | | | | | | | | | | |
| Name | Supervisory Board | Audit Committee | Remuneration Committee | Selection and Nomination Committee | Technology Committee |
| Gerard Kleisterlee (Chair) | 6/6 | 6/6 | n/a | 9/9 | 5/5 |
| Annet Aris | 6/6 | n/a | 6/6 | 9/9 | 5/5 |
Birgit Conix1 | 4/4 | 3/3 | n/a | n/a | n/a |
| Marc Durcan | 5/6 | n/a | n/a | 4/4 | 5/5 |
| Warren East | 6/6 | 6/6 | n/a | n/a | n/a |
| Terri Kelly | 6/6 | n/a | 9/9 | 4/4 | n/a |
| Rolf-Dieter Schwalb | 6/6 | 6/6 | 9/9 | n/a | n/a |
| Hans Stork | 6/6 | n/a | 9/9 | n/a | 5/5 |
Douglas Grose2 | 2/2 | n/a | n/a | 5/5 | 3/3 |
Carla Smits-Nusteling3 | 2/2 | 3/3 | n/a | n/a | n/a |
1.Appointed at the AGM on April 29, 2021 also appointed as member of the Audit Committee.
2.Stepped down per the AGM on April 29, 2021.
3.Stepped down per the AGM on April 29, 2021.
Composition
The Supervisory Board determines the number of Supervisory Board members required to perform its functions, the minimum being three members. The Supervisory Board currently consists of eight members. The Supervisory Board attaches great importance to its composition, independence and diversity and strives to meet all the associated guidelines and requirements. To ensure an appropriate and balanced composition, the Supervisory Board spends considerable time on an ongoing basis discussing its profile, composition and rotation schedule.
Independence
In order to properly perform its tasks, the Supervisory Board considers it to be very important that its members are able to act critically and independently of one another, the Board of Management and other stakeholders. The independence of the Supervisory Board and its individual members is assessed on an annual basis. All current members of the Supervisory Board are fully independent, as defined by the Dutch Corporate Governance Code, and have completed the annual questionnaire addressing the relevant independence requirements.
Diversity
The current composition of ASML’s Supervisory Board is diverse in terms of gender, nationality, knowledge, experience and background and has a suitable level of experience in the financial, economic, technological, social and legal aspects of international business. For more information about diversity, reference is made to the section Corporate Governance - Other Board-Related Matters.
ASML ANNUAL REPORT 2021 146
Supervisory Board skills matrix
| | | | | | | | | | | | | | | | | | | | | | | | | | |
| Gerard Kleisterlee (Chair) | Annet Aris | Birgit Conix | Marc Durcan | Warren East | Terri Kelly | Rolf-Dieter Schwalb | Hans Stork |
| General skills |
| Executive board member of (listed) international company | l | | l | l | l | l | l | l |
| Finance / governance | l | l | l | | l | | l | |
| Remuneration | l | l | | l | l | l | l | l |
| Human resources / employee relations | l | l | l | l | l | l | l | l |
| IT / digital / cyber | l | l | l | l | l | | l | l |
| ASML-specific skills |
| Semiconductor ecosystem | l | l | | l | l | | | l |
| Deep understanding of semiconductor technology | l | l | | l | | | | l |
| High-tech manufacturing / integrated supply chain management | l | l | | l | | l | | l |
| Business in Asia | l | | | l | l | l | l | l |
Changes in composition in 2021
Per the 2021 AGM, the term of appointment of Douglas Grose and Carla Smits-Nusteling expired. Mr. Grose and Ms. Smits-Nusteling stepped down from the Supervisory Board per the 2021 AGM, after having served eight years on the Supervisory Board. As announced during the 2020 AGM, the number of Supervisory Board members increased temporarily from eight to nine in 2020. Upon the retirement of Mr. Grose and Ms. Smits-Nusteling, the Supervisory Board decided to only nominate one candidate, Ms. Birgit Conix, for appointment at the 2021 AGM. The Works Council of ASML Netherlands B.V. decided not to use its recommendation right with regard to the vacancy arising per the 2021 AGM and the General Meeting resolved to appoint Ms. Conix for a term of four years effective per the 2021 AGM. As a result, the Supervisory Board consists of eight members per the 2021 AGM.
Changes in composition in 2022
Per the 2022 AGM, the appointment terms of Terri Kelly and Hans Stork will expire.
Mr. Stork has informed the Supervisory Board that he is not available for reappointment and will retire per the 2022 AGM, upon completion of his current term. The Supervisory Board extends its thanks to Mr. Stork for his valuable contribution over the past eight years, during which the Supervisory Board has greatly benefited from his knowledge and experience.
Ms. Kelly has informed the Supervisory Board that she is available for reappointment per the 2022 AGM. As Ms. Kelly's initial appointment was based on the enhanced recommendation right of the Works Council, the Works Council also has an enhanced right of recommendation in respect of the vacancy arising from the retirement by rotation of Ms. Kelly.
The agenda and explanatory notes for the 2022 AGM will contain further information about the nomination for (re)appointment of Supervisory Board members.
For further information and background on the members of the Supervisory Board, including details on nationality, gender and age, please see the Supervisory Board members’ information in Our performance in 2021 - Governance - Corporate governance - Supervisory Board as well as the Supervisory Board skills matrix included in this Supervisory Board Report.
Induction and training
We have a comprehensive induction program in place for newly appointed Supervisory Board members, designed to ensure that new members gain a good understanding of our business and strategy, as well as the key risks we face. The induction program includes meetings with other Supervisory Board and Board of Management members, a technology tutorial and detailed presentations by our Business Lines, Sectors and Corporate departments. A site visit and factory tour is also part of the induction program. On joining the Supervisory Board, Ms. Conix followed an induction program, which was partly virtual and partly in person.
To ensure permanent education, the Supervisory Board is provided with regular deep dives on a variety of topics, both in the plenary meetings and in the meetings of the Supervisory Board's committees. During 2021, strategy and risk deep dives were held on a variety of topics, see the Our Activities 2021 section in this Supervisory Board Report. Furthermore, external speakers or advisors attended various committee meetings to provide outside-in views on topics such as technology developments and technology outlook. The Supervisory Board also performed site visits. We visited the EUV factory at ASML's headquarters and were updated on the EUV 0.33 NA and EUV 0.55 NA (High-NA) programs. We saw the preparations for the assembly of the first High-NA system and were impressed by the achievements made. The Technology Committee visited ZEISS to see, among other things, how ZEISS' High-NA program was progressing. Finally, a virtual tour of ASML's production facilities in Wilton and San Diego was organized.
ASML ANNUAL REPORT 2021 147
Evaluation
The Supervisory Board greatly values the structural and ongoing evaluation process as a means of ensuring continuous improvement in our way of working. Each year, the Supervisory Board, assisted by the Selection and Nomination Committee, evaluates the composition, competence and functioning of the Supervisory Board and its committees, the relationship between the Supervisory Board and the Board of Management, its committees, its individual members, the chairs of both the Supervisory Board and the committees, as well as the composition and functioning of the Board of Management and its individual members, and the education and training needs for the Supervisory Board and Board of Management members.
In principle, the evaluation of the Supervisory Board is performed once every three years by an external adviser; in the other two years, the evaluation of the Supervisory Board is performed by means of a self-assessment using a written questionnaire, followed by one-on-one meetings between the Chairman and individual Supervisory Board members.
The 2021 evaluation of the Supervisory Board and its committees was performed through a web-based survey, which was prepared by the Selection and Nomination Committee. The Chairman of the Supervisory Board also held meetings with the individual Supervisory Board members. The evaluation was centered around the following themes: composition, stakeholder oversight, oversight of strategy, risk management and succession planning, management and focus of meetings and priorities for improvement. An upward review by the Board of Management and the external Auditor was also part of the annual assessment.
The results of the Supervisory Board evaluation were discussed in early 2022. The conclusion was that the Supervisory Board and its committees continue to function well. Suggestions to further improve the functioning of the Supervisory Board include further optimizing the meeting agenda to ensure an appropriate balance between recurring items and strategic topics as well as topics related to operations and people and organization. Other suggestions relate to the balance between presentation and discussion during meetings, and increasing the engagement with management and the organization outside meetings.
The Board of Management also conducted a self-evaluation in 2021, focusing on the role, responsibilities and functioning of the Board of Management collectively, and on the functioning of the individual Board of Management members. This self-evaluation was performed in a number of off-site Board of Management meetings dedicated to this topic. As part of the self-evaluation a survey was completed and interviews with the individual Board of Management members were held. Themes addressed include the Board of Management's strategic focus, stakeholder involvement, people & organization, board dynamics and board organization. Also in 2022 a special Board of Management session will be held to continue the discussion and follow-up on the observations made. The overall conclusion of the self-evaluation was that ASML has a well-functioning Board of Management. The self-evaluation was also discussed with the Supervisory Board and its Selection and Nomination Committee.

The four committees of the Supervisory Board prepare the decision-making of the full Board. In the plenary Supervisory Board meetings, the chairpersons of the committees report on the items discussed in the committee meetings. In addition, the meeting documents and minutes of the committee meetings are available to all Supervisory Board members, enabling the full Supervisory Board to make the appropriate decisions.
Audit Committee
The Audit Committee assists the Supervisory Board in overseeing the integrity and quality of our financial reporting and the effectiveness of the internal risk management and internal control systems.
ASML ANNUAL REPORT 2021 148
| | | | | |
| Members | Main responsibilities |
•Rolf-Dieter Schwalb (Chairman) •Birgit Conix •Warren East | •Overseeing the integrity and quality of ASML's financial statements and related non-financial disclosure and submitting proposals to ensure such integrity; •Overseeing the accounting and financial reporting processes and the audits of the financial statements; •Overseeing the effectiveness of our internal risk management and control systems, including the compliance with the relevant legislation and regulations, and the effect of codes of conduct; •Overseeing the integrity and effectiveness of our system of disclosure controls and procedures and our system of internal controls over financial reporting; •Overseeing the External Auditor’s qualifications, independence, performance and determining its compensation; and •Overseeing the functioning of Internal Audit. |
The members of the Audit Committee are all independent members of the Supervisory Board.
The Supervisory Board has determined that both Mr. Schwalb and Ms. Conix qualify as an Audit Committee financial expert pursuant to Section 407 of the Sarbanes-Oxley Act and Dutch statutory rules, taking into consideration their extensive financial backgrounds and experience. |
The Audit Committee is provided with all relevant information to be able to adequately and efficiently supervise the preparation and disclosure of financial information. This includes information on the status and development of the (semiconductor) market to be able to judge the outlook and budget for the next six to 12 months, the application of EU-IFRS and US GAAP, the choice of accounting policies and the work of the internal and external auditor.
Audit Committee meetings in 2021
The Audit Committee meets at least four times a year and always before the publication of the quarterly, half-year and annual financial results. In 2021, the Audit Committee held six meetings.
| | | | | | | | | | | |
| Recurring agenda topics (quarterly) | Attendance |
•Financial update and financing •Review of the quarterly financial results and press release •Accounting update •Internal control update •Observations External Auditor •Risk and Internal Audit update •Disclosure Committee report •Legal matters report •Ethics and compliance | In addition to the Audit Committee members, the Chairman of the Supervisory Board attends the Audit Committee meetings whenever possible. The external auditor and the internal auditor have a standing invitation for Audit Committee meetings and attended all Audit Committee meetings in 2021. The CEO, CFO, EVP Finance, Corporate Chief Accountant and the VP Risk and Business Assurance are invited to the meetings. |
The below overview provides a number of topics discussed during Audit Committee meetings in 2021, in addition to the recurring agenda topics.
| | | | | | | | | | | |
Q1 | •2020 Annual Report and financial statements US GAAP and EU-IFRS •Accounting deep-dive: Balance sheet review •2020 External audit report •Annual Reporting Process •Capital return: final dividend 2020 and share buyback program •Fraud-risk assessment •Results of the External Auditor evaluation 2020 •Results Self-Evaluation Audit Committee •Annual plans Risk and Internal Audit
| Q2 | •Approval external audit plan 2021 •Expense reporting Board of Management and Supervisory Board 2020 |
| Q3 | •Statutory Interim report 2021 •External Audit rotation process •Compliance deep-dive: export control •Share Buyback program 2021-2023 •Finance and IT transformation program | Q4 | •Interim Dividend 2021 •Accounting deep-dive: Zeiss framework agreement •2021 Annual Report process •Long-term financial plan •Annual Plan 2022 •Compliance deep-dives: Finance compliance and country compliance Korea •Annual tax update •External audit update •Review rules of procedure Audit Committee •Process for the External Auditor evaluation
|
Financials
In 2021, the Audit Committee focused, among other things, on financial reporting, most particularly the review of ASML's Annual and Interim Reports, including the annual and interim financial statements and non-financial information. The Audit Committee also closely monitored the progress and discussed the outcomes of the year-end US GAAP and EU-IFRS audits. The quarterly results and the accompanying press releases were reviewed before publication.
On a quarterly basis, the Audit Committee was provided accounting updates by the Corporate Chief Accountant, highlighting the main accounting matters relevant for the quarter. A recurring item of focus of the Audit Committee in this regard is revenue recognition, as this is a complex accounting also identified as a critical audit matter by the external auditor. Other important elements of the Audit Committee's quarterly procedures were the discussion of the observations of the External Auditor in relation to the accounting matters, as well as the report by the Disclosure Committee on the accuracy and completeness of the quarterly
ASML ANNUAL REPORT 2021 149
disclosures. Throughout the year, specific accounting topics were addressed in-depth, for instance the accounting aspects of the new framework agreement between ASML and ZEISS dated September 21, 2021. In this review, the Audit Committee took note of Management's and the external auditor's assessments on the accounting treatment and concurred with the conclusions. An annual in-depth balance sheet review was also performed.
The operational and financial short- and long-term performance of ASML was discussed extensively, looking at various performance scenarios and their impact on ASML’s results, cash generation, and financing and capital return policies. Particular item of focus in 2021 was the surge in customer demand, the ability of ASML to deliver in order to meet this demand and the potential impact on the financial figures.
The Audit Committee reviewed and provided the Supervisory Board with advice regarding the long-term financial plan, the financing of ASML and ASML’s capital return policy. Specifically discussed were the proposed final dividend payment in respect of the 2020 financial year and the interim dividend for the financial year 2021, which were approved by the Supervisory Board upon recommendation of the Audit Committee. The Audit Committee was kept updated on the progress of the 2020-2022 share buyback program, which was replaced by a new program in July 2021. The Audit Committee also extensively discussed the entering into of the new 2021-2023 share buyback program, thereby taking into consideration ASML's cash position and free cash flow, and provided the Supervisory Board with a positive recommendation with respect to the Board of Management's proposal.
Risk management and internal control
Throughout 2021, the Audit Committee closely monitored risk management and the risk management process, including the timely follow-up of high-priority actions based on quarterly progress updates. The Audit Committee oversaw the annual internal control process. Focus was on scoping, materiality levels, updates to the internal control framework, the tests of design and effectiveness and management's assessment of ASML's internal control over financial reporting and disclosures. The observations made by the Internal Auditor and the External Auditor on the design and effectiveness of internal controls were also discussed with the Audit Committee. We are pleased with the conclusion that ASML's internal control framework was effective in 2021.
Emerging risks related to increasing demand
In 2021, we performed an in-depth review of emerging risks as a result of ASML's growth and ramp-up to meet customer demand, given its potential impact on several risk categories in the risk landscape. We looked in detail into the risks impacted and the mitigating actions identified by management. We paid special attention to the process effectiveness and efficiency risk, with a focus on support processes, not only in view of the challenges related to the significant growth, but also considering the different business models for ASML's products, the IT and process landscape.
Ethics and compliance
We consider acting with the highest standards of integrity of key importance to our value creation for our stakeholders and the long-term success of ASML. The Audit Committee received quarterly reports on the Ethics program, including the trends and risks in the area of ethics and the Ethics training strategy. The Audit Committee was also involved in the revision of ASML's Speak Up & Non-Retaliation Policy. During 2021 we also discussed ASML's compliance program and performed detailed reviews of specific compliance topics such as export control, finance compliance and the country compliance review for South Korea. Furthermore, an annual update on fraud and fraud risk management was provided.
Internal audit
The Audit Committee reviewed the annual internal audit plan, including the scope of the audit at the start of 2021. During the year, the Audit Committee was kept updated on the progress of the internal audit activities on a quarterly basis and reviewed the results of audits performed as well as the status of the follow-up on action plans. The Audit Committee also discussed the internal management letter and monitored the follow-up by the Board of Management on the recommendations made in the internal management letter.
External audit
The Audit Committee reviewed the 2021 external audit plan, including scoping, materiality level and fees. It monitored the progress of the external audit activities, including review of the observations made in the quarterly procedures and the audits performed at year-end. The Audit Committee oversaw the follow-up by the Board of Management on the control deficiencies reported by the External Auditor in their periodic internal control update. The Audit Committee confirms that the communication over the 2021 financial year contained no significant items that need to be mentioned in this report.
The Audit Committee evaluated the performance of the external auditor at the end of 2021, including a review of their independence. The results of the evaluation have led the Audit Committee to recommend to the Supervisory Board to submit to the 2022 AGM a proposal to appoint KPMG as the External Auditor for the reporting year 2023. The Audit Committee reached the decision to do so independently.
Due to the required audit partner rotation, a new lead audit partner became responsible for the ASML audit as of the 2021 reporting year. Much effort has been put into the transition process in anticipation of the change, and the Audit Committee is pleased that the transition has gone smoothly.
In September 2021, the Audit Committee started the selection process in connection with the mandatory external audit firm rotation. Although the current external auditor is only required to rotate off after 2025, the Audit Committee considers it prudent to
ASML ANNUAL REPORT 2021 150
start the selection process early, given the limited number of candidate firms eligible for selection and in view of non-audit services provided by potential candidate audit firms. A Selection Committee was established, consisting of the members of the Audit Committee, the CFO, the EVP Finance and the Corporate Chief Accountant. The Selection Committee met three times in 2021. At the 2022 AGM, we intend to submit a proposal to appoint a new external auditor for the 2025 reporting year. The proposal will contain more detailed information on the process followed.
Other topics
Other topics discussed by the Audit Committee in 2021 were ASML’s tax policy and planning, the Finance and IT transformation program and the quarterly legal matters overviews.
The Audit Committee also performed an annual review and update of its Rules of Procedure.
After most of the Audit Committee meetings, the internal and external auditor each have a session with the Audit Committee without management present to discuss their views on the matters warranting the attention of the Audit Committee. This may include their relationship with the Audit Committee, the relationship with the Board of Management, and any other matters deemed necessary to be discussed. The Audit Committee also held regular one-to-one meetings with the CFO.
Remuneration Committee
The Remuneration Committee advises the Supervisory Board, and prepares the Supervisory Board's resolutions with respect to the remuneration of the Board of Management and the Supervisory Board.
| | | | | |
| Members | Main responsibilities |
•Terri Kelly (Chair); •Annet Aris; •Rolf-Dieter Schwalb; •Hans Stork.
| •Overseeing the development and implementation of the Remuneration Policy for the Board of Management and preparing the Supervisory Board Remuneration Policy; •Reviewing and proposing to the Supervisory Board corporate goals and objectives relevant to the variable part of the Board of Management’s remuneration; •Carrying out scenario analyses of the possible financial outcomes on the variable remuneration of meeting these goals, as well as exceeding these goals, before proposing these corporate goals and objectives to the Supervisory Board for approval; •Evaluating the performance of the members of the Board of Management in view of those goals and objectives, and – based on this evaluation – recommending to the Supervisory Board appropriate compensation levels for the members of the Board of Management. |
| Each member is an independent, non-executive member of our Supervisory Board in accordance with the NASDAQ Listing Rules. Ms. Kelly is neither a former member of our Board of Management, nor a member of the management board of another company. Currently, no member of the Remuneration Committee is a member of the management board of another Dutch listed company. |
Remuneration Committee meetings in 2021
The Remuneration Committee meets at least two times a year and more frequently when deemed necessary. In 2021, the Remuneration Committee held nine meetings. Of these nine meetings, four were regular meeting and five were special meetings, scheduled in connection with the fundamental review of the Remuneration Policy for the Board of Management.
| | | | | | | | | | | |
| Recurring agenda topics | Attendance |
•Remuneration of the Board of Management •Remuneration of the Supervisory Board •Update on performance on targets for short- and long-term incentives | In addition to the Remuneration Committee members, the Remuneration Committee generally invites the CEO, the EVP HR&O, the Head of Compensation and Benefits and in some instances also the CFO to attend (parts of) its meetings. The Remuneration Committee’s external advisor is also invited to attend the Remuneration Committee meetings when deemed necessary. |
The below overview provides details on the topics discussed during Remuneration Committee meetings in 2021.
| | | | | | | | | | | |
Q1 | •Short-term Incentive Plan: performance 2020, pay-out 2020 and targets 2021 •Long-term Incentive Plan: share vesting performance period 2018-2020, and conditional grant and targets performance period 2021-2023 •Remuneration Report 2020 •Self-Evaluation Remuneration Committee •Board of Management Remuneration Policy review •Selection external remuneration adviser | Q2 | •Board of Management Remuneration Policy review
|
| Q3 | •Board of Management Remuneration Policy review including labor market reference group •Feedback BoM on direction of new Remuneration Policy •Share ownership guidelines
| Q4 | •Board of Management Remuneration Policy review •Approach & planning stakeholder outreach •Update Short-term Incentive Plan and Long-term Incentive Plan •Draft Remuneration Report 2021 •Compliance Board of Management members with share ownership guideline •Share planning AGM period 2022-2023 •Engagement of external auditor for agreed upon procedures on remuneration |
ASML ANNUAL REPORT 2021 151
Remuneration Board of Management
In 2021, the Remuneration Committee proposed certain adjustments to be made to the Remuneration Policy for the Board of Management and the Supervisory Board. The adjusted Remuneration Policies were submitted to and adopted by the General Meeting on April 29, 2021.
Starting as of Q2 2021, the Remuneration Committee performed a fundamental review of the Remuneration Policy for the Board of Management. This review had been planned for 2020, but was postponed due to the COVID-19 pandemic. For more information about the fundamental review of the Remuneration Policy for the Board of Management, reference is made to the Remuneration Report, which is also part of this 2021 Annual Report, and to the convocation documents for the 2022 AGM, which we intend to publish in March 2022.
The Remuneration Committee made recommendations to the Supervisory Board concerning the total remuneration package of the Board of Management and the variable remuneration consisting of a short-term incentive in cash and a long-term incentive in shares. The Remuneration Committee proposed 2021 targets for the Board of Management's variable remuneration to the Supervisory Board. During the year, the Remuneration Committee closely monitored the Board of Management's performance. It provided recommendations to the Supervisory Board regarding the achievement of the 2021 targets and related compensation levels for the Board of Management members.
In proposing and evaluating the Board of Management's performance in relation to the corporate goals and objectives for the variable remuneration of the Board of Management members, the Remuneration Committee closely cooperates with the Audit Committee and the Technology Committee.
The Remuneration Committee has taken note of the views of the individual members of the Board of Management with regard to the amount and structure of their remuneration.
The shareholding positions of the Board of Management members were reviewed by the Remuneration Committee in order to assess compliance with the share ownership guideline as included in the Remuneration Policy for the Board of Management.
The Remuneration Committee also prepared the Remuneration Report, which details the remuneration of members of the Supervisory Board and the Board of Management.
Increased transparency around remuneration
At the AGM 2021, we received valuable feedback from shareholders and shareholder interest organizations on the Remuneration Report, in particular how to further improve transparency around remuneration. We have taken this feedback into consideration and as a result, we have implemented several changes in the 2021 Remuneration Report. For example, we now include ex-post disclosure of the target and actual performance levels for the variable remuneration (where this is not contrary to the strategic and/or commercial interests of ASML). Read more in the 2021 Remuneration Report, which is included in this Annual Report.
The Remuneration Committee engaged the external auditor to perform certain agreed-upon procedures with respect to the execution of the Remuneration Policy for the Board of Management.
Remuneration Supervisory Board
In Q1 2021, the Remuneration Committee finalized its benchmark review of the Supervisory Board's remuneration. This led to some adjustments to the Supervisory Board and Committees membership fees. The revised Remuneration Policy for the Supervisory Board incorporating these adjustments was submitted to and adopted by the General Meeting on April 29, 2021.
For further details, see Supervisory Board - Remuneration report.
ASML ANNUAL REPORT 2021 152
Selection and Nomination Committee
The Selection and Nomination Committee assists the Supervisory Board in relation to its responsibilities over the composition and functioning of the Supervisory Board and the Board of Management and to the monitoring of corporate governance developments.
| | | | | |
| Members | Main responsibilities |
•Gerard Kleisterlee (Chair) •Annet Aris •Mark Durcan •Terri Kelly | •The preparation of the selection criteria and appointment procedures for members of the Supervisory Board and Board of Management, and the supervision of the Board of Management's policy in relation to the selection and appointment criteria for senior management; •The periodical evaluation of the scope and composition of the Board of Management and the Supervisory Board, and proposing the profile of the Supervisory Board; •The periodical evaluation of the functioning of the Board of Management and the Supervisory Board, and their individual members. •The preparation of the Supervisory Board’s decisions for appointing and reappointing members of the Board of Management and proposing (re)appointments of members of the Supervisory Board •Monitoring and discussing developments in corporate governance. |
| Each member is an independent, non-executive member of our Supervisory Board in accordance with the NASDAQ Listing Rules. |
Selection and Nomination Committee meetings
The Selection and Nomination Committee meets at least two times a year and more frequently when deemed necessary. In 2021, the Selection and Nomination Committee held nine meetings.
| | | | | | | | | | | |
| Recurring agenda topics | Attendance |
•Role, composition, functioning Board of Management •Role, composition, functioning Supervisory Board •Corporate governance
| Besides the Selection and Nomination Committee members, the two Presidents and the EVP HRO are regularly invited to attend (parts of) its meetings. An external advisors is also invited to attend the Selection and Nomination Committee meetings when deemed necessary. |
The below overview provides details on the topics discussed during Remuneration Committee meetings in 2021.
| | | | | | | | | | | |
1st Half Year | •Composition Board of Management, including diversity aspects, and succession pipeline •Composition Supervisory Board, incl. succession and composition of committees per 2021 •Changes in composition Supervisory Board per 2022 and 2023 AGM and nominations for appointment of Supervisory Board members •Induction program for new appointed Supervisory board member •Evaluation Supervisory Board and committees | 2nd Half Year | •Future composition Board of Management, incl. diversity requirements, and succession pipeline •Composition Board of Management per 2022 AGM •Changes in composition Supervisory Board per 2022 and 2023 AGM and nomination for appointment of Supervisory Board members •Composition of the Supervisory Board committees per 2022 AGM •Evaluation of the Supervisory Board and committees •Corporate Governance update: Dutch gender diversity bill •Composition Board of Directors Preference Shares Foundation per January 1, 2022 |
Composition, role and responsibilities Board of Management
In 2021, the Selection and Nomination Committee spent ample time to discuss the future composition, role and responsibilities of the Board of Management, e.g. reviewing the talent bench, discussing career development of top talent to prepare for future Board of Management roles. The committee also assessed the functioning of the Board of Management and its individual members. For this purpose, the Chair held meetings with each individual Board of Management member, the outcome of which was discussed with the Committee.
Frits van Hout retired as member of ASML's Board of Management upon completion of his appointment term, which ended per the 2021 AGM. ASML did not appoint a successor to Frits van Hout. As a result, the Board of Management consists of five members effective per the 2021 AGM. Frits van Hout's responsibilities have been taken over by the remaining Board of Management members, securing the uninterrupted execution of ASML’s strategy to reach its stated targets for stakeholders.
Per the 2022 AGM the appointment terms of Messrs. Wennink, Van den Brink, Dassen, Fouquet and Schneider-Maunoury will expire. In light of this, the Selection and Nomination Committee and the Supervisory Board are extensively discussing the potential extension of the appointment terms effective per the 2022 AGM, both among themselves as well as with the individual Board of Management members.
Composition, role and responsibilities Supervisory Board
The Selection and Nomination Committee extensively discussed the composition of the Supervisory Board.
A significant amount of time was spent discussing the Supervisory Board's profile and rotation schedule, particularly the appointment and reappointment of Supervisory Board members to fill vacancies both in the short and longer term. This resulted in
ASML ANNUAL REPORT 2021 153
the recommendation to the Supervisory Board to nominate Birgit Conix as member of the Supervisory Board effective per the 2021 AGM.
The Selection and Nomination Committee also discussed the composition of the Supervisory Board committees in light of the retirements and new appointment and proposed several changes which took effect per the 2021 AGM.
Changes to Supervisory Board Committees in 2021
On recommendation of the Selection and Nomination Committee, the Supervisory Board decided to implement several changes in the composition of its committees in 2021. Rolf-Dieter Schwalb became the Chair of the Audit Committee after the retirement of Carla Smits-Nusteling and Birgit Conix became an Audit Committee member. Terri Kelly took over the Remuneration Committee chairmanship and Annet Aris joined the Remuneration Committee as a regular member. Mark Durcan was appointed Chair of the Technology Committee, succeeding Douglas Grose upon his retirement. Mark Durcan and Terri Kelly joined the Selection and Nomination Committee after Douglas Grose retired. Finally, Annet Aris was appointed Vice Chair of the Supervisory Board.
The Selection and Nomination Committee also discussed the changes to its composition effective per the 2022 AGM and advised the Supervisory Board on the nomination for appointment of a successor to Hans Stork, who will retire after having served eight years on our Supervisory Board. For further details, see Supervisory Board - Supervisory Board report - Composition.
At the end of 2021 and early 2022, the Selection and Nomination Committee discussed the functioning of the individual members of the Supervisory Board as well as the process and outcome of the Supervisory Board’s self-evaluation. For further details on the self-evaluation, see Supervisory Board - Supervisory Board report - Evaluation.
Corporate governance
As part of its responsibility to monitor corporate governance developments, the Selection and Nomination Committee discussed, among other things, the developments with regard to the Dutch gender diversity bill that was adopted by Dutch Parliament on September 28, 2021 and its impact on ASML. The focus items of investors and shareholder interest organizations were also discussed.
Technology Committee
The Technology Committee advises the Supervisory Board with respect to our technology plans required to execute our business strategy.
| | | | | |
| Members | Main responsibilities |
•Mark Durcan (Chair) •Annet Aris •Gerard Kleisterlee •Hans Stork
| •Advising on technology trends, the study of potential alternative strategies, the technology strategy, product roadmaps, required technical resources and operational performance in R&D; •Making recommendations to the Supervisory Board on technology-related projects with respect to ASML’s competitive position; •Discussing the technology targets set to measure short- and long-term performance as well as the achievements related to these, and advising the Remuneration Committee on this topic. |
| The Technology Committee is supported by external experts and as experts from within ASML who act as advisers on the subjects reviewed and discussed by this committee. External experts may include representatives of customers, suppliers and partners to increase the committee’s understanding of the technology and research required to develop our leading-edge systems. |
Technology Committee meetings in 2021
In general, the Technology Committee meets at least two times a year and more frequently when deemed necessary. In 2021, the Technology Committee held five meetings.
| | | | | | | | | | | |
| Recurring agenda items | Attendance |
•Product Roadmap •Progress Technology Leadership Index | Besides the Technology Committee members, the committee's external and internal advisors regularly attended committee meetings. The advisers do not have voting rights. |
In addition to the recurring agenda items, the Technology Committee also reviewed and discussed other matters in 2021. Below table provides an overview of these topics.
| | | | | | | | | | | |
Q1 | •Business Line review: Applications •Review self-Evaluation Technology Committee | Q2 | •Business Line review: EUV (including High-NA)
|
| Q3 | •Business Line review: DUV •Future of Moore's Law •Roadmap in Logic and memory | Q4 | •Status of the roadmap and challenges in EUV (including High-NA) •Status of the roadmap and challenges in DUV •Mid- / Long-term roadmap and technology outlook
|
Review of technology programs
In 2021, the Technology Committee primarily focused on the review of the execution and implementation of technology programs and roadmaps in EUV 0.55 NA (High-NA), EUV 0.33 NA, DUV and Applications. In this respect the key challenges and opportunities
ASML ANNUAL REPORT 2021 154
both from a business perspective as well as from a technology standpoint were reviewed and discussed in depth. During each meeting the Technology Committee also discussed the progress made on the technology targets included in the Technology Leadership Index, a performance measure for the short-term and long-term variable remuneration of the Board of Management. In a meeting especially planned for this purpose, the Technology Committee discussed the final achievements on the technology targets and the technology targets for the new performance period. The Technology Committee subsequently provided advice to the Remuneration Committee and the Supervisory Board.
The meeting in Q1 was dedicated to the achievements within the business line Applications. The Technology Committee was informed on the outlook toward 2026, the market developments, competitive landscape and the opportunities in that respect. In addition, updates were provided with respect to the computational lithography, optical metrology, e-beam metrology and control and data products. In this meeting the Technology Committee also discussed the outcome of the external evaluation of the functioning of the Technology Committee.
In Q2, the achievements and challenges in EUV 0.33 NA and EUV 0.55 NA (High-NA) were discussed. Special attention was paid to market developments and performance in EUV 0.33 NA as well as the product and power roadmap. On High-NA the Technology Committee was informed on the interest and engagement of customers for High-NA, the status of the shipment plan and the value proposition. During this meeting there was a live connection where the Technology Committee was provided with a virtual tour of the ASML production facilities in Wilton and San Diego. Next to that ZEISS also provided a virtual tour of its facilities in Oberkochen, Germany.
The primary focus of the Q3 meeting of the Technology Committee were the developments and achievements in DUV. Next to the product roadmaps and the technology programs, the Technology Committee discussed the possibilities to ramp-up capacity at ASML and its supply chain to meet customer demand, the continuation of innovation to support the roadmap and economics of our customers and the drive for efficiency and quality. Furthermore, external speakers from imec were invited to inform the Technology Committee on their view on the future of Moore’s law and the roadmaps for logic and memory.
In Q4, the Technology Committee focused on the status of the roadmaps and the challenges relating to EUV 0.55 NA (High-NA), EUV 0.33 NA and DUV. Furthermore the Technology Committee also looked ahead to the mid- and long-term roadmap and the technology outlook. The Q4 Technology Committee meeting was partly attended by representatives from ZEISS management to discuss the cooperation and common challenges related to the product and technology roadmaps.
Technology Committee visit to ZEISS
The Q4 Technology Committee meeting was held at ZEISS in Oberkochen, Germany. During the visit, the Technology Committee and a delegation from ZEISS discussed the cooperation between the two companies, also in light of the new framework agreement concluded in 2021. They also discussed the status of the various product roadmaps and related challenges. The Technology Committee also visited the ZEISS manufacturing facility to witness the great achievements made in preparing for the assembly of the first EUV 0.55 NA system.
The Technology Committee’s in-depth technology discussions and the subsequent reporting on the main points of these discussions in the full Supervisory Board increases the Supervisory Board’s understanding of our technology requirements. It also enables the Supervisory Board to adequately supervise the strategic choices we face, including our investment in R&D.
ASML ANNUAL REPORT 2021 155
Financial Statements and Profit Allocation
The financial statements of ASML for the financial year 2021, as prepared by the Board of Management, have been audited by KPMG Accountants N.V. All members of the Board of Management and the Supervisory Board have signed these financial statements.
We recommend to shareholders that they adopt the 2021 financial statements. We also recommend that our shareholders adopt the Board of Management's proposal to make a final dividend payment of €3.70 per ordinary share, which together with the interim dividend of €1.80 per ordinary share, leads to a total dividend of €5.50 per ordinary share in respect of the 2021 financial year.
Finally, we would like to extend a word of thanks to the Board of Management and all ASML employees for their continued commitment and hard work during this challenging year.
The Supervisory Board,
Gerard Kleisterlee, Chair
Annet Aris, Vice Chair
Birgit Conix
Marc Durcan
Warren East
Terri Kelly
Rolf-Dieter Schwalb
Hans Stork
Veldhoven, February 9, 2022
ASML ANNUAL REPORT 2021 156
Message from the Chair of the Remuneration Committee
Terri Kelly (Chair of the Remuneration Committee)
Dear Stakeholder,
On behalf of the Remuneration Committee I am pleased to present the 2021 Remuneration Report, providing a summary of the remuneration policies for the Board of Management and the Supervisory Board and an explanation about how they were applied in 2021.
To maintain its fast pace of innovation and ensure long-term success as a company, ASML needs to attract and retain the best talent. Remuneration is an important, but not the sole factor here – I strongly believe that people are motivated for other reasons beyond that as well. We have a great story with the global impact of ASML still growing, and it can also be very rewarding to work together at the cutting edge of technology with highly talented colleagues – we offer a work culture that enables people to develop their talent, feel respected and work to the best of their abilities.
A lot of great work has been done in rolling out ASML’s cultural values and making them more explicit. While striving to keep a fine balance between protecting our competitive position and providing transparency, we are continually looking for opportunities to get these values reinforced in how we reward our leaders and the broader organization, to drive long-term success for ASML.
Summary of 2021 performance
Looking back on 2021, which by all accounts was not an easy year due to the many constraints caused by the COVID-19 pandemic, we are pleased to see ASML has had an outstanding performance in a very dynamic environment. Strong growth in semiconductor end markets and increasing lithography intensity to address the need for more wafer output led to huge demand for ASML’s products and services. To meet current and future customer demand, ASML and its supply chain partners are actively adding and improving capacity. In addition, stepping up in hiring and retaining ASML’s workforce in the current competitive market has become increasingly challenging. Overall, starting from high standards, ASML’s leadership set ambitious targets and was able to resolve and respond to many challenges. The Supervisory Board is very supportive of ASML’s long-term strategy and proud of what the Board of Management and the entire organization have achieved.
Changes in the Remuneration Committee in 2021
In 2021, Annet Aris became a member of the Remuneration Committee, and I feel honored about taking over the chair role from Rolf-Dieter Schwalb after the 2021 AGM. The Remuneration Committee’s composition provides a proper balance with very different views, both from a geographical and historical perspective. For me, it is a great opportunity to come in at a time that we are taking a deep dive in revisiting our Remuneration Policy for the Board of Management, to assess what is working well and to see where we can still improve. We also rely upon external experts to help us understand best practices with other peer organizations, as well as changing expectations from our many constituents.
Decisions made in 2021
In the first quarter of 2021, we finalized the review of the Remuneration Policies for the Board of Management and the Supervisory Board. Based on the results of the bi-annual review of the labor market reference group and the remuneration benchmark performed during 2020, the Supervisory Board concluded that it was appropriate to slightly adjust the Remuneration Policy for the Board of Management to maintain competitive remuneration levels in relation to a reference market in which ASML had considerably grown again in size and complexity. The revision of the Remuneration Policy for the Supervisory Board entailed an
ASML ANNUAL REPORT 2021 157
amendment of the Supervisory Board and Committees' membership fees in order to remain competitive and continue to be able to attract and retain qualified Supervisory Board members. Both policies were submitted to the 2021 AGM and were adopted with over 90% support.
Toward more transparency about our Remuneration Policy
In 2021, we had many interactions with governance organizations, proxy advisors, individual shareholders and ASML's Works Council. These interactions related to the revision of the Remuneration Policies for the Board of Management and the Supervisory Board as already referred to above, and to the 2020 Remuneration Report.
The discussions concerned three topics: i) the level of transparency around target setting and actual achievements; ii) a discretionary adjustment to the ROAIC score as part of the overall achievement score on the long-term incentive; and iii) the performance metric related to sustainability. Finally, views were exchanged with our stakeholders on the Remuneration Policy for the Board of Management in general, the link between remuneration and company strategy and performance, the structure of remuneration and the performance metrics for the short- and long-term incentives.
The discussions were very constructive and we received valuable feedback and suggestions on how the level of transparency in the Remuneration Report could be further improved. This feedback has been taken into account in this Remuneration Report. Stakeholder feedback has also been taken into account in the fundamental review of the Remuneration Policy for the Board of Management, which started in Q2 2021. The sustainability-related performance metric was extensively discussed in this context, in particular its weight and how to best define the performance measure and link it to ASML's ESG strategy, which was amended during 2021.
Looking ahead to 2022
Starting in Q2 2021, the Remuneration Committee performed a fundamental review of the Remuneration Policy for the Board of Management – this review had been planned for 2020, but was postponed due to the COVID-19 pandemic. Important focus points in the review were the remuneration structure and elements, as well as the labor market reference group. We considered a fundamental review appropriate, as the prior structural revision of the policy took place in 2017 and since that time only minor revisions were implemented by adjusting compensation levels (mainly STI and LTI) to remain competitive. After five years, it was time to do a more fundamental review to see if the policy optimally supports the strategic direction of the company. It was also a moment to review current market practice, societal trends and expectations, and developments in corporate governance. Based on the outcome of this fundamental review, we intend to submit a proposal for a revised Remuneration Policy for the Board of Management to the AGM in 2022. The main changes relate to a revised labor market reference group and remuneration structure, as well as adjusted STI and LTI performance metrics.
During the fundamental review of the Remuneration Policy for the Board of Management, we have had continued dialogue with the Board of Management to gain their perspective and feedback. Strong collaboration between the Remuneration Committee and ASML’s leadership is top of mind for us, to establish confidence that we are measuring the things that matter, that we are comparing ourselves to the right companies, and that we are setting ambitious, but realistic goals.
We are also in dialogue with the Works Council as well as with governance organizations, proxy advisors and our major shareholders on the envisaged changes to the Remuneration Policy for the Board of Management. More information on these stakeholder engagements will be included in the convocation documents for the 2022 AGM.
For the fundamental review of the Remuneration Policy for the Board of Management we engaged an external remuneration expert, bringing in a fresh pair of eyes to challenge us and share with us their experience in the field of managing people, risk and capital.
The full proposal for the revised Remuneration Policy for the Board of Management will be included in the convocation documents for the 2022 AGM, which are expected to be published in March 2022.
A fundamental review of the Remuneration Policy for the Supervisory Board has not taken place, since the Supervisory Board Remuneration Policy is relatively new, introduced in 2020 based on new legal requirements.
I would like to thank our shareholders and other stakeholders for their engagement and for sharing their views on executive remuneration. We welcome feedback from our stakeholders on this 2021 Remuneration Report, which will be submitted to the shareholders on April 29, 2022 for an advisory vote. Furthermore, we hope for that our shareholders will support the 2022 Remuneration Policy for the Board of Management which we intend to submit for adoption at our 2022 AGM.
Terri Kelly
Chair of the Remuneration Committee
ASML ANNUAL REPORT 2021 158
Board of Management remuneration
In this section of the Remuneration Report we provide an overview of the 2021 Remuneration Policy for the Board of Management which was adopted by the General Meeting on April 29, 2021 and applied as of January 1, 2021. It also contains information about the execution of the 2021 Remuneration Policy for the Board of Management as well as the details of the Board of Management members' actual remuneration for the financial year 2021. The 2021 Remuneration Policy for the Board of Management can be found in the governance section of our website.
Remuneration Policy
Remuneration as a strategic instrument
The 2021 Remuneration Policy for the Board of Management supports the long-term development and strategy of ASML in a highly dynamic environment, while aiming to fulfill all stakeholders’ requirements and maintaining an acceptable risk profile. More than ever, the challenge for ASML is to drive technology, to serve its customers and to satisfy its stakeholders. These drivers are embedded in the identity, mission and values of ASML and its affiliated enterprises and are the backbone of the policy. The Supervisory Board ensures that the policy and its implementation are linked to ASML's objectives.
The 2021 Remuneration Policy for the Board of Management is designed to enable ASML to attract, motivate and retain qualified industry professionals for the Board of Management in order to define and achieve our strategic goals. The policy acknowledges the internal and external context as well as our business needs and long-term strategy. The policy encourages behavior that is focused on long-term value creation and the long-term interests and sustainability of ASML, while adopting the highest standards of good corporate governance. It is aimed at motivating for outstanding achievements, using a combination of non-financial and financial performance measures. Technology leadership, customer value creation and employee engagement are the key drivers of sustainable returns to our shareholders.
Remuneration principles
The remuneration philosophy that ASML applies for all its employees includes the principle that ASML wants to be competitive in its relevant labor markets and pay what is fair in such markets, while maintaining internal consistency in reflecting differences in size and complexity of individual jobs. The Supervisory Board applies the same principle for the Board of Management of ASML and in doing so takes the pay and employment conditions for the ASML employees into account when formulating the remuneration policy.
The 2021 Remuneration Policy for the Board of Management is built on the following principles:
•Transparent – The policy and its execution are clear and practical;
•Aligned – The policy is aligned with the Short-term Incentive and/or Long-Term Incentive policy for ASML senior management and other ASML employees;
•Long-term – The incentives focus on long-term value creation;
•Compliant – ASML adopts the highest standards of good corporate governance; and
•Simple – The policy and its execution are as simple as possible and easily understandable to all stakeholders.
Reference group and market positioning
Similar to the remuneration philosophy for all ASML employees, we offer the Board of Management a remuneration package that is competitive compared to a relevant labor market. This market is defined by creating a reference group of companies comparable to
ASML ANNUAL REPORT 2021 159
ASML in terms of size and complexity, data transparency and geographical area. The median market level serves as reference point for determining the level of pay for the Board of Management for as long as ASML is positioned around the median of the reference group in terms of company size (measured by enterprise value, revenue and number of employees) and thus complexity.
In principle, a benchmark is conducted every two years. To ensure an appropriate composition of the relevant labor market, the Supervisory Board reviews the composition of the reference group at the time a benchmark is conducted. Substantial changes applied to the composition of the reference group will be proposed to the shareholders. In the year without a market assessment, the Supervisory Board considers the appropriateness of any change of base salary in light of the market environment as well as the salary adjustments for other ASML employees.
In 2020 we reviewed the reference group and performed a remuneration benchmark. The reference group (consisting of twenty companies) had not changed since 2018, while ASML grew considerably. The outcome of the 2020 review of the reference group was that, as a result of ASML's growth, one reference company, Smith & Nephew PLC, became too small compared to ASML and was therefore removed. Two other companies, Shire PLC and Linde AG, were removed because they were acquired by or merged with companies outside Europe and therefore no longer qualified as reference companies due to geography. To keep the size of the reference group more or less equal, two new companies were added to the reference group: NXP Semiconductors, which is an industry peer of ASML, and Ericsson, which is on average larger than ASML and therefore brings ASML closer to the median of the reference group in terms of size. In the revised reference group, ASML ends up slightly above the median (55th percentile) in terms of size (based on 2019 data). The 2020 review of the reference group and corresponding benchmark were the basis for the adjustments in the 2021 Remuneration Policy for the Board of Management.
| | | | | |
| Current reference group composition | |
| AkzoNobel | Legrand |
| Alstom | Leonardo-Finmeccanica |
| Continental | Nokia |
| Covestro | NXP Semiconductors |
| DSM | Philips |
| Ericsson | SAP |
| Essilux (formerly Essilor) | Schindler |
| Evonik | Solvay |
| Givaudan | Yara International |
| Infineon Technologies | |
| |
Total direct compensation
The remuneration levels are determined using the total direct compensation. Total direct compensation consists of a fixed base salary and variable remuneration in the form of a short-term incentive (STI) and a long-term incentive (LTI). Other remuneration elements are pension and expense reimbursements.
Variable compensation
The performance parameters are set by the Supervisory Board and consist of financial and qualitative measures in such a way that an optimal balance is achieved between the various corporate objectives, both in the short term and the long term. By doing so, it is ensured that the variable compensation contributes to the strategy, long-term interests and sustainability of ASML. The Supervisory Board may adjust the performance measures and their relative weighting of the variable income based on the rules and principles as outlined in the 2021 Remuneration Policy for the Board of Management, if required by changed strategic priorities in any given year. The Supervisory Board may use its discretionary power to adjust the incentive pay-out upward or downward (‘ultimum remedium’).
As part of the revision of the Remuneration Policy for the Board of Management as approved at the 2021 AGM, total direct compensation at target was adjusted so that it was closer to the median total direct compensation level of the revised reference group. This was done by increasing the at-target level of the long-term incentive from 110% (Presidents) or 100% (other Board of Management members) to 120% for all Board of Management members.
The following table represents the variable pay as percentage of base salary for the Board of Management in the case of on-target performance.
| | | | | |
| Variable compensation | Variable pay as % of base salary |
| Short-term incentive | 80 | % |
| Long-term incentive | 120 | % |
| Total | 200 | % |
ASML ANNUAL REPORT 2021 160
Summary of 2021 Remuneration Policy Board of Management
The elements of the 2021 Remuneration Policy for the Board of Management and their link to the strategy of ASML are summarized below.
ASML ANNUAL REPORT 2021 161
Remuneration Board of Management in 2021
The remuneration of the Board of Management for the financial year 2021 is an implementation of and complies with the 2021 Remuneration Policy for the Board of Management as further explained below. As such, the remuneration of the Board of Management in 2021 contributed to the objectives of the 2021 Remuneration Policy for the Board of Management and, as a result, to ASML's strategy aimed at long-term value creation. Scenario analyses of the possible outcomes of the variable remuneration components and their effect on the remuneration of the Board of Management are conducted.
Base Salary
The base salaries of the members of the Board of Management were set at the beginning of 2021. The Supervisory Board decided not to apply a base salary increase for 2021 compared to 2020 levels. The reason to keep base salary levels unchanged, was the 2021 revision of the Remuneration Policy, which included an increase of the at-target level of the long-term incentive, thereby increasing total direct compensation. For 2021 base salary levels, reference is made to section Total remuneration Board of Management.
Short-Term Incentive
The financial and non-financial target levels for the STI were set at the beginning of the 2021 financial year in accordance with the 2021 Remuneration Policy for the Board of Management and taking into account the annual plan (forecast) for 2021.
For the STI, the following qualitative performance metrics applied in 2021:
•Market Position, measuring ASML’s performance in the market, not only in terms of market share, but also customer satisfaction and quality. The Market Position metric consisted of several sub-metrics. For the Applications and DUV business, market share targets were set. These targets related to certain segments of the Applications and DUV markets where ASML faces intense competition. For EUV, no market share target was set, given that ASML is the sole supplier of EUV technology. Instead, a target related to the availability of the NXE:3400 tool was used, as availability is a key metric reflecting the quality of the performance of our tools at the customer site, and as such the Supervisory Board considered it an appropriate metric to measure customer satisfaction. Overall customer satisfaction was also part of the Market Position metric and was measured using an external benchmark: the VLSI Survey. The Applications and DUV market share metrics and the EUV availability metric together accounted for 50% of the total weighting of the Market Position metric. The VLSI survey result accounted for the remaining 50% of the Market Position target.
•Technology Leadership Index, a set of internal targets related to ASML's product and technology roadmaps. As such, it measures the technological progress made by ASML over the relevant performance period, supporting our efforts to drive innovation and thereby helping our customers achieve their goals and realize new technology and applications. The Technology Leadership Index for 2021 consisted of a list of 17 key projects in Applications, DUV and EUV. These projects are for example related to improvements in inspection and metrology systems, manufacturing capacity expressed in wafers per day, component commonality to decrease costs, the power of the (EUV) light source, etcetera. Exact details of the key projects included in the Technology Leadership Index are not disclosed, given that this would be detrimental to the Company and its stakeholders from a competitive and strategic point of view. To calculate the Technology Leadership Index performance, each project is scored between 1 and 10; the overall Technology Leadership Index score is the average of the 17 individual scores. Both the STI and LTI make use of the Technology Leadership Index as a qualitative performance measure. The objectives are the same for both, but the applicable measures, targets and performance periods are different and aligned with specific short- and long-term strategic priorities.
In addition to the Technology Leadership Index and Market Position performance metrics, three financial performance metrics were selected for the 2021 STI. Based on ASML's business challenges and circumstances in 2021, the Supervisory Board chose the following three financial measures from the pre-defined list as included in the 2021 Remuneration Policy for the Board of Management:
•EBIT Margin %, measuring Income from operations as percentage of Total net sales
•EUV Gross Margin %, measuring Gross Profit as a percentage of Total net sales for EUV
•Free Cash Flow, measuring Cash Flow from Operating Activities minus purchase of property, plant and equipment and Purchase of intangible assets.
After the end of the performance period, the Supervisory Board assessed the performance achieved against the targets, in cooperation with the relevant subcommittees Technology Committee, Audit Committee and Remuneration Committee. The target and actual achievement levels for the STI performance criteria are set out in the table below, except for figures which qualify as commercially or strategically sensitive information, being the figures related to availability and market share related elements of the Market Position metric. The Supervisory Board considers disclosure of this information not to be in the interest of ASML and its stakeholders. In view of transparency, we report performance for these metrics as percentage of target.
ASML ANNUAL REPORT 2021 162
| | | | | | | | | | | | | | | | | | | | |
| Performance metric | Performance Targets2 | Actual Outcome | Payout4 |
| Weight | Threshold | Target | Stretch | | % target |
| Market Position | | | | | | |
| Availability & market share | 10 | % | * | | 122.5 | % |
| VLSI Survey | 10 | % | Top 5 | Top 3 | Top 2 | Top 2 | 150.0 | % |
| Total Market Position | 20 | % | | | 136.3 | % |
| | | | | | | |
| Technology Leadership Index | 20 | % | 4 | | 6 | | 10 | | 8 | | 125.0 | % |
| | | | | | | |
EBIT Margin (%) 3 | 20 | % | 24 | % | 27 | % | 30 | % | 36 | % | 150.0 | % |
| | | | | | | |
| EUV Gross Margin % | 20 | % | 43.5 | % | 45.5 | % | 47.5 | % | 46.0 | % | 111.3 | % |
| | | | | | | |
Free Cash Flow (€, in millions) 1 | 20 | % | 1,000 | | 2,000 | | 3,000 | | 8,158 | | 150.0 | % |
| | | | | | | |
| Total | 100 | % | | | | | 134.5 | % |
1.Free Cash Flow target levels and actuals are excluding early payments received in this financial year from clients without a contractual payment obligation in 2021. Actual Outcome Free Cash Flow (Non-GAAP measure) is calculated as Cash Flow from Operating Activities of €10,846 million minus Purchase of property, plant and equipment of €901 million, minus purchases of Intangible assets of €39.6 million and minus early payments received in this financial year from clients without a contractual payment obligation in 2021 of €1,747 million resulting in an Actual Outcome of €8,158 million.
2.Certain performance targets (*) are not disclosed due to strategic or commercial sensitivity.
3.Actual Outcome EBIT Margin % (Non-GAAP measure), is calculated as Income from Operations of €6,750 million divided by Total net sales of €18,611 million resulting in an Actual Outcome of 36%.
4.The Payout % is based on the payout levels as included in the section Summary of 2021 Remuneration Policy Board of Management.
The total STI outcome for current Board of Management results in a cash pay-out of €4.4 million, representing a payout as % of target of 134.5%.
The Actual Performance outcome for EBIT Margin of 36% is mainly driven by an increase in sales and profitability. Profitability increased for our EUV and DUV immersion systems, as we deliver more value to our customers. The improved profitability in our installed base business is through a ramp in production and economies of scale.
The Actual Performance outcome for Free Cash Flow of €8,158 million is mainly driven by strong Net cash provided by operating activities due to the increase in Net income and increase in down payments from our customers.
Long-Term Incentive
For the LTI, the following performance metrics apply, in accordance with the 2021 Remuneration Policy for the Board of Management:
•Total shareholder return vs. Index, measuring ASML's relative change in share price, plus dividends paid over the relevant performance period. ASML's total shareholder return is compared to the PHLX Semiconductor Sector Index, a NASDAQ index designed to track the performance of a set of companies engaged in the design, distribution, manufacture, and sale of semiconductors.
•Return on Average Invested Capital (ROAIC), measuring ASML’s rate of return on capital it has put to work, regardless of our capital structure. It is used as a fundamental metric to measure value creation of the company. The ROAIC is calculated by dividing the Income after income taxes by the Average Invested Capital.
•Technology Leadership Index, a qualitative measure which is also applied for the STI. For the definition of the Technology Leadership Index and an explanation of how it contributes to the corporate strategy, reference is made to the section Short-Term Incentive. The Technology Leadership Index as metric for the LTI is more forward looking than its STI equivalent. It consists of targets to be achieved three years ahead, two years ahead, and in the coming year. Each year, new targets are defined for the period three years ahead. The targets for two years ahead are based on the prior year targets (that were three years ahead at that moment) and a correction factor on the score (up or down) depending on whether targets appeared to be easier or more difficult to achieve. The same approach is utilized for the subsequent years. The total score for the Technology Leadership Index over the three-year performance period is the average of the scores over the three years, including the relevant correction factors applied on each year's score.
•Sustainability, a qualitative measure for determining our performance in the area of sustainability by benchmarking our result from the annual comprehensive Dow Jones Sustainability Index (DJSI) against the best of the semiconductor industry. This DJSI Assessment is a comprehensive assessment measuring our performance on more than 20 ESG aspects. It allows us to benchmark our company performance in the wider field of ESG with our industry peers and drive continuous improvement. Underlying is our Sustainability Strategy 2019-2025 containing a set of 16 KPIs and targets, which we define by means of a comprehensive materiality assessment and input from continuous stakeholder engagement. Read more in: Non-financial statements - Materiality assessment.
ASML ANNUAL REPORT 2021 163
Vesting LTI 2019-2021
After the end of the three-year performance period 2019-2021, the Supervisory Board assessed the performance achieved against the LTI targets, in cooperation with the Technology Committee, Audit Committee and Remuneration Committee. The target and actual achievement levels for the LTI performance criteria are set out in the table below.
The Supervisory Board applied an adjustment for the pay-out related to the ROAIC performance metric of the 2019-2021 LTI plan, in order to bring the performance metric in line with the metric in use for the 2021-2023 plan and the previously adjusted 2018-2020 plan. The adjustment resulted in a payout of 193.3% for the performance metric ROAIC compared to Stretch performance (200%) on an unadjusted basis, and was therefore unfavorable for the outcome under the 2019-2021 LTI plan. This adjustment has no incremental accounting impact since expenses are recognized based on the maximum Stretch performance.
The target and achievement levels for the 2019-2021 LTI performance criteria are set out in the table below.
| | | | | | | | | | | | | | | | | | | | | | | | | | |
| Performance metric | Performance Targets | Actual Performance | Payout %2 | |
| Weight | Threshold | Target | Exceed | Stretch | | | |
| Relative TSR | 30 | % | (20) | % | 0 | % | n/a | 20 | % | 161.1 | % | 200.0 | % | |
ROAIC 1 | 40 | % | 27.0 | % | 29.5 | % | 32.0 | % | 34.5 | % | 34.2 | % | 193.3 | % | |
| Technology Leadership Index | 20 | % | 4 | 6 | 8 | 10 | 8.3 | 157.5 | % | |
| Sustainability | 10 | % | ≤ 16% | ≤ 13% | n/a | ≤ 7% | 12.1 | % | 115.2 | % | |
| | | | | | | | | |
| Total | 100 | % | | | | | | 180.3 | % | 3 |
1.Actual Performance score ROAIC of 34.2% is the Normalized score. ROAIC is calculated by dividing the Income after income taxes by the Average Invested Capital.
2.The Payout % is based on the payout levels as included in the section Summary of 2021 Remuneration Policy Board of Management.
3.Total Actual Performance score of 180.3% is based on weighting of individual performance metrics multiplied with the payout %.
The total LTI outcome results in a share vesting of 180.3% of target.
Grant 2021
At the beginning of 2021, 28,354 performance shares were conditionally granted to the current members of the Board of Management for the 2021 performance plan. These conditional grants are based on the maximum achievable opportunity.
The targets levels related to the LTI performance measures ROAIC, Technology Leadership Index and Sustainability were set at the beginning of 2021 for the performance period 2021-2023. This was done taking into account the long-term product roadmap, sustainability goals and the long-term financial plan, thereby ensuring alignment between the various targets and ASML’s long-term strategic priorities and encouraging behavior focused on long-term value creation.
Other remuneration
In 2021, the Board of Management members participated in the pension arrangement for the Board of Management, which is based on the ‘excedent’ (supplementary) arrangement for our employees in the Netherlands, a defined contribution opportunity as defined in Dutch fiscal regulations. It consists of a gross pension element (for the salary below approximately EUR 112,000) and a net pension element (for the salary above EUR 112,000). Some members opted out of the net pension due to different tax treatment of this outside the Netherlands. Details on the incurred accounting expenses relating to the application of the pension arrangement in 2021 can be found in the table Total Remuneration Board of Management.
Expenses reimbursed by ASML in 2021 included company car costs, representation allowances, social security costs, and health and disability insurance costs.
Share ownership guidelines
The table below shows the share ownership requirement, number of outstanding vested shares and share ownership ratio of each Board of Management member as per December 31, 2021.
| | | | | | | | | | | | | | |
| BoM Member | Ownership requirement | 2021 base salary in € thousands | Total vested shares | Ownership ratio1 |
| P.T.F.M. Wennink | 3x base | 1,020 | | 32,485 | | 22.51 | |
| M.A. van den Brink | 3x base | 1,020 | | 13,066 | | 9.05 | |
| F.J.M Schneider-Maunoury | 2x base | 694 | | 17,506 | | 17.83 | |
R.J.M. Dassen 2 | 2x base | 694 | | 1,613 | | 1.64 | |
| C.D. Fouquet | 2x base | 694 | | 3,488 | | 3.55 | |
1.The Ownership ratio is calculated by multiplying the total vested shares with the share price of €706.70 (based on the closing share price of December 31, 2021) and dividing this by the base salary.
2.The Ownership ratio of RJ.M. Dassen as per December 31, 2021 is lower than the internal Ownership requirement. The Remuneration Committee decided to take into account the vesting of shares in January 2022 for the assessment of compliance with the share ownership guidelines per December 31, 2021. This results in a total number of vested shares that far exceeds the ownership requirement due to vesting of the 2019-2021 plans on January 1, 2022.
ASML ANNUAL REPORT 2021 164
Total remuneration Board of Management
The remuneration of the members of the Board of Management based on incurred accounting expenses in 2021, 2020 and 2019 was as follows (amounts are in € thousands):
| | | | | | | | | | | | | | | | | | | | | | | | | | | | | | | | | | | | | | |
Board of
Management | Financial
Year | Base salary | Pension | Other benefits | Total fixed | % Fixed | STI | LTI | Total variable | % Variable | Total Remuneration | Relative proportion fixed vs. variable |
| P.T.F.M. Wennink | 2021 | 1,020 | | 206 | | 57 | | 1,283 | | 26.6 | % | 1,098 | | 2,439 | | 3,537 | | 73.4 | % | 4,820 | | 0.36 |
| 2020 | 1,020 | | 216 | | 57 | | 1,293 | | 28.3 | % | 1,135 | | 2,136 | | 3,271 | | 71.7 | % | 4,564 | | 0.40 |
| 2019 | 1,000 | | 207 | | 53 | | 1,260 | | 28.9 | % | 1,070 | | 2,031 | | 3,101 | | 71.1 | % | 4,361 | | 0.41 |
| M.A. van den Brink | 2021 | 1,020 | | 206 | | 56 | | 1,282 | | 26.6 | % | 1,098 | | 2,439 | | 3,537 | | 73.4 | % | 4,819 | | 0.36 |
| 2020 | 1,020 | | 216 | | 57 | | 1,293 | | 28.3 | % | 1,135 | | 2,136 | | 3,271 | | 71.7 | % | 4,564 | | 0.40 |
| 2019 | 1,000 | | 207 | | 52 | | 1,259 | | 28.9 | % | 1,070 | | 2,031 | | 3,101 | | 71.1 | % | 4,360 | | 0.41 |
F.J.M.
Schneider-
Maunoury | 2021 | 694 | | 115 | | 36 | | 845 | | 26.8 | % | 747 | | 1,566 | | 2,313 | | 73.2 | % | 3,158 | | 0.37 |
| 2020 | 694 | | 122 | | 36 | | 852 | | 29.1 | % | 773 | | 1,302 | | 2,075 | | 70.9 | % | 2,927 | | 0.41 |
| 2019 | 680 | | 114 | | 30 | | 824 | | 30.3 | % | 728 | | 1,172 | | 1,900 | | 69.7 | % | 2,724 | | 0.43 |
| R.J.M. Dassen | 2021 | 694 | | 115 | | 51 | | 860 | | 22.6 | % | 747 | | 2,193 | | 2,940 | | 77.4 | % | 3,800 | | 0.29 |
| 2020 | 694 | | 100 | | 51 | | 845 | | 22.2 | % | 773 | | 2,186 | | 2,959 | | 77.8 | % | 3,804 | | 0.29 |
| 2019 | 680 | | 93 | | 47 | | 820 | | 27.7 | % | 728 | | 1,408 | | 2,136 | | 72.3 | % | 2,956 | | 0.38 |
| C.D. Fouquet | 2021 | 694 | | 78 | | 52 | | 824 | | 26.3 | % | 747 | | 1,566 | | 2,313 | | 73.7 | % | 3,137 | | 0.36 |
| 2020 | 694 | | 83 | | 51 | | 828 | | 27.8 | % | 773 | | 1,374 | | 2,147 | | 72.2 | % | 2,975 | | 0.39 |
| 2019 | 680 | | 74 | | 47 | | 801 | | 36.4 | % | 728 | | 674 | | 1,402 | | 63.6 | % | 2,203 | | 0.57 |
| Total Board of Management | 2021 | 4,122 | | 720 | | 252 | | 5,094 | | 25.8 | % | 4,437 | | 10,203 | | 14,640 | | 74.2 | % | 19,734 | | 0.35 |
| 2020 | 4,122 | | 737 | | 252 | | 5,111 | | 27.1 | % | 4,589 | | 9,134 | | 13,723 | | 72.9 | % | 18,834 | | 0.37 |
| 2019 | 4,040 | | 695 | | 229 | | 4,964 | | 29.9 | % | 4,324 | | 7,316 | | 11,640 | | 70.1 | % | 16,604 | | 0.43 |
| | | | | | | | | | | | |
The remuneration reported as part of the LTI (share awards) is based on costs incurred under US GAAP. The costs of share awards are charged to the Consolidated Statements of Operations over the 3-year vesting period based on the number of awards expected to vest for Non-market based elements. For the first 2 years, we apply the maximum achievable number of share awards, and in the final performance year of the awards we update this estimate for the non-market performance conditions to the best estimated amounts which are anticipated to vest. Any difference between the amount based on the best estimate of achievable number of shares awards and the amount based on the actual number of share awards that vest, is taken into account in the Consolidated Statements of Operations in the financial year in which the share awards vest. Market based elements are accounted at target.
Total remuneration Former Board of Management
F.J. van Hout is no longer part of the Board of Management since he retired from the company in 2021.
| | | | | | | | | | | | | | | | | | | | | | | | | | | | | | | | | | | | | | |
Former Board of
Management | Financial
Year | Base salary | Pension | Other benefits | Total fixed | % Fixed | STI | LTI | Total variable | % Variable | Total Remuneration | Relative proportion fixed vs. variable |
F.J. van Hout 1 | 2021 | 231 | | 47 | | 16 | | 294 | | 11.4 | % | 243 | | 2,036 | | 2,279 | | 88.6 | % | 2,573 | | 0.13 |
| 2020 | 694 | | 122 | | 47 | | 863 | | 29.4 | % | 773 | | 1,302 | | 2,075 | | 70.6 | % | 2,938 | | 0.42 |
| 2019 | 680 | | 114 | | 44 | | 838 | | 30.6 | % | 728 | | 1,172 | | 1,900 | | 69.4 | % | 2,738 | | 0.44 |
1.The 2021 total remuneration of F.J. van Hout is excluding an estimated amount of €8.8 million to account for the tax levy payable to the Dutch tax authorities by the Company on termination benefits pursuant to Article 32bb of the Dutch wage tax act.
The 2021 STI of Mr. van Hout is pro-rated based on the days of service provided in 2021. Mr. van Hout will remain entitled to the performance shares granted under the LTI plans in 2018, 2019 and 2020, which will vest in accordance with the relevant performance criteria as stated in the grant letters. The grant of the 2021-2023 LTI plan is pro-rated based on the days of service provided in 2021. All LTI expenses for the running LTI plans are accounted in 2021, since no services are provided beyond the end of the service period in 2021. The total disclosed remuneration is excluding an estimated amount of €8.8 million to account for the tax levy payable to the Dutch tax authorities by the Company on termination benefits pursuant to Article 32bb of the Dutch wage tax act. Total remuneration expense for Mr. van Hout including this tax levy are €11.4 million for the financial year 2021.
ASML ANNUAL REPORT 2021 165
Share-based payments
Performance based share-based remuneration current members of the Board of Management is disclosed in below table.
| | | | | | | | | | | | | | | | | | | | | | | | | | | | | | | | | | | | | | | | | |
| | | | Market based element | Non-Market based element | | | | | | |
Board of
Management | Grant date | Status | Full control | Number of shares at target | Fair value at grant date | Number of shares at target | Fair value at grant date | Total target shares at grant date | Maximum shares (200%) | Vesting date | Number of shares at vesting date | Year-end share price in year of vesting | End of lock-up date |
P.T.F.M.
Wennink | 1/22/21 | Conditional | No | 1,053 | | 635.6 | | 2,455 | | 454.9 | | 3,508 | | 7,016 | | 1/1/24 | n/a | n/a | 1/1/26 |
| 1/24/20 | Conditional | No | 1,387 | | 286.9 | | 3,235 | | 263.7 | | 4,622 | | 9,245 | | 1/1/23 | n/a | n/a | 1/1/25 |
| 7/19/19 | Unconditional | No | 2,217 | | 245.4 | | 5,173 | | 194.4 | | 7,390 | | 14,780 | | 1/1/22 | 13,326 | | 706.7 | 1/1/24 |
| 1/19/18 | Unconditional | No | 1,958 | | 215.1 | | 4,570 | | 162.8 | | 6,528 | | 13,056 | | 1/19/21 | 9,566 | | 439.9 | | 1/19/23 |
| 1/20/17 | Unconditional | No | 3,037 | | 145.4 | | 7,085 | | 110.5 | | 10,122 | | 20,243 | | 1/1/20 | 16,733 | | 263.7 | | 1/1/22 |
| | | | | | | | | | | | | |
M.A. van
den Brink | 1/22/21 | Conditional | No | 1,053 | | 635.6 | | 2,455 | | 454.9 | | 3,508 | | 7,016 | | 1/1/24 | n/a | n/a | 1/1/26 |
| 1/24/20 | Conditional | No | 1,387 | | 286.9 | | 3,235 | | 263.7 | | 4,622 | | 9,245 | | 1/1/23 | n/a | n/a | 1/1/25 |
| 7/19/19 | Unconditional | No | 2,217 | | 245.4 | | 5,173 | | 194.4 | | 7,390 | | 14,780 | | 1/1/22 | 13,326 | | 706.7 | 1/1/24 |
| 1/19/18 | Unconditional | No | 1,958 | | 215.1 | | 4,570 | | 162.8 | | 6,528 | | 13,056 | | 1/19/21 | 9,566 | | 439.9 | | 1/19/23 |
| 1/20/17 | Unconditional | No | 3,037 | | 145.4 | | 7,085 | | 110.5 | | 10,122 | | 20,243 | | 1/1/20 | 16,733 | | 263.7 | | 1/1/22 |
| | | | | | | | | | | | | |
F.J.M.
Schneider-
Maunoury | 1/22/21 | Conditional | No | 717 | | 635.6 | | 1,670 | | 454.9 | | 2,387 | | 4,774 | | 1/1/24 | n/a | n/a | 1/1/26 |
| 1/24/20 | Conditional | No | 858 | | 286.9 | | 2,001 | | 263.7 | | 2,859 | | 5,718 | | 1/1/23 | n/a | n/a | 1/1/25 |
| 7/19/19 | Unconditional | No | 1,371 | | 245.4 | | 3,198 | | 194.4 | | 4,569 | | 9,137 | | 1/1/22 | 8,239 | | 706.7 | 1/1/24 |
| 1/19/18 | Unconditional | No | 1,125 | | 215.1 | | 2,626 | | 162.8 | | 3,751 | | 7,502 | | 1/19/21 | 5,496 | | 439.9 | | 1/19/23 |
| 1/20/17 | Unconditional | No | 1,745 | | 145.4 | | 4,070 | | 110.5 | | 5,815 | | 11,629 | | 1/1/20 | 9,613 | | 263.7 | | 1/1/22 |
| | | | | | | | | | | | | |
R.J.M.
Dassen | 1/22/21 | Conditional | No | 717 | | 635.6 | | 1,670 | | 454.9 | | 2,387 | | 4,774 | | 1/1/24 | n/a | n/a | 1/1/26 |
| 1/24/20 | Conditional | No | 858 | | 286.9 | | 2,001 | | 263.7 | | 2,859 | | 5,718 | | 1/1/23 | n/a | n/a | 1/1/25 |
| 7/19/19 | Unconditional | No | 1,371 | | 245.4 | | 3,198 | | 194.4 | | 4,569 | | 9,137 | | 1/1/22 | 8,239 | | 706.7 | 1/1/24 |
| 1/25/19 | Unconditional | No | 3,000 | | 169.0 | | 7,000 | | 148.3 | | 10,000 | | 20,000 | | 1/1/22 | 18,032 | | 706.7 | 1/1/24 |
| 7/20/18 | Unconditional | No | 657 | | 274.6 | | 1,531 | | 185.0 | | 2,188 | | 4,376 | | 1/19/21 | 3,207 | | 439.9 | 1/19/23 |
| C.D. Fouquet | 1/22/21 | Conditional | No | 717 | | 635.6 | | 1,670 | | 454.9 | | 2,387 | | 4,774 | | 1/1/24 | n/a | n/a | 1/1/26 |
| 1/24/20 | Conditional | No | 858 | | 286.9 | | 2,001 | | 263.7 | | 2,859 | | 5,718 | | 1/1/23 | n/a | n/a | 1/1/25 |
| 7/19/19 | Unconditional | No | 1,371 | | 245.4 | | 3,198 | | 194.4 | | 4,569 | | 9,137 | | 1/1/22 | 8,239 | | 706.7 | 1/1/24 |
| 7/20/18 | Unconditional | No | 844 | | 274.6 | | 1,969 | | 185.0 | | 2,813 | | 5,626 | | 1/19/21 | 4,122 | | 439.9 | 1/19/23 |
Performance based share-based remuneration former member of the Board of Management is disclosed in below table.
| | | | | | | | | | | | | | | | | | | | | | | | | | | | | | | | | | | | | | | | | |
| | | | Market based element | Non-Market based element | | | | | | |
Former Board of
Management | Grant date | Status | Full control | Number of shares at target | Fair value at grant date | Number of shares at target | Fair value at grant date | Total target shares at grant date | Maximum shares (200%) | Vesting date | Number of shares at vesting date | Year-end share price in year of vesting | End of lock-up date |
| F.J. van Hout | 1/22/21 | Conditional | No | 239 | | 635.6 | | 557 | | 454.9 | | 796 | | 1,592 | | 1/1/24 | n/a | n/a | 1/1/26 |
| 1/24/20 | Conditional | No | 858 | | 286.9 | | 2,001 | | 263.7 | | 2,859 | | 5,718 | | 1/1/23 | n/a | n/a | 1/1/25 |
| 7/19/19 | Unconditional | No | 1,371 | | 245.4 | | 3,198 | | 194.4 | | 4,569 | | 9,137 | | 1/1/22 | 8,239 | | 706.7 | 1/1/24 |
| 1/19/18 | Unconditional | No | 1,125 | | 215.1 | | 2,626 | | 162.8 | | 3,751 | | 7,501 | | 1/19/21 | 5,496 | | 439.9 | | 1/19/23 |
| 1/20/17 | Unconditional | No | 1,745 | | 145.4 | | 4,070 | | 110.5 | | 5,815 | | 11,629 | | 1/1/20 | 9,613 | | 263.7 | | 1/1/22 |
| | | | | | | | | | | | | |
| | | | | | | | | | | | | |
| | | | | | | | | | | | | |
Reasons, criteria and principal conditions for granting shares
For the reasons and criteria for granting the performance shares to each member of the Board of Management, reference is made to the table summarizing the 2021 Remuneration Policy for the Board of Management and to the section Board of Management Remuneration in 2021 - Long Term Incentive as included in this Remuneration Report.
The principal conditions applicable to the 2021 performance shares are described below. These apply to each member of the Board of Management.
ASML ANNUAL REPORT 2021 166
| | | | | |
| Instrument: | Performance Shares |
| Grant: | Conditional grant on an annual basis based on maximum achievable opportunity. The number of performance shares to be conditionally awarded is calculated using the volume-weighted average share price during the last quarter of the year preceding the conditional award. |
| Grant date: | Two days after the publication of ASML’s annual results in January of the year in which the three-year performance period starts |
| Performance period: | Three years, starting on January 1 in year of grant |
| Vesting: | The shares will become unconditional in the year after the end of the three-year performance period, depending on the level of achievement of the predetermined performance targets |
| Lock-up period: | The minimum holding period is two years after the vesting date. |
| Upon termination of contract the transfer restrictions will remain in place during the holding period except in case of decease. |
| In case a tax payment is due by the members of the Board of Management over the retrieved variable income, performance shares may be partially sold at vesting (‘sell to cover’) in accordance with the law and internal regulations. |
Relationship between accounted remuneration and company's performance
The following table sets forth an overview of the relationship between accounted remuneration and the company's performance for the past five years:
| | | | | | | | | | | | | | | | | |
| For the year ended December 31 (€, in thousands) | 2017 | 2018 1 | 2019 | 2020 | 2021 |
| Net sales | 8,962,658 | | 10,944,016 | | 11,820,001 | | 13,978,452 | | 18,610,994 | |
| | | | | |
| Net income based on US GAAP | 2,066,679 | | 2,591,614 | | 2,592,252 | | 3,553,670 | | 5,883,177 | |
| | | | | |
| Net income based on EU-IFRS | 2,173,400 | | 2,525,515 | | 2,581,107 | | 3,696,813 | | 6,134,595 | |
| | | | | |
| ASML share price (closing price on Euronext Amsterdam in €) | 145.2 | 137.2 | 263.7 | 397.6 | 706.7 |
| Average number of payroll employees in FTEs | 15,136 | 18,204 | 22,192 | 24,727 | 28,223 |
| | | | | |
| | | | | | |
| Remuneration P.T.F.M. Wennink (CEO) | 3,455 | | 3,433 | | 4,361 | | 4,564 | | 4,820 | |
| | | | | |
| Remuneration M.A. van den Brink | 3,454 | | 3,431 | | 4,360 | | 4,564 | | 4,819 | |
| | | | | |
| Remuneration R.J.M. Dassen | — | | 897 | | 2,956 | | 3,804 | | 3,800 | |
| | | | | |
| Remuneration F.J. van Hout | 2,276 | | 2,177 | | 2,738 | | 2,938 | | 2,573 | |
| | | | | |
| Remuneration C.D. Fouquet | — | | 1,125 | | 2,203 | | 2,975 | | 3,137 | |
| | | | | |
| Remuneration F.J.M. Schneider-Maunoury | 2,260 | | 2,169 | | 2,724 | | 2,927 | | 3,158 | |
| | | | | |
| | | | | |
| | | | | |
| | | | | | |
Average remuneration per FTE 2 | 117 | | 115 | | 114 | | 120 | | 122 | |
| | | | | |
| | | | | | |
Internal pay ratio (CEO versus employee remuneration) 2 | 30 | | 30 | | 38 | | 38 | | 40 | |
1.The remuneration of the R.J.M. Dassen and C.D. Fouquet is lower in 2018 as they were appointed as members of the Board of Management during 2018.
2.The calculation approach of the Internal pay ratio is disclosed in the section Relationship between CEO and average remuneration (pay ratio). We revised our calculation approach to the internal pay ratio based on the December 2020 guidance from the Monitoring Committee Dutch Corporate Governance Code on section 3.4.1.iv of the Dutch Corporate Governance Code effective as of 2021. The comparative historical numbers of the internal pay ratio have therefore been restated to include the social security expenses in the internal pay ratio numbers. In the calculation, we have taken into account the payroll employees only, since this ensures consistency with the figures disclosed in the consolidated financial statements. The ratio would be lower in case we would incorporate the temporary employees as they earn on average a higher remuneration.
Explanation of changes in company's performance versus remuneration
The table set out above aims to provide insight into the Company's performance over the past five years and the development of the remuneration. The metrics sales, net income and share price are used to measure Company performance, as they are key metrics serving as a good proxy for ASML's general performance, as well as in view of comparability with other companies. The Company has grown significantly over the last years, not only reflected in the number of employees but also in terms of revenue. Since 2017, net sales increased by 107%. The performance of the Company in that same period has increased significantly as well, reflected for example in Net Income (185% growth since 2017 based on EU-IFRS) and ASML share price (387% growth). As the table shows, the Company performance over the last five years has improved more significantly compared to the development of remuneration in that same period. The growth of the Company has led to revisions of the Remuneration Policy for the Board of Management in 2019 and 2021, resulting into higher base salaries as well as higher levels of STI (at target) and LTI (at target). Actual remuneration may fluctuate year over year depending on actual STI pay-out in any year, as well as the vesting of performance shares (LTI) in any year and the share price at that moment.
Relationship between CEO and average remuneration (pay ratio)
The internal pay ratio1 (CEO versus employee remuneration) increased towards 40:1 in 2021 (2020 38:1), due to the policy change performed in 2021, which increased remuneration. ASML intends to grant competitive remuneration to employees at all position levels within the Company. At each level remuneration should reflect the responsibilities of the role. The build-up of remuneration from level to level should therefore be gradual and in line with increasing responsibilities, also following market practice. At the highest level the steps become gradually bigger as responsibilities ultimately rise from a divisional level to an overall company level. The Supervisory Board considers the current build-up and the overall pay ratio of 40:1 to be equitable, considering the current size and organization structure of the company.
ASML ANNUAL REPORT 2021 167
1.This ratio consists of the CEO's total remuneration (including all remuneration components) during 2021 of €4,820 thousand, compared to the average remuneration of all employees. The average remuneration of all employees was calculated using the average number of payroll employees in FTE (wages and salaries + social security expenses + pension and retirement expenses + share-based payments) / average number of payroll employees = €3,439.2 million / 28,223 = €122 thousand. This ratio has not been prepared to comply with the Pay Ratio Disclosure requirements under SEC regulations.
Remuneration Supervisory Board
In this section of the Remuneration Report we provide an overview of the 2021 Remuneration Policy for the Supervisory Board as adopted by the General Meeting on April 29, 2021 and as in force as of April 1, 2021. The Supervisory Board's Remuneration Policy as adopted by the General Meeting on April 22, 2020 was applicable for the first few months in 2021, as disclosed in the Remuneration Report 2020. It also provides information about the implementation of the 2021 Remuneration Policy for the Supervisory Board and the details of the Supervisory Board members' actual remuneration in 2021. The 2021 Remuneration Policy for the Supervisory Board can be found in the Governance section of our website.
Remuneration Policy
Remuneration objectives and principles
The 2021 Remuneration Policy for the Supervisory Board is designed to enable ASML to attract and retain qualified Supervisory Board members, which together compose a diverse and balanced Supervisory Board with the appropriate level of skills, competencies and experience required to properly supervise (the execution of) ASML's strategy, which is focused on the creation of long-term value for all stakeholders.
The 2021 Remuneration Policy for the Supervisory Board is built on the following principles:
•Transparent – The remuneration policy and its execution are clear and practical
•Alignment – The remuneration policy is benchmarked to market practice
•Compliant – ASML adopts the highest standards of good corporate governance
•Simple – The remuneration policy and its execution are as simple as possible and easily understandable to all stakeholders
•Fair – The remuneration should reflect the time spent and the responsibilities of the role of the members of the Supervisory Board
•Independent – The remuneration of a Supervisory Board member may not be dependent on the results of the company.
Reference group and market positioning
The remuneration of the Supervisory Board should be competitive compared to a relevant reference market. This market is defined using a reference group of companies with a two-tier board structure included in the AEX Index of Euronext Amsterdam. To determine the positioning in this group, enterprise value, revenue and number of employees are taken into account.
ASML ANNUAL REPORT 2021 168
Summary of Remuneration Policy Supervisory Board
The table below provides an overview and description of the elements of the 2021 Remuneration Policy for the Supervisory Board. The table includes the amended Supervisory Board and Committee membership fees resulting from the revision of the Remuneration Policy as approved at the 2021 AGM.
Remuneration Supervisory Board in 2021
Overview of the remuneration to the Supervisory Board members based on incurred accounting expenses over the last five years (amounts are in € thousands):
| | | | | | | | | | | | | | | | | | | | | | | | | | | | | |
| Membership fees 2021 | Committee fees 2021 | Allowances 20211 | Proportion fixed vs. variable 2021 | Total remuneration 2021 | Total remuneration 2020 | Total remuneration 2019 | Total remuneration 2018 | Total remuneration 2017 |
| G.J. Kleisterlee | 125 | 51 | 2 | 100:0 | 178 | 157 | 154 | 138 | 135 |
| A.P. Aris | 87 | 39 | 1 | 100:0 | 127 | 95 | 98 | 80 | 80 |
B.M. Conix | 50 | 12 | 1 | 100:0 | 63 | — | — | — | — |
| D.M. Durcan | 74 | 27 | 11 | 100:0 | 112 | 57 | — | — | — |
| D.W.A. East | 74 | 17 | 2 | 100:0 | 93 | 59 | — | — | — |
| T.L. Kelly | 74 | 27 | 6 | 100:0 | 107 | 88 | 101 | 60 | — |
| R.D. Schwalb | 74 | 38 | 1 | 100:0 | 113 | 104 | 101 | 88 | 86 |
| J.M.C. Stork | 74 | 28 | 11 | 100:0 | 113 | 100 | 118 | 100 | 100 |
| Total | 632 | 239 | 35 | 100:0 | 906 | 660 | 572 | 466 | 401 |
1. Allowances consist of fixed expense allowances and allowances for intercontinental meetings.
ASML ANNUAL REPORT 2021 169
No variable pay has been granted to the current and former members of the Supervisory Board during the last five years. The remuneration of the Supervisory Board is not directly linked to the performance of ASML, in line with the remuneration principles set out in the 2021 Remuneration Policy for the Supervisory Board.
Remuneration Former Supervisory Board
Overview of the remuneration awarded to the former Supervisory members in 2021, 2020 and 2019 (amounts are in € thousands):
| | | | | | | | | | | | | | | | | | | | | | | |
| Membership fees 2021 | Committee fees 2021 | Allowances 20211 | Proportion fixed vs. variable 2021 | Total remuneration 2021 | Total remuneration 2020 | Total remuneration 2019 |
| D.A. Grose | 26 | 10 | — | 100:0 | 36 | 117 | 133 |
| C.M.S. Smits Nusteling | 23 | 8 | — | 100:0 | 31 | 95 | 91 |
| W.H. Ziebart | — | — | — | — | — | 30 | 101 |
| Total | 49 | 18 | — | | 67 | 242 | 325 |
1. Allowances consist of fixed expense allowances and allowances for intercontinental meetings.
Other information
Total remuneration
The total annual remuneration for the members of the Board of Management and Supervisory Board members including Former Members during 2021 amounts to €23.2 million (2020: €22.6 million).
Other arrangements
No remuneration has been granted and allocated by subsidiaries or other companies whose financials are consolidated by ASML, since all members of the Board of Management and the Supervisory Board are paid directly by ASML Holding N.V.
No (personal) loans have been granted to the members of the Board of Management or the Supervisory Board and no guarantees or the like have been granted in favor of any of the members of the Board of Management and the Supervisory Board.
No severance payments were granted to members of the Board of Management and the Supervisory Board in 2021 and no variable remuneration has been clawed-back.
Deviations
In 2021 no deviations took place from the decision-making process for the implementation of the 2021 Remuneration Policies for the Board of Management and the Supervisory Board and no temporary deviations took place from the 2021 Remuneration Policies.
Shareholder voting
At the 2021 AGM the 2021 Remuneration Policy for the Board of Management was adopted with 93.86% of the votes cast in favor. The 2021 Remuneration Policy for the Supervisory Board was also adopted at the 2021 AGM with a majority of 98.90% of the votes cast in favor of the proposal.
The Remuneration Report for the financial year 2020 was submitted to the 2021 AGM for an advisory vote. 85.07% of the votes were cast in favor. In the Message from the Remuneration Committee Chair at the beginning of this Remuneration Report, we discuss how we have responded to the feedback received on Board of Management remuneration.
This Remuneration Report will be submitted to the 2022 AGM for an advisory vote in line with Dutch law, together with a proposal for revision of the 2021 Remuneration Policy for the Board of Management as described in more detail in the section "Looking forward to 2022".
ASML ANNUAL REPORT 2021 170
Report of Independent Registered Public Accounting Firm
To the Shareholders and the Supervisory Board
ASML Holding N.V.:
Opinions on the Consolidated Financial Statements and Internal Control Over Financial Reporting
We have audited the accompanying consolidated balance sheets of ASML Holding N.V. and subsidiaries (the “Company”) as of December 31, 2021 and 2020, the related consolidated statements of operations, comprehensive income, shareholders’ equity and cash flows for each of the years in the three-year period ended December 31, 2021, and the related notes (collectively, the “consolidated financial statements”). We also have audited the Company’s internal control over financial reporting as of December 31, 2021, based on criteria established in Internal Control – Integrated Framework (2013) issued by the Committee of Sponsoring Organizations of the Treadway Commission.
In our opinion, the consolidated financial statements referred to above present fairly, in all material respects, the financial position of the Company as of December 31, 2021 and 2020, and the results of its operations and its cash flows for each of the years in the three-year period ended December 31, 2021, in conformity with U.S. generally accepted accounting principles. Also in our opinion, the Company maintained, in all material respects, effective internal control over financial reporting as of December 31, 2021, based on criteria established in Internal Control – Integrated Framework (2013) issued by the Committee of Sponsoring Organizations of the Treadway Commission.
Basis for Opinions
The Company’s management is responsible for these consolidated financial statements, for maintaining effective internal control over financial reporting, and for its assessment of the effectiveness of internal control over financial reporting, included in the accompanying Management’s report on internal control over financial reporting. Our responsibility is to express an opinion on the Company’s consolidated financial statements and an opinion on the Company’s internal control over financial reporting based on our audits. We are a public accounting firm registered with the Public Company Accounting Oversight Board (United States) (“PCAOB”) and are required to be independent with respect to the Company in accordance with the U.S. federal securities laws and the applicable rules and regulations of the Securities and Exchange Commission and the PCAOB.
We conducted our audits in accordance with the standards of the PCAOB. Those standards require that we plan and perform the audits to obtain reasonable assurance about whether the consolidated financial statements are free of material misstatement, whether due to error or fraud, and whether effective internal control over financial reporting was maintained in all material respects.
Our audits of the consolidated financial statements included performing procedures to assess the risks of material misstatement of the consolidated financial statements, whether due to error or fraud, and performing procedures that respond to those risks. Such procedures included examining, on a test basis, evidence regarding the amounts and disclosures in the consolidated financial statements. Our audits also included evaluating the accounting principles used and significant estimates made by management, as well as evaluating the overall presentation of the consolidated financial statements. Our audit of internal control over financial reporting included obtaining an understanding of internal control over financial reporting, assessing the risk that a material weakness exists, and testing and evaluating the design and operating effectiveness of internal control based on the assessed risk. Our audits also included performing such other procedures as we considered necessary in the circumstances. We believe that our audits provide a reasonable basis for our opinions.
Definition and Limitations of Internal Control Over Financial Reporting
A company’s internal control over financial reporting is a process designed to provide reasonable assurance regarding the reliability of financial reporting and the preparation of financial statements for external purposes in accordance with generally accepted accounting principles. A company’s internal control over financial reporting includes those policies and procedures that (1) pertain to the maintenance of records that, in reasonable detail, accurately and fairly reflect the transactions and dispositions of the assets of the company; (2) provide reasonable assurance that transactions are recorded as necessary to permit preparation of financial statements in accordance with generally accepted accounting principles, and that receipts and expenditures of the company are being made only in accordance with authorizations of management and directors of the company; and (3) provide reasonable assurance regarding prevention or timely detection of unauthorized acquisition, use, or disposition of the company’s assets that could have a material effect on the financial statements.
Because of its inherent limitations, internal control over financial reporting may not prevent or detect misstatements. Also, projections of any evaluation of effectiveness to future periods are subject to the risk that controls may become inadequate because of changes in conditions, or that the degree of compliance with the policies or procedures may deteriorate.
Critical Audit Matter
The critical audit matter communicated below is a matter arising from the current period audit of the consolidated financial statements that was communicated or required to be communicated to the audit committee and that: (1) relates to accounts or disclosures that are material to the consolidated financial statements and (2) involved our especially challenging, subjective, or complex judgments. The communication of a critical audit matter does not alter in any way our opinion on the consolidated
ASML ANNUAL REPORT 2021 172
financial statements, taken as a whole, and we are not, by communicating the critical audit matter below, providing a separate opinion on the critical audit matter or on the accounts or disclosures to which it relates.
Revenue recognition - Identification of distinct performance obligations and allocation of the total contract consideration
As disclosed in note 2 to the consolidated financial statements, net system sales was EUR 13,652.8 million for the year ended December 31, 2021. Sales of systems are usually entered into with customers under Volume Purchase Agreements (VPAs). These VPAs contain multiple performance obligations, for example delivery of goods, installation, warranty and training. Once these performance obligations are identified, the total contract consideration, including discounts, offer of free goods or services and credits that can be used towards future purchases, is allocated to the performance obligations.
We identified revenue recognition, and specifically the identification of performance obligations in the VPAs as well as the allocation of the total contract consideration, including discounts, offer of free goods or services and credits that can be used towards future purchases, as a critical audit matter since it is inherently judgmental, and complex. As a result, evaluating the Company’s judgments regarding the identified performance obligations, notably the estimate of the number of systems to be delivered, and the allocation of the total contract consideration to these performance obligations required a high degree of auditor judgment.
The following are the primary procedures we performed to address this critical audit matter. We evaluated the design and tested the operating effectiveness of certain internal controls related to the critical audit matter. This includes controls related to VPA assessments for the identification of performance obligations and the allocation of the total contract consideration to these performance obligations, and the correct application to individual sales transactions. We evaluated the identification of performance obligations and the allocation of the total contract consideration by inspecting a selection of VPAs and the related documentation, performing inquiries with relevant operational functions in the Company, and performing sensitivity analyses, to assess the impact of the estimated number of systems to be delivered on the allocation. Furthermore, we tested a selection of recognized sales transactions under VPAs and performed a retrospective review of prior period estimates to assess management’s ability to estimate the number of systems to be delivered. Finally, we checked the accuracy of the Company’s model used to allocate the contract consideration to the identified performance obligations.
/s/ KPMG Accountants N.V.
We have served as the Company's auditor since 2015.
Amstelveen, the Netherlands
February 9, 2022
ASML ANNUAL REPORT 2021 173
Consolidated Statements of Operations
| | | | | | | | | | | | | | |
| Year ended December 31 (€, in millions, except per share data) | Notes | 2019 | 2020 | 2021 |
| Net system sales | | 8,996.2 | | 10,316.6 | | 13,652.8 | |
| Net service and field option sales | | 2,823.8 | | 3,661.9 | | 4,958.2 | |
| Total net sales | 2, 3 | 11,820.0 | | 13,978.5 | | 18,611.0 | |
| | | | |
| Cost of system sales | | (4,676.2) | | (5,169.3) | | (6,482.9) | |
| Cost of service and field option sales | | (1,864.0) | | (2,012.0) | | (2,319.1) | |
Total cost of sales 1 | | (6,540.2) | | (7,181.3) | | (8,802.0) | |
| | | | |
| Gross profit | | 5,279.8 | | 6,797.2 | | 9,809.0 | |
| | | | |
| Research and development costs | | (1,968.5) | | (2,200.8) | | (2,547.0) | |
| Selling, general and administrative costs | | (520.5) | | (544.9) | | (725.6) | |
| Other income | 10 | — | | — | | 213.7 | |
| Income from operations | | 2,790.8 | | 4,051.5 | | 6,750.1 | |
| | | | |
| Interest and other, net | 16 | (25.0) | | (34.9) | | (44.6) | |
| Income before income taxes | | 2,765.8 | | 4,016.6 | | 6,705.5 | |
| | | | |
| Income tax expense | 21 | (191.7) | | (551.5) | | (1,021.4) | |
| Income after income taxes | | 2,574.1 | | 3,465.1 | | 5,684.1 | |
| | | | |
| Profit from equity method investments | 9 | 18.2 | | 88.6 | | 199.1 | |
| Net income | | 2,592.3 | | 3,553.7 | | 5,883.2 | |
| | | | |
| Basic net income per ordinary share | 23 | | 6.16 | | 8.49 | | 14.36 | |
| Diluted net income per ordinary share | 23 | | 6.15 | | 8.48 | | 14.34 | |
| Number of ordinary shares used in computing per share amounts: | | | | |
| Basic | 23 | 420.8 | | 418.3 | | 409.8 | |
| Diluted | 23 | 421.6 | | 419.1 | | 410.4 | |
1.Cost of sales includes amounts with related parties of €1,855.2 million, €1,457.4 million and €1,321.8 million in 2021, 2020, and 2019, respectively.
ASML ANNUAL REPORT 2021 174
Consolidated Statements of Comprehensive Income
| | | | | | | | | | | | | | |
| Year ended December 31 (€, in millions) | Notes | 2019 | 2020 | 2021 |
| Net income | | 2,592.3 | | 3,553.7 | | 5,883.2 | |
| | | | | |
| Other comprehensive income: | | | | |
| Proportionate share of OCI from equity method investments | | (19.8) | | (1.3) | | 22.0 | |
| | | | | |
| Foreign currency translation, net of taxes: | | | | |
| Gain (loss) on foreign currency translation and effective portion of hedges | | 20.1 | | (73.8) | | 93.3 | |
| | | | | |
| Financial instruments, net of taxes: | | | | |
| Gain (loss) on derivative financial instruments | 25 | | 3.2 | | (21.0) | | 16.6 | |
| Transfers to net income | 25 | | (10.7) | | (2.3) | | 22.2 | |
| Other comprehensive income, net of taxes | | (7.2) | | (98.4) | | 154.1 | |
| | | | | |
| Total comprehensive income, net of taxes | | 2,585.1 | | 3,455.3 | | 6,037.3 | |
| Attributable to equity holders | | 2,585.1 | | 3,455.3 | | 6,037.3 | |
ASML ANNUAL REPORT 2021 175
Consolidated Balance Sheets
| | | | | | | | | | | | |
| As of December 31 (€, in millions, except share and per share data) | Notes | 2020 | 2021 | |
| Assets | | | | |
| Cash and cash equivalents | 4 | | 6,049.4 | | 6,951.8 | | |
| Short-term investments | 4 | | 1,302.2 | | 638.5 | | |
| Accounts receivable, net | 5 | | 1,310.3 | | 3,028.0 | | |
| Finance receivables, net | 6 | | 1,710.5 | | 1,185.6 | | |
| Current tax assets | 21 | | 67.3 | | 42.0 | | |
| Contract assets | 2 | | 119.2 | | 164.6 | | |
| Inventories, net | 7 | | 4,569.4 | | 5,179.2 | | |
| | | | |
Other assets 1 | 8 | | 801.7 | | 1,000.5 | | |
| | | | |
| Total current assets | | 15,930.0 | | 18,190.2 | | |
| | | | | |
| Finance receivables, net | 6 | | 400.5 | | 383.0 | | |
| Deferred tax assets | 21 | | 671.5 | | 1,098.7 | | |
| | | | |
Other assets 2 | 8 | | 951.5 | | 1,011.4 | | |
| Equity method investments | 9 | | 820.7 | | 892.5 | | |
| Goodwill | 11 | | 4,629.1 | | 4,555.6 | | |
| Other intangible assets, net | 12 | | 1,048.9 | | 952.1 | | |
| Property, plant and equipment, net | 13 | | 2,470.3 | | 2,982.7 | | |
| Right-of-use assets - Operating | 14 | | 180.1 | | 159.5 | | |
Right-of-use assets - Finance 3 | 14 | | 164.8 | | 5.3 | | |
| Total non-current assets | | 11,337.4 | | 12,040.8 | | |
| | | | | |
| Total assets | | 27,267.4 | | 30,231.0 | | |
| | | | | |
| Liabilities and shareholders’ equity | | | | |
Accounts payable 4 | | 1,377.9 | | 2,116.3 | | |
| Accrued and other liabilities | 15 | | 1,146.0 | | 1,435.5 | | |
| Current tax liabilities | 21 | | 110.0 | | 301.9 | | |
| Current portion of long-term debt | 16 | | 15.4 | | 509.1 | | |
| Contract liabilities | 2 | | 3,954.2 | | 7,935.2 | | |
| | | | |
| Total current liabilities | | 6,603.5 | | 12,298.0 | | |
| | | | | |
| Long-term debt | 16 | | 4,662.8 | | 4,075.0 | | |
| Deferred and other income tax liabilities | 21 | | 238.3 | | 240.6 | | |
| Contract liabilities | 2 | | 1,639.9 | | 3,225.7 | | |
| Accrued and other liabilities | 15 | | 257.5 | | 251.1 | | |
| Total non-current liabilities | | 6,798.5 | | 7,792.4 | | |
| | | | | |
| Total liabilities | | 13,402.0 | | 20,090.4 | | |
| | | | | |
Ordinary shares; €0.09 nominal value; | | | | |
699,999,000 shares authorized at December 31, 2021; (2020: 699,999,000) | | | | |
402,601,613 issued and outstanding at December 31, 2021; (2020: 416,514,034) | | | | |
| Issued and outstanding shares | | 37.6 | | 36.5 | | |
| Share premium | | 3,780.1 | | 3,876.1 | | |
| Treasury shares at cost | | (863.2) | | (2,422.8) | | |
| Retained earnings | | 10,731.5 | | 8,317.3 | | |
| Accumulated other comprehensive income | | 179.4 | | 333.5 | | |
| Total shareholders’ equity | 22 | | 13,865.4 | | 10,140.6 | | |
| | | | | |
| Total liabilities and shareholders’ equity | | 27,267.4 | | 30,231.0 | | |
1.Other assets - current includes amounts with related parties of €288.5 million and €265.8 million at December 31, 2021 and 2020, respectively.
2.Other assets - non-current includes amounts with related parties of €818.7 million and €668.0 million at December 31, 2021 and 2020, respectively.
3.Right-of-use assets - Finance includes amounts with related parties of €0.0 million and €149.9 million at December 31, 2021 and 2020, respectively.
4.Accounts Payable includes amounts with related parties of €482.7 million and €110.9 million at December 31, 2021 and 2020, respectively.
ASML ANNUAL REPORT 2021 176
Consolidated Statements of Shareholders’ Equity
| | | | | | | | | | | | | | | | | | | | | | | | | | |
| | Issued and Outstanding Shares | Share Premium | Treasury Shares at Cost | Retained Earnings | OCI1 | Total |
| (€, in millions) | Notes | Number | Amount |
| Balance at January 1, 2019 | | 421.1 | | 38.6 | | 3,741.3 | | (1,621.8) | | 9,197.9 | | 285.0 | | 11,641.0 | |
| Components of comprehensive income: | | | | | | | | |
| Net income | | — | | — | | — | | — | | 2,592.3 | | — | | 2,592.3 | |
| Share of OCI from equity method investments | | — | | — | | — | | — | | — | | (19.8) | | (19.8) | |
| Foreign currency translation | | — | | — | | — | | — | | — | | 20.1 | | 20.1 | |
| Gain (loss) on financial instruments | 25 | — | | — | | — | | — | | — | | (7.5) | | (7.5) | |
| Total comprehensive income | | — | | — | | — | | — | | 2,592.3 | | (7.2) | | 2,585.1 | |
| | | | | | | | |
| | | | | | | | |
| | | | | | | | | |
| Purchase of treasury shares | 22 | | (1.9) | | — | | — | | (410.0) | | — | | — | | (410.0) | |
| Cancellation of treasury shares | 22 | | — | | (0.5) | | — | | 902.3 | | (901.8) | | — | | — | |
| Share-based payments | 20 | | — | | — | | 74.6 | | — | | — | | — | | 74.6 | |
| Issuance of shares | 20 | | 0.6 | | 0.1 | | (43.9) | | 109.9 | | (38.9) | | — | | 27.2 | |
| Dividend paid | 22 | | — | | — | | — | | — | | (1,325.7) | | — | | (1,325.7) | |
| | | | | | | | |
| Balance at December 31, 2019 | | 419.8 | | 38.2 | | 3,772.0 | | (1,019.6) | | 9,523.8 | | 277.8 | | 12,592.2 | |
| | | | | | | | |
| | | | | | | | |
| | | | | | | | | |
| Components of comprehensive income: | | | | | | | | |
| Net income | | — | | — | | — | | — | | 3,553.7 | | — | | 3,553.7 | |
| Share of OCI from equity method investments | | — | | — | | — | | — | | — | | (1.3) | | (1.3) | |
| Foreign currency translation | | — | | — | | — | | — | | — | | (73.8) | | (73.8) | |
| Gain (loss) on financial instruments | 25 | | — | | — | | — | | — | | — | | (23.3) | | (23.3) | |
| Total comprehensive income | | — | | — | | — | | — | | 3,553.7 | | (98.4) | | 3,455.3 | |
| | | | | | | | |
| | | | | | | | |
| | | | | | | | | |
| Purchase of treasury shares | 22 | | (3.9) | | — | | — | | (1,207.5) | | — | | — | | (1,207.5) | |
| Cancellation of treasury shares | 22 | | — | | (0.7) | | — | | 1,262.3 | | (1,261.6) | | — | | — | |
| Share-based payments | 20 | | — | | — | | 53.9 | | — | | — | | — | | 53.9 | |
| Issuance of shares | 20 | | 0.6 | | 0.1 | | (45.8) | | 101.6 | | (18.0) | | — | | 37.9 | |
| Dividend paid | 22 | | — | | — | | — | | — | | (1,066.4) | | — | | (1,066.4) | |
| | | | | | | | |
| Balance at December 31, 2020 | | 416.5 | | 37.6 | | 3,780.1 | | (863.2) | | 10,731.5 | | 179.4 | | 13,865.4 | |
| | | | | | | | | |
| Components of comprehensive income: | | | | | | | | |
| Net income | | — | | — | | — | | — | | 5,883.2 | | — | | 5,883.2 | |
| Share of OCI from equity method investments | | — | | — | | — | | — | | — | | 22.0 | | 22.0 | |
| Foreign currency translation | | — | | — | | — | | — | | — | | 93.3 | | 93.3 | |
| Gain (loss) on financial instruments | 25 | | — | | — | | — | | — | | — | | 38.8 | | 38.8 | |
| Total comprehensive income | | — | | — | | — | | — | | 5,883.2 | | 154.1 | | 6,037.3 | |
| | | | | | | | |
| | | | | | | | |
| | | | | | | | | |
| Purchase of treasury shares | 22 | | (14.4) | | — | | — | | (8,560.3) | | — | | — | | (8,560.3) | |
| Cancellation of treasury shares | 22 | | — | | (1.2) | | — | | 6,926.6 | | (6,925.4) | | — | | — | |
| Share-based payments | 20 | | — | | — | | 117.5 | | — | | — | | — | | 117.5 | |
| Issuance of shares | 20 | | 0.5 | | 0.1 | | (21.5) | | 74.1 | | (3.7) | | — | | 49.0 | |
| Dividend paid | 22 | | — | | — | | — | | — | | (1,368.3) | | — | | (1,368.3) | |
| | | | | | | | |
| Balance at December 31, 2021 | | 402.6 | | 36.5 | | 3,876.1 | | (2,422.8) | | 8,317.3 | | 333.5 | | 10,140.6 | |
1.As of December 31, 2021, accumulated OCI consists of €(4.9) million loss relating to our proportionate share of other comprehensive income from equity method investments (2020: €(26.9) million loss; 2019: €(25.6) million loss), €321.9 million relating to foreign currency translation gain (2020: €228.6 million gain; 2019: €302.4 million gain) and €16.5 million relating to unrealized gains on financial instruments (2020: €(22.3) million loss; 2019: €1.0 million gains).
ASML ANNUAL REPORT 2021 177
Consolidated Statements of Cash Flows
| | | | | | | | | | | | | | |
| Year ended December 31 (€, in millions) | Notes | 2019 | 2020 | 2021 |
| Cash Flows from Operating Activities | | | |
|
| Net income | | 2,592.3 | | 3,553.7 | | 5,883.2 | |
| Adjustments to reconcile net income to net cash flows from operating activities: | | | | |
Depreciation and amortization 1 | 12, 13, 14 | 448.5 | | 490.8 | | 471.0 | |
| Impairment and loss (gain) on disposal | 12, 13 | 7.8 | | 5.5 | | (15.9) | |
| Share-based compensation expense | 18, 20 | 74.6 | | 53.9 | | 117.5 | |
| Gain on sale of subsidiaries | 10 | | — | | — | | (213.7) | |
| Inventory reserves | 7 | | 221.5 | | 192.4 | | 180.7 | |
| Deferred tax expense (benefit) | 21 | | (236.8) | | (211.3) | | (419.6) | |
Equity method investments 2 | 9 | | 56.9 | | 11.0 | | (49.8) | |
| Changes in assets and liabilities: | | | | |
| Accounts receivable, net | 5 | | (255.0) | | 507.5 | | (1,754.9) | |
| Finance receivables, net | 6 | | (95.3) | | (1,125.4) | | 542.3 | |
| Inventories | 7 | | (404.7) | | (706.7) | | (483.2) | |
| Other assets | 8 | | (199.1) | | (75.1) | | (222.2) | |
| Accrued and other liabilities | 15 | | 82.1 | | 47.5 | | 347.6 | |
| Accounts payable | | (12.1) | | 334.3 | | 718.6 | |
| Current tax assets and liabilities | 21 | | (202.6) | | 131.5 | | 214.4 | |
| Contract assets and liabilities | 2 | | 1,198.3 | | 1,418.0 | | 5,529.8 | |
| Net cash provided by operating activities | | 3,276.4 | | 4,627.6 | | 10,845.8 | |
| | | | | |
| Cash Flows from Investing Activities | | | | |
Purchase of property, plant and equipment 3 | 13 | | (766.6) | | (962.0) | | (900.7) | |
| Purchase of intangible assets | 12 | | (119.3) | | (38.8) | | (39.6) | |
| Purchase of short-term investments | 4 | | (1,291.5) | | (1,475.5) | | (1,162.7) | |
| Maturity of short-term investments | 4 | | 1,019.0 | | 1,359.1 | | 1,826.4 | |
| | | | |
| Loans issued and other investments | 8 | | 0.9 | | (12.2) | | (124.4) | |
| Proceeds from sale of subsidiaries (net of cash disposed of) | 10 | | — | | — | | 329.0 | |
| | | | |
| Acquisition of subsidiaries (net of cash acquired) | 10 | | — | | (222.8) | | — | |
| Net cash used in investing activities | | (1,157.5) | | (1,352.2) | | (72.0) | |
| | | | | |
| Cash Flows from Financing Activities | | | | |
| Dividend paid | 22 | | (1,325.7) | | (1,066.4) | | (1,368.3) | |
| Purchase of treasury shares | 22 | | (410.0) | | (1,207.5) | | (8,560.3) | |
| Net proceeds from issuance of shares | 20 | | 27.2 | | 37.9 | | 49.0 | |
| Net proceeds from issuance of notes, net of issuance costs | 16 | | — | | 1,486.3 | | — | |
| | | | |
| Repayment of debt and finance lease obligations | 14, 16 | (3.8) | | (3.3) | | (12.1) | |
| Net cash used in financing activities | | (1,712.3) | | (753.0) | | (9,891.7) | |
| | | | | |
| Net cash flows | | 406.6 | | 2,522.4 | | 882.1 | |
| Effect of changes in exchange rates on cash | | 4.6 | | (5.3) | | 20.3 | |
| Net increase (decrease) in cash and cash equivalents | | 411.2 | | 2,517.1 | | 902.4 | |
| Cash and cash equivalents at beginning of the year | 4 | | 3,121.1 | | 3,532.3 | | 6,049.4 | |
| Cash and cash equivalents at end of the year | 4 | | 3,532.3 | | 6,049.4 | | 6,951.8 | |
| | | | | |
| Supplemental Disclosures of Cash Flow Information: | | | | |
| Unpaid portion of property, plant & equipment excluded in investing activities | | 85.9 | | (46.9) | | 29.3 | |
| Interest received | | 38.9 | | 32.1 | | 36.6 | |
| Interest paid | | (59.9) | | (64.1) | | (83.0) | |
| Income taxes paid, net of refunds | | (678.7) | | (650.2) | | (1,235.0) | |
1.Depreciation and amortization includes depreciation of property, plant and equipment, amortization of intangible assets, depreciation of right-of-use assets, amortization of underwriting commissions and discount related to the bonds and credit facility.
2.Equity method investments includes the profit and dividends received from our equity method investment, as well as the capitalization of R&D and supply chain support funding in 2019 and 2020 as disclosed in note 26. Related parties and variable interest entities. The dividend received is a cash inflow in 2021 of €168.0 million (2020: €128.1 million, 2019: €99.9 million).
3.In 2021, an amount of €69.2 million (2020: €203.7 million, 2019: €184.1 million) was included in purchase of property, plant and equipment which relates to funding provided for facilities and tooling to our equity method investment, which was initially recognized as part of the other assets.
ASML ANNUAL REPORT 2021 178
Notes to the Consolidated Financial Statements
1. General information / summary of general accounting policies
We are a global innovation leader in the chip industry. We provide chipmakers with hardware, software and services to mass produce patterns on silicon with the highest possible level of fidelity, we call this holistic lithography. What we do increases the value and lowers the cost of a chip, which advances us all toward a smarter, more connected world. Headquartered in Europe’s top tech hub, the Brainport Eindhoven region in the Netherlands, we are a global team of over 32,000 FTEs with 122 different nationalities across 3 continents. ASML’s principal operations are in Europe, North America and Asia.
Our shares are listed for trading in the form of registered shares on Euronext Amsterdam and on NASDAQ. The principal trading market of our ordinary shares is Euronext Amsterdam.
Basis of preparation
The accompanying Consolidated Financial Statements are stated in millions of euros unless indicated otherwise.
The accompanying Consolidated Financial Statements have been prepared in conformity with US GAAP.
Use of estimates
The preparation of our Consolidated Financial Statements in conformity with US GAAP requires management to make estimates and assumptions that affect the reported amounts of assets and liabilities and the disclosure of contingent assets and liabilities on the balance sheet dates, and the reported amounts of net sales and costs during the reported periods. The inputs into our estimates and assumptions consider economic implications including COVID-19 on our critical accounting estimates. We believe that the critical accounting estimates and assumptions are appropriate. ASML will continue to monitor the impacts of economic implications including COVID-19 and incorporate them into accounting estimates. Actual results could differ from those estimates. We evaluate our estimates continuously and we base our estimates on historical experience and on various other assumptions that we believe to be reasonable under the circumstances. Actual results may differ from these estimates if the assumptions prove incorrect. To the extent there are material differences between actual results and these estimates, our future results could be materially and adversely affected. We believe that the accounting policies described below require us to make significant judgments and estimates in the preparation of our Consolidated Financial Statements. Our most critical accounting estimates include:
•Revenue recognition, including lease accounting
•Inventory reserves
•Unrecognized tax benefits
•Contingencies and litigation
•Evaluation of long-lived assets for impairment
Principles of consolidation
The Consolidated Financial Statements include the Financial Statements of ASML Holding N.V. and all of its subsidiaries. Subsidiaries are all entities over which ASML controls the financial and operating activities, generally accompanying a shareholding of more than 50.0% of the outstanding voting rights. Subsidiaries are fully consolidated from the date on which control is obtained by ASML. The Company consolidates Berliner Glas using a one-quarter lag, to allow for the timely preparation of consolidated financial information. There were no significant intervening events occurred during this lag period that materially affected the Consolidated Financial Statements except for the divestiture of the non-core business of Berliner Glas, which has been recognized in the financial year ended December 31, 2021. All intercompany transactions, balances and unrealized results on transactions with subsidiaries are eliminated. We also assess if we are the primary beneficiary of, and thus would consolidate, any variable interest entity.
Foreign currency translation
The financial information for subsidiaries with a functional currency outside the euro-zone is measured using a mix of local currencies or the euro as the functional currency. The Financial Statements of those foreign subsidiaries with a functional currency different than the euro are translated into euros in the preparation of ASML’s Consolidated Financial Statements. Assets and liabilities are translated into euros at the exchange rate on the respective balance sheet dates and income and costs are translated into euros based on the average exchange rate for the corresponding period. The resulting translation adjustments are recorded directly in shareholders’ equity.
New US GAAP accounting pronouncements adopted
During 2021, there were no new US GAAP accounting pronouncements that were adopted which have a material impact on our Consolidated Financial Statements.
New US GAAP accounting pronouncements issued but not adopted
For the year ended December 31, 2021, there are no new US GAAP accounting pronouncements issued which have not yet been adopted and are expected to have a material impact on our Consolidated Financial Statements.
ASML ANNUAL REPORT 2021 179
2. Revenue from contracts with customers
Accounting Policy
We measure revenue based on the consideration specified in the contracts with our customers, adjusted for any significant financing components, and excluding any taxes collected on behalf of third parties. We recognize revenue when we satisfy a performance obligation by transferring control over a good or service to our customer. We bill our customers for, and recognize as revenue, any charges for shipping and handling costs.
Depending on the contract, we obtain a right to payment for our systems through a combination of either a reservation of a production slot or upon delivery of our systems, with the remaining portion upon final acceptance of our systems. Right to payment for our service and field options occurs upon shipment or completion of the service unless described otherwise. The payment is typically due 15-45 days after the aforementioned events. Our contracts typically include cancellation penalties that provide economic protection from the risk of customer cancellation. The costs related to our sales are recognized as cost of sales.
We generate revenue from the sale of integrated patterning solutions for the semiconductor industry, which mainly consist of systems, system related options and upgrades, other holistic lithography solutions and customer services. The main portion of our net sales is derived from volume purchase agreements with our customers that have multiple performance obligations, which mainly include the sale of our systems, system related options, installation, training and extended and enhanced warranties. In our volume purchase agreements we offer customers discounts in the normal course of sales negotiations. As part of these volume purchases agreements, we may also offer free goods or services and credits that can be used towards future purchases. Occasionally, systems, with the related extended and enhanced warranties, installation and training services, are ordered individually. Our sales agreements do not include a right of return for any reason other than not meeting the agreed upon specifications.
For bundled packages, we account for individual goods and services as separate and distinct performance obligations, including the free or discounted goods or services, if a product or service is separately identifiable from other items in the bundled package and if a customer can benefit from it on its own or with other resources that are readily available to the customer.
The consideration paid for our performance obligations is typically fixed. However, most of our volume purchase agreements with customers contain some component of variable consideration, typically dependent on the final volume of systems ordered by the customer or the system performance. Variable consideration is estimated at contract inception for each performance obligation based on communications with the customer to understand their requirements and roadmap. This is subsequently updated each quarter, using either the expected value method or most likely amount method, whichever is determined to best predict the consideration to be collected from the customer. Variable consideration is only included in the transaction price if it is considered probable that a significant revenue reversal will not occur.
In certain scenarios when entering into a volume purchase agreement, free goods or services are provided directly or through a voucher that can be used on future contracts. Consideration from the contract will be allocated to these performance obligations and revenue recognized when control transfers based on the nature of the goods or services provided.
Some of our contracts require our customers to pay a down payment on systems to be shipped. We do not record a significant financing component for down payments as the timing difference between when the consideration is paid and when the system is transferred to the customer arises from reasons other than financing.
The total consideration of the contract is allocated between all distinct performance obligations in the contract based on their stand-alone selling prices. The stand-alone selling prices are determined based on other stand-alone sales that are directly observable, when possible. However, for the majority of our performance obligations these are not available. If no directly observable evidence is available, the stand-alone selling price is determined using the adjusted market assessment approach, which requires judgment.
Options to buy goods or services in addition to the purchase commitment are assessed to determine if they provide a material right to the customer that they would not have received if they had not entered into this contract. Each option to buy additional goods or services provided at a discount from the stand-alone selling price is considered a material right. The discount offered from the stand-alone selling price will be allocated from the consideration of the other goods and services in the contract if it is determined the customer will exercise the option to buy, adjusted for the likelihood. Revenue will be recognized in line with the nature of the related goods or services. If it is subsequently determined the customer will not exercise the option to buy, or the option expires, revenue will be recognized.
Occasionally we enter into bill-and-hold transactions where we invoice a customer for a system that is ready for delivery but not shipped to the customer until a later date, based on customer’s request. Transfer of control is determined to have occurred only when there is a substantive reason for the arrangement, the system is separately identified as belonging to the customer, the good has been accepted by the customer and is ready for delivery, and we do not have the ability to direct the use of the system.
We generate revenue from lessor agreements, which we classify as a sales-type lease when the lease meets any of the following criteria at lease commencement:
ASML ANNUAL REPORT 2021 180
•The lease transfers ownership of the underlying asset to the lessee by the end of the lease term;
•The lease grants the lessee an option to purchase the underlying asset, that the lessee is reasonably certain to exercise;
•The lease term is for the major part of the remaining economic life of the underlying asset. However, if the commencement date falls at or near the end of the economic life of the underlying asset, this criterion shall not be used for purposes of classifying the lease;
•The present value of the sum of the lease payments and any residual value guaranteed by the lessee that is not already reflected in the lease payments equals or exceeds substantially all of the fair value of the underlying asset; or
•The underlying asset is of such a specialized nature that it is expected to have no alternative use to the lessor at the end of the lease term.
For sales-type leases where substantially all the risks and rewards incidental to ownership of an asset are transferred to the lessee, revenue is recognized at commencement of the lease term. The difference between the gross finance receivable and the present value of the minimum lease payments is initially recognized as unearned interest and presented as a deduction to the gross finance receivable. Interest income is recognized in the Consolidated Statements of Operations over the term of the lease contract using the effective interest method.
Leases that are not a sales-type lease are operating lease arrangements. If we have offered the customer an operating lease arrangement, the system is included in Property, plant and equipment upon commencement of the lease. Revenue from operating lease arrangements is recognized in the Consolidated Statements of Operations on a straight-line basis over the term of the lease contract.
| | | | | |
| Goods or services | Nature, timing of satisfying the performance obligations, and significant payment terms |
| New systems (established technologies) | New systems sales include i-line, KrF, ArF, ArFi and EUV related systems, along with the related factory options ordered with the base system, as well as metrology and inspection systems. Prior to shipment, the majority of our systems undergo a Factory Acceptance Test (FAT) in our cleanroom facilities, effectively replicating the operating conditions that will be present on the customer’s site, in order to verify whether the system meets its standard specifications and any additional technical and performance criteria agreed with the customer. A system is shipped only after all contractual specifications are met or discrepancies from agreed upon specifications are waived and customer sign-off is received for delivery. Each system’s performance is re-tested through a Site Acceptance Test (SAT) after installation at the customer site. We have never failed to successfully complete installation of a system at a customer’s premises; therefore, acceptance at FAT is considered to be proven for established technologies with a history of successful customer acceptances at SAT (equal or better than FAT).
New system sales do not meet the requirements for over time revenue recognition because our customers do not simultaneously receive and consume the benefits provided by our performance, or control the asset throughout any stage of our production process, as well as the systems are considered to have alternative use.
|
Transfer of control of a system undergoing a FAT, and recognition of revenue related to this system, will occur upon delivery of the system.
|
| Transfer of control of a system not undergoing a FAT, and recognition of revenue related to this system, will occur upon customer acceptance of the system at SAT after installation is complete. |
| |
| Used systems | We have no repurchase commitments in our general sales terms and conditions, however we occasionally repurchase systems that we previously manufactured and sold, in order to refurbish and resell the system to a different customer. This repurchase decision is mainly driven by market demand expressed by other customers.
|
Transfer of control of a used system, and recognition of revenue, follow the same logic as for our “New systems (established technologies)”. |
| |
| Field upgrades and options (system enhancements) | Field upgrades and options mainly relate to goods and services that are delivered for systems already installed in the customer factories. Certain upgrades require significant installation efforts, enhancing an asset the customer controls, therefore resulting in transfer of control over the period of installation, measured using the cost incurred method which is estimated using labor hours, as this best depicts the satisfaction of our obligation in transferring control. For the options and other upgrades for which the customer receives and consumes the benefit at the moment of delivery, the transfer of control and recognition of revenue will occur upon delivery.
|
| As long as we are not able to make a reliable estimate of the total efforts needed to complete the upgrade, we only recognize revenue to cover costs incurred. Margin will be realized at the earlier of us being able to make a reliable estimate or completion of the upgrade. |
| |
| New product introduction | We sell new products and services, which are evolutions of our existing technologies. If installation is determined not to be a separate performance or if there is not a sufficient established history of acceptance on FAT, the product is determined to be a “new product introduction”.
New product introductions are typically newly developed options to be used within our systems. Transfer of control and revenue recognition for new product introductions occurs after successful installation and customer acceptance at SAT. Once there is an established history of successful installation and customer acceptance, revenue will be recognized consistent with other systems and goods after transfer of control. |
| |
| Installation | Installation is provided within the selling price of a system. Installation is considered to be distinct as it does not significantly modify the system being purchased and the customer or a third party could be capable of performing the installation themselves, if desired. Transfer of control takes place over the period of installation from delivery through SAT, measured on a straight-line basis, as our performance is satisfied evenly over this period of time. |
| |
ASML ANNUAL REPORT 2021 181
| | | | | |
| Goods or services | Nature, timing of satisfying the performance obligations, and significant payment terms |
| Warranties | We provide standard warranty coverage on our systems for 12 months, providing labor and non-consumable parts necessary to repair our systems during these warranty periods. These standard warranties cannot be purchased and do not provide a service in addition to the general assurance the system will perform as promised. As a result, no revenue is allocated to these standard warranties.
|
| Both the extended and enhanced warranties on our systems are accounted for as a separate performance obligation, with transfer of control taking place over the warranty period, measured on a straight-line basis, as this is a stand-ready obligation. |
| |
| Time-based licenses and related service | Time-based licenses relate to software licenses and the related service which are sold for a period of time. The licenses and the related service are not considered to be individually distinct as the support services are integral to the customer’s ability to continue to use the software license in the rapidly changing technological environment. The transfer of control takes place over the license term, measured on a straight-line basis, as our performance is satisfied evenly over this period of time. Payments are made in installments throughout the license term. |
| |
| Application projects | Application projects are node transition and consulting projects which at times may be provided as free service within a volume purchase agreement. Measuring satisfaction of this performance obligation is performed through an input method based on the labor hours expended relative to the estimated total labor hours as this best depicts the transfer of control of these kind of services. |
| |
| Service contracts | Service contracts are entered into with our customers to support our systems used in their ongoing operations during the systems lifecycle, typically in the form of full-service agreements, limited manpower agreements, other labor agreements, parts availability or parts usage agreements. These services are for a specified period of time and typically have a fixed price. Control transfers over this period of time, measured on a straight-line basis, as these are stand-ready obligations. For service contracts where the price is not fixed, the transaction price has a variable component that is based on the performance of the system. |
| |
| Billable parts and labor | Billable labor represents maintenance services to our systems installed in the customer’s factories while in operation, through purchase orders from our customer. Control over these services is transferred to the customer upon receipt of customer sign-off.
|
Billable parts represent spare parts including optical components relating to our systems installed in the customer’s factories while in operation, through purchase orders from our customer.
|
| Billable parts can be: |
•Sold as direct spare parts, for which control transfers upon delivery; or |
•Sold as part of maintenance services, where control transfers upon receipt of customer sign-off. |
| |
| Field projects (relocations) | Field projects represent mainly relocation services. Measuring satisfaction of this performance obligation is performed through an input method based on the labor hours expended relative to the estimated total labor hours as this best depicts the transfer of control of our service. |
| |
| OnPulse Maintenance | OnPulse maintenance services are provided over a specified period of time on our light source systems. Payment is determined by the amount of pulses counted from each light source system, which is variable. Invoicing is monthly based on the pulses counted. Revenue is recognized in line with invoicing using the practical expedient in ASC 606-10-55-18. |
ASML ANNUAL REPORT 2021 182
Disaggregation of revenue
Our revenue from contracts with customers, on a disaggregated basis, aligns with our reportable segment disclosures with the addition of disaggregation of net system sales per technology and per end-use.
Net system sales per technology were as follows:
| | | | | | | | |
| Year ended December 31 | Net system sales
in units | Net system sales in € millions |
| 2021 | | |
| EUV | 42 | | 6,284.0 | |
| ArFi | 81 | | 4,959.6 | |
| ArF dry | 22 | | 431.9 | |
| KrF | 131 | | 1,321.3 | |
| I-line | 33 | | 142.3 | |
| Metrology & Inspection | 196 | | 513.7 | |
| Total | 505 | | 13,652.8 | |
| | | |
| 2020 | | |
| EUV | 31 | | 4,463.8 | |
| ArFi | 68 | | 3,917.0 | |
| ArF dry | 22 | | 427.0 | |
| KrF | 103 | | 1,012.3 | |
| I-line | 34 | | 146.4 | |
| Metrology & Inspection | 137 | | 350.1 | |
| Total | 395 | | 10,316.6 | |
| | | |
| 2019 | | |
| EUV | 26 | | 2,799.7 | |
| ArFi | 82 | | 4,707.7 | |
| ArF dry | 22 | | 401.2 | |
| KrF | 65 | | 679.7 | |
| I-line | 34 | | 133.5 | |
| Metrology & Inspection | 115 | | 274.4 | |
| Total | 344 | | 8,996.2 | |
Net system sales per end-use were as follows:
| | | | | | | | |
| Year ended December 31 | Net system sales
in units | Net system sales in € millions |
| 2021 | | |
| Logic | 327 | | 9,588.5 | |
| Memory | 178 | | 4,064.3 | |
| Total | 505 | | 13,652.8 | |
| | | |
| 2020 | | |
| Logic | 260 | | 7,393.0 | |
| Memory | 135 | | 2,923.6 | |
| Total | 395 | | 10,316.6 | |
| | | |
| 2019 | | |
| Logic | 238 | | 6,565.3 | |
| Memory | 106 | | 2,430.9 | |
| Total | 344 | | 8,996.2 | |
Contract assets and liabilities
The contract assets relate to our right to a consideration in exchange for goods or services delivered, when that right is conditional on something other than the passage of time. The contract assets are transferred to the receivables when the receivables become unconditional. The contract liabilities primarily relate to remaining performance obligations for which consideration has been received such as down payments received for systems to be delivered, as well as deferred revenue from system shipments, based on the allocation of the consideration to the related performance obligations in the contract. This deferred revenue mainly consists of extended and enhanced warranties, installation and free goods or services provided as part of a volume purchase agreement.
ASML ANNUAL REPORT 2021 183
The majority of our customer contracts contain both asset and liability positions. At the end of each reporting period, these positions are netted on a contract basis and presented as either an asset or a liability in the Consolidated Balance Sheets. Consequently, a contract balance can change between periods from a net contract asset balance to a net contract liability balance in the balance sheet.
Significant changes in the contract assets and the contract liabilities balances during the periods are as follows.
| | | | | | | | | | | | | | |
| Year ended December 31 (€, in millions) | 2020 | 2021 |
| Contract Assets | Contract Liabilities | Contract Assets | Contract Liabilities |
| Balance at beginning of the year | 231.0 | | 4,286.0 | | 119.2 | | 5,594.1 | |
| Transferred from contract assets to accounts receivables | (192.2) | | — | | (268.2) | | — | |
| Revenue recognized during the year ending in contract assets | 83.4 | | — | | 199.7 | | — | |
| Revenue recognized that was included in contract liabilities | — | | (2,428.4) | | — | | (3,767.0) | |
| Changes as a result of cumulative catch-up adjustments arising from changes in estimates | — | | (41.9) | | — | | 39.7 | |
| Remaining performance obligations for which considerations have been received, or for which we have an unconditional right to consideration | — | | 3,781.4 | | — | | 9,180.2 | |
| | | | |
| Transfer between contract assets and liabilities | (3.0) | | (3.0) | | 113.9 | | 113.9 | |
| Total | 119.2 | | 5,594.1 | | 164.6 | | 11,160.9 | |
The increase in the net contract liability to €10,996.3 million as of December 31, 2021 compared to €5,474.9 million as of December 31, 2020 is mainly driven by the recognition of down payments for systems which will be shipped in the future. Cumulative catch-up adjustments recognized in our current year revenue are due to updated estimates for system volume, discounts and credits included in our volume purchase agreements.
Remaining performance obligations
Our customers generally commit to purchase systems, service, or field options through separate sales orders and service contracts. Typically the terms and conditions of these sales orders come from volume purchase agreements with our customers which can cover up to 5 years. The revenues for each committed performance obligation are estimated based on the terms and conditions agreed through the volume purchase agreements.
When revenues will be recognized is mainly dependent on when systems are shipped or installed, as well as when service projects and field upgrades are performed and completed. All of which is estimated based on contract terms and communication with our customers, including the customer facility readiness to take delivery of our goods or services. The volume purchase agreements may be subject to modifications, impacting the amount and timing of revenue recognition for the anticipated revenues.
As of December 31, 2021 the remaining performance obligations amount to €28.9 billion (December 31, 2020: €15.1 billion). We estimate that 61% (December 31, 2020: 76%) of these anticipated revenues will be recognized during the next 12 months. The remaining anticipated revenues mainly include orders related to EUV systems and our next-generation EUV platform, High-NA, which are planned to be shipped in 2023 or later.
3. Segment disclosure
ASML has one reportable segment, for the development, production, marketing, sales, upgrading and servicing of advanced semiconductor equipment systems, consisting of lithography, metrology and inspection systems. Its operating results are regularly reviewed by the Chief Operating Decision Maker in order to make decisions about resource allocation and assess performance.
Management reporting includes net system sales figures of new and used systems, sales per technology and sales per end-use. For the sales per technology and end-use, see Note 2 Revenue from contracts with customers.
Net system sales for new and used systems were as follows:
| | | | | | | | | | | |
| Year ended December 31 (€, in millions) | 2019 | 2020 | 2021 |
| New systems | 8,807.1 | | 10,160.8 | | 13,446.1 | |
| Used systems | 189.1 | | 155.8 | | 206.7 | |
| Net system sales | 8,996.2 | | 10,316.6 | | 13,652.8 | |
ASML ANNUAL REPORT 2021 184
For geographical reporting, total net sales are attributed to the geographic location in which the customers’ facilities are located. Long-lived assets are attributed to the geographic location in which these assets are located. Total net sales and long-lived assets (consisting of Property, plant and equipment, net) by geographic region were as follows:
| | | | | | | | |
| Year ended December 31 (€, in millions) | Total net sales | Long-lived assets |
| 2021 | | |
| Japan | 459.3 | | 5.5 | |
| South Korea | 6,223.0 | | 61.2 | |
| Singapore | 126.2 | | 7.3 | |
| Taiwan | 7,327.9 | | 163.6 | |
| China | 2,740.8 | | 17.0 | |
| Rest of Asia | 1.8 | | 0.2 | |
| Netherlands | 14.2 | | 2,048.1 | |
| EMEA | 134.6 | | 124.0 | |
| United States | 1,583.2 | | 555.8 | |
| Total | 18,611.0 | | 2,982.7 | |
| | | |
| 2020 | | |
| Japan | 542.8 | | 8.3 | |
| South Korea | 4,151.6 | | 34.1 | |
| Singapore | 84.9 | | 2.1 | |
| Taiwan | 4,731.3 | | 164.3 | |
| China | 2,324.4 | | 17.8 | |
| Rest of Asia | 1.6 | | 0.4 | |
| Netherlands | 1.6 | | 1,625.2 | |
| EMEA | 483.3 | | 129.2 | |
| United States | 1,657.0 | | 488.9 | |
| Total | 13,978.5 | | 2,470.3 | |
| | | |
| 2019 | | |
| Japan | 463.2 | | 6.5 | |
| South Korea | 2,202.1 | | 24.1 | |
| Singapore | 120.0 | | 1.6 | |
| Taiwan | 5,357.0 | | 131.6 | |
| China | 1,377.7 | | 21.3 | |
| Rest of Asia | 2.6 | | 0.5 | |
| Netherlands | 2.6 | | 1,396.0 | |
| EMEA | 314.6 | | 4.3 | |
| United States | 1,980.2 | | 413.4 | |
| Total | 11,820.0 | | 1,999.3 | |
In 2021, 2 customers exceed more than 10% of total net sales, totaling €12,505.4 million, or 67.2%, of total net sales. In 2020 and 2019, 3 customers exceed more than 10% of total net sales, in 2020 totaling €9,946.5 million, or 71.2% (2019: €8,018.1 million, or 67.8%). Our three largest customers (based on total net sales) accounted for €3,855.2 million, or 83.7%, of accounts receivable and finance receivables at December 31, 2021, compared with €2,757.0 million, or 80.1%, at December 31, 2020 and 2,191.8 million, or 77.2%, at December 31, 2019.
The increase in total net sales of €4,632.5 million, or 33.1%, to €18,611.0 million in 2021 from €13,978.5 million in 2020 is driven by the global chip shortage, the acceleration of the digital infrastructure and the push for ‘technological sovereignty’. This resulted in higher sales volumes across each technology. It has also led to growth in our service and field options business, as customers have pulled forward demand for our productivity enhancement packages, which provide the most effective and efficient way to increase wafer output. The Logic sector continued to be strong in 2021, and was the largest consumer of our most advanced EUV systems. Memory demand continued growing in 2021 resulting from strong data center and smartphone demand. Taiwan and South Korea saw the largest geographic sales growth in support of expanding capacity to meet worldwide demand.
ASML ANNUAL REPORT 2021 185
4. Cash and cash equivalents and short-term investments
Accounting Policy
Cash and cash equivalents consist primarily of highly liquid investments, such as bank deposits, deposits with governments and government related bodies, money market funds and bank accounts readily convertible to known amounts of cash with insignificant interest rate risk and original maturities to the entity holding the investments 3 months or less at the date of acquisition.
Investments with original maturities at the date of acquisition greater than 3 months and 1 year or less are presented as short-term investments. Fair value changes in these investments, which are not temporary, are recognized in the Consolidated Statements of Operations. Short-term investments have insignificant interest rate risk.
Cash and cash equivalents and short-term investments consist of the following:
| | | | | | | | |
| Year ended December 31 (€, in millions) | 2020 | 2021 |
| | |
| Deposits with financial institutions, governments and government related bodies | 1,545.3 | | 2,131.7 | |
| Investments in money market funds | 3,841.9 | | 2,928.3 | |
| Bank accounts | 662.2 | | 1,891.8 | |
| Cash and cash equivalents | 6,049.4 | | 6,951.8 | |
| | | |
| Deposits with financial institutions, governments and government related bodies | 1,302.2 | | 638.5 | |
| Short-term investments | 1,302.2 | | 638.5 | |
Cash and cash equivalents and short term investments are mainly impacted by strong net cash provided by operating activities, driven by higher net income and increase in down payments, mainly offset by the share buyback program, dividends paid and acquisition of property plant & equipment and intangible assets.
The deposits with financial institutions, governments and government related bodies and investments in money market funds have an investment grade credit rating as rated by credit rating institutions such as S&P, Moody's or Fitch. Our cash and cash equivalents are predominantly denominated in euros and to some extent in US dollars, Taiwanese dollars, South Korean Won and Chinese Yuan.
As of December 31, 2021, no restrictions on usage of cash and cash equivalents exist (2020: no restrictions). The carrying amount of these assets approximates their fair value.
5. Accounts receivable, net
Accounting Policy
Accounts receivable are measured at fair value and are subsequently measured at amortized cost, less allowance for credit losses. The carrying amount of the accounts receivable approximates the fair value. We perform ongoing credit evaluations on our customers’ financial condition. We periodically review whether an allowance for credit losses is needed by considering factors such as historical payment experience, credit quality, aging of the accounts receivable balances, expected lifetime losses, and current economic conditions that may affect a customer's ability to pay.
When entering into arrangements to sell our receivable, we derecognize the receivable only when meeting the derecognition criteria. The criteria require isolation from the seller, granting the buyer the right to pledge or exchange the receivables, and legal transfer of control over the receivable.
Accounts receivable consist of the following:
| | | | | | | | |
| Year ended December 31 (€, in millions) | 2020 | 2021 |
| Accounts receivable, gross | 1,313.1 | | 3,032.5 | |
| Allowance for credit losses | (2.8) | | (4.5) | |
| Accounts receivable, net | 1,310.3 | | 3,028.0 | |
The increase in accounts receivable as of December 31, 2021 compared to December 31, 2020 is due to an increase in our sales and timing of factoring receivables.
In 2021, receivables have been sold through factoring arrangements for cash totaling €2.3 billion (2020: €2.2 billion). The amounts consist of €0.5 billion (2020: €1.4 billion) regular trade receivables and €1.8 billion (2020: €0.8 billion) absolute, unconditional, irrevocable accounts receivable for down payments on systems to be shipped in 2022 and 2023. The factored receivables have been derecognized since the asset is isolated from the seller, control is transferred to the buyer and there are no restrictions on the buyer related to the factored items. The fair value of the receivables sold was substantially the same as their carrying value. The cash receipt is treated as an operating cash flow within the Consolidated Statements of Cash Flows.
ASML ANNUAL REPORT 2021 186
6. Finance receivables, net
Accounting Policy
Finance receivables consist of receivables in relation to sales-type leases. We perform ongoing credit evaluations of our customers’ financial condition. We periodically review whether an allowance for credit losses is needed by considering factors such as historical payment experience, credit quality, the aging of the finance receivables balances, expected lifetime losses, and current economic conditions that may affect a customer’s ability to pay.
The following table lists the components of the finance receivables as of December 31, 2021 and 2020:
| | | | | | | | |
| Year ended December 31 (€, in millions) | 2020 | 2021 |
| Finance receivables, gross | 2,122.5 | | 1,570.0 | |
| Unearned interest | (11.5) | | (1.4) | |
| Finance receivables, net | 2,111.0 | | 1,568.6 | |
| Current portion of finance receivables, gross | 1,716.1 | | 1,187.0 | |
| Current portion of unearned interest | (5.6) | | (1.4) | |
| Non-current portion of finance receivables, net | 400.5 | | 383.0 | |
The decrease in finance receivables as of December 31, 2021 compared to December 31, 2020 is the result of the expiration of free-use and evaluation periods of systems shipped, partly offset by new sales-type leases by providing additional systems with a free-use period. These sales-type leases support the capacity ramp-up of high-end systems which are part of the early-insertion lifecycle of the technology. It is expected they will be purchased at the end of the free-use period.
Gross profit recognized at the commencement date of the lease for our sales-type leases amounts to €514.2 million during 2021 (2020: €830.2 million; 2019: €343.9 million).
At December 31, 2021, payment of the finance receivables in the next 5 years and thereafter are:
| | | | | |
| (€, in millions) | Amount |
| 2022 | 1,187.0 | |
| 2023 | 383.0 | |
| 2024 | — | |
| 2025 | — | |
| 2026 | — | |
| Thereafter | — | |
| Finance receivables, gross | 1,570.0 | |
In 2021, 2020 and 2019 we did not record any expected credit losses from finance receivables. As of December 31, 2021, the finance receivables were neither past due nor impaired.
7. Inventories, net
Accounting Policy
Inventory costs are computed on a first-in, first-out basis. Our inventory values are comprised of purchased materials, freight expenses, customs, duties, production labor and variable overhead. The valuation of inventory includes determining which fixed costs should be capitalized into inventory based on the normal capacity of our manufacturing and assembly facilities. During periods when production is below our established normal capacity, abnormal amounts of our fixed overhead costs, freights and wasted materials are not capitalized into inventory but are expensed in Cost of sales as incurred.
Inventory is valued at the lower of cost or net realizable value, based on assumptions about future demand and market conditions. Valuation of inventory also requires us to establish provisions for inventory that is defective, obsolete or in excess. We use our demand forecast to develop manufacturing plans and utilize this information to compare against raw materials, work in progress and finished product levels to determine the amount of defective, obsolete or excess inventory.
ASML ANNUAL REPORT 2021 187
Inventories consist of the following:
| | | | | | | | |
| Year ended December 31 (€, in millions) | 2020 | 2021 |
| Raw materials | 2,073.4 | | 2,668.3 | |
| Work-in-process | 1,805.0 | | 1,749.9 | |
| Finished products | 1,164.2 | | 1,179.0 | |
| Inventories, gross | 5,042.6 | | 5,597.2 | |
| Inventory reserves | (473.2) | | (418.0) | |
| Inventories, net | 4,569.4 | | 5,179.2 | |
The increase in inventory in 2021 compared to 2020 is driven by the increased demand from customers, higher costs of our latest technologies and growing install base.
A summary of movements in the inventory reserves is as follows:
| | | | | | | | |
| Year ended December 31 (€, in millions) | 2020 | 2021 |
| Balance at beginning of year | (494.3) | | (473.2) | |
| Additions for the year | (192.4) | | (180.7) | |
| Effect of changes in exchange rates | 0.8 | | (6.1) | |
| Utilization of the reserve | 212.7 | | 242.0 | |
| Balance at end of year | (473.2) | | (418.0) | |
The additions for 2021, 2020 and 2019 are recorded in Cost of sales. The additions for the year mainly relate to inventory items which became obsolete due to technological developments and design changes.
8. Other assets
Other current and non-current assets consist of the following:
| | | | | | | | |
| Year ended December 31 (€, in millions) | 2020 | 2021 |
Advance payments to Carl Zeiss SMT GmbH 1 | 265.8 | | 288.5 | |
| Prepaid expenses | 278.7 | | 374.3 | |
Derivative financial instruments 2 | 39.0 | | 52.2 | |
| VAT receivable | 125.6 | | 136.7 | |
| Other assets | 92.6 | | 148.8 | |
| Other current assets | 801.7 | | 1,000.5 | |
| | | |
Advance payments to Carl Zeiss SMT GmbH 1 | 668.0 | | 694.3 | |
Loan to Carl Zeiss SMT GmbH 1 | — | | 124.4 | |
| Prepaid expenses | 55.2 | | 41.0 | |
Derivative financial instruments 2 | 123.8 | | 47.3 | |
| Compensation plan assets | 67.0 | | 81.4 | |
| Non-current accounts receivable | 22.6 | | 8.0 | |
| Other assets | 14.9 | | 15.0 | |
| Other non-current assets | 951.5 | | 1,011.4 | |
1.For further details on other assets to Carl Zeiss SMT GmbH see Note 26 Related parties and variable interest entities.
2.For further details on derivative financial instruments see Note 25 Financial risk management.
Prepaid expenses mainly include prepaid income taxes to intercompany profit on inventory that has not been realized by the ASML group of €261.2 million (2020: €162.9 million). Prepaid expenses further include mainly prepayments for maintenance and the contract balance related to the joint development program with imec of €30.3 million as of December 31, 2021 (2020: €53.8 million). At the end of 2018 we started the new joint development program with imec under which we mainly deliver systems and services upfront and receive R&D services throughout the contract period up until 2024.
ASML ANNUAL REPORT 2021 188
9. Equity method investments
Accounting Policy
Equity investments which we are able to exercise significant influence but do not control, are accounted for using the equity method and presented on our Consolidated Balance Sheets within Equity method investments. The difference between the cost of our investment and our proportionate share of the carrying value of the investee's underlying net assets as of the acquisition date is the basis difference. The basis difference is allocated to the identifiable assets and liabilities based on their fair value as of the acquisition date (i.e. the date which we obtain significant influence), with the excess costs of the investment over our proportional fair value of the identifiable assets and liabilities being equity method goodwill.
We amortize the basis difference related to the other intangible assets over the estimated remaining useful lives of these assets that gave rise to this difference. The remaining weighted-average life of the finite-lived intangible assets acquired is 15.1 years and is amortized using a straight-line method. In-process R&D is initially capitalized at fair value as an intangible asset with an indefinite life. When the R&D project is complete, it is reclassified as an amortizable purchased intangible asset and is amortized over its estimated useful life. If the project is abandoned, we will record the full basis difference charge for the value of the related intangible asset in our Consolidated Statements of Operations in the period of abandonment. Equity method goodwill is not amortized or tested for impairment; instead the equity method investment is tested for impairment whenever events or changes in circumstances indicate that the carrying value of the investment may not be recoverable.
Under the equity method, after initial recognition at cost, our Equity method investments are adjusted for our proportionate share of the profit or loss and other comprehensive income of the investee, recognized on a one-quarter time lag to allow for the timely preparation of financial information and presented within Profit from equity method investments. Our proportionate share of the profit or loss of the investee is adjusted for any differences in accounting principles and policies, basis difference adjustments and intra-entity profits. Receipt of dividends reduces our Equity method investments, which is presented as an operating cash flow based on the nature of the distributions.
Equity method investments consists of a 24.9% equity interest acquired on June 29, 2017 in Carl Zeiss SMT Holding GmbH & Co. KG, a limited partnership that owns Carl Zeiss SMT GmbH, our single supplier of optical columns.
For the year ended December 31, 2021, we recorded a profit from equity method investments of €199.1 million (2020: €88.6 million) in our Consolidated Statements of Operations. This profit includes the following components:
•Profit of €246.5 million (2020: €111.4 million) related to our share of Carl Zeiss SMT Holding GmbH & Co. KG’s net income after accounting policy alignment, including a €79.0 million benefit in 2021 related to previously deferred income of Carl Zeiss SMT Holding GmbH & Co. KG, which was released due to entering into the new framework agreement
•Cost due to basis difference amortization related to intangible assets of €26.7 million (2020: €26.7 million)
•Cost (benefit) due to intercompany profit elimination of €20.7 million (2020: €(3.9) million)
In 2021 we received a dividend of €168.0 million (2020: €128.1 million) from Carl Zeiss SMT Holding GmbH & Co. KG.
Carl Zeiss SMT Holding GmbH & Co. KG is a privately held company; therefore, quoted market prices for its stock are not available.
10. Business combinations and divestitures
Accounting Policy
Acquisitions of subsidiaries are included on the basis of the acquisition method. The cost of acquisition is measured based on the consideration transferred at fair value, the fair value of identifiable assets distributed and the fair value of liabilities incurred or assumed at the acquisition date (i.e. the date which we obtain control). Goodwill is capitalized as the excess of the costs of an acquired subsidiary, net of the amounts assigned to identifiable assets acquired and liabilities incurred or assumed. Acquisition-related costs are expensed when incurred in the period they arise or the service is received.
Business combinations
On October 30, 2020, we concluded the acquisition of Berliner Glas and obtained control through acquiring 100% of the issued share capital of Berliner Glas, for a total consideration of €257.1 million. Berliner Glas is one of the world’s leading providers of optical key components, assemblies and systems.
The total consideration was allocated to goodwill of €87.9 million, assets acquired of €312.1 million and liabilities assumed of €142.9 million. The contingent consideration was paid in cash in 2021. The majority of the goodwill arising on the acquisition of Berliner Glas is attributable to the fact that the acquisition will help us achieve our strategic objective to secure the ramp-up and roll-out of future lithography systems. All goodwill has been allocated to the ASML reporting unit. None of the goodwill recognized is expected to be deductible for income tax purposes.
Divestitures
During 2021, we sold the non-semiconductor businesses acquired as part of the Berliner Glas acquisition.
ASML ANNUAL REPORT 2021 189
The proceeds from these disposals totaled €339.4 million, which primarily related to the sale of the Medical Applications and Swiss Optic business on November 30, 2021. The remaining proceeds are from the sale of the Berliner Glas Technical Glas business on April 30, 2021.
A pre-tax gain of €213.7 million was recognized on these transactions which was recorded in the line item Other income (loss) in our Consolidated Statements of Operations.
11. Goodwill
Accounting Policy
Goodwill represents the excess of the costs of an acquisition over the fair value of the amounts assigned to assets acquired and liabilities incurred or assumed of the acquired subsidiary at the date of acquisition. Goodwill on acquisition of subsidiaries is allocated to reporting units for the purpose of impairment testing. The allocation is made to those reporting units that are expected to benefit from the business combination in which the goodwill arose. Goodwill is stated at cost less accumulated impairment losses.
Goodwill is tested for impairment annually or whenever events or changes in circumstances indicate that the carrying amount of the goodwill may not be recoverable. To determine whether it is necessary to perform the quantitative goodwill impairment test, we perform a step-zero qualitative assessment, annually. If we determine that it is more likely than not that the fair value of a reporting unit exceeds its carrying amount, we do not perform a quantitative goodwill impairment test.
Goodwill mainly results from the acquisitions of Cymer and HMI. The balance as of December 31, 2021 is €4,555.6 million (2020: €4,629.1 million). The decrease of €73.5 million is the result of the divestment of the non-semiconductor businesses of Berliner Glas during 2021.
We have identified two reporting units: Reporting Unit ASML and Reporting Unit Cymer Light Sources. As of December 31, 2021 the goodwill allocated to Reporting Unit ASML amounts to €4,093.3 million (2020: €4,166.8 million) and Reporting Unit Cymer Light Sources amounts to €462.3 million (2020: €462.3 million).
Based on our assessment during the annual goodwill impairment test, we believe it is more likely than not that the fair values of the reporting units exceed their carrying amounts, and therefore goodwill was not impaired as of December 31, 2021.
12. Intangible assets, net
Accounting Policy
Intangible assets include brands, intellectual property, developed technology, customer relationships, and other intangible assets not yet available for use. These finite-lived intangible assets are stated at cost, less accumulated amortization and accumulated impairment losses. Amortization is calculated using the straight-line method based on the estimated useful lives of the assets.
Finite-lived intangible assets are assessed for impairment whenever there is an indication that the balance sheet carrying amount may not be recoverable using cash flow projections for the useful life.
The following table shows the respective useful lives for intangible assets:
| | | | | |
| Category | Estimated useful life |
| Brands | 20 years |
| Intellectual property | 3 - 10 years |
| Developed technology | 6 - 15 years |
| Customer relationships | 8 - 18 years |
| Other | 2 - 10 years |
ASML ANNUAL REPORT 2021 190
As of December 31, 2021 intangible assets consist mainly of brands, intellectual property, developed technology and customer relationships obtained from the acquisitions of HMI (2016) and Cymer (2013):
| | | | | | | | | | | | | | | | | | | | |
| €, in millions | Brands | Intellectual property | Developed technology | Customer relationships | Other | Total |
| Cost | | | | | | |
| Balance at January 1, 2020 | 38.9 | | 142.4 | | 1,200.1 | | 228.6 | | 110.5 | | 1,720.5 | |
| Acquisitions through business combinations | — | | — | | 30.0 | | — | | 2.3 | | 32.3 | |
| Additions | — | | 2.5 | | — | | — | | 33.4 | | 35.9 | |
| | | | | | |
| Disposals | — | | — | | — | | — | | (0.2) | | (0.2) | |
| Effect of changes in exchange rates | — | | (0.1) | | — | | — | | (0.1) | | (0.2) | |
| Balance at December 31, 2020 | 38.9 | | 144.8 | | 1,230.1 | | 228.6 | | 145.9 | | 1,788.3 | |
| | | | | | |
| Additions | — | | — | | — | | — | | 45.6 | | 45.6 | |
| Divestment | — | | — | | (9.9) | | — | | (0.8) | | (10.7) | |
| Disposals | — | | — | | — | | — | | (0.5) | | (0.5) | |
| Effect of changes in exchange rates | — | | — | | — | | — | | (0.2) | | (0.2) | |
| Balance at December 31, 2021 | 38.9 | | 144.8 | | 1,220.2 | | 228.6 | | 190.0 | | 1,822.5 | |
| | | | | | | |
| Accumulated amortization | | | | | | |
| Balance at January 1, 2020 | 9.2 | | 70.6 | | 428.6 | | 83.2 | | 24.5 | | 616.1 | |
| Amortization | 1.9 | | 8.2 | | 82.1 | | 12.7 | | 18.6 | | 123.5 | |
| | | | | | |
| Disposals | — | | — | | — | | — | | (0.2) | | (0.2) | |
| Effect of changes in exchange rates | — | | — | | — | | — | | — | | — | |
| Balance at December 31, 2020 | 11.1 | | 78.8 | | 510.7 | | 95.9 | | 42.9 | | 739.4 | |
| Amortization | 1.9 | | 8.4 | | 84.2 | | 12.7 | | 25.8 | | 133.0 | |
| | | | | | |
| Divestment | — | | — | | (0.9) | | — | | (0.4) | | (1.3) | |
| Disposals | — | | — | | — | | — | | (0.4) | | (0.4) | |
| Effect of changes in exchange rates | — | | — | | — | | — | | (0.3) | | (0.3) | |
| Balance at December 31, 2021 | 13.0 | | 87.2 | | 594.0 | | 108.6 | | 67.6 | | 870.4 | |
| | | | | | | |
| Carrying amount | | | | | | |
| December 31, 2020 | 27.8 | | 66.0 | | 719.4 | | 132.7 | | 103.0 | | 1,048.9 | |
| December 31, 2021 | 25.9 | | 57.6 | | 626.2 | | 120.0 | | 122.4 | | 952.1 | |
The Consolidated Statements of Operations include the following amortization charges:
| | | | | | | | | | | |
| Year ended December 31 (€, in millions) | 2019 | 2020 | 2021 |
| Cost of Sales | 97.4 | | 101.8 | | 107.8 | |
| R&D Costs | 7.5 | | 12.0 | | 14.5 | |
| SG&A | 10.5 | | 9.7 | | 10.7 | |
| Total Amortization | 115.4 | | 123.5 | | 133.0 | |
As of December 31, 2021, the intangible assets not yet available for use amount to €23.6 million (2020: €24.8 million) and are allocated to Reporting Unit ASML.
During 2021 we recorded no impairment charges (2020: €0.0 million; 2019: €0.0 million).
As of December 31, 2021, the estimated amortization expenses for intangible assets for the next 5 years and thereafter:
| | | | | |
| €, in millions | Amount |
| 2022 | 135.2 | |
| 2023 | 130.4 | |
| 2024 | 121.0 | |
| 2025 | 115.6 | |
| 2026 | 109.0 | |
| Thereafter | 340.9 | |
| Total | 952.1 | |
ASML ANNUAL REPORT 2021 191
13. Property, plant and equipment, net
Accounting Policy
Property, plant and equipment are stated at cost, less accumulated depreciation and accumulated impairment losses. Costs of assets manufactured by ASML include direct manufacturing costs, production overhead and interest costs incurred for qualifying assets during the construction period. Property, plant and equipment are depreciated on a straight-line basis in the Consolidated Statements of Operations over their estimated useful lives, except for land which is not depreciated.
Evaluation systems leased to our customers under an operating lease are capitalized as Property, plant and equipment at cost and depreciated over the respective lease term. Leased assets that are returned to ASML upon expiration of the lease term are either taken back into Property, plant and equipment as they will be used internally by D&E or transferred back to Inventory to be reworked and sold.
The carrying values of prototypes, tooling and equipment that are intended to be sold, but first internally utilized for more than one year for R&D purposes, are reclassified from Inventories to Property, plant and equipment and depreciated while being internally used. When no longer required for R&D activities, the assets' carrying value is reclassified back to Inventories and reworked to make them ready for sale to our customers. These transfers are reported as Net non-cash movements to/from Inventories in our Property, plant and equipment movement schedule.
Property, plant and equipment is assessed for impairment whenever there is an indication that the carrying amount may not be recoverable using cash flow projections for the useful life.
The following table shows the respective useful lives for Property, plant and equipment:
| | | | | |
| Category | Estimated useful life |
| Buildings and constructions | 5 - 45 years |
| Machinery and equipment | 1 - 7 years |
| Leasehold improvements | 1 - 10 years |
| Furniture, fixtures and other | 3 - 5 years |
ASML ANNUAL REPORT 2021 192
Property, plant and equipment consist of the following:
| | | | | | | | | | | | | | | | | |
| €, in millions | Land and
buildings | Machinery
and
equipment | Leasehold improvements | Furniture, fixtures and other | Total |
| Cost | | | | | |
| Balance at January 1, 2020 | 2,036.5 | | 1,587.8 | | 301.0 | | 377.7 | | 4,303.0 | |
| Acquisitions through business combinations | 49.1 | | 65.7 | | — | | 10.3 | | 125.1 | |
| Additions | 359.3 | | 263.0 | | 45.7 | | 43.4 | | 711.4 | |
| Disposals | (0.4) | | (53.6) | | (5.2) | | (9.0) | | (68.2) | |
| Net non-cash movements to/from Inventories | — | | (23.9) | | — | | — | | (23.9) | |
| Effect of changes in exchange rates | (12.3) | | (10.1) | | (1.2) | | (1.8) | | (25.4) | |
| Balance at December 31, 2020 | 2,432.2 | | 1,828.9 | | 340.3 | | 420.6 | | 5,022.0 | |
| | | | | |
| Additions | 372.7 | | 389.6 | | 33.2 | | 65.3 | | 860.8 | |
| Divestment | (17.9) | | (13.4) | | — | | (4.7) | | (36.0) | |
| Disposals | (0.5) | | (199.1) | | (7.5) | | (70.3) | | (277.4) | |
| Net non-cash movements to/from Inventories | — | | 11.9 | | — | | — | | 11.9 | |
| Effect of changes in exchange rates | 17.2 | | 10.8 | | 2.6 | | 3.2 | | 33.8 | |
| Balance at December 31, 2021 | 2,803.7 | | 2,028.7 | | 368.6 | | 414.1 | | 5,615.1 | |
| | | | | | |
| Accumulated depreciation and impairment | | | | | |
| Balance at January 1, 2020 | 746.3 | | 1,022.7 | | 281.3 | | 253.4 | | 2,303.7 | |
| Depreciation | 102.0 | | 186.2 | | 21.4 | | 42.1 | | 351.7 | |
| Impairment charges | — | | 2.7 | | — | | — | | 2.7 | |
| Disposals | (0.1) | | (51.6) | | (4.7) | | (9.0) | | (65.4) | |
| Net non-cash movements to/from Inventories | — | | (29.9) | | — | | — | | (29.9) | |
| Effect of changes in exchange rates | (5.6) | | (3.9) | | (0.7) | | (0.9) | | (11.1) | |
| Balance at December 31, 2020 | 842.6 | | 1,126.2 | | 297.3 | | 285.6 | | 2,551.7 | |
| Depreciation | 95.6 | | 167.1 | | 15.9 | | 43.0 | | 321.6 | |
| Impairment charges | 3.1 | | 8.2 | | 0.2 | | — | | 11.5 | |
| Divestment | (0.6) | | (4.4) | | — | | (2.5) | | (7.5) | |
| Disposals | (0.4) | | (181.2) | | (3.9) | | (69.7) | | (255.2) | |
| Net non-cash movements to/from Inventories | — | | (7.9) | | — | | — | | (7.9) | |
| Effect of changes in exchange rates | 7.4 | | 7.6 | | 1.5 | | 1.7 | | 18.2 | |
| Balance at December 31, 2021 | 947.7 | | 1,115.6 | | 311.0 | | 258.1 | | 2,632.4 | |
| | | | | | |
| Carrying amount | | | | | |
| December 31, 2020 | 1,589.6 | | 702.7 | | 43.0 | | 135.0 | | 2,470.3 | |
| December 31, 2021 | 1,856.0 | | 913.1 | | 57.6 | | 156.0 | | 2,982.7 | |
As of December 31, 2021, the carrying amount includes assets under construction of €695.9 million (2020: €676.4 million) consisting of primarily Land and buildings, as well as Machinery and equipment.
As of December 31, 2021, the carrying amount of land amounts to €137.5 million (2020: €102.4 million).
The additions in 2021 in Land and buildings, as well as Furniture, fixtures and other, relates to construction of ASML’s logistics facility, EUV 0.55 NA (High-NA) factory and office space at our headquarters in Veldhoven, in order to support our continued growth.
The additions in 2021 in Machinery and equipment mainly relate to the upgrade and expansion of production tooling to support the growth of our business, as well as investments in prototypes of new technologies.
The additions in 2021 in Leasehold Improvements relate to installation of clean rooms and office space for leased properties in both the United States and Korea. During 2021 we did not enter into any additional leases that will require further Leasehold Improvement investments.
ASML ANNUAL REPORT 2021 193
The Consolidated Statements of Operations include the following depreciation charges:
| | | | | | | | | | | |
| Year ended December 31 (€, in millions) | 2019 | 2020 | 2021 |
| Cost of Sales | 196.1 | | 205.9 | | 188.6 | |
| R&D Costs | 117.2 | | 119.9 | | 101.4 | |
| SG&A | 12.0 | | 25.9 | | 31.6 | |
| Total Depreciation | 325.3 | | 351.7 | | 321.6 | |
14. Right-of-use assets and lease liabilities
Accounting Policy
We determine if an arrangement is a lease at inception. Operating leases are included in Right-of-use assets - Operating, Accrued & other current liabilities, and Accrued & other non-current liabilities in our consolidated balance sheets. Finance leases are included in Right-of-use assets - Finance, current portion of Long-term debt, and Long-term debt in our Consolidated Balance Sheets.
Right-of-use assets represent our right to use an underlying asset for the lease term and lease liabilities represent our obligation to make lease payments arising from the lease. Right-of-use assets and lease liabilities are recognized at commencement date based on the present value of lease payments over the lease term. As our leases do not provide an implicit rate, we use our incremental borrowing rate based on the information available at commencement date in determining the present value of lease payments. The Right-of-use assets include any lease payments made at or before the commencement date and are reduced by lease incentives. Our Right-of-use asset valuation may include options to extend or terminate the lease when it is reasonably certain that we will exercise that option. Lease expenses are recognized on a straight-line basis over the lease term.
We have lease agreements with lease and non-lease components. The lease components are accounted for separately from non-lease components. The allocation of the consideration between lease and non-lease components is based on the relative stand-alone prices of lease components included in the lease contracts.
Right-of-use assets consist of the following leases:
| | | | | | | | | | | | | | | | | |
| Operating Leases | | Finance Leases |
| Year ended December 31 (€, in millions) | 2020 | 2021 | | 2020 | 2021 |
| Properties | 158.2 | | 144.4 | | | 130.7 | | 5.3 | |
| Cars | 7.6 | | 6.7 | | | — | | — | |
| Equipment | — | | — | | | 34.1 | | — | |
| Warehouses | 11.0 | | 7.5 | | | — | | — | |
| Other | 3.3 | | 0.9 | | | — | | — | |
| Right-of-use assets | 180.1 | | 159.5 | | | 164.8 | | 5.3 | |
ASML owns the majority of real estate we utilize for manufacturing, supply chain management and general administration at our headquarter in Veldhoven, in the Netherlands. At our other locations, worldwide much of the properties we occupy are leased.
The Right-of-use assets from finance leases in 2020 mainly consisted of facilities and tooling related to our High-NA agreement with Carl Zeiss SMT, for which the funds are prepaid by ASML. This agreement was replaced by a new framework agreement. These assets no longer meet the definition of a lease upon entering into the new agreement. They are classified as part of Other assets in 2021. For further details, see Note 26 Related parties and variable interest entities.
Lease liabilities are split between current and non-current:
| | | | | | | | | | | | | | | | | |
| Operating Leases | | Finance Leases |
| Year ended December 31 (€, in millions) | 2020 | 2021 | | 2020 | 2021 |
| Current | 46.5 | | 43.7 | | | 4.7 | | 2.9 | |
| Non-current | 129.8 | | 118.0 | | | 8.1 | | 2.3 | |
| Lease liabilities | 176.3 | | 161.7 | | | 12.8 | | 5.2 | |
For the year ended December 31, 2021, Lease Liabilities under an operating lease arrangement decreased by €14.6 million, mainly due to scheduled lease payments, partly offset by new lease contracts.
ASML ANNUAL REPORT 2021 194
The Consolidated Statements of Operations include the following depreciation charges relating to these leases:
| | | | | | | | | | | | | | | | | | | | | | | |
| Operating Leases | | Finance Leases |
| Year ended December 31 (€, in millions) | 2019 | 2020 | 2021 | | 2019 | 2020 | 2021 |
| Properties | 48.2 | | 47.6 | | 49.3 | | | 2.8 | | 4.1 | | 2.9 | |
| Cars | 8.1 | | 5.5 | | 4.8 | | | — | | — | | — | |
| Equipment | — | | — | | — | | | 4.5 | | 7.0 | | — | |
| Warehouses | 4.5 | | 6.6 | | 3.0 | | | — | | — | | — | |
| Other | 12.4 | | 5.9 | | 2.4 | | | — | | — | | — | |
| Depreciation charge right-of-use assets | 73.2 | | 65.6 | | 59.5 | | | 7.3 | | 11.1 | | 2.9 | |
The total cash flows relating to the lease liabilities are as follows:
| | | | | | | | | | | | | | | | | | | | | | | |
| Operating Leases | | Finance Leases |
| Year ended December 31 (€, in millions) | 2019 | 2020 | 2021 | | 2019 | 2020 | 2021 |
| Total Cash Flows | 73.2 | | 58.8 | | 64.3 | | | 2.8 | | 2.9 | | 4.6 | |
The weighted average remaining lease term and weighted average discount rate related to the leases are as follows:
| | | | | | | | | | | | | | | | | | | | | | | |
| Operating Leases | | Finance Leases |
| Year ended December 31 (€, in millions) | 2019 | 2020 | 2021 | | 2019 | 2020 | 2021 |
| Weighted average remaining lease term (months) | 70 | 65 | 64 | | 230 | 243 | 86 |
| Weighted average discount rate (%) | 2.2 | % | 2.0 | % | 2.0 | % | | 0.7 | % | 0.5 | % | 0.5 | % |
15. Accrued and other liabilities
Accrued and other liabilities consist of the following:
| | | | | | | | |
| Year ended December 31 (€, in millions) | 2020 | 2021 |
| Costs to be paid | 233.9 | | 352.0 | |
| Personnel related items | 757.4 | | 864.7 | |
Derivative financial instruments 1 | 20.0 | | 2.8 | |
Operating lease liabilities 2 | 176.3 | | 161.7 | |
| Provisions | 84.8 | | 91.2 | |
| Standard warranty reserve | 119.1 | | 145.3 | |
| Other | 12.0 | | 68.9 | |
| Accrued and other liabilities | 1,403.5 | | 1,686.6 | |
| Less: non-current portion of accrued and other liabilities | 257.5 | | 251.1 | |
| Current portion of accrued and other liabilities | 1,146.0 | | 1,435.5 | |
1.For further details on derivative financial instruments see Note 25 Financial risk management.
2.For further details on operating lease liabilities see Note 14 Right-of-use assets and lease liabilities.
Costs to be paid as of December 31, 2021 include VAT payables and accrued costs for unbilled services provided by suppliers including contracted labor, outsourced services and consultancy.
Personnel related items mainly consist of accrued annual short-term incentive bonus plans, accrued vacation days, accrued pension premiums, accrued wage tax and accrued vacation allowance. The increase in the accrued personnel related items compared to prior year is mainly the result of the continued growth of our business, which resulted in an increase in the number of our employees.
The standard warranty reserve is based on historical product performance and total expected costs to fulfill our warranty obligation. Annually, we assess and update the standard warranty reserve based on the latest actual historical warranty costs and expected future warranty costs. Total changes in standard warranty reserve for the years 2021 and 2020 are as follows:
| | | | | | | | |
| Year ended December 31 (€, in millions) | 2020 | 2021 |
| Balance at beginning of year | 128.4 | | 119.1 | |
| Additions for the year | 137.1 | | 188.6 | |
| Utilization of the reserve | (145.9) | | (162.8) | |
| | |
| Effect of exchange rates | (0.5) | | 0.4 | |
| Balance at end of year | 119.1 | | 145.3 | |
ASML ANNUAL REPORT 2021 195
16. Long-term debt and interest and other costs
Accounting policy
Long-term debt represents debt issued privately without registration with a government authority and is payable to others under the terms of a signed agreement. Long-term debt is initially recognized at fair value and subsequently measured at amortized cost. Debt is qualified as long-term debt as long as the group has an unconditional right to defer settlement of the liability for at least 12 months after the reporting period.
Interest accruals and payments relating to Long-term debt are accounted for as part of Accrued and other liabilities. Interest and other costs should be accrued and recorded with the passage of time over the agreed term, regardless of when the interest receipt or payment has taken place.
Long-term debt consists of the following:
| | | | | | | | |
| Year ended December 31 (€, in millions) | 2020 | 2021 |
€500 million 0.625% senior notes issued July 2016 and principal due July 7th 2022 interest annually payable on July 7th, carrying amount | 501.5 | | 500.5 | |
€750 million 3.375% senior notes issued September 2013 and principal due September 19th 2023 interest annually payable on September 19th, carrying amount | 802.1 | | 780.6 | |
€1,000 million 1.375% senior notes issued July 2016 and principal due July 7th 2026 interest annually payable on July 7th, carrying amount | 1,028.0 | | 1,003.2 | |
€750 million 1.625% senior notes issued November 2016 and principal due May 28th 2027 interest annually payable on May 28th, carrying amount | 795.4 | | 769.3 | |
€750 million 0.250% senior notes issued February 2020 and principal due February 25th 2030 interest annually payable on February 25th, carrying amount | 740.7 | | 741.7 | |
€750 million 0.625% senior notes Issued May 2020 and principal due May 7th 2029 interest annually payable on May 7th, carrying amount | 746.8 | | 747.1 | |
| Debt acquired with Berliner Glas | 55.5 | | 36.4 | |
| Other | 8.2 | | 5.3 | |
| Long-term debt | 4,678.2 | | 4,584.1 | |
| Less: current portion of long-term debt | 15.4 | | 509.1 | |
| Non-current portion of long-term debt | 4,662.8 | | 4,075.0 | |
All senior notes are redeemable at the option of ASML, in whole or in part, at any time by paying a make whole premium, and unless previously redeemed, will be redeemed at 100% of their principal amount on the due date.
Our obligations to make principal repayments under our senior notes and other borrowing arrangements excluding interest expense as of December 31, 2021:
| | | | | |
| €, in millions | Amount |
| 2022 | 508.6 | |
| 2023 | 755.9 | |
| 2024 | 4.5 | |
| 2025 | 4.5 | |
| 2026 | 1,004.5 | |
| Thereafter | 2,263.6 | |
| Total debt maturities | 4,541.6 | |
For the year 2022, the obligations mainly relate to principal repayment of the senior notes due on July 7, 2022. The years thereafter mainly relate to repayments of principals under the long-term senior notes.
Eurobonds
The following table summarizes the carrying amount of our outstanding Eurobonds, including the fair value of interest rate swaps used to hedge the change in the fair value of the Eurobonds:
| | | | | | | | |
| Year ended December 31 (€, in millions) | 2020 | 2021 |
| Amortized cost amount | 4,474.1 | | 4,478.5 | |
Fair value interest rate swaps 1 | 140.4 | | 63.9 | |
| Carrying amount | 4,614.5 | | 4,542.4 | |
1.The fair value of the interest rate swaps excludes accrued interest.
ASML ANNUAL REPORT 2021 196
We use interest rate swaps to minimize the net interest exposure for the group by aligning the interest terms of the available cash and the interest bearing debt. The fair value changes of these interest rate swaps are recorded on the Consolidated Balance Sheets under Other assets and the carrying amount of the Eurobonds is adjusted for these fair value changes. We did not enter into additional interest rate swaps in connection with the Eurobonds issued in 2020.
The following table summarizes the estimated fair value of our Eurobonds:
| | | | | | | | |
| Year ended December 31 (€, in millions) | 2020 | 2021 |
| Principal amount | 4,500.0 | | 4,500.0 | |
| Carrying amount | 4,614.5 | | 4,542.4 | |
Fair value 1 | 4,798.8 | | 4,673.9 | |
1.Source: Bloomberg Finance LP.
The fair value of our Eurobonds is estimated based on quoted market prices as of December 31, 2021. The fair value deviates from the principal amount, due to changes in market interest rates and credit spreads since the issue of our Eurobonds which carry a fixed coupon interest rate.
Debt acquired with Berliner Glas
The loans of Berliner Glas are comprised of a mortgage loan of €24.1 million with an annual interest rate of 0.5% repayable in 2034, revolving credit facilities at various financial institutions of €12.3 million with an annual interest rate between 0.8% and 1.2% that are repayable annually through 2024.
Lines of credit
We maintain an available committed credit facility, with a group of banks, of €700.0 million as of December 31, 2021 and as of December 31, 2020. No amounts were outstanding under the committed credit facility at the end of 2021 and 2020. This facility of €700.0 million was renegotiated on July 3, 2019, with an original maturity date of July 3, 2024. The facility included two 1-year extension options. The second 1-year extension was exercised in June 2021. This extends the maturity from July 2025 to July 2026. Outstanding amounts under this credit facility will bear an interest of Euribor plus a margin. The margin depends on our credit rating and ESG score.
We have a non-committed guarantee facility of €85.0 million under which guarantees in the ordinary course of business, such as customs or rental guarantees, can be provided to third parties. As of 2019, ASML entered into a non-committed credit facility for our Chinese subsidiary of €130.0 million. The non-committed credit facility covers bank guarantees, standby letters of credit, as well as advances up to €75.0 million. No amounts were outstanding under this facility. Outstanding amounts under the non-committed facility will bear interest based on market conditions at the moment of draw down.
Interest and other, net
Interest and other, net consist mainly of interest income and interest expenses. In 2021, the interest expense component is €54.6 million (2020: €43.3 million; 2019: €36.6 million). The expenses mainly relate to interest expense on our Eurobonds, interest rate swaps and hedges, and amortized financing costs, and to negative interest on Cash and cash equivalents.
17. Commitments and contingencies
Commitments
We have various contractual obligations, some of which are required to be recorded as liabilities in our Consolidated Balance Sheets, including long- and short-term debt and lease commitments. Other contractual obligations, namely purchase obligations, are generally not required to be recognized as liabilities but are required to be disclosed.
Our contractual obligations as of December 31, 2021 can be summarized as follows:
| | | | | | | | | | | | | | | | | | | | | | | |
| Payments due by period (€, in millions) | Total | 1 year | 2 year | 3 year | 4 year | 5 year | >5 years |
Long-Term Debt Obligations, including interest1 | 4,806.9 | | 570.3 | | 814.2 | | 37.5 | | 37.6 | | 1,037.7 | | 2,309.6 | |
Lease Obligations 2 | 161.7 | | 43.7 | | 35.7 | | 21.3 | | 16.6 | | 15.4 | | 29.0 | |
| Purchase Obligations | 8,527.4 | | 6,974.0 | | 814.1 | | 405.7 | | 223.4 | | 74.2 | | 36.0 | |
| Total Contractual Obligations | 13,496.0 | | 7,588.0 | | 1,664.0 | | 464.5 | | 277.6 | | 1,127.3 | | 2,374.6 | |
1.Long-term debt obligations mainly relate to principal amounts and interest payments of our Eurobonds. For the amounts excluding interest expenses and for further details see Note 16 Long-term debt and interest and other costs.
2.For further details see Note 14 Right-of-use assets and lease liabilities.
ASML ANNUAL REPORT 2021 197
We have purchase obligations towards suppliers in the ordinary course of business which mainly relate to goods and services for our operations. The general terms and conditions of the agreements relating to the major part of our purchase obligations as of December 31, 2021 contain clauses that enable us to delay or cancel delivery of ordered goods and services up to the dates specified in the purchase agreements, in line with the timing of future sales. The terms and conditions that we normally agree with our suppliers give us additional flexibility to adapt our purchase obligations to our requirements in light of the cyclically and technological developments inherent in the industry in which we operate.
Contingencies
ASML is subject to proceedings, litigation and other actual or potential claims. In addition, ASML’s customers may be subject to claims of infringement from third parties alleging that the ASML equipment used by those customers in the manufacture of semiconductor products, and / or the methods relating to use of the ASML equipment, infringes one or more patents issued to those third parties. If these claims were successful, ASML could be required to indemnify such customers for some or all of the losses incurred or damages assessed against them as a result of that infringement.
In connection with any proceedings and claims, our management evaluates, based on the relevant facts and legal principles, the likelihood of an unfavorable (or favorable) outcome, and whether the amount of the loss (or gain) can be reasonably estimated. Judgment is required in these evaluations, including judgments regarding the validity of asserted claims and the likely outcome of legal and administrative proceedings. The outcome of these proceedings, however, is subject to a number of factors beyond our control, most notably the uncertainty associated with predicting decisions by courts and administrative agencies. In addition, estimates of the potential costs (or gains) associated with legal and administrative proceedings frequently cannot be subjected to any sensitivity analysis, as damage estimates or settlement offers by claimants may bear little or no relation to the eventual outcome. Finally, in any particular proceeding, we may agree to settle or to terminate a claim or proceeding in which we believe that it would ultimately prevail where we believe that doing so, when taken together with other relevant commercial considerations, is more effective than engaging in an expensive and protracted litigation, the outcome of which is uncertain.
As of December 31, 2021, management has determined that ASML does not have any material contingency which is considered probable or reasonably probable for each year presented in our Consolidated Balance Sheets.
18. Personnel expenses and employee information
Personnel expenses for all payroll employees were as follows:
| | | | | | | | | | | |
| Year ended December 31 (€, in millions) | 2019 | 2020 | 2021 |
| Wages and salaries | 2,124.4 | | 2,519.6 | | 2,842.7 | |
| Social security expenses | 181.9 | | 208.1 | | 249.8 | |
| Pension and retirement expenses | 152.5 | | 182.6 | | 229.2 | |
| Share-based payments | 74.6 | | 53.9 | | 117.5 | |
| Personnel expenses | 2,533.4 | | 2,964.2 | | 3,439.2 | |
The continued increase in personnel expenses is mainly due to an increase in payroll employees to support the continued growth of our business. The personnel expenses in 2020 do not include any expenses of Berliner Glas, since ASML consolidates Berliner Glas using a one-quarter lag.
The average number of payroll employees in FTEs was:
| | | | | | | | | | | |
| Average number of payroll employees in FTEs | 2019 | 2020 | 2021 |
| Netherlands | 11,376 | | 12,812 | | 14,222 | |
| Worldwide | 22,192 | | 24,727 | | 28,223 | |
The total number of payroll and temporary employees as of December 31 in FTEs per sector was:
| | | | | | | | | | | |
| Year ended December 31 (in FTE) | 2019 | 2020 | 2021 |
| Customer Support | 5,953 | | 6,429 | | 7,485 | |
| Manufacturing and Supply Chain Management | 5,933 | | 7,680 | | 8,237 | |
| Strategic Supply Management | 326 | | 346 | | 707 | |
| General & Administrative | 1,898 | | 2,061 | | 2,761 | |
| Sales and Mature Products and Services | 624 | | 744 | | 766 | |
| Research & Development | 10,166 | | 10,813 | | 12,060 | |
| Total | 24,900 | | 28,073 | | 32,016 | |
| Less: Temporary employees | 1,681 | | 1,459 | | 2,155 | |
| Payroll employees | 23,219 | | 26,614 | | 29,861 | |
ASML ANNUAL REPORT 2021 198
Short-term incentive bonus plans
We have annual performance related short-term incentive (STI) bonus plans for our employees. Under these plans, the employee bonus payout depends on the employee's job grade, the type of bonus plan and the company/individual performance. The employee bonus payout (excluding the Board of Management) ranges between 0.0% and 117.0% of their annual base gross salary. The 2021 STI bonus is accrued for as part of Accrued and other liabilities in the Consolidated Balance Sheets and will be paid in the first quarter of 2022.
The STI bonus expenses for the Board of Management and other employees were as follows:
| | | | | | | | | | | |
| Year ended December 31 (€, in millions) | 2019 | 2020 | 2021 |
| Board of Management | 5.1 | | 5.4 | | 4.4 | |
| Former Board of Management | — | | — | | 0.2 | |
| Other employees | 269.1 | | 402.5 | | 423.5 | |
| Total STI bonus expenses | 274.2 | | 407.9 | | 428.1 | |
19. Employee benefits
Accounting policy
Contributions to defined contribution retirement benefit plans are recognized as an expense when employees have rendered service entitling them to the contributions. Payments made to state-managed retirement benefit schemes are dealt with as payments to defined contribution plans where our obligations under the plans are equivalent to those arising in a defined contribution retirement benefit plan.
We maintain one multi-employer union defined benefit pension plan and various other defined contribution pension plans covering a substantial part of our employees. ASML accounts for its multi-employer defined benefit plan as if it were a defined contribution plan for the following reasons:
•ASML is affiliated to an industry-wide pension fund and uses the pension scheme in common with other participating companies
•Under the regulations of the pension plan, the only obligation these participating companies have towards the pension fund is to pay the annual premium liability. Participating companies are under no obligation whatsoever to pay off any deficits the pension plan may incur. Nor have they any claim to any potential surpluses
Our pension and retirement expenses for all employees for the years ended December 31, 2021, 2020 and 2019 were:
| | | | | | | | | | | |
| Year ended December 31 (€, in millions) | 2019 | 2020 | 2021 |
| Pension plan based on multi-employer union plan | 96.6 | | 126.8 | | 161.7 | |
| Pension plans based on defined contribution & other plans | 55.9 | | 55.8 | | 67.5 | |
| Pension and retirement expenses | 152.5 | | 182.6 | | 229.2 | |
Multi-employer union plan
In accordance with the collective bargaining agreements effective for the industry in which we operate, which has no expiration date, there are 15,414 eligible employees in the Netherlands (51.6% of our total payroll employees) that participate in a multi-employer union plan. Our net periodic pension cost for this multi-employer union plan for any period is the amount of the required employer contribution for that period.
This multi-employer union plan is managed by PME (Stichting Pensioenfonds van de Metalektro) and this plan covers approximately 1,466 companies and approximately 167,768 contributing members. Every participating company contributes a premium that is based on the same contribution rate. This contribution rate can fluctuate yearly based on the coverage ratio of the multi-employer union plan. For 2021, the contribution percentage was 27.6% (2020: 22.7%, 2019: 22.7%). For 2021, our contribution to this multi-employer union plan (including the premiums paid by employees), was 13.6% (2020: 14.0%, 2019: 11.7%) of the total contribution to the plan. For 2022, we expect to contribute around €240.0 million to this plan (including the premiums paid by employees). The pension rights of each employee are based upon the employee’s average salary during employment.
The PME multi-employer union plan monitors its risks on a global basis and is subject to regulation by Dutch governmental authorities. By Dutch law (the Dutch Pension Act), a multi-employer union plan must be monitored against specific criteria, including the coverage ratio of the plan’s assets to its obligations. The coverage ratio is calculated by dividing the funds capital by the total sum of pension liabilities and is based on actual market interest rates.
ASML ANNUAL REPORT 2021 199
During 2021 the coverage ratio of PME improved to 107.9% as per December 31, 2021 (December 31, 2020: 97.2%). The pension payouts during 2021 were not reduced, since PME made use of an extended temporary ministerial exemption regulation. The legally required minimal coverage ratio is 104.3% (2020: 104.3%). A recovery plan is in place to improve the coverage ratio towards 118%. ASML has no obligation to pay off any deficits the pension fund may incur, nor do we have any claim to any potential surpluses.
Defined contribution and other pension plans
We also participate in several other defined contribution pension plans (inside and outside the Netherlands), with our expenses for these plans equaling the employer contributions made in the relevant period.
Deferred compensation plans
For our US employees we have a non-qualified deferred compensation plan that allows a select group of management or highly compensated employees to defer a portion of their salary, bonus, and commissions. The plan allows us to credit additional amounts to the participants’ account balances. The participants divide their funds among the investments available in the plan. Participants elect to receive their funds in future periods after the earlier of their employment termination or their withdrawal election, at least 3 years after deferral. Expenses were close to nil relating to this plan in 2021, 2020 and 2019. As of December 31, 2021, our liability under deferred compensation plans was €82.4 million (2020: €68.3 million).The related compensation plan assets are €81.4 million (2020: €67.0 million).
20. Share-based compensation
ASML has the following plans in place for its employees:
•Long-term incentive bonus plans
•Option plans
•Employee purchase plan
Long-term incentive bonus plans
Our LTI plans are covered by an overarching Employee Umbrella Share Plan, which is effective as of January 1, 2014 and covers all employees. The main purpose of the grants of Equity Incentives under this Employee Umbrella Share Plan is to continue to attract, reward and retain qualified and experienced industry professionals in an international labor market. All grants under the Employee Umbrella Share Plan typically have a 2.5 to 3 year vesting period and are subject to performance and/or service criteria.
As part of our long-term incentive (LTI) bonus, employees can be granted either a service or performance share based-payment plan. For service-type plans, shares are granted at grant date and after having been in service for a set period, the participant is awarded these shares at the vesting date. For performance plans, the same conditions apply as a service-type plan. Additionally, the shares are conditionally granted and awarded based on the company specific performance criteria, which can be split between market and non-market based elements. These shares vest after completion of the service period and the performance reached at vesting date.
The General Meeting approved the adoption of the most recent remuneration policy for the Board of Management and the number of shares to be issued. The most recent remuneration policy includes the target and maximum levels of the LTI plans, the performance measures and pay-out zone percentages. The policies for employees are approved by the Board of Management. The General Meeting also approved the restrictions and limits to the Board of Management for issuance/granting of ordinary shares, limits for restricting or excluding the preemption rights accruing to shareholder and the restrictions and limits to the Board of Management for repurchasing ordinary shares on behalf of the company.
ASML ANNUAL REPORT 2021 200
The table below shows the performance criteria and the corresponding weight of the LTI performance plans granted in 2021.
| | | | | | | | |
| LTI performance plan criteria | Market / Non-Market element | Weight |
| Total Shareholder Return | Market | 30 | % |
| ROAIC | Non-Market | 40 | % |
| Technology Leadership Index | Non-Market | 20 | % |
| Sustainability | Non-Market | 10 | % |
| Total | | 100 | % |
Accounting Policy
The fair value of the market based element is measured at the grant date incorporating the expected vesting and expected value at vesting, using a tailored Monte Carlo simulation model. The fair value of the service plans and the non-market based elements of the performance plans is the share price at grant date less the present value of expected dividends during the vesting period, as participants are not entitled to dividends payable and voting rights during the vesting period. The likelihood of the conditions being met for service and non-market performance plans is assessed as part of the company’s best estimate of the number of equity instruments that will ultimately vest.
Participants are entitled to a conditional grant of company shares upon awarding. Performance plans are subject to cliff vesting and are accounted for on a straight line basis. Service only plans are subject to graded vesting. Each installment of the plan is therefore accounted as a separate grant with a separate fair value. This means that each installment will be separately measured and attributed to expense over the related vesting period. Expenses for the market based element are recognized during vesting at a fixed vesting level (as the vesting expectation is incorporated in the fair value) provided that all other performance conditions are met. Expenses for the non-market based elements and service plans are recognized during vesting at expected vesting levels, which are updated during vesting period as necessary, with a final update/adjustment at vesting date. All share based remuneration expenses are recognized as personnel expense, with a corresponding entry in equity, during the vesting period of the award. Share based remuneration expenses are included in the same income statement line or lines in the functional grouped consolidated statement of operations as the compensation paid to the employees receiving the stock-based awards.
The most important assumptions for the calculation of the fair value of shares for the LTI performance plans, which include a market based performance criteria, are set out in the following table:
| | | | | | | | | | | |
| Year ended December 31 | 2019 | 2020 | 2021 |
| Share price in € at grant date | 199.5 | | 270.7 | | 462.9 | |
| Expected volatility ASML | 29.8 | % | 28.9 % | 38.5 | % |
| Expected volatility PHLX index | 24.8 | % | 24.7 % | 35.3 | % |
| Vesting period | 2.5 years | 2.9 years | 2.9 years |
| Dividend yield | 1.1 | % | 0.9 % | 0.6 | % |
| Risk free interest rate (Eurozone) | (0.8) | % | (0.6) | % | (0.8) | % |
| Risk free interest rate (US) | 1.8 | % | 1.5 % | 0.2 | % |
Expenses for LTI plans, including the Board of Management, were as follows:
| | | | | | | | | | | |
| Year ended December 31 (€, in millions) | 2019 | 2020 | 2021 |
| Total incurred expenses | 74.6 | | 53.9 | | 117.5 | |
| Recognized income tax benefit (excluding excess income tax benefits) | 5.9 | | 6.6 | | 8.2 | |
| Total expected expenses in future periods | 95.8 | | 85.9 | | 125.4 | |
| Weighted average period in which these expected expenses are to be recognized | 1.6 years | 1.6 years | 1.7 years |
Details with respect to shares granted and vested during the year are set out in the following table:
| | | | | | | | | | | | | | | | | | | | |
| | EUR-denominated | USD-denominated |
| Year ended December 31 | 2019 | 2020 | 2021 | 2019 | 2020 | 2021 |
| Total fair value at vesting date of shares vested during the year (in millions) | 58.7 | | 124.9 | | 156.9 | | 54.9 | | 133.9 | | 164.0 | |
| Weighted average fair value of shares granted | 190.33 | | 297.05 | | 547.79 | | 206.90 | | 302.75 | | 498.64 | |
ASML ANNUAL REPORT 2021 201
A summary of the status of conditionally outstanding shares as of December 31, 2021, and changes during the year ended December 31, 2021, is presented below:
| | | | | | | | | | | | | | |
| | EUR-denominated | USD-denominated |
| | Number
of shares | Weighted
average
fair value at
grant date | Number
of shares | Weighted
average
fair value at
grant date |
| Conditional shares outstanding at January 1, 2021 | 555,094 | | 201.44 | | 444,754 | | 225.26 | |
| Granted | 120,665 | | 547.79 | | 69,440 | | 498.64 | |
| Vested | (222,085) | | 273.86 | | (205,945) | | 270.80 | |
| Forfeited | (1,469) | | 458.46 | | (11,248) | | 349.44 | |
| Conditional shares outstanding at December 31, 2021 | 452,205 | | 303.32 | | 297,001 | | 416.07 | |
Option plans
Since 2017 we no longer grant any options, but there are still outstanding options which may be exercised by employees.
Accounting Policy
The grant-date fair value of stock options was estimated using a Black-Scholes option valuation model. This Black-Scholes model required the use of assumptions, including expected share price volatility, the estimated life of each award and the estimated dividend yield. The risk-free interest rate used in the model is determined, based on an index populated with euro denominated European government agency bonds with high credit ratings and with a life equal to the expected life of the equity settled share-based payments. Our option plans typically vest over a 3-year service period with any unexercised stock options expiring 10 years after the grant date. Options granted have fixed exercise prices equal to the closing price of our shares listed at Euronext Amsterdam on grant date. The purchase of shares against the exercise price is settled with the employees involved through deductions on their salary and the issuance of shares upon exercising the stock options are deducted from our treasury shares.
Details with respect to stock options exercised and outstanding are set out in the following table:
| | | | | | | | | | | | | | | | | | | | |
| | EUR-denominated | USD-denominated |
| Year ended December 31 | 2019 | 2020 | 2021 | 2019 | 2020 | 2021 |
| | | | | | |
| Weighted average share price at the exercise date of stock options | 201.52 | | 302.20 | | 583.33 | | 225.70 | | 355.44 | | 658.16 | |
| Aggregate intrinsic value of stock options exercised (in millions) | 4.3 | | 4.8 | | 5.7 | | 2.3 | | 3.7 | | 4.1 | |
| Weighted average remaining contractual term of currently exercisable options (in years) | 4.16 | 3.55 | 2.81 | 4.40 | 3.66 | 2.93 |
| Aggregate intrinsic value of exercisable stock options (in millions) | 17.7 | | 22.4 | | 36.7 | | 11.8 | | 16.9 | | 24.9 | |
| Aggregate intrinsic value of outstanding stock options (in millions) | 17.7 | | 22.4 | | 36.7 | | 11.8 | | 16.9 | | 24.9 | |
The number and weighted average exercise prices of stock options as of December 31, 2021, and changes during the year then ended are presented below:
| | | | | | | | | | | | | | |
| | EUR-denominated | USD-denominated |
| | Number
of options | Weighted
average
exercise price
per ordinary
share (EUR) | Number
of options | Weighted
average
exercise price
per ordinary
share (USD) |
| Outstanding, January 1, 2021 | 68,540 | | 70.02 | | 42,255 | | 86.87 | |
Granted 1 | — | | — | | — | | — | |
| Exercised | (10,717) | | 48.77 | | (7,004) | | 69.32 | |
| Forfeited | 100 | | 28.77 | | — | | — | |
| Expired | — | | — | | — | | — | |
| Outstanding, December 31, 2021 | 57,923 | | 73.87 | | 35,251 | | 90.36 | |
| Exercisable, December 31, 2021 | 57,923 | | 73.87 | | 35,251 | | 90.36 | |
1.As of 2017 we no longer grant options to our employees.
ASML ANNUAL REPORT 2021 202
Details with respect to stock options exercised in the relevant year and outstanding stock options as of December 31, 2021 are set out in the following table:
| | | | | | | | | | | | | | | | | | | | |
| EUR-denominated | | USD-denominated |
Range of exercise prices (€) | Number of outstanding options | Weighted average remaining contractual life of outstanding (years) | | Range of exercise prices (USD) | Number of outstanding options | Weighted average remaining contractual life of outstanding (years) |
| | | | | | |
| | | | | | |
| | | | | | |
| | | | | | |
25 - 40 | 234 | | 0.08 | | 25 - 40 | — | | 0.00 |
40 - 50 | 5,902 | | 0.80 | | 40 - 50 | 291 | | 0.05 |
50 - 60 | 5,376 | | 1.95 | | 50 - 60 | 1,699 | | 0.62 |
60 - 70 | 12,355 | | 1.94 | | 60 - 70 | 393 | | 1.06 |
70 - 80 | 10,920 | | 3.35 | | 70 - 80 | 843 | | 1.30 |
80 - 90 | 11,625 | | 3.85 | | 80 - 90 | 9,036 | | 2.89 |
90 - 100 | 11,511 | | 3.69 | | 90 - 100 | 16,062 | | 3.02 |
100 - 110 | — | | 0.00 | | 100 - 110 | 6,927 | | 3.74 |
| | | | | | |
| Total | 57,923 | | 2.81 | | Total | 35,251 | | 2.93 |
Employee purchase plan
Additionally, we also offer an Employee Purchase Plan to our payroll employees, except the Board of Management who is excluded from participation in this plan. Through this plan, payroll employees are given the opportunity to buy our shares using their monthly paycheck. The maximum amount for which employees can participate in the plan amounts to 10.0% of their annual gross base salary. When employees retain the shares for a minimum of 12 months, we will pay out a 20.0% gross cash bonus on the initial participation amount.
Accounting Policy
Employee purchase plans are accounted on an accrual basis. The shares for employee purchase plans are issued on a quarterly basis and the share purchase price is based on the closing share price of our listed shares on grant date, which is the date after our quarterly filings. The purchased shares by employees are deducted from our treasury shares.
In 2021, ASML received €49.0 million (2020: €37.9 million and 2019: €27.2 million) from issuance of shares for this plan.
21. Income taxes
Accounting Policy
The asset and liability method is used in accounting for income taxes. Under this method, deferred tax assets and liabilities are recognized for the tax effect of operating losses and tax credit carry forward as well as for tax consequences attributable to differences between the balance sheets carrying amounts of existing assets and liabilities and their respective tax bases. If it is more likely than not that the carrying amounts of deferred tax assets will not be realized, a valuation allowance is recorded for the difference. Income tax expense includes current and deferred taxes on profit, related interest and penalties, non-recoverable withholding taxes that qualify as income tax, as well as actual or potential withholding taxes on current and expected dividend income from group companies.
Deferred tax assets and liabilities are measured using enacted tax rates expected to apply to taxable income in the years in which temporary differences, net operating losses and tax credit carry forwards are expected to be recovered or settled. The effect on deferred tax assets and liabilities of a change in tax rates is recognized in the Consolidated Statements of Operations in the period that includes the enactment date. Deferred income taxes originally recognized through OCI are recycled through earnings in future periods upon release of the connected item from OCI to the statement of income.
We assess unrecognized tax benefits based on a two-step process. The first step is to evaluate the tax position for recognition by determining if the weight of available evidence indicates that it is more likely than not that the position will be sustained on audit, including resolution of related appeals or litigation processes, if any. The second step is to measure the tax benefit as the largest amount that is more than 50% likely of being realized upon settlement. While we believe we have appropriate support for the positions taken on our tax returns, we regularly assess the potential outcomes of examinations by tax authorities in determining the adequacy of our income tax expense, and adjust the income tax expense, income taxes payable and deferred taxes in the period in which the facts that give rise to a revision become known.
Income taxes are affecting our Consolidated Statements of Operations, Consolidated Statements of Comprehensive Income and Consolidated Balance Sheets. The disclosure of the Income taxes is therefore split into:
•Income tax expense
•Liability for unrecognized tax benefits
•Deferred taxes
ASML ANNUAL REPORT 2021 203
Income tax expense
The components of the income tax expense are as follows:
| | | | | | | | | | | |
| Year ended December 31 (€, in millions) | 2019 | 2020 | 2021 |
| Netherlands | 2,441.2 | | 3,574.6 | | 5,982.8 | |
| Foreign | 324.6 | | 442.0 | | 722.7 | |
| Income before income taxes | 2,765.8 | | 4,016.6 | | 6,705.5 | |
| | | | |
| Income tax expense current | (305.5) | | (407.7) | | (865.0) | |
| Income tax expense deferred | 74.8 | | 1.4 | | (28.6) | |
| Income tax expense Netherlands | (230.7) | | (406.3) | | (893.6) | |
| | | | |
| Income tax expense current | (118.4) | | (375.3) | | (523.5) | |
| Income tax expense deferred | 157.4 | | 230.1 | | 395.7 | |
| Income tax expense Foreign | 39.0 | | (145.2) | | (127.8) | |
| | | | |
| Total income tax expense current | (423.9) | | (783.0) | | (1,388.5) | |
| Total income tax expense deferred | 232.2 | | 231.5 | | 367.1 | |
| Total income tax expense | (191.7) | | (551.5) | | (1,021.4) | |
Current and deferred tax expense can be further broken down into:
| | | | | | | | | | | |
| Year ended December 31 (€, in millions) | 2019 | 2020 | 2021 |
| Current year tax expense | (470.6) | | (743.7) | | (1,367.2) | |
| Prior year tax expense | 46.7 | | (39.3) | | (21.3) | |
| Current tax expense | (423.9) | | (783.0) | | (1,388.5) | |
| | | | | | | | | | | |
| Year ended December 31 (€, in millions) | 2019 | 2020 | 2021 |
| Changes to recognition of tax losses and tax credits | 7.6 | | (56.9) | | (37.2) | |
| | | |
| Prior year tax expense | 9.8 | | 27.0 | | (2.4) | |
| Tax rate changes | — | | 15.0 | | 1.5 | |
| Origination and reversal of temporary differences, tax losses and tax credits | 214.8 | | 246.4 | | 405.2 | |
| Deferred tax expense | 232.2 | | 231.5 | | 367.1 | |
The Dutch statutory tax rate was 25.0% in 2021, 2020 and 2019. Tax amounts in other jurisdictions are calculated at the rates prevailing in the relevant jurisdictions.
The effective tax rate increased to 15.2% in 2021, compared to 13.7% in 2020. The higher rate is mainly due to an increase in the innovation box rate in the Netherlands changing from 7% to 9% as of 2021.
The reconciliation of the income tax expense from the Dutch statutory rate to the effective income tax rate is as follows:
| | | | | | | | | | | | | | | | | | | | |
| Year ended December 31 (€, in millions) | 2019 | %1 | 2020 | %1 | 2021 | %1 |
| Income before income taxes | 2,765.8 | | 100.0 | % | 4,016.6 | | 100.0 | % | 6,705.5 | | 100.0 | % |
| Income tax expense based on ASML’s domestic rate | (691.4) | | 25.0 | % | (1,004.1) | | 25.0 | % | (1,676.4) | | 25.0 | % |
| Effects of tax rates in foreign jurisdictions | 5.0 | | (0.2) | % | 0.9 | | — | % | (4.6) | | 0.1 | % |
| Adjustments in respect of tax exempt income | 7.2 | | (0.3) | % | 0.2 | | — | % | — | | — | % |
| Adjustments in respect of tax incentives | 351.0 | | (12.7) | % | 510.4 | | (12.7) | % | 727.3 | | (10.8) | % |
| Adjustments in respect of prior years’ current taxes | 46.7 | | (1.7) | % | (39.3) | | 1.0 | % | (21.3) | | 0.3 | % |
| Adjustments in respect of prior years’ deferred taxes | 9.8 | | (0.4) | % | 27.0 | | (0.7) | % | (2.4) | | — | % |
| Movements in the liability for unrecognized tax benefits | (16.9) | | 0.6 | % | (41.0) | | 1.0 | % | (21.6) | | 0.3 | % |
| Tax effects in respect of acquisition/restructuring related items | 89.8 | | (3.2) | % | — | | — | % | 35.9 | | (0.5) | % |
| Change in valuation allowance | 7.6 | | (0.3) | % | (56.9) | | 1.4 | % | (37.2) | | 0.6 | % |
| Equity method investments | (19.7) | | 0.7 | % | (20.9) | | 0.5 | % | (46.7) | | 0.7 | % |
| Effect of change in tax rates | — | | — | % | 15.0 | | (0.4) | % | 1.5 | | — | % |
| Other (credits) and non-tax deductible items | 19.2 | | (0.7) | % | 57.2 | | (1.4) | % | 24.1 | | (0.4) | % |
| Income tax expense | (191.7) | | 6.8 | % | (551.5) | | 13.7 | % | (1,021.4) | | 15.2 | % |
1.As a percentage of income before income taxes.
The individual line items in the table above are explained in more detail below.
ASML ANNUAL REPORT 2021 204
Income tax expense based on ASML’s domestic rate
The income tax expense based on ASML’s domestic rate is based on the Dutch statutory income tax rate. It reflects the income tax expense that would have been applicable assuming that all of our income is taxable against the Dutch statutory tax rate and there are no differences between taxable base and financial results and no tax incentives are applied.
Effects of tax rates in foreign jurisdictions
A portion of our results is realized in countries other than the Netherlands where different tax rates are applicable. The effect can differ from year to year depending on the profit before tax in respective foreign jurisdictions.
Adjustments in respect of tax exempt income
In past years in certain jurisdictions part of the income generated was tax exempted. In conjunction with changed facts and circumstances this effect is significantly reduced as of 2020 and stable in 2021.
Adjustments in respect of tax incentives
Adjustments in respect of tax incentives mainly relate to a reduced tax rate as a result of application of the Dutch Innovation Box, which is a facility under Dutch corporate tax law pursuant to which qualified income associated with R&D is subject to an effective tax rate of 9.0% in 2021. The effective innovation box tax rate was 7% in 2020 and 2019. The innovation box benefit is determined according to Dutch laws and published tax policy, whereby the application has been confirmed in an agreement between ASML and the Dutch tax authorities that is applicable for the years through 2023 assuming facts and circumstances do not change.
Furthermore this category includes the benefit of the Foreign Derived Intangible Income (FDII) deduction which is applicable at the level of our US group companies. The FDII deduction is a facility under US corporate tax law which reduces the effective tax rate on income derived from tangible and intangible products and services in foreign markets.
The higher amount in 2021 compared to prior years is mainly caused by an increase in innovation box benefit resulting from an increased level in income before tax at the level of our Dutch group companies.
Adjustments in respect of prior years' current taxes
The adjustments in respect of prior years’ current taxes relate to differences between the initially estimated income taxes and final corporate income tax returns filed or arrangements agreed upon with tax authorities.
The benefit in 2019 mainly related to the FDII deduction which was taken into account in our 2018 tax filings in the US for the first time.
Adjustments in respect of prior years’ deferred taxes
The movements in the adjustments in respect of prior years’ deferred taxes also mainly relate to differences between the initially estimated income taxes and final corporate income tax returns filed. Additionally it includes some smaller adjustments on the deferred tax positions initially recorded.
Movements in the liability for unrecognized tax benefits
In 2021, similar to prior years, the effective tax rate was impacted by movements in the liability for unrecognized tax benefits. The movement for 2021 is mainly driven by pending dialogues with Dutch and foreign tax authorities in the area of transfer pricing, as well as by uncertainties in FDII deduction claimed at the level of our US group companies.
Tax effects in respect to acquisition/restructuring related items
The 2019 effect was driven by an internal restructuring of our HMI group companies concluded in that year. As a result of that restructuring a deferred tax asset was recognized in 2019 for book to tax differences on intangible fixed assets transferred as part of the restructuring. For years 2020 and 2021 this restructuring has no additional impact on the effective tax rate.
The 2021 effect relates to divestment of part of the Berliner Glass entities, whereby the commercial transaction result to a large extent is exempt for income tax purposes.
Change in valuation allowance
The higher effect in 2020 and 2021 as compared to 2019 is mainly caused by the recognition of R&D and withholding tax credits during the year at the level of our group companies in the Netherlands and the US as of which it is considered not more likely than not that these can be realized in future years.
Equity method investments
This line includes the income tax expense relating to our investment in Carl Zeiss SMT Holding GmbH & Co. KG. The increased effect in 2021 compared to prior years is mainly caused by an increase in the profit from the equity method investment as well tax accounting consequences following from adjustment in the outside basis difference for the equity investment.
Effect of change in tax rates
The impact on the effective tax rate in 2021 is caused by the enacted increase of the general Dutch corporate income tax rate to 25.8% as of 2022, which impacts the valuation of deferred tax assets and liabilities of our Dutch fiscal unity.
ASML ANNUAL REPORT 2021 205
Other credits and non-tax deductible items
Other credits and non-tax deductible items reflect the impact on our statutory rates of permanent non-tax deductible items such as non-deductible withholding taxes, non-deductible shared based payment expenses and non-deductible meals and entertainment expenses, as well as the impact of various tax credits on our income tax expense.
US Tax Reform
The year-end tax positions also reflect the regulations of 2017 US Tax Reform, thereby taking into account the guidance issued by the US government. Hereby the most recent guidance for the final FDII regulations has been applied as of 2021 onwards, not retrospectively as permitted by aforementioned regulations. With regard to GILTI and BEAT, the decision has been taken to treat these as a period permanent item.
Liability for unrecognized tax benefits and deferred taxes
The liability for unrecognized tax benefits and related accrued interest and penalties and total deferred tax position recorded on the Consolidated Balance Sheets is as follows:
| | | | | | | | |
| Year ended December 31 (€, in millions) | 2020 | 2021 |
| Liability for unrecognized tax benefits | (200.4) | | (205.9) | |
| Deferred tax assets | 671.5 | | 1,098.7 | |
| Deferred tax liabilities | (37.9) | | (34.7) | |
| Deferred and other tax assets (liabilities) | 433.2 | | 858.1 | |
Liability for unrecognized tax benefits
We have operations in multiple jurisdictions, where we are subject to the application of complex tax laws. Application of these complex tax laws may lead to uncertainties on tax positions. We aim to resolve these uncertainties in discussions with the tax authorities. We record unrecognized tax benefits in line with the requirements of ASC 740, which requires us to estimate the potential outcome of any tax position. Our estimate for the potential outcome of any uncertain tax position is highly judgmental. We believe that we have adequately provided for uncertain tax positions. However, settlement of these uncertain tax positions in a manner inconsistent with our expectations could have a material impact on our Consolidated Financial Statements.
Consistent with the requirements of ASC 740, as of December 31, 2021, the liability for unrecognized tax benefits and related interest and penalties amounts to €205.9 million (2020: €200.4 million) which is classified as Deferred and other income tax liabilities. If recognized, these unrecognized tax benefits would affect our effective tax rate for approximately €190.9 million benefit (2020: €151.7 million benefit).
Expected interest and penalties related to income tax liabilities have been accrued for and are included in the liability for unrecognized tax benefits and in the income tax expense. Accrued interest and penalties in 2021 amount to a benefit of €9.7 million (2020: €14.2 million benefit; 2019: €9.0 million expense).
A reconciliation of the beginning and ending balance of the liability for unrecognized tax benefits (excluding interest and penalties) is as follows:
| | | | | | | | |
| Year ended December 31 (€, in millions) | 2020 | 2021 |
| Balance as at January 1 | (150.7) | | (138.0) | |
| Gross presentation for different tax jurisdictions | (27.3) | | — | |
| Gross increases – tax positions in prior period | (66.6) | | (21.6) | |
| Gross decreases – tax positions in prior period | 0.5 | | 8.9 | |
| Gross increases – tax positions in current period | (21.6) | | (18.8) | |
| | |
| Settlements | 106.6 | | 2.5 | |
| Lapse of statute of limitations | 14.5 | | 32.0 | |
| Effect of changes in exchange rates | 6.6 | | (9.3) | |
| Total liability for unrecognized tax benefits | (138.0) | | (144.3) | |
| Balance of accrued interest and penalties | (62.4) | | (61.6) | |
| Total liabilities for unrecognized tax benefits including interest and penalties | (200.4) | | (205.9) | |
We conclude our liability for unrecognized tax benefits to be appropriate. Based on the information currently available, we estimate that the liability for unrecognized tax benefits will decrease by €23.8 million (excluding interest and penalties) within the next 12 months, mainly as a result of expiration of statute of limitations.
For 2020 gross increases of tax positions in prior period and settlements were in essence mainly relating to finalization of a tax audit at the level of our South Korean group companies.
We file income tax returns in all countries where we operate, with the Netherlands, US, Taiwan, South Korea and China being the major jurisdictions. The years for which tax returns are still open for examination for respective jurisdictions are as follows:
ASML ANNUAL REPORT 2021 206
| | | | | |
| Country | Years |
| Netherlands | 2018-2021 |
| US | 2015-2021 |
| Taiwan | 2016-2021 |
| South Korea | 2017-2021 |
| China | 2011-2021 |
We are routinely subject to examinations and audits from tax and other authorities in the various jurisdictions in which we operate. We believe that adequate amounts of taxes and related interest and penalties have been provided for, and any adjustments as a result of examinations are not expected to have a material adverse effect.
Deferred taxes
The composition of total deferred tax assets and liabilities reconciled to the classification in the Consolidated Balance Sheets is:
| | | | | | | | | | | | | | | | | | | | | |
| Deferred taxes (€, in millions) | January 1, 2021 | | Credits and other | Consolidated
Statements
of
Operations | Income tax recognized in Other Comprehensive Income | Effect of
changes
in exchange
rates | December 31, 2021 |
| Deferred tax assets: | | | | | | | |
| Capitalized R&D expenditures | 287.1 | | | — | | 106.8 | | — | | 26.5 | | 420.4 | |
| R&D & other credit carry forwards | 117.2 | | | 21.4 | | 16.4 | | — | | 7.7 | | 162.7 | |
| Inventories | 37.2 | | | — | | (7.2) | | — | | 1.5 | | 31.5 | |
| Deferred revenue | 125.2 | | | — | | 288.0 | | — | | 10.0 | | 423.2 | |
| Accrued and other liabilities | 87.8 | | | — | | 5.7 | | — | | 4.6 | | 98.1 | |
| Installation and warranty reserve | 16.4 | | | — | | (6.3) | | — | | 1.2 | | 11.3 | |
| Tax effect carry-forward losses | 27.1 | | | — | | (19.9) | | — | | 0.2 | | 7.4 | |
| Property, plant and equipment | 26.9 | | | — | | (10.8) | | — | | 2.5 | | 18.6 | |
| Lease liabilities | 6.5 | | | — | | 16.2 | | — | | 0.5 | | 23.2 | |
| Intangible fixed assets | 143.5 | | | — | | — | | — | | — | | 143.5 | |
| | | | | | | |
| | | | | | | |
| Share-based payments | 7.2 | | | — | | 1.8 | | — | | 0.6 | | 9.6 | |
| Other temporary differences | 23.9 | | | — | | 7.5 | | (1.0) | | (2.9) | | 27.5 | |
| Total deferred tax assets, gross | 906.0 | | | 21.4 | | 398.2 | | (1.0) | | 52.4 | | 1,377.0 | |
Valuation allowance 1 | (122.5) | | | — | | (37.2) | | — | | (7.9) | | (167.6) | |
| Total deferred tax assets, net | 783.5 | | | 21.4 | | 361.0 | | (1.0) | | 44.5 | | 1,209.4 | |
| Deferred tax liabilities: | | | | | | | |
| Intangible fixed assets | (93.9) | | | 2.9 | | 17.1 | | — | | (6.0) | | (79.9) | |
| Goodwill | (15.6) | | | — | | (5.3) | | — | | — | | (20.9) | |
| Right-of-use assets | (6.5) | | | — | | (16.2) | | — | | (0.5) | | (23.2) | |
| Property, plant and equipment | (5.4) | | | — | | (4.3) | | — | | (1.2) | | (10.9) | |
| Deferred revenue | (18.2) | | | — | | 10.3 | | — | | — | | (7.9) | |
| Borrowing costs long-term debt | (1.6) | | | — | | 0.1 | | — | | — | | (1.5) | |
| Other temporary differences | (8.7) | | | 2.5 | | 4.4 | | — | | 0.7 | | (1.1) | |
| Total deferred tax liabilities | (149.9) | | | 5.4 | | 6.1 | | — | | (7.0) | | (145.4) | |
| Net deferred tax assets (liabilities) | 633.6 | | | 26.8 | | 367.1 | | (1.0) | | 37.5 | | 1,064.0 | |
| Classified as: | | | | | | | |
| | | | | | | |
| Deferred tax assets – non-current | 671.5 | | | | | | | 1,098.7 | |
| Deferred tax liabilities – non-current | (37.9) | | | | | | | (34.7) | |
| Net deferred tax assets (liabilities) | 633.6 | | | | | | | 1,064.0 | |
1.The valuation allowance disclosed above relates to R&D and other credits and Tax effect carry-forward losses that may not be realized.
ASML ANNUAL REPORT 2021 207
| | | | | | | | | | | | | | | | | | | | | |
| Deferred taxes (€, in millions) | January 1, 2020 | Acquisitions through business combinations | | Consolidated
Statements
of
Operations | Income tax recognized in Other Comprehensive Income | Effect of
changes
in exchange
rates | December 31, 2020 |
| Deferred tax assets: | | | | | | | |
| Capitalized R&D expenditures | 192.9 | | — | | | 117.3 | | — | | (23.1) | | 287.1 | |
| R&D & other credit carry forwards | 60.8 | | — | | | 63.7 | | — | | (7.3) | | 117.2 | |
| Inventories | 49.3 | | — | | | (9.0) | | — | | (3.1) | | 37.2 | |
| Deferred revenue | 56.8 | | — | | | 70.8 | | — | | (2.4) | | 125.2 | |
| Accrued and other liabilities | 73.4 | | 3.8 | | | 15.9 | | — | | (5.3) | | 87.8 | |
| Installation and warranty reserve | 12.3 | | — | | | 5.4 | | — | | (1.3) | | 16.4 | |
| Tax effect carry-forward losses | 12.5 | | — | | | 15.3 | | — | | (0.7) | | 27.1 | |
| Property, plant and equipment | 32.8 | | 0.8 | | | (7.0) | | — | | 0.3 | | 26.9 | |
| Lease liabilities | 8.1 | | — | | | (1.6) | | — | | — | | 6.5 | |
| Intangible fixed assets | 129.8 | | — | | | 13.7 | | — | | — | | 143.5 | |
| | | | | | | |
| | | | | | | |
| Share-based payments | 8.5 | | — | | | (0.6) | | — | | (0.7) | | 7.2 | |
| Other temporary differences | 20.3 | | | | 1.9 | | 0.6 | | 1.1 | | 23.9 | |
| Total deferred tax assets, gross | 657.5 | | 4.6 | | | 285.8 | | 0.6 | | (42.5) | | 906.0 | |
Valuation allowance 1 | (73.6) | | — | | | (56.9) | | — | | 8.0 | | (122.5) | |
| Total deferred tax assets, net | 583.9 | | 4.6 | | | 228.9 | | 0.6 | | (34.5) | | 783.5 | |
| Deferred tax liabilities: | | | | | | | |
| Intangible fixed assets | (104.2) | | (8.9) | | | 11.0 | | — | | 8.2 | | (93.9) | |
| Goodwill | (6.6) | | — | | | (9.0) | | — | | — | | (15.6) | |
| Right-of-use assets | (8.1) | | — | | | 1.6 | | — | | — | | (6.5) | |
| Property, plant and equipment | (15.3) | | (1.9) | | | 10.9 | | — | | 0.9 | | (5.4) | |
| Deferred revenue | (13.1) | | — | | | (5.1) | | — | | — | | (18.2) | |
| Borrowing costs long-term debt | (1.5) | | — | | | (0.1) | | — | | — | | (1.6) | |
| Other temporary differences | 2.9 | | (5.7) | | | (6.7) | | — | | 0.8 | | (8.7) | |
| Total deferred tax liabilities | (145.9) | | (16.5) | | | 2.6 | | — | | 9.9 | | (149.9) | |
| Net deferred tax assets (liabilities) | 438.0 | | (11.9) | | | 231.5 | | 0.6 | | (24.6) | | 633.6 | |
| Classified as: | | | | | | | |
| | | | | | | |
| Deferred tax assets – non-current | 445.3 | | | | | | | 671.5 | |
| Deferred tax liabilities – non-current | (7.3) | | | | | | | (37.9) | |
| Net deferred tax assets (liabilities) | 438.0 | | | | | | | 633.6 | |
1.The valuation allowance disclosed above relates to R&D and other credits and Tax effect carry-forward losses that may not be realized.
Tax effect carry-forward losses and Tax credits
The deferred tax assets from carry-forward losses and R&D & other credits recognized as per December 31, 2021 are almost fully reserved. R&D & other credits for the amount of €135.8 million have no expiration date. The remaining R&D & other credits of €26.9 million have an expiration date between 2022 and 2036. The carry-forward losses of €48.2 million have an expiration date between 2022 and 2030.
Unrecognized Deferred Tax Liability Related to Investments in Foreign Subsidiaries
In general, it is our practice and intention to indefinitely reinvest the earnings of our non-Dutch subsidiaries in those operations and distribute only when strictly necessary or opportune and permitted by law. The tax implications of distributions by such non-Dutch subsidiaries are dependent on local tax and accounting regulations applying at the moment of actual distribution. As these cannot practicably be determined, no deferred tax liability has been recognized in respect of undistributed profit reserves of the foreign subsidiaries. As per December 31, 2021, the aggregate amount of unrecognized temporary differences approximately amounts to €283.4 million (2020: €240.0 million).
ASML ANNUAL REPORT 2021 208
22. Shareholders’ equity
Share capital
ASML's authorized share capital amounts to €126.0 million and is divided into:
| | | | | | | | | | | |
| Type of shares | Amount of shares | Nominal value | Votes per share |
Cumulative preference shares | 700,000,000 | €0.09 per share | 9 |
Ordinary shares | 699,999,000 | €0.09 per share | 9 |
Ordinary shares B | 9,000 | €0.01 per share | 1 |
The issued and fully paid up ordinary shares with a nominal value of €0.09 each were as follows:
| | | | | | | | | | | |
| Year ended December 31 | 2019 | 2020 | 2021 |
Issued ordinary shares with nominal value of €0.09 | 419,810,706 | | 416,514,034 | | 402,601,613 | |
Issued ordinary treasury shares with nominal value of €0.09 | 5,848,998 | | 2,983,454 | | 3,873,663 | |
Total issued ordinary shares with nominal value of €0.09 | 425,659,704 | | 419,497,488 | | 406,475,276 | |
82,915,935 ordinary shares were held by 286 registered holders with a registered address in the US. Since certain of our ordinary shares were held by brokers and nominees, the number of record holders in the US may not be representative of the number of beneficial holders, or of where the beneficial holders are resident.
Each ordinary share consists of 900 fractional shares. Fractional shares entitle the holder thereof to a fractional dividend, but do not give entitlement to voting rights. Only those persons who hold shares directly in the share register in the Netherlands, held by us at our address at 5504 DR Veldhoven, de Run 6501, the Netherlands, or in the New York share register, held by JP Morgan Chase Bank, N.A., P.O. Box 64506, St. Paul, MN 55164-0506, United States, can hold fractional shares. Shareholders who hold ordinary shares through the deposit system under the Dutch Securities Bank Giro Transactions Act maintained by the Dutch central securities depository Euroclear Nederland or through the Depository Trust Company cannot hold fractional shares.
No ordinary shares B and no cumulative preference shares have been issued.
There are no special voting rights on the issued shares in our share capital.
In 2012, we issued shares to three key customers – Intel, TSMC and Samsung – as part of the customer co-investment program (CCIP) to accelerate ASML’s development of EUV. Under this program, the participating customers funded certain development programs and invested in ASML’s ordinary shares. Currently, only one participating customer still holds (directly or indirectly) ordinary shares. Certain voting restrictions apply in respect of ordinary shares issued in connection with the CCIP. These voting restrictions in respect of these ordinary shares are set out in the underlying agreement between ASML and the relevant customer. The shares issued in the CCIP were held by foundations which issued depository receipts to participants in the CCIP. A total of 96,566,077 depository receipts for ordinary shares were issued at the launch of the CCIP. This number has since decreased with the sell-down by the relevant customers following expiry of the lock-up.
There are currently no limitations, either under Dutch law or in ASML’s Articles of Association, on the transfer of ordinary shares in the share capital of ASML. Pursuant to ASML’s Articles of Association, the Supervisory Board’s approval shall be required for every transfer of cumulative preference shares.
Issue and repurchase of (rights to) shares
Our Board of Management has the power to issue ordinary shares and cumulative preference shares insofar as it has been authorized to do so by the General Meeting. The Board of Management requires approval of the Supervisory Board for such an issue. The authorization by the General Meeting can only be granted for a certain period not exceeding five years and may be extended for no longer than five years on each occasion. If the General Meeting has not authorized the Board of Management to issue shares, the General Meeting will be authorized to issue shares on the Board of Management’s proposal, provided that the Supervisory Board has approved such proposal.
Holders of ASML’s ordinary shares have a preemptive right, in proportion to the aggregate nominal amount of the ordinary shares held by them. This preemptive right may be restricted or excluded. Holders of ordinary shares do not have preemptive right with respect to any ordinary shares issued for consideration other than cash or ordinary shares issued to employees. If authorized for this purpose by the General Meeting, the Board of Management has the power, subject to approval of the Supervisory Board, to restrict or exclude the preemptive rights of holders of ordinary shares.
At our 2021 AGM, the Board of Management was authorized from April 29, 2021 through October 29, 2022, subject to the approval of the Supervisory Board, to issue shares and / or rights thereto representing up to a maximum of 5% of our issued share capital at April 29, 2021, plus an additional 5% of our issued share capital at April 29, 2021 that may be issued in connection with mergers, acquisitions and / or (strategic) alliances. Our shareholders also authorized the Board of Management through October 29, 2022, subject to approval of the Supervisory Board, to restrict or exclude preemptive rights with respect to holders of ordinary shares up
ASML ANNUAL REPORT 2021 209
to a maximum of 5% of our issued share capital in connection with the general authorization to issue shares and/ or rights to shares, plus an additional 5% in connection with the authorization to issue shares and/ or rights to shares in connection with mergers, acquisitions and / or (strategic) alliances.
We may repurchase our issued ordinary shares at any time, subject to compliance with the requirements of Dutch law and our Articles of Association. Any such repurchases are subject to the approval of the Supervisory Board and the authorization by the General Meeting, which authorization may not be for more than 18 months.
At the 2021 AGM, the Board of Management was authorized, subject to Supervisory Board approval, to repurchase through October 29, 2022, up to a maximum of two times 10% of our issued share capital at April 29, 2021, at a price between the nominal value of the ordinary shares purchased and 110% of the market price of these securities on Euronext Amsterdam or NASDAQ.
ASML Preference Shares Foundation
The ASML Preference Shares Foundation (Stichting Preferente Aandelen ASML), a foundation organized under Dutch law, has been granted an option right to acquire preference shares in the share capital of ASML. The Foundation may exercise the Preference Share Option in situations where, in the opinion of the Foundation’s Board of Directors, ASML’s interests, ASML’s business or the interests of ASML’s stakeholders are at stake. This may be the case if:
•A public bid for ASML’s shares is announced or made, or there is a justified expectation that such a bid will be made without any agreement having been reached with ASML in relation to such a bid; or
•In the opinion of the Foundation’s Board of Directors, the (attempted) exercise of the voting rights by one shareholder or more shareholders, acting in concert, is materially in conflict with ASML’s interests, ASML’s business or ASML’s stakeholders.
The Foundation’s objectives are to look after the interests of ASML and the enterprises maintained by and/or affiliated in a group with ASML, in such a way that the interests of ASML, of those enterprises and of all parties concerned are safeguarded in the best possible way, and that influences in conflict with these interests, which might affect the independence or the identity of ASML and those companies, are deterred to the best of the Foundation’s ability, and everything related to the above or possibly conducive thereto. The Foundation aims to realize its objects by acquiring and holding cumulative preference shares in the capital of ASML and by exercising the rights attached to these shares, particularly the voting rights.
The Preference Share Option gives the Foundation the right to acquire such number of cumulative preference shares as the Foundation will require, provided that the aggregate nominal value of such number of cumulative preference shares shall not exceed the aggregate nominal value of the ordinary shares issued at the time of exercise of the Preference Share Option. The subscription price will be equal to their nominal value. Only one-fourth of the subscription price would be payable at the time of initial issuance of the cumulative preference shares, with the other three-fourths of the nominal value only being payable when ASML calls up this amount. Exercise of the preference share option could effectively dilute the voting power of the outstanding ordinary shares by one-half.
Cancellation and repayment of the issued cumulative preference shares by ASML requires authorization by the General Meeting, on a proposal to this effect made by the Board of Management and approved by the Supervisory Board. If the Preference Share Option is exercised and as a result cumulative preference shares are issued, ASML will initiate the repurchase or cancellation of all cumulative preference shares held by the Foundation on the Foundation’s request. In that case, ASML is obliged to effect the repurchase and respective cancellation as soon as possible. A cancellation will result in a repayment of the amount paid and exemption from the obligation to pay up on the cumulative preference shares. A repurchase of the cumulative preference shares can only take place when such shares are fully paid up.
If the Foundation does not request ASML to repurchase or cancel all cumulative preference shares held by the Foundation within 20 months of issuance of these shares, we will be required to convene a General Meeting for the purpose of deciding on a repurchase or cancellation of these shares.
The Foundation is independent of ASML. The Board of Directors of the Foundation is composed of four independent members from the Netherlands’ business and academic communities. The Foundation’s Board of Directors is composed per December 31, 2021 of the following members: Mr. A.P.M. van der Poel, Mr. S. Perrick, Mr. A.H. Lundqvist and Mr. J. Streppel.
Other than the arrangements made with the Foundation as described above, ASML has not established any other anti-takeover devices.
Dividend policy
ASML aims to distribute a dividend that will be growing over time, paid semi-annually. On an annual basis, the Board of Management, upon prior approval from the Supervisory Board, submits a proposal to the AGM with respect to the amount of dividend to be declared with respect to the prior year, taking into account any interim dividend distributions. The dividend proposal in any given year will be subject to availability of distributable profits, retained earnings and cash, and may be affected by, among other things, our view of potential future liquidity requirements including for investments in production capacity, working capital requirements, the funding of our R&D programs and acquisition opportunities that may arise from time to time.
ASML ANNUAL REPORT 2021 210
ASML intends to declare a total dividend in respect of 2021 of €5.50 per ordinary share. Recognizing the interim dividend of €1.80 per ordinary share paid in November 2021, this leads to a final dividend proposal to the General Meeting of €3.70 per ordinary share. The total 2021 dividend is a 100% increase compared to the 2020 total dividend of €2.75 per ordinary share.
Dividends on ordinary shares are payable out of net income or retained earnings as shown in our Financial Statements as adopted by our AGM, after payment first of (accumulated) dividends out of net income on any issued cumulative preference shares.
Purchase of equity securities
In addition to dividend payments, we intend to return cash to our shareholders on a regular basis through share buybacks or capital repayment, subject to our actual and anticipated level of liquidity requirements and other relevant factors.
On July 21, 2021 we announced a new share buyback program to be executed by 31 December 2023. As part of this program, ASML intends to repurchase shares up to an amount of €9 billion, of which we expect a total of up to 0.45 million shares will be used to cover employee share plans. ASML intends to cancel the remainder of the shares repurchased. The new program has replaced the previous €6 billion share buyback program 2020-2022 which has not been completed for the full amount in light of the new share buyback program.
In 2021 we repurchased 14,358,838 shares (2020: 3,908,429 shares) for a total consideration of €8,560.3 million (2020: €1,207.5 million) of which 6,601,699 shares for a consideration of €4,560.3 million were purchased under the new program. In 2021 we cancelled 13,023,016 shares (2020: 6,162,395 shares canceled), of which 9,759,021 shares were repurchased under the 2020-2022 program and 3,263,995 shares were repurchased under the 2021-2023 program.
The share buyback program may be suspended, modified or discontinued at any time.
The following table provides a summary of shares repurchased by ASML in 2021:
| | | | | | | | | | | | | | |
| Period | Total number of shares purchased | Average price paid per Share (€) | Total number of shares purchased under programs | Maximum value of shares that may yet be purchased (€ millions) |
| January 21 - 31, 2021 | 495,533 | | 455.68 | | 495,533 | | 4,566.7 | |
| February 1 - 28, 2021 | 1,360,410 | | 474.24 | | 1,855,943 | | 3,921.6 | |
| March 1 - 31, 2021 | 1,580,604 | | 469.40 | | 3,436,547 | | 3,179.6 | |
| April 1 - 30, 2021 | 1,128,123 | | 537.04 | | 4,564,670 | | 2,573.8 | |
| May 1 - 31, 2021 | 1,240,714 | | 528.93 | | 5,805,384 | | 1,917.5 | |
| June 1 - 30, 2021 | 1,204,128 | | 570.95 | | 7,009,512 | | 1,230.0 | |
| July 1 - 31, 2021 | 1,178,129 | | 603.46 | | 8,187,641 | | 8,726.6 | |
| August 1 - 31, 2021 | 1,274,521 | | 674.28 | | 9,462,162 | | 7,867.2 | |
| September 1 - 30, 2021 | 1,188,430 | | 723.11 | | 10,650,592 | | 7,007.8 | |
| October 1 - 31, 2021 | 1,237,721 | | 658.97 | | 11,888,313 | | 6,192.2 | |
| November 1 - 30, 2021 | 1,393,794 | | 726.43 | | 13,282,107 | | 5,179.7 | |
| December 1 - 23, 2021 | 1,076,731 | | 687.26 | | 14,358,838 | | 4,439.7 | |
| | | | |
| Total | 14,358,838 | | 596.17 | | | |
23. Net income per ordinary share
Basic net income per ordinary share is calculated by dividing net income by the weighted average number of ordinary shares outstanding for that period.
The dilutive effect is calculated using the treasury stock method by dividing net income by the weighted average number of ordinary shares outstanding for that period plus shares applicable to options and conditional shares (dilutive potential ordinary shares). The calculation of diluted net income per ordinary share does not assume exercise of options when exercise would be anti-dilutive. Excluded from the diluted weighted average number of shares outstanding calculation are cumulative preference shares contingently issuable to the preference share foundation, since they represent a different class of stock than the ordinary shares.
ASML ANNUAL REPORT 2021 211
The basic and diluted net income per ordinary share has been calculated as follows:
| | | | | | | | | | | |
| Year ended December 31 (€, in millions, except per share data) | 2019 | 2020 | 2021 |
| Net income | 2,592.3 | | 3,553.7 | | 5,883.2 | |
| | | | |
| Weighted average number of shares outstanding | 420.8 | | 418.3 | | 409.8 | |
| Basic net income per ordinary share | 6.16 | | 8.49 | | 14.36 | |
| | | | |
| Weighted average number of shares outstanding | 420.8 | | 418.3 | | 409.8 | |
| Plus shares applicable to options and conditional shares | 0.9 | | 0.8 | | 0.6 | |
| Diluted weighted average number of shares | 421.6 | | 419.1 | | 410.4 | |
| Diluted net income per ordinary share | 6.15 | | 8.48 | | 14.34 | |
24. Vulnerability due to certain concentrations
We rely on outside vendors for components and subassemblies used in our systems including the design thereof, each of which is obtained from a single supplier or a limited number of suppliers. Our reliance on a limited group of suppliers involves several risks, including a potential inability to obtain an adequate supply of required components, reduced control over pricing and the risk of untimely delivery of these components and subassemblies.
25. Financial risk management
We are exposed to certain financial risks such as foreign currency risk, interest rate risk, credit risk, liquidity risk and capital risk. Our overall risk management program focuses on the unpredictability of financial markets and seeks to minimize potentially adverse effects on our financial performance. Our risk management program focuses appropriately on the current environment of uncertainty in the financial markets.
A key element within our risk management program is our long held prudent financing policy, which is based on three foundational elements:
•Liquidity: Maintain financial stability with a target to keep our Cash & cash equivalents, together with Short-term investments, above a minimum range of €2.0 to €2.5 billion
•Capital structure: Maintain a capital structure that targets a solid investment grade credit rating
•Cash return: Provide a sustainable dividend per share that will grow over time, paid semi-annually, while returning excess cash to shareholders through share buybacks or capital repayment
We use derivative financial instruments to hedge certain risk exposures. None of these transactions are entered into for trading or speculative purposes. We use market information to determine the fair value of our derivative financial instruments.
Foreign currency risk management
We are exposed to currency risks. Our Financial Statements are expressed in euros. Accordingly, our results of operations are exposed to fluctuations in exchange rates between the euro and other currencies. Changes in currency exchange rates can result in losses in our Financial Statements. We are particularly exposed to fluctuations in the exchange rates between the US dollar and the euro, and to a lesser extent to the Japanese yen, the South Korean won, the Taiwanese dollar and Chinese yuan, in relation to the euro. We incur costs of sales predominantly in euros with portions also denominated in US and Taiwanese dollars. A small portion of our operating results are driven by movements in currencies other than the euro, US dollar, Japanese yen, South Korean won, Taiwanese dollar or Chinese yuan. In general, our customers run their businesses in US dollars and therefore a weakening of the US dollar against the euro might impact the ability or desire of our customers to purchase our products at quoted prices.
Foreign currency sensitivity
The following table details our sensitivity to a 10.0% strengthening of foreign currencies against the euro. The sensitivity analysis includes foreign currency denominated monetary items outstanding and adjusts their translation at the period end for a 10.0% strengthening in foreign currency rates. A positive amount indicates an increase in net income or equity.
| | | | | | | | | | | | | | |
| Year ended December 31 (€, in millions) | 2020 | 2021 |
| Impact on net income | Impact on
equity | Impact on net income | Impact on
equity |
| US dollar | (4.3) | | 34.4 | | (6.9) | | 51.5 | |
| Japanese yen | (13.4) | | — | | (2.2) | | (32.9) | |
| Taiwanese dollar | 1.3 | | — | | (3.7) | | — | |
| Other currencies | (3.9) | | — | | 6.2 | | — | |
| Total | (20.3) | | 34.4 | | (6.6) | | 18.6 | |
ASML ANNUAL REPORT 2021 212
It is our policy to limit the effects of currency exchange rate fluctuations on our Consolidated Statements of Operations. The impact on net income reflects our net exposure to currencies other than the euro at year-end 2021. The negative effect on net income as presented in the table above for 2021 is mainly attributable to timing differences between the arising and hedging of exposures.
The effects of the fair value movements of cash flow hedges, entered into for US dollar transactions are recognized in equity. The US dollar effect on equity in 2021 compared with 2020 is the result of an increase in outstanding purchase hedges. The Japanese Yen effect on equity in 2021 compared to 2020 is the result of an increase in outstanding sales hedges due to the strong increase in demand for chips.
For a 10.0% weakening of the foreign currencies against the euro, there would be approximately an equal but opposite effect on net income and equity.
Foreign currency risk policy
It is our policy to hedge material transaction exposures, such as forecasted sales and purchase transactions. We hedge these exposures through the use of forward foreign exchange contracts.
Foreign exchange contracts
The notional principal amounts of the outstanding forward foreign exchange contracts are mainly denominated in US dollar, Japanese yen, Taiwanese dollar, Korean won and Chinese Yuan at December 31, 2021 are respectively USD 0.6 billion, JPY 44.5 billion, TWD 2.5 billion, KRW 11.9 billion and CNY 0.6 billion (2020: USD 0.4 billion, JPY 15.5 billion, TWD 0.5 billion, KRW 0.0 billion and CNY 0.4 billion).
The hedged highly probable forecasted transactions denominated in foreign currency are expected to occur at various dates during the coming 12 months. Gains and losses recognized in OCI on forward foreign exchange contracts included in a hedge relationship will be recognized in the Consolidated Statements of Operations in the period during which the hedged forecasted transactions affect the Consolidated Statements of Operations.
In 2021, we recognized a transfer to net income of €22.2 million loss (2020: €2.3 million gain; 2019: €10.7 million gain) in the Consolidated Statements of Operations resulting from effective cash flow hedges for forecasted sales and purchase transactions that occurred in the year. Furthermore, we recognized a net amount of €7.9 million loss in the Consolidated Statements of Operations resulting from derivative financial instruments measured at fair value through profit or loss (2020: €28.2 million gain; 2019: €12.0 million loss), which is mainly offset by the revaluation of the hedged monetary items.
OCI balance unrealized gains and losses on financial instruments from foreign exchange contracts
Outstanding accumulated OCI balances unrealized gains and losses on financial instruments consist of:
•Outstanding anticipated gains and losses of foreign currency denominated forecasted purchase transactions. As of December 31, 2021, outstanding accumulated OCI includes €20.8 million representing the total anticipated gain to be released to cost of sales (2020: loss €26.1 million and 2019: gain €2.1 million), (net of taxes: 2021: gain €17.7 million; 2020: loss €22.7 million; 2019: gain €1.8 million), which will offset the euro equivalent of foreign currency denominated forecasted purchase transactions. All amounts are expected to be released over the next 12 months.
•Outstanding anticipated loss to be realized to sales. As of December 31, 2021, outstanding accumulated OCI includes loss €1.2 million (2020: gain €0.4 million; 2019: loss €1.2 million), representing the total anticipated loss to be released to sales.
The effectiveness of all contracts for which we apply hedge accounting is monitored on a quarterly basis throughout the life of the hedges. During 2021, 2020 and 2019, no ineffective hedge relationships were recognized.
Interest rate risk management
We have interest-bearing assets and liabilities that expose us to fluctuations in market interest rates, managed through interest rate swaps.
Interest rate sensitivity
The sensitivity analysis below has been determined based on the exposure to interest rates for both derivative financial and non-derivative financial instruments at the balance sheet date with the stipulated change taking place at the beginning of the financial year and held constant throughout the reporting period. The table below shows the effect of a 1.0% increase in interest rates on our net income and equity. A positive amount indicates an increase in net income and equity.
| | | | | | | | | | | | | | |
| Year ended December 31 (€, in millions) | 2020 | 2021 |
| Impact on net income | Impact on
equity | Impact on net income | Impact on
equity |
Effect of a 1.0% increase in interest rates | 43.5 | | — | | 45.9 | | — | |
The positive effect on net income mainly relates to our total amount of cash and cash equivalents and short-term investments being higher than our total floating debt position, which is excluding the Eurobonds issued in 2020.
For a 1.0% decrease in interest rates there would be approximately an equal but opposite effect on net income and equity.
ASML ANNUAL REPORT 2021 213
Hedging policy interest rates
We use interest rate swaps to minimize the net interest exposure for the group by aligning the interest terms of the available cash and the interest bearing debt. There may be residual interest rate risk to the extent the asset and liability positions do not fully offset.
Interest rate swaps
The notional principal amount of the outstanding interest rate swap contracts as of December 31, 2021 was €3.0 billion (2020: €3.0 billion). During 2021, these outstanding hedges were highly effective in hedging the fair value exposure to interest rate movements. The changes in fair value of the Eurobonds were included in the Consolidated Statements of Operations in the same period as the changes in the fair value of the interest rate swaps. We did not enter into interest rate swaps in connection with the Eurobonds issued in 2020.
Credit risk management
Financial instruments that potentially subject us to significant concentration of credit risk consist principally of Cash and cash equivalents, Short-term investments, Derivative financial instruments used for hedging activities, Accounts receivable and Finance receivables and prepayments to suppliers.
Cash and cash equivalents, Short-term investments and Derivative financial instruments contain an element of risk of the counterparties being unable to meet their obligations. Our risk management program focuses appropriately on the current environment of uncertainty in the financial markets. We invest our Cash and cash equivalents and Short-term investments in short-term deposits with financial institutions that have investment grade credit ratings and in government and or government related bodies that have investment grade credit ratings and in money market and other investment funds that invest in high-rated debt securities. To mitigate the risk that our counterparties in hedging transactions are unable to meet their obligations, we enter into transactions with a limited number of major financial institutions that have investment grade credit ratings and closely monitor their creditworthiness. All credit ratings are rated by credit rating institutions like for instance S&P, Moody’s or Fitch. Concentration risk is mitigated by limiting the exposure to each of the individual counterparties.
Our customers consist of integrated circuit manufacturers located throughout the world. We perform ongoing credit evaluations of our customers’ financial condition. We mitigate credit risk through additional measures, including the use of down payments, letters of credit, and contractual ownership retention provisions. Retention of ownership enables us to recover the systems in the event a customer defaults on payment.
Liquidity risk management
Our principal sources of liquidity consist of Cash and cash equivalents, Short-term investments and available credit facilities with a target to keep our Cash & cash equivalents, together with Short-term investments, above a minimum range of €2.0 to €2.5 billion. In addition, we may from time to time raise additional funding in debt and equity markets. We seek to ensure that our principal sources of liquidity will be sufficient to satisfy our liquidity requirements at all times.
Our liquidity needs are affected by many factors, some of which are based on the normal on-going operations of the business, and others that relate to the uncertainties of the global economy and the semiconductor industry. Although our cash requirements fluctuate based on the timing and extent of these factors, we believe that cash generated from operations, together with our other sources of liquidity are sufficient to satisfy our current requirements, including our expected capital expenditures and debt servicing.
We intend to return cash to our shareholders on a regular basis in the form of dividend payments and, subject to our actual and anticipated liquidity requirements and other relevant factors, share buybacks or capital repayments.
Capital risk management
Our objectives when managing our capital structure are to safeguard our ability to satisfy our capital providers by maintaining a capital structure that ensures liquidity and supports a solid investment grade credit rating. The capital structure includes both debt and the components of equity, in accordance with both US GAAP and EU-IFRS. The capital structure is mainly altered by, among other things, adjusting the amount of dividends paid to shareholders, the amount of share buybacks or capital repayment, and any changes in the level of debt. Our capital structure is formally reviewed with the Supervisory Board each year in connection with our updated long-term financial plan and relevant scenarios. The outcome of this year’s review confirmed to maintain our existing financing policy in relation to our capital structure.
Our current credit rating from Moody’s is A2 (Stable). This rating was upgraded in September 2021 from A3. Our current credit rating from Fitch is A- (stable), which is consistent with the rating on December 31, 2020.
Financial instruments
Accounting Policy - Derivative financial instruments and hedging activities
We measure all derivative financial instruments based on fair values derived from level 2 input criteria. We adopt hedge accounting for hedges that are highly effective in offsetting the identified hedged risks taking into account required effectiveness criteria.
ASML ANNUAL REPORT 2021 214
Derivatives are initially recognized at fair value on the date a derivative contract is entered into and subsequently remeasured. The method of recognizing the resulting gain or loss depends on whether the derivative is designated as a hedging instrument, and if so, the nature of the item being hedged. We designate derivatives as one of the following:
•A hedge of an exposure relating to changes in the fair value of a recognized asset or liability, that is attributable to a particular risk (fair value hedge).
•A hedge of an exposure relating to the variability in the cash flows of a recognized asset or liability, or of a forecasted transaction, that is attributable to a particular risk (cash flow hedge).
•A hedge of the foreign currency exposure relating to a net investment in a foreign operation (net investment hedge).
We assess at the inception of the transaction the relationship between hedging instruments and hedged items, as well as our risk management objectives and strategy for undertaking various hedging transactions. We also assess, both at hedge inception and on an ongoing basis, whether derivatives that are used in hedging transactions are highly effective in offsetting changes in fair values or cash flows of hedged items. The cash flows resulting from the derivative financial instruments are classified in the Consolidated Statements of Cash Flows according to the nature of the hedged item.
Fair value hedge
Changes in the fair value of a derivative financial instrument, that is designated and qualified as a fair value hedge, along with the gain or loss on the hedged asset or liability that is attributable to the hedged risk, are recorded in the Consolidated Statements of Operations.
Hedge accounting is discontinued when we revoke the hedging relationship, the hedging instrument expires or is sold, terminated or exercised, or no longer qualifies for hedge accounting. The adjustment to the carrying amount of the hedged item arising from the hedged risk is amortized to the Consolidated Statements of Operations from that date.
Interest rate swaps that are being used to hedge the fair value of fixed loan coupons payable are designated as fair value hedges. The change in fair value is intended to offset the change in the fair value of the underlying fixed loan coupons, which is recorded accordingly. The gain or loss relating to the ineffective portion of interest rate swaps hedging fixed loan coupons payable is recognized in the Consolidated Statements of Operations as interest and other, net.
Cash flow hedge
Changes in the fair value of a derivative that is designated and qualified as a cash flow hedge are recorded in OCI, net of taxes, until the underlying hedged transaction is recognized in the Consolidated Statements of Operations. In the event that the underlying hedge transaction will not occur within the specified time period, the gain or loss on the related cash flow hedge is released from OCI and included in the Consolidated Statements of Operations, unless extenuating circumstances exist that are related to the nature of the forecasted transaction and are outside our control or influence and which cause the forecasted transaction to be probable of occurring on a date that is beyond the specified time period.
Foreign currency hedging instruments that are being used to hedge cash flows related to forecasted sales or purchase transactions in non-functional currencies are designated as cash flow hedges. The gain or loss relating to the ineffective portion of the foreign currency hedging instruments is recognized in the Consolidated Statements of Operations in Net sales or Cost of sales.
Fair values of the derivatives
The following table summarizes the notional amounts and estimated fair values of our derivative financial instruments:
| | | | | | | | | | | | | | |
| Year ended December 31 (€, in millions) | 2020 | 2021 |
| Notional
amount | Fair Value | Notional
amount | Fair Value |
| Forward foreign exchange contracts | 182.0 | | (17.6) | | 27.5 | | 12.8 | |
| Interest rate swaps | 3,000.0 | | 160.4 | | 3,000.0 | | 83.9 | |
ASML ANNUAL REPORT 2021 215
The following table summarizes our derivative financial instruments per category:
| | | | | | | | | | | | | | |
| Year ended December 31 (€, in millions) | 2020 | 2021 |
| Assets | Liabilities | Assets | Liabilities |
| | | | |
| Interest rate swaps — fair value hedges | 160.4 | | — | | 83.9 | | — | |
| Forward foreign exchange contracts — cash flow hedges | 0.9 | | 15.1 | | 15.0 | | 2.2 | |
| | | | |
| Forward foreign exchange contracts — no hedge accounting | 1.5 | | 4.9 | | 0.6 | | 0.6 | |
| Total | 162.8 | | 20.0 | | 99.5 | | 2.8 | |
| Less non-current portion: | | | | |
| | | | |
| Interest rate swaps — fair value hedges | 123.8 | | — | | 47.3 | | — | |
| Total non-current portion | 123.8 | | — | | 47.3 | | — | |
| Total current portion | 39.0 | | 20.0 | | 52.2 | | 2.8 | |
The fair value part of a hedging derivative financial instrument that has a remaining term of 12 months or less after balance sheet date is classified as current asset or liability. When the fair value part of a hedging derivative has a term of more than 12 months after balance sheet date, it is classified as non-current asset or liability. Derivative financial instruments are included in Other assets and Accrued and other liabilities in the Consolidated Balance Sheets, split between current and non-current.
Fair value measurements
Fair value is the price that would be received to sell an asset or paid to transfer a liability in an orderly transaction between market participants at the measurement date. The fair value measurement hierarchy prioritizes the inputs to valuation techniques used to measure fair value as follows:
•Level 1: Valuations based on inputs such as quoted prices for identical assets or liabilities in active markets that the entity has the ability to access.
•Level 2: Valuations based on inputs other than level 1 inputs such as quoted prices for similar assets or liabilities, quoted prices in markets that are not active, or other inputs that are observable or can be corroborated by observable data for substantially the full term of the assets or liabilities.
•Level 3: Valuations based on inputs that are supported by little or no market activity and that are significant to the fair value of the assets or liabilities.
The fair value hierarchy gives the highest priority to quoted prices (unadjusted) in active markets for identical assets or liabilities (Level 1) and the lowest priority to unobservable inputs (Level 3). A financial instrument’s fair value classification is based on the lowest level of any input that is significant in the fair value measurement hierarchy.
Financial assets and financial liabilities measured at fair value on a recurring basis
Investments in money market funds (included in our Cash and cash equivalents) have fair value measurements which are all based on quoted prices for identical assets or liabilities.
Our Short-term investments consist of deposits with original maturities to the entity holding the investments longer than 3 months and one year or less at the date of acquisition with financial institutions that have investment grade credit ratings. The fair value of the deposits is determined with reference to quoted market prices in an active market for similar assets or discounted cash flow analysis.
The principal market in which we execute our derivative contracts is the institutional market in an over-the-counter environment with a high level of price transparency. The market participants usually are large commercial banks. The valuation inputs for our derivative contracts are based on quoted prices and quoting pricing intervals from public data sources; they do not involve management judgment.
The valuation technique used to determine the fair value of forward foreign exchange contracts (used for hedging purposes) approximates the net present value technique which is the estimated amount that a bank would receive or pay to terminate the forward foreign exchange contracts at the reporting date, taking into account current interest rates and current exchange rates.
The valuation technique used to determine the fair value of interest rate swaps (used for hedging purposes) is the net present value technique, which is the estimated amount that a bank would receive or pay to terminate the swap agreements at the reporting date, taking into account current interest rates.
Four of our outstanding Eurobonds, with a combined principal amount of €3 billion, serve as hedged items in fair value hedge relationships in which we hedge the variability of changes in the fair value of our Eurobonds due to changes in market interest rates with interest rate swaps. No hedging is applied for our bond offerings issued in 2020. The fair value changes of the interest rate swaps are recorded on the Consolidated Balance Sheets under derivative financial instruments and the carrying amounts of the Eurobonds are adjusted for the effective portion of these fair value changes only. For the actual aggregate carrying amount and the fair value of our Eurobonds, see Note 16 Long-term debt and interest and other costs.
ASML ANNUAL REPORT 2021 216
The following tables present our financial assets and financial liabilities that are measured at fair value on a recurring basis:
| | | | | | | | | | | | | | |
| Year ended December 31, 2021 (€, in millions) | Level 1 | Level 2 | Level 3 | Total |
| Assets measured at fair value | | | | |
Derivative financial instruments 1 | — | | 99.5 | | — | | 99.5 | |
Money market funds 2 | 2,928.3 | | — | | — | | 2,928.3 | |
Short-term investments 3 | — | | 638.5 | | — | | 638.5 | |
| Total | 2,928.3 | | 738.0 | | — | | 3,666.3 | |
| Liabilities measured at fair value | | | | |
Derivative financial instruments 1 | — | | 2.8 | | — | | 2.8 | |
| Assets and Liabilities for which fair values are disclosed | | | | |
Long-term debt 4 | 4,673.9 | | — | | — | | 4,673.9 | |
| | | | | | | | | | | | | | |
| Year ended December 31, 2020 (€, in millions) | Level 1 | Level 2 | Level 3 | Total |
| Assets measured at fair value | | | | |
Derivative financial instruments 1 | — | | 162.8 | | — | | 162.8 | |
Money market funds 2 | 3,841.9 | | — | | — | | 3,841.9 | |
Short-term investments 3 | — | | 1,302.2 | | — | | 1,302.2 | |
| Total | 3,841.9 | | 1,465.0 | | — | | 5,306.9 | |
| Liabilities measured at fair value | | | | |
Derivative financial instruments 1 | — | | 20.0 | | — | | 20.0 | |
| Assets and Liabilities for which fair values are disclosed | | | | |
Long-term debt 4 | 4,798.8 | | — | | — | | 4,798.8 | |
1.Derivative financial instruments consist of forward foreign exchange contracts and interest rate swaps.
2.Money market funds are part of our cash and cash equivalents.
3.Short-term investments consist of deposits with original maturities to the entity holding the investments longer than three months, but one year or less at the date of acquisition. These deposits are valued at amortized costs which is close to their fair value. Their fair value is determined with reference to quoted market prices in an active market for similar assets or discounted cash flow analysis
4.Long-term debt mainly relates to Eurobonds.
There were no transfers between levels during the years ended December 31, 2021 and December 31, 2020.
Financial assets and financial liabilities that are not measured at fair value
The carrying amount of Cash and cash equivalents, Accounts payable, and other current financial assets and liabilities approximate their fair value because of the short-term nature of these instruments. The carrying amount of the loan to Carl Zeiss SMT GmbH approximates the fair value given current interest and investment grade credit rating.
Money market and investment funds measurement
The money market and investment funds qualify as available for sale securities. The fair value is close to the carrying value due to short term nature and since related to investment with investment grade credit ratings. Allowances for credit losses and total unrealized gains and losses are close to nil. These money market funds can be called on a daily basis. Investments and redemptions in money market funds are managed on a daily basis based triggered through actual cash balances. Realized gain and losses on these money market funds are not significant given low interest rates and high credit ratings. Costs of securities were close to nil. ASML does not have trading securities as of December 31, 2021.
Deposits measurement
The deposits as part of the Cash and cash equivalents and Short term investments qualify as securities held to maturity. The amortized cost value is close to the fair value and carrying value due to short term nature and since related to investment with investment grade credit ratings. Allowance for credit losses and total unrealized gains and losses are close to nil. Maturities are 1year or less. No held to maturity securities were sold before expiration date.
Assets and liabilities measured at fair value on a non-recurring basis
In 2020 and 2021, we had no significant fair value measurements on a non-recurring basis from regular business activities. We did not recognize any impairment charges for goodwill and other intangible assets during 2020 and 2021. For fair value measurements in relation to the acquisition of Berliner Glas in 2020 and the subsequent divestment of the non-semiconductor businesses in 2021, we refer to Note 10 Business combinations and divestitures.
ASML ANNUAL REPORT 2021 217
26. Related parties and variable interest entities
Carl Zeiss SMT GmbH is our single supplier, and we are their single customer, of optical columns for lithography systems. Carl Zeiss SMT GmbH is capable of developing and producing these items only in limited numbers and only through the use of manufacturing and testing facilities in Oberkochen and Wetzlar, Germany. Our relationship with Carl Zeiss SMT GmbH is structured as a strategic alliance that is run under the principle of ‘two companies, one business’ and is focused on continuous innovation and improvement of operational excellence in the lithography business.
We have a 24.9% interest in Carl Zeiss SMT Holding GmbH & Co. KG, which owns 100% of the shares in Carl Zeiss SMT GmbH. Based on the 24.9% investment, Carl Zeiss SMT Holding GmbH & Co. KG and its subsidiaries are considered related parties. Additionally, we have determined that Carl Zeiss SMT Holding GmbH & Co. KG is a variable interest entity because the entity was established without substantive voting rights since there is disparity between our voting rights and our economics, as well as substantially all of Carl Zeiss SMT Holding GmbH & Co. KG’s activities involve us or are conducted on our behalf. However, we are not the primary beneficiary of the variable interest entity because we lack the power to direct the activities that most significantly impact Carl Zeiss SMT Holding GmbH & Co. KG’s economic performance.
We had several framework agreements in place with Carl Zeiss SMT GmbH since 1997. We entered into a new framework agreement in September 2021 with Carl Zeiss SMT GmbH, with effect as of the beginning of 2021. This agreement replaces our key existing framework agreements and aligns our business interests in order to focus on supporting our end customers. The key components to the new framework agreement are:
•A behavior and interaction model that fosters mutual respect and understanding
•A governance model that enables both companies to become more effective and aligned in their decision-making and the execution of the strategy in the business via mutual approval on (i) certain investment decisions affecting the lithography business, and (ii) the requirements of all products supplied by Carl Zeiss SMT GmbH
•New variable pricing model for purchases of products and services determined by the relevant annual financial performance of both ASML and Carl Zeiss SMT GmbH in the lithography business
•Cash support via additional prepayments on product deliveries to ensure Carl Zeiss SMT GmbH a minimum adjusted free cash flow floor in an annual period, if certain criteria are met
•A commitment from ASML to finance the capital expenditures of Carl Zeiss SMT GmbH up to €1 billion if their investments required to execute on the lithography business roadmap exceed certain thresholds, measured annually
The financing would be through loan agreements, with the key terms being:
•Ten years term loans with linear annual repayment after three years grace period
•Interest rate subject to a floor of 0.01% and a cap of 1%
•Voluntary prepayment option without penalty
The two companies have agreed to perpetually continue their strategic alliance in order to meet end customer demand, even in case of termination of the new framework agreement.
Transition from previous agreements
In 2016, we agreed with Carl Zeiss SMT GmbH to support their R&D costs, capital expenditures and supply chain investments, in respect of EUV 0.55 NA (High-NA). With our new framework agreement, these payments will no longer be made starting in 2021. We paid €969.1 million prior to the effective amendment date of the new framework agreement, of which €305.5 million relating to R&D costs, which was not to be repaid, and €663.6 million relating to capital expenditures and supply chain investments. The method of repayment for the capital expenditure and supply chain investment support has been converted to be repaid annually to ASML between 2021 and 2032. This amount is presented within Other Assets as Advanced payments to Carl Zeiss SMT GmbH. The new framework agreement does not change the risk associated with these assets.
The cash outflows from ASML in the new variable pricing model for purchases of products and services was determined to currently have two elements. The first is cash outflows for purchasing products and services reflected in our inventory valuation and cost of sales. The second consists of R&D funding for High-NA as Carl Zeiss SMT GmbH, for which these costs are presented within Research and development costs. For 2021, this amount was determined to be €61.2 million. Under the previous High-NA agreement, we incurred R&D costs of €96.1 million in 2020 and €94.2 million in 2019.
An initial loan of €124.4 million has been provided on September 29, 2021, which is valued at amortized cost and presented within Other Assets. Under the previous High-NA agreement, we provided support for capital expenditures and supply chain investments in 2020 of €221.4 million and in 2019 of €188.6 million.
In addition to the High-NA support, we make non-interest bearing advance payments to support Carl Zeiss SMT GmbH’s work-in-process. These payments are made to secure optical column deliveries and these advance payments are settled through future lens or optical column deliveries, and are also presented in Other Assets. The new framework does not change our right to settle
ASML ANNUAL REPORT 2021 218
the previously paid amounts and does not change the risk associated with these assets. We will continue to support Carl Zeiss SMT GmbH's work-in-process under the new framework agreement through prepayments on product deliveries.
The outstanding balances with Carl Zeiss SMT Holding GmbH & Co. KG and its subsidiaries in our Consolidated Balance Sheets, as well as our maximum exposure to losses as of December 31, 2021:
| | | | | | | | | | | |
| Year ended December 31 (€, in millions) | 2020 | 2021 | Maximum exposure to loss |
| Advance payments included in Other assets | 933.8 | | 982.8 | | 982.8 | |
| Advance payments included in Property, plant & equipment | 52.8 | | 82.1 | | 82.1 | |
| Loan receivable | — | | 124.4 | | 124.4 | |
| Right-of-use assets - Finance | 149.9 | | — | | — | |
Investment agreement for 24.9% equity | 820.7 | | 892.5 | | 892.5 | |
| Accounts payable | 110.9 | | 482.7 | | — | |
| Accrued and other liabilities | — | | — | | — | |
Our maximum exposure to loss related to our involvement in Carl Zeiss SMT Holding GmbH & Co. KG as a variable interest entity includes the carrying value of each of the assets, as well as the risk of any future operating losses of Carl Zeiss SMT Holding GmbH & Co. KG, which cannot be quantified.
The Right-of-use assets from finance leases in 2020 mainly consisted of facilities and tooling related to our High-NA agreement with Carl Zeiss SMT, for which the funds are prepaid by ASML. This agreement was replaced by a new framework agreement. These assets no longer meet the definition of a lease upon entering into the new agreement. They are classified as part of Other assets in 2021.
The total purchases from Carl Zeiss SMT Holding GmbH & Co. KG and its subsidiaries are as follows:
| | | | | | | | | | | |
| Year ended December 31 (€, in millions) | 2019 | 2020 | 2021 |
| Total purchases | 1,502.3 | | 1,623.9 | | 2,070.3 | |
Other related party considerations
There have been no transactions between ASML or any of its subsidiaries, any other significant shareholder, any director or officer, or any relative or spouse thereof, other than ordinary course (compensation) arrangements. During our most recent fiscal year, there has been no, and at present there is no, outstanding indebtedness to ASML owed by or owing to any director or officer of ASML or any associate thereof. Furthermore, ASML has not granted any personal loans, guarantees, or the like to members of the Board of Management or Supervisory Board.
ASML ANNUAL REPORT 2021 219
27. Subsequent events
Subsequent events were evaluated up to February 9, 2022, which is the date the Financial Statements included in this Annual Report were approved.
ASML Berlin manufactures components for ASML’s lithography systems, including wafer tables and clamps, reticle chucks and mirror blocks. There was a fire on January 2, 2022 inside a part of one production building on the site in Berlin and the smoke partly impacted an adjacent building. We have been able to resume production in parts of these buildings already. The other buildings on the site have not been affected and are fully operational. We are in the process of a thorough investigation and make a full assessment on the financial impact. Based on our current insights, we believe we can manage the consequences of this fire without significant impact on our system output.
There are no other events to report.
Veldhoven, the Netherlands
February 9, 2022
/s/ Peter T.F.M. Wennink
Peter T.F.M. Wennink
President, CEO and member of the Board of Management
/s/ Roger J.M. Dassen
Roger J.M. Dassen
Executive Vice President, CFO and member of the Board of Management
ASML ANNUAL REPORT 2021 220
Assurance Report of the Independent Auditor
To: the General Meeting of Shareholders and the Supervisory Board of ASML Holding N.V.
Our conclusion
We have reviewed the non-financial information of ASML Holding N.V. (hereafter:’ the Company’) for the year ended 31 December 2021 (hereafter: the non-financial information).
Based on the procedures performed nothing has come to our attention that causes us to believe that the non-financial information is not prepared, in all material respects, in accordance with the reporting criteria as described in the ‘Reporting criteria’ section of our report.
The non-financial information consists of: 2021 at a glance (pages 5 to 8), Who we are and what we do (pages 9-27), Our strategy (pages 34-37), Our performance in 2021 (pages 38-41 and 52-138) and the Non-financial statements (pages 221-246).
Basis for our conclusion
We performed our review in accordance with Dutch law, including Dutch Standard 3810N: "Assurance engagements relating to sustainability reports", which is a specified Dutch standard that is based on the International Standard on Assurance Engagements (ISAE) 3000: "Assurance Engagements other than Audits or Reviews of Historical Financial Information (Attestation engagements)". This engagement is aimed to obtain limited assurance.
Our responsibilities in this regard are further described in the ‘Auditor’s responsibilities’ section of our report.
We are independent of ASML Holding N.V. in accordance with the ‘Verordening inzake de onafhankelijkheid van accountants bij assurance-opdrachten’ (ViO, Code of Ethics for Professional Accountants, a regulation with respect to independence). Furthermore, we have complied with the ‘Verordening gedrags- en beroepsregels accountants’ (VGBA, Dutch Code of Ethics).
We believe the assurance evidence we have obtained is sufficient and appropriate to provide a basis for our conclusion.
Reporting Criteria
The non-financial information needs to be read and understood together with the reporting criteria. ASML Holding N.V. is solely responsible for selecting and applying these reporting criteria, taking into account applicable law and regulations related to reporting.
The reporting criteria used for the preparation of the non-financial information are the Sustainability Reporting Standards of the Global Reporting Initiative (GRI) and the applied supplemental reporting criteria as disclosed in section ‘About the non-financial information’ of the Annual Report.
Materiality
Based on our professional judgement we determined materiality levels for each relevant part of the non-financial information and for the non-financial information as a whole. When evaluating our materiality levels, we have taken into account quantitative and qualitative considerations as well as the relevance of information for both stakeholders and the Company.
We agreed with the Supervisory Board that misstatements which are identified during the review and which in our view must be reported on quantitative or qualitative grounds, would be reported to them.
Scope of the group review
ASML Holding N.V. is the parent company of a group of entities. The non-financial information incorporates the consolidated information of this group of entities to the extent as specified in ‘About the non-financial information’ of the Annual Report.
Our group review procedures consisted of both review procedures at corporate (consolidated) level and at entity level. Our selection of entities in scope of our review procedures is primarily based on the entities’ individual contribution to the consolidated information.
By performing our review procedures at entity level, together with additional review procedures at corporate level, we have been able to obtain sufficient and appropriate assurance evidence about the group’s non-financial information to provide a conclusion about the non-financial information.
ASML ANNUAL REPORT 2021 222
Limitations to the scope of our review
The non-financial information includes prospective information such as ambitions, strategy, plans, expectations and estimates. Inherently the actual future results are uncertain. We do not provide any assurance on the assumptions and achievability of prospective information in the non-financial information.
References to external sources or websites in the non-financial information are not part of the non-financial information itself as reviewed by us. Therefore, we do not provide assurance on this information.
Board of Management's responsibilities
The Board of Management of the Company is responsible for the preparation of the non-financial information in accordance with the applicable criteria as described in the ‘Reporting criteria’ section of our report, including the identification of stakeholders and the definition of material matters. The choices made by Board of Management regarding the scope of the non-financial information and the reporting policy are summarized within the section ‘About the non-financial information’ of the Annual Report.
Furthermore, the Board of Management is responsible for such internal control as it determines is necessary to enable the preparation of the non-financial information that is free from material misstatement, whether due to fraud or error.
The Board of Management is, amongst other things, responsible for overseeing the Company’s reporting process.
Auditor's responsibilities
Our responsibility is to plan and perform our review in a manner that allows us to obtain sufficient and appropriate assurance evidence for our conclusion.
Procedures performed to obtain a limited level of assurance are aimed to determine the plausibility of information and vary in nature and timing, and are less in extent, compared to a reasonable assurance engagement. The level of assurance obtained in a limited assurance engagement is substantially lower than the assurance that would have been obtained had a reasonable assurance engagement been performed.
We apply the ‘Nadere Voorschriften Kwaliteitssystemen’ (NVKS, Regulations for Quality management systems) and accordingly maintain a comprehensive system of quality control including documented policies and procedures regarding compliance with ethical requirements, professional standards and applicable legal and regulatory requirements.
We have exercised professional judgement and have maintained professional scepticism throughout the review, in accordance with the Dutch Standard 3810N, ethical requirements and independence requirements.
Our review included among others:
•Performing an analysis of the external environment and obtaining an understanding of relevant societal themes and issues, and the characteristics of the Company;
•Evaluating the appropriateness of the reporting criteria used, their consistent application and related disclosures in the non-financial information. This includes the evaluation of the results of stakeholder dialogue and the reasonableness of estimates made by the Board of Management;
•Obtaining an understanding of the reporting processes for the non-financial information, including obtaining a general understanding of internal control relevant to our review;
•Identifying areas of the non-financial information where a material misstatement, whether due to fraud or error, is most likely to occur, designing and performing assurance procedures responsive to these areas, and obtaining assurance information that is sufficient and appropriate to provide a basis for our conclusion. Our procedures included, among others:
–Interviewing management and relevant staff responsible for the strategy, policy and results;
–Interviewing relevant staff responsible for providing the information for, carrying out internal control procedures over, and consolidating the data in the non-financial information;
–Obtaining assurance information that the non-financial information reconciles with underlying records of the Company;
–Reviewing, on a limited test basis, relevant internal and external documentation;
–Performing an analytical review of the data and trends.
•Evaluating the consistency of the non-financial information with the information in the report which is not included in the scope of our review;
•Evaluating the presentation, structure and content of the non-financial information;
•Considering whether the non-financial information as a whole, including the disclosures, reflects the purpose of the reporting criteria used.
We have communicated with the Board of Management and the Supervisory Board regarding, among other matters, the planned scope and timing of the review and significant findings that we identified during our review.
Amstelveen, 9 February 2022
KPMG Accountants N.V.
P.J. Groenland- van der Linden RA
ASML ANNUAL REPORT 2021 223
About the non-financial information
Reporting scope
The content disclosed in this Annual Report1 is based on the material topics identified for both ASML and our stakeholders by the comprehensive materiality assessment conducted in 2018. As part of the materiality assessment, we asked internal and external stakeholders to identify where in the value chain the theme has an impact, where we include the boundaries as required by the GRI Standards). Read more in: Non-financial statements - Materiality assessment.
The materiality assessment was used as input for the sustainability strategy setting for the period 2019-2025. (Key) performance indicators have been determined to report on our performance of this sustainability strategy. During our investor day we announced our updated sustainability strategy over which we will report as of 2022.
The Reporting scope table (see next page) clarifies the scope of the data reported per theme and explains where the scope of the data provided differs from the scope of the report’s content.
This Annual Report generally covers the performance of ASML from January 1, 2021 to December 31, 2021.
The financial information in this report is derived from our Financial Statements that are in conformity with US GAAP. The reporting basis for the information in this report on our performance in the area of sustainability is prepared in accordance with the GRI Sustainability Reporting Standards and is presented in accordance with the ‘core’ option. Details of our compliance with the GRI standards (GRI content index) can be found in a separate Reporting Supplement available on the Website.
1.We publish two annual reports. One version of the annual report is prepared in conformity with US GAAP. The other version of the annual report is prepared in accordance with EU-IFRS and also complies with Article 362.9 of Book 2 of the Dutch Civil Code. For internal and external reporting purposes, we apply US GAAP. US GAAP is our primary accounting standard for setting financial and operational performance targets.
Reporting process
Each theme has an owner who is responsible for the theme ambition, strategy and relevant performance indicators, as well as the timely delivery of content and relevant data for reporting and monitoring the execution of the strategy. The data is reviewed and consolidated by Finance. Finance is also responsible for the reporting and planning process for the Annual Report.
Reporting indicators
The Consolidated Financial Statements included in this report are audited. Read more in: Consolidated Financial Statements - Report of Independent Registered Public Accounting Firm.
The non-financial data disclosed in this report is derived from various sources and the way data is processed differs within our operating subsidiaries and departments. This causes a degree of uncertainty, because of limitations in measuring and estimating data. We continue to work on improving our sustainability control environment and data collection processes.
Systems active in installed base
We monitor the number of active systems in our installed base, which we service. This includes our EUV, DUV and PAS5500 systems. We calculated the percentage of all systems ever sold (EUV, DUV and PAS5500 systems) that are still in use. Some systems in the field may not be serviced by ASML, but are operational. For the indicator '% of active systems' we apply assumptions for the portion of systems active but not serviced by ASML. Based on historical information and experience we determine that 33% of non-ASML serviced systems are still active in the field.
Scope 3 emissions
We measure and report the indirect emissions from our activities in the value chain – scope 3 emissions. This category includes emissions resulted from our operations as well as the emissions from upstream supply chain and downstream use of our products by customers. Read more in: Our performance in 2021 - Environmental - Climate and energy - Carbon footprint strategy.
When using the reported information, the following methodology, assumptions and data reliability needs to be considered:
•Due to its nature the scope 3 emissions data includes a time lag. As a result the emissions reported in the reporting year, are calculated by use of the actual data sources from one year earlier.
•The emissions reported are in line with the Greenhouse Gas (GHG) Protocol and are calculated for nine categories, as described in the Scope 3 Accounting and Reporting Standard issued by GHG Protocol, which are deemed relevant to us and our value chain.
•The categories included: Cat.1 Purchased goods and services, Cat.2 Capital goods, Cat.3 Fuel- and energy- related activities, Cat.4 and Cat.9 Upstream / Downstream transportation & distribution, Cat.5 Waste generated in operations, Cat.6 Business
ASML ANNUAL REPORT 2021 224
travel, Cat.7 Employee commuting, Cat.11 Use of sold products, and Cat.12 End-of-life treatment of sold products. The remaining five categories are deemed irrelevant or immaterial to ASML and our value chain. Therefore we exclude these categories from our Scope 3 emissions assessment.
•The applied emission factors used to calculate our value chain carbon footprint are from the latest DEFRA (UK Department for Environment, Food & Rural Affairs) 2021 emission factors.
•The basis for the calculation method applied for scope 3, Cat.11 Use of sold products is based on SEMI S23 standard for the system energy measurement. In addition, we apply certain assumptions such as system availability level and performance level. These may change overtime due to system enhancements.
•The basis for the calculation method applied for scope 3, Cat.1 Purchased goods and services is based on spend. As a result, it relies on expenditure-based emission factors, which is an indirect measure of GHG intensity of goods and services.
•In addition, we have gathered actual emissions data from our suppliers for Cat.4 Upstream transportation & distribution and Cat.6 Business travel, which accounts for around 3% of total Scope 3 emissions.
Reporting scope table
The below table clarifies the scope of the data reported per theme and explains where the scope of the data provided differs from the scope of the report’s content. Companies excluded in the scope below do not have data available for certain subchapters.
| | | | | |
| (Sub)chapter Annual Report | Scope |
| Who we are and what we do | |
| How we innovate | ASML worldwide |
| Customer intimacy | ASML worldwide |
| Financial performance | |
| Financial performance indicators | ASML worldwide |
| Climate and energy | |
| Carbon footprint strategy | ASML locations above 250 FTE, excluding BG |
| Product energy efficiency strategy | ASML products, excluding BG |
| Circular economy | |
| Reduce waste in our operations | ASML locations above 250 FTE, excluding BG |
| Re-use parts and materials from installed base | ASML products, excluding BG |
| Recycle mature products through refurbishment | ASML products, excluding BG |
| Our people | |
| Our people vision | ASML worldwide, excluding BG |
| Unified culture | ASML worldwide, excluding BG |
| Employee experience | ASML worldwide, excluding BG – NOTE: The indicator ‘Absenteeism’ is excluding Cymer and HMI. The scope for indicator Open positions filled by internal candidates (in %) excludes ASML US. |
| Strong leadership | ASML worldwide, excluding BG |
| Ensuring employee safety | ASML worldwide, excluding BG |
| Community engagement | |
| Community engagement program | ASML worldwide, excluding BG – NOTE: Technology promotion is ASML Netherlands only |
| ASML Foundation | ASML worldwide, excluding BG |
| Innovation ecosystem | |
| Partnerships with research institutes and universities | ASML worldwide, excluding BG |
| Collaborating with R&D partners | ASML worldwide, excluding HMI and BG |
| Supporting startups and scaleups | ASML Netherlands |
| Responsible supply chain | |
| Sourcing and supply chain strategy | ASML worldwide, excluding BG |
| Supplier performance management | ASML worldwide, excluding BG |
| Supply chain risk management | ASML worldwide, excluding BG |
| Responsible Supply Chain | ASML worldwide, excluding HMI and BG |
| Responsible business | |
| Business ethics and Code of Conduct | ASML worldwide, excluding BG |
| Product safety | ASML products |
| Water management | ASML locations above 250 FTE, excluding BG - except for Total Ultra-pure water consumption and Total water recycled and re-used, which is Veldhoven (the Netherlands), Linkou (Taiwan) and HMI Tainan (Taiwan) only. |
| Rest | ASML worldwide |
ASML ANNUAL REPORT 2021 225
Scope changes
Compared to the 2020 Annual Report, the following scope changes have been made:
•The scope of 'Carbon footprint of our operations', 'Water management' and 'Reduce waste' for the 2021 non-financial data is extended with the manufacturing locations 'San Jose', 'Tainan' and 'Other'. Other includes the locations with more than 250 FTE combined, except BG.
•'GRI 306: Waste 2020' requires a split between 'waste diverted from disposal' and 'waste directed to disposal'. The non-financial data layout of 'Circular economy- reduce waste' is changed to be compliant with the updated GRI for waste.
•The scope of 'Fair Remuneration' is extended with a split by region for 2019, 2020 and 2021 non-financial data.
•The source for 'Total training expenses' changed from a HR-report to a more detailed SAP report.
•As of 2021, overall ranking for South Korea is no longer conducted by Universum. The result reported for 2021 is based on a customized ranking report. We corrected 2020 result for the Netherlands by including the overall ranking.
Review of this report
As requested by our Board of Management, our non-financial information has been independently reviewed. Our external auditor (KPMG) was asked to review this non-financial information. For KPMG’s assurance report, including details of the work they carried out, read more in: Non-financial statements - Assurance Report of the Independent Auditor.
ASML ANNUAL REPORT 2021 226
Non-financial indicators
The non-financial Key Performance Indicators (KPIs) are reported in the different chapters of our sustainability reporting within Our position in the semiconductor value chain. The other non-financial performance indicators (PIs) are reported in the tables below.
| | | | | | | | | | | | | | |
| Customer intimacy | | | | |
| Description | 2019 | 2020 | 2021 | Comments |
| Overall Loyalty Score (Customer Feedback Survey) | n/a | 72.6 | % | n/a | The survey takes place every 24 months (last survey held in September 2020) |
| VLSI Survey results | | | | |
| Large suppliers of chipmaking equipment - score (scale 0 to 10) | 9.2 | | 9.3 | | 9.2 | | |
| Suppliers of Fab equipment - score (scale 0 to 10) | 9.2 | | 9.3 | | 9.2 | | |
| Technical leadership for lithography equipment - score (scale 0 to 10) | 9.6 | | 9.7 | | 9.5 | | |
| | | | | | | | | | | | | | |
| Climate and energy - Energy | | | | |
| Description | 2019 | 2020 | 2021 | Comments |
| Energy consumption (in TJ) | 1,367 | 1,412 | 1,689 | | |
| Energy savings worldwide through projects (in TJ) | 80 | 114 | 13 | | In 2021 we started a new master-plan period for 2021-2025 with a target to achieve 100 TJ energy savings by the end of 2025. The savings are realized by projects resulting in improved technical installation or by projects resulting in an improved production process. Types of energy included in savings: fuel and electricity. The figures from 2019 and 2020 are related to the master-plan 2016-2020. The savings reported are cumulated compared to the base year, therefore they are not comparable. |
| Electricity purchased per location (in TJ) | | | | |
| Veldhoven | 751 | 802 | 881 | | |
| Wilton | 102 | 114 | 120 | | |
| Linkou | 36 | 35 | 34 | | |
| San Diego | 162 | 167 | 176 | | |
| San Jose | — | — | 28 | | In scope for this indicator since 2021. |
| Tainan | — | — | 36 | | In scope for this indicator since 2021. |
| Other | — | — | 47 | | In scope for this indicator since 2021.Other includes the locations with more than 250 FTE combined. |
| Total | 1,051 | 1,118 | 1,322 | | |
ASML ANNUAL REPORT 2021 227
| | | | | | | | | | | | | | |
| Climate and energy - Energy | | | | |
| Description | 2019 | 2020 | 2021 | Comments |
Fossil fuels consumed from non-renewable sources (in TJ) 1 | | | | Fossil fuels consumed consists of only natural gas. |
| Veldhoven | 159 | | 141 | | 184 | | |
| Wilton | 111 | | 112 | | 127 | | |
| Linkou | — | | — | | — | No natural gas is used by this manufacturing location. |
| San Diego | 46 | | 40 | | 43 | | |
| San Jose | — | — | 5 | | In scope for this indicator since 2021. |
| Tainan | — | — | — | | In scope for this indicator since 2021. No natural gas is used by this manufacturing location. |
| Other | — | — | 8 | | In scope for this indicator since 2021.Other includes the locations with more than 250 FTE combined. |
| Total | 316 | 293 | 367 | | |
| Fuels consumed from renewable sources (in TJ) | — | | — | | — | | |
| | | | |
1.The sources of the conversion factors used are the Dutch Emissions Authority and the US Energy Information Administration.
| | | | | | | | | | | | | | |
Climate and energy - CO2 emissions | | | | |
| Description | 2019 | 2020 | 2021 | Comments |
| Emission intensity (scope 1+2+3) | 0.01 | | 0.61 | | 0.47 | In 2020 the definition for emission intensity has changed and is calculated as scope 1,2 and 3 emissions (in kt) divided by total revenue (in millions). The recalculated number for 2019 amounts to 0.56. In 2019 the emission intensity was calculated as net scope 1 and scope 2 emissions (in kt) divided by total revenue (in millions). Per 2020, scope 3 is included in the calculation. |
| Type of Energy Attribute Certificates (in TJ) | | | | |
| Guarantee of Origins (GOs) | 751 | | 802 | | 883 | |
| Renewable Energy Certificates (RECs) | 264 | | 281 | | 331 | |
| I-RECs | — | | 35 | | — | |
| Total | 1,015 | | 1,118 | | 1,214 | | |
| Type of Energy Attribute Certificates (in kton) | | | | |
| Guarantee of Origins (GOs) | 116 | | 110 | | 121 | |
| Renewable Energy Certificates (RECs) | 21 | | 21 | | 24 | |
| I-RECs | — | 9 | — | |
| Total | 137 | 140 | 145 | |
| Number of significant fines and non-monetary sanctions | — | 1 | — | In 2020, there was one fine for HMI Beijing due to fact that they had no environmental permit. |
| The monetary value of significant fines for non-compliance with environmental laws and regulations (in thousand €) | — | 70 | — | |
ASML ANNUAL REPORT 2021 228
| | | | | | | | | | | | | | |
| Circular economy - Waste management | | | | |
| Description | 2019 | 2020 | 2021 | Comments |
Total waste generated (in 1,000 kg)1 | | | | |
| Total non-hazardous waste | 4,565 | 4,654 | 5,284 | |
| Total hazardous waste | 362 | 372 | 395 | |
| Total construction waste | 608 | 231 | 199 | |
| Total | 5,535 | 5,257 | 5,878 | Total waste is treated offsite, no waste treatment onsite. |
Total waste by disposal (in 1,000 kg)1 | | | | |
| Waste diverted from disposal | 4,532 | 4,466 | 4,544 | |
| Waste directed to disposal | 1,003 | 791 | 1,334 | |
| Total | 5,535 | 5,257 | 5,878 | |
Waste diverted from disposal: Recycling1 | | | | We apply recycling of waste. Other categories like preparation for re-use and composting are not applicable to us. |
| Total non-hazardous waste | 3,618 | 3,911 | 4,028 | |
| Total hazardous waste | 336 | 349 | 346 | |
| Total construction waste | 578 | 206 | 170 | |
| Total | 4,532 | 4,466 | 4,544 | |
Waste directed to disposal: Incineration (with energy recovery)1 | | | | |
| Total non-hazardous waste | 567 | 411 | 938 | Increase due to change in waste treatment by supplier. We engaged with the supplier to recycle related waste. |
| Total hazardous waste | 9 | 9 | 16 | |
| Total construction waste | 20 | 20 | 17 | |
| Total | 596 | 440 | 971 | |
Waste directed to disposal: Incineration (without energy recovery)1 | | | | |
| Total non-hazardous waste | 37 | 3 | 51 | |
| Total hazardous waste | 15 | 13 | 27 | |
| Total construction waste | 0 | 0 | 0 | |
| Total | 52 | 16 | 78 | |
Waste directed to disposal: Landfill1 | | | | |
| Total non-hazardous waste | 343 | 329 | 267 | |
| Total hazardous waste | 2 | 1 | 6 | |
| Total construction waste | 10 | 5 | 12 | |
| Total | 355 | 335 | 285 | |
Total waste disposed (% of total waste from operations)1 | | | | |
| Incineration (with energy recovery) | 12 | % | 8 | % | 17 | % | |
| Incineration (without energy recovery) | 1 | % | — | % | 1 | % | |
| Landfill | 7 | % | 7 | % | 5 | % | |
| Total | 20 | % | 15 | % | 23 | % | |
| Used lithography systems sold | 26 | 22 | 23 | Lifetime extension of mature systems. |
1.The waste disposal methods are determined by information provided by the waste disposal contractor. As of 2021 we split total waste in waste directed to disposal and waste diverted from disposal as required by the GRI. The comparing figures for 2019 and 2020 are adjusted to disclose this split.
ASML ANNUAL REPORT 2021 229
| | | | | | | | | | | | | | | | | | | | | | | | | | | | | | | | | | | | | | |
| Our people - Workforce indicators |
| Number of FTEs (payroll and temporary) | Total ASML | Asia | Europe | US |
| 2019 | 2020 | 2021 | 2019 | 2020 | 2021 | 2019 | 2020 | 2021 | 2019 | 2020 | 2021 |
| Payroll employees (in FTE) | 23,219 | 25,082 | 28,747 | 5,664 | 6,027 | 7,404 | 12,393 | 13,627 | 15,444 | 5,162 | 5,428 | 5,899 |
| Female (in %) | 16 | 17 | 18 | 16 | 17 | 17 | 16 | 17 | 18 | 17 | 17 | 17 |
| Male (in %) | 84 | 83 | 82 | 84 | 83 | 83 | 84 | 83 | 82 | 83 | 83 | 83 |
| Temporary employees (in FTE) | 1,681 | 1,399 | 2,095 | 68 | 30 | 26 | 1,339 | 1,087 | 1,786 | 274 | 282 | 283 |
| Female (in %) | 17 | 16 | 18 | 34 | 28 | 19 | 17 | 19 | 20 | 11 | 7 | 8 |
| Male (in %) | 83 | 84 | 82 | 66 | 72 | 81 | 83 | 81 | 80 | 89 | 93 | 92 |
| Total | 24,900 | 26,481 | 30,842 | 5,732 | 6,057 | 7,430 | 13,732 | 14,714 | 17,230 | 5,436 | 5,710 | 6,182 |
| Number of FTEs (by age group) | | | | | | | | | | | | |
| < 30 | 4,894 | 4,798 | 6,344 | 1,628 | 1,518 | 2,191 | 2,378 | 2,381 | 3,041 | 888 | 899 | 1,112 |
| 30 - 50 | 15,606 | 16,848 | 19,058 | 3,902 | 4,300 | 4,933 | 8,924 | 9,615 | 11,007 | 2,780 | 2,933 | 3,118 |
| > 50 | 4,130 | 4,556 | 5,158 | 201 | 238 | 305 | 2,430 | 2,718 | 3,182 | 1,499 | 1,600 | 1,671 |
Unknown 1 | 270 | 279 | 282 | 1 | 1 | 1 | — | — | — | 269 | 278 | 281 |
| Total | 24,900 | 26,481 | 30,842 | 5,732 | 6,057 | 7,430 | 13,732 | 14,714 | 17,230 | 5,436 | 5,710 | 6,182 |
1.In the US, it is not mandatory to register the age for temporary employees.
| | | | | | | | | | | | | | | | | | | | | | | | | | | | | | | | | | | | | | |
| Our people - Workforce indicators | | | | | | | | | | | | |
| Number of payroll FTEs (split in full-time and part-time) | Total ASML | Asia | Europe | US |
| 2019 | 2020 | 2021 | 2019 | 2020 | 2021 | 2019 | 2020 | 2021 | 2019 | 2020 | 2021 |
| Full-time payroll FTEs (by age group) | | | | | | | | | | | | |
| < 30 | 4,397 | 4,351 | 5,664 | 1,612 | 1,512 | 2,185 | 1,898 | 1,941 | 2,367 | 887 | 898 | 1,112 |
| 30 - 50 | 13,567 | 14,938 | 16,682 | 3,856 | 4,280 | 4,917 | 6,937 | 7,730 | 8,651 | 2,774 | 2,928 | 3,114 |
| > 50 | 3,674 | 4,028 | 4,501 | 193 | 232 | 299 | 1,988 | 2,207 | 2,542 | 1,493 | 1,589 | 1,660 |
| | | | | | | | | | | | |
| Total | 21,638 | | 23,317 | | 26,847 | 5,661 | | 6,024 | | 7,401 | 10,823 | | 11,878 | | 13,560 | 5,154 | | 5,415 | | 5,886 |
| Full-time payroll FTEs (by gender) | | | | | | | | | | | | |
| Female (in %) | 15 | 15 | 16 | 16 | 17 | 17 | 14 | 14 | 15 | 17 | 17 | 17 |
| Male (in %) | 85 | 85 | 84 | 84 | 83 | 83 | 86 | 86 | 85 | 83 | 83 | 83 |
| Part-time payroll FTEs (by age group) | | | | | | | | | | | | |
| < 30 | 41 | 39 | 46 | — | — | — | 41 | 39 | 46 | — | — | — |
| 30 - 50 | 1,264 | 1,337 | 1,420 | 1 | 1 | 2 | 1,259 | 1,332 | 1,415 | 4 | 4 | 3 |
| > 50 | 276 | 389 | 434 | 2 | 2 | 1 | 270 | 378 | 423 | 4 | 9 | 10 |
| | | | | | | | | | | | |
| Total | 1,581 | | 1,765 | | 1,900 | 3 | | 3 | | 3 | 1,570 | | 1,749 | | 1,884 | 8 | | 13 | | 13 |
| Part-time payroll FTEs (by gender) | | | | | | | | | | | | |
| Female (in %) | 37 | 37 | 37 | 17 | — | — | 37 | 37 | 37 | 62 | 46 | 27 |
| Male (in %) | 63 | 63 | 63 | 83 | 100 | 100 | 63 | 63 | 63 | 38 | 54 | 73 |
ASML ANNUAL REPORT 2021 230
| | | | | | | | | | | | | | | | | | | | | | | | | | | | | | | | | | | | | | |
| Our people - Workforce indicators |
| Number of new hires payroll employees (in FTEs) | Total ASML | Asia | Europe | US |
| 2019 | | 2020 | | 2021 | 2019 | | 2020 | | 2021 | 2019 | | 2020 | | 2021 | 2019 | | 2020 | | 2021 |
| Number of new hires | 2,219 | 1,932 | 4,373 | 558 | 598 | 1,848 | 1,102 | 879 | 1,737 | 559 | 455 | 788 |
| New hires as a % of the total payroll employees | 10 | 8 | 15 | 10 | 10 | 25 | 9 | 6 | 11 | 11 | 8 | 13 |
| Gender | | | | | | | | | | | | |
| Female | 542 | 454 | 896 | 123 | 123 | 313 | 280 | 216 | 432 | 139 | 115 | 151 |
| Male | 1,677 | 1,478 | 3,477 | 435 | 475 | 1,535 | 822 | 663 | 1,305 | 420 | 340 | 637 |
| Total | 2,219 | | 1,932 | | 4,373 | 558 | | 598 | | 1,848 | 1,102 | | 879 | | 1,737 | 559 | | 455 | | 788 |
| Age group | | | | | | | | | | | | |
| < 30 | 923 | 854 | 2,392 | 318 | 338 | 1,213 | 380 | 329 | 783 | 225 | 187 | 396 |
| 30 - 50 | 1,136 | 947 | 1,789 | 233 | 253 | 627 | 643 | 491 | 848 | 260 | 203 | 314 |
| > 50 | 160 | 131 | 190 | 7 | 7 | 6 | 79 | 59 | 106 | 74 | 65 | 78 |
| Unknown | | | 2 | | | 2 | | | | | | |
| Total | 2,219 | | 1,932 | | 4,373 | 558 | | 598 | | 1,848 | 1,102 | | 879 | | 1,737 | 559 | | 455 | | 788 |
| | | | | | | | | | | | | | | | | | | | | | | | | | | | | | | | | | | | | | |
| Our people - Workforce indicators |
| Employee attrition (in FTE) | Total ASML | Asia | Europe | US |
| 2019 | | 2020 | | 2021 | 2019 | | 2020 | | 2021 | 2019 | | 2020 | | 2021 | 2019 | | 2020 | | 2021 |
| Number of involuntary employee attrition | 177 | 186 | 199 | 40 | 38 | 41 | 80 | 102 | 101 | 57 | 46 | 57 |
| Number of voluntary employee attrition | 761 | 723 | 1,234 | 198 | 201 | 421 | 257 | 239 | 341 | 306 | 283 | 472 |
| Total | 938 | | 909 | | 1,433 | 238 | | 239 | | 462 | 337 | | 341 | | 442 | 363 | | 329 | | 529 |
| Gender | | | | | | | | | | | | |
| Female | 196 | 189 | 258 | 55 | 56 | 78 | 72 | 69 | 89 | 69 | 64 | 91 |
| Male | 742 | 720 | 1,175 | 183 | 183 | 384 | 265 | 272 | 353 | 294 | 265 | 438 |
| Total | 938 | | 909 | | 1,433 | 238 | | 239 | | 462 | 337 | | 341 | | 442 | 363 | | 329 | | 529 |
| Age group | | | | | | | | | | | | |
| < 30 | 219 | 218 | 337 | 78 | 73 | 143 | 61 | 67 | 69 | 80 | 78 | 125 |
| 30 - 50 | 519 | 479 | 806 | 144 | 149 | 292 | 198 | 179 | 257 | 177 | 151 | 257 |
| > 50 | 200 | 212 | 290 | 16 | 17 | 27 | 78 | 95 | 116 | 106 | 100 | 147 |
| Total | 938 | | 909 | | 1,433 | 238 | | 239 | | 462 | 337 | | 341 | | 442 | 363 | | 329 | | 529 |
| | | | | | | | | | | | | | |
| Our people - Employee engagement |
| Engagement score We@ASML by gender | 2019 | 2020 | 2021 | Comments |
| Female | 75 | % | 80 | % | 78 | % | |
| Male | 77 | % | 80 | % | 78 | % | |
ASML ANNUAL REPORT 2021 231
| | | | | | | | | | | | | | |
| Our people - Employee engagement |
| Description | 2019 | 2020 | 2021 | Comments |
| Employee Attrition (in %) | 4.3 | | 3.8 | 5.4 | |
| Attrition rate of high performers (in %) | 2.4 | | 1.7 | 2.6 | A high performer is an employee with the merit classification 'exceptional' or 'exceeds expectations' from the annual employee performance evaluation. |
| Promotion rate - Overall (in %) | 14 | | 13 | 15 | |
| Promotion rate of high performers (in %) | 38 | | 37 | 40 | |
| Absenteeism (in %) | | | | |
Asia 1 | 0.4 | 0.5 | 0.7 | In some Asian countries sick leave is regarded as annual leave, hence illness-related absenteeism is recorded as 0%. |
| Europe | 2.6 | 2.3 | 2.4 | |
| US | 1.6 | 1.3 | 1.4 | |
| | | | | | | | | | | | | | |
| Our people - Employee engagement |
| Description | 2019 | 2020 | 2021 | Comments |
| Open positions filled by internal candidates (in %) | 36 | | 30 | | 29 | |
| Rotation ratio (in %) | 18 | | 20 | | 13 | |
| Human Capital Return On Investment (ROI) | 2.1 | | 2.4 | | 3.0 | Human Capital Return on Investment is calculated as total net sales minus total operating expenses excluding total employee salaries & benefits, divided by total employee salaries & benefits. |
| | | | |
| People Performance Management process completion (in %) | 97 | | 97 | 95 | |
| Development Action Plan completion (in %) | 76 | | 77 | 74 | |
| Scholarships | | | | |
| Number of scholarships Netherlands | 53 | | 49 | | 50 | |
| Number of scholarships US | — | | — | | 7 | |
| Number of scholarships Taiwan | — | | 16 | | 24 | |
| Number of scholarships China | — | | 5 | | 5 | |
| Number of scholarships South Korea | — | | 3 | | 5 | |
| | | | | | | | | | | | | | |
| Our people - Employee engagement |
| Description | 2019 | 2020 | 2021 | Comments |
| Total training expenses (in million €) | 19 | | 12 | 27 | Out-of-pocket expenses for technical and non-product related classroom trainings as recorded in MyLearning (learning management system). |
| Average spend on training and development per FTE (€) | 836 | | 494 | | 1,020 | | |
| Number of total training hours per FTE | | | | Includes technical and non-product related training hours (including nomination courses). |
| Female | 41 | | 26 | | 25 | |
| Male | 46 | | 29 | | 30 | |
| Weighted average | 45 | | 28 | | 29 | |
ASML ANNUAL REPORT 2021 232
| | | | | | | | | | | | | | |
| Our people - Employee engagement |
| Description | 2019 | 2020 | 2021 | Comments |
Number of technical training hours per technical FTE | | | | The number of technical training hours per FTE is calculated as the total technical training hours divided by the total payroll FTEs working in technical departments within Operations and R&D. |
| Female | 35 | 22 | 22 | |
| Male | 41 | 27 | 29 | |
| Weighted average | 40 | | 26 | | 28 | |
| Number of non-product related training hours per FTE | | | | Excluding nomination courses (leadership development programs) |
| Female | 13 | 7 | 8 | |
| Male | 8 | 4 | 5 | |
| Weighted average | 9 | | 5 | | 5 | |
| Nomination courses: Leadership Development Programs | | | | |
| Number of training hours | 33,715 | | 22,896 | | 6,264 | | Due to COVID-19 only two ECAP programs started in 2021 |
| Number of employees attending (unique) | 387 | | 216 | | 48 | | |
| | | | | | | | | | | | | | | | | | | | | | | | | | | | | | | | | | | | | | |
| Our people - Diversity & inclusion | | | | | | | | | | | | |
| Description | Gender | | Gender ratio | | Age group | Comments |
Male/female in managerial positions and in Supervisory Board (in headcount) 1 | Female | Male | Total | | Female | Male | | < 30 | 30 - 50 | >50 | Total | |
| Supervisory Board | 3 | | 5 | | 8 | | | 38 | % | 62 | % | | | | 8 | | 8 | | |
| Board of Management | | 5 | | 5 | | | — | % | 100 | % | | | 1 | | 4 | | 5 | | |
| Senior Management | 67 | | 555 | | 622 | | | 11 | % | 89 | % | | | 283 | | 339 | | 622 | | |
| Middle Management | 363 | | 2,505 | | 2,868 | | | 13 | % | 87 | % | | 1 | | 1,704 | | 1,163 | | 2,868 | | |
| Junior Management | 218 | | 1,170 | | 1,388 | | | 16 | % | 84 | % | | 36 | | 1,136 | | 216 | | 1,388 | | |
| Other | 4,607 | | 19,732 | | 24,339 | | | 19 | % | 81 | % | | 5,708 | | 15,311 | | 3,320 | | 24,339 | | |
| Total | 5,258 | | 23,972 | | 29,230 | | | 18 | % | 82 | % | | 5,745 | | 18,435 | | 5,050 | | 29,230 | | |
| Gender | | Gender ratio | | | | | | |
| Male/female split by sector (in FTE) | Female | Male | Total | | Female | Male | | | | | | |
| Customer Support | 795 | | 6,596 | | 7,391 | | | 11 | % | 89 | % | | | | | | |
| Manufacturing and Supply Chain Management | 1,507 | | 5,973 | | 7,480 | | | 20 | % | 80 | % | | | | | | |
| Research & Development | 1,733 | | 10,098 | | 11,831 | | | 15 | % | 85 | % | | | | | | |
| General & Administrative | 1,099 | | 1,632 | | 2,731 | | | 40 | % | 60 | % | | | | | | |
| Sales and Mature Product Services | 116 | | 586 | | 702 | | | 17 | % | 83 | % | | | | | | |
| Strategic Supply Management | 192 | | 515 | | 707 | | | 27 | % | 73 | % | | | | | | |
| Total | 5,442 | | 25,400 | | 30,842 | | | 18 | % | 82 | % | | | | | | |
1.Temporary employees are not included in the headcount numbers.
ASML ANNUAL REPORT 2021 233
| | | | | | | | | | | | | | |
| Our people - Diversity & inclusion | | | | |
| Description | 2019 | 2020 | 2021 | Comments |
| Workforce by gender male / female (in %) | | | | |
| Female | 16 | 17 | 18 | | |
| Male | 84 | 83 | 82 | | |
| Total | 100 | 100 | 100 | | |
| Number of nationalities working for ASML | | | | |
| Asia | 36 | 35 | 33 | | |
| Europe | 103 | 103 | 108 | | |
| US | 82 | 86 | 90 | | |
| Worldwide total | 118 | 120 | 122 | | |
| Foreign nationals working for ASML (in %) | | | | Foreign nationals working for ASML (in %) is the percentage of payroll and temporary employees with another nationality than the country in which the employee is working |
| Asia | 6 | 6 | 5 | | |
| Europe | 31 | 32 | 33 | | |
| US | 29 | 27 | 28 | | |
| Worldwide total | 25 | 25 | 26 | | |
ASML ANNUAL REPORT 2021 234
| | | | | | | | | | | | | | |
| Our people - Labor relations | | | | |
| Description | 2019 | 2020 | 2021 | Comments |
| Percentage of employees covered by collective bargaining agreements | 52 | % | 53 | % | 52 | % | |
| | | | | | | | | | | | | | |
| Our people - Fair remuneration | | | | |
| Description | 2019 | 2020 | 2021 | Comments |
Ratio of base salary of women to men 1,2 | | | | |
Senior Management 3 | 103 | % | 99 | % | 99 | % | Calculation method has been changed compared to 2019 see footnote 3. |
Middle Management 3 | 99 | % | 98 | % | 99 | % | |
Non-management 3 | 98 | % | 98 | % | 98 | % | |
Ratio of base salary women to men, split by region 1 | | | | Split to region is made since 2021, including comparative figure for 2020. |
| Europe | — | % | 99 | % | 99 | % | |
| Asia | — | % | 96 | % | 96 | % | |
| US | — | % | 99 | % | 100 | % | |
Ratio of total cash of women to men 1,4 | | | | Total cash is base salary plus short-term incentive. |
Senior Management 5 | 102 | % | 99 | % | 99 | % | Calculation method has been changed compared to 2019 see footnote 5. |
Middle Management 5 | 98 | % | 98 | % | 99 | % | |
Non-Management 5 | 98 | % | 97 | % | 98 | % | |
Ratio of total cash women to men, split by region 1 | | | | Split to region is made since 2021, including comparative figure for 2020. |
| Europe | — | % | 97 | % | 98 | % | |
| Asia | — | % | 96 | % | 96 | % | |
| US | — | % | 99 | % | 100 | % | |
| | | | |
Internal pay ratio (CEO versus employee remuneration) 6 | 38 | 38 | 40 | For more information, see Supervisory Board - Remuneration Report |
1.The base salary and total cash used for the calculation in the reporting year consists of the actual base salaries and total cash paid in the previous reporting year.
2.In 2020 the definition for the ratio of base salary women to men has changed and is calculated as: average weighted salary female/average weighted salary male * 100%. In 2019 the ratio of the base salary women to men was calculated as: average salary per grade female/ average salary per grade male *100%.
3.The recalculated ratio of base salary of women to men for 2019 of senior management is 99%. The recalculation does not impact the 2019 PI for middle management and non-management.
4.In 2020 the definition for the ratio of total cash women to men has changed and is calculated as: average weighted salary including bonus female/average weighted salary including bonus male * 100%. In 2019 the ratio of the base salary women to men was calculated as: average salary per grade including bonus female/ average salary per grade including bonus male *100%.
5.The recalculated ratio of total cash of women to men for 2019 PI of senior management is 96%. The recalculation does not impact the 2019 PI for middle management and non-management.
6.The calculation approach of the Internal pay ratio is disclosed in the section Relationship between CEO and average remuneration (pay ratio). We revised our calculation approach to the internal pay ratio based on the December 2020 guidance from the Monitoring Committee Dutch Corporate Governance Code on section 3.4.1.iv of the Dutch Corporate Governance Code effective as of 2021. The comparative historical numbers of the internal pay ratio have therefore been restated to include the social security expenses in the internal pay ratio numbers. In the calculation, we have taken into account the payroll employees only, since this ensures consistency with the figures disclosed in the consolidated financial statements. The ratio would be lower in case we would incorporate the temporary employees as they earn on average a higher remuneration.
ASML ANNUAL REPORT 2021 235
| | | | | | | | | | | | | | |
| Our people - Employee safety | | | | |
| Description | 2019 | 2020 | 2021 | Comments |
| ASML recordable incident rate | 0.28 | 0.18 | 0.17 | |
| Number of recordable incidents | 66 | 46 | 48 | |
| Number of fatalities | — | — | — | |
| Number of recordable incidents by region: | | | | |
| Asia | 12 | | 12 | | 7 | | |
| Europe | 26 | | 19 | | 29 | | |
| US | 28 | | 15 | | 12 | | |
| Number of first-aid incidents per body part affected: | | | | |
| Head | 45 | | 37 | | 45 | | |
| Eyes | 4 | | 7 | | 8 | | |
| Shoulder | 4 | | 4 | | 10 | | |
| Chest | 2 | | 3 | | 2 | | |
| Back | 17 | | 10 | | 13 | | |
| Arm | 19 | | 12 | | 12 | | |
| Hand | 80 | | 70 | | 74 | | |
| Leg | 29 | | 19 | | 18 | | |
| Foot | 12 | | 19 | | 19 | | |
| Other | 29 | | 1 | | 12 | | |
| Total | 241 | | 182 | | 213 | | |
| Number of first-aid incidents per region: | | | | |
| Asia | 44 | | 47 | | 34 | | |
| Europe | 143 | | 80 | | 112 | | |
| US | 54 | | 55 | | 67 | | |
| Total | 241 | | 182 | | 213 | | |
| Number of near misses by region: | | | | A near miss is an unplanned event which did not result in injury, illness, or damage, but had the potential to do so |
| Asia | 1,031 | | 3,201 | | 1,868 | | |
| Europe | 1,498 | | 1,221 | | 1,354 | | |
| US | 718 | | 631 | | 991 | | |
| Total | 3,247 | | 5,053 | | 4,213 | | |
ASML ANNUAL REPORT 2021 236
| | | | | | | | | | | | | | |
| Community engagement | | | | |
| Description | 2019 | 2020 | 2021 | Comments |
| Number of students reached | 8,998 | 13,378 | 9,168 | |
| Time investment of volunteers (in hours) - Technology promotion and Campus promotion | 5,445 | 2,936 | 1,886 | |
| Time investment of volunteers (in hours) - Community Involvement | 7,664 | 1,333 | 2,393 | |
| | | | |
| | | | |
| Total cost of volunteering (x €1,000) | 772 | | 271 | | 283 | |
| # ASML Foundation projects supported | 17 | | 22 | | 22 | |
| | | | | | | | | | | | | | |
| Our supply chain - Responsible supply chain | | | | |
| Description | 2019 | 2020 | 2021 | Comments |
| RBA Code of Conduct compliance contract clause for LTSA suppliers (in %) | 59 | % | 67 | % | 76 | % | |
| Suppliers assessed on sustainability (in #) split by: | | | | |
| Audits | 12 | — | — | In 2020 and 2021, the audits have been put on hold due to COVID-19. |
RBA Self-Assessment Questionnaire (SAQ) | 29 | 59 | 56 | |
| RBA self-assessment completed (in %) | 78 | % | 88 | % | 89 | % | This indicator measures whether improvement plans are closed before the due date agreed with the supplier. The improvement plans are initiated in prior or current reporting period(s) based on RBA SAQs or Audits. |
| Suppliers identified with overall risk level 'high' on all sustainability elements (in #) | — | — | — | The risk level is determined by means of the RBA SAQ and ASML assessment, applied to major product-related suppliers |
| | | | |
| | | | |
| | | | |
| | | | |
| | | | |
| | | | |
| | | | |
| | | | |
| | | | |
| | | | |
| | | | |
| | | | |
ASML ANNUAL REPORT 2021 237
| | | | | | | | | | | | | | |
| Our supply chain - Supply chain | | | | |
| Description | 2019 | 2020 | 2021 | Comments |
| Total number of suppliers | 5,003 | 4,749 | 4,657 | |
| Number of suppliers, split by region: | | | | |
| Asia | 1,356 | 1,313 | 1,319 | |
| EMEA (excl. Netherlands) | 700 | 684 | 702 | |
| Netherlands | 1,620 | 1,477 | 1,459 | |
| North America | 1,327 | 1,275 | 1,177 | |
| Total | 5,003 | 4,749 | 4,657 | |
| Number of suppliers, split by: | | | | |
| Product-related | 790 | 779 | 772 | |
| Non-product related | 4,213 | 3,970 | 3,885 | |
| Total | 5,003 | 4,749 | 4,657 | Only Tier 1 suppliers |
| Number of suppliers, split by: | | | | |
| Critical | 221 | 222 | 229 | Critical suppliers are Tier 1 suppliers of strategic importance |
| Non-critical | 4,782 | 4,527 | 4,428 | |
| Total | 5,003 | 4,749 | 4,657 | |
| Number of critical suppliers, split by: | | | | |
| Product-related | 198 | 188 | 197 | |
| Non-product related | 23 | 34 | 32 | |
| Total | 221 | 222 | 229 | |
| Number of suppliers in scope for risk management | 212 | 235 | 243 | This includes 14 critical N-Tier suppliers |
| Total sourcing spend (in million €) | 6,683 | 7,645 | 9,045 | |
| Sourcing spend per supplier group (in %) | | | | |
| Product-related | 66 | % | 68 | % | 70 | % | |
| Non-product related | 34 | % | 32 | % | 30 | % | |
| Proportion of spending on local suppliers (in %) | | | | We define 'local' as the country in which a significant location of operation is located. The significant locations of operations are the main manufacturing sites of ASML, which are located in Veldhoven, the Netherlands; Linkou, Taiwan; San Diego and in Wilton, both in the United States. |
| Veldhoven | 46 | % | 47 | % | 45 | % | A relatively large amount of the total supplier spend for Veldhoven relates to Carl Zeiss (non-local) |
| Linkou | 46 | % | 48 | % | 50 | % | |
| San Diego | 89 | % | 94 | % | 92 | % | |
| Wilton | 66 | % | 71 | % | 64 | % | |
ASML ANNUAL REPORT 2021 238
| | | | | | | | | | | | | | |
| Responsible business - Business ethics | | | | |
| Description | 2019 | 2020 | 2021 | Comments |
| Total number of Speak Up messages | 255 | 229 | 396 | In October 2020 a new code of conduct and an updated speak up policy is launched. |
| Anti-corruption & bribery Speak Up messages | 16 | 19 | 37 | None of the Speak Up messages led to any indication of violation of anti-corruption laws. |
| Human rights Speak Up messages | 58 | 69 | 187 | |
| % Completion of Code of Conduct online training | 86 | % | 88 | % | 71 | % | |
| | | | |
| | | | |
| | | | | | | | | | | | | | |
| Responsible business - Product safety |
| Description | 2019 | 2020 | 2021 | Comments |
| Percentage of product types shipped that have a SEMI S2 Safety Guidelines compliance report | 100 | % | 100 | % | 100 | % | |
| Number of (significant) fines for non-compliance with product design related laws and regulations | — | — | — | |
| | | | | | | | | | | | | | |
| Responsible business - Water management | | | | |
| Description | 2019 | 2020 | 2021 | Comments |
Water consumption (in 1,000 m3) | | | | |
| Veldhoven | 628 | 658 | 728 | |
| San Diego | 90 | 80 | 105 | |
| Wilton | 90 | 94 | 95 | |
| Linkou | 30 | 28 | 26 | |
| San Jose | — | — | 21 | In scope for this indicator since 2021. |
| Tainan | — | — | 30 | In scope for this indicator since 2021. |
| Other | — | — | 36 | In scope for this indicator since 2021. Other includes the locations with more than 250 FTE combined. |
| Total | 838 | 860 | 1,041 | Municipal water supply |
| | | | |
Total Ultrapure water consumption (in 1,000 m3) | 115 | 127 | 84 | Only Veldhoven, Linkou and HMI Tainan are in scope for this indicator. The other locations are excluded from the scope because the data to report on the indicator is not yet available. |
| Total water recycled and reused (in %) | 2.4 | % | 1.8 | % | 1.2 | % | Only Veldhoven, Linkou and HMI Tainan are in scope for this indicator. The other locations are excluded from the scope because the data to report on the indicator is not yet available. |
| Water intensity | 71 | 62 | 56 | Water intensity is calculated as total water consumption (in m3) divided by total revenue (in millions). |
ASML ANNUAL REPORT 2021 239
Materiality assessment
Dialogue and knowledge-sharing are important in an innovation-driven industry. To this end, we continually and openly communicate with our main stakeholder groups through various channels and at different levels in our organization. Our stakeholders are parties affected by our activities or those who have a direct interest in or who can influence our company’s long-term business success.
Our materiality process
We develop our materiality assessment framework according to the GRI Standards, which includes principles of stakeholder engagement and identification, analysis and prioritization. We conduct our materiality assessment through a three-step approach.
| | | | | |
| Step 1: Identification of relevant aspects | Input |
| We update a shortlist of relevant topics annually. These are based on an analysis of stakeholder feedback, continuous stakeholder engagement, risks and opportunities, and a review of relevant industry and global trends. Topics include those important to our stakeholders in their decision-making, and, for ASML, those that can have an environmental, social or economic impact, in the organization, value chain or society. | International standards and legislation, such as: GRI, ISO 26000, TCFD, the EU Non-financial Reporting Directive
Industry and media analysis, such as: RBA, industry development reports, benchmarking sustainability performance from our peers in the DJSI
ESG analysts’ questionnaires/assessments, such as: DJSI, Sustainalytics, ISS ESG rating, CDP, MSCI ESG Index, FTSE4Good
Stakeholder engagement: feedback from regular and occasional stakeholder communication, ESG conferences and networks. Read more in: Stakeholder engagement. |
| Step 2: Analysis and prioritization | Output |
| We follow GRI Standards guidelines to rate how important topics are based on the level of stakeholder concern, and the significance of our environmental, social and economic impact resulting from our business and operations. | We narrow the long list of topics down to a shortlist of those relevant to us. The impact of these topics is gauged using available data, feedback from continuous stakeholder engagement, discussions with senior management and Board of Management members, business owners, and other relevant internal stakeholders (such as subject-matter experts). The Board of Management validates and approves assessment results. We identified the environmental, social, and governance topics that have the greatest impact on our business, and are of the greatest concern to stakeholders in our value chain. Read more in: How we create value. |
| Step 3: Confirmation and implementation | Strategy and reporting structure |
| The results of the materiality assessment are used to shape our strategy, setting long-term targets and aimed at long-term value creation for all of our stakeholder groups. The results also define the content of this Annual Report, in line with the GRI principles for defining report content. | In our latest assessment, conducted in 2018 for the sustainability strategy 2019-2025, we identified 17 material topics for sustainability, which we categorize in 5 material sustainability themes, and 2 ASML company specific topic (Innovation management and customer intimacy). These are the themes most relevant to our stakeholders in their decision-making, and in areas where ASML has or could have the highest impact. For each of the material themes we have determined our ambitions and have set long-term targets (2025). We monitor the progress, measure the performance and report these with regular intervals, at least annually in the Annual Report.
We also identified other factors we need to address as a company committed to conducting our business in an accountable and caring way. These include issues our stakeholders expect us to act on or issues we have an impact on. We have been categorized these under the ‘Responsible business' themes. Read more in: Materiality matrix below.
Our current sustainability strategy was launched in 2018 for the time period 2019–2025, focusing on five strategic sustainability areas. The evolution of our company and the increasing demand for transparent reporting on environmental, social and governance (ESG) aspects of sustainability have made us re-assess our sustainability strategy in 2021. To this end, we have updated our materiality assessment for the remaining period of 2022–2025, based on major sustainability topics and their relative importance to our business operations. We will implement the updated materiality topics in our reporting from reporting year 2022 onwards. Read more in: Our strategy. |
We also support the 2030 ambition defined in the United Nations Sustainable Development Goals (SDGs) adopted by the United Nations. These goals aim to protect the planet and improve the lives of people everywhere. We have mapped out how our strategy and current efforts actively support these goals. The materiality table outlines the five most relevant SDGs we contribute to. The SDG 9 'Industry, Innovation and Infrastructure' goal is connected to the core of our company, as innovation is our lifeblood and the engine that drives our business. We also contribute towards the SDG 4 'Quality Education', SDG 8 'Decent Work and Economic Growth', SDG 12 'Responsible Production and Consumption' and SDG 13 'Climate Action' goals. We highlight our performance against these SDGs throughout this report.
ASML ANNUAL REPORT 2021 240
Materiality matrix
| | | | | | | | | | | |
| Level of stakeholder concern |
| High | | (E) Energy management (operations) (E) Carbon footprint (E) Climate change | (B) Innovation management (B) Customer intimacy (E) Energy management (products) (S) Talent attraction and retention (S) Human capital development (S) Employee engagement |
| (S) Human rights
(S) Community engagement | (S) Occupational health and safety
(S) Diversity and inclusion
(S) Innovation ecosystem - Startups and scaleups support | (E) Waste management
(E) Product stewardship
(E) Circular economy - Re-use
(E) Circular economy - Recycling
(S) ESG risk supply chain
(S) Responsible supply chain
(S) Innovation partnership |
| Low | (G) Water management | (G) Tax strategy
(G) Financing policy | (B) Operational excellence
(G) Business ethics and compliance
(G) Information security
(G) IP Protection
(G) Product safety
(G) Enterprise risk management |
| Low | | High |
| | | Degree of impact on ASML |
Material themes, topics and their impact on the value chain | | | | | | | | | | | | | | | | | | | | |
| | | Impact area |
| Material theme | Topics | GRI topic | Upstream suppliers and partners | Our operations | Downstream customers and society | SDG |
| Business-related | | | | | | |
| Innovation management | •Core strategy •Technology and innovation •R&D •Product roadmap | N/A | þ
| þ þ þ þ |
þ
þ | SDG 9 |
| Customer intimacy | •Customer feedback survey •Operational excellence •Customer engagement | N/A | | þ
þ
þ | þ
þ
þ | |
| Environment | | | | | | |
| Climate & energy | •Energy efficiency products •Energy consumption EUV •Scope 1 emissions •Scope 2 emissions •Scope 3 carbon footprint •Renewable energy •Climate change | a.302: Energy b.305: Emissions | þ
þ | þ
þ
þ
þ
þ
þ
þ | þ þ
þ
þ | SDG 13 |
| Circular economy | •Waste management - Reduce •Circular economy - Reuse •Circular economy - Recycling | a.306: Effluents and waste | þ
þ | þ
þ
þ | þ
þ | SDG 12 |
| Social | | | | | | |
| Our people | •Culture and values •Employee experience •Employee engagement •Employer labor market brand •Human capital development •Attraction and retention •Diversity & inclusion •Labor practice | a.401: Employment b.404: Training and education c.405: Diversity of governance bodies and employees | | þ
þ
þ
þ
þ
þ
þ
þ | þ þ
| SDG 4
SDG 8 |
| Innovation ecosystem | •Innovation partnerships •Innovation pipeline •Support startup and scaleups | N/A | þ
| þ
þ
þ | þ þ | SDG 9 |
| Responsible supply chain | •Responsible supply chain - supplier sustainability standard (RBA) and performance •ESG risk in supply chain | a.204: Procurement practices b.308: Supplier environmental assessment c.414: Supplier social assessment | þ
þ | þ
þ | þ | SDG 8 |
ASML ANNUAL REPORT 2021 241
In addition to above mentioned material themes and topics, there are also other topics of interest for our stakeholders, which we deem as good company governance and practice, but are less material to our stakeholders and impact to ASML. We define those as Responsible business topics: business ethics, legal compliance, anti bribery and corruption, competition law, privacy protection, human rights, information security, intellectual property protection, product safety, water management, operational excellence, financing policy and tax policy. We report on these topics in a more concise manner.
Economic performance and corporate governance are topics classified under General Disclosures by the GRI Standards. While they are not mapped in the materiality matrix, relevant information are disclosed in our company's annual reporting.
Managing sustainability
We manage ESG sustainability through a robust framework, governed by several levels to drive accountability and execution, which include Board of Management, ESG Sustainability committee, ESG Sustainability office, topic specific action owners and experts.
Our Board of Management approves and signs off our ESG Sustainability strategy. They are responsible for policymaking and the supervision of ASML’s ESG Sustainability Strategy, as well as its compliance with legal and reporting requirements. This includes addressing the principal risks and opportunities related to the strategy. The Board of Management meets regularly to give guidance on relevant issues, including climate related risks and opportunities.
The ESG Sustainability Committee (SC) comprises members of the Board of Management and senior management executives and is headed by our CEO and COO. The ESG SC aims to optimize coordination and alignment at company wide level. The ESG SC is charged with developing corporate-wide ESG sustainability policies and has overall responsibility for monitoring and reviewing the ESG Sustainability KPIs to track progress. This also includes initiatives and actions addressing climate change matters. The ESG SC is equally focused on creating positive social and environmental impacts.
Our ESG Sustainability Office is responsible for overseeing and implementing our ESG Sustainability Strategy, and facilitating the ESG SC, such as facilitating the accomplishment of sustainability management policies and goals. Furthermore, the ESG Sustainability Office is tasked with identifying key issues, risks and opportunities (including climate change relates matters), global trends and (peers) best practices that could impact various short, medium and long-term ESG sustainability objectives.
Each of the material and responsible business themes are assigned to a senior executive, supported by a topic expert. Each senior executive is responsible for a KPI from the ESG Sustainability Strategy and is responsible for monitoring progress against agreed targets, and ensuring there are sufficient resources available to meet targets and objectives. In the event of insufficient progress, this is discussed at operational performance review meetings and raised during the ESG SC meetings.
In addition, we identify and assess the impact of climate-related risks and opportunities through an Enterprise Risk Management (ERM) process. We assess risks from both top-down (company-level) and bottom-up (organization and process-level) perspectives. Our risk management and control system is based on identifying external and internal risk factors that could influence our operational, business continuity and financial objectives. It contains a system of multidisciplinary assessments, monitoring, reporting, and operational reviews. The main value chain stages include, but are not limited to, our direct operations, upstream (our supply chain) and downstream (our customers) value chain.
Our performance on sustainability areas, as outlined in the materiality table, is part of the long-term incentive plans of our Board of Management and senior management. We measure our overall sustainability performance by benchmarking our result from the
ASML ANNUAL REPORT 2021 242
annual comprehensive Dow Jones Sustainability Index (DJSI) – assessing more than 20 ESG topics – with the best of the semiconductor industry. Read more in: Remuneration report.
ASML ANNUAL REPORT 2021 243
Stakeholder engagement
We define stakeholders as those individuals or groups or organizations that can affect or can be affected by our business. We regard five stakeholder groups: shareholders, customers, suppliers (including contractors), employees and society (e.g. local community, governments and authorities, industry union, labor organizations, other associations, media and NGOs).
Continuous stakeholder engagement, in which we embrace open dialogue and knowledge-sharing, are important in an innovation-driven industry and helps us to identify the areas of improvement. We communicate with our stakeholders through various channels and at a variety of levels. The methods of engagement will vary depending on the stakeholders, the issues of concern and the purpose of engagement. The following table is an overview of our main stakeholder groups, the way we communicate with them and an overview of the topics most relevant to them.
Shareholders
Purpose: This group consist of current shareholders, potential active and passive investors, financial and ESG analysts. We aim to help them to understand our (long-term) investment opportunities. We communicates with them about our financial growth strategies and opportunities, financial performance and outlook, shareholder returns as well as our Sustainability Strategy.
| | | | | | | | |
| Main communication channel and frequency | Main engagement topic | Themes in our materiality |
•Direct interaction with the Investor Relations department (e.g. calls, ESG performance surveys, email exchange, site visits - at ASML and/or at the investor) - [daily] •AGM - [annually] •Investor Day - [bi-annually] •Company quarterly results presentation and press release - [quarterly] •Various investor conferences and roadshows - [on occurrence] •Various sustainability questionnaires, assessments and survey feedback - [on occurrence, the majority of these are annual recurring] | •Financial results •Capital return •Market outlook •Products and end-market •Customer adoption •Geopolitics •Business summary •Company roadmap and product portfolio •ESG targets: human capital development, carbon footprint, waste, recycling, energy consumption, social responsibility in supply chain •Board diversity and remuneration | •Financial performance •Technology and innovation ecosystem •Customer intimacy •Our people •Our supply chain •Circular economy •Climate and energy •How we manage risk •Responsible business •Governance |
Customers
Purpose: We are a manufacturer of leading edge chipmaking equipment. We enable our customers to create the patterns that define the electronic circuits on a chip. Our customers are the world’s leading microchip manufacturers, and our success is inextricably linked with theirs.
| | | | | | | | |
| Main communication channel and frequency | Main engagement topic | Themes in our materiality |
•Customer feedback Survey - [bi-annually] •Direct interaction via account teams and zone quality managers •Voice of the customer sessions - [monthly] •Technology Review Meetings (between our CTO, product managers, other executives and our major customers) - [bi-annually] •Executive Review Meetings (between ASML executives and major customers) - [bi-annually] •Different technology symposia and special events - [on occurrence] | •Products and technology •Customer roadmap •Innovation •Customer support, cost of ownership and quality •ESG targets: carbon footprint, energy consumption, social responsibility in supply chain (RBA) | •Technology and innovation ecosystem •Customer intimacy •Operational excellence •Responsible supply chain •Circular economy •Climate and energy |
ASML ANNUAL REPORT 2021 244
Suppliers
Purpose: We rely heavily on our supplier network to achieve the innovations we strive for. Our goal is to ensure we get the products, materials and services we need to meet our short- and long-term needs. To this end we invest in developing our supply landscape to help suppliers meet our requirements with regard to quality, logistics, technology, cost and sustainability. We are committed to a responsible and sustainable supply chain.
| | | | | | | | |
| Main communication channel and frequency | Main engagement topic | Themes in our materiality |
•ASML’s supplier day - [annually] •Direct interaction via supplier account teams / procurement account managers - [daily] •Supplier audits - [on occurrence] •Site visit - [on occurrence] •Newsletter - [monthly] •RBA Self-assessment questionnaire - [annually] •ASML Speak up service - [on occurrence] | •Products and technology •QLTCS •Supplier performance and risk management •IP / information security •Business continuity •RBA compliance (ethics, labor practice, health and safety, and environment) •Scare (natural) resources, 3TG, hazardous substances, etc. •Circularity (re-use, recycling, refurb) •Scope 3 carbon footprint | •Technology and innovation ecosystem •Our supply chain •Responsible supply chain •Responsible business (including human rights) •Circular economy •Climate and energy |
Employees
Purpose: We want to provide a unified direction and anchor ASML’s identity deep in the organization. To do this, we aim to help people embrace our values and familiarize themselves with our strategy and purpose and uphold our Code of Conduct principles. Employee engagement is important to the success of our company and employer brand enables us to attract talent. We are committed to good labor practice and respect human rights.
| | | | | | | | |
| Main communication channel and frequency | Main engagement topic | Themes in our materiality |
•Employee engagement survey - [annually] •Training and development programs including employee evaluation/feedback - [on occurrence] •ASML Speak up service - [on occurrence] •Works Council - [quarterly] •Employee networks, such as Young ASML, Women@ASML, Seniors@ASML, Pink ASML - [on occurrence] •Internal communication and awareness (e.g. intranet, ethics program, department employee meeting, lunch with board members) - [daily] •Onboarding program new employees - [on occurrence] •All-employee meeting and Senior Management meetings - [annually] | •Training and development •Code of Conduct/Ethics •Strategy •Diversity and inclusion •Labor conditions •Vitality •Human rights •Sustainability target and performance | •Technology and innovation ecosystem •Our people (employee development, labor relations, fair remuneration) •Responsible supply chain •Circular economy •Climate and energy •Responsible business |
ASML ANNUAL REPORT 2021 245
Society
Purpose: We are committed to conducting our business in an accountable and caring way, for our employees and the wider communities we operate in. As a global technology leader and employer, we play an active role in the local communities in which we operate. We engage regularly with governments and (local) authorities, industry unions and associations, (local) community, universities, media and NGOs.
| | | | | | | | |
| Main communication channel and frequency | Main engagement topic | Themes in our materiality |
| Industry unions and associations | •Employee development •Charity, sponsoring and donations •Collaboration in innovation •Strengthening innovation in the industry, society and where we operate •Social and environmental responsibility •Promote STEM education •Local developments | •Technology and innovation ecosystem •Customer intimacy •Community engagement •Responsible business (human rights, ethics, privacy, ABC policy, etc.) •Our people (employee development, labor relations, fair remuneration) •Climate and energy •Circular economy •How we manage risk |
•Member conferences and technical forums (e.g. RBA, SEMI, FME, VNO-NCW, SPIE, etc.) - [monthly/on occurrence] •Member consultation on standards - [on occurrence] •Brainport - [on occurrence] |
| Governments and authorities |
•Dialogue with tax authority - [monthly/on occurrence] •Relevant EU round table discussions (semiconductor industry or innovation) - [on occurrence] •Compliance reporting - [monthly/on occurrence] •Proactive dialogue with government, authorities and municipalities - [on occurrence] |
| Community, universities, media, NGOs, other |
•www.asml.com - [daily] •Community engagement program (STEM promotion at secondary schools and universities, cultural institutions, local community, etc.) - [on occurrence] •Young high tech community (HighTechXL, Make Next platform, Startup Alliance) - [daily/on occurrence] •Company visit - [on occurrence] •Press release, interviews, engagement calls/meetings, etc. - [on occurrence] |
ASML ANNUAL REPORT 2021 246
Appendix - Principal accountant fees and services
KPMG has served as our independent registered public accounting firm for the years ended December 31, 2021 and 2020. The following table sets out the aggregate fees for professional audit services and other services rendered by KPMG and their member firms and affiliates in 2021 and 2020:
| | | | | | | | | | | | | | | | | | | | |
| Year ended December 31 | 2020 | 2021 |
| (€, in thousands) | KPMG Accountants N.V. | KPMG Network | Total | KPMG Accountants N.V. | KPMG Network | Total |
| Audit fees | 2,246 | | 1,090 | | 3,337 | | 2,449 | | 1,047 | | 3,496 | |
| Audit-related fees | 88 | | — | | 88 | | 90 | | — | | 90 | |
| Tax fees | — | | — | | — | | — | | — | | — | |
| All other fees | 37 | | — | | 37 | | 27 | | — | | 27 | |
| Principal accountant fees | 2,371 | | 1,090 | | 3,461 | | 2,566 | | 1,047 | | 3,613 | |
Audit fees and audit-related fees
Our independent registered public accounting firm is KPMG Accountants N.V. (KPMG), Amstelveen, The Netherlands, Auditor Firm ID: 1012. Audit fees relate to the audit of the Financial Statements as set out in this Annual Report, certain quarterly procedures, services related to offering memoranda (2020 only), as well as our statutory and regulatory filings of our subsidiaries. These fees relate to the audit of the respective Financial Statements, regardless of whether the work was performed during the financial year. Other audit-related fees are related to assurance services on non-financial information.
Other (non-audit) services relate to certain agreed-upon procedures on the targets achieved in order for the Remuneration Committee to assess compliance with the Remuneration Policy and agreed upon procedures for the US Advanced Pricing Agreement.
All audit fees, audit-related fees and permitted services that the independent auditor provides are subject to pre-approval by the Audit Committee. The Audit Committee pre-approved 100% of the external audit plan and audit fees for the years 2021 and 2020.
The Audit Committee monitors compliance with the Dutch, EU regulation and SEC rules on non-audit services provided by an independent registered public accounting firm, which outlines strict separation of audit and advisory services for Dutch public interest entities.
ASML ANNUAL REPORT 2021 248
Appendix - Property, plant and equipment
We lease a number of our facilities under operating leases. We also own a number of buildings, mainly consisting of production facilities in Veldhoven, the Netherlands, in Wilton, Connecticut, and San Diego, California, both in the US, in Linkou and Tainan, both in Taiwan and in Pyeongtaek, South Korea. The book value of land and buildings owned amounts to €1,856.0 million as of December 31, 2021 compared with €1,589.6 million as of December 31, 2020. See Consolidated Financial Statements - Notes to the Consolidated Financial Statements - Note 13 Property, plant and equipment, net.
Our capital expenditures (purchases of property, plant and equipment, see the Consolidated Statements of Cash Flows as recorded in the Consolidated Financial Statements) for 2021, 2020 and 2019 amounted to €900.7 million, €962.0 million and €766.6 million, respectively. The capital expenditures in 2021 slightly decreased compared to 2020 and relate to the expansion and upgrades of facilities, prototypes, evaluation and training systems.
Subject to market conditions, we expect that our capital expenditures (purchases of property, plant and equipment) in 2022 will be approximately €1.6 billion. These expenditures will mainly consist of further expansion and upgrades of facilities. We expect to finance these capital expenditures through cash generated by operations and existing cash and cash equivalents.
Facilities in Europe
Our headquarters, mainly manufacturing and R&D facilities are located at a single site in Veldhoven, the Netherlands. This state-of-the-art facility includes 187 thousand square meters of office space and 58 thousand square meters of cleanroom used for manufacturing and R&D activities and 53 thousand square meters of warehouses. Our main facilities in Veldhoven (and other buildings in the larger Eindhoven area) in the Netherlands are partly owned and partly leased office and industrial buildings. We also lease several sales and service offices across Europe consisting of 3 thousand square meters. This year we added the site in Berlin to our portfolio.
Facilities in the US
Our US head office is located in a 5 thousand square meter office building in Chandler, Arizona. We maintain R&D and manufacturing operations in a 42 thousand square meter facility and 8 thousand square meter warehousing in Wilton, Connecticut, and one facilities for mainly office and R&D activities totaling 17 thousand square meters in San Jose, California. Furthermore, our facilities in San Diego totaling 46 thousand square meters include 29 thousand square meters of buildings used for office and R&D activities, 10 thousand square meters of buildings used for manufacturing and R&D activities and 7 thousand square meters of buildings used for warehousing. Our HMI facilities in San Jose, California which is mainly used for R&D and Local sales and service activities are comprised of approximately 34 thousand square meters.
Facilities in Asia
Our key locations are Taiwan, Korea and China, where we have local service, sales and manufacturing activities. Our facility in Linkou, Taiwan is comprised of a manufacturing facilities that is approximately 3 thousand square meters and office space that is approximately 5 thousand square meters. Our facility in Hwasung, South Korea is comprised of a cleanroom that is approximately 0.9 thousand square meters and office space that is approximately 7 thousand square meters. Our Cymer facility in Pyeongtaek, South Korea, is a manufacturing facility, mainly used for refurbishment activities of light sources. Our HMI facilities include Tainan, Taiwan (approximately 20 thousand square meters) utilized for manufacturing and office space, as well as Beijing, China that is 9 thousand square meters utilized for manufacturing and office space. We also have several sales, service and training locations across Asia. Lastly, we have regional service activity in Hong Kong.
ASML ANNUAL REPORT 2021 249
Appendix - Dutch taxation
The statements below represent a summary of current Dutch tax laws, regulations and judicial interpretations thereof. The description is limited to the material tax implications for a holder of ordinary shares who is not, and / or is not deemed to be, a resident of the Netherlands for Dutch tax purposes (‘Non-Resident Holder’). This summary does not address special rules that may apply to special classes of holders of ordinary shares and should not be read as extending by implication to matters not specifically referred to herein. As to individual tax consequences, each investor in our ordinary shares should consult his or her tax counsel.
General
The acquisition of ordinary shares by a non-resident of the Netherlands should in itself not be treated as a taxable event for Dutch tax purposes. The material tax consequences in connection with owning and disposing of our ordinary shares are discussed below.
Substantial interest
A person that, (inter alia) directly or indirectly, and either independently or jointly with his partner (as defined in the Dutch Personal Income Tax Act 2001), owns 5.0% or more of our share capital, owns profit participating rights that correspond to at least 5.0% of the annual profits of a Dutch company or to at least 5.0% of the liquidation proceeds of such company or holds options to purchase 5.0% or more of our share capital, is deemed to have a substantial interest in our shares, or our options, as applicable. Specific rules apply in case certain family members of the Non-Resident Holder hold a substantial interest. A deemed substantial interest also exists if (part of) a substantial interest has been disposed of, or is deemed to be disposed of, in a transaction where no taxable gain has been recognized. Specific attribution rules exist in determining the presence of a substantial interest.
Income tax consequences for individual non-resident holders on owning and disposing of the ordinary shares
An individual who is a Non-Resident Holder will not be subject to Dutch income tax on received income in respect of our ordinary shares or capital gains derived from the sale, exchange or other disposition of our ordinary shares, provided that such holder:
•Does not carry on and has not carried on a business in the Netherlands through a (deemed) permanent establishment or a permanent representative to which the ordinary shares are attributable;
•Does not hold and has not held a (deemed) substantial interest in our share capital or, in the event the Non-Resident Holder holds or has held a (deemed) substantial interest in our share capital, such interest is, or was, a business asset in the hands of the holder;
•Does not share and has not shared directly (through the beneficial ownership of ordinary shares or similar securities) in the profits of an enterprise managed and controlled in the Netherlands which (is deemed to) own(s), or (is deemed to have) has owned, our ordinary shares; and
•Does not carry out and has not carried out any activities which generate taxable profit in the Netherlands or taxable income in the Netherlands to which the holding of our ordinary shares was connected.
Corporate income tax consequences for corporate non-resident holders
Income derived from ordinary shares or capital gains derived from the sale, exchange or disposition of ordinary shares by a corporate Non-Resident Holder is taxable if:
•The holder carries on a business in the Netherlands through a permanent establishment or a permanent representative in the Netherlands (Dutch enterprise) and the ordinary shares are attributable to this permanent establishment or permanent representative, unless the participation exemption (discussed below) applies; or
•The holder has a substantial interest in our share capital, which is held with the primary aim or one of the primary aims to avoid the levy of income tax at the level of another person and which is not put into place with valid commercial reasons that reflect economic reality; or
•The holder is a resident of Aruba, Curacao or Saint Martin with a permanent establishment or permanent representative in Bonaire, Eustatius or Saba to which our ordinary shares are attributable and certain conditions are met; or
•Certain assets of the holder are deemed to be treated as a Dutch enterprise under Dutch tax law and the ordinary shares are attributable to this Dutch enterprise.
To qualify for the Dutch participation exemption, the holder must generally hold at least 5.0% of our nominal paid-in capital and meet certain other requirements.
Dividend withholding tax
In general, a dividend distributed by us in respect of our ordinary shares will be subject to a withholding tax imposed by the Netherlands at the statutory rate of 15.0%.
ASML ANNUAL REPORT 2021 250
Dividends include:
•Dividends in cash and in kind;
•Deemed and constructive dividends;
•Consideration for the repurchase or redemption of ordinary shares (including a purchase by a direct or indirect ASML subsidiary) in excess of qualifying average paid-in capital unless such repurchase is made for temporary investment purposes or is exempt by law;
•Stock dividends up to their nominal value (unless distributed out of qualifying paid-in capital);
•Any (partial) repayment of paid-in capital not qualifying as capital for Dutch dividend withholding tax purposes; and
•Liquidation proceeds in excess of qualifying average paid-in capital for Dutch dividend withholding tax purposes.
Under certain circumstances, a reduction of Dutch dividend withholding tax can be obtained:
•An exemption at source is available if the participation exemption applies and the ordinary shares are attributable to a business carried out in the Netherlands;
•An exemption at source is available for dividend distributions to certain qualifying EU/EEA resident corporate holders, unless such holder holds our ordinary shares with the primary aim or one of the primary aims to avoid the levy of Dutch dividend withholding tax at the level of another person and our ordinary shares are not held for valid commercial reasons that reflect economic reality;
•An exemption at source is available for dividend distributions to certain qualifying corporate holders that are a resident of a non-EU/EEA jurisdiction with which the Netherlands has concluded a tax treaty that includes a dividend article, unless such holder holds our ordinary shares with the primary aim or one of the primary aims to avoid the levy of Dutch dividend withholding tax at the level of another person and our ordinary shares are not held for valid commercial reasons that reflect economic reality;
•Certain tax exempt organizations (e.g. pension funds and excluding collective investment vehicles) resident in EU/EEA member states or in qualifying non-EU/EEA states may be eligible for a refund of Dutch dividend withholding tax upon their request. Based on domestic law not yet entered into force, in those circumstances, an exemption at source may also become available upon request;
•Upon request and under certain conditions, certain qualifying Non-Resident Individual and Corporate Holders of ordinary shares resident in EU/EEA member states or in a qualifying non-EU/EEA state may be eligible for a refund of Dutch dividend withholding tax insofar the withholding tax levied is higher than the personal and corporate income tax which would have been due if they were resident of the Netherlands.
Furthermore, a Non-Resident Holder of ordinary shares can be eligible for a partial or complete exemption or refund of all or a portion of the above withholding tax under a tax treaty that is in effect between the Netherlands and the Non-Resident Holder’s country of residence. The Netherlands has concluded such treaties with the US, Canada, Switzerland, Japan, most EU member states, as well as many other countries. Under the treaty between the US and the Netherlands for the Avoidance of Double Taxation and the Prevention of Fiscal Evasion with Respect to Taxes on Income (the ‘US Tax Treaty’), dividends paid by us to a Non-Resident Holder that is a resident of the US as defined in the US Tax Treaty (other than an exempt organization or exempt pension trust, as discussed below) are generally liable to 15.0% Dutch withholding tax or, in the case of certain US corporate shareholders owning directly at least 10.0% of our voting power, a reduction to 5.0%, provided that the Holder is the beneficial owner of the dividends received and does not have an enterprise or an interest in an enterprise that is, in whole or in part, carried on through a permanent establishment or permanent representative in the Netherlands to which the dividends are attributable. The US Tax Treaty also provides for a dividend withholding tax exemption on dividends, but only for a shareholder owning directly at least 80.0% of our voting power and meeting all other requirements. The US Tax Treaty provides for a complete exemption from tax on dividends received by exempt pension trusts and exempt organizations, as defined therein. Except in the case of exempt organizations, the reduced dividend withholding tax rate (or exemption from withholding) can be applied at the source upon payment of the dividends, provided that the proper forms have been filed in advance of the payment. Exempt organizations, in principle, remain subject to the statutory withholding rate of 15.0% and are required to file for a refund of such withholding, however such organizations may become eligible for the exemption at source when the domestic law as described above has entered into force.
A Non-Resident Holder may not claim the benefits of the US Tax Treaty unless (i) he/she is a resident of the US as defined therein, or (ii) he/she is deemed to be a resident on the basis of the provisions of article 24(4) of the US Tax Treaty, and (iii) his or her entitlement to those benefits is not limited by the provisions of article 26 (limitation on benefits) of the US Tax Treaty.
Dividend stripping rules
Under Dutch tax legislation regarding anti-dividend stripping, no exemption from, or refund of, Dutch dividend withholding tax is granted if the recipient of dividends paid by us is not considered the beneficial owner of such dividends.
Gift or inheritance taxes
Dutch gift or inheritance taxes will not be levied on the transfer of ordinary shares by way of gift or upon the death of a Non-Resident Holder, unless the transfer is construed as an inheritance or as a gift made by or on behalf of a person, who at the time of the gift or death, is deemed to be resident of the Netherlands.
ASML ANNUAL REPORT 2021 251
Gift tax and inheritance tax are levied on the beneficiary. For purposes of Dutch gift and inheritance tax, an individual of Dutch nationality is deemed to be a resident of the Netherlands if he/she has been a resident thereof at any time during the ten years preceding the time of the gift or death. For purposes of Dutch gift tax, a person not possessing Dutch nationality is deemed to be a resident of the Netherlands if he / she has resided therein at any time in the twelve months preceding the gift.
Value added tax
No Dutch VAT is imposed on dividends in respect of our ordinary shares or on the transfer of our shares.
Residence
A Non-Resident Holder will not become resident, or be deemed to be resident, in the Netherlands solely as a result of holding our ordinary shares or of the execution, performance, delivery and / or enforcement of rights in respect of our ordinary shares.
US taxation
The following is a discussion of the material US federal income tax consequences relating to the acquisition, ownership and disposition of ordinary shares by a United States Holder (as defined below) acting in the capacity of a beneficial owner who is not a tax resident of the Netherlands. This discussion deals only with ordinary shares held as capital assets and does not deal with the tax consequences applicable to all categories of investors, some of which (such as tax-exempt entities, financial institutions, regulated investment companies, dealers in securities/traders in securities that elect a mark-to-market method of accounting for securities holdings, insurance companies, investors owning directly, indirectly or constructively 10.0% or more of our outstanding voting shares, investors who hold ordinary shares as part of hedging or conversion transactions and investors whose functional currency is not the US dollar) may be subject to special rules. In addition, the discussion does not address any alternative minimum tax or any state, local, Foreign Investment in Real Property Tax Act-related US federal income tax consequences, or non-US tax consequences.
This discussion is based on the US-Netherlands Income tax treaty, the Internal Revenue Code of 1986, as amended to the date hereof, final, temporary and proposed Treasury Department regulations promulgated, and administrative and judicial interpretations thereof, changes to any of which subsequent to the date hereof, possibly with retroactive effect, may affect the tax consequences described herein. In addition, there can be no assurance that the IRS will not challenge one or more of the tax consequences described herein, and we have not obtained, nor do we intend to obtain, a ruling from the IRS or an opinion of counsel with respect to the US federal income tax consequences of acquiring or holding shares. Prospective purchasers of ordinary shares are advised to consult their tax advisers with respect to their particular circumstances and with respect to the effects of US federal, state, local or non-US tax laws to which they may be subject.
As used herein, the term ‘United States Holder’ means a beneficial owner of ordinary shares for US federal income tax purposes whose holding of such ordinary shares does not form part of the business property or assets of a permanent establishment or fixed base in the Netherlands; who is fully entitled to the benefits of the treaty in respect of such ordinary shares; and is:
•An individual citizen or tax resident of the US; or
•A corporation or other entity treated as a corporation for US federal income tax purposes created or organized in or under the laws of the US or of any political subdivision thereof; or
•An estate of which the income is subject to US federal income taxation regardless of its source; or
•A trust whose administration is subject to the primary supervision of a court within the US and which has one or more US persons who have the authority to control all of its substantial decisions.
If an entity treated as a partnership for US federal income tax purposes owns ordinary shares, the US federal income tax treatment of a partner in such partnership will generally depend upon the status and tax residency of the partner and the activities of the partnership. A partnership that owns ordinary shares and the partners in such partnership should consult their tax advisors about the US federal income tax consequences of holding and disposing of the ordinary shares.
Passive Foreign Investment Company considerations
We believe we were not a passive foreign investment company for US federal income tax purposes in 2021 and that we will not be a passive foreign investment company in 2022. However, as passive foreign investment company status is a factual matter that must be determined annually at the close of each taxable year, there can be no certainty as to our actual passive foreign investment company status in any particular year until the close of the taxable year in question. We have not conducted a detailed study at this time to confirm our non-passive foreign investment company status. If we were treated as a passive foreign investment company in any year during which a United States Holder owned common shares, certain adverse tax consequences could apply. Investors should consult their tax advisors with respect to any passive foreign investment company considerations.
ASML ANNUAL REPORT 2021 252
Taxation of dividends
United States Holders should generally include in gross income, as foreign-source dividend income the gross amount of any non-liquidating distribution (before reduction for Dutch withholding taxes) we make out of our current or accumulated earnings and profits (as determined for US federal income tax purposes) when the distribution is actually or constructively received by the United States Holder. Distributions will not be eligible for the dividends-received deduction generally allowed to US corporations in respect of dividends received from other US corporations. The amount of the dividend distribution included in income of a United States Holder should be the US dollar value of the foreign currency (e.g. euros) paid, determined by the spot rate of exchange on the date of the distribution, regardless of whether the payment is in fact converted into US dollars. Distributions in excess of current and accumulated earnings and profits, as determined for US federal income tax purposes, will be treated as a non-taxable return of capital to the extent of the United States Holder’s US tax basis in the ordinary shares and thereafter as taxable capital gain. We presently do not maintain calculations of our earnings and profits under US federal income tax principles. If we do not report to a United States Holder the portion of a distribution that exceeds earnings and profits, the distribution will generally be taxable as a dividend even if that distribution would otherwise be treated as a non-taxable return of capital or as capital gain under the rules described above.
Subject to limitations provided in the US Internal Revenue Code, a United States Holder may generally deduct from its US federal taxable income, or credit against its US federal income tax liability, the amount of qualified Dutch withholding taxes. However, Dutch withholding tax may be credited only if the United States Holder does not claim a deduction for any Dutch or other non-US taxes paid or accrued in that year. In addition, Dutch dividend withholding taxes will likely not be creditable against the United States Holder’s US tax liability to the extent we are not required to pay over the amount withheld to the Dutch Tax Administration. Currently, a Dutch corporation that receives dividends from qualifying non-Dutch subsidiaries may credit source country tax withheld from those dividends against Dutch withholding tax imposed on a dividend paid by a Dutch corporation, up to a maximum of 3.0% of the dividend paid by the Dutch corporation. The credit reduces the amount of dividend withholding that we are required to pay to the Dutch Tax Administration but does not reduce the amount of tax we are required to withhold from dividends.
For US foreign tax credit purposes, dividends paid by us generally will be treated as foreign-source income and as ‘passive category income’ (or in the case of certain holders, as ‘general category income’). Gains or losses realized by a United States Holder on the sale or exchange of ordinary shares generally will be treated as US-source gain or loss. The rules governing the foreign tax credit are complex and we suggest that each United States Holder consult his or her own tax advisor to determine whether, and to what extent, a foreign tax credit will be available.
Dividends received by a United States Holder will generally be taxed at ordinary income tax rates. However, the Jobs and Growth Tax Relief Reconciliation Act of 2003, as amended by the Working Families Tax Relief Act of 2004, the American Jobs Creation Act of 2004, the American Taxpayer Relief Act of 2012, and most recently the 2017 tax reform act (Public Law No. 115-97) reduces to 20.0% the maximum tax rate for certain dividends received by individuals, so long as certain exclusions do not apply and the stock has been held for at least 60 days during the 121-day period beginning 60 days before the ex-dividend date. Dividends received from ‘qualified foreign corporations’ generally qualify for the reduced rate. A non-US corporation (other than a passive foreign investment company) generally will be considered to be a qualified foreign corporation if: (i) the shares of the non-US corporation are readily tradable on an established securities market in the US or (ii) the non-US corporation is eligible for the benefits of a comprehensive income tax treaty with the US that has been identified as a qualifying treaty and contains an exchange of information program. In addition, subject to income limitations, dividends received by US individuals and US residents, estates and trusts will be subject to a Net Investment Income Tax (NIIT) assessed at the rate of 3.8%. Individual United States Holders should consult their tax advisors regarding the impact of this provision on their particular situations.
Dividends paid by us generally will constitute ‘portfolio income’ for purposes of the limitations on the use of passive activity losses (and, therefore, generally may not be offset by passive activity losses) and as ‘investment income’ for purposes of the limitation on the deduction of investment interest expense.
Taxation on sale or other disposition of ordinary shares
Upon a sale or other disposition of ordinary shares, a United States Holder will generally recognize capital gain or loss for US federal income tax purposes in an amount equal to the difference between the amount realized, if paid in US dollars, or the US dollar value of the amount realized (determined at the spot rate on the settlement date of the sale) if proceeds are paid in currency other than the US dollar, as the case may be, and the United States Holder’s US tax basis (determined in US dollars) in such ordinary shares. Generally, the capital gain or loss will be long-term capital gain or loss if the holding period of the United States Holder in the ordinary shares exceeds one year at the time of the sale or other disposition. The deductibility of capital losses is subject to limitations for US federal income tax purposes. Gain or loss from the sale or other disposition of ordinary shares generally will be treated as US source income or loss for US foreign tax credit purposes. Generally, any gain or loss resulting from currency fluctuations during the period between the date of the sale of the ordinary shares and the date the sale proceeds are converted into US dollars will be treated as ordinary income or loss from sources within the US. Each United States Holder should consult his or her tax advisor with regard to the translation rules applicable when computing its adjusted US tax basis and the amount realized upon a sale or other disposition of its ordinary shares if purchased in, or sold or disposed of for, a currency other than US dollar.
ASML ANNUAL REPORT 2021 253
Information reporting and backup withholding
Information returns may be filed with the IRS in connection with payments on the ordinary shares or proceeds from a sale, redemption or other disposition of the ordinary shares. A ‘backup withholding’ tax may be applied to, and withheld from, these payments if the beneficial owner fails to provide a correct taxpayer identification number to the paying agent and to comply with certain certification procedures or otherwise establish an exemption from backup withholding. Any amounts withheld under the backup withholding rules might be refunded (or credited against the beneficial owner’s US federal income tax liability, if any) depending on the facts and provided that the required information is furnished to the IRS.
The discussion set out above is included for general information only and may not be applicable depending upon a holder’s particular situation. Holders should consult their tax advisors with respect to the tax consequences to them of the purchase, ownership and disposition of shares including the tax consequences under state, local and other tax laws and the possible effects of changes in US federal and other tax laws.
ASML ANNUAL REPORT 2021 254
Appendix - Government regulation
Our business is subject to direct and indirect regulations in each of the countries in which our customers or we do business, and changes in various types of regulations can affect our business adversely. As our business has expanded, we have become subject to increasing and increasingly complex regulation. The implementation of new safety, environmental or legal requirements, including export controls and required permits and licenses or changes in interpretation, implementation or enforcement of such regulations and requirements, could impact our products, our manufacturing or distribution processes or location of sales, and could affect the timing of product introductions, the cost of our production, and products as well as their commercial success in each market in which we operate. The impact of these regulations could adversely affect our business, financial condition and our results of operations even where the specific regulations do not directly apply to us or to our products. Read more in: Our performance in 2021 - Governance - Risk factors - Legal and compliance.
ASML ANNUAL REPORT 2021 255
Appendix - Offer and listing details
Our ordinary shares are listed for trading in the form of registered ASML NASDAQ shares and in the form of registered ASML Euronext Amsterdam shares. The principal trading market of our ordinary shares is Euronext Amsterdam (trading symbol: ASML). Our ordinary shares also trade on NASDAQ (trading symbol: ASML).
Our shares listed on NASDAQ are registered with JPMorgan Chase Bank N.A., our New York Transfer Agent, pursuant to the terms of the Transfer Agent Agreement between ASML and JPMorgan Chase Bank N.A. Our shares listed on Euronext Amsterdam are held in dematerialized form through the facilities of Euroclear Nederland, the Dutch centralized securities custody and administration system. The New York Transfer Agent charges shareholders a fee of up to USD 5.00 per 100 shares for the exchange of our shares listed at NASDAQ for our shares listed at Euronext Amsterdam and vice versa.
Dividends payable on our shares listed at NASDAQ are declared in euro and converted to US dollars at the rate of exchange at the close of business on the date determined by the Board of Management. The resulting amounts are distributed through the New York Transfer Agent and no charge is payable by holders of our shares listed at NASDAQ in connection with this conversion or distribution.
Pursuant to the terms of the Transfer Agent Agreement, we have agreed to reimburse the New York Transfer Agent for certain out of pocket expenses, including in connection with any mailing of notices, reports or other communications made generally available by ASML to holders of ordinary shares. The New York Transfer Agent has waived its fees associated with routine services to ASML associated with our shares listed at NASDAQ. In addition, the New York Transfer Agent in consideration of its acting as Transfer Agent has agreed to make a contribution towards covering certain expenses incurred by ASML in connection with the issuance and transfer of our shares listed on NASDAQ. In the year ended December 31, 2021, the Transfer Agent contributed USD 0.5 million towards coverage of expenses incurred by ASML (which mainly comprised of audit, advisory, legal and listing fees incurred due to the existence of our share listing on NASDAQ).
ASML ANNUAL REPORT 2021 256
Appendix - Material contracts
Framework agreement between ASML and Carl Zeiss SMT GmbH
On 21 July 2021, ASML Netherlands B.V. and Carl Zeiss SMT GmbH signed a new overall framework agreement covering the entire spectrum of their relationship (the ASML-SMT Business Agreement).
For further details see note 26 Related parties and variable interest entities.
ASML ANNUAL REPORT 2021 257
Appendix - Exchange controls
Cash distributions, if any, payable in euros on our shares listed at Euronext Amsterdam may be officially transferred by a bank from the Netherlands and converted into any other currency without being subject to any Dutch legal restrictions. However, for statistical purposes, such payments and transactions must be reported by ASML to the Dutch Central Bank. Furthermore, no payments, including dividend payments, may be made to jurisdictions subject to certain sanctions, adopted by the government of the Netherlands, implementing resolutions of the Security Council of the United Nations. Cash distributions, if any, on our shares listed at NASDAQ shall be declared in euros but paid in US dollars, converted at the rate of exchange at the close of business on the date fixed for that purpose by the Board of Management in accordance with the Articles of Association.
ASML ANNUAL REPORT 2021 258
Appendix - Documents on display
We are subject to certain reporting requirements of the Exchange Act. As a "foreign private issuer", we are exempt from the rules under the Exchange Act prescribing certain disclosure and procedural requirements for proxy solicitations, and our officers, directors and principal shareholders are exempt from the reporting and "short-swing" profit recovery provisions contained in Section 16 of the Exchange Act, with respect to their purchases and sales of shares. In addition, we are not required to file reports and financial statements with the SEC as frequently or as promptly as companies whose securities are registered under the Exchange Act that are not foreign private issuers. However, we are required to file with the SEC, within 4 months after the end of each fiscal year, an Annual Report on Form 20-F containing financial statements audited by an independent accounting firm and interactive data comprising financial statements in extensible business reporting language. We publish unaudited interim financial information in accordance with U.S. GAAP after the end of each quarter. We furnish this quarterly financial information to the SEC under cover of a Form 6-K.
Documents we file with the SEC are publicly available on the SEC's website, which contains reports and other information regarding registrants that are required to file electronically with the SEC. The address of this website is http://www.sec.gov.
ASML ANNUAL REPORT 2021 259
Appendix - Controls and procedures
Disclosure controls and procedures
As of December 31, 2021, ASML’s senior management conducted an evaluation, under the supervision and with the participation of ASML’s CEO and CFO, of the effectiveness of the design and operation of ASML’s disclosure controls and procedures (as defined in Rule 13a-15(e) under the Exchange Act). Based on such evaluation, ASML’s CEO and CFO have concluded that, as of December 31, 2021, ASML’s disclosure controls and procedures are effective in recording, processing, summarizing and reporting, on a timely basis, information required to be disclosed by ASML in the reports that it files or submits under the Exchange Act and are effective in ensuring that information required to be disclosed by ASML is accumulated and communicated to ASML’s management, including ASML’s CEO and CFO, as appropriate to allow timely decisions regarding required disclosure.
Management’s report on internal control over financial reporting
ASML’s management is responsible for establishing and maintaining adequate internal control over financial reporting, as defined in Rule 13a-15(f) under the Exchange Act. Under the supervision and with the participation of ASML’s CEO and CFO, ASML’s management conducted an evaluation of the effectiveness of ASML’s internal control over financial reporting as of December 31, 2021 based upon the framework in "Internal Control – Integrated Framework" (2013) issued by the Committee of Sponsoring Organizations of the Treadway Commission. Based on that evaluation, management has concluded that ASML’s internal control over financial reporting was effective as of December 31, 2021 at providing reasonable assurance regarding the reliability of financial reporting and the preparation of the Financial Statements for external purposes in conformity with US GAAP.
KPMG Accountants N.V., an independent registered public accounting firm, have audited the Financial Statements as included in this Annual Report and, have also audited and issued a report, included herein, on the effectiveness of ASML’s internal control over financial reporting.
Changes in internal control over financial reporting
During the year ended December 31, 2021, there have been no changes in our internal control over financial reporting that have materially affected, or are reasonably likely to materially affect, our internal control over financial reporting.
Inherent limitations of disclosure controls and procedures in internal control over financial reporting
It should be noted that any system of controls, however well-designed and operated, can provide only reasonable, and not absolute, assurance that the objectives of the system will be met. In addition, the design of any control system is based in part upon certain assumptions about the likelihood of future events.
ASML ANNUAL REPORT 2021 260
Appendix - Financial calendar and investor relations
Financial Calendar
April 20, 2022
Announcement of First Quarter results for 2022
April 29, 2022
Annual General Meeting
July 20, 2022
Announcement of Second Quarter results for 2022
October 19, 2022
Announcement of Third Quarter results for 2022
Fiscal Year
ASML’s fiscal year ends on December 31, 2022
Investor Relations
ASML Investor Relations supplies information regarding the company and its business opportunities to investors and financial analysts. Our annual reports, quarterly releases and other information are also available on our website.
ASML ANNUAL REPORT 2021 261
Appendix - ASML contact information
Corporate Headquarters
De Run 6501
5504 DR Veldhoven
The Netherlands
Mailing Address
P.O. Box 324
5500 AH Veldhoven
The Netherlands
Investor Relations
phone: +31 40 268 3938
email: investor.relations@asml.com
For additional contact information please visit www.asml.com.
ASML ANNUAL REPORT 2021 262
Appendix - Reference table 20-F
| | | | | | | | | | | |
| Item | Form 20-F Caption | Location in this document | Page |
| Part I | | | |
| 1 | Identity of Directors, Senior Management and Advisors | Not applicable | |
| 2 | Offer Statistics and Expected Timetable | Not applicable | |
| 3 | Key Information | |
| B. Capitalization and Indebtedness | Not applicable | |
| C. Reasons for the Offer and Use of Proceeds | Not applicable | |
| D. Risk Factors | Our performance in 2021 - Governance - Risk factors | |
| 4 | Information on the Company | |
| A. History and Development of the Company | Cover Page | |
| | Who we are and what we do - Our company | |
| | Appendix - Property, plant and equipment | |
| | Appendix - Documents on display | |
| | Appendix - ASML contact information | |
| B. Business Overview | Who we are and what we do | |
| | Our position in the semiconductor value chain | |
| | Note 2 Revenue from contracts with customers | |
| | Note 3 Segment disclosure | |
| | Appendix - Government regulation | |
| C. Organizational Structure | Our performance in 2021 - Corporate governance - Financial Reporting and Audit - Corporate information | 109 |
| D. Property, Plant and Equipment | Note 13 Property, plant and equipment, net | |
| | Appendix - Property, plant and equipment | |
| 4A | Unresolved Staff Comments | Not applicable | |
| 5 | Operating and Financial Review and Prospects | |
| A. Operating Results | Our performance in 2021 - Financial - Financial performance | |
| B. Liquidity and Capital Resources | Our performance in 2021 - Financial - Financial performance | |
| | Financing policy | |
| | Consolidated Statements of Cash Flows | |
| | Note 4 Cash and cash equivalents and short-term investments | |
| | Note 16 Long-term debt and interest and other costs | |
| | Note 17 Commitments and contingencies | |
| | Note 25 Financial risk management | |
| C. Research and Development, Patents and Licenses, etc. | Message from the CTO | |
| | How we innovate | |
| | Financial performance - Research and development costs | |
| | Innovation ecosystem | |
| | Responsible business - Intellectual Property protection | |
| D. Trend Information | Financial performance - Long-term growth opportunities | |
| E. Critical Accounting Estimates | Notes to the Consolidated Financial Statements - Note 1 General information / summary of general accounting policies - Use of estimates | |
| 6 | Directors, Senior Management and Employees | |
| A. Directors and Senior Management | Corporate governance | |
| B. Compensation | Remuneration report | |
| C. Board Practices | Corporate governance
| |
| | Corporate governance - Supervisory Board - Supervisory Board Committees | 97 |
| D. Employees | Social - Our people | |
| E. Share Ownership | Corporate governance - Share capital - Major shareholders | 107 |
| | Remuneration report - Remuneration of the Board of Management in 2021 | 162 |
| | Note 20 Share-based compensation | |
| 7 | Major Shareholders and Related Party Transactions | |
| A. Major Shareholders | Corporate governance - Share capital - Major shareholders | 107 |
| B. Related Party Transactions | Note 26 Related parties and variable interest entities | |
| C. Interests of Experts & Counsel | Not applicable | |
ASML ANNUAL REPORT 2021 263
| | | | | | | | | | | |
| Item | Form 20-F Caption | Location in this document | Page |
| 8 | Financial Information | |
| A. Consolidated Statements and Other Financial Information | Consolidated Financial Statements | |
| B. Significant Changes | Financial performance - Long-term growth opportunities | |
| | Notes to the Consolidated Financial Statements | |
| 9 | The Offer and Listing | |
| A. Offer and Listing Details | Appendix - Offer and listing details | |
| B. Plan of Distribution | Not applicable | |
| C. Markets | Appendix - Offer and listing details | |
| D. Selling Shareholders | Not applicable | |
| E. Dilution | Not applicable | |
| F. Expenses of the Issue | Not applicable | |
| 10 | Additional Information | |
| A. Share Capital | Not applicable | |
| B. Memorandum and Articles of Association | Corporate governance - Share capital | |
| C. Material Contracts | Appendix - Material contracts | |
| D. Exchange Controls | Appendix - Exchange controls | |
| E. Taxation | Appendix - Dutch taxation / US taxation | |
| F. Dividends and Paying Agents | Not applicable | |
| G. Statement by Experts | Not applicable | |
| H. Documents on Display | Appendix - Documents on display | |
| I. Subsidiary Information | Not applicable | |
| 11 | Quantitative and Qualitative Disclosures About Market Risk | Note 16 Long-term debt and interest and other costs | |
| | Note 25 Financial risk management | |
| 12 | Description of Securities Other Than Equity Securities | Appendix - Offer and listing details | |
| Part II | | | |
| 13 | Defaults, Dividend Arrearages and Delinquencies | None | |
| 14 | Material Modifications to the Rights of Security Holders and Use of Proceeds | None | |
| 15 | Controls and Procedures | Appendix - Controls and procedures | |
| 16A | Audit Committee Financial Expert | Supervisory Board report - Audit committee | |
| 16B | Code of Ethics | Responsible business - Business ethics and Code of Conduct | |
| 16C | Principal Accountant Fees and Services | Appendix - Principal accountant fees and services | |
| 16D | Exemptions from the Listing Standards for Audit Committees | Not applicable | |
| 16E | Purchases of Equity Securities by the Issuer and Affiliated Purchasers | Note 22 Shareholders’ equity | |
| 16F | Change in Registrant’s Certifying Accountant | None | |
| 16G | Corporate Governance | Corporate governance - Financial reporting and audit - US listing requirements | 109 |
| 16H | Mine Safety Disclosure | Not applicable | |
| 16I | Disclosure Regarding Foreign Jurisdictions that Prevent Inspections | Not applicable | |
| Part III | | | |
| 17 | Financial Statements | Not applicable | |
| 18 | Financial Statements | Consolidated Financial Statements | |
| 19 | Exhibits | Exhibit index | |
This document contains information required for the Annual Report on Form 20-F for the year ended December 31, 2021 of ASML Holding N.V. Reference is made to the Form 20-F cross reference table contained herein under ‘Reference Table - 20-F’. Only the information in this document that is referenced in the Form 20-F cross reference table and this paragraph, this cross-reference table itself, the section entitled Special note regarding forward looking statements shall be deemed to be filed with the Securities and Exchange Commission for any purpose. Any additional information in this document which is not referenced in the Form 20-F cross reference table, or the Exhibits themselves, shall not be deemed to be incorporated by reference, shall not be part of the 2021 Annual Report on Form 20-F and is furnished to the Securities and Exchange Commission for information only.
ASML ANNUAL REPORT 2021 264

| | | | | | | | |
| Name | | Description |
| 0-9 | | |
| 3TG | | Tin, tantalum, tungsten and gold |
| A | | |
| ADAS | | Advanced driver-assistance systems |
| AFM | | The Dutch Authority for the Financial Markets (Autoriteit Financiële Markten) |
| AGM | | Annual general meeting |
| AI | | Artificial intelligence |
| AIoT | | Artificial intelligence of things |
| Annual Report | | Annual Report on Form 20-F |
| ARCNL | | Advanced Research Center for Nanolithography |
| ArF | | Argon fluoride |
| ArFi | | Argon fluoride immersion |
| ASC | | Accounting Standards Codification |
| ASML | | ASML Holding N.V. and / or any of its subsidiaries and / or any investments in associates |
| ASML Foundation | | An independent charity with strong ties to ASML that supports educational initiative for disadvantaged 4-18 year olds in regions where ASML operates. |
| ASML Preference Shares Foundation | | Stichting Preferente Aandelen ASML |
| | |
| B | | |
| BAPA | | Bilateral advance pricing agreements |
| BEAT | | Base erosion anti-abuse tax |
| | |
| BoM | | Board of Management |
| BREEAM | | Building Research Establishment Environmental Assessment Method |
| Brion | | Brion Technologies, Inc. |
| C | | |
| CAGR | | Compound annual growth rate |
| Canon | | Canon Kabushiki Kaisha |
| | |
| CAPEX | | Additions in property, plant and equipment plus additions in intangible assets plus additions in right-of-use assets (Operating and finance). |
| Capital resources | | The capitals resources as defined by the IIRC are referred to as: financial, manufacturing, intellectual, human, social and natural. |
| Carl Zeiss SMT | | Carl Zeiss SMT GmbH |
| CCIP | | Customer Co-investment Program |
| CCPA | | California Consumer Privacy Act (US) |
| CDP | | The Carbon Disclosure Project |
| CEO | | Chief Executive Officer |
| CFO | | Chief Financial Officer |
| CGU | | Cash-generating unit |
| CGU ASML | | ASML excluding CGU Cymer Light Sources |
| Cleanroom | | The central part of a wafer fab where wafers are processed, and the environment is minutely controlled to eliminate dust and other contaminants. |
| CMO | | Chief Marketing Officer |
CO2 | | Carbon dioxide |
| | |
| Code | | The Dutch Corporate Governance Code |
| Code of Conduct | | Code of ethics and conduct |
| Company | | ASML Holding N.V. |
| Computational lithography | | The use of powerful algorithms and computer modeling of the manufacturing process to optimize reticle patterns by intentionally deforming them to compensate for physical and chemical effects that occur during lithography and patterning. |
| COO | | Chief Operating Officer |
| COVID-19 | | Coronavirus disease 2019 |
| | |
| CRC | | ASML’s corporate risk committee |
| CRMC | | Capital Research & Management Company |
| CTO | | Chief Technology Officer |
| Cymer | | Cymer Inc., Cymer LLC and its subsidiaries |
| D | | |
| D&E | | Development and engineering |
| | |
| Deloitte | | Deloitte Accountants B.V. |
| D&I | | Diversity and inclusion |
| DJSI | | Dow Jones Sustainability Index |
ASML ANNUAL REPORT 2021 266
| | | | | | | | |
| Name | | Description |
| DRAM | | Dynamic Random Access Memory |
| DUV | | Deep ultraviolet |
| E | | |
| | |
| EHS | | Environment, health and safety |
| EHS Competence Center | | A group within ASML that defines EHS standards, gathers best practices and helps managers implement them |
| EMEA | | Europe, the Middle East and Africa |
| EPS | | Earnings per share |
| ERM | | Enterprise risk management |
| eScan | | ASML’s e-beam wafer inspection system family for targeted in-line defect detection |
| ESG score | | An integrated scoring system for environmental, social and governance (ESG) factors used in credit rating decisions |
| ETR | | Effective tax rate |
| EU | | European Union |
| EU-IFRS | | International Financial Reporting Standards as adopted by the European Union |
| EURIBOR | | Euro Interbank Offered Rate |
| Eurobond | | A bond denominated in Euros |
| Euroclear Nederland | | The Dutch Central Securities Depository (Nederlands Centraal Instituut voor Giraal Effectenverkeer B.V.) |
| Euronext Amsterdam | | Euronext Amsterdam N.V. |
| EUV lithography | | A lithography technology that uses extreme ultraviolet light with a wavelength of 13.5 nm. This is currently the cutting edge of lithography, enabling technology nodes of 16 nm and beyond. It is used for only the most critical layers with the smallest features. |
| Exchange Act | | US Securities Exchange Act of 1934 |
| ExCom | | Executive Committee |
| F | | |
| Fab | | Semiconductor fabrication plant |
| FAT | | Factory acceptance test |
| FDII | | Foreign-derived intangible income |
| Feature | | The elements that make up the pattern for a given layer of a microchip. |
| Flash | | A type of non-volatile memory used for storing and transferring information. |
| Foundry | | A contract manufacturer of logic chips |
| FTEs | | Full-time equivalents |
| FTSE4Good | | Series of ethical investment stock market indices launched in 2001 by the FTSE Group |
| G | | |
| GAAP | | Generally accepted accounting principles |
| GDPR | | General data protection regulation |
| GeSI | | Global e-Sustainability Initiative |
| GHG | | Greenhouse gas |
| GILTI | | Global intangible low-tax income |
| GPU | | Graphics processing unit |
| GRI | | Global Reporting Initiative |
| GRI standards | | GRI sustainability reporting standards |
| H | | |
| H2 | | Hydrogen |
| HDD | | Hard disk drive |
| High-NA | | High numerical aperture – specifically a next-generation EUV lithography platform (EUV 0.55 NA) |
| HMI | | The brand name for ASML's range of electron beam (e-beam) wafer inspection and metrology systems |
| Holistic lithography | | The ability to optimize the entire microchip manufacturing process and enable affordable scaling in chip technology by integrating lithography systems with computational modeling and wafer metrology solutions (analyzing and controlling the manufacturing process in real time) |
| HTSC | | High Tech Systems Center |
| I | | |
| IAS | | International Accounting Standards |
| IC | | Integrated circuit |
| IDM | | Integrated device manufacturer |
| IIRC | | International Integrated Reporting Council |
| i-line | | Light with a wavelength of 365 nm, generated by mercury vapor lamps and used in some lithography systems |
| ILO | | International Labor Organization |
| Imaging | | The ability to transfer a pattern to the photoresist on to a wafer using light |
| imec | | Interuniversitair Micro-Elektronica Centrum |
ASML ANNUAL REPORT 2021 267
| | | | | | | | |
| Name | | Description |
| Immersion lithography | | A lithography technique that uses a pool of ultra-pure water between the lens and the wafer to increase the lenses numerical aperture (ability to collect and focus light). This improves both the resolution and depth of focus for the lithography system. |
| Installed Base Management | | Net service and field option sales |
| Intel | | Intel Corporation |
| Internet of Things (IoT) | | A network of physical objects embedded with sensors, actuators, electronics and software that allow the objects to collect and exchange data |
| IPR | | Intellectual property rights |
| ISO | | International Organization for Standardization |
| K | | |
| KLA-Tencor | | KLA-Tencor Corporation |
| KPI | | Key performance indicator |
| KPMG | | KPMG Accountants N.V. |
| KrF | | Krypton fluoride |
| kWh | | Kilowatt-hour |
| L | | |
| LGBTQI+ | | Lesbian, gay, bisexual, transgender, queer and intersex |
| LIBOR | | London Interbank Offered Rate |
| Lithography | | Lithography, or photolithography, is the process in microchip manufacturing that uses light to pattern parts on a silicon wafer |
| Logic | | Integrated devices such as microprocessors, microcontrollers and GPUs. Also refers to companies that manufacture such devices |
| LTI | | Long-term incentive |
| M | | |
| MBA | | Master of Business Administration |
| Memory | | Microchips, such as NAND Flash and DRAM, that store information. Also refers to companies that manufacture such chips. |
| mm | | Millimeter (one thousandth of a meter) |
| MPS | | Mature Products and Services |
| MSCI | | Morgan Stanley Capital International |
| N | | |
| NA | | Numerical aperture |
| NAND | | A binary logical operator that gives an output when it receives one or no input; a composite of ‘NOT AND’ |
| NASDAQ | | NASDAQ Stock Market LLC |
| NGO | | Non-governmental organization |
| Nikon | | Nikon Corporation |
| NL | | The Netherlands |
| nm | | Nanometer (one billionth of a meter) |
| Node | | A steppingstone in the chipmaking industry's roadmap for smaller features and more advanced microchips, describes and differentiates generations of semiconductor manufacturing technologies and the chips made with them. Nodes with “smaller sizes” refer to more advanced technologies. |
| Non-GAAP | | A company’s historical or future financial performance, financial position, or cash flows that are not calculated or presented in accordance with the most comparable GAAP measure. |
| NRE | | Non-recurring engineering |
| NXE | | The original TWINSCAN system platform for EUV lithography |
| NXT | | An enhanced version of the original TWINSCAN system platform offering significantly improved overlay and productivity |
| O | | |
| OCI | | Other comprehensive income |
| ODM | | Original design manufacturer |
| OECD | | Organization for Economic Co-operation and Development |
| OEM | | Original equipment manufacturer |
| ONE | | ASML’s Our New Enterprise program, which aims to improve our business processes and IT enterprise management system |
| Overlay | | The layer-to-layer alignment of chip structures |
| P | | |
| Pattern fidelity | | A holistic measure of how well the desired pattern is reproduced on the wafer |
| Pattern fidelity control | | A holistic approach to controlling the whole process of manufacturing advanced microchips in high volumes that aims to improve overall yields. It draws data from production equipment and computational lithography tools, analyzing it with techniques such as machine learning to provide real-time feedback. |
| Patterning | | The process of creating a pattern in a surface (to build microchips) |
| PGP | | Product generation process |
ASML ANNUAL REPORT 2021 268
| | | | | | | | |
| Name | | Description |
| PME | | Bedrijfstakpensioenfonds Metalektro |
| Preference shares foundation | | Stichting Preferente Aandelen ASML |
| Preference share option | | An option to acquire cumulative preference shares in our capital |
| Q | | |
| QLTCS | | Quality, logistics, technology, cost and sustainability |
| R | | |
| R&D | | Research and development |
| RBA | | Responsible Business Alliance |
| RC | | ASML’s Remuneration Committee |
| REACH | | Registration, evaluation, authorization and restriction of chemicals |
| Recoverable amount | | The greater out of an asset’s fair value less costs to sell and its value in use |
| Remuneration policy | | The remuneration policy applicable to the Board of Management of ASML Holding N.V. |
| Reticle | | A plate containing the pattern of features to be transferred to the wafer for each exposure |
| ROAIC | | Return on average invested capital |
| RoHS | | Restriction of hazardous substances |
| S | | |
| Samsung | | Samsung Electronics Corporation |
| SAQ | | Self-assessment questionnaire |
| Sarbanes-Oxley Act | | The Sarbanes-Oxley Act of 2002 |
| SAT | | Site acceptance test |
| SB | | ASML’s Supervisory Board |
Scope 1 CO2 emissions | | Direct carbon dioxide emissions from resources an organization owns or controls |
Scope 2 CO2 emissions | | Indirect carbon dioxide emissions due to the energy and organization consumes |
Scope 3 CO2 emissions | | All other indirect carbon dioxide emissions that occur in an organization’s value chain |
| SDG | | United Nations Sustainable Development Goals |
| SEC | | The United States Securities and Exchange Commission |
| SEMI | | Semiconductor Equipment and Materials International |
| SEMI S2 | | SEMI S2 – Safety Guideline, Environmental, Health, and Safety Guideline for Semiconductor Manufacturing Equipment, a set of performance-based EHS considerations for semiconductor manufacturing equipment |
| SEMI S23 | | SEMI S23 – Guide for Conservation of Energy, Utilities, and Materials Used by Semiconductor Manufacturing Equipment, guidelines for collecting, analyzing, and reporting energy-consuming semiconductor manufacturing equipment utility data |
| SG&A | | Selling, general and administrative |
| Shrink | | The process of developing smaller transistors for more advanced chips |
| SoC | | System on a chip |
| SPE Shareholders | | A syndicate of three banks for the purpose of leasing ASML’s headquarters in Veldhoven |
| S&SC | | Sourcing and supply chain |
| SSD | | Solid-state drive |
| | |
| SSRA | | Safety risk assessment |
| STEM | | Science, technology, engineering and mathematics |
| STI | | Short-term incentive |
| SWOT | | Strengths, weaknesses, opportunities and threats |
| T | | |
| TC | | ASML’s Technology Committee |
| TCFD | | Task Force on Climate-related Financial Disclosures |
| TCJA | | Tax Cuts and Jobs Act |
| TDC | | Total direct compensation |
| Technical competence | | The capabilities and spread of technical expertise among our people, and the extent to which they are embedded in our processes and operations |
| Throughput | | The number of wafers a system can process per hour |
| TJ | | Terajoule (one trillion joules) |
| Transistor | | A semiconductor device that is the fundamental building block of microchips |
| TSMC | | Taiwan Semiconductor Manufacturing Company Ltd. |
| TSR | | Total shareholder return |
| TWINSCAN | | ASML’s unique lithography system platform, with two complete wafer stages to allow one wafer to be mapped while another is being exposed - enabling higher accuracy and throughput. |
| U | | |
| UNGP | | United Nations guiding principles |
| US | | United States |
ASML ANNUAL REPORT 2021 269
| | | | | | | | |
| Name | | Description |
| US GAAP | | Generally accepted accounting principles in the United States of America |
| US ITC | | United States International Trade Commission |
| V | | |
| VAT | | Value-added tax |
| VIE | | Variable interest entity |
| VLSI | | VLSI Research Inc. |
| VNO-NCW | | The Confederation of Netherlands Industry and Employers |
| VP | | Vice president |
| W | | |
| WACC | | Weighted average cost of capital |
| Wafer inspection | | The process of locating and analyzing individual chip defects on a wafer |
| Wafer metrology | | The process of measuring the quality of patterns on a wafer |
| Wavelength | | The distance between two peaks of a wave such as light. The shorter the wavelength of light used in a lithography system, the smaller the features the system can resolve. |
| Website | | www.asml.com |
| Works Council | | Works Council of ASML Netherlands B.V. |
| Y | | |
| YieldStar | | ASML's diffraction-based wafer metrology platform |
| Z | | |
| Zeiss | | Carl Zeiss AG |
| | |
| | |
| | |
| | |
| | |
| | |
| | |
| | |
| | |
| | |
| | |
| | |
| | |
| | |
| | |
| | |
| | |
| | |
| | |
| | |
| | |
| | |
| | |
| | |
| | |
| | |
| | |
| | |
| | |
| | |
| | |
| | |
| | |
| | |
| | |
| | |
| | |
| | |
| | |
| | |
| | |
| | |
| | |
| | |
ASML ANNUAL REPORT 2021 270
ASML Holding N.V. hereby certifies that it meets all of the requirements for filing on Form 20-F and that it has duly caused and authorized the undersigned to sign this Annual Report on Form 20-F on its behalf.
ASML Holding N.V. (Registrant)
/s/ Peter T.F.M. Wennink
Name: Peter T.F.M. Wennink
Title: President, CEO and member of the Board of Management
Dated: February 9, 2022
/s/ Roger J.M. Dassen
Name: Roger J.M. Dassen
Title: Executive Vice President, CFO and member of the Board of Management
Dated: February 9, 2022
ASML ANNUAL REPORT 2021 271
Exhibit index
| | | | | |
| Exhibit No. | Description |
| 1 | |
| 2.1 | |
| 4.1 | |
| 4.2 | |
| 4.3 | |
| 4.4 | |
| 4.5 | |
| 4.6 | |
| 4.7 | |
| 4.8 | |
| 4.9 | |
| 4.10 | Settlement and Cross License Agreement, dated February 18, 2019, among Nikon Corporation, ASML Holding N.V. and Carl Zeiss SMT GmbH and, with regards to Sections 3(b) 2.2.1, 3.8, 6.3.3, 6.6, 10.6, 10.8, 10.14 and 10.15, Carl Zeiss AG (Incorporated by reference to the Registrant’s Annual Report on Form 20-F for the fiscal year ended December 31, 2019) 3 |
| 4.11 | |
| 8.1 | |
| 12.1 | |
| 13.1 | |
| 15.1 | |
| 101.INS | XBRL Instance Document 2 |
| 101.SCH | XBRL Taxonomy Extension Schema Document 2 |
| 101.CAL | XBRL Taxonomy Extension Calculation Linkbase Document 2 |
| 101.DEF | XBRL Taxonomy Extension Definition Linkbase Document 2 |
| 101.LAB | XBRL Taxonomy Extension Label Linkbase Document 2 |
| 101.PRE | XBRL Taxonomy Extension Presentation Linkbase Document 2 |
| 104 | Cover Page Interactive Data File (formatted as inline XBRL and contained in Exhibit 101) 2 |
1.Certain information omitted pursuant to a request for confidential treatment filed separately with the SEC.
2.Filed at the SEC herewith.
3.Portions of this exhibit have been omitted because they are both (i) not material and (ii) would be competitively harmful if publicly disclosed
ASML is party to 6 debt instruments (senior notes) under which the total amount of securities under each individual debt instrument does not exceed 10% of the total assets of ASML and its subsidiaries on a consolidated basis. Pursuant to paragraph 2(b) (i) of the instructions to the exhibits to Form 20-F, ASML agrees to furnish a copy of such instruments to the SEC upon request. Classes of senior notes registered are:
•0.625% ASML Holding NV Fixed Rate Senior Notes due 2022 (XS1405774990) at Luxembourg Stock Exchange;
•3.375% ASML Holding NV Fixed Rate Senior Notes due 2023 (XS0972530561) at Luxembourg Stock Exchange;
•1.375% ASML Holding NV Fixed Rate Senior Notes due 2026 (XS1405780963) at Luxembourg Stock Exchange;
•1.625% ASML Holding NV Fixed Rate Senior Notes due 2027 (XS1527556192) at Luxembourg Stock Exchange;
•0.625% ASML Holding NV Fixed Rate Senior Notes due 2029 (XS2166219720) at Luxembourg Stock Exchange;
•0.25% ASML Holding NV Fixed Rate Senior Notes due 2030 (XS2010032378) at Luxembourg Stock Exchange.
ASML ANNUAL REPORT 2021 273