us-gaap:DepositAccountMemberus-gaap:DepositAccountMemberus-gaap:DepositAccountMemberus-gaap:AccountingStandardsUpdate201802Memberus-gaap:AccountingStandardsUpdate201613MemberP6MP2YP6Mus-gaap:OtherAssetsus-gaap:AccountsPayableAndOtherAccruedLiabilitiesP3YP6YP3YP1YFALSE2020FY0000936528--09-30iso4217:USD0000936528us-gaap:RetainedEarningsMembersrt:CumulativeEffectPeriodOfAdoptionAdjustmentMember2019-09-3000009365282020-09-3000009365282019-09-30iso4217:USDxbrli:sharesxbrli:shares00009365282019-10-012020-09-3000009365282018-10-012019-09-3000009365282017-10-012018-09-300000936528us-gaap:CommonStockMember2017-09-300000936528us-gaap:AdditionalPaidInCapitalMember2017-09-300000936528us-gaap:RetainedEarningsMember2017-09-300000936528us-gaap:AccumulatedOtherComprehensiveIncomeMember2017-09-300000936528us-gaap:TreasuryStockMember2017-09-3000009365282017-09-300000936528us-gaap:RetainedEarningsMembersrt:CumulativeEffectPeriodOfAdoptionAdjustmentMember2017-09-300000936528us-gaap:AccumulatedOtherComprehensiveIncomeMembersrt:CumulativeEffectPeriodOfAdoptionAdjustmentMember2017-09-300000936528srt:CumulativeEffectPeriodOfAdoptionAdjustmentMember2017-09-300000936528us-gaap:RetainedEarningsMember2017-10-012018-09-300000936528us-gaap:AccumulatedOtherComprehensiveIncomeMember2017-10-012018-09-300000936528us-gaap:CommonStockMember2017-10-012018-09-300000936528us-gaap:AdditionalPaidInCapitalMember2017-10-012018-09-300000936528us-gaap:TreasuryStockMember2017-10-012018-09-300000936528us-gaap:CommonStockMember2018-09-300000936528us-gaap:AdditionalPaidInCapitalMember2018-09-300000936528us-gaap:RetainedEarningsMember2018-09-300000936528us-gaap:AccumulatedOtherComprehensiveIncomeMember2018-09-300000936528us-gaap:TreasuryStockMember2018-09-3000009365282018-09-300000936528us-gaap:RetainedEarningsMember2018-10-012019-09-300000936528us-gaap:AccumulatedOtherComprehensiveIncomeMember2018-10-012019-09-300000936528us-gaap:CommonStockMember2018-10-012019-09-300000936528us-gaap:AdditionalPaidInCapitalMember2018-10-012019-09-300000936528us-gaap:TreasuryStockMember2018-10-012019-09-300000936528us-gaap:CommonStockMember2019-09-300000936528us-gaap:AdditionalPaidInCapitalMember2019-09-300000936528us-gaap:RetainedEarningsMember2019-09-300000936528us-gaap:AccumulatedOtherComprehensiveIncomeMember2019-09-300000936528us-gaap:TreasuryStockMember2019-09-300000936528srt:CumulativeEffectPeriodOfAdoptionAdjustmentMember2019-09-300000936528us-gaap:RetainedEarningsMember2019-10-012020-09-300000936528us-gaap:AccumulatedOtherComprehensiveIncomeMember2019-10-012020-09-300000936528us-gaap:CommonStockMember2019-10-012020-09-300000936528us-gaap:AdditionalPaidInCapitalMember2019-10-012020-09-300000936528us-gaap:TreasuryStockMember2019-10-012020-09-300000936528us-gaap:CommonStockMember2020-09-300000936528us-gaap:AdditionalPaidInCapitalMember2020-09-300000936528us-gaap:RetainedEarningsMember2020-09-300000936528us-gaap:AccumulatedOtherComprehensiveIncomeMember2020-09-300000936528us-gaap:TreasuryStockMember2020-09-30wfsl:branchxbrli:pure0000936528srt:MinimumMember2019-10-012020-09-300000936528srt:MaximumMember2019-10-012020-09-30wfsl:payment0000936528srt:MinimumMemberwfsl:StockOptionsandRestrictedStockMember2019-10-012020-09-300000936528srt:MaximumMemberwfsl:StockOptionsandRestrictedStockMember2019-10-012020-09-30wfsl:segment00009365282013-10-090000936528us-gaap:SubsequentEventMember2020-10-270000936528us-gaap:MortgageBackedSecuritiesMemberus-gaap:AccountingStandardsUpdate201904Member2020-01-0100009365282020-01-010000936528us-gaap:AccountingStandardsUpdate201904Member2020-01-010000936528us-gaap:RetainedEarningsMembersrt:CumulativeEffectPeriodOfAdoptionAdjustmentMember2019-10-010000936528us-gaap:CommercialPortfolioSegmentMembersrt:MultifamilyMember2019-09-300000936528us-gaap:CommercialPortfolioSegmentMembersrt:MultifamilyMembersrt:CumulativeEffectPeriodOfAdoptionAdjustmentMember2019-09-300000936528srt:CumulativeEffectPeriodOfAdoptionAdjustedBalanceMemberus-gaap:CommercialPortfolioSegmentMembersrt:MultifamilyMember2019-10-010000936528us-gaap:CommercialRealEstateMemberus-gaap:CommercialPortfolioSegmentMember2019-09-300000936528us-gaap:CommercialRealEstateMemberus-gaap:CommercialPortfolioSegmentMembersrt:CumulativeEffectPeriodOfAdoptionAdjustmentMember2019-09-300000936528us-gaap:CommercialRealEstateMembersrt:CumulativeEffectPeriodOfAdoptionAdjustedBalanceMemberus-gaap:CommercialPortfolioSegmentMember2019-10-010000936528wfsl:CommercialandIndustrialMemberus-gaap:CommercialPortfolioSegmentMember2019-09-300000936528wfsl:CommercialandIndustrialMemberus-gaap:CommercialPortfolioSegmentMembersrt:CumulativeEffectPeriodOfAdoptionAdjustmentMember2019-09-300000936528wfsl:CommercialandIndustrialMembersrt:CumulativeEffectPeriodOfAdoptionAdjustedBalanceMemberus-gaap:CommercialPortfolioSegmentMember2019-10-010000936528us-gaap:ConstructionLoansMemberus-gaap:CommercialPortfolioSegmentMember2019-09-300000936528us-gaap:ConstructionLoansMemberus-gaap:CommercialPortfolioSegmentMembersrt:CumulativeEffectPeriodOfAdoptionAdjustmentMember2019-09-300000936528us-gaap:ConstructionLoansMembersrt:CumulativeEffectPeriodOfAdoptionAdjustedBalanceMemberus-gaap:CommercialPortfolioSegmentMember2019-10-010000936528wfsl:LandAcquisitionAndDevelopmentMemberus-gaap:CommercialPortfolioSegmentMember2019-09-300000936528wfsl:LandAcquisitionAndDevelopmentMemberus-gaap:CommercialPortfolioSegmentMembersrt:CumulativeEffectPeriodOfAdoptionAdjustmentMember2019-09-300000936528wfsl:LandAcquisitionAndDevelopmentMembersrt:CumulativeEffectPeriodOfAdoptionAdjustedBalanceMemberus-gaap:CommercialPortfolioSegmentMember2019-10-010000936528us-gaap:CommercialPortfolioSegmentMember2019-09-300000936528us-gaap:CommercialPortfolioSegmentMembersrt:CumulativeEffectPeriodOfAdoptionAdjustmentMember2019-09-300000936528srt:CumulativeEffectPeriodOfAdoptionAdjustedBalanceMemberus-gaap:CommercialPortfolioSegmentMember2019-10-010000936528srt:SingleFamilyMemberus-gaap:ConsumerPortfolioSegmentMember2019-09-300000936528srt:SingleFamilyMemberus-gaap:ConsumerPortfolioSegmentMembersrt:CumulativeEffectPeriodOfAdoptionAdjustmentMember2019-09-300000936528srt:SingleFamilyMembersrt:CumulativeEffectPeriodOfAdoptionAdjustedBalanceMemberus-gaap:ConsumerPortfolioSegmentMember2019-10-010000936528us-gaap:ConstructionLoansMemberus-gaap:ConsumerPortfolioSegmentMember2019-09-300000936528us-gaap:ConstructionLoansMemberus-gaap:ConsumerPortfolioSegmentMembersrt:CumulativeEffectPeriodOfAdoptionAdjustmentMember2019-09-300000936528us-gaap:ConstructionLoansMembersrt:CumulativeEffectPeriodOfAdoptionAdjustedBalanceMemberus-gaap:ConsumerPortfolioSegmentMember2019-10-010000936528wfsl:LandConsumerLotLoansMemberus-gaap:ConsumerPortfolioSegmentMember2019-09-300000936528wfsl:LandConsumerLotLoansMemberus-gaap:ConsumerPortfolioSegmentMembersrt:CumulativeEffectPeriodOfAdoptionAdjustmentMember2019-09-300000936528wfsl:LandConsumerLotLoansMembersrt:CumulativeEffectPeriodOfAdoptionAdjustedBalanceMemberus-gaap:ConsumerPortfolioSegmentMember2019-10-010000936528us-gaap:HomeEquityMemberus-gaap:ConsumerPortfolioSegmentMember2019-09-300000936528us-gaap:HomeEquityMemberus-gaap:ConsumerPortfolioSegmentMembersrt:CumulativeEffectPeriodOfAdoptionAdjustmentMember2019-09-300000936528us-gaap:HomeEquityMembersrt:CumulativeEffectPeriodOfAdoptionAdjustedBalanceMemberus-gaap:ConsumerPortfolioSegmentMember2019-10-010000936528us-gaap:ConsumerLoanMemberus-gaap:ConsumerPortfolioSegmentMember2019-09-300000936528us-gaap:ConsumerLoanMemberus-gaap:ConsumerPortfolioSegmentMembersrt:CumulativeEffectPeriodOfAdoptionAdjustmentMember2019-09-300000936528srt:CumulativeEffectPeriodOfAdoptionAdjustedBalanceMemberus-gaap:ConsumerLoanMemberus-gaap:ConsumerPortfolioSegmentMember2019-10-010000936528us-gaap:ConsumerPortfolioSegmentMember2019-09-300000936528us-gaap:ConsumerPortfolioSegmentMembersrt:CumulativeEffectPeriodOfAdoptionAdjustmentMember2019-09-300000936528srt:CumulativeEffectPeriodOfAdoptionAdjustedBalanceMemberus-gaap:ConsumerPortfolioSegmentMember2019-10-010000936528srt:CumulativeEffectPeriodOfAdoptionAdjustedBalanceMember2019-10-010000936528wfsl:RetainedEarningsPreTaxMembersrt:CumulativeEffectPeriodOfAdoptionAdjustmentMember2019-09-300000936528wfsl:RetainedEarningsTaxMembersrt:CumulativeEffectPeriodOfAdoptionAdjustmentMember2019-09-300000936528us-gaap:AccountingStandardsUpdate201602Member2019-10-010000936528us-gaap:RetainedEarningsMemberus-gaap:AccountingStandardsUpdate201602Membersrt:CumulativeEffectPeriodOfAdoptionAdjustmentMember2019-10-010000936528us-gaap:USTreasuryAndGovernmentMember2020-09-300000936528us-gaap:AssetBackedSecuritiesMember2020-09-300000936528us-gaap:CorporateDebtSecuritiesMember2020-09-300000936528us-gaap:MunicipalBondsMember2020-09-300000936528us-gaap:MortgageBackedSecuritiesIssuedByUSGovernmentSponsoredEnterprisesMember2020-09-300000936528us-gaap:CommercialMortgageBackedSecuritiesMember2020-09-300000936528us-gaap:USTreasuryAndGovernmentMember2019-09-300000936528us-gaap:AssetBackedSecuritiesMember2019-09-300000936528us-gaap:CorporateDebtSecuritiesMember2019-09-300000936528us-gaap:MunicipalBondsMember2019-09-300000936528us-gaap:MortgageBackedSecuritiesIssuedByUSGovernmentSponsoredEnterprisesMember2019-09-300000936528us-gaap:CommercialMortgageBackedSecuritiesMember2019-09-30wfsl:security0000936528us-gaap:CorporateBondSecuritiesMember2020-09-300000936528us-gaap:USGovernmentAgenciesDebtSecuritiesMember2020-09-300000936528us-gaap:MortgageBackedSecuritiesMember2020-09-300000936528us-gaap:CorporateBondSecuritiesMember2019-09-300000936528us-gaap:USGovernmentAgenciesDebtSecuritiesMember2019-09-300000936528us-gaap:MortgageBackedSecuritiesMember2019-09-300000936528us-gaap:CommercialPortfolioSegmentMembersrt:MultifamilyMember2020-09-300000936528us-gaap:CommercialRealEstateMemberus-gaap:CommercialPortfolioSegmentMember2020-09-300000936528wfsl:CommercialandIndustrialMemberus-gaap:CommercialPortfolioSegmentMember2020-09-300000936528us-gaap:ConstructionLoansMemberus-gaap:CommercialPortfolioSegmentMember2020-09-300000936528wfsl:LandAcquisitionAndDevelopmentMemberus-gaap:CommercialPortfolioSegmentMember2020-09-300000936528us-gaap:CommercialPortfolioSegmentMember2020-09-300000936528srt:SingleFamilyMemberus-gaap:ConsumerPortfolioSegmentMember2020-09-300000936528us-gaap:ConstructionLoansMemberus-gaap:ConsumerPortfolioSegmentMember2020-09-300000936528wfsl:LandConsumerLotLoansMemberus-gaap:ConsumerPortfolioSegmentMember2020-09-300000936528us-gaap:HomeEquityMemberus-gaap:ConsumerPortfolioSegmentMember2020-09-300000936528us-gaap:ConsumerLoanMemberus-gaap:ConsumerPortfolioSegmentMember2020-09-300000936528us-gaap:ConsumerPortfolioSegmentMember2020-09-300000936528wfsl:SmallBusinessAdministrationSBACARESActPayrollProtectionProgramMemberwfsl:CommercialandIndustrialMemberus-gaap:CommercialPortfolioSegmentMember2020-09-300000936528wfsl:WithinOneYearMember2020-09-300000936528wfsl:MoreThanOneWithinThreeYearsMember2020-09-300000936528wfsl:MoreThanThreeWithinFiveYearsMember2020-09-300000936528wfsl:MoreThanFiveWithinTenYearsMember2020-09-300000936528wfsl:MoreThanTenWithinTwentyYearsMember2020-09-300000936528wfsl:MoreThanTwentyYearsMember2020-09-300000936528wfsl:FinancingReceivableFromRelatedPartyIncludingUnfundedLoanCommitmentMember2019-10-012020-09-300000936528wfsl:FinancingReceivableFromRelatedPartyIncludingUnfundedLoanCommitmentMember2018-10-012019-09-300000936528us-gaap:FinancialAssetOriginatedMemberus-gaap:CommercialPortfolioSegmentMembersrt:MultifamilyMember2020-09-300000936528us-gaap:FinancialAssetOriginatedMemberus-gaap:CommercialPortfolioSegmentMembersrt:MultifamilyMember2019-09-300000936528us-gaap:CommercialRealEstateMemberus-gaap:FinancialAssetOriginatedMemberus-gaap:CommercialPortfolioSegmentMember2020-09-300000936528us-gaap:CommercialRealEstateMemberus-gaap:FinancialAssetOriginatedMemberus-gaap:CommercialPortfolioSegmentMember2019-09-300000936528us-gaap:FinancialAssetOriginatedMemberwfsl:CommercialandIndustrialMemberus-gaap:CommercialPortfolioSegmentMember2020-09-300000936528us-gaap:FinancialAssetOriginatedMemberwfsl:CommercialandIndustrialMemberus-gaap:CommercialPortfolioSegmentMember2019-09-300000936528us-gaap:ConstructionLoansMemberus-gaap:FinancialAssetOriginatedMemberus-gaap:CommercialPortfolioSegmentMember2020-09-300000936528us-gaap:ConstructionLoansMemberus-gaap:FinancialAssetOriginatedMemberus-gaap:CommercialPortfolioSegmentMember2019-09-300000936528wfsl:LandAcquisitionAndDevelopmentMemberus-gaap:FinancialAssetOriginatedMemberus-gaap:CommercialPortfolioSegmentMember2020-09-300000936528wfsl:LandAcquisitionAndDevelopmentMemberus-gaap:FinancialAssetOriginatedMemberus-gaap:CommercialPortfolioSegmentMember2019-09-300000936528us-gaap:FinancialAssetOriginatedMemberus-gaap:CommercialPortfolioSegmentMember2020-09-300000936528us-gaap:FinancialAssetOriginatedMemberus-gaap:CommercialPortfolioSegmentMember2019-09-300000936528srt:SingleFamilyMemberus-gaap:FinancialAssetOriginatedMemberus-gaap:ConsumerPortfolioSegmentMember2020-09-300000936528srt:SingleFamilyMemberus-gaap:FinancialAssetOriginatedMemberus-gaap:ConsumerPortfolioSegmentMember2019-09-300000936528us-gaap:ConstructionLoansMemberus-gaap:FinancialAssetOriginatedMemberus-gaap:ConsumerPortfolioSegmentMember2020-09-300000936528us-gaap:ConstructionLoansMemberus-gaap:FinancialAssetOriginatedMemberus-gaap:ConsumerPortfolioSegmentMember2019-09-300000936528wfsl:LandConsumerLotLoansMemberus-gaap:FinancialAssetOriginatedMemberus-gaap:ConsumerPortfolioSegmentMember2020-09-300000936528wfsl:LandConsumerLotLoansMemberus-gaap:FinancialAssetOriginatedMemberus-gaap:ConsumerPortfolioSegmentMember2019-09-300000936528us-gaap:HomeEquityMemberus-gaap:FinancialAssetOriginatedMemberus-gaap:ConsumerPortfolioSegmentMember2020-09-300000936528us-gaap:HomeEquityMemberus-gaap:FinancialAssetOriginatedMemberus-gaap:ConsumerPortfolioSegmentMember2019-09-300000936528us-gaap:FinancialAssetOriginatedMemberus-gaap:ConsumerLoanMemberus-gaap:ConsumerPortfolioSegmentMember2020-09-300000936528us-gaap:FinancialAssetOriginatedMemberus-gaap:ConsumerLoanMemberus-gaap:ConsumerPortfolioSegmentMember2019-09-300000936528us-gaap:FinancialAssetOriginatedMemberus-gaap:ConsumerPortfolioSegmentMember2020-09-300000936528us-gaap:FinancialAssetOriginatedMemberus-gaap:ConsumerPortfolioSegmentMember2019-09-300000936528us-gaap:FinancialAssetOriginatedMember2020-09-300000936528us-gaap:FinancialAssetOriginatedMember2019-09-300000936528us-gaap:FinancingReceivables1To29DaysPastDueMemberus-gaap:CommercialPortfolioSegmentMembersrt:MultifamilyMember2020-09-300000936528us-gaap:FinancingReceivables30To59DaysPastDueMemberus-gaap:CommercialPortfolioSegmentMembersrt:MultifamilyMember2020-09-300000936528us-gaap:CommercialPortfolioSegmentMembersrt:MultifamilyMemberus-gaap:FinancingReceivables60To89DaysPastDueMember2020-09-300000936528us-gaap:FinancingReceivables1To29DaysPastDueMemberus-gaap:CommercialRealEstateMemberus-gaap:CommercialPortfolioSegmentMember2020-09-300000936528us-gaap:FinancingReceivables30To59DaysPastDueMemberus-gaap:CommercialRealEstateMemberus-gaap:CommercialPortfolioSegmentMember2020-09-300000936528us-gaap:CommercialRealEstateMemberus-gaap:CommercialPortfolioSegmentMemberus-gaap:FinancingReceivables60To89DaysPastDueMember2020-09-300000936528us-gaap:FinancingReceivables1To29DaysPastDueMemberwfsl:CommercialandIndustrialMemberus-gaap:CommercialPortfolioSegmentMember2020-09-300000936528us-gaap:FinancingReceivables30To59DaysPastDueMemberwfsl:CommercialandIndustrialMemberus-gaap:CommercialPortfolioSegmentMember2020-09-300000936528wfsl:CommercialandIndustrialMemberus-gaap:CommercialPortfolioSegmentMemberus-gaap:FinancingReceivables60To89DaysPastDueMember2020-09-300000936528us-gaap:FinancingReceivables1To29DaysPastDueMemberus-gaap:ConstructionLoansMemberus-gaap:CommercialPortfolioSegmentMember2020-09-300000936528us-gaap:FinancingReceivables30To59DaysPastDueMemberus-gaap:ConstructionLoansMemberus-gaap:CommercialPortfolioSegmentMember2020-09-300000936528us-gaap:ConstructionLoansMemberus-gaap:CommercialPortfolioSegmentMemberus-gaap:FinancingReceivables60To89DaysPastDueMember2020-09-300000936528us-gaap:FinancingReceivables1To29DaysPastDueMemberwfsl:LandAcquisitionAndDevelopmentMemberus-gaap:CommercialPortfolioSegmentMember2020-09-300000936528us-gaap:FinancingReceivables30To59DaysPastDueMemberwfsl:LandAcquisitionAndDevelopmentMemberus-gaap:CommercialPortfolioSegmentMember2020-09-300000936528wfsl:LandAcquisitionAndDevelopmentMemberus-gaap:CommercialPortfolioSegmentMemberus-gaap:FinancingReceivables60To89DaysPastDueMember2020-09-300000936528us-gaap:FinancingReceivables1To29DaysPastDueMemberus-gaap:CommercialPortfolioSegmentMember2020-09-300000936528us-gaap:FinancingReceivables30To59DaysPastDueMemberus-gaap:CommercialPortfolioSegmentMember2020-09-300000936528us-gaap:CommercialPortfolioSegmentMemberus-gaap:FinancingReceivables60To89DaysPastDueMember2020-09-300000936528us-gaap:FinancingReceivables1To29DaysPastDueMembersrt:SingleFamilyMemberus-gaap:ConsumerPortfolioSegmentMember2020-09-300000936528us-gaap:FinancingReceivables30To59DaysPastDueMembersrt:SingleFamilyMemberus-gaap:ConsumerPortfolioSegmentMember2020-09-300000936528srt:SingleFamilyMemberus-gaap:ConsumerPortfolioSegmentMemberus-gaap:FinancingReceivables60To89DaysPastDueMember2020-09-300000936528us-gaap:FinancingReceivables1To29DaysPastDueMemberus-gaap:ConstructionLoansMemberus-gaap:ConsumerPortfolioSegmentMember2020-09-300000936528us-gaap:FinancingReceivables30To59DaysPastDueMemberus-gaap:ConstructionLoansMemberus-gaap:ConsumerPortfolioSegmentMember2020-09-300000936528us-gaap:ConstructionLoansMemberus-gaap:ConsumerPortfolioSegmentMemberus-gaap:FinancingReceivables60To89DaysPastDueMember2020-09-300000936528wfsl:LandConsumerLotLoansMemberus-gaap:FinancingReceivables1To29DaysPastDueMemberus-gaap:ConsumerPortfolioSegmentMember2020-09-300000936528wfsl:LandConsumerLotLoansMemberus-gaap:FinancingReceivables30To59DaysPastDueMemberus-gaap:ConsumerPortfolioSegmentMember2020-09-300000936528wfsl:LandConsumerLotLoansMemberus-gaap:ConsumerPortfolioSegmentMemberus-gaap:FinancingReceivables60To89DaysPastDueMember2020-09-300000936528us-gaap:HomeEquityMemberus-gaap:FinancingReceivables1To29DaysPastDueMemberus-gaap:ConsumerPortfolioSegmentMember2020-09-300000936528us-gaap:HomeEquityMemberus-gaap:FinancingReceivables30To59DaysPastDueMemberus-gaap:ConsumerPortfolioSegmentMember2020-09-300000936528us-gaap:HomeEquityMemberus-gaap:ConsumerPortfolioSegmentMemberus-gaap:FinancingReceivables60To89DaysPastDueMember2020-09-300000936528us-gaap:FinancingReceivables1To29DaysPastDueMemberus-gaap:ConsumerLoanMemberus-gaap:ConsumerPortfolioSegmentMember2020-09-300000936528us-gaap:FinancingReceivables30To59DaysPastDueMemberus-gaap:ConsumerLoanMemberus-gaap:ConsumerPortfolioSegmentMember2020-09-300000936528us-gaap:ConsumerLoanMemberus-gaap:ConsumerPortfolioSegmentMemberus-gaap:FinancingReceivables60To89DaysPastDueMember2020-09-300000936528us-gaap:FinancingReceivables1To29DaysPastDueMemberus-gaap:ConsumerPortfolioSegmentMember2020-09-300000936528us-gaap:FinancingReceivables30To59DaysPastDueMemberus-gaap:ConsumerPortfolioSegmentMember2020-09-300000936528us-gaap:ConsumerPortfolioSegmentMemberus-gaap:FinancingReceivables60To89DaysPastDueMember2020-09-300000936528us-gaap:FinancingReceivables1To29DaysPastDueMember2020-09-300000936528us-gaap:FinancingReceivables30To59DaysPastDueMember2020-09-300000936528us-gaap:FinancingReceivables60To89DaysPastDueMember2020-09-300000936528us-gaap:FinancingReceivables1To29DaysPastDueMemberus-gaap:CommercialPortfolioSegmentMembersrt:MultifamilyMember2019-09-300000936528us-gaap:FinancingReceivables30To59DaysPastDueMemberus-gaap:CommercialPortfolioSegmentMembersrt:MultifamilyMember2019-09-300000936528us-gaap:CommercialPortfolioSegmentMembersrt:MultifamilyMemberus-gaap:FinancingReceivables60To89DaysPastDueMember2019-09-300000936528us-gaap:FinancingReceivables1To29DaysPastDueMemberus-gaap:CommercialRealEstateMemberus-gaap:CommercialPortfolioSegmentMember2019-09-300000936528us-gaap:FinancingReceivables30To59DaysPastDueMemberus-gaap:CommercialRealEstateMemberus-gaap:CommercialPortfolioSegmentMember2019-09-300000936528us-gaap:CommercialRealEstateMemberus-gaap:CommercialPortfolioSegmentMemberus-gaap:FinancingReceivables60To89DaysPastDueMember2019-09-300000936528us-gaap:FinancingReceivables1To29DaysPastDueMemberwfsl:CommercialandIndustrialMemberus-gaap:CommercialPortfolioSegmentMember2019-09-300000936528us-gaap:FinancingReceivables30To59DaysPastDueMemberwfsl:CommercialandIndustrialMemberus-gaap:CommercialPortfolioSegmentMember2019-09-300000936528wfsl:CommercialandIndustrialMemberus-gaap:CommercialPortfolioSegmentMemberus-gaap:FinancingReceivables60To89DaysPastDueMember2019-09-300000936528us-gaap:FinancingReceivables1To29DaysPastDueMemberus-gaap:ConstructionLoansMemberus-gaap:CommercialPortfolioSegmentMember2019-09-300000936528us-gaap:FinancingReceivables30To59DaysPastDueMemberus-gaap:ConstructionLoansMemberus-gaap:CommercialPortfolioSegmentMember2019-09-300000936528us-gaap:ConstructionLoansMemberus-gaap:CommercialPortfolioSegmentMemberus-gaap:FinancingReceivables60To89DaysPastDueMember2019-09-300000936528us-gaap:FinancingReceivables1To29DaysPastDueMemberwfsl:LandAcquisitionAndDevelopmentMemberus-gaap:CommercialPortfolioSegmentMember2019-09-300000936528us-gaap:FinancingReceivables30To59DaysPastDueMemberwfsl:LandAcquisitionAndDevelopmentMemberus-gaap:CommercialPortfolioSegmentMember2019-09-300000936528wfsl:LandAcquisitionAndDevelopmentMemberus-gaap:CommercialPortfolioSegmentMemberus-gaap:FinancingReceivables60To89DaysPastDueMember2019-09-300000936528us-gaap:FinancingReceivables1To29DaysPastDueMemberus-gaap:CommercialPortfolioSegmentMember2019-09-300000936528us-gaap:FinancingReceivables30To59DaysPastDueMemberus-gaap:CommercialPortfolioSegmentMember2019-09-300000936528us-gaap:CommercialPortfolioSegmentMemberus-gaap:FinancingReceivables60To89DaysPastDueMember2019-09-300000936528us-gaap:FinancingReceivables1To29DaysPastDueMembersrt:SingleFamilyMemberus-gaap:ConsumerPortfolioSegmentMember2019-09-300000936528us-gaap:FinancingReceivables30To59DaysPastDueMembersrt:SingleFamilyMemberus-gaap:ConsumerPortfolioSegmentMember2019-09-300000936528srt:SingleFamilyMemberus-gaap:ConsumerPortfolioSegmentMemberus-gaap:FinancingReceivables60To89DaysPastDueMember2019-09-300000936528us-gaap:FinancingReceivables1To29DaysPastDueMemberus-gaap:ConstructionLoansMemberus-gaap:ConsumerPortfolioSegmentMember2019-09-300000936528us-gaap:FinancingReceivables30To59DaysPastDueMemberus-gaap:ConstructionLoansMemberus-gaap:ConsumerPortfolioSegmentMember2019-09-300000936528us-gaap:ConstructionLoansMemberus-gaap:ConsumerPortfolioSegmentMemberus-gaap:FinancingReceivables60To89DaysPastDueMember2019-09-300000936528wfsl:LandConsumerLotLoansMemberus-gaap:FinancingReceivables1To29DaysPastDueMemberus-gaap:ConsumerPortfolioSegmentMember2019-09-300000936528wfsl:LandConsumerLotLoansMemberus-gaap:FinancingReceivables30To59DaysPastDueMemberus-gaap:ConsumerPortfolioSegmentMember2019-09-300000936528wfsl:LandConsumerLotLoansMemberus-gaap:ConsumerPortfolioSegmentMemberus-gaap:FinancingReceivables60To89DaysPastDueMember2019-09-300000936528us-gaap:HomeEquityMemberus-gaap:FinancingReceivables1To29DaysPastDueMemberus-gaap:ConsumerPortfolioSegmentMember2019-09-300000936528us-gaap:HomeEquityMemberus-gaap:FinancingReceivables30To59DaysPastDueMemberus-gaap:ConsumerPortfolioSegmentMember2019-09-300000936528us-gaap:HomeEquityMemberus-gaap:ConsumerPortfolioSegmentMemberus-gaap:FinancingReceivables60To89DaysPastDueMember2019-09-300000936528us-gaap:FinancingReceivables1To29DaysPastDueMemberus-gaap:ConsumerLoanMemberus-gaap:ConsumerPortfolioSegmentMember2019-09-300000936528us-gaap:FinancingReceivables30To59DaysPastDueMemberus-gaap:ConsumerLoanMemberus-gaap:ConsumerPortfolioSegmentMember2019-09-300000936528us-gaap:ConsumerLoanMemberus-gaap:ConsumerPortfolioSegmentMemberus-gaap:FinancingReceivables60To89DaysPastDueMember2019-09-300000936528us-gaap:FinancingReceivables1To29DaysPastDueMemberus-gaap:ConsumerPortfolioSegmentMember2019-09-300000936528us-gaap:FinancingReceivables30To59DaysPastDueMemberus-gaap:ConsumerPortfolioSegmentMember2019-09-300000936528us-gaap:ConsumerPortfolioSegmentMemberus-gaap:FinancingReceivables60To89DaysPastDueMember2019-09-300000936528us-gaap:FinancingReceivables1To29DaysPastDueMember2019-09-300000936528us-gaap:FinancingReceivables30To59DaysPastDueMember2019-09-300000936528us-gaap:FinancingReceivables60To89DaysPastDueMember2019-09-300000936528wfsl:SmallBusinessAdministrationSBACARESActPayrollProtectionProgramMember2019-10-012020-09-30wfsl:loan0000936528us-gaap:ConsumerPortfolioSegmentMember2020-09-302020-09-300000936528us-gaap:CommercialPortfolioSegmentMember2020-09-302020-09-300000936528us-gaap:CommercialPortfolioSegmentMemberus-gaap:PassMembersrt:MultifamilyMember2020-09-300000936528us-gaap:SpecialMentionMemberus-gaap:CommercialPortfolioSegmentMembersrt:MultifamilyMember2020-09-300000936528us-gaap:SubstandardMemberus-gaap:CommercialPortfolioSegmentMembersrt:MultifamilyMember2020-09-300000936528us-gaap:CommercialRealEstateMemberus-gaap:CommercialPortfolioSegmentMemberus-gaap:PassMember2020-09-300000936528us-gaap:SpecialMentionMemberus-gaap:CommercialRealEstateMemberus-gaap:CommercialPortfolioSegmentMember2020-09-300000936528us-gaap:CommercialRealEstateMemberus-gaap:SubstandardMemberus-gaap:CommercialPortfolioSegmentMember2020-09-300000936528wfsl:CommercialandIndustrialMemberus-gaap:CommercialPortfolioSegmentMemberus-gaap:PassMember2020-09-300000936528us-gaap:SpecialMentionMemberwfsl:CommercialandIndustrialMemberus-gaap:CommercialPortfolioSegmentMember2020-09-300000936528wfsl:CommercialandIndustrialMemberus-gaap:SubstandardMemberus-gaap:CommercialPortfolioSegmentMember2020-09-300000936528us-gaap:ConstructionLoansMemberus-gaap:CommercialPortfolioSegmentMemberus-gaap:PassMember2020-09-300000936528us-gaap:SpecialMentionMemberus-gaap:ConstructionLoansMemberus-gaap:CommercialPortfolioSegmentMember2020-09-300000936528us-gaap:ConstructionLoansMemberus-gaap:SubstandardMemberus-gaap:CommercialPortfolioSegmentMember2020-09-300000936528wfsl:LandAcquisitionAndDevelopmentMemberus-gaap:CommercialPortfolioSegmentMemberus-gaap:PassMember2020-09-300000936528us-gaap:SpecialMentionMemberwfsl:LandAcquisitionAndDevelopmentMemberus-gaap:CommercialPortfolioSegmentMember2020-09-300000936528us-gaap:CommercialPortfolioSegmentMemberus-gaap:PassMember2020-09-300000936528us-gaap:SpecialMentionMemberus-gaap:CommercialPortfolioSegmentMember2020-09-300000936528us-gaap:SubstandardMemberus-gaap:CommercialPortfolioSegmentMember2020-09-300000936528us-gaap:FinancingReceivablesEqualToGreaterThan90DaysPastDueMembersrt:SingleFamilyMemberus-gaap:ConsumerPortfolioSegmentMember2020-09-300000936528wfsl:LandConsumerLotLoansMemberus-gaap:FinancingReceivablesEqualToGreaterThan90DaysPastDueMemberus-gaap:ConsumerPortfolioSegmentMember2020-09-300000936528us-gaap:HomeEquityMemberus-gaap:FinancingReceivablesEqualToGreaterThan90DaysPastDueMemberus-gaap:ConsumerPortfolioSegmentMember2020-09-300000936528us-gaap:FinancingReceivablesEqualToGreaterThan90DaysPastDueMemberus-gaap:ConsumerLoanMemberus-gaap:ConsumerPortfolioSegmentMember2020-09-300000936528us-gaap:FinancingReceivablesEqualToGreaterThan90DaysPastDueMemberus-gaap:ConsumerPortfolioSegmentMember2020-09-300000936528us-gaap:CommercialPortfolioSegmentMembersrt:MultifamilyMember2019-10-012020-09-300000936528us-gaap:CommercialRealEstateMemberus-gaap:CommercialPortfolioSegmentMember2019-10-012020-09-300000936528wfsl:CommercialandIndustrialMemberus-gaap:CommercialPortfolioSegmentMember2019-10-012020-09-300000936528us-gaap:ConstructionLoansMemberus-gaap:CommercialPortfolioSegmentMember2019-10-012020-09-300000936528wfsl:LandAcquisitionAndDevelopmentMemberus-gaap:CommercialPortfolioSegmentMember2019-10-012020-09-300000936528us-gaap:CommercialPortfolioSegmentMember2019-10-012020-09-300000936528srt:SingleFamilyMemberus-gaap:ConsumerPortfolioSegmentMember2019-10-012020-09-300000936528us-gaap:ConstructionLoansMemberus-gaap:ConsumerPortfolioSegmentMember2019-10-012020-09-300000936528wfsl:LandConsumerLotLoansMemberus-gaap:ConsumerPortfolioSegmentMember2019-10-012020-09-300000936528us-gaap:HomeEquityMemberus-gaap:ConsumerPortfolioSegmentMember2019-10-012020-09-300000936528us-gaap:ConsumerLoanMemberus-gaap:ConsumerPortfolioSegmentMember2019-10-012020-09-300000936528us-gaap:ConsumerPortfolioSegmentMember2019-10-012020-09-300000936528us-gaap:CommercialPortfolioSegmentMembersrt:MultifamilyMember2018-09-300000936528us-gaap:CommercialPortfolioSegmentMembersrt:MultifamilyMember2018-10-012019-09-300000936528us-gaap:CommercialRealEstateMemberus-gaap:CommercialPortfolioSegmentMember2018-09-300000936528us-gaap:CommercialRealEstateMemberus-gaap:CommercialPortfolioSegmentMember2018-10-012019-09-300000936528wfsl:CommercialandIndustrialMemberus-gaap:CommercialPortfolioSegmentMember2018-09-300000936528wfsl:CommercialandIndustrialMemberus-gaap:CommercialPortfolioSegmentMember2018-10-012019-09-300000936528us-gaap:ConstructionLoansMemberus-gaap:CommercialPortfolioSegmentMember2018-09-300000936528us-gaap:ConstructionLoansMemberus-gaap:CommercialPortfolioSegmentMember2018-10-012019-09-300000936528wfsl:LandAcquisitionAndDevelopmentMemberus-gaap:CommercialPortfolioSegmentMember2018-09-300000936528wfsl:LandAcquisitionAndDevelopmentMemberus-gaap:CommercialPortfolioSegmentMember2018-10-012019-09-300000936528us-gaap:CommercialPortfolioSegmentMember2018-09-300000936528us-gaap:CommercialPortfolioSegmentMember2018-10-012019-09-300000936528srt:SingleFamilyMemberus-gaap:ConsumerPortfolioSegmentMember2018-09-300000936528srt:SingleFamilyMemberus-gaap:ConsumerPortfolioSegmentMember2018-10-012019-09-300000936528us-gaap:ConstructionLoansMemberus-gaap:ConsumerPortfolioSegmentMember2018-09-300000936528us-gaap:ConstructionLoansMemberus-gaap:ConsumerPortfolioSegmentMember2018-10-012019-09-300000936528wfsl:LandConsumerLotLoansMemberus-gaap:ConsumerPortfolioSegmentMember2018-09-300000936528wfsl:LandConsumerLotLoansMemberus-gaap:ConsumerPortfolioSegmentMember2018-10-012019-09-300000936528us-gaap:HomeEquityMemberus-gaap:ConsumerPortfolioSegmentMember2018-09-300000936528us-gaap:HomeEquityMemberus-gaap:ConsumerPortfolioSegmentMember2018-10-012019-09-300000936528us-gaap:ConsumerLoanMemberus-gaap:ConsumerPortfolioSegmentMember2018-09-300000936528us-gaap:ConsumerLoanMemberus-gaap:ConsumerPortfolioSegmentMember2018-10-012019-09-300000936528us-gaap:ConsumerPortfolioSegmentMember2018-09-300000936528us-gaap:ConsumerPortfolioSegmentMember2018-10-012019-09-300000936528us-gaap:NonperformingFinancingReceivableMember2020-09-300000936528us-gaap:NonperformingFinancingReceivableMember2019-09-300000936528wfsl:LoansSubjectToQuantitativeEvaluationMember2020-09-300000936528wfsl:LoansSubjectToManagementQualitativeEvaluationMember2020-09-300000936528us-gaap:DoubtfulMemberus-gaap:CommercialPortfolioSegmentMembersrt:MultifamilyMember2020-09-300000936528wfsl:LossMemberus-gaap:CommercialPortfolioSegmentMembersrt:MultifamilyMember2020-09-300000936528us-gaap:DoubtfulMemberus-gaap:CommercialRealEstateMemberus-gaap:CommercialPortfolioSegmentMember2020-09-300000936528us-gaap:CommercialRealEstateMemberwfsl:LossMemberus-gaap:CommercialPortfolioSegmentMember2020-09-300000936528us-gaap:DoubtfulMemberwfsl:CommercialandIndustrialMemberus-gaap:CommercialPortfolioSegmentMember2020-09-300000936528wfsl:LossMemberwfsl:CommercialandIndustrialMemberus-gaap:CommercialPortfolioSegmentMember2020-09-300000936528us-gaap:DoubtfulMemberus-gaap:ConstructionLoansMemberus-gaap:CommercialPortfolioSegmentMember2020-09-300000936528wfsl:LossMemberus-gaap:ConstructionLoansMemberus-gaap:CommercialPortfolioSegmentMember2020-09-300000936528wfsl:LandAcquisitionAndDevelopmentMemberus-gaap:SubstandardMemberus-gaap:CommercialPortfolioSegmentMember2020-09-300000936528us-gaap:DoubtfulMemberwfsl:LandAcquisitionAndDevelopmentMemberus-gaap:CommercialPortfolioSegmentMember2020-09-300000936528wfsl:LandAcquisitionAndDevelopmentMemberwfsl:LossMemberus-gaap:CommercialPortfolioSegmentMember2020-09-300000936528us-gaap:DoubtfulMemberus-gaap:CommercialPortfolioSegmentMember2020-09-300000936528wfsl:LossMemberus-gaap:CommercialPortfolioSegmentMember2020-09-300000936528srt:SingleFamilyMemberus-gaap:PassMemberus-gaap:ConsumerPortfolioSegmentMember2020-09-300000936528us-gaap:SpecialMentionMembersrt:SingleFamilyMemberus-gaap:ConsumerPortfolioSegmentMember2020-09-300000936528srt:SingleFamilyMemberus-gaap:SubstandardMemberus-gaap:ConsumerPortfolioSegmentMember2020-09-300000936528us-gaap:DoubtfulMembersrt:SingleFamilyMemberus-gaap:ConsumerPortfolioSegmentMember2020-09-300000936528wfsl:LossMembersrt:SingleFamilyMemberus-gaap:ConsumerPortfolioSegmentMember2020-09-300000936528us-gaap:ConstructionLoansMemberus-gaap:PassMemberus-gaap:ConsumerPortfolioSegmentMember2020-09-300000936528us-gaap:SpecialMentionMemberus-gaap:ConstructionLoansMemberus-gaap:ConsumerPortfolioSegmentMember2020-09-300000936528us-gaap:ConstructionLoansMemberus-gaap:SubstandardMemberus-gaap:ConsumerPortfolioSegmentMember2020-09-300000936528us-gaap:DoubtfulMemberus-gaap:ConstructionLoansMemberus-gaap:ConsumerPortfolioSegmentMember2020-09-300000936528wfsl:LossMemberus-gaap:ConstructionLoansMemberus-gaap:ConsumerPortfolioSegmentMember2020-09-300000936528wfsl:LandConsumerLotLoansMemberus-gaap:PassMemberus-gaap:ConsumerPortfolioSegmentMember2020-09-300000936528wfsl:LandConsumerLotLoansMemberus-gaap:SpecialMentionMemberus-gaap:ConsumerPortfolioSegmentMember2020-09-300000936528wfsl:LandConsumerLotLoansMemberus-gaap:SubstandardMemberus-gaap:ConsumerPortfolioSegmentMember2020-09-300000936528wfsl:LandConsumerLotLoansMemberus-gaap:DoubtfulMemberus-gaap:ConsumerPortfolioSegmentMember2020-09-300000936528wfsl:LandConsumerLotLoansMemberwfsl:LossMemberus-gaap:ConsumerPortfolioSegmentMember2020-09-300000936528us-gaap:HomeEquityMemberus-gaap:PassMemberus-gaap:ConsumerPortfolioSegmentMember2020-09-300000936528us-gaap:SpecialMentionMemberus-gaap:HomeEquityMemberus-gaap:ConsumerPortfolioSegmentMember2020-09-300000936528us-gaap:HomeEquityMemberus-gaap:SubstandardMemberus-gaap:ConsumerPortfolioSegmentMember2020-09-300000936528us-gaap:DoubtfulMemberus-gaap:HomeEquityMemberus-gaap:ConsumerPortfolioSegmentMember2020-09-300000936528us-gaap:HomeEquityMemberwfsl:LossMemberus-gaap:ConsumerPortfolioSegmentMember2020-09-300000936528us-gaap:ConsumerLoanMemberus-gaap:PassMemberus-gaap:ConsumerPortfolioSegmentMember2020-09-300000936528us-gaap:SpecialMentionMemberus-gaap:ConsumerLoanMemberus-gaap:ConsumerPortfolioSegmentMember2020-09-300000936528us-gaap:SubstandardMemberus-gaap:ConsumerLoanMemberus-gaap:ConsumerPortfolioSegmentMember2020-09-300000936528us-gaap:DoubtfulMemberus-gaap:ConsumerLoanMemberus-gaap:ConsumerPortfolioSegmentMember2020-09-300000936528wfsl:LossMemberus-gaap:ConsumerLoanMemberus-gaap:ConsumerPortfolioSegmentMember2020-09-300000936528us-gaap:PassMemberus-gaap:ConsumerPortfolioSegmentMember2020-09-300000936528us-gaap:SpecialMentionMemberus-gaap:ConsumerPortfolioSegmentMember2020-09-300000936528us-gaap:SubstandardMemberus-gaap:ConsumerPortfolioSegmentMember2020-09-300000936528us-gaap:DoubtfulMemberus-gaap:ConsumerPortfolioSegmentMember2020-09-300000936528wfsl:LossMemberus-gaap:ConsumerPortfolioSegmentMember2020-09-300000936528us-gaap:PassMember2020-09-300000936528us-gaap:SpecialMentionMember2020-09-300000936528us-gaap:SubstandardMember2020-09-300000936528us-gaap:DoubtfulMember2020-09-300000936528wfsl:LossMember2020-09-300000936528us-gaap:AccountsReceivableMemberus-gaap:CreditConcentrationRiskMemberus-gaap:PassMember2019-10-012020-09-300000936528us-gaap:SpecialMentionMemberus-gaap:AccountsReceivableMemberus-gaap:CreditConcentrationRiskMember2019-10-012020-09-300000936528us-gaap:AccountsReceivableMemberus-gaap:SubstandardMemberus-gaap:CreditConcentrationRiskMember2019-10-012020-09-300000936528us-gaap:DoubtfulMemberus-gaap:AccountsReceivableMemberus-gaap:CreditConcentrationRiskMember2019-10-012020-09-300000936528us-gaap:AccountsReceivableMemberwfsl:LossMemberus-gaap:CreditConcentrationRiskMember2019-10-012020-09-300000936528us-gaap:CommercialPortfolioSegmentMemberus-gaap:PassMembersrt:MultifamilyMember2019-09-300000936528us-gaap:SpecialMentionMemberus-gaap:CommercialPortfolioSegmentMembersrt:MultifamilyMember2019-09-300000936528us-gaap:SubstandardMemberus-gaap:CommercialPortfolioSegmentMembersrt:MultifamilyMember2019-09-300000936528us-gaap:DoubtfulMemberus-gaap:CommercialPortfolioSegmentMembersrt:MultifamilyMember2019-09-300000936528wfsl:LossMemberus-gaap:CommercialPortfolioSegmentMembersrt:MultifamilyMember2019-09-300000936528us-gaap:CommercialRealEstateMemberus-gaap:CommercialPortfolioSegmentMemberus-gaap:PassMember2019-09-300000936528us-gaap:SpecialMentionMemberus-gaap:CommercialRealEstateMemberus-gaap:CommercialPortfolioSegmentMember2019-09-300000936528us-gaap:CommercialRealEstateMemberus-gaap:SubstandardMemberus-gaap:CommercialPortfolioSegmentMember2019-09-300000936528us-gaap:DoubtfulMemberus-gaap:CommercialRealEstateMemberus-gaap:CommercialPortfolioSegmentMember2019-09-300000936528us-gaap:CommercialRealEstateMemberwfsl:LossMemberus-gaap:CommercialPortfolioSegmentMember2019-09-300000936528wfsl:CommercialandIndustrialMemberus-gaap:CommercialPortfolioSegmentMemberus-gaap:PassMember2019-09-300000936528us-gaap:SpecialMentionMemberwfsl:CommercialandIndustrialMemberus-gaap:CommercialPortfolioSegmentMember2019-09-300000936528wfsl:CommercialandIndustrialMemberus-gaap:SubstandardMemberus-gaap:CommercialPortfolioSegmentMember2019-09-300000936528us-gaap:DoubtfulMemberwfsl:CommercialandIndustrialMemberus-gaap:CommercialPortfolioSegmentMember2019-09-300000936528wfsl:LossMemberwfsl:CommercialandIndustrialMemberus-gaap:CommercialPortfolioSegmentMember2019-09-300000936528us-gaap:ConstructionLoansMemberus-gaap:CommercialPortfolioSegmentMemberus-gaap:PassMember2019-09-300000936528us-gaap:SpecialMentionMemberus-gaap:ConstructionLoansMemberus-gaap:CommercialPortfolioSegmentMember2019-09-300000936528us-gaap:ConstructionLoansMemberus-gaap:SubstandardMemberus-gaap:CommercialPortfolioSegmentMember2019-09-300000936528us-gaap:DoubtfulMemberus-gaap:ConstructionLoansMemberus-gaap:CommercialPortfolioSegmentMember2019-09-300000936528wfsl:LossMemberus-gaap:ConstructionLoansMemberus-gaap:CommercialPortfolioSegmentMember2019-09-300000936528wfsl:LandAcquisitionAndDevelopmentMemberus-gaap:CommercialPortfolioSegmentMemberus-gaap:PassMember2019-09-300000936528us-gaap:SpecialMentionMemberwfsl:LandAcquisitionAndDevelopmentMemberus-gaap:CommercialPortfolioSegmentMember2019-09-300000936528wfsl:LandAcquisitionAndDevelopmentMemberus-gaap:SubstandardMemberus-gaap:CommercialPortfolioSegmentMember2019-09-300000936528us-gaap:DoubtfulMemberwfsl:LandAcquisitionAndDevelopmentMemberus-gaap:CommercialPortfolioSegmentMember2019-09-300000936528wfsl:LandAcquisitionAndDevelopmentMemberwfsl:LossMemberus-gaap:CommercialPortfolioSegmentMember2019-09-300000936528us-gaap:CommercialPortfolioSegmentMemberus-gaap:PassMember2019-09-300000936528us-gaap:SpecialMentionMemberus-gaap:CommercialPortfolioSegmentMember2019-09-300000936528us-gaap:SubstandardMemberus-gaap:CommercialPortfolioSegmentMember2019-09-300000936528us-gaap:DoubtfulMemberus-gaap:CommercialPortfolioSegmentMember2019-09-300000936528wfsl:LossMemberus-gaap:CommercialPortfolioSegmentMember2019-09-300000936528srt:SingleFamilyMemberus-gaap:PassMemberus-gaap:ConsumerPortfolioSegmentMember2019-09-300000936528us-gaap:SpecialMentionMembersrt:SingleFamilyMemberus-gaap:ConsumerPortfolioSegmentMember2019-09-300000936528srt:SingleFamilyMemberus-gaap:SubstandardMemberus-gaap:ConsumerPortfolioSegmentMember2019-09-300000936528us-gaap:DoubtfulMembersrt:SingleFamilyMemberus-gaap:ConsumerPortfolioSegmentMember2019-09-300000936528wfsl:LossMembersrt:SingleFamilyMemberus-gaap:ConsumerPortfolioSegmentMember2019-09-300000936528us-gaap:ConstructionLoansMemberus-gaap:PassMemberus-gaap:ConsumerPortfolioSegmentMember2019-09-300000936528us-gaap:SpecialMentionMemberus-gaap:ConstructionLoansMemberus-gaap:ConsumerPortfolioSegmentMember2019-09-300000936528us-gaap:ConstructionLoansMemberus-gaap:SubstandardMemberus-gaap:ConsumerPortfolioSegmentMember2019-09-300000936528us-gaap:DoubtfulMemberus-gaap:ConstructionLoansMemberus-gaap:ConsumerPortfolioSegmentMember2019-09-300000936528wfsl:LossMemberus-gaap:ConstructionLoansMemberus-gaap:ConsumerPortfolioSegmentMember2019-09-300000936528wfsl:LandConsumerLotLoansMemberus-gaap:PassMemberus-gaap:ConsumerPortfolioSegmentMember2019-09-300000936528wfsl:LandConsumerLotLoansMemberus-gaap:SpecialMentionMemberus-gaap:ConsumerPortfolioSegmentMember2019-09-300000936528wfsl:LandConsumerLotLoansMemberus-gaap:SubstandardMemberus-gaap:ConsumerPortfolioSegmentMember2019-09-300000936528wfsl:LandConsumerLotLoansMemberus-gaap:DoubtfulMemberus-gaap:ConsumerPortfolioSegmentMember2019-09-300000936528wfsl:LandConsumerLotLoansMemberwfsl:LossMemberus-gaap:ConsumerPortfolioSegmentMember2019-09-300000936528us-gaap:HomeEquityMemberus-gaap:PassMemberus-gaap:ConsumerPortfolioSegmentMember2019-09-300000936528us-gaap:SpecialMentionMemberus-gaap:HomeEquityMemberus-gaap:ConsumerPortfolioSegmentMember2019-09-300000936528us-gaap:HomeEquityMemberus-gaap:SubstandardMemberus-gaap:ConsumerPortfolioSegmentMember2019-09-300000936528us-gaap:DoubtfulMemberus-gaap:HomeEquityMemberus-gaap:ConsumerPortfolioSegmentMember2019-09-300000936528us-gaap:HomeEquityMemberwfsl:LossMemberus-gaap:ConsumerPortfolioSegmentMember2019-09-300000936528us-gaap:ConsumerLoanMemberus-gaap:PassMemberus-gaap:ConsumerPortfolioSegmentMember2019-09-300000936528us-gaap:SpecialMentionMemberus-gaap:ConsumerLoanMemberus-gaap:ConsumerPortfolioSegmentMember2019-09-300000936528us-gaap:SubstandardMemberus-gaap:ConsumerLoanMemberus-gaap:ConsumerPortfolioSegmentMember2019-09-300000936528us-gaap:DoubtfulMemberus-gaap:ConsumerLoanMemberus-gaap:ConsumerPortfolioSegmentMember2019-09-300000936528wfsl:LossMemberus-gaap:ConsumerLoanMemberus-gaap:ConsumerPortfolioSegmentMember2019-09-300000936528us-gaap:PassMemberus-gaap:ConsumerPortfolioSegmentMember2019-09-300000936528us-gaap:SpecialMentionMemberus-gaap:ConsumerPortfolioSegmentMember2019-09-300000936528us-gaap:SubstandardMemberus-gaap:ConsumerPortfolioSegmentMember2019-09-300000936528us-gaap:DoubtfulMemberus-gaap:ConsumerPortfolioSegmentMember2019-09-300000936528wfsl:LossMemberus-gaap:ConsumerPortfolioSegmentMember2019-09-300000936528us-gaap:PassMember2019-09-300000936528us-gaap:SpecialMentionMember2019-09-300000936528us-gaap:SubstandardMember2019-09-300000936528us-gaap:DoubtfulMember2019-09-300000936528wfsl:LossMember2019-09-300000936528us-gaap:AccountsReceivableMemberus-gaap:CreditConcentrationRiskMemberus-gaap:PassMember2018-10-012019-09-300000936528us-gaap:SpecialMentionMemberus-gaap:AccountsReceivableMemberus-gaap:CreditConcentrationRiskMember2018-10-012019-09-300000936528us-gaap:AccountsReceivableMemberus-gaap:SubstandardMemberus-gaap:CreditConcentrationRiskMember2018-10-012019-09-300000936528us-gaap:DoubtfulMemberus-gaap:AccountsReceivableMemberus-gaap:CreditConcentrationRiskMember2018-10-012019-09-300000936528us-gaap:AccountsReceivableMemberwfsl:LossMemberus-gaap:CreditConcentrationRiskMember2018-10-012019-09-300000936528us-gaap:PerformingFinancingReceivableMemberus-gaap:CommercialPortfolioSegmentMembersrt:MultifamilyMember2020-09-300000936528us-gaap:CommercialPortfolioSegmentMemberus-gaap:NonperformingFinancingReceivableMembersrt:MultifamilyMember2020-09-300000936528us-gaap:PerformingFinancingReceivableMemberus-gaap:CommercialRealEstateMemberus-gaap:CommercialPortfolioSegmentMember2020-09-300000936528us-gaap:CommercialRealEstateMemberus-gaap:CommercialPortfolioSegmentMemberus-gaap:NonperformingFinancingReceivableMember2020-09-300000936528us-gaap:PerformingFinancingReceivableMemberwfsl:CommercialandIndustrialMemberus-gaap:CommercialPortfolioSegmentMember2020-09-300000936528wfsl:CommercialandIndustrialMemberus-gaap:CommercialPortfolioSegmentMemberus-gaap:NonperformingFinancingReceivableMember2020-09-300000936528us-gaap:PerformingFinancingReceivableMemberus-gaap:ConstructionLoansMemberus-gaap:CommercialPortfolioSegmentMember2020-09-300000936528us-gaap:ConstructionLoansMemberus-gaap:CommercialPortfolioSegmentMemberus-gaap:NonperformingFinancingReceivableMember2020-09-300000936528us-gaap:PerformingFinancingReceivableMemberwfsl:LandAcquisitionAndDevelopmentMemberus-gaap:CommercialPortfolioSegmentMember2020-09-300000936528wfsl:LandAcquisitionAndDevelopmentMemberus-gaap:CommercialPortfolioSegmentMemberus-gaap:NonperformingFinancingReceivableMember2020-09-300000936528us-gaap:PerformingFinancingReceivableMemberus-gaap:CommercialPortfolioSegmentMember2020-09-300000936528us-gaap:CommercialPortfolioSegmentMemberus-gaap:NonperformingFinancingReceivableMember2020-09-300000936528us-gaap:PerformingFinancingReceivableMembersrt:SingleFamilyMemberus-gaap:ConsumerPortfolioSegmentMember2020-09-300000936528srt:SingleFamilyMemberus-gaap:NonperformingFinancingReceivableMemberus-gaap:ConsumerPortfolioSegmentMember2020-09-300000936528us-gaap:PerformingFinancingReceivableMemberus-gaap:ConstructionLoansMemberus-gaap:ConsumerPortfolioSegmentMember2020-09-300000936528us-gaap:ConstructionLoansMemberus-gaap:NonperformingFinancingReceivableMemberus-gaap:ConsumerPortfolioSegmentMember2020-09-300000936528wfsl:LandConsumerLotLoansMemberus-gaap:PerformingFinancingReceivableMemberus-gaap:ConsumerPortfolioSegmentMember2020-09-300000936528wfsl:LandConsumerLotLoansMemberus-gaap:NonperformingFinancingReceivableMemberus-gaap:ConsumerPortfolioSegmentMember2020-09-300000936528us-gaap:HomeEquityMemberus-gaap:PerformingFinancingReceivableMemberus-gaap:ConsumerPortfolioSegmentMember2020-09-300000936528us-gaap:HomeEquityMemberus-gaap:NonperformingFinancingReceivableMemberus-gaap:ConsumerPortfolioSegmentMember2020-09-300000936528us-gaap:PerformingFinancingReceivableMemberus-gaap:ConsumerLoanMemberus-gaap:ConsumerPortfolioSegmentMember2020-09-300000936528us-gaap:NonperformingFinancingReceivableMemberus-gaap:ConsumerLoanMemberus-gaap:ConsumerPortfolioSegmentMember2020-09-300000936528us-gaap:PerformingFinancingReceivableMemberus-gaap:ConsumerPortfolioSegmentMember2020-09-300000936528us-gaap:NonperformingFinancingReceivableMemberus-gaap:ConsumerPortfolioSegmentMember2020-09-300000936528us-gaap:PerformingFinancingReceivableMember2020-09-300000936528us-gaap:NonperformingFinancingReceivableMember2020-09-300000936528us-gaap:PerformingFinancingReceivableMemberus-gaap:CommercialPortfolioSegmentMembersrt:MultifamilyMember2019-09-300000936528us-gaap:CommercialPortfolioSegmentMemberus-gaap:NonperformingFinancingReceivableMembersrt:MultifamilyMember2019-09-300000936528us-gaap:PerformingFinancingReceivableMemberus-gaap:CommercialRealEstateMemberus-gaap:CommercialPortfolioSegmentMember2019-09-300000936528us-gaap:CommercialRealEstateMemberus-gaap:CommercialPortfolioSegmentMemberus-gaap:NonperformingFinancingReceivableMember2019-09-300000936528us-gaap:PerformingFinancingReceivableMemberwfsl:CommercialandIndustrialMemberus-gaap:CommercialPortfolioSegmentMember2019-09-300000936528wfsl:CommercialandIndustrialMemberus-gaap:CommercialPortfolioSegmentMemberus-gaap:NonperformingFinancingReceivableMember2019-09-300000936528us-gaap:PerformingFinancingReceivableMemberus-gaap:ConstructionLoansMemberus-gaap:CommercialPortfolioSegmentMember2019-09-300000936528us-gaap:ConstructionLoansMemberus-gaap:CommercialPortfolioSegmentMemberus-gaap:NonperformingFinancingReceivableMember2019-09-300000936528us-gaap:PerformingFinancingReceivableMemberwfsl:LandAcquisitionAndDevelopmentMemberus-gaap:CommercialPortfolioSegmentMember2019-09-300000936528wfsl:LandAcquisitionAndDevelopmentMemberus-gaap:CommercialPortfolioSegmentMemberus-gaap:NonperformingFinancingReceivableMember2019-09-300000936528us-gaap:PerformingFinancingReceivableMemberus-gaap:CommercialPortfolioSegmentMember2019-09-300000936528us-gaap:CommercialPortfolioSegmentMemberus-gaap:NonperformingFinancingReceivableMember2019-09-300000936528us-gaap:PerformingFinancingReceivableMembersrt:SingleFamilyMemberus-gaap:ConsumerPortfolioSegmentMember2019-09-300000936528srt:SingleFamilyMemberus-gaap:NonperformingFinancingReceivableMemberus-gaap:ConsumerPortfolioSegmentMember2019-09-300000936528us-gaap:PerformingFinancingReceivableMemberus-gaap:ConstructionLoansMemberus-gaap:ConsumerPortfolioSegmentMember2019-09-300000936528us-gaap:ConstructionLoansMemberus-gaap:NonperformingFinancingReceivableMemberus-gaap:ConsumerPortfolioSegmentMember2019-09-300000936528wfsl:LandConsumerLotLoansMemberus-gaap:PerformingFinancingReceivableMemberus-gaap:ConsumerPortfolioSegmentMember2019-09-300000936528wfsl:LandConsumerLotLoansMemberus-gaap:NonperformingFinancingReceivableMemberus-gaap:ConsumerPortfolioSegmentMember2019-09-300000936528us-gaap:HomeEquityMemberus-gaap:PerformingFinancingReceivableMemberus-gaap:ConsumerPortfolioSegmentMember2019-09-300000936528us-gaap:HomeEquityMemberus-gaap:NonperformingFinancingReceivableMemberus-gaap:ConsumerPortfolioSegmentMember2019-09-300000936528us-gaap:PerformingFinancingReceivableMemberus-gaap:ConsumerLoanMemberus-gaap:ConsumerPortfolioSegmentMember2019-09-300000936528us-gaap:NonperformingFinancingReceivableMemberus-gaap:ConsumerLoanMemberus-gaap:ConsumerPortfolioSegmentMember2019-09-300000936528us-gaap:PerformingFinancingReceivableMemberus-gaap:ConsumerPortfolioSegmentMember2019-09-300000936528us-gaap:NonperformingFinancingReceivableMemberus-gaap:ConsumerPortfolioSegmentMember2019-09-300000936528us-gaap:PerformingFinancingReceivableMember2019-09-300000936528us-gaap:NonperformingFinancingReceivableMember2019-09-300000936528wfsl:NonSingleFamilyMember2019-09-300000936528srt:SingleFamilyMember2019-09-300000936528us-gaap:FairValueInputsLevel1Memberus-gaap:FairValueMeasurementsRecurringMemberus-gaap:USTreasuryAndGovernmentMember2020-09-300000936528us-gaap:FairValueInputsLevel2Memberus-gaap:FairValueMeasurementsRecurringMemberus-gaap:USTreasuryAndGovernmentMember2020-09-300000936528us-gaap:FairValueMeasurementsRecurringMemberus-gaap:FairValueInputsLevel3Memberus-gaap:USTreasuryAndGovernmentMember2020-09-300000936528us-gaap:FairValueMeasurementsRecurringMemberus-gaap:USTreasuryAndGovernmentMember2020-09-300000936528us-gaap:FairValueInputsLevel1Memberus-gaap:AssetBackedSecuritiesMemberus-gaap:FairValueMeasurementsRecurringMember2020-09-300000936528us-gaap:FairValueInputsLevel2Memberus-gaap:AssetBackedSecuritiesMemberus-gaap:FairValueMeasurementsRecurringMember2020-09-300000936528us-gaap:AssetBackedSecuritiesMemberus-gaap:FairValueMeasurementsRecurringMemberus-gaap:FairValueInputsLevel3Member2020-09-300000936528us-gaap:AssetBackedSecuritiesMemberus-gaap:FairValueMeasurementsRecurringMember2020-09-300000936528us-gaap:FairValueInputsLevel1Memberus-gaap:MunicipalBondsMemberus-gaap:FairValueMeasurementsRecurringMember2020-09-300000936528us-gaap:FairValueInputsLevel2Memberus-gaap:MunicipalBondsMemberus-gaap:FairValueMeasurementsRecurringMember2020-09-300000936528us-gaap:MunicipalBondsMemberus-gaap:FairValueMeasurementsRecurringMemberus-gaap:FairValueInputsLevel3Member2020-09-300000936528us-gaap:MunicipalBondsMemberus-gaap:FairValueMeasurementsRecurringMember2020-09-300000936528us-gaap:FairValueInputsLevel1Memberus-gaap:CorporateDebtSecuritiesMemberus-gaap:FairValueMeasurementsRecurringMember2020-09-300000936528us-gaap:FairValueInputsLevel2Memberus-gaap:CorporateDebtSecuritiesMemberus-gaap:FairValueMeasurementsRecurringMember2020-09-300000936528us-gaap:CorporateDebtSecuritiesMemberus-gaap:FairValueMeasurementsRecurringMemberus-gaap:FairValueInputsLevel3Member2020-09-300000936528us-gaap:CorporateDebtSecuritiesMemberus-gaap:FairValueMeasurementsRecurringMember2020-09-300000936528us-gaap:FairValueInputsLevel1Memberus-gaap:MortgageBackedSecuritiesIssuedByUSGovernmentSponsoredEnterprisesMemberus-gaap:FairValueMeasurementsRecurringMember2020-09-300000936528us-gaap:FairValueInputsLevel2Memberus-gaap:MortgageBackedSecuritiesIssuedByUSGovernmentSponsoredEnterprisesMemberus-gaap:FairValueMeasurementsRecurringMember2020-09-300000936528us-gaap:MortgageBackedSecuritiesIssuedByUSGovernmentSponsoredEnterprisesMemberus-gaap:FairValueMeasurementsRecurringMemberus-gaap:FairValueInputsLevel3Member2020-09-300000936528us-gaap:MortgageBackedSecuritiesIssuedByUSGovernmentSponsoredEnterprisesMemberus-gaap:FairValueMeasurementsRecurringMember2020-09-300000936528us-gaap:FairValueInputsLevel1Memberus-gaap:FairValueMeasurementsRecurringMember2020-09-300000936528us-gaap:FairValueInputsLevel2Memberus-gaap:FairValueMeasurementsRecurringMember2020-09-300000936528us-gaap:FairValueMeasurementsRecurringMemberus-gaap:FairValueInputsLevel3Member2020-09-300000936528us-gaap:FairValueMeasurementsRecurringMember2020-09-300000936528us-gaap:FairValueInputsLevel1Memberus-gaap:InterestRateContractMemberus-gaap:FairValueMeasurementsRecurringMember2020-09-300000936528us-gaap:FairValueInputsLevel2Memberus-gaap:InterestRateContractMemberus-gaap:FairValueMeasurementsRecurringMember2020-09-300000936528us-gaap:InterestRateContractMemberus-gaap:FairValueMeasurementsRecurringMemberus-gaap:FairValueInputsLevel3Member2020-09-300000936528us-gaap:InterestRateContractMemberus-gaap:FairValueMeasurementsRecurringMember2020-09-300000936528us-gaap:FairValueInputsLevel1Memberwfsl:CommercialLoanHedgeMemberus-gaap:FairValueMeasurementsRecurringMember2020-09-300000936528us-gaap:FairValueInputsLevel2Memberwfsl:CommercialLoanHedgeMemberus-gaap:FairValueMeasurementsRecurringMember2020-09-300000936528wfsl:CommercialLoanHedgeMemberus-gaap:FairValueMeasurementsRecurringMemberus-gaap:FairValueInputsLevel3Member2020-09-300000936528wfsl:CommercialLoanHedgeMemberus-gaap:FairValueMeasurementsRecurringMember2020-09-300000936528us-gaap:FairValueInputsLevel1Memberwfsl:MortgageLoanHedgeMemberus-gaap:FairValueMeasurementsRecurringMember2020-09-300000936528us-gaap:FairValueInputsLevel2Memberwfsl:MortgageLoanHedgeMemberus-gaap:FairValueMeasurementsRecurringMember2020-09-300000936528wfsl:MortgageLoanHedgeMemberus-gaap:FairValueMeasurementsRecurringMemberus-gaap:FairValueInputsLevel3Member2020-09-300000936528wfsl:MortgageLoanHedgeMemberus-gaap:FairValueMeasurementsRecurringMember2020-09-300000936528wfsl:LongTermBorrowingHedgeMemberus-gaap:FairValueInputsLevel1Memberus-gaap:FairValueMeasurementsRecurringMember2020-09-300000936528wfsl:LongTermBorrowingHedgeMemberus-gaap:FairValueInputsLevel2Memberus-gaap:FairValueMeasurementsRecurringMember2020-09-300000936528wfsl:LongTermBorrowingHedgeMemberus-gaap:FairValueMeasurementsRecurringMemberus-gaap:FairValueInputsLevel3Member2020-09-300000936528wfsl:LongTermBorrowingHedgeMemberus-gaap:FairValueMeasurementsRecurringMember2020-09-300000936528us-gaap:FairValueInputsLevel1Memberus-gaap:FairValueMeasurementsRecurringMemberus-gaap:USTreasuryAndGovernmentMember2019-09-300000936528us-gaap:FairValueInputsLevel2Memberus-gaap:FairValueMeasurementsRecurringMemberus-gaap:USTreasuryAndGovernmentMember2019-09-300000936528us-gaap:FairValueMeasurementsRecurringMemberus-gaap:FairValueInputsLevel3Memberus-gaap:USTreasuryAndGovernmentMember2019-09-300000936528us-gaap:FairValueMeasurementsRecurringMemberus-gaap:USTreasuryAndGovernmentMember2019-09-300000936528us-gaap:FairValueInputsLevel1Memberus-gaap:AssetBackedSecuritiesMemberus-gaap:FairValueMeasurementsRecurringMember2019-09-300000936528us-gaap:FairValueInputsLevel2Memberus-gaap:AssetBackedSecuritiesMemberus-gaap:FairValueMeasurementsRecurringMember2019-09-300000936528us-gaap:AssetBackedSecuritiesMemberus-gaap:FairValueMeasurementsRecurringMemberus-gaap:FairValueInputsLevel3Member2019-09-300000936528us-gaap:AssetBackedSecuritiesMemberus-gaap:FairValueMeasurementsRecurringMember2019-09-300000936528us-gaap:FairValueInputsLevel1Memberus-gaap:MunicipalBondsMemberus-gaap:FairValueMeasurementsRecurringMember2019-09-300000936528us-gaap:FairValueInputsLevel2Memberus-gaap:MunicipalBondsMemberus-gaap:FairValueMeasurementsRecurringMember2019-09-300000936528us-gaap:MunicipalBondsMemberus-gaap:FairValueMeasurementsRecurringMemberus-gaap:FairValueInputsLevel3Member2019-09-300000936528us-gaap:MunicipalBondsMemberus-gaap:FairValueMeasurementsRecurringMember2019-09-300000936528us-gaap:FairValueInputsLevel1Memberus-gaap:CorporateDebtSecuritiesMemberus-gaap:FairValueMeasurementsRecurringMember2019-09-300000936528us-gaap:FairValueInputsLevel2Memberus-gaap:CorporateDebtSecuritiesMemberus-gaap:FairValueMeasurementsRecurringMember2019-09-300000936528us-gaap:CorporateDebtSecuritiesMemberus-gaap:FairValueMeasurementsRecurringMemberus-gaap:FairValueInputsLevel3Member2019-09-300000936528us-gaap:CorporateDebtSecuritiesMemberus-gaap:FairValueMeasurementsRecurringMember2019-09-300000936528us-gaap:FairValueInputsLevel1Memberus-gaap:MortgageBackedSecuritiesIssuedByUSGovernmentSponsoredEnterprisesMemberus-gaap:FairValueMeasurementsRecurringMember2019-09-300000936528us-gaap:FairValueInputsLevel2Memberus-gaap:MortgageBackedSecuritiesIssuedByUSGovernmentSponsoredEnterprisesMemberus-gaap:FairValueMeasurementsRecurringMember2019-09-300000936528us-gaap:MortgageBackedSecuritiesIssuedByUSGovernmentSponsoredEnterprisesMemberus-gaap:FairValueMeasurementsRecurringMemberus-gaap:FairValueInputsLevel3Member2019-09-300000936528us-gaap:MortgageBackedSecuritiesIssuedByUSGovernmentSponsoredEnterprisesMemberus-gaap:FairValueMeasurementsRecurringMember2019-09-300000936528us-gaap:FairValueInputsLevel1Memberus-gaap:FairValueMeasurementsRecurringMember2019-09-300000936528us-gaap:FairValueInputsLevel2Memberus-gaap:FairValueMeasurementsRecurringMember2019-09-300000936528us-gaap:FairValueMeasurementsRecurringMemberus-gaap:FairValueInputsLevel3Member2019-09-300000936528us-gaap:FairValueMeasurementsRecurringMember2019-09-300000936528us-gaap:FairValueInputsLevel1Memberus-gaap:InterestRateContractMemberus-gaap:FairValueMeasurementsRecurringMember2019-09-300000936528us-gaap:FairValueInputsLevel2Memberus-gaap:InterestRateContractMemberus-gaap:FairValueMeasurementsRecurringMember2019-09-300000936528us-gaap:InterestRateContractMemberus-gaap:FairValueMeasurementsRecurringMemberus-gaap:FairValueInputsLevel3Member2019-09-300000936528us-gaap:InterestRateContractMemberus-gaap:FairValueMeasurementsRecurringMember2019-09-300000936528us-gaap:FairValueInputsLevel1Memberwfsl:MortgageLoanHedgeMemberus-gaap:FairValueMeasurementsRecurringMember2019-09-300000936528us-gaap:FairValueInputsLevel2Memberwfsl:MortgageLoanHedgeMemberus-gaap:FairValueMeasurementsRecurringMember2019-09-300000936528wfsl:MortgageLoanHedgeMemberus-gaap:FairValueMeasurementsRecurringMemberus-gaap:FairValueInputsLevel3Member2019-09-300000936528wfsl:MortgageLoanHedgeMemberus-gaap:FairValueMeasurementsRecurringMember2019-09-300000936528us-gaap:FairValueInputsLevel1Memberwfsl:CommercialLoanHedgeMemberus-gaap:FairValueMeasurementsRecurringMember2019-09-300000936528us-gaap:FairValueInputsLevel2Memberwfsl:CommercialLoanHedgeMemberus-gaap:FairValueMeasurementsRecurringMember2019-09-300000936528wfsl:CommercialLoanHedgeMemberus-gaap:FairValueMeasurementsRecurringMemberus-gaap:FairValueInputsLevel3Member2019-09-300000936528wfsl:CommercialLoanHedgeMemberus-gaap:FairValueMeasurementsRecurringMember2019-09-300000936528wfsl:LongTermBorrowingHedgeMemberus-gaap:FairValueInputsLevel1Memberus-gaap:FairValueMeasurementsRecurringMember2019-09-300000936528wfsl:LongTermBorrowingHedgeMemberus-gaap:FairValueInputsLevel2Memberus-gaap:FairValueMeasurementsRecurringMember2019-09-300000936528wfsl:LongTermBorrowingHedgeMemberus-gaap:FairValueMeasurementsRecurringMemberus-gaap:FairValueInputsLevel3Member2019-09-300000936528wfsl:LongTermBorrowingHedgeMemberus-gaap:FairValueMeasurementsRecurringMember2019-09-300000936528wfsl:ImpairedLoansMemberus-gaap:FairValueInputsLevel1Memberus-gaap:FairValueMeasurementsNonrecurringMember2020-09-300000936528us-gaap:FairValueInputsLevel2Memberwfsl:ImpairedLoansMemberus-gaap:FairValueMeasurementsNonrecurringMember2020-09-300000936528wfsl:ImpairedLoansMemberus-gaap:FairValueMeasurementsNonrecurringMemberus-gaap:FairValueInputsLevel3Member2020-09-300000936528wfsl:ImpairedLoansMemberus-gaap:FairValueMeasurementsNonrecurringMember2020-09-300000936528wfsl:ImpairedLoansMemberus-gaap:FairValueMeasurementsNonrecurringMemberus-gaap:ChangeDuringPeriodFairValueDisclosureMember2019-10-012020-09-300000936528us-gaap:FairValueInputsLevel1Memberus-gaap:FairValueMeasurementsNonrecurringMemberwfsl:RealEstateOwnedMember2020-09-300000936528us-gaap:FairValueInputsLevel2Memberus-gaap:FairValueMeasurementsNonrecurringMemberwfsl:RealEstateOwnedMember2020-09-300000936528us-gaap:FairValueMeasurementsNonrecurringMemberwfsl:RealEstateOwnedMemberus-gaap:FairValueInputsLevel3Member2020-09-300000936528us-gaap:FairValueMeasurementsNonrecurringMemberwfsl:RealEstateOwnedMember2020-09-300000936528us-gaap:FairValueMeasurementsNonrecurringMemberus-gaap:ChangeDuringPeriodFairValueDisclosureMemberwfsl:RealEstateOwnedMember2019-10-012020-09-300000936528us-gaap:FairValueInputsLevel1Memberus-gaap:FairValueMeasurementsNonrecurringMember2020-09-300000936528us-gaap:FairValueInputsLevel2Memberus-gaap:FairValueMeasurementsNonrecurringMember2020-09-300000936528us-gaap:FairValueMeasurementsNonrecurringMemberus-gaap:FairValueInputsLevel3Member2020-09-300000936528us-gaap:FairValueMeasurementsNonrecurringMember2020-09-300000936528us-gaap:FairValueMeasurementsNonrecurringMemberus-gaap:ChangeDuringPeriodFairValueDisclosureMember2019-10-012020-09-300000936528wfsl:ImpairedLoansMemberus-gaap:FairValueInputsLevel1Memberus-gaap:FairValueMeasurementsNonrecurringMember2019-09-300000936528us-gaap:FairValueInputsLevel2Memberwfsl:ImpairedLoansMemberus-gaap:FairValueMeasurementsNonrecurringMember2019-09-300000936528wfsl:ImpairedLoansMemberus-gaap:FairValueMeasurementsNonrecurringMemberus-gaap:FairValueInputsLevel3Member2019-09-300000936528wfsl:ImpairedLoansMemberus-gaap:FairValueMeasurementsNonrecurringMember2019-09-300000936528wfsl:ImpairedLoansMemberus-gaap:FairValueMeasurementsNonrecurringMemberus-gaap:ChangeDuringPeriodFairValueDisclosureMember2018-10-012019-09-300000936528us-gaap:FairValueInputsLevel1Memberus-gaap:FairValueMeasurementsNonrecurringMemberwfsl:RealEstateOwnedMember2019-09-300000936528us-gaap:FairValueInputsLevel2Memberus-gaap:FairValueMeasurementsNonrecurringMemberwfsl:RealEstateOwnedMember2019-09-300000936528us-gaap:FairValueMeasurementsNonrecurringMemberwfsl:RealEstateOwnedMemberus-gaap:FairValueInputsLevel3Member2019-09-300000936528us-gaap:FairValueMeasurementsNonrecurringMemberwfsl:RealEstateOwnedMember2019-09-300000936528us-gaap:FairValueMeasurementsNonrecurringMemberus-gaap:ChangeDuringPeriodFairValueDisclosureMemberwfsl:RealEstateOwnedMember2018-10-012019-09-300000936528us-gaap:FairValueInputsLevel1Memberus-gaap:FairValueMeasurementsNonrecurringMember2019-09-300000936528us-gaap:FairValueInputsLevel2Memberus-gaap:FairValueMeasurementsNonrecurringMember2019-09-300000936528us-gaap:FairValueMeasurementsNonrecurringMemberus-gaap:FairValueInputsLevel3Member2019-09-300000936528us-gaap:FairValueMeasurementsNonrecurringMember2019-09-300000936528us-gaap:FairValueMeasurementsNonrecurringMemberus-gaap:ChangeDuringPeriodFairValueDisclosureMember2018-10-012019-09-300000936528us-gaap:FairValueInputsLevel1Memberus-gaap:CarryingReportedAmountFairValueDisclosureMember2020-09-300000936528us-gaap:FairValueInputsLevel1Memberus-gaap:EstimateOfFairValueFairValueDisclosureMember2020-09-300000936528us-gaap:FairValueInputsLevel1Memberus-gaap:CarryingReportedAmountFairValueDisclosureMember2019-09-300000936528us-gaap:FairValueInputsLevel1Memberus-gaap:EstimateOfFairValueFairValueDisclosureMember2019-09-300000936528us-gaap:FairValueInputsLevel2Memberus-gaap:CarryingReportedAmountFairValueDisclosureMemberus-gaap:USTreasuryAndGovernmentMember2020-09-300000936528us-gaap:FairValueInputsLevel2Memberus-gaap:EstimateOfFairValueFairValueDisclosureMemberus-gaap:USTreasuryAndGovernmentMember2020-09-300000936528us-gaap:FairValueInputsLevel2Memberus-gaap:CarryingReportedAmountFairValueDisclosureMemberus-gaap:USTreasuryAndGovernmentMember2019-09-300000936528us-gaap:FairValueInputsLevel2Memberus-gaap:EstimateOfFairValueFairValueDisclosureMemberus-gaap:USTreasuryAndGovernmentMember2019-09-300000936528us-gaap:FairValueInputsLevel2Memberus-gaap:AssetBackedSecuritiesMemberus-gaap:CarryingReportedAmountFairValueDisclosureMember2020-09-300000936528us-gaap:FairValueInputsLevel2Memberus-gaap:EstimateOfFairValueFairValueDisclosureMemberus-gaap:AssetBackedSecuritiesMember2020-09-300000936528us-gaap:FairValueInputsLevel2Memberus-gaap:AssetBackedSecuritiesMemberus-gaap:CarryingReportedAmountFairValueDisclosureMember2019-09-300000936528us-gaap:FairValueInputsLevel2Memberus-gaap:EstimateOfFairValueFairValueDisclosureMemberus-gaap:AssetBackedSecuritiesMember2019-09-300000936528us-gaap:FairValueInputsLevel2Memberus-gaap:CarryingReportedAmountFairValueDisclosureMemberus-gaap:MunicipalBondsMember2020-09-300000936528us-gaap:FairValueInputsLevel2Memberus-gaap:EstimateOfFairValueFairValueDisclosureMemberus-gaap:MunicipalBondsMember2020-09-300000936528us-gaap:FairValueInputsLevel2Memberus-gaap:CarryingReportedAmountFairValueDisclosureMemberus-gaap:MunicipalBondsMember2019-09-300000936528us-gaap:FairValueInputsLevel2Memberus-gaap:EstimateOfFairValueFairValueDisclosureMemberus-gaap:MunicipalBondsMember2019-09-300000936528us-gaap:FairValueInputsLevel2Memberus-gaap:CorporateDebtSecuritiesMemberus-gaap:CarryingReportedAmountFairValueDisclosureMember2020-09-300000936528us-gaap:FairValueInputsLevel2Memberus-gaap:EstimateOfFairValueFairValueDisclosureMemberus-gaap:CorporateDebtSecuritiesMember2020-09-300000936528us-gaap:FairValueInputsLevel2Memberus-gaap:CorporateDebtSecuritiesMemberus-gaap:CarryingReportedAmountFairValueDisclosureMember2019-09-300000936528us-gaap:FairValueInputsLevel2Memberus-gaap:EstimateOfFairValueFairValueDisclosureMemberus-gaap:CorporateDebtSecuritiesMember2019-09-300000936528us-gaap:FairValueInputsLevel2Memberus-gaap:CarryingReportedAmountFairValueDisclosureMemberus-gaap:MortgageBackedSecuritiesIssuedByUSGovernmentSponsoredEnterprisesMember2020-09-300000936528us-gaap:FairValueInputsLevel2Memberus-gaap:EstimateOfFairValueFairValueDisclosureMemberus-gaap:MortgageBackedSecuritiesIssuedByUSGovernmentSponsoredEnterprisesMember2020-09-300000936528us-gaap:FairValueInputsLevel2Memberus-gaap:CarryingReportedAmountFairValueDisclosureMemberus-gaap:MortgageBackedSecuritiesIssuedByUSGovernmentSponsoredEnterprisesMember2019-09-300000936528us-gaap:FairValueInputsLevel2Memberus-gaap:EstimateOfFairValueFairValueDisclosureMemberus-gaap:MortgageBackedSecuritiesIssuedByUSGovernmentSponsoredEnterprisesMember2019-09-300000936528us-gaap:CarryingReportedAmountFairValueDisclosureMember2020-09-300000936528us-gaap:EstimateOfFairValueFairValueDisclosureMember2020-09-300000936528us-gaap:CarryingReportedAmountFairValueDisclosureMember2019-09-300000936528us-gaap:EstimateOfFairValueFairValueDisclosureMember2019-09-300000936528us-gaap:CarryingReportedAmountFairValueDisclosureMemberus-gaap:CommercialMortgageBackedSecuritiesMember2020-09-300000936528us-gaap:EstimateOfFairValueFairValueDisclosureMemberus-gaap:CommercialMortgageBackedSecuritiesMember2020-09-300000936528us-gaap:CarryingReportedAmountFairValueDisclosureMemberus-gaap:CommercialMortgageBackedSecuritiesMember2019-09-300000936528us-gaap:EstimateOfFairValueFairValueDisclosureMemberus-gaap:CommercialMortgageBackedSecuritiesMember2019-09-300000936528us-gaap:CarryingReportedAmountFairValueDisclosureMemberus-gaap:FairValueInputsLevel3Member2020-09-300000936528us-gaap:EstimateOfFairValueFairValueDisclosureMemberus-gaap:FairValueInputsLevel3Member2020-09-300000936528us-gaap:CarryingReportedAmountFairValueDisclosureMemberus-gaap:FairValueInputsLevel3Member2019-09-300000936528us-gaap:EstimateOfFairValueFairValueDisclosureMemberus-gaap:FairValueInputsLevel3Member2019-09-300000936528us-gaap:FairValueInputsLevel2Memberus-gaap:CarryingReportedAmountFairValueDisclosureMember2020-09-300000936528us-gaap:FairValueInputsLevel2Memberus-gaap:EstimateOfFairValueFairValueDisclosureMember2020-09-300000936528us-gaap:FairValueInputsLevel2Memberus-gaap:CarryingReportedAmountFairValueDisclosureMember2019-09-300000936528us-gaap:FairValueInputsLevel2Memberus-gaap:EstimateOfFairValueFairValueDisclosureMember2019-09-300000936528us-gaap:FairValueInputsLevel2Memberus-gaap:CarryingReportedAmountFairValueDisclosureMemberus-gaap:InterestRateContractMember2020-09-300000936528us-gaap:FairValueInputsLevel2Memberus-gaap:EstimateOfFairValueFairValueDisclosureMemberus-gaap:InterestRateContractMember2020-09-300000936528us-gaap:FairValueInputsLevel2Memberus-gaap:CarryingReportedAmountFairValueDisclosureMemberus-gaap:InterestRateContractMember2019-09-300000936528us-gaap:FairValueInputsLevel2Memberus-gaap:EstimateOfFairValueFairValueDisclosureMemberus-gaap:InterestRateContractMember2019-09-300000936528us-gaap:FairValueInputsLevel2Memberus-gaap:CarryingReportedAmountFairValueDisclosureMemberwfsl:MortgageLoanHedgeMember2020-09-300000936528us-gaap:FairValueInputsLevel2Memberus-gaap:EstimateOfFairValueFairValueDisclosureMemberwfsl:MortgageLoanHedgeMember2020-09-300000936528us-gaap:FairValueInputsLevel2Memberus-gaap:CarryingReportedAmountFairValueDisclosureMemberwfsl:MortgageLoanHedgeMember2019-09-300000936528us-gaap:FairValueInputsLevel2Memberus-gaap:EstimateOfFairValueFairValueDisclosureMemberwfsl:MortgageLoanHedgeMember2019-09-300000936528us-gaap:FairValueInputsLevel2Memberwfsl:CommercialLoanHedgeMemberus-gaap:CarryingReportedAmountFairValueDisclosureMember2020-09-300000936528us-gaap:FairValueInputsLevel2Memberus-gaap:EstimateOfFairValueFairValueDisclosureMemberwfsl:CommercialLoanHedgeMember2020-09-300000936528us-gaap:FairValueInputsLevel2Memberwfsl:CommercialLoanHedgeMemberus-gaap:CarryingReportedAmountFairValueDisclosureMember2019-09-300000936528us-gaap:FairValueInputsLevel2Memberus-gaap:EstimateOfFairValueFairValueDisclosureMemberwfsl:CommercialLoanHedgeMember2019-09-300000936528wfsl:LongTermBorrowingHedgeMemberus-gaap:FairValueInputsLevel2Memberus-gaap:CarryingReportedAmountFairValueDisclosureMember2020-09-300000936528wfsl:LongTermBorrowingHedgeMemberus-gaap:FairValueInputsLevel2Memberus-gaap:EstimateOfFairValueFairValueDisclosureMember2020-09-300000936528wfsl:LongTermBorrowingHedgeMemberus-gaap:FairValueInputsLevel2Memberus-gaap:CarryingReportedAmountFairValueDisclosureMember2019-09-300000936528wfsl:LongTermBorrowingHedgeMemberus-gaap:FairValueInputsLevel2Memberus-gaap:EstimateOfFairValueFairValueDisclosureMember2019-09-300000936528us-gaap:InterestRateContractMemberus-gaap:OtherAssetsMember2020-09-300000936528us-gaap:OtherLiabilitiesMemberus-gaap:InterestRateContractMember2020-09-300000936528wfsl:CommercialLoanHedgeMemberus-gaap:OtherAssetsMember2020-09-300000936528wfsl:CommercialLoanHedgeMemberus-gaap:OtherLiabilitiesMember2020-09-300000936528wfsl:MortgageLoanHedgeMemberus-gaap:OtherAssetsMember2020-09-300000936528us-gaap:OtherLiabilitiesMemberwfsl:MortgageLoanHedgeMember2020-09-300000936528wfsl:LongTermBorrowingHedgeMemberus-gaap:OtherAssetsMember2020-09-300000936528wfsl:LongTermBorrowingHedgeMemberus-gaap:OtherLiabilitiesMember2020-09-300000936528us-gaap:OtherAssetsMember2020-09-300000936528us-gaap:OtherLiabilitiesMember2020-09-300000936528us-gaap:InterestRateContractMemberus-gaap:OtherAssetsMember2019-09-300000936528us-gaap:OtherLiabilitiesMemberus-gaap:InterestRateContractMember2019-09-300000936528wfsl:CommercialLoanHedgeMemberus-gaap:OtherAssetsMember2019-09-300000936528wfsl:CommercialLoanHedgeMemberus-gaap:OtherLiabilitiesMember2019-09-300000936528wfsl:MortgageLoanHedgeMemberus-gaap:OtherAssetsMember2019-09-300000936528us-gaap:OtherLiabilitiesMemberwfsl:MortgageLoanHedgeMember2019-09-300000936528wfsl:LongTermBorrowingHedgeMemberus-gaap:OtherAssetsMember2019-09-300000936528wfsl:LongTermBorrowingHedgeMemberus-gaap:OtherLiabilitiesMember2019-09-300000936528us-gaap:OtherAssetsMember2019-09-300000936528us-gaap:OtherLiabilitiesMember2019-09-300000936528us-gaap:LoansReceivableMember2020-09-300000936528us-gaap:LoansReceivableMemberwfsl:MortgageLoanHedgeMember2020-09-300000936528wfsl:MortgageLoanHedgeMember2020-09-300000936528wfsl:CommercialLoanHedgeMemberus-gaap:LoansReceivableMember2020-09-300000936528wfsl:CommercialLoanHedgeMember2020-09-300000936528us-gaap:LoansReceivableMember2019-09-300000936528us-gaap:LoansReceivableMemberwfsl:MortgageLoanHedgeMember2019-09-300000936528wfsl:MortgageLoanHedgeMember2019-09-300000936528wfsl:CommercialLoanHedgeMemberus-gaap:LoansReceivableMember2019-09-300000936528wfsl:CommercialLoanHedgeMember2019-09-300000936528srt:WeightedAverageMember2019-10-012020-09-300000936528us-gaap:CashFlowHedgingMemberwfsl:InterestRateContractPayFixedReceiveFloatingSwapMember2019-10-012020-09-300000936528us-gaap:CashFlowHedgingMemberwfsl:InterestRateContractPayFixedReceiveFloatingSwapMember2018-10-012019-09-300000936528us-gaap:CashFlowHedgingMember2019-10-012020-09-300000936528us-gaap:CashFlowHedgingMember2018-10-012019-09-300000936528us-gaap:InterestRateContractMemberwfsl:InterestIncomeLoansReceivableMemberus-gaap:FairValueHedgingMember2019-10-012020-09-300000936528us-gaap:InterestRateContractMemberwfsl:InterestIncomeLoansReceivableMemberus-gaap:FairValueHedgingMember2018-10-012019-09-300000936528us-gaap:CashFlowHedgingMemberus-gaap:InterestRateContractMemberwfsl:InterestExpenseFHLBAdvancesMember2019-10-012020-09-300000936528us-gaap:CashFlowHedgingMemberus-gaap:InterestRateContractMemberwfsl:InterestExpenseFHLBAdvancesMember2018-10-012019-09-300000936528wfsl:RelatedPartyLoanMember2020-09-300000936528wfsl:NoninterestIncomeOtherOperatingIncomeMemberwfsl:InterestRateContractPayFixedReceiveFloatingSwapMember2019-10-012020-09-300000936528wfsl:NoninterestIncomeOtherOperatingIncomeMemberwfsl:InterestRateContractPayFixedReceiveFloatingSwapMember2018-10-012019-09-300000936528wfsl:NoninterestIncomeOtherOperatingIncomeMemberwfsl:InterestRateContractReceiveFixedPayFloatingSwapMember2019-10-012020-09-300000936528wfsl:NoninterestIncomeOtherOperatingIncomeMemberwfsl:InterestRateContractReceiveFixedPayFloatingSwapMember2018-10-012019-09-300000936528us-gaap:InterestRateContractMember2019-10-012020-09-300000936528us-gaap:InterestRateContractMember2018-10-012019-09-300000936528us-gaap:FinanceReceivablesMember2020-09-300000936528us-gaap:FinanceReceivablesMember2019-09-300000936528us-gaap:MortgageBackedSecuritiesMember2020-09-300000936528us-gaap:MortgageBackedSecuritiesMember2019-09-300000936528us-gaap:DebtSecuritiesMember2020-09-300000936528us-gaap:DebtSecuritiesMember2019-09-300000936528us-gaap:LandMember2020-09-300000936528us-gaap:LandMember2019-09-300000936528us-gaap:BuildingMembersrt:MinimumMember2019-10-012020-09-300000936528us-gaap:BuildingMembersrt:MaximumMember2019-10-012020-09-300000936528us-gaap:BuildingMember2020-09-300000936528us-gaap:BuildingMember2019-09-300000936528us-gaap:LeaseholdImprovementsMembersrt:MinimumMember2019-10-012020-09-300000936528us-gaap:LeaseholdImprovementsMembersrt:MaximumMember2019-10-012020-09-300000936528us-gaap:LeaseholdImprovementsMember2020-09-300000936528us-gaap:LeaseholdImprovementsMember2019-09-300000936528wfsl:FurnitureFixturesAndEquipmentMembersrt:MinimumMember2019-10-012020-09-300000936528wfsl:FurnitureFixturesAndEquipmentMembersrt:MaximumMember2019-10-012020-09-300000936528wfsl:FurnitureFixturesAndEquipmentMember2020-09-300000936528wfsl:FurnitureFixturesAndEquipmentMember2019-09-300000936528srt:FederalHomeLoanBankOfDesMoinesMember2019-10-012020-09-3000009365282018-01-012020-09-3000009365282018-10-012020-09-300000936528wfsl:A2020IncentivePlanMember2020-09-300000936528us-gaap:EmployeeStockOptionMember2019-10-012020-09-300000936528us-gaap:EmployeeStockOptionMember2020-09-300000936528srt:MinimumMemberus-gaap:RestrictedStockMember2019-10-012020-09-300000936528srt:MaximumMemberus-gaap:RestrictedStockMember2019-10-012020-09-300000936528us-gaap:RestrictedStockMember2020-09-300000936528us-gaap:RestrictedStockMember2019-10-012020-09-300000936528us-gaap:RestrictedStockMember2019-09-300000936528us-gaap:RestrictedStockMember2018-09-300000936528us-gaap:RestrictedStockMember2017-09-300000936528us-gaap:RestrictedStockMember2018-10-012019-09-300000936528us-gaap:RestrictedStockMember2017-10-012018-09-300000936528srt:ParentCompanyMember2020-09-300000936528srt:SubsidiariesMember2020-09-300000936528srt:ParentCompanyMember2019-09-300000936528srt:SubsidiariesMember2019-09-300000936528srt:WeightedAverageMember2018-10-012019-09-300000936528us-gaap:WarrantMember2019-10-012020-09-300000936528us-gaap:WarrantMember2018-10-012019-09-300000936528us-gaap:WarrantMember2017-10-012018-09-300000936528us-gaap:StockOptionMember2019-10-012020-09-300000936528us-gaap:StockOptionMember2018-10-012019-09-300000936528us-gaap:StockOptionMember2017-10-012018-09-300000936528srt:ParentCompanyMember2019-10-012020-09-300000936528srt:ParentCompanyMember2018-10-012019-09-300000936528srt:ParentCompanyMember2017-10-012018-09-300000936528srt:ParentCompanyMember2018-09-300000936528srt:ParentCompanyMember2017-09-3000009365282019-10-012019-12-3100009365282020-01-012020-03-3100009365282020-04-012020-06-3000009365282020-07-012020-09-3000009365282018-10-012018-12-3100009365282019-01-012019-03-3100009365282019-04-012019-06-3000009365282019-07-012019-09-3000009365282020-03-3100009365282020-11-17
WASHINGTON FEDERAL, INC. AND SUBSIDIARIES
2020 ANNUAL REPORT
Table of Contents
WASHINGTON FEDERAL, INC. AND SUBSIDIARIES
2020 ANNUAL REPORT
BUSINESS DESCRIPTION
Washington Federal Bank, National Association, a federally-insured national bank dba WaFd Bank (the “Bank” or “WaFd Bank”), was founded on April 24, 1917 in Ballard, Washington and is engaged primarily in providing lending, depository, insurance and other banking services to consumers, mid-sized to large businesses, and owners and developers of commercial real estate. Washington Federal, Inc., a Washington corporation (the “Company”), was formed as the Bank’s holding company in November, 1994. As used throughout this document, the terms “Washington Federal” or the “Company” refer to the Company and its consolidated subsidiaries, including the Bank, and the term “Bank” refers to the operating subsidiary, Washington Federal Bank, National Association. The Company is headquartered in Seattle, Washington.
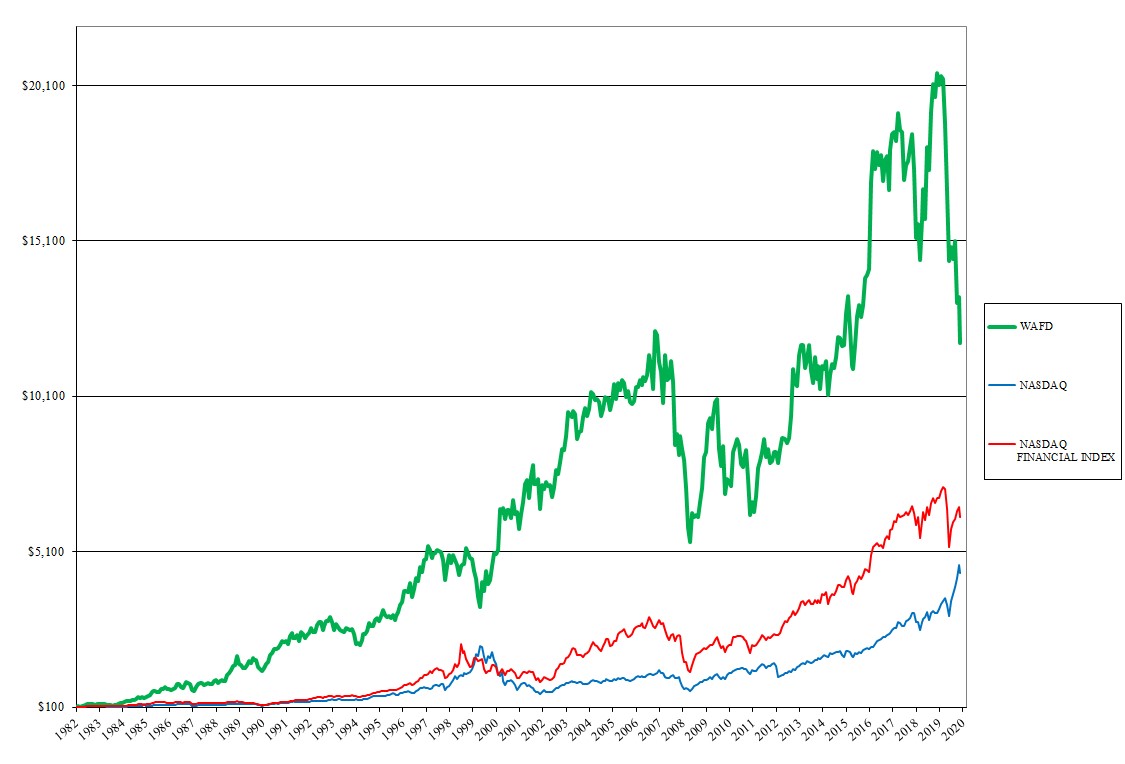
On November 9, 1982 the Company listed and began trading on the NASDAQ. Profitable operations have been recorded every year since and the Company ranks in the top 15% of the 100 largest publicly traded U.S. banks in terms of common equity tier 1 capital strength. As of September 30, 2020, the stock traded at 56 times its original 1982 offering price, has paid 150 consecutive quarterly cash dividends and has returned 10,114% total shareholder return to those who invested 37 years ago.
Over the years, the Company has expanded to serve banking clients across much of the western United States. While much has changed since its founding, one constant has been the commitment to doing business with integrity, serving our communities and treating employees, clients and investors fairly.
We strive toward having a powerful and diverse team of employees, knowing we are better together with our combined wisdom and intellect. With a commitment to equality, inclusion and workplace diversity, we focus on understanding, accepting, and valuing the differences between people. To accomplish this, we have established a Diversity & Inclusion Advisory Council made up of 15 employee representatives throughout our footprint. We continued our commitment to equal employment opportunity through a robust affirmative action plan which includes annual compensation analyses and ongoing reviews of our selection and hiring practices alongside a continued focus on building and maintaining a diverse workforce.
Corporate Social and Environmental Responsibility
We recognize the social and environmental responsibility that arises from the impact of our activities on peoples’ lives and society as a whole. The Company's Corporate and Social Environmental Policy integrates social, environmental and ethical concerns into our daily business activities and our approach to stakeholder relationships. Below is a summary of our community activities in 2020.
WASHINGTON FEDERAL, INC. AND SUBSIDIARIES
2020 ANNUAL REPORT
FINANCIAL HIGHLIGHTS
| | | | | | | | | | | |
| As of and for the year end September 30, | 2020 | 2019 | % Change |
| (In thousands, except per share and ratio data) |
| Assets | $ | 18,794,055 | | $ | 16,474,910 | | +14.1% |
| Cash and cash equivalents | 1,702,977 | | 419,158 | | +306.3 |
| Investment securities | 1,281,240 | | 503,183 | | +154.6 |
| Loans receivable, net | 12,792,317 | | 11,930,575 | | +7.2 |
| Mortgage-backed securities | 1,674,090 | | 2,426,039 | | (31.0) |
| Customer deposits | 13,779,624 | | 11,990,764 | | +14.9 |
| FHLB advances and other borrowings | 2,700,000 | | 2,250,000 | | +20.0 |
| Shareholders’ equity | 2,014,133 | | 2,032,995 | | (0.9) |
| Net income | 173,438 | | 210,256 | | (17.5) |
| Diluted earnings per share | 2.26 | | 2.61 | | (13.4) |
| Dividends per share | 0.87 | | 0.79 | | +10.1 |
| Shareholders’ equity per share | 26.61 | | 25.79 | | +3.2 |
| Shares outstanding | 75,689 | | 78,841 | | (4.0) |
| Return on average shareholders’ equity | 8.63 | % | 10.46 | % | (17.5) |
| Return on average assets | 1.00 | | 1.28 | | (21.9) |
| Efficiency ratio (1) (2) | 58.99 | | 52.09 | | +13.2 |
(1)Calculated as total operating costs divided by net interest income, plus other income (excluding non-operating gains)
(2)Efficiency ratio for the year ended September 30, 2020 excludes the impact of $31,600,000 gain on sales of fixed assets and $5,900,000 impairment charge on computer hardware and software.
WASHINGTON FEDERAL, INC. AND SUBSIDIARIES
2020 ANNUAL REPORT
ANNUAL REPORT 2020
Fellow Shareholder,
Fiscal 2020 was a challenging yet invigorating year for your Company, Washington Federal. Net income for the year was $173,438,000, a 17.5% decrease from the record $210,256,000 generated last year. Earnings per share, perhaps the most important measure of performance for shareholders, decreased to $2.26 per share, 13.4% lower than the previous $2.61 achieved in 2019. As for our stock price, it feels like we are on a seesaw. Two years ago, our stock price was at $32.00, then last year we experienced a nice increase to $36.99. This year, the stock took a significant hit, closing the fiscal year at $20.86. Why this kind of volatility for a bank that has shown consistent profitability for so long? The answer, we believe, is the world-wide pandemic that materialized this past year and the resulting economic fallout, along with continuing speculation as to what the future will hold.
We are pleased to be done with fiscal 2020 and look forward to a bright future. Earnings were down primarily as a result of lower interest rates, increased credit costs and higher operating costs. The Federal Reserve’s lowering of interest rates to near zero resulted in one of the most challenging interest rate environments in our 103-year history. Not only did our floating rate assets reprice downward, but we experienced record prepayment and refinancing of long-term assets. For example, today's market interest rate for 30-year mortgages is at 2.75%, a rate never before seen, and this has impacted top line revenue for both our loans and investments. Next, as a result of the impacts of the COVID-19 pandemic, including record unemployment, there is a great deal of uncertainty regarding future credit quality. In response, we increased our credit loss allowance from $138 million to $192 million, a 39% increase. Lastly, investments we made to improve our client experience, operations and compliance increased operating expenses by $32 million or 11%.
Despite this being an incredibly challenging year, I am very proud of what our team has accomplished and happy to share some of the Company’s achievements. First, we reported record growth in transaction deposit accounts, up $2.7 billion or 38%. Second, our incredible teams produced record loan production of $6.2 billion, up $2.1 billion or 51%. Third, our net promoter score (a measure of how likely our customers are to recommend us to others) improved to 51, up from 17 just four years ago. We are pleased to see our customers appreciate the investments we've made in mobile banking, website and customer services.
Our strategic objective is to significantly change the mix of our deposit accounts, away from higher cost certificates of deposits to lower-cost transaction accounts. In this regard, 2020 was a blockbuster year for the bank. Transaction deposit accounts increased by $2.7 billion or 38%. This is the result of improvements to our product offerings and the opportunity created by the Federal Reserve flooding the market with liquidity in response to the pandemic.
I believe that what we are currently experiencing is a generational opportunity for WaFd Bankers. It is difficult to get a strong business to re-evaluate their banking relationship. Inertia can be a powerful force. The pandemic provided an opportunity for your bank to “walk the talk” and be nimble in working to meet the needs of clients when other banks were indecisive. Tangible results included originating over 6,500 Small Business Administration (“SBA”) Paycheck Protection Program (“PPP”) loans in the span of four weeks. That is even more impressive when one considers we had never previously made an SBA loan and just under 50% of the loans were made to new clients of WaFd. We have already seen substantial benefit in earning new commercial business and believe we will have significant opportunities for years to come.
Looking forward, we have substantial operating leverage. For example, as of September 30, 2020, the $1.7 billion in cash on our balance sheet was earning only 0.10%. If we are able to deploy that into loans (earning 2.75% or better) that would increase net interest income by around 10%. Undoubtedly, there are significant risks on the horizon, including future tax rates, the depth and duration of the recession, and health risks from the COVID-19 pandemic, but on balance we see meaningful opportunities to profitably grow the bank, particularly with strong projected net economic and population growth in the markets we serve.
Our culture is foundational to who we are at WaFd Bank. This year we took action for change to better promote social equity. Your company has formed a Diversity and Inclusion Committee made up of numerous employees that is setting goals to improve social awareness, community outreach and career development. We are old fashioned in the respect that we believe a publicly traded bank can do good in its communities, deliver for its clients and post a solid return for shareholders. The way the bank came together as a team during this tumultuous year was truly impressive. Titles were checked at the door as bankers were working side-by-side, literally fifteen to twenty hours a day, to provide PPP loans to small businesses desperate for funds to keep their people employed during the economic shut down. As a result, we have grateful clients and engaged employees that understand that banking done right is a noble profession.
Let me conclude by saying that there is a bright future for your company. It is my opinion that the market may have oversold bank stocks and left them undervalued. Our stock is trading below tangible book value, indicating investors are clearly worried about future credit costs. The yield on our market capitalization is 10.7%. The last time our stock was trading at these levels (as compared to tangible book value) was during the Great Recession (2008-2010), when we experienced record loan charge-offs. The market may be missing the fact that, unlike the Great Recession when real estate values fell dramatically, real estate values during the pandemic have so far been increasing. Over 83% of our loan portfolio is secured by real estate. At year end,
WASHINGTON FEDERAL, INC. AND SUBSIDIARIES
2020 ANNUAL REPORT
residential mortgages were our largest loan category with $5.3 billion outstanding, or 37% of the portfolio. Based on recent valuation estimates, we believe that our current loan-to-value ratio is less than 40% on that portfolio. Circumstances may change, but based on what we know today, we do not see near-term significant loan losses coming from our residential real estate loan portfolio.
Due to health concerns, we will be holding a virtual annual shareholder meeting via the Internet this year, on January 26, 2021, at 2 p.m. PST. In the meantime, we invite you to help our business grow and prosper by referring your friends, neighbors, and business associates to WaFd Bank for all their banking needs. We look forward to serving you in the coming new year.
Sincerely,
Brent J. Beardall
President and Chief Executive Officer
Back row from left to right: Ryan Mauer, Executive Vice President & Chief Credit Officer; Vince Beatty, Executive Vice President & Chief Financial Officer; Cathy Cooper, Executive Vice President Retail Banking; James Endrizzi, Executive Vice President Commercial Banking
Front row from left to right: Brent Beardall, President & Chief Executive Officer; Kim Robison, Executive Vice President Operations
MANAGEMENT'S DISCUSSION AND ANALYSIS OF FINANCIAL CONDITION AND RESULTS OF OPERATIONS
We make statements in this Annual Report that constitute forward-looking statements. Words such as “expects,” “anticipates,” “believes,” “estimates,” “intends,” “forecasts,” “projects” and other similar expressions, as well as future or conditional verbs such as “will,” “should,” “would” and “could,” are intended to help identify such forward-looking statements. These statements are not historical facts, but instead represent current expectations, plans or forecasts of the Company and are based on the beliefs and assumptions of the management of the Company and the information available to management at the time that these disclosures were prepared. The Company intends for all such forward-looking statements to be covered by the safe harbor provisions for forward-looking statements within the meaning of the Private Securities Litigation Reform Act of 1995 and the provisions of Section 27A of the Securities Act of 1933 and Section 21E of the Securities Exchange Act of 1934. These statements are not guarantees of future results or performance and involve certain risks, uncertainties and assumptions that are difficult to predict and often are beyond the Company's control. Actual outcomes and results may differ materially from those expressed in, or implied by, the Company's forward-looking statements.
You should not place undue reliance on any forward-looking statement and should consider the following uncertainties and risks, as well as the risks and uncertainties discussed elsewhere in this report, and under "Item 1A. Risk Factors” contained in our Form 10-K for the fiscal year ended September 30, 2020, and in any of the Company's other subsequent Securities and Exchange Commission filings, which could cause our future results to differ materially from the plans, objectives, goals, estimates, intentions and expectations expressed in forward-looking statements:
•a deterioration in economic conditions, including declines in the real estate market and home sale volumes and financial stress on borrowers as a result of the uncertain economic environment;
•the effects of natural or man-made disasters, calamities, or conflicts, including terrorist events and pandemics (such as the COVID-19 pandemic), including on our asset credit quality and business operations, as well as its impact on general economic and financial market conditions;
•the effects of a severe economic downturn, including high unemployment rates and declines in housing prices and property values, in the Company's primary market areas;
•the effects of and changes in monetary and fiscal policies of the Board of Governors of the Federal Reserve System and the U.S. Government, including responses to the COVID-19 pandemic;
•fluctuations in interest rate risk and changes in market interest rates, including risk related to LIBOR reform and risk of negative rates;
•the Company's ability to make accurate assumptions and judgments about the collectability of its loan portfolio, including the creditworthiness of its borrowers and the value of the assets securing these loans;
•legislative and regulatory limitations, including those arising under the Dodd-Frank Act and potential limitations in the manner in which the Company conducts its business and undertakes new investments and activities;
•the ability of the Company to obtain external financing to fund its operations or obtain this financing on favorable terms;
•changes in other economic, competitive, governmental, regulatory, and technological factors affecting the Company's markets, assets, liabilities, operations, pricing, products, services and fees;
•the success of the Company at managing the risks involved in the remediation efforts associated with its Bank Secrecy Act ("BSA") program, costs of enhancements to the Bank’s BSA program are greater than anticipated; and governmental authorities undertake enforcement actions or legal proceedings with respect to the Bank’s BSA program beyond those contemplated by the Consent Order, and the potential impact of such matters on the success, timing and ability to pursue the Company’s growth or other business initiatives;
•the success of the Company at managing the risks involved in the remediation efforts associated with its Home Mortgage Disclosure Act (“HMDA”) compliance and reporting, costs of enhancements to the Bank’s HMDA program are greater than anticipated; and governmental authorities undertake enforcement actions or legal proceedings with respect to the Bank’s HMDA program beyond those contemplated by the Consent Orders that have been entered into with the Consumer Financial Protection Bureau (the “CFPB”);
•the success of the Company at managing the risks involved in the foregoing and managing its business; and
•the timing and occurrence or non-occurrence of events that may be subject to circumstances beyond the Company's control.
All forward-looking statements speak only as of the date on which such statements are made, and the Company undertakes no obligation to update or revise any forward-looking statements to reflect changed assumptions, the occurrence of unanticipated events, changes to future operating results over time, or the impact of circumstances arising after the date the forward-looking statement was made.
MANAGEMENT'S DISCUSSION AND ANALYSIS OF FINANCIAL CONDITION AND RESULTS OF OPERATIONS
GENERAL
Washington Federal Bank, National Association, a federally-insured national bank dba WaFd Bank (the “Bank” or “WaFd Bank”), was founded on April 24, 1917 in Ballard, Washington and is engaged primarily in providing lending, depository, insurance and other banking services to consumers, mid-sized to large businesses, and owners and developers of commercial real estate. Washington Federal, Inc., a Washington corporation (the “Company”), was formed as the Bank’s holding company in November, 1994. As used throughout this document, the terms “Washington Federal” or the “Company” refer to the Company and its consolidated subsidiaries, including the Bank, and the term “Bank” refers to the operating subsidiary, Washington Federal Bank, National Association. The Company is headquartered in Seattle, Washington.
The Company's fiscal year end is September 30. All references to 2020, 2019 and 2018 represent balances as of September 30, 2020, September 30, 2019, and September 30, 2018, or activity for the fiscal years then ended.
CRITICAL ACCOUNTING POLICIES
The Company has determined that the only accounting policy critical to an understanding of its consolidated financial statements relates to the methodology for determining the amount of the allowance for credit losses (“ACL”). The Company maintains an allowance based on the expected credit losses over the contractual life of the loan portfolio as well as unfunded loan commitments. The allowance is based on ongoing, quarterly assessments by management.
The ACL consists of the allowance for loan losses and the reserve for unfunded commitments. In June 2016, the FASB issued ASU 2016-13, Financial Instruments - Credit Losses (“ASC 326”). The ASC, as amended, is intended to provide financial statement users with more decision-useful information about the expected credit losses on financial instruments that are not accounted for at fair value through net income.
The Company early adopted ASC 326 during its third fiscal quarter of 2020 and based on the application of the modified retrospective method it became effective on October 1, 2019 for all financial assets measured at amortized cost (primarily loans receivable and held-to-maturity debt securities) and off-balance-sheet credit exposures. Results for reporting periods beginning after October 1, 2019 are presented under ASC 326 while prior period amounts continue to be reported in accordance with previously applicable GAAP. The Company recorded a decrease to retained earnings of $21,945,000 as of October 1, 2019 for the cumulative effect of adopting ASC 326.
As a result of our adoption of ASC 326, our methodology for estimating the ACL changed significantly from September 30, 2019. The adoption of this standard affects all interim periods for fiscal year 2020, and resulted in an adoption impact as of October 1, 2019 as noted above. The standard replaced the “incurred loss” approach with an “expected loss” approach known as current expected credit loss (“CECL”). The CECL methodology requires an estimate of the credit losses expected over the life of an exposure (or pool of exposures) and it removes the incurred loss methodology’s threshold that delayed the recognition of a credit loss until it was “probable” a loss event was deemed to be “incurred.”
The estimate of expected credit losses under the CECL methodology is based on relevant information about past events, current conditions, and reasonable and supportable forecasts that affect the collectability of the reported amounts. Historical loss experience is generally the starting point for estimating expected credit losses. We then consider whether the historical loss experience should be adjusted for asset-specific risk characteristics or current conditions at the reporting date that did not exist over the period from which historical experience was based. Finally, we consider forecasts about future economic conditions or changes in collateral values that are reasonable and supportable.
Management’s determination of the amount of the ACL is a critical accounting estimate as it requires significant reliance on the credit risk we ascribe to individual borrowers, the use of estimates and significant judgment as to the amount and timing of expected future cash flows on individually evaluated loans, significant reliance on historical loss rates on homogenous portfolios, consideration of our quantitative and qualitative evaluation of past events, current conditions, and reasonable and supportable forecasts that affect the collectability of the reported amounts.
Going forward, the impact of utilizing the CECL methodology to calculate the ACL will be significantly influenced by the composition, characteristics and quality of our loan portfolio, as well as the prevailing economic conditions and forecasts utilized. Material changes to these and other relevant factors may result in greater volatility to the allowance for credit losses, and therefore, greater volatility in our reported earnings. See Notes A, B, D and E to the Consolidated Financial Statements and
MANAGEMENT'S DISCUSSION AND ANALYSIS OF FINANCIAL CONDITION AND RESULTS OF OPERATIONS
the “Asset Quality and Allowance for Credit Losses” section below for more information on loans receivable and the allowance for credit losses.
INTEREST RATE RISK
The primary source of income for the Company is net interest income, which is the difference between the interest income generated by interest-earning assets and the interest expense incurred for interest-bearing liabilities. The level of net interest income is a function of the average balance of interest-earning assets and interest-bearing liabilities and the difference between the yield on earning assets and the cost of interest-bearing liabilities. Both the pricing and mix of the Company's interest-earning assets and interest-bearing liabilities influence these factors. All else being equal, if the interest rates on the Company's interest-bearing liabilities increase at a faster pace than the interest rates on its interest-earning assets, the result would be a reduction in net interest income and with it, a reduction in net earnings.
Based on management's assessment of the current interest rate environment, the Company has taken steps, including growing commercial loans having shorter average lives and transaction deposit accounts, to position itself for changing interest rates.
The Company's balance sheet strategy, in conjunction with controlled operating costs, has allowed the Company to manage interest rate risk, within guidelines established by the Board of Directors, through all interest rate cycles. It is management's objective to grow the dollar amount of net interest income through the rate cycles, acknowledging that there will be some periods of time when that will not be feasible.
Management relies on various measures of interest rate risk, including modeling of changes in the Company's forecasted net interest income under various rate change scenarios, the impact of interest rate changes on the net portfolio value ("NPV") and an asset/liability maturity gap analysis.
Net Interest Income Sensitivity. We estimate the sensitivity of our net interest income to changes in market interest rates using an interest rate simulation model that includes assumptions related to the level of balance sheet growth, deposit repricing characteristics and the rate of prepayments for multiple interest rate change scenarios. Interest rate sensitivity depends on certain repricing characteristics in our interest-earning assets and interest-bearing liabilities, including the maturity structure of assets and liabilities and their repricing characteristics during the periods of changes in market interest rates. The analysis assumes a constant balance sheet. Actual results would differ from the assumptions used in this model, as management monitors and adjusts loan and deposit pricing and the size and composition of the balance sheet to respond to changing interest rates.
In the event of an immediate and parallel increase of 200 basis points in both short- and long-term interest rates, the model estimates that net interest income would increase by 3.4% in the next year. This compares to an estimated decrease of 1.4% as of the September 30, 2019 analysis. It is noted that a flattening yield curve where the spread between short-term rates and long-term rates decreases would likely result in lower net interest income and vice versa. Management estimates that a gradual increase of 300 basis points in short-term rates and 100 basis points in long-term rates over two years would result in a 1.1% increase in net interest income in the first year and an increase of 3.1% in the second year, assuming a constant balance sheet and no management intervention.
NPV Sensitivity. The NPV is an estimate of the market value of shareholders' equity at a point in time. It is derived by calculating the difference between the present value of expected cash flows from interest-earning assets and the present value of expected cash flows from interest-paying liabilities and off-balance-sheet contracts. The sensitivity of the NPV to changes in interest rates provides a longer term view of interest rate risk as it incorporates all future expected cash flows. As of September 30, 2020, in the event of an immediate and parallel increase of 200 basis points in interest rates, the NPV is estimated to increase by $141,000,000, or 5.3%, and the NPV-to-total assets ratio to rise to 15.6% from a base of 14.1%. As of September 30, 2019, in the event of an immediate and parallel increase of 200 basis points in interest rates, the NPV was estimated to decline by $257,637,561, or 10.5%, and the NPV-to-total assets ratio to drop to 13.9% from a base of 14.6%. The change in the sensitivity of the NPV ratio to this assumed change in interest rates is primarily due to the decline in interest rates as a result of the Federal Reserve Bank's actions in response to the COVID-19 pandemic and changes in balance sheet mix year over year.
Interest Rate Spread. The interest rate spread is measured as the difference between the rate on interest-earning assets and the rate on interest-bearing liabilities at the end of each period. The interest rate spread was 2.34% at September 30, 2020 and 2.80% at September 30, 2019. As of September 30, 2020, the weighted average rate on interest-earning assets decreased by 107
MANAGEMENT'S DISCUSSION AND ANALYSIS OF FINANCIAL CONDITION AND RESULTS OF OPERATIONS
basis points to 3.03% compared to September 30, 2019. The lower rate on interest-earning assets is due primarily to the rapid drop in short-term rates by the Federal Reserve Bank in response to the COVID-19 pandemic which resulted in variable rate loans decreasing in yield and repayments of fixed rate loans with higher yields than newly originated loans, as well as prepayments of fixed rate mortgage-backed securities at higher rates than those on newly purchased mortgage-backed securities and other investments. As of September 30, 2020, the weighted average rate on interest-bearing liabilities decreased by 61 basis points to 0.69% compared to September 30, 2019. The lower rate on interest-bearing liabilities is also due primarily to the rapid drop in short-term rates by the Federal Reserve Bank described above. This resulted in a drop in interest rates on customer deposits and short-term FHLB borrowings. The interest rate spread for the last eight fiscal quarters is shown below:
| | | | | | | | | | | | | | | | | | | | | | | | | | | | | | | | | | | | | | | | | | | | | | | |
| SEP 2020 | | JUN 2020 | | MAR 2020 | | DEC 2019 | | SEP 2019 | | JUN 2019 | | MAR 2019 | | DEC 2018 |
| Interest rate on loans and mortgage-backed securities | 3.55 | % | | 3.62 | % | | 4.06 | % | | 4.17 | % | | 4.25 | % | | 4.32 | % | | 4.32 | % | | 4.28 | % |
| Interest rate on other interest-earning assets | 0.63 | | | 0.73 | | | 0.76 | | | 2.00 | | | 2.10 | | | 2.37 | | | 2.33 | | | 2.25 | |
| Combined, all interest-earning assets | 3.03 | | | 3.21 | | | 3.59 | | | 4.00 | | | 4.10 | | | 4.21 | | | 4.20 | | | 4.17 | |
| Interest rate on customer accounts | 0.48 | | | 0.57 | | | 0.77 | | | 1.02 | | | 1.08 | | | 1.13 | | | 1.09 | | | 0.99 | |
| Interest rate on borrowings | 1.79 | | | 1.49 | | | 1.37 | | | 2.46 | | | 2.49 | | | 2.58 | | | 2.77 | | | 2.75 | |
| Combined cost of funds | 0.69 | | | 0.73 | | | 0.89 | | | 1.24 | | | 1.30 | | | 1.39 | | | 1.39 | | | 1.31 | |
| Interest rate spread | 2.34 | % | | 2.48 | % | | 2.70 | % | | 2.76 | % | | 2.80 | % | | 2.82 | % | | 2.81 | % | | 2.86 | % |
The chart below shows the volatility of our period end net interest spread (dashed line measured against the right axis) compared to the relatively consistent growth in net interest income (solid line measured against the left axis). The relative consistency of net interest income is accomplished by actively managing the size and composition of the balance sheet through different rate cycles.
Net Interest Margin. The net interest margin is measured using net interest income divided by average interest-earning assets for the period. The net interest margin decreased to 2.93% for the year ended September 30, 2020, from 3.16% for the year ended September 30, 2019. The yield on interest-earning assets decreased 56 basis points to 3.86% and the cost of interest-
MANAGEMENT'S DISCUSSION AND ANALYSIS OF FINANCIAL CONDITION AND RESULTS OF OPERATIONS
bearing liabilities decreased by 35 basis points to 1.15%. The lower yield on interest-earning assets is due primarily to the rapid drop in short-term rates by the Federal Reserve Bank in response to the COVID-19 pandemic which resulted in variable rate loans decreasing in yield and repayments on fixed rate loans with higher yields than newly originated loans, as well as prepayments of fixed rate mortgage-backed securities at higher rates than those on newly purchased mortgage-backed securities and other investments. This was also affected by the origination of low-yield SBA Payroll Protection Program ("PPP") loans. The lower cost on interest-bearing liabilities is due primarily to the rapid drop in short-term rates by the Federal Reserve Bank in response to the COVID-19 pandemic which resulted in a drop in interest rates on customer deposits and short-term FHLB borrowings.
For the year ended September 30, 2020, average interest-earning assets increased by 5.6% to $16,050,130,000, up from $15,203,819,000 for the year ended September 30, 2019. During 2020, average loans receivable increased $451,950,000, or 3.8%, while the combined average balances of mortgage-backed securities, other investment securities and cash increased by $394,413,000 or 12.1%. Management views organic loan growth as the highest and best use of capital; thus the focus on primarily growing loans receivable.
During 2020, average interest-bearing customer deposit accounts increased $449,012,000 or 4.4% and the average balance of FHLB borrowings decreased by $1,294,000, or 0.1%, from 2019.
The following table sets forth the information explaining the changes in the net interest income and net interest margin for 2020 compared to the prior year.
| | | | | | | | | | | | | | | | | | | | | | | | | | | | | | | | | | | |
| Twelve Months Ended September 30, 2020 | | Twelve Months Ended September 30, 2019 |
| | Average Balance | | Interest | | Average Rate | | Average Balance | | Interest | | Average Rate |
| ($ in thousands) | | ($ in thousands) |
| Assets | | | | | | | | | | | |
| Loans receivable | $ | 12,266,430 | | | $ | 545,708 | | | 4.44 | % | | $ | 11,814,480 | | | $ | 568,096 | | | 4.81 | % |
| Mortgage-backed securities | 2,060,804 | | | 49,312 | | | 2.39 | | | 2,554,653 | | | 74,485 | | | 2.92 | |
| Cash & investments | 1,587,602 | | | 20,112 | | | 1.26 | | | 699,340 | | | 22,290 | | | 3.19 | |
| FHLB & FRB stock | 135,294 | | | 6,133 | | | 4.52 | | | 135,346 | | | 6,595 | | | 4.87 | |
| Total interest-earning assets | 16,050,130 | | | 621,265 | | | 3.86 | % | | 15,203,819 | | | 671,466 | | | 4.42 | % |
| Other assets | 1,254,061 | | | | | | | 1,160,302 | | | | | |
| Total assets | $ | 17,304,191 | | | | | | | $ | 16,364,121 | | | | | |
| | | | | | | | | | | |
| Liabilities and Equity | | | | | | | | | | | |
| Interest-bearing customer accounts | $ | 10,647,044 | | | $ | 100,312 | | | 0.94 | % | | $ | 10,198,032 | | | $ | 122,216 | | | 1.20 | % |
| FHLB advances | 2,532,596 | | | 51,445 | | | 2.03 | | | 2,533,890 | | | 68,190 | | | 2.69 | |
| Other borrowings | 19 | | | — | | | 0.46 | | | — | | | — | | | — | |
| Total interest-bearing liabilities | 13,179,659 | | | 151,757 | | | 1.15 | % | | 12,731,922 | | | 190,406 | | | 1.50 | % |
| Noninterest-bearing customer accounts | 1,870,032 | | | | | | | 1,465,110 | | | | | |
| Other liabilities | 244,203 | | | | | | | 156,557 | | | | | |
| Total liabilities | 15,293,894 | | | | | | | 14,353,589 | | | | | |
| Shareholders' equity | 2,010,297 | | | | | | | 2,010,532 | | | | | |
| Total liabilities and equity | $ | 17,304,191 | | | | | | | $ | 16,364,121 | | | | | |
| Net interest income | | | $ | 469,508 | | | | | | | $ | 481,060 | | | |
| Net interest margin | | | | | 2.93 | % | | | | | | 3.16 | % |
MANAGEMENT'S DISCUSSION AND ANALYSIS OF FINANCIAL CONDITION AND RESULTS OF OPERATIONS
ASSET QUALITY & ALLOWANCE FOR CREDIT LOSSES
The Company maintains an ACL for the expected credit losses over the contractual life of the loan portfolio as well as unfunded loan commitments. The amount of ACL is based on ongoing, quarterly assessments by management.
The ACL consists of the allowance for loan losses and the reserve for unfunded commitments. The estimate of expected credit losses under the CECL methodology is based on relevant information about past events, current conditions, and reasonable and supportable forecasts that affect the collectability of the reported amounts. Historical loss experience is generally the starting point for estimating expected credit losses. We then consider whether the historical loss experience should be adjusted for asset-specific risk characteristics or current conditions at the reporting date that did not exist over the period that historical experience was based for each loan type. Finally, we consider forecasts about future economic conditions or changes in collateral values that are reasonable and supportable.
Portfolio segment is defined as the level at which an entity develops and documents a systematic methodology to determine its ACL. The Company has designated two loan portfolio segments, commercial loans and consumer loans. These loan portfolio segments are further disaggregated into classes, which represent loans of similar type, risk characteristics, and methods for monitoring and assessing credit risk. The commercial loan portfolio segment is disaggregated into five classes: multi-family, commercial real estate, commercial and industrial, construction, and land acquisition and development. The risk of loss for the commercial loan portfolio segment is generally most indicated by the credit risk rating assigned to each borrower. Commercial loan risk ratings are determined by experienced senior credit officers based on specific facts and circumstances and are subject to periodic review by an independent internal team of credit specialists. The consumer loan portfolio segment is disaggregated into five classes: single-family-residential mortgage, custom construction, consumer lot loans, home equity lines of credit, and other consumer. The risk of loss for the consumer loan portfolio segment is generally most indicated by delinquency status and general economic factors. Each commercial and consumer loan portfolio class may also be further segmented based on risk characteristics.
For most of our loan portfolio classes, the historical loss experience is determined using a cohort methodology. This method pools loans into groups (“cohorts”) sharing similar risk characteristics and tracks each cohort’s net charge-offs over the lives of the loans to calculate a historical loss rate. The historical loss rates for each cohort are then averaged to calculate an overall historical loss rate which is applied to the current loan balance to arrive at the quantitative baseline portion of the allowance for credit losses for the respective loan portfolio class. For certain loan portfolio classes, the Company determined there was not sufficient historical loss information to calculate a meaningful historical loss rate using the cohort methodology. For any such loan portfolio class, the weighted-average remaining maturity (“WARM”) methodology is being utilized until sufficient historical loss data is obtained. The WARM method multiplies an average annual loss rate by the expected remaining life of the loan pool to arrive at the quantitative baseline portion of the allowance for credit losses for the respective loan portfolio class.
The Company also considers qualitative adjustments to the historical loss rate for each loan portfolio class. The qualitative adjustments for each loan class are split into two components: 1) asset or class specific risk characteristics or current conditions at the reporting date related to portfolio credit quality, remaining payments, volume and nature, credit culture and management, business environment or other management factors as compared to the periods for which historical loss experience was used to arrive at the quantitative portion of the ACL and 2) reasonable and supportable forecast of future economic conditions and collateral values.
The Company performs a quarterly asset quality review which includes a review of forecasted gross charge-offs and recoveries, nonperforming assets, criticized loans, risk rating migration, delinquencies, etc. The asset quality review is performed by management and the results are used to consider a qualitative overlay to the quantitative baseline. The second qualitative adjustment noted above, economic conditions and collateral values, encompasses a one-year reasonable and supportable forecast period. The overlay adjustment for the reasonable and supportable forecast assumes an immediate reversion after the one-year forecast period to historical loss rates for the remaining life of the respective loan pool.
When management deems it to be appropriate, the Company establishes a specific reserve for individually evaluated loans that do not share similar risk characteristics with the loans included in each respective loan pool. These individually evaluated loans are removed from their respective pools and typically represent collateral dependent loans but may also include other non-performing loans or troubled debt restructurings (“TDRs”). In addition, the Company individually evaluates “reasonably
MANAGEMENT'S DISCUSSION AND ANALYSIS OF FINANCIAL CONDITION AND RESULTS OF OPERATIONS
expected” TDRs, which are identified by the Company as a loan expected to be classified as a TDR within the next six months. Management judgment is utilized to make this determination.
The allowance for loan losses increased by $35,421,000, or 26.93%, from $131,534,000 as of September 30, 2019, to $166,955,000 at September 30, 2020. As of September 30, 2020, the allowance of $166,955,000 is for loans that are evaluated on a pooled basis, which was comprised of $115,457,000 related to the quantitative component and $51,498,000 related to management's qualitative overlays.
As a result of the adoption of ASC 326 in 2020, which had an effective date of October 1, 2019, there is a lack of comparability in both the reserves and provisions for credit losses for the periods presented. Results for reporting periods beginning after October 1, 2019 are presented using the CECL methodology, while comparative period information continues to be reported in accordance with the incurred loss methodology in effect for prior fiscal years. The following table shows the Company’s allowance for credit losses.
| | | | | | | | | | | | | | | | | | | | | | | | | | | |
| September 30, 2019
(Before ASC 326 Adoption) | | CECL Adoption Impact | | October 1, 2019 | | | | | | September 30, 2020 |
| (In thousands) | | | | | | | |
| Allowance for credit losses: | | | | | | | | | | | |
| Commercial loans | | | | | | | | | | | |
| Multi-family | $ | 7,391 | | | $ | 3,013 | | | $ | 10,404 | | | | | | | $ | 13,853 | |
| Commercial real estate | 13,170 | | | (146) | | | 13,024 | | | | | | | 22,516 | |
| Commercial & industrial | 31,450 | | | 785 | | | 32,235 | | | | | | | 38,665 | |
| Construction | 32,304 | | | (9,536) | | | 22,768 | | | | | | | 24,156 | |
| Land - acquisition & development | 9,155 | | | 1,749 | | | 10,904 | | | | | | | 10,733 | |
| Total commercial loans | 93,470 | | | (4,135) | | | 89,335 | | | | | | | 109,923 | |
| Consumer loans | | | | | | | | | | | |
| Single-family residential | 30,988 | | | 16,783 | | | 47,771 | | | | | | | 45,186 | |
| Construction - custom | 1,369 | | | 1,511 | | | 2,880 | | | | | | | 3,555 | |
| Land - consumer lot loans | 2,143 | | | 492 | | | 2,635 | | | | | | | 2,729 | |
| HELOC | 1,103 | | | 945 | | | 2,048 | | | | | | | 2,571 | |
| Consumer | 2,461 | | | 2,154 | | | 4,615 | | | | | | | 2,991 | |
| Total consumer loans | 38,064 | | | 21,885 | | | 59,949 | | | | | | | 57,032 | |
| Total allowance for loan losses | 131,534 | | | 17,750 | | | 149,284 | | | | | | | 166,955 | |
| Reserve for unfunded commitments | 6,900 | | | 10,750 | | | 17,650 | | | | | | | 25,000 | |
| Total allowance for credit losses | $ | 138,434 | | | $ | 28,500 | | | $ | 166,934 | | | | | | | $ | 191,955 | |
| | | | | | | | | | | |
| | | | | | | | | | | |
| | | | | | | | | | | |
| | | | | | | | | | | |
| | | | | | | | | | | |
| | | | | | | | | | | |
| | | | | | | | | | | |
| | | | | | | | | | | |
| | | | | | | | | | | |
| | | | | | | | | | | |
The reserve for unfunded commitments represents the expected lifetime credit losses on off-balance sheet obligations such as commitments to extend credit and standby letters of credit. However, a liability is not recognized for commitments that are unconditionally cancellable by the Company. The reserve for unfunded commitments is determined by estimating future draws, including the effects of risk mitigation actions, and applying the expected loss rates on those draws. Loss rates are estimated by utilizing the same loss rates calculated for the allowance for credit losses related to the respective loan portfolio class. Unfunded commitments tend to vary depending on the Company's loan mix and the proportionate share of commercial loans. The reserve for unfunded loan commitments was $25,000,000 as of September 30, 2020, compared to $6,900,000 as of September 30, 2019.
The Company recorded a provision for credit losses of $21,750,000 in 2020 due primarily to the COVID-19 pandemic including estimated impacts to the energy, hospitality, restaurant and senior living industries. For the year ended September 30, 2020, net recoveries were $3,271,000, compared to $3,577,000 in the prior year. No allowance was recorded as of September 30, 2020 for the $745,081,000 of PPP loans, which are included in the commercial & industrial loan category, due to the
MANAGEMENT'S DISCUSSION AND ANALYSIS OF FINANCIAL CONDITION AND RESULTS OF OPERATIONS
government guarantee. The ratio of the total ACL to total gross loans was 1.33% as of September 30, 2020, and 1.04% as of September 30, 2019. Management believes the total ACL is sufficient to absorb estimated losses inherent in the portfolio of loans and unfunded commitments.
The recovery of the carrying value of loans is susceptible to future market conditions beyond the Company's control, which may result in losses or recoveries differing from those estimated.
Troubled debt restructured loans (TDRs). TDRs are reserved for under the Company's CECL methodology. Most TDRs are performing and accruing loans where the borrower has proactively approached the Company about modifications due to temporary financial difficulties. Each request is individually evaluated for merit and likelihood of success. The concession for these loans is typically a payment reduction through a rate reduction of 100 to 200 basis points for a specific term, usually six to twelve months. Interest-only payments may also be approved during the modification period.
The balance of outstanding TDRs decreased to $91,408,000 as of September 30, 2020, from $121,677,000 as of September 30, 2019. As of September 30, 2020, 97.4% of TDR loans were performing. During 2020, there were additions of $424,000 and reductions of $30,693,000 due to prepayments and transfers to real estate owned ("REO"). As of September 30, 2020, 93.6% of TDRs are comprised of single-family residential loans.
Concessions for construction, land A&D and multi-family loans are typically an extension of maturity combined with a rate reduction of normally 100 basis points. Before granting approval to modify a loan in a TDR, a borrower’s ability to repay is considered by evaluating current income levels, debt-to-income ratio, credit score, loan payment history and an updated evaluation of the secondary repayment source.
If a loan is on non-accrual status before becoming a TDR, it will stay on non-accrual status following restructuring until it has been performing for at least six months, at which point it may be moved to accrual status. If a loan is on accrual status before it becomes a TDR, and it is concluded that a full repayment is highly probable, it will remain on accrual status following restructuring. If the homogeneous restructured loan does not perform, it is placed in non-accrual status when it is 90 days delinquent. For commercial loans, six consecutive payments on newly restructured loan terms are required prior to returning the loan to accrual status. After the required six consecutive payments are made, a management assessment may conclude that collection of the entire principal and interest due is still in doubt. In those instances, the loan will remain on non-accrual. A loan that defaults and is subsequently modified would impact the Company's delinquency trend, which is part of the qualitative risk factors component of the CECL methodology. Any modified loan that re-defaults and is charged-off would impact the quantitative component of the CECL methodology.
Non-performing assets. Non-performing assets were $37,695,000, or 0.20% of total assets, at September 30, 2020, compared to $43,826,000, or 0.27% of total assets, at September 30, 2019.
MANAGEMENT'S DISCUSSION AND ANALYSIS OF FINANCIAL CONDITION AND RESULTS OF OPERATIONS
The following table provides detail related to the Company's non-performing assets.
| | | | | | | | | | | | | | | | | | | | | | | | | | |
| | | September 30, | | | | |
| Non-Performing Assets | | 2020 | | 2019 | | $ Change | | % Change |
| | | (In thousands) | | |
| Non-accrual loans: | | | | | | | | |
| Multi-family | | $ | — | | | $ | — | | | $ | — | | | — | % |
| Commercial real estate | | 3,771 | | | 5,835 | | | (2,064) | | | (35.4) | |
| Commercial & industrial | | 329 | | | 1,292 | | | (963) | | | (74.5) | |
| Construction | | 1,669 | | | — | | | 1,669 | | | 100.0 | |
| Land - acquisition & development | | — | | | 169 | | | (169) | | | (100.0) | |
| Single-family residential | | 22,431 | | | 25,271 | | | (2,840) | | | (11.2) | |
| Construction - custom | | — | | | — | | | — | | | — | % |
| Land - consumer lot loans | | 243 | | | 246 | | | (3) | | | (1.2) | |
| HELOC | | 553 | | | 907 | | | (354) | | | (39.0) | |
| Consumer | | 60 | | | 11 | | | 49 | | | 445.5 | |
| Total non-accrual loans | | 29,056 | | | 33,731 | | | (4,675) | | | (13.9) | |
| Real estate owned | | 4,966 | | | 6,781 | | | (1,815) | | | (26.8) | |
| Other property owned | | 3,673 | | | 3,314 | | | 359 | | | 10.8 | |
| Total non-performing assets | | $ | 37,695 | | | $ | 43,826 | | | $ | (6,131) | | | (14.0) | % |
The ratio of the allowance for loan losses to non-accrual loans increased to 575% as of September 30, 2020, from 390% as of September 30, 2019.
MANAGEMENT'S DISCUSSION AND ANALYSIS OF FINANCIAL CONDITION AND RESULTS OF OPERATIONS
LIQUIDITY AND CAPITAL RESOURCES
The principal sources of funds for the Company's activities are loan repayments (including prepayments), net deposit inflows, repayments and sales of investments, borrowings and retained earnings. The Company's principal sources of revenue are interest on loans and interest and dividends on investments.
The Company's shareholders' equity at September 30, 2020, was $2,014,133,000, or 10.72% of total assets, as compared to $2,032,995,000, or 12.34% of total assets, at September 30, 2019. The Company's shareholders' equity was impacted in the year by net income of $173,438,000, the payment of $66,496,000 in cash dividends, $112,133,000 of treasury stock purchases, as well as other comprehensive income of $1,661,000. The Company paid out 38.3% of its 2020 earnings in cash dividends to common shareholders, compared with 30.1% last year. For the year ended September 30, 2020, the Company returned 103% of net income to shareholders in the form of cash dividends and share repurchases as compared to 89% for the year ended September 30, 2019. Share repurchases were temporarily suspended during 2020 due to the COVID-19 pandemic. Management believes the Company's strong net worth position allows it to manage balance sheet risk and provide the capital support needed for controlled growth in a regulated environment.
The Bank has a credit line with the Federal Home Loan Bank of Des Moines ("FHLB") up to 45% of total assets depending on specific collateral eligibility. This line provides a substantial source of additional liquidity if needed. As of September 30, 2020, the Bank had $1,375,553,000 of additional borrowing capacity at the FHLB.
The Bank has entered into borrowing agreements with the FHLB to borrow funds under a short-term floating rate cash management advance program and fixed-rate term advance agreements. All borrowings are secured by stock of the FHLB, deposits with the FHLB, and a blanket pledge of qualifying loans receivable as provided in the agreements with the FHLB. The Bank is also eligible to borrow under the Federal Reserve Bank's primary credit program.
The Company's cash and cash equivalents were $1,702,977,000 at September 30, 2020, which is a 306.3% increase from the balance of $419,158,000 as of September 30, 2019. This increase was primarily due to the $1,788,860,000 increase in customer deposits. See “Changes in Financial Condition” below and the “Statement of Cash Flows” included in the financial statements for additional details regarding this change.
MANAGEMENT'S DISCUSSION AND ANALYSIS OF FINANCIAL CONDITION AND RESULTS OF OPERATIONS
CHANGES IN FINANCIAL CONDITION
Cash and cash equivalents: Cash and cash equivalents increased to $1,702,977,000 at September 30, 2020, as compared to $419,158,000 at September 30, 2019. The change was primarily due to the $1,788,860,000 increase in customer accounts.
Available-for-sale investment securities: Available-for-sale securities increased $763,750,000, or 51.4%, during the year ended September 30, 2020, to $2,249,492,000, primarily due to $374,680,000 of securities reclassified from held-to-maturity pursuant to the adoption of ASU 2019-04 and purchases of $1,064,815,000, partially offset by principal repayments of $493,402,000 and sales of $204,351,000. As of September 30, 2020, the Company had a net unrealized gain on available-for-sale securities of $39,393,000, which is recorded net of tax as part of shareholders' equity.
The Company adopted ASC 326 and the CECL model effective on October 1, 2019 with application to all interim periods in fiscal year 2020. Substantially all of the Company’s available-for-sale debt securities are issued by U.S. government agencies or U.S. government-sponsored enterprises. These securities carry the explicit and/or implicit guarantee of the U.S. government and have a long history of zero credit loss. The Company does not believe that any of its available-for-sale debt securities had credit loss impairment upon adoption of ASC 326 on October 1, 2019 or as of September 30, 2020, therefore, no allowance was recorded. The impact going forward will depend on the composition, characteristics, and credit quality of the loan and securities portfolios as well as the economic conditions at future reporting periods.
Held-to-maturity investment securities: Held-to-maturity securities decreased by $737,642,000, or 51.1%, during the year ended September 30, 2020, to $705,838,000 primarily due to $374,680,000 of securities reclassified to available-for-sale pursuant to the adoption of ASU 2019-04 and principal repayments and maturities of $356,532,000. There were no held-to-maturity securities purchased or sold during the year ended September 30, 2020. Rising interest rates may cause these securities to be subject to unrealized losses. As of September 30, 2020, the net unrealized gain on held-to-maturity securities was $21,530,000, which management attributes to the change of interest rates since acquisition.
The Company adopted ASC 326 and the CECL model effective on October 1, 2019 with application to all interim periods in fiscal year 2020. Substantially all of the Company’s held-to-maturity debt securities are issued by U.S. government agencies or U.S. government-sponsored enterprises. These securities carry the explicit and/or implicit guarantee of the U.S. government and have a long history of zero credit loss. The Company did not record an allowance for credit losses for held-to-maturity securities upon adoption of ASC 326 or as of September 30, 2020 as the investment portfolio consists primarily of U.S. government agency mortgage-backed securities that management deems to have immaterial risk of loss. The impact going forward will depend on the composition, characteristics, and credit quality of the loan and securities portfolios as well as the economic conditions at future reporting periods.
Loans receivable: Loans receivable, net of related contra accounts, increased $861,742,000, or 7.2%, to $12,792,317,000 at September 30, 2020, from $11,930,575,000 one year earlier. This increase resulted primarily from originations of $6,220,600,000 and loan repayments of $5,096,622,000 during the year ended September 30, 2020. Commercial loan originations accounted for 73.7% of total originations and consumer originations were 26.3% as the Company continues to focus on commercial lending, coupled with growing economies in all major markets in which we operate.
The following table presents loan balances by category and the year-over-year change.
MANAGEMENT'S DISCUSSION AND ANALYSIS OF FINANCIAL CONDITION AND RESULTS OF OPERATIONS
| | | | | | | | | | | | | | | | | | | | | | | | | | |
| | September 30, 2020 | | September 30, 2019 | | Change |
| | ($ in thousands) | | ($ in thousands) | | $ | % |
| Gross loans by category | | | | | | | | |
| Commercial loans | | | | | | | | |
| Multi-family | $ | 1,538,762 | | 10.6 | % | | $ | 1,422,674 | | 10.7 | % | | $ | 116,088 | | 8.2% |
| Commercial real estate | 1,895,086 | | 13.1 | | | 1,631,170 | | 12.3 | | | 263,916 | | 16.2 |
| Commercial & industrial (1) | 2,132,160 | | 14.7 | | | 1,268,695 | | 9.5 | | | 863,465 | | 68.1 |
| Construction | 2,403,276 | | 16.6 | | | 2,038,052 | | 15.3 | | | 365,224 | | 17.9 |
| Land - acquisition & development | 193,745 | | 1.3 | | | 204,107 | | 1.5 | | | (10,362) | | (5.1) |
| Total commercial loans | 8,163,029 | | 56.3 | | | 6,564,698 | | 49.3 | | | 1,598,331 | | 24.3 |
| Consumer loans | | | | | | | | |
| Single-family residential | 5,304,689 | | 36.7 | | | 5,835,194 | | 43.8 | | | (530,505) | | (9.1) |
| Construction - custom | 674,879 | | 4.7 | | | 540,741 | | 4.1 | | | 134,138 | | 24.8 |
| Land - consumer lot loans | 102,263 | | 0.7 | | | 99,694 | | 0.7 | | | 2,569 | | 2.6 |
| HELOC | 139,703 | | 1.0 | | | 142,178 | | 1.1 | | | (2,475) | | (1.7) |
| Consumer | 83,159 | | 0.6 | | | 129,883 | | 1.0 | | | (46,724) | | (36.0) |
| Total consumer loans | 6,304,693 | | 43.7 | | | 6,747,690 | | 50.7 | | | (442,997) | | (6.6) |
| Total gross loans | 14,467,722 | | 100 | % | | 13,312,388 | | 100 | % | | 1,155,334 | | 8.7% |
| Less: | | | | | | | | |
| Allowance for loan losses | 166,955 | | | | 131,534 | | | | 35,421 | | 26.9 |
| Loans in process | 1,456,072 | | | | 1,201,341 | | | | 254,731 | | 21.2 |
| Net deferred fees, costs and discounts | 52,378 | | | | 48,938 | | | | 3,440 | | 7.0 |
| Total loan contra accounts | 1,675,405 | | | | 1,381,813 | | | | 293,592 | | 21.2 |
| Net loans | $ | 12,792,317 | | | | $ | 11,930,575 | | | | $ | 861,742 | | 7.2% |
(1) Includes $762,004,000 of SBA Payroll Protection Program loans as of September 30, 2020.
The following table shows the change in the geographic distribution by state of the loan portfolio.
| | | | | | | | | | | |
| September 30, | 2020 | 2019 | Change |
| Washington | 40.0 | % | 42.7 | % | (2.7) | |
| Oregon | 17.9 | | 16.6 | | 1.3 | |
| Arizona | 11.7 | | 11.9 | | (0.2) | |
| Utah | 6.5 | | 7.5 | | (1.0) | |
| Texas | 8.1 | | 7.4 | | 0.7 | |
| New Mexico | 5.6 | | 5.3 | | 0.3 | |
| Idaho | 4.8 | | 4.8 | | — | |
| Nevada | 3.3 | | 2.1 | | 1.2 | |
| Other (1) | 2.1 | | 1.7 | | 0.4 | |
| 100 | % | 100 | % | |
(1) Includes loans from outside of our eight state footprint.
Allowance for credit losses: As a result of the adoption of ASC 326 in 2020, which had an effective date of October 1, 2019, there is a lack of comparability in both the reserves and provisions for credit losses for the periods presented. Results for reporting periods beginning after October 1, 2019 are presented using the CECL methodology, while comparative period information continues to be reported in accordance with the incurred loss methodology in effect for prior fiscal years. The following table shows the Company’s allowance for credit losses.
MANAGEMENT'S DISCUSSION AND ANALYSIS OF FINANCIAL CONDITION AND RESULTS OF OPERATIONS
| | | | | | | | | | | | | | | | | | | | | | | | | | | |
| September 30, 2019
(Before ASC 326 Adoption) | | CECL Adoption Impact | | October 1, 2019 | | | | | | September 30, 2020 |
| (In thousands) | | | | | | | |
| Allowance for credit losses: | | | | | | | | | | | |
| Commercial loans | | | | | | | | | | | |
| Multi-family | $ | 7,391 | | | $ | 3,013 | | | $ | 10,404 | | | | | | | $ | 13,853 | |
| Commercial real estate | 13,170 | | | (146) | | | 13,024 | | | | | | | 22,516 | |
| Commercial & industrial | 31,450 | | | 785 | | | 32,235 | | | | | | | 38,665 | |
| Construction | 32,304 | | | (9,536) | | | 22,768 | | | | | | | 24,156 | |
| Land - acquisition & development | 9,155 | | | 1,749 | | | 10,904 | | | | | | | 10,733 | |
| Total commercial loans | 93,470 | | | (4,135) | | | 89,335 | | | | | | | 109,923 | |
| Consumer loans | | | | | | | | | | | |
| Single-family residential | 30,988 | | | 16,783 | | | 47,771 | | | | | | | 45,186 | |
| Construction - custom | 1,369 | | | 1,511 | | | 2,880 | | | | | | | 3,555 | |
| Land - consumer lot loans | 2,143 | | | 492 | | | 2,635 | | | | | | | 2,729 | |
| HELOC | 1,103 | | | 945 | | | 2,048 | | | | | | | 2,571 | |
| Consumer | 2,461 | | | 2,154 | | | 4,615 | | | | | | | 2,991 | |
| Total consumer loans | 38,064 | | | 21,885 | | | 59,949 | | | | | | | 57,032 | |
| Total allowance for loan losses | 131,534 | | | 17,750 | | | 149,284 | | | | | | | 166,955 | |
| Reserve for unfunded commitments | 6,900 | | | 10,750 | | | 17,650 | | | | | | | 25,000 | |
| Total allowance for credit losses | $ | 138,434 | | | $ | 28,500 | | | $ | 166,934 | | | | | | | $ | 191,955 | |
| | | | | | | | | | | |
| | | | | | | | | | | |
| | | | | | | | | | | |
| | | | | | | | | | | |
| | | | | | | | | | | |
| | | | | | | | | | | |
| | | | | | | | | | | |
| | | | | | | | | | | |
| | | | | | | | | | | |
| | | | | | | | | | | |
No allowance was recorded as of September 30, 2020 for the $745,081,000 of PPP loans, which are included in commercial & industrial, due to the government guarantee. Unfunded commitments tend to vary depending on our loan mix and the proportional share of commercial loans. The reserve for unfunded commitments was $25,000,000 as of September 30, 2020, which is an increase from $6,900,000 at September 30, 2019. Management believes the allowance for credit losses of $191,955,000, or 1.33% of gross loans, is sufficient to absorb estimated losses inherent in the portfolio of loans and unfunded commitments. See Note E and Note M for further details of the allowance for loan losses and reserve for unfunded commitments as of and for the year ended September 30, 2020.
Non-performing assets: NPAs decreased to $37,695,000 as of September 30, 2020, from $43,826,000 at September 30, 2019, a 14.0% decrease. The decrease was primarily a result of a $4,675,000 decrease in non-accrual loans and real estate owned declining by $1,815,000. Other property owned of $3,673,000 as of September 30, 2020 is comprised of $897,000 of equipment acquired through foreclosure on a commercial loan and a $2,776,000 government guarantee related to that same loan. Non-performing assets as a percentage of total assets was 0.20% at September 30, 2020, compared to 0.27% at September 30, 2019.
Troubled debt restructured loans ("TDRs"): Total TDRs declined to $91,408,000 as of September 30, 2020, from $121,677,000 as of September 30, 2019. As of September 30, 2020, $89,072,000 or 97.4% of TDRs were performing. Non-performing TDRs of $2,336,000 are included in NPAs. Total NPAs and performing TDRs as a percent of total assets has declined to 0.67% as of September 30, 2020, from 0.97% as of September 30, 2019.
CARES Act loan modifications: The Company is actively working with its borrowers to provide loan payment deferrals as a result of the COVID-19 pandemic. Pursuant to the CARES Act, these loan modifications are not accounted for as TDRs. A total of 1,502 loans were approved for deferrals of which 823 had resumed payments by September 30, 2020 and 681 remained in deferral as of that date. Payment deferral terms generally range from 90 to 180 days and some borrowers have been granted multiple deferrals. See Note D "Loans Receivable" for further details.
MANAGEMENT'S DISCUSSION AND ANALYSIS OF FINANCIAL CONDITION AND RESULTS OF OPERATIONS
Real estate owned: As of September 30, 2020, real estate owned totaled $4,966,000, a decrease of $1,815,000, or 26.8%, from $6,781,000 as of September 30, 2019, as the Company continued to liquidate foreclosed properties. During 2020, the Company sold real estate owned properties for total net proceeds of $5,022,000.
Interest receivable: Interest receivable was $53,799,000 as of September 30, 2020, an increase of $4,942,000, or 10.1%, since September 30, 2019. The increase was primarily a result of the payment deferrals on CARES Act loan modifications.
Bank Owned Life Insurance: Bank-owned life insurance increased to $227,749,000 as of September 30, 2020 from $222,076,000 as of September 30, 2019, primarily as a result of increases in the cash surrender value of the policies. The investments in bank-owned life insurance serve to assist in funding growing employee benefit costs.
Intangible assets: The Company's intangible assets totaled $309,906,000 at September 30, 2020 compared to $309,247,000 as of September 30, 2019. The balance at September 30, 2020 is comprised of $302,707,000 of goodwill and the unamortized balance of the core deposit and other intangibles of $7,199,000.
Customer accounts: As of September 30, 2020, customer deposits totaled $13,779,624,000 compared with $11,990,764,000 at September 30, 2019, a $1,788,860,000, or 14.9%, increase. During 2020, the Company was able to increase transaction accounts by $2,722,631,000 or 38.4% and time deposits decreased by $933,771,000 or 19.0%.
The following table shows customer deposits by account type.
| | | | | | | | | | | | | | | | | | | | | | | | | | | | | | | | | | | |
| ($ in thousands) | September 30, 2020 | | September 30, 2019 |
| | Deposit Account Balance | | As a % of Total Deposits | | Weighted
Average Rate | | Deposit Account Balance | | As a % of Total Deposits | | Weighted
Average Rate |
| Non-interest checking | $ | 2,164,071 | | | 15.7 | % | | — | % | | $ | 1,621,343 | | | 13.5 | % | | — | % |
| Interest checking | 3,029,576 | | | 22.0 | | | 0.23 | | | 1,984,576 | | | 16.6 | | | 0.61 | |
| Savings | 872,087 | | | 6.3 | | | 0.11 | | | 753,574 | | | 6.3 | | | 0.13 | |
| Money market | 3,740,698 | | | 27.1 | | | 0.30 | | | 2,724,308 | | | 22.7 | | | 0.82 | |
| Time deposits | 3,973,192 | | | 28.8 | | | 1.17 | | | 4,906,963 | | | 40.9 | | | 1.91 | |
| Total | $ | 13,779,624 | | | 100 | % | | 0.48 | % | | $ | 11,990,764 | | | 100 | % | | 1.08 | % |
The following table shows the geographic distribution by state for customer deposits.
| | | | | | | | | | | | | | | | | |
| ($ in thousands) | September 30, 2020 | September 30, 2019 | $ Change |
| Washington | $ | 5,914,476 | | 42.9 | % | $ | 5,502,418 | | 45.9 | % | $ | 412,058 | |
| Oregon | 2,627,720 | | 19.1 | | 2,337,401 | | 19.5 | | 290,319 | |
| Arizona | 1,481,603 | | 10.8 | | 1,352,365 | | 11.3 | | 129,238 | |
| New Mexico | 1,148,816 | | 8.3 | | 1,023,479 | | 8.5 | | 125,337 | |
| Idaho | 949,920 | | 6.9 | | 867,250 | | 7.2 | | 82,670 | |
| Nevada | 442,772 | | 3.2 | | 384,491 | | 3.2 | | 58,281 | |
| Utah | 988,498 | | 7.2 | | 345,208 | | 2.9 | | 643,290 | |
| Texas | 225,819 | | 1.6 | | 178,152 | | 1.5 | | 47,667 | |
| $ | 13,779,624 | | 100 | % | $ | 11,990,764 | | 100 | % | $ | 1,788,860 | |
FHLB advances: FHLB advances were $2,700,000,000 at September 30, 2020, as compared to $2,250,000,000 at September 30, 2019. The weighted average rate for FHLB advances was 1.79% as of September 30, 2020 and 2.49% at September 30, 2019. The decrease is primarily due to the rapid drop in short-term rates by the Federal Reserve Bank in response to the COVID-19 pandemic which resulted in a drop in interest rates on short-term FHLB borrowings. The Company has entered into
MANAGEMENT'S DISCUSSION AND ANALYSIS OF FINANCIAL CONDITION AND RESULTS OF OPERATIONS
interest rate swaps to hedge interest rate risk and convert certain FHLB advances to fixed rate payments. Taking into account these hedges, the weighted average effective maturity of FHLB advances at September 30, 2020 is 4.96 years.
Contractual obligations: The following table presents the Company's significant fixed and determinable contractual obligations, within the categories described below, by contractual maturity or payment amount.
| | | | | | | | | | | | | | | | | | | | | | | | | | |
| September 30, 2020 | | Total | | Less than
1 Year | | 1 to 5
Years | | Over 5
Years |
| | | (In thousands) |
| Customer accounts (1) | | $ | 13,779,624 | | | $ | 12,933,849 | | | $ | 844,842 | | | $ | 933 | |
| Debt obligations (2) | | 2,700,000 | | | 1,830,000 | | | 870,000 | | | — | |
| Operating lease obligations | | 36,421 | | | 6,617 | | | 19,415 | | | 10,389 | |
| | $ | 16,516,045 | | | $ | 14,770,466 | | | $ | 1,734,257 | | | $ | 11,322 | |
(1) Includes non-maturing customer transaction accounts.
(2) Represents final maturities of debt obligations.
These obligations are included in the Consolidated Statements of Financial Condition. The payment amounts of the operating lease obligations represent those amounts contractually due.
MANAGEMENT'S DISCUSSION AND ANALYSIS OF FINANCIAL CONDITION AND RESULTS OF OPERATIONS
RESULTS OF OPERATIONS
For highlights of the quarter-by-quarter results for the years ended September 30, 2020, and September 30, 2019, see Note R, “Selected Quarterly Financial Data (Unaudited).”
COMPARISON OF 2020 RESULTS WITH 2019
Net Income: Net income decreased $36,818,000, or 17.5%, to $173,438,000 for the year ended September 30, 2020, as compared to $210,256,000 for the year ended September 30, 2019.
Net Interest Income: For the year ended September 30, 2020, net interest income was $469,508,000, a decrease of $11,552,000 or 2.4% from the year ended September 30, 2019. The decrease in net interest income from the prior year was primarily due to the average rate earned on interest-earning assets declining by 56 basis points while the average rate paid on interest-bearing liabilities only declined by 35 basis points. Net interest margin of 2.93% in fiscal 2020 was down from 3.16% for the prior year, primarily caused by the rapid drop in short-term rates by the Federal Reserve Bank in response to the COVID-19 pandemic. For the year ended September 30, 2020, average earning assets increased 5.6% to $16,050,130,000, up from $15,203,819,000 for the year ended September 30, 2019. During 2020, the average balance of loans receivable increased $451,950,000 or 3.8%, while the combined average balances of mortgage backed securities, other investment securities and cash increased by $394,413,000 or 12.1%.
The following table sets forth certain information explaining changes in interest income and interest expense for the period indicated compared to the same period one year ago. For each category of interest-earning asset and interest-bearing liability, information is provided on changes attributable to (1) changes in volume (changes in volume multiplied by old rate) and (2) changes in rate (changes in rate multiplied by old volume). The change in interest income and interest expense attributable to changes in both volume and rate has been allocated proportionately to the change due to volume and the change due to rate.
Rate / Volume Analysis:
| | | | | | | | | | | |
| Comparison of Year Ended September 30, 2020 and
September 30, 2019 |
| ($ in thousands) | Volume | Rate | Total |
| Interest income: | | | |
| Loans receivable | $ | 21,197 | | $ | (43,585) | | $ | (22,388) | |
| Mortgage-backed securities | (13,094) | | (12,079) | | (25,173) | |
| Investments (1) | 19,566 | | (22,206) | | (2,640) | |
| | | |
| All interest-earning assets | 27,669 | | (77,870) | | (50,201) | |
| | | |
| Interest expense: | | | |
| Customer accounts | 9,781 | | (31,685) | | (21,904) | |
| FHLB advances and other borrowings | (35) | | (16,710) | | (16,745) | |
| | | |
| All interest-bearing liabilities | 9,746 | | (48,395) | | (38,649) | |
| | | |
| Change in net interest income | $ | 17,923 | | $ | (29,475) | | $ | (11,552) | |
(1) Includes interest on cash equivalents and dividends on FHLB & FRB stock.
Provision (Release) for Credit Losses: Primarily due to the continued economic distress caused by the COVID-19 pandemic, the Company recorded a provision for credit losses of $21,750,000 for the year ended September 30, 2020, as compared to a release of $1,650,000 for the year ended September 30, 2019. The relatively significant credit loss provision for 2020 is due primarily to COVID-19 related factors including estimated impacts to the energy, hospitality, restaurant and senior living industries. The release recorded for 2019 was a result of strong net recoveries and the overall quality of the loan portfolio as a
MANAGEMENT'S DISCUSSION AND ANALYSIS OF FINANCIAL CONDITION AND RESULTS OF OPERATIONS
result of a strong economy. The Company had recoveries, net of charge-offs, of $3,271,000 for the year ended September 30, 2020, compared with $3,577,000 of net recoveries for the year ended September 30, 2019.
Other Income: Other income was $86,960,000 for the year ended September 30, 2020, an increase of $24,642,000, or 39.5%, from $62,318,000 for the year ended September 30, 2019. The increase is primarily due to a net gain of $30,700,000 from the sale and valuation adjustments of fixed assets, including a branch property in Bellevue, Washington, while fiscal 2019 included a net gain of $10,200,000 from the sale and valuation adjustments of fixed assets. Loan fee income was $3,352,000 higher in fiscal year 2020 than in 2019 due to higher loan prepayments. Fiscal year 2020 also included a $15,028,000 gain on the sale of $189,000,000 of available-for-sale securities that was partially offset by a $13,809,000 loss on early repayment of a $200,000,000 FHLB advance that carried an effective rate of 3.86% and was scheduled to mature in August 2022.
Other Expense: Operating expense was $315,558,000 for the year ended September 30, 2020, an increase of $32,495,000, or 11.5%, from the $283,063,000 for the year ended September 30, 2019. Compensation and benefits costs increased $14,008,000 or 10.5% year-over-year due mostly to a 5.5% increase in headcount, including growth in our compliance program, as well as cost-of-living adjustments. Information technology costs increased by $13,947,000 primarily due to a $5,900,000 impairment charge and continued investments in new hardware and software. The Company’s efficiency ratio increased to 56.71% for fiscal 2020 as compared to 52.1% for the prior year. The increase in operating expenses and efficiency ratio are the result of ongoing investments in people, process and technology with the objectives of enhancing compliance, growing market share and ultimately enhancing earnings. The number of staff, including part-time employees on a full-time equivalent basis, was 2,080 and 1,971 at September 30, 2020 and 2019, respectively. Total operating expense for the years ended September 30, 2020, and 2019 equaled 1.82% and 1.73%, respectively, of average assets.
Gain (Loss) on Real Estate Owned: Net gain on real estate owned was $26,000 for the year ended September 30, 2020, compared to a net gain of $810,000 for the year ended September 30, 2019. This amount includes ongoing maintenance expense, periodic valuation adjustments, and gains (losses) on sales of REO.
Income Tax Expense: Income tax expense was $45,748,000 for the year ended September 30, 2020, a decrease of $6,771,000, or 12.9%, from the $52,519,000 for the year ended September 30, 2019. The decrease is mostly due to a 16.6% decrease in pre-tax income. The effective tax rate for 2020 was 20.87% as compared to 19.99% for the year ended September 30, 2019. The effective tax rate of 20.87% for 2020 is lower than the statutory rate mainly due to the effects of state taxes, bank-owned life insurance, tax credit investments, tax-exempt loans to municipal entities and other qualified borrowers as well as adjustments to deferred tax items.
MANAGEMENT'S DISCUSSION AND ANALYSIS OF FINANCIAL CONDITION AND RESULTS OF OPERATIONS
COMPARISON OF 2019 RESULTS WITH 2018
For management's review of the factors that affected our results of operations for the years ended September 30, 2019 and 2018 refer to our Annual Report on Form 10-K for the year ended September 30, 2019, which was filed with the Securities and Exchange Commission on November 20, 2019.
SELECTED FINANCIAL DATA
| | | | | | | | | | | | | | | | | | |
| Year ended September 30, | 2020 | 2019 | 2018 | 2017 | 2016 | |
| | (In thousands, except per share data) |
| Interest income | $ | 621,265 | | $ | 671,466 | | $ | 607,083 | | $ | 548,918 | | $ | 536,793 | | |
| Interest expense | 151,757 | | 190,406 | | 134,944 | | 116,992 | | 116,544 | | |
| Net interest income | 469,508 | | 481,060 | | 472,139 | | 431,926 | | 420,249 | | |
| Provision (reversal) for credit losses | 21,750 | | (1,650) | | (5,450) | | (2,100) | | (6,250) | | |
| Other income | 86,986 | | 63,128 | | 43,976 | | 53,709 | | 57,082 | | |
| Other expense | 315,558 | | 283,063 | | 264,322 | | 231,519 | | 235,447 | | |
| Income before income taxes | 219,186 | | 262,775 | | 257,243 | | 256,216 | | 248,134 | | |
| Income taxes | 45,748 | | 52,519 | | 53,393 | | 82,684 | | 84,085 | | |
| Net income | $ | 173,438 | | $ | 210,256 | | $ | 203,850 | | $ | 173,532 | | $ | 164,049 | | |
| Per share data | | | | | | |
| Basic earnings | $ | 2.26 | | $ | 2.61 | | $ | 2.40 | | $ | 1.95 | | $ | 1.79 | | |
| Diluted earnings | 2.26 | | 2.61 | | 2.40 | | 1.94 | | 1.78 | | |
| Cash dividends | 0.87 | | 0.79 | | 0.67 | | 0.84 | | 0.55 | | |
| | | | | | |
| September 30, | 2020 | 2019 | 2018 | 2017 | 2016 | |
| Total assets | $ | 18,794,055 | | $ | 16,474,910 | | $ | 15,865,724 | | $ | 15,253,580 | | $ | 14,888,063 | | |
| Loans receivable, net | 12,792,317 | | 11,930,575 | | 11,477,081 | | 10,882,622 | | 9,910,920 | | |
| Mortgage-backed securities | 1,674,090 | | 2,426,039 | | 2,524,923 | | 2,489,544 | | 2,490,510 | | |
| Investment securities | 1,281,240 | | 503,183 | | 415,454 | | 423,521 | | 849,983 | | |
| Cash and cash equivalents | 1,702,977 | | 419,158 | | 268,650 | | 313,070 | | 450,368 | | |
| Customer accounts | 13,779,624 | | 11,990,764 | | 11,387,146 | | 10,835,008 | | 10,600,852 | | |
| FHLB advances | 2,700,000 | | 2,250,000 | | 2,330,000 | | 2,225,000 | | 2,080,000 | | |
| | | | | | |
| Shareholders’ equity | 2,014,133 | | 2,032,995 | | 1,996,908 | | 2,005,688 | | 1,975,731 | | |
| Number of | | | | | | |
| Customer accounts | 434,686 | | 450,375 | | 449,339 | | 449,793 | | 491,098 | | |
| Loans | 41,623 | | 37,551 | | 37,992 | | 39,688 | | 41,418 | | |
| Offices | 238 | | 238 | | 235 | | 237 | | 238 | | |
WASHINGTON FEDERAL, INC. AND SUBSIDIARIES
CONSOLIDATED STATEMENTS OF FINANCIAL CONDITION
| | | | | | | | | | | |
| September 30, 2020 | | September 30, 2019 |
| | (In thousands, except share data) |
| ASSETS | | | |
| Cash and cash equivalents | $ | 1,702,977 | | | $ | 419,158 | |
| Available-for-sale securities, at fair value | 2,249,492 | | | 1,485,742 | |
| Held-to-maturity securities, at amortized cost | 705,838 | | | 1,443,480 | |
Loans receivable, net of allowance for loan losses of $166,955 and $131,534 (1) | 12,792,317 | | | 11,930,575 | |
| Interest receivable | 53,799 | | | 48,857 | |
| Premises and equipment, net | 252,805 | | | 274,015 | |
| Real estate owned | 4,966 | | | 6,781 | |
| FHLB & FRB stock | 141,990 | | | 123,990 | |
| Bank owned life insurance | 227,749 | | | 222,076 | |
Intangible assets, including goodwill of $302,707 and $301,368 | 309,906 | | | 309,247 | |
| Federal and state income tax assets, net | 5,708 | | | — | |
| Other assets | 346,508 | | | 210,989 | |
| $ | 18,794,055 | | | $ | 16,474,910 | |
| LIABILITIES AND SHAREHOLDERS’ EQUITY | | | |
| Liabilities | | | |
| Customer accounts | | | |
| Transaction deposit accounts | $ | 9,806,432 | | | $ | 7,083,801 | |
| Time deposit accounts | 3,973,192 | | | 4,906,963 | |
| 13,779,624 | | | 11,990,764 | |
| FHLB advances | 2,700,000 | | | 2,250,000 | |
| Advance payments by borrowers for taxes and insurance | 49,462 | | | 57,830 | |
| Federal and state income tax liabilities, net | — | | | 5,104 | |
| Accrued expenses and other liabilities | 250,836 | | | 138,217 | |
| 16,779,922 | | | 14,441,915 | |
| Commitments and contingencies (see Note M) | | | |
| Shareholders’ equity | | | |
Common stock, $1.00 par value, 300,000,000 shares authorized; 135,727,237 and 135,539,806 shares issued; 75,689,364 and 78,841,463 shares outstanding | 135,727 | | | 135,540 | |
| Paid-in capital | 1,678,843 | | | 1,672,417 | |
| Accumulated other comprehensive income (loss), net of taxes | 16,953 | | | 15,292 | |
Treasury stock, at cost; 60,037,873 and 56,698,343 shares | (1,238,296) | | | (1,126,163) | |
| Retained earnings | 1,420,906 | | | 1,335,909 | |
| 2,014,133 | | | 2,032,995 | |
| $ | 18,794,055 | | | $ | 16,474,910 | |
(1) Effective October 1, 2019, the Company has applied FASB ASU 2016-13, Financial Instruments - Credit Losses ("ASC 326"), which requires the use of the current expected credit loss methodology ("CECL"). Prior to October 1, 2019, the calculation was based on incurred loss methodology. See Note E "Allowance for Loan Losses" for details.
SEE NOTES TO CONSOLIDATED FINANCIAL STATEMENTS
25
WASHINGTON FEDERAL, INC. AND SUBSIDIARIES
CONSOLIDATED STATEMENTS OF OPERATIONS
| | | | | | | | | | | |
| Year ended September 30, | 2020 | 2019 | 2018 |
| | (In thousands, except share data) |
| INTEREST INCOME | | | |
| Loans receivable | $ | 545,708 | | $ | 568,096 | | $ | 515,807 | |
| Mortgage-backed securities | 49,312 | | 74,485 | | 70,407 | |
| Investment securities and cash equivalents | 26,245 | | 28,885 | | 20,869 | |
| 621,265 | | 671,466 | | 607,083 | |
| INTEREST EXPENSE | | | |
| Customer accounts | 100,312 | | 122,216 | | 72,492 | |
| FHLB advances | 51,445 | | 68,190 | | 62,452 | |
| 151,757 | | 190,406 | | 134,944 | |
| Net interest income | 469,508 | | 481,060 | | 472,139 | |
| Provision (release) for credit losses | 21,750 | | (1,650) | | (5,450) | |
| Net interest income after provision (release) | 447,758 | | 482,710 | | 477,589 | |
| | | |
| OTHER INCOME | | | |
| Gain (loss) on sale of investment securities | 15,028 | | (9) | | — | |
| Prepayment penalty on early extinguishment of debt | (13,809) | | — | | — | |
| FDIC loss share termination valuation adjustments | — | | — | | (8,550) | |
| Loan fee income | 7,293 | | 3,941 | | 3,804 | |
| Deposit fee income | 23,691 | | 24,882 | | 25,904 | |
| Other income | 54,757 | | 33,504 | | 22,920 | |
| 86,960 | | 62,318 | | 44,078 | |
| OTHER EXPENSE | | | |
| Compensation and benefits | 147,596 | | 133,588 | | 123,554 | |
| Occupancy | 39,570 | | 38,579 | | 36,453 | |
| FDIC insurance premiums | 10,939 | | 9,808 | | 11,592 | |
| Product delivery | 17,010 | | 15,934 | | 16,372 | |
| Information technology | 52,902 | | 38,955 | | 34,643 | |
| Other expense | 47,541 | | 46,199 | | 41,708 | |
| 315,558 | | 283,063 | | 264,322 | |
| Gain (loss) on real estate owned, net | 26 | | 810 | | (102) | |
| Income before income taxes | 219,186 | | 262,775 | | 257,243 | |
| Income tax expense (benefit) | | | |
| Current | 55,092 | | 50,933 | | 44,557 | |
| Deferred | (9,344) | | 1,586 | | 8,836 | |
| 45,748 | | 52,519 | | 53,393 | |
| NET INCOME | $ | 173,438 | | $ | 210,256 | | $ | 203,850 | |
| | | |
| PER SHARE DATA | | | |
| Basic earnings per share | $ | 2.26 | | $ | 2.61 | | $ | 2.40 | |
| Diluted earnings per share | 2.26 | | 2.61 | | 2.40 | |
| Dividends paid on common stock per share | 0.87 | | 0.79 | | 0.67 | |
| Basic weighted average number of shares outstanding | 76,721,969 | | 80,471,316 | | 85,008,040 | |
| Diluted weighted average number of shares outstanding | 76,731,464 | | 80,495,163 | | 85,109,843 | |
SEE NOTES TO CONSOLIDATED FINANCIAL STATEMENTS
26
WASHINGTON FEDERAL, INC. AND SUBSIDIARIES
CONSOLIDATED STATEMENTS OF COMPREHENSIVE INCOME
| | | | | | | | | | | | | | | | | |
| Year ended September 30, | 2020 | | 2019 | | 2018 |
| | (In thousands) |
| Net income | $ | 173,438 | | | $ | 210,256 | | | $ | 203,850 | |
| Other comprehensive income (loss), net of tax: | | | | | |
Net unrealized gain (loss) during the period on available-for-sale debt securities, net of tax of $(6,220), $(8,917) and $6,156 | 20,528 | | | 30,278 | | | (14,980) | |
Reclassification adjustment of net (gain) loss included in net income during the period from sale of available-for-sale securities, net of tax of $3,456, $2 and $0 | (11,572) | | | (7) | | | — | |
| 8,956 | | | 30,271 | | | (14,980) | |
| | | | | |
Net unrealized gain (loss) during the period on borrowing cash flow hedges, net of tax of $2,204, $6,854 and $(5,684) | (7,295) | | | (23,273) | | | 18,259 | |
| (7,295) | | | (23,273) | | | 18,259 | |
| | | | | |
| Other comprehensive income (loss) | 1,661 | | | 6,998 | | | 3,279 | |
| Comprehensive income | $ | 175,099 | | | $ | 217,254 | | | $ | 207,129 | |
SEE NOTES TO CONSOLIDATED FINANCIAL STATEMENTS
27
WASHINGTON FEDERAL, INC. AND SUBSIDIARIES
CONSOLIDATED STATEMENTS OF SHAREHOLDERS' EQUITY
| | | | | | | | | | | | | | | | | | | | |
| (In thousands) | Common
Stock | Paid-in
Capital | Retained
Earnings | Accumulated
Other
Comprehensive
Income (Loss) | Treasury
Stock | Total |
| | | | | | | |
| Balance at September 30, 2017 | $ | 134,958 | | $ | 1,660,885 | | $ | 1,042,890 | | $ | 5,015 | | $ | (838,060) | | $ | 2,005,688 | |
| | | | | | |
Adjustment pursuant to adoption of ASU 2018-02 | — | | — | | (1,772) | | 1,772 | | — | | — | |
| Net income | — | | — | | 203,850 | | — | | — | | 203,850 | |
| Other comprehensive income (loss) | — | | — | | — | | 1,507 | | — | | 1,507 | |
Dividends on common stock ($0.67 per share) | — | | — | | (55,997) | | — | | — | | (55,997) | |
| Proceeds from stock-based awards | 63 | | 1,275 | | — | | — | | — | | 1,338 | |
| Stock-based compensation expense | 209 | | 4,562 | | — | | — | | — | | 4,771 | |
| Repurchase of stock warrants | 113 | | (113) | | — | | — | | — | | — | |
| Treasury stock purchased | — | | — | | — | | — | | (164,249) | | (164,249) | |
| Balance at September 30, 2018 | 135,343 | | 1,666,609 | | 1,188,971 | | 8,294 | | (1,002,309) | | 1,996,908 | |
| | | | | | |
| Net income | — | | — | | 210,256 | | — | | — | | 210,256 | |
| Other comprehensive income (loss) | — | | — | | | 6,998 | | — | | 6,998 | |
Dividends on common stock ($0.79 per share) | — | | — | | (63,318) | | — | | — | | (63,318) | |
| Proceeds from stock-based awards | 39 | | 701 | | — | | — | | — | | 740 | |
| Stock-based compensation expense | 119 | | 5,146 | | — | | — | | — | | 5,265 | |
| Repurchase of stock warrants | 39 | | (39) | | — | | — | | — | | — | |
| Treasury stock purchased | — | | — | | — | | — | | (123,854) | | (123,854) | |
| Balance at September 30, 2019 | 135,540 | | 1,672,417 | | 1,335,909 | | 15,292 | | (1,126,163) | | 2,032,995 | |
| | | | | | |
Adjustment pursuant to adoption of ASU 2016-13 | — | | — | | (21,945) | | — | | — | | (21,945) | |
| Net income | — | | — | | 173,438 | | — | | — | | 173,438 | |
| Other comprehensive income (loss) | — | | — | | — | | 1,661 | | — | | 1,661 | |
Dividends on common stock ($0.87 per share) | — | | — | | (66,496) | | — | | — | | (66,496) | |
| Proceeds from stock-based awards | 8 | | 136 | | — | | — | | — | | 144 | |
| Stock-based compensation expense | 179 | | 6,290 | | — | | — | | — | | 6,469 | |
| Treasury stock purchased | — | | — | | — | | — | | (112,133) | | (112,133) | |
| Balance at September 30, 2020 | $ | 135,727 | | $ | 1,678,843 | | $ | 1,420,906 | | $ | 16,953 | | $ | (1,238,296) | | $ | 2,014,133 | |
SEE NOTES TO CONSOLIDATED FINANCIAL STATEMENTS
28
WASHINGTON FEDERAL, INC. AND SUBSIDIARIES
CONSOLIDATED STATEMENTS OF CASH FLOWS
| | | | | | | | | | | | | | | | | |
| Year ended September 30, | 2020 | | 2019 | | 2018 |
| | (In thousands) |
| CASH FLOWS FROM OPERATING ACTIVITIES | | | |
| Net income | $ | 173,438 | | | $ | 210,256 | | | $ | 203,850 | |
| Adjustments to reconcile net income to net cash provided by operating activities: | | | | | |
| Depreciation, amortization, accretion and other, net | 39,912 | | | 31,058 | | | 46,735 | |
| Cash received from (paid to) FDIC under loss share | — | | | — | | | 1,595 | |
| Stock-based compensation expense | 6,469 | | | 5,265 | | | 4,771 | |
| Provision (release) for credit losses | 21,750 | | | (1,650) | | | (5,450) | |
| Loss (gain) on sale of investment securities | (15,028) | | | 9 | | | — | |
| Prepayment penalty on early extinguishment of debt | 13,809 | | | — | | | — | |
| Gain on settlements of bank owned life insurance | — | | | — | | | (2,416) | |
| Impairment loss on premises and equipment | 6,431 | | | — | | | — | |
| Net realized (gain) loss on sales of premises, equipment and real estate owned | (31,990) | | | (12,484) | | | (1,450) | |
| Decrease (increase) in accrued interest receivable | (4,942) | | | (1,562) | | | (5,652) | |
| Decrease (increase) in federal and state income tax receivable | (5,708) | | | 1,804 | | | (1,804) | |
| Decrease (increase) in cash surrender value of bank owned life insurance | (5,673) | | | (5,822) | | | (5,992) | |
| Decrease (increase) in other assets | (146,893) | | | (17,416) | | | (6,876) | |
| Increase (decrease) in federal and state income tax liabilities | 890 | | | 3,043 | | | — | |
| Increase (decrease) in accrued expenses and other liabilities | 114,135 | | | 21,553 | | | (36,609) | |
| Net cash provided (used) by operating activities | 166,600 | | | 234,054 | | | 190,702 | |
| | | | | |
| CASH FLOWS FROM INVESTING ACTIVITIES | | | | | |
| Origination of loans and principal repayments, net | (902,481) | | | (452,334) | | | (459,183) | |
| Loans purchased | (15,456) | | | — | | | (143,605) | |
| FHLB & FRB stock purchase | (435,200) | | | (532,600) | | | (530,000) | |
| FHLB & FRB stock redeemed | 417,200 | | | 535,800 | | | 525,800 | |
| Available-for-sale securities purchased | (1,064,815) | | | (358,709) | | | (272,780) | |
| Principal payments and maturities of available-for-sale securities | 493,402 | | | 224,118 | | | 199,008 | |
| Proceeds from sales of available-for-sale investment securities | 204,351 | | | 491 | | | — | |
| Held-to-maturity securities purchased | — | | | — | | | (170,836) | |
| Principal payments and maturities of held-to-maturity securities | 356,532 | | | 178,147 | | | 187,812 | |
| | | | | |
| Proceeds from sales of real estate owned | 5,022 | | | 8,659 | | | 15,192 | |
| Proceeds from settlements of bank owned life insurance | — | | | — | | | 3,484 | |
| Purchase of strategic investments | — | | | (5,000) | | | — | |
| Net cash received (paid) in business combinations | (2,810) | | | — | | | (2,211) | |
| Proceeds from sales of premises and equipment | 55,213 | | | 15,585 | | | 1 | |
| Premises and equipment purchased and REO improvements | (31,937) | | | (35,530) | | | (27,127) | |
| Net cash provided (used) by investing activities | (920,979) | | | (421,373) | | | (674,445) | |
| | | | | |
| CASH FLOWS FROM FINANCING ACTIVITIES | | | | | |
| Net increase (decrease) in customer accounts | 1,788,860 | | | 603,846 | | | 552,445 | |
| Proceeds from borrowings | 10,880,000 | | | 13,315,000 | | | 13,250,000 | |
| Repayments of borrowings | (10,443,809) | | | (13,395,000) | | | (13,145,000) | |
| Proceeds from stock-based awards | 144 | | | 740 | | | 1,338 | |
| Dividends paid on common stock | (66,496) | | | (63,318) | | | (55,997) | |
| | | | | |
| Treasury stock purchased | (112,133) | | | (123,854) | | | (164,249) | |
| Increase (decrease) in advance payments by borrowers for taxes and insurance | (8,368) | | | 413 | | | 786 | |
| Net cash provided (used) by financing activities | 2,038,198 | | | 337,827 | | | 439,323 | |
| Increase (decrease) in cash and cash equivalents | 1,283,819 | | | 150,508 | | | (44,420) | |
| Cash and cash equivalents at beginning of year | 419,158 | | | 268,650 | | | 313,070 | |
| Cash and cash equivalents at end of year | $ | 1,702,977 | | | $ | 419,158 | | | $ | 268,650 | |
SEE NOTES TO CONSOLIDATED FINANCIAL STATEMENTS
29
WASHINGTON FEDERAL, INC. AND SUBSIDIARIES
CONSOLIDATED STATEMENTS OF CASH FLOWS
| | | | | | | | | | | | | | | | | |
| Year ended September 30, | 2020 | | 2019 | | 2018 |
| | (In thousands) |
| SUPPLEMENTAL DISCLOSURES OF CASH FLOW INFORMATION | | | | | |
| Non-cash investing activities | | | | | |
| Real estate acquired through foreclosure | $ | 1,765 | | | $ | 1,839 | | | $ | 4,032 | |
| Other personal property acquired through foreclosure | 359 | | | 205 | | | 3,109 | |
| Non-cash financing activities | | | | | |
| Stock issued upon exercise of warrants | — | | | 1,082 | | | 3,914 | |
| Cash paid during the year for | | | | | |
| Interest | 146,675 | | | 194,277 | | | 133,722 | |
| Income taxes | 35,640 | | | 33,545 | | | 44,260 | |
| | | | | |
| | | | | |
| | | | | |
| | | | | |
SEE NOTES TO CONSOLIDATED FINANCIAL STATEMENTS
30
WASHINGTON FEDERAL, INC. AND SUBSIDIARIES
NOTES TO THE CONSOLIDATED FINANCIAL STATEMENTS
YEARS ENDED SEPTEMBER 30, 2020, 2019, AND 2018
NOTE A - SUMMARY OF SIGNIFICANT ACCOUNTING POLICIES
Company and nature of operations. Washington Federal Bank, National Association, a federally-insured national bank dba WaFd Bank (the “Bank” or “WaFd Bank”), was founded on April 24, 1917 in Ballard, Washington and is engaged primarily in providing lending, depository, insurance and other banking services to consumers, mid-sized to large businesses, and owners and developers of commercial real estate. Washington Federal, Inc., a Washington corporation (the “Company”), was formed as the Bank’s holding company in November, 1994. As used throughout this document, the terms “Washington Federal” or the “Company” refer to the Company and its consolidated subsidiaries, and the term “Bank” refers to the operating subsidiary, Washington Federal Bank, National Association. The Company is headquartered in Seattle, Washington. The Bank conducts its activities through a network of 234 bank branches located in Washington, Oregon, Idaho, Utah, Arizona, Nevada, New Mexico and Texas.
Risks and Uncertainties. The worldwide spread of coronavirus (“COVID-19”) has created significant uncertainty in the global economy. There have been no comparable recent events that provide guidance as to the effect the spread of COVID-19 as a global pandemic may have, and, as a result, the ultimate impact of COVID-19 and the extent to which COVID-19 and the related government actions impact the Company’s business, results of operations and financial condition will depend on future developments, which are highly uncertain and difficult to predict.
Basis of presentation and use of estimates. The Company’s accounting and financial reporting policies conform to accounting principles generally accepted in the United States of America (U.S. GAAP). Inter-company balances and transactions have been eliminated in consolidation. In preparing the consolidated financial statements, the Company makes estimates and assumptions that affect the reported amounts of assets and liabilities as of the date of the financial statements and revenues and expenses during the reporting periods and related disclosures. The areas that require application of significant management judgments often result in the need to make estimates about the effect of matters that are inherently uncertain and may change in future periods. Actual results could differ materially from those estimates. Certain amounts in the financial statements from prior periods have been reclassified to conform to the current financial statement presentation. In certain instances, amounts in text are presented by rounding to the nearest thousand.
The Company's fiscal year end is September 30. All references to 2020, 2019 and 2018 represent balances as of September 30, 2020, September 30, 2019, and September 30, 2018, or activity for the fiscal years then ended.
Cash and cash equivalents. Cash and cash equivalents include cash on hand, amounts due from banks, overnight investments and repurchase agreements with an initial maturity of three months or less.
Restricted cash balances - Based on the level of vault cash on hand, the Company was not required to maintain cash reserve balances with the Federal Reserve Bank as of September 30, 2020. As of September 30, 2020 and September 30, 2019, the Company pledged cash collateral related to derivative contracts of $97,600,000 and $31,850,000, respectively.
Equity securities - The Company records equity securities within Other assets in its Consolidated Statements of Financial Condition. Investments in equity securities with readily determinable fair values (marketable) are measured at fair value, with changes in the fair value recognized as a component of Other income in the Consolidated Statements of Operations. Investments in equity investments that do not have readily determinable fair values (non-marketable) are accounted for at cost minus impairment, if any, plus or minus changes resulting from observable price changes in orderly transactions for the identical or similar investment of the same issuer, also referred to as the measurement alternative. Any adjustments to the carrying value of these investments are recorded in Other income in the Consolidated Statements of Operations.
Debt securities, including mortgage-backed securities. The Company accounts for debt securities in two categories: held-to-maturity and available-for-sale. Premiums and discounts on debt securities are deferred and recognized into income over the contractual life of the asset using the effective interest method.
Held-to-maturity securities are accounted for at amortized cost, but the Company must have both the positive intent and the ability to hold those securities to maturity. There are very limited circumstances under which securities in the held-to-maturity category can be sold without jeopardizing the cost basis of accounting for the remainder of the securities in this category.
WASHINGTON FEDERAL, INC. AND SUBSIDIARIES
NOTES TO THE CONSOLIDATED FINANCIAL STATEMENTS
YEARS ENDED SEPTEMBER 30, 2020, 2019, AND 2018
Available-for-sale securities are accounted for at fair value. Gains and losses realized on the sale of these securities are accounted for based on the specific identification method. Unrealized gains and losses for available-for-sale securities are excluded from earnings and reported net of the related tax effect in the accumulated other comprehensive income component of shareholders' equity.
Allowance for Credit Losses (Held-to-Maturity Debt Securities). For held-to-maturity (“HTM”) debt securities, the Company is required to utilize a CECL methodology to estimate expected credit losses. Substantially all of the Company’s HTM debt securities are issued by U.S. government agencies or U.S. government-sponsored enterprises. These securities carry the explicit and/or implicit guarantee of the U.S. government and have a long history of zero credit loss. Therefore, the Company did not record an allowance for credit losses for these securities. As September 30, 2020, the Company determined that the expected credit loss on its corporate and municipal bonds was immaterial, and therefore, an allowance for credit losses was not recorded. See Note C "Investment Securities" and Note F "Fair Value Measurements" for more information about HTM debt securities.
Allowance for Credit Losses (Available-for-Sale Debt Securities). The impairment model for available-for-sale (“AFS”) debt securities differs from the CECL methodology applied for HTM debt securities because AFS debt securities are measured at fair value rather than amortized cost. Although ASC 326 replaced the legacy other-than-temporary impairment (“OTTI”) model with a credit loss model, it retained the fundamental nature of the legacy OTTI model. For AFS debt securities in an unrealized loss position, the Company first assesses whether it intends to sell, or it is more likely than not that it will be required to sell, the security before recovery of its amortized cost basis. If either criteria is met, the security’s amortized cost basis is written down to fair value through income. For AFS debt securities where neither of the criteria are met, the Company evaluates whether the decline in fair value has resulted from credit losses or other factors. In making this assessment, management considers the extent to which fair value is less than amortized cost, any changes to the credit rating of the security by a rating agency, and adverse conditions specifically related to the security, among other factors. If this assessment indicates that a credit loss exists, the present value of cash flows expected to be collected from the security are compared to the amortized cost basis of the security. If the present value of cash flows expected to be collected is less than the amortized cost basis, a credit loss exists and an allowance for credit losses is recorded for the credit loss, limited to the amount that the fair value is less than the amortized cost basis. Any remaining discount that has not been recorded through an allowance for credit losses is recognized in other comprehensive income. Under the new guidance, an entity may no longer consider the length of time fair value has been less than amortized cost. Changes in the allowance for credit losses are recorded as a provision (or release) for credit losses. Losses are charged against the allowance when management believes the uncollectibility of an AFS security is confirmed or when either of the criteria regarding intent or requirement to sell is met. As of September 30, 2020, the Company determined that the unrealized loss positions in AFS securities were not the result of credit losses, and therefore, an allowance for credit losses was not recorded. See Note C "Investment Securities" and Note F "Fair Value Measurements" for more information about AFS debt securities.
Loans receivable. Loans that are performing in accordance with their contractual terms are carried at the unpaid principal balance, net of premiums, discounts and net deferred loan fees. Net deferred loan fees include nonrefundable loan origination fees less direct loan origination costs. Net deferred loan fees, premiums and discounts are amortized into interest income using either the interest method or straight-line method over the terms of the loans, adjusted for actual prepayments. In addition to fees and costs for originating loans, various other fees and charges related to existing loans may occur, including prepayment charges, late charges and assumption fees.
When a borrower fails to make a required payment on a loan, the Bank attempts to cure the deficiency by contacting the borrower. Contact is made after a payment is 30 days past its grace period. In most cases, deficiencies are cured promptly. If the delinquency is not cured within 90 days, the Bank may institute appropriate action to foreclose on the property. If foreclosed, the property is sold at a public sale and may be purchased by the Bank.
Allowance for Credit Losses (Loans Receivable). Effective October 1, 2019, the Company has applied FASB ASU 2016-13, Financial Instruments - Credit Losses ("ASC 326"), so the allowance calculation is based on current expected credit loss methodology ("CECL"). Prior to October 1, 2019, the calculation was based on incurred loss methodology. See Note B "New Accounting Pronouncements" and Note E "Allowance for Losses on Loans" for details. The Company maintains an allowance for credit losses (“ACL”) for the expected credit losses of the loan portfolio as well as unfunded loan commitments. The amount of ACL is based on ongoing, quarterly assessments by management. The CECL methodology requires an estimate of
WASHINGTON FEDERAL, INC. AND SUBSIDIARIES
NOTES TO THE CONSOLIDATED FINANCIAL STATEMENTS
YEARS ENDED SEPTEMBER 30, 2020, 2019, AND 2018
the credit losses expected over the life of an exposure (or pool of exposures) and replaces the incurred loss methodology’s threshold that delayed the recognition of a credit loss until it was probable a loss event was incurred.
The ACL consists of the allowance for loan losses and the reserve for unfunded commitments. The estimate of expected credit losses under the CECL methodology is based on relevant information about past events, current conditions, and reasonable and supportable forecasts that affect the collectability of the reported amounts. Historical loss experience is generally the starting point for estimating expected credit losses. We then consider whether the historical loss experience should be adjusted for asset-specific risk characteristics or current conditions at the reporting date that did not exist over the period that historical experience was based for each loan type. Finally, we consider forecasts about future economic conditions or changes in collateral values that are reasonable and supportable.
Portfolio segment is defined as the level at which an entity develops and documents a systematic methodology to determine its ACL. The Company has designated two loan portfolio segments, commercial loans and consumer loans. These loan portfolio segments are further disaggregated into classes, which represent loans of similar type, risk characteristics, and methods for monitoring and assessing credit risk. The commercial loan portfolio segment is disaggregated into five classes: multi-family, commercial real estate, commercial and industrial, construction, and land acquisition and development. The risk of loss for the commercial loan portfolio segment is generally most indicated by the credit risk rating assigned to each borrower. Commercial loan risk ratings are determined by experienced senior credit officers based on specific facts and circumstances and are subject to periodic review by an independent internal team of credit specialists. The consumer loan portfolio segment is disaggregated into five classes: single-family-residential mortgage, custom construction, consumer lot loans, home equity lines of credit, and other consumer. The risk of loss for the consumer loan portfolio segment is generally most indicated by delinquency status and general economic factors. Each commercial and consumer loan portfolio class may also be further segmented based on risk characteristics.
For most of our loan portfolio classes, the historical loss experience is determined using a cohort methodology. This method pools loans into groups (“cohorts”) sharing similar risk characteristics and tracks each cohort’s net charge-offs over the lives of the loans to calculate a historical loss rate. The historical loss rates for each cohort are then averaged to calculate an overall historical loss rate which is applied to the current loan balance to arrive at the quantitative baseline portion of the allowance for credit losses for the respective loan portfolio class. For certain loan portfolio classes, the Company determined there was not sufficient historical loss information to calculate a meaningful historical loss rate using the cohort methodology. For any such loan portfolio class, the weighted-average remaining maturity (“WARM”) methodology is being utilized until sufficient historical loss data is obtained. The WARM method multiplies an average annual loss rate by the expected remaining life of the loan pool to arrive at the quantitative baseline portion of the allowance for credit losses for the respective loan portfolio class.
The Company also considers qualitative adjustments to the historical loss rate for each loan portfolio class. The qualitative adjustments for each loan class consider the conditions over the period from which historical loss experience was based and are split into two components: 1) asset or class specific risk characteristics or current conditions at the reporting date related to portfolio credit quality, remaining payments, volume and nature, credit culture and management, business environment or other management factors and 2) reasonable and supportable forecast of future economic conditions and collateral values.
The Company performs a quarterly asset quality review which includes a review of forecasted gross charge-offs and recoveries, nonperforming assets, criticized loans, risk rating migration, delinquencies, etc. The asset quality review is performed by management and the results are used to consider a qualitative overlay to the quantitative baseline. The second qualitative adjustment noted above, economic conditions and collateral values, encompasses a one-year reasonable and supportable forecast period. The overlay adjustment for the reasonable and supportable forecast assumes an immediate reversion after the one-year forecast period to historical loss rates for the remaining life of the respective loan pool.
When management deems it to be appropriate, the Company establishes a specific reserve for individually evaluated loans that do not share similar risk characteristics with the loans included in each respective loan pool. These individually evaluated loans are removed from their respective pools and typically represent collateral dependent loans but may also include other non-performing loans or troubled debt restructurings (“TDRs”). In addition, the Company individually evaluates “reasonably expected” TDRs, which are identified by the Company as a loan expected to be classified as a TDR within the next six months. Management judgment is utilized to make this determination.
WASHINGTON FEDERAL, INC. AND SUBSIDIARIES
NOTES TO THE CONSOLIDATED FINANCIAL STATEMENTS
YEARS ENDED SEPTEMBER 30, 2020, 2019, AND 2018
Troubled debt restructured loans ("TDRs"). The Company will consider modifying the interest rates and terms of a loan if it determines that a modification is a better alternative to foreclosure. Most TDRs are accruing and performing loans where the borrower has proactively approached the Company about modifications due to temporary financial difficulties. Each request is individually evaluated for merit and likelihood of success. The concession for these loans is typically a payment reduction through a rate reduction of 100 to 200 bps for a specific term, usually six to 12 months. Interest-only payments may also be approved during the modification period. Principal forgiveness is generally not an available option for restructured loans. Before granting approval to modify a loan in a TDR, the borrower’s ability to repay is evaluated, including: current income levels and debt to income ratio, borrower’s credit score, payment history of the loan and updated evaluation of the secondary repayment source. The Company also modifies some loans that are not classified as TDRs as the modification is due to a restructuring where the effective interest rate on the debt is reduced to reflect a decrease in market interest rates. The Company's ACL reflects the effects of a TDR when management reasonably expects at the reporting date that a TDR will be executed with an individual borrower.
CARES Act loan modifications. The Company is actively working with its borrowers to provide loan payment deferrals as a result of the COVID-19 pandemic. Pursuant to the CARES Act, these loan modifications are not accounted for as TDRs. Payment deferral terms generally range from 90 to 180 days and some borrowers have been granted multiple deferrals.
Non-accrual loans. Loans are placed on nonaccrual status when, in the judgment of management, the probability of collection of interest is deemed to be insufficient to warrant further accrual. When a loan is placed on nonaccrual status, previously accrued but unpaid interest is deducted from interest income. The Company does not accrue interest on loans 90 days or more past due. If payment is made on a loan so that the loan becomes less than 90 days past due, and the Company expects full collection of principal and interest, the loan is returned to full accrual status. Any interest ultimately collected is credited to income in the period of recovery. A loan is charged-off when the loss is estimable and it is confirmed that the borrower is not expected to be able to meet contractual obligations.
If a consumer loan is on non-accrual status before becoming a TDR it will stay on non-accrual status following restructuring until it has been performing for at least six months, at which point it may be moved to accrual status. If a loan is on accrual status before it becomes a TDR, and management concludes that full repayment is probable based on internal evaluation, it will remain on accrual status following restructuring. If the restructured consumer loan does not perform, it is placed on non-accrual status when it is 90 days delinquent. For commercial loans, six consecutive payments on newly restructured loan terms are required prior to returning the loan to accrual status. In some instances, after the required six consecutive payments are made, management will conclude that collection of the entire principal and interest due is still in doubt. In those instances, the loan will remain on non-accrual status.
Accrued interest receivable. Upon adoption of ASC 326, the Company made the following elections regarding accrued interest receivable ("AIR"):
•Presenting accrued interest receivable balances separately from their underlying instruments within the consolidated statements of financial condition.
•Excluding accrued interest receivable that is included in the amortized cost of financing receivables from related disclosure requirements.
•Continuing our policy to write off accrued interest receivable by reversing interest income in cases where the Company does not reasonably expect to receive payment.
•Not measuring an allowance for credit losses for accrued interest receivable due to the Company’s policy of writing off uncollectible accrued interest receivable balances in a timely manner. We believe accrued interest receivable recorded as of September 30, 2020 is collectible.
Off-balance-sheet credit exposures. The only material off-balance-sheet credit exposures are loans in process and unused lines of credit. The reserve for unfunded commitments is recognized as a liability (other liabilities in the consolidated statements of financial condition), with adjustments to the reserve recognized through provision for credit losses in the consolidated statements of income. The reserve for unfunded commitments represents the expected lifetime credit losses on off-balance sheet obligations such as commitments to extend credit and standby letters of credit. However, a liability is not recognized for commitments that are unconditionally cancellable by the Company. The reserve for unfunded commitments is determined by estimating future draws, including the effects of risk mitigation actions, and applying the expected loss rates on those draws. Loss rates are estimated by utilizing the same loss rates calculated for the allowance for credit losses related to the respective loan portfolio class. See Note M "Commitments and Contingencies" for details.
WASHINGTON FEDERAL, INC. AND SUBSIDIARIES
NOTES TO THE CONSOLIDATED FINANCIAL STATEMENTS
YEARS ENDED SEPTEMBER 30, 2020, 2019, AND 2018
Client swap program hedges. Interest rate swap agreements are provided to certain clients who desire to convert their obligations from variable to fixed interest rates. Under these agreements, the Bank enters into a variable-rate loan agreement with a customer in addition to a swap agreement, and then enters into a corresponding swap agreement with a third party in order to offset its exposure on the customer swap agreement. As the interest rate swap agreements with the customers and third parties are not designated as accounting hedges under FASB ASC 815, the instruments are marked to market in earnings. The change in fair value of the offsetting swaps are included in interest income and interest expense and there is no impact on net income. There is fee income earned on the swaps that is included in loan fee income.
Borrowings cash flow hedges. The Company has entered into interest rate swaps to convert a series of future short-term borrowings to fixed-rate payments. These interest rate swaps qualify as cash flow hedging instruments under ASC 815 so gains and losses are recorded in Other Comprehensive Income to the extent the hedge is effective. Gains and losses on the interest rate swaps are reclassified from OCI to earnings in the period the hedged transaction affects earnings and are included in the same income statement line item that the hedged transaction is recorded.
Mortgage loan "last-of-layer" portfolio hedges. The Company has entered into interest rate swaps to hedge the portion of the respective closed portfolios of prepayable mortgage loans that are expected to remain at the end of the hedge term. These hedges qualify as last-of-layer hedges under ASC 815 and provide for matching of the recognition of the gains and losses on the interest rate swap and the related hedged item.
Commercial loan fair value hedges. The Company has entered into interest rate swaps to hedge long term fixed rate commercial loans. These hedges qualify as fair value hedges under ASC 815 and provide for matching of the recognition of the gains and losses on the interest rate swap and the related hedged loan.
Premises and equipment. Premises and equipment are stated at cost, less accumulated depreciation. Depreciation is computed on the straight-line method over the estimated useful lives of the respective assets. Costs for improvements are capitalized. Charges for ordinary maintenance and repairs are expensed to operations as incurred.
Real estate owned. Real estate properties acquired through foreclosure of loans or through acquisitions are recorded initially at fair value less selling costs and are subsequently recorded at lower of cost or fair value. Costs for improvements are capitalized. Any gains (losses) and maintenance costs are recorded in Gain (loss) on real estate owned, net.
Intangible assets. Goodwill represents the excess of the cost of businesses acquired over the fair value of the net assets acquired. Other intangibles, including core deposit intangibles, are acquired assets that lack physical substance but can be distinguished from goodwill. Goodwill is evaluated for impairment on an annual basis during the fourth quarter. Other intangible assets are amortized over their estimated lives and are subject to impairment testing when events or circumstances change. If circumstances indicate that the carrying value of the assets may not be recoverable, an impairment charge could be recorded. The Bank amortizes the core deposit intangibles over their estimated lives using an accelerated method.
The table below provides detail regarding the Company's intangible assets.
| | | | | | | | | | | | | | | | | |
| Goodwill | | Core Deposit and Other Intangibles | | Total |
| (In thousands) |
| Balance at September 30, 2018 | $ | 301,368 | | | $ | 9,918 | | | $ | 311,286 | |
| Additions | — | | | — | | | — | |
| Amortization | — | | | (2,039) | | | (2,039) | |
| Balance at September 30, 2019 | 301,368 | | | 7,879 | | | 309,247 | |
| Additions | 1,339 | | | 1,471 | | | 2,810 | |
| Amortization | — | | | (2,151) | | | (2,151) | |
| Balance at September 30, 2020 | $ | 302,707 | | | $ | 7,199 | | | $ | 309,906 | |
The table below presents the estimated future amortization expense of core deposit and other intangibles for the next five years.
WASHINGTON FEDERAL, INC. AND SUBSIDIARIES
NOTES TO THE CONSOLIDATED FINANCIAL STATEMENTS
YEARS ENDED SEPTEMBER 30, 2020, 2019, AND 2018
| | | | | | | | |
| Fiscal Year | | Expense |
| | (In thousands) |
| 2021 | | $ | 1,369 | |
| 2022 | | 949 | |
| 2023 | | 893 | |
| 2024 | | 859 | |
| 2025 | | 810 | |
Income taxes. Income taxes are accounted for using the asset and liability method, which requires the recognition of deferred tax assets and liabilities for the expected future tax consequences of events that have been included in the financial statements. Under this method, a deferred tax asset or liability is determined based on the temporary differences between the financial statement and corresponding tax treatment of income, gains, losses, deductions or credits using enacted tax rates in effect for the year in which the differences are expected to reverse. The provision for income taxes includes current and deferred income tax expense based on net income adjusted for temporary and permanent differences such as depreciation, loan loss reserve, tax-exempt interest, and affordable housing tax credits. Reserves for uncertain tax positions, together with any related interest and penalties, if applicable, and amortization of affordable housing tax credit investments are recorded within income tax expense.
Accounting for stock-based compensation. We recognize in the statement of operations the grant-date fair value of stock options and other equity-based forms of compensation issued to employees over the employees' requisite service period (generally the vesting period). The requisite service period may be subject to performance conditions. Stock options and restricted stock awards generally vest ratably over two to five years and are recognized as expense over that same period of time. The exercise price of each option equals the market price of the Company's common stock on the date of the grant, and the maximum term is ten years.
Certain grants of restricted stock are subject to performance-based and market-based vesting as well as other approved vesting conditions and cliff vest based on those conditions. Compensation expense is recognized over the service period to the extent restricted stock awards are expected to vest. See Note O for additional information.
Business segments. As the Company manages its business and operations on a consolidated basis, management has determined that there is one reportable business segment.
Regulatory matters. On February 28, 2018, pursuant to a Stipulation and Consent to the Issuance of a Consent Order (the “Consent Order”), the Office of the Comptroller of the Currency issued a Consent Order relating to the Bank, the terms of which are intended to further enhance its Bank Secrecy Act ("BSA") program. The Consent Order requires the Bank to create a BSA-focused action plan, supplement existing customer due diligence policies and procedures, perform a BSA risk assessment, perform a transaction activity look-back, enhance training, and complete independent testing. The Bank has not been informed that this action includes the assessment of a civil money penalty. The Bank is working cooperatively with the OCC to implement the necessary changes to comply with the provisions of the Consent Order.
On October 9, 2013, the CFPB entered a Consent Order against the Bank that required the Bank to pay a civil money penalty of $34,000, and to adopt an enhanced compliance program related to reporting Home Mortgage Disclosure Act ("HMDA") data. The Bank has adopted an enhanced HMDA program, which continues to be subject to review by the CFPB. On October 27, 2020 the CFPB entered a second Consent Order against the Bank for violations related to the Bank’s HMDA reporting obligations. The 2020 Consent Order required the Bank to pay a $200,000 civil money penalty and develop and implement a HMDA compliance management system.
Subsequent events. The Company has evaluated subsequent events for adjustment to or disclosure in the Company’s consolidated financial statements through the date of this report, and the Company has not identified any recordable or disclosable events, not otherwise reported in these consolidated financial statements or the notes thereto.
WASHINGTON FEDERAL, INC. AND SUBSIDIARIES
NOTES TO THE CONSOLIDATED FINANCIAL STATEMENTS
YEARS ENDED SEPTEMBER 30, 2020, 2019, AND 2018
NOTE B - NEW ACCOUNTING PRONOUNCEMENTS
In March 2020, the Financial Accounting Standards Board (“FASB”) issued Accounting Standards Update (“ASU”) 2020-04, Reference Rate Reform (Topic 848). The amendments in this ASU provide temporary, optional guidance to ease the potential burden in accounting for reference rate reform. The ASU provides optional expedients and exceptions for applying GAAP to transactions affected by reference rate reform if certain criteria are met. The ASU primarily includes relief related to contract modifications and hedging relationships, as well as providing a one-time election for the sale or transfer of debt securities classified as held-to-maturity. This guidance is effective immediately and the amendments may be applied prospectively through December 31, 2022. The Company is currently in the process of evaluating the amendments and determining the impact to its consolidated financial statements.
In April 2019, the FASB issued ASU 2019-04, Codification Improvements to Topic 326, Financial Instruments-Credit Losses, Topic 815, Derivatives and Hedging, and Topic 825, Financial Instruments, that clarifies and improves areas of guidance related to the recently issued standards on credit losses (ASU 2016-13), hedging (ASU 2017-12), and recognition and measurement of financial instruments (ASU 2016-01). The amendments generally have the same effective dates as their related standards. If already adopted, the amendments of ASU 2016-01 and ASU 2016-13 are effective for fiscal years beginning after December 15, 2019 and the amendments of ASU 2017-12 are effective as of the beginning of the Company’s next annual reporting period; early adoption is permitted. Effective January 1, 2020, the Company adopted the amendments of ASU 2019-04 pertaining to ASU 2017-12 and ASU 2016-01, both of which had been previously adopted, and at that time elected to reclassify mortgage-backed securities with an amortized cost of $374,680,000 and fair value of $390,669,000 from held-to-maturity to available-for-sale. During the third fiscal quarter, the Company adopted the amendments of ASU 2019-04 that pertain to ASU 2016-13. See discussion below regarding the adoption of ASU 2016-13.
In August 2018, the FASB issued ASU 2018-15, Customer’s Accounting for Implementation Costs Incurred in a Cloud Computing Arrangement That is a Service Contract. The amendments in this ASU align the requirements for capitalizing implementation costs incurred in a hosting arrangement that is a service contract with the requirements for capitalizing implementation costs incurred to develop or obtain internal-use software. The amendments also require the entity to expense the capitalized implementation costs of a hosting arrangement that is a service contract over the term of the hosting arrangement, including reasonably certain renewal periods. The amendments in the ASU are effective for fiscal years beginning after December 15, 2019 and interim periods within those fiscal years. Early adoption is permitted, including adoption in any interim period. The Company is assessing the impact that this guidance will have on its consolidated financial statements.
In August 2018, the FASB issued ASU 2018-13, Fair Value Measurement (Topic 820): Disclosure Framework - Changes to the Disclosure Requirements for Fair Value Measurement. This ASU adds, eliminates, and modifies certain disclosure requirements for fair value measurements. Among the changes, entities will no longer be required to disclose the amount of and reasons for transfers between Level 1 and Level 2 of the fair value hierarchy, but will be required to disclose the range and weighted average used to develop significant unobservable inputs for Level 3 fair value measurements. The ASU is effective for interim and annual reporting periods beginning after December 15, 2019; early adoption is permitted. Entities are also allowed to elect early adoption of the eliminated or modified disclosure requirements and delay adoption of the added disclosure requirements until their effective date. The Company early adopted this ASU beginning October 1, 2019 and removed or modified disclosures as permitted.
In July 2018, the FASB issued ASU 2018-11, Leases (Topic 842) - Targeted Improvements. The ASU provides entities with relief from the costs of implementing certain aspects of the new leasing standard, ASU No. 2016-02. Specifically, under the amendments in ASU 2018-11: (1) entities may elect not to recast the comparative periods presented when transitioning to the new leasing standard, and (2) lessors may elect to not separate non-lease components from leases when certain conditions are met. The amendments have the same effective date as ASU 2016-02 (October 1, 2019 for the Company). The Company adopted this ASU beginning October 1, 2019 and elected both transition options.
In June 2016, the FASB issued ASU 2016-13, Financial Instruments - Credit Losses (ASC 326). ASC 326, as amended, is intended to provide financial statement users with more decision-useful information about the expected credit losses on financial instruments that are not accounted for at fair value through net income, including loans held for investment, held-to-maturity debt securities, trade and other receivables, net investments in leases and other commitments to extend credit held by a reporting entity at each reporting date. The amendments require that financial assets measured at amortized cost be presented at the net amount expected to be collected, through an allowance for credit losses that is deducted from the amortized cost basis.
WASHINGTON FEDERAL, INC. AND SUBSIDIARIES
NOTES TO THE CONSOLIDATED FINANCIAL STATEMENTS
YEARS ENDED SEPTEMBER 30, 2020, 2019, AND 2018
ASC 326 eliminates the current framework of recognizing probable incurred losses and instead requires an entity to use its current estimate of all expected credit losses over the contractual life. The measurement of expected credit losses is based upon historical experience, current conditions, and reasonable and supportable forecasts that affect the collectability of the financial assets.
For purchased financial assets with a more-than-insignificant amount of credit deterioration since origination (“PCD assets”) that are measured at amortized cost, an allowance for expected credit losses is recorded as an adjustment to the cost basis of the asset. Subsequent changes in estimated cash flows would be recorded as an adjustment to the allowance and through the statement of income.
Credit losses relating to available-for-sale debt securities will be recorded through an allowance for credit losses rather than as a direct write-down to the security's cost basis.
The Company early adopted ASC 326 during its third fiscal quarter and based on the application of the modified retrospective method it became effective on October 1, 2019 for all financial assets measured at amortized cost (primarily loans receivable and held-to-maturity debt securities) and off-balance-sheet credit exposures. Results for reporting periods beginning after October 1, 2019 are presented under ASC 326 while prior period amounts continue to be reported in accordance with previously applicable GAAP.
WASHINGTON FEDERAL, INC. AND SUBSIDIARIES
NOTES TO THE CONSOLIDATED FINANCIAL STATEMENTS
YEARS ENDED SEPTEMBER 30, 2020, 2019, AND 2018
The Company recorded a decrease to retained earnings of $21,945,000 as of October 1, 2019 for the cumulative effect of adopting ASC 326 as further detailed below.
| | | | | | | | | | | | | | | | | | | | | | | |
| September 30, 2019 | | CECL Adoption Impact | | October 1, 2019 | | | | | | |
| (In thousands) | | | | | | | |
| Allowance for credit losses: | | | | | | | | | | | |
| Commercial loans | | | | | | | | | | | |
| Multi-family | $ | 7,391 | | | $ | 3,013 | | | $ | 10,404 | | | | | | | |
| Commercial real estate | 13,170 | | | (146) | | | 13,024 | | | | | | | |
| Commercial & industrial | 31,450 | | | 785 | | | 32,235 | | | | | | | |
| Construction | 32,304 | | | (9,536) | | | 22,768 | | | | | | | |
| Land - acquisition & development | 9,155 | | | 1,749 | | | 10,904 | | | | | | | |
| Total commercial loans | 93,470 | | | (4,135) | | | 89,335 | | | | | | | |
| Consumer loans | | | | | | | | | | | |
| Single-family residential | 30,988 | | | 16,783 | | | 47,771 | | | | | | | |
| Construction - custom | 1,369 | | | 1,511 | | | 2,880 | | | | | | | |
| Land - consumer lot loans | 2,143 | | | 492 | | | 2,635 | | | | | | | |
| HELOC | 1,103 | | | 945 | | | 2,048 | | | | | | | |
| Consumer | 2,461 | | | 2,154 | | | 4,615 | | | | | | | |
| Total consumer loans | 38,064 | | | 21,885 | | | 59,949 | | | | | | | |
| Total allowance for loan losses | 131,534 | | | 17,750 | | | 149,284 | | | | | | | |
| Reserve for unfunded commitments | 6,900 | | | 10,750 | | | 17,650 | | | | | | | |
| Total allowance for credit losses | $ | 138,434 | | | $ | 28,500 | | | $ | 166,934 | | | | | | | |
| | | | | | | | | | | |
| | | | | | | | | | | |
| | | | | | | | | | | |
| | | | | | | | | | | |
| | | | | | | | | | | |
| | | | | | | | | | | |
| Retained earnings | | | | | | | | | | | |
| Total pre-tax impact | | | $ | 28,500 | | | | | | | | | |
| Tax effect | | | (6,555) | | | | | | | | | |
| Decrease to retained earnings | | | $ | 21,945 | | | | | | | | | |
The Company's available-for-sale and held-to-maturity portfolios consist primarily of debt securities issued by U.S. government agencies or U.S. government-sponsored enterprises. These securities carry the explicit and/or implicit guarantee of the U.S. government and have a long history of zero credit loss. Therefore, the Company did not record an allowance for credit losses for these securities upon adoption of ASC 326. The impact going forward will depend on the composition, characteristics, and credit quality of the loan and securities portfolios as well as the economic conditions at future reporting periods.
In February 2016, the FASB issued ASU 2016-02, Leases. The ASU, as amended, requires lessees to recognize a lease liability, which is a lessee's obligation to make lease payments arising from a lease, and a right-of-use asset, which is an asset that represents the lessee's right to use, or control the use of, a specified asset for the lease term. The guidance also simplifies the accounting for sale and leaseback transactions and introduces new disclosure requirements for leasing arrangements. Accounting by lessors is largely unchanged. The amendments are effective for fiscal years beginning after December 15, 2018, including interim periods within those fiscal years. The Company adopted this ASU beginning October 1, 2019 utilizing the transition method allowed under ASU 2018-11 and did not restate comparative periods. The Company elected the package of practical expedients permitted under the transition guidance, which allowed us to carry forward our historical lease classifications and our assessment on whether a contract is or contains a lease. We also elected to keep leases with an initial term of 12 months or less off the balance sheet. The adoption of this ASU resulted in an increase in other assets and an increase in other liabilities of $29,013,000 and $29,013,000, respectively. The Company recognized no cumulative effect adjustment to the beginning balance of retained earnings upon adoption.
WASHINGTON FEDERAL, INC. AND SUBSIDIARIES
NOTES TO THE CONSOLIDATED FINANCIAL STATEMENTS
YEARS ENDED SEPTEMBER 30, 2020, 2019, AND 2018
NOTE C - INVESTMENT SECURITIES
The tables below provide detail regarding the amortized cost and fair value of available-for-sale and held-to-maturity investment securities.
| | | | | | | | | | | | | | | | | | | | | | | | | | | | | |
| September 30, 2020 | Amortized
Cost | | Gross Unrealized | | Fair
Value | | Yield |
| Gains | | Losses | |
| | ($ in thousands) |
| Available-for-sale securities | | | | | | | | | |
| U.S. government and agency securities due | | | | | | | | | |
| | | | | | | | | |
| | | | | | | | | |
| 5 to 10 years | $ | 18,448 | | | $ | 376 | | | $ | — | | | $ | 18,824 | | | 2.05 | % |
| | | | | | | | | |
| Asset-backed securities | | | | | | | | | |
| | | | | | | | | |
| | | | | | | | | |
| 5 to 10 years | 38,289 | | | — | | | (1,600) | | | 36,689 | | | 0.83 | |
| Over 10 years | 906,489 | | | 647 | | | (6,908) | | | 900,228 | | | 1.14 | |
| | | | | | | | | |
| | | | | | | | | |
| | | | | | | | | |
| | | | | | | | | |
| Corporate debt securities due | | | | | | | | | |
| Within 1 year | 54,209 | | | 337 | | | (51) | | | 54,495 | | | 1.22 | |
| 1 to 5 years | 128,289 | | | 3,366 | | | (428) | | | 131,227 | | | 1.78 | |
| 5 to 10 years | 97,157 | | | 4,305 | | | — | | | 101,462 | | | 1.50 | |
| | | | | | | | | |
| Municipal bonds due | | | | | | | | | |
| | | | | | | | | |
| 1 to 5 years | 1,461 | | | 36 | | | — | | | 1,497 | | | — | |
| | | | | | | | | |
| Over 10 years | 36,044 | | | 774 | | | — | | | 36,818 | | | 5.40 | |
| Mortgage-backed securities | | | | | | | | | |
| Agency pass-through certificates | 929,713 | | | 39,166 | | | (627) | | | 968,252 | | | 2.82 | |
| Commercial MBS | — | | | — | | | — | | | — | | | — | |
| 2,210,099 | | | 49,007 | | | (9,614) | | | 2,249,492 | | | 1.97 | |
| Held-to-maturity securities | | | | | | | | | |
| | | | | | | | | |
| | | | | | | | | |
| | | | | | | | | |
| | | | | | | | | |
| | | | | | | | | |
| | | | | | | | | |
| | | | | | | | | |
| | | | | | | | | |
| Agency pass-through certificates | 698,934 | | | 21,582 | | | — | | | 720,516 | | | 3.16 | |
| Commercial MBS | 6,904 | | | — | | | (52) | | | 6,852 | | | 1.02 | |
| 705,838 | | | 21,582 | | | (52) | | | 727,368 | | | 3.14 | |
| $ | 2,915,937 | | | $ | 70,589 | | | $ | (9,666) | | | $ | 2,976,860 | | | 2.25 | % |
WASHINGTON FEDERAL, INC. AND SUBSIDIARIES
NOTES TO THE CONSOLIDATED FINANCIAL STATEMENTS
YEARS ENDED SEPTEMBER 30, 2020, 2019, AND 2018
| | | | | | | | | | | | | | | | | | | | | | | | | | | | | |
| September 30, 2019 | Amortized
Cost | | Gross Unrealized | | Fair
Value | | Yield |
| Gains | | Losses | |
| | ($ in thousands) |
| Available-for-sale securities | | | | | | | | | |
| U.S. government and agency securities due | | | | | | | | | |
| | | | | | | | | |
| | | | | | | | | |
| 5 to 10 years | $ | 21,049 | | | $ | 39 | | | $ | — | | | $ | 21,088 | | | 2.05 | % |
| | | | | | | | | |
| Asset-backed securities | | | | | | | | | |
| | | | | | | | | |
| | | | | | | | | |
| 5 to 10 years | 44,238 | | | — | | | (629) | | | 43,609 | | | 2.61 | |
| Over 10 years | 207,067 | | | 1 | | | (987) | | | 206,081 | | | 3.02 | |
| | | | | | | | | |
| | | | | | | | | |
| | | | | | | | | |
| | | | | | | | | |
| Corporate debt securities due | | | | | | | | | |
| Within 1 year | 43,903 | | | 411 | | | — | | | 44,314 | | | 3.65 | |
| 1 to 5 years | 70,000 | | | 689 | | | (50) | | | 70,639 | | | 3.29 | |
| 5 to 10 years | 92,931 | | | 1,879 | | | — | | | 94,810 | | | 3.27 | |
| | | | | | | | | |
| Municipal bonds due | | | | | | | | | |
| | | | | | | | | |
| 1 to 5 years | 1,430 | | | 14 | | | — | | | 1,444 | | | 1.94 | |
| | | | | | | | | |
| Over 10 years | 20,303 | | | 895 | | | — | | | 21,198 | | | 6.45 | |
| Mortgage-backed securities | | | | | | | | | |
| Agency pass-through certificates | 957,150 | | | 26,533 | | | (1,124) | | | 982,559 | | | 3.29 | |
| | | | | | | | | |
| 1,458,071 | | | 30,461 | | | (2,790) | | | 1,485,742 | | | 3.27 | |
| Held-to-maturity securities | | | | | | | | | |
| | | | | | | | | |
| | | | | | | | | |
| | | | | | | | | |
| | | | | | | | | |
| | | | | | | | | |
| | | | | | | | | |
| | | | | | | | | |
| Mortgage-backed securities | | | | | | | | | |
| Agency pass-through certificates | 1,428,480 | | | 19,945 | | | (337) | | | 1,448,088 | | | 3.15 | |
| Commercial MBS | 15,000 | | | 7 | | | — | | | 15,007 | | | 2.89 | |
| 1,443,480 | | | 19,952 | | | (337) | | | 1,463,095 | | | 3.15 | |
| $ | 2,901,551 | | | $ | 50,413 | | | $ | (3,127) | | | $ | 2,948,837 | | | 3.21 | % |
During fiscal year 2020, as permitted in conjunction with the adoption of ASU 2019-04, the Company reclassified $374,680,000 of prepayable debt securities from held-to-maturity to available-for-sale. The Company purchased $1,064,815,000 of available-for-sale investment securities and no held-to-maturity investment securities during 2020. Sales of available-for-sale securities totaled $204,351,000 and there were no sales of held-to-maturity investment securities in 2020. Substantially all mortgage-backed securities have contractual due dates that exceed 25 years.
The Company elected to exclude AIR from the amortized cost basis of debt securities disclosed throughout this footnote. For AFS securities, AIR totaled $3,285,000 and $3,712,000 as of September 30, 2020 and September 30, 2019, respectively. For HTM debt securities, AIR totaled $1,811,000 and $3,716,000 as of September 30, 2020 and September 30, 2019, respectively. AIR is included in the “interest receivable” line item on the Company’s consolidated statements of financial condition.
The following tables show the gross unrealized losses and fair value of securities as of September 30, 2020 and September 30, 2019, by length of time that individual securities in each category have been in a continuous loss position. There were 51 and 41 securities with an unrealized loss as of September 30, 2020 and September 30, 2019, respectively. The decline in fair value since purchase is attributable to changes in interest rates. Because the Company does not intend to sell these securities and does not consider it more likely than not that it will be required to sell these securities before the recovery of amortized cost basis, which may be upon maturity, the Company does not consider these investments to be impaired.
WASHINGTON FEDERAL, INC. AND SUBSIDIARIES
NOTES TO THE CONSOLIDATED FINANCIAL STATEMENTS
YEARS ENDED SEPTEMBER 30, 2020, 2019, AND 2018
| | | | | | | | | | | | | | | | | | | | | | | | | | | | | | | | | | | |
| September 30, 2020 | Less than 12 months | | 12 months or more | | Total |
| | Unrealized
Gross Losses | | Fair
Value | | Unrealized
Gross Losses | | Fair
Value | | Unrealized
Gross Losses | | Fair
Value |
| | (In thousands) | | |
| Available-for-sale securities | | | | | | | | | | | |
| Corporate debt securities | $ | (74) | | | $ | 45,875 | | | $ | (405) | | | $ | 24,596 | | | $ | (479) | | | $ | 70,471 | |
| | | | | | | | | | | |
| | | | | | | | | | | |
| Asset-backed securities | (5,481) | | | 587,746 | | | (3,027) | | | 204,369 | | | (8,508) | | | 792,115 | |
| Mortgage-backed securities | (278) | | | 41,897 | | | (349) | | | 56,196 | | | (627) | | | 98,093 | |
| (5,833) | | | 675,518 | | | (3,781) | | | 285,161 | | | (9,614) | | | 960,679 | |
| Held-to-maturity securities | | | | | | | | | | | |
| Mortgage-backed securities | (52) | | | 6,853 | | | — | | | — | | | (52) | | | 6,853 | |
| $ | (5,885) | | | $ | 682,371 | | | $ | (3,781) | | | $ | 285,161 | | | $ | (9,666) | | | $ | 967,532 | |
| | | | | | | | | | | | | | | | | | | | | | | | | | | | | | | | | | | |
| September 30, 2019 | Less than 12 months | | 12 months or more | | Total |
| | Unrealized
Gross Losses | | Fair
Value | | Unrealized
Gross Losses | | Fair
Value | | Unrealized
Gross Losses | | Fair
Value |
| | (In thousands) | | |
| Available-for-sale securities | | | | | | | | | | | |
| Corporate debt securities | $ | — | | | $ | — | | | $ | (50) | | | $ | 24,950 | | | $ | (50) | | | $ | 24,950 | |
| | | | | | | | | | | |
| | | | | | | | | | | |
| Asset-backed securities | (656) | | | 152,715 | | | (960) | | | 77,391 | | | (1,616) | | | 230,106 | |
| Mortgage-backed securities | (148) | | | 87,895 | | | (976) | | | 155,620 | | | (1,124) | | | 243,515 | |
| (804) | | | 240,610 | | | (1,986) | | | 257,961 | | | (2,790) | | | 498,571 | |
| Held-to-maturity securities | | | | | | | | | | | |
| Mortgage-backed securities | — | | | — | | | (337) | | | 115,182 | | | (337) | | | 115,182 | |
| $ | (804) | | | $ | 240,610 | | | $ | (2,323) | | | $ | 373,143 | | | $ | (3,127) | | | $ | 613,753 | |
Substantially all of the Company’s held-to-maturity debt securities are issued by U.S. government agencies or U.S. government-sponsored enterprises. These securities carry the explicit and/or implicit guarantee of the U.S. government and have a long history of zero credit loss. Therefore, the Company did not record an allowance for credit losses for these securities upon adoption of ASC 326 on October 1, 2019 or as of September 30, 2020.
The Company does not believe that the available-for-sale debt securities that were in an unrealized loss position have any credit loss impairment upon adoption of ASC 326 on October 1, 2019 or as of September 30, 2020. The Company does not intend to sell the investment securities that were in an unrealized loss position and it is not more likely than not that the Company will be required to sell the investment securities before recovery of their amortized cost basis, which may be at maturity. Available-for-sale debt securities issued by U.S. government agencies or U.S. government-sponsored enterprises carry the explicit and/or implicit guarantee of the U.S. government and have a long history of zero credit loss. Corporate debt securities and municipal bonds are considered to have issuer(s) of high credit quality (rated AA or higher) and the decline in fair value is due to changes in interest rates and other market conditions. The issuer(s) continues to make timely principal and interest payments on the bonds. The fair value is expected to recover as the bond(s) approach maturity.
WASHINGTON FEDERAL, INC. AND SUBSIDIARIES
NOTES TO THE CONSOLIDATED FINANCIAL STATEMENTS
YEARS ENDED SEPTEMBER 30, 2020, 2019, AND 2018
NOTE D - LOANS RECEIVABLE
For a detailed discussion of loans and credit quality, including accounting policies and the CECL methodology used to estimate the allowance for credit losses, see Note A "Summary of Significant Accounting Policies" and Note B "New Accounting Pronouncements" above.
The Company's loans held for investment are divided into two portfolio segments, commercial loans and consumer loans, with each of those segments further split into loan classes for purposes of estimating the allowance for credit losses.
The following table is a summary of loans receivable by loan portfolio segment and class.
| | | | | | | | | | | | | | | | | |
| | September 30, 2020 | | September 30, 2019 |
| | ($ in thousands) | | ($ in thousands) |
| Gross loans by category | | | | | |
| Commercial loans | | | | | |
| Multi-family | $ | 1,538,762 | | 10.6 | % | | $ | 1,422,674 | | 10.7 | % |
| Commercial real estate | 1,895,086 | | 13.1 | | | 1,631,170 | | 12.3 | |
| Commercial & industrial (1) | 2,132,160 | | 14.7 | | | 1,268,695 | | 9.5 | |
| Construction | 2,403,276 | | 16.6 | | | 2,038,052 | | 15.3 | |
| Land - acquisition & development | 193,745 | | 1.3 | | | 204,107 | | 1.5 | |
| Total commercial loans | 8,163,029 | | 56.3 | | | 6,564,698 | | 49.3 | |
| Consumer loans | | | | | |
| Single-family residential | 5,304,689 | | 36.7 | | | 5,835,194 | | 43.8 | |
| Construction - custom | 674,879 | | 4.7 | | | 540,741 | | 4.1 | |
| Land - consumer lot loans | 102,263 | | 0.7 | | | 99,694 | | 0.7 | |
| HELOC | 139,703 | | 1.0 | | | 142,178 | | 1.1 | |
| Consumer | 83,159 | | 0.6 | | | 129,883 | | 1.0 | |
| Total consumer loans | 6,304,693 | | 43.7 | | | 6,747,690 | | 50.7 | |
| Total gross loans | 14,467,722 | | 100 | % | | 13,312,388 | | 100 | % |
| Less: | | | | | |
| Allowance for loan losses | 166,955 | | | | 131,534 | | |
| Loans in process | 1,456,072 | | | | 1,201,341 | | |
| Net deferred fees, costs and discounts | 52,378 | | | | 48,938 | | |
| Total loan contra accounts | 1,675,405 | | | | 1,381,813 | | |
| Net loans | $ | 12,792,317 | | | | $ | 11,930,575 | | |
| | | | | |
(1) Includes $762,004,000 of SBA Payroll Protection Program loans as of September 30, 2020.
The Company elected to exclude AIR from the amortized cost basis of loans for disclosure purposes and from the calculations of estimated credit losses. As of September 30, 2020 and September 30, 2019, AIR for loans totaled $48,704,000 and $41,429,000, respectively, and is included in the “accrued interest receivable” line item on the Company’s consolidated statements of financial condition.
Loans in the amount of $5,361,504,000 and $5,874,704,000 at September 30, 2020 and September 30, 2019, respectively, were pledged to secure borrowings from the FHLB as part of our liquidity management strategy. The FHLB does not have the right to sell or re-pledge these loans.
WASHINGTON FEDERAL, INC. AND SUBSIDIARIES
NOTES TO THE CONSOLIDATED FINANCIAL STATEMENTS
YEARS ENDED SEPTEMBER 30, 2020, 2019, AND 2018
The following summary breaks down the Company's fixed rate and adjustable rate loans by time to maturity or to rate adjustment.
| | | | | | | | | | | | | | | | | | | | |
| September 30, 2020 |
| Fixed-Rate | | Adjustable-Rate |
| Term To Maturity | Loans | % of Loans | | Term To Rate Adjustment | Loans | % of Loans |
| | (In thousands) | | | | (In thousands) | |
| Within 1 year | $ | 128,254 | | 1.0 | % | | Less than 1 year | $ | 3,592,689 | | 27.7 | % |
| 1 to 3 years | 1,179,316 | | 9.1 | | | 1 to 3 years | 440,980 | | 3.4 | |
| 3 to 5 years | 398,019 | | 3.1 | | | 3 to 5 years | 588,366 | | 4.5 | |
| 5 to 10 years | 1,044,581 | | 8.1 | | | 5 to 10 years | 46,473 | | 0.4 | |
| 10 to 20 years | 983,856 | | 7.6 | | | 10 to 20 years | 25,190 | | 0.2 | |
| Over 20 years | 4,517,836 | | 34.9 | | | Over 20 years | 13,712 | | 0.1 | |
| $ | 8,251,862 | | 63.8 | % | | | $ | 4,707,410 | | 36.3 | % |
The Company has granted loans to officers and directors of the Company and related interests. These loans are made on the same terms, including interest rates and collateral, as those prevailing at the time for comparable transactions with unrelated persons and do not involve more than the normal risk of collectability. The aggregate dollar amount of these loans, including unfunded commitments to lend, was $112,812,000 and $76,288,000 at September 30, 2020 and 2019, respectively. As of September 30, 2020, all of these loans were performing in accordance with contractual terms.
WASHINGTON FEDERAL, INC. AND SUBSIDIARIES
NOTES TO THE CONSOLIDATED FINANCIAL STATEMENTS
YEARS ENDED SEPTEMBER 30, 2020, 2019, AND 2018
The following table sets forth the amortized cost basis of loans receivable for specific disclosures required by ASC 326.
| | | | | | | | | | | | | | | | | | | | | | | | | | | | | | | | | | | |
| | September 30, 2020 | | September 30, 2019 |
| | (In thousands, except ratio data) |
| Non-accrual | | Non-accrual with no ACL | | 90 days or more past due and accruing | | Non-accrual | | Non-accrual with no ACL | | 90 days or more past due and accruing |
| Commercial loans | | | | | | | | | | | |
| Multi-family | $ | — | | | $ | — | | | $ | — | | | $ | — | | | $ | — | | | $ | — | |
| Commercial real estate | 3,771 | | | — | | | — | | | 5,835 | | | — | | | — | |
| Commercial & industrial | 329 | | | — | | | — | | | 1,292 | | | — | | | — | |
| Construction | 1,669 | | | — | | | — | | | — | | | — | | | — | |
| Land - acquisition & development | — | | | — | | | — | | | 169 | | | — | | | — | |
| Total commercial loans | 5,769 | | | — | | | — | | | 7,296 | | | — | | | — | |
| Consumer loans | | | | | | | | | | | |
| Single-family residential | 22,431 | | | — | | | 933 | | | 25,271 | | | — | | | 1,671 | |
| Construction - custom | — | | | — | | | — | | | — | | | — | | | — | |
| Land - consumer lot loans | 243 | | | — | | | — | | | 246 | | | — | | | 620 | |
| HELOC | 553 | | | — | | | — | | | 907 | | | — | | | — | |
| Consumer | 60 | | | — | | | 17 | | | 11 | | | — | | | 19 | |
| Total consumer loans | 23,287 | | | — | | | 950 | | | 26,435 | | | — | | | 2,310 | |
| Total loans | $ | 29,056 | | | $ | — | | | $ | 950 | | | $ | 33,731 | | | $ | — | | | $ | 2,310 | |
| % of total loans | 0.22 | % | | | | | | 0.28 | % | | | | |
The following tables break down loan delinquencies by loan portfolio segment and class.
| | | | | | | | | | | | | | | | | | | | | | | | | | | | | | | | | | | | | | | | | |
| September 30, 2020 | | | Days Delinquent Based on $ Amount of Loans | | % based
on $ |
| Loan type | Loans Receivable (Amortized Cost) | | Current | | 30 | | 60 | | 90 | | Total | |
| ($ in thousands) | | |
| Commercial loans | | | | | | | | | | | | | |
| Multi-Family | $ | 1,538,240 | | | $ | 1,538,240 | | | $ | — | | | $ | — | | | $ | — | | | $ | — | | | — | % |
| Commercial Real Estate | 1,884,688 | | | 1,884,210 | | | — | | | 195 | | | 283 | | | 478 | | | 0.03 | |
| Commercial & Industrial | 2,115,513 | | | 2,114,650 | | | — | | | 583 | | | 280 | | | 863 | | | 0.04 | |
| Construction - Speculative | 1,352,414 | | | 1,350,752 | | | — | | | — | | | 1,662 | | | 1,662 | | | 0.12 | |
| Land - Acquisition & Development | 153,571 | | | 153,571 | | | — | | | — | | | — | | | — | | | — | |
| Total commercial loans | 7,044,426 | | | 7,041,423 | | | — | | | 778 | | | 2,225 | | | 3,003 | | | 0.04 | |
| Consumer loans | | | | | | | | | | | | | |
| Single-Family Residential | 5,293,962 | | | 5,267,608 | | | 3,922 | | | 3,108 | | | 19,324 | | | 26,354 | | | 0.50 | |
| Construction - Custom | 295,953 | | | 295,953 | | | — | | | — | | | — | | | — | | | — | |
| Land - Consumer Lot Loans | 101,394 | | | 101,029 | | | 152 | | | — | | | 213 | | | 365 | | | 0.36 | |
| HELOC | 140,222 | | | 139,491 | | | 275 | | | 76 | | | 380 | | | 731 | | | 0.52 | |
| Consumer | 83,315 | | | 82,959 | | | 121 | | | 11 | | | 224 | | | 356 | | | 0.43 | |
| Total consumer loans | 5,914,846 | | | 5,887,040 | | | 4,470 | | | 3,195 | | | 20,141 | | | 27,806 | | | 0.47 | |
| Total Loans | $ | 12,959,272 | | | $ | 12,928,463 | | | $ | 4,470 | | | $ | 3,973 | | | $ | 22,366 | | | $ | 30,809 | | | 0.24 | % |
| Delinquency % | | | 99.76% | | 0.03% | | 0.03% | | 0.17% | | 0.24% | | |
WASHINGTON FEDERAL, INC. AND SUBSIDIARIES
NOTES TO THE CONSOLIDATED FINANCIAL STATEMENTS
YEARS ENDED SEPTEMBER 30, 2020, 2019, AND 2018
| | | | | | | | | | | | | | | | | | | | | | | | | | | | | | | | | | | | | | | | | |
| September 30, 2019 | | | Days Delinquent Based on $ Amount of Loans | | % based
on $ |
| Loan type | Loans Receivable (Net of Loans in Process) | | Current | | 30 | | 60 | | 90 | | Total | |
| ($ in thousands) | | |
| Commercial loans | | | | | | | | | | | | | |
| Multi-Family | $ | 1,422,652 | | | $ | 1,422,652 | | | $ | — | | | $ | — | | | $ | — | | | $ | — | | | — | % |
| Commercial Real Estate | 1,631,171 | | | 1,625,509 | | | 1,614 | | | 285 | | | 3,763 | | | 5,662 | | | 0.35 | |
| Commercial & Industrial | 1,268,695 | | | 1,267,828 | | | — | | | — | | | 867 | | | 867 | | | 0.07 | |
| Construction - Speculative | 1,164,889 | | | 1,164,889 | | | — | | | — | | | — | | | — | | | — | |
| Land - Acquisition & Development | 161,194 | | | 161,194 | | | — | | | — | | | — | | | — | | | — | |
| Total commercial loans | 5,648,601 | | | 5,642,072 | | | 1,614 | | | 285 | | | 4,630 | | | 6,529 | | | 0.12 | |
| Consumer loans | | | | | | | | | | | | | |
| Single-Family Residential | 5,835,186 | | | 5,809,239 | | | 3,672 | | | 3,211 | | | 19,064 | | | 25,947 | | | 0.44 | |
| Construction - Custom | 255,505 | | | 255,505 | | | — | | | — | | | — | | | — | | | — | |
| Land - Consumer Lot Loans | 99,694 | | | 98,916 | | | 112 | | | 619 | | | 47 | | | 778 | | | 0.78 | |
| HELOC | 142,178 | | | 140,718 | | | 580 | | | 183 | | | 697 | | | 1,460 | | | 1.03 | |
| Consumer | 129,883 | | | 129,227 | | | 295 | | | 117 | | | 244 | | | 656 | | | 0.51 | |
| Total consumer loans | 6,462,446 | | | 6,433,605 | | | 4,659 | | | 4,130 | | | 20,052 | | | 28,841 | | | 0.45 | |
| Total Loans | $ | 12,111,047 | | | $ | 12,075,677 | | | $ | 6,273 | | | $ | 4,415 | | | $ | 24,682 | | | $ | 35,370 | | | 0.29 | % |
| Delinquency % | | | 99.71% | | 0.05% | | 0.04% | | 0.20% | | 0.29% | | |
The Company participated in the Small Business Administration’s Paycheck Protection Program. This program came about through the Coronavirus Aid, Relief, and Economic Security Act (“CARES Act”) passed by Congress to help small businesses keep their employees employed through the COVID-19 shelter in place orders. In 2020, the Company assisted over 6,500 businesses with more than $780,000,000 in PPP loan originations.
The Company is actively working with its borrowers to modify consumer mortgage and commercial loans to provide payment deferrals as a result of the COVID-19 pandemic. The terms of the payment deferrals are generally 90 days for consumer mortgage loans and up to 180 days for commercial loans and borrowers may be eligible for multiple deferrals. Pursuant to the CARES Act, these loan modifications are not accounted for as TDRs. As of September 30, 2020, 612 mortgage loans totaling $171,000,000 and 69 commercial loans totaling $167,000,000 that had been modified remain in deferral. These loans are not considered past due until after the deferral period is over and scheduled payments have resumed.
Most TDRs are accruing and performing loans where the borrower has proactively approached the Company about modifications due to temporary financial difficulties. Each request is individually evaluated for merit and likelihood of success. The concession for these loans is typically a payment reduction through a rate reduction of 100 to 200 bps for a specific term, usually six to 12 months. Interest-only payments may also be approved during the modification period. Principal forgiveness is not an available option for restructured loans. As of September 30, 2020, the outstanding balance of TDRs was $91,408,000 as compared to $121,677,000 as of September 30, 2019. As of September 30, 2020, 97.4% of the restructured loans were performing. Single-family residential loans comprised 93.6% of TDRs as of September 30, 2020. The Company's ACL methodology takes into account the following performance indicators for restructured loans: 1) time since modification, 2) current payment status and 3) geographic area.
We evaluate the credit quality of our commercial loans based on regulatory risk ratings and also consider other factors. Based on this evaluation, the loans are assigned a grade and classified as follows:
•Pass – the credit does not meet one of the definitions below.
WASHINGTON FEDERAL, INC. AND SUBSIDIARIES
NOTES TO THE CONSOLIDATED FINANCIAL STATEMENTS
YEARS ENDED SEPTEMBER 30, 2020, 2019, AND 2018
•Special mention – A special mention credit is considered to be currently protected from loss but is potentially weak. No loss of principal or interest is foreseen; however, proper supervision and management attention is required to deter further deterioration in the credit. Assets in this category constitute some undue and unwarranted credit risk but not to the point of justifying a risk rating of substandard. The credit risk may be relatively minor yet constitutes an unwarranted risk in light of the circumstances surrounding a specific asset.
•Substandard – A substandard credit is an unacceptable credit. Additionally, repayment in the normal course is in jeopardy due to the existence of one or more well defined weaknesses. In these situations, loss of principal is likely if the weakness is not corrected. A substandard asset is inadequately protected by the current sound worth and paying capacity of the borrower or of the collateral pledged, if any. Assets so classified will have a well-defined weakness or weaknesses that jeopardize the collection or liquidation of the debt. Loss potential, while existing in the aggregate amount of substandard assets, does not have to exist in individual assets risk rated substandard.
•Doubtful – A credit classified doubtful has all the weaknesses inherent in one classified substandard with the added characteristic that the weakness makes collection or liquidation in full, on the basis of currently existing facts, conditions and values, highly questionable and improbable. The probability of loss is high, but because of certain important and reasonably specific pending factors that may work to the advantage and strengthening of the asset, its classification as an estimated loss is deferred until its more exact status may be determined. Pending factors include proposed merger, acquisition, or liquidation procedures, capital injection, perfecting liens on additional collateral, and refinancing plans.
•Loss – Credits classified loss are considered uncollectible and of such little value that their continuance as a bankable asset is not warranted. This classification does not mean that the asset has absolutely no recovery or salvage value, but rather it is not practical or desirable to defer writing off this asset even though partial recovery may be affected in the future. Losses should be taken in the period in which they are identified as uncollectible. Partial charge-off versus full charge-off may be taken if the collateral offers some identifiable protection.
The following tables present by credit quality indicator, loan class, and year of origination, the amortized cost basis of loans receivable as of September 30, 2020.
WASHINGTON FEDERAL, INC. AND SUBSIDIARIES
NOTES TO THE CONSOLIDATED FINANCIAL STATEMENTS
YEARS ENDED SEPTEMBER 30, 2020, 2019, AND 2018
| | | | | | | | | | | | | | | | | | | | | | | | | | | | | |
| Term Loans Amortized Cost Basis by Origination Year | | | |
| (In thousands) | 2020 | 2019 | 2018 | 2017 | 2016 | Prior to 2016 | Revolving Loans | Revolving to Term Loans | Total Loans |
| Commercial loans | | | | | | | | | |
| Multi-family | | | | | | | | | |
| Pass | $ | 397,008 | | $ | 151,175 | | $ | 267,832 | | $ | 243,349 | | $ | 177,888 | | $ | 255,177 | | $ | 14,263 | | $ | — | | $ | 1,506,692 | |
| Special Mention | 649 | | 2,815 | | 907 | | 4,515 | | 2,654 | | 2,181 | | — | | — | | 13,721 | |
| Substandard | — | | 7,543 | | 3,974 | | 3,791 | | 2,298 | | 221 | | — | | — | | 17,827 | |
| | | | | | | | | |
| | | | | | | | | |
| | | | | | | | | |
| Total | $ | 397,657 | | $ | 161,533 | | $ | 272,713 | | $ | 251,655 | | $ | 182,840 | | $ | 257,579 | | $ | 14,263 | | $ | — | | $ | 1,538,240 | |
| Commercial real estate | | | | | | | | | |
| Pass | $ | 425,246 | | $ | 243,780 | | $ | 259,958 | | $ | 265,841 | | $ | 182,584 | | $ | 301,156 | | $ | 2,558 | | $ | 107 | | $ | 1,681,230 | |
| Special Mention | 5,096 | | 13,694 | | 3,987 | | 14,910 | | 303 | | 54,194 | | — | | — | | 92,184 | |
| Substandard | 4,196 | | 25,607 | | 2,718 | | 38,289 | | 10,041 | | 30,423 | | — | | — | | 111,274 | |
| | | | | | | | | |
| | | | | | | | | |
| | | | | | | | | |
| Total | $ | 434,538 | | $ | 283,081 | | $ | 266,663 | | $ | 319,040 | | $ | 192,928 | | $ | 385,773 | | $ | 2,558 | | $ | 107 | | $ | 1,884,688 | |
| Commercial & industrial | | | | | | | | | |
| Pass | $ | 908,408 | | $ | 64,015 | | $ | 90,796 | | $ | 79,421 | | $ | 99,426 | | $ | 75,672 | | $ | 580,123 | | $ | 848 | | $ | 1,898,709 | |
| Special Mention | 25,612 | | 7,107 | | 1,167 | | 4,330 | | 24,204 | | — | | 2,275 | | — | | 64,695 | |
| Substandard | 30,894 | | 9,696 | | 10,780 | | 901 | | 23,907 | | 4,561 | | 71,223 | | 147 | | 152,109 | |
| | | | | | | | | |
| | | | | | | | | |
| | | | | | | | | |
| Total | $ | 964,914 | | $ | 80,818 | | $ | 102,743 | | $ | 84,652 | | $ | 147,537 | | $ | 80,233 | | $ | 653,621 | | $ | 995 | | $ | 2,115,513 | |
| Construction | | | | | | | | | |
| Pass | $ | 344,346 | | $ | 405,030 | | $ | 239,125 | | $ | 132,034 | | $ | 290 | | $ | — | | $ | 66,961 | | $ | — | | $ | 1,187,786 | |
| Special Mention | 2,275 | | — | | 43,486 | | 15,417 | | — | | — | | — | | — | | 61,178 | |
| Substandard | 7 | | 33,457 | | 5,847 | | 21,915 | | 42,224 | | — | | — | | — | | 103,450 | |
| | | | | | | | | |
| | | | | | | | | |
| | | | | | | | | |
| Total | $ | 346,628 | | $ | 438,487 | | $ | 288,458 | | $ | 169,366 | | $ | 42,514 | | $ | — | | $ | 66,961 | | $ | — | | $ | 1,352,414 | |
| Land - acquisition & development | | | | | | | | | |
| Pass | $ | 47,223 | | $ | 43,297 | | $ | 18,139 | | $ | 18,338 | | $ | 3,774 | | $ | 1,911 | | $ | 5,316 | | $ | — | | $ | 137,998 | |
| Special Mention | — | | — | | — | | — | | — | | 15,573 | | — | | — | | 15,573 | |
| | | | | | | | | |
| | | | | | | | | |
| | | | | | | | | |
| | | | | | | | | |
| Total | $ | 47,223 | | $ | 43,297 | | $ | 18,139 | | $ | 18,338 | | $ | 3,774 | | $ | 17,484 | | $ | 5,316 | | $ | — | | $ | 153,571 | |
| Total commercial loans | | | | | | | | | |
| Pass | $ | 2,122,231 | | $ | 907,297 | | $ | 875,850 | | $ | 738,983 | | $ | 463,962 | | $ | 633,916 | | $ | 669,221 | | $ | 955 | | $ | 6,412,415 | |
| Special Mention | 33,632 | | 23,616 | | 49,547 | | 39,172 | | 27,161 | | 71,948 | | 2,275 | | — | | 247,351 | |
| Substandard | 35,097 | | 76,303 | | 23,319 | | 64,896 | | 78,470 | | 35,205 | | 71,223 | | 147 | | 384,660 | |
| | | | | | | | | |
| | | | | | | | | |
| | | | | | | | | |
| Total | $ | 2,190,960 | | $ | 1,007,216 | | $ | 948,716 | | $ | 843,051 | | $ | 569,593 | | $ | 741,069 | | $ | 742,719 | | $ | 1,102 | | $ | 7,044,426 | |
WASHINGTON FEDERAL, INC. AND SUBSIDIARIES
NOTES TO THE CONSOLIDATED FINANCIAL STATEMENTS
YEARS ENDED SEPTEMBER 30, 2020, 2019, AND 2018
| | | | | | | | | | | | | | | | | | | | | | | | | | | | | |
| Term Loans Amortized Cost Basis by Origination Year | | | |
| (In thousands) | 2020 | 2019 | 2018 | 2017 | 2016 | Prior to 2016 | Revolving Loans | Revolving to Term Loans | Total Loans |
| Consumer loans | | | | | | | | | |
| Single-family residential | | | | | | | | | |
| Current | $ | 828,030 | | $ | 585,133 | | $ | 597,198 | | $ | 714,066 | | $ | 523,000 | | $ | 2,020,181 | | $ | — | | $ | — | | $ | 5,267,608 | |
| 30 days past due | — | | — | | — | | 859 | | 135 | | 2,928 | | — | | — | | 3,922 | |
| 60 days past due | — | | — | | — | | — | | — | | 3,108 | | — | | — | | 3,108 | |
| 90+ days past due | — | | 680 | | — | | 440 | | 640 | | 17,564 | | — | | — | | 19,324 | |
| | | | | | | | | |
| Total | $ | 828,030 | | $ | 585,813 | | $ | 597,198 | | $ | 715,365 | | $ | 523,775 | | $ | 2,043,781 | | $ | — | | $ | — | | $ | 5,293,962 | |
| Construction - custom | | | | | | | | | |
| Current | $ | 200,853 | | $ | 91,940 | | $ | 3,160 | | $ | — | | $ | — | | $ | — | | $ | — | | $ | — | | $ | 295,953 | |
| | | | | | | | | |
| | | | | | | | | |
| | | | | | | | | |
| | | | | | | | | |
| Total | $ | 200,853 | | $ | 91,940 | | $ | 3,160 | | $ | — | | $ | — | | $ | — | | $ | — | | $ | — | | $ | 295,953 | |
| Land - consumer lot loans | | | | | | | | | |
| Current | $ | 44,908 | | $ | 18,139 | | $ | 6,971 | | $ | 7,693 | | $ | 2,619 | | $ | 20,699 | | $ | — | | $ | — | | $ | 101,029 | |
| 30 days past due | — | | — | | 152 | | — | | — | | — | | — | | — | | 152 | |
| | | | | | | | | |
| 90+ days past due | — | | — | | — | | 122 | | — | | 91 | | — | | — | | 213 | |
| | | | | | | | | |
| Total | $ | 44,908 | | $ | 18,139 | | $ | 7,123 | | $ | 7,815 | | $ | 2,619 | | $ | 20,790 | | $ | — | | $ | — | | $ | 101,394 | |
| HELOC | | | | | | | | | |
| Current | $ | — | | $ | — | | $ | — | | $ | — | | $ | — | | $ | 6,732 | | $ | 131,353 | | $ | 1,406 | | $ | 139,491 | |
| 30 days past due | — | | — | | — | | — | | — | | 44 | | 231 | | — | | 275 | |
| 60 days past due | — | | — | | — | | — | | — | | 37 | | 39 | | — | | 76 | |
| 90+ days past due | — | | — | | — | | — | | — | | 30 | | 350 | | — | | 380 | |
| | | | | | | | | |
| Total | $ | — | | $ | — | | $ | — | | $ | — | | $ | — | | $ | 6,843 | | $ | 131,973 | | $ | 1,406 | | $ | 140,222 | |
| Consumer | | | | | | | | | |
| Current | $ | 1,334 | | $ | 1,527 | | $ | 58,384 | | $ | 129 | | $ | 338 | | $ | 18,523 | | $ | 2,724 | | $ | — | | $ | 82,959 | |
| 30 days past due | — | | — | | — | | 62 | | — | | 59 | | — | | — | | 121 | |
| 60 days past due | — | | — | | — | | — | | — | | 11 | | — | | — | | 11 | |
| 90+ days past due | — | | 54 | | — | | 159 | | — | | 6 | | 5 | | — | | 224 | |
| | | | | | | | | |
| Total | $ | 1,334 | | $ | 1,581 | | $ | 58,384 | | $ | 350 | | $ | 338 | | $ | 18,599 | | $ | 2,729 | | $ | — | | $ | 83,315 | |
| Total consumer loans | | | | | | | | | |
| Current | $ | 1,075,125 | | $ | 696,739 | | $ | 665,713 | | $ | 721,888 | | $ | 525,957 | | $ | 2,066,135 | | $ | 134,077 | | $ | 1,406 | | $ | 5,887,040 | |
| 30 days past due | — | | — | | 152 | | 921 | | 135 | | 3,031 | | 231 | | — | | 4,470 | |
| 60 days past due | — | | — | | — | | — | | — | | 3,156 | | 39 | | — | | 3,195 | |
| 90+ days past due | — | | 734 | | — | | 721 | | 640 | | 17,691 | | 355 | | — | | 20,141 | |
| | | | | | | | | |
| Total | $ | 1,075,125 | | $ | 697,473 | | $ | 665,865 | | $ | 723,530 | | $ | 526,732 | | $ | 2,090,013 | | $ | 134,702 | | $ | 1,406 | | $ | 5,914,846 | |
WASHINGTON FEDERAL, INC. AND SUBSIDIARIES
NOTES TO THE CONSOLIDATED FINANCIAL STATEMENTS
YEARS ENDED SEPTEMBER 30, 2020, 2019, AND 2018
NOTE E - ALLOWANCE FOR LOAN LOSSES
For a detailed discussion of loans and credit quality, including accounting policies and the CECL methodology used to estimate the allowance for credit losses, see Note A, "Summary of Significant Accounting Policies."
As a result of the adoption of ASC 326 in fiscal 2020, with an effective date of October 1, 2019, there is a lack of comparability in both the allowance and provisions for credit losses for the periods presented. Results for reporting periods beginning after October 1, 2019 (as reflected in the table below) are presented using the CECL methodology, while comparative period information continues to be reported in accordance with the incurred loss methodology in effect for prior fiscal years. See Note B, "New Accounting Pronouncements," for details regarding the adoption of ASC 326.
| | | | | | | | | | | | | | | | | | | | | | | | | | | |
| September 30, 2019 | | CECL Adoption Impact | | October 1, 2019 (Post ASC 326 Adoption) | | | | | | | | September 30, 2020 |
| (In thousands) | | | | | | | | | |
| Allowance for credit losses: | | | | | | | | | | | | | |
| Commercial loans | | | | | | | | | | | | | |
| Multi-family | $ | 7,391 | | | $ | 3,013 | | | $ | 10,404 | | | | | | | | | $ | 13,853 | |
| Commercial real estate | 13,170 | | | (146) | | | 13,024 | | | | | | | | | 22,516 | |
| Commercial & industrial | 31,450 | | | 785 | | | 32,235 | | | | | | | | | 38,665 | |
| Construction | 32,304 | | | (9,536) | | | 22,768 | | | | | | | | | 24,156 | |
| Land - acquisition & development | 9,155 | | | 1,749 | | | 10,904 | | | | | | | | | 10,733 | |
| Total commercial loans | 93,470 | | | (4,135) | | | 89,335 | | | | | | | | | 109,923 | |
| Consumer loans | | | | | | | | | | | | | |
| Single-family residential | 30,988 | | | 16,783 | | | 47,771 | | | | | | | | | 45,186 | |
| Construction - custom | 1,369 | | | 1,511 | | | 2,880 | | | | | | | | | 3,555 | |
| Land - consumer lot loans | 2,143 | | | 492 | | | 2,635 | | | | | | | | | 2,729 | |
| HELOC | 1,103 | | | 945 | | | 2,048 | | | | | | | | | 2,571 | |
| Consumer | 2,461 | | | 2,154 | | | 4,615 | | | | | | | | | 2,991 | |
| Total consumer loans | 38,064 | | | 21,885 | | | 59,949 | | | | | | | | | 57,032 | |
| Total allowance for loan losses | $ | 131,534 | | | $ | 17,750 | | | 149,284 | | | | | | | | | 166,955 | |
| Reserve for unfunded commitments | $ | 6,900 | | | $ | 10,750 | | | 17,650 | | | | | | | | | 25,000 | |
| Total allowance for credit losses | $ | 138,434 | | | $ | 28,500 | | | $ | 166,934 | | | | | | | | | $ | 191,955 | |
| | | | | | | | | | | | | |
| | | | | | | | | | | | | |
| | | | | | | | | | | | | |
| | | | | | | | | | | | | |
| | | | | | | | | | | | | |
| | | | | | | | | | | | | |
| | | | | | | | | | | | | |
| | | | | | | | | | | | | |
| | | | | | | | | | | | | |
| | | | | | | | | | | | | |
WASHINGTON FEDERAL, INC. AND SUBSIDIARIES
NOTES TO THE CONSOLIDATED FINANCIAL STATEMENTS
YEARS ENDED SEPTEMBER 30, 2020, 2019, AND 2018
The following tables summarize the activity in the allowance for loan losses by loan portfolio segment and class.
| | | | | | | | | | | | | | | | | | | | | | | | | | | | | | | | | | | |
| Twelve Months Ended September 30, 2020 | Beginning
Allowance
(Before ASC 326 Adoption) | | Impact of ASC 326 Adoption | | Charge-offs | | Recoveries | | Provision &
Transfers | | Ending Allowance (After ASC 326 Adoption) |
| | (In thousands) |
| Commercial loans | | | | | | | | | | | |
| Multi-family | $ | 7,391 | | | $ | 3,013 | | | $ | — | | | $ | 498 | | | $ | 2,951 | | | $ | 13,853 | |
| Commercial real estate | 13,170 | | | (146) | | | (111) | | | 2,447 | | | 7,156 | | | 22,516 | |
| Commercial & industrial | 31,450 | | | 785 | | | (4,196) | | | 443 | | | 10,183 | | | 38,665 | |
| Construction - speculative | 32,304 | | | (9,536) | | | — | | | 188 | | | 1,200 | | | 24,156 | |
| Land - acquisition & development | 9,155 | | | 1,749 | | | (11) | | | 2,070 | | | (2,230) | | | 10,733 | |
| Total commercial loans | 93,470 | | | (4,135) | | | (4,318) | | | 5,646 | | | 19,260 | | | 109,923 | |
| Consumer loans | | | | | | | | | | | |
| Single-family residential | 30,988 | | | 16,783 | | | (131) | | | 1,394 | | | (3,848) | | | 45,186 | |
| Construction - custom | 1,369 | | | 1,511 | | | — | | | — | | | 675 | | | 3,555 | |
| Land - consumer lot loans | 2,143 | | | 492 | | | (237) | | | 639 | | | (308) | | | 2,729 | |
| HELOC | 1,103 | | | 945 | | | — | | | 95 | | | 428 | | | 2,571 | |
| Consumer | 2,461 | | | 2,154 | | | (1,069) | | | 1,252 | | | (1,807) | | | 2,991 | |
| Total consumer loans | 38,064 | | | 21,885 | | | (1,437) | | | 3,380 | | | (4,860) | | | 57,032 | |
| $ | 131,534 | | | $ | 17,750 | | | $ | (5,755) | | | $ | 9,026 | | | $ | 14,400 | | | $ | 166,955 | |
| | | | | | | | | | | | | | | | | | | | | | | | | | | | | |
| Twelve Months Ended September 30, 2019 | Beginning Allowance
(Before ASC 326 Adoption) | | Charge-offs | | Recoveries | | Provision &
Transfers | | Ending Allowance (Before ASC 326 Adoption) |
| (In thousands) |
| Commercial loans | | | | | | | | | |
| Multi-family | $ | 8,329 | | | $ | — | | | $ | — | | | $ | (938) | | | $ | 7,391 | |
| Commercial real estate | 11,852 | | | (428) | | | 1,102 | | | 644 | | | 13,170 | |
| Commercial & industrial | 28,702 | | | (5,782) | | | 3,443 | | | 5,087 | | | 31,450 | |
| Construction - speculative | 31,317 | | | — | | | 99 | | | 888 | | | 32,304 | |
| Land - acquisition & development | 7,978 | | | (107) | | | 7,457 | | | (6,173) | | | 9,155 | |
| Total commercial loans | 88,178 | | | (6,317) | | | 12,101 | | | (492) | | | 93,470 | |
| Consumer loans | | | | | | | | | |
| Single-family residential | 33,033 | | | (268) | | | 1,020 | | | (2,797) | | | 30,988 | |
| Construction - custom | 1,842 | | | (1,973) | | | — | | | 1,500 | | | 1,369 | |
| Land - consumer lot loans | 2,164 | | | (804) | | | 719 | | | 64 | | | 2,143 | |
| HELOC | 781 | | | (1,086) | | | 46 | | | 1,362 | | | 1,103 | |
| Consumer | 3,259 | | | (1,028) | | | 1,167 | | | (937) | | | 2,461 | |
| Total consumer loans | 41,079 | | | (5,159) | | | 2,952 | | | (808) | | | 38,064 | |
| $ | 129,257 | | | $ | (11,476) | | | $ | 15,053 | | | $ | (1,300) | | | $ | 131,534 | |
Primarily due to the continued economic distress caused by the COVID-19 pandemic, the Company recorded a provision for credit losses of $21,750,000 for the year ended September 30, 2020, as compared to a release of $1,650,000 for the year ended September 30, 2019. The relatively significant credit loss provision for 2020 is due primarily to COVID-19 related factors
WASHINGTON FEDERAL, INC. AND SUBSIDIARIES
NOTES TO THE CONSOLIDATED FINANCIAL STATEMENTS
YEARS ENDED SEPTEMBER 30, 2020, 2019, AND 2018
including estimated impacts to the energy, hospitality, restaurant and senior living industries. The release recorded for 2019 was a result of strong net recoveries and the overall quality of the loan portfolio as a result of a strong economy. The Company had recoveries, net of charge-offs, of $3,271,000 for the year ended September 30, 2020, compared with $3,577,000 of net recoveries for the year ended September 30, 2019. A loan is charged-off when the loss is estimable and it is confirmed that the borrower is not expected to be able to meet its contractual obligations. No allowance was recorded as of September 30, 2020 for the $745,081,000 of SBA PPP loans, which are included in the commercial & industrial loan category, due to the government guarantee.
Non-accrual loans decreased to $29,056,000 as of September 30, 2020, from $33,731,000 as of September 30, 2019. Non-performing assets totaled $37,695,000, or 0.20% of total assets, at September 30, 2020, compared to $43,826,000, or 0.27% of total assets, as of September 30, 2019.
As of September 30, 2020, the allowance for loan losses of $166,955,000 is for loans that are evaluated on a pooled basis, which was comprised of $115,457,000 related to the quantitative component and $51,498,000 related to management's qualitative overlays.
The following table shows loans collectively and individually evaluated for impairment and the related general and specific reserves.
| | | | | | | | | | | | | | | | | | | | | | | | | | | | | | | | | | | |
| September 30, 2019 | Loans Collectively Evaluated for Impairment | | Loans Individually Evaluated for Impairment |
| | General Reserve
Allocation | | Recorded Investment of Loans | | Ratio | | Specific Reserve
Allocation | | Recorded Investment of Loans | | Ratio |
| | (In thousands) | | | | (In thousands) |
| Commercial loans | | | | | | | | | | | |
| Multi-family | $ | 7,387 | | | $ | 1,422,266 | | | 0.5 | % | | $ | 4 | | | $ | 385 | | | 1.0 | % |
| Commercial real estate | 12,847 | | | 1,618,406 | | | 0.8 | | | 323 | | | 12,765 | | | 2.5 | |
| Commercial & industrial | 31,358 | | | 1,266,913 | | | 2.5 | | | 92 | | | 1,805 | | | 5.1 | |
| Construction - speculative | 32,304 | | | 1,164,889 | | | 2.8 | | | — | | | — | | | — | |
| Land - acquisition & development | 9,135 | | | 160,964 | | | 5.7 | | | 20 | | | 230 | | | 8.7 | |
| Total commercial loans | 93,031 | | | 5,633,438 | | | 1.7 | | | 439 | | | 15,185 | | | 2.9 | |
| Consumer loans | | | | | | | | | | | |
| Single-family residential | 30,988 | | | 5,822,200 | | | 0.5 | | | — | | | 17,978 | | | — | |
| Construction - custom | 1,369 | | | 255,505 | | | 0.5 | | | — | | | — | | | — | |
| Land - consumer lot loans | 2,143 | | | 95,574 | | | 2.2 | | | — | | | 375 | | | — | |
| HELOC | 1,103 | | | 140,378 | | | 0.8 | | | — | | | 837 | | | — | |
| Consumer | 2,461 | | | 129,527 | | | 1.9 | | | — | | | 50 | | | — | |
| Total consumer loans | 38,064 | | | 6,443,184 | | | 0.6 | | | — | | | 19,240 | | | — | |
| $ | 131,095 | | | $ | 12,076,622 | | | 1.1 | % | | $ | 439 | | | $ | 34,425 | | | 1.3 | % |
WASHINGTON FEDERAL, INC. AND SUBSIDIARIES
NOTES TO THE CONSOLIDATED FINANCIAL STATEMENTS
YEARS ENDED SEPTEMBER 30, 2020, 2019, AND 2018
The Company has an asset quality review function that analyzes its loan portfolio and reports the results of the review to its Board of Directors on a quarterly basis. The single-family residential, HELOC and consumer portfolios are evaluated based on their performance as a pool of loans, since no single loan is individually significant or judged by its risk rating, size or potential risk of loss. The construction, land, multi-family, commercial real estate and commercial and industrial loans are risk rated on a loan by loan basis to determine the relative risk inherent in specific borrowers or loans. Based on that risk rating, the loans are assigned a grade and classified as described in Note D "Loans Receivable."
The following table provides the amortized cost of loans receivable based on risk rating categories (as previously defined).
| | | | | | | | | | | | | | | | | | | | | | | | | | | | | | | | | | | |
| September 30, 2020 | Internally Assigned Grade | | |
| | Pass | | Special mention | | Substandard | | Doubtful | | Loss | | Total |
| | (In thousands) |
| Loan type | | | | | | | | | | | |
| Commercial loans | | | | | | | | | | | |
| Multi-family | $ | 1,506,692 | | | $ | 13,721 | | | $ | 17,827 | | | $ | — | | | $ | — | | | $ | 1,538,240 | |
| Commercial real estate | 1,681,230 | | | 92,184 | | | 111,274 | | | — | | | — | | | 1,884,688 | |
| Commercial & industrial | 1,898,709 | | | 64,695 | | | 152,109 | | | — | | | — | | | 2,115,513 | |
| Construction - speculative | 1,187,786 | | | 61,178 | | | 103,450 | | | — | | | — | | | 1,352,414 | |
| Land - acquisition & development | 137,998 | | | 15,573 | | | — | | | — | | | — | | | 153,571 | |
| Total commercial loans | 6,412,415 | | | 247,351 | | | 384,660 | | | — | | | — | | | 7,044,426 | |
| Consumer loans | | | | | | | | | | | |
| Single-family residential | 5,270,666 | | | 192 | | | 23,104 | | | — | | | — | | | 5,293,962 | |
| Construction - custom | 295,953 | | | — | | | — | | | — | | | — | | | 295,953 | |
| Land - consumer lot loans | 101,151 | | | — | | | 243 | | | — | | | — | | | 101,394 | |
| HELOC | 139,646 | | | — | | | 576 | | | — | | | — | | | 140,222 | |
| Consumer | 83,304 | | | — | | | 11 | | | — | | | — | | | 83,315 | |
| Total consumer loans | 5,890,720 | | | 192 | | | 23,934 | | | — | | | — | | | 5,914,846 | |
| Total loans | $ | 12,303,135 | | | $ | 247,543 | | | $ | 408,594 | | | $ | — | | | $ | — | | | $ | 12,959,272 | |
| | | | | | | | | | | |
| Total grade as a % of total loans | 94.9 | % | | 1.9 | % | | 3.2 | % | | — | % | | — | % | | |
The following table provides the gross loans receivable based on risk rating categories (as previously defined).
WASHINGTON FEDERAL, INC. AND SUBSIDIARIES
NOTES TO THE CONSOLIDATED FINANCIAL STATEMENTS
YEARS ENDED SEPTEMBER 30, 2020, 2019, AND 2018
| | | | | | | | | | | | | | | | | | | | | | | | | | | | | | | | | | | |
| September 30, 2019 | Internally Assigned Grade | | |
| | Pass | | Special mention | | Substandard | | Doubtful | | Loss | | Total Gross Loans |
| | (In thousands) |
| Loan type | | | | | | | | | | | |
| Commercial loans | | | | | | | | | | | |
| Multi-family | $ | 1,418,837 | | | $ | — | | | $ | 3,837 | | | $ | — | | | $ | — | | | $ | 1,422,674 | |
| Commercial real estate | 1,602,634 | | | 2,754 | | | 25,782 | | | — | | | — | | | 1,631,170 | |
| Commercial & industrial | 1,229,891 | | | 18,125 | | | 20,679 | | | — | | | — | | | 1,268,695 | |
| Construction - speculative | 2,038,052 | | | — | | | — | | | — | | | — | | | 2,038,052 | |
| Land - acquisition & development | 200,283 | | | — | | | 3,824 | | | — | | | — | | | 204,107 | |
| Total commercial loans | 6,489,697 | | | 20,879 | | | 54,122 | | | — | | | — | | | 6,564,698 | |
| Consumer loans | | | | | | | | | | | |
| Single-family residential | 5,808,444 | | | — | | | 26,750 | | | — | | | — | | | 5,835,194 | |
| Construction - custom | 540,741 | | | — | | | — | | | — | | | — | | | 540,741 | |
| Land - consumer lot loans | 98,828 | | | — | | | 866 | | | — | | | — | | | 99,694 | |
| HELOC | 141,271 | | | — | | | 907 | | | — | | | — | | | 142,178 | |
| Consumer | 129,872 | | | — | | | 11 | | | — | | | — | | | 129,883 | |
| Total consumer loans | 6,719,156 | | | — | | | 28,534 | | | — | | | — | | | 6,747,690 | |
| Total gross loans | $ | 13,208,853 | | | $ | 20,879 | | | $ | 82,656 | | | $ | — | | | $ | — | | | $ | 13,312,388 | |
| | | | | | | | | | | |
| Total grade as a % of total gross loans | 99.2 | % | | 0.2 | % | | 0.6 | % | | — | % | | — | % | | |
WASHINGTON FEDERAL, INC. AND SUBSIDIARIES
NOTES TO THE CONSOLIDATED FINANCIAL STATEMENTS
YEARS ENDED SEPTEMBER 30, 2020, 2019, AND 2018
The following table provides information on amortized cost of loans receivable based on borrower payment activity.
| | | | | | | | | | | | | | | | | | | | | | | |
| September 30, 2020 | Performing Loans | | Non-Performing Loans |
| | Amount | | % of Total Loans | | Amount | | % of Total Loans |
| | (In thousands) | | | | (In thousands) | | |
| Commercial loans | | | | | | | |
| Multi-family | $ | 1,538,240 | | | 100.0 | % | | $ | — | | | — | % |
| Commercial real estate | 1,880,917 | | | 99.8 | | | 3,771 | | | 0.2 | |
| Commercial & industrial | 2,115,184 | | | 100.0 | | | 329 | | | — | |
| Construction - speculative | 1,350,745 | | | 99.9 | | | 1,669 | | | 0.1 | |
| Land - acquisition & development | 153,571 | | | 100.0 | | | — | | | — | |
| Total commercial loans | 7,038,657 | | | 99.9 | | | 5,769 | | | 0.1 | |
| Consumer loans | | | | | | | |
| Single-family residential | 5,271,531 | | | 99.6 | | | 22,431 | | | 0.4 | |
| Construction - custom | 295,953 | | | 100.0 | | | — | | | — | |
| Land - consumer lot loans | 101,151 | | | 99.8 | | | 243 | | | 0.2 | |
| HELOC | 139,669 | | | 99.6 | | | 553 | | | 0.4 | |
| Consumer | 83,255 | | | 99.9 | | | 60 | | | 0.1 | |
| Total consumer loans | 5,891,559 | | | 99.6 | | | 23,287 | | | 0.4 | |
| Total | $ | 12,930,216 | | | 99.8 | % | | $ | 29,056 | | | 0.2 | % |
The following table provides information on gross loans based on borrower payment activity.
| | | | | | | | | | | | | | | | | | | | | | | |
| September 30, 2019 | Performing Loans | | Non-Performing Loans |
| | Amount | | % of Total
Gross Loans | | Amount | | % of Total
Gross Loans |
| | (In thousands) | | | | (In thousands) | | |
| Commercial loans | | | | | | | |
| Multi-family | $ | 1,422,674 | | | 100.0 | % | | $ | — | | | — | % |
| Commercial real estate | 1,625,335 | | | 99.6 | | | 5,835 | | | 0.4 | |
| Commercial & industrial | 1,267,403 | | | 99.9 | | | 1,292 | | | 0.1 | |
| Construction - speculative | 2,038,052 | | | 100.0 | | | — | | | — | |
| Land - acquisition & development | 203,938 | | | 99.9 | | | 169 | | | 0.1 | |
| Total commercial loans | 6,557,402 | | | 99.9 | | | 7,296 | | | 0.1 | |
| Consumer loans | | | | | | | |
| Single-family residential | 5,809,923 | | | 99.6 | | | 25,271 | | | 0.4 | |
| Construction - custom | 540,741 | | | 100.0 | | | — | | | — | |
| Land - consumer lot loans | 99,448 | | | 99.8 | | | 246 | | | 0.2 | |
| HELOC | 141,271 | | | 99.4 | | | 907 | | | 0.6 | |
| Consumer | 129,872 | | | 100.0 | | | 11 | | | — | |
| Total consumer loans | 6,721,255 | | | 99.6 | | | 26,435 | | | 0.4 | |
| Total gross loans | $ | 13,278,657 | | | 99.7 | % | | $ | 33,731 | | | 0.3 | % |
WASHINGTON FEDERAL, INC. AND SUBSIDIARIES
NOTES TO THE CONSOLIDATED FINANCIAL STATEMENTS
YEARS ENDED SEPTEMBER 30, 2020, 2019, AND 2018
The following table provides information on impaired loan balances and the related allowances by loan types.
| | | | | | | | | | | | | | | | | | | | | | | |
| September 30, 2019 | Recorded
Investment | | Unpaid
Principal
Balance | | Related
Allowance | | Average
Recorded
Investment |
| | (In thousands) |
| Impaired loans with no related allowance recorded: | | | | | | | |
| Multi-family | $ | — | | | $ | — | | | $ | — | | | $ | 286 | |
| Commercial real estate | 7,467 | | | 11,881 | | | — | | | 8,890 | |
| Commercial & industrial | 1,114 | | | 5,312 | | | — | | | 7,168 | |
| Construction | — | | | — | | | — | | | 1,172 | |
| Land - acquisition & development | 78 | | | 143 | | | — | | | 290 | |
| Single-family residential | 17,979 | | | 19,252 | | | — | | | 16,685 | |
| Construction - custom | — | | | — | | | — | | | 251 | |
| Land - consumer lot loans | 344 | | | 848 | | | — | | | 287 | |
| HELOC | 837 | | | 931 | | | — | | | 597 | |
| Consumer | 50 | | | 119 | | | — | | | 23 | |
| 27,869 | | | 38,486 | | | — | | | 35,649 | |
| Impaired loans with an allowance recorded: | | | | | | | |
| Multi-family | 385 | | | 385 | | | 4 | | | 418 | |
| Commercial real estate | 4,168 | | | 5,298 | | | 323 | | | 5,160 | |
| Commercial & industrial | 426 | | | 691 | | | 92 | | | 2,535 | |
| Construction | — | | | — | | | — | | | — | |
| Land - acquisition & development | 91 | | | 152 | | | — | | | 99 | |
| Single-family residential | 112,042 | | | 114,609 | | | 2,208 | | | 125,976 | |
| Construction - custom | — | | | — | | | — | | | — | |
| Land - consumer lot loans | 3,556 | | | 3,695 | | | 20 | | | 4,324 | |
| HELOC | 949 | | | 963 | | | — | | | 961 | |
| Consumer | 60 | | | 282 | | | — | | | 65 | |
| 121,677 | | | 126,075 | | | 2,647 | | (1) | 139,538 | |
| Total: | | | | | | | |
| Multi-family | 385 | | | 385 | | | 4 | | | 704 | |
| Commercial real estate | 11,635 | | | 17,179 | | | 323 | | | 14,050 | |
| Commercial & industrial | 1,540 | | | 6,003 | | | 92 | | | 9,703 | |
| Construction | — | | | — | | | — | | | 1,172 | |
| Land - acquisition & development | 169 | | | 295 | | | — | | | 389 | |
| Single-family residential | 130,021 | | | 133,861 | | | 2,208 | | | 142,661 | |
| Construction - custom | — | | | — | | | — | | | 251 | |
| Land - consumer lot loans | 3,900 | | | 4,543 | | | 20 | | | 4,611 | |
| HELOC | 1,786 | | | 1,894 | | | — | | | 1,558 | |
| Consumer | 110 | | | 401 | | | — | | | 88 | |
| $ | 149,546 | | | $ | 164,561 | | | $ | 2,647 | | (1) | $ | 175,187 | |
____________________
(1)Includes $439,000 of specific reserves and $2,208,000 included in the general reserves.
WASHINGTON FEDERAL, INC. AND SUBSIDIARIES
NOTES TO THE CONSOLIDATED FINANCIAL STATEMENTS
YEARS ENDED SEPTEMBER 30, 2020, 2019, AND 2018
NOTE F - FAIR VALUE MEASUREMENTS
FASB ASC 820 defines fair value as the exchange price that would be received for an asset or paid to transfer a liability (an exit price) in the principal or most advantageous market for the asset or liability in an orderly transaction between market participants on the measurement date. ASC 820 also establishes a fair value hierarchy which requires an entity to maximize the use of observable inputs and minimize the use of unobservable inputs when measuring fair value. The standard describes three levels of inputs that may be used to measure fair value:
Level 1: Quoted prices (unadjusted) for identical assets or liabilities in active exchange markets that the entity has the ability to access as of the measurement date.
Level 2: Significant other observable inputs other than Level 1 prices, such as quoted prices for similar assets or liabilities, quoted prices in markets that are not active and other inputs that are observable or can be corroborated by observable market data.
Level 3: Significant unobservable inputs that reflect a company’s own assumptions about the assumptions that market participants would use in pricing an asset or liability.
The Company has established and documented the process for determining the fair values of its assets and liabilities, where applicable. Fair value is based on quoted market prices, when available, for identical or similar assets or liabilities. In the absence of quoted market prices, fair value is determined using valuation models or third-party appraisals. The following is a description of the valuation methodologies used to measure and report the fair value of financial assets and liabilities on a recurring or nonrecurring basis.
Measured on a Recurring Basis
Available-for-sale investment securities and derivative contracts
Securities available for sale are recorded at fair value on a recurring basis. The fair value of debt securities are priced using model pricing based on the securities' relationship to other benchmark quoted prices as provided by an independent third party, and under GAAP are considered a Level 2 input method. Securities that are traded on active exchanges, including the Company's equity securities, are measured using the closing price in an active market and are considered a Level 1 input method.
The Company offers interest rate swaps to its variable rate borrowers who want to manage their interest rate risk. At the same time, the Company enters into the opposite trade with a counter party to offset its interest rate risk. The Company has also entered various forms of fair value hedges and cash flow hedges using interest rate swaps. The fair value of these interest rate swaps are estimated by a third party pricing service using a discounted cash flow technique. These are considered a Level 2 input method.
WASHINGTON FEDERAL, INC. AND SUBSIDIARIES
NOTES TO THE CONSOLIDATED FINANCIAL STATEMENTS
YEARS ENDED SEPTEMBER 30, 2020, 2019, AND 2018
The following tables present the balance and level in the fair value hierarchy for assets and liabilities that are measured at fair value on a recurring basis.
| | | | | | | | | | | | | | | | | | | | | | | |
| September 30, 2020 |
| Level 1 | | Level 2 | | Level 3 | | Total |
| (In thousands) |
| Available-for-sale securities | | | | | | | |
| | | | | | | |
| U.S. government and agency securities | $ | — | | | $ | 18,824 | | | $ | — | | | $ | 18,824 | |
| Asset-backed securities | — | | | 936,917 | | | | | 936,917 | |
| Municipal bonds | — | | | 38,315 | | | — | | | 38,315 | |
| | | | | | | |
| Corporate debt securities | — | | | 287,184 | | | — | | | 287,184 | |
| Mortgage-backed securities | | | | | | | |
| Agency pass-through certificates | — | | | 968,252 | | | — | | | 968,252 | |
| | | | | | | |
| | | | | | | |
| Total Available-for-sale securities | — | | | 2,249,492 | | | — | | | 2,249,492 | |
| Client swap program hedges | — | | | 48,201 | | | — | | | 48,201 | |
| | | | | | | |
| | | | | | | |
| | | | | | | |
| Total Financial Assets | $ | — | | | $ | 2,297,693 | | | $ | — | | | $ | 2,297,693 | |
| | | | | | | |
| Financial Liabilities | | | | | | | |
| Client swap program hedges | $ | — | | | $ | 48,201 | | | $ | — | | | $ | 48,201 | |
| Commercial loan fair value hedges | — | | | 8,492 | | | — | | | 8,492 | |
| Mortgage loan hedges | — | | | 16,061 | | | — | | | 16,061 | |
| Borrowings cash flow hedges | — | | | 17,375 | | | — | | | 17,375 | |
| Total Financial Liabilities | $ | — | | | $ | 90,129 | | | $ | — | | | $ | 90,129 | |
There were no transfers between, into and/or out of Levels 1, 2 or 3 during the year ended September 30, 2020.
WASHINGTON FEDERAL, INC. AND SUBSIDIARIES
NOTES TO THE CONSOLIDATED FINANCIAL STATEMENTS
YEARS ENDED SEPTEMBER 30, 2020, 2019, AND 2018
| | | | | | | | | | | | | | | | | | | | | | | |
| September 30, 2019 |
| Level 1 | | Level 2 | | Level 3 | | Total |
| (In thousands) |
| Available-for-sale securities | | | | | | | |
| | | | | | | |
| U.S. government and agency securities | $ | — | | | $ | 21,088 | | | $ | — | | | $ | 21,088 | |
| Asset-backed securities | — | | | 249,690 | | | — | | | 249,690 | |
| Municipal bonds | — | | | 22,642 | | | — | | | 22,642 | |
| | | | | | | |
| Corporate debt securities | — | | | 209,763 | | | — | | | 209,763 | |
| Mortgage-backed securities | | | | | | | |
| Agency pass-through certificates | — | | | 982,559 | | | — | | | 982,559 | |
| | | | | | | |
| | | | | | | |
| Total Available-for-sale securities | — | | | 1,485,742 | | | — | | | 1,485,742 | |
| Client swap program hedges | — | | | 20,381 | | | — | | | 20,381 | |
| | | | | | | |
| Mortgage loan fair value hedge | — | | | 1,608 | | | — | | | 1,608 | |
| | | | | | | |
| Total Financial Assets | $ | — | | | $ | 1,507,731 | | | $ | — | | | $ | 1,507,731 | |
| | | | | | | |
| Financial Liabilities | | | | | | | |
| Client swap program hedges | $ | — | | | $ | 20,381 | | | $ | — | | | $ | 20,381 | |
| Commercial loan hedges | — | | | 4,288 | | | — | | | 4,288 | |
| Borrowing hedges | — | | | 7,877 | | | — | | | 7,877 | |
| Total Financial Liabilities | $ | — | | | $ | 32,546 | | | $ | — | | | $ | 32,546 | |
There were no transfers between, into and/or out of Level 1, 2 or 3 during the year ended September 30, 2019.
Measured on a Nonrecurring Basis
Certain assets and liabilities are measured at fair value on a nonrecurring basis after initial recognition such as collateral dependent loans and real estate owned ("REO"). REO consists principally of properties acquired through foreclosure. From time to time, and on a nonrecurring basis, adjustments using fair value measurements are recorded to reflect increases or decreases based on the discounted cash flows, the current appraisal or estimated value of the collateral or REO property.
When management determines that the fair value of the collateral or the REO requires additional adjustments, either as a result of an updated appraised value or when there is no observable market price, the Company classifies the collateral dependent loan or real estate owned as Level 3. Level 3 assets recorded at fair value on a nonrecurring basis includes loans for which an allowance was established or a partial charge-off was recorded based on the fair value of collateral, as well as real estate owned where the fair value of the property was less than the cost basis.
WASHINGTON FEDERAL, INC. AND SUBSIDIARIES
NOTES TO THE CONSOLIDATED FINANCIAL STATEMENTS
YEARS ENDED SEPTEMBER 30, 2020, 2019, AND 2018
The following tables present the aggregated balance of assets that were measured at fair value on a nonrecurring basis for the periods presented, and the total gains (losses) resulting from those fair value adjustments during the respective periods. The estimated fair value measurements are shown gross of estimated selling costs.
| | | | | | | | | | | | | | | | | | | | | | | | | | | | | | | |
| | September 30, 2020 | | | | Twelve Months Ended September 30, 2020 |
| | Level 1 | | Level 2 | | Level 3 | | Total | | | | Total Gains (Losses) |
| | (In thousands) | | |
| Loans receivable (1) | $ | — | | | $ | — | | | $ | 2,277 | | | $ | 2,277 | | | | | $ | (4,843) | |
| Real estate owned (2) | — | | | — | | | 4,757 | | | 4,757 | | | | | (233) | |
| Balance at end of period | $ | — | | | $ | — | | | $ | 7,034 | | | $ | 7,034 | | | | | $ | (5,076) | |
(1)The gains (losses) represent re-measurements of collateral-dependent impaired loans.
(2)The gains (losses) represent aggregate write-downs and charge-offs on real estate owned.
| | | | | | | | | | | | | | | | | | | | | | | | | | | | | | | |
| | September 30, 2019 | | | | Twelve Months Ended September 30, 2019 |
| | Level 1 | | Level 2 | | Level 3 | | Total | | | | Total Gains (Losses) |
| | (In thousands) | | |
| Impaired loans (1) | $ | — | | | $ | — | | | $ | 6,662 | | | $ | 6,662 | | | | | $ | (7,796) | |
| Real estate owned (2) | — | | | — | | | 7,307 | | | 7,307 | | | | | 119 | |
| Balance at end of period | $ | — | | | $ | — | | | $ | 13,969 | | | $ | 13,969 | | | | | $ | (7,677) | |
(1)The gains (losses) represent re-measurements of collateral-dependent impaired loans.
(2)The gains (losses) represent aggregate write-downs and charge-offs on real estate owned.
The following describes the process used to value Level 3 assets measured on a nonrecurring basis:
At September 30, 2020, there was $718,000 in foreclosed residential real estate properties held as REO. The recorded investment of consumer mortgage loans secured by residential real estate properties for which formal foreclosure proceedings were in process was $2,663,000.
Fair Values of Financial Instruments
U. S. GAAP requires disclosure of fair value information about financial instruments, whether or not recognized on the statement of financial condition, for which it is practicable to estimate those values. Certain financial instruments and all non-financial instruments are excluded from the disclosure requirements. Accordingly, the aggregate fair value estimates presented do not reflect the underlying fair value of the Company. Although management is not aware of any factors that would materially affect the estimated fair value amounts presented below, such amounts have not been comprehensively revalued for purposes of these financial statements since the dates shown, and therefore, estimates of fair value subsequent to those dates may differ significantly from the amounts presented below.
WASHINGTON FEDERAL, INC. AND SUBSIDIARIES
NOTES TO THE CONSOLIDATED FINANCIAL STATEMENTS
YEARS ENDED SEPTEMBER 30, 2020, 2019, AND 2018
| | | | | | | | | | | | | | | | | | | | |
| | | September 30, 2020 | | September 30, 2019 |
| Level | Carrying
Amount | Estimated
Fair Value | | Carrying
Amount | Estimated
Fair Value |
| | | (In thousands) |
| Financial assets | | | | | | |
| Cash and cash equivalents | 1 | $ | 1,702,977 | | $ | 1,702,977 | | | $ | 419,158 | | $ | 419,158 | |
| Available-for-sale securities: | | | | | | |
| | | | | | |
| U.S. government and agency securities | 2 | 18,824 | | 18,824 | | | 21,088 | | 21,088 | |
| Asset-backed securities | 2 | 936,917 | | 936,917 | | | 249,690 | | 249,690 | |
| Municipal bonds | 2 | 38,315 | | 38,315 | | | 22,642 | | 22,642 | |
| | | | | | |
| Corporate debt securities | 2 | 287,184 | | 287,184 | | | 209,763 | | 209,763 | |
| Mortgage-backed securities | | | | | | |
| Agency pass-through certificates | 2 | 968,252 | | 968,252 | | | 982,559 | | 982,559 | |
| | | | | | |
| Total available-for-sale securities | | 2,249,492 | | 2,249,492 | | | 1,485,742 | | 1,485,742 | |
| Held-to-maturity securities: | | | | | | |
| | | | | | |
| | | | | | |
| | | | | | |
| | | | | | |
| | | | | | |
| Mortgage-backed securities | | | | | | |
| Agency pass-through certificates | 2 | 698,934 | | 720,516 | | | 1,428,480 | | 1,448,088 | |
| Commercial MBS | | 6,904 | | 6,852 | | | 15,000 | | 15,007 | |
| Total held-to-maturity securities | | 705,838 | | 727,368 | | | 1,443,480 | | 1,463,095 | |
| | | | | | |
| Loans receivable | 3 | 12,792,317 | | 13,392,089 | | | 11,930,575 | | 12,617,600 | |
| | | | | | |
| FHLB and FRB stock | 2 | 141,990 | | 141,990 | | | 123,990 | | 123,990 | |
| | | | | | |
| Other assets - client swap program hedges | 2 | 48,201 | | 48,201 | | | 20,381 | | 20,381 | |
| | | | | | |
| Other assets - mortgage loan fair value hedges | 2 | — | | — | | | 1,608 | | 1,608 | |
| | | | | | |
| | | | | | |
| Financial liabilities | | | | | | |
| Time deposits | 2 | 3,973,192 | | 3,963,203 | | | 4,906,963 | | 4,937,847 | |
| FHLB advances and other borrowings | 2 | 2,700,000 | | 2,722,509 | | | 2,250,000 | | 2,282,887 | |
| Other liabilities - client swap program hedges | 2 | 48,201 | | 48,201 | | | 20,381 | | 20,381 | |
| Other liabilities - commercial loan fair value hedges | 2 | 8,492 | | 8,492 | | | 4,288 | | 4,288 | |
| Other liabilities - mortgage loan fair value hedges | 2 | 16,061 | | 16,061 | | | — | | — | |
| Other liabilities - borrowings cash flow hedges | 2 | 17,375 | | 17,375 | | | 7,877 | | 7,877 | |
The following methods and assumptions were used to estimate the fair value of financial instruments:
Cash and cash equivalents – The carrying amount of these items is a reasonable estimate of their fair value.
Available-for-sale securities and held-to-maturity securities – Securities at fair value are primarily priced using model pricing based on the securities' relationship to other benchmark quoted prices as provided by an independent third party, and are considered a Level 2 input method. Equity securities which are exchange traded are considered a Level 1 input method.
Loans receivable – Fair values are estimated first by stratifying the portfolios of loans with similar financial characteristics. Loans are segregated by type such as multi-family real estate, residential mortgage, construction, commercial, consumer and land loans. Each loan category is further segmented into fixed- and adjustable-rate interest terms. For residential mortgages and multi-family loans, the bank determined that its best exit price was by securitization. MBS benchmark prices are used as a base price, with further loan level pricing adjustments made based on individual loan characteristics such as FICO score, LTV, Property Type and occupancy. For all other loan categories an estimate of fair value is then calculated based on discounted cash
WASHINGTON FEDERAL, INC. AND SUBSIDIARIES
NOTES TO THE CONSOLIDATED FINANCIAL STATEMENTS
YEARS ENDED SEPTEMBER 30, 2020, 2019, AND 2018
flows using a discount rate offered and observed in the market on similar products, plus an adjustment for liquidity to reflect the non-homogeneous nature of the loans, as well as, an annual loss rate based on historical losses to arrive at an estimated exit price fair value. Fair value for impaired loans is also based on recent appraisals or estimated cash flows discounted using rates commensurate with risk associated with the estimated cash flows. Assumptions regarding credit risk, cash flows and discount rates are judgmentally determined using available market information and specific borrower information.
FHLB and FRB stock – The fair value is based upon the par value of the stock which equates to its carrying value.
Time deposits – The fair value of fixed-maturity time deposits is estimated by discounting the estimated future cash flows using the rates currently offered for deposits with similar remaining maturities.
FHLB advances – The fair value of FHLB advances and other borrowings is estimated by discounting the estimated future cash flows using rates currently available to the Company for debt with similar remaining maturities.
Interest rate swaps – The Company offers interest rate swaps to its variable rate borrowers who want to manage their interest rate risk. At the same time, the Bank enters into the opposite trade with a counterparty to offset its interest rate risk. The Company also uses interest rate swaps for various fair value hedges and cash flow hedges. The fair value of interest rate swaps are estimated by a third-party pricing service using a discounted cash flow technique.
WASHINGTON FEDERAL, INC. AND SUBSIDIARIES
NOTES TO THE CONSOLIDATED FINANCIAL STATEMENTS
YEARS ENDED SEPTEMBER 30, 2020, 2019, AND 2018
NOTE G - DERIVATIVES AND HEDGING ACTIVITIES
On October 1, 2018, the Company early adopted ASU 2017-12, Targeted Improvements to Accounting for Hedge Activities. This standard primarily impacts the accounting for derivatives designated as fair value and cash flow accounting hedges.
The following tables present the fair value, notional amount and balance sheet classification of derivative assets and liabilities at September 30, 2020 and September 30, 2019.
| | | | | | | | | | | | | | | | | | | | | | | |
| September 30, 2020 | Derivative Assets | | Derivative Liabilities |
| Balance Sheet Location | Notional | Fair Value | | Balance Sheet Location | Notional | Fair Value |
| (In thousands) | | (In thousands) |
| Client swap program hedges | Other assets | $ | 656,074 | | $ | 48,201 | | | Other liabilities | $ | 656,074 | | $ | 48,201 | |
| Commercial loan fair value hedges | Other assets | — | | — | | | Other liabilities | 93,316 | | 8,492 | |
| Mortgage loan fair value hedges | Other assets | — | | — | | | Other liabilities | 500,000 | | 16,061 | |
| Borrowings cash flow hedges | Other assets | — | | — | | | Other liabilities | 1,600,000 | | 17,375 | |
| | $ | 656,074 | | $ | 48,201 | | | | $ | 2,849,390 | | $ | 90,129 | |
| | | | | | | | | | | | | | | | | | | | | | | |
| September 30, 2019 | Derivative Assets | | Derivative Liabilities |
| Interest rate contract purpose | Balance Sheet Location | Notional | Fair Value | | Balance Sheet Location | Notional | Fair Value |
| (In thousands) | | (In thousands) |
| Client swap program hedges | Other assets | $ | 425,607 | | $ | 20,381 | | | Other liabilities | $ | 425,607 | | $ | 20,381 | |
| Commercial loan fair value hedges | Other assets | — | | — | | | Other liabilities | 95,645 | | 4,288 | |
| Mortgage loan fair value hedges | Other assets | 200,000 | | 1,608 | | | Other liabilities | — | | — | |
| Borrowings cash flow hedges | Other assets | — | | — | | | Other liabilities | 700,000 | | 7,877 | |
| | $ | 625,607 | | $ | 21,989 | | | | $ | 1,221,252 | | $ | 32,546 | |
The Company enters into interest rate swaps to hedge interest rate risk. These arrangements include hedges of individual fixed rate commercial loans and also hedges of a specified portion of pools of prepayable fixed rate mortgage loans under the "last of layer" method. These relationships qualify as fair value hedges under FASB ASC 815, Derivatives and Hedging ("ASC 815"), which provides for offsetting of the recognition of gains and losses of the respective interest rate swap and the hedged items. Gains and losses on interest rate swaps designated in these hedge relationships, along with the offsetting gains and losses on the hedged items attributable to the hedged risk, are recognized in current earnings within the same income statement line item.
Upon electing to apply ASC 815 fair value hedge accounting, the carrying value of the hedged items are adjusted to reflect the cumulative impact of changes in fair value attributable to the hedged risk. The hedge basis adjustment remains with each hedged item until the hedged item is de-recognized from the balance sheet. The following tables presents the impact of fair value hedge accounting on the carrying value of the hedged items at September 30, 2020 and September 30, 2019.
| | | | | | | | |
| (In thousands) | September 30, 2020 |
| Balance sheet line item in which hedged item is recorded | Carrying value of hedged items | Cumulative gain (loss) fair value hedge adjustment included in carrying amount of hedged items |
| Loans receivable (1) (2) | $ | 2,562,765 | | $ | 24,664 | |
| $ | 2,562,765 | | $ | 24,664 | |
(1) Includes the amortized cost basis of the closed mortgage loan portfolios used to designate the hedging relationships in which the hedged items are the last layer expected to be remaining at the end of the hedging
WASHINGTON FEDERAL, INC. AND SUBSIDIARIES
NOTES TO THE CONSOLIDATED FINANCIAL STATEMENTS
YEARS ENDED SEPTEMBER 30, 2020, 2019, AND 2018
relationships. At September 30, 2020, the amortized cost basis of the closed loan portfolios used in the hedging relationships was $2,461,008,000, the cumulative basis adjustment associated with the hedging relationships was $16,049,000, and the amount of the designated hedged items was $500,000,000.
(2) Includes the amortized cost basis of commercial loans designated in fair value hedging relationships. At September 30, 2020, the amortized cost basis of the hedged commercial loans was $101,757,000 and the cumulative basis adjustment associated with the hedging relationships was $8,615,000.
| | | | | | | | |
| (In thousands) | September 30, 2019 |
| Balance sheet line item in which hedged item is recorded | Carrying value of hedged items | Cumulative gain (loss) fair value hedge adjustment included in carrying amount of hedged items |
| Loans receivable (1) (2) | $ | 1,612,208 | | $ | (2,680) | |
| $ | 1,612,208 | | $ | 2,680 | |
(1) Includes the amortized cost basis of the closed mortgage loan portfolios used to designate the hedging relationships in which the hedged items are the last layer expected to be remaining at the end of the hedging relationships. At September 30, 2019, the amortized cost basis of the closed loan portfolios used in the hedging relationships was $1,520,647,000, the cumulative basis adjustment associated with the hedging relationships was $1,608,000, and the amount of the designated hedged items was 200,000,000.
(2) Includes the amortized cost basis of commercial loans designated in fair value hedging relationships. At September 30, 2019, the amortized cost basis of the hedged commercial loans was $91,561,000 and the cumulative basis adjustment associated with the hedging relationships was $4,288,000.
The Company has entered into interest rate swaps to convert certain short-term borrowings to fixed rate payments. The primary purpose of these hedges is to mitigate the risk of changes in future cash flows resulting from increasing interest rates. For qualifying cash flow hedges under ASC 815, gains and losses on the interest rate swaps are recorded in accumulated other comprehensive income ("AOCI") and then reclassified into earnings in the same period the hedged cash flows affect earnings and within the same income statement line item as the hedged cash flows. As of September 30, 2020, the maturities for hedges of adjustable rate borrowings ranged from less than one year to ten years, with the weighted average being 6.7 years.
The following table presents the impact of derivative instruments (cash flow hedges on borrowings) on AOCI for the periods presented.
| | | | | | | | |
| (In thousands) | Twelve Months Ended September 30, |
| Amount of gain/(loss) recognized in AOCI on derivatives in cash flow hedging relationships | 2020 | 2019 |
| Interest rate contracts: | | |
| Pay fixed/receive floating swaps on cash flow hedges of borrowings | $ | (9,499) | | $ | (28,519) | |
| Total pre-tax gain/(loss) recognized in AOCI | $ | (9,499) | | $ | (28,519) | |
WASHINGTON FEDERAL, INC. AND SUBSIDIARIES
NOTES TO THE CONSOLIDATED FINANCIAL STATEMENTS
YEARS ENDED SEPTEMBER 30, 2020, 2019, AND 2018
The following table presents the gains/(losses) on derivative instruments in fair value and cash flow accounting hedging relationships under ASC 815 for the period presented.
| | | | | | | | | | | | | | |
| Twelve Months Ended September 30, 2020 | Twelve Months Ended September 30, 2019 |
| Interest income on loans receivable | Interest expense on FHLB advances | Interest income on loans receivable | Interest expense on FHLB advances |
| (In thousands) | (In thousands) |
| Interest income/(expense), including the effects of fair value and cash flow hedges | $ | 545,708 | | $ | (51,445) | | $ | 568,096 | | $ | (68,190) | |
| | | | |
| Gain/(loss) on fair value hedging relationships: | | | | |
| Interest rate contracts | | | | |
| Amounts related to interest settlements on derivatives | $ | (898) | | | $ | 128 | | |
| Recognized on derivatives | (21,873) | | | (6,504) | | |
| Recognized on hedged items | 21,906 | | | 6,479 | | |
| Net income/(expense) recognized on fair value hedges | $ | (865) | | | $ | 103 | | |
| | | | |
| Gain/(loss) on cash flow hedging relationships: | | | | |
| Interest rate contracts | | | | |
| Amounts related to interest settlements on derivatives | | $ | 6,075 | | | $ | (2,823) | |
| Amount of derivative gain/(loss) reclassified from AOCI into interest income/expense | | — | | | — | |
| Net income/(expense) recognized on cash flow hedges | | $ | 6,075 | | | $ | (2,823) | |
The Company periodically enters into certain interest rate swap agreements in order to provide commercial loan customers the ability to convert from variable to fixed interest rate payments, while the Company retains a variable rate loan. Under these agreements, the Company enters into a variable rate loan agreement and a swap agreement with the client. The swap agreement effectively converts the client’s variable rate loan into a fixed rate. The Company enters into a corresponding swap agreement with a third party in order to offset its exposure on the variable and fixed components of the client's swap agreement. The interest rate swaps are derivatives under ASC 815, with changes in fair value recorded in earnings. There was no net impact to the statement of operations for the years ended September 30, 2020 and 2019 as the changes in fair value of the receive fixed swap and pay fixed swap offset each other. As of September 30, 2020, $34,283,000 of the outstanding notional balance is associated with a related party loan.
The following table presents the impact of derivative instruments (client swap program) that are not designated in accounting hedges under ASC 815 for the periods presented.
| | | | | | | | | | | |
| (In thousands) | | Twelve Months Ended September 30, |
| Derivative instruments | Classification of gain/(loss) recognized in income on derivative instrument | 2020 | 2019 |
| Interest rate contracts: | | | |
| Pay fixed/receive floating swap | Other noninterest income | $ | (27,820) | | $ | (33,112) | |
| Receive fixed/pay floating swap | Other noninterest income | 27,820 | | 33,112 | |
| | $ | — | | $ | — | |
WASHINGTON FEDERAL, INC. AND SUBSIDIARIES
NOTES TO THE CONSOLIDATED FINANCIAL STATEMENTS
YEARS ENDED SEPTEMBER 30, 2020, 2019, AND 2018
NOTE H – REVENUE FROM CONTRACTS WITH CUSTOMERS
On October 1, 2018, the Company adopted ASU No. 2014-09, Revenue from Contracts with Customers ("ASC 606"). Since net interest income on financial assets and liabilities is excluded from this guidance, a significant majority of our revenues are not subject to the new guidance.
Revenue streams that are within the scope of the new guidance are presented within noninterest income and are, in general, recognized as revenue at the same time the Company's obligation to the customer is satisfied. Most of the Company's customer contracts that are within the scope of the new guidance are cancelable by either party without penalty and are short-term in nature. These sources of revenue include depositor and other consumer and business banking fees, commission income, as well as debit and credit card interchange fees. For fiscal years ended 2020 and 2019, in scope revenue streams represented approximately 5.1% and 5.0% of our total revenues, respectively. As this standard is immaterial to our consolidated financial statements, the Company has omitted certain disclosures in ASC 606, including the disaggregation of revenue table. Sources of noninterest income within the scope of the new guidance include the following:
Deposit related and other service charges (recognized in Deposit Fee Income): The Company's deposit accounts are governed by standardized contracts customary in the industry. Revenues are earned at a point in time or over time (monthly) from account maintenance fees and charges for specific transactions such as wire transfers, stop payment orders, overdrafts, debit card replacements, check orders and cashiers' checks. The Company’s performance obligation related to each of these fees is generally satisfied, and the related revenue recognized, at the time the service is provided (point in time or monthly). The Company is principal in each of these contracts.
Debit and credit card interchange fees (recognized in Deposit Fee Income): The Company receives interchange fees from the debit card and credit card payment networks based on transactions involving debit or credit cards issued by the Company, generally measured as a percentage of the underlying transaction. Interchange fees from debit and credit card transactions are recognized as the transaction processing services are provided by the network. The Company acts as an agent in the card payment network arrangement so the interchange fees are recorded net of any expenses paid to the principal (the card payment networks in this case).
Insurance agency commissions (recognized in Other Income): WAFD Insurance Group, Inc. is a wholly-owned subsidiary of Washington Federal Bank, N.A. that operates as an insurance agency, selling and marketing property and casualty insurance policies for a small number of high-quality insurance carriers. WAFD Insurance Group, Inc. earns revenue in the form of commissions paid by the insurance carriers for policies that have been sold. In addition to the origination commission, WAFD Insurance Group, Inc. may also receive contingent incentive fees based on the volume of business generated for the insurance carrier and based on policy renewal rates.
NOTE I - INTEREST RECEIVABLE
The following table provides a summary of interest receivable by interest-earning asset type.
| | | | | | | | | | | |
| September 30, 2020 | | September 30, 2019 |
| | (In thousands) |
| Loans receivable | $ | 48,704 | | | $ | 41,429 | |
| Mortgage-backed securities | 3,071 | | | 6,107 | |
| Investment securities | 2,024 | | | 1,321 | |
| $ | 53,799 | | | $ | 48,857 | |
NOTE J - PREMISES AND EQUIPMENT
The following table provides a summary of premises and equipment by asset type.
| | | | | | | | | | | |
| | September 30, 2020 | September 30, 2019 |
| | Estimated
Useful Life | (In thousands) |
| Land | — | | $ | 98,852 | | $ | 117,431 | |
| Buildings | 10 - 40 | 175,390 | | 165,088 | |
| Leasehold improvements | 5 - 15 | 15,123 | | 22,765 | |
| Furniture, software and equipment | 2 - 10 | 123,264 | | 138,553 | |
| | 412,629 | | 443,837 | |
| Less accumulated depreciation and amortization | | (159,824) | | (169,822) | |
| | $ | 252,805 | | $ | 274,015 | |
WASHINGTON FEDERAL, INC. AND SUBSIDIARIES
NOTES TO THE CONSOLIDATED FINANCIAL STATEMENTS
YEARS ENDED SEPTEMBER 30, 2020, 2019, AND 2018
NOTE K - CUSTOMER ACCOUNTS
The following tables provide the composition of the Company's customer accounts, including time deposits.
| | | | | | | | | | | | | | | | | | | | | | | | | | | | | | | | | | | |
| September 30, 2020 | | September 30, 2019 |
| | Deposit Account Balance | | As a % of Total Deposits | | Weighted
Average Rate | | Deposit Account Balance | | As a % of Total Deposits | | Weighted
Average Rate |
| ($ in thousands) | | | | | | | | | | | |
| Non-interest checking | $ | 2,164,071 | | | 15.7 | % | | — | % | | $ | 1,621,343 | | | 13.5 | % | | — | % |
| Interest checking | 3,029,576 | | | 22.0 | | | 0.23 | | | 1,984,576 | | | 16.6 | | | 0.61 | |
| Savings | 872,087 | | | 6.3 | | | 0.11 | | | 753,574 | | | 6.3 | | | 0.13 | |
| Money market | 3,740,698 | | | 27.1 | | | 0.30 | | | 2,724,308 | | | 22.7 | | | 0.82 | |
| Time deposits | 3,973,192 | | | 28.8 | | | 1.17 | | | 4,906,963 | | | 40.9 | | | 1.91 | |
| Total | $ | 13,779,624 | | | 100 | % | | 0.48 | % | | $ | 11,990,764 | | | 100 | % | | 1.08 | % |
| | | | | | | | |
| Time deposits by rate band are as follows: | September 30, 2020 | September 30, 2019 |
| | (In thousands) |
| Less than 1.00% | $ | 920,220 | | $ | 21,281 | |
| 1.00% to 1.99% | 2,967,345 | | 3,588,689 | |
| 2.00% to 2.99% | 85,533 | | 1,294,889 | |
| 3.00% to 3.99% | 94 | | 2,104 | |
| | |
| $ | 3,973,192 | | $ | 4,906,963 | |
| | |
| Time deposits by maturity band are as follows: | September 30, 2020 | September 30, 2019 |
| | (In thousands) |
| Within 1 year | $ | 3,127,416 | | $ | 3,489,839 | |
| 1 to 2 years | 532,264 | | 925,170 | |
| 2 to 3 years | 111,204 | | 294,990 | |
| Over 3 years | 202,308 | | 196,964 | |
| $ | 3,973,192 | | $ | 4,906,963 | |
Customer accounts over $250,000 totaled $5,491,395,000 as of September 30, 2020, compared to $3,609,961,000 as of September 30, 2019.
WASHINGTON FEDERAL, INC. AND SUBSIDIARIES
NOTES TO THE CONSOLIDATED FINANCIAL STATEMENTS
YEARS ENDED SEPTEMBER 30, 2020, 2019, AND 2018
Interest expense on customer accounts consisted of the following:
| | | | | | | | | | | |
| Year ended September 30, | 2020 | 2019 | 2018 |
| (In thousands) |
| Checking accounts | $ | 8,447 | | $ | 12,499 | | $ | 6,072 | |
| Savings accounts | 959 | | 980 | | 920 | |
| Money market accounts | 18,951 | | 21,967 | | 7,788 | |
| Time deposit accounts | 72,494 | | 87,665 | | 58,468 | |
| 100,851 | | 123,111 | | 73,248 | |
| Less early withdrawal penalties | (539) | | (895) | | (756) | |
| $ | 100,312 | | $ | 122,216 | | $ | 72,492 | |
| | | |
| Weighted average interest rate at end of year | 0.48 | % | 1.08 | % | 0.87 | % |
| Daily weighted average interest rate during the year | 0.94 | % | 1.05 | % | 0.65 | % |
NOTE L - FHLB ADVANCES AND OTHER BORROWINGS
The table below shows the contractual maturity dates of outstanding FHLB advances.
| | | | | | | | |
| September 30, 2020 | September 30, 2019 |
| | (In thousands) |
| FHLB advances | | |
| Within 1 year | $ | 1,830,000 | | $ | 950,000 | |
| 1 to 3 years | 520,000 | | 750,000 | |
| 3 to 5 years | 350,000 | | 400,000 | |
| More than 5 years | — | | 150,000 | |
| $ | 2,700,000 | | $ | 2,250,000 | |
As of September 30, 2020, there is $100,000,000 of FHLB advances that are callable as of August 7, 2020 and quarterly thereafter.
Financial information pertaining to the weighted-average cost and the amount of FHLB advances were as follows.
| | | | | | | | | | | |
| 2020 | 2019 | 2018 |
| | ($ in thousands) |
| Weighted average interest rate, including cash flow hedges, at end of year | 1.79 | % | 2.49 | % | 2.66 | % |
| Weighted daily average interest rate, including cash flow hedges, during the year | 2.03 | % | 2.69 | % | 2.62 | % |
| Daily average of FHLB advances during the year | $ | 2,532,596 | | $ | 2,533,890 | | $ | 2,384,795 | |
| Maximum amount of FHLB advances at any month end | $ | 3,050,000 | | $ | 2,665,000 | | $ | 2,620,000 | |
| Interest expense during the year (including swap interest income and expense) | $ | 51,445 | | $ | 68,190 | | $ | 62,452 | |
The Bank has a credit line with the FHLB equal to 45% of total assets, subject to collateral requirements.
The Bank has entered into borrowing agreements with the FHLB to borrow funds under a short-term floating rate cash management advance program and a fixed-rate term loan agreements. All borrowings are secured by stock of the FHLB, deposits with the FHLB and a blanket pledge of qualifying loans receivable as provided in the agreements with the FHLB.
WASHINGTON FEDERAL, INC. AND SUBSIDIARIES
NOTES TO THE CONSOLIDATED FINANCIAL STATEMENTS
YEARS ENDED SEPTEMBER 30, 2020, 2019, AND 2018
NOTE M - COMMITMENTS AND CONTINGENCIES
Lease Commitments - The Company’s lease commitments consist primarily of real estate property for branches and office space under various non-cancellable operating leases that expire between 2021 and 2070. The majority of the leases contain renewal options and provisions for increases in rental rates based on a predetermined schedule or an agreed upon index. If, at lease inception, the Company considers the exercising of a renewal option to be reasonably certain, the Company will include the extended term in the calculation of the right-of-use asset and lease liability.
Operating lease liabilities and right-of-use assets are recognized on the lease commencement date based on the present value of the future minimum lease payments over the lease term. The future lease payments are discounted at a rate that represents the Company's collateralized borrowing rate for financing instruments of a similar term and are included in Accrued expenses and other liabilities. The related right-of-use asset is included in Other assets.
The table below presents the Company’s operating lease right-of-use asset and the related lease liability.
| | | | | | |
| (In thousands) | September 30, 2020 | |
| Operating lease asset | $ | 31,610 | | |
| Operating lease liability | $ | 33,302 | | |
As of September 30, 2020, the Company’s operating leases have a weighted average remaining lease term of 8.8 years and a weighted average discount rate of 1.9%. Cash paid for amounts included in the measurement of the above operating lease liability was $6,494,000 for the twelve months ended September 30, 2020. Right-of-use assets obtained in exchange for new operating lease liabilities during the same period were $8,341,000.
The following table presents the components of net lease costs, a component of Occupancy expense. The Company elected not to separate lease and non-lease components and instead account for them as a single lease component. Variable lease costs include subsequent increases in index-based rents and variable payments such as common area maintenance.
| | | | | | |
| (In thousands) | | Twelve Months Ended September 30, |
| | 2020 |
| Operating lease cost | | $ | 6,557 | |
| Variable lease cost | | 1,353 | |
| Sublease income | | (338) | |
| Net lease cost | | $ | 7,572 | |
WASHINGTON FEDERAL, INC. AND SUBSIDIARIES
NOTES TO THE CONSOLIDATED FINANCIAL STATEMENTS
YEARS ENDED SEPTEMBER 30, 2020, 2019, AND 2018
The following table shows future minimum payments for operating leases as of September 30, 2020 for the respective periods.
| | | | | |
| (In thousands) | Year ending September 30, |
| |
| 2021 | $ | 6,617 | |
| 2022 | 5,917 | |
| 2023 | 5,348 | |
| 2024 | 4,547 | |
| 2025 | 3,603 | |
| Thereafter | 10,389 | |
| Total minimum payments | 36,421 | |
| Amounts representing interest | (3,119) | |
| Present value of minimum lease payments | $ | 33,302 | |
Future minimum lease payments for the Company’s operating leases as of September 30, 2019, prior to the adoption of the new lease guidance, were as follows.
| | | | | |
| (In thousands) | Year ending September 30, |
| |
| 2020 | $ | 5,838 | |
| 2021 | 5,246 | |
| 2022 | 4,698 | |
| 2023 | 4,302 | |
| 2024 | 3,596 | |
| Thereafter | 10,531 | |
| Total minimum payments | $ | 34,211 | |
| |
| |
Rental expense, including amounts paid under month-to-month cancelable leases, amounted to $6,455,000 and $6,477,000 in 2019, and 2018, respectively.
Financial Instruments with Off-Balance Sheet Risk - The only material off-balance-sheet credit exposures are loans in process and unused lines of credit, which had a combined balance of $2,738,095,000 and $2,379,089,000 at September 30, 2020 and September 30, 2019, respectively. The reserve for unfunded commitments was $25,000,000 as of September 30, 2020, which is an increase from $6,900,000 at September 30, 2019. See Note A "Summary of Significant Accounting Policies" for details regarding the reserve methodology.
Legal Proceedings - The Company and its subsidiaries are from time to time defendants in and are threatened with various legal proceedings arising from regular business activities. Management, after consulting with legal counsel, is of the opinion that the ultimate liability, if any, resulting from these pending or threatened actions and proceedings will not have a material effect on the financial statements of the Company.
WASHINGTON FEDERAL, INC. AND SUBSIDIARIES
NOTES TO THE CONSOLIDATED FINANCIAL STATEMENTS
YEARS ENDED SEPTEMBER 30, 2020, 2019, AND 2018
NOTE N - INCOME TAXES
Effective January 1, 2018, the corporate income tax rate was reduced to 21%. Because the Company has a fiscal year end of September 30, the reduced corporate tax rate resulted in the application of a blended federal statutory tax rate of 24.53% for its fiscal year 2018 and then 21% thereafter.
Under generally accepted accounting principles, the Company uses the asset and liability method of accounting for income taxes. Under this method, deferred tax assets and liabilities are recognized for the future tax consequences attributable to differences between the financial statement carrying amounts of existing assets and liabilities and their respective tax bases. Deferred tax assets and liabilities are measured using enacted tax rates applicable to taxable income in the years in which those temporary differences are expected to reverse.
The table below provides a summary of the Company's tax assets and liabilities, including deferred tax assets and deferred tax liabilities by major source. Deferred tax balances represent temporary differences between the financial statement and corresponding tax treatment of income, gains, losses, deductions or credits.
| | | | | | | | |
| September 30, 2020 | September 30, 2019 |
| | (In thousands) |
| Deferred tax assets | | |
| Allowance for credit losses | $ | 44,150 | | $ | 31,494 | |
| REO reserves | 265 | | 255 | |
| | |
| Non-accrual loan interest | 892 | | 891 | |
| | |
| Federal and state tax credits | — | | 537 | |
| Deferred compensation | 3,506 | | 3,022 | |
| Stock based compensation | 2,218 | | 1,876 | |
| Lease liability | 7,660 | | — | |
| Other | 2,269 | | 2,081 | |
| Total deferred tax assets | 60,960 | | 40,156 | |
| Deferred tax liabilities | | |
| FHLB stock dividends | 14,637 | | 14,478 | |
| Valuation adjustment on available-for-sale securities and cash flow hedges | 5,064 | | 4,503 | |
| Loan origination fees and costs | 7,116 | | 8,385 | |
| Premises and equipment | 21,399 | | 25,399 | |
| Lease right-of-use assets | 7,270 | | — | |
| Other | 5,767 | | 2,851 | |
| Total deferred tax liabilities | 61,253 | | 55,616 | |
| Net deferred tax asset (liability) | (293) | | (15,460) | |
| Current tax asset (liability) | 6,001 | | 10,356 | |
| Net tax asset (liability) | $ | 5,708 | | $ | (5,104) | |
WASHINGTON FEDERAL, INC. AND SUBSIDIARIES
NOTES TO THE CONSOLIDATED FINANCIAL STATEMENTS
YEARS ENDED SEPTEMBER 30, 2020, 2019, AND 2018
The table below presents a reconciliation of the statutory federal income tax rate to the Company's effective income tax rate.
| | | | | | | | | | | |
| Year ended September 30, | 2020 | 2019 | 2018 |
| Statutory income tax rate | 21 | % | 21 | % | 25 | % |
| State income tax | 2 | | 2 | | 2 | |
| Impact of change in Federal income tax rate | — | | — | | (2) | |
| Other differences | (2) | | (3) | | (4) | |
| Effective income tax rate | 21 | % | 20 | % | 21 | % |
The following table summarizes the Company's income tax expense (benefit) for the respective periods.
| | | | | | | | | | | |
| Year ended September 30, | 2020 | 2019 | 2018 |
| (In thousands) |
| Federal: | | | |
| Current | $ | 49,782 | | $ | 46,376 | | $ | 40,314 | |
| Deferred | (7,858) | | 1,916 | | 8,952 | |
| 41,924 | | 48,292 | | 49,266 | |
| State: | | | |
| Current | $ | 5,310 | | $ | 4,557 | | $ | 4,243 | |
| Deferred | (1,486) | | (330) | | (116) | |
| 3,824 | | 4,227 | | 4,127 | |
| Total | | | |
| Current | 55,092 | | 50,933 | | 44,557 | |
| Deferred | (9,344) | | 1,586 | | 8,836 | |
| $ | 45,748 | | $ | 52,519 | | $ | 53,393 | |
Based on current information, the Company does not expect that changes in the amount of unrecognized tax benefits over the next 12 months will have a significant impact on its results of operations or financial position. The Company does not have a liability for uncertain tax positions as of September 30, 2020 or September 30, 2019.
The Company's federal income tax returns are open and subject to potential examination by the IRS for fiscal years 2017 and later. State income tax returns are generally subject to examination for a period of three to five years after filing. The state impact of any federal changes remains subject to examination by various states for a period of up to two years after formal notification to the states.
NOTE O - 401(k) PLAN
The Company maintains a 401(k) Plan (the "Plan") for the benefit of its employees. Company contributions are made annually as approved by the Board of Directors. Such amounts are not in excess of amounts permitted by the Employee Retirement Income Security Act of 1974.
Plan participants may make voluntary after-tax contributions of their considered earnings as defined by the Plan. In addition, participants may make pre-tax contributions up to the statutory limits through the 401(k) provisions of the Plan. The annual addition from contributions to an individual participant's account in this Plan cannot exceed the lesser of 100% of base salary or $56,000.
WASHINGTON FEDERAL, INC. AND SUBSIDIARIES
NOTES TO THE CONSOLIDATED FINANCIAL STATEMENTS
YEARS ENDED SEPTEMBER 30, 2020, 2019, AND 2018
New employees become eligible to participate in the Plan and make employee contributions on the first day of the calendar month following the completion of 30 days days of employment. Such eligible employees do not become eligible for profit sharing or matching contributions until the first day of the quarter (January 1, April 1, July 1 or October 1) following completion of 1 year of service. A “year of service” is defined as a 12-month period in which the eligible employee works at least 1,000 hours of service and the first eligibility service period started on the first day of employment.
The Plan provides for a guaranteed safe harbor matching contribution equal to 100% of the first 4% of compensation that employees contribute to their account and this amount is immediately vested. The safe harbor match is not subject to the six year vesting schedule of the profit sharing contribution. This provides plan participants more investment flexibility. The Company anticipates that all eligible employees, regardless of personal plan participation, will continue to receive an annual discretionary profit sharing contribution from the Company, now capped at 7% of eligible compensation with this change.
Company contributions to the Plan amounted to $8,333,000, $6,920,000 and $5,910,000 for the years ended 2020, 2019 and 2018, respectively.
NOTE P - STOCK AWARD PLANS
The Company's stock based compensation plan provides for grants of stock options and restricted stock. On January 22, 2020, the shareholders approved the 2020 Incentive Plan. Upon approval of the 2020 Incentive Plan, the 2011 Incentive Plan terminated with respect to future awards, and the remaining shares that were not awarded under the 2011 Incentive Plan as of that date were canceled. A total of 3,200,000 shares are available for grant under the 2020 Incentive Plan and 2,546,414 shares remain available for issuance as of September 30, 2020.
When applicable, stock options are granted with an exercise price equal to the market price of the Company's stock at the date of grant; those option awards generally vest based on three to five years of continuous service and have 10-year contractual terms. The Company's policy is to issue new shares upon option exercises. The fair value of stock options granted is estimated on the date of grant using the Black-Scholes option-pricing model. Additionally, there may be other factors that would otherwise have a significant effect on the value of employee stock options granted but are not considered by the model. Expected volatility is based on the historical volatility of the Company's stock. The risk-free interest rate is based on the U.S. Treasury yield curve that is in effect at the time of grant with a remaining term equal to the options' expected life. The expected term represents the period of time that options granted are expected to be outstanding.
Stock Option Awards:
There were 1,043,349 stock options granted under the incentive plans during 2020, compared to 356,343 stock options granted in 2019 and no stock options granted in 2018 under the previous plan.
A summary of stock option activity and changes during the year are as follows.
WASHINGTON FEDERAL, INC. AND SUBSIDIARIES
NOTES TO THE CONSOLIDATED FINANCIAL STATEMENTS
YEARS ENDED SEPTEMBER 30, 2020, 2019, AND 2018
| | | | | | | | | | | | | | |
| Options | Number of Options | Weighted
Average
Exercise
Price | Weighted
Average
Remaining
Contractual
Term (Years) | Aggregate
Intrinsic
Value
(In thousands) |
| Outstanding at September 30, 2018 | 51,060 | | $ | 15.25 | | 2 | $ | 855 | |
| Granted | 356,343 | | 28.16 | | | |
| Exercised | (22,975) | | 12.99 | | | |
| Forfeited | (64,141) | | 27.96 | | | |
| Outstanding at September 30, 2019 | 320,287 | | 27.21 | | 8 | 3,136 | |
| Granted | 1,043,349 | | 29.53 | | | |
| Exercised | (8,085) | | 17.88 | | | |
| Forfeited | (125,827) | | 30.25 | | | |
| Outstanding at September 30, 2020 | 1,229,724 | | $ | 28.93 | | 9 | $ | — | |
| Exercisable at September 30, 2020 | 19,535 | | $ | 16.88 | | 0.5 | $ | 78 | |
The table below presents other information regarding stock options.
| | | | | | | | | | | |
| Year ended September 30, | 2020 | 2019 | 2018 |
| (In thousands, except grant date fair value per stock option) |
| Compensation cost for stock options | $ | 1,344 | | $ | 521 | | $ | — | |
| Weighted average grant date fair value per stock option | 4.37 | | 5.21 | | 3.15 | |
| Total intrinsic value of options exercised | 102 | | 414 | | 908 | |
| Grant date fair value of options exercised | 33 | | 51 | | 285 | |
| Cash received from option exercises | 144 | | 298 | | 1,338 | |
The following is a summary of activity related to unvested stock options.
| | | | | | | | | | | | | | | | | | | | | | | | | | |
| Year ended September 30, | 2020 | | 2019 | | 2018 |
| Unvested Stock Options | Options Outstanding | Weighted
Average
Grant Date
Fair Value | | Options Outstanding | Weighted
Average
Grant Date
Fair Value | | Options Outstanding | Weighted
Average
Grant Date
Fair Value |
| Outstanding at beginning of period | 293,167 | | $ | 5.33 | | | — | | $ | — | | | — | | $ | — | |
| Granted | 1,043,349 | | 4.17 | | | 356,343 | | 5.33 | | | — | | — | |
| Vested | — | | — | | | — | | — | | | — | | — | |
| Forfeited | (125,827) | | 4.83 | | | (63,176) | | 5.33 | | | — | | — | |
| Outstanding at end of period | 1,210,689 | | $ | 4.38 | | | 293,167 | | $ | 5.33 | | | — | | $ | — | |
As of September 30, 2020, there was $3,437,000 of unrecognized compensation cost related to stock options.
Restricted Stock Awards:
The Company grants shares of restricted stock pursuant to the incentive plans. The restricted stock grants are subject to a service condition and vest over a period of one to seven years.
WASHINGTON FEDERAL, INC. AND SUBSIDIARIES
NOTES TO THE CONSOLIDATED FINANCIAL STATEMENTS
YEARS ENDED SEPTEMBER 30, 2020, 2019, AND 2018
Certain grants of restricted stock to executive officers are also subject to additional market and performance conditions based upon meeting certain total shareholder return targets pre-established by the Board. The Company had a total of 409,469 shares of restricted stock outstanding as of September 30, 2020, with a total grant date fair value of $9,958,286.
The following table summarizes information about unvested restricted stock activity.
| | | | | | | | | | | | | | | | | | | | | | | | | | |
| Year ended September 30, | 2020 | | 2019 | | 2018 |
| Non-vested Restricted Stock | Outstanding | Weighted
Average
Fair Value | | Outstanding | Weighted
Average
Fair Value | | Outstanding | Weighted
Average
Fair Value |
| Outstanding at beginning of period | 435,838 | | $ | 23.73 | | | 460,999 | | $ | 22.52 | | | 466,681 | | $ | 18.56 | |
| Granted | 197,706 | | 26.24 | | | 249,272 | | 21.41 | | | 205,100 | | 26.11 | |
| Vested | (205,715) | | 25.56 | | | (159,103) | | 26.09 | | | (198,620) | | 16.65 | |
| Forfeited | (18,360) | | 17.20 | | | (115,330) | | 10.61 | | | (12,162) | | 27.00 | |
| Outstanding at end of period | 409,469 | | $ | 24.32 | | | 435,838 | | $ | 23.73 | | | 460,999 | | $ | 22.52 | |
Compensation expense related to restricted stock awards was $4,453,000, $4,188,000, and $4,259,000 for the years ended 2020, 2019 and 2018, respectively.
NOTE Q - SHAREHOLDERS' EQUITY
The Company and the Bank are subject to various regulatory capital requirements. Quantitative measures established by regulation to ensure capital adequacy require the Company and the Bank to maintain minimum amounts and ratios (set forth in the following table) of Common Equity Tier 1, Tier 1 and Total capital to risk weighted assets (as defined in the regulations) and Tier 1 capital to average assets (as defined in the regulations). Failure to meet minimum capital requirements can initiate certain mandatory and possibly additional discretionary action by regulators that, if undertaken, could have a direct material effect on the Company's financial statements. The Company and the Bank are also subject to certain restrictions on the amount of dividends that they may declare without prior regulatory approval.
As of September 30, 2020, and 2019, the Company and the Bank met all capital adequacy requirements to which they are subject, and the OCC categorized the Bank as well capitalized under the regulatory framework for prompt corrective action. To be categorized as well capitalized, the Bank must maintain minimum Common Equity Tier 1, Tier 1 risk-based, Total risk-based and Tier 1 leverage ratios as set forth in the following table. The Bank's actual capital amounts and ratios as of these dates are also presented. There are no conditions or events since that management believes have changed the Bank's categorization.
WASHINGTON FEDERAL, INC. AND SUBSIDIARIES
NOTES TO THE CONSOLIDATED FINANCIAL STATEMENTS
YEARS ENDED SEPTEMBER 30, 2020, 2019, AND 2018
| | | | | | | | | | | | | | | | | | | |
| | Actual | | | Capital Adequacy
Guidelines | | Categorized as Well Capitalized Under Prompt Corrective Action Provisions |
| Capital | Ratio | | | Ratio | | Ratio |
| September 30, 2020 | ($ in thousands) |
| Common Equity Tier 1 risk-based capital ratio: | | | | | | | |
| The Company | $ | 1,687,676 | | 12.93 | % | | | 4.50 | % | | NA |
| The Bank | 1,625,478 | | 12.46 | | | | 4.50 | | | 6.50 | % |
| Tier 1 risk-based capital ratio: | | | | | | | |
| The Company | 1,687,676 | | 12.93 | | | | 6.00 | | | NA |
| The Bank | 1,625,478 | | 12.46 | | | | 6.00 | | | 8.00 | |
| Total risk-based capital ratio: | | | | | | | |
| The Company | 1,851,136 | | 14.19 | | | | 8.00 | | | NA |
| The Bank | 1,788,904 | | 13.71 | | | | 8.00 | | | 10.00 | |
| Tier 1 leverage ratio: | | | | | | | |
| The Company | 1,687,676 | | 9.28 | | | | 4.00 | | | NA |
| The Bank | 1,625,478 | | 8.94 | | | | 4.00 | | | 5.00 | |
| | | | | | | |
| September 30, 2019 | | | | | | | |
| Common Equity Tier 1 risk-based capital ratio: | | | | | | | |
| The Company | $ | 1,710,147 | | 14.30 | % | | | 4.50 | % | | NA |
| The Bank | 1,666,426 | | 13.93 | | | | 4.50 | | | 6.50 | % |
| Tier 1 risk-based capital ratio: | | | | | | | |
| The Company | 1,710,147 | | 14.30 | | | | 6.00 | | | NA |
| The Bank | 1,666,426 | | 13.93 | | | | 6.00 | | | 8.00 | |
| Total risk-based capital ratio: | | | | | | | |
| The Company | 1,848,581 | | 15.45 | | | | 8.00 | | | NA |
| The Bank | 1,804,860 | | 15.09 | | | | 8.00 | | | 10.00 | |
| Tier 1 leverage ratio: | | | | | | | |
| The Company | 1,710,147 | | 10.51 | | | | 4.00 | | | NA |
| The Bank | 1,666,426 | | 10.24 | | | | 4.00 | | | 5.00 | |
At periodic intervals, the Federal Reserve, the OCC and the FDIC routinely examine the Company's and the Bank's financial statements as part of their oversight. Based on their examinations, these regulators can direct that the Company's or Bank's financial statements be adjusted in accordance with their findings.
The Company and the Bank are subject to regulatory restrictions on paying dividends.
The Company has an ongoing share repurchase program and 3,339,530 shares were repurchased during 2020 at a weighted average price of $33.58. In 2019, 4,065,837 shares were repurchased at a weighted average price of $30.46. As of September 30, 2020, management had authorization from the Board of Directors to repurchase up to 4,627,231 additional shares.
WASHINGTON FEDERAL, INC. AND SUBSIDIARIES
NOTES TO THE CONSOLIDATED FINANCIAL STATEMENTS
YEARS ENDED SEPTEMBER 30, 2020, 2019, AND 2018
The following table sets forth information regarding earnings per share calculations.
| | | | | | | | | | | | | | | | | |
| Year ended September 30, | 2020 | | 2019 | | 2018 |
| Weighted average shares outstanding | 76,721,969 | | | 80,471,316 | | | 85,008,040 | |
| Weighted average dilutive warrants | — | | | 4,448 | | | 63,079 | |
| Weighted average dilutive options | 9,495 | | | 19,399 | | | 38,724 | |
| Weighted average diluted shares | 76,731,464 | | | 80,495,163 | | | 85,109,843 | |
| | | | | |
| Net income (In thousands) | $ | 173,438 | | | $ | 210,256 | | | $ | 203,850 | |
| Basic EPS | $ | 2.26 | | | $ | 2.61 | | | $ | 2.40 | |
| Diluted EPS | 2.26 | | | 2.61 | | | 2.40 | |
NOTE R - FINANCIAL INFORMATION – WASHINGTON FEDERAL, INC.
The following Washington Federal, Inc. (parent company only) financial information should be read in conjunction with the other notes to the Consolidated Financial Statements.
| | | | | | | | |
| Condensed Statements of Financial Condition | | |
| September 30, 2020 | September 30, 2019 |
| | (In thousands) |
| Assets | | |
| Cash | $ | 57,198 | | $ | 38,721 | |
| Other assets | 5,000 | | 5,000 | |
| Investment in subsidiary | 1,951,935 | | 1,989,274 | |
| Total assets | $ | 2,014,133 | | $ | 2,032,995 | |
| | |
| Liabilities | | |
| Other liabilities | $ | — | | $ | — | |
| Total liabilities | — | | — | |
| | |
| Shareholders’ equity | | |
| Total shareholders’ equity | 2,014,133 | | 2,032,995 | |
| Total liabilities and shareholders’ equity | $ | 2,014,133 | | $ | 2,032,995 | |
WASHINGTON FEDERAL, INC. AND SUBSIDIARIES
NOTES TO THE CONSOLIDATED FINANCIAL STATEMENTS
YEARS ENDED SEPTEMBER 30, 2020, 2019, AND 2018
| | | | | | | | | | | |
| Condensed Statements of Operations | | | |
| Twelve Months Ended September 30, | 2020 | 2019 | 2018 |
| | (In thousands) |
| Income | | | |
| Dividends from subsidiary | $ | 190,900 | | $ | 208,389 | | $ | 198,294 | |
| | | |
| Total Income | 190,900 | | 208,389 | | 198,294 | |
| Expense | | | |
| Miscellaneous expense | 529 | | 448 | | 439 | |
| Total expense | 529 | | 448 | | 439 | |
| | | |
| Net income (loss) before equity in undistributed net income (loss) of subsidiary | 190,371 | | 207,941 | | 197,855 | |
| Equity in undistributed net income (loss) of subsidiaries | (17,055) | | 2,213 | | 5,880 | |
| Income before income taxes | 173,316 | | 210,154 | | 203,735 | |
| Income tax benefit (expense) | 122 | | 102 | | 115 | |
| Net income | $ | 173,438 | | $ | 210,256 | | $ | 203,850 | |
| | | | | | | | | | | |
| Condensed Statements of Cash Flows | | | |
| Twelve Months Ended September 30, | 2020 | 2019 | 2018 |
| | (In thousands) |
| Cash Flows From Operating Activities | | | |
| Net income | $ | 173,438 | | $ | 210,256 | | $ | 203,850 | |
| Adjustments to reconcile net income to net cash provided by operating activities: | | | |
| Equity in undistributed net income (loss) of subsidiaries | 17,055 | | (2,213) | | (5,880) | |
| Stock based compensation expense | 6,469 | | 5,265 | | 4,771 | |
| | | |
| Increase (decrease) in other liabilities | — | | (3,489) | | 3,424 | |
| Net cash provided by (used in) operating activities | 196,962 | | 209,819 | | 206,165 | |
| | | |
| Cash Flows From Investing Activities | | | |
| Purchase of strategic investments | — | | (5,000) | | — | |
| Net cash provided by (used in) investing activities | — | | (5,000) | | — | |
| | | |
| Cash Flows From Financing Activities | | | |
| Proceeds from exercise of common stock options and related tax benefit | 144 | | 740 | | 1,338 | |
| | | |
| Treasury stock purchased | (112,133) | | (123,854) | | (164,249) | |
| Dividends paid on common stock | (66,496) | | (63,318) | | (55,997) | |
| Net cash provided by (used in) financing activities | (178,485) | | (186,432) | | (218,908) | |
| | | |
| Increase (decrease) in cash | 18,477 | | 18,387 | | (12,743) | |
| Cash at beginning of year | 38,721 | | 20,334 | | 33,077 | |
| Cash at end of year | $ | 57,198 | | $ | 38,721 | | $ | 20,334 | |
WASHINGTON FEDERAL, INC. AND SUBSIDIARIES
NOTES TO THE CONSOLIDATED FINANCIAL STATEMENTS
YEARS ENDED SEPTEMBER 30, 2020, 2019, AND 2018
NOTE S - SELECTED QUARTERLY FINANCIAL DATA (UNAUDITED)
The following is a summary of the unaudited interim results of operations by quarter for the years presented.
| | | | | | | | | | | | | | |
| Twelve Months Ended September 30, 2020 | First
Quarter | Second
Quarter | Third
Quarter | Fourth
Quarter |
| | (In thousands, except per share data) |
| Interest income | $ | 164,824 | | $ | 159,618 | | $ | 149,709 | | $ | 147,114 | |
| Interest expense | 45,139 | | 42,006 | | 32,331 | | 32,281 | |
| Net interest income | 119,685 | | 117,612 | | 117,378 | | 114,833 | |
| Provision (release) for credit losses | (3,750) | | 8,200 | | 10,800 | | 6,500 | |
| Other operating income (including REO gain (loss), net) | 45,490 | | 16,272 | | 13,055 | | 12,169 | |
| Other operating expense | 82,636 | | 79,433 | | 75,323 | | 78,166 | |
| Income before income taxes | 86,289 | | 46,251 | | 44,310 | | 42,336 | |
| Income tax expense | 18,423 | | 9,874 | | 9,458 | | 7,993 | |
| Net income | $ | 67,866 | | $ | 36,377 | | $ | 34,852 | | $ | 34,343 | |
| | | | |
| Basic earnings per share | $ | 0.84 | | $ | 0.49 | | $ | 0.46 | | $ | 0.45 | |
| Diluted earnings per share | 0.84 | | 0.49 | | 0.46 | | 0.45 | |
| Cash dividends paid per share | 0.21 | | 0.22 | | 0.22 | | 0.22 | |
| | | | |
| | | | | | | | | | | | | | |
| Twelve Months Ended September 30, 2019 | First
Quarter | Second
Quarter | Third
Quarter | Fourth
Quarter |
| | (In thousands, except per share data) |
| Interest income | $ | 162,622 | | $ | 167,582 | | $ | 171,826 | | $ | 169,436 | |
| Interest expense | 43,470 | | 47,512 | | 50,160 | | 49,264 | |
| Net interest income | 119,152 | | 120,070 | | 121,666 | | 120,172 | |
| Provision (release) for credit losses | (500) | | 750 | | — | | (1,900) | |
| Other operating income (including REO gain (loss), net) | 19,329 | | 13,618 | | 14,395 | | 15,786 | |
| Other operating expense | 71,672 | | 67,967 | | 70,898 | | 72,526 | |
| Income before income taxes | 67,309 | | 64,971 | | 65,163 | | 65,332 | |
| Income tax expense | 14,367 | | 13,873 | | 11,309 | | 12,970 | |
| Net income | $ | 52,942 | | $ | 51,098 | | $ | 53,854 | | $ | 52,362 | |
| | | | |
| Basic earnings per share | $ | 0.65 | | $ | 0.63 | | $ | 0.67 | | $ | 0.66 | |
| Diluted earnings per share | 0.65 | | 0.63 | | 0.67 | | 0.66 | |
| Cash dividends paid per share | 0.18 | | 0.20 | | 0.20 | | 0.21 | |
| | | | |
MANAGEMENT'S REPORT ON INTERNAL CONTROL OVER FINANCIAL REPORTING
The management of the Company is responsible for establishing and maintaining adequate internal control over financial reporting. The Company's internal control system was designed to provide reasonable assurance to the Company's management and Board of Directors regarding the preparation and fair presentation of published financial statements.
The Company's management assessed the effectiveness of the Company's internal control over financial reporting as of September 30, 2020. In making this assessment, the Company's management used the criteria set forth by the Committee of Sponsoring Organizations of the Treadway Commission (COSO) in the 2013 version of its Internal Control-Integrated Framework. Based on its assessment, the Company's management believes that as of September 30, 2020, the Company's internal control over financial reporting was effective based on those criteria.
The Company's independent auditors, Deloitte & Touche LLP, an independent registered public accounting firm, have issued an audit report on the Company's internal control over financial reporting and their report follows.
November 23, 2020
Brent J. Beardall
President and Chief Executive Officer
Vincent L. Beatty
Executive Vice President and Chief Financial Officer
REPORT OF INDEPENDENT REGISTERED PUBLIC ACCOUNTING FIRM
To the Board of Directors and Shareholders of
Washington Federal, Inc.
Seattle, Washington
Opinion on the Financial Statements
We have audited the accompanying consolidated statements of financial condition of Washington Federal, Inc. and subsidiaries (the “Company”) as of September 30, 2020 and 2019, and the related consolidated statements of operations, comprehensive income, shareholders' equity, and cash flows for each of the three years in the period ended September 30, 2020, and the related notes (collectively referred to as the "financial statements"). In our opinion, the financial statements present fairly, in all material respects, the financial position of the Company as of September 30, 2020, and 2019, and the results of its operations and its cash flows for each of the three years in the period ended September 30, 2020, in conformity with accounting principles generally accepted in the United States of America.
We have also audited, in accordance with the standards of the Public Company Accounting Oversight Board (United States) (PCAOB), the Company's internal control over financial reporting as of September 30, 2020, based on the criteria established in Internal Control - Integrated Framework (2013) issued by the Committee of Sponsoring Organizations of the Treadway Commission and our report dated November 23, 2020, expressed an unqualified opinion on the Company's internal control over financial reporting.
Change in Accounting Principle
As discussed in Note B to the financial statements, the Company changed its method for accounting for credit losses effective October 1, 2019, due to the early adoption of Financial Accounting Standards Board (FASB) Accounting Standards Codification No. 326, Financial Instruments - Credit Losses (ASC 326). The Company adopted the new credit loss standard using the modified retrospective method provided in Accounting Standards Update No. 2016-13 such that prior period amounts are not adjusted and continue to be reported in accordance with previously applicable generally accepted accounting principles. The adoption of the new credit loss standard and its subsequent application is also communicated as a critical audit matter below.
Basis for Opinion
These financial statements are the responsibility of the Company's management. Our responsibility is to express an opinion on the Company's financial statements based on our audits. We are a public accounting firm registered with the PCAOB and are required to be independent with respect to the Company in accordance with the U.S. federal securities laws and the applicable rules and regulations of the Securities and Exchange Commission and the PCAOB.
We conducted our audits in accordance with the standards of the PCAOB. Those standards require that we plan and perform the audit to obtain reasonable assurance about whether the financial statements are free of material misstatement, whether due to error or fraud. Our audits included performing procedures to assess the risks of material misstatement of the financial statements, whether due to error or fraud, and performing procedures that respond to those risks. Such procedures included examining, on a test basis, evidence regarding the amounts and disclosures in the financial statements. Our audits also included evaluating the accounting principles used and significant estimates made by management, as well as evaluating the overall presentation of the financial statements. We believe that our audits provide a reasonable basis for our opinion.
Critical Audit Matter
The critical audit matter communicated below is a matter arising from the current-period audit of the financial statements that was communicated or required to be communicated to the audit committee and that (1) relates to accounts or disclosures that are material to the financial statements and (2) involved our especially challenging, subjective, or complex judgments. The communication of a critical audit matter does not alter in any way our opinion on the financial statements, taken as a whole, and we are not, by communicating the critical audit matter below, providing a separate opinion on the critical audit matter or on the accounts or disclosures to which it relates.
Allowance for Credit Losses - Refer to Notes A, B and E to the financial statements (also see change in accounting principle explanatory paragraph above)
Critical Audit Matter Description
The Company early adopted ASC 326, Financial Instruments - Credit Losses, as of October 1, 2019, using the modified retrospective method. In so doing, the Company recorded a decrease to retained earnings of $21,945,000 as of October 1, 2019 for the cumulative effect of adopting ASC 326. As of September 30, 2020, the allowance for credit losses was $191,955,000. The Company has disclosed the impact of adoption in Note B to its 2020 financial statements.
Estimates of expected credit losses under the current expected credit loss (“CECL”) methodology required under ASC 326 are based on relevant information about current conditions, past events, and reasonable and supportable forward-looking forecasts regarding collectability of the reported amounts. In order to estimate the expected credit losses for loans and unfunded loan commitments, the Company employed a mix of cohort and weighted average remaining maturities (“WARM”) methodologies to determine the historical loss rate, by loan portfolio class, then considered whether qualitative adjustments to those historical loss rates were warranted.
Significant management judgments are required in determining whether, and to what extent, qualitative adjustments for each portfolio loan class are required. These adjustments are made after considering the conditions over the period from which historical loss experience was based and are split into two components: 1) asset or class specific risk characteristics or current conditions at the reporting date related to portfolio credit quality, remaining payments, volume and nature, credit culture and management, business environment or other management factors, not captured in the historical loss rates and 2) reasonable and supportable forecasts of future economic conditions and collateral values.
Given that the estimation of credit losses significantly changes under the CECL methodology, including the application of new accounting policies, the use of new subjective judgments, and changes made to the loss estimation models, performing audit procedures to evaluate the implementation and subsequent application of ASC 326 for loans and unfunded loan commitments involved a high degree of auditor judgment and required significant effort, including the need to involve more experienced audit personnel and credit specialists.
How the Critical Audit Matter Was Addressed in the Audit
Our audit procedures related to the initial adoption of ASC 326 and its subsequent application included the following, among others:
•We tested the effectiveness of management’s controls over (1) key assumptions and judgments, (2) the CECL estimation model for loan portfolios, (3) the reasonable and supportable forecast adjustment selected by management, (4) the qualitative adjustments determined by management, (5) selection and application of new accounting policies, and (6) disclosures.
•We evaluated the appropriateness of the Company’s accounting policies, assumptions, and elections involved in the adoption of the CECL methodology.
•We tested the underlying historical data and mathematical accuracy of the cohort and WARM methodologies used to determine the loan portfolio class historical loss rates.
•We evaluated the reasonableness and conceptual soundness of the methodologies, as applied in the CECL estimation models, including key assumptions and judgments in estimating expected credit losses.
•We evaluated the accuracy and completeness of the Company’s disclosures in accordance with ASC 326.
•Specific to the qualitative adjustments made to the historical loss rates:
- We assessed the appropriateness of the framework for the qualitative adjustments.
- We performed analysis to evaluate the relevance of each of the reasonable and supportable forecast assumptions to historic losses.
- We evaluated management’s reasonable and supportable forecast of economic variables by comparing forecasts to relevant external market data.
- We assessed management’s determination whether, and to what extent, a qualitative adjustment was warranted to certain loan portfolio classes to account for specific risk characteristics or current conditions that differ from the period over which the historical loss rate was determined.
Seattle, Washington
November 23, 2020
We have served as the Company’s auditor since at least 1982; however, an earlier year could not be reliably determined.
REPORT OF INDEPENDENT REGISTERED PUBLIC ACCOUNTING FIRM
To the Board of Directors and Shareholders of
Washington Federal, Inc.
Seattle, Washington
Opinion on Internal Control over Financial Reporting
We have audited the internal control over financial reporting of Washington Federal, Inc. and subsidiaries (the “Company”) as of September 30, 2020, based on criteria established in Internal Control - Integrated Framework (2013) issued by the Committee of Sponsoring Organizations of the Treadway Commission (COSO). Because management’s assessment and our audit were conducted to meet the reporting requirements of Section 112 of the Federal Deposit Insurance Corporation Improvement Act (FDICIA), management’s assessment and our audit of the Company’s internal control over financial reporting included controls over the preparation of the schedules equivalent to the basic financial statements in accordance with the instructions for the Office of the Comptroller of the Currency Instructions for Call Reports for Balance Sheet on schedule RC, Income Statement on schedule RI, and Changes in Bank Equity Capital on schedule RI-A. In our opinion, the Company maintained, in all material respects, effective internal control over financial reporting as of September 30, 2020, based on criteria established in Internal Control — Integrated Framework (2013) issued by COSO.
We have not examined and, accordingly, we do not express an opinion or any other form of assurance on management's statement referring to compliance with laws and regulations.
We have also audited, in accordance with the standards of the Public Company Accounting Oversight Board (United States) (PCAOB), the consolidated financial statements as of and for the year ended September 30, 2020, of the Company and our report dated November 23, 2020, expressed an unqualified opinion on those financial statements and included an explanatory paragraph regarding the Company's adoption of Financial Accounting Standards Board Accounting Standards Codification No. 326, Financial Instruments - Credit Losses.
Basis for Opinion
The Company's management is responsible for maintaining effective internal control over financial reporting and for its assessment of the effectiveness of internal control over financial reporting, included in the accompanying Management's Report on Internal Control Over Financial Reporting. Our responsibility is to express an opinion on the Company's internal control over financial reporting based on our audit. We are a public accounting firm registered with the PCAOB and are required to be independent with respect to the Company in accordance with the U.S. federal securities laws and the applicable rules and regulations of the Securities and Exchange Commission and the PCAOB.
We conducted our audit in accordance with the standards of the PCAOB. Those standards require that we plan and perform the audit to obtain reasonable assurance about whether effective internal control over financial reporting was maintained in all material respects. Our audit included obtaining an understanding of internal control over financial reporting, assessing the risk that a material weakness exists, testing and evaluating the design and operating effectiveness of internal control based on the assessed risk, and performing such other procedures as we considered necessary in the circumstances. We believe that our audit provides a reasonable basis for our opinion.
Definition and Limitations of Internal Control over Financial Reporting
A company's internal control over financial reporting is a process designed to provide reasonable assurance regarding the reliability of financial reporting and the preparation of financial statements for external purposes in accordance with generally accepted accounting principles. A company's internal control over financial reporting includes those policies and procedures that (1) pertain to the maintenance of records that, in reasonable detail, accurately and fairly reflect the transactions and dispositions of the assets of the company; (2) provide reasonable assurance that transactions are recorded as necessary to permit preparation of financial statements in accordance with generally accepted accounting principles, and that receipts and expenditures of the company are being made only in accordance with authorizations of management and directors of the company; and (3) provide reasonable assurance regarding prevention or timely detection of unauthorized acquisition, use, or disposition of the company's assets that could have a material effect on the financial statements.
Because of its inherent limitations, internal control over financial reporting may not prevent or detect misstatements. Also, projections of any evaluation of effectiveness to future periods are subject to the risk that controls may become inadequate because of changes in conditions, or that the degree of compliance with the policies or procedures may deteriorate.
Seattle, Washington
November 23, 2020
Performance Graphs
The following graphs compare the cumulative total return to Washington Federal shareholders (stock price appreciation plus reinvested dividends) to the cumulative total return of the Nasdaq Stock Market Index (U.S. Companies) and the KBW Bank Index Index for the five year period ended September 30, 2020, and since Washington Federal first became a publicly traded company on November 9, 1982, respectively. The graphs assume that $100 was invested on September 30, 2012, and November 9, 1982, respectively, in Washington Federal Common Stock, the Nasdaq Stock Market Index and the Nasdaq Financial Stocks Index, and that all dividends were reinvested. Management of Washington Federal cautions that the stock price performance shown in the graphs below should not be considered indicative of potential future stock price performance.
GENERAL CORPORATE AND
SHAREHOLDERS' INFORMATION
| | | | | |
Corporate | 425 Pike Street |
Headquarters | Seattle, Washington 98101 |
| (206) 624-7930 |
| |
Independent | Deloitte & Touche LLP |
Auditors | Seattle, Washington |
| |
Transfer Agent, | Shareholder inquiries regarding transfer |
Registrar and | requirements, cash or stock dividends, lost |
Dividend | certificates, consolidating records, correcting |
Disbursing | a name or changing an address should be |
Agent | directed to the transfer agent: |
| American Stock Transfer & Trust Company |
| 59 Maiden Lane |
| Plaza Level |
| New York, NY 10038 |
| Telephone: 1-888-888-0315 |
| www.amstock.com |
| |
Annual Meeting | The annual meeting of shareholders will be held live via the Internet at www.virtualshareholdermeeting.com/WAFD2021 on January 26, 2021, at 2 p.m., Pacific Time. |
| |
Available | |
Information | To find out more about the Company, please visit our website. The Company uses its website to distribute financial and other material information about the Company. Our annual report on Form 10-K, our quarterly reports on Form 10-Q, current reports on Form 8-K, amendments to those reports and other SEC filings of the Company are available through the Company's website: |
| www.wafdbank.com |
| |
Stock | |
Information | Washington Federal, Inc. is traded on the NASDAQ Global Select Market. The common stock symbol is WAFD. At September 30, 2020, there were 1,071 shareholders of record. |
| | | | | | | | | | | |
| | Stock Prices | |
| Quarter Ended | High | Low | Dividends |
| December 31, 2018 | $ | 32.03 | | $ | 24.93 | | $ | 0.18 | |
| March 31, 2019 | 30.96 | | 26.80 | | 0.20 | |
| June 30, 2019 | 34.93 | | 29.13 | | 0.20 | |
| September 30, 2019 | 38.14 | | 33.94 | | 0.21 | |
| December 31, 2019 | 38.01 | | 35.76 | | 0.21 | |
| March 31, 2020 | 36.49 | | 21.67 | | 0.22 | |
| June 30, 2020 | 29.85 | | 22.62 | | 0.22 | |
| September 30, 2020 | 25.89 | | 20.20 | | 0.22 | |
Our Board of Directors' dividend policy is to review our financial performance, capital adequacy, regulatory compliance and cash resources on a quarterly basis, and, if such review is favorable, to declare and pay a quarterly cash dividend to shareholders.
DIRECTORS AND EXECUTIVE OFFICERS
| | | | | | | | | |
| BOARD OF DIRECTORS | | EXECUTIVE MANAGEMENT COMMITTEE | |
| | | |
THOMAS J. KELLEY
Chairman of the Board
Retired Partner, Arthur Andersen LLP | | BRENT J. BEARDALL
President and Chief Executive Officer | |
BRENT J. BEARDALL
President and Chief Executive Officer | | VINCENT L. BEATTY
Executive Vice President
Chief Financial Officer | |
LINDA S. BROWER
Former Executive Officer
Washington Federal Bank | | CATHY E. COOPER
Executive Vice President
Retail Banking | |
STEPHEN M. GRAHAM
Senior Partner
Fenwick & West LLP | | JAMES A. ENDRIZZI
Executive Vice President
Commercial Banking | |
DAVID K. GRANT
Managing Partner
Catalyst Storage Partners | | RYAN M. MAUER
Executive Vice President
Chief Credit Officer
| |
S. STEVEN SINGH
Managing Director
Madrona Venture Group | | KIM E. ROBISON
Executive Vice President
Operations
| |
BARBARA L. SMITH, PhD.
Owner, B. Smith Consulting Group | | | |
MARK N. TABBUTT
Chairman of the Board of Directors
Saltchuk Resources | | | |
RANDALL H. TALBOT
Managing Director
Talbot Financial, LLC. | | | |
| | | |
| | | |
| DIRECTOR EMERITUS | | | |
| W. ALDEN HARRIS | | | |