United States
Securities and Exchange Commission
Washington, D.C. 20549
____________________________________________________________
FORM 10-K
____________________________________________________________
x | ANNUAL REPORT PURSUANT TO SECTION 13 OR 15(d) OF THE SECURITIES EXCHANGE ACT OF 1934 |
FOR THE FISCAL YEAR ENDED SEPTEMBER 30, 2018. | |
OR
¨ | TRANSITION REPORT PURSUANT TO SECTION 13 OR 15(d) OF THE SECURITIES EXCHANGE ACT OF 1934 |
For the transition period from to | |
____________________________________________________________
Washington Federal, Inc.
(Exact name of registrant as specified in its charter)
____________________________________________________________
Washington | 91-1661606 | |
(State or other jurisdiction of incorporation or organization) | (I.R.S. Employer Identification No.) | |
425 Pike Street, Seattle, Washington 98101
(Address of principal executive offices) (Zip Code)
Registrant’s telephone number, including area code: (206) 624-7930
_____________________________________
Securities registered pursuant to Section 12(b) of the Act:
Title of each Class | Name of each exchange on which registered | |
Common Stock, $1.00 par value per share | NASDAQ Stock Market | |
Securities registered pursuant to section 12(g) of the Act:
None
____________________________________
Indicate by check mark if the registrant is a well-known seasoned issuer, as defined in Rule 405 of the Securities Act. Yes x No ¨
Indicate by check mark if the registrant is not required to file reports pursuant to Section 13 or 15(d) of the Act. Yes ¨ No x
Indicate by check mark whether the registrant (1) has filed all reports required by Section 13 or 15(d) of the Securities Exchange Act of 1934 during the preceding 12 months (or for such shorter period that the registrant was required to file such reports), and (2) has been subject to such filing requirements for the past 90 days. Yes x No ¨
Indicate by check mark whether the registrant has submitted electronically and posted on its corporate Web site, if any, every Interactive Data File required to be submitted and posted pursuant to Rule 405 of Regulation S-T (§ 229.405 of this chapter) during the preceding 12 months (or for such shorter period that the registrant was required to submit and post such files). Yes x No ¨
Indicate by check mark if disclosure of delinquent filers pursuant to Item 405 of Regulation S-K is not contained herein, and will not be contained, to the best of registrant’s knowledge, in definitive proxy or information statements incorporated by reference in Part III of this Form 10-K or any amendment to this Form 10-K. x
Indicate by check mark whether the registrant is a large accelerated filer, an accelerated filer, a non-accelerated filer, a smaller reporting company or an emerging growth company. See definitions of “large accelerated filer,” “accelerated filer,” “smaller reporting company” and "emerging growth company" in Rule 12b-2 of the Exchange Act.
Large accelerated filer | x | Accelerated filer | o |
Non-accelerated filer | o | Smaller reporting company | o |
Emerging growth company | o | ||
If an emerging growth company, indicate by check mark if the registrant has elected not to use the extended transition period for complying with any new or revised financial accounting standards provided pursuant to Section 13(a) of the Exchange Act. o
Indicate by check mark whether the registrant is a shell company (as defined in Rule 12b-2 of the Act). Yes ¨ No x
The aggregate market value of the registrant's common stock ("Common Stock") held on March 29, 2018, the last business day of the registrant's second fiscal quarter by non-affiliates was $2,899,004,354 based on the NASDAQ Stock Market closing price of $34.60 per share on that date. This is based on 83,786,253 shares of Common Stock that were issued and outstanding on this date, which excludes 962,950 shares held by all affiliates.
At November 15, 2018, there were 81,582,736 shares of Common Stock outstanding.
DOCUMENTS INCORPORATED BY REFERENCE
List hereunder the following documents incorporated by reference and the Part of Form 10-K into which the document is incorporated:
(1) Portions of the Registrant’s Annual Report to Shareholders for the fiscal year ended September 30, 2018, are incorporated into Part II, Items 5-8 and Part III, Item 12 of this Form 10-K.
(2) Portions of the Registrant’s definitive proxy statement for its Annual Meeting of Shareholders to be held on January 16, 2019 are incorporated into Part III, Items 10-14 of this Form 10-K.
PART I
Washington Federal, Inc. (the "Company") makes statements in this Annual Report on Form 10-K that constitute forward-looking statements. Words such as “expects,” “anticipates,” “believes,” “estimates,” “intends,” “forecasts,” “projects” and other similar expressions or future or conditional verbs such as “will,” “should,” “would” and “could” are intended to help identify such forward-looking statements. These statements are not historical facts, but instead represent current expectations, plans or forecasts of the Company and are based on the beliefs and assumptions of the management of the Company and the information available to management at the time that these disclosures were prepared. The Company intends for all such forward-looking statements to be covered by the safe harbor provisions for forward-looking statements within the meaning of the Private Securities Litigation Reform Act of 1995 and the provisions of Section 27A of the Securities Act of 1933 and Section 21E of the Securities Exchange Act of 1934. These statements are not guarantees of future results or performance and involve certain risks, uncertainties and assumptions that are difficult to predict and often are beyond the Company's control. Actual outcomes and results may differ materially from those expressed in, or implied by, the Company's forward-looking statements.
You should not place undue reliance on any forward-looking statement and should consider the following uncertainties and risks, as well as the risks and uncertainties discussed elsewhere in this report, including under Item 1A. “Risk Factors,” and in any of the Company's other subsequent Securities and Exchange Commission filings, which could cause the Company's future results to differ materially from the plans, objectives, goals, estimates, intentions and expectations expressed in forward-looking statements:
• | a deterioration in economic conditions, including declines in the real estate market and home sale volumes and financial stress on borrowers (consumers and businesses) as a result of the uncertain economic environment; |
• | the effects of a severe economic downturn, including high unemployment rates and declines in housing prices and property values, in the Company's primary market areas; |
• | the effects of and changes in monetary and fiscal policies of the Board of Governors of the Federal Reserve System and the U.S. Government; |
• | fluctuations in interest rate risk and changes in market interest rates; |
• | the Company's ability to make accurate assumptions and judgments about the collectability of its loan portfolio, including the creditworthiness of its borrowers and the value of the assets securing these loans; |
• | the Company's ability to successfully complete merger and acquisition activities and realize expected strategic and operating efficiencies associated with such activities; |
• | legislative and regulatory limitations, including those arising under the Dodd-Frank Act and potential limitations in the manner in which the Company conducts its business and undertake new investments and activities; |
• | the ability of the Company to obtain external financing to fund its operations or obtain this financing on favorable terms; |
• | changes in other economic, competitive, governmental, regulatory and technological factors affecting the Company's markets, operations, pricing, products, services and fees; |
• | the success of the Company at managing the risks involved in the remediation efforts associated with its Bank Secrecy Act program, costs of enhancements to the Bank’s BSA program are greater than anticipated; and governmental authorities undertake enforcement actions or legal proceedings with respect to the Bank’s BSA program beyond those contemplated by the Consent Order, and the potential impact of such matters on the success, timing and ability to pursue the Company’s growth or other business initiatives; |
• | the success of the Company at managing the risks involved in the foregoing and managing its business; and |
• | the timing and occurrence or non-occurrence of events that may be subject to circumstances beyond the Company's control. |
All forward-looking statements speak only as of the date on which such statements are made, and the Company undertakes no obligation to update or revise any forward-looking statements to reflect changed assumptions, the occurrence of unanticipated events, changes to future operating results over time, or the impact of circumstances arising after the date the forward-looking statement was made.
3
Item 1. | Business |
General
Washington Federal has its origins on April 24, 1917 in Ballard, Washington and just completed its 101st year in business. Washington Federal is engaged primarily in providing lending, depository, insurance and other banking services to consumers, mid-sized to large businesses, and owners and developers of commercial real estate. Washington Federal, Inc., was formed in November 1994, and is a Washington corporation headquartered in Seattle, Washington that conducts its operations through a federally-insured national bank subsidiary, Washington Federal, National Association (the “Bank”). As used throughout this document, the terms “Washington Federal” or the “Company” refer to Washington Federal, Inc. and its consolidated subsidiaries and the term "Bank" refers to the operating subsidiary Washington Federal, National Association. The Bank is principally engaged in the business of attracting deposits from businesses and the general public and investing these funds, together with borrowings and other funds, in commercial and consumer loans.
The Company's fiscal year end is September 30th. All references to 2018, 2017 and 2016 represent balances as of September 30, 2018, September 30, 2017 and September 30, 2016, respectively, or activity for the fiscal years then ended.
The business of the Bank consists primarily of accepting deposits from the general public and investing these funds in loans of various types, including first lien mortgages on single-family dwellings, construction loans, land acquisition and development loans, loans on multi-family, commercial real estate and other income producing properties, home equity loans and business loans. It also invests in certain United States government and agency obligations and other investments permitted by applicable laws and regulations. As of September 30, 2018, Washington Federal has 235 branches located in Washington, Oregon, Idaho, Arizona, Utah, Nevada, New Mexico and Texas. Through the Bank's subsidiaries, the Company is also engaged in insurance brokerage activities.
The principal sources of funds for the Company's activities are retained earnings, loan repayments, net deposit inflows, repayments and sales of investments and borrowings. Washington Federal's principal sources of revenue are interest on loans and interest and dividends on investments. Its principal expenses are interest paid on deposits, credit costs, general and administrative expenses, interest on borrowings and income taxes.
The Bank is subject to extensive regulation, supervision and examination by the Office of the Comptroller of the Currency ("OCC"), its primary federal regulator, the Consumer Financial Protection Bureau ("CFPB") and the Federal Deposit Insurance Corporation ("FDIC"), which insures its deposits up to applicable limits. The Company, as a bank holding company, is subject to extensive regulation, supervision and examination by the Board of Governors of the Federal Reserve System (" Federal Reserve"). The CFPB has broad authority to regulate providers of credit, payments and other consumer financial products and services and to bring actions to enforce federal consumer protection legislation as necessary.
The regulatory structure gives the regulatory authorities extensive discretion in connection with their supervisory and enforcement activities. Any change in such regulation, whether by the OCC, the FDIC, the Federal Reserve, the CFPB or the U.S. Congress, could have a significant impact on the Company and its operations. See “Regulation” section below.
4
Average Statements of Financial Condition | ||||||||||||||||||||||||||||||||
Year Ended September 30, | ||||||||||||||||||||||||||||||||
2018 | 2017 | 2016 | ||||||||||||||||||||||||||||||
Average Balance | Interest | Average Rate | Average Balance | Interest | Average Rate | Average Balance | Interest | Average Rate | ||||||||||||||||||||||||
(In thousands) | ||||||||||||||||||||||||||||||||
Assets | ||||||||||||||||||||||||||||||||
Loans receivable (1) | $ | 11,202,129 | $ | 515,807 | 4.60 | % | $ | 10,402,346 | $ | 470,523 | 4.52 | % | $ | 9,511,351 | $ | 454,085 | 4.77 | % | ||||||||||||||
Mortgage-backed securities | 2,543,796 | 70,407 | 2.77 | 2,561,400 | 60,612 | 2.37 | 2,737,947 | 62,949 | 2.30 | |||||||||||||||||||||||
Cash and other investment securities (2) | 584,145 | 15,456 | 2.65 | 719,175 | 14,187 | 1.97 | 1,167,596 | 16,282 | 1.39 | |||||||||||||||||||||||
FHLB & FRB stock | 129,382 | 5,413 | 4.18 | 120,725 | 3,596 | 2.98 | 113,664 | 3,477 | 3.06 | |||||||||||||||||||||||
Total interest-earning assets | 14,459,452 | 607,083 | 4.20 | % | 13,803,646 | 548,918 | 3.98 | % | 13,530,558 | 536,793 | 3.97 | % | ||||||||||||||||||||
Other assets | 1,155,819 | 1,161,408 | 1,181,975 | |||||||||||||||||||||||||||||
Total assets | $ | 15,615,271 | $ | 14,965,054 | $ | 14,712,533 | ||||||||||||||||||||||||||
Liabilities and Stockholders’ Equity | ||||||||||||||||||||||||||||||||
Customer accounts | $ | 11,068,461 | 72,492 | 0.65 | % | $ | 10,615,511 | 52,023 | 0.49 | % | $ | 10,589,817 | 52,485 | 0.50 | % | |||||||||||||||||
FHLB advances | 2,384,795 | 62,452 | 2.62 | 2,167,986 | 64,969 | 3.00 | 1,992,434 | 64,059 | 3.22 | |||||||||||||||||||||||
Total interest-bearing liabilities | 13,453,256 | 134,944 | 1.00 | % | 12,783,497 | 116,992 | 0.92 | % | 12,582,251 | 116,544 | 0.93 | % | ||||||||||||||||||||
Other liabilities | 155,950 | 173,495 | 161,446 | |||||||||||||||||||||||||||||
Total liabilities | 13,609,206 | 12,956,992 | 12,743,697 | |||||||||||||||||||||||||||||
Stockholders’ equity | 2,006,065 | 2,008,062 | 1,968,836 | |||||||||||||||||||||||||||||
Total liabilities and stockholders’ equity | $ | 15,615,271 | $ | 14,965,054 | $ | 14,712,533 | ||||||||||||||||||||||||||
Net interest income/Interest rate spread | $ | 472,139 | 3.20 | % | $ | 431,926 | 3.06 | % | $ | 420,249 | 3.04 | % | ||||||||||||||||||||
Net interest margin (3) | 3.27 | % | 3.13 | % | 3.11 | % | ||||||||||||||||||||||||||
___________________
(1) | Interest income includes net amortization-accretion of deferred loan fees, costs, discounts and premiums of $15.2 million, $19.1 million and $29.9 million for year ended 2018, 2017 and 2016, respectively. |
(2) | Includes cash equivalents and non-mortgage backed security investments, such as U.S. agency obligations, mutual funds, corporate bonds, and municipal bonds. |
(3) | Net interest income divided by average interest-earning assets. |
5
Lending Activities
General. The Company's net portfolio of loans totaled $11.5 billion at September 30, 2018 and represents 72.3% of total assets. The Bank's lending activities include the origination of loans secured by real estate, including long-term fixed-rate and adjustable-rate mortgage loans, adjustable-rate construction loans, adjustable-rate land development loans, fixed-rate and adjustable-rate multi-family loans, fixed-rate and adjustable-rate commercial real estate loans and fixed-rate and adjustable-rate business loans.
The following table sets forth the composition of the Bank’s loan portfolio.
September 30, 2018 | September 30, 2017 | September 30, 2016 | September 30, 2015 | September 30, 2014 | |||||||||||||||||||||
(In thousands) | |||||||||||||||||||||||||
Gross loans by category | |||||||||||||||||||||||||
Single-family residential | $ | 5,798,966 | 45.1 | % | $ | 5,711,004 | 46.8 | % | $ | 5,658,830 | 51.7 | % | $ | 5,700,780 | 58.0 | % | $ | 5,618,730 | 63.3 | % | |||||
Construction | 1,890,668 | 14.7 | 1,597,996 | 13.1 | 1,110,411 | 10.1 | 200,509 | 2.0 | 140,241 | 1.6 | |||||||||||||||
Construction - custom | 624,479 | 4.9 | 602,631 | 4.9 | 473,069 | 4.3 | 396,307 | 4.0 | 385,824 | 4.3 | |||||||||||||||
Land - acquisition & development | 155,204 | 1.2 | 124,308 | 1.0 | 118,497 | 1.1 | 98,282 | 1.0 | 87,313 | 1.0 | |||||||||||||||
Land - consumer lot loans | 102,036 | 0.8 | 104,405 | 0.9 | 104,567 | 1.0 | 106,815 | 1.1 | 111,698 | 1.3 | |||||||||||||||
Multi-family | 1,385,125 | 10.8 | 1,303,148 | 10.7 | 1,124,290 | 10.3 | 1,129,437 | 11.5 | 929,109 | 10.5 | |||||||||||||||
Commercial real estate | 1,452,168 | 11.3 | 1,434,610 | 11.8 | 1,093,639 | 10.0 | 1,186,551 | 12.1 | 874,167 | 9.8 | |||||||||||||||
Commercial & industrial | 1,140,874 | 8.9 | 1,093,360 | 9.0 | 978,589 | 8.9 | 657,581 | 6.7 | 448,475 | 5.0 | |||||||||||||||
HELOC | 130,852 | 1.0 | 144,850 | 1.2 | 149,716 | 1.4 | 149,526 | 1.5 | 148,590 | 1.7 | |||||||||||||||
Consumer | 173,306 | 1.3 | 85,075 | 0.7 | 139,000 | 1.3 | 197,482 | 2.0 | 138,773 | 1.6 | |||||||||||||||
Total gross loans | 12,853,678 | 100 | % | 12,201,387 | 100 | % | 10,950,608 | 100 | % | 9,823,270 | 100 | % | 8,882,920 | 100 | % | ||||||||||
Less: | |||||||||||||||||||||||||
Allowance for probable losses | 129,257 | 123,073 | 113,494 | 106,829 | 114,591 | ||||||||||||||||||||
Loans in process | 1,195,506 | 1,149,934 | 879,484 | 476,796 | 346,172 | ||||||||||||||||||||
Net deferred fees, costs and discounts | 51,834 | 45,758 | 46,710 | 69,011 | 97,359 | ||||||||||||||||||||
Total loan contra accounts | 1,376,597 | 1,318,765 | 1,039,688 | 652,636 | 558,122 | ||||||||||||||||||||
Net loans | $ | 11,477,081 | $ | 10,882,622 | $ | 9,910,920 | $ | 9,170,634 | $ | 8,324,798 | |||||||||||||||
6
The following table summarizes the Company’s loan portfolio, due for the periods indicated based on contractual terms to maturity or repricing. Amounts are presented prior to deduction of net discounts and premiums, loans in process, deferred net loan origination fees and costs and allowance for loan losses.
September 30, 2018 | Total | Less than 1 Year | 1 to 5 Years | After 5 Years | |||||||||||
(In thousands) | |||||||||||||||
Single-family residential | $ | 5,798,966 | $ | 117,416 | $ | 292,873 | $ | 5,388,677 | |||||||
Construction | 1,890,668 | 1,513,196 | 114,201 | 263,271 | |||||||||||
Construction – custom | 624,479 | — | 1,142 | 623,337 | |||||||||||
Land – acquisition and development | 155,204 | 84,494 | 66,898 | 3,812 | |||||||||||
Land – consumer lot loans | 102,036 | 12,460 | 18,739 | 70,837 | |||||||||||
Multi-family | 1,385,125 | 215,423 | 633,236 | 536,466 | |||||||||||
Commercial real estate | 1,452,168 | 601,359 | 401,886 | 448,923 | |||||||||||
Commercial & industrial | 1,140,874 | 402,159 | 475,566 | 263,149 | |||||||||||
HELOC | 130,852 | 121,061 | 4,870 | 4,921 | |||||||||||
Consumer | 173,306 | 26,011 | 19,200 | 128,095 | |||||||||||
$ | 12,853,678 | $ | 3,093,579 | $ | 2,028,611 | $ | 7,731,488 | ||||||||
The contractual loan payment period for residential mortgage loans originated by the Company normally ranges from 15 to 30 years. Experience during recent years has indicated that, because of prepayments in connection with refinancing and sales of property, residential loans have a weighted average life of four to ten years.
The following summary breaks down the Company's fixed rate and adjustable rate loans by time to maturity or to rate adjustment.
September 30, 2018 | ||||||||
Fixed-Rate | Adjustable-Rate | |||||||
Term To Maturity | Gross Loans | Term To Rate Adjustment | Gross Loans | |||||
(In thousands) | (In thousands) | |||||||
Within 1 year | $ | 90,107 | Less than 1 year | $ | 3,003,472 | |||
1 to 3 years | 205,442 | 1 to 3 years | 873,078 | |||||
3 to 5 years | 280,760 | 3 to 5 years | 669,331 | |||||
5 to 10 years | 1,069,783 | 5 to 10 years | 395,157 | |||||
10 to 20 years | 1,137,196 | 10 to 20 years | 45,603 | |||||
Over 20 years | 5,061,088 | Over 20 years | 22,661 | |||||
$ | 7,844,376 | $ | 5,009,302 | |||||
Lending Programs and Policies. The Bank's lending activities include the commercial and consumer loans, including the following loan categories.
Single-family residential loans. The Bank primarily originates 30 year fixed-rate mortgage loans secured by single-family residences. Moreover, it is the Bank's general policy to include in the documentation evidencing its conventional mortgage loans a due-on-sale clause, which facilitates adjustment of interest rates on such loans when the property securing the loan is sold or transferred.
All of the Bank's mortgage lending is subject to written, nondiscriminatory underwriting standards, loan origination procedures and lending policies approved by the Company's Board of Directors (the "Board"). Property valuations are required on all real estate loans. Appraisals are prepared by independent appraisers, reviewed by staff of the Bank, and approved by the Bank's management. Property evaluations are sometimes utilized in lieu of appraisals on single-family real estate loans of $250,000 or less and are reviewed by the Bank's staff. Detailed loan applications are obtained to determine the borrower's ability to repay and the more significant items on these applications are verified through the use of credit reports, financial statements or written confirmations.
7
Depending on the size of the loan involved, a varying number of officers of the Bank must approve the loan application before the loan can be granted. Federal guidelines limit the amount of a real estate loan made to a specified percentage of the value of the property securing the loan, as determined by an evaluation at the time the loan is originated. This is referred to as the loan-to-value ratio. The Board sets the maximum loan-to-value ratios for each type of real estate loan offered by the Bank.
When establishing general reserves for loans with loan-to-value ratios exceeding 80% that are not insured by private mortgage insurance, the Bank considers the additional risk inherent in these products, as well as their relative loan loss experience, and provides reserves when deemed appropriate. The total balance for loans with loan-to-value ratios exceeding 80% at origination as of September 30, 2018, was $439 million, with allocated reserves of $7.7 million.
Construction loans. The Bank originates construction loans to finance construction of single-family and multi-family residences as well as commercial properties. Loans made to builders are generally tied to an interest rate index and normally have maturities of two years or less. Loans made to individuals for construction of their home generally are 30 year fixed rate loans. The Bank's policies provide that for residential construction loans, loans may be made for 85% or less of the appraised value of the property upon completion. As a result of activity over the past four decades, the Bank believes that builders of single-family residences in its primary market areas consider it to be a construction lender of choice. Because of this history, the Bank has developed a staff with in-depth land development and construction experience and working relationships with selected builders based on their operating histories and financial stability.
Construction lending involves a higher level of risk than single-family residential lending due to the concentration of principal in a limited number of loans and borrowers and the effects of general economic conditions in the homebuilding industry. Moreover, a construction loan can involve additional risks because of the inherent difficulty in estimating both the estimated cost (including interest) of the project and the property's value at completion of the project.
Land loans. The Bank's land development loans are of a short-term nature and are generally made for 75% or less of the appraised value of the unimproved property. Funds are disbursed periodically at various stages of completion as authorized by the Company's personnel. The interest rate on these loans generally adjusts daily in accordance with a designated index.
Land development loans involve a higher degree of credit risk than long-term financing on owner-occupied real estate. Mitigation of risk of loss on a land development loan is dependent largely upon the accuracy of the initial estimate of the property's value at completion of development compared to the estimated cost (including interest) of development and the financial strength of the borrower.
The Bank's permanent land loans (also called consumer lot loans) are generally made on improved land, with the intent of building a primary or secondary residence. These loans are limited to 80% or less of the appraised value of the property, up to a maximum loan amount of $350,000. The interest rate on permanent land loans is generally fixed for 20 years.
Multi-family residential loans. Multi-family residential (five or more dwelling units) loans generally are secured by multi-family rental properties, such as apartment buildings. In underwriting multi-family residential loans, the Bank considers a number of factors, which include the projected net cash flow to the loan's debt service requirement, the age and condition of the collateral, the financial resources and income level of the borrower and the borrower's experience in owning or managing similar properties. Multi-family residential loans are originated in amounts up to 80% of the appraised value of the property securing the loan.
Loans secured by multi-family residential real estate generally involve a different degree of credit risk than single-family residential loans and carry larger loan balances. This increased credit risk is a result of several factors, including the concentration of principal in a limited number of loans and borrowers, the effects of general economic conditions on income-producing properties, and the increased difficulty of evaluating and monitoring these types of loans. Furthermore, the repayment of loans secured by multi-family mortgages typically depends upon the successful operation of the related real estate property. If the cash flow from the project is reduced, the borrower's ability to repay the loan may be impaired. The Bank seeks to minimize these risks through its underwriting policies, which require such loans to be qualified at origination on the basis of the property's income and debt service ratio.
It is the Bank's policy to obtain title insurance ensuring that it has a valid first lien on the mortgaged real estate serving as collateral for the loan. Borrowers must also obtain hazard insurance prior to closing and, when required by regulation, flood insurance. Borrowers may be required to advance funds on a monthly basis, together with each payment of principal and interest, to a mortgage escrow account from which the Bank makes disbursements for items such as real estate taxes, hazard insurance premiums and private mortgage insurance premiums when due.
Commercial and industrial loans. The Bank makes various types of business loans to customers in its market area for working capital, acquiring real estate, equipment or other business purposes, such as acquisitions. The terms of these loans generally range from less than one year to a maximum of ten years. The loans are either negotiated on a fixed-rate basis or carry adjustable interest rates indexed to the LIBOR rate, prime rate or another market rate.
8
Commercial loans are made based upon assessment of the borrower's ability and willingness to repay along with an evaluation of secondary repayment sources such as the value and marketability of collateral. Most such loans are extended to closely held businesses and the personal guaranty of the principals is usually obtained. Commercial loans have a relatively high risk of default compared to residential real estate loans. Pricing of commercial loans is based on the credit risk of the borrower with consideration given to the overall relationship of the borrower, including deposits. The acquisition of business deposits is an important focus of this business line. The Bank provides a full line of treasury management products to support the depository needs of its clients.
Consumer loans. The Bank's non-mortgage consumer loan portfolio consists of prime quality student loans acquired from an independent financial investment firm that retains 1% of each loan, plus various other non-mortgage consumer loans obtained through acquisitions.
Home equity loans. The Bank extends revolving lines of credit to consumers that are secured by a first or second mortgage on a single family residence. The interest rate on these loans adjusts monthly indexed to prime. Total loan-to-value ratios when combined with any underlying first liens are limited to 80% or less. Loan terms are a ten year draw period followed by a fifteen year amortization period.
Origination and Purchase of Loans. The Bank has general authority to lend anywhere in the United States; however, its primary lending areas are within the states of Washington, Oregon, Idaho, Arizona, Utah, Nevada, New Mexico and Texas. Loan originations come from a variety of sources. Residential loan originations result from referrals from real estate brokers, walk-in customers, purchasers of property in connection with builder projects that are financed by the Bank, mortgage brokers and refinancings for existing customers. Business purpose loans are obtained primarily by direct solicitation of borrowers and ongoing relationships.
The Bank also purchases loans and mortgage-backed securities when lending rates and mortgage volume for new loan originations in its market area do not fulfill its needs. Over the past few years, single-family residential loan originations were lower than historical levels due to the low interest rate environment and excessive government participation in the mortgage market.
The table below shows the Company's total loan origination, purchase and repayment activities.
Twelve Months Ended September 30, | 2018 | 2017 | 2016 | 2015 | 2014 | ||||||||||||||
(In thousands) | |||||||||||||||||||
Loans originated (1): | |||||||||||||||||||
Single-family residential | $ | 621,431 | $ | 757,116 | $ | 692,575 | $ | 705,741 | $ | 696,999 | |||||||||
Construction | 1,068,443 | 1,081,464 | 900,649 | 263,532 | 170,539 | ||||||||||||||
Construction – custom | 523,951 | 530,435 | 421,816 | 365,220 | 359,073 | ||||||||||||||
Land – acquisition & development | 85,208 | 79,876 | 59,511 | 78,818 | 53,960 | ||||||||||||||
Land – consumer lot loans | 33,820 | 39,151 | 29,661 | 21,422 | 12,441 | ||||||||||||||
Multi-family | 272,046 | 299,359 | 361,261 | 349,442 | 239,352 | ||||||||||||||
Commercial real estate | 274,242 | 443,687 | 353,265 | 600,610 | 258,367 | ||||||||||||||
Commercial & industrial | 869,337 | 931,840 | 1,051,950 | 642,309 | 332,871 | ||||||||||||||
HELOC | 82,508 | 72,913 | 74,538 | 74,455 | 47,054 | ||||||||||||||
Consumer | 3,008 | 3,137 | 3,308 | 1,966 | 1,359 | ||||||||||||||
Total loans originated | 3,833,994 | 4,238,978 | 3,948,534 | 3,103,515 | 2,172,015 | ||||||||||||||
Loans purchased (2) | 143,605 | 72,856 | 105,420 | 279,936 | 211,228 | ||||||||||||||
Loan principal repayments | (3,335,896 | ) | (3,099,851 | ) | (2,935,167 | ) | (2,418,547 | ) | (1,857,597 | ) | |||||||||
Net change in loans in process, discounts, etc. (3) | (47,244 | ) | (240,281 | ) | (378,501 | ) | (119,068 | ) | (24,825 | ) | |||||||||
Net loan activity increase (decrease) | $ | 594,459 | $ | 971,702 | $ | 740,286 | $ | 845,836 | $ | 500,821 | |||||||||
Beginning balance | $ | 10,882,622 | $ | 9,910,920 | $ | 9,170,634 | $ | 8,324,798 | $ | 7,823,977 | |||||||||
Ending balance | $ | 11,477,081 | $ | 10,882,622 | $ | 9,910,920 | $ | 9,170,634 | $ | 8,324,798 | |||||||||
___________________
(1) | Includes undisbursed loan in process and for years prior to 2016 does not include savings account loans, which were not material during the periods indicated. |
(2) | Includes non-covered loans acquired through acquisitions and whole loan purchases. |
(3) | Includes non-cash transactions. |
9
Interest Rates, Loan Fees and Service Charges. Interest rates charged by the Bank on mortgage loans are primarily determined by the competitive loan rates offered in its lending areas and in the secondary market. Mortgage loan rates reflect factors such as general interest rates, the supply of money available to the industry and the demand for such loans. General economic conditions, the regulatory programs and policies of federal and state agencies, including the FRB’s monetary policies, changes in tax laws and governmental budgetary programs influence these factors.
The Bank receives fees for originating loans in addition to various fees and charges related to existing loans, including prepayment charges, late charges and assumption fees. In making one-to-four- family home mortgage loans, the Bank normally charges an origination fee and as part of the loan application, the borrower pays the Bank for out-of-pocket costs, such as the appraisal fee, whether or not the borrower closes the loan. The interest rate charged is normally the prevailing rate at the time the loan application is approved and accepted. In the case of construction loans, the Bank normally charges an origination fee. Loan origination fees and other terms of multi-family residential loans are individually negotiated.
Non-Performing Assets. When a borrower violates a condition of a loan, the Bank attempts to cure the default by contacting the borrower. In most cases, defaults are cured promptly. If the default is not cured within an appropriate time frame, typically 90 days, the Bank may institute appropriate action to collect the loan, such as making demand for payment or initiating foreclosure proceedings on the collateral. If foreclosure occurs, the collateral will typically be sold at public auction and may be purchased by the Bank.
Loans are placed on nonaccrual status when, in the judgment of management, the probability of collecting interest or principal is deemed to be insufficient to warrant further accrual. When a loan is placed on nonaccrual status, previously accrued but unpaid interest is deducted from interest income. The Bank does not accrue interest on loans 90 days past due or more. See Note A to the Consolidated Financial Statements included in Item 8 hereof for additional information.
The Bank will consider modifying the interest rate and terms of a loan if it determines that a modification is deemed to be the best option available for collection in full or to minimize the loss to the Bank. Most loans restructured in troubled debt restructurings ("TDRs") are accruing and performing loans where the borrower has proactively approached the Bank about a modification due to temporary financial difficulties. Each request is individually evaluated for merit and likelihood of success. The modification of these loans is typically a payment reduction through a rate reduction of from 100 to 200 bps for a specific term, usually six to twelve months. Interest-only payments may also be approved during the modification period. Principal forgiveness generally is not an available option for restructured loans. As of September 30, 2018, single-family residential loans comprised 89.1% of restructured loans. The Bank reserves for restructured loans within its allowance for loan loss methodology by taking into account the following performance indicators: 1) time since modification, 2) current payment status and 3) geographic market conditions.
Real estate acquired by foreclosure or deed-in-lieu thereof (“REO” or “Real Estate Owned”) is classified as real estate held for sale. When property is acquired, it is recorded at the fair market value less estimated selling costs at the date of acquisition. Interest accrual ceases on the date of acquisition and all costs incurred in maintaining the property from that date forward are expensed as incurred. Costs incurred for the improvement or development of such property is capitalized. See Note A to the Consolidated Financial Statements included in Item 8 hereof for additional information.
10
The following table sets forth information regarding the Company's restructured and non-accrual loans and REO.
September 30, | 2018 | 2017 | 2016 | 2015 | 2014 | ||||||||||||||
(In thousands) | |||||||||||||||||||
Performing restructured loans | $ | 150,667 | $ | 202,272 | $ | 251,583 | $ | 289,587 | $ | 350,653 | |||||||||
Non-performing restructured loans | 6,191 | 5,105 | 9,948 | 13,126 | 24,090 | ||||||||||||||
Total restructured loans | 156,858 | 207,377 | 261,531 | 302,713 | 374,743 | ||||||||||||||
Non-accrual loans: | |||||||||||||||||||
Single-family residential | 27,643 | 27,930 | 33,148 | 59,074 | 74,067 | ||||||||||||||
Construction | 2,427 | — | — | 754 | 1,477 | ||||||||||||||
Construction – custom | — | 91 | — | 732 | — | ||||||||||||||
Land – acquisition & development | 920 | 296 | 58 | — | 811 | ||||||||||||||
Land – consumer lot loans | 787 | 605 | 510 | 1,273 | 2,637 | ||||||||||||||
Multi-family | — | 139 | 776 | 2,558 | 1,742 | ||||||||||||||
Commercial real estate | 8,971 | 11,815 | 7,100 | 2,176 | 5,106 | ||||||||||||||
Commercial & industrial | 14,394 | 8,082 | 583 | — | 7 | ||||||||||||||
HELOC | 523 | 531 | 239 | 563 | 795 | ||||||||||||||
Consumer | 21 | 91 | — | 680 | 789 | ||||||||||||||
Total non-accrual loans (1) | 55,686 | 49,580 | 42,414 | 67,810 | 87,431 | ||||||||||||||
Real estate owned | 11,298 | 20,658 | 29,027 | 61,098 | 59,880 | ||||||||||||||
Other property owned | 3,109 | — | — | — | — | ||||||||||||||
Total non-performing assets | 70,093 | 70,238 | 71,441 | 128,908 | 147,311 | ||||||||||||||
Total non-performing assets and performing restructured loans | $ | 220,760 | $ | 272,510 | $ | 323,024 | $ | 418,495 | $ | 497,964 | |||||||||
Total non-performing assets and restructured loans as a percent of total assets | 1.39 | % | 1.79 | % | 2.17 | % | 2.87 | % | 3.37 | % | |||||||||
Total non-performing assets to total assets | 0.44 | % | 0.46 | % | 0.48 | % | 0.88 | % | 1.00 | % | |||||||||
___________________
(1) | For the year ended September 30, 2018, the Company recognized $5,191,000 in interest income on cash payments received from borrowers on non-accrual loans. The Company would have recognized interest income of $2,364,000 for the same period had these loans performed according to their original contract terms. The recognized interest income may include more than twelve months of interest for some of the non-accrual loans that were brought current or paid off. In addition to the non-accrual loans reflected in the above table, the Company had $42,258,000 of loans that were less than 90 days delinquent at September 30, 2018 but were classified as substandard for one or more reasons. If these loans were deemed non-performing, the Company's ratio of total non-performing assets and performing restructured loans as a percent of total assets would have increased to 1.66% at September 30, 2018. For a discussion of the Company's policy for placing loans on nonaccrual status, see Note A to the Consolidated Financial Statements included in Item 8 hereof. |
Allowance for Loan Losses. The Company maintains an allowance for loan losses to absorb losses inherent in the loan portfolio. The amount of this allowance is based on ongoing, quarterly assessments of the probable and estimable losses inherent in the loan portfolio. The Bank’s method for assessing the appropriateness of the allowance is to apply a loss percentage factor to the different loan types. The loss percentage factor is made up of two parts - the historical loss factor (“HLF”) and the qualitative loss factor (“QLF”). The HLF takes into account historical charge-offs by loan type. The Company uses an average of historical loss rates for each loan category multiplied by an estimated loss emergence period. The QLFs are based on management's continuing evaluation of the pertinent factors underlying the quality of the loan portfolio, including changes in the size and composition of the loan portfolio, actual loan loss experience, current economic conditions, collateral values, geographic concentrations, seasoning of the loan portfolio, specific industry conditions, and the duration of the current business cycle. These factors are considered by loan type. Specific allowances are established in cases where management has identified conditions or circumstances related to a loan that management believes indicate the probability that a loss has been incurred. The Company has also established a reserve for unfunded commitments.
As part of the process for determining the adequacy of the allowance for loan losses, management reviews the loan portfolio for specific weaknesses and considers the factors noted above. The recovery of the carrying value of loans is susceptible to future market conditions
11
beyond the Bank's control, which may result in losses or recoveries differing from those provided. In those cases, a portion of the allowance is then allocated to reflect the estimated loss exposure.
The following table provides detail regarding the Company's allowance for loan losses.
Twelve Months Ended September 30, | 2018 | 2017 | 2016 | 2015 | 2014 | ||||||||||||||
(In thousands) | |||||||||||||||||||
Beginning balance | $ | 123,073 | $ | 113,494 | $ | 106,829 | $ | 114,591 | $ | 116,741 | |||||||||
Charge-offs: | |||||||||||||||||||
Single-family residential | 1,142 | 1,229 | 3,106 | 5,524 | 8,529 | ||||||||||||||
Construction | — | — | — | 388 | 949 | ||||||||||||||
Construction – custom | 50 | 16 | 60 | — | — | ||||||||||||||
Land – Acquisition & development | 13 | 280 | 42 | 38 | 541 | ||||||||||||||
Land – consumer lot loans | 67 | 17 | 732 | 459 | 658 | ||||||||||||||
Multi-family | — | — | — | — | — | ||||||||||||||
Commercial real estate | 36 | 11 | 103 | 1,711 | 105 | ||||||||||||||
Commercial & industrial loans | 3,574 | 173 | 941 | 3,354 | 826 | ||||||||||||||
HELOC | 668 | 90 | 54 | 66 | 48 | ||||||||||||||
Consumer | 382 | 884 | 962 | 3,060 | 3,443 | ||||||||||||||
5,932 | 2,700 | 6,000 | 14,600 | 15,099 | |||||||||||||||
Recoveries: | |||||||||||||||||||
Single-family residential | 757 | 653 | 3,251 | 13,403 | 17,684 | ||||||||||||||
Construction | — | — | 745 | 120 | 97 | ||||||||||||||
Construction – custom | — | — | 60 | — | — | ||||||||||||||
Land – Acquisition & development | 14,223 | 11,038 | 8,220 | 207 | 3,071 | ||||||||||||||
Land – consumer lot loans | 35 | 481 | 5 | 221 | 22 | ||||||||||||||
Multi-family | — | — | — | 220 | — | ||||||||||||||
Commercial real estate | 189 | 1,684 | 1,812 | 735 | 33 | ||||||||||||||
Commercial & industrial loans | 714 | 1,833 | 2,933 | 1,374 | 5,043 | ||||||||||||||
HELOC | 71 | 21 | 21 | 2 | — | ||||||||||||||
Consumer | 993 | 1,297 | 2,018 | 3,688 | 3,513 | ||||||||||||||
16,982 | 17,007 | 19,065 | 19,970 | 29,463 | |||||||||||||||
Net charge-offs (recoveries) | (11,050 | ) | (14,307 | ) | (13,065 | ) | (5,370 | ) | (14,364 | ) | |||||||||
Provision (release) for loan losses and transfers | (4,866 | ) | (4,728 | ) | (6,400 | ) | (13,132 | ) | (16,514 | ) | |||||||||
Ending balance (1) | $ | 129,257 | $ | 123,073 | $ | 113,494 | $ | 106,829 | $ | 114,591 | |||||||||
Ratio of net charge-offs (recoveries) to average loans outstanding | (0.10 | )% | (0.14 | )% | (0.14 | )% | (0.06 | )% | (0.18 | )% | |||||||||
__________________
(1) This does not include a reserve for unfunded commitments of $7,250,000, $7,750,000, $3,235,000, $3,085,000 and $2,910,000 as of September 30, 2018, 2017, 2016, 2015 and 2014 respectively.
12
The following table sets forth the amount of the Company’s allowance for loan losses by loan category.
September 30, | 2018 | 2017 | 2016 | 2015 | 2014 | |||||||||||||||||||||||||||||||||||||||
ALLL Amount | Loans to Total Loans (1) | Coverage Ratio (2) | ALLL Amount | Loans to Total Loans (1) | Coverage Ratio (2) | ALLL Amount | Loans to Total Loans (1) | Coverage Ratio (2) | ALLL Amount | Loans to Total Loans (1) | Coverage Ratio (2) | ALLL Amount | Loans to Total Loans (1) | Coverage Ratio (2) | ||||||||||||||||||||||||||||||
(In thousands) | ||||||||||||||||||||||||||||||||||||||||||||
Allowance allocation: | ||||||||||||||||||||||||||||||||||||||||||||
Single-family residential | $ | 33,033 | 49.7 | % | 0.6 | % | $ | 36,892 | 51.8 | % | 0.6 | % | $ | 37,796 | 51.5 | % | 0.7 | % | $ | 47,347 | 57.8 | % | 0.8 | % | $ | 62,067 | 62.6 | % | 0.8 | % | ||||||||||||||
Construction | 31,317 | 9.1 | 3.0 | 24,556 | 7.2 | 3.1 | 19,838 | 10.1 | 4.0 | 6,680 | 2.0 | 5.1 | 6,742 | 1.6 | 5.1 | |||||||||||||||||||||||||||||
Construction – custom | 1,842 | 2.5 | 0.6 | 1,944 | 2.5 | 0.7 | 1,080 | 4.3 | 0.5 | 990 | 4.0 | 0.5 | 1,695 | 4.3 | 50.0 | |||||||||||||||||||||||||||||
Land – acquisition & development | 7,978 | 1.1 | 6.5 | 6,829 | 1.0 | 6.5 | 6,023 | 1.1 | 6.6 | 5,781 | 1.0 | 7.7 | 5,592 | 0.9 | 7.7 | |||||||||||||||||||||||||||||
Land – consumer lot loans | 2,164 | 0.8 | 2.2 | 2,649 | 0.9 | 2.7 | 2,535 | 1.0 | 2.7 | 2,946 | 1.1 | 2.8 | 3,077 | 1.3 | 2.8 | |||||||||||||||||||||||||||||
Multi-family | 8,329 | 11.9 | 0.6 | 7,862 | 11.8 | 0.6 | 6,925 | 10.3 | 0.6 | 5,304 | 11.6 | 0.5 | 4,248 | 10.4 | 0.5 | |||||||||||||||||||||||||||||
Commercial real estate | 11,852 | 12.5 | 0.8 | 11,818 | 12.8 | 0.8 | 8,588 | 10.0 | 0.9 | 8,960 | 11.7 | 1.0 | 7,548 | 8.5 | 1.0 | |||||||||||||||||||||||||||||
Commercial & industrial | 28,702 | 9.8 | 2.5 | 28,524 | 9.9 | 2.6 | 28,008 | 8.9 | 2.9 | 24,980 | 6.7 | 3.9 | 17,223 | 4.9 | 3.9 | |||||||||||||||||||||||||||||
HELOC | 781 | 1.1 | 0.6 | 855 | 1.3 | 0.6 | 813 | 1.3 | 0.6 | 902 | 1.4 | 0.7 | 928 | 1.5 | 0.7 | |||||||||||||||||||||||||||||
Consumer | 3,259 | 1.5 | 1.9 | 1,144 | 0.8 | 1.4 | 1,888 | 1.3 | 1.4 | 2,939 | 2.0 | 1.5 | 3,227 | 1.6 | 1.5 | |||||||||||||||||||||||||||||
Covered loans | — | — | — | — | — | 0.2 | — | 0.7 | 2,244 | 2.4 | ||||||||||||||||||||||||||||||||||
Total allowance for loan losses (3) | $ | 129,257 | 100 | % | $ | 123,073 | 100 | % | $ | 113,494 | 100 | % | $ | 106,829 | 100 | % | $ | 114,591 | 100 | % | ||||||||||||||||||||||||
___________________
(1) | Represents the gross loan amount (less LIP and discounted loans) for each respective loan category as a % of total gross loans (less LIP and discounted loans). |
(2) | Represents the allocated allowance for each respective loan category as a % of gross loans for that same category, excluding acquired loans outstanding that are not subject to the allowance for loan loss. |
(3) | This does not include a reserve for unfunded commitments of $7,250,000, $7,750,000, $3,235,000, $3,085,000 and $2,910,000 as of September 30, 2018, 2017, 2016, 2015 and 2014, respectively. |
13
Investment Activities
As a national association, the Bank is obligated to maintain adequate liquidity and does so by holding cash and cash equivalents and by investing in securities. These investments may include, among other things, certain certificates of deposit, repurchase agreements, bankers’ acceptances, loans to financial institutions whose deposits are federally-insured, federal funds, United States government and agency obligations and mortgage-backed securities.
The following table sets forth the composition of the Company’s investment portfolio.
September 30, | 2018 | 2017 | 2016 | ||||||||||||||||||||
Amortized Cost | Fair Value | Amortized Cost | Fair Value | Amortized Cost | Fair Value | ||||||||||||||||||
(In thousands) | |||||||||||||||||||||||
U.S. government and agency securities | $ | 208,971 | $ | 207,293 | $ | 212,032 | $ | 211,077 | $ | 263,946 | $ | 259,351 | |||||||||||
Equity securities | 500 | 488 | 500 | 522 | 100,422 | 101,824 | |||||||||||||||||
Corporate debt securities | 183,727 | 184,695 | 183,582 | 185,298 | 461,530 | 461,138 | |||||||||||||||||
Municipal bonds | 21,721 | 22,978 | 24,054 | 26,624 | 24,013 | 27,670 | |||||||||||||||||
Agency pass-through certificates | 2,518,512 | 2,429,783 | 2,474,925 | 2,470,210 | 2,396,554 | 2,434,597 | |||||||||||||||||
Commercial MBS | 18,460 | 18,490 | 8,350 | 8,391 | 80,318 | 79,870 | |||||||||||||||||
$ | 2,951,891 | $ | 2,863,727 | $ | 2,903,443 | $ | 2,902,122 | $ | 3,326,783 | $ | 3,364,450 | ||||||||||||
The table below shows the investment portfolio categorized by maturity band.
September 30, 2018 | Amortized Cost | Weighted Average Yield | ||||
(In thousands) | ||||||
Due in less than 1 year | $ | 3,460 | 4.36 | % | ||
Due after 1 year through 5 years | 156,046 | 3.33 | ||||
Due after 5 years through 10 years | 130,838 | 2.91 | ||||
Due after 10 years | 2,661,547 | 3.23 | ||||
$ | 2,951,891 | 3.22 | % | |||
Sources of Funds
General. Deposits are the primary source of the Bank’s funds for use in lending and other general business purposes. In addition to deposits, the Bank derives funds from loan repayments, advances from the FHLB, other borrowings, and from investment repayments and sales. Loan repayments are a relatively stable source of funds, while deposit inflows and outflows are influenced by general interest rates, money market conditions, the availability of FDIC insurance and the market perception of the Company’s financial stability. Borrowings may be used on a short-term basis to compensate for reductions in normal sources of funds, such as deposit inflows at lower than projected levels. Borrowings may also be used on a longer-term basis to support expanded activities and to manage interest rate risk.
Deposits. The Bank relies on a mix of deposit types, including business and personal checking accounts, term certificates of deposit, and other savings deposit alternatives that have no fixed term, such as money market accounts and passbook savings accounts The Bank offers several consumer checking account products, both interest bearing and non-interest bearing and three business checking accounts, two of which target small businesses with relatively simple and straightforward banking needs and one for larger, more complex business depositors with an account that prices monthly based on the volume and type of activity. Savings and money market accounts are offered to both businesses and consumers, with interest paid after certain threshold amounts are exceeded.
Certificates of deposit with a maturity of one year or less have penalties for premature withdrawal equal to 90 days of interest. When the maturity is greater than one year but less than four years, the penalty is 180 days of interest. When the maturity is greater than four years, the penalty is 365 days interest. Early withdrawal penalty fee income for the years ended 2018, 2017 and 2016 amounted to $756,000, $524,000 and $450,000, respectively.
14
The Bank’s deposits are obtained primarily from residents of Washington, Oregon, Idaho, Arizona, Utah, Nevada, New Mexico and Texas. The Bank does not advertise for deposits outside of these states.
The following table sets forth certain information relating to the Company’s deposits.
September 30, | 2018 | 2017 | 2016 | ||||||||||||||||
Amount | Rate | Amount | Rate | Amount | Rate | ||||||||||||||
(In thousands) | |||||||||||||||||||
Balance by interest rate: | |||||||||||||||||||
Checking accounts | $3,179,746 | 0.28 | % | $3,019,095 | 0.13 | % | $2,721,721 | 0.06 | % | ||||||||||
Savings accounts | 836,501 | 0.11 | 888,881 | 0.11 | 820,980 | 0.10 | |||||||||||||
Money market accounts | 2,566,096 | 0.65 | 2,453,182 | 0.19 | 2,462,891 | 0.15 | |||||||||||||
6,582,343 | 6,361,158 | 6,005,592 | |||||||||||||||||
Fixed-rate time deposit accounts: | |||||||||||||||||||
Under 1.00% | 629,589 | 2,204,756 | 3,268,272 | ||||||||||||||||
1.00% to 1.99% | 3,761,543 | 2,099,841 | 1,292,612 | ||||||||||||||||
2.00% to 2.99% | 413,671 | 169,253 | 34,376 | ||||||||||||||||
4,804,803 | 4,473,850 | 4,595,260 | |||||||||||||||||
$ | 11,387,146 | $ | 10,835,008 | $ | 10,600,852 | ||||||||||||||
The following table sets forth, by various interest rate categories, the amount of fixed-rate time deposits that mature during the periods indicated.
Maturing in | |||||||||||||||||||||||||||
September 30, 2018 | 1 to 3 Months | 4 to 6 Months | 7 to 12 Months | 13 to 24 Months | 25 to 36 Months | 37 to 60 Months | Total | ||||||||||||||||||||
(In thousands) | |||||||||||||||||||||||||||
Fixed-rate time deposits: | |||||||||||||||||||||||||||
Under 1.00% | $ | 622,633 | $ | 2,140 | $ | 4,490 | $ | — | $ | 326 | $ | — | $ | 629,589 | |||||||||||||
1.00 to 1.99% | 421,164 | 618,182 | 1,097,510 | 1,181,028 | 295,400 | 148,259 | 3,761,543 | ||||||||||||||||||||
2.00% to 2.99% | 721 | 3,649 | 30,489 | 154,214 | 512 | 224,086 | 413,671 | ||||||||||||||||||||
Total | $ | 1,044,518 | $ | 623,971 | $ | 1,132,489 | $ | 1,335,242 | $ | 296,238 | $ | 372,345 | $ | 4,804,803 | |||||||||||||
Historically, a significant number of certificate of deposit holders roll over their balances into new certificates of the same term at the Bank’s then current rate. To ensure a continuity of this trend, the Bank expects to continue to offer market rates of interest. Its ability to retain maturing deposits in certificate accounts is difficult to project; however, the Bank believes that by competitively pricing these certificates, levels deemed appropriate by management can be achieved on a continuing basis.
At September 30, 2018, the Bank had $753,748,000 of certificates of deposit in amounts of $250,000 or more outstanding, maturing as follows: $217,132,000 within 3 months; $77,780,000 over 3 months through 6 months; $171,775,000 over 6 months through 12 months; and $287,061,000 thereafter.
Borrowings. The Bank has a credit line with the Federal Home Loan Bank of Des Moines ("FHLB") equal to 45% of total assets. The Bank obtains advances from the FHLB upon the security of the FHLB capital stock it owns and certain of its loans, provided certain standards related to credit worthiness have been met. See “Regulation-Washington Federal-Federal Home Loan Bank System” below. Such advances are made pursuant to several different credit programs. Each credit program has its own interest rate and range of maturities, and the FHLB prescribes acceptable uses to which the advances pursuant to each program may be put, as well as limitations on the size of such advances. Depending on the program, such limitations are based either on a fixed percentage of assets or the Company's credit worthiness. FHLB advances have, from time to time, been available to meet seasonal
15
and other withdrawals of savings accounts and to expand the Bank's lending program. The Bank had $2,330,000,000 of FHLB advances outstanding at September 30, 2018.
The Bank may need to borrow funds for short periods of time to meet day-to-day financing needs. In these instances, funds are borrowed from other financial institutions or the Federal Reserve, for periods generally ranging from one to seven days at the then current borrowing rate. At September 30, 2018, the Bank had no such short-term borrowings.
The following table presents additional information regarding the Company's borrowings.
Twelve Months Ended September 30, | 2018 | 2017 | 2016 | ||||||||
(In thousands) | |||||||||||
FHLB advances: | |||||||||||
Average balance outstanding | $ | 2,384,795 | $ | 2,167,986 | $ | 1,992,434 | |||||
Maximum amount outstanding at any month-end during the period | 2,620,000 | 2,350,000 | 2,080,000 | ||||||||
Weighted-average interest rate, net of cash flow hedges, during the period (1) | 2.62 | % | 3.00 | % | 3.22 | % | |||||
Securities sold to customers under agreements to repurchase: | |||||||||||
Average balance outstanding | $ | 60,933 | $ | 59,361 | $ | 49,885 | |||||
Maximum amount outstanding at any month-end during the period | 84,919 | 74,104 | 56,310 | ||||||||
Weighted-average interest rate during the period (1) | 0.31 | % | 0.20 | % | 0.22 | % | |||||
Total average borrowings: | $ | 2,445,728 | $ | 2,227,347 | $ | 2,042,319 | |||||
Weighted-average interest rate, net of cash flow hedges, on total average borrowings (1) | 2.56 | % | 2.92 | % | 3.14 | % | |||||
___________________
(1) | Interest expense divided by average daily balances. |
Other Ratios
The following table sets forth certain ratios related to the Company.
Twelve Months Ended September 30, | ||||||||
2018 | 2017 | 2016 | ||||||
Return on assets (1) | 1.31 | % | 1.16 | % | 1.12 | % | ||
Return on equity (2) | 10.16 | 8.64 | 8.33 | |||||
Average equity to average assets | 12.59 | 13.15 | 13.27 | |||||
Dividend payout ratio (3) | 27.47 | 42.94 | 30.43 | |||||
___________________
(1) | Net income divided by average total assets. |
(2) | Net income divided by average equity. |
(3) | Dividends paid per share divided by net income per share. |
Rate/Volume Analysis
The table below sets forth certain information regarding changes in interest income and interest expense of the Company for the years indicated. For each category of interest-earning asset and interest-bearing liability, information is provided on changes attributable to: (1) changes in volume (changes in volume multiplied by old rate) and (2) changes in rate (changes in rate multiplied by old average volume). The change in interest income and interest expense attributable to changes in both volume and rate has been allocated proportionately to the change due to volume and the change due to rate.
16
Twelve Months Ended September 30, | |||||||||||||||||||||||||||||||||||
2018 vs. 2017 Increase (Decrease) Due to | 2017 vs. 2016 Increase (Decrease) Due to | 2016 vs. 2015 Increase (Decrease) Due to | |||||||||||||||||||||||||||||||||
Volume | Rate | Total | Volume | Rate | Total | Volume | Rate | Total | |||||||||||||||||||||||||||
(In thousands) | (In thousands) | (In thousands) | |||||||||||||||||||||||||||||||||
Interest income: | |||||||||||||||||||||||||||||||||||
Loan portfolio | $ | 36,820 | $ | 8,464 | $ | 45,284 | $ | 40,942 | $ | (24,504 | ) | $ | 16,438 | $ | 44,395 | $ | (27,312 | ) | $ | 17,083 | |||||||||||||||
Mortgage-backed securities | (418 | ) | 10,213 | 9,795 | (4,192 | ) | 1,855 | (2,337 | ) | (7,824 | ) | (619 | ) | (8,443 | ) | ||||||||||||||||||||
Investments (1) | (2,970 | ) | 6,056 | 3,086 | (8,050 | ) | 6,074 | (1,976 | ) | (7,283 | ) | 4,883 | (2,400 | ) | |||||||||||||||||||||
All interest-earning assets | 33,432 | 24,733 | 58,165 | 28,700 | (16,575 | ) | 12,125 | 29,288 | (23,048 | ) | 6,240 | ||||||||||||||||||||||||
Interest expense: | |||||||||||||||||||||||||||||||||||
Customer accounts | 2,371 | 18,098 | 20,469 | 180 | (642 | ) | (462 | ) | (370 | ) | 1,801 | 1,431 | |||||||||||||||||||||||
FHLB advances and other borrowings | 6,160 | (8,677 | ) | (2,517 | ) | 3,518 | (2,608 | ) | 910 | 3,900 | (5,859 | ) | (1,959 | ) | |||||||||||||||||||||
All interest-bearing liabilities | 8,531 | 9,421 | 17,952 | 3,698 | (3,250 | ) | 448 | 3,530 | (4,058 | ) | (528 | ) | |||||||||||||||||||||||
Change in net interest income | $ | 24,901 | $ | 15,312 | $ | 40,213 | $ | 25,002 | $ | (13,325 | ) | $ | 11,677 | $ | 25,758 | $ | (18,990 | ) | $ | 6,768 | |||||||||||||||
___________________
(1) | Includes interest on cash equivalents and dividends on stock of the FHLB of Des Moines and FRB of San Francisco. |
Interest Rate Risk
The primary source of income for the Company is net interest income, which is the difference between the interest income generated by interest-earning assets and the interest expense incurred for interest-bearing liabilities. The level of net interest income is a function of the average balance of interest-earning assets and interest-bearing liabilities and the difference between the yield on earning assets and the cost of interest-bearing liabilities. Both the pricing and mix of the Company's interest-earning assets and interest-bearing liabilities influence these factors. All else being equal, if the interest rates on the Company's interest-bearing liabilities increase at a faster pace than the interest rates on its interest-earning assets, the result would be a reduction in net interest income and with it, a reduction in net earnings.
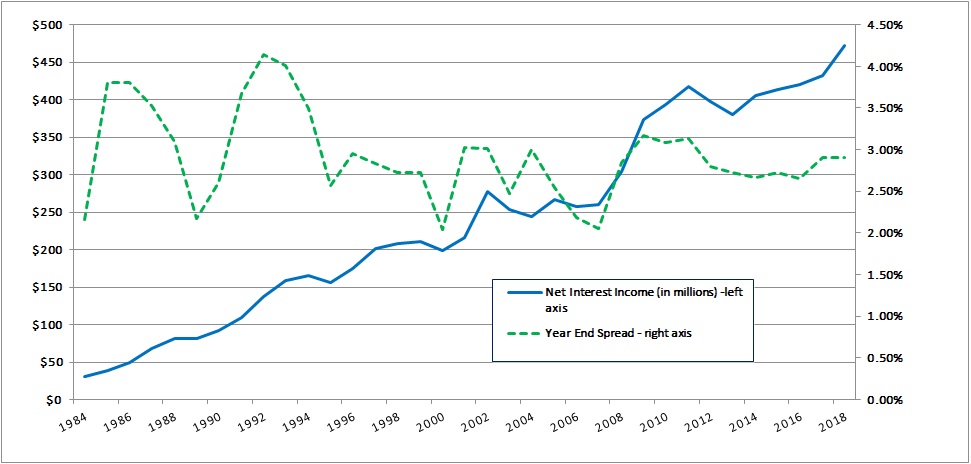
The net interest margin is measured using the net interest income divided by average earning assets for the period. The net interest margin increased to 3.27% for the year ended September 30, 2018 from 3.13% for the year ended September 30, 2017. The yield on earning assets increased 1 basis point to 4.20% and the cost of interest bearing liabilities decreased by 1 basis point to 1.00%. The higher yield on interest earning assets is primarily the result of changes in the asset mix.
Interest rate risk arises in part due to the Bank's significant holdings of fixed-rate single-family home loans, which are longer-term than customer accounts that constitute its primary liabilities. Accordingly, assets do not usually respond as quickly to changes in interest rates as liabilities. In the absence of management action, net interest income can be expected to decline when interest rates rise and to expand when interest rates fall. Shortening the maturity or repricing of the investment portfolio is one action that management can take. The composition of the investment portfolio was 24.5% variable rate and 75.5% fixed rate as of September 30, 2018 to provide some protection against rising rates. In addition, the Bank is producing more short term or variable rate loans and has increased less rate sensitive transaction deposit accounts to 57.8% of the deposit portfolio.
The Company's balance sheet strategy, in conjunction with low operating costs, has allowed the Company to manage interest rate risk, within guidelines established by the Board, through all interest rate cycles. It is management's objective to grow the dollar amount of net interest income, through the rate cycles, acknowledging that there will be some periods of time when that will not be feasible.
The chart below shows the volatility of the Company's period end net interest spread (dotted line which is measured against the right axis) compared to the relatively consistent growth in net interest income (solid line which is measured against the left axis). As noted above, this consistency is accomplished by managing the size and composition of the balance sheet through different rate cycles.
17
The following table shows the estimated repricing periods for earning assets and paying liabilities.
September 30, 2018 | Repricing Period | ||||||||||||||
Within One Year | After 1 year - before 6 Years | Thereafter | Total | ||||||||||||
(In thousands) | |||||||||||||||
Earning assets (1) | $ | 5,728,733 | $ | 5,131,215 | $ | 3,617,982 | $ | 14,477,930 | |||||||
Paying liabilities | (7,433,148 | ) | (3,899,724 | ) | (2,474,307 | ) | (13,807,179 | ) | |||||||
Excess (liabilities) assets | $ | (1,704,415 | ) | $ | 1,231,491 | $ | 1,143,675 | ||||||||
Excess as % of total assets | (10.7 | )% | |||||||||||||
(1) Asset repricing period includes estimated prepayments based on historical activity
At September 30, 2018, the Company had approximately $1,704,415,000 more in liabilities subject to maturity or repricing in the next year than assets, which resulted in a one-year repricing gap of (10.7)% of total assets. This compares to the (15.7)% gap as of September 30, 2017. A negative repricing gap implies that funding costs will change more rapidly than interest income on earning assets with movements in interest rates. A negative repricing gap typically results in lower margins when interest rates rise and higher margins when interest rates decline. The interest rate gap analysis provides management with a high-level indication of interest rate risk, but it is considered less reliable than more detailed modeling. Cash and cash equivalents of $268,650,000 and shareholders' equity of $1,996,908,000 provide management with additional flexibility in managing interest rate risk going forward. If management were to take steps to change the size and/or mix of the balance sheet or slow the repricing of deposit rates upward, rising rates might not cause a decrease in net interest income.
The following table shows the potential impact of rising interest rates on net income for one year. The Company's focus is primarily on the impact of rising rates, given the negative gap position which implies that generally when rates fall income should increase and when rates increase income is at risk to decrease (assuming no change in the size or composition of the balance sheet).
It is important to note that this is not a forecast or prediction of future events, but is used as a tool for measuring potential risk. This analysis assumes zero balance sheet growth and a constant percentage composition of assets and liabilities.
18
Potential Impact on Net Interest Income | |||||||||||
Basis Point Increase in Interest Rates | September 30, 2018 | September 30, 2017 | |||||||||
(In thousands, except percentages) | |||||||||||
100 | $ | (2,885 | ) | (0.64 | )% | $ | 9,274 | 1.95 | % | ||
200 | (8,623 | ) | (1.91 | )% | 14,157 | 2.97 | % | ||||
300 | (16,712 | ) | (3.71 | )% | 16,884 | 3.55 | % | ||||
Actual results will differ from the assumptions used in this model, as management monitors and adjusts both the size and the composition of the balance sheet in order to respond to changing interest rates. In a rising interest rate environment, it is likely that the Company will grow its balance sheet to offset margin compression that may occur. Improvement in the net income sensitivity during the year is the result of changing the loan and deposit mix toward shorter term and/or floating rate instruments.
Another method used to quantify interest rate risk is the net portfolio value (“NPV”) analysis. This analysis calculates the difference between the present value of interest-bearing liabilities and the present value of expected cash flows from interest-earning assets and off-balance-sheet contracts. The following tables set forth an analysis of the Company’s interest rate risk as measured by the estimated changes in NPV resulting from instantaneous and sustained parallel shifts in the yield curve (measured in 100-basis-point increments).
The tables below express the NPV under varying interest scenarios.
September 30, 2018 | ||||||||||||
Change in Interest Rates | Estimated NPV Amount | Estimated (Decrease) in NPV Amount | NPV as % of Assets | |||||||||
(Basis Points) | (In thousands) | (In thousands) | ||||||||||
300 | $ | 1,625,034 | $ | (676,994 | ) | 11.53 | % | |||||
200 | 1,883,904 | (418,124 | ) | 12.89 | % | |||||||
100 | 2,114,828 | (187,200 | ) | 13.96 | % | |||||||
No change | 2,302,028 | — | 14.71 | % | ||||||||
September 30, 2017 | ||||||||||||
Change in Interest Rates | Estimated NPV Amount | Estimated (Decrease) in NPV Amount | NPV as % of Assets | |||||||||
(Basis Points) | (In thousands) | (In thousands) | ||||||||||
300 | $ | 1,781,509 | $ | (765,057 | ) | 12.98 | % | |||||
200 | 2,083,962 | (462,604 | ) | 14.60 | % | |||||||
100 | 2,347,755 | (198,811 | ) | 15.85 | % | |||||||
No change | 2,546,566 | — | 16.62 | % | ||||||||
As of September 30, 2018, the Company was in compliance with all of its interest rate risk policy guidelines.
Subsidiaries
The Company is a bank holding company that conducts its primary business through its only directly-owned subsidiary, the Bank. The Bank has a national bank charter with the OCC. The Bank has three active wholly owned subsidiaries, discussed further below.
WAFD Insurance Group, Inc. is incorporated under the laws of the state of Washington and is an insurance agency that offers a full line of individual and business insurance policies to customers of the Bank, as well as to the general public. As of September 30, 2018 and September 30, 2017, WAFD Insurance Group, Inc. had total assets of $17,605,000 and $14,987,000, respectively.
19
Statewide Mortgage Services Company is incorporated under the laws of the state of Washington and it holds and markets real estate owned. As of September 30, 2018 and September 30, 2017, Statewide Mortgage Services Company had total assets of $785,000 and $785,000, respectively.
Washington Services, Inc. is incorporated under the laws of the state of Washington. It acts as a trustee under deeds of trust as to which the Bank is beneficiary. As of September 30, 2018 and September 30, 2017, Washington Services, Inc. had total assets of $13,000 and $13,000, respectively.
Employees
As of September 30, 2018, the Company had approximately 1,877 employees, including the full-time equivalent of 20 part-time employees and its service corporation employees. None of these employees are represented by a collective bargaining agreement.
Regulation
Set forth below is a brief description of certain laws and regulations that relate to the regulation of the Company and the Bank. The description of these laws and regulations, and descriptions of laws and regulations contained elsewhere herein, do not purport to be complete and are qualified in their entirety by reference to applicable laws and regulations. The Dodd-Frank Wall Street Reform and Consumer Protection Act of 2010 (the “Dodd-Frank Act”) amended certain federal banking laws.
The Company
General. The Company is registered as a bank holding company and is subject to regulation, examination, supervision and reporting requirements of the Federal Reserve.
Restrictions on Activities and Acquisitions. Bank holding companies are subject to a variety of restrictions on their activities and the acquisitions they can make. Generally, the activities or acquisition of a bank holding company that is not a financial holding company are limited to those that constitute banking or managing or controlling banks or which are closely related to banking. In addition, without the prior approval of the Federal Reserve, bank holding companies are generally prohibited from acquiring more than 5% of the outstanding shares of any class of voting securities of a bank or bank holding company, taking any action that causes a bank to become a subsidiary of the bank holding company, acquiring all or substantially all of the assets of a bank, or merging with another bank holding company.
Control of Company or Bank. Pursuant to the Change in Bank Control Act, (the “CIBC Act”) individuals, corporations or other entities acquiring Company equity interests may, alone or together with other investors, be deemed to control a holding company or a bank. If an acquisition is deemed to constitute control of the holding company or bank and is not subject to approval under the Bank Holding Company Act or certain other statutes, such person or group will be required to file a notice under the CIBC Act. Generally, ownership of, or power to vote, more than 25% of any class of voting securities constitutes control. In the case of a bank or bank holding company the securities of which are registered with the Securities and Exchange Commission ("SEC"), ownership of or power to vote more than 10% of any class of voting securities creates a presumption of control.
Source of Strength. Under long-standing Federal Reserve policy, a bank holding company is expected to serve as a source of financial and management strength to its subsidiary bank. Under this policy, a bank holding company is expected to stand ready to provide adequate capital funds to its subsidiary bank during periods of financial adversity and to maintain financial flexibility and capital raising capacity to assist its subsidiary bank. The Dodd-Frank Act codified the source of strength doctrine by adopting a statutory provision requiring, among other things, that bank holding companies serve as a source of financial strength to their subsidiary banks.
Restrictions on Company Dividends. The Company’s ability to pay dividends to its shareholders is affected by several factors. Since the Company is a separate legal entity from the Bank and its subsidiaries and does not have significant operations of its own, the Company may not be able to pay dividends to its shareholders if the Bank is unable to pay dividends to the Company. The Bank’s ability to pay dividends is subject to various regulatory restrictions.
See “Washington Federal, National Association, wholly owned subsidiary (Bank) - Restrictions on Dividends.” In addition, the Company’s ability to pay dividends is subject to rules and policies of the Federal Reserve. It is the policy of the Federal Reserve that bank holding companies should pay cash dividends only out of income available over the past year and only if prospective earnings retention is consistent with the company’s expected future needs and financial condition. New capital rules adopted by the Federal Reserve, effective January 2015, may limit the Company’s ability to pay dividends if the Company fails to meet certain
20
requirements under the rules.
See “Washington Federal, National Association, wholly owned operating subsidiary (Bank) - Restrictions on Dividends.”
Since the Company is a Washington state corporation, it is also subject to restrictions under Washington corporate law relating to dividends. Generally, under Washington law, a corporation may not pay a dividend if, after giving effect to the dividend, the corporation would be unable to pay its liabilities as they become due in the ordinary course of business or the corporation’s total assets would be less than the sum of its total liabilities plus (with some exceptions) the amount that would be needed, if the corporation were to be dissolved at the time of the dividend payment, to satisfy the dissolution preferences of senior equity securities.
Washington Federal, National Association, wholly-owned operating subsidiary (Bank)
General. The Bank is a federally-chartered national bank and certain deposits of the bank are federally insured and backed by the full faith and credit of the United States government. Accordingly, the Bank is subject to broad federal regulation and oversight by its primary regulator, the OCC, extending to all aspects of its operations. The Bank is a member of the FDIC and its deposits are insured up to applicable limits of the Depository Insurance Fund (“DIF”), which is administered by the FDIC. As a result, the FDIC has certain regulatory and examination authority over the Bank.
As a national bank, the Bank is required to be a member of the Federal Reserve. As a member, it is required to purchase and maintain stock in the Federal Reserve Bank of San Francisco (“FRBSF”) in an amount equal to 3.00% of the paid-up capital stock and surplus of the Bank and have available another 3.00% in reserves. At September 30, 2018, the Bank had $24.0 million in FRBSF stock, which was in compliance with this requirement.
Federal Institution Regulations. On July 17, 2013, the Bank completed its conversion from a federally chartered savings association to a national bank charter with the OCC. In addition, the Company became a bank holding company registered with the Federal Reserve. The OCC has extensive authority over the operations of national banks. As part of this authority, national banks are required to file periodic reports with the OCC and are subject to periodic examinations by the OCC. Federal laws and regulations prescribe the investment and lending authority of the Bank, and the Bank is prohibited from engaging in any activities not permitted by such laws and regulations. While the Bank has broad authority to engage in all types of lending activities, a variety of restrictions apply to certain other investments by the Bank.
Financial Modernization. On July 21, 2010 the Dodd-Frank Act became effective. This law has broadly affected the financial services industry by implementing changes to the financial regulatory landscape aimed at strengthening the sound operation of the financial services industry, and will continue to significantly change the current bank regulatory structure and affect the lending, deposit, investment, trading and operating activities of financial institutions and their holding companies, including the Company and the Bank. Some of the changes that are significant to the Company and the Bank include:
The CFPB was established on July 21, 2011 and took over responsibility for the principal federal consumer protection laws, such as the Truth in Lending Act, the Equal Credit Opportunity Act, the Real Estate Settlement Procedures Act and the Truth in Saving Act, among others. The CFPB has broad rule-making authority in this area, and also has primary supervisory and examination authority on these issues over institutions such as the Bank with assets of $10 billion or more. The Dodd-Frank Act also gives the CFPB expanded data collecting powers for fair lending purposes for both small business and mortgage loans, as well as expanded authority to prevent unfair, deceptive and abusive practices.
On October 9, 2013, the CFPB entered a Consent Order against the Bank that required the Bank to pay a civil money penalty of $34,000, and to adopt an enhanced compliance program related to reporting Home Mortgage Disclosure Act ("HMDA") data. The Bank has adopted an enhanced HMDA program, which continues to be subject to review by the CFPB. The Bank believes it continues to be in compliance with all material terms of the Consent Order.
As required by the Dodd-Frank Act, the Federal Reserve adopted a rule that restricted interchange fees applicable to debit card transactions. Effective October 1, 2011, interchange fees on debit card transactions are limited to a maximum of 21 cents per transaction plus 5 basis points of the transaction amount. A debit card issuer may recover an additional one cent per transaction for fraud prevention purposes if the issuer complies with certain fraud-related requirements prescribed by the Federal Reserve.
Interstate Banking. Subject to certain limitations and restrictions, a bank holding company, with prior approval of the Federal Reserve, may acquire an out-of-state bank; banks in states that do not prohibit out-of-state mergers may merge with the approval of the appropriate federal banking agency, and a bank may establish a de novo branch out of state if such branching is permitted by the other state for state banks chartered by such other state.
21
Insurance of Deposit Accounts. Under the Dodd-Frank Act, the maximum amount of federal deposit insurance coverage was permanently increased from $100,000 to $250,000 per depositor, per institution. Due to the significant number of bank failures and the current balance of the DIF, the Company anticipates continued elevated FDIC premiums for the industry going forward. Continued credit quality improvements have lessened this increase for the Company. The Dodd-Frank Act also broadened the base for FDIC insurance assessments. Assessments are now based on the average consolidated total assets less tangible equity capital of a financial institution. In addition, the Dodd-Frank Act raised the minimum designated reserve ratio, which the FDIC is required to set each year for the DIF, to 1.35% and requires that the DIF meet that minimum ratio by September 30, 2020. The Dodd-Frank Act eliminated the requirement that the FDIC pay dividends to depository institutions when the reserve ratio exceeds certain thresholds. The FDIC has established a higher reserve ratio of 2% as a long-term goal beyond what is required by statute.
All insured institutions are also required to pay quarterly assessments to the FDIC in order to fund interest payments on bonds issued by the Financing Corporation ("FICO"), a federal agency that was established to recapitalize a predecessor to the DIF. These assessments will continue until the FICO bonds mature, which will be between 2017 and 2019. The FICO assessment rate is subject to quarterly adjustment.
Transactions with Affiliates; Insider Loans. Under current federal law, all transactions between and among a national bank and its affiliates, including holding companies, are subject to Sections 23A and 23B of the Federal Reserve Act and Regulation W promulgated thereunder. Generally, these requirements limit extensions of credit and certain other such transactions by the bank to affiliates to a percentage of the institution's capital and generally such transactions must be collateralized. Generally, all affiliate transactions must be on terms at least as favorable to the bank as transactions with non-affiliates. In addition, a bank may not lend to any affiliate engaged in non-banking activities that are not permissible for a bank holding company or acquire shares of any affiliate that is not a subsidiary. The OCC is authorized to impose additional restrictions on transactions with affiliates if necessary to protect the safety and soundness of a national bank.
Extensions of credit by a national bank to executive officers, directors and principal shareholders are subject to Section 22(h) of the Federal Reserve Act, which, among other things, generally prohibits loans to any such individual where the aggregate amount exceeds an amount equal to 15% of an institution's unimpaired capital and surplus plus an additional 10% of unimpaired capital and surplus in the case of loans that are fully secured by readily marketable collateral. Section 22(h) permits loans to directors, executive officers and principal shareholders made pursuant to a benefit or compensation program that is widely available to employees of a subject bank provided that no preference is given to any officer, director or principal shareholder, or related interest thereto, over any other employee. In addition, the aggregate amount of extensions of credit by a bank to all insiders cannot exceed the institution's unimpaired capital and surplus. Furthermore, Section 22(g) places additional restrictions on loans to executive officers.
Effective on July 21, 2012, the affiliate transaction rules in Sections 23A and 23B of the Federal Reserve Act were expanded to broaden the definition of affiliate and to apply these rules to securities lending, repurchase agreements and derivatives. These revisions also strengthened collateral requirements and limited Federal Reserve exemptive authority. Further, the definition of “extension of credit” for transactions with executive officers, directors and principal shareholders was expanded to include credit exposure arising from a derivative transaction, a repurchase or reverse repurchase agreement or a securities lending or borrowing transaction. These provisions have not had a material effect on the Company or the Bank.
Restrictions on Dividends. OCC regulations govern dividends by a national bank. A national bank must file an application for approval of a dividend if:
• | the total dividends for the applicable calendar year exceed the sum of the institution's net income for that year to date plus the institution's retained net income for the preceding two years; |
•the institution would not be at least adequately capitalized following the dividend;
•the dividend would violate any applicable statute, regulation, agreement or OCC imposed condition; or
•the dividend is paid in property other than cash or stock of the bank.
Other capital distributions, such as stock repurchases, generally require the approval of the OCC. Failure to meet minimum capital requirements may place certain restrictions on the payment of dividends and stock repurchases.
Federal Home Loan Bank System. The Bank is a member of the Federal Home Loan Bank ("FHLB") of Des Moines, which is one of 11 regional FHLBs that provide funding to their members for making home mortgage loans, as well as loans for affordable housing and community development. Each FHLB serves members within its assigned region and is funded primarily through proceeds derived from the sale of consolidated obligations of the FHLB system. Loans are made to members in accordance with
22
the policies and procedures established by the Board of Directors of the FHLB. At September 30, 2018, FHLB advances to the Company amounted to $2,330,000,000. As a member, the Bank is required to purchase and maintain stock in the FHLB of Des Moines. At September 30, 2018, the Company had $103.2 million in FHLB of Des Moines stock, which was in compliance with this requirement.
Community Reinvestment Act and Fair Lending Laws. National banks have a responsibility under the Community Reinvestment Act ("CRA") and related regulations of the OCC to help meet the credit needs of their communities, including low- and moderate-income neighborhoods. In addition, the Equal Credit Opportunity Act and the Fair Housing Act (together, the "Fair Lending Laws") prohibit lenders from discriminating in their lending practices on the basis of characteristics specified in those statutes. An institution's failure to comply with the provisions of the CRA could, at a minimum, result in regulatory restrictions on its activities. Failure to comply with the Fair Lending Laws could result in enforcement actions by the OCC, the CFPB and other federal regulatory agencies, including the U.S. Department of Justice.
USA Patriot Act of 2001. The USA PATRIOT Act of 2001 ("Patriot Act"), through amendments to the federal Bank Secrecy Act (“BSA”), substantially broadened the scope of United States anti money-laundering laws and regulations by imposing significant new compliance and due diligence obligations, creating new crimes and penalties and expanding the extra-territorial scope of United States jurisdiction. The United States Treasury Department has issued a number of regulations under the Patriot Act that apply to financial institutions such as the Bank. These regulations impose obligations on financial institutions to maintain appropriate policies, procedures and controls to detect, prevent and report money laundering and terrorist financing and to verify the identity of their customers. Failure of a financial institution to maintain and implement adequate programs to combat money laundering and terrorist financing, or to comply satisfactorily with all relevant Patriot Act and BSA requirements, could have serious legal and reputational consequences for the institution.
On February 28, 2018, pursuant to a Stipulation and Consent to the Issuance of a Consent Order (the “Consent Order”), the Office of the Comptroller of the Currency issued a Consent Order relating to the Bank, the terms of which are intended to further enhance its BSA program.
The Consent Order requires, among other things, that the Bank: (1) maintain a Compliance Committee of at least three directors; (2) employ a permanent, qualified, and experienced BSA Officer and be provided sufficient staffing and oversight resources; (3) review, update and implement an ongoing BSA risk assessment; (4) ensure adherence to a written program of policies and procedures to provide compliance with the BSA; (5) develop and implement a written program of policies and procedures to ensure timely and appropriate review of transaction activity, disposition of alerts, and timely filing of SARs; (6) develop and implement a written program of policies and procedures to provide for implementation of an automated suspicious activity monitoring system, including appropriate model governance; (7) engage an independent consultant to review account and transaction activity (“Look-Back”); (8) review and update risk-based processes to obtain and analyze appropriate customer due diligence information at the time of account opening and on an ongoing basis; (9) complete independent testing; (10) develop and implement a comprehensive, ongoing BSA and OFAC training program; and (11) submit certain reports to the OCC.
Copies of the Stipulation and the Consent Order were filed with the SEC on March 1, 2018 as exhibits to the Company’s Current Report on Form 8-K. See Item 1A. Risk Factors for additional details.
Regulatory Capital Requirements. Bank holding companies and federally insured banks are required to maintain minimum levels of regulatory capital. The Federal Reserve establishes capital standards applicable to all bank holding companies, and the OCC establishes capital standards applicable to all national banks. The Federal Reserve and the OCC implemented new capital rules, effective January 1, 2015, that substantially amend the existing capital rules for bank holding companies and banks. These new rules reflect, in part, certain standards initially adopted by the Basel Committee on Banking Supervision in December 2010 (which standards are commonly referred to as “Basel III”) as well as requirements contemplated by the Dodd-Frank Act.
The recent rules implemented a new capital ratio of common equity Tier 1 capital to risk based assets. Common equity Tier 1 capital generally consists of retained earnings and common stock instruments (subject to certain adjustments) as well as accumulated other comprehensive income (“AOCI”) except to the extent that the Company and the Bank exercise a one-time irrevocable option to exclude certain components of AOCI, which the Company and the Bank have done. Tier 1 capital also includes non-cumulative perpetual preferred stock and limited amounts of minority interests. Regulatory deductions from capital include goodwill and intangible assets. The new rules modify the manner in which certain capital elements are determined, including but not limited to, requiring certain deductions related to mortgage servicing rights and deferred tax assets. Total capital consists of Tier 1 capital and supplementary capital. Supplementary capital consists of certain capital instruments that do not qualify as core capital as well as general valuation loan and lease loss allowances up to a maximum of 1.25% of risk-weighted assets.
23
Supplementary capital may be used to satisfy the risk-based requirement only in an amount equal to the amount of Tier 1 capital.
In determining the required amount of risk-based capital, total assets, including certain off-balance-sheet items, are multiplied by a risk-weight factor based on the risks inherent in the type of assets held by an institution. The risk categories range from 0% for low-risk assets such as U.S. Treasury securities and GNMA securities to 1,250% for various types of loans and other assets deemed to be of higher risk. Single-family residential loans having loan-to-value ratios not exceeding 80% and meeting certain additional criteria, as well as certain multi-family residential loans, qualify for a 50% risk-weight treatment. The book value of each asset is multiplied by the risk factor applicable to the asset category, and the sum of the products of this calculation equals total risk-weighted assets. The new rules make changes in the methods of calculating certain risk-based assets, which in turn affects the calculation of risk-based ratios. Higher or more sensitive risk weights are assigned to various categories of assets, among which are commercial real estate, credit facilities that finance the acquisition, development or construction of real property, certain exposures or credit that are 90 days past due or are nonaccrual, foreign exposures, certain corporate exposures, securitization exposures, equity exposures and in certain cases mortgage servicing rights and deferred tax assets.
Both the Company and the Bank are required to have a common equity Tier 1 capital ratio of 4.5%. In addition, both the Company and the Bank are required to have a Tier 1 leverage ratio of 4.0%, a Tier 1 risk-based ratio of 6.0% and a total risk-based ratio of 8.0%. Both the Company and the Bank are required to establish a “conservation buffer,” consisting of common equity Tier 1 capital, equal to 2.5%. The capital conservation buffer is designed to ensure that banks build up capital buffers outside periods of stress, which can be drawn down as losses are incurred. An institution that does not meet the conservation buffer will be subject to restrictions on certain activities including payment of dividends, stock repurchases and discretionary bonuses to executive officers. The conservation buffer is phased in beginning in 2016 and will take full effect on January 1, 2019. Certain calculations under the rules will also have phase-in periods.
The Federal Reserve and the OCC are also authorized to impose capital requirements in excess of these standards on individual institutions on a case-by-case basis. Management believes that the current capital levels of the Company and the Bank are sufficient to be in compliance with the fully phased-in standards under the new rules.
Any bank holding company or national bank that fails the capital requirements is subject to possible enforcement actions. Such actions could include a capital directive, a cease and desist order, civil money penalties, restrictions on an institution's operations and/or the appointment of a conservator or receiver. Federal Reserve and OCC capital regulations provide that such supervisory actions, through enforcement proceedings or otherwise, could require one or more of a variety of corrective actions.
For information regarding compliance with each of these capital requirements by the Company and the Bank as of September 30, 2018, see Note O to the Consolidated Financial Statements included in Item 8 hereof.
Prompt Corrective Action. Federal statutes establish a supervisory framework based on five capital categories: well capitalized, adequately capitalized, undercapitalized, significantly undercapitalized and critically undercapitalized. An institution’s category depends upon its capital levels in relation to relevant capital measures, which include a risk-based capital measure, a leverage ratio capital measure and certain other factors. The federal banking agencies have adopted regulations that implement this statutory framework.
The prompt corrective action rules, which apply to the Bank but not the Company, are modified to include a common equity Tier 1 risk-based ratio and to increase certain other capital requirements for the various thresholds. For example, the requirements for the Bank to be considered well-capitalized under the rules are a 5.0% Tier 1 leverage ratio, a 6.5% common equity Tier 1 risk-based ratio, an 8.0% Tier 1 risk-based capital ratio and a 10.0% total risk-based capital ratio. To be adequately capitalized, those ratios are 4.0%, 4.5%. 6.0% and 8.0%, respectively.
An institution that is not well capitalized is subject to certain restrictions on brokered deposits, including restrictions on the rates it can offer on its deposits, generally. Any institution that is neither well capitalized nor adequately capitalized is considered undercapitalized. Federal law authorizes the OCC to reclassify a well-capitalized institution as adequately capitalized and may require an adequately capitalized institution or an undercapitalized institution to comply with supervisory actions as if it were in the next lower category. The OCC may not reclassify a significantly undercapitalized institution as critically undercapitalized. As of September 30, 2018, the Bank exceeded the requirements of a well capitalized institution.
Dodd-Frank Act Stress Tests ("DFAST"). On July 6, 2018, bank regulatory agencies (the Federal Reserve, Federal Deposit Insurance Corporation and the Office of the Comptroller of the Currency) issued a joint interagency statement regarding the impact of the Economic Growth, Regulatory Relief, and Consumer Protection Act ("EGRRCPA") on financial institutions. The EGRRCPA gave immediate relief from stress testing for applicable bank holding companies but not financial institutions until November 25, 2019. Pursuant to direction from the Bank's regulators, the Bank was provided similar relief and is no longer required to submit
24
company-run annual stress tests. Notwithstanding these amendments to the stress testing requirements, the federal banking agencies indicated through interagency guidance that the capital planning and risk management practices of institutions with total assets less than $100 billion would continue to be reviewed through the regular supervisory process. Although the Corporation will continue to monitor its capital consistent with the safety and soundness expectations of the federal regulators, the Corporation will no longer conduct company-run stress testing as a result of the legislative and regulatory amendments. The Company continues to use customized stress testing to support the business and as part of its capital planning process.
Additional disclosures related to EGRRCPA used by other mid-size bank holding companies:
EGRRCPA also enacted several important changes in some technical compliance areas that we believe will help reduce our regulatory burden, including:
• | Prohibiting federal banking regulators from imposing higher capital standards on High Volatility Commercial Real Estate (“HVCRE”) exposures unless they are for acquisition, development or construction (“ADC”), and clarifying ADC status; |
• | Requiring the federal banking agencies to amend the Liquidity Coverage Ratio Rule such that all qualifying investment-grade, liquid and readily-marketable municipal securities are treated as level 2B liquid assets, making them more attractive investment alternatives; |
• | Exempting from appraisal requirements certain transactions involving real property in rural areas and valued at less than $400,000; and |
• | Directing the Bureau of Consumer Financial Protection to provide guidance on the applicability of the TILA-RESPA Integrated Disclosure rule to mortgage assumption transactions and construction-to-permanent home loans, as well the extent to which lenders can rely on model disclosures that do not reflect recent regulatory changes. |
Despite the improvements for mid-size financial institutions such as the Corporation that has resulted from EGRRCPA, many provisions of the Dodd-Frank Act and its implementing regulations remain in place and will continue to result in additional operating and compliance costs that could have a material adverse effect on our business, financial condition, results of operation. In addition, the Economic Growth Act requires the enactment of a number of implementing regulations, the details of which may have a material effect on the ultimate impact of the law.
Taxation
Federal Taxation. For federal and state income tax purposes, the Company reports its income and expenses on the accrual basis method of accounting and files its federal and state income tax returns on a September 30, fiscal year basis. The Company files consolidated federal and state income tax returns with its subsidiaries.
The Company's federal income tax returns are open and subject to potential examination by the IRS for fiscal year 2015 and later.
State Taxation. The states of Washington and Nevada do not have state income taxes. Washington state has a business and occupation tax based on a percentage of gross receipts; however, interest received on loans secured by first mortgages or deeds of trust on non-transient residential properties is not subject to this tax.
• | The state of Idaho has a corporate income tax with a statutory rate of 7.4% of apportionable income. |
• | The state of Oregon has a corporate excise tax with a statutory rate of 6.6% on the first $1 million of apportionable income and then 7.6% on any excess over $1 million. |
• | The state of Utah has a corporate franchise tax with a statutory rate of 5.0% of apportionable income. |
• | The state of Arizona has a corporate income tax with a statutory rate of 4.9% of apportionable income. |
• | The state of Texas has a corporate franchise tax with a statutory rate of 0.75% on apportionable taxable margin. |
• | The state of New Mexico has a corporate income tax with graduated statutory rates. For our fiscal year beginning October 1, 2017, the applicable tax rate is 4.8% on the first $500,000 of apportionable income, and 6.2% on any excess over $500,000. For our fiscal year beginning October 1, 2018, the applicable tax rate is 4.8% on the first $500,000 of apportionable income, and 5.9% on any excess over $500,000. |
Availability of Financial Data
Under the Securities Exchange Act of 1934 ("Exchange Act"), the Company is required to file annual, quarterly and current reports, proxy statements and other information with the SEC.
25
The Company makes available, free of charge through its website, its reports on Forms 10-K, 10-Q and 8-K, and amendments to those reports, as soon as reasonably practicable after such reports are filed with or furnished to the SEC. Additionally, the Company has adopted and posted on its website a code of ethics that applies to its senior financial officers. The Company’s website also includes the charters for its audit committee, compensation committee, risk management committee, and nominating and governance committee. The address for the Company’s website is www.washingtonfederal.com. The Company will provide a printed copy of any of the aforementioned documents to any requesting shareholder.
26
Item 1A. | Risk Factors |
Ownership of the Company's common stock involves risk. Investors should carefully consider, in addition to the other information set forth herein, the following risk factors:
Non-Compliance with the USA PATRIOT Act, Bank Secrecy Act, Real Estate Settlement Procedures Act, Truth-in-Lending Act, Community Reinvestment Act, Fair Lending Laws, Flood Insurance Reform Act or other laws and regulations could result in fines or sanctions, and curtail expansion opportunities.
Financial institutions are required under the USA PATRIOT and Bank Secrecy Acts to develop programs to prevent financial institutions from being used for money-laundering and terrorist activities. Financial institutions are also obligated to file suspicious activity reports with the U.S. Treasury Department's Office of Financial Crimes Enforcement Network if such activities are detected. These rules also require financial institutions to establish procedures for identifying and verifying the identity of customers seeking to open new financial accounts. Failure or the inability to comply with the USA PATRIOT Act and BSA statutes and regulations could result in fines or penalties, curtailment of expansion opportunities, enforcement actions, intervention or sanctions by regulators and costly litigation or expensive additional controls and systems. During the last few years, several banking institutions have received large fines for non-compliance with these laws and regulations. In addition, the U.S. Government imposed and will continue to expand laws and regulations relating to residential and consumer lending activities that create significant new compliance burdens and financial risks.
The Office of the Comptroller of the Currency has issued a Consent Order with respect to the Company's Bank Secrecy Act compliance. Failure to comply with the Consent Order could result in additional regulatory enforcement action.
The Bank Secrecy Act ("BSA"), the USA PATRIOT Act of 2001 (the “Patriot Act”), and other laws and regulations require financial institutions, among other duties, to institute and maintain an effective anti-money laundering program and file suspicious activity and currency transaction reports as appropriate. On February 28, 2018, pursuant to a Stipulation and Consent to the Issuance of a Consent Order (the “Stipulation”), the Office of the Comptroller of the Currency issued a Consent Order relating to the Bank, the terms of which are intended to further enhance its BSA program. Copies of the Stipulation and the Consent Order were filed with the SEC on March 1, 2018 as exhibits to the Company’s Current Report on Form 8-K. The Bank expects to continue to incur significant expenses as it strengthens its BSA program and implements additional policies and procedures associated with complying with the Consent Order. The Bank does not expect to pursue acquisitions or branch expansion until its BSA program has improved. Issuance of the Consent Order does not preclude further government action with respect to the Bank’s BSA program, including the imposition of fines, sanctions, additional expenses and compliance costs, and/or restrictions on the activities of the Bank. In addition, failure to comply with the Consent Order could subject us to additional expense and further regulatory enforcement action, including the imposition of material restrictions on the activities of the Bank or the assessment of fines or penalties, which could prevent the Bank from executing its business strategy and negatively impact its business and the price of the Company's common stock. Any further deficiency in the Bank's BSA/AML policies, procedures and systems could cause us to incur additional significant compliance costs and could subject it to fines and further regulatory actions. Moreover, failure to maintain and implement an effective BSA program could also have serious reputational consequences for the Company. Any of these results could have a material adverse effect on the Company's business, financial condition and results of operations.
The Company has risk of systems failures and cyber-security risk, including "hacking" and "identity theft."
The Company relies extensively on the successful and uninterrupted functioning of its information technology and telecommunications systems to conduct its business. This includes internally developed systems, the systems of third-party service providers, and digital and mobile technologies. Any failure, interruption or breach in security of these systems could result in failures or disruptions in its customer relationship management, general ledger, deposit, loan and other systems, and could damage its reputation, result in loss of customer business, subject it to regulatory scrutiny, or expose it to civil litigation and possible financial liability.
While the Company believes it has robust information systems and security procedures, controls and policies designed to prevent or limit the effect of the failure, interruption or security breach of its information systems, there can be no assurance that any such failures, interruptions or security breaches will not occur, or, if they do occur, that the Company will be able to address or remediate the damage. Because the techniques used to obtain unauthorized access, disable or degrade systems change frequently and often are not recognized until launched against a target, the Company may be unable to anticipate these techniques or to implement adequate protective measures.
Cybersecurity and the continued development and enhancement of the Company's controls, processes and practices designed to protect customer information, its systems, computers, software, data and networks from attack, damage or unauthorized access
27
remain a priority for the Company. As cybersecurity threats continue to evolve, the Company may be required to expend additional resources to continue to enhance, modify and refine its protective measures against these evolving threats.
To date, the Company has no knowledge of a cyber-attack or other information security breach, but there can be no assurance that it will not suffer such attacks or be impacted by losses from such events in the future. The Company’s risk and exposure to these matters remains heightened because of, among other things, the evolving nature of these threats and its plans to continue to implement internet banking and mobile banking channels, expand operations and use third-party information systems. Recent instances of attacks specifically targeting financial services businesses indicate that the risk to the Company’s systems remains significant. If the Company were to experience a cyber-attack or information security breach, it could incur substantial additional expenses, which could include remediation expenses, costs associated with customer notification and credit monitoring services, increased insurance premiums, regulatory penalties and fines and costs associated civil litigation, any of which could have a material adverse effect on the Company’s business, financial conditions or results of operations.
Current economic conditions pose challenges and could adversely affect the financial condition and results of operations of the Company.
The Company is operating in an uncertain economic environment, including lackluster national and global conditions, accompanied by relatively low interest rates. Financial institutions can be affected by changing conditions in the real estate and financial markets. Dramatic declines in the housing market in past years, with falling home prices and increasing foreclosures and unemployment, resulted in significant write-downs of asset values by financial institutions. While conditions have improved, a return to a recessionary economy could result in financial stress on the Bank's borrowers that could adversely affect its financial condition and results of operations. Deteriorating conditions in the regional economy served by the Company could drive losses beyond that which is provided for in its allowance for loan losses. The Company could also face the following risks in connection with the following events:
▪ | Ineffective monetary policy or other market conditions could cause rapid changes in interest rates and asset values that would have a materially adverse impact on the Company's profitability and overall financial condition. |
• | Market developments may affect consumer confidence levels and may cause adverse changes in payment patterns, resulting in increased delinquencies and default rates on loans and other credit facilities. |
• | The processes the Company uses to estimate the allowance for loan losses and other reserves may prove to be unreliable. Such estimates rely upon complex modeling inputs and judgments, including forecasts of economic conditions, which may be rendered inaccurate and/or no longer subject to accurate forecasting. |
• | The Company's ability to assess the creditworthiness of its borrowers may be impaired if the models and approaches it uses to select, manage, and underwrite loans become less predictive of future charge-offs. |
• | Regulatory scrutiny of the industry could increase, leading to harsh regulation of the industry that could lead to a higher cost of compliance, limit the Company's ability to pursue business opportunities and increase its exposure to the judicial system and the plaintiff’s bar. |
• | Further erosion in the fiscal condition of the U.S. Treasury could lead to new taxes that would limit the ability of the Company to pursue growth and return profits to shareholders. |
If these conditions or similar ones continue to exist or worsen, the Company could experience continuing or increased adverse effects on its financial condition.
The effects of an economic recession could be severe in the Company's primary market areas.
Substantially all of the Bank's loans are to individuals, businesses and real estate developers in the Pacific Northwest, Arizona, Utah, Texas, New Mexico and Nevada. The Bank's business depends significantly on general economic conditions in these market areas. A substantial increase in unemployment rates, or severe declines in housing prices and property values in the Company's primary market areas could have a material adverse effect on the Company's business:
• | Loan delinquencies may increase. |
• | Problem assets and foreclosures may increase. |
• | Demand for the Bank's products and services may decline. |
• | Collateral for loans made by the Bank, especially real estate, may decline in value, in turn reducing a customer's borrowing power and reducing the value of assets and collateral associated with the loans. |
A downturn in the real estate market would hurt the Company's business.
28
The Company's business activities and credit exposure are concentrated in real estate lending. The market for real estate is cyclical and the outlook for this sector is uncertain. A downturn in the real estate market, accompanied by falling values and increased foreclosures would hurt the Company's business because a large majority of its loans are secured by real estate.
Actions by other lenders or bank regulators could depress the value of the Company's real estate holdings, if lenders aggressively dispose of properties because of demand by their regulators or the prevailing business conditions. If a significant decline in market values occurs, the collateral for the Company's loans will provide decreasing levels of security. As a result, the Company's ability to recover the principal amount due on defaulted loans by selling the underlying real estate will be diminished, and the Company will be more likely to suffer losses on defaulted loans.
The Company owns real estate as a result of foreclosures resulting from non-performing loans. If other lenders or borrowers liquidate significant amounts of real estate in a rapid or disorderly fashion, or if the FDIC elects to dispose of significant amounts of real estate from failed financial institutions in a similar fashion, it could have an adverse effect on the values of the properties owned by the Company. In such a case, the Company may incur further write-downs and charge-offs, which could, in turn, adversely affect its results of operations and financial condition.
The Company may suffer losses in its loan portfolio despite its underwriting and loan collection practices.
The Company seeks to mitigate the risks inherent in its loan portfolio by adhering to specific underwriting and loan collection practices. Underwriting practices often include analysis of a borrower's prior credit history; financial statements; tax returns; cash flow projections; valuation of collateral; personal guarantees of loans to businesses; and verification of liquid assets. If the underwriting process fails to capture accurate information or proves to be inadequate, the Company may incur losses on loans that appeared to meet its underwriting criteria, and those losses may exceed the amounts set aside as reserves in the allowance for loan losses. Loan collection resources may be expanded to meet increases in nonperforming loans resulting from economic downturns or to service any loans acquired, resulting in higher loan administration costs. The Company is also exposed to the risk of improper documentation of foreclosure proceedings that would also increase the cost of collection.
The Company recently upgraded its core technology infrastructure, which may expose it to significant risks.
The Company recently completed the transition from a stable, cost-efficient but aging legacy operating system to a more modern, efficient, scalable system. The Company believes the new system will allow it to better provide its products and services to its customers but is dependent on the third party vendor to provide the necessary services and support. Any disruption of such services, or the termination of a third-party license or service agreement related thereto, could adversely affect the Company’s ability to provide and service customer products.
In addition, when the Company acquires other institutions or branches, the success and value of the transaction can depend in part on the Company’s ability to seamlessly integrate the acquired customers’ services and products with the technology platform. Failure to do so can lead to, among other things, dissatisfaction among acquired customers and the loss of the business of such customers.
The Company has risk of systems failures and security risk, including "hacking" and "identity theft."
The Company relies extensively on the successful and uninterrupted functioning of its information technology and telecommunications systems. Any failure, interruption or breach in security of these systems could result in failures or disruptions in its customer relationship management, general ledger, deposit, loan and other systems and could damage its reputation, result in loss of customer business, subject it to regulatory scrutiny, or expose it to civil litigation and possible financial liability. This applies to internally developed systems and the systems of third-party service providers.
While the Company believes it has robust information systems and security procedures, controls and policies designed to prevent or limit the effect of the failure, interruption or security breach of its information systems, there can be no assurance that any such failures, interruptions or security breaches will not occur, or, if they do occur, that they will be adequately addressed. Because the techniques used to obtain unauthorized access, disable or degrade systems change frequently and often are not recognized until launched against a target, the Company may be unable to anticipate these techniques or to implement adequate protective measures.
To date, the Company has not experienced any material losses related to cyber-attacks or other information security breaches, but there can be no assurance that it will not suffer such attacks and losses in the future. The Company’s risk and exposure to these matters remains heightened because of, among other things, the evolving nature of these threats, its plans to continue to implement internet banking and mobile banking channels, expand operations and use third-party information systems.
29
Cybersecurity and the continued development and enhancement of the Company's controls, processes and practices designed to protect customer information, its systems, computers, software, data and networks from attack, damage or unauthorized access remain a priority for the Company. As cybersecurity threats continue to evolve, the Company may be required to expend additional resources to continue to modify or refine our protective measures against these threats.
The Company's business is subject to interest rate risk and changes in market interest rates may negatively affect its results of operations and financial condition.
The Company's primary source of income is net interest income, which is the difference between the interest income generated by interest-earning assets and the interest expense generated by interest-bearing liabilities. The level of net interest income is a function of the average balances of interest-earning assets and interest-bearing liabilities and the spread between the amounts of the yield on such assets and the cost of such liabilities. These factors are influenced by both the pricing and the mix of interest-earning assets and interest-bearing liabilities which, in turn, are impacted by such external factors as the local economy, competition for loans and deposits, the monetary policy of the Federal Open Market Committee of the Federal Reserve Board of Governors (the “FOMC”) and market interest rates. Management is unable to predict these external factors, including the fluctuations of market interest rates, which are affected by many drivers, including inflation, recession, unemployment, monetary policy, domestic and international disorder, instability in domestic and foreign financial markets and investor and consumer demand.
Furthermore, movements in interest rates, the pace at which such movements occur and the volume and mix of the Company’s interest-bearing assets and liabilities influence the level of net interest income. The cost of the Company's deposits is largely based on short-term interest rates, the level of which is driven by the FOMC. However, the yields generated by its long-term loans, such as single-family residential and multifamily mortgage loans, and securities are typically driven by longer-term (10 year) interest rates, which are set by the market and vary from day to day. During the last few years, the Federal Reserve's unprecedented involvement in the purchase of assets, commonly known as "quantitative easing," has caused interest rates to be lower than they would have been without such involvement. The withdrawal of this quantitative easing began in October 2017, but the completion time frame and ultimate impact remains unknown.
If the interest rates on the Company's interest-bearing liabilities increase at a faster pace than the interest rates on its interest-earning assets, the result could be a reduction in net interest income and with it, a reduction in earnings. Net interest income and earnings would be similarly impacted were the interest rates on interest-earning assets to decline more quickly than the interest rates on interest-bearing liabilities. In addition, changes in interest rates could affect the Bank's ability to originate loans and attract and retain deposits; the fair values of its securities and other financial assets; the fair values of its liabilities; and the average lives of its loan and securities portfolios. Additionally, decreases in interest rates could lead to increased loan refinancing activity, which, in turn, would alter the balance of the Company's interest-earning assets and impact net interest income. Increases in interest rates could reduce loan refinancing activity, which could result in compression of the spread between loan yields and more quickly rising funding rates.
The Company may be exposed to movements in market rates to a degree not experienced by other financial institutions. The Company must carefully manage interest rate risk as a result of its significant portfolio of fixed-rate single-family home loans, which are longer-term in nature than the customer accounts and borrowed money that constitute its liabilities. The Company manages its interest rate risk in part by growing the fixed-rate loan portfolio when yields are higher and focusing on loans or investments with shorter-term characteristics, such as construction or commercial loans, when loan rates are lower. This balance sheet strategy, in conjunction with a strong capital position, has allowed the Company to manage interest rate risk through all interest rate cycles. Low operating costs have contributed further to the strong capital position. Although the Company has implemented asset and liability management policies and procedures that seek to minimize or contain this interest rate risk, these policies may not be successful in the future.
The Company relies, in part, on external financing to fund its operations and the unavailability of such funding in the future could adversely impact its growth and prospects.
The Company relies on customer deposits, advances from the FHLB of Des Moines and other borrowings to fund its operations. Management has historically been able to replace maturing deposits, if desired; however the Company may not be able to replace such funds at any given point in time if its financial condition or market conditions change or if the cost of doing so might adversely affect its financial condition or results of operations.
Although the Company considers its sources of funds adequate for its liquidity needs, it may seek additional debt in the future to achieve its long-term business objectives. Such borrowings, if sought, may not be available to the Company or, if available, may not be on favorable terms. If additional financing sources are unavailable or are not available on reasonable terms, the Company's financial condition, results of operations and future prospects could be adversely affected.
30
The Company's ability to pay dividends is subject to limitations that may affect its ability to pay dividends to its Shareholders.
The Company is a separate legal entity from its bank subsidiary and does not have significant operations of its own. The availability of dividends from the Bank is limited by the Bank's earnings and capital, as well as various statutes and regulations. It is possible, depending upon the financial condition of the Bank and other factors, that the Bank may not pay dividends to the Company. If the Bank is unable to pay dividends to the Company, the Company may not be able to pay dividends on its common stock. Consequently, the inability to receive dividends from the Bank could adversely affect the Company's financial condition, results of operations and future prospects.
The market price for the Company's common stock may be volatile.
The market price of the Company's common stock could fluctuate substantially in the future in response to a number of factors, including those discussed below. The market price of the Company's common stock has in the past fluctuated significantly and is likely to continue to fluctuate significantly. Some factors that may cause the price of its common stock to fluctuate include:
• | variations in the operating results of the Company and its competitors |
• | changes in securities analysts' estimates of the Company's future performance and the future performance of its competitors |
• | announcements by the Company or its competitors of mergers, acquisitions and strategic partnerships |
• | additions or departure of key personnel |
• | events affecting other companies that the market deems comparable to the Company |
• | general conditions in the financial markets and real estate markets |
• | general conditions in the United States |
• | the presence or absence of short selling of the Company's common stock |
• | future sales of the Company's common stock or debt securities |
The stock markets in general have experienced substantial price and trading fluctuations. These fluctuations have resulted in volatility in the market prices of securities that often has been unrelated or disproportionate to changes in operating performance. These broad market fluctuations may adversely affect the trading price of the Company's common stock.
A person holding the Company's common stock could have the voting power of their shares of common stock on all matters significantly reduced under Washington's anti-takeover statutes, if the person acquires 10% or more of the voting stock of the Company.
The Company is incorporated in the state of Washington and subject to Washington state law. Some provisions of Washington state law could interfere with or restrict takeover bids or other change-in-control events affecting us. For example, Chapter 23B.19 of the Washington Business Corporation Act, with limited exceptions, prohibits a “target corporation” from engaging in specified “significant business transactions” for a period of five years after the share acquisition by an acquiring person, unless:
▪ | the prohibited transaction or the acquiring person's purchase of shares was approved by a majority of the members of the target corporation's board of directors prior to the acquiring person's share acquisition; or |
▪ | the prohibited transaction was both approved by the majority of the members of the target corporation's board and authorized at a shareholder meeting by at least two-thirds of the outstanding voting shares (excluding the acquiring person's shares) at or subsequent to the acquiring person's share acquisition. An acquiring person is defined as a person or group of persons that beneficially own 10% or more of the voting securities of the target corporation. Such prohibited transactions include, among other things: |
* | certain mergers, or consolidations with, disposition of assets to, or issuances of stock to or redemption of stock from, the acquiring person; |
* | termination of 5% or more of the employees of the target corporation as a result of the acquiring person's acquisition of 10% or more of the shares; |
* | allowing the acquiring person to receive any disproportionate benefit as a shareholder; and |
* | liquidating or dissolving the target corporation. |
After the five-year period, certain “significant business transactions” are permitted, if they comply with certain “fair price” provisions of the statute or are approved by a majority of the outstanding shares other than those of which the acquiring person has beneficial ownership. As a Washington corporation, the Company is not permitted to “opt out” of this statute.
The Company's results of operations, financial condition or liquidity may be adversely impacted by issues arising from certain industry deficiencies in foreclosure practices, including delays and challenges in the foreclosure process.
31
Foreclosure process issues and the potential legal and regulatory responses to them could negatively impact the process and timing to completion of foreclosures for residential mortgage lenders, including the Bank. Foreclosure timelines have increased in recent years due to, among other reasons, delays associated with the significant increase in the number of foreclosure cases as a result of economic downturns, additional consumer protection initiatives related to the foreclosure process and voluntary or, in some cases, mandatory programs intended to permit or require lenders to consider loan modifications or other alternatives to foreclosure. Increases in the foreclosure timeline may have an adverse effect on collateral values and the Company's ability to minimize its losses.
The Company's ability to originate mortgage loans has been adversely affected by the increased competition resulting from the involvement of the U.S. Government, the Federal Reserve and Government-Sponsored Enterprises (“GSEs”) in the residential mortgage market.
Over the past few years, the Company has faced increased competition for mortgage loans due to the increased involvement of the GSEs in the mortgage market as a result of the recent economic crisis, which has caused interest rates for thirty year fixed-rate mortgage loans that conform to GSE guidelines to remain artificially low. Additionally, the Federal Reserve has participated in the mortgage market in an unusual manner, through its purchases of GSE mortgage-backed securities as part of its "quantitative easing" program. The Company's one-to-four family mortgage loan repayments have been elevated, and it is possible that its one-to-four family mortgage loan repayments will outpace its loan production as a result of these factors, making it difficult for it to grow its mortgage loan portfolio and balance sheet.
The Company may need to increase its allowance for loan and lease losses ("ALLL") in material amounts. The Company may experience elevated amounts of net charge-offs.
The Company's customers may not repay their loans according to the original terms, and the collateral securing the payment of those loans may be insufficient to pay any remaining loan balance. While the Company maintains an ALLL to provide for loan defaults and non-performance, losses may exceed the value of the collateral securing the loans and the allowance may not fully cover any excess loss.
The Company makes various assumptions and judgments about the collectability of its loan portfolio, including the creditworthiness of its borrowers and the value of the real estate and other assets serving as collateral for the repayment of loans. The Company's ALLL is based on these judgments, as well as historical loss experience and an evaluation of the other risks associated with its loan portfolio, including but not limited to, the size and composition of the loan portfolio, current economic conditions and geographic concentrations within the portfolio. Federal regulatory agencies, as part of their examination process, review the Company's loans and ALLL. If the Company's assumptions and judgments used to determine the ALLL prove to be incorrect, if the value of the collateral securing the loans decreases substantially or if the Company's regulators disagree with its judgments, it may need to increase the ALLL in amounts that exceed its expectations. Material additions to the ALLL would adversely affect the Company's results of operations and financial condition.
The Company may be required to increase its ALLL as a result of a recent change to an accounting standard.
In June 2016, the FASB issued ASU 2016-13, Financial Instruments - Credit Losses. The amendments in this ASU were issued to provide financial statement users with more decision-useful information about the expected credit losses on financial instruments that are not accounted for at fair value through net income, including loans held for investment, held-to-maturity debt securities, trade and other receivables, net investments in leases and other commitments to extend credit held by a reporting entity at each reporting date. The amendments require that financial assets measured at amortized cost be presented at the net amount expected to be collected, through an allowance for credit losses that is deducted from the amortized cost basis. The ASU eliminates the current framework of recognizing probable incurred losses and instead requires an entity to use its current estimate of all expected credit losses over the contractual life. The measurement of expected credit losses is based upon historical experience, current conditions, and reasonable and supportable forecasts that affect the collectability of the financial assets.
For purchased financial assets with a more-than-insignificant amount of credit deterioration since origination (“PCD assets”) that are measured at amortized cost, an allowance for expected credit losses is recorded as an adjustment to the cost basis of the asset. Subsequent changes in estimated cash flows would be recorded as an adjustment to the allowance and through the statement of income.
Credit losses relating to available-for-sale debt securities will be recorded through an allowance for credit losses rather than as a direct write-down to the security's cost basis.
The amendments in this ASU are effective for fiscal years beginning after December 15, 2019, including interim periods within those fiscal years. For most debt securities, the transition approach requires a cumulative-effect adjustment to the statement
32
of financial position as of the beginning of the first reporting period the guidance is effective. For other-than-temporarily impaired debt securities and PCD assets, the guidance will be applied prospectively. The Company is currently evaluating the provisions of this ASU to determine the impact the new standard will have on the Company's consolidated financial statements.
The Company operates in a highly regulated industry, which limits the manner and scope of its business activities.
The Company is subject to extensive supervision, regulation and examination by the OCC, CFPB and the FDIC. In addition, the Federal Reserve is responsible for regulating the Company. This regulatory structure is designed primarily for the protection of the deposit insurance funds and consumers and not to benefit the Company's Shareholders. This regulatory structure also gives the regulatory authorities extensive discretion in connection with their supervisory and enforcement activities and examination policies to address not only compliance with applicable laws and regulations (including laws and regulations governing consumer credit, and anti-money laundering and anti-terrorism laws), but also capital adequacy, asset quality and risk, management ability and performance, earnings, liquidity and various other factors. As part of this regulatory structure, the Company and the Bank are subject to policies and other guidance developed by the regulatory agencies with respect to capital levels, the timing and amount of dividend payments, the classification of assets and the establishment of adequate loan loss reserves for regulatory purposes. Under this structure the OCC, the FDIC, the CFPB and the Federal Reserve have broad discretion to impose restrictions and limitations on the Company's operations if they determine, among other things, that our operations are unsafe or unsound, fail to comply with applicable law or are otherwise inconsistent with laws and regulations or with the supervisory policies of these agencies. This supervisory framework could materially impact the conduct, growth and profitability of the Company's operations.
Failure to comply with applicable laws and regulations also could result in a range of sanctions and enforcement actions, including the imposition of civil money penalties, formal agreements and cease and desist orders. In addition, the OCC has specific authority to take “prompt corrective action,” depending on the Bank's capital level. Currently, the Bank is considered “well-capitalized” for prompt corrective action purposes. If the Bank were designated by the OCC as “adequately capitalized,” its ability to take brokered deposits would become limited. If the Bank were to be designated by the OCC in one of the lower capital levels “undercapitalized,” “significantly undercapitalized” or “critically undercapitalized,” it would be required to raise additional capital and would be subject to progressively more severe restrictions on its operations, management and capital distributions, and replacement of senior executive officers and directors. If the Bank became “critically undercapitalized,” it would also be subject to the appointment of a conservator or receiver.
Recent national and state legislation and regulatory initiatives to support the financial services industry have been coupled with numerous restrictions and requirements that could detrimentally affect the Company's business.
The Dodd-Frank Act is having a substantial impact on the financial services industry. The Dodd-Frank Act creates a framework through which regulatory reform is being written. Many of the rules required by the Dodd-Frank Act have been implemented and others are still being drafted. As a result, the impact of the future regulatory requirements continues to be uncertain. We expect the way we conduct business to continue to be affected by these regulatory requirements.
Recent legislative initiatives to support housing finance, both state and federal, could detrimentally affect the Company's business.
Legislative initiatives could detrimentally impact the Company in the future. The extent of the impact of any such legislation will be dependent on the specific details of the final legislation passed, if any.
The Company faces strong competition from other financial institutions and new market participants, offering services similar to those offered by the Bank.
Many competitors offer the types of loans and deposit services that the Company offers. These competitors include other national banks, savings associations, community banks, credit unions and other financial intermediaries. In particular, the Company's competitors include national banks and major financial companies whose greater resources may afford them a marketplace advantage by enabling them to maintain numerous banking locations and mount extensive promotional and advertising campaigns. Additionally, recent technological breakthroughs have made it possible for other non-traditional competitors to enter the marketplace and compete for traditional banking services. Increased competition within the Company's market area may result in reduced loan originations and deposits. Ultimately, the Company may not be able to compete with full success against current and future competitors.
The Company's deposit insurance premiums could increase further in the future, which could have a material adverse impact on future earnings and financial condition.
The FDIC insures deposits at FDIC-insured financial institutions, including the Bank. The FDIC charges insured financial institutions premiums to maintain the Deposit Insurance Fund ("DIF") at a specific level. The Bank's FDIC insurance premiums
33
increased substantially beginning in 2009, and it expects to pay significant premiums in the future. Unfavorable economic conditions, increased bank failures and additional failures decreased the DIF. In order to restore the DIF to its statutorily mandated minimum of 1.35% of total deposits by September 30, 2020, the FDIC may need to increase deposit insurance premium rates. Insured institutions with assets of $10 billion or more are responsible for funding this increase. The FDIC has issued regulations to implement these provisions of the Dodd-Frank Act. It has, in addition, established a higher reserve ratio of 2% as a long-term goal which goes beyond what is required by statute. There is no implementation deadline for the 2% ratio. The FDIC may increase the assessment rates or impose additional special assessments in the future to keep the DIF at the statutory target level. Any increase in the Bank's FDIC premiums could have an adverse effect on its financial condition and results of operations.
The Company is subject to a variety of operational risks, including legal and compliance risk, fraud and theft risk and the risk of operational errors, which may adversely affect its business and results of operations.
The Company is, from time to time, subject to claims and proceedings related to its operations. These claims and legal actions, which could include supervisory or enforcement actions by its regulators, or criminal proceedings by prosecutorial authorities, could involve large monetary claims, including civil money penalties or fines imposed by government authorities, and significant defense costs. To mitigate the cost of some of these claims, the Company maintains insurance coverage in amounts and with deductibles that it believes is appropriate for its operations.
Both internal and external fraud and theft are risks. If personal, non-public, confidential or proprietary information of customers were to be mishandled or misused, the Company could suffer significant regulatory consequences, reputational damage and financial loss. Such mishandling or misuse could include, for example, if such information were erroneously provided to parties who are not permitted to have the information, either by fault of its systems, employees, or counterparties, or if such information were to be intercepted or otherwise inappropriately taken by third parties.
Operational errors include clerical or record-keeping errors or those resulting from faulty or disabled computer or telecommunications systems. Because the nature of the financial services business involves a high volume of transactions, certain errors may be repeated or compounded before they are discovered and successfully rectified. Because of the Company's large transaction volume and its necessary dependence upon automated systems to record and process these transactions there is a risk that technical flaws or tampering or manipulation of those automated systems arising from events wholly or partially beyond its control may give rise to disruption of service to customers and to financial loss or liability. The Company is exposed to the risk that its business continuity and data security systems prove to be inadequate.
The occurrence of any of these risks could result in a diminished ability for the Company to operate its business, additional costs to correct defects, potential liability to clients, reputational damage and regulatory intervention, any of which could adversely affect its business, financial condition and results of operations, perhaps materially.
There may be future sales or other dilution of the Company's equity, which may adversely affect the market price of its common stock.
The Company is not restricted from issuing additional shares of common stock, including any securities that are convertible into or exchangeable for, or that represent the right to receive, common stock. The issuance of any additional shares of common or of preferred stock or convertible securities or the exercise of such securities could be substantially dilutive to Shareholders of the Company's common stock. For instance, exercise of the warrant issued to the U.S. Treasury in connection with its participation in the Capital Purchase Program diluted the value of the Company's common stock. Holders of the Company's shares of common stock have no preemptive rights that entitle holders to purchase their pro rata share of any offering of shares of any class or series and, therefore, such sales or offerings could result in increased dilution to its Shareholders.
Item 1B. | Unresolved Staff Comments |
None.
34
Item 2. | Properties |
The Company owns the building in which its principal executive offices are located in Seattle, Washington. The following table sets forth certain information concerning the Company's other properties, including bank branches and administrative centers:
September 30, 2018 | Property | |||||||||||
Location | Number of Offices | Owned | Leased (1) | Net Book Value (2) | ||||||||
(In thousands) | ||||||||||||
Washington | 80 | 67 | 13 | $ | 149,480 | |||||||
Idaho | 24 | 21 | 3 | 19,175 | ||||||||
Oregon | 46 | 37 | 9 | 36,512 | ||||||||
Utah | 10 | 5 | 5 | 7,274 | ||||||||
Arizona | 31 | 25 | 6 | 21,538 | ||||||||
Texas | 6 | 2 | 4 | 5,547 | ||||||||
New Mexico | 27 | 24 | 3 | 23,122 | ||||||||
Nevada | 11 | 7 | 4 | 5,347 | ||||||||
Total | 235 | 188 | 47 | $ | 267,995 | |||||||
(1) | The leases have varying terms expiring from 2018 through 2070, including renewal options. |
(2) | Amount represents the net book value of all land, property and equipment owned by the Company and the book value of leasehold improvements, where applicable. |
The Company evaluates on a continuing basis the suitability and adequacy of its offices, both branches and administrative centers, and has opened, relocated, remodeled or closed them as necessary to maintain efficient and attractive premises. The net investment in premises, equipment and leaseholds was $267,995,000 at September 30, 2018.
Item 3. | Legal Proceedings |
The Company and its consolidated subsidiaries are involved in legal proceedings occurring in the ordinary course of business that in the aggregate are believed by management to be immaterial to the financial statements of the Company. The effects of legal proceedings did not have a material impact on the Company's consolidated financial statements.
Item 4. | Mine Safety Disclosures |
None.
35
PART II
Item 5. | Market for Registrant’s Common Equity, Related Shareholder Matters and Issuer Purchases of Equity Securities |
The information required by this item is set forth in the 2018 Annual Report to Shareholders, which is included herein as Exhibit 13.
Issuer Purchases of Equity Securities
The Company’s stock repurchase program was publicly announced by the board of directors on February 3, 1995 and has no expiration date. Under this program, a total of 56,956,264 shares of the Company’s common stock have been authorized for repurchase. The following table shows the share repurchases made for the three months ended September 30, 2018.
Period | Total Number of Shares Purchased | Average Price Paid Per Share | Total Number of Shares Purchased as Part of Publicly Announced Plan (1) | Maximum Number of Shares That May Yet Be Purchased Under the Plan at the End of the Period (2) | ||||||||
July 1, 2018 to July 31, 2018 | 205,790 | $ | 33.89 | 205,790 | 2,649,975 | |||||||
August 1, 2018 to August 31, 2018 | 106,515 | 33.66 | 106,515 | 2,543,460 | ||||||||
September 1, 2018 to September 30, 2018 | 510,862 | 32.78 | 510,862 | 2,032,598 | ||||||||
Total | 823,167 | $ | 33.17 | 823,167 | 2,032,598 | |||||||
Item 6. | Selected Financial Data |
The information required by this item is set forth in the 2018 Annual Report and is incorporated herein by reference.
Item 7. | Management’s Discussion and Analysis of Financial Condition and Results of Operations |
The information required by this item is set forth in the 2018 Annual Report and is incorporated herein by reference.
Item 7A. | Quantitative and Qualitative Disclosures About Market Risk |
The information required herein is incorporated by reference to the section titled Interest Rate Risk within this Form 10-K.
Item 8. | Financial Statements and Supplementary Data |
The information required by this item is set forth in the 2018 Annual Report and is incorporated herein by reference.
Item 9. | Changes in and Disagreements with Accountants on Accounting and Financial Disclosure |
None.
Item 9A. | Controls and Procedures |
Evaluation of Disclosure Controls and Procedures
As of September 30, 2018, the Company carried out an evaluation, under the supervision and participation of the Company’s management, including the Company’s Chief Executive Officer and Chief Financial Officer, of the effectiveness of the design and operation of the Company’s disclosure controls and procedures pursuant to Rule 13a-15(e) of the Exchange Act. Based upon that evaluation, the Company’s Chief Executive Officer and Chief Financial Officer concluded that the Company’s disclosure controls and procedures were effective to ensure that information required to be disclosed by the Company in the reports it files or submits under the Exchange Act is recorded, processed, summarized and reported within time periods specified in SEC rules and forms and were effective to ensure that such information is accumulated and communicated to the Company's management,
36
including its Chief Executive Officer and Chief Financial Officer, as appropriate to allow timely decisions regarding required disclosure.
Management’s Report on Internal Control Over Financial Reporting
The Company's management is responsible for establishing and maintaining adequate internal control over financial reporting. The Company’s internal control system is designed to provide reasonable assurance regarding the reliability of financial reporting and the preparation of financial statements for external purposes in accordance with generally accepted accounting practices in the United States of America.
The Company’s management assessed the effectiveness of the Company’s internal control over financial reporting as of September 30, 2018. In making the assessment, the Company’s management used the criteria set forth by the Committee of Sponsoring Organizations of the Treadway Commission (COSO) in the 2013 version of its Internal Control-Integrated Framework. Based on its assessment, the Company’s management believes that as of September 30, 2018, the Company’s internal control over financial reporting was effective based on this criteria.
The Company’s independent auditors, Deloitte & Touche LLP, an independent registered public accounting firm, have issued an audit report on the Company’s internal control over financial reporting, which is incorporated by reference and set forth in the 2018 Annual Report.
There have been no changes in the Company’s internal control over financial reporting during the Company’s most recent fiscal quarter ended September 30, 2018 that have materially affected, or are reasonably likely to materially affect, the Company’s internal control over financial reporting.
Item 9B. | Other Information |
None.
37
PART III
Item 10. | Directors, Executive Officers and Corporate Governance |
The information required by this item will be set forth in the 2018 Proxy Statement and is incorporated herein by reference. The Company’s annual meeting of Shareholders is set to be held on January 16, 2019.
The Company has adopted a code of ethics that applies to all senior financial officers, including its Chief Executive Officer and Chief Financial Officer. The code of ethics is publicly available on the Company’s website at www.washingtonfederal.com. If the Company makes any substantive amendments to the code of ethics or grants any waiver from a provision of the code, it will disclose the nature of such amendment or waiver on its website or in a report on Form 8-K.
Item 11. | Executive Compensation |
The information required by this item will be set forth in the 2018 Proxy Statement and is incorporated herein by reference.
Item 12. | Security Ownership of Certain Beneficial Owners and Management and Related Shareholder Matters |
The information required by this item will be set forth in the 2018 Proxy Statement and is incorporated herein by reference.
Item 13. | Certain Relationships and Related Transactions and Director Independence |
The information required by this item will be set forth in the 2018 Proxy Statement and is incorporated herein by reference.
Item 14. | Principal Accounting Fees and Services |
The information required by this item will be set forth in the 2018 Proxy Statement and is incorporated herein by reference.
38
PART IV
Item 15. | Exhibits and Financial Statement Schedules |
(a)(1) The following financial statements are incorporated herein by reference in the sections immediately following the Selected Financial Data of the Annual Report.
Reports of Independent Registered Public Accounting Firm
Consolidated Statements of Financial Condition as of September 30, 2018 and 2017
Consolidated Statements of Operations for each of the years in the three-year period ended September 30, 2018
Consolidated Statements of Comprehensive Income for each of the years in the three-year period ended September 30, 2018
Consolidated Statements of Shareholders’ Equity for each of the years in the three-year period ended September 30, 2018
Consolidated Statements of Cash Flows for each of the years in the three-year period ended September 30, 2018
Notes to Consolidated Financial Statements
(a)(2) There are no financial statement schedules filed herewith.
(a)(3) The following exhibits are filed as part of this report, and this list includes the Exhibit Index:
No. | Exhibit | Page/ Footnote |
(1) | ||
(2) | ||
(3) | ||
(4) | ||
(5) | ||
(5) | ||
(5) | ||
(6) | ||
(7) | ||
101 | Financial Statements from the Company’s Annual Report on Form 10-K for the fiscal year ended September 30, 2018 formatted in XBRL | |
___________________
* | Management contract or compensation plan |
(1) | Incorporated by reference from the Registrant's Form 10-Q filed with the SEC on May 3, 2016. |
(2) | Incorporated by reference from the Registrant's Form 8-K filed with the SEC on January 22, 2016. |
(3) | Incorporated by reference from the Registrant’s Annual Report on Form 10-K filed with the SEC on November 8, 2005. |
(4) | Incorporated by reference from the Registrant's Form 10-K filed with the SEC on November 21, 2016. |
(5) | Incorporated by reference from the Registrant's Form 8-K filed with the SEC on October 24, 2016. |
39
(6) | Incorporated by reference from the Registrant's Form 8-K filed with the SEC on August 19, 2015. |
(7) | Incorporated by reference from the Registrant's Form 8-K filed with the SEC on January 24, 2017. |
40
Item 16. Form 10-K Summary
Not applicable.
SIGNATURES
Pursuant to the requirements of Section 13 or 15(d) of the Securities Exchange Act of 1934, the Registrant has duly caused this report to be signed on its behalf by the undersigned, thereunto duly authorized.
WASHINGTON FEDERAL, INC. | ||
November 19, 2018 | By: | /S/ BRENT J. BEARDALL |
Brent J. Beardall, President and Chief Executive Officer | ||
41
Pursuant to the requirements of the Securities Exchange Act of 1934, this report is signed below by the following persons on behalf of the Registrant and in the capacities and on the dates indicated.
/s/ Brent J. Beardall | November 19, 2018 |
Brent J. Beardall Director, President and Chief Executive Officer (Principal Executive Officer) | |
/s/ Vincent L. Beatty | November 19, 2018 |
Vincent L. Beatty Executive Vice President and Chief Financial Officer (Principal Financial Officer) | |
/s/ Cory D. Stewart | November 19, 2018 |
Cory D. Stewart Senior Vice President and Principal Accounting Officer (Principal Accounting Officer) | |
/s/ Thomas J. Kelley | November 19, 2018 |
Thomas J. Kelley, Chairman of the Board | |
/s/ Roy M. Whitehead | November 19, 2018 |
Roy M. Whitehead, Director | |
/s/ David K. Grant | November 19, 2018 |
David K. Grant, Director | |
/s/ Anna C. Johnson | November 19, 2018 |
Anna C. Johnson, Director | |
/s/ S. Steven Singh | November 19, 2018 |
S. Steven Singh, Director | |
/s/ Barbara L. Smith | November 19, 2018 |
Barbara L. Smith, Director | |
/s/ Mark N. Tabbutt | November 19, 2018 |
Mark N. Tabbutt, Director | |
/s/ Randall H. Talbot | November 19, 2018 |
Randall H. Talbot, Director | |
42