0001654954-21-000133.txt : 20210105 0001654954-21-000133.hdr.sgml : 20210105 20210105165827 ACCESSION NUMBER: 0001654954-21-000133 CONFORMED SUBMISSION TYPE: 6-K PUBLIC DOCUMENT COUNT: 8 CONFORMED PERIOD OF REPORT: 20210104 FILED AS OF DATE: 20210105 DATE AS OF CHANGE: 20210105 FILER: COMPANY DATA: COMPANY CONFORMED NAME: IRSA INVESTMENTS & REPRESENTATIONS INC CENTRAL INDEX KEY: 0000933267 STANDARD INDUSTRIAL CLASSIFICATION: LAND SUBDIVIDERS & DEVELOPERS (NO CEMETERIES) [6552] IRS NUMBER: 000000000 FISCAL YEAR END: 0630 FILING VALUES: FORM TYPE: 6-K SEC ACT: 1934 Act SEC FILE NUMBER: 001-13542 FILM NUMBER: 21506721 BUSINESS ADDRESS: STREET 1: BOLIVAR 108 CITY: BUENOS AIRES STATE: C1 ZIP: C1066AAD BUSINESS PHONE: 00541143237449 MAIL ADDRESS: STREET 1: BOLIVAR 108 CITY: BUENOS AIRES STATE: C1 ZIP: C1066AAD 6-K 1 irsa6k.htm PRIMARY DOCUMENT irsa6k

United States
 
SECURITIES AND EXCHANGE COMMISSION
 
Washington, D.C. 20549
 
FORM 6-K
 
REPORT OF FOREIGN PRIVATE ISSUER
 
PURSUANT TO RULE 13a-16 OR 15d-16 UNDER THE SECURITIES EXCHANGE ACT OF 1934
 
For the month of January 2021.
 
Commission File Number 001-13542
 
IRSA Inversiones y Representaciones Sociedad Anónima
 
(Exact name of registrant as specified in its charter)
 
IRSA Investments and Representations Inc.
 
(Translation of registrant’s name into English)
 
Carlos Della Paolera 261
 
(C1001ADA) Ciudad Autónoma de Buenos Aires, Argentina
 
(Address of principal executive office)
 
Indicate by check mark whether the registrant files or will file annual reports under cover of Form 20-F or Form 40-F. Form 20-F ☒ Form 40-F ☐
 
Indicate by check mark if the registrant is submitting the Form 6-K in paper as permitted by Regulation S-T Rule 101(b)(1): ____
 
Note: Regulation S-T Rule 101(b)(1) only permits the submission in paper of a Form 6-K if submitted solely to provide an attached Form 6-K to security holders.
 
Indicate by check mark if the registrant is submitting the Form 6-K in paper as permitted by Regulation S-T Rule 101(b)(7): ____
 
Note: Regulation S-T Rule 101(b)(7) only permits the submission in paper of a Form 6-K if submitted to furnish a report or other document that the registrant foreign private issuer must furnish and make public under the laws of the jurisdiction in which the registrant is incorporated, domiciled or legally organized (the registrant’s “home country”), or under the rules of the home country exchange on which the registrant’s securities are traded, as long as the report or other document is not a press release, is not required to be and has not been distributed to the registrant’s security holders, and, if discussing a material event, has already been the subject of a Form 6-K submission or other Commission filing on EDGAR.


TABLE OF CONTENTS
 
Page
Explanatory Note
1
Disclaimer Regarding Forward-Looking Statements
2
Available Information
2
Presentation of Financial and Certain Other Information
3
Selected Consolidated Financial Data
5
Local Exchange Market and Exchange Rates
8
Information on the Company
9
Operating and Financial Review and Prospects
28
Directors, Senior Management and Employees
54
Major Shareholders
55
Controls and Procedures
56
Signatures
58


EXPLANATORY NOTE
 
IRSA Inversiones y Representaciones Sociedad Anónima (“IRSA,” the “Company,” “we,” “our” or “us”) is filing this report on Form 6-K (this “Form 6-K”) pursuant to SEC Financial Reporting Manual, Topic 13 – Effects of Subsequent Events on Financial Statements Required in Filings, which requires retrospective revision of audited financial statements that are incorporated by reference in a registration statement to reflect a subsequent change in accounting principle (or consistent with staff practice, discontinued operations and changes in segment presentation) if the registration statement also incorporates by reference post-event interim financial statements. Exhibit 99.1 to this Form 6-K includes IRSA’s audited consolidated financial statements as of June 30, 2020 and 2019 and for the fiscal years ended June 30, 2020, 2019 and 2018, which have been recast to: (a) present the audited consolidated financial statements in the measuring unit current at the end of the reporting period as of September 30, 2020 (the most recent period for which financial statements were included in this Form 6-K); and (b) reflect IRSA’s loss of control of IDB Development Corporation, Ltd. (“IDBD”) and Discount Investment Corporation, Ltd. (“DIC”) on September 25, 2020 and, consequently, the deconsolidation of such investees since that date. See “Presentation of Financial and Certain Other Information.” Our Audited Consolidated Financial Statements included as Exhibit 99.1 to this Form 6-K amend and replace in their entirety the audited consolidated financial statements of IRSA included in IRSA’s annual report on Form 20-F for the fiscal year ended June 30, 2020 (our “2020 Form 20-F”) originally filed with the U.S. Securities and Exchange Commission (the “SEC”) on November 16, 2020, and the other information in this Form 6-K amends and replaces information set forth in our 2020 Form 20-F to the extent the information contained in our 2020 Form 20-F conflicts with the information contained herein. Exhibit 99.2 to this Form 6-K includes IRSA’s unaudited condensed interim consolidated financial statements as of September 30, 2020 and for the three-month periods ended September 30, 2020 and 2019. This Form 6-K should be read in conjunction with our 2020 Form 20-F.


1
 
 
 DISCLAIMER REGARDING FORWARD-LOOKING STATEMENTS
 
This Form 6-K includes forward-looking statements, principally under “Risk Factors,” “Information on the Company” and “Operating and Financial Review and Prospects.” We have based these forward-looking statements largely on our current beliefs, expectations and projections about future events and financial trends affecting our business. Many important factors, in addition to those discussed elsewhere in this Form 6-K, could cause our actual results to differ substantially from those anticipated in our forward-looking statements, including, among other things:
 
Factors that could cause actual results to differ materially and adversely include but are not limited to:
 
changes in general economic, financial, business, political, legal, social or other conditions in Argentina and Latin America or changes in developed markets or emerging markets or both;
 
changes in capital markets in general that may affect policies or attitudes toward lending to or investing in Argentina or Argentine companies, including volatility in domestic and international financial markets;
 
inflation and deflation;
 
ongoing economic impacts of the COVID-19 pandemic on the Argentine economy;
 
measures adopted by the Argentine Government in response to the COVID-19 pandemic;
 
impact on our business of the COVID-19 pandemic;
 
economic consequences of the pandemic and the related impact on our business and financial condition;
 
fluctuations in the exchanges rates of the peso and in the prevailing interest rates;
 
increases in financing costs or our inability to obtain additional financing on attractive terms, which may limit our ability to fund existing operations and to finance new activities;
 
current and future government regulation and changes in law or in the interpretation by Argentine courts;
 
price fluctuations in the real estate market;
 
political, civil and armed conflicts;
 
adverse legal or regulatory disputes or proceedings;
 
fluctuations and declines in the aggregate principal amount of Argentine public debt outstanding, default of sovereign debt;
 
government intervention in the private sector and in the economy, including through nationalization, expropriation, labor regulation or other actions;
 
restrictions on transfer of foreign currencies and other exchange controls;
 
increased competition in the shopping mall sector, office or other commercial properties and related industries;
 
potential loss of significant tenants at our shopping malls, offices or other commercial properties;
 
our ability to take advantage of opportunities in the real estate market on a timely basis;
 
restrictions on energy supply or fluctuations in prices of utilities in the Argentine market;
 
our ability to meet our debt obligations;
 
shifts in consumer purchasing habits and trends;
 
technological changes and our potential inability to implement new technologies;
 
deterioration in regional, national or global businesses and economic conditions;
 
changes on the applicable regulations to currency exchange or transfers;
 
incidents of government corruption that adversely impact the development of our real estate projects;
 
fluctuations and declines in the exchange rate of the peso, the U.S. dollar against other currencies; and
 
the risk factors discussed under “Risk Factors” in our 2020 Form 20-F.
 
You can identify forward-looking statements because they contain words such as “believes,” “expects,” “may,” “will,” “should,” “seeks,” “intends,” “plans,” “estimates,” “anticipates,” “could,” “target,” “projects,” “contemplates,” “potential,” “continue” or similar expressions. Forward-looking statements include information concerning our possible or assumed future results of operations, business strategies, financing plans, competitive position, industry environment, potential growth opportunities, the effects of future regulation and the effects of competition. Forward-looking statements speak only as of the date they were made, and we undertake no obligation to update publicly or to revise any forward-looking statements after we furnish this Form 6-K because of new information, future events or other factors. In light of the risks and uncertainties described above, the forward-looking events and circumstances discussed in this Form 6-K might not occur and are not guarantees of future performance.
 
You should not place undue reliance on such statements which speak only as of the date that they were made. These cautionary statements should be considered in connection with any written or oral forward-looking statements that we might issue in the future.
 
 AVAILABLE INFORMATION
 
We file annual and current reports and other information with the SEC. You may obtain any report, information or other document we file electronically with the SEC at the SEC’s website (http://www.sec.gov) or at our website (http://www.irsa.com.ar). The information contained in our website is not incorporated by reference herein and does not form part of this Form 6-K.


2
 
 
 PRESENTATION OF FINANCIAL AND CERTAIN OTHER INFORMATION
 
In this Form 6-K, references to “IRSA,” the “Company,” “we,” “us” and “our” means IRSA Inversiones y Representaciones Sociedad Anónima and its consolidated subsidiaries, unless the context otherwise requires, or where we make clear that such term refers only to IRSA and not to its subsidiaries.
 
The terms “Argentine government” and “government” refer to the federal government of Argentina, the term “Central Bank” refers to the Banco Central de la República Argentina (the Argentine Central Bank), the terms “CNV” and “CNV Rules” refer to the Comisión Nacional de Valores (the Argentine National Securities Commission) and the rules issued by the CNV, respectively. In this Form 6-K, when we refer to “peso,” “pesos” or “ARS” we mean Argentine pesos, the legal currency of Argentina, and when we refer to “U.S. dollar,” “U.S. dollars” or “USD” we mean United States dollars, the legal currency of the United States.
 
References to “GDSs” are to the Global Depositary Shares, each representing 10 shares of our common stock, issued pursuant to the deposit agreement, dated as of March 18, 1997 (the “deposit agreement”), between us, The Bank of New York, as depositary (the “GDS Depositary”), and the owners and holders of the GDSs issued from time to time thereunder, and references to “GDRs” are to the Global Depositary Receipts, which represent the GDSs.
 
Financial Statements
 
We prepare and maintain our financial books and records in pesos and in conformity with International Financial Reporting Standards (“IFRS”), as issued by the International Accounting Standards Board (“IASB”), and the CNV Rules. Our fiscal year begins on July 1 and ends on June 30 of each year.
 
The following have been filed as exhibits to this Form 6-K:
 
our audited consolidated financial statements as of June 30, 2020 and 2019 and for the years ended June 30, 2020, 2019 and 2018 (our “Audited Consolidated Financial Statements”), which have been recast to: (a) present the Audited Consolidated Financial Statements in the measuring unit current at the end of the reporting period as of September 30, 2020 (the most recent period for which financial statements are included in this Form 6-K); and (b) reflect IRSA’s loss of control in IDBD and DIC on September 25, 2020 and, consequently, the deconsolidation of such investees since that date; and
 
our unaudited condensed interim consolidated financial statements as of September 30, 2020 and for the three-month periods ended September 30, 2020 and 2019 (our “Unaudited Condensed Interim Consolidated Financial Statements” and, together with our Audited Consolidated Financial Statements, our “Financial Statements”).
 
Our Audited Consolidated Financial Statements have been approved by our Board of Directors on January 5, 2020 and have been audited by Price Waterhouse & Co S.R.L., Argentina, member of PriceWaterhouseCoopers International Limited, an independent registered public accounting firm whose report is included herein.
 
Deconsolidation of IDBD and DIC
 
Prior to September 25, 2020, we managed our business and operations in Israel through our subsidiaries IDBD and DIC. On September 25, 2020, the District Court in Tel Aviv-Jaffa (the “Court”), in response to a petition from IDBD’s creditors, declared the insolvency of IDBD and initiated liquidation proceedings (the “Liquidation Proceedings”). The Court appointed a trustee for IDBD’s shares and receivers for DIC’s and Clal’s shares.
 
Under IFRS 10 “Consolidated Financial Statements” (“IFRS 10”), an investor controls an investee if and only if the investor has all the following: (a) power over the investee; (b) exposure, or rights, to variable returns from its involvement with the investee; and (c) the ability to use its power over the investee to affect the amount of the investor’s returns. Based on the facts and circumstances outlined above, our management believes that, as from September 25, 2020, IRSA lost control over IDBD and DIC (as this term is defined by IFRS 10). Accordingly, (a) our investment in IDBD and DIC has been deconsolidated in our Unaudited Interim Financial Statements, and (b) our Audited Consolidated Financial Statements have been restated to reflect the deconsolidation of IDBD and DIC.
 
Functional and Presentation Currency; Adjustment for Inflation
 
Our functional and presentation currency is the peso, and our Financial Statements filed as exhibits to this Form 6-K are presented in pesos.
 
IAS 29, Financial Reporting in Hyperinflationary Economies (“IAS 29”) requires that the financial statements of an entity whose functional currency is one of a hyperinflationary economy be measured in terms of the current unit of measurement at the closing date of the reporting period, regardless of whether they are based on the historical cost method or the current cost method. This requirement also includes the comparative information of the financial statements.
 
In order to conclude that an economy is “hyperinflationary,” IAS 29 outlines a series of factors, including the existence of an accumulated inflation rate in three years that is approximately or exceeds 100%. As of July 1, 2018, Argentina reported a cumulative three-year inflation rate greater than 100% and therefore financial information published as from that date should be adjusted for inflation in accordance with IAS 29. Therefore, our Financial Statements and the financial information included in this Form 6-K have been presented in terms of the measuring unit current at the end of the reporting period as of September 30, 2020. For more information, see “—Financial Statements” and Note 2.1 to our Audited Consolidated Financial Statements.
 
Effective July 1, 2018, we adopted IFRS 15, Revenues from contracts with customers (“IFRS 15”) and IFRS 9, Financial instruments (“IFRS 9”) using the modified retrospective approach, so that the cumulative impact of the adoption was recognized in the retained earnings at the beginning of the fiscal year starting on July 1, 2018, and the comparative figures were consequently not modified. Accordingly, certain comparisons between periods may be affected. See Note 2.2 to our Audited Consolidated Financial Statements and “Operating Review and Prospects—New Accounting Pronouncements” for a more comprehensive discussion of the effects of the adoption of these new standards.
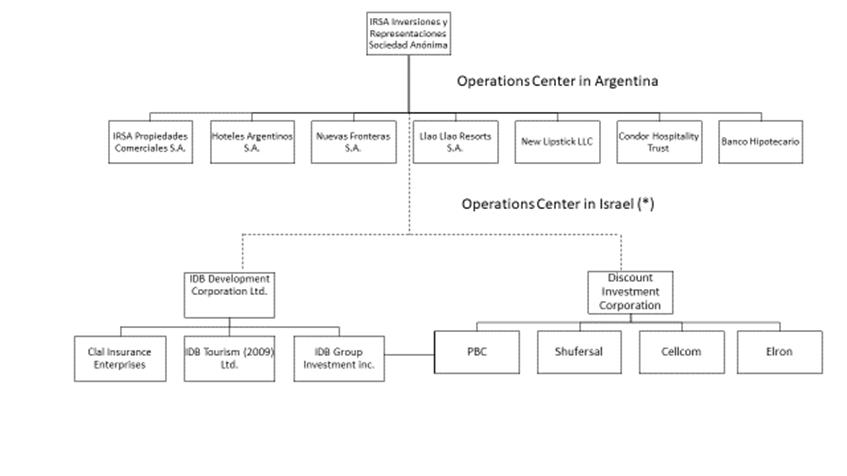
 
Organizational Structure
 
As of September 30, 2020, we had two operations centers to manage our global business, which we refer to in this Form 6-K as the “Operations Center in Argentina” and the “Operations Center in Israel.” Following the loss of control of IDBD and DIC on September 25, 2020, and starting on October 1, 2020, we manage our global business from our Operations Center in Argentina. See above “—Deconsolidation of IDBD and DIC.”
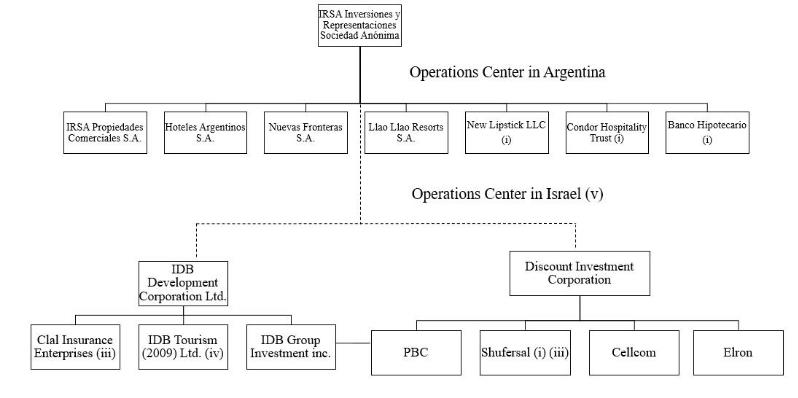


(i)  Corresponds to the Company’s associates, which are entities over which the Company has significant influence and are accounted for using the equity method in accordance with IAS 28, and, accordingly, are excluded from consolidation.
(ii)  The results for the 2018 fiscal year reflected as “discontinued operations” in our Financial Statements, due to the loss of control in June 2018. See “—Financial Information of our Subsidiaries in Israel.”
(iii)  Reflected as “financial assets held for sale” in our Financial Statements.
(iv)  Assets and liabilities are reflected as “held for sale” and the results as “discontinued operations” in our Financial Statements.
(v)  For more information about the changes within the Operations Center in Israel, see Note 4 to our Audited Consolidated Financial Statements. As from September 25, 2020, IRSA lost control over IDBD and DIC. Accordingly, our investment in IDBD and DIC was deconsolidated in our financial statements as of and for the three-month period ended September 30, 2020.


3
 

Currency Translations
 
We have translated some of the peso amounts contained in this Form 6-K into U.S. dollars for convenience purposes only. Unless otherwise specified or the context otherwise requires, the rate used to convert peso amounts to U.S. dollars is the seller exchange rate quoted by Banco de la Nación Argentina of ARS  76.18 per USD 1.00 as of September 30, 2020. The seller exchange rate quoted by Banco de la Nación Argentina was ARS 84.70 per USD 1.00 as of January 4, 2021. The U.S. dollar equivalent information presented in this Form 6-K is provided solely for the convenience of the reader and should not be construed as implying that the peso amounts represent, or could have been or could be converted into, U.S. dollars at such rates or at any other rate. See “Local Exchange Market and Exchange Rates” and “Risk Factors—Risks relating to Argentina—Continuing inflation may have an adverse effect on the economy and our business, financial condition and the results of our operations” in our 2020 Form 20-F.
 
Market Share Data
 
Information regarding market share in a specified region or area is based on data compiled by us from internal sources and from publications such as Bloomberg, the International Council of Shopping Centers, the Argentine Chamber of Shopping Centers (Cámara Argentina de Shopping Centers), and the INDEC.
 
Certain Measurements
 
In Argentina the standard measure of area in the real estate market is the sqm (m2, or “sqm”), while in the United States and certain other jurisdictions the standard measure of area is the square foot (sq. ft.). All units of area shown in this Form 6-K (e.g., gross leasable area of buildings (“GLA” or “gross leasable area”), and size of undeveloped land) are expressed in terms of sqm. One sqm is equal to approximately 10.8 square feet. One hectare is equal to approximately 10,000 sqm and to approximately 2.47 acres.
 
As used herein, GLA in the case of shopping malls refers to the total leasable area of the property, regardless of our ownership interest in such property (excluding common areas and parking and space occupied by supermarkets, hypermarkets, gas stations and co-owners, except where specifically stated).
 
Rounding Adjustments
 
Certain numbers and percentages included in this Form 6-K have been subject to rounding adjustments. Accordingly, figures shown for the same category presented in various tables or other sections of this Form 6-K may vary slightly, and figures shown as totals in certain tables may not be the arithmetic aggregation of the figures that precede them.
 
 
4
 
 
 SELECTED CONSOLIDATED FINANCIAL DATA
 
The following table presents our selected financial data as of June 30, 2020, 2019 and 2018 and for the fiscal years ended June 30, 2020, 2019, 2018 and 2017. The selected consolidated statement of income and other comprehensive income data and the selected consolidated statement of cash flow data for the fiscal years ended June 30, 2020, 2019 and 2018 and the selected consolidated statement of financial position data as of June 30, 2020 and 2019 have been prepared in accordance with IFRS, as issued by the IASB, and CNV Rules, and have been derived from our Audited Consolidated Financial Statements included as an exhibit to this Form 6-K, which have been recast to: (a) present the Audited Consolidated Financial Statements in the measuring unit current at the end of the reporting period as of September 30, 2020 (the most recent period for which financial statements were included in this Form 6-K); and (b) reflect IRSA’s loss of control in IDBD and DIC on September 25, 2020 and, consequently, the deconsolidation of such investees since that date. The selected consolidated statement of income and other comprehensive income data and the selected consolidated statement of cash flow data for the fiscal year ended June 30, 2017 and the selected consolidated statement of financial position data as of June 30, 2018 have been prepared in accordance with IFRS, as issued by the IASB, and CNV Rules, and have been derived from our audited consolidated financial statements as of June 30, 2019 and 2018 and for the years ended June 30, 2019, 2018 and 2017 filed as an exhibit to our Annual Report on Form 20-F filed with the SEC on October 31, 2019, recast to present such financial information in the measuring unit current as of September 30, 2020 and reflect IRSA’s loss of control in IDBD and DIC on September 25, 2020 and, consequently, the deconsolidation of such investees since that date. The summary financial data as of June 30, 2017 and 2016 and for the fiscal year ended June 30, 2016 have not been presented as these cannot be provided on a restated basis without unreasonable effort or expense. See “Presentation of Financial and Other Information—Functional and Presentation Currency,” “Operating and Financial Review and Prospects—Results of Operations— Effects of Changes in Inflation,” “Risk Factors—Risk Related to Argentina—If the high levels of inflation continue, the Argentine economy and our results of operations could be adversely affected in our 2020 Form 20-F,” and Note 2 to our Audited Consolidated Financial Statements.
 
The following table also presents our selected financial data as of September 30, 2020 and 2019 and for the three-month periods ended September 30, 2020 and 2019. The selected interim consolidated statement of income and comprehensive income data and the selected interim consolidated statement of cash flow data for the three-month periods ended September 30, 2020 and 2019 and the selected interim consolidated statement of financial position data as of September 30, 2020 have been prepared in accordance with IAS 34, Interim Financial Reporting (“IAS 34”), as issued by the IASB and have been derived from our Unaudited Condensed Interim Consolidated Financial Statements included as an exhibit to this Form 6-K. The results of our operations for the three-month period ended September 30, 2020 are not necessarily indicative of the results to be expected for the full fiscal year ending June 30, 2021.
 
You should read the information below in conjunction with our Financial Statements, including the notes thereto.
 
 
5
 
 
Summarized Consolidated Financial and Other Information


For the three months           
 
 
For the fiscal year ended                     


ended September 30,           
 
 
June 30,                     
 
 
2020
 
2020
 
 
2019
 
 
2020
 
 
2020
 
 
2019
 
 
2018
 
 
2017
 
 
(in millions of USD)(i)(ii)
 
(in millions of ARS; except per share data)      
 
 
(in millions of USD)(i)(ii)
 
 
(in millions of ARS; except per share data)                
 
CONSOLIDATED STATEMENT OF INCOME AND OTHER COMPREHENSIVE INCOME


Revenues
  21 
  1,609 
  4,487 
  200 
  15,240 
  20,071 
  19,522 
  19,858 
Costs
  (14)
  (1,097)
  (1,682)
  (83)
  (6,359)
  (7,498)
  (7,727)
  (8,320)
Gross profit
  7 
  512 
  2,805 
  117 
  8,881 
  12,573 
  11,795 
  11,538 
Net gain / (loss) from changes in fair value of investment properties
  316 
  24,089 
  12,349 
  477 
  36,313 
  (41,737)
  20,627 
  (7,951)
General and administrative expenses
  (8)
  (644)
  (661)
  (31)
  (2,365)
  (2,928)
  (2,518)
  (2,402)
Selling expenses
  (6)
  (450)
  (295)
  (17)
  (1,306)
  (1,160)
  (1,195)
  (1,163)
Other operating results, net
  0 
  (18)
  (56)
  0 
  (24)
  (506)
  (27)
  (986)
Profit / (loss) from operations
  308 
  23.489 
  14.142 
  545 
  41,499 
  (33,758)
  28,682 
  (964)
Share of profit / (loss) of associates and joint ventures
  2 
  147 
  737 
  102 
  7,771 
  (7,588)
  (3,551)
  (1,223)
Profit / (loss) from operations before financial results and income tax
  310 
  23,636 
  14,879 
  647 
  49,270 
  (41,346)
  25,131 
  (2,187)
Finance income
  1 
  56 
  83 
  3 
  229 
  202 
  808 
  1,041 
Finance cost
  (21)
  (1,593)
  (1,782)
  (87)
  (6,629)
  (5,151)
  (4,631)
  (4,014)
Other financial results
  8 
  624 
  (9,152)
  (87)
  (6,657)
  2,415 
  (11,832)
  2,308 
Inflation adjustment
  0 
  (29)
  (393)
  1 
  97 
  (568)
  (949)
  (588)
Financial results, net
  (12)
  (942)
  (11,244)
  (170)
  (12,960)
  (3,102)
  (16,604)
  (1,253)
Profit/ (loss) before income tax
  298 
  22,694 
  3,635 
  477 
  36,310 
  (44,448)
  8,527 
  (3,440)
Income tax expense
  (104)
  (7,958)
  (2,505)
  (95)
  (7,216)
  4,845 
  11,455 
  (1,131)
Profit / (Loss) from continuing operations
  193 
  14,736 
  1,130 
  382 
  29,094 
  (39,603)
  19,982 
  (4,571)
Profit / (Loss) from discontinued operation
  (84)
  (6,396)
  13,887 
  (47)
  (3,546)
  (1,704)
  15,773 
  9,262 
Total Profit / (Loss) for the year
  109 
  8,34 
  15,017 
  335 
  25,548 
  (41,307)
  35,755 
  4,691 
Profit / (loss) from continuing operations attributable to:


Equity holders of the parent
  153 
  11,679 
  247 
  290 
  22,065 
  (34,991)
  16,208 
  (4,296)
Non-controlling interest
  40 
  3,057 
  883 
  92 
  7,029 
  (4,612)
  3,774 
  (275)


Total profit / (loss) attributable to:


Equity holders of the parent
  87 
  6,615 
  4,509 
  201 
  15,340 
  (39,412)
  22,66 
  (1,723)
Non-controlling interest
  23 
  1,725 
  10,508 
  134 
  10,208 
  (1,895)
  13,095 
  6,414 


Profit / (loss) per common share from continuing operations attributable to equity holders of the parent:


Basic
  0.15 
  11.50 
  7.84 
  0.35 
  26.66 
  (68.55)
  39.39 
  (2.99)
Diluted
  0.15 
  11.42 
  7.84 
  0.35 
  26.50 
  (68.55)
  39.16 
  (2.99)


Total profit / (loss) per common share attributable to equity holders of the parent:


Basic
  0.27 
  20.31 
  0.43 
  0.50 
  38.35 
  (60.86)
  28.17 
  (13.13)
Diluted
  0.26 
  20.17 
  0.43 
  0.50 
  38.12 
  (60.86)
  28.17 
  (13.13)


CONSOLIDATED STATEMENT OF OTHER COMPREHENSIVE OPERATIONS


Profit/ (loss) for the year
  109 
  8,340 
  15,017 
  335 
  25,548 
  (41,307)
  35,755 
  4,691 
Other comprehensive income (loss):


Items that may be reclassified subsequently to profit or loss:


Currency translation adjustment
  (77)
  (5,833)
  71 
  7 
  520 
  306 
  (25)
  (13,931)
Net change in fair value of hedging instruments


Revaluation reserve
  26 
  1,954 
  1,730 


Items that may not be reclassified subsequently to profit or loss, net of income tax


Actuarial loss from defined benefit plans
   
   
  (11)


Other comprehensive income / (loss) from continuing operations
  (51)
  (3,879)
  1,790 
  7 
  520 
  306 
  (25)
  (13,931)
Other comprehensive income / (loss) from discontinued operations
  (63)
  (4,794)
  14,057 
  194 
  14,748 
  (2,486)
  14,564 
  19,271 
Total other comprehensive income / (loss) for the year
  (114)
  (8,673)
  15,847 
  200 
  15,268 
  (2,180)
  14,539 
  5,340 
Total comprehensive income / (loss) for the year
  (4)
  (333)
  30,864 
  536 
  40,816 
  (43,487)
  50,294 
  10,031 


Total comprehensive income / (loss) from continuing operations
  143 
  10,857 
  2,920 
  389 
  29,614 
  (39,297)
  19,958 
  (18,501)
Total comprehensive income / (loss) from discontinued operations
  (147)
  (11,190)
  27,944 
  147 
  11,202 
  (4,190)
  30,336 
  28,532 
Total comprehensive income / (loss) for the year
  (4)
  (333)
  30,864 
  536 
  40,816 
  (43,487)
  50,294 
  10,031 


Total comprehensive income / (loss) from continued operation attributable to:


Equity holders of the parent
  197 
  15,034 
  2,062 
  296 
  22,585 
  (34,685)
  15,972 
  (17,433)
Non-controlling interest
  (55)
  (4,177)
  858 
  92 
  7,029 
  (4,612)
  3,985 
  (1,068)


Total comprehensive income / (loss) attributable to:


Equity holders of the parent
  39 
  2,914 
  3,568 
  187 
  14,280 
  (40,421)
  19,040 
  1,538 
Non-controlling interest
  (43)
  (3,247)
  27,296 
  348 
  26,536 
  (3,066)
  31,254 
  8,493 


CASH FLOW DATA


Net cash generated by / (used in) operating activities
  44 
  3,362 
  10,467 
  440 
  33,495 
  29,111 
  21,983 
  20,380 
Net cash generated by / (used in) investing activities
  544 
  41,441 
  3,490 
  574 
  43,755 
  12,045 
  (32,870)
  (6,075)
Net cash generated by / (used in) financing activities
  (356)
  27,144 
  (35,239)
  (1,076)
  (81,952)
  (29,878)
  (6,634)
  5,311 


6


As of September 30,
 
 
For the fiscal year endedJune 30,


2020
 
 
2020
 
 
2019
 
 
2020
 
 
2020
 
 
2019
 
 
2018


(in millions of USD)(i)(ii)
 
 
(in millions of ARS)
 
 
(in millions of USD)(i)(ii)
 
 
(in millions of ARS)
 
CONSOLIDATED STATEMENT OF FINANCIAL POSITION


ASSETS


Non-current assets


Investment properties 
  2,185 
  166,478 
  244,966 
  3,216 
  244,966 
  359,056 
  389,643 
Property, plant and equipment 
  31 
  2,338 
  40,618 
  533 
  40,618 
  34,347 
  34,011 
Trading properties 
  17 
  1,328 
  5,228 
  69 
  5,228 
  8,436 
  15,916 
Intangible assets 
  16 
  1,186 
  29,911 
  393 
  29,911 
  27,563 
  29,679 
Right-of-use assets 
  8 
  621 
  21,379 
  281 
  21,379 
   
   
Other assets 


  37 
  452 
Investment in associates and joint ventures 
  167 
  12,718 
  80,089 
  1,051 
  80,089 
  47,841 
  62,040 
Deferred income tax assets 
  2 
  148 
  681 
  9 
  681 
  614 
  857 
Income tax and Minimum Presumed Income Tax credit 
  0 
  26 
  27 
  - 
  27 
  232 
  990 
Restricted assets 
   
   
  2,014 
  26 
  2,014 
  4,737 
  4,893 
Trade and other receivables 
  25 
  1,881 
  24,898 
  327 
  24,898 
  19,033 
  19,491 
Employee benefits 


Investments in financial assets 
  7 
  506 
  3,782 
  50 
  3,782 
  4,444 
  4,105 
Financial assets and other assets held for sale 


  6,428 
  18,642 
Derivative financial instruments 
   
   
  153  
  2  
  153  
  146  
   
Total non-current assets 
  2,458 
  187,230 
  453,746 
  5,956 
  453,746 
  512,914 
  580,719 
Current Assets


Trading properties 
  3 
  218 
  2,493 
  33 
  2,493 
  563 
  7,843 
Inventories 
  1 
  65 
  5,041 
  66 
  5,041 
  1,765 
  1,508 
Restricted assets 
  0 
  8 
  6,684 
  88 
  6,684 
  6,741 
  10,160 
Income tax credit 
  1 
  105 
  331 
  4 
  331 
  600 
  953 
Group of assets held for sale 
   
   
  44,868 
  589 
  44,868 
  12,378 
  12,427 
Trade and other receivables 
  66 
  4,998 
  39,986 
  525 
  39,986 
  34,687 
  35,789 
Investments in financial assets 
  44 
  3,378 
  20,922 
  275 
  20,922 
  49,573 
  61,015 
Financial assets and other assets held for sale 
   
   
  3,636 
  48 
  3,636 
  17,942 
  10,690 
Derivative financial instruments 
  0 
  16 
  227 
  3 
  227 
  63 
  208 
Cash and cash equivalents 
  58  
  4,397  
  97,276  
  1,277  
  97,276  
  93,060  
  89,326  
Total Current Assets 
  173  
  13,185  
  221,464  
  2,907  
  221,464  
  217,372  
  229,919  
TOTAL ASSETS 
  2,631 
  200,415 
  675,210 
  8,863 
  675,210 
  730,286 
  810,638 
SHAREHOLDERS’ EQUITY


Shareholders’ equity attributable to equity holders of the parent


Share capital 
  8 
  575 
  575 
  8 
  575 
  575 
  575 
Treasury stock 
  0 
  4 
  4 
  0 
  4 
  4 
  4 
Inflation adjustment of share capital and treasury stock 
  192 
  14,613 
  14,613 
  192 
  14,612 
  14,612 
  14,612 
Share premium 
  205 
  15,653 
  15,653 
  205 
  15,653 
  15,653 
  15,653 
Additional paid-in capital from treasury stock 
  1 
  104 
  102 
  1 
  101 
  83 
  83 
Legal reserve 
  7 
  522 
  522 
  7 
  522 
  522 
  522 
Special reserve 
  133 
  10,124 
  10,124 
  133 
  10,121 
  10,121 
  10,121 
Other reserves 
  113 
  8,603 
  6,345 
  83 
  6,348 
  73,257 
  5,284 
Retained earnings 
  265  
  20,177  
  13,562  
  179  
  13,564  
  (65,475)
  47,517  
Total capital and reserves attributable to equity holders of the parent
  924 
  70,375 
  61,500 
  807 
  61,500 
  49,352 
  94,371 
Non-controlling interest 
  307  
  23,364  
  70,544  
  926  
  70,544  
  82,692  
  89,519  
TOTAL SHAREHOLDERS’ EQUITY 
  1,230 
  93,739 
  132,044 
  1,733 
  132,044 
  132,044 
  183,890 
LIABILITIES


Non-current liabilities


Trade and other payables 
  23 
  1,745 
  2,335 
  30 
  2,335 
  2,697 
  8,653 
Lease liabilities 
  8 
  586 
  14,400 
  189 
  14,400 
   
   
Borrowings 
  420 
  31,967 
  320,616 
  4,209 
  320,616 
  410,853 
  433,369 
Derivative financial instruments 
  0 
  29 
  59 
  1 
  59 
  1,582 
  57 
Deferred income tax liabilities 
  553 
  42,121 
  47,408 
  622 
  47,408 
  56,616 
  63,538 
Employee benefits 
   
   
  481 
  6 
  481 
  202 
  263 
Salaries and social security liabilities 
  0 
  33 
  210 
  3 
  210 
  169 
  160 
Provisions 
  2  
  145  
  3,297  
  43  
  3,297  
  12,329  
  8,495  
Total non-current liabilities 
  1,006 
  76,626 
  388,806 
  5,104 
  388,806 
  484,448 
  514,535 
Current liabilities


Trade and other payables 
  66 
  5,007 
  31,943 
  419 
  31,943 
  28,559 
  35,276 
Lease liabilities 
   
   
  23,912 
  314 
  23,912 
  8,759 
  7,763 
Group of liabilities held for sale 
  2 
  139 
  5,242 
  69 
  5,242 
   
   
Salaries and social security liabilities 
  3 
  235 
  4,419 
  57 
  4,419 
  3,241 
  3,725 
Borrowings 
  321 
  24,471 
  84,338 
  1,107 
  84,338 
  70,014 
  61,246 
Derivative financial instruments 
  1 
  60 
  1,206 
  16 
  1,206 
  38 
  434 
Provisions 
  1 
  108 
  2,627 
  34 
  2,627 
  2,651 
  2,520 
Income tax and minimum presumed income tax (“MPIT”) liabilities
  0  
  30  
  673  
  9  
  673  
  532  
  1,249  
Total current liabilities 
  394  
  30,050  
  154,360  
  2,026  
  154,360  
  113,794  
  112,213  
TOTAL LIABILITIES 
  1,400  
  106,676  
  543,166  
  7,130  
  543,166  
  598,242  
  626,748  
TOTAL SHAREHOLDERS’ EQUITY AND LIABILITIES 
  2,631 
  200,415 
  675,210 
  8,863 
  675,210 
  730,286 
  810,638 


7


As of and for the three months ended September 30,
 
 
As of and for the fiscal year endedJune 30,


2020
 
 
2020
 
 
2019
 
 
2020
 
 
2020
 
 
2019
 
 
2018


(in millions of USD)(i)(ii)
 
 
(in millions of ARS)(except for number of shares, per share and GDS data and ratios)
 
 
(in millions of USD)(i)(ii)
 
 
(in millions of ARS)(except for number of shares, per share and GDS data and ratios)
 
OTHER FINANCIAL DATA


Basic net (loss)/ income per common share from continuing operations(1)
  0.15 
  11.50 
  7.84 
  0.35 
  26.66 
  (68.55)
  39.39 
Diluted net (loss)/ income per common share from continuing operations(2)
  0.15 
  11.42 
  7.84 
  0.35 
  26.50 
  (68.55)
  39.16 
Basic net (loss)/ income per GDS from continuing operations(1) (3) 
  1.51 
  115.00 
  78.40 
  3.50 
  266.60 
  (685.50)
  393.90 
Diluted net (loss)/ income per GDS from continuing operations(2) (3)
  1.50 
  114.20 
  78.40 
  3.48 
  265.00 
  (685.50)
  391.60 
Basic net (loss)/ income per common share 
  0.27 
  20.31 
  0.43 
  0.50 
  38.35 
  (60.86)
  28.17 
Diluted net (loss)/ income per common share 
  0.26 
  20.17 
  0.43 
  0.50 
  38.12 
  (60.86)
  28.17 
Basic net (loss)/ income per GDS 
  2.67 
  203.10 
  4.30 
  5.03 
  383.50 
  (608.60)
  281.73 
Diluted net (loss)/ income per GDS 
  2.65 
  201.70 
  4.30 
  5.00 
  381.20 
  (608.60)
  281.73 
Diluted weighted – average number of common shares 
  578,676,471 
  578,676,471 
  578,676,471 
  578,676,471 
  578,676,471 
  578,676,471 
  578,676,471 
Depreciation and amortization 
  2 
  122 
  119 
  7 
  519 
  402 
  324 
Capital expenditures 
  16 
  1,202 
  3,459 
  156 
  11,896 
  20,191 
  20,523 
Working capital 
  (221)
  (16,865)
  67,104 
  881 
  67,104 
  103,578 
  117,706 
Ratio of current assets to current liabilities 
  0.01 
  0.44 
  1.43 
  0.02 
  1.43 
  1.91 
  2.05 
Ratio of shareholders’ equity to total liabilities 
  0.01 
  0.88 
  0.24 
  0.00 
  0.24 
  0.22 
  0.29 
Ratio of non-current assets to total assets 
  0.01 
  0.93 
  0.67 
  0.01 
  0.67 
  0.70 
  0.72 
Dividend paid 


  3 
  239 
   
  (1,106)
Dividends per common share 


  0.01 
  0.42 
   
  (1.92)
Dividends per GDS 


  0.05 
  4.16 
   
  (19.20)
Number of common shares outstanding 
  576,056,589 
  576,056,589 
  574,940,605 
  576,056,589 
  576,056,589 
  574,940,605 
  575,421,864 
Capital Stock 
  575 
  575 
  575 
  575 
  575 
  575 
  575 
 
(i) 
Totals may not sum due to rounding.
(ii) 
Solely for the convenience of the reader we have translated peso amounts into U.S. dollars at the seller exchange rate quoted by Banco de la Nación Argentina as of September 30, 2020, which was ARS 76.18 per USD 1.00. We make no representation that the peso or U.S. dollar amounts actually represent, could have been or could be converted into U.S. dollars at the rates indicated, at any particular rate or at all. See “Local Exchange Market and Exchange Rates.” Totals may not sum due to rounding.
(1) 
Basic net income per share is calculated by dividing the net income available to holders of common shares for the period / year by the weighted average number of shares outstanding during the period / year.
(2) 
Diluted net income per share is calculated by dividing the net income for the year by the weighted average number of ordinary shares including treasury shares.
(3) 
Determined by multiplying the amounts per share by ten (one GDS is equal to ten common shares). Dividend amounts, corresponding to fiscal years ending on June 30 of each year, are determined by the annual shareholders’ meeting, which takes place in October of each year.
 
 LOCAL EXCHANGE MARKET AND EXCHANGE RATES
 
The Argentine government has established a series of exchange control measures that restrict the free disposition of funds and the transfer of funds abroad. These measures significantly curtail access to the foreign exchange market Mercado Único y Libre de Cambios (“MULC”) by both individuals and private sector entities. This makes it necessary, among other things, to obtain prior approval from the Banco Central de la República Argentina (the “Central Bank”) to enter into certain foreign exchange transactions such as payments relating to royalties, services or fees payable to related parties of Argentine companies outside Argentina. For more information about exchange controls see, “Item 10. Additional Information—D. Exchange Controls” in our 2020 Form 20-F.
 
The following table shows the maximum, minimum, average and closing exchange rates for each applicable period to purchases of U.S. dollars.


Maximum(1)(2)
 
 
Minimum(1)(3)
 
 
Average(1)(4)
 
 
At closing(1)
 
Fiscal year ended:


June 30, 2018 
  28.8000 
  16.7500 
  19.4388 
  28.8000 
June 30, 2019 
  45.8700 
  27.1600 
  37.8373 
  42.3630 
June 30, 2020 
  70.3600 
  41.5000 
  59.5343 
  70.3600 
Month ended:


July 31, 2020 
  72.2200 
  70.4200 
  71.3795 
  72.2200 
August 31, 2020 
  74.0800 
  72.4200 
  73.1980 
  74.0800 
September 30, 2020 
  76.0800 
  74.1500 
  75.1036 
  76.0800 
October 30, 2020 
  78.2200 
  76.1500 
  77.4843 
  78.2200 
November 30, 2020 
  81.2100 
  78.5900 
  79.0814 
  81.2100 
December 2020
  84.0500 
  81.3300 
  82.5383 
  84.0500 
January 4, 2021 (through January 4, 2021)
  84.6000 
  84.6000 
  84.6000 
  84.6000 
 
Source: Banco de la Nación Argentina
(1) 
Average between the offer exchange rate and the bid exchange rate according to Banco de la Nación Argentina’s foreign currency exchange rate.
(2) 
The maximum exchange rate appearing in the table was the highest end-of-month exchange rate in the year or shorter period, as indicated.
(3) 
The minimum exchange rate appearing in the table was the lowest end-of-month exchange rate in the year or shorter period, as indicated.
(4) 
Average exchange rates at the end of the month.


8
 
 
 INFORMATION ON THE COMPANY
 
History and Development of the Company
 
General Information
 
Our legal and commercial name is IRSA Inversiones y Representaciones Sociedad Anónima. We were incorporated and organized on April 30, 1943, under Argentine law as a stock corporation (sociedad anónima), and we were registered with the Public Registry of Commerce of the City of Buenos Aires (Inspección General de Justicia or “IGJ”) on June 23, 1943, under number 284, on page 291, book 46 of volume A. Pursuant to our bylaws, our term of duration expires on April 5, 2043.
 
Our common shares are listed and traded on the Bolsas y Mercados Argentinos (“BYMA”) and our GDSs representing our common shares are listed on the New York Stock Exchange (“NYSE”). Our headquarters are located at Carlos M. Della Paolera 261, 9th Floor, Ciudad Autónoma de Buenos Aires (C1091AAQ), Argentina. Our telephone is +54 (11) 4323-7400. Our website is www.irsa.com.ar. Information contained in or accessible through our website is not a part of this Form 6-K.
 
We assume no responsibility for the information contained on these sites. Our depositary agent for the GDSs in the United States is The Bank of New York Mellon whose address is 240 Greenwich Street, New York, NY 10286, and whose telephone numbers are +1-888-BNY-ADRS (+1-888-269-2377) for U.S. calls and +1-201-680-6825 for calls outside U.S.
 
History
 
From our Operations Center in Argentina we manage our businesses in Argentina and our international investment in Condor Hospitality Trust, Inc., a hotel-focused real estate investment trust (“Condor”).
 
In July 1994, we acquired a controlling interest in IRSA CP, our main subsidiary in the Operation Center in Argentina, and in January 14, 2010, we acquired from Parque Arauco S.A. a 31.6% stake in IRSA CP. Consequently, we increased our shareholding in IRSA CP to 94.9%. On October 27, 2017, we completed the sale in the secondary market of 2,560,000 ADSs of IRSA CP, which represented 8.1% of IRSA CP. As of June 30, 2020, our holding in IRSA CP was 80.65%, and as of November 30, 2020, after the dividend payment in kind with IRSA CP shares, our holdingin IRSA CP was 79.92%.
 
Shopping Malls (through our subsidiary IRSA CP)
 
We are engaged in the acquisition, development and management of Shopping Malls through our subsidiary IRSA CP and its subsidiaries.
 
Since 1996, we have expanded our real estate activities in the shopping mall segment, through the acquisition and development of shopping malls.
 
As of June 30, 2020, through our subsidiary IRSA CP, we own 15 shopping malls in Argentina: Alto Palermo, Abasto Shopping, Alto Avellaneda, Alcorta Shopping, Patio Bullrich, Dot Baires Shopping, Soleil Premium Outlet, Distrito Arcos, Alto NOA Shopping, Alto Rosario Shopping, Mendoza Plaza Shopping, Córdoba Shopping Villa Cabrera, La Ribera Shopping, Alto Comahue Sopping and Patio Olmos (operated by a third party), totaling 333,062 sqm.
 
Offices (through our subsidiary IRSA CP)
 
We own, develop and manage office buildings throughout Argentina, directly and indirectly through our subsidiary IRSA CP.
 
During 2005, attractive prospects in office business led us to make an important investment in this segment by acquiring Bouchard 710 building in fiscal year 2005, covering 15,014 sqm of rentable premium space. On July 30, 2020, our subsidiary IRSA CP sold an unrelated third party of the entire building, located at Plaza Roma, in the City of Buenos Aires, for a total amount of USD 87.2 million approximately.
 
During 2007, we made several significant acquisitions in the Offices segment. We purchased Bouchard Plaza building, also known as “Edificio La Nación,” located in the downtown of the City of Buenos Aires, and during 2015, we completed the sale of all of the floors in Edificio La Nación. In 2007, we also bought Dock del Plata building with a gross leasable area of 7,921 sqm, located in the exclusive area of Puerto Madero, already sold in its entirety, in December 2015. In addition, we acquired a 50% interest in an office building including current leases with a gross leasable area of 31,670 sqm, known as Torre BankBoston, which is located in Buenos Aires, and was designed by the recognized architect Cesar Pelli (who also designed the World Financial Center in New York and the Petronas Towers in Kuala Lumpur).
 
In 2007, through Panamerican Mall S.A., subsidiary of IRSA CP, we started the construction of one of our most important projects called “Polo Dot,” a Shopping Mall, an Office Building and different plots of land to develop three additional office buildings (one of them may include a hotel). This project is located in Saavedra neighborhood, at the intersection of Avenida General Paz and the Panamerican Highway. First, the Shopping Mall Dot Baires was developed and opened on May, 2009 and then the Office Building was opened in July 2010, which meant our landing on the growing corridor of rental offices located in the North Zone of Buenos Aires. In addition, on June 5, 2017, the Company through IRSA CP, reported the acquisition of the historic Philips Building, adjacent to the Dot Baires Shopping Mall, located in Saavedra neighborhood in the City of Buenos Aires. It has 4 office floors, a total gross leasable area of approximately 7,755 sqm which has a remaining construction capacity of approximately 20,000 sqm. Likewise, through PAMSA, we developed the Zetta building, A+ and potentially LEED building, which was inaugurated on May, 2019, it has 11 office floors with a profitable area of 32,173 sqm, fully leased at the opening date.
 
In April 2008, we acquired one of the most emblematic building in the City of Buenos Aires, known as “Edificio República.” This property, also designed by the architect César Pelli, is a premium office building in the downtown area of the City of Buenos Aires, which added approximately 19,885 gross leasable sqm to our portfolio.
 
On December 22, 2014, we transferred to our subsidiary IRSA CP, 83,789 sqm of five buildings of our premium office portfolio and a reserve of land. The premium office buildings transferred included Edificio República, Torre Bank Boston, Edificio Intercontinental Plaza, Edificio Bouchard 710 and Edificio Suipacha and the land reserve “Intercontinental II” with the potential to develop up to 19,600 sqm, each located in the City of Buenos Aires. The acquisition was carried out as part of our strategy to expand our business of developing and operating commercial properties in Argentina and to create a unique and unified portfolio of rental properties consisting of the best office buildings in the City of Buenos Aires and the best shopping malls in Argentina. The total value of the transaction was USD 308.0 million, based on third party appraisals.
 
As of September 30, 2020, we own 8 premium office buildings of rental office property totaling 93,144 sqm of gross leasable area. On November 5, 2020, our subsidiary IRSA CP sold four floors and fifteen parking spaces of the Boston Tower and on November 12, 2020, it sold three floors and fifteen parking spaces of Boston Tower. For more information, see "Recent Developments – Boston Tower Floor’s sale" in our 2020 Form 20-F.
 
Sales and developments
 
Since 1996, we have also expanded our operations to the residential real estate market through the development and construction of apartment tower complexes in the City of Buenos Aires and through the development of private residential communities in the greater Buenos Aires.
 
We own an important 70-hectare property facing the Río de la Plata in the south of Puerto Madero, 10 minutes from downtown Buenos Aires, called “Solares de Santa María.” We are owners of this property in which we aim to develop an entrepreneurship for mixed purposes, i.e. our development project involves residential complexes as well as offices, stores, hotels, sports and sailing clubs, services areas with schools, supermarkets and parking lots. For more information regarding the status see “B. Business Overview - Sale and Development of Properties and Land Reserves - Mixed uses - Solares de Santa María – City of Buenos Aires.”
 
In March 2011, we bought the Nobleza Piccardo warehouse, through a subsidiary in which we have a 50% stake. This property is located in the city of San Martín, Province of Buenos Aires, and due to its size and location represents an excellent venue for the future development of different segments. The total plot area is 160,000 sqm. The master plan was carried out by the prestigious Gehl Studio (Denmark), generating a modern concept of a new urban district which is being carried out to a preliminary project / project phase through the Mc Cormack Architecture Studio and Associates and internal and external teams.
 
We are currently developing the project called “Polo Dot,” through PAMSA, subsidiary of IRSA CP, located in the commercial complex adjoining to Dot Baires Shopping Mall. The project will consist of three office buildings (one of them may include a hotel and recently opened Zetta building) on land reserves we own through IRSA CP and the expansion of Dot Baires Shopping by approximately 15,000 sqm of gross leasable area. In the first phase, we developed the Zetta building which was inaugurated on May 2019. The second stage of the project consists of two office/ hotel buildings that will add 38,400 sqm of GLA to the complex. We have noticed an important demand for premium office spaces in this new commercial center and we are confident that we will be able to generate a quality enterprise similar to the ones that the company has done in the past with attractive income levels and high occupancy.
 
Likewise, we are moving forward with the construction of Catalinas Building, which is expected to have approximately 35,000 sqm of gross leasable area consisting of 30 office floors and 316 parking spaces, and will be located in the “Catalinas” area in the City of Buenos Aires, one of the most sought after neighborhoods for premium office development in Argentina. IRSA CP acquired from us certain units in the building and owns 30,832 sqm consisting of 26 floors and 272 parking spaces in the building. On December 4, 2015, we sold to Globant 4,636 sqm corresponding to four office floors. Construction work started in late 2016, and is currently expected to be completed in approximately three years. IRSA CP reported with an unrelated third party the assignment and transfer of the right to deed with delivery of possession of two medium-height floors for a total area of approximately 2,430 sqm and 16 parking spaces units in the building. As of June 30, 2020, we had completed 95% of the construction work.
 
 
9
 
 
On March 22, 2018 we acquired through IRSA CP, directly and indirectly, 100% of a land of approximately 78,000 sqm of surface located in Camino General Belgrano, between 514 street, avenue 19 and 511 street, in La Plata, Province of Buenos Aires. The objective of this acquisition is to develop a mix uses project given that the land offers location and scale adequate characteristics for the commercial development in a place of great potential.
 
On July 2018, we acquired through IRSA CP “La Maltería S.A.,” a wholly-owned subsidiary of IRSA CP which is directly or indirectly controlled by the company in a 100%, a property of 147,895 sqm of surface and approximately 40,000 sqm of built surface known as “Maltería Hudson,” located in the intersection between Route 2 and Buenos Aires - La Plata highway, main connection route to the south of Greater Buenos Aires and the Atlantic Coast, in the City of Hudson, province of Buenos Aires. The purpose of this acquisition is the future development of a mixed-use project, with a total constructive capacity of approximately 177.000 sqm, given that the property has location and scale characteristics for a real estate development with great potential.
 
Hotels
 
In 1997, we entered the hotel market through the acquisition of a 50% interest in the Llao Llao Hotel near Bariloche Province of Rio Negro and 76.3% in the Intercontinental Hotel in the City of Buenos Aires. In 1998, we also acquired Libertador Hotel in the City of Buenos Aires and subsequently sold a 20% interest in it to an affiliate of Sheraton Hotels, and during the fiscal year 2019, we acquired the interest of 20% and reaching 100% of the capital of Hoteles Argentinos S.A.U and beginning to operate the hotel directly under the name “Libertador.”
 
International
 
In July 2008, we decided to expand internationally into the United States, taking advantage of certain investment opportunities generated after the global financial crisis. We acquired a 49% interest in Metropolitan 885 3rd Ave (“Metropolitan”), whose main asset is a 34-story building with 59,000 sqm of gross leasable area named Lipstick Building, located at 885 Third Avenue, New York. On August 7, 2020, as a consequence of negotiations conducted in the context of an increased lease price effective as of May 2020, Metropolitan signed an agreement with the owner of the Ground Lease to terminate the commercial relationship, leaving the administration of the building. For this reason, as of June 30, 2020, Metropolitan no longer recognizes the liability associated with the ground lease, as well as all the assets and liabilities associated with the building and the operation of the administration. For more information see “Recent Developments – Lipstick Building.”
 
In March 2012, we entered into an agreement with Supertel Hospitality Inc. whereby we invested approximately USD 20 million. In 1994, Supertel Hospitality Inc completed its initial public offering, and in 2015 changed its name to “Condor Hospitality Trust” (“Condor”). Condor is a REIT listed in Nasdaq focused on medium-class hotels located in various states of the United States of America, managed by various operators and franchises. As of June 30, 2020, we hold an 18.9% interest and voting rights in Condor. The Company entered into an agreement to sell such shares, whose sale process has been delayed. For more information see “Investment in Condor Hospitality Trust”
 
Others
 
Over the years, we have acquired 29.91% of Banco Hipotecario. Banco Hipotecario has historically been Argentina’s leading mortgage lender, provider of mortgage-related insurance and mortgage loan services.
 
Significant acquisitions, dispositions and development of business
 
Boston Tower Sale
 
On July 15, 2020, IRSA CP entered into a preliminary sale agreement (with delivery of possession) with respect to a medium-height floor from Boston tower located at Della Paolera 265, Catalinas district, City of Buenos Aires, covering a total area of approximately 1,063 sqm and 5 parking lots located in the building. The price of the transaction was ARS 477.7 million (USD 6.7 million), which has been paid in full.
 
On August 26, 2020, IRSA CP entered into a preliminary sale agreement (with delivery of possession) with respect to 5 floors from Boston tower located at Della Paolera 265, Catalinas district, City of Buenos Aires, covering a total area of approximately 6,235 sqm and 25 parking lots located in the building. The price of the transaction was ARS 2,562 million (USD 34.7 million), which has been paid in full.
 
Bouchard Sale
 
On July 30, 2020, IRSA CP sold the entire “Bouchard 710” building, located in the Plaza Roma district of the City of Buenos Aires. The tower has a gross leasable area of 15,014 sqm divided into 12 floors for office use and 116 parking lots. The price of the transaction was approximately ARS 6,300 million (USD 87 million), which has been paid in full.
 
Lipstick Building, New York, United States
 
On August 7, 2020, Metropolitan signed an agreement with the owner of the ground lease by which it terminated the relationship, leaving the administration of the building. For this reason, Metropolitan derecognized the liabilities associated with the ground lease, as well as all the assets and liabilities associated with the building and the administration of the building; and made an agreement with the owner of the ground lease that states that Metropolitan is completely released from responsibilities, except for (i) claims for liabilities prior to June 1, 2020 from people who have performed work or provided services in the building or to Metropolitan and (ii) claims from people who have had an accident on the property dated after August 7, 2020. The impact of this agreement was recognized in the Audited Consolidated Financial Statements.
 
Condor Merger Agreement
 
On July 19, 2019, Condor entered into a merger agreement with Nextponint Hospitality Trust. In accordance with the contractual terms, each Condor common share, with a par value of USD 0.01 per share, was canceled prior to the merger and became the right to receive a cash amount equivalent to USD 11.10 per share. ordinary action. Additionally, in accordance with the terms and conditions of the merger agreement, each Class E convertible share was automatically canceled and became the right to receive a cash amount equivalent to USD 10.00 per share. The closing of the transaction, which had been scheduled for March 23, 2020, did not occur.
 
On October 14, 2020, Condor entered into an agreement with Nextponint Hospitality Trust and some of its affiliates "(NHT Parties)" to resolve any and all claims between them related to the aforementioned merger agreement.
 
Under the agreement with NHT, the Parties will make three payments to Condor in three installments, with the last payment maturing on December 30, 2020 and for a total of USD 7.0 million.
 
As of September 30, 2020, the Company has 2,245,100 ordinary shares and 325,752 Series E shares of Condor.
 
Loss of control of IDBD
 
As described in “Presentation of Financial and Certain Other Information” on September 25, 2020, IRSA lost control of IDBD, deconsolidating the related assets and liabilities and reclassifying the operations from this operations center to discontinued operations.


10
 
 
  The following table details the net assets disposed of:


As of September 30, 2020
 
ASSETS


(In millions of ARS)
 
Investment properties                                                                                                          
  84,251 
Property, plant and equipment                                                                                                          
  34,396 
Trading properties                                                                                                          
  5,512 
Intangible assets                                                                                                          
  26,194 
Right-of-use assets                                                                                                          
  18,530 
Investments in associates and joint ventures                                                                                                          
  34,721 
Deferred income tax assets                                                                                                          
  407 
Income tax credit                                                                                                          
  305 
Restricted assets                                                                                                          
  6,021 
Trade and other receivables                                                                                                          
  50,669 
Investments in financial assets                                                                                                          
  22,680 
Derivative financial instruments                                                                                                          
  264 
Inventories                                                                                                          
  3,377 
Group of assets held for sale                                                                                                          
  39,441 
Cash and cash equivalents                                                                                                          
  104,164  
TOTAL ASSETS                                                                                                          
  430,932  
Borrowings                                                                                                          
  305,070 
Lease liabilities                                                                                                          
  16,984 
Deferred income tax liabilities                                                                                                          
  11,655 
Trade and other payables                                                                                                          
  22,782 
Income tax liabilities                                                                                                          
  427 
Provisions                                                                                                          
  5,085 
Employee benefits                                                                                                          
  447 
Derivative financial instruments                                                                                                          
  447 
Salaries and social security liabilities                                                                                                          
  3,173 
Group of liabilities held for sale                                                                                                          
  20,646  
TOTAL LIABILITIES                                                                                                          
  386,716  
TOTAL NET ASSETS                                                                                                          
  44,216  
Non-controlling interest                                                                                                          
  (43,846)
Result for loss of control                                                                                                          
  370  
Recycling of currency translation adjustment and other reserves                                                                                                          
  (3,252)
Total result for loss of control (*)                                                                                                          
  (2,882)
 
(*) included within discontinued operations
 
Recent Developments:
 
                Sale of Manibil
 
            On December 22, 2020, IRSA reported that it had sold and transferred 217,332,873 ordinary Class B shares, nominative not endorsable, with a nominal value of ARS 1 and entitled to one vote per share owned by IRSA, representing 49% of the stock capital of Manibil S.A., a company dedicated to real estate developments. The price for the sale of the shares amounts to ARS 576,974,387.50. After this transaction, IRSA is no longer a shareholder of Manibil S.A. As a repayment of the sale price of the shares, the Company received rights to acquire future real estate assets from Manibil. 
 
Change of Corporate Headquarters
 
On December 21 2020, IRSA reported that the Company has moved its offices from Bolívar 108, 1st Floor, City of Buenos Aires, to Carlos Della Paolera 261, 9th Floor, City of Buenos Aires. On December 9, 2020, IRSA CP reported that it has moved its offices from Moreno 877, 22 Floor, City of Buenos Aires, to Carlos Della Paolera 261, 8th Floor, City of Buenos Aires.
 
Termination of Contract with SP
 
IRSA reported that on November 25, 2020, they requested the termination of the rating services provided by Standard & Poor’s (“Standard & Poor’s”) to IRSA on a global scale and on a national scale for Argentina, given the repayment and cancellation of all of the Company’s New York-law governed debt securities. The Company had no disagreements with respect to the methodology used by Standard & Poor’s. The rating of the Company’s debt securities on a national scale undertaken by Fix SCR S.A. continues to be in force. Fix SCR S.A. is affiliated with Fitch Ratings.
 
Change of Company’s corporate headquarters –IRSA CP
 
On December 9, 2020, IRSA CP reported that the Company has moved its offices from Moreno 877, 22 Floor, City of Buenos Aires, to Carlos Della Paolera 261, 8 Floor, City of Buenos Aires.
 
Shareholders’ Meeting– IRSA CP
 
On December 9, 2020, IRSA CP’s informs that the Shareholders’ Meeting has resolved to move its corporate headquarters from Moreno 877 to Carlos Della Paolera 261.
 
Business Overview
 
Operations and principal activities
 
Founded in 1943, IRSA Inversiones y Representaciones Sociedad Anónima is one of Argentina’s leading real estate companies and the only Argentine real estate company whose shares are listed both on BYMA and on the NYSE.
 
We are engaged, directly and indirectly through subsidiaries and joint ventures, in a range of diversified activities, primarily in real estate, including:
 
i. the acquisition, development and operation of shopping malls,
 
ii. the acquisition and development of office buildings and other non-shopping mall properties primarily for rental purposes,
 
iii. the development and sale of residential properties,
 
iv. the acquisition and operation of luxury hotels,
 
v. the acquisition of undeveloped land reserves for future development or sale, and
 
vi. selective investments outside Argentina.
 
We operate our business in Argentina through seven segments, namely “Shopping Malls,” “Offices” “Sales and Developments,” “Hotels,” “International” and “Corporate” and “Others” as further described below:
 
Our “Shopping Malls” segment includes the operating results from our portfolio of shopping malls principally comprised of lease and service revenue from tenants. Our Shopping Malls segment had assets of ARS 54,406 million and ARS 55,279 million as of September 30, 2020 and 2019, respectively, representing 29.41% and 29.88% of our operating assets for the Operations Center in Argentina at such dates, respectively. Our Shopping Malls segment generated operating income of ARS 986 million and of ARS 2,082 million for the three-month periods ended September 30, 2020 and 2019, respectively.
 
Our “Offices” segment includes the operating results from lease revenues of offices, other rental spaces and other service revenues related to the office activities. Our Offices segment had assets of ARS 72,262 million and ARS 40,970 million as of September 30, 2020 and 2019, respectively, representing and 39.06% and 22.14% of our operating assets for the Operations Center in Argentina at such dates, respectively. Our Offices segment generated an operating income of ARS 13,483 million and of ARS 7,413 million for the three-months periods ended September 30, 2020 and 2019, respectively.
 
Our “Sales and Developments” segment includes the operating results of the development, maintenance and sales of undeveloped parcels of land and/or trading properties. Real estate sales results are also included. Our Sales and Developments segment had assets of ARS 45,273 million and ARS 36,352 million as of September 30, 2020 and 2019, respectively, representing 24.47% and 19.65% of our operating assets for the Operations Center in Argentina. Our Sales and Developments segment generated an operating income of ARS 9,661 million and of ARS 5,045 million for the three-month periods ended September 30, 2020 and 2019, respectively, without considering the share of profit of associates and joint ventures.
 
Our “Hotels” segment includes the operating results of our hotels mainly comprised of room, catering and restaurant revenues. Our Hotels segment had assets of ARS 1,954 million and ARS 2,155 million as of September 30, 2020 and 2019, respectively, representing 1.06% and 1.16% of our operating assets for the Operations Center in Argentina, respectively. Our Hotels segment generated an operating loss of ARS 191 million and an operating income of ARS 84 million for the three-month periods ended September 30, 2020 and 2019, respectively.
 
 
11
 
 
Our “International” segment includes investments that mainly operate in the United States in relation to the lease of office buildings and hotels in that country. We intend to continue evaluating investment opportunities outside Argentina as long as they are attractive investment and development options. Our International segment had assets of ARS 1,884 million and net liabilities of ARS 9,269 million as of September 30, 2020 and 2019, respectively. Our International segment generated operating income of ARS 11 million an operating loss of ARS 43 million for the three-month periods ended September 30, 2020 and 2019, respectively.
 
Our “Corporate” segment. Since fiscal year 2019, we have decided to disclose certain corporate expenses related to the holding structure in a separate “Corporate” segment. This segment generated a loss of ARS 74 million and ARS 88 million during the three-month periods ended September 30, 2020 and 2019, respectively.
 
Our “Others” Segment includes the entertainment activities through La Arena and La Rural S.A. and the financial activities carried out by Banco Hipotecario for both years and Tarshop S.A. (“Tarshop”) just for 2020. Our “Others” segment had assets of ARS 9,241 million and ARS 7,357 million as of September 30, 2020 and 2019, respectively, representing 4.99 and 3.98% of our operating assets for the Operations Center in Argentina, respectively. Our Others segment generated an operating income of ARS 492 million and of ARS 257 million for the three-month periods ended September 30, 2020 and 2019, respectively, without considering share of profit of associates and joint ventures.
 
Our “Shopping Malls” segment includes the operating results from our portfolio of shopping malls principally comprised of lease and service revenue from tenants. Our Shopping Malls segment had assets of ARS 53,165 million and ARS 54,277 million as of June 30, 2020 and 2019, respectively, representing 31.2% and 45.2% of our operating assets for the Operations Center in Argentina at such dates, respectively. Our Shopping Malls segment generated operating income of ARS 1,818 million and an operating loss ARS 37,033 million for the fiscal years ended June 30, 2020 and 2019, respectively.
 
Our “Offices” segment includes the operating results from lease revenues of offices, other rental spaces and other service revenues related to the office activities. Our Offices segment had assets of ARS 67,827 million and ARS 34,166 million as of June 30, 2020 and 2019, respectively, representing and 39.8% and 28.4% of our operating assets for the Operations Center in Argentina at such dates, respectively. Our Offices segment generated an operating income of ARS 27,099 million and of ARS 2,553 million for the fiscal years ended June 30, 2020 and 2019, respectively.
 
Our “Sales and Developments” segment includes the operating results of the development, maintenance and sales of undeveloped parcels of land and/or trading properties. Real estate sales results are also included. Our Sales and Developments segment had assets of ARS 36,018 million and ARS 30,558 million as of June 30, 2020 and 2019, respectively, representing 21.1% and 25.4% of our operating assets for the Operations Center in Argentina. Our Sales and Developments segment generated an operating income of ARS 12,694 million and of ARS 680 million for the fiscal years ended June 30, 2020 and 2019, respectively, without considering the share of profit of associates and joint ventures.
 
Our “Hotels” segment includes the operating results of our hotels mainly comprised of room, catering and restaurant revenues. Our Hotels segment had assets of ARS 1,979 million and ARS 2,075 million as of June 30, 2020 and 2019, respectively, representing 1.2% and 1.7% of our operating assets for the Operations Center in Argentina, respectively. Our Hotels segment generated an operating income of ARS 172 million and of ARS 725 million for the fiscal years ended June 30, 2020 and 2019, respectively.
 
Our “International” segment includes investments that mainly operate in the United States in relation to the lease of office buildings and hotels in that country. We intend to continue evaluating investment opportunities outside Argentina as long as they are attractive investment and development options. Our International segment had assets of ARS 2,488 million and net liabilities of ARS 7,484 million as of June 30, 2020 and 2019, respectively. Our International segment generated operating losses of ARS 119 million and ARS 129 million for the fiscal years ended June 30, 2020 and 2019, respectively.
 
“Corporate” segment. Since fiscal year 2019, we have decided to disclose certain corporate expenses related to the holding structure in a separate “Corporate” segment. This segment generated a loss of ARS 304 million and ARS 560 million during fiscal years 2020 and 2019, respectively.
 
                Our “Others” Segment includes the entertainment activities through La Arena and La Rural S.A. and the financial activities carried out by Banco Hipotecario for both years and Tarshop S.A. (“Tarshop”) just for 2019. Our “Others” segment had assets of ARS 8,902 million and ARS 6,510 million as of June 30, 2020 and 2019, respectively, representing 5.2% and 5.4% of our operating assets for the Operations Center in Argentina, respectively. Our Others segment generated an operating income of ARS 596 million and an operating loss of ARS 844 million for the fiscal years ended June 30, 2020 and 2019, respectively, without considering share of profit of associates and joint ventures.
 
Operations Center in Argentina
 
Shopping Malls
 
As of September 30, 2020, IRSA CP owned a majority interest in and operated, a portfolio of 15 shopping malls in Argentina, six of which are located in the City of Buenos Aires (Abasto, Alcorta Shopping, Alto Palermo Shopping, Patio Bullrich, Dot Baires Shopping and Distrito Arcos), two are located in the greater Buenos Aires area (Alto Avellaneda and Soleil Premium Outlet), and the rest are located in different provinces of Argentina (Alto Noa in the City of Salta, Alto Rosario in the City of Rosario, Mendoza Plaza in the City of Mendoza, Córdoba Shopping Villa Cabrera and Patio Olmos (operated by a third party) in the City of Córdoba, La Ribera Shopping in Santa Fe (through a joint venture) and Alto Comahue in the City of Neuquén).
 
The shopping malls we operate comprise a total of 333,345 sqm of GLA (excluding certain spaces occupied by hypermarkets which are not our tenants). Total tenant sales in our shopping malls, as reported by retailers, were ARS  75,321 million for fiscal year 2020 and ARS  101,665 million for fiscal year 2019, a decrease of 25.9% in real terms (+6.7% in nominal terms). The greatest impact of this drop was evidenced in the first quarter of the year because of the closure of operations due to the lockdown decreed in Argentina on March 20, 2020 as a consequence of COVID19. Tenant sales at our shopping malls are relevant to our revenues and profitability because it is an important factor in determining rent our tenants pay. Sales also affect tenant’s overall occupancy costs as a percentage of that tenant’s sales.
 
The following table shows certain information about IRSA CP’s shopping malls as of September 30, 2020:
 
Shopping malls
Date of acquisition/
development
Location
 
GLA (sqm)(1)
 
 
Number of stores
 
 
Occupancy rate(2)
 
 
Our ownership interest(3)
 
 
Rental revenue


(%)
 
 
(%)
 
 
(in million of ARS )
 
Alto Palermo 
Dec-97
City of Buenos Aires
  18,655 
  136 
  94.5 
  100 
  69 
Abasto Shopping(4)
Nov-99
City of Buenos Aires
  36,761 
  163 
  94.6 
  100 
  28 
Alto Avellaneda
Dec-97
Buenos Aires Province
  38,801 
  126 
  96.2 
  100 
  8 
Alcorta Shopping
Jun-97
City of Buenos Aires
  15,725 
  114 
  97.4 
  100 
  24 
Patio Bullrich 
Oct-98
City of Buenos Aires
  11,396 
  89 
  89.7 
  100 
  (7)
Dot Baires Shopping
May-09
City of Buenos Aires
  48,805 
  164 
  71.7 
  80 
  10 
Soleil Premium Outlet
Jul-10
Buenos Aires Province
  15,156 
  79 
  95.9 
  100 
  16 
Distrito Arcos 
Dec-14
City of Buenos Aires
  14,335 
  65 
  100.0 
  90 
  26 
Alto Noa Shopping
Mar-95
City of Salta
  19,313 
  85 
  96.6 
  100 
  31 
Alto Rosario Shopping(4)
Nov-04
City of Rosario
  33,682 
  140 
  98.3 
  100 
  83 
Mendoza Plaza Shopping
Dec-94
City of Mendoza
  43,123 
  127 
  96.0 
  100 
  39 
Córdoba Shopping
Dec-06
City of Córdoba
  15,361 
  104 
  98.1 
  100 
  29 
La Ribera Shopping
Aug-11
City of Santa Fé
  10,530 
  70 
  97.4 
  50 
  2 
Alto Comahue 
Mar-15
City of Neuquén
  11,702 
  95 
  93.9 
  99.95 
  67 
Patio Olmos(5) 
Sep-07
City of Córdoba


Total 
 
 
  333,345 
  1,557 
  92.8 
    
  425 
 
(1) 
Corresponds to gross leasable area in each property. Excludes common areas and parking spaces.
(2) 
Calculated dividing occupied sqm by leasable area as of the last day of the fiscal year.
(3) 
Company’s effective interest in each of its business units.
(4) 
Excludes Museo de los Niños (which represents 3,732 sqm in Abasto and 1,261 sqm in Alto Rosario).
(5) IRSA CP owns the historic building of the Patio Olmos shopping mall in the Province of Córdoba, operated by a third party and does not include the rental revenues of Patio Olmos, for more details see “Accumulated rental income”.


12
 
 
The following table shows information about IRSA CP’s future expansions on current assets as of September 30, 2020: 
 
Expansions
 
Ownership interest
 
 
Surface
 
Locations
 
 
(%)
 
 
(sqm)
 
 
Alto Palermo Adjoining Plot
  100 
  3,900 
City of Buenos Aires
Subtotal current expansions
    
  3,900 
 
Other future expansions(1)
    
  98,055 
 
Subtotal future expansions
    
  98,055 
 
Total Shopping Malls
    
  101,955 
 
Patio Bullrich - Offices / Hotel
  100 
  10,000 
City of Buenos Aires
Philips Building
  100 
  20,000 
City of Buenos Aires
Subtotal future expansions
    
  30,000 
 
Total offices
    
  30,000 
 
Total expansions
    
  131,955 
 
 
(1) Includes Alto Palermo, Paseo Alcorta, Alto Avellaneda, Soleil, Alto Noa, Alto Rosario, Mendoza, Córdoba y La Ribera Shopping
 
Rental income
 
The following table sets forth total rental income for each of IRSA CP’s shopping malls for the fiscal years indicated:


As of September 30,
 
 
For the fiscal years ended June 30,(1)


2020
 
 
2019
 
 
2020
 
 
2019
 
 
2018


(in millions of ARS)
 
Alto Palermo
  69 
  340 
  1,073 
  1,516 
  1,631 
Abasto Shopping
  28 
  312 
  919 
  1,412 
  2,196 
Alto Avellaneda
  8 
  213 
  646 
  1,015 
  1,140 
Alcorta Shopping
  24 
  171 
  573 
  746 
  791 
Patio Bullrich
  (7)
  101 
  332 
  434 
  458 
Dot Baires Shopping
  10 
  230 
  703 
  1,196 
  1,170 
Soleil Premium Outlet
  16 
  95 
  267 
  395 
  414 
Distrito Arcos
  26 
  174 
  494 
  680 
  667 
Alto Noa Shopping
  31 
  70 
  199 
  267 
  300 
Alto Rosario Shopping
  83 
  168 
  560 
  735 
  788 
Mendoza Plaza Shopping
  39 
  101 
  318 
  441 
  483 
Córdoba Shopping Villa Cabrera
  29 
  63 
  191 
  265 
  293 
La Ribera Shopping(2)
  2 
  21 
  64 
  94 
  99 
Alto Comahue
  67  
  108  
  406  
  451  
  389  
Subtotal
  425 
  2,167 
  6,742 
  9,646 
  10,823 
Patio Olmos(3)
  2 
  3 
  8 
  11 
  11 
Adjustments and eliminations(4)
  (58)
  (83)
  (362)  
  (463)
  (337)
Total
  369 
  2,087 
  6,389 
  9,195 
  10,496 
 
(1) Includes base rent, percentage rent, admission rights, fees, parking, commissions, revenue from non-traditional advertising and others. Does not include Patio Olmos.
(2) Through our joint venture Nuevo Puerto Santa Fé S.A.
(3) IRSA CP owns the historic building where the Patio Olmos shopping mall is located in the province of Cordoba. The property is managed by a third party.
(4) Includes indirect incomes and eliminations between segments. In 2019 and 2018, revenue from Buenos Aires Design are included. End of concession December 5, 2018.
 
The following table sets forth IRSA CP’s revenue from cumulative leases by revenue category for the fiscal years presented:


As of September 30,
 
 
For the fiscal year ended June 30,


2020
 
 
2019
 
 
2020
 
 
2019
 
 
2018


(in millions of ARS)
 
Base rent
  123 
  1,128 
  3,367 
  5,146 
  6,053 
Percentage rent
  63 
  499 
  1,584 
  1,915 
  2,006 
Total rent
  186 
  1,627 
  4,951 
  7,061 
  8,059 
Non-traditional advertising
  33 
  56 
  198 
  239 
  264 
Revenues from admission rights
  146 
  263 
  972 
  1,131 
  1,251 
Fees
  25 
  29 
  113 
  127 
  149 
Parking
  3 
  122 
  319 
  509 
  615 
Commissions
  29 
  56 
  167 
  346 
  462 
Other
  3  
  15  
  23  
  233  
  24  
Subtotal(1)
  425 
  2,168 
  6,742 
  9,646 
  10,823 
Patio Olmos
  2 
  2 
  8 
  11 
  11 
Adjustments and eliminations(2)
  (58)
  (83)
  (362)
  (463)
  (337)
Total
  369 
  2,087 
  6,389 
  9,195 
  10,496 
 
(1) Does not include Patio Olmos
(2) Includes indirect incomes and eliminations between segments. In 2019 and 2018, revenues from Buenos Aires Design are included. End of concession December 5, 2018.
 
Tenant retail sales
 
For the 2020 fiscal year, IRSA CP’s shopping mall tenants’ sales reached ARS  75,321 million, a decrease of 25.9% in real terms compared to the previous fiscal year (+6,7% in nominal terms).
 
Tenant sales at the shopping malls located in the City of Buenos Aires and Greater Buenos Aires recorded year-on-year decreases of 26.9% in real terms (+5.0% in nominal terms), up from ARS  70,411 million to ARS  51,464 million during fiscal year 2020, whereas shopping malls in the interior of Argentina decreased approximately 23.7% in real terms (+10.4% in nominal terms) in comparison with the previous fiscal year, from ARS  31,254 million to ARS  23,856 million during fiscal year 2020.
 
The following table sets forth the total retail sales of IRSA CP’s shopping mall tenants for the fiscal years indicated:


As of September 30,(1)
 
 
For the fiscal years ended June 30,(1)


2020
 
 
2019
 
 
2020
 
 
2019
 
 
2018


(in millions of ARS)
 
Alto Palermo
  127 
  3,116 
  9,191 
  12,472 
  13,783 
Abasto Shopping
  94 
  3,231 
  9,346 
  13,228 
  15,546 
Alto Avellaneda
  92 
  2,829 
  8,258 
  11,862 
  14,955 
Alcorta Shopping
  17 
  1,765 
  5,480 
  7,035 
  7,535 
Patio Bullrich
  168 
  1,193 
  3,728 
  4,622 
  4,177 
Buenos Aires Design(1)


  605 
  1,922 
Dot Baires Shopping
  83 
  2,390 
  7,341 
  10,137 
  12,863 
Soleil Premium Outlet
  184 
  1,377 
  3,814 
  5,443 
  6,098 
Distrito Arcos
  500 
  1,491 
  4,307 
  5,007 
  5,026 
Alto Noa Shopping
  653 
  1,099 
  3,739 
  4,491 
  5,425 
Alto Rosario Shopping
  1,230 
  2,509 
  7,783 
  9,997 
  11,152 
Mendoza Plaza Shopping
  1,226 
  1,971 
  6,075 
  7,969 
  9,412 
Córdoba Shopping Villa Cabrera
  506 
  771 
  2,396 
  3,261 
  3,856 
La Ribera Shopping(2)
  142 
  572 
  1,589 
  2,333 
  2,824 
Alto Comahue
  152  
  799  
  2,274  
  3,204  
  3,510  
Total
  5,174 
  25,113 
  75,321 
  101,665 
  118,083 
 
(1) Retail sales based upon information provided to us by retailers and prior owners. The amounts shown reflect 100% of the retail sales of each shopping mall, although in certain cases we own less than 100% of such shopping malls. Includes sales from stands and excludes spaces used for special exhibitions.
(2) End of concession term was December 5, 2018
(3) Owned by Nuevo Puerto Santa Fé S.A., in which we are a joint venture partner.
 
 
13
 
 
Total sales by type of business
 
The following table sets forth the retail sales of IRSA CP’s shopping mall tenants by type of business for the fiscal years indicated:


As of September 30,(1)
 
 
For the fiscal years ended June 30,(1)


2020
 
 
2019
 
 
2020
 
 
2019
 
 
2018


(in millions of ARS)
 
Department Store
  381 
  1,327 
  4,009 
  5,502 
  6,771 
Clothes and footwear
  2,477 
  13,575 
  41,203 
  56,492 
  61,600 
Entertainment
   
  1,047 
  2,311 
  3,408 
  3,665 
Home and decoration
  143 
  493 
  1,541 
  2,258 
  3,306 
Home Appliances
  452 
  3,065 
  8,494 
  11,387 
  13,020 
Restaurants
  939 
  3,140 
  10,764 
  12,744 
  13,947 
Miscellaneous
  23 
  296 
  866 
  1,213 
  1,274 
Services
  759  
  2,170  
  6,133  
  8,661  
  14,501  
Total
  5,174 
  25,113 
  75,321 
  101,665 
  118,083 
 
(1) Includes sales from stands and excludes spaces used for special exhibitions.
 
Occupancy rate
 
The following table sets forth the occupancy rate of IRSA CP’s shopping malls expressed as a percentage of gross leasable area of each shopping mall for the fiscal years indicated:


As of September 30,(1)
 
 
As of June 30,(1)


2020
 
 
2019
 
 
2020
 
 
2019
 
 
2018


(%)
 
Alto Palermo
  94.5 
  98.1 
  91.9 
  99.1 
  99.5 
Abasto Shopping
  94.6 
  97.7 
  94.9 
  98.7 
  99.1 
Alto Avellaneda
  96.2 
  99.1 
  97.4 
  98.6 
  98.9 
Alcorta Shopping
  97.4 
  98.1 
  97.3 
  97.9 
  99.8 
Patio Bullrich
  89.7 
  94.7 
  91.4 
  93.5 
  97.1 
Dot Baires Shopping
  71.7 
  75.6 
  74.6 
  74.5 
  99.5 
Soleil Premium Outlet
  95.9 
  98.9 
  97.1 
  99.0 
  97.7 
Distrito Arcos
  100.0 
  94.5 
  93.8 
  99.4 
  99.7 
Alto Noa Shopping
  99.6 
  97.2 
  99.0 
  99.5 
  96.8 
Alto Rosario Shopping
  98.3 
  99.8 
  97.2 
  99.6 
  99.5 
Mendoza Plaza Shopping
  96.0 
  95.0 
  97.8 
  97.3 
  98.3 
Córdoba Shopping Villa Cabrera
  98.1 
  99.9 
  95.4 
  99.3 
  100.0 
La Ribera Shopping
  97.4 
  95.7 
  99.0 
  94.6 
  94.9 
Alto Comahue
  93.9  
  96.9  
  96.2  
  96.2  
  94.4  
Total (1)
  92.8 
  94.3 
  93.2 
  94.7 
  98.5 
 
(1) As of September 30, 2020, the occupancy rate decreased mainly due to 12,600 sqm vacancy generated by Walmart in Dot Baires Shopping. Excluding this effect, the occupancy would have been 96.4%.
 
Rental price
 
The following table shows the annual average rental price per sqm of our shopping malls for the fiscal years indicated:


As of September 30,(1)
 
 
As of June 30,(1)


2020
 
 
2019
 
 
2020
 
 
2019
 
 
2018


(en ARS)
 
Alto Palermo
  1,570 
  12,722 
  38,255 
  55,615 
  62,034 
Abasto Shopping
  (82)
  6,230 
  17,412 
  27,113 
  36,409 
Alto Avellaneda
  (477)
  4,477 
  12,464 
  20,817 
  24,609 
Alcorta Shopping
  353 
  7,576 
  24,507 
  32,923 
  35,654 
Patio Bullrich
  (1,482)
  5,823 
  19,220 
  25,229 
  26,674 
Dot Baires Shopping
  (188)
  3,258 
  9,663 
  14,328 
  16,280 
Soleil Premium Outlet
  487 
  5,096 
  13,674 
  21,277 
  23,379 
Distrito Arcos
  1,450 
  10,203 
  26,975 
  39,130 
  39,393 
Alto Noa Shopping
  1,266 
  3,224 
  8,766 
  11,703 
  13,785 
Alto Rosario Shopping
  1,779 
  4,036 
  12,940 
  17,686 
  19,629 
Mendoza Plaza Shopping
  663 
  2,013 
  5,953 
  8,486 
  9,814 
Córdoba Shopping Villa Cabrera
  1,501 
  3,293 
  9,751 
  14,071 
  16,015 
La Ribera Shopping
  39 
  1,766 
  4,869 
  7,336 
  8,199 
Alto Comahue
  5,392 
  8,510 
  32,979 
  31,830 
  38,722 
 
(1) Corresponds to consolidated annual accumulated rental prices according to the IFRS divided by gross leasable sqm. Does not include revenues from Patio Olmos.
 
Lease expirations(1)(2)
 
Includes information as of June 30, 2020 due to the fact that, during the first quarter ended on September 30, 2020, a large portion of our shopping centers were unable to open to the public or did so with under sanitary restrictions, as provided by DNU 297/2020 and subsequent extensions, which made it impossible to renew expired rental contracts and/or to sign new contracts.
 
The following table sets forth the schedule of estimated lease expirations for our shopping malls for leases in effect as of June 30, 2020, assuming that none of our tenants exercises its option to renew or terminate its lease prior to expiration:


As of June 30, 2020
 
Agreements’ Expiration
 
Number of agreements(1)
 
 
Sqm to expire
 
 
Due to expire (%)
 
 
Total lease payments (in millions of ARS)(3)
 
 
Agreements (%)
 
Vacant Stores
  113 
  22,684 
  6.8 


Expired in-force
  246 
  53,600 
  16.1 
  486 
  18.4 
As of June 30, 2021
  424 
  68,355 
  20.5 
  763 
  28.9 
As of June 30, 2022
  383 
  48,719 
  14.6 
  589 
  22.3 
As of June 30, 2023
  278 
  38,916 
  11.7 
  418 
  15.8 
As of June 30, 2024 and subsequent years
  118  
  100,788  
  30.3  
  383  
  14.5  
Total
  1,562 
  333,062 
  100.0 
  2,639 
  100.0 
 
(1) Includes vacant stores as of June 30, 2020. A lease may be associated with one or more stores.
(2) Does not reflect our ownership interest in each property.
(3) The amount expresses the annual base rent as of June 30, 2020 of agreements due to expire.
 
Five largest tenants of the portfolio
 
Includes information as of June 30, 2020 due to the fact that, during the quarter ended on September 30, 2020, a large portion of our shopping centers were unable to open to the public or did so under sanitary restrictions, as provided by DNU 297/2020 and subsequent extensions, which made it impossible to renew expired rental contracts and/or to sign new contracts.
 
The five largest tenants of the portfolio (in terms of sales) account for approximately 16.6% of their gross leasable area as of June 30, 2020 and represent approximately 9.8% of the annual basic rent for the fiscal year ending on that date.
 
 
14
 
 
The following table describes our portfolio’s five largest tenants:
 
Tenant
Type of Business
 
Sales
 
 
Gross Leaseable Area
 
 
Gross Leaseable Area


(%)
 
 
(sqm)
 
 
(%)
 
Zara
Clothes and footwear
  7.5 
  10,771 
  3.2 
Falabella
Department store
  5.4 
  28,892 
  8.7 
Nike
Clothes and footwear
  4.0 
  7,610 
  2.3 
Fravega
Home appliances
  3.2 
  3,524 
  1.1 
Mc Donald’s
Restaurant
  2.5  
  4,400  
  1.3  
Total
 
  22.5 
  55,197 
  16.6 
 
New leases and renewals
 
Includes information as of June 30, 2020 due to the fact that, during the quarter ended on September 30, 2020, a large portion of our shopping centers were unable to open to the public or did so under sanitary restrictions, as provided by DNU 297/2020 and subsequent extensions, which made it impossible to renew expired rental contracts and / or to sign new contracts.
 
The following table shows certain information about IRSA CP’s leases agreement as of June 30, 2020:


Number of agreements renewed
 
 
Annual base rent (in millions of ARS)
 
 
Annual admission rights (in millions of ARS)
 
 
Average annual base rent per sqm (ARS)
 
 
Number of non-renewed agreements(1)
 
 
Non-renewed agreements(1) annual base rent amount (in millions of ARS)
 
Type of business


New and renewed
 
 
Former agreements


Clothing and footwear
  268 
  478 
  95 
  12,781 
  10,103 
  578 
  1,122 
Restaurant
  72 
  107 
  15 
  13,466 
  11,877 
  130 
  226 
Miscellaneous(2)
  56 
  112 
  26 
  6,741 
  25,798 
  147 
  318 
Home
  32 
  61 
  8 
  8,484 
  9,762 
  54 
  128 
Services
  28 
  47 
  4 
  8,636 
  10,927 
  12 
  59 
Entertainment
  11 
  19 
  0 
  1,224 
  1,455 
  14 
  73 
Supermarket
  1  
  5  
  0  
  1,222  
  2,950  
  1  
  9  
Total
  468 
  829 
  148 
  7,057 
  8,123 
  936 
  1,935 
 
(1) Includes vacant stores as of June 30, 2020. Gross leasable area with respect to such vacant stores is included under the type of business of the last tenant to occupy such stores.
(2) Miscellaneous includes anchor store.
 
Principal Terms of our Leases
 
Under the Civil and Commercial Code of Argentina, the term of our leases cannot exceed twenty years for the residential destination and fifty years for the other destinations.
 
Leasable space in our shopping malls is marketed through an exclusive arrangement with our wholly owned subsidiary and real estate broker Fibesa S.A., or “Fibesa.” We use a standard lease agreement for most tenants at our shopping malls, the terms and conditions of which are described below. However, our largest or “anchor” tenants generally negotiate better terms for their respective leases. No assurance can be given that lease terms will be as set forth in the standard lease agreement.
 
Rent amount specified in our leases generally is the higher of (i) a monthly Base Rent and (ii) a specified percentage of the tenant’s monthly gross sales in the store, which generally ranges between 3% and 12% of tenant’s gross sales. In addition, pursuant to the rent escalation clause in most of our leases, a tenant’s Base Rent generally increases between 18% and 28% on a semi-annually and cumulative basis from the thirteenth (13th) month of effectiveness of the lease. Although many of our lease agreements contain price adjustment provisions, these are not based on an official index nor do they reflect the inflation index. In the event of litigation, there can be no assurance that we will be able to enforce such clauses contained in our lease agreements. These terms and conditions have not been applied during a period when the shopping malls remained closed due to the Social, Preventive and Mandatory Isolation decreed by the government of Argentina as a result of the novel COVID-19 virus since IRSA CP decided to defer the billing and collection of the Base Rent until September 30, 2020, with some exceptions and IRSA CP alsos suspended collection of the collective promotion fund during the same period, prioritizing the long-term relationship with its tenants.
 
In addition to rent, we charge most of our tenants an admission right, which must be paid upon execution of the lease agreement and upon its renewal. The admission right is normally paid as a lump sum or in a small number of monthly installments. If the tenants pay this fee in installments, the tenants are responsible for paying the balance of any such unpaid amount if they terminate the lease prior to its expiration. In the event of unilateral termination and/or resolution for breach by the tenants, tenants will not be refunded their admission payment without our consent. We lease our stores, kiosks and spaces in our shopping malls through our wholly-owned subsidiary Fibesa. We charge our tenants a fee for the brokerage services, which usually amounts to approximately three months of the Base Rent plus the admission right.
 
We are responsible, except in the mall Distrito Arcos, for providing each unit within our shopping malls with electricity, a main telephone switchboard, central air conditioning and a connection to a general fire detection system. We also provide the food court tenants with sanitation and with gas systems connections. In Distrito Arcos, the connections are managed by the tenants. Each tenant is responsible for completing all necessary installations within its rental unit, in addition to paying direct related expenses, including electricity, water, gas, telephone and air conditioning. Tenants must also pay for a percentage of total expenses and general taxes related to common areas. We determine this percentage based on different factors. The common area expenses include, among others, administration, security, operations, maintenance, cleaning and taxes.
 
We carry out promotional and marketing activities to draw consumer traffic to our shopping malls. These activities are paid for with the tenants’ contributions to the Collective Promotion Fund, or “CPF,” which is administered by us. Tenants are required to contribute 15% of their rent (Base Rent plus Percentage Rent) to the CPF. We may increase the percentage tenants must contribute to the CPF with up to 25% of the original amount set forth in the corresponding lease agreement for the contributions to the CPF. We may also require tenants to make extraordinary contributions to the CPF to fund special promotional and marketing campaigns or to cover the costs of special promotional events that benefit all tenants. We may require tenants to make these extraordinary contributions up to four times a year provided that each extraordinary contribution may not exceed 25% of the tenant’s preceding monthly lease payment.
 
Each tenant leases its rental unit as a shell without any fixtures and is responsible for the interior design of its rental unit. Any modifications and additions to the rental units must be pre-approved by us. We have the option to charge the tenant for all costs incurred in remodeling the rental units and for removing any additions made to the rental unit when the lease expires. Furthermore, tenants are responsible for obtaining adequate insurance for their rental units, which must cover, among other things, damage caused by fire, glass breakage, theft, flood, civil liability and workers’ compensation.
 
Insurance
 
We and our subsidiary IRSA CP carry all-risk insurance for the shopping malls and other buildings covering property damage caused by fire, terrorist acts, explosion, gas leak, hail, storms and wind, earthquakes, vandalism, theft and business interruption. In addition, we carry liability insurance covering any potential damage to third parties or property caused by the conduct of our business throughout Argentina. We and our subsidiary IRSA CP are in compliance with all legal requirements related to mandatory insurance, including insurance required by the Occupational Risk Law (Ley de Riesgos del Trabajo), life insurance required under collective bargaining agreements and other insurance required by laws and executive orders. IRSA CP’s and our history of damages is limited to one single claim resulting from a fire in Alto Avellaneda Shopping in March 2006, which loss was substantially recovered from our insurers. These insurance policies contain specifications, limits and deductibles which we believe are adequate to the risks to which we are exposed in our daily operations. We and our subsidiary IRSA CP also maintain liability insurance covering the liability of our directors and corporate officers.
 
Control Systems
 
IRSA CP has computer systems equipped to monitor tenants’ sales (except stands) in all of its shopping malls. IRSA CP also conduct regular audits of our tenants’ accounting sales records in all of our shopping malls. Almost every store in its shopping malls has a point of sale that is linked to our main server. IRSA CP uses the information generated from the computer monitoring system to prepare statistical data regarding, among other things, total sales, average sales and peak sale hours for marketing purposes and as a reference for the internal audit. Most of its shopping mall lease agreements require the tenant to have its point of sale system linked to our server. During this fiscal year, we signed an agreement to renew our payment terminals with contactless technology (Clover).
 
 
15
 
 
Competition
 
We are the largest owner and operator of shopping malls, offices and other commercial properties in Argentina in terms of gross leasable area and number of rental properties. Given that most of our shopping malls are located in highly populated areas, there are competing shopping malls within, or in close proximity to, our targeted areas, as well as stores located on avenues or streets. The number of shopping malls in a particular area could have a material effect on our ability to lease space in our shopping malls and on the amount of rent that we are able to charge. We believe that due to the limited availability of large plots of land and zoning restrictions in the City of Buenos Aires, it is difficult for other companies to compete with us in areas through the development of new shopping malls. Our principal competitor is Cencosud S.A. which owns and operates Unicenter Shopping and the Jumbo hypermarket chain, among others.
 
The following table shows certain information concerning the most significant owners and operators of shopping malls in Argentina, as of June 30, 2020.
 
Entity
Shopping malls
Location
 
GLA
 
 
Marketshare(1)


(%)
 
IRSA CP
Alto Palermo
City of Buenos Aires
  18,655 
  1.44 
Abasto Shopping(2)
City of Buenos Aires
  36,761 
  2.83 
Alto Avellaneda
Province of Buenos Aires
  38,801 
  2.99 
Alcorta Shopping
City of Buenos Aires
  15,725 
  1.21 
Patio Bullrich
City of Buenos Aires
  11,396 
  0.88 
Dot Baires Shopping(4)
City of Buenos Aires
  48,805 
  3.75 
Soleil
Province of Buenos Aires
  15,156 
  1.17 
Distrito Arcos
City of Buenos Aires
  14,335 
  1.10 
Alto Noa(2)
City of Salta
  19,313 
  1.49 
Alto Rosario(3)
City of Rosario
  33,682 
  2.59 
Mendoza Plaza
City of Mendoza
  43,123 
  3.32 
Córdoba Shopping
City of Córdoba
  15,361 
  1.18 
La Ribera Shopping
City of Santa Fe
  10,530 
  0.81 
Alto Comahue
City of Neuquén
  11,702  
  0.90  
Subtotal
 
 
  333,345 
  25.64 
Cencosud S.A.
 
 
  277,203 
  21.33 
Other operators
 
 
  689,304  
  53.05  
Total
 
 
  1,299,852 
  100.00 
 
(1) Corresponding to gross leasable area in respect of total gross leaseable area. Market share is calculated dividing sqm over total sqm.
(2) Does not include Museo de los Niños (3,732 sqm).
(3) Does not include Museo de los Niños (1,261 sqm).
(4) Our interest in PAMSA is 80%:
Source: Argentine Chamber of Shopping Centers.
 
Seasonality
 
IRSA CP’s business is directly related with seasonality, affecting the level of our tenants’ sales. During summer holidays (January and February) our tenants’ sales reach their minimum level, whereas during winter holidays (July) and in December (Christmas) they reach their maximum level. Clothing stores generally change their collections in spring and autumn, positively affecting our shopping malls’ sales. Sales at discount prices at the end of each season are also one of the main sources of impact on our business.
 
Offices
 
According to Colliers International, as of September 30, 2020, the A+ and A office inventory is 1,827,742 sqm. The vacancy rate was steady at approximately 14.2% during the third quarter of 2020. These values indicate that the market is healthy in terms of its operations, allowing an optimum level of supply with robust values.
 
Compared to the previous quarter, the Premium Offices prices increased in the order of USD 25.5 per sqm compared to the previous quarter. The prices for A+ properties were USD 30.0 per sqm for the second quarter of 2020. In this context, Catalinas presents as the zone with higher prices per sqm, reaching an average of USD 29.2. Likewise, the industry reported a USD/m2 1.2 decreased in rental prices for A+ properties compared to the second quarter of 2020.
 
Management of office buildings
 
We generally act as the manager of the office properties in which we own an interest. We typically own the entire building or a substantial number of floors in the building. The buildings in which we own floors are generally managed pursuant to the terms of a condominium agreement that typically provides for control by a simple majority of the interests based on owned area. As building manager, we handle services such as security, maintenance and housekeeping, which are generally outsourced. The cost of the services is passed through to, and paid for by, the tenants, except in the case of our units that have not been leased, if any, for which we bear the cost. We market our leasable area through commissioned brokers or directly by us.
 
Leases
 
We usually lease our offices by using contracts with an average term between three to ten years. Contracts for the rental of office buildings and other commercial properties are generally stated in U.S. dollars. Rental rates for renewed periods are negotiated at market value.
 
Properties
 
The following table sets forth certain information regarding IRSA CP’s office buildings, as of September 30, 2020:
 
 
Date of acquisition/development
 
GLA (sqm)(1)
 
 
Occupancy rate(2)
 
 
Ownership interest
 
 
Total rental income for the three-month period ended September 30, 2020


(%)
 
 
(%)
 
 
(in thousands of ARS)
 
Offices


AAA & A buildings


República Building
Dec-14
  19,885 
  86.9 
  100 
  115,706 
Bankboston Tower(5)
Dec-14
  7,383 
  85.6 
  100 
  71,721 
Intercontinental Plaza(3)
Dec-14
  2,979 
  100.0 
  100 
  31,654 
Bouchard 710(6)
Dec-14
  - 
  - 
  100 
  31,066 
Dot Building
Nov-06
  11,242 
  84.9 
  80 
  55,714 
Zetta
Jun-19
  32,173 
  97.5 
  80 
  188,072 
Total AAA & A buildings
 
  73,662 
  91.6 
    
  493,933 
B buildings


Philips
Jun-17
  8,017 
  85.8 
  100 
  8,574 
Suipacha 652/64
Dec-14
  11,465 
  31.2 
  100 
  27,684 
Total B buildings
 
  19,482 
  53.6 
    
  36,258 
Total Offices
 
  93,144 
  83.7 
    
  530,191 
Other rental properties(4)


  10,150 
Total Offices and Others


  540,341 
 
(1) Corresponds to the gross leasable area of each property as of September 30, 2020. Excludes common areas and parking spaces.
(2) Calculated by dividing occupied sqm by leasable area as of September 30, 2020.
(3) We own 13.2% of the building that has 22,535 sqm of gross leasable area.
(4) Includes rental income from all those properties that are not buildings intended for rent, but that are partially or fully rented (Philips Deposit, Anchorena 665 and San Martin Plot)
(5) On November 5, 2020, our subsidiary IRSA CP sold four floors and fifteen parking spaces and on November 12, 2020, it sold three floors and fifteen parking spaces. For more information, see “Recent Developments – Boston Tower Floor’s sale.
(6) On July 30, 2020, IRSA CP sold the entire building. For more information see: “Recent Developments – Bouchard 710 Building sale.”
 
 
16
 
 
Occupancy rate
 
The following table shows our offices occupancy percentage(1) as of the end of fiscal years 2020, 2019 and 2018 and at the end of the three-month periods ended September 30, 2020 and 2019:


Occupancy rate (1)


As of September 30,
 
 
As of June 30,


2020
 
 
2019
 
 
2020
 
 
2019
 
 
2018


(%)


Offices:


República Building
  86.9 
  92.6 
  86.9 
  95.2 
  98.4 
Bankboston Tower (2)
  85.6 
  93.5 
  96.4 
  93.5 
  85.6 
Intercontinental Plaza
  100.0 
  100.0 
  100.0 
  100.0 
  100.0 
Bouchard 710(3)
   
  100.0 
  92.5 
  100.0 
  100.0 
Suipacha 652/64
  31.2 
  31.2 
  31.2 
  44.6 
  86.2 
DOT Building
  84.9 
  100.0 
  84.9 
  100.0 
  100.0 
Philips Building
  85.8 
  67.6 
  82.7 
  45.7 
  69.8 
Zetta Building
  97.5  
  97.5  
  97.5  
  97.5  
   
Total
  83.7 
  88.1 
  86.1 
  88.3 
  92.3 
 
(1) Leased sqm pursuant to lease agreements in effect as of June 30, 2020, 2019 and 2018 over gross leasable area of offices for the same fiscal years.
(2) On November 5, 2020, our subsidiary IRSA CP sold four floors and fifteen parking spaces and on November 12, 2020, it sold three floors and fifteen parking spaces. For more information, see “Recent Developments – Boston Tower Floor’s sale.
(3) On July 30, 2020, our subsidiary IRSA CP sold the entire building. For more information see: “Recent Developments – Bouchard 710 Building sale.”
 
Annual average income per surface area as of June 30, 2020, 2019 and 2018(1):


Income per sqm(1)


As of September 30,
 
 
As of June 30,


2020
 
 
2019
 
 
2020
 
 
2019
 
 
2018


(ARS/sqm)
 
República Building
  6,692 
  6,354 
  26,992 
  25,260 
  17,650 
Bankboston Tower(2)
  11,354 
  6,434 
  24,353 
  25,914 
  18,522 
Intercontinental Plaza
  10,626 
  2,127 
  14,607 
  16,578 
  18,438 
Bouchard 710(3)
   
  6,769 
  28,823 
  26,375 
  21,985 
Suipacha 652/64
  2,398 
  3,741 
  11,740 
  24,038 
  9,341 
Dot Building
  5,840 
  6,169 
  26,221 
  21,522 
  15,542 
Philips Building
  4,026 
  2,799 
  12,044 
  27,766 
  7,738 
Zetta Building
  5,998 
  8,270 
  26,114 
  17,144 
   
 
(1) Calculated by dividing annual rental income by the gross leasable area of offices based on our interest in each building as of June 30 for each fiscal period.
(2) On November 5, 2020, our subsidiary IRSA CP sold one four floors and fifteen parking spaces and on November 12, 2020, it sold three floors and fifteen parking spaces. For more information, see “Recent Developments – Boston Tower Floor’s sale.
(3) On July 30, 2020, our subsidiary IRSA CP sold the entire building. For more information see: “Recent Developments - Bouchard 710 Building sale”
 
New agreements and renewals
 
Includes information as of June 30, 2020 due to the fact that, during the quarter ended on September 30, 2020, a large portion of the offices were unable to open to the public or did so under sanitary restrictions, as provided by DNU 297/2020 and subsequent extensions, which made it impossible to renew expired rental contracts and / or to sign new contracts.
 
The following table sets forth certain Information on lease agreements as of June 30, 2020:
 
Building
 
Number of lease agreements(1)(5)
 
 
Annual rental price (In million of ARS) (2)
 
 
Rental price per new and renewed sqm(3)
 
 
Rental price per previous sqm (ARS)(3)
 
 
Number of lease agreements not renewed
 
 
Lease agreements not renewed Annual rental price (In million of ARS )(4)
 
Bouchard 710(6)


  1 
  14 
Bankboston Tower(7)
  2 
  34 
  1,891 
  1,933 
   
   
Republica Building
  3 
  133 
  1,703 
  1,777 
  2 
  25 
DOT Building
  1 
  17 
  882 
  851 
   
   
Philips Building
  3 
  35 
  896 


Suipacha 664
  1 
  25 
  1,046 
  1,046 
   
   
Total Offices
  10 
  244 
  1,369 
  1,206 
  3 
  39 
 
(1) Includes new and renewed lease agreements executed in FY 2019.
(2) Lease agreements in U.S. dollars converted to Pesos at the exchange rate prevailing in the first effective month of the agreement, multiplied by 12 months.
(3) Monthly value.
(4) Lease agreements in U.S. dollars converted to Pesos at the exchange rate prevailing in the last effective month of the agreement, multiplied by 12 months.
(5) It does not include lease agreements over parking spaces, antennas or terrace area.
(6) On July 30, 2020, our subsidiary IRSA CP sold the entire building. For more information see: “Recent Developments – Bouchard 710 Building sale”
(7) On July 15, 2020, our subsidiary IRSA CP sold one floor and five parking spaces and on August 26, 2020, our subsidiary IRSA CP sold five floors and twenty five parking spaces, on November 5, 2020, it sold four floor and fifteen parking spaces and on November 12, 2020, it sold four floors and fifteen parking spaces. For more information, see “Recent Developments – Boston Tower Floor’s sale - Signature of a Purchase ticket regarding Boston Tower floor with possession.”
 
Includes information as of June 30, 2020 due to the fact that, during the quarter ended on September 30, 2020, a large portion of the offices were unable to open to the public or did so under sanitary restrictions, as provided by DNU 297/2020 and subsequent extensions, which made it impossible to renew expired rental contracts and / or to sign new contracts.
 
The following table sets forth the schedule of estimated lease expirations for our offices and other properties for leases in effect as of June 30, 2020. This data is presented assuming that none of our tenants exercises its option to renew or terminate its lease prior to expiration (most leases have renewal clauses):
 
Expiration year
 
Number of leases due to expire(1)
 
 
Sqm of leases due to expire (sqm)(3)
 
 
Sqm of leases due to expire (%)
 
 
Annual rental income amount of leases due to expire (in million of ARS)(2)
 
 
Annual rental income amount of leases to expire (%)
 
As of September 30, 2020
  4 
  9,454 
  13 
  57 
  3 
As of June 30, 2021
  22 
  24,983 
  23 
  679 
  33 
As of June 30, 2022 and thereafter
  33 
  65,149 
  64 
  1,345 
  65 
Total
  59 
  99,586 
  100 
  2,081 
  100 
 
(1) Includes offices with leases that have not been renewed as of June 30, 2020.
(2) It does not include sqm used by IRSA CP.
(3) It does not include sqm or revenues from parking spaces.
 
Hotels
 
According to the Hotel Vacancy Survey (EOH) prepared by INDEC, at September 2020, overnight stays at hotel and parahotel establishments were estimated at 140 thousand, 96.3% shorter than the same month the previous year. Overnight stays by resident and nonresident travelers decreased by 95.4% and 99.4%, respectively. Total travelers who stayed at hotels during June were 47 thousand, a 97.2% decrease compared to the same month the previous year. The number of resident and nonresident travelers decreased by 96.5% and 99.7%, respectively. The Room Occupancy Rate in September was 80.9%, showing a sharp decrease compared to the same month the previous year. Moreover, the Bed Occupancy Rate for the same period was 95.1%, which represents a sharp decrease compared to September 2019.
 
Hotels segment has also been affected by the social, preventive, and mandatory isolation decreed by the Argentine government as of March 20, 2020, together with the closure of borders and the arrival of tourism. The Libertador hotel in the city of Buenos Aires and Llao Llao hotal in the province of Río Negro have been temporarily closed since that date and there is no certainty about their reopening and the reactivation of the sector; in turn, the Intercontinental Hotel in the City of Buenos Aires is working only under a contingency and emergency plan.
 
At the moment, there are no certainties about the opening of the social, preventive and mandatory isolation that motivates the reactivation of the sector. The perspectives of slow normalization and reopening place us at the end of the year or the beginning of next year.
 
Future confirmations on the relaxation of social isolation, the opening of airports for national and international flights, land borders and normal interprovincial traffic will contribute to the slow normalization. With the reopening, an initial occupancy is expected, oscillating between 5% and 15%, growing gradually.
 
The crisis in the sector has motivated palliative measures by national and provincial authorities, necessary measures that partially contribute to sustainability. In a complementary way, the management of each one of the hotels makes its best efforts to adapt operationally to the context.
 
 
17
 
 
As of September 2020, we kept our 76.34% interest in Intercontinental hotel, 100% interest in Libertador hotel and 50.00% interest in Llao Llao.
 
The following chart shows certain information regarding our luxury hotels:
 
Hotels
Date of Acquisition
 
IRSA’s Interest
 
 
Number of rooms
 
 
Occupancy (%)(1)
 
 
Average Price per Room ARS(2)
 
 
As of September 30,
 
 
Fiscal Year Sales as of June 30


2020
 
 
2019
 
 
2020
 
 
2019
 
 
2018


(in millions of ARS)
 
Intercontinental(3)
11/01/1997
  76.34%
  313 
  1.4 
  7,072 
  5 
  92 
  776 
  1,129 
  591 
Libertador(4) 
03/01/1998
  100%
  200 
  0 
  N/A 
  1 
  261 
  271 
  636 
  349 
Llao Llao(5) 
06/01/1997
  50.00%
  205 
  0 
  N/A 
  0 
  348 
  1,129 
  1,413 
  753 
Total 
 
    
  718 
  0.6 
  7,088 
  6 
  702 
  2,176 
  3,179 
  1,692 
 
(1) Accumulated average in the twelve-month period.
(2) Accumulated average in the twelve-month period.
(3) Through Nuevas Fronteras S.A.
(4) Through Hoteles Argentinos S.A.U.
(5) Through Llao Llao Resorts S.A.
 
Hotel Llao Llao, San Carlos de Bariloche, Province of Rio Negro
 
In June 1997 we acquired the Hotel Llao Llao from Llao Llao Holding S.A. Fifty percent is currently owned by the Sutton Group. The Hotel Llao Llao is located on the Llao Llao peninsula, 25 kilometers from the City of San Carlos de Bariloche, and it is one of the most important tourist hotels in Argentina. Surrounded by mountains and lakes, this hotel was designed and built by the famous architect Bustillo in a traditional alpine style and first opened in 1938. The hotel was renovated between 1990 and 1993 and has a total constructed surface area of 15,000 sqm and 158 original rooms. The hotel-resort also includes an 18-hole golf course, tennis courts, fitness facility, spa, game room and swimming pool. The hotel is a member of The Leading Hotels of the World, Ltd., a prestigious luxury hospitality organization representing 430 of the world’s finest hotels, resorts and spas. The Hotel Llao Llao is currently being managed by Compañía de Servicios Hoteleros S.A., operator, among others, of the Alvear Palace Hotel, a luxury hotel located in the Recoleta neighborhood of Buenos Aires. During 2007, the hotel was subject to an expansion and the number of suites in the hotel rose to 205 rooms.
 
Hotel Intercontinental, City of Buenos Aires
 
In November 1997, we acquired 76.34% of the Hotel Intercontinental. The Hotel Intercontinental is located in the downtown City of Buenos Aires neighborhood of Montserrat, near the Intercontinental Plaza office building. Intercontinental Hotels Corporation, a United States corporation, currently owns 23.66% of the Hotel Intercontinental. The hotel’s meeting facilities include eight meeting rooms, a convention center and a divisible 588 sqm ballroom. Other amenities include a restaurant, a business center, a sauna and a fitness facility with swimming pool. The hotel was completed in December 1994 and has 313 rooms.
 
Hotel Libertador, City of Buenos Aires
 
In March 1998 we acquired 100% of the Sheraton Libertador Hotel from Citicorp Equity Investment for an aggregate purchase price of USD 23 million. In March 1999, we sold a 20% interest in the Sheraton Libertador Hotel for USD 4.7 million to Hoteles Sheraton de Argentina.
 
During the fiscal year 2019, we acquired 20% of the shares of Hoteles Argentinos S.A.U. (“HASAU”), reaching 100% of the capital stock of HASAU and beginning to operate the hotel directly under the name “Libertador.” The hotel is located in downtown Buenos Aires. The hotel contains 193 rooms and 7 suites, eight meeting rooms, a restaurant, a business center, a spa and fitness facilities with a swimming pool.
 
Bariloche Plot, “El Rancho,” San Carlos de Bariloche, Province of Río Negro
 
On December 14, 2006, through our hotel operator subsidiary, Llao Llao Resorts S.A., we acquired a land covering 129,533 sqm of surface area in the City of San Carlos de Bariloche in the Province of Río Negro. The total price of the transaction was USD 7 million, of which USD 4.2 million were paid in cash and the balance of USD 2.8 million was financed by means of a mortgage to be paid in 36 monthly, equal and consecutive installments of USD 0.086 million each. The land is in the border of the Lago Gutiérrez, close to the Llao Llao Hotel in an outstanding natural environment and it has a large cottage covering 1,000 sqm of surface area designed by the architect Ezequiel Bustillo.
 
Sale and Development of Properties and Land Reserves
 
Residential Development Properties
 
The acquisition and development of residential apartment complexes and residential communities for sale is one of our core activities. Our development of residential apartment complexes consists of the new construction of high-rise towers or the conversion and renovation of existing structures such as factories or warehouses. In connection with our development of residential communities, we frequently acquire vacant land, develop infrastructure such as roads, utilities and common areas, and sell plots of land for construction of single-family homes. We may also develop or sell portions of land for others to develop complementary facilities such as shopping areas within residential developments.
 
In the fiscal year ended June 30, 2020, revenues from the development and sale of properties from the Operations Center in Argentina segment amounted to ARS 791 million, compared to ARS 1,205 million posted in the fiscal year ended June 30, 2019.
 
Construction and renovation works on our residential development properties are performed, under our supervision, by independent Argentine construction companies that are selected through a bidding process. We enter into turnkey contracts with the selected company for the construction of residential development properties pursuant to which the selected company agrees to build and deliver the development for a fixed price and at a fixed date. We are generally not responsible for any additional costs based upon the turnkey contract. All other aspects of the construction, including architectural design, are performed by third parties.
 
Another modality for the development of residential undertakings is the exchange of land for constructed sqm. In this way, we deliver undeveloped pieces of land and another firm is in charge of building the project. In this case, we receive finished sqm for commercialization, without taking part in the construction works.
 
 
18
 
 
The following table shows information about IRSACP’s land reserves as of September 30, 2020:


Ownership Interest (%)
 
Date of acquisition
 
Land Surface (sqm)
 
 
Buildable surface (sqm)
 
 
GLA (sqm)
 
 
Salable Surface (sqm)
 
 
Book Value (in millions of ARS)


RESIDENTIAL - BARTER AGREEMENTS


CONIL - Güemes 836 – Mz. 99 & Güemes 902 – Mz. 95 & Commercial stores - Buenos Aires(6)
  100 
Jul-96


  1,461 
  70 
Total Intangibles (Residential)


  1,461 
  70 


LAND RESERVES:


Catalinas - City of Buenos Aires(4)(5)
  100 
May-10
  3,648 
  58,100 
  28,051 
   
   
Subtotal offices
    
 
  3,648 
  58,100 
  28,051 
   
   
Total under Development
    
 
  3,648 
  58,100 
  28,051 
   
   
UOM Luján - Buenos Aires
  100 
May-08
  1,160,000 
  464,000 
   
   
  1,326 
San Martin Plot (Ex Nobleza Piccardo) - Buenos Aires
  50 
May-11
  159,996 
  500,000 
   
   
  3,797 
La Plata - Greater Buenos Aires
  100 
Mar-18
  78,614 
  116,552 
   
   
  1,293 
Caballito plot - City of Buenos Aires
  100 
Jan-99
  23,791 
  86,387 
  10,518 
  75,869 
  4,353 
Subtotal Mixed-uses
    
 
  1,422,401 
  1,166,940 
  10,518 
  75,869 
  10,769 
Coto Abasto air space - City of Buenos Aires(2)
  100 
Sep-97
   
  21,536 
   
  16,385 
  37 
Córdoba Shopping Adjoining plots - Córdoba(2)
  100 
Jun-15
  8,000 
  13,500 
   
  2,160 
  36 
Neuquén - Residential plot - Neuquén(2)
  100 
Jun-99
  13,000 
  18,000 
   
  18,000 
  86 
Subtotal residential
    
 
  21,000 
  53,036 
   
  36,545 
  159 
Polo Dot commercial expansion – City of Buenos Aires
  80 
Nov-06
   
   
  15,940 
   
  1,888 
Paraná plot - Entre Ríos(3)
  100 
Aug-10
  10,022 
  5,000 
  5,000 
   
   
Subtotal retail
    
 
  10,022 
  5,000 
  20,940 
   
  1,888 
Polo Dot - Offices 2 & 3 - City of Buenos Aires
  80 
Nov-06
  12,800 
   
  38,400 
   
  3,627 
Intercontinental Plaza II - City of Buenos Aires
  100 
Feb-98
  6,135 
   
  19,598 
   
  1,484 
Córdoba Shopping adjoining plots - Córdoba(2)
  100 
Jun-15
  2,800 
  5,000 
  5,000 
   
  27 
Subtotal offices
    
 
  21,735 
  5,000 
  62,998 
   
  5,138 
Total future developments
    
 
  1,475,158 
  1,229,976 
  94,456 
  112,414 
  17,954 
Other land reserves(1)
    
 
  1,899 
   
  7,297 
  262 
  1,880 
Total land reserves
    
 
  1,477,057 
  1,229,976 
  101,753 
  112,676 
  19,834 
 
(1) Includes Zelaya 3102-3103, Chanta IV, Anchorena 665, Condominios del Alto II, Ocampo parking spaces, DOT adjoining plot and Mendoza shopping adjoining plot.
(2) These land reserves are classified as Trading Properties, therefore, their value is maintained at historical cost. The rest of the land reserves are classified as Investment Property, valued at market value.
(3) Sign of the deeds pending subject to certain conditions.
(4) The sale agreements for 86.93% of the property under development have been signed between IRSA and IRSA CP and the remaining units have been sold to Globant, also through an agreement. The deed of sale with both entities has not yet been signed. The aforementioned fair value corresponds only to the land.
(5) On June 10, 2020, IRSA CP informed with an unrelated third party the assignment and transfer of the right to deed with delivery of possession of two floors of medium height of the tower under construction “200 Della Paolera” located in the Catalinas district of the Autonomous City of Buenos Aires for a total area of approximately 2,430 m2 and 16 parking units located in the building.
(6) Classified as Intangible Assets, therefore, their value is kept at historical cost.


19
 
 
The following chart shows information about IRSA’s land reserves as of September 30, 2020:


IRSA’s Interest
 
Date of acquisition
 
Land surface (sqm)
 
 
Buildable surface (sqm)
 
 
Saleable surface (sqm)
 
 
Book Value (ARS millions)
 
LAND RESERVES


La Adela - Buenos Aires(3)
  100%
8/1/2014
  9,868,500 
  3,951,227 
   
  1,887 
Puerto Retiro - BA City(1)
  50%
5/18/1997
  82,051 
  246,153 
   
  - 
Solares Santa María - BA City(3)
  100%
7/10/1997
  716,058 
  716,058 
   
  27,580 
Subtotal Mixed-uses 
    
 
  10,666,609 
  4,913,438 
   
  29,467 
Caballito Block 35 -BA City(4)
  100%
10/22/1998
  9,879 
  57,192 
  30,064 
  424 
Zetol – Uruguay(4) 
  90%
6/1/2009
   
   
  64,080 
  334 
Vista al Muelle – Uruguay(4)
  90%
6/1/2009
   
   
  60,360 
  285 
Subtotal Residential 
    
 
  9,879 
  57,192 
  154,504 
  1,043 
Total Future Developments
    
 
  10,676,488 
  4,970,630 
  154,504 
  30,510 
Another Land Reserves(2)(3)(4)
    
 
  5,249,941 
   
  4,713 
  618 
Total Land Reserves
    
 
  15,926,429 
  4,970,630 
  159,217 
  31,128 


(1)  This landplot is under judicial litigation and it is fully allowanced.
(2) 
Includes Pilar R8 Km 53, Pontevedra, Mariano Acosta, Merlo and San Luis plot, and Llao Llao plot.
(3) 
These properties (La Adela, Solares Santa María, Pilar R.8 Km 53, Pontevedra, Mariano Acosta, Merlo and San Luis) are valuated as Fair Value.
(4) 
These properties (Caballito Block 35, Zetol, Vista al Muelle and Llao Llao plot) are valuated as Cost adjusted for inflation.
 
Residential Properties (available for sale)
 
In the residential market, we acquire undeveloped properties strategically located in densely populated areas of the City of Buenos Aires, particularly properties located near shopping malls and hypermarkets or those to be constructed. We then develop multi-building high-rise complexes targeting the middle- and high- income market. These are equipped with modern comforts and services, such as open “green areas,” swimming pools, sports and recreation facilities and 24-hour security.
 
Condominios del Alto II – City of Rosario, Province of Santa Fe (IRSA CP)
 
The Condominios del Alto II project will be composed of two opposite building blocks, commercially divided into 10 sub-blocks. The project consists of a total of 189 apartments distributed in 6 stories and 195 parking spaces located in two basements. The amenities include a swimming pool with solarium, a multiple use room, sauna, a gym with dressrooms and a laundry. As of the date of this Form 6-K, the works in parcel H have been completed and all the units subject to the barter have been received, with six parking spaces available for sale.
 
Horizons, Vicente López, Olivos, Province of Buenos Aires.
 
The IRSA-CYRELA Project, developed over two adjacent blocks, was launched in March 2008 under the name Horizons. Horizons is one of the most significant developments in Greater Buenos Aires, featuring a new concept in residential complexes given its emphasis on the use of common spaces. This project includes two complexes with a total of six buildings: one complex faces the river and consists of three 14-floor buildings, the “Río” complex, and the other one, facing Libertador Avenue, consists of three 17-floor buildings, it is known as the “Parque” complex, thus totaling 59,000 sqm built of saleable area distributed in 467 units (excluding the units to be delivered as consideration for the purchase of the lands). Horizons is a unique and style-innovating residential complex offering 32 amenities, including a meeting room, work zone, heated swimming pools, mansion with spa, sauna, gym, children room, teen room, thematically landscaped areas, and aerobic trail. The showroom was opened to the public in March 2008 with great success. As of June 30, 2020, all the units were sold and the stock available for sale consisted of 1 parking space and 19 storage spaces.
 
Pereiraola (Greenville), Hudson – Province of Buenos Aires
 
In April de 2010 we sold Pereiraola S.A., a company owner of certain lands adjacent to Abril Club de Campo that comprised 130 hectares, for USD 11.7 million. The purchaser would develop a project that includes the fractioning into lots, a condo-hotel, two polo fields, and apartment buildings. The delivery to the Company of 39,634 sqm of lots amounting to approximately USD 3 million was included in the sale price. As of September 30, 2020, 10 lots had been transferred and 46 remain to be traded.
 
Intangibles – Units to be received under barter agreements
 
Conil – Avellaneda, Province of Buenos Aires (IRSA CP)
 
These plots of land we own, through IRSA CP, face Alto Avellaneda shopping mall, totaling 2,398 sqm distributed in two opposite corners and, according to urban planning standards, around 6,000 sqm may be built. Its intended use, either through our own development or sale to a third party, is residential with the possibility of a retail space as well. In November 2014, a barter deed was executed to carry out a residential development, in consideration of which IRSA CP will receive 1,389 sqm of retail stores located on the ground floors of blocks 99 and 95 at Güemes 836 and Güemes 902, respectively. The barter was valued at USD 0.7 million. Considerations for block 95 and 99 were estipulated to be delivered in January 2018 and September 2018, respectively. In June 2018 an extension to the barter agreement was signed. In consideration for the delay and as compensation, IRSA CP will receive an additional apartment (55.5 sqm) and one parking lot (14 sqm).
 
Zetol S.A. and Vista al Muelle S.A. – District of Canelones – Uruguay
 
In the course of fiscal year 2009 we acquired a 100% ownership interest in Liveck S.A., a company organized under the laws of Uruguay. In June 2009, Liveck had acquired a 90% stake in the capital stock of Vista al Muelle S.A. and Zetol S.A., two companies incorporated under the laws of Uruguay, for USD 7.8 million. The remaining 10% ownership interest in both companies is in the hands of Banzey S.A. These companies have undeveloped lands in Canelones, Uruguay, close to the capital city of Uruguay, Montevideo.
 
We intend to develop in these 13 plots, with a construction capacity of 182,000 sqm, an urban project that consists of the development and comercialization of 1,860 apartments. Such project has the “urban feasibility” status for the construction of approximately 200,000 sqm for a term of 10 years, which was granted by the Mayor’s Office of the Canelones department and by its Local Legislature. Zetol S.A. and Vista al Muelle S.A. agreed to carry out the infrastructure works for USD 8 million as well as minimum amount of sqm of properties. The satisfaction of this commitment under the terms and conditions agreed upon will grant an additional 10-year effective term to the urban feasibility status.
 
The total purchase price for Zetol S.A. was USD 7 million; of which USD 2 million were paid. Sellers may opt to receive the balance in cash or through the delivery of units in the buildings to be constructed in the land owned by Zetol S.A. equivalent to 12% of the total marketable meters to be constructed.
 
Besides, Vista al Muelle S.A. owned since September 2008 a plot of land purchased for USD 0.83 million. Then, in February 2010, plots of land were acquired for USD 1 million. In December 2010, Vista al Muelle S.A. executed the title deed of other plots for a total amount of USD 2.66 million, of which USD 0.3 million were paid. The balance will be repaid by delivering 2,334 sqm of units and/or retail stores to be constructed or in cash.
 
On June 30, 2009, the Company sold a 50% stake in Liveck S.A. to Cyrela Brazil Realty S.A. for USD 1.3 million. On December 17, 2010, together with Cyrela Brazil Realty S.A. we executed a stock purchase agreement pursuant to which we repurchased from Cyrela Brazil Realty S.A. a 50% shareholding in Liveck S.A. for USD 2.7 million. Accordingly, as of June 30, 2016, our stake, through Tyrus, in Liveck is 100%.
 
As a result of the plot barter agreements executed in due time between the IMC, Zetol S.A. and Vista al Muelle S.A. in March 2014, the parcel redistribution dealing was concluded. This milestone, as set forth in the amendment to the Master Agreement executed in 2013, initiates the 10-year term for the investment in infrastructure and construction of the buildings mentioned above. Construction capacity of the 13 plots is 182,000 sqm.
 
 
20
 
 
On November 15, 2018, the translation deed of sale of the first plot where the first Tower of Departments, Villas and single and double parking spaces is currently being built has been signed, the total exchange price was USD 7,298,705, equivalent to 16% of all of the marketable built meters in the first Tower. 12% of it has been used to cancel part of the price balance maintained to date with the sellers of the plots acquired by Zetol S.A in June 2009. The estimated delivery date of the units is January 2022.
 
Canteras Natal Crespo, La Calera – Province of Córdoba
 
On June 26, 2013, we sold 100% of our interest in Canteras Natal Crespo S.A. representing 50% of its capital stock, to Euromayor S.A. de Inversiones for USD 4,215,000 according to the following payment schedule: USD 3,815,000 in cash and USD 400,000 through the transfer of almost 40,000 sqm for business purposes within the project to be developed in the site known as Laguna Azul. Delivery of the non-monetary consideration, which consist in 30,000 sqm, is pending. In December 2019, an agreement was reached with the counterpart that allowed the resale of the non-monetary consideration to an unrelated third party for a total value of USD 450,000.
 
Projects under Development
 
Alto Palermo Expansion (IRSA CP)
 
We keep working on the expansion of Alto Palermo shopping mall, the shopping mall with the highest sales per sqm in our portfolio, that will add a gross leasable area of approximately 3,900 sqm and will consist in moving the food court to a third level by using the area of an adjacent building acquired in 2015. Work progress as of June 30 2020 was 64% and construction works are expected to be finished by June 2021.
 
200 Della Paolera - Catalinas building (IRSA CP)
 
The building under construction will have 35,000 sqm of GLA consisting of 30 office floors and 316 parking spaces and will be located in the “Catalinas” area in the City of Buenos Aires, one of the most sought-after spots for Premium office development in Argentina. The Company owns 30,832 sqm consisting of 26 floors and 272 parking spaces in the building. As of September 30, 2020, work progress was 98%.
 
Mixed uses
 
Ex UOM – Luján, Province of Buenos Aires (IRSA CP)
 
This 116-hectare plot of land is located in the 62 Km of the West Highway, in the intersection with Route 5 and was originally purchased by IRSA from Birafriends S.A. for USD 3 million on May 31, 2008. In May 2012, the Company acquired the property through a purchase and sale agreement entered into between related parties, thus becoming the current owner. Our intention is to carry out a mixed-use project, taking advantage of the environment consolidation and the strategic location of the plot. At present, dealings are being carried out so as to change the zoning parameters, thus enabling the consummation of the project.
 
Ex Nobleza Piccardo Plant – San Martín, Province of Buenos Aires (IRSA CP)
 
This plot of land is owned by Quality Invest. On May 31, 2011, Quality Invest S.A. and Nobleza Picardo S.A.I.C. y F. (Nobleza) executed the title deed for the purchase of a plot of land extending over 160,000 sqm located in the District of San Martín, Province of Buenos Aires, currently intended for industrial purposes and suitable in terms of characteristics and scales for mixed-use developments.
 
The Master Plan, by which it is projected to develop a large-scale integral urbanization (residential, commercial, etc.), which includes the construction of approximately 540,000 m2, was endorsed by the Municipality of San Martin through Decree 1589/19 and registered before the General Directorate of Urbanism and Directorate of Urban Planning of the Municipality. Likewise, the subdivision plan in accordance with the urban indicators was presented to the Directorate of Cadastre of the Province of Bs. As.
 
Additionally, during this fiscal year, the pre-feasibility requirements began to be processed with public bodies. The one corresponding to the Hydraulic Directorate of the Province is in the process of approval, and in the next fiscal year, we will begin the rest of the presentations before the service companies, to obtain the pre-feasibilities of electric power, gas, water and overturning. of effluents.
 
Córdoba Shopping Mall Project (IRSA CP)
 
The Company owns a few plots adjacent to Córdoba Shopping Mall with a construction capacity of approximately 17,300 sqm in the center of the City of Córdoba.
 
In May 2016, a preliminary barter agreement was signed for 13,500 sqm out of the total construction capacity, subject to certain conditions, for a term of one year, at the end of which the deed will be signed. It will be a mixed residential and office project and, as part of the consideration, the Company will receive 2,160 sqm in apartments, parking spaces, shopping space, plus IRSA CP will assume the management of permits, unifications and subdivisions in 3 plots. The consideration will be delivered by May 2022 for Torre I and by July 2024 for Torre II. The value of the barter was USD 4 million.
 
La Plata Plot of land (IRSA CP)
 
On March 22, 2018 the Company has acquired, directly and indirectly, 100% of a plot of land of 78,614 sqm located in the city of La Plata, Province of Buenos Aires. The price of the transaction was USD 7.5 million, which have been fully paid.
 
The price of the operation was set at the amount of USD 7.5 million which have been fully paid. The purpose of this acquisition is the future development of a mixed-use project, given that the property has characteristics for a commercial development in a high potential district.
 
On January 21, 2019, Ordinance No. 11767, approved by the Honorable Deliberative Council of La Plata on December 26, 2018, has been promulgated. With said promulgation, the uses and indicators requested to develop a project of 116,553 sqm are formally confirmed by said Ordinance.
 
On September 24, 2020, the agreement that validates Ordinance No. 11767 was signed between the Mayor Dr. Julio Garro and the Director of the Real Estate Business, Dr. Daniel Elsztain, where the uses within the property are fixed, they may be: Shopping and entertainment center, Offices, Hotels, Housing, Medical Assistance Center and any other use authorized by the Planning Code of the City of La Plata.
 
The Master plan was consolidated with 16 lots, which are already in process to obtain the corresponding subdivision, by Geodesia in the Province of Buenos Aires.
 
Caballito Plot – City of Buenos Aires
 
On December 23, 2019, the Company transferred Parcel 1 of the land reserve located at Av. Avellaneda and Olegario Andrade 367 in the Caballito neighborhood of the City of Buenos Aires to an unrelated third party.
 
Plot 1 has an estimated surface of 3,221 sqm where a 10 floors residential building will be developed for a total area of 11,400 sqm, together with a commercial ground floor of 1,216 sqm and a basement of 138 parking spaces (“Building 1”).
 
The amount of the operation was set at USD 5.5 million to be paid in future functional units of Building 1, which represent the equivalent of 23.53% of the owned sqm, with a minimum guaranteed of 2,735 sqm composed for 1,215.62 commercial sqm, 1,519.68 residential sqm and a certain number of parking spaces that represent 22.50% of the own sqm with that destination and never less than 31 units.
 
The consideration is guaranteed by a mortgage on Plot 1 and Building 1 and the buyer has an Option to acquire Plot 2 of the same property until August 31, 2020 and Plots 3 and 4 until March 31, 2021, subject to certain suspensive conditions.
 
On July 20, 2020, IRSA CP was notified of the filing of a protection action (amparo) that is processed before the Administrative and Tax Litigation Jurisdiction of the City of Buenos Aires, where the plaintiff has requested the nullity of: 1) Administrative act that grants the certificate of environmental aptitude and 2) Administrative act that registered the plans. On October 1, 2020, the Chamber confirmed the precautionary measure. The Government of the City of Buenos Aires appealed the measure by filing an Appeal of Unconstitutionality. For more information, see “ITEM 8. Financial Information—A. Consolidated Statements and Other Financial Information—Legal or Arbitration Proceedings—Caballito.”
 
La Adela – Buenos Aires
 
During 2015 the company acquired the “La Adela” land reserve with an area of approximately 1,058 hectares, located in the District of Luján, Province of Buenos Aires, that was previously owned by Cresud for a total amount of ARS  210 million. Given its degree of development and closeness to the City of Buenos Aires, we intend to develop a new real estate project.
 
Puerto Retiro – City of Buenos Aires
 
At present, this 8.3 hectare plot of land, which is located in one of the most privileged areas of the city, near Catalinas, Puerto Madero and Retiro and is the only privately owned waterfront property facing directly to Río de la Plata, is affected by a zoning regulation defined as U.P. which prevents the property from being used for any purposes other than strictly port activities.
 
During fiscal year 1998, the Company initiated negotiations with the authorities of the Government of the City of Buenos Aires in order to obtain a rezoning permit for the property, allowing a change in the use of the property and setting forth new regulations for its development.
 
In turn, Tandanor filed a civil action against Puerto Retiro S.A. and the other defendants in the criminal case for violation of Section 174 (5) based on Section 173 (7) of the Criminal Code. Such action seeks -on the basis of the nullity of the decree that approved the bidding process involving the Dársena Norte property- the restitution of the property and a reimbursement in favor of Tandanor for all such amounts it has allegedly lost as a result of a suspected fraudulent transaction involving the sale of the property. Puerto Retiro has presented the allegation on the merit of the evidence, highlighting that the current shareholders of Puerto Retiro did not participate in any of the suspected acts in the criminal case since they acquired the shares for consideration and in good faith several years after the facts told in the process. Likewise, it was emphasized that the company Puerto Retiro is foreign - beyond its founders - to the bidding / privatization carried out for the sale of Tandanor shares. The pronouncement of the sentence is pending.
 
 
21
 
 
On September 7, 2018, the Oral Federal Criminal Court No. 5 rendered a decision. According to the sentence read by the President of the Court, Puerto Retiro won the preliminary objection of limitation filed in the civil action. However, in the criminal case, where Puerto Retiro is not a party, it was ordered, among other issues, the confiscation (decomiso) of the property owned by Puerto Retiro known as Planta I. The grounds of the Court`s judgement will be read on November 30, 2018. From that moment, all the parties might file the appeals.
 
On December 27, 2018, an action for annulment was filed against the judgment that ordered the confiscation of the property named “Planta 1.” On March 1, 2019 we were notified of the “in limine” rejection of the action for annulment filed. Subsequently, on March 8, 2019, a motion for restitution was filed against said resolution. On March 19, 2019, we were notified of the Court’s decision that rejected the replacement and declared the appeal filed in a subsidiary inadmissible. On March 22, 2019, a complaint was filed for appeal denied (before the Federal Criminal Cassation Chamber), the caul was granted, which is why the appeal filed is currently pending. In that sense, in April the appeal was maintained and subsequently, its foundations were expanded.
 
On 21 February 2020, an electronic document was received from the Federal Court of Criminal notifying the decision rejecting the appeals brought by Puerto Retiro against the verdict of the Federal Oral Court 5 that provided for the confiscation of the property Plant I and the distribution of costs in the order caused as regards the exception for the limitation of civil action brought by Puerto Retiro to which the Oral Court took place. Against that decision of appeal, Puerto Retiro was brought in a timely and form of Federal Extraordinary Appeal. In addition, Federal Criminal Cassation Chamber upheld the above limitation period by rejecting, to that effect, the appeal brought by the National State and Tandanor.
 
In the face of the evolution of the legal cases affecting it and based on the reports of its legal advisors, the Management of Puerto Retiro has decided to record a impairment equivalent to 100% of the book value of its investment property, without prejudice to the reversal of the same in the event that a favorable judgment is obtained in the actions brought.
 
Solares de Santa María – City of Buenos Aires
 
Solares de Santa María is a 70-hectare property facing the Río de la Plata in the south of Puerto Madero, 10 minutes from downtown Buenos Aires. We are owners of this property in which we intend to develop an entrepreneurship for mixed purposes, i.e. our development project involves residential complexes as well as offices, stores, hotels, sports and sailing clubs, services areas with schools, supermarkets and parking lots, and we would need to obtain all the necessary permits and authorizations
 
On October 30, 2012 a new agreement was executed with the Government of the City of Buenos Aires, replacing all prior agreements, and such has been submitted to the Legislature for its consideration. The agreement provided that if by February 28, 2014 the agreement was not approved would become invalidated.
 
During 2016, a new Agreement was executed with the Executive Branch of the City of Buenos Aires, including a new Bill of Law. The new Bill of Law was submitted to the Legislative Branch of the City of Buenos Aires for consideration and was approved by the relevant commissions, yet, during legislative year 2018 it was reserved and remained without legislative treatment. As a consequence, at the end of the 2018 legislative session, the lack of treatment triggered the automatically invalidity of the above mentioned and executed Agreement with the Executive Branch of the City of Buenos Aires, which include such Bill of Law.
 
As of the date of this Form 6-K, efforts are still being made both in the CABA with the Goverment as well as in the CABA Legislature in order that the project Law may be treated on the premises, for its treatment and subsequent legislative approval.
 
Residential
 
Coto Residential Project (IRSA CP)
 
The Company owns the right to construct above the premises of the Coto hypermarket that is close to Abasto Shopping in the heart of the City of Buenos Aires which we acquired in September 24, 1997. We estimate it has a construction capacity of 23,000 square feet (it also includes the right to receive certain parking units). The premises are located within the area between Agüero, Lavalle, Guardia Vieja and Gallo streets, in the Abasto neighborhood.
 
On October 25, 2019, IRSA CP transferred to a non-related third party the rights to develop a residential building (“Tower 1”) on Coto Supermarket airspace located in Abasto neighborhood in the City of Buenos Aires. Tower 1 will have 22 floors of 1 to 3 rooms apartments, totaling an area of 8,400 sqm.
 
The amount of the operation was set at USD 4.5 million: USD 1 million in cash and the balance in at least 35 apartment units, which represent the equivalent of 24.20% of the owned sqm, with a minimum guaranteed of 1,982 sqm.
 
In a 30 month-period since the signature, when certain conditions have been met, IRSA CP must transfer to the same unrelated third party the rights to build a second apartment building.
 
Neuquén Residential Plot– Neuquén, Province of Neuquén (IRSA CP)
 
Through Shopping Neuquén S.A., we own a plot of 13,000 sqm with construction capacity of 18,000 sqm of residential properties in an area with significant growth potential. This area is located close to the shopping mall Alto Comahue, the hypermarket currently in operation and a hotel to be constructed.
 
Caballito Plot – City of Buenos Aires
 
On June 29, 2011, we and TGLT, a residential developer, entered into an agreement to barter for the development of a plot of land located at Méndez de Andes street in the neighborhood of Caballito in the City of Buenos AiresA neighborhood association named Asociación Civil y Vecinal SOS Caballito secured a preliminary injunction which suspended the works to be carried out by TGLT in the above-mentioned property. On April 2018 TGLT and us terminated the barter agreement and we recovered the land. In July 2018, the Supreme Court of Justice issued a favorable final decision allowing the construction of 57,192 sqm of apartments on the plot.
 
Offices
 
Polo Dot 2nd and 3rd Stages – City of Buenos Aires (IRSA CP)
 
These two parcels of 6,400 sqm with a construction capacity of 33,485 sqm each, are located adjoining to where the extension of Dot Baires Shopping is planned. In April 2018, both plots were unified into a single one of 12,800 sqm.
 
Intercontinental Plaza II Plot - City of Buenos Aires (IRSA CP)
 
In the heart of the neighborhood of Monserrat, just a few meters from the most trafficked avenue in the city and the financial center, is the Intercontinental Plaza complex consisting of an office tower and the exclusive Intercontinental Hotel. In the current plot of 6,135 sqm a second office tower of 19,600 sqm and 25 stories could be built to supplement the tower currently located in the intersection of Moreno and Tacuarí streets.
 
Other Land Reserves
 
Other Land Reserves – Pilar, Pontevedra, Mariano Acosta, Merlo, San Luis Plot, Llao Llao Plot and Casona Abril remaining surface
 
We grouped here those plots of land with a significant surface area the development of which is not feasible in the short term either due to their current urban and zoning parameters, their legal status or the lack of consolidation of their immediate environment. This group totals around 7 million sqm.
 
Isla Sirgadero
 
On September 3, 2015, the entire property of 10,083,270 sqm was sold to several companies for USD 3.9 million, payable in 16 quarterly installments, plus an installment in kind, land resulting from the final blueprint, equivalent to 10% of the surface area. Delivery of the non-monetary consideration, consisting in 1,083,327 sqm, is pending.
 
International
 
Lipstick Building, New York, United States
 
The Lipstick Building is a landmark building in the City of New York, located at Third Avenue and 53th Street in Midtown Manhattan, New York. It was designed by architects John Burgee and Philip Johnson (Glass House and Seagram Building, among other renowned works) and it is named after its elliptical shape and red façade. Its gross leasable area is approximately 58,000 sqm and consists of 34 floors.
 
On August 7, 2020, as a consequence of negotiations conducted in the context of an increased lease price effective as of May 2020, Metropolitan signed an agreement with the owner of the Ground Lease to terminate the commercial relationship, leaving the administration of the building. For this reason, as of June 30, 2020, Metropolitan no longer recognizes the liability associated with the ground lease, as well as all the assets and liabilities associated with the building and the operation of the administration. For more information see “Recent Developments – Lipstick Building.”
 
Investment in Condor Hospitality Trust
 
We maintain our investment in the Condor Hospitality Trust Hotel REIT (NYSE: CDOR) mainly through our subsidiary Real Estate Investment Group VII (“REIG VII”), in which we hold a 100% interest. Condor is a REIT listed in NYSE focused on medium-class hotels located in various states of the United States of America, managed by various operators and franchises.
 
Condor’s investment strategy is to build a branded premium, select service hotels portfolio within the top 100 Metropolitan Statistical Areas (“MSA”) with a particular focus on the range of MSA 20 to 60. Since the beginning of the reconversion of the hotel portfolio in 2015, Condor has acquired 14 high quality select service hotels in its target markets for a total purchase price of approximately USD 277 million. In addition, during this time, it has sold 53 legacy assets for a total value of approximately USD 161 million.
 
 
22
 
 
On July 19, 2019, Condor signed an agreement and merger plan with a company not related to the group. As agreed, each Condor ordinary share, whose nominal value is USD 0.01 per share will be canceled before the merger and will become the right to receive a cash amount equivalent to USD 11.10 per ordinary share. Additionally, in accordance with the terms and conditions of the merger agreement, each Series E convertible share will be automatically canceled and its holders will become entitled to receive a cash amount equal to USD 10.00 per share. The closing of the acquisition, scheduled for March 23, 2020, did not occur.
 
On October 12, 2020, Condor executed an agreement with Nextponint Hospitality Trust and some of its affiliates (“NHT Parties”) to resolve and settle any and all claims between them related to the merger agreement mentioned hereinabove.
 
According to the agreement with NHT Parties shall make three payments to Condor in three instalments ending the last payment on December 30, 2020 and totalling USD 7.0 million.
 
As of the date of presentation of these financial statements, the Company has 2,197,023 common shares and 325,752 Series E shares.
 
Others
 
Our interest in Banco Hipotecario
 
As of September 30, 2020, we held a 29.91% interest in Banco Hipotecario. Established in 1886 by the argentine government and privatized in 1999, Banco Hipotecario has historically been Argentina’s leading mortgage lender, provider of mortgage-related insurance and mortgage loan services. All of its operations are located in Argentina where it operates a nationwide network of 63 branches in the 23 Argentine provinces and the City of Buenos Aires, and 12 additional sales offices throughout Argentina.
 
Banco Hipotecario is an inclusive commercial bank that provides universal banking services, offering a wide variety of banking products and activities, including a wide range of individual and corporate loans, deposits, credit and debit cards and related financial services to individuals, small-and medium-sized companies and large corporations. As of September 30, 2020, Banco Hipotecario ranked thirteenth in the Argentine financial system in terms of totals assets and twelfth in terms of loans. As of September 30, 2020, Banco Hipotecario’s shareholders’ equity was ARS 15,141.5 million, its consolidated assets were ARS 150,789.5 million, and its net income for the nine-month period ended September 30, 2020 was ARS 291.8 million. Since 1999, Banco Hipotecario’s shares have been listed on the Buenos Aires Stock Exchange in Argentina, and since 2006 it has had a Level I ADR program.
 
Banco Hipotecario continues its business strategy of diversifying its loan portfolio. As a result, non-mortgage loans were ARS 36,944.8 million as of September 30, 2020. Total non-mortgage loans granted by the bank to the non-financial private sector were ARS 36,939.7 million as of September 30, 2020. Non-performing loans represented 16.9% of its total portfolio as of September 30, 2020.
 
In recent years, Banco Hipotecario has diversified its funding base and has become one of the most frequent issuers of corporate debt in Argentina based on the percentage of its total funding, by developing presence in the domestic and international capital markets, and it has also increased its deposit base. Its financial indebtedness as a percentage of its total funding was 36.2% as of June 30, 2020.
 
Its subsidiaries include BACS Banco de Crédito y Securitización S.A., a bank specialized in investment banking, asset securitization and asset management; BACS Administradora de Activos S.A.S.G.F.C.I., a mutual investment fund management company; BHN Sociedad de Inversión S.A., which controls BHN Vida S.A., a life insurance company; and BHN Seguros Generales S.A., a property insurance company.
 
By virtue of communications “A” 6939 and “7035” of the BCRA, the distribution of dividends is suspended until December 31, 2020.
 
Other Assets
 
La Rural (Exhibition and Convention Center)
 
LRSA holds usufruct rights for the commercial operation of the emblematic Predio Ferial de Palermo (Palermo exhibition center) in the City of Buenos Aires. We own 35% of the equity of LRSA.
 
In July 2016, we acquired from FEG Entretenimientos S.A. 25% of the shares of EHSA, in which we already held 50% of the share. We also acquired a 1.25% interest in ENUSA from Mr. Marcelo Figoli. The aggregate acquisition price for such acquisitions was ARS  66.5 million. Immediately after this acquisition, we sold 5% of the shares of EHSA to Mr. Diego Finkelstein, who already owned a 25% equity interest. The sale amount was agreed at ARS  13.5 million. As a result, we now hold 70% of the shares of EHSA and Mr. Diego Finkelstein holds the remaining 30%.
 
EHSA holds, directly and indirectly, 100% of the shares of OASA and 95% of the shares of ENUSA. OASA holds 50% of the voting stock of LRSA and SRA holds the remaining 50%. In addition, OASA manages LRSA pursuant to agreements entered into with SRA that include the right to appoint the chairman of the board of LRSA—with deciding vote on certain key governance matters—and the chief executive of LRSA. ENUSA is mainly engaged in organizing entertainment events for trade fairs.
 
On August 4, 2017, a 15-year concession for the Exhibition and Convention Center of the City of Buenos Aires was executed by the joint venture La Rural S.A., OFC S.R.L., Ogden Argentina S.A. and Entretenimiento Universal S.A. - Union Transitoria, which was granted pursuant a public bidding process. The members of the joint venture hold the following interests: (a) LRSA 5%; (b) OFC SRL 20%; (c) OASA 55%; and (d) EUSA 20%.
 
The shareholders of LRSA are Sociedad Rural Argentina and OASA, each of which owns 50% equity interest. OASA and EUSA are controlled by EHSA. Consequently, we indirectly hold a 50.00% interest in the joint venture.
 
The Exhibition and Convention Center has a surface area of approximately 22,800 sqm and may accommodate approximately 5,000 attendees. It has a main exhibit hall and an ancillary hall, offices and meetings rooms, arranged in three underground levels that were designed to blend into the landscape extending from the School of Law of the University of Buenos Aires to Parque Thays.
 
Also, La Rural S.A. continues to work on the consolidation of the commercial development of the “Convention Center of Punta del Este,” through its equity participation in the company that holds the concession until 2041.
 
As a result of the measures adopted by Argentina’s national Government in response to the COVID-19 pandemic, La Rural, the Buenos Aires and Punta del Este Convention Centers have been closed since March 20, 2020, the date on which social, preventive, and mandatory isolation was decreed by the government of Argentina to combat the impact of the COVID-19. All the planned congresses are suspended, a large part of the fairs and conventions were postponed, while the shows scheduled at the DirecTV Arena were mostly canceled. The reopening date of these establishments is uncertain, as well as the future agenda of fairs, conventions and shows.
 
TGLT (real estate)
 
TGLT is a real estate company listed on the BYMA which is mainly engaged in residential development projects in Argentina and Uruguay. We hold a 30.2% interest in TGLT.
 
On August 1, 2017, we exercised our preemptive subscription and accretion rights and purchased 22,225,000 Subordinated Notes Convertible into Newly Issued Shares of TGLT for an aggregate amount of USD 22,225,000 (USD 1.00 par value) due 2027.
 
On August 8, 2019 has executed with TGLT certain contracts tending to collaborate in the process of financial restructuring of said company through its recapitalization. On December 11, 2019, and in compliance with the contracts signed with TGLT on August 8, 2019, IRSA CP made the exchange of all the Convertible Notes it had of TGLT. Likewise, it subscribed preferred shares making a contribution in kind of the 100% of the shares of the company La Maltería S.A., owner of the property known as Maltería Hudson, for a value of USD 24 million.
 
As a result of the aforementioned exchange and capitalization, IRSA Commercial Properties obtained 21,600,000 Class A preferred shares and 24,948,798 Class B preferred shares that are added to its holding of 3,003,990 ordinary shares.
 
On February 10, 2020, the TGLT Board of Directors determined the mandatory conversion of its Convertible Negotiable Obligations and preferred shares with immediate effect, this is how IRSA CP converted its Class A and B preferred shares of TGLT into ordinary shares of the company. As a consequence of this transaction, IRSA CP owns as of March 31, the amount of 279,502,813 ordinary shares of TGLT, representing 30.2% of its capital stock.
 
DirecTV Arena
 
DirecTV Arena is an indoor stadium with unique features designed to host top-level international events, including sporting events and concerts. The price set for the transaction was USD 4.2 million. Through these types of investments, our equity stake in LRSA and through the new Convention Center of the City of Buenos Aires, we continue to expand our exposure to conventions, sporting events and entertainment, which could generate synergies with our core shopping mall business.
 
As is publicly known, the DirecTV Arena stadium has been closed since March 20, the date on which social, preventive, and mandatory isolation was decreed in Argentina due to COVID-19. All the planned congresses are suspended, a large part of the fairs and conventions were postponed, while the shows scheduled at the DirecTV Arena were mostly canceled. The reopening date of these establishments is uncertain, as well as the future agenda of fairs, conventions and shows.
 
Pareto
 
On October 8, 2018, the company Pareto S.A. was incorporated, with the social purpose of design, programming and development of software, mobile and web applications.
 
As of September 30, 2020, IRSA CP’s participation in PARETO S.A. It was 69.96% and after the closing it increased its stake to 91.96%.
 
Pareto is a 100% digital customer loyalty system that promotes benefits and discounts in all our shopping mall.
 
Appa, Pareto’s app is a 100% digital customer loyalty system that promotes benefits and discounts across all our shopping malls. The app is also used to pay Parking lots giving customers the most convenient and fast check out available. The plan is to extend this frictionless payments method in gastronomic and apparel stores too.
 
 
23
 
 
Legal Framework
 
Regulation and Government Supervision
 
The laws and regulations governing the acquisition and transfer of real estate, as well as municipal zoning ordinances, apply to the development and operation of our properties. Currently, Argentine law does not specifically regulate shopping mall leases. Since our shopping mall leases generally diverge from ordinary commercial leases, we have developed contractual provisions which are tailored to the commercial relationship with our shopping mall tenants.
 
Leases
 
Argentine law imposes certain restrictions on property owners, including:
 
a minimum lease term of three years for all purposes, except in particular cases such as embassy, consulate or international organization venues, room with furniture for touristic purposes for less than three months, custody and bailment of goods, exhibition or offering of goods in fairs or in cases where due to the circumstances, the subject matter of the lease requires a shorter term.
 
Lease term limits
 
Under the Argentine Civil and Commercial Code lease terms may not exceed 20 years (for residential purpose) or fifty years (all other purposes). Generally, terms in our leases range from three to ten years.
 
Rescission rights
 
The Argentine Civil and Commercial Code provides that tenants may terminate leases with other destiny than home destiny, early after the first six months of the effective date. Such termination is subject to penalties which range from one to one and a half months of rent. If the tenant terminates the agreement during the first year of the lease, the penalty is one and a half month’s rent and if termination occurs after the first year of lease, the penalty is one month’s rent.
 
Other
 
The Argentine Civil and Commercial Code, among other rules, repealed the Urban Lease Law No. 23,091, which set forth a rule similar to the one described above, but established the obligation to give at least 60 days’ prior notice of exercise of the tenant’s unilateral termination right. There are no court rulings to date with respect to the new regulations related to: (i) the tenant’s unilateral termination right; or (ii) the possibility of agreeing a penalty different from that described above upon such termination.
 
While current policy discourages government regulation of leases, there can be no assurance that additional regulations will not be imposed in the future by Congress, including regulations similar to those previously in place. Furthermore, most of our leases provide that the tenants pay all costs and taxes related to the property in proportion to their respective leasable areas. In the event of a significant increase in such costs and taxes, the government may respond to political pressure to intervene by regulating this practice, thereby adversely affecting our rental income.
 
The Argentine Civil and Commercial Code enables landlords to pursue what is known as an “executory proceeding” if a tenant fails to pay rent when due. In executory proceedings, debtors have fewer defenses available to prevent foreclosure, making these proceedings substantially shorter, as the origin of the debt is not in question and the trial should focus on the formalities of the contract. The Argentine Civil and Commercial Code also permits special eviction proceedings, which are carried out in the same way as ordinary proceedings. The Argentine Civil and Commercial Code also requires that a residential tenant receive at least 10 days’ prior notice when a landlord demands payment of rent due if a breach prior to eviction occurs but does not impose any such requirement for other leases. However, court cases pending resolution and numerous procedural hurdles have resulted in significant delays to eviction proceedings in the commercial context, which generally last from six months to two years from the date of filing of the suit for eviction.
 
Development and use of the land
 
In the City of Buenos Aires, where the vast majority of our properties are located, we are subject to the following regulations:
 
Buenos Aires Urban Planning Code
 
The Buenos Aires Urban Planning Code (Código de Planeamiento Urbano de la Ciudad de Buenos Aires) generally restricts the density and use of property and regulates physical features of improvements to property, such as height, design, set back and overhang, consistent with the city’s urban planning policy. The Secretary of Urban Planning of the City of Buenos Aires (Secretaría de Planeamiento Urbano) is responsible for implementing and enforcing the Buenos Aires Urban Planning Code.
 
Buenos Aires Building Code
 
The Buenos Aires Building Code (Código de Edificación de la Ciudad de Buenos Aires) complements the Buenos Aires Urban Planning Code regulating the use and development of property in the City of Buenos Aires. The Building Code requires developers to obtain building permits, including submitting architectural plans for review of the Secretary of Work and Public Services, to monitor regulatory compliance.
 
Buenos Aires Authorizations and Licenses Code
 
The Authorizations and Licenses Code (Código de Habilitaciones de la Ciudad de Buenos Aires) sets forth the conditions under which authorizations or licenses to operate may be granted. The General Bureau of Authorizations and Licenses is responsible for implementing and enforcing the Authorizations and Licenses Code. Outside the city of Buenos Aires, our real estate activities are subject to similar municipal zoning, building, occupation and environmental regulations, which must also comply with national standards. In some jurisdictions we may also be subject to regulation of large commercial areas, which require approval of the location of these areas. We believe that all of our real estate properties are in material compliance with relevant laws, ordinances and regulations.
 
Sales and ownership
 
Real Estate Installment Sales Law
 
The Real Estate Installment Sales Law No. 14,005, as amended by Law No. 23,266 and Decree No. 2015/85, or “Real Estate Installment Sales Act,” imposes a series of requirements on contracts for the sale of subdivided real estate property including, for example, that the purchase price for a property is payable in installments. The law requires, among other things:
 
Registration of intent to sell the property in subdivided plots with the Real Estate Registry in the jurisdiction where the property is located. Registration is only permitted for unencumbered property. Mortgaged property may only be registered if creditors agree to divide the debt in accordance with subdivided plots. Creditors may be judicially compelled to agree to the partition.
 
Preliminary registration with the Real Estate Registry of the purchase instrument within 30 days after its execution.
 
Once the property is registered, the installment sale must be completed in a manner consistent with the Real Estate Installment Sales Act. If a dispute arises over the title between the purchaser and third party creditors of the seller, the installment purchaser who has duly registered the purchase instrument will have title to the plot. The purchaser can demand conveyance of title after at least 25% of the purchase price has been paid, although the seller may record a mortgage over the subject property to secure payment of the balance of the purchase price.
 
After paying of 25% of the purchase price or advancing of at least 50% of construction, the Real Estate Installment Sales Act prohibits termination of the sales contract for failure by the purchaser to pay the balance of the purchase price but gives the seller the right to enforce under any mortgage on the property.
 
Buildings Law
 
Buildings Law No. 19,724 (Ley de Pre horizontalidad) was repealed by the Argentine Civil and Commercial Code which provides that for purposes of execution of sales agreements for units under construction, the owner or developer must purchase insurance in favor of prospective purchasers against the risk of frustration of the development pursuant to the agreement for any reason. A breach of this obligation precludes the owner from exercising any right against the purchaser—such as demanding payment of any outstanding installments due—unless he/she fully complies with their obligations, but does not prevent the purchaser from exercising its rights against the seller.
 
Protection of the Disabled
 
The Law for Protection of the Disabled No. 22,431, enacted on March 16, 1981, as amended, provides that properties under construction or that are being remodeled must provide access for handicapped persons. Public spaces, entrances, hallways, elevators and common use facilities must be designed to provide mobility for impaired individuals. Buildings developed before enactment of the Protection for the Disabled Law must be reformatted to provide requisite access. Buildings that, because of their architectural design, may not be adapted to the use by the physically impaired, are exempted from these requirements.
 
Other regulations
 
Consumer relations, consumer or end user protection
 
Article 42 of the Argentine Constitution establishes that consumers and users of goods and services have a right to protection of health, safety and economic interests in a consumer relationship. Consumer Protection Law No. 24,240, as amended, regulates several issues concerning the protection of consumers and end users in a consumer relationship, in the arrangement and execution of contracts. The Consumer Protection Law, and the applicable sections of the Argentine Civil and Commercial Code are intended to regulate the constitutional right conferred under the Constitution on the weakest party to the consumer relationship and prevent potential abuses deriving from the stronger bargaining position of vendors of goods and services in a market economy where standard form contracts are widespread.
 
 
24
 
 
These laws deem void and unenforceable contractual provisions included in consumer contracts, that:
 
deprive obligations of their nature or limit liability for damages;
 
imply a waiver or restriction of consumer rights and an extension of seller rights; and
 
impose the shifting of the burden of proof from the consumer to the seller in order to protect the consumers.
 
In addition, the Consumer Protection Law imposes penalties ranging from warnings to the forfeiture of concession rights, privileges, tax regimes or special credits to which the sanctioned party may be entitled, including closing down establishments for a term of up to 30 days.
 
The Consumer Protection Law and the Argentine Civil and Commercial Code define consumers or end users as the individuals or legal entities that acquire or use goods or services, free of charge or for a price for their own final use or benefit or that of their family or social group. The protection under the laws afforded to consumers and end users encompasses the entire consumer relationship, from the offering of the product or service, to cover more than just those relationships established by means of a contract. Providers of goods and services include those who produce, import, distribute or commercialize goods or supply services to consumers or users (but excludes professionals whose services require a college degree or higher who are required to register in officially recognized professional organizations).
 
The Argentine Civil and Commercial Code defines a consumer agreement as one that is entered into between a consumer or end user and an individual or entity that manufactures goods or provides services to consumers for private, family or social use. The Consumer Protection Law imposes a range of penalties for violation of its provisions, from warnings to the forfeiture of concession rights, and establishes joint and several liability of each participant in the chain of distribution or whose trademark on the thing or service for damages caused to consumers derived from a defect or risk inherent in the thing or the provision of a service.
 
The Consumer Protection Law excludes the services supplied by professionals that require a college degree and registration in officially recognized professional organizations or by a governmental authority. However, this law regulates the advertisements that promote the services of such professionals.
 
The Consumer Protection Law determines that the information contained in the offer addressed to undetermined prospective consumers binds the offeror during the period when the offer is made until its public revocation. Further, it determines that specifications included in advertisements, announcements, prospectuses, circulars or other media bind the offeror and are considered part of the contract entered into by the consumer.
 
Pursuant to Resolution No. 104/2005 issued by the Secretariat of Technical Coordination reporting to the Argentine Ministry of Treasury, Consumer Protection Law adopted Resolution No. 21/2004 issued by the Mercosur’s Common Market Group, persons engaged in internet commerce must disclose precisely the characteristics of the products and/or services offered and the sale terms. Failure to comply with the terms of the offer is deemed an unjustified denial to sell and may give rise to sanctions.
 
On September 17, 2014, the Argentine Congress enacted Law No. 26,993 called “Conflict Resolution in Consumer Relationships System” law that provides for creation of new administrative and judicial procedures. The law created a bicameral administrative system: the Preliminary Conciliation Service for Consumer Relations (Servicio de Conciliación Previa en las Relaciones de Consumo), or “COPREC,” and the Consumer Relations Audit, and a number of courts assigned to the resolution of conflicts between consumers and providers (Fuero Judicial Nacional de Consumo). The amount of any filed claim may not exceed a fixed amount equivalent to 55 adjustable minimum wages, as determined by the Ministry of Labor, Employment and Social Security. The claim must be filed with the administrative agency. If an agreement is not reached, the claimant may file the claim in court. While COPREC is currently in full force and effect, the court system (Fuero Judicial Nacional de Consumo) is still pending. Therefore, any current claim must be filed with existing courts. A considerable number of claims pending against us are expected to be settled within the framework of this system.
 
Antitrust Law
 
Law No. 27,442, as amended, or the “Antitrust Law,” prevents collusive practices by market participants and requires administrative approval for transactions that according to the Antitrust Law constitute an economic concentration. According to this law, mergers, transfers of goodwill, acquisitions of property or rights over shares, capital or other convertible securities, or similar transactions by which the acquirer controls or substantially influences a company, are considered as an economic concentration. Whenever an economic concentration involves a company or companies and the aggregate volume of business in Argentina of the companies concerned exceeds 100 million mobile units, the respective concentration must be submitted for approval to the CNDC. The request for approval may be filed, either prior to the transaction or the implementing of the control take.
 
For the purpose of determining the volume of the business mentioned on the paragraph before, the CNDC will annually inform the amount in legal currency that will apply during the corresponding year. For that purpose, the CNDC will consider the mobile unit value current at the last business day of the previous year. When a request for approval is filed, the CNDC may (i) authorize the transaction, (ii) subordinate the transaction to the accomplishment of certain conditions or (iii) reject the authorization.
 
The Antitrust Law provides that economic concentrations in which the transaction amount and the value of the assets subject to acquisition or disposition do not exceed 20 million mobile units each do not require approval. When the amount of the transactions consummated in the preceding 12 months exceeds in aggregate 20 million mobile units or 60 million mobile units in the preceding 36 months, these transactions require CNDC approval.
 
As our consolidated annual sales volume and our parent’s consolidated annual sales volume exceed ARS  200.0 million, we must give notice to the CNDC of any concentration provided for under the Antitrust Law.
 
Money laundering
 
For more information about money laundering see, “Item 10. Additional Information—E. Money Laundering.”
 
Environmental Law
 
Our activities are subject to several national, provincial and municipal environmental provisions.
 
Article 41 of the Argentine Constitution, as amended in 1994, provides that all Argentine inhabitants have the right to a healthy and balanced environment fit for human development and have the duty to preserve it. Environmental damage shall bring about primarily the obligation to restore it as provided by applicable law. The authorities shall control the protection of this right, the rational use of natural resources, the preservation of the natural and cultural heritage and of biodiversity and shall also provide for environmental information and education. The National Government shall establish minimum standards for environmental protection whereas Provincial and Municipal Governments shall fix specific standards and regulatory provisions.
 
On November 6, 2009, the Argentine Congress passed Law No. 25,675. Such law regulates the minimum standards for the achievement of a sustainable environment and the preservation and protection of biodiversity and fixes environmental policy goals.
 
Law No. 25,675 establishes the activities that will be subject to an environmental impact assessment procedure and certain requirements applicable thereto. In addition, such Law sets forth the duties and obligations that will be triggered by any damage to the environment and mainly provides for restoration of the environment to its former condition or, if that is not technically feasible, for payment of compensation in lieu thereof. Such Law also fosters environmental education and provides for certain minimum reporting obligations to be fulfilled by natural and legal entities.
 
In addition, the CNV Rules require the obligation to report to the CNV any events of any nature and fortuitous acts that seriously hinder or could potentially hinder performance of our activities, including any events that generate or may generate significant impacts on the environment, providing details on the consequences thereof.
 
The new Argentine Civil and Commercial Code has introduced as a novel feature the acknowledgement of collective rights, including the right to a healthy and balanced environment. Accordingly, the Argentine Civil and Commercial Code expressly sets forth that the law does not protect an abusive exercise of individual rights if such exercise could have an adverse impact on the environment and the rights with a collective impact in general.
 
Environmental matters
 
We consistently strive to act responsibly regarding protection of the environment in the management of our operating activities by preventing and minimizing the potential adverse environmental impacts of our activities. We have adopted an environmental impact policy, which is used as a reference for the realization of our investments. We are subject to environmental legislation under a series of laws, ordinances, norms, and national, provincial and municipal regulations of Argentina. Environmental obligations vary depending on the project site, the site’s environmental conditions, current and prior uses, and the activity proposed to be developed. Compliance with environmental laws may result in project delays or impose additional requirements that may result in substantial additional costs that may adversely affect our commercial activities. Before purchasing land or carrying out an investment on a plot of land, we carry out an environmental assessment of the parcel to identify possible environmental contingencies and analyze the possible environmental impact of the investment or the development to be carried out. Historically, our operations have not been negatively affected by the existence or potential existence of pollutants, nor by the failure to obtain environmental approvals or permits.
 
We intend to continue implementing plans that enhance our monitoring activities, in line with our commitment to and respect for the environment, our compliance obligations and with existing regulations, while seeking to optimize the use of resources.
 
 
25
 
 
Organizational Structure
 
The following table presents information relating to our ownership interest and the percentage of our consolidated total net revenues represented by our subsidiaries as of September 30, 2020:


% of ownership interest held by the Group
 
Name of the entity
Country
Main activity
 
As of September 30, 2020
 
IRSA’s direct interest:


IRSA CP(1) 
Argentina
Real estate
  80.65%
E-Commerce Latina S.A. 
Argentina
Investment
  100.00%
Efanur S.A. 
Uruguay
Investment
  100.00%
Hoteles Argentinos S.A.U. 
Argentina
Hotel
  100.00%
Inversora Bolívar S.A. 
Argentina
Investment
  100.00%
Llao Llao Resorts S.A.(2) 
Argentina
Hotel
  50.00%
Nuevas Fronteras S.A. 
Argentina
Hotel
  76.34%
Palermo Invest S.A. 
Argentina
Investment
  100.00%
Ritelco S.A. 
Uruguay
Investment
  100.00%
Tyrus S.A. 
Uruguay
Investment
  100.00%
U.T. IRSA y Galerías Pacifico(2)
Argentina
Investment
  50.00%
IRSA CP’s direct interest:


Arcos del Gourmet S.A. 
Argentina
Real estate
  90.00%
Emprendimiento Recoleta S.A. 
Argentina
Real estate
  53.68%
Fibesa S.A.(3) 
Argentina
Real estate
  100.00%
Panamerican Mall S.A. 
Argentina
Real estate
  80.00%
Shopping Neuquén S.A. 
Argentina
Real estate
  99.95%
Torodur S.A. 
Uruguay
Investment
  100.00%
EHSA 
Argentina
Investment
  70.00%
Centro de Entretenimiento La Plata
Argentina
Real estate
  100.00%
Pareto S.A. 
Argentina
design and software development
  69.69%
Tyrus S.A.’s direct interest:


DFL and DN BV 
Bermuda’s / Netherlands
Investment
  97.04%
I Madison LLC 
USA
Investment
   
IRSA Development LP 
USA
Investment
   
IRSA International LLC 
USA
Investment
  100.00%
Jiwin S.A. 
Uruguay
Investment
  100.00%
Liveck S.A. 
Uruguay
Investment
  100.00%
Real Estate Investment Group V LP (REIG V)
Bermuda’s
Investment
   
Real Estate Strategies LLC 
USA
Investment
  100.00%
Efanur S.A.’s direct interest:


Real Estate Investment Group VII LP (REIG VII)
Bermuda’s
Investment
  100.00%
 
(1) Includes interest held through E-Commerce Latina S.A. and Tyrus S.A..
(2) The Company has consolidated the investment in Llao Llao Resorts S.A. and UT IRSA and Galerías Pacífico considering its equity interest and a shareholder agreement that confers it majority of votes in the decision making process.
(3) Includes interest held through Ritelco S.A. and Torodur S.A.

Except for the aforementioned items the percentage of votes does not differ from stake.
 
The Company takes into account both quantitative and qualitative aspects in order to determine which non-controlling interests in subsidiaries are considered significant.
 
 
26
 
 
Property, Plant and Equipment
 
In the ordinary course of business, we lease property or spaces for administrative or commercial use both in Argentina under operating lease arrangements. The agreements include several clauses, including but not limited, to fixed, variable or adjustable payments.
 
The following table sets forth certain information about our properties for the Operation Center in Argentina as of September 30, 2020:
 
Property(6)


Leasable/ Sale sqm / Rooms
 
Location
 
Net Book Value ARS(2)
 
Use
 
Occupancy rate
 
República Building(3)
 
Apr-08
 
  19,885 
City of Buenos Aires
  12,383 
Office Rental
  86.9%
BankBoston Tower(3)(13)
 
Aug-07
 
  7,383 
City of Buenos Aires
  3,250 
Office Rental
  85.6%
Bouchard 551
 
Mar-07
 
   
City of Buenos Aires
  427 
Office Rental
   
Intercontinental Plaza Building(3)
 
Nov-97
 
  2,979 
City of Buenos Aires
  1,566 
Office Rental
  100%
Bouchard 710(3)(14)
 
Jun-05
 
  - 
City of Buenos Aires
  - 
Office Rental
  - 
Dot Building(3)
 
Nov-06
 
  11,242 
City of Buenos Aires
  5,834 
Office Rental
  84.9%
Zetta Building
 
Jun-19
 
  32,173 
City of Buenos Aires
  17,028 
Office Rental
  97.5%
Suipacha 664
 
Nov-91
 
  11,465 
City of Buenos Aires
  2,067 
Office Rental
  31.20%
Phillips Building
 
Jun-17
 
  8,017 
City of Buenos Aires
  3,683 
Office Rental
  85.80%
Catalinas Building
 
Jun-20
 
  N/A 
City of Buenos Aires
  18,698 
Office Rental
  N/A 
San Martín plot (ex Nobleza Picardo)
 
May-11
 
  109,610 
Province of Buenos Aires, Argentina
  7,594 
Other Rentals
  22.5%
Other Properties(5)
  N/A 
  N/A 
City and Province of Buenos Aires / Detroit U.S
  6,274 
Other Rentals
  N/A 
 
  N/A 


Abasto Shopping(3)
 
Nov-99
 
  36,761 
City of Buenos Aires, Argentina
  7,391 
Shopping Mall
  94.6%
Alto Palermo Shopping(3)
 
Dec-97
 
  18,655 
City of Buenos Aires, Argentina
  8,949 
Shopping Mall
  94.5%
Alto Avellaneda(3)
 
Dec-97
 
  38,801 
Province of Buenos Aires, Argentina
  5,043 
Shopping Mall
  96.2%
Alcorta Shopping(3)(12)
 
Jun-97
 
  15,725 
City of Buenos Aires, Argentina
  5,510 
Shopping Mall
  97.4%
Patio Bullrich(3)
 
Oct-98
 
  11,396 
City of Buenos Aires, Argentina
  2,534 
Shopping Mall
  89.7%
Alto Noa(3)
 
Nov-95
 
  19,313 
City of Salta, Argentina
  1,255 
Shopping Mall
  99.6%
Mendoza Plaza(3)
 
Dec-94
 
  43,123 
Mendoza, Argentina
  2,101 
Shopping Mall
  96.0%
Alto Rosario(3)
 
Dec-04
 
  33,682 
Santa Fe, Argentina
  4,458 
Shopping Mall
  98.3%
Córdoba Shopping –Villa Cabrera(3)(11)
 
Dec-06
 
  15,361 
City of Córdoba, Argentina
  1,374 
Shopping Mall
  98.1%
Dot Baires Shopping(3)
 
May-09
 
  48,805 
City of Buenos Aires, Argentina
  5,669 
Shopping Mall
  71.7%
Soleil Premium Outlet(3)
 
Jul-10
 
  15,156 
Province of Buenos Aires, Argentina
  2,013 
Shopping Mall
  95.9%
La Ribera Shopping(3)
 
Aug-11
 
  10,530 
Santa Fe, Argentina
  630 
Shopping Mall
  97.4%
Distrito Arcos (3)
 
Dec-14
 
  14,335 
City of Buenos Aires, Argentina
  2,037 
Shopping Mall
  95.9%
Alto Comahue(3)
 
Mar-15
 
  11,702 
Neuquén, Argentina
  1,366 
Shopping Mall
  93.9%
Patio Olmos(3)
 
Sep-97
 
   
City of Córdoba, Argentina
  1,240 
Shopping Mall
  N/A 
Caballito Plot of Land(3)
 
Nov-97
 
   
City of Buenos Aires
  4,353 
Land Reserve
  N/A 
Santa María del Plata
 
Oct-97
 
  116,100 
City of Buenos Aires
  7,594 
Other Rentals
  17.3%
Catalinas Building
 
May-10
 
   
City of Buenos Aires
  630 
Offices and Other Rentals
  N/A 
Luján plot of land(3)
 
May-08
 
  1,160,000 
Province of Buenos Aires, Argentina
  1,326 
Mixed uses
  N/A 
Other Land Reserves(4)
  N/A 
  N/A 
City and Province of Buenos Aires
  9,091 
Land Reserve
  N/A 
Building annexed to Alto Palermo Shopping
  N/A 
  N/A 
City of Buenos Aires
  2,160 
Properties under development
  N/A 
Other Developments(15)
  N/A 
  N/A 
City of Buenos Aires
  263 
Properties under development
  N/A 
Intercontinental Hotel(7)(12)
 
Nov-97
 
  313 
City of Buenos Aires
  640 
Hotel
  1.4%
Libertador Hotel(8)(12)
 
Mar-98
 
  200 
City of Buenos Aires
  309 
Hotel
  N/A 
Llao Llao Hotel(9)(10)(12)
 
Jun-97
 
  205 
City of Bariloche
  981 
Hotel
  N/A 
 
(1) Total leasable area for each property. Excludes common areas and parking spaces.
(2) Cost of acquisition or development plus improvements, less accumulated depreciation, less allowances for our Hotels (considering inflation adjustment). The remaining properties are valued at fair value.
(3) Through IRSA CP.
(4) Includes the following land reserves: Pontevedra plot; Mariano Acosta Plot, San Luis Plot, Pilar plot and Merlo plot (through IRSA) and Intercontinental Plot, the building and plot annexed to Dot, Mendoza Plot, Mendoza 2.992 East Av. Plot and La Plata plot (through IRSA CP).
(5) Includes the following properties: Anchorena 665, Anchorena 545 (Chanta IV), Zelaya 3102, 3103 y 3105, Madero 1020, La Adela, Paseo del Sol, Libertador 498, Beruti Parking Space Santa María del Plata and Detroit properties.
(6) Percentage of occupation of each property. Land reserves are assets that the company keeps in the portfolio for future developments.
(7) Through Nuevas Fronteras S.A.
(8) Through Hoteles Argentinos S.A.U.
(9) Through Llao Llao Resorts S.A.
(10) Includes “Terreno Bariloche.”
(11) The cinema building located at Córdoba Shopping – Villa Cabrera is included in Investment Properties, which is encumbered by a right of antichresis as a result of loan due to Empalme by NAI INTERNACIONAL II Inc. Includes “Ocampo parking spaces”
(12) Express in number of rooms.
(13) On November 5, 2020, our subsidiary IRSA CP sold four floor and fifteen parking spaces and on November 12, 2020, it sold three floors and fifteen parking spaces. For more information, see “Recent Developments – Boston Tower Sale.”
(14) On July 30, 2020, IRSA CP sold the entire building.
(15) Includes the following developments: EH UT, PH Office Park, Phillips Building and Alto Avellaneda.
 
 
27
 
 
 OPERATING AND FINANCIAL REVIEW AND PROSPECTS
 
A. Operating Results
 
The following management’s discussion and analysis of our financial condition and results of operations should be read together with “Selected Consolidated Financial Data” and Our Audited Consolidated Financial Statements and related notes appearing elsewhere in this Form 6-K. This discussion and analysis of our financial condition and results of operations contains forward-looking statements that involve risks, uncertainties and assumptions. These forward-looking statements include such words as, “expects,” “anticipates,” “intends,” “believes” and similar language. Our actual results may differ materially and adversely from those anticipated in these forward-looking statements as a result of many factors, including without limitation those set forth elsewhere in this Form 6-K. See Item 3 “Key Information – D. Risk Factors” for a more complete discussion of the economic and industry-wide factors relevant to us.
 
General
 
We prepare our Audited Consolidated Financial Statements in pesos and in accordance with IFRS, as issued by the IASB, and with CNV Rules. Our Audited Consolidated Financial Statements included elsewhere in this Form 6-K have been recast to: (a) present the audited consolidated financial statements in the measuring unit current at the end of the reporting period as of September 30, 2020 (the most recent period for which financial statements were included in this Form 6-K); and (b) reflect IRSA’s loss of control of IDBD and DIC on September 25, 2020 and, consequently, the deconsolidation of such investees since that date. As a result, income and expenses from our Operations Center in Israel have been presented within Discontinued Operations in the consolidated statements of income and other comprehensive income for the years ended June 30, 2020, 2019 and 2018. Accordingly, the following management’s discussion and analysis of our financial condition and results of operations will be focused primarily on our Operations Center in Argentina.
 
Our Audited Consolidated Financial Statements and the financial information included elsewhere in this Form 6-K have been prepared in accordance with IFRS. We have determined that, as of July 1, 2018, the Argentine economy qualifies as a hyperinflationary economy according to the guidelines of IAS 29 since the total cumulative inflation in Argentina in the 36 months prior to July 1, 2018 exceeded 100%. IAS 29 requires that the financial information recorded in a hyperinflationary currency be adjusted by applying a general price index and expressed in the measuring unit (the hyperinflationary currency) current at the end of the reporting period. Therefore, our Audited Consolidated Financial Statements included in this Form 6-K have been adjusted by applying a general price index. See “Risk Factors—Risks Relating to Argentina—A high level of uncertainty with regard to these economic variables, and a general lack of stability in terms of inflation, could have a negative impact on economic activity and adversely affect our financial condition
 
Overview
 
We are engaged, directly and indirectly through subsidiaries and joint ventures, in a range of diversified activities, primarily in real estate, including:
 
i. the acquisition, development and operation of shopping malls,
 
ii. the acquisition and development of office buildings and other non-shopping mall properties primarily for rental purposes,
 
iii. the development and sale of residential properties,
 
iv. the acquisition and operation of luxury hotels,
 
v. the acquisition of undeveloped land reserves for future development or sale, and
 
vi. selective investments outside Argentina.
 
Effects of the global macroeconomic factors
 
Until September 25, 2020, most of our assets were located in Israel and Argentina. Upon the loss of control on IDBD and DIC, we conduct our operations mostly in Argentina. Therefore, our financial condition and the results of our operations, as presented in our Audited Consolidated Financial Statements, are significantly dependent upon economic conditions prevailing in Argentina.
 
The table below shows Argentina’s GDP, inflation rates, dollar exchange rates, the appreciation (depreciation) of the Peso against the U.S. dollar, and the appreciation (depreciation) of the NIS against the U.S. dollar for the indicated periods (inter-annual information—which is the 12 month period preceding the dates presented—is presented to conform to our fiscal year periods).


As of September 30,
 
 
Fiscal year ended June 30,


2020
 
 
2020
 
 
2019
 
 
2018


(year-to-year data)
 
GDP (1) 
  (10.2)%
  (19.1)%
  (3.7)%
  2.0%
Inflation (IPIM)(2) 
  11.7%
  39.7%
  60.8%
  44.1%
Inflation (CPI) 
  7.6%
  42.8%
  55.8%
  29.5%
Depreciation of the Peso against the U.S. dollar 
  (8.2)%
  (66.1)%
  (47.1)%
  (73.7)%
Average exchange rate per USD1.00(3) 
ARS 76.1800
 
ARS 70.3600
 
 
ARS 42.3630
 
 
ARS 28.8000
 
Appreciation/ (depreciation) of the NIS against the U.S. Dollar
    
  3.0%
  2.4%
  (4.8)%
 
(1) Represents inter-annual growth of the last twelve months GDP average at constant prices (2004).
(2) IPIM (Índice de Precios Internos al por Mayor) is the wholesale price index as measured by the Argentine Ministry of Treasury.
(3) Represents average of the selling and buying exchange rate quoted by Banco de la Nación Argentina as of June 30, 2020. As of December 22, 2020, the exchange rate was 83.2500 per U.S. Dollar.
Source: INDEC and Banco de la Nación Argentina.
 
Argentine GDP contracted 10.2% during the third quarter of 2020 fiscal year, compared to the third quarter of 2019. Nationally, shopping mall sales decreased 82.2% in fiscal 2020 compared to fiscal 2019. As of June 30, 2020, the unemployment rate was at 13.1% of the country’s economically active population compared to 10.6% as of June 30, 2019. The monthly estimate of economic activity (“EMAE”) as of June 30, 2020, contracted by 12.3% compared to the same month in 2019. In the second quarter of 2020, the activity rate was 38.4%, the employment rate was 33.4% and the unemployment rate was 13.1%.
 
In the context of the health emergency related to the COVID-19 pandemic, the main impact on the labor market was verified in the dynamics of the employment rate (TE), which measures the proportion of employed persons in relation to the total population. The second quarter of 2020 showed a drop of 8.8 percentage points (p.p.) compared to the first quarter of the year and of 9.2 p.p. compared to the second quarter of 2019, driven by the lower proportion of people who were able to report to work. Due to COVID-19 pandemic, total sales at current prices in the month of June 2020 relevant to the survey reached a total of ARS 2,841.6 million, which represents a decrease of 82.2% compared to the month of June 2019.
 
Changes in short- and long-term interest rates, unemployment and inflation rates may reduce the availability of consumer credit and the purchasing power of individuals who frequent shopping malls. These factors, combined with low GDP growth, may reduce general consumption rates at our shopping malls. Since most of the lease agreements at our shopping malls, our main source of revenue, require tenants to pay a percentage of their total sales as rent, a general reduction in consumption may reduce our revenue. A reduction in the number of shoppers at our shopping malls and, consequently, in the demand for parking, may also reduce our revenues from services rendered.
 
Regarding Israel’s economy, and based on information published by OECD, despite a decline in residential investment, activity remained solid at the beginning of 2018, with strong public consumption and good export performance, particularly of services. After picking up to 3.3% in 2017, growth is projected to be around 3.7% in 2018 and 3.6% in 2019. Rising wage pressures are projected to lead to a steady increase in inflation.
 
Effects of inflation
 
The following are annual inflation rates during the fiscal years indicated, based on information published by the INDEC, an entity dependent of the Argentine Ministry of Treasury.


Consumer price index
 
 
Wholesale price index


(year-to-year data)
 
Fiscal Year ended June 30,


2018
  29.5%
  44.1%
2019
  55.8%
  60.8%
2020
  42.8%
  39.7%
As of September 30, 2020
7.6%
  11.7%
 
 
28
 
 
The current structure of IRSA CP’s leases contracts for shopping mall tenants generally include provisions that provide for payment of variable rent, which is a percentage of the IRSA CP’s shopping mall tenant’s sales. Therefore, the projected cash flows for these shopping malls generally are highly correlated with GDP growth and consumption power.
 
For the leases of spaces at our shopping malls we use for most tenants a standard lease agreement, the terms and conditions of which are described below. However, our largest tenants generally negotiate better terms for their respective leases. No assurance can be given that lease terms will be as set forth in the standard lease agreement.
 
The rent specified in our leases generally is the higher of (i) a monthly Base Rent and (ii) a specified percentage of the store’s monthly gross sales, which generally ranges between 2% and 10% of such sales. In addition, pursuant to the rent escalation clause in most of our leases, a tenant’s Base Rent generally increases between 10% and 15% on a semi-annual and cumulative basis from the seventh (7th) month following effectiveness of the lease. Although many of our lease agreements contain price adjustment provisions, these are not based on an official index nor do they reflect the inflation index. In the event of litigation regarding these adjustment provisions, there can be no assurance that we may be able to enforce such clauses contained in our lease agreements. See “Information of the Company—Business Overview—Our Shopping Malls—Principal Terms of our Leases.”
 
Continuing increases in the rate of inflation are likely to have an adverse effect on our operations. Although higher inflation rates in Argentina may increase minimum lease payments, given that tenants tend to pass on any increases in their expenses to consumers, higher inflation may lead to an increase in the prices our tenants charge consumers for their products and services, which may ultimately reduce their sales volumes and consequently the portion of rent we receive based on our tenants’ gross sales.
 
In addition, we measure the fair market value of our shopping malls based upon the estimated cash flows generated by such assets which, as discussed in previous paragraphs, is directly related to consumer spending since a significant component of the rent payment received from our tenants is tied to the sales realized by such tenants (i.e. is a percentage of the sales of our tenants). Therefore, macroeconomic conditions in Argentina have an impact in the fair market value of our shopping malls as measured in pesos. Specifically, since our tenants’ products have been adjusted (increased) to account for inflation of the peso, our expected cash flows from our shopping malls have similarly increased in nominal terms since rent is largely dependent on sales of our tenants in pesos.
 
Seasonality
 
Our business is directly affected by seasonality, influencing the level of our tenants’ sales. During Argentine summer holidays (January and February) our tenants’ sales typically reach their lowest level, whereas during winter holidays (July) and in Christmas (December) they reach their maximum level. Clothing retailers generally change their collections in spring and autumn, positively affecting our shopping malls’ sales. Discount sales at the end of each season are also one of the main seasonal factors affecting our business. See “Item 5.A. Operating Results – The Ongoing COVID-19 Pandemic.”
 
In Israel, the retail segment business’s results are subject to seasonal fluctuations as a result of the consumption behavior of the population proximate to the Passover holidays (March and/or April) and Rosh Hashanah and Sukkoth holidays (September and/or October). This also affects the balance sheet values of inventory, customers and suppliers. Revenues from cellular services are usually affected by seasonality with the third quarter of the year characterized by higher roaming revenues due to increased incoming and outgoing tourism.
 
Effects of interest rate fluctuations
 
Most of our U.S. dollar-denominated debt accrues interest at a fixed rate. An increase in interest rates will result in a significant increase in our financing costs and may materially affect our financial condition or our results of operations.
 
In addition, a significant increase of interest rates could deteriorate the terms and conditions in which our tenants obtain financing from banks and financial institutions in the market. As a consequence of that, if they suffer liquidity problems the collection of our lease contracts could be affected by an increase in the level of delinquency.
 
Effects of foreign currency fluctuations 
 
A significant portion of our financial debt is denominated in U.S. dollars. Therefore, a devaluation or depreciation of the peso against the U.S. dollar would increase our indebtedness measured in pesos and materially affect our results of operations. Foreign currency exchange restrictions imposed by the Argentine government could prevent or restrict our access to U.S. dollars, affecting our ability to service our U.S. dollar denominated- liabilities.
 
In addition, contracts for the rental of office buildings are generally stated in U.S. dollars, so a devaluation or depreciation of the peso against the U.S. dollar would increase the risk of delinquency on our lease receivables. 
 
As discussed above, we calculate the fair market value of our office properties based on comparable sales transactions. Typically real estate transactions in Argentina are transacted in U.S. dollars. Therefore, a devaluation or depreciation of the peso against the U.S. dollar would increase the value of our real estate properties measured in pesos and an appreciation of the peso would have the opposite effect. In addition, foreign currency exchange restrictions imposed by Argentine government could prevent or restrict the access to U.S. dollars for the acquisition of real estate properties, which are denominated and transacted in U.S dollars in Argentina, that could affect our ability to sell or acquire real estate properties and could have an adverse impact in real estate prices.
 
For more information about the evolution of the U.S dollar / Peso exchange rate, see “Exchange Rate and Exchange Controls.”
 
Fluctuations in the market value of our investment properties as a result of revaluations
 
Currently, our interests in investment properties are revalued quarterly. Any increase or decrease in the fair value of our investment properties, based on appraisal reports prepared by appraisers, is recorded in our consolidated statement of comprehensive income for the fiscal year during which the revaluation occurs. The revaluation of our properties may therefore result in significant fluctuations in the results of our operations.
 
Property values are affected by, among other factors, a) shopping malls, which are mainly impacted by the discount rate used (WACC), the projected GDP growth and the projected inflation and devaluation for future periods and b) office buildings, which are mostly impacted by the supply and demand of comparable properties and the U.S. dollar / peso exchange rate at the reporting period, as office buildings fair value is generally established in U.S. dollars For example:
 
during the 2018 fiscal year there was a 73.5% depreciation of the peso from ARS 16.63 to USD1.00 as of June 30, 2017 to ARS 28.85 to USD1.00 as of June 30, 2018.
 
during the 2019 fiscal year, there was a 47.1% depreciation of the peso from ARS 28.85 to USD1.00 as of June 30, 2018 to ARS 42.363 to USD1.00 as of June 30, 2019.
 
during the 2020 fiscal year, there was a 66.1% depreciation of the peso from ARS 42.363 to USD1.00 as of June 30, 2019 to ARS 70.36 to USD1.00 as of June 30, 2020.
 
during the first quarter of the 2021 fiscal year, there was a 8.2% depreciation of the peso from ARS 70.36 to USD 1.00 as of June 30, 2020 to ARS 76.18 to USD1.00 as of September 30, 2020.
 
The value of the Company investment properties is determined in U.S. dollar pursuant to the methodologies further described in “Critical Accounting Policies and estimates” and then determined in pesos (the Company functional and presentation currency).
 
In the past, purchases and sales of office buildings were usually settled in US dollars, However, as a consequence of the restrictions imposed by the BCRA on foreign exchange transactions, purchase and sales of office buildings are now usually settled in Argentine pesos, using an implicit exchange rate that is higher than the official one (as it was the case in the operations carried out by IRSA CP in the past few months). Therefore, IRSA CP has valued its office buildings and undeveloped parcels of land in Argentine pesos at the end of the year, considering the situation described above, which results in a gain with respect to the values previously recorded.
 
Factors Affecting Comparability of our Results
 
Comparability of information
 
Operations Center in Argentina
 
Office buildings
 
On June 30, 2019, IRSA CP’s Office portfolio consisted of 115,378 sqm of GLA after incorporating the recently inaugurated Zetta building. Additionally, we acquired the Maltería Hudson plot that has a surface area of 147,895 sqm and approximately 40,000 GLA at the intersection of Route 2 and Buenos Aires - La Plata highway.
 
On June 30, 2020, IRSA CP has acquired as an investment property the building “200 Della Paolera” located in Catalinas District in Buenos Aires. It consists of 35,208 sqm of gross leasable area over 30 office floors and includes 316 parking lots in 4 basements.
 
Shopping malls
 
During the fiscal years ended June 30, 2020 and 2019, we maintained the same portfolio of operating shopping malls. During the fiscal year ended June 30, 2019, the surface area of our Shopping Malls segment was reduced by 11,875 sqm due to the return of Buenos Aires Design, whose concession terminated in November 2018.
 
Operations Center in Israel
 
IDBD and DIC, our principal subsidiaries in the Operations Center in Israel, report their quarterly and annual results following Israeli regulations, whose filing deadlines fall after the filing deadlines in Argentina. In addition, IDBD and DIC fiscal year ends differ from our fiscal year end, consequently, we consolidate the results of operations from IDBD and DIC on a three-month lag basis adjusted for the effects of any significant transactions taking place within such period. As such, our consolidated statement of income and other comprehensive income for the year ended June 30, 2020 includes the results of IDBD and DIC for the 12-month period from April 1, 2019 to March 31, 2020, adjusted for the significant transactions that occurred between April 1, 2020 and June 30, 2020. As further described above, we lost control on IDBD and DIC on September 25, 2020 and thus, our Audited Consolidated Financial Statements included elsewhere in this Form 6-K present the results of operations of the Operations Center in Israel within Discontinued Operations.
 
 
29
 
 
Business Segment Reporting
 
IFRS 8 requires an entity to report financial and descriptive information about its reportable segments, which are operating segments or aggregations of operating segments that meet specified criteria. Operating segments are components of an entity about which separate financial information is available that is evaluated regularly by the CODM. According to IFRS 8, the CODM represents a function whereby strategic decisions are made and resources are assigned. The CODM function is carried out by the President of the Group, Mr. Eduardo S. Elsztain. Upon the acquisition of IDBD, two responsibility levels have been established for resource allocation and assessment of results of the two operations centers, through executive committees in Argentina and Israel.
 
Segment information is reported from two perspectives: geographic presence (Argentina and Israel) and products and services. In each operations center, the Group considers separately the various activities being developed, which represent reporting operating segments given the nature of its products, services, operations and risks. Management believes the operating segment clustering in each operations center reflects similar economic characteristics in each region, as well as similar products and services offered, types of clients and regulatory environments.
 
As described in “Presentation of Financial and Certain Other Information,” we lost control of IDBD and DIC on September 25, 2020 and, accordingly, we have presented the results of operations of the Operation Center in Israel within Discontinued Operations in our Audited Consolidated Financial Statements. Segment information for the years ended June 30, 2020, 2019 and 2018 and for the three-month period ended September 30, 2019, has been recast for purposes of comparability.
 
As from fiscal year 2018, the CODM reviews certain corporate expenses associated with each operations center in an aggregate manner and separately from each of the segments, such expenses have been disclosed in the "Corporate" segment of each operations center. Additionally, as from fiscal year 2018, the CODM reviews the offices business as a single segment and the entertainment business in an aggregate manner and separately from the offices segment. The entertainment business is presented within the "Others" segment.
 
Below is the segment information which was prepared as follows:
 
Operations Center in Argentina: Within this operations center, the Group operates in the following segments:
 
The “Shopping Malls” segment includes results principally comprised of lease and service revenues related to rental of commercial space and other spaces in the shopping malls of the Group.
 
The “Offices” segment includes the operating results from lease revenues of offices, other rental spaces and other service revenues related to the office activities.
 
The “Sales and Developments” segment includes the operating results of the development, maintenance and sales of undeveloped parcels of land and/or trading properties. Real estate sales results are also included.
 
The "Hotels" segment includes the operating results mainly comprised of room, catering and restaurant revenues.
 
The “International” segment includes assets and operating profit or loss from business related to associates Condor (hotels) and New Lipstick (offices).
 
The “Others” segment primarily includes the entertainment activities through ALG Golf Center S.A., La Rural S.A. and TGLT, and the financial activities carried out by BHSA.
 
The “Corporate” segment includes the expenses related to the corporate activities of the Operations Center in Argentina.
 
The CODM periodically reviews the results and certain asset categories and assesses performance of operating segments of this operations center based on a measure of profit or loss of the segment composed by the operating income plus the share of profit / (loss) of joint ventures and associates. The valuation criteria used in preparing this information are consistent with IFRS, the accounting standards used for the preparation of our Audited Consolidated Financial Statements, except for the following:
 
Operating results from joint ventures are evaluated by the CODM applying proportional consolidation method. Under this method, profit/loss and assets are reported in the Statement of Income and Other Comprehensive Income on a line-by-line basis, based on the percentage held in joint ventures rather than in a single item as required by IFRS. Management believes that the proportional consolidation method provides more useful information to understand the business return. On the other hand, the investment in the joint venture La Rural S.A. is accounted for under the equity method since this method is considered to provide more accurate information in this case.
 
Operating results from Shopping Malls and Offices segments do not include the amounts pertaining to building administration expenses and collective promotion funds (“FPC,” as per its Spanish acronym) as well as total recovered costs, whether by way of expenses or other concepts included under financial results (for example default interest and other concepts). The CODM examines the net amount from these items (total surplus or deficit between building administration expenses and FPC and recoverable expenses).
 
The assets’ categories examined by the CODM are: investment properties, property, plant and equipment, trading properties, inventories, right to receive future units under barter agreements, investment in associates and goodwill. The sum of these assets, classified by business segment, is reported under “assets by segment.” Assets are allocated to each segment based on the operations and/or their physical location.
 
Within the Operations Center in Argentina, most revenue from its operating segments is derived from, and their assets are located in, Argentina, except for the share of profit / (loss) of associates included in the “International” segment located in USA.
 
Revenues for each reporting segments derive from a large and diverse client base and, therefore, there is no revenue concentration in any particular segment.
 
Operations Center in Israel: Within this operations center, as of June 30, 2020, the Company operated in the following segments:
 
The “Real Estate” segment in which, through PBC, the Group operates rental properties and residential properties in Israel, USA and other parts of the world and carries out commercial projects in Las Vegas, USA. In this fiscal year, the Company lost control over Gav-Yam. Income was reclassified to discontinued operations and no longer forms part of this segment in this fiscal year. The comparative information has been adjusted accordingly. As of September 2019, Gav-Yam started to be accounted for as an associate.
 
The “Supermarkets” segment in which, through Shufersal, the Group operated a supermarket chain in Israel. Upon the loss of control in 2018 this segment was reclassified to discontinued operations and presented as an associate since 2019. Due to the loss of control, it was reclassified to discontinued operations and no longer represents a segment for fiscal year 2018.
 
The “Telecommunications” segment includes Cellcom whose main activities include the provision of mobile phone services, fixed line phone services, data, Internet and television, among others.
 
The "Insurance" segment includes the investment in Clal, insurance company which main activities includes pension and social security insurance, among others. As stated in Note 14, the Group does not have control over Clal; therefore, the business is reported in a single line as a financial asset held for sale and valued at fair value.
 
The "Others" segment includes other diverse business activities, such as technological developments, tourism, oil and gas assets, electronics, agricultural activities and others.
 
The “Corporate” segment includes the expenses related with the activities of the holding companies.
 
Goods and services exchanged between segments are calculated on the basis of established prices. Intercompany transactions between segments, if any, are eliminated.
 
 
30


Results of Operations for the Year ended June 30, 2020 compared to the Year ended June 30, 2019
 
Below is a summary of the operating segments by geography and a reconciliation between the total of the operating result according to the information by segments and the operating result according to the income statement for the years ended June 30, 2020 and 2019.


Operations Center in Argentina
 
 
Operations Center in Israel
 
 
Total Segment Information
 
 
Joint Ventures
 
 
Expenses and Collective Promotion Fund
 
 
Inter-segment eliminations and non-reportable assets / liabilities
 
 
Total income statement / statement of financial position
 
 
  06.30.20  
  06.30.19  
 
Var.
 
  06.30.20  
  06.30.19  
 
Var.
 
  06.30.20  
  06.30.19  
 
Var.
 
  06.30.20  
  06.30.19  
 
Var.
 
  06.30.20  
  06.30.19  
 
Var.
 
  06.30.20  
  06.30.19  
 
Var.
 
  06.30.20  
  06.30.19  
 
Var.
 
 
(in Million ARS)
 
Revenues
  11,991 
  16,208 
  (4,217)
  –– 
  –– 
  –– 
  11,991 
  16,208 
  (4,217)
  (65)
  (101)
  36 
  3,338 
  3,990 
  (652)
  (24)
  (26)
  2 
  15,240 
  20,071 
  (4,831)
Costs
  (2,940)
  (3,418)
  478 
  –– 
  –– 
  –– 
  (2,940)
  (3,418)
  478 
  57 
  71 
  (14)
  (3,476)
  (4,151)
  675 
  –– 
  –– 
  –– 
  (6,359)
  (7,498)
  1,139 
Gross profit/(loss)
  9,051 
  12,790 
  (3,739)
  –– 
  –– 
  –– 
  9,051 
  12,790 
  (3,739)
  (8)
  (30)
  22 
  (138)
  (161)
  23 
  (24)
  (26)
  2 
  8,881 
  12,573 
  (3,692)
Net gain/(loss) from fair value adjustment of investment properties
  36,596 
  (42,639)
  79,235 
  –– 
  –– 
  –– 
  36,596 
  (42,639)
  79,235 
  (283)
  902 
  (1,185)
  –– 
  –– 
  –– 
  –– 
  –– 
  –– 
  36,313 
  (41,737)
  78,050 
General and administrative expenses
  (2,317)
  (2,880)
  563 
  (99)
  (115)
  16 
  (2,416)
  (2,995)
  579 
  15 
  19 
  (4)
  –– 
  –– 
  - 
  36 
  48 
  (12)
  (2,365)
  (2,928)
  563 
Selling expenses
  (1,325)
  (1,168)
  (157)
  –– 
  –– 
  –– 
  (1,325)
  (1,168)
  (157)
  19 
  8 
  11 
  –– 
  –– 
  –– 
  –– 
  –– 
  –– 
  (1,306)
  (1,160)
  (146)
Impairment of associates and joint ventures
  –– 
  –– 
  –– 
  –– 
  –– 
  –– 
  –– 
  –– 
  –– 
  –– 
  –– 
  –– 
  –– 
  –– 
  –– 
  –– 
  –– 
  –– 
  –– 
  –– 
  - 
Other operating results, net
  (49)
  (711)
  662  
  ––  
  ––  
  ––  
  (49)
  (711)
  662  
  19  
  209  
  (190)
  18  
  18  
  ––  
  (12)
  (22)
  10  
  (24)
  (506)
  482  
Profit/(loss) from operations
  41,956  
  (34,608)
  76,564  
  (99)
  (115)
  16  
  41,857  
  (34,723)
  76,580  
  (238)
  1,108  
  (1,346)
  (120)
  (143)
  23  
  ––  
  ––  
  ––  
  41,499  
  (33,758)
  75,257  
Share of profit/(loss) of associates and joint ventures
  7,587  
  (6,492)
  14,079  
  ––  
  ––  
  ––  
  7,587  
  (6,492)
  14,079  
  184  
  (1,096)
  1,280  
  ––  
  ––  
  ––  
  ––  
  ––  
  ––  
  7,771  
  (7,588)
  15,359  
Segment profit/(loss)
  49,543  
  (41,100)
  90,643  
  (99)
  (115)
  16  
  49,444  
  (41,215)
  90,659  
  (54)
  12  
  (66)
  (120)
  (143)
  23  
  ––  
  ––  
  ––  
  49,270  
  (41,346)
  90,616  
Reportable assets
  170,379 
  120,102 
  50,277 
  485,812 
  576,561 
  (90,749)
  656,191 
  696,663 
  (40,472)
  (745)
  (656)
  (89)
  –– 
  –– 
  –– 
  19,764 
  34,279 
  (14,515)
  675,210 
  730,286 
  (55,076)
Reportable liabil-ities
  ––  
  ––  
  ––  
  (434,048)
  (496,305)
  62,257  
  (434,048)
  (496,305)
  62,257  
  ––  
  ––  
  ––  
  ––  
  ––  
  ––  
  (109,118)
  (101,937)
  (7,181)
  (543,166)
  (598,242)
  55,076  
Net reportable assets
  170,379  
  120,102  
  50,277  
  51,764  
  80,256  
  (28,492)
  222,143  
  200,358  
  21,785  
  (745)
  (656)
  (89)
  ––  
  ––  
  ––  
  (89,354)
  (67,658)
  (21,696)
  132,044  
  132,044  
  ––  
 
Operations Center in Argentina
 
Below is a summary analysis of the operating segments by products and services of the Operations Center in Argentina for the years ended June 30, 2020 and 2019.


Shopping Malls
 
 
Offices
 
 
Sales and Developments
 
 
Hotels
 
 
International
 
 
Corporate
 
 
Others
 
 
Total
 
 
  06.30.20  
  06.30.19  
 
Var.
 
 
  06.30.20  
  06.30.19  
 
Var.
 
 
  06.30.20  
  06.30.19  
 
Var.
 
 
  06.30.20  
  06.30.19  
 
Var.
 
 
  06.30.20  
  06.30.19  
 
Var.
 
 
  06.30.20  
  06.30.19  
 
Var.
 
 
  06.30.20  
  06.30.19  
 
Var.
 
 
  06.30.20  
  06.30.19  
 
Var.
 
 
(in Million ARS)
Revenues
  6,389 
  9,195 
  (2,806)
  2,539 
  2,409 
  130 
  791 
  1,205 
  (414)
  2,176 
  3,179 
  (1,003)
  12 
  15 
  (3)
  –– 
  –– 
  –– 
  84 
  205 
  (121)
  11,991 
  16,208 
  (4,217)
Costs
  (610)
  (835)
  225  
  (149)
  (141)
  (8)
  (722)
  (566)
  (156)
  (1,340)
  (1,707)
  367  
  (13)
  (6)
  (7)
  ––  
  ––  
  ––-  
  (106)
  (163)
  57  
  (2,940)
  (3,418)
  478  
Gross profit/(loss)
  5,779  
  8,360  
  (2,581)
  2,390  
  2,268  
  122  
  69  
  639  
  (570)
  836  
  1,472  
  (636)
  (1)
  9  
  (10)
  –– 
  –– 
  –– 
  (22)
  42  
  (64)
  9,051  
  12,790  
  (3,739)
Net gain/(loss) from fair value adjustment of investment properties
  (2,266)
  (43,687)
  41,421 
  25,067 
  663 
  24,404 
  13,111 
  782 
  12,329 
  –– 
  –– 
  –– 
  –– 
  6 
  (6)
  –– 
  –– 
  –– 
  684 
  (403)
  1,087 
  36,596 
  (42,639)
  79,235 
General and administrative expenses
  (892)
  (1,017)
  125 
  (238)
  (228)
  (10)
  (245)
  (305)
  60 
  (394)
  (530)
  136 
  (118)
  (118)
  - 
  (304)
  (560)
  256 
  (126)
  (122)
  (4)
  (2,317)
  (2,880)
  563 
Selling expenses
  (763)
  (571)
  (192)
  (90)
  (107)
  17 
  (212)
  (127)
  (85)
  (248)
  (340)
  92 
  –– 
  –– 
  –– 
  –– 
  –– 
  –– 
  (12)
  (23)
  11 
  (1,325)
  (1,168)
  (157)
Other operating results, net
  (40)
  (118)
  78  
  (30)
  (43)
  13  
  (29)
  (309)
  280  
  (22)
  123  
  (145)
  ––  
  (26)
  26  
  ––  
  ––  
  ––  
  72  
  (338)
  410  
  (49)
  (711)
  662  
Profit/(loss) from operations
  1,818  
  (37,033)
  38,851  
  27,099  
  2,553  
  24,546  
  12,694  
  680  
  12,014  
  172  
  725  
  (553)
  (119)
  (129)
  10  
  (304)
  (560)
  256  
  596  
  (844)
  1,440  
  41,956  
  (34,608)
  76,564  
Share of profit/(loss) of associates and joint ventures
  ––  
  ––  
  ––  
  ––  
  ––  
  ––  
  ––  
  (40)
  40  
  ––  
  ––  
  ––  
  7,942  
  (3,960)
  11,902  
  ––  
  ––  
  ––  
  (355)
  (2,492)
  2,137  
  7,587  
  (6,492)
  14,079  
Segment profit/(loss)
  1,818  
  (37,033)
  38,851  
  27,099  
  2,553  
  24,546  
  12,694  
  640  
  12,054  
  172  
  725  
  (553)
  7,823  
  (4,089)
  11,912  
  (304)
  (560)
  256  
  241  
  (3,336)
  3,577  
  49,543  
  (41,100)
  90,643  
Reportable assets
  53,165 
  54,277 
  (1,112)
  67,827 
  34,166 
  33,661 
  36,018 
  30,558 
  5,460 
  1,979 
  2,075 
  (96)
  2,488 
  (7,484)
  9,972 
  –– 
  –– 
  –– 
  8,902 
  6,510 
  2,392 
  170,379 
  120,102 
  50,277 
Reportable liabilities
  ––  
  ––  
  ––  
  ––  
  ––  
  ––  
  ––  
  ––  
  ––  
  ––  
  ––  
  ––  
  ––  
  ––  
  ––  
  ––  
  ––  
  ––  
  ––  
  ––  
  ––  
  ––  
  ––  
  ––  
Net reportable assets
  53,165  
  54,277  
  (1,112)
  67,827  
  34,166  
  33,661  
  36,018  
  30,558  
  5,460  
  1,979  
  2,075  
  (96)
  2,488  
  (7,484)
  9,972  
  ––  
  ––  
  ––  
  8,902  
  6,510  
  2,392  
  170,379  
  120,102  
  50,277  
 
 
31
 
 
Operations Center in Israel
 
Below is a summary analysis of the operating segments by products and services of the Operations Center in Israel for the years ended June 30, 2020 and 2019.


Real Estate
 
 
Supermarkets
 
 
Telecommunications
 
 
Insurance
 
 
Corporate
 
 
Others
 
 
Total
 
 
  06.30.20  
  06.30.19  
 
Var.
 
 
  06.30.20  
  06.30.19  
 
Var.
 
 
  06.30.20  
  06.30.19  
 
Var.
 
 
  06.30.20  
  06.30.19  
 
Var.
 
 
  06.30.20  
  06.30.19  
 
Var.
 
 
  06.30.20  
  06.30.19  
 
Var.
 
 
  06.30.20  
  06.30.19  
 
Var.
 
 
(in Million Pesos)
Revenues
  –– 
  –– 
  –– 
  –– 
  –– 
  –– 
  –– 
  –– 
  –– 
  –– 
  –– 
  –– 
  –– 
  –– 
  –– 
  –– 
  –– 
  –– 
  –– 
  –– 
  –– 
Costs
  ––  
  ––  
  ––  
  ––  
  ––  
  ––  
  ––  
  ––  
  ––  
  ––  
  ––  
  ––  
  ––  
  ––  
  ––  
  ––  
  ––  
  ––  
  ––  
  ––  
  ––  
Gross profit/(loss)
  ––  
  ––  
  ––  
  ––  
  ––  
  ––  
  ––  
  ––  
  ––  
  ––  
  ––  
  ––  
  ––  
  ––  
  ––  
  ––  
  ––  
  ––  
  ––  
  ––  
  ––  
Net gain/(loss) from fair value adjustment of investment properties
  –– 
  –– 
  –– 
  –– 
  –– 
  –– 
  –– 
  –– 
  –– 
  –– 
  –– 
  –– 
  –– 
  –– 
  –– 
  –– 
  –– 
  –– 
  –– 
  –– 
  –– 
General and administrative expenses
  –– 
  –– 
  –– 
  –– 
  –– 
  –– 
  –– 
  –– 
  –– 
  –– 
  –– 
  –– 
  (99)
  (115)
  16 
  –– 
  –– 
  –– 
  (99)
  (115)
  16 
Selling expenses
  –– 
  –– 
  –– 
  –– 
  –– 
  –– 
  –– 
  –– 
  –– 
  –– 
  –– 
  –– 
  –– 
  –– 
  –– 
  –– 
  –– 
  –– 
  –– 
  –– 
  –– 
Impairment of associates and joint ventures
  –– 
  –– 
  –– 
  –– 
  –– 
  –– 
  –– 
  –– 
  –– 
  –– 
  –– 
  –– 
  –– 
  –– 
  –– 
  –– 
  –– 
  –– 
  –– 
  –– 
  –– 
Other operating results, net
  ––  
  ––  
  ––  
  ––  
  ––  
  ––  
  ––  
  ––  
  ––  
  ––  
  ––  
  ––  
  ––  
  ––  
  ––  
  ––  
  ––  
  ––  
  ––  
  ––  
  ––  
Profit/(loss) from operations
  ––  
  ––  
  ––  
  ––  
  ––  
  ––  
  ––  
  ––  
  ––  
  ––  
  ––  
  ––  
  (99)
  (115)
  16  
  ––  
  ––  
  ––  
  (99)
  (115)
  16  
Share of profit/(loss) of associates and joint ventures
  ––  
  ––  
  ––  
  ––  
  ––  
  ––  
  ––  
  ––  
  ––  
  ––  
  ––  
  ––  
  ––  
  ––  
  ––  
  ––  
  ––  
  ––  
  ––  
  ––  
  ––  
Segment profit/(loss)
  ––  
  ––  
  ––  
  ––  
  ––  
  ––  
  ––  
  ––  
  ––  
  ––  
  ––  
  ––  
  (99)
  (115)
  16  
  ––  
  ––  
  ––  
  (99)
  (115)
  16  
Reportable assets
  164,649  
  326,652  
  (162,003)
  30,240  
  24,775  
  5,465  
  150,744  
  117,753  
  32,991  
  3,636  
  24,370  
  (20,734)
  19,282  
  44,716  
  (25,434)
  117,261  
  38,295  
  78,966  
  485,812  
  576,561  
  (90,749)
Reportable liabilities
  (157,533)
  (253,584)
  96,051  
  ––  
  ––  
  ––  
  (114,196)
  (91,292)
  (22,904)
  ––  
  ––  
  ––  
  (120,196)
  (136,275)
  16,079  
  (42,123)
  (15,154)
  (26,969)
  (434,048)
  (496,305)
  62,257  
Net reportable assets
  7,116  
  73,068  
  (65,952)
  30,240  
  24,775  
  5,465  
  36,548  
  26,461  
  10,087  
  3,636  
  24,370  
  (20,734)
  (100,914)
  (91,559)
  (9,355)
  75,138  
  23,141  
  51,997  
  51,764  
  80,256  
  (28,492)


32
 
 
Revenues 2020 vs 2019
 
Revenues from sales, leases, and services, according to the income statement, decreased by ARS 4,831 million, from ARS 20,071 million in the fiscal year ended June 30, 2019, to ARS 15,240 million in the fiscal year ended June 30, 2020 (from the Operations Center in Argentina). Excluding revenues from the Operations Center in Israel, revenues from sales, leases, and services decreased by 24.1% mainly explained by the closure of operations of shopping malls since March 20, 2020 due to COVID-19 pandemic.
 
In turn, revenues from expenses and Collective Promotion Fund decreased by 16.3%, from ARS 3,990 million (out of which ARS 3,670 million are allocated to the Shopping Malls segment and ARS 320 million to the Offices segment in the Operations Center in Argentina) in fiscal year ended June 30, 2019, to ARS 3,338 million (out of which ARS 3,074 million are allocated to the Shopping Malls segment and ARS 264 million to the Offices segment) in fiscal year ended June 30, 2020.
 
Moreover, revenues from our joint ventures decreased by 35.6%, from ARS 101 million in fiscal year ended June 30, 2019 (out of which ARS 82 million are allocated to the Shopping Malls segment; ARS 18 million to the Offices segment and ARS 1 million to the Sales and Developments segment of the Operations Center in Argentina), to ARS 65 million in fiscal year ended June 30, 2020 (out of which ARS 56 million are allocated to the Shopping Malls segment and ARS 9 million to the Offices segment of the Operations Center in Argentina).
 
Finally, revenues from inter-segment transactions decreased by ARS 2 million, from ARS 26 million in fiscal year ended June 30, 2019, to ARS 24 million in fiscal year ended June 30, 2020.
 
Therefore, according to information by segments, revenues decreased by ARS 4,217 million, from ARS 16,208 million in the fiscal year ended June 30, 2019 to ARS 11,991 million in fiscal year ended June 30, 2020 (from the Operations Center in Argentina). Excluding revenues from the Operations Center in Israel, revenues, according to information by segments, decreased by 26.0%.
 
Operations Center in Argentina
 
Shopping Malls. Revenues from the Shopping Malls segment decreased by 30.5% from ARS 9,195 million during fiscal year ended June 30, 2019, to ARS 6,389 million during fiscal year June 30, 2020 mainly explained by the closure of operations of shopping malls since March 20, 2020 due to COVID-19 pandemic. Such fall is mainly attributable to: (i) an ARS 2,056 million decrease in revenues from permanent and variable leases (total sales from our lessees went from ARS 101,665 million in fiscal year 2019 to ARS 75,321 million in fiscal year 2020); (ii) an ARS 211 million decrease in the Others segment, mainly attributable to the termination of the Walmart agreement; (iii) an ARS 200 million decrease in parking revenues; and (iv) an ARS 163 million decrease in admission rights.
 
Offices. Revenues from the Offices segment increased by 5.4% from ARS 2,409 million during fiscal year ended June 30,2019 to ARS 2,539 million during fiscal year ended June 30, 2020. This variation is mainly explained by an increase of 6% in revenues from leases, from ARS 2,365 million during the fiscal year ended June 30, 2019 to ARS 2,508 million during the fiscal year ended June 30, 2020, mainly as a result of an increase in leases of buildings, PH Office Park and Zeta Buildings, and by the effect of the exchange rate variation.
 
Sales and Developments. Revenues from the Sales and Developments segment recorded a 34.4% decrease, from ARS 1,205 million during fiscal year ended June 30, 2019, to ARS 791 million during fiscal year ended June 30, 2020. This segment often varies significantly from fiscal year to fiscal year to the non-recurrence of different sales transactions carried out by the Group over time.
 
Hotels. Revenues from our Hotels segment decreased by 31.6% from ARS 3,179 million during the fiscal year ended June 30, 2019 to ARS 2,176 million during the fiscal year ended June 30, 2020, mainly due to a decrease in revenues from Hoteles Argentinos S.A.U. as a result of a deflag process and due to the impact on revenues as a result of the fall in the tourist industry during March because of COVID 19.
 
International. Revenues from our International segment decreased by 20.0%, recording ARS 12 million during fiscal year ended June 30, 2020, due to an ARS 3 million decrease in revenues from leases.
 
Corporate. Revenues associated with our Corporate segment showed no variations for the reported fiscal years.
 
Others. Revenues from the Others segment decreased by 59.0% from ARS 205 million during fiscal year ended June 30, 2019 to ARS 84 million during fiscal year ended June 30, 2020, mainly due to the revenues derived from La Arena and La Rural S.A., OFC S.R.L., Ogden S.A. and Entretenimiento Universal S.A. – Joint venture – (Convention Center and Exhibitions of the City of Buenos Aires Administrator).
 
Costs 2020 vs 2019
 
Total consolidated costs, according to the income statement, decreased by ARS 1,139 million, from ARS 7,498 million in fiscal year ended June 30, 2019 to ARS 6,359 million in fiscal year ended June 30, 2020 (from the Operations Center in Argentina). Excluding costs derived from the Operations Center in Israel, costs decreased by 15.2%. Furthermore, consolidated total costs measured as a percentage of consolidated total revenues increased from 37.4% during fiscal year ended June 30, 2019 to 41.7% during fiscal year ended June 30, 2020. 
 
In turn, costs related to expenses and Collective Promotion Fund decreased by 16.3% from ARS 4,151 million during fiscal year ended June 30, 2019 (out of which ARS 3,825 million are allocated to the Shopping Malls segment and ARS 326 million to the Offices segment of the Operations Center in Argentina) to ARS 3,476 million during fiscal year ended June 30, 2020 (out of which ARS 3,200 million are allocated to the Shopping Malls segment and ARS 276 million to the Offices segment of the Operations Center in Argentina) mainly due to lower costs originated by our Shopping Malls, which decreased by 16.3% from ARS 3,825 million during fiscal ended June 30, 2019 to ARS 3,200 million during fiscal year ended June 30, 2020.
 
Likewise, costs from our joint ventures showed a 19.7% decrease, from ARS 71 million during fiscal year ended June 30, 2019 (out of which ARS 17 million are allocated to the Shopping Malls segment; ARS 45 million to the Offices segment and ARS 9 million to the Sales and Developments segment of the Operations Center in Argentina) to ARS 57 million during fiscal year ended June 30, 2020 (out of which ARS 7 million are allocated to the Shopping Malls segment; ARS 43 million to the Offices segment and ARS 7 million to the Sales and Developments segment of the Operations Center in Argentina).
 
Finally, costs from inter-segment operations showed no variations for the reported periods.
 
Therefore, according to information by segments (taking into account the costs from our joint ventures and without considering the costs associated with expenses and collective promotion fund or the costs from inter-segment operations), costs evidenced an decrease of ARS 478 million, from ARS 3,418 million during fiscal year ended June 30, 2019 to ARS 2,940 million during fiscal year ended June 30, 2020 (from the Operations Center in Argentina. Excluding costs derived from the Operations Center in Israel, costs decreased by 14.0%. Likewise, total costs, measured as a percentage of total revenues, according to information by segments, increased from 21.1% during fiscal year ended June 30, 2019 to 24.5% during fiscal year ended June 30, 2020.
 
Operations Center in Argentina
 
Shopping Malls. Costs associated with the Shopping Malls segment decreased by 26.9%, from ARS 835 million during fiscal year ended June 30, 2019 to ARS 610 million during fiscal year ended June 30, 2020, mainly due to: (i) a decrease in leases and expenses of ARS 140 million (mainly due to the transfer of the expenses deficit from the previous fiscal year); and (ii) a decrease in salaries, social security and other personnel administrative expenses of ARS 84 million. Costs associated with the Shopping Malls segment, measured as a percentage of the revenues from this segment, increased from 9.1% during fiscal year ended June 30, 2019 to 9.5% during fiscal year 2020.
 
Offices. Costs associated with the Offices segment increased by 5.7%, from ARS 141 million during fiscal year ended June 30, 2019 to ARS 149 million during fiscal year ended June 30, 2020, mainly due to (i) an increase in leases and expenses of ARS 37 million; offset by: (ii) a decrease in maintenance expenses of ARS 14 million; and (iii) a decrease in amortization and depreciation of ARS 12 million. Costs associated with the Offices segment, measured as a percentage the revenues from this segment, remained stable at 5.9% during fiscal years ended June 30, 2019 and 2020.
 
Sales and Developments. Costs associated with our Sales and Developments segment recorded a 27.6% increase from ARS 566 million during fiscal year ended June 30, 2019 to ARS 722 million during fiscal year ended June 30, 2020, mainly due to: (i) the exchange transaction with respect to the Coto air space, resulting in fees and compensation costs for ARS 57 million, and an increase in goods and services sale costs of ARS 19 million; and (ii) an increase in the cost of sale of goods and services generated by Catalinas in an amount of ARS 52 million. Costs in the Sales and Developments segment, measured as a percentage of revenues from this segment, increased from 47.0% during fiscal year ended June 30, 2019 to 91.3% during fiscal year ended June 30, 2020.
 
Hotels. Costs in the Hotels segment decreased by 21.5%, from ARS 1,707 million during fiscal year ended June 30, 2019 to ARS 1,340 million during fiscal year ended June 30, 2020, mainly as a result of (i) an ARS 203 million decrease in the costs of salaries, social security and other personnel expenses; (ii) an ARS 73 million decrease in maintenance, repair, and services; (iii) an ARS 41 million decrease in food, beverages and other hotel expenses; and (iv) an ARS 35 million decrease in fees and compensation services. Costs in the Hotels segment, measured as a percentage of revenues from this segment, increased from 53.7% during fiscal year ended June 30, 2019 to 61.6% during fiscal year ended June 30, 2020.
 
International. Costs in the International segment increased 116.7%, amounting to ARS 13 million during fiscal year ended June 30, 2020 and ARS 6 million during fiscal year ended June 30, 2019, mainly as a result of: (i) an ARS 5 million increase in maintenance, repair and services; (ii) an ARS 1 million increase in fees and compensation for services; and (iii) an ARS 1 million increase in taxes, fees, and contributions. Costs in the International segment, measured as a percentage of revenues from this segment, increased from 40.0% during fiscal year ended June 30, 2019 to 108.3% during fiscal year ended June 30, 2020.
 
Corporate. Costs in the Corporate segment did not vary in the reported fiscal years.
 
Others. Costs in the Others segment decreased by 35.0%, from ARS 163 million during fiscal year ended June 30, 2019 to ARS 106 million during fiscal year ended June 30, 2020, mainly as a result of: (i) an ARS 37 million decrease in leases and expenses; (ii) an ARS 32 million decrease in taxes, fees and contributions; and (iii) an ARS 23 million decrease in fees and compensation for services, partially offset by (iv) an ARS 39 million increase in depreciation and amortization.
 
 
33
 
 
Gross profit 2020 vs. 2019
 
The total consolidated gross profit, according to the income statement, decreased by ARS 3,692 million, from ARS 12,573 million during fiscal year ended June 30, 2019 to ARS 8,881 million during fiscal year ended June 30, 2020 (from the Operations Center in Argentina). Excluding gross profit derived from the Operations Center in Israel, the gross profit decreased by 29.4%. The total consolidated gross profit, measured as a percentage of revenues, decreased from 62.6% during fiscal year ended June 30, 2019 to 58.3% during fiscal year ended June 30, 2020.
 
In turn, total gross profit (loss) on account of expenses and collective promotion fund decreased by ARS 23 million, from ARS 161 million during fiscal year ended June 30, 2019 (out of which a loss of ARS 155 million derives from the Shopping Malls segment and a loss of ARS 6 million from the Offices segment), to ARS 138 million during fiscal year ended June 30, 2020 (out of which a loss of ARS 126 million derives from the Shopping Malls segment and other loss of ARS 12 million from the Offices segment).
 
Additionally, the gross profit (loss) from our joint ventures decreased by 73.3%, from ARS 30 million during fiscal year ended June 30, 2019 to ARS 8 million during fiscal year ended June 30, 2020.
 
Therefore, according to information by segments, gross profit decreased by ARS 3,739 million, from ARS 12,790 million during fiscal year ended June 30, 2019 to ARS 9,051 million during fiscal year ended June 30, 2020 (from the Operations Center in Argentina). Excluding gross profit derived from the Operations Center in Israel, the gross profit decreased by 29.2%. In addition, gross profit, measured as a percentage of revenues, according to information by segments, decreased from 78.9% during fiscal year ended June 30, 2019 to 75.5% during fiscal year ended June 30, 2020.
 
Operations Center in Argentina
 
Shopping Malls. Gross profit from the Shopping Malls segment decreased by 30.9%, from ARS 8,360 million during fiscal year ended June 30, 2019 to ARS 5,779 million during fiscal year ended June 30, 2020, mainly as a result of a decrease in total sales of our lessees in real terms, thus resulting in lower percentage rentals under our lease agreements. Gross profit from the Shopping Malls segment as a percentage of the segment revenues, slightly decreased from 90.9% during fiscal year ended June 30, 2019 to 90.5% during fiscal year ended June 30, 2020.
 
Offices. Gross profit from the Offices segment increased by 5.4% from ARS 2,268 million during fiscal year ended June 30, 2019 to ARS 2,390 million during fiscal year ended June 30, 2020. Gross profit from the Offices segment, measured as percentage of revenues from this segment, remained stable at 94.1% during fiscal years ended June 30, 2019 and 2020.
 
Sales and developments. Gross profit from the Sales and Developments segment decreased by 89.2%, from ARS 639 million during fiscal year ended June 30, 2019 to ARS 69 million fiscal year ended June 30, 2020. Gross profit from the Sales and Developments segment, measured as a percentage of revenues from this segment, decreased from 53% during fiscal year ended June 30, 2019 to 8.7% during fiscal year ended June 30, 2020.
 
Hotels. Gross profit from the Hotels segment decreased by 43.2% from ARS 1,472 million during fiscal year ended June 30, 2019 to ARS 836 million during fiscal year ended June 30, 2020. Gross profit from the Hotels segment, measured as a percentage of revenues from this segment, decreased from 46.3% during fiscal year ended June 30, 2019 to 38.4% during fiscal year ended June 30, 2020.
 
International. Gross profit from the International segment decreased by 111.1%, as a gross profit of ARS 9 million was recorded during fiscal year ended June 30, 2019 and an ARS 1 million gross loss was recorded during fiscal year ended June 30, 2020. Gross profit from the International segment, measured as a percentage of revenues from this segment, decreased from 60.0% positive during fiscal year ended June 30, 2019 to 8.3% negative during fiscal year ended June 30, 2020.
 
Corporate. Gross profit from the Corporate segment did not show any variations during the reported fiscal years.
 
Others. Gross profit from the Others segment decreased by 152.4% from a profit of ARS 42 million during fiscal year ended June 30, 2019 to an ARS 22 million loss during fiscal year ended June 30, 2020. Gross profit from the Others segment, measured as a percentage of revenues from this segment, increased from 20.5% positive during fiscal year ended June 30, 2019 to 26.2% negative during fiscal year ended June 30, 2020.
 
Net gain (loss) from fair value adjustment of investment properties 2020 vs 2019
 
Total consolidated net gain/(loss) from fair value adjustment of investment properties, according to the income statement, increased by ARS 78,050 million, from a net loss of ARS 41,737 million during fiscal year ended June 30, 2019 to a net gain of ARS 36,313 million during fiscal year ended June 30, 2020 (from the Operations Center in Argentina).
 
Operations Center in Argentina
 
For the fiscal year ended June 30, 2020, the net gain/(loss) from fair value adjustment of investment properties was a gain of ARS 36,596 million (an ARS 2,266 million loss from our Shopping Malls segment; an ARS 25,067 million gain from our Offices segment; an ARS 13,111 million gain of our Sales and Developments segment; and an ARS 684 million gain of our Other segment).
 
The net impact of prices in Pesos of our properties mainly resulted from a change in macroeconomic conditions: (i) the Argentine gross domestic product growth rate estimated for 2020 decreased from 2.2% to -11%; (ii) from June 2019 to June 2020, the Argentine Peso depreciated by 66% with respect to the US Dollar (from ARS 42.26 per USD 1.00 to ARS 70.26 per USD 1.00) which mainly resulted in a decrease in projected cash flows in US Dollars from the Shopping Malls; and (iii) an 8 base point increase in the Dollar discount rate at which the projected cash flow from Shopping Malls is discounted.
 
The offices market in Argentina is a liquid market, in which a great number of counterparties participates carrying out sale-purchase transactions. This situation results in significant and representative sale-purchase prices. Furthermore, lease agreements are denominated in US dollars and are usually executed for three-year terms, hence this business produces stable cash flows in US dollars. In this sense, we use the Market Approach method to determine the fair value of our Offices and Others segment, the value per sqm being the most representative measurement.
 
Since September 2019, the real estate market experienced certain operational changes due to the adoption of foreign exchange regulations. As a result, it is very likely that office buildings/lands reserved sales be settled in Pesos at an implied exchange rate higher than the official exchange rate, which can be observed in the transactions conducted by the Company during 2020. Therefore, we have valued our offices and lands reserves in Pesos at the date of each statement of financial position considering the aforementioned situation, thus resulting in a gain with respect to the previously recorded values.
 
General and administrative expenses 2020 vs 2019
 
Total general and administrative expenses, according to the income statement, recorded an decrease of ARS 563 million, from ARS 2,928 million during the fiscal year ended June 30, 2019 (out of which ARS 115 million derive from the Operations Center in Israel and ARS 2,813 million from the Operations Center in Argentina) to ARS 2,365 million during the fiscal year ended June 30, 2020 (out of which ARS 99 million derive from the Operations Center in Israel and ARS 2,266 million from the Operations Center in Argentina). Excluding the effect from the Operations Center in Israel, administrative expenses decreased by 19.4%. Total administrative expenses, measured as a percentage of revenues, slightly increased from 14.6% during the fiscal year ended June 30, 2019 to 15.5% during the fiscal year ended June 30, 2020. Excluding the effect from the Operations Center in Israel, total general and administrative expenses, measured as a percentage of revenues, increased from 14.0% during the fiscal year ended June 30, 2019 to 14.9% during the fiscal year ended June 30, 2020.
 
In turn, administrative expenses of our joint ventures decreased by ARS 4 million, from ARS 19 million during the fiscal year ended June 30, 2019 to ARS 15 million during the year ended June 30, 2020.
 
Finally, administrative expenses for inter-segment transactions decreased by ARS 12 million, from ARS 48 million during the fiscal year ended June 30, 2019 to ARS 36 million during the fiscal year ended June 30, 2020.
 
Therefore, according to information by segments, administrative expenses decreased by ARS 579 million, from ARS 2,995 million during the fiscal year ended June 30, 2019 (out of which ARS 115 million derive from the Operations Center in Israel and ARS 2,880 million derive from the Operations Center in Argentina) to ARS 2,416 million during the fiscal year ended June 30, 2020 (out of which ARS 99 million derive from the Operations Center in Israel and ARS 2,317 million from the Operations Center in Argentina). Excluding the administrative expenses from the Operations Center in Israel, expenses decreased by 19.5%. Administrative expenses, measured as a percentage of revenues, slightly increased from 18.5% during the fiscal year ended June 30, 2019 to 20.1% during the fiscal year ended June 30, 2020. Without considering the effects from the Operations Center in Israel, total administrative expenses, measured as a percentage of total revenues, showed an increase, from 17.8% during the fiscal year ended June 30, 2019 to 19.3% during the fiscal year ended June 30, 2020.
 
Operations Center in Argentina
 
Shopping Malls. Administrative expenses of Shopping Malls decreased by 12.3%, from ARS 1,017 million during the fiscal year ended June 30, 2019 to ARS 892 million during the fiscal year ended June 30, 2020, mainly due to: (i) a decrease of ARS 92 million in salaries, social security charges and other personnel administrative expenses; (ii) a decrease of ARS 58 million in fees payable to directors, partially offset by: (iii) an increase of ARS 20 million in amortization and depreciation and; (iv) an increase of ARS 11 million in fees and compensation for services. Administrative expenses of Shopping Malls, measured as a percentage of revenues from such segment, increased from 11.1% during the fiscal year ended June 30, 2019 to 14.0% during the fiscal year ended June 30, 2020.
 
Offices. The general and administrative expenses of our Offices segment increased by 4.4%, from ARS 228 million during the fiscal year ended June 30, 2019 to ARS 238 million during the fiscal year ended June 30, 2020, mainly as a result of: (i) an increase of ARS 7 million in fees and compensation for services; and (ii) an increase of ARS 2 million in taxes, rates and contributions. General and administrative expenses, measured as a percentage of revenues from the same segment, decreased from 9.5% during the fiscal year ended June 30, 2019 to 9.4% during the fiscal year ended June 30, 2020.
 
Sales and Developments. General and administrative expenses associated with our Sales and Developments segment decreased by 19.7%, from ARS 305 million during the fiscal year ended June 30, 2019 to ARS 245 million during the fiscal year ended June 30, 2020, mainly as a result of: (i) a decrease in salaries, social security and other personnel administrative expenses of ARS 28 million; (ii) a decrease of ARS 14 million in publicity, advertising and other commercial expenses; (iii) a decrease of ARS 6 million in leases and building administrative expenses; and (iv) a decrease of ARS 5 million in fees and compensation for services. General and administrative expenses, measured as a percentage of revenues from the same segment, slightly increased from 25.3% during the fiscal year ended June 30, 2019 to 31.0% during the fiscal year ended June 30, 2020.
 
 
34
 
 
Hotels. General and administrative expenses associated with our Hotels segment decreased by 25.7% from ARS 530 million during the fiscal year ended June 30, 2019 to ARS 394 million during the fiscal year ended June 30, 2020, mainly as a result of: (i) an ARS 60 million decrease in fees and compensation for services; (ii) an ARS 54 million decrease in salaries, social security and other personnel administrative expenses; (iii) an ARS 16 million decrease in maintenance, security, cleaning, repairs and related expenses and (iv) an ARS 8 million decrease in taxes, rates and contributions. General and administrative expenses associated with the Hotels segment, measured as a percentage of revenues from this segment, increased from 16.7% during the fiscal year ended June 30, 2019 to 18.1% during the fiscal year ended June 30, 2020.
 
International. General and administrative expenses associated with our International segment showed no variation and expenses in the amount of ARS 118 million were recorded during the fiscal years ended June 30, 2019 and 2020.
 
Corporate. General and administrative expenses associated with our Corporate segment decreased by 45.7%, from ARS 560 million during the fiscal year ended June 30, 2019 to ARS 304 million during the fiscal year ended June 30, 2020, mainly as a result of: (i) an ARS 215 million decrease in fees payable to directors; and (ii) an ARS 43 million decrease in salaries, social security and other personnel administrative expenses.
 
Others. General and administrative expenses associated with our Others segment increased by 3.3%, from ARS 122 million during the fiscal year ended June 30, 2019 to ARS 126 million during the fiscal year ended June 30, 2020, mainly due to (i) an increase of ARS 9 million in maintenance, repairs and services; partially offset by (ii) a decrease of ARS 5 million in taxes, rates and contributions.
 
Operations Center in Israel
 
Corporate. General and administrative expenses associated with the Corporate segment decreased from ARS 115 million during the fiscal year ended June 30, 2019 to ARS 99 million during the fiscal year ended June 30, 2020. Such variation was due to a decrease in fees and compensation for services.
 
Selling expenses 2020 vs 2019
 
Total consolidated selling expenses, according to the income statement, showed an increase of ARS 146 million, from ARS 1,160 million during the fiscal year ended June 30, 2019 to ARS 1,306 million during the fiscal year ended June 30, 2020 (from the Operations Center in Argentina). Excluding selling expenses from the Operations Center in Israel, selling expenses increased by 12.6%. Total consolidated selling expenses, measured as a percentage of revenues from sales, leases and services, increased from 5.8% during the fiscal year ended June 30, 2019 to 8.6% during the fiscal year ended June 30, 2020.
 
In turn, selling expenses of our joint ventures increased by ARS 11 million, from ARS 8 million during the fiscal year ended June 30, 2019 to ARS 19 million during the fiscal year ended June 30, 2020.
 
Therefore, according to information by segments, selling expenses increased by ARS 157 million from ARS 1,168 million during the fiscal year ended June 30, 2019 to ARS 1,325 million during the fiscal year ended June 30, 2020 (from the Operations Center in Argentina). Excluding selling expenses from the Operations Center in Israel, selling expenses increased by 13.4%. Selling expenses, measured as a percentage of revenues, according to information by segments, increased from 7.2% during the fiscal year ended June 30, 2019 to 11.0% during the fiscal year ended June 30, 2020. Without considering the effects from the Operations Center in Israel, total selling expenses, measured as a percentage of total revenues according to information by segments, showed an increase, from 7.2% during the fiscal year ended June 30, 2019 to 11.0% during the fiscal year ended June 30, 2020.
 
Operations Center in Argentina
 
Shopping Malls. Selling expenses of the Shopping Malls segment increased by 33.6%, from ARS 571 million during the fiscal year ended June 30, 2019 to ARS 763 million during the fiscal year ended June 30, 2020, mainly as a result of: (i) an increase in the charge of doubtful accounts of ARS 235 million, partially offset by (ii) a decrease in the charge of taxes, rates and contributions of ARS 24 million; (iii) a decrease in the charge of publicity, advertising and other commercial expenses of ARS 11 million; and (iv) a decrease in salaries, social security and other personnel administrative expenses of ARS 4 million. Selling expenses, measured as a percentage of revenues from the Shopping Malls segment, increased from 6.2% during the fiscal year ended June 30, 2019 to 11.9% during the fiscal year ended June 30, 2020.
 
Offices. Selling expenses associated with our Offices segment decreased by 15.9% from ARS 107 million during the fiscal year ended June 30, 2019 to ARS 90 million during the fiscal year ended June 30, 2020. Such variation was mainly generated as a result of: (i) an ARS 10 million decrease in publicity, advertising, and other commercial expenses; and (ii) an ARS 10 million decrease in the charge of doubtful accounts. Selling expenses associated with our Offices segment, measured as a percentage of revenues from this segment, decreased from 4.4% during the fiscal year ended June 30, 2019 to 3.5% during the fiscal year ended June 30, 2020.
 
Sales and Developments. Selling expenses associated with our Sales and Developments segment increased by 66.9% from ARS 127 million during the fiscal year ended June 30, 2019 to ARS 212 million during the fiscal year ended June 30, 2020. Such variation was mainly generated by: (i) an ARS 85 million increase in taxes, rates and contributions; (ii) an ARS 12 million increase in publicity, advertising and other commercial expenses, offset by: (iii) an ARS 8 million decrease in the charge of doubtful accounts; (iv) an ARS 2 million decrease in salaries, social security and other personnel administrative expenses; and (v) an ARS 2 million decrease in fees and compensation for services. Selling expenses associated with our Sales and Developments segment, measured as a percentage of revenues from this segment, increased from 10.5% during the fiscal year ended June 30, 2019 to 26.8% during the fiscal year ended June 30, 2020.
 
Hotels. Selling expenses associated with our Hotels segment decreased by 27.1% from ARS 340 million during the fiscal year ended June 30, 2019 to ARS 248 million during the fiscal year ended June 30, 2020, mainly as a result of: (i) an ARS 47 million decrease in the charge of taxes, rates and contributions; (ii) an ARS 21 million decrease in publicity, advertising and other commercial expenses; (iii) an ARS 12 million decrease in fees and compensation for services; and (iv) an ARS 10 million decrease in salaries, social security and other personnel administrative expenses. Selling expenses associated with our Hotels segment, measured as a percentage of revenues from this segment, slightly increased from 10.7% during the fiscal year ended June 30, 2019 to 11.4% during the fiscal year ended June 30, 2020.
 
International. Selling expenses associated with the International segment were not recorded in both fiscal years.
 
Corporate. Selling expenses associated with the Corporate segment were not recorded in both fiscal years.
 
Others. Selling expenses associated with our Others segment decreased by 47.8% from ARS 23 million during the fiscal year ended June 30, 2019 to ARS 12 million during the fiscal year ended June 30, 2020, mainly due to: (i) an ARS 5 million decrease in the charge of doubtful accounts; and (ii) an ARS 4 million decrease in taxes, rates and contributions. Selling expenses associated with our Others segment, measured as a percentage of revenues from this segment, increased from 11.2% during the fiscal year ended June 30, 2019 to 14.3% during the fiscal year ended June 30, 2020.
 
Other operating results, net 2020 vs 2019
 
Other operating results, net, according to the income statement, recorded a variation of ARS 482 million, from a net loss of ARS 506 million during the fiscal year ended June 30, 2019, to a net loss of ARS 24 million during the fiscal year ended June 30, 2020 (from the Operations Center in Argentina).
 
Other operating results, net, from our joint ventures decreased by ARS 190 million, from a net profit of ARS 209 million during the fiscal year ended June 30, 2019 to a net profit of ARS 19 million during the fiscal year ended June 30, 2020 (out of which a profit of ARS 2 million derives from the Sales and Developments segment, an ARS 19 million profit is allocated to the Offices segment and a loss of ARS 2 million is allocated to the Shopping Malls segment).
 
In turn, other operating results on account of building administration expenses and collective promotion fund remained unchanged in the reported fiscal years.
 
Therefore, according to information by segments, the other operating results line, net, increased by ARS 662 million, from a net loss of ARS 711 million during the fiscal year ended June 30, 2019 to a net loss of ARS 49 million during the fiscal year ended June 30, 2020.
 
Operations Center in Argentina
 
Shopping Malls. Other operating results, net associated with our Shopping Malls segment decreased by 66.1%, from a net loss of ARS 118 million during the fiscal year ended June 30, 2019 to a net loss of ARS 40 million during the fiscal year ended June 30, 2020, mainly as a result of: (i) a lower charge of donations of ARS 58 million; and (ii) an increase in Others of ARS 27 million, mainly due to a loss for indemnification payment recognized in 2019, partially offset by: (iii) an ARS 13 million decrease in interest earned on operating assets. Other operating results, net, from this segment, as a percentage of revenues from this segment, decreased from 1.3% negative during the fiscal year ended June 30, 2019 to 0.6% negative during the fiscal year ended June 30, 2020.
 
Offices. Other operating results, net associated with our Offices segment decreased by 30.2%, from a net loss of ARS 43 million during the fiscal year ended June 30, 2019 to a net loss of ARS 30 million during the fiscal year ended June 30, 2020, mainly as a consequence of an ARS 17 million decrease in donations, among other items. Other operating results, net from this segment, as a percentage of the revenues from this segment, decreased from 1.8% negative during the fiscal year ended June 30, 2019 to 1.2% negative during the fiscal year ended June 30, 2020.
 
Sales and Developments. Other operating results, net associated with our Sales and Developments segment decreased by 90.6%, from a net loss of ARS 309 million during the fiscal year ended June 30, 2019 to a net loss of ARS 29 million during the fiscal year ended June 30, 2020, mainly as a result of a decrease in the provision set up for the write-off of the Puerto Retiro plot of land and a decrease in donations, among other items. Other operating results, net from this segment, as a percentage of the revenues of this segment, decreased from 25.6% negative during the fiscal year ended June 30, 2019 to 3.7% negative during the fiscal year ended June 30, 2020.
 
Hotels. Other operating results, net associated with the Hotels segment decreased by 117.9%, from a net profit of ARS 123 million during the fiscal year ended June 30, 2019 to a net loss of ARS 22 million during the fiscal year ended June 30, 2020, mainly due to an insurance recovery associated with a boiler-related loss during fiscal year 2019. Other operating results, net from this segment, as a percentage of the revenues from this segment, decreased from 3.9% positive during the fiscal year ended June 30, 2019 to 1.0% negative during the fiscal year ended June 30, 2020.
 
International. Other operating results, net associated with the International segment showed a net loss of ARS 26 million during the fiscal year ended June 30, 2019. No charge was recognized during the fiscal year ended June 30, 2020, mainly due to a decrease in donations.
 
Corporate. Other operating results, net associated with the Corporate segment showed no variations between the reported fiscal years.
 
 
35
 
 
Others. Other operating results, net associated with the Others segment increased by 121.3%, from a net loss of ARS 338 million during the fiscal year ended June 30, 2019 to a net profit of ARS 72 million during the fiscal year ended June 30, 2020, mainly due to a loss from the sale of Tarshop S.A. and the impairment of the goodwill of La Arena during the comparative fiscal year. Other operating results, net from this segment, as a percentage of the revenues from this segment, decreased from 164.9% negative during the fiscal year ended June 30, 2019 to 85.7% positive during the fiscal year ended June 30, 2020.
 
Profit / (loss) from operations 2020 vs 2019
 
Total consolidated profit/ (loss) from operations, according to the income statement, increased from a net loss of ARS 33,758 million during the fiscal year ended June 30, 2019 to a net profit of ARS 41,499 million during the fiscal year ended June 30, 2020 (out of which a net loss of ARS 99 million derives from the Operations Center in Israel and a net profit of ARS 41,598 from the Operations Center in Argentina). Excluding the effect from the Operations Center in Israel, the profit/(loss) from operations varied by 223.6%. Total consolidated profit/(loss) from operations, measured as a percentage of revenues from sales, leases and services, increased from 168.2% negative during the fiscal year ended June 30, 2019 to 272.3% positive during the fiscal year ended June 30, 2020. Excluding the effect from the Operations Center in Israel, total consolidated profit/(loss) from operations, measured as a percentage of total revenues, increased from 167.6% negative during the fiscal year ended June 30, 2019 to 273.0% positive during the fiscal year ended June 30, 2020.
 
Profit/(loss) from operations from our joint ventures decreased from a profit of ARS 1,108 million during the fiscal year ended June 30, 2019 (out of which a net profit of ARS 125 million is allocated to the Shopping Malls segment; a net profit of ARS 758 million to the Offices segment and a profit of ARS 225 million to the Sales and Developments segment, of the Operations Center in Argentina) to a net loss of ARS 238 million during the fiscal year ended June 30, 2020 (out of which a profit of ARS 16 million is allocated to the Shopping Malls segment, a net loss of ARS 266 million to the Offices segment, and a profit of ARS 12 million to the Sales and Developments segment, of the Operations Center in Argentina).
 
Therefore, according to information by segments, the net profit from operations increased from a net loss of ARS 34,723 million during the fiscal year ended June 30, 2019 to a net profit of ARS 41,857 million during the fiscal year ended June 30, 2020 (out of which a net loss of ARS 99 million derives from the Operations Center in Israel and a net profit of ARS 41,956 million derives from the Operations Center in Argentina). The profit/(loss) from operations, measured as a percentage of revenues, according to information by segments, increased from a 214.2% loss during the fiscal year ended June 30, 2019 to a 349.1% profit during the fiscal year ended June 30, 2020. Excluding the effect from the Operations Center in Israel, total profit/(loss) from operations, according to information by segments, measured as a percentage of total revenues, increased from a 213.5% loss during the fiscal year ended June 30, 2019 to a 349.9% profit during the fiscal year ended June 30, 2020.
 
Operations Center in Argentina
 
Shopping Malls. Profit/(loss) from operations associated with the Shopping Malls segment increased from a loss of ARS 37,033 million during the fiscal year ended June 30, 2019 to a profit of ARS 1,818 million during the fiscal year ended June 30, 2020.
 
Offices. Profit / (loss) from operations associated with our Offices segment increased by 961.5%, from a net profit of ARS 2,553 million during the fiscal year ended June 30, 2019 to a net profit of ARS 27,099 million during the fiscal year ended June 30, 2020. Such variation was mainly due to an ARS 24,404 million increase in the gain / (loss) from fair value adjustments of investment properties. Profit / (loss) from operations associated with the Offices segment, as a percentage of revenues from such segment, increased from 106.0% during the fiscal year ended June 30, 2019 to 1,067.3% during the fiscal year ended June 30, 2020.
 
Sales and Developments. Profit / (loss) from operations associated with our Sales and Developments segment increased by 1,766.8%, from a net profit of ARS 680 million during the fiscal year ended June 30, 2019 to a net profit of ARS 12,694 million during the fiscal year ended June 30, 2020. Such increase is mainly due to the gain / (loss) from fair value adjustments of investment properties. Profit / (loss) from operations associated with the Sales and Developments segment, as a percentage of revenues from this segment, increased from 56.4% during the fiscal year ended June 30, 2019 to 1,604.8% during the fiscal year ended June 30, 2020.
 
Hotels. Profit / (loss) from operations associated with the Hotels segment decreased by 76.3%, from a net profit of ARS 725 million during the fiscal year ended June 30, 2019 to a net profit of ARS 172 million during the fiscal year ended June 30, 2020. Such decrease is mainly due to the deflagging process of Hoteles Argentinos S.A.U. and to the fact that revenues were significantly affected by a decline in the activity since March, attributable to the COVID-19 pandemic. The profit / (loss) from operations associated with the Hotels segment, as a percentage of revenues from such segment, decreased from 22.8% during the fiscal year ended June 30, 2019 to 7.9% during the fiscal year ended June 30, 2020.
 
International. Profit/(loss) from operations associated with our International segment varied by 7.8% from a net loss of ARS 129 million during the fiscal year ended June 30, 2019 to a net loss of ARS 119 million during the fiscal year ended June 30, 2020. Such variation is due to a decrease in donations.
 
Corporate. Profit/(loss) from operations associated with our Corporate segment decreased by 45.7% from a loss of ARS 560 million during the fiscal year ended June 30, 2019 to a loss of ARS 304 million during the fiscal year ended June 30, 2020, mainly affected by general and administrative expenses.
 
Others. Profit/(loss) from operations associated with the Others segment increased from a net loss of ARS 844 million during the fiscal year ended June 30, 2019 to a net profit of ARS 596 million during the fiscal year ended June 30, 2020. The variation is mainly due to the loss generated by the sale of Tarshop, the impairment of the goodwill of La Arena during the fiscal year ended June 30, 2019, and a decrease in share of profit / (loss) of associates and joint ventures. Profit/(loss) from operations of the Others segment, as a percentage of the revenues from such segment, increased from a 411.7% loss during the fiscal year ended June 30, 2019 to a 709.5% profit during the fiscal year ended June 30, 2020.
 
Operations Center in Israel
 
Corporate. Profit/ (loss) from operations associated with the Corporate segment went from a net loss of ARS 115 million during the fiscal year ended June 30, 2019 to a net loss of ARS 99 million during the fiscal year ended June 30, 2020. Such variation was due to a decrease in fees and compensation for services.
 
Share of profit / (loss) of associates and joint ventures 2020 vs 2019
 
The share of profit / (loss) of associates and joint ventures, according to the income statement, increased by 202.4%, from a net loss of ARS 7,588 million during the fiscal year ended June 30, 2019 to a net profit of ARS 7,771 million during the fiscal year ended June 30, 2020 (from the Operations Center in Argentina), mainly due to the positive results from the International segment.
 
Also, the net share of profit / (loss) of joint ventures, mainly from Nuevo Puerto Santa Fe S.A. (Shopping Malls segment), Quality Invest S.A. (Offices segment) and Cyrsa S.A. and Puerto Retiro S.A. (Sales and Developments segment), showed a 116.8% increase, from a loss of ARS 1,096 million during the fiscal year ended June 30, 2019 to a profit of ARS 184 million during the fiscal year ended June 30, 2020, mainly due to results from the joint venture Puerto Retiro S.A., as a consequence of the impairment of the plot of land based on the progress of litigations concerning it during the fiscal year ended June 30, 2019 and the share in Quality Invest S.A., mainly attributable to the gain / (loss) from fair value adjustments of investment properties.
 
Operations Center in Argentina
 
Shopping Malls. In the information by segments, the share of profit / (loss) of the joint venture Nuevo Puerto Santa Fe S.A. is recorded on a consolidated basis, line by line in this segment.
 
Offices. In the information by segments, the share of profit / (loss) of the joint venture Quality S.A. is recorded on a consolidated basis, line by line in this segment.
 
Sales and Developments. The share of profit / (loss) of the joint ventures Cyrsa S.A. and Puerto Retiro S.A is recorded on a consolidated basis, line by line. The share of profit / (loss) of our associate Manibil S.A., which is recorded in this line, increased by ARS 40 million during the fiscal year ended June 30, 2020.
 
Hotels. This segment does not show results from the share of profit / (loss) of associates and joint ventures.
 
International. The share of profit / (loss) of associates of this segment increased by 300.6%, from a net loss of ARS 3,960 million during the fiscal year ended June 30, 2019 to a net profit of ARS 7,942 million during the fiscal year ended June 30, 2020, mainly generated by a positive result from our investment in New Lipstick LLC of ARS 8,044 million offset by a negative result from our investment in Condor Hospitality of ARS 110 million.
 
Other. The share of profit / (loss) of associates from the Others segment decreased by 85.8%, from a net loss of ARS 2,492 million during the fiscal year ended June 30, 2019 to a net loss of ARS 355 million during the fiscal year ended June 30, 2020, mainly as a result of a loss from our investments in Banco Hipotecario S.A. in the amount of ARS 410 million.
 
Financial results, net
 
The financial results went from a loss of ARS 3,102 million during the fiscal year ended June 30, 2019 to a loss of ARS 12,960 million during the fiscal year ended June 30, 2020. Such variation is mainly due to the devaluation of the Argentine peso against the dollar.
 
Income Tax
 
The Company applies the deferred tax method to calculate the income tax for the reported fiscal years, thus recognizing temporary differences as tax assets and liabilities. The income tax charge went from a profit of ARS 4,845 million for the fiscal year ended June 30, 2019, to a loss of ARS 7,216 million during the fiscal year ended June 30, 2020, from the Operations Center in Argentina.
 
Profit for the year
 
As a result of the factors described above, the profit for the year, including the effect of discontinued operations, went from a loss of ARS 41,307 million during the fiscal year ended June 30, 2019 to a profit of ARS 25,548 million during the fiscal year ended June 30, 2020, out of which a profit of ARS 29,171 million derives from the Operations Center in Argentina, and a loss of ARS 3,623 million from the Operations Center in Israel.


36


Results of Operations for the Year ended June 30, 2019 compared to the Year ended June 30, 2018
 
Below is a summary of the operating segments by geography and a reconciliation between the operating result according to the information by segments and the operating result according to the income statement for the years ended June 30, 2019 and 2018.


Operations Center in Argentina
 
 
Operations Center in Israel
 
 
Total Segment Information
 
 
Joint Ventures
 
 
Expenses and Collective Promotion Fund
 
 
Inter-segment eliminations and non-reportable assets / liabilities
 
 
Total income statement / statement of financial position
 
 
  06.30.19 
  06.30.18 
 
Var.
 
  06.30.19 
  06.30.18 
 
Var.
 
  06.30.19 
  06.30.18 
 
Var.
 
  06.30.19 
  06.30.18 
 
Var.
 
  06.30.19 
  06.30.18 
 
Var.
 
  06.30.19 
  06.30.18 
 
Var.
 
  06.30.19 
  06.30.18 
 
Var.
 
(in Million ARS)
Revenues
  16,208 
  14,935 
  1,273 
  - 
  - 
  - 
  16,208 
  14,935 
  1,273 
  (101)
  (116)
  15 
  3,990 
  4,724 
  (734)
  (26)
  (21)
  (5)
  20,071 
  19,522 
  549 
Costs
  (3,418)
  (3,016)
  (402)
  - 
  - 
  - 
  (3,418)
  (3,016)
  (402)
  71 
  74 
  (3)
  (4,151)
  (4,785)
  634 
  - 
  - 
  - 
  (7,498)
  (7,727)
  229 
Gross profit/(loss)
  12,790 
  11,919 
  871 
  - 
  - 
  - 
  12,790 
  11,919 
  871 
  (30)
  (42)
  12 
  (161)
  (61)
  (100)
  (26)
  (21)
  (5)
  12,573 
  11,795 
  778 
Net gain/(loss) from fair value adjustment of investment properties
  (42,639)
  21,764 
  (64,403)
  - 
  - 
  - 
  (42,639)
  21,764 
  (64,403)
  902 
  (1,137)
  2,039 
  - 
  - 
  - 
  - 
  - 
  - 
  (41,737)
  20,627 
  (62,364)
General and administrative expenses
  (2,880)
  (2,513)
  (367)
  (115)
  (84)
  (31)
  (2,995)
  (2,597)
  (398)
  19 
  44 
  (25)
  - 
  - 
  - 
  48 
  35 
  13 
  (2,928)
  (2,518)
  (410)
Selling expenses
  (1,168)
  (1,211)
  43 
  - 
  - 
  - 
  (1,168)
  (1,211)
  43 
  8 
  16 
  (8)
  - 
  - 
  - 
  - 
  - 
  - 
  (1,160)
  (1,195)
  35 
Other operating results, net
  (711)
  (57)
  (654)
  - 
  - 
  - 
  (711)
  (57)
  (654)
  209 
  46 
  163 
  18 
  (2)
  20 
  (22)
  (14)
  (8)
  (506)
  (27)
  (479)
Profit/(loss) from operations
  (34,608)
  29,902 
  (64,510)
  (115)
  (84)
  (31)
  (34,723)
  29,818 
  (64,541)
  1,108 
  (1,073)
  2,181 
  (143)
  (63)
  (80)
  - 
  - 
  - 
  (33,758)
  28,682 
  (62,440)
Share of profit/(loss) of associates and joint ventures
  (6,492)
  (4,551)
  (1,941)
  - 
  - 
  - 
  (6,492)
  (4,551)
  (1,941)
  (1,096)
  1,000 
  (2,096)
  - 
  - 
  - 
  - 
  - 
  - 
  (7,588)
  (3,551)
  (4,037)
Segment profit/(loss)
  (41,100)
  25,351 
  (66,451)
  (115)
  (84)
  (31)
  (41,215)
  25,267 
  (66,482)
  12 
  (73)
  85 
  (143)
  (63)
  (80)
  - 
  - 
  - 
  (41,346)
  25,131 
  (66,477)
Reportable assets
  120,102 
  164,606 
  (44,504)
  576,561 
  606,800 
  (30,239)
  696,663 
  771,406 
  (74,743)
  (656)
  331 
  (987)
  - 
  - 
  - 
  34,279 
  27,117 
  7,162 
  730,286 
  798,854 
  (68,568)
Reportable liabilities
  - 
  - 
  - 
  (496,305)
  (515,728)
  19,423 
  (496,305)
  (515,728)
  19,423 
  - 
  - 
  - 
  - 
  - 
  - 
  (101,937)
  (111,024)
  9,087 
  (598,242)
  (626,752)
  28,510 
Net reportable assets
  120,102 
  164,606 
  (44,504)
  80,256 
  91,072 
  (10,816)
  200,358 
  255,678 
  (55,320)
  (656)
  331 
  (987)
  - 
  - 
  - 
  (67,658)
  (83,907)
  16,249 
  132,044 
  172,102 
  (40,058)
 
Operations Center in Argentina
 
Below is a summary analysis of the operating segments by products and services of the Operations Center in Argentina for the years ended June 30, 2019 and 2018.


Shopping Malls
 
 
Offices
 
 
Sales and Developments
 
 
Hotels
 
 
International
 
 
Corporate
 
 
Others
 
 
Total
 
 
  06.30.19 
  06.30.18 
 
Var.
 
  06.30.19 
  06.30.18 
 
Var.
 
  06.30.19 
  06.30.18 
 
Var.
 
  06.30.19 
  06.30.18 
 
Var.
 
  06.30.19 
  06.30.18 
 
Var.
 
  06.30.19 
  06.30.18 
 
Var.
 
  06.30.19 
  06.30.18 
 
Var.
 
  06.30.19 
  06.30.18 
 
Var.
 
(in Million ARS)
 
Revenues
  9,195 
  10,497 
  (1,302)
  2,409 
  1,434 
  975 
  1,205 
  324 
  881 
  3,179 
  2,633 
  546 
  15 
  - 
  15 
  - 
  - 
  - 
  205 
  47 
  158 
  16,208 
  14,935 
  1,273 
Costs
  (835)
  (892)
  57 
  (141)
  (113)
  (28)
  (566)
  (160)
  (406)
  (1,707)
  (1,798)
  91 
  (6)
  - 
  (6)
  - 
  - 
  - 
  (163)
  (53)
  (110)
  (3,418)
  (3,016)
  (402)
Gross profit/(loss)
  8,360 
  9,605 
  (1,245)
  2,268 
  1,321 
  947 
  639 
  164 
  475 
  1,472 
  835 
  637 
  9 
  - 
  9 
  - 
  - 
  - 
  42 
  (6)
  48 
  12,790 
  11,919 
  871 
Net gain/(loss) from fair value adjustment of investment properties
  (43,687)
  6,746 
  (50,433)
  663 
  6,728 
  (6,065)
  782 
  7,900 
  (7,118)
  - 
  - 
  - 
  6 
  - 
  6 
  - 
  - 
  - 
  (403)
  390 
  (793)
  (42,639)
  21,764 
  (64,403)
General and administrative expenses
  (1,017)
  (917)
  (100)
  (228)
  (235)
  7 
  (305)
  (213)
  (92)
  (530)
  (524)
  (6)
  (118)
  (127)
  9 
  (560)
  (413)
  (147)
  (122)
  (84)
  (38)
  (2,880)
  (2,513)
  (367)
Selling expenses
  (571)
  (653)
  82 
  (107)
  (153)
  46 
  (127)
  (62)
  (65)
  (340)
  (335)
  (5)
  - 
  - 
  - 
  - 
  - 
  - 
  (23)
  (8)
  (15)
  (1,168)
  (1,211)
  43 
Other operating results, net
  (118)
  (113)
  (5)
  (43)
  (24)
  (19)
  (309)
  149 
  (458)
  123 
  (43)
  166 
  (26)
  (62)
  36 
  - 
  - 
  - 
  (338)
  36 
  (374)
  (711)
  (57)
  (654)
Profit/(loss) from operations
  (37,033)
  14,668 
  (51,701)
  2,553 
  7,637 
  (5,084)
  680 
  7,938 
  (7,258)
  725 
  (67)
  792 
  (129)
  (189)
  60 
  (560)
  (413)
  (147)
  (844)
  328 
  (1,172)
  (34,608)
  29,902 
  (64,510)
Share of profit/(loss) of associates and joint ventures
  - 
  - 
  - 
  - 
  - 
  - 
  (40)
  4 
  (44)
  - 
  - 
  - 
  (3,960)
  (4,763)
  803 
  - 
  - 
  - 
  (2,492)
  208 
  (2,700)
  (6,492)
  (4,551)
  (1,941)
Segment profit/(loss)
  (37,033)
  14,668 
  (51,701)
  2,553 
  7,637 
  (5,084)
  640 
  7,942 
  (7,302)
  725 
  (67)
  792 
  (4,089)
  (4,952)
  863 
  (560)
  (413)
  (147)
  (3,336)
  536 
  (3,872)
  (41,100)
  25,351 
  (66,451)
Reportable assets
  54,277 
  97,172 
  (42,895)
  34,166 
  30,827 
  3,339 
  30,558 
  27,757 
  2,801 
  2,075 
  2,191 
  (116)
  (7,484)
  (3,953)
  (3,531)
  - 
  - 
  - 
  6,510 
  10,612 
  (4,102)
  120,102 
  164,606 
  (44,504)
Reportable liabilities
  - 
  - 
  - 
  - 
  - 
  - 
  - 
  - 
  - 
  - 
  - 
  - 
  - 
  - 
  - 
  - 
  - 
  - 
  - 
  - 
  - 
  - 
  - 
  - 
Net reportable assets
  54,277 
  97,172 
  (42,895)
  34,166 
  30,827 
  3,339 
  30,558 
  27,757 
  2,801 
  2,075 
  2,191 
  (116)
  (7,484)
  (3,953)
  (3,531)
  - 
  - 
  - 
  6,510 
  10,612 
  (4,102)
  120,102 
  164,606 
  (44,504)
 
37
 
 
Operations Center in Israel
 
Below is a summary analysis of the operating segments by products and services of the Operations Center in Israel for the years ended June 30, 2019 and 2018.


Real Estate
 
 
Supermarkets
 
 
Telecommunications
 
 
Insurance
 
 
Corporate
 
 
Others
 
 
Total
 
 
  06.30.19 
  06.30.18 
 
Var.
 
  06.30.19 
  06.30.18 
 
Var.
 
  06.30.19 
  06.30.18 
 
Var.
 
  06.30.19 
  06.30.18 
 
Var.
 
  06.30.19 
  06.30.18 
 
Var.
 
  06.30.19 
  06.30.18 
 
Var.
 
  06.30.19 
  06.30.18 
 
Var.
 
(in Million Pesos)
 
Revenues
  - 
  - 
  - 
  - 
  - 
  - 
  - 
  - 
  - 
  - 
  - 
  - 
  - 
  - 
  - 
  - 
  - 
  - 
  - 
  - 
  - 
Costs
  - 
  - 
  - 
  - 
  - 
  - 
  - 
  - 
  - 
  - 
  - 
  - 
  - 
  - 
  - 
  - 
  - 
  - 
  - 
  - 
  - 
Gross profit/(loss)
  - 
  - 
  - 
  - 
  - 
  - 
  - 
  - 
  - 
  - 
  - 
  - 
  - 
  - 
  - 
  - 
  - 
  - 
  - 
  - 
  - 
Net gain/(loss) from fair value adjustment of investment properties
  - 
  - 
  - 
  - 
  - 
  - 
  - 
  - 
  - 
  - 
  - 
  - 
  - 
  - 
  - 
  - 
  - 
  - 
  - 
  - 
  - 
General and administrative expenses
  - 
  - 
  - 
  - 
  - 
  - 
  - 
  - 
  - 
  - 
  - 
  - 
  (115)
  (84)
  (31)
  - 
  - 
  - 
  (115)
  (84)
  (31)
Selling expenses
  - 
  - 
  - 
  - 
  - 
  - 
  - 
  - 
  - 
  - 
  - 
  - 
  - 
  - 
  - 
  - 
  - 
  - 
  - 
  - 
  - 
Other operating results, net
  - 
  - 
  - 
  - 
  - 
  - 
  - 
  - 
  - 
  - 
  - 
  - 
  - 
  - 
  - 
  - 
  - 
  - 
  - 
  - 
  - 
Profit/(loss) from operations
  - 
  - 
  - 
  - 
  - 
  - 
  - 
  - 
  - 
  - 
  - 
  - 
  (115)
  (84)
  (31)
  - 
  - 
  - 
  (115)
  (84)
  (31)
Share of profit/(loss) of associates and joint ventures
  - 
  - 
  - 
  - 
  - 
  - 
  - 
  - 
  - 
  - 
  - 
  - 
  - 
  - 
  - 
  - 
  - 
  - 
  - 
  - 
  - 
Segment profit/(loss)
  - 
  - 
  - 
  - 
  - 
  - 
  - 
  - 
  - 
  - 
  - 
  - 
  (115)
  (84)
  (31)
  - 
  - 
  - 
  (115)
  (84)
  (31)
Reportable assets
  326,652 
  320,845 
  5,807 
  24,775 
  31,843 
  (7,068)
  117,753 
  119,199 
  (1,446)
  24,370 
  29,332 
  (4,962)
  44,716 
  51,062 
  (6,346)
  38,295 
  54,519 
  (16,224)
  576,561 
  606,800 
  (30,239)
Reportable liabilities
  (253,584)
  (249,429)
  (4,155)
  - 
  - 
  - 
  (91,292)
  (92,885)
  1,593 
  - 
  - 
  - 
  (136,275)
  (167,475)
  31,200 
  (15,154)
  (5,939)
  (9,215)
  (496,305)
  (515,728)
  19,423 
Net reportable assets
  73,068 
  71,416 
  1,652 
  24,775 
  31,843 
  (7,068)
  26,461 
  26,314 
  147 
  24,370 
  29,332 
  (4,962)
  (91,559)
  (116,413)
  24,854 
  23,141 
  48,580 
  (25,439)
  80,256 
  91,072 
  (10,816)
 
 
38
 
 
Revenue 2019 vs 2018
 
Revenues from sales, leases and services, according to the income statement, increased by ARS 549 million, from ARS 19,522 million during the year ended June 30, 2018 to ARS 20,071 million during the year ended June 30, 2019 (from the Operations Center in Argentina). Excluding revenue from the Operations Center in Israel, revenues from sales, leases and services increased by 2.8%.
 
In turn, revenues from expenses and collective promotion fund decreased by 15.5%, from ARS 4,724 million (out of which ARS 4,424 million are allocated to the Shopping Malls segment and ARS 300 million to the Offices segment of the Operations Center in Argentina) during the year ended June 30, 2018, to ARS 3,990 million (out of which ARS 3,670 million are allocated to the Shopping Malls segment and ARS 320 million to the Offices segment) during the year ended June 30, 2019.
 
Likewise, revenues from our joint ventures decreased by 12.9%, from ARS 116 million during the fiscal year ended June 30, 2018 (out of which ARS 91 million are allocated to the Shopping Malls segment, ARS 10 million to the Offices segment and ARS 15 million to the Sales and Developments Segment of the Operations Center in Argentina) to ARS 101 million during the year ended June 30, 2019 (out of which ARS 82 million are allocated to the Shopping Malls segment, ARS 18 million to the Offices segment and ARS 1 million to the Sales and Developments segment of the Operations Center in Argentina).
 
Finally, revenues from inter-segment operations increased ARS  5 million, from ARS 21 million during the year ended June 30, 2018 to ARS 26 million during the year ended June 30, 2019.
 
Therefore, according to the information by segments, revenues increased ARS 1,273 million, from ARS 14,935 million during the year ended June 30, 2018 to ARS 16,208 million during the year ended June 30, 2019 (from the Operations Center in Argentina). Excluding revenue from the Operations Center in Israel, revenues, according to the information by segments, increased by 8.5%.
 
Operations Center in Argentina
 
Shopping Malls. Revenues from the Shopping Malls segment decreased 12.4%, from ARS 10,497 million during fiscal year 2018 to ARS 9,195 million during fiscal year 2019, mainly attributable to: (i) an ARS 1,051 million decrease in revenues from fixed and variable leases as a result of a 13.9% decrease in the total sales of our tenants, from ARS 118,083 million during fiscal year 2018 to ARS 101,665 million during fiscal year 2019, (ii) an ARS 151 million decrease in the revenues from commissions, (iii) an ARS 131 million decrease in the revenues from admission rights, (iv) an ARS 129 million decrease in the revenues from parking fees, (v) an ARS 18 million decrease in the revenue from averaging of scheduled rent escalation; partially mitigated by (vi) an increase of ARS 207 million in other income, mainly attributable to the rescind of the contract with Walmart.
 
Offices. Revenues from the Offices segment increased 68.0%, from ARS 1,434 million during the year ended June 30, 2018 to ARS 2,409 million during the year ended June 30, 2019. The variation is explained by a significant increase in revenues from leases of different buildings, mainly PH Office Park and Zeta Buildings, and the effect of the exchange rate variation.
 
Sales and developments. Revenues from the Sales and Developments segment registered an increase of 271.9%, from ARS 324 million during the year ended June 30, 2018 to ARS 1,205 million during the year ended June 30, 2019. This segment often varies significantly from year to year due to the non-recurrence of different sales transactions carried out by the Group over time.
 
Hotels. Revenues from our Hotels segment increased by 20.7% from ARS 2,633 million during the year ended June 30, 2018 to ARS 3,179 million during the year ended June 30, 2019, mainly due to an increase in the average room rate of our hotel portfolio (measured in pesos).
 
International. Revenues associated with our International segment increased 100.0%, for ARS 15 million during the year ended June 30, 2019, due to the sale of properties by our subsidiary Real Estate Strategies LLC.
 
Corporate. Revenues associated with our Corporate segment did not present variations for the years presented.
 
Others. Revenues from the Others segment increased 336.2%, from ARS 47 million during the year ended June 30, 2018 to ARS 205 million during the year ended June 30, 2019, mainly due to the increase in revenues from La Arena S.A. y La Rural S.A., OFC S.R.L., Ogden S.A and Eentretenumiento Universal S.A. – Unión transitoria – (administradora del Centro de Convenciones y Exposiciones de la Ciudad de Buenos Aires).
 
Costs 2019 vs 2018
 
Total consolidated costs, according to the income statement, registered a decrease of ARS 229 million, from ARS 7,727 million during the year ended June 30, 2018 to ARS 7,498 million during the year ended June 30, 2019 (from the Operations Center in Argentina). Excluding costs derived from the Operations Center in Israel, costs decreased by 3.0%. Furthermore, total consolidated costs measured as a percentage of total consolidated revenues increased from 39.6% during the year ended June 30, 2018 to 37.4% during the year ended June 30, 2019.
 
 
39
 
 
In turn, costs related to expenses and collective promotion fund decreased by 13.2%, from ARS 4,785 million during the year ended June 30, 2018 (out of which ARS 4,519 million are allocated to the Shopping Malls segment and ARS 266 million to the Offices segment of the Operations Center in Argentina) to ARS 4,151 million during the year ended June 30, 2019 (out of which ARS 3,825 million are allocated to the Shopping Malls segment and ARS 326 million to the Offices segment of the Operations Center in Argentina) due mainly to lower costs originated by our Shopping Malls, which decreased by 15.4%, from ARS 4,519 million during the year ended June 30, 2018 to ARS 3,825 million during the year ended June 30, 2019.
 
Likewise, costs from our joint ventures decreased by 4.1%, from ARS 74 million during the year ended June 30, 2018 (out of which ARS 10 million are allocated to the Shopping Malls segment, ARS 52 million to the Offices segment and ARS 12 million to the Sales and Developments segment of the Operations Center in Argentina) to ARS 71 million during the year ended June 30, 2019 (out of which ARS 17 million are allocated to the Shopping Malls segment, ARS 45 million to the Offices segment and ARS 9 million to the Sales and Developments segment of the Operations Center in Argentina).
 
Finally, costs from inter-segment operations showed no variations for the reported periods.
 
Therefore, according to the information by segments (taking into account the costs from our joint ventures and without considering the costs from expenses and collective promotion fund or the costs from inter-segment operations), costs evidenced an increase of ARS 402 million, from ARS 3,016 million during the year ended June 30, 2018 to ARS 3,418 million during the year ended June 30, 2019 (from the Operations Center in Argentina). Excluding costs derived from the Operations Center in Israel, costs increased by 13.3%. Likewise, total costs measured as a percentage of total revenues, according to information by segments, increased from 20.2% during the year ended June 30, 2018 to 21.1% during the year ended June 30, 2019, mainly from the Operations Center in Israel.
 
Operations Center in Argentina
 
Shopping Malls. The costs of our Shopping Malls segment decreased 6.4%, from ARS 892 million during fiscal year 2018 to ARS 835 million during fiscal year 2019, mainly generated by: (i) a decrease in salaries, social security charges and other personnel expenses of ARS 47 million; (ii) a decrease in depreciation and amortization of ARS 22 million; and (iii) a decrease in maintenance, security, cleaning, repairs and related expenses of ARS 10 million; partially offset by: (iv) an increase in costs of leases and expenses for ARS 26 million (generated by the leases in dollar, due to the increase in the exchange rate). The Shopping Malls segment costs, as a percentage of revenues from this segment, increased from 8.5% during fiscal year 2018 to 9.1% during fiscal year 2019.
 
Offices. Costs in the Offices segment increased by 24.8%, from ARS 113 million during the year ended June 30, 2018 to ARS 141 million during the year ended June 30, 2019, mainly due to: (i) an increase in depreciation and amortization of ARS 57 million; offset by: (i) a decrease in leases and expenses of ARS 14 million; (ii) a decrease in maintenance, repairs and services expenses of ARS 9 million; (iii) a decrease in fees and compensation for services of ARS 5 million; and (iv) a decrease in taxes, fees and contributions of ARS 3 million. Costs in the Offices segment, measured as a percentage of revenues of this segment, decreased from 7.9% during the year ended June 30, 2018 to 5.9% during the year ended June 30, 2019.
 
Sales and developments. Costs associated with our Sales and Developments segment registered an increase of 253.8%, from ARS 160 million during the year ended June 30, 2018 to ARS 566 million during the year ended June 30, 2019, mainly due to the costs of sales of Catalinas Norte. The costs of the Sales and Developments segment, measured as a percentage of revenues from this segment decreased from 49.4% during the year ended June 30, 2018 to 47.0% during the year ended June 30, 2019.
 
Hotels. Costs in the Hotels segment decreased by 5.1%, from ARS 1,798 million during the year ended June 30, 2018 to ARS 1,707 million during the year ended June 30, 2019, mainly as a result of: (i) a decrease of ARS 115 million in costs of salaries, social security and other personnel expenses; and (ii) a decrease of ARS 9 million in food, beverages and other hotel expenses, offset by (i) an increase in fees and compensation for services of ARS 31 million. Costs in the Hotels segment, measured as a percentage of revenues of this segment, decreased from 68.3% during the year ended June 30, 2018 to 53.7% during the year ended June 30, 2019.
 
International. Costs in the International segment increased 100.0%, with ARS 6 million during the year ended June 30, 2019, associated with the cost of sale of properties by our subsidiary Real Estate Strategies LLC.
 
Corporate. Costs in the Corporate segment did not vary for the years presented.
 
Others. Costs in the Others segment increased by 207.5%, from ARS 53 million during the year ended June 30, 2018 to ARS 163 million during the year ended June 30, 2019, mainly as a result of: (i) higher charges of ARS 31 million in taxes, fees and contributions, (ii) an increase of ARS 21 million in leases and expenses; (iii) an increase of ARS 18 million in fees and compensation for services, (iv) an increase of ARS 15 million in depreciation and amortization, (v) an increase of ARS 13 million in maintenance, repairs and services; and (vi) an increase of ARS 10 million in salaries, social security and other personnel expenses.
 
Gross profit 2019 vs 2018
 
The total consolidated gross profit, according to the income statement, increased by ARS 778 million, from ARS 11,795 million during the year ended June 30, 2018 to ARS 12,573 million during the year ended June 30, 2019 (from the Operations Center in Argentina). Excluding gross profit from the Operations Center in Israel, the gross profit increased by 6.6%. The total consolidated gross profit, measured as a percentage of revenues from sales, leases and services, increased from 60.4% during the year ended June 30, 2018 to 62.6% during the year ended June 30, 2019.
 
In turn, total gross loss for expenses and collective promotion fund increased ARS 100 million, from ARS 61 million during the year ended June 30, 2018 (out of which a loss of ARS 95 million derives from the Shopping Malls segment and a loss of ARS 34 million from the Offices segment), to ARS 161 million during the year ended June 30, 2019 (out of which a loss of ARS 155 million derives from the Shopping Malls segment and a loss of ARS 6 million from the Offices segment).
 
Additionally, the gross profit of our joint ventures decreased by 28.6%, from ARS 42 million during the year ended June 30, 2018 to ARS 30 million during the year ended June 30, 2019.
 
Therefore, according to the information by segments, gross profit increased by ARS 871 million, from ARS 11,919 million during the year ended June 30, 2018 to ARS 12,790 million during the year ended June 30, 2019 (from the Operations Center in Argentina). Excluding gross profit from the Operations Center in Israel, the gross profit increased by 7.3%. Likewise, gross profit, measured as a percentage of revenues, according to information by segments, decreased from 79.8% during the year ended June 30, 2018 to 78.9% during the year ended June 30, 2019.
 
Operations Center in Argentina
 
Shopping Malls. Gross profit from the Shopping Malls segment decreased 13.0%, from ARS 9,605 million during fiscal year 2018 to ARS 8,360 million for fiscal year 2019, mainly as a result of a decrease in total sales of our tenants, giving rise to lower rental percentages under our lease agreements. Gross profit from our Shopping Malls segment as a percentage of revenues for the segment decreased from 91.5% during fiscal year 2018 to 90.9% during fiscal year 2019.
 
Offices. Gross profit of the Offices segment increased by 71.7%, from ARS 1,321 million for the year ended June 30, 2018 to ARS 2,268 million during the year ended June 30, 2019. The gross profit of the Offices segment, measured as a percentage of revenues of this segment, increased from 92.1% during the year ended June 30, 2018 to 94.1% during the year ended June 30, 2019.
 
Sales and developments. Gross profit of the Sales and Developments segment increased by 289.6%, from ARS 164 million during the year ended June 30, 2018 to ARS 639 million during the year ended June 30, 2019, mainly as a result of higher sales recorded during the year ended June 30, 2019. The gross profit of the Sales and Developments segment, measured as a percentage of this segment’s revenues, increased from 50.6% during the year ended June 30, 2018 to 53.0% during the year ended June 30, 2019.
 
Hotels. Gross profit for the Hotels segment increased by 76.3% from ARS 835 million during the fiscal year ended June 30, 2018 to ARS 1,472 million during the year ended June 30, 2019. The gross profit of the Hotels segment, measured as a percentage of revenues of this segment, increased from 31.7% during the year ended June 30, 2018 to 46.3% during the year ended June 30, 2019.
 
International. Gross profit of the International segment increased 100.0%, with a gross profit of ARS 9 million during the year ended June 30, 2019.
 
Corporate. Gross profit of the Corporate segment did not present variations during the reported years.
 
Others. Gross profit from the Others segment increased 800.0%, from a loss of ARS 6 million during the year ended June 30, 2018 to a profit of ARS 42 million during the year ended June 30, 2019. The gross profit of the Others segment, measured as a percentage of revenues of this segment, increased from 12.8% negative during the year ended June 30, 2018 to 20.5% positive during the year ended June 30, 2019.
 
Net gain from fair value adjustment of investment properties 2019 vs 2018
 
Net gain from fair value adjustment of investment properties, according to the income statement, decreased by ARS 62,364 million, from a net gain of ARS 20,627 million during the year ended June 30, 2018 (from the Operations Center in Argentina) to a net loss of ARS 41,737 million during the year ended June 30, 2019 (from the Operations Center in Argentina).
 
It should be noted that according to the adjustment for inflation methodology, the gain/(loss) from fair value adjustment of investments properties should be broken down into its two effects: i) adjustment for inflation and ii) loss or gain from actual fair value adjustment, During the year ended June 30, 2019, the inflationary effect exceeds the appreciation of investment properties, therefore, a loss from fair value adjustment of investment properties of ARS 41,737 million is recognized.
 
Operations Center in Argentina
 
1. Shopping Malls segment
 
The shopping -Malls portfolio decreased between the fiscal year ended June 30, 2019 and 2018, as the end of the concession we had for Buenos Aires Design took place.
 
The net impact in the peso values of our properties was primarily a consequence of macroeconomic changes: (i) from june 2018 to june 2019, the Argentinian peso depreciated 47% against US Dolar (from ARS 28.75 per dolar to ARS 42.26 per dolar), which had a direct impact in a less projected cash flows in US Dolar from our Shopping Malls segment; and (ii) an increase of 234 basis points on the discount rate in US dolar, which it is used to discount the projected cash flow from Shopping Malls segment.
 
2. “Offices,” “Sales and developments,” “International” and “Others” segments,
 
Net gain/(loss) from actual fair value adjustment of investment properties included in these segments decreased by 93.0% during the year ended June 30, 2019.
 
The Argentine office market is a liquid market, in which a significant volume of counterparties participates and frequently carries out purchase and sale transactions. This allows to observe sale prices that are relevant and representative in the market. Furthermore, lease agreements are denominated in dollars for an average term of 3 years, with the current business thus generating a stable cash flow in dollars, In this sense, the “Market approach” technique is used (market comparable values) for the determination of the fair value of these segments, with the value per sqm being the most representative metric.
 
Changes in fair value from our Shopping Malls segment differ from our offices segment because the nature of each business is different and prices depend on factors that may not have similarly over time. As we mentioned before, the office property market is dominated by investors and owners that seek medium- to long-term leases and perceive real estate as a safe dollar-denominated investment option. In contrast, the shopping mall segment is a relatively new industry in Argentina where the first shopping mall opened in 1990, compared to markets such as the United States and Brazil where the industry began in the 1950’s and 1960’s, respectively. Additionally, unlike the office properties segment, the financial performance of shopping mall properties is highly correlated with the volatile economic activity in Argentina since the cash flow generated by shopping malls are closely related to the purchasing power of customers.
 
General and administrative expenses 2019 vs 2018
 
Total general and administrative expenses, according to the income statement, recorded an increase of ARS 410 million, from ARS 2,518 million during the year ended June 30, 2018 (out of which ARS 84 million derive from the Operations Center in Israel and ARS 2,434 million from the Operations Center in Argentina) to ARS 2,928 million during the year ended June 30, 2019 (out of which ARS 115 million derive from the Operations Center in Israel and ARS 2,813 million from the Operations Center in Argentina). Excluding the effect from the Operations Center in Israel, general and administrative expenses increased by 15.6%. Total general and administrative expenses measured as a percentage of revenues from sales, leases and services slightly increased from 12.9% during the year ended June 30, 2018 to 14.6% during the year ended June 30, 2019. Excluding the effect from the Operations Center in Israel, total general and administrative expenses, according to the income statement, increased from 12.5% during the year ended June 30, 2018 to 14.0% during the year ended June 30, 2019.
 
In turn, general and administrative expenses of our joint ventures decreased ARS 25 million, from ARS 44 million during the year ended June 30, 2018 to ARS 19 million during the year ended June 30, 2019.
 
Finally, general and administrative expenses for inter-segment operations increased ARS 13 million, from ARS 35 million during the year ended June 30, 2018 to ARS 48 million during the year ended June 30, 2019.
 
Therefore, according to the information by segments, general and administrative expenses increased ARS 398 million, from ARS 2,597 million during the year ended June 30, 2018 (out of which ARS 84 million derive from the Operations Center in Israel and ARS 2,513 million from the Operations Center in Argentina) to ARS 2,995 million during the year ended June 30, 2019 (out of which ARS 115 million derive from the Operations Center in Israel and ARS 2,880 million from the Operations Center in Argentina). Excluding the general and administrative expenses from the Operations Center in Israel, expenses increased by 14.6%. General and administrative expenses measured as a percentage of revenues, according to the information by segments, slightly increased from 17.4% during the year ended June 30, 2018 to 18.5% during the year ended June 30, 2019. Without considering the effect from the Operations Center in Israel, total general and administrative expenses, measured as a percentage of total revenues, increased from 16.8% during the year ended June 30, 2018 to 17.8% during the year ended June 30, 2019.
 
Operations Center in Argentina
 
Shopping Malls. Administrative expenses of Shopping Malls increased 10.9%, from ARS 917 million during fiscal year 2018 to ARS 1,017 million during fiscal year 2019, mainly due to: (i) an increase of ARS 141 million in salaries, social security charges and other personnel expenses; (ii) an increase of ARS 32 million in maintenance, repair and service expenses and employees’ travel expenses; partially mitigated by (iii) a decrease of ARS 37 million in directors’ fees; (iv) a decrease of ARS 22 million in banking expenses; and (v) a decrease of ARS 13 million in fees and compensations for services. Administrative expenses of Shopping Malls as a percentage of revenues from such segment increased from 8.7% during fiscal year 2018 to 11.1% during fiscal year 2019.
 
Offices. The general and administrative expenses of our Offices segment decreased by 3.0%, from ARS 235 million during the year ended June 30, 2018 to ARS 228 million during the year ended June 30, 2019, mainly as a result of: (i) a decrease of ARS 13 million in salaries, social security and other personnel expenses; (ii) a decrease of ARS 8 million in fees and compensation for services and (iii) a decrease of ARS 8 million in advertising and other commercial expenses, partially offset by: (iv) an increase of ARS 23 million in fees to directors. General and administrative expenses, measured as a percentage of revenues in the same segment, decreased from 16.4% during the year ended June 30, 2018 to 9.5% during the year ended June 30, 2019.
 
Sales and developments. General and administrative expenses associated with our Sales and developments segment increased by 43.2%, from ARS 213 million during the year ended June 30, 2018 to ARS 305 million during the year ended June 30, 2019, mainly as a result of an increase in salaries, social security and other personnel expenses of ARS 75 million, among other items. General and administrative expenses, measured as a percentage of revenues in the same segment, decreased from 65.7% during the year ended June 30, 2018 to 25.3% during the year ended June 30, 2019.
 
 
40
 
 
Hotels. General and administrative expenses associated with our Hotels segment increased by 1.1% from ARS 524 million during the year ended June 30, 2018 to ARS 530 million during the year ended June 30, 2019, mainly as a result of: (i) an increase of ARS 34 million in fees and compensation for services, offset by (i) a decrease in salaries, social security and other personnel expenses of ARS 18 million and (ii) a decrease of ARS 7 million in taxes, fees and contributions. General and administrative expenses associated with the Hotels segment measured as a percentage of this segment’s revenues decreased from 19.9% during the year ended June 30, 2018 to 16.7% during the year ended June 30, 2019.
 
International. General and administrative expenses associated with our International segment decreased by 7.1%, from ARS 127 million during the year ended June 30, 2018 to ARS 118 million during the year ended June 30, 2019, mainly due to: (i) an increase in fees and compensation for services of ARS 28 million, (ii) an increase in salaries, social security and other personnel expenses of ARS 12 million, (iii) an increase in maintenance, repairs and services of ARS 6 million, and (iv) an increase in depreciation and amortization of ARS 3 million, partially offset by: (v) decreased taxes, as Imadison’s taxes were paid in the previous year.
 
Corporate. General and administrative expenses associated with our Corporate segment increased by 35.6%, from ARS 413 million during the year ended June 30, 2018 to ARS 560 million during the year ended June 30, 2019, mainly due to an increase of ARS 187 million in fees to directors, offset by a decrease of ARS 40 million in fees and compensation for services, among other items.
 
Others. General and administrative expenses associated with our Others segment increased 45.2%, from ARS 84 million during the year ended June 30, 2018 to ARS 122 million during the year ended June 30, 2019, mainly due to (i) an increase of ARS 16 million in other administrative expenses; (ii) an increase of ARS 7 million in maintenance, repairs and services; (iii) an increase of ARS 4 million in fees and compensation for services, and (iv) an increase of ARS 7 million in salaries, social security and other personnel expenses, among other items.
 
Operations Center in Israel
 
Corporate. General and administrative expenses associated with the Corporate segment increased from ARS 84 million during the period ended June 30, 2018 to ARS 115 million during the period ended June 30, 2019. Such variation was due to an increase in fees and compensation for services.
 
Selling expenses 2019 vs 2018
 
Total consolidated selling expenses, according to the income statement, showed a decrease of ARS 35 million, from ARS 1,195 million during the year ended June 30, 2018 to ARS 1,160 million during the year ended June 30, 2019 (from the Operations Center in Argentina. Excluding selling expenses derived from the Operations Center in Israel, selling expenses decreased by 2.9%. Total consolidated selling expenses measured as a percentage of revenues from sales, leases and services, decreased from 6.1% during the year ended June 30, 2018 to 5.8% during the year ended June 30, 2019.
 
In turn, selling expenses of our joint ventures decreased ARS 8 million, from ARS 16 million during the year ended June 30, 2018 to ARS 8 million during the year ended June 30, 2019.
 
Therefore, according to the information by segments, selling expenses decreased ARS 43 million, from ARS 1,211 million during the year ended June 30, 2018 to ARS 1,168 million during the year ended June 30, 2019 (from the Operations Center in Argentina). Excluding selling expenses derived from the Operations Center in Israel, selling expenses decreased by 3.6%, Selling expenses measured as a percentage of revenues, according to information by segments, decreased from 8.1% during the year ended June 30, 2018 to 7.2% during the year ended June 30, 2019.
 
Operations Center in Argentina
 
Shopping Malls. Selling expenses from the Shopping Malls segment decreased 12.6%, from ARS 653 million during fiscal year 2018 to ARS 571 million during fiscal year 2019, mainly as a result of: (i) a decrease in publicity, advertising and other commercial expenses of ARS 36 millions; (ii) a decrease in taxes, rates and contributions of ARS 33 millions and (iii) a decrease of ARS 15 millions in bad debt charge; partially offset by (iv) an increase in salaries, social security charges and other personnel expenses of ARS 3 million. Selling expenses as a percentage of revenues from the Shopping Malls segment remained flat in 6.2% during fiscal year 2018 and 2019.
 
Offices. Selling expenses associated with our Offices segment decreased by 30.1%, from ARS 153 million during the year ended June 30, 2018 to ARS 107 million during the year ended June 30, 2019. This variation was generated mainly as a result of a decrease in the charge of doubtful accounts of ARS 74 million, offset by: (i) an increase of ARS 14 million in taxes, fees and contributions and (ii) an increase of ARS 12 million in advertising and other commercial expenses. Selling expenses associated with our Offices segment, measured as a percentage of this segment's revenues, decreased from 10.7% during the year ended June 30, 2018 to 4.4% during the year ended June 30, 2019.
 
Sales and developments. Selling expenses associated with the Sales and Developments segment increased 104.8%, from ARS 62 million during the year ended June 30, 2018 to ARS 127 million during the year ended June 30, 2019. This variation was mainly due to an ARS 70 million increase in taxes, fees and contributions. Selling expenses associated with our Sales and developments segment, measured as a percentage of this segment’s revenues, decreased from 19.1% during the year ended June 30, 2018 to 10.5% during the year ended June 30, 2019.
 
Hotels. Selling expenses associated with our Hotels segment increased 1.5%, from ARS 335 million during the year ended June 30, 2018 to ARS 340 million during the year ended June 30, 2019, mainly as a result of an increase of ARS 28 million in taxes, fees and contributions, offset by: (i) a decrease of ARS 14 million in fees and compensation for services, and (ii) a decrease of ARS 12 million in salaries, social security and other personnel expenses. Selling expenses associated with our Hotels segment measured as a percentage of this segment's revenues decreased from 12.7% during the year ended June 30, 2018 to 10.7% during the year ended June 30, 2019.

International. Selling expenses associated with the International segment did not show variations during the reported years.
 
Corporate. Selling expenses associated with the Corporate segment did not show variations during the reported years.
 
Others. Selling expenses associated with our Others segment increased 187.5%, from ARS 8 million during the year ended June 30, 2018 to ARS 23 million during the year ended June 30, 2019, mainly due to: (i) an increase of ARS 8 million in taxes, rates and contributions, (ii) an increase of ARS 6 million in advertising and other commercial expenses, and (iii) an increase of ARS 6 million in doubtful accounts. Selling expenses associated with our Others segment measured as a percentage of this segment's revenues decreased, from 17.0% during the year ended June 30, 2018 to 11.2% during the year ended June 30, 2019.
 
Other operating results, net 2019 vs 2018
 
Other operating results, net, according to the income statement, registered a decrease of ARS 479 million, from a net loss of ARS 27 million during the year ended June 30, 2018 to a net loss of ARS 506 million during the year ended June 30, 2019 (from the Operations Center in Argentina).
 
Other operating results, net from our joint ventures increased ARS 163 million, from a profit of ARS 46 million during the year ended June 30, 2018 to a profit of ARS 209 million during the year ended June 30, 2019 (out of which a profit of ARS 201 million is allocated to the Sales and Developments segment, a profit of ARS 10 million is allocated to the Shopping Malls segment within the Operations Center in Argentina and a loss of ARS 2 million is allocated to the Offices segment).
 
In turn, other operating results for expenses and collective promotion fund increased ARS 20 million, from ARS 2 million during the year ended June 30, 2018 (out of which a loss of ARS 2 million derives from the Shopping Malls segment), to ARS 18 million during the year ended June 30, 2019 (out of which a profit of ARS 18 million derives from the Shopping Malls segment).
 
Therefore, according to the information by segments, other operating results, net recorded a decrease of ARS 654 million, from a net loss of ARS 57 million during the year ended June 30, 2018 to a net loss of ARS 711 million during the year ended June 30, 2019.
 
Operations Center in Argentina
 
Shopping Malls. Other operating results, net from the Shopping Malls segment increased by 4.4%, from a net loss of ARS 113 million during fiscal year 2018 to a net loss of ARS 118 million during fiscal year 2019, mainly as a result of: (i) an increase in charity charges of ARS 46 million; partially offset by: (ii) a recovery of litigation costs of ARS 25 million and (iii) an increase in the interest for late payment that is charged to our customers of ARS 34 million. Other operating results, net from this segment as a percentage of the revenues from this segment slightly increased from 1.1% negative during the year ended June 30, 2018 to 1.3% negative during the year ended June 30, 2019.
 
Offices. Other operating results, net, associated with our Offices segment increased by 79.2%, from a net loss of ARS 24 million during the year ended June 30, 2018 to a net loss of ARS 43 million during the year ended June 30, 2019, mainly as a consequence of an increase in donations, among other items. Other operating results, net, of this segment, as a percentage of this segment’s revenues, increased from 1.7% negative during the year ended June 30, 2018 to 1.8% negative during the year ended June 30, 2019.
 
Sales and developments. Other operating results, net, associated with our Sales and Developments segment decreased by 307.4%, from a net profit of ARS 149 million during the year ended June 30, 2018 to a net loss of ARS 309 million during the year ended June 30, 2019, mainly as a result of a provision set up for the plot of land owned by Puerto Retiro S.A., thus generating a negative result of ARS 304 million, compared to the previous year in which a positive result was obtained due to the sale of floors of Intercontinental Building by IRSA Propiedades Comerciales. Other operating results, net, of this segment, as a percentage of this segment's revenues, decreased from 46.0% positive during the year ended June 30, 2018 to 25.6% negative during the year ended June 30, 2019.
 
Hotels. Other operating results, net, associated with the Hotels segment increased 386.0%, from a net loss of ARS 43 million during the year ended June 30, 2018 to a net profit of ARS 123 million during the year ended June 30, 2019, mainly due to an insurance recovery associated with a boiler-related loss. Other operating results, net, of this segment, as a percentage of this segment's revenues increased from 1.6% negative during the year ended June 30, 2018 to 3.9% positive during the year ended June 30, 2019.
 
International. Other operating results, net, of this segment decreased by 58.1%, from a net loss of ARS 62 million during the year ended June 30, 2018 to a net loss of ARS 26 million during the year ended June 30, 2019, mainly due to lower donations and tax charges.
 
Corporate. Other operating results, net, associated with the Corporate segment did not show variations during the reported years.
 
Others. Other operating results, net, associated with the Others segment decreased by 1,038.9%, from a net profit of ARS 36 million during the year ended June 30, 2018 to a net loss of ARS 338 million during the year ended June 30, 2019, mainly due to a negative result generated by the sale of Tarshop S.A. and lower results from Entertainment Holdings S.A. Other net operating results, of this segment, as a percentage of this segment's revenues increased from 76.6% positive during the year ended June 30, 2018 to 164.9% negative during the year ended June 30, 2019.
 
 
41
 
 
Profit / (loss) from operations 2019 vs 2018
 
The total consolidated profit from operations, pursuant to the income statement, decreased from a net profit of ARS 28,682 million during the year ended June 30, 2018 to a net loss of ARS 33,758 million during the year ended June 30, 2019 (out of which a net profit of ARS 115 million derives from the Operations Center in Israel and a loss of ARS 33,643 from the Operations Center in Argentina), Excluding the effect from the Operations Center in Israel, profit from operations decreased by 217.0%. The total consolidated profit from operations, measured as a percentage of revenues from sales, leases and services, increased from 146.9% positive during the year ended June 30, 2018 to 168.2% negative during the year ended June 30, 2019, Without considering the effect from the Operations Center in Israel, the total consolidated profit from operations, measured as a percentage of total revenues, increased from 147.4% positive during the year ended June 30, 2018 to 167.6% negative during the year ended June 30, 2019.
 
Profit from operations of our joint ventures increased from a loss of ARS 1,073 million during the year ended June 30, 2018 (out of which an ARS 122 million profit is allocated to the Shopping Malls segment, a net loss of ARS 1,027 million derives from the Offices segment and an ARS 76 million profit to the Sales and Developments segment of the Operations Center in Argentina), to a net profit of ARS 1,108 million during the year ended June 30, 2019 (out of which a profit of ARS 125 million is allocated to the Shopping Malls segment, a net profit of ARS 758 million derives from the Offices segment and a profit of ARS 225 million to the Sales and Developments of the Operations Center in Argentina).
 
Therefore, according to the information by segments, profit from operations net loss, decreased from a net profit of ARS 29,818 million during the year ended June 30, 2018 to a net loss of ARS 34,723 million during the year ended June 30, 2019 (out of which ARS 115 million derive from the Operations Center in Israel and a loss of ARS 34,608 from the Operations Center in Argentina). Profit from operations, measured as a percentage of revenues according to segment information, decreased from 199.7% profit during the year ended June 30, 2018 to 214.2% loss during the year ended June 30, 2019. Excluding the effect from the Operations Center in Israel, total profit from operations according to segment information, measured as a percentage of total revenues, increased from 200.2% profit during the year ended June 30, 2018 to 213.5% loss during the year ended June 30, 2019.
 
Operations Center in Argentina
 
Shopping Malls. Operating income from the Shopping Malls segment decreased, from a profit of ARS 14,668 million during fiscal year 2018, to a loss of ARS 37,033 million during fiscal year 2019.
 
Offices. Profit from operations associated with our Offices segment, decreased by 66.6%, from a profit of ARS 7,637 million during the year ended June 30, 2018 to a profit of ARS 2,553 million during the year ended June 30, 2019. The variation is mainly due to a decrease of ARS 6,047 million from the net gain from fair value adjustment of investment properties. Profit from operations of the Offices segment as a percentage of this segment's revenues decreased from 532.6% during the year ended June 30, 2018 to 106.0% during the year ended June 30, 2019.
 
Sales and developments. Profit from operations associated with our Sales and Developments segment decreased by 91.4%, from an ARS 7,938 million profit during the year ended June 30, 2018 to an ARS 680 million profit during the year ended June 30, 2019. This decrease is mainly due to a decrease of ARS 7,136 million in the net gain from fair value adjustment of investment properties. Profit from operations of the Sales and Developments segment as a percentage of this segment's revenues decreased from 2,450.0% during the year ended June 30, 2018 to 56.4% during the year ended June 30, 2019.
 
Hotels. Profit from operations associated with the Hotels segment showed an increase of 1,182.1%, from a loss of ARS 67 million during the year ended June 30, 2018 to a profit of ARS 725 million during the year ended June 30, 2019. This increase is mainly due to the increase in the average rate per room of our hotel portfolio (measured in pesos), thus generating an increase in revenues, and to the insurance recovery associated with the boiler-related loss in Intercontinental Hotel. Profit from operations of the Hotels segment as a percentage of this segment's revenues increased from 2.5% during the year ended June 30, 2018 to 22.8% during the year ended June 30, 2019.
 
International. Profit from operations associated with our International segment changed by 31.7%, from a loss of ARS 189 million during the year ended June 30, 2018 to a loss of ARS 129 million during the year ended June 30, 2019. This variation is due to lower donations and tax charges.
 
Corporate. Profit from operations associated with our Corporate segment increased by 35.6%, from a loss of ARS 413 million during the year ended June 30, 2018 to a loss of ARS 560 million during the year ended June 30, 2019, mainly affected by general and administrative expenses.
 
Others. Profit from operations associated with our Others segment decreased, from a net profit of ARS 328 million during the year ended June 30, 2018 to a net loss of ARS 844 million during the year ended June 30, 2019. This variation is mainly due to an ARS 793 million decrease in the net gain from fair value adjustment of investment properties. Profit from operations of the Others segment as a percentage of this segment's revenues decreased from 697.9% profit during the year ended June 30, 2018 to 411.7% loss during the year ended June 30, 2019.
 
Operations Center in Israel
 
Corporate. Profit from operations of the Corporate segment went from a net loss of ARS 84 million during the period ended June 30, 2018 to a net loss of ARS 115 million during the year ended June 30, 2019. Such variation was due to an increase in fees and compensation for services.
 
Share of profit / (loss) of associates and joint ventures 2019 vs 2018
 
The share of profit / (loss) of associates and joint ventures, pursuant to the income statement, increased by 113.7% from a net loss of ARS 3,551 million during the year ended June 30, 2018 to a net loss of ARS 7,588 million during the year ended June 30, 2019 (from the Operations Center in Argentina), mainly due to the negative results from the Sales and developments. International and Others segments.
 
Also, the net share of profit / (loss) of associates and joint ventures, mainly from Nuevo Puerto Santa Fe S.A. (Shopping Malls segment), Quality Invest S.A. (Offices segment) and Cyrsa S.A. and Puerto Retiro S.A. (Sales and Developments segment), evidenced a decrease of 209.6%, going from a profit of ARS 1,000 million during the year ended June 30, 2018 to a loss of ARS 1,096 million during the year ended June 30, 2019, mainly due to results from the joint venture Quality Invest S.A. due to lower results in the valuation of investment properties and Puerto Retiro S.A. due to a provision equivalent to 100% of the book value of the plot of land based on the evolution of the judicial actions that affect it.
 
Operations Center in Argentina
 
Shopping Malls. In the segment information the share of profit / (loss) of joint venture Nuevo Puerto Santa Fe S.A. is exposed line by line on a consolidated basis.
 
Offices. In the information by segments, the share of profit / (loss) of joint venture Quality S.A. is exposed line by line on a consolidated basis.
 
Sales and developments. The share of profit / (loss) of joint ventures Cyrsa S.A. and Puerto Retiro S.A. are exposed line by line on a consolidated basis. The share of profit / (loss) of our associate Manibil S.A., which is disclosed in this line, decreased by ARS 44 million, from a profit of ARS 4 million during the year ended June 30, 2018 to a loss of ARS 40 million during the year ended June 30, 2019.
 
Hotels. This segment does not present results from the share of profit / (loss) of associates and joint ventures.
 
International. The share of profit / (loss) of associates and joint ventures of this segment decreased by 16.9%, from a net loss of ARS 4,763 million during the year ended June 30, 2018 to a net loss of ARS 3,960 million during the year ended June 30, 2019, mainly generated by a negative result of our investment in New Lipstick LLC of ARS 4,007 million.
 
Others. The share of profit / (loss) of associates and joint ventures of the Others segment decreased by 1,298.1%, from a net profit of ARS 208 million during the year ended June 30, 2018 to a net loss of ARS 2,492 million during the year ended June 30, 2019, mainly as a result of a loss from of our investments in Banco Hipotecario S.A. for ARS 2,597 million.
 
Financial results, net
 
The financial results went from a loss of ARS 16,604 million during the year ended June 30, 2018 to a loss of ARS 3,102 million during the year ended June 30, 2019, this variation is mainly due to:
 
 
Positive variation of the net exchange difference that went from a loss of ARS 14,235 million during the year ended June 30, 2018 to a profit of ARS 1,080 million during the year ended June 30, 2019. This variation lies in the fact that in fiscal year 2019 inflation was higher than devaluation (47% vs, 56%, respectively).
 
 
Increase in net interest expense that went from a loss of ARS 4,315 million during the year 2018 to a loss of ARS 5,034 million during the year 2019.
 
Income tax
 
The Company applies the deferred tax method to calculate the income tax corresponding to the years presented, thus recognizing temporary differences as tax assets and liabilities. The income tax charge for the year went from a profit of ARS 11,455 million during the year ended June 30, 2018, to a profit of ARS 4,845 million during the year ended June 30, 2019, from the Operations Center in Argentina.
 
Loss for the year
 
As a result of the factors described above, the profit of the year, including the effect of discontinued operations, decreased by ARS 77,062, from a profit of ARS 35,755 million during the year ended June 30, 2018 to a loss of ARS 41,307 million during the year ended June 30, 2019, out of which a loss of ARS 39,547 million derives from the Operations Center in Argentina and a loss of ARS 1,760 million from the Operations Center in Israel.


42


Results of Operations for the Three Months ended September 30, 2020 compared to the Three Months ended September 30, 2019
 
Below is a summary of the operating segments by geography and a reconciliation between the total of the operating result according to the information by segments and the operating result according to the income statement for the periods ended September 30, 2020 and 2019.


Operations Center in Argentina


Operations Center in Israel


Total Segment Information


Joint Ventures


Expenses and Collective Promotion Fund


Inter-segment eliminations and non-reportable assets / liabilities


Total income statement / statement of financial position


  09.30.20  
  09.30.19  
 
Var.
 
 
  09.30.20  
  09.30.19  
 
Var.
 
 
  09.30.20  
  09.30.19  
 
Var.
 
 
  09.30.20  
  09.30.19  
 
Var.
 
 
  09.30.20  
  09.30.19  
 
Var.
 
 
  09.30.20  
  09.30.19  
 
Var.
 
 
  09.30.20  
  09.30.19  
 
Var.
 
 
(in Million ARS)
Revenues
  1,218 
  3,609 
  (2,391)


  1,218 
  3,609 
  (2,391)
  (8)
  (25)
  17 
  405 
  910 
  (505)
  (6)
  (7)
  1 
  1,609 
  4,487 
  (2,878)
Costs
  (651)
  (740)
  89  


  (651)
  (740)
  89  
  14  
  11  
  3  
  (460)
  (953)
  493  


  (1,097)
  (1,682)
  585  
Gross profit/(loss)
  567  
  2,869  
  (2,302)


  567  
  2,869  
  (2,302)
  6  
  (14)
  20  
  (55)
  (43)
  (12)
  (6)
  (7)
  1  
  512  
  2,805  
  (2,293)
Net gain/(loss) from fair value adjustment of investment properties
  24,926 
  12,897 
  12,029 


  24,926 
  12,897 
  12,029 
  (837)
  (548)
  (289)


  24,089 
  12,349 
  11,740 
General and administrative expenses
  (649)
  (651)
  2 
  (5)
  (28)
  23 
  (654)
  (679)
  25 
  1 
  8 
  (7)


  9 
  10 
  (1)
  (644)
  (661)
  17 
Selling expenses
  (451)
  (300)
  (151)


  (451)
  (300)
  (151)
  1 
  5 
  (4)


  (450)
  (295)
  (155)
Other operating results, net
  (25)
  (65)
  40  


  (25)
  (65)
  40  
  1  
   
  1  
  9  
  12  
  (3)
  (3)
  (3)
   
  (18)
  (56)
  38  
Profit/(loss) from operations
  24,368  
  14,750  
  9,618  
  (5)
  (28)
  23  
  24,363  
  14,722  
  9,641  
  (828)
  (549)
  (279)
  (46)
  (31)
  (15)


  23,489  
  14,142  
  9,347  
Share of profit/(loss) of associates and joint ventures
  (472)
  324  
  (796)


  (472)
  324  
  (796)
  619  
  413  
  206  


  147  
  737  
  (590)
Segment profit/(loss)
  23,896  
  15,074  
  8,822  
  (5)
  (28)
  23  
  23,891  
  15,046  
  8,845  
  (209)
  (136)
  (73)
  (46)
  (31)
  (15)


  23,636  
  14,879  
  8,757  
Reportable assets
  185,020 
  132,844 
  52,176 
  1,399 
  542,703 
  (541,304)
  186,419 
  675,547 
  (489,128)
  (954)
  (771)
  (183)


  14,950 
  33,893 
  (18,943)
  200,415 
  708,669 
  (508,254)
Reportable liabilities


  (2,355)
  (480,535)
  478,180  
  (2,355)
  (480,535)
  478,180  


  (104,321)
  (114,060)
  9,739  
  (106,676)
  (594,595)
  487,919  
Net reportable assets
  185,020  
  132,844  
  52,176  
  (956)
  62,168  
  (63,124)
  184,064  
  195,012  
  (10,948)
  (954)
  (771)
  (183)


  (89,371)
  (80,167)
  (9,204)
  93,739  
  114,074  
  (20,335)
 
Operations Center in Argentina
 
Below is a summary analysis of the operating segments by products and services of the Operations Center in Argentina for the periods ended September 30, 2020 and 2019


Shopping Malls


Offices


Sales and Developments


Hotels


International


Corporate


Others


Total


  09.30.20  
  09.30.19  
 
Var.
 
 
  09.30.20  
  09.30.19  
 
Var.
 
 
  09.30.20  
  09.30.19  
 
Var.
 
 
  09.30.20  
  09.30.19  
 
Var.
 
 
  09.30.20  
  09.30.19  
 
Var.
 
 
  09.30.20  
  09.30.19  
 
Var.
 
 
  09.30.20  
  09.30.19  
 
Var.
 
 
  09.30.20  
  09.30.19  
 
Var.


(in Million ARS)
 
Revenues
  367 
  2,085 
  (1,718)
  541 
  697 
  (156)
  39 
  83 
  (44)
  6 
  701 
  (695)
  263 
  3 
  260 


  2 
  40 
  (38)
  1,218 
  3,609 
  (2,391)
Costs
  (134)
  (180)
  46  
  (45)
  (37)
  (8)
  (97)
  (56)
  (41)
  (129)
  (429)
  300  
  (221)
  (4)
  (217)


  (25)
  (34)
  9  
  (651)
  (740)
  89  
Gross profit/(loss)
  233  
  1,905  
  (1,672)
  496  
  660  
  (164)
  (58)
  27  
  (85)
  (123)
  272  
  (395)
  42  
  (1)
  43  


  (23)
  6  
  (29)
  567  
  2,869  
  (2,302)
Net gain/(loss) from fair value adjustment of investment properties
  1,178 
  601 
  577 
  13,112 
  6,845 
  6,267 
  10,096 
  5,153 
  4,943 


  2 
   
  2 


  538 
  298 
  240 
  24,926 
  12,897 
  12,029 
General and administrative expenses
  (328)
  (257)
  (71)
  (87)
  (56)
  (31)
  (66)
  (66)
   
  (57)
  (107)
  50 
  (17)
  (41)
  24 
  (74)
  (88)
  14 
  (20)
  (36)
  16 
  (649)
  (651)
  2 
Selling expenses
  (73)
  (140)
  67 
  (37)
  (29)
  (8)
  (305)
  (53)
  (252)
  (19)
  (77)
  58 
  (16)
   
  (16)


  (1)
  (1)
   
  (451)
  (300)
  (151)
Other operating results, net
  (24)
  (27)
  3  
  (1)
  (7)
  6  
  (6)
  (16)
  10  
  8  
  (4)
  12  
   
  (1)
  1  


  (2)
  (10)
  8  
  (25)
  (65)
  40  
Profit/(loss) from operation s
  986  
  2,082  
  (1,096)
  13,483  
  7,413  
  6,070  
  9,661  
  5,045  
  4,616  
  (191)
  84  
  (275)
  11  
  (43)
  54  
  (74)
  (88)
  14  
  492  
  257  
  235  
  24,368  
  14,750  
  9,618  
Share of profit/(loss) of associates and joint ventures


  (8)
  1  
  (9)


  (386)
  (228)
  (158)


  (78)
  551  
  (629)
  (472)
  324  
  (796)
Segment profit/(loss)
  986  
  2,082  
  (1,096)
  13,483  
  7,413  
  6,070  
  9,653  
  5,046  
  4,607  
  (191)
  84  
  (275)
  (375)
  (271)
  (104)
  (74)
  (88)
  14  
  414  
  808  
  (394)
  23,896  
  15,074  
  8,822  
Reportable assets
  54,406 
  55,279 
  (873)
  72,262 
  40,970 
  31,292 
  45,273 
  36,352 
  8,921 
  1,954 
  2,155 
  (201)
  1,884 
  (9,269)
  11,153 


  9,241 
  7,357 
  1,884 
  185,020 
  132,844 
  52,176 
Reportable liabilities


Net reportable assets
  54,406  
  55,279  
  (873)
  72,262  
  40,970  
  31,292  
  45,273  
  36,352  
  8,921  
  1,954  
  2,155  
  (201)
  1,884  
  (9,269)
  11,153  


  9,241  
  7,357  
  1,884  
  185,020  
  132,844  
  52,176  
 
 
43
 
 
Operations Center in Israel
 
Below is a summary analysis of the operating segments by products and services of the Operations Center in Israel for the periods ended September 30, 2020 and 2019


Real Estate
 
 
Supermarkets
 
 
Telecommunications
 
 
Insurance
 
 
Corporate
 
 
Others
 
 
Total
 
 
  09.30.20  
  09.30.19  
 
Var.
 
 
  09.30.20  
  09.30.19  
 
Var.
 
 
  09.30.20  
  09.30.19  
 
Var.
 
 
  09.30.20  
  09.30.19  
 
Var.
 
 
  09.30.20  
  09.30.19  
 
Var.
 
 
  09.30.20  
  09.30.19  
 
Var.
 
 
  09.30.20  
  09.30.19  
 
Var.
 
 
(in Million Pesos)
Revenues


Costs


Gross profit/(loss)


Net gain/(loss) from fair value adjustment of investment properties


General and administrative expenses


  (5)
  (28)
  23 


  (5)
  (28)
  23 
Selling expenses


Other operating results, net


Profit/(loss) from operations


  (5)
  (28)
  23  


  (5)
  (28)
  23  
Share of profit/(loss) of associates and joint ventures


Segment profit/(loss)


  (5)
  (28)
  23  


  (5)
  (28)
  23  
Reportable assets
   
  204,587 
  (204,587)
   
  34,536 
  (34,536)
   
  159,317 
  (159,317)
   
  20,065 
  (20,065)
  1,399 
  74,195 
  (72,796)
   
  50,003 
  (50,003)
  1,399 
  542,703 
  (541,304)
Reportable liabilities
   
  (165,817)
  165,817  


  (127,182)
  127,182  


  (2,355)
  (27,718)
  25,363  
   
  (159,818)
  159,818  
  (2,355)
  (480,535)
  478,180  
Net reportable assets
   
  38,770  
  (38,770)
   
  34,536  
  (34,536)
   
  32,135  
  (32,135)
   
  20,065  
  (20,065)
  (956)
  46,477  
  (47,433)
   
  (109,815)
  109,815  
  (956)
  62,168  
  (63,124)


44
 
 
Revenues September 2020 vs September 2019
 
Revenues from sales, leases, and services, according to the income statement, decreased by ARS 2,878 million, from ARS 4,487 million during the three-month period ended September 30, 2019, to ARS 1,609 million during the three-month period ended September 30, 2020 (from the Operations Center in Argentina). In index terms, revenues from sales, leases, and services decreased by 64.1%.
 
In turn, revenues from expenses and Collective Promotion Fund decreased by 55.5%, from ARS 910 million (out of which ARS 844 million are allocated to the Shopping Malls segment and ARS 66 million to the Offices segment in the Operations Center in Argentina) during the three-month period ended September 30, 2019, to ARS 405 million (out of which ARS 353 million are allocated to the Shopping Malls segment and ARS 52 million to the Offices segment) during the three-month period ended September 30, 2020.
 
Moreover, revenues from our joint ventures decreased by 68.0%, from ARS 25 million during the three-month period ended September 30, 2019 (out of which ARS 20 million are allocated to the Shopping Malls segment and ARS 5 million to the Offices segment of the Operations Center in Argentina), to ARS 8 million during the three-month period ended September 30, 2020 (out of which ARS 2 million are allocated to the Shopping Malls segment and ARS 6 million to the Offices segment of the Operations Center in Argentina).
 
Finally, revenues from inter-segment transactions decreased by ARS 1 million, from ARS 7 million during the three-month period ended September 30, 2019, to ARS 6 million during the three-month period ended September 30, 2020.
 
Therefore, according to information by segments, revenues decreased by ARS 2,391 million, from ARS 3,609 million during the three-month period ended September 30, 2019 to ARS 1,218 million during the three-month period ended September 30, 2020 (from the Operations Center in Argentina). Revenues, according to information by segments, decreased by 66.3%.
 
Operations Center in Argentina
 
Shopping Malls. Revenues from the Shopping Malls segment decreased by 82.4% from ARS 2,085 million during the three-month period ended September 30, 2019, to ARS 367 million during the three-month period ended September 30, 2020. Such fall is mainly attributable to: (i) an ARS 926 million decrease in revenues from permanent leases (total sales from our lessees decrease 79.4% from ARS 25,113 million in period 2019 to ARS 5,174 million in period 2020). Compared to the comparative quarter, there is an increase in real terms due to the reopening of some of the shopping malls that were operating as of September 30, 2020; (ii) a decrease in contingent leases income of ARS 437 million; (iii) an ARS 118 million decrease in income from parking; (iv) an ARS 114 million decrease in income from admission rights; and (v) an ARS 72 million decrease in averaging of scheduled rent escalation.
 
Offices. Revenues from the Offices segment increased by 22.4% from ARS 697 million during the three-month period ended September 30, 2019 to ARS 541 million during the three-month period ended September 30, 2020. This variation is mainly explained by a decrease of 22.6% in revenues from leases, from ARS 691 million during the three-month period ended September 30, 2019 to ARS 535 million during the three-month period ended September 30, 2020, mainly as a result less income from leases due to the sale of Bouchard Building and sale of floors in Boston Tower during this quarter.
 
Sales and Developments. Revenues from the Sales and Developments segment recorded a 53.0% decrease, from ARS 83 million during the three-month period ended September 30, 2019, to ARS 39 million during the three-month period ended September 30, 2020. This segment often varies significantly from period to period to the non-recurrence of different sales transactions carried out by the Group over time.
 
Hotels. Revenues from our Hotels segment decreased by 99.1% from ARS 701 million during the three-month period ended September 30, 2019 to ARS 6 million during the three-month period ended September 30, 2020, mainly due to a decrease in revenues as a result of the fall in the tourist industry during this period because of COVID 19.
 
International. Revenues from our International segment increased by ARS 260 million, from ARS 3 million during the three-month period ended September 30, 2019, to ARS 263 million during the three-month period ended September 30, 2020 due to the sale of Stowe House in USD 3.45 million, generating a profit of USD 0.3 million.
 
Corporate. Revenues associated with our Corporate segment showed no variations for the reported periods.
 
Others. Revenues from the Others segment decreased by 95.0% from ARS 40 million during the three-month period ended September 30, 2019 to ARS 2 million during the three-month period ended September 30, 2020, mainly due to the lack of incomes derived from LA RURAL S.A. – OFC S.R.L. – OGDEN S.A. – ENTRETENIMIENTO UNIVERSAL S.A. – Joint venture – (Convention Center and Exhibitions of the City of Buenos Aires Administrator), attributable to the COVID-19 pandemic.
 
Costs September 2020 vs September 2019
 
Total consolidated costs, according to the income statement, decreased by ARS 585 million, from ARS 1,682 million during the three-month period ended September 30, 2019 to ARS 1,097 million during the three-month period ended September 30, 2020 (from the Operations Center in Argentina). In index terms, costs decreased by 34.8%. Furthermore, consolidated total costs measured as a percentage of consolidated total revenues increased from 37.5% during the three-month period ended September 30, 2019 to 68.2% during the three-month period ended September 30, 2020.
 
In turn, costs related to expenses and Collective Promotion Fund decreased by 51.7% from ARS 953 million during the three-month period ended September 30, 2019 (out of which ARS 881 million are allocated to the Shopping Malls segment and ARS 72 million to the Offices segment of the Operations Center in Argentina) to ARS 460 million during the three-month period ended September 30, 2020 (out of which ARS 405 million are allocated to the Shopping Malls segment and ARS 55 million to the Offices segment of the Operations Center in Argentina) mainly due to lower costs originated by our Shopping Malls, which decreased by 54.0% from ARS 881 million during the three-month period ended September 30, 2019 to ARS 405 million during the three-month period ended September 30, 2020.
 
Likewise, costs from our joint ventures showed a 27.3% increase, from ARS 11 million during the three-month period ended September 30, 2019 (out of which ARS 1 million are allocated to the Shopping Malls segment; ARS 9 million to the Offices segment and ARS 1 million to the Sales and Developments segment of the Operations Center in Argentina) to ARS 14 million during the three-month period ended September 30, 2020 (out of which ARS 2 million are allocated to the Shopping Malls segment; ARS 10 million to the Offices segment and ARS 2 million to the Sales and Developments segment of the Operations Center in Argentina).
 
Finally, costs from inter-segment operations showed no variations for the reported periods.
 
Therefore, according to information by segments (taking into account the costs from our joint ventures and without considering the costs associated with expenses and collective promotion fund or the costs from inter-segment operations), costs evidenced a decrease of ARS 89 million, from ARS 740 million during the three-month period ended September 30, 2019 to ARS 651 million during the three-month period ended September 30, 2020 (from the Operations Center in Argentina). In index terms, costs decreased by 12.0%. Likewise, total costs, measured as a percentage of total revenues, according to information by segments, increased from 20.5% during the three-month period ended September 30, 2019 to 53.4% during the three-month period ended September 30, 2020.
 
Operations Center in Argentina
 
Shopping Malls. Costs associated with the Shopping Malls segment decreased by 25.6%, from ARS 180 million during the three-month period ended September 30, 2019 to ARS 134 million during the three-month period ended September 30, 2020, mainly due to: (i) a decrease in maintenance expenses of ARS 36 million; (ii) a decrease in leases and expenses of ARS 7 million; (iii) an ARS 4 million decrease in fees and compensation services; partially offset by: (iv) an increase in salaries, social security and other personnel administrative expenses of ARS 7 million. Costs associated with the Shopping Malls segment, measured as a percentage of the revenues from this segment, increased from 8.6% during the three-month period ended September 30, 2019 to 36.5% during the three-month period ended September 30, 2020.
 
Offices. Costs associated with the Offices segment increased by 21.6%, from ARS 37 million during the three-month period ended September 30, 2019 to ARS 45 million during the three-month period ended September 30, 2020, mainly due to (i) an increase of ARS 7 million in salaries, social security charges and other personnel administrative expenses; (ii) a decrease in amortization and depreciation of ARS 3 million; (iii) an increase in maintenance expenses of ARS 3 million; offset by: (iv) a decrease in leases and expenses of ARS 7 million. Costs associated with the Offices segment, measured as a percentage the revenues from this segment, increased from 5.3% during the three-month period ended September 30, 2019 to 8.3% during the three-month period ended September 30, 2020.
 
Sales and Developments. Costs associated with our Sales and Developments segment recorded a 73.2% increase from ARS 56 million during the three-month period ended September 30, 2019 to ARS 97 million during the three-month period ended September 30, 2020, mainly due to an increase in the cost of sale of goods and services generated by Catalinas in an amount of ARS 43 million. Costs in the Sales and Developments segment, measured as a percentage of revenues from this segment, increased from 67.5% during the three-month period ended September 30, 2019 to 248.7% during the three-month period ended September 30, 2020.
 
Hotels. Costs in the Hotels segment decreased by 69.9%, from ARS 429 million during the three-month period ended September 30, 2019 to ARS 129 million during the three-month period ended September 30, 2020, mainly as a result of (i) an ARS 136 million decrease in the costs of salaries, social security and other personnel expenses; (ii) an ARS 81 million decrease in maintenance, repair, and services; (iii) an ARS 41 million decrease in food, beverages and other hotel expenses; and (iv) an ARS 20 million decrease in fees and compensation services. Costs in the Hotels segment, measured as a percentage of revenues from this segment, increased from 61.2% during the three-month period ended September 30, 2019 to 2,150.0% during the three-month period ended September 30, 2020.
 
International. Costs in the International segment increased 5,425.0%, amounting to ARS 221 million during the three-month period ended September 30, 2020 and ARS 4 million during the three-month period ended September 30, 2019, mainly as a result of an increase in cost of selling properties of ARS 219 million due to the sale of Stowe House. Costs in the International segment, measured as a percentage of revenues from this segment, decreased from 133.3% during the three-month period ended September 30, 2019 to 84.0% during the three-month period ended September 30, 2020.
 
Corporate. Costs in the Corporate segment did not vary in the reported periods.
 
Others. Costs in the Others segment decreased by 26.5%, from ARS 34 million during the three-month period ended September 30, 2019 to ARS 25 million during the three-month period ended September 30, 2020, mainly as a result of: (i) a decrease of ARS 5 million in salaries, social security charges and other personnel administrative expenses; and (ii) an decrease in maintenance expenses of ARS 4 million.
 
 
45
 
 
Gross profit 2020 vs. 2019
 
The total consolidated gross profit, according to the income statement, decreased by ARS 2,293 million, from ARS 2,805 million during the three-month period ended September 30, 2019 to ARS 512 million during the three-month period ended September 30, 2020 (from the Operations Center in Argentina). In index terms, the gross profit decreased by 81.7%. The total consolidated gross profit, measured as a percentage of revenues, decreased from 62.5% during the three-month period ended September 30, 2019 to 31.8% during the three-month period ended September 30, 2020.
 
In turn, total gross profit (loss) on account of expenses and collective promotion fund increased by ARS 12 million, from ARS 43 million during the three-month period ended September 30, 2019 (out of which a loss of ARS 37 million derives from the Shopping Malls segment and a loss of ARS 6 million from the Offices segment), to ARS 55 million during the three-month period ended September 30, 2020 (out of which a loss of ARS 52 million derives from the Shopping Malls segment and other loss of ARS 3 million from the Offices segment).
 
Additionally, the gross profit (loss) from our joint ventures decreased by 142.9%, from ARS 14 million during the three-month period ended September 30, 2019 to ARS 6 million during the three-month period ended September 30, 2020.
 
Therefore, according to information by segments, gross profit decreased by ARS 2,302 million, from ARS 2,869 million during the three-month period ended September 30, 2019 to ARS 567 million during the three-month period ended September 30, 2020 (from the Operations Center in Argentina). In index terms, the gross profit decreased by 80.2%. In addition, gross profit, measured as a percentage of revenues, according to information by segments, decreased from 79.5% during the three-month period ended September 30, 2019 to 46.6% during the three-month period ended September 30, 2020.
 
Operations Center in Argentina
 
Shopping Malls. Gross profit from the Shopping Malls segment decreased by 87.8%, from ARS 1,905 million during the three-month period ended September 30, 2019 to ARS 233 million during the three-month period ended September 30, 2020, mainly as a result of a decrease in total sales of our lessees in real terms, thus resulting in lower percentage rentals under our lease agreements. Gross profit from the Shopping Malls segment as a percentage of the segment revenues, decreased from 91.4% during the three-month period ended September 30, 2019 to 63.5% during the three-month period ended September 30, 2020.
 
Offices. Gross profit from the Offices segment decreased by 24.8% from ARS 660 million during the three-month period ended September 30, 2019 to ARS 496 million during the three-month period ended September 30, 2020. Gross profit from the Offices segment, measured as percentage of revenues from this segment, decreased from 94.7% during the three-month period ended September 30, 2019 to 91.7% during the three-month period ended September 30, 2020.
 
Sales and developments. Gross profit from the Sales and Developments segment decreased by 314.8%, from a profit of ARS 27 million during the three-month period ended September 30, 2019 to an ARS 58 million loss during the three-month period ended September 30, 2020. Gross profit from the Sales and Developments segment, measured as a percentage of revenues from this segment, increased from 32.5% positive during the three-month period ended September 30, 2019 to 148.7% negative during the three-month period ended September 30, 2020.
 
Hotels. Gross profit from the Hotels segment decreased by 145.2% from a profit of ARS 272 million during the three-month period ended September 30, 2019 to an ARS 123 million loss during the three-month period ended September 30, 2020. Gross profit from the Hotels segment, measured as a percentage of revenues from this segment, increased from 38.8% positive during the three-month period ended September 30, 2019 to 2,050.0% negative during the three-month period ended September 30, 2020.
 
International. Gross profit from the International segment increased by 4,300.0%, as a gross loss of ARS 1 million was recorded during the three-month period ended September 30, 2019 and a ARS 42 million gross profit was recorded during the three-month period ended September 30, 2020. Gross profit from the International segment, measured as a percentage of revenues from this segment, decreased from 33.3% negative during the three-month period ended September 30, 2019 to 16.0% positive during the three-month period ended September 30, 2020.
 
Corporate. Gross profit from the Corporate segment did not show any variations during the reported periods.
 
Others. Gross profit from the Others segment decreased by 483.3% from a profit of ARS 6 million during the three-month period ended September 30, 2019 to an ARS 23 million loss during the three-month period ended September 30, 2020. Gross profit from the Others segment, measured as a percentage of revenues from this segment, increased from 15.0% positive during the three-month period ended September 30, 2019 to 1,150.0% negative during the three-month period ended September 30, 2020.
 
Net gain (loss) from fair value adjustment of investment properties September 2020 vs September 2019
 
Total consolidated net gain/(loss) from fair value adjustment of investment properties, according to the income statement, increased by ARS 11,740 million, from a net profit of ARS 12,349 million during the three-month period ended September 30, 2019 (mainly from the Operations Center in Argentina) to a net gain of ARS 24,089 million during the three-month period ended September 30, 2020 (from the Operations Center in Argentina).
 
Operations Center in Argentina
 
For the period ended September 30, 2020, the net gain/(loss) from fair value adjustment of investment properties was a gain of ARS 24,926 million (an ARS 1,178 million profit from our Shopping Malls segment; an ARS 13,112 million gain from our Offices segment; an ARS 10,096 million gain of our Sales and Developments segment; an ARS 2 million gain of our International segment; and an ARS 538 million gain of our Other segment).
 
The net impact of prices in Pesos of our properties mainly resulted from a change in macroeconomic conditions: (i) the Argentine gross domestic product growth rate estimated for 2020 remained in order to -11.5%; and (ii) from June 2020 to September 2020, the Argentine Peso depreciated by 8% with respect to the US Dollar (from ARS 70.26 per USD 1.00 to ARS 75.98 per USD 1.00) which mainly resulted in a decrease in projected cash flows in US Dollars from the Shopping Malls.
 
The offices market in Argentina is a liquid market, in which a great number of counterparties participates carrying out sale-purchase transactions. This situation results in significant and representative sale-purchase prices. Furthermore, lease agreements are denominated in US dollars and are usually executed for three-year terms, hence this business produces stable cash flows in US dollars. In this sense, we use the Market Approach method to determine the fair value of our Offices and Others segment, the value per sqm, being the most representative measurement.
 
Since September 2019, the real estate market experienced certain operational changes due to the adoption of foreign exchange regulations. As a result, it is very likely that office buildings/lands reserved sales be settled in Pesos at an implied exchange rate higher than the official exchange rate, which can be observed in the transactions conducted by the Company before and after closing of these financial statements. Therefore, we have valued our offices and lands reserved in Pesos as of closing of these financial statements considering the aforementioned situation, thus resulting in a gain with respect to the previously recorded values.
 
General and administrative expenses September 2020 vs September 2019
 
Total general and administrative expenses, according to the income statement, recorded a decrease of ARS 17 million, from ARS 661 million during the three-month period ended September 30, 2019 (out of which ARS 28 million derive from the Operations Center in Israel and ARS 633 million from the Operations Center in Argentina) to ARS 644 million during the three-month period ended September 30, 2020 (out of which ARS 5 million derive from the Operations Center in Israel and ARS 639 million from the Operations Center in Argentina). Excluding the effect from the Operations Center in Israel, administrative expenses increased by 0.9%. Total administrative expenses, measured as a percentage of revenues, increased from 14.7% during the three-month period ended September 30, 2019 to 40.0% during the three-month period ended September 30, 2020. Excluding the effect from the Operations Center in Israel, total general and administrative expenses, measured as a percentage of revenues, increased from 14.1% during the three-month period ended September 30, 2019 to 39.7% during the three-month period ended September 30, 2020.
 
In turn, administrative expenses of our joint ventures decreased by ARS 7 million, from ARS 8 million during the three-month period ended September 30, 2019 to ARS 1 million during the three-month period ended September 30, 2020.
 
Finally, administrative expenses for inter-segment transactions decreased by ARS 1 million, from ARS 10 million during the three-month period ended September 30, 2019 to ARS 9 million during the three-month period ended September 30, 2020.
 
Therefore, according to information by segments, administrative expenses decreased by ARS 25 million, from ARS 679 million during the three-month period ended September 30, 2019 (out of which ARS 28 million derive from the Operations Center in Israel and ARS 651 million derive from the Operations Center in Argentina) to ARS 654 million during the three-month period ended September 30, 2020 (out of which ARS 5 million derive from the Operations Center in Israel and ARS 649 million from the Operations Center in Argentina). Excluding the administrative expenses from the Operations Center in Israel, expenses decreased by 0.3%. Administrative expenses, measured as a percentage of revenues, increased from 18.8% during the three-month period ended September 30, 2019 to 53.7% during the three-month period ended September 30, 2020. Without considering the effects from the Operations Center in Israel, total administrative expenses, measured as a percentage of total revenues, showed an increase, from 18.0% during the three-month period ended September 30, 2019 to 53.3% during the three-month period ended September 30, 2020.
 
Operations Center in Argentina
 
Shopping Malls. Administrative expenses of Shopping Malls increased by 27.6%, from ARS 257 million during the three-month period ended September 30, 2019 to ARS 328 million during the three-month period ended September 30, 2020, mainly due to: (i) an increase of ARS 110 million in fees payable to directors; (ii) an increase of ARS 3 million in amortization and depreciation; partially offset by: (iii) a decrease of ARS 36 million in salaries, social security charges and other personnel administrative expenses; and (iv) a decrease of ARS 3 million in banking expenses. Administrative expenses of Shopping Malls, measured as a percentage of revenues from such segment, increased from 12.3% during the three-month period ended September 30, 2019 to 89.4% during the three-month period ended September 30, 2020.
 
Offices. The general and administrative expenses of our Offices segment increased by 55.4%, from ARS 56 million during the three-month period ended September 30, 2019 to ARS 87 million during the three-month period ended September 30, 2020, mainly as a result of: (i) a decrease in fees payable to directors of ARS 34 million; partially offset by (ii) a decrease in salaries, social security and other personnel administrative expenses of ARS 5 million. General and administrative expenses, measured as a percentage of revenues from the same segment, increased from 8.0% during the three-month period ended September 30, 2019 to 16.1% during the three-month period ended September 30, 2020.
 
 
46
 
 
Sales and Developments. General and administrative expenses associated with our Sales and Developments segment showed no variations remaining stable at ARS 66 million in both periods. General and administrative expenses, measured as a percentage of revenues from the same segment, increased from 79.5% during the three-month period ended September 30, 2019 to 169.2% during the three-month period ended September 30, 2020.
 
Hotels. General and administrative expenses associated with our Hotels segment decreased by 46.7% from ARS 107 million during the three-month period ended September 30, 2019 to ARS 57 million during the three-month period ended September 30, 2020, mainly as a result of: (i) an ARS 26 million decrease in salaries, social security and other personnel administrative expenses; (ii) an ARS 10 million decrease in maintenance, security, cleaning, repairs and related expenses; (iii) an ARS 8 million decrease in fees and compensation for services; and (iv) an ARS 5 million decrease in taxes, rates and contributions. General and administrative expenses associated with the Hotels segment, measured as a percentage of revenues from this segment, increased from 15.3% during the three-month period ended September 30, 2019 to 950.0% during the three-month period ended September 30, 2020.
 
International. General and administrative expenses associated with our International decreased by 58.5%, from ARS 41 million during the three-month period ended September 30, 2019 to ARS 17 million during the three-month period ended September 30, 2020, mainly as a result of an ARS 25 million decrease in salaries, social security and other personnel administrative expense.
 
Corporate. General and administrative expenses associated with our Corporate segment decreased by 15.9%, from ARS 88 million during the three-month period ended September 30, 2019 to ARS 74 million during the three-month period ended September 30, 2020, mainly as a result of: (i) an ARS 10 million decrease in salaries, social security and other personnel administrative expenses; and (ii) an ARS 6 million decrease in business expenses, mobility and library.
 
Others. General and administrative expenses associated with our Others segment increased by 44.4%, from ARS 36 million during the three-month period ended September 30, 2019 to ARS 20 million during the three-month period ended September 30, 2020, mainly due to (i) a decrease of ARS 12 million in maintenance, repairs and services; and (ii) a decrease of ARS 5 million in fees and compensation for services.
 
Operations Center in Israel
 
Corporate. General and administrative expenses associated with the Corporate segment decreased from ARS 28 million during the three-month period ended September 30, 2019 to ARS 5 million during the three-month period ended September 30, 2020. Such variation was due to a decrease in fees and compensation for services.
 
Selling expenses September 2020 vs September 2019
 
Total consolidated selling expenses, according to the income statement, showed an increase of ARS 155 million, from ARS 295 million during the three-month period ended September 30, 2019 to ARS 450 million during the three-month period ended September 30, 2020 (from the Operations Center in Argentina). In index terms, selling expenses increased by 52.5%. Total consolidated selling expenses, measured as a percentage of revenues from sales, leases and services, increased from 6.6% during the three-month period ended September 30, 2019 to 28.0% during the three-month period ended September 30, 2020.
 
In turn, selling expenses of our joint ventures decreased by ARS 4 million, from ARS 5 million during the three-month period ended September 30, 2019 to ARS 1 million during the three-month period ended September 30, 2020.
 
Therefore, according to information by segments, selling expenses increased by ARS 151 million from ARS 300 million during the three-month period ended September 30, 2019 to ARS 451 million during the three-month period ended September 30, 2020 (from the Operations Center in Argentina). In index terms, selling expenses increased by 50.3%. Selling expenses, measured as a percentage of revenues, according to information by segments, increased from 8.3% during the three-month period ended September 30, 2019 to 37.0% during the three-month period ended September 30, 2020.
 
Operations Center in Argentina
 
Shopping Malls. Selling expenses of the Shopping Malls segment decreased by 47.9%, from ARS 140 million during the three-month period ended September 30, 2019 to ARS 73 million during the three-month period ended September 30, 2020, mainly as a result of: (i) a decrease in the charge of taxes, rates and contributions of ARS 53 million; ii) a decrease in the charge of publicity, advertising and other commercial expenses of ARS 7 million; and iii) a decrease in the charge of fees and compensation for services of ARS 4 million. Selling expenses, measured as a percentage of revenues from the Shopping Malls segment, increased from 6.7% during the three-month period ended September 30, 2019 to 19.9% during the three-month period ended September 30, 2020.
 
Offices. Selling expenses associated with our Offices segment increased by 27.6% from ARS 29 million during the three-month period ended September 30, 2019 to ARS 37 million during the three-month period ended September 30, 2020. Such variation was mainly generated as a result of: (i) an ARS 12 million increase in the charge of taxes, rates and contributions, partially offset by (ii) an ARS 3 million decrease in the charge of doubtful accounts. Selling expenses associated with our Offices segment, measured as a percentage of revenues from this segment, increased from 4.2% during the three-month period ended September 30, 2019 to 6.8% during the three-month period ended September 30, 2020.
 
Sales and Developments. Selling expenses associated with our Sales and Developments segment increased by 475.5% from ARS 53 million during the three-month period ended September 30, 2019 to ARS 305 million during the three-month period ended September 30, 2020. Such variation was mainly generated by: (i) an ARS 139 million increase in taxes, rates and contributions; and (ii) an ARS 115 million increase in fees and compensation for services. Selling expenses associated with our Sales and Developments segment, measured as a percentage of revenues from this segment, increased from 63.9% during the three-month period ended September 30, 2019 to 782.1% during the three-month period ended September 30, 2020.
 
Hotels. Selling expenses associated with our Hotels segment decreased by 75.3% from ARS 77 million during the three-month period ended September 30, 2019 to ARS 19 million during the three-month period ended September 30, 2020, mainly as a result of: (i) an ARS 26 million decrease in taxes, rates and contributions; (ii) an ARS 9 million decrease in fees and compensation for services; and (iii) an ARS 8 million decrease in publicity, advertising and other commercial expenses. Selling expenses associated with our Hotels segment, measured as a percentage of revenues from this segment, increased from 11.0% during the three-month period ended September 30, 2019 to 316.7% during the three-month period ended September 30, 2020.
 
International. Selling expenses associated with the International segment increased by 100,0%, no charge was recorded during the three-month period ended September 30, 2019 and ARS 16 million was recorded during the three-month period ended September 30, 2020, due to fees and compensation for services.
 
Corporate. Selling expenses associated with the Corporate segment were not recorded in both periods.
 
Others. Selling expenses associated with our Others segment showed no variations during the reported periods. Selling expenses associated with our Others segment, measured as a percentage of revenues from this segment, increased from 2.5% during the three-month period ended September 30, 2019 to 50.0% during the three-month period ended September 30, 2020.
 
Other operating results, net September 2020 vs September 2019
 
Other operating results, net, according to the income statement, recorded a variation of ARS 38 million, from a net loss of ARS 56 million during the three-month period ended September 30, 2019, to a net loss of ARS 18 million during the three-month period ended September 30, 2020 (from the Operations Center in Argentina).
 
Other operating results, net, from our joint ventures increased by ARS 1 million, no charge was recorded during the three-month period ended September 30, 2019 and a net profit of ARS 1 million was recorded during the three-month period ended September 30, 2020 (from the Sales and Developments segment).
 
In turn, other operating results on account of building administration expenses and collective promotion fund decreased by ARS 3 million, from ARS 12 million during the three-month period ended September 30, 2019 (out of which a profit of ARS 11 million are allocated to the Shopping Malls segment and a profit of ARS 1 million to the Offices segment) to ARS 9 million during the three-month period ended September 30, 2020 (out of which ARS 8 million are allocated to the Shopping Malls segment and ARS 1 million to the Offices segment).
 
Therefore, according to information by segments, the other operating results line, net, increased by ARS 40 million, from a net loss of ARS 65 million during the three-month period ended September 30, 2019 to a net loss of ARS 25 million during the three-month period ended September 30, 2020.
 
Operations Center in Argentina
 
Shopping Malls. Other operating results, net associated with our Shopping Malls segment decreased by 11.1%, from a net loss of ARS 27 million during the three-month period ended September 30, 2019 to a net loss of ARS 24 million during the three-month period ended September 30, 2020, mainly as a result of: (i) a lower charge of donations of ARS 3 million; (ii) a lower charge of contingencies of ARS 3 million; partially offset by: (iii) a decrease in interest generated by credits and others. Other operating results, net, from this segment, as a percentage of revenues from this segment, increased from 1.3% negative during the three-month period ended September 30, 2019 to 6.5% negative during the three-month period ended September 30, 2020.
 
Offices. Other operating results, net associated with our Offices segment decreased by 85.7%, from a net loss of ARS 7 million during the three-month period ended September 30, 2019 to a net loss of ARS 1 million during the three-month period ended September 30, 2020, mainly as a consequence of an ARS 6 million decrease in donations, among other items. Other operating results, net from this segment, as a percentage of the revenues from this segment, decreased from 1.0% negative during the three-month period ended September 30, 2019 to 0.2% negative during the three-month period ended September 30, 2020.
 
Sales and Developments. Other operating results, net associated with our Sales and Developments segment decreased by 62.5%, from a net loss of ARS 16 million during the three-month period ended September 30, 2019 to a net loss of ARS 6 million during the three-month period ended September 30, 2020, mainly as a result of: (i) an ARS 6 decrease in the charge of tax on personal assets; and (ii) an ARS 5 million decrease in donations, among other items. Other operating results, net from this segment, as a percentage of the revenues of this segment, decreased from 19.3% negative during the three-month period ended September 30, 2019 to 15.4% negative during the three-month period ended September 30, 2020.
 
Hotels. Other operating results, net associated with the Hotels segment increased by 300.0%, from a net loss of ARS 4 million during the three-month period ended September 30, 2019 to a net profit of ARS 8 million during the three-month period ended September 30, 2020, mainly due to an ARS 14 million income by sell of property, plant and equipment. Other operating results, net from this segment, as a percentage of the revenues from this segment, increased from 0.6% negative during the three-month period ended September 30, 2019 to 113.3% positive during the three-month period ended September 30, 2020.
 
 
47
 
 
International. Other operating results, net associated with the International segment showed a net loss of ARS 1 million during the three-month period ended September 30, 2019. No charge was recognized during the three-month period ended September 30, 2020, mainly due to a decrease in donations.
 
Corporate. Other operating results, net associated with the Corporate segment showed no variations between the reported periods.
 
Others. Other operating results, net associated with the Others segment decreased by 80.0%, from a net loss of ARS 10 million during the three-month period ended September 30, 2019 to a net loss of ARS 2 million during the three-month period ended September 30, 2020, mainly due to a loss in the comparative period related to the sale of Tarshop S.A. Other operating results, net from this segment, as a percentage of the revenues from this segment, increased from 25.0% negative during the three-month period ended September 30, 2019 to 100.0% negative during the three-month period ended September 30, 2020.
 
Profit / (loss) from operations September 2020 vs September 2019
 
Total consolidated profit/ (loss) from operations, according to the income statement, increased from a net profit of ARS 14,142 million during the three-month period ended September 30, 2019 to a net profit of ARS 23,489 million during the three-month period ended September 30, 2020 (out of which a net loss of ARS 5 million derives from the Operations Center in Israel and a net profit of ARS 23,494 from the Operations Center in Argentina). Excluding the effect from the Operations Center in Israel, the profit/(loss) from operations varied by 65.8%. Total consolidated profit/(loss) from operations, measured as a percentage of revenues from sales, leases and services, increased from 315.2% positive during the three-month period ended September 30, 2019 to 1,459.9% positive during the three-month period ended September 30, 2020. Excluding the effect from the Operations Center in Israel, total consolidated profit/(loss) from operations, measured as a percentage of total revenues, increased from 315.8% positive during the three-month period ended September 30, 2019 to 1,460.2% positive during the three-month period ended September 30, 2020.
 
Profit/(loss) from operations from our joint ventures increased from a loss of ARS 549 million during the three-month period ended September 30, 2019 (out of which a net loss of ARS 24 million is allocated to the Shopping Malls segment; a net loss of ARS 530 million to the Offices segment and a profit of ARS 5 million to the Sales and Developments segment, of the Operations Center in Argentina) to a net loss of ARS 828 million during the three-month period ended September 30, 2020 (out of which a profit of ARS 1 million is allocated to the Shopping Malls segment, a net loss of ARS 832 million to the Offices segment, and a profit of ARS 3 million to the Sales and Developments segment, of the Operations Center in Argentina).
 
Therefore, according to information by segments, the net profit from operations increased from a net profit of ARS 14,722 million during the three-month period ended September 30, 2019 to a net profit of ARS 24,363 million during the three-month period ended September 30, 2020 (out of which a net loss of ARS 5 million derives from the Operations Center in Israel and a net profit of ARS 24,368 million derives from the Operations Center in Argentina). The profit/(loss) from operations, measured as a percentage of revenues, according to information by segments, increased from a 407.9% profit during the three-month period ended September 30, 2019 to a 2,000.2% profit during the three-month period ended September 30, 2020. Excluding the effect from the Operations Center in Israel, total profit/(loss) from operations, according to information by segments, measured as a percentage of total revenues, increased from a 408.7% profit during the three-month period ended September 30, 2019 to a 2,000.7% profit during the three-month period ended September 30, 2020.
 
Operations Center in Argentina
 
Shopping Malls. Profit/(loss) from operations associated with the Shopping Malls segment decreased from a profit of ARS 2,082 million during the three-month period ended September 30, 2019 to a profit of ARS 986 million during the three-month period ended September 30, 2020.
 
Offices. Profit / (loss) from operations associated with our Offices segment increased by 81.9%, from a net profit of ARS 7,413 million during the three-month period ended September 30, 2019 to a net profit of ARS 13,483 million during the three-month period ended September 30, 2020. Such variation was mainly due to an ARS 6,267 million increase in the gain / (loss) from fair value adjustments of investment properties. Profit / (loss) from operations associated with the Offices segment, as a percentage of revenues from such segment, increased from 1,063.6% during the three-month period ended September 30, 2019 to 2,492.2% during the three-month period ended September 30, 2020.
 
Sales and Developments. Profit / (loss) from operations associated with our Sales and Developments segment increased by 91.5%, from a net profit of ARS 5,045 million during the three-month period ended September 30, 2019 to a net profit of ARS 9,661 million during the three-month period ended September 30, 2020. Such increase is mainly due to the gain / (loss) from fair value adjustments of investment properties. Profit / (loss) from operations associated with the Sales and Developments segment, as a percentage of revenues from this segment, increased from 6,078.3% during the three-month period ended September 30, 2019 to 24,771.8% during the three-month period ended September 30, 2020.
 
Hotels. Profit / (loss) from operations associated with the Hotels segment decreased by 327.4%, from a net profit of ARS 84 million during the three-month period ended September 30, 2019 to a net loss of ARS 191 million during the three-month period ended September 30, 2020. Such decrease is mainly due to the fact that revenues were significantly affected by a decline in the activity in the present period, attributable to the COVID-19 pandemic. The profit / (loss) from operations associated with the Hotels segment, as a percentage of revenues from such segment, increased from 12.0% during the three-month period ended September 30, 2019 to 3,183.3% during the three-month period ended September 30, 2020.
 
International. Profit/(loss) from operations associated with our International segment varied by 125.6% from a net loss of ARS 43 million during the three-month period ended September 30, 2019 to a net profit of ARS 11 million during the three-month period ended September 30, 2020. Such variation is due to the income generated by the sale of Stowe House.
 
Corporate. Profit/(loss) from operations associated with our Corporate segment decreased by 15.9% from a loss of ARS 88 million during the three-month period ended September 30, 2019 to a loss of ARS 74 million during the three-month period ended September 30, 2020, mainly affected by general and administrative expenses.
 
Others. Profit/(loss) from operations associated with the Others segment increased from a net profit of ARS 257 million during the three-month period ended September 30, 2019 to a net profit of ARS 492 million during the three-month period ended September 30, 2020. The variation is mainly due to the gain / (loss) from fair value adjustments of investment properties.
 
Operations Center in Israel
 
Corporate. Profit/ (loss) from operations associated with the Corporate segment went from a net loss of ARS 28 million during the three-month period ended September 30, 2019 to a net loss of ARS 5 million during the three-month period ended September 30, 2020. Mainly due to a decrease in fees and compensation for services.
 
Share of profit / (loss) of associates and joint ventures September 2020 vs September 2019
 
The share of profit / (loss) of associates and joint ventures, according to the income statement, decreased by 80.1%, from a net profit of ARS 737 million during the three-month period ended September 30, 2019 to a net profit of ARS 147 million during the three-month period ended September 30, 2020 (from the Operations Center in Argentina), mainly due to the negative results from the Others segment.
 
Also, the net share of profit / (loss) of joint ventures, mainly from Nuevo Puerto Santa Fe S.A. (Shopping Malls segment), Quality Invest S.A. (Offices segment) and Cyrsa S.A. and Puerto Retiro S.A. (Sales and Developments segment), showed a 49.9% increase, from a profit of ARS 413 million during the three-month period ended September 30, 2019 to a profit of ARS 619 million during the three-month period ended September 30, 2020, mainly due to results from the share in Quality Invest S.A., mainly attributable to the gain / (loss) from fair value adjustments of investment properties.
 
Operations Center in Argentina
 
Shopping Malls. In the information by segments, the share of profit / (loss) of the joint venture Nuevo Puerto Santa Fe S.A. is recorded on a consolidated basis, line by line in this segment.
 
Offices. In the information by segments, the share of profit / (loss) of the joint venture Quality S.A. is recorded on a consolidated basis, line by line in this segment.
 
Sales and Developments. The share of profit / (loss) of the joint ventures Cyrsa S.A. and Puerto Retiro S.A is recorded on a consolidated basis, line by line. The share of profit / (loss) of our associate Manibil S.A., which is recorded in this line, increased by ARS 9 million during the three-month period ended September 30, 2020.
 
Hotels. This segment does not show results from the share of profit / (loss) of associates and joint ventures.
 
International. The share of profit / (loss) of associates of this segment increased by 69.3%, from a net loss of ARS 228 million during the three-month period ended September 30, 2019 to a net loss of ARS 386 million during the three-month period ended September 30, 2020, mainly generated by a negative result from our investment in New Lipstick LLC of ARS 334 million offset by a negative result from our investment in Condor Hospitality of ARS 53 million.
 
Other. The share of profit / (loss) of associates from the Others segment decreased by 114.2%, from a net profit of ARS 551 million during the three-month period ended September 30, 2019 to a net loss of ARS 78 million during the three-month period ended September 30, 2020, mainly as a result of a loss from our investments in Banco Hipotecario S.A. in the amount of ARS 57 million.
 
Financial results, net
 
The financial results went from a loss of ARS 11,244 million during the three-month period ended September 30, 2019 to a loss of ARS 942 million during the three-month period ended September 30, 2020. Mainly due to lower results in terms of the exchange rate variation.
 
Income Tax
 
The Company applies the deferred tax method to calculate the income tax for the reported periods, thus recognizing temporary differences as tax assets and liabilities. The income tax charge went from a loss of ARS 2,505 million during the three-month period ended September 30, 2019, to a loss of ARS 7,958 million during the three-month period ended September 30, 2020, from the Operations Center in Argentina.
 
Profit for the period
 
As a result of the factors described above, the profit for the period went from a loss of ARS 15,017 million (that includes a profit of ARS 13,887 for the effect of discontinued operations) during the three-month period ended September 30, 2019 to a profit of ARS 8,340 million (that includes a loss of ARS 6,396 for the effect of discontinued operations) during the three-month period ended September 30, 2020.
 
 
48
 
 
B. Liquidity and Capital Resources
 
Our principal sources of liquidity have historically been:
 
Cash generated by operations;
 
Cash generated by issuance of debt securities;
 
Cash from borrowing and financing arrangements; and
 
Cash proceeds from the sale of real estate assets.
 
Our principal cash requirements or uses (other than in connection with our operating activities) have historically been:
 
capital expenditures for acquisition or construction of investment properties and property, plant and equipment;
 
interest payments and repayments of debt;
 
acquisition of equity interests in companies;
 
payments of dividends; and
 
acquisition of real estate.
 
Our liquidity and capital resources include our cash and cash equivalents, proceeds from bank borrowings and long-term debt, capital financing and sales of real estate investments.
 
As of June 30, 2020, our Operation Center in Argentina had negative working capital of ARS 26,224 million while our Operations Center in Israel had positive working capital of ARS 93,328 million, resulting in a consolidated positive working capital of ARS 67,104 million (calculated as current assets less current liabilities as of such date).
 
At the same date, our Operations Center in Argentina had cash and cash equivalents of ARS 7,780 million while our Operations Center in Israel had cash and cash equivalents of ARS 89,496 million, totaling consolidated cash and cash equivalents for ARS 97,276 million.
 
As described in “Presentation of Financial and Certain Other Information”, we lost control of IDBD and DIC on September 25, 2020. Accordingly, assets and liabilities corresponding to the Operations Center in Israel have been deconsolidated as from that date.
 
The commitments and other restrictions resulting from the indebtedness of IDBD and DIC have no effect on IRSA since said indebtedness has no recourse against IRSA, nor has IRSA guaranteed it with its assets. Therefore, IRSA's financial risk with respect to the Israeli business center is limited to the values indicated in the preceding paragraph.
 
On September 13, 2020, IDBD filed a claim against Dolphin Netherlands B.V. and against IRSA in which it sought to require them, together and separately, to pay it a total of NIS 70 million plus linkage differences and interest in accordance with the law. In addition, in tandem with the submission of the lawsuit, IDBD submitted an urgent petition for placing temporary attachments (in the presence of one party) on Dolphin Netherlands B.V and IRSA, which was not accepted by the Court in the presence of one party and which has been passed on for the respondents to respond to the petition.
 
The table below shows our cash flow for the fiscal years ended June 30, 2020, 2019 and 2018:


Year ended June 30,


2020
 
 
2019
 
 
2018


(in millions of ARS)
 
Net cash flow generated from operating activities
  33,495 
  29,111 
  21,983 
Net cash flow generated from / (used in) investing activities
  43,755 
  12,045 
  (32,870)
Net cash flow generated from financing activities
  (81,952)
  (29,878)
  (6,634)
Net (decrease) / increase in cash and cash equivalents
  (4,702)
  11,278 
  (17,521)
 
Cash Flow Information
 
Operating activities
 
Fiscal year ended June 30, 2020
 
Our operating activities for the fiscal year ended June 30, 2020 generated net cash inflows of ARS 33,495 million, of which ARS 26,778 are originated in discontinued operations and ARS 6,717 from continuing operations, mainly due to operating income of ARS 7,778 million, a increase in trading properties of ARS 424 million and a decrease in trade and other receivables of ARS 2,045 million, partially offset by a decrease in provisions of ARS 572 million, a decrease in trade and other payables of ARS 328 million and ARS 326 million related to Income Tax paid.
 
Fiscal year ended June 30, 2019
 
Our operating activities for the fiscal year ended June 30, 2019 generated net cash inflows of ARS 29,111 million, of which ARS 23,158 million were originated from discontinued operations and ARS 5,953 million from continuing operations, mainly due to a net operating income of ARS 8,806 million, a increase in trading properties of ARS 937 million and a increase in trade and other receivables of ARS 49 million, partially offset by a decrease in provisions of ARS 85 million, a decrease in trade and other payables of ARS 1,305 million and ARS 362 million related to Income Tax paid.
 
Fiscal year ended June 30, 2018
 
Our operating activities for the fiscal year ended June 30, 2018 generated net cash inflows of ARS 21,983 million, of which ARS 28,904 million were originated from discontinued operations and ARS (6,921) million from continuing operations, mainly due to a net operating loss of ARS 6,005 million, a increase in trading properties of ARS 357 million, an increase in trade and other payables of ARS 1,354 million, partially offset by a decrease in provisions of ARS 64 million and ARS 1,591 million related to Income Tax paid.
 
Investment activities
 
Fiscal year ended June 30, 2020
 
Our investing activities resulted in net cash outflows of ARS 43,755 million, comprised of ARS 43,840 million discontinued activities inflows and ARS (85) million continuing operations inflows for the fiscal year ended June 30, 2020, mainly due to (i) ARS 21,624 million arising from disposal of investments in financial assets, (ii) ARS 194 million from sales of investment properties, (iii) ARS 225 million from increase in restricted assets, net and (iv) ARS 272 million used in the acquisition and improvements of property, plant and equipment and (v) ARS 3,960 million used in the acquisitions and improvements of investment properties.
 
Fiscal year ended June 30, 2019
 
Our investing activities resulted in net cash inflows of ARS 12,045 million, comprised of ARS 13,456 million discontinued activities outflows and ARS (1,411) million continuing operations inflows for the fiscal year ended June 30, 2019. Such net inflows are primarily related to (i) ARS 35,610 million arising from disposal of investments in financial assets and (ii) ARS 6 million from sales of interest held in associates and joint ventures; partially offset by (iii) ARS 33,101 million used in the acquisition of investments in financial assets, (iv) ARS 4,605 million used in the acquisition and improvements of investment properties and (v) ARS 162 million used in the acquisitions and improvements of property, plant and equipment.
 
Fiscal year ended June 30, 2018
 
Our investing activities resulted in net cash outflows of ARS 32,870 million, comprised of ARS 21,244 million discontinued activities outflows and ARS 11,626 million continuing operations outflows for the fiscal year ended June 30, 2018. Such net outflows are mainly related to (i) ARS 3,878 million and ARS 706 million used in the acquisition and improvements of investment properties and property, plant and equipment, respectively, (ii) ARS 164 million used in the acquisition of intangible assets, (iii) ARS 35,314 million related to the increase of investments in financial assets, (iv) ARS 19 million from the net decrease of restricted assets; partially offset by (v) ARS 27,945 million arising from disposal of investments in financial assets, and (vi) ARS 146 million collected from loans granted.
 
Financing activities
 
Fiscal year ended June 30, 2020
 
Our financing activities for the fiscal year ended June 30, 2020 resulted in net cash outflows of ARS 81,952 million, of which ARS 75,785 derive from discontinued operations and ARS 6,167 derive from continuing activities, mainly due to (i) the payment of loans and principal on notes of ARS 29,099 million; (ii) the payment of interest on short-term and long-term debt of ARS 5,811 million, and (iii) ARS 2,188 million from the repurchase of non-convertible notes, partially offset by (iv) an increase in borrowings and issuance of non-convertible notes for ARS 23,777 million.
 
 
49
 
 
Fiscal year ended June 30, 2019
 
Our financing activities for the fiscal year ended June 30, 2019 resulted in net cash outflows of ARS 29,878 million, comprised of ARS 23,439 million discontinued activities inflows and ARS 6,439 million continuing operations outflows for the fiscal year ended June 30, 2019. Such net outflows are mainly related to (i) the payment of loans and principal from notes of ARS 4,311 million; (ii) the payment of interest on short-term and long-term debt of ARS 5,724 million; (iii) ARS 1,654 million from the repurchase of non-convertible notes, and (iv) ARS 1,057 million from the acquisition of non-controlling interest in subsidiaries, in part offset by (v) an increase in borrowings and issuance of non-convertible notes for ARS 6,670 million.
 
Fiscal year ended June 30, 2018
 
Our financing activities for the fiscal year ended June 30, 2018 resulted in net cash outflows of ARS 6,634 million, corresponding to ARS 7,367 million continuing activities outflows partially offset by ARS 14,001 million discontinued operations inflows. Such net outflows are mainly related to: (i) the payment of loans and principal on notes of ARS 1,732 million; (ii) the payment of interest on short-term and long-term debt of ARS 3,922 million, (iii) ARS 1,106 million related to dividends paid, and (iv) ARS 2,669 million from the acquisition of non-controlling interest in subsidiaries, in part offset by (v) the increase in borrowings and issuance of non-convertible notes for ARS 11,310 million, and (vi) the net proceeds from disposal of non-controlling interest in subsidiaries of ARS 7,249 million.

The following table shows our cash flow for the three-month periods ended September 30, 2020 and 2019:


Period ended September 30,


2020
 
 
2019


(in million of ARS)
 
Net cash flow generated from operating activities
  3,362 
  10,467 
Net cash flow generated from / (used in) investing activities
  41,441 
  3,490 
Net cash flow generated from financing activities
  (27,144)
  (35,239)
Net (decrease) / increase in cash and cash equivalents
  17,659 
  (21,282)
 
As of September 30, 2020, in our Operations Center in Argentina, we had a negative working capital of ARS 16,865 million (calculated as current assets less current liabilities as of that date).
 
As of the same date, our Operations Center in Argentina had cash and cash equivalents for ARS 4,397 million, which represents the total of cash and cash equivalents at a consolidated level.
 
Cash Flow Information
 
Operating activities
 
Three-month period ended September 30, 2020
 
Our operating activities for the three-month period ended September 30, 2020 generated net cash inflows of ARS 3,362. million, of which ARS 2,227 are originated in discontinued operations and ARS 1,135 from continuing operations, mainly due to (i) an increase in trade and other payables of ARS 1,885 million; (ii) a decrease in restricted assets of ARS 1,157 million; and (iii) a decrease in trading properties of ARS 256 million; partially offset by (iv) an operating loss of ARS 1,437 million; (v) an increase in trade and other receivables of ARS 643 million; and (vi) a decrease in salaries and social security contributions of ARS 73 million.
 
Three-month period ended September 30, 2019
 
Our operating activities for the three-month period ended September 30, 2019 generated net cash inflows of ARS 10,467 million, of which ARS 7,738 million are originated in discontinued operations and ARS 2,729 million in continuing operations, mainly due to: (i) an operating result of ARS 3,407 million; (ii) a decrease in trade and other receivables of ARS 392 million; partially offset by (iii) a decrease in provisions of ARS 186 million; (iv) a decrease in trade and other payables for ARS 476 million; (v) a decrease in salaries and social security contributions of ARS 160 million; and (vi) ARS 197 million related to income tax paid.
 
Investment activities
 
Three-month period ended September 30, 2020
 
Our investment activities generated a net cash inflow of ARS 41,441 million, corresponding to an inflow from discontinued operations of ARS 31,830 million and an inflow of ARS 9,611 million of from continued operations for the three-month period ended on September 30, 2020, mainly due to (i) ARS 9,604 inflow from the sale of investment properties; and (ii) ARS 6,809 million inflow dorm the sale of financial assets; partially offset by (iii) ARS 6,181 million used in the acquisition of investments in financial assets; and (iv) ARS 719 used in the acquisition and improvements of investment properties.
 
Three-month period ended September 30, 2019
 
Our investing activities generated a net cash flow inflow of ARS 3,490 million, corresponding to an inflow of funds from discontinued activities of ARS 1,500 million and an inflow of funds from continued operations of ARS 1,990 million for the three-month period ended on September 30, 2019, mainly due to: (i) ARS 14,811 million from the sale of investments in financial assets; partially offset by (ii) ARS 11,245 million used in the acquisition of investments in financial assets; (iii) ARS 824 million used in the acquisition and improvements of investment properties; and (iv) ARS 639 million used to grant loans.
 
 
50
 
 
Financing activities
 
Three-month period ended September 30, 2020
 
Our financing activities for the three-month period ended September 30, 2020 resulted in a net cash outflow of ARS 27,144 million, out of which ARS 13,019 million correspond to discontinued operations, and ARS 14,125 million correspond to continued operations , mainly due to (i) the cancellation of loans and capital of negotiable obligations of ARS 20,009 million; (ii) the payment of interest on short and long-term debt of ARS 2,624 million; and (iii) ARS 225 million due to the payment of derivative financial instruments; partially offset by (iv) ARS 4,861 million for obtaining short-term loans; (v) borrowing and issuance of negotiable obligations for ARS 3,466 million; and (vi) ARS 525 million from the sale of our own negotiable obligations in the portfolio.
 
Three-month period ended September 30, 2019
 
Our financing activities for the three-month period ended September 30, 2019 resulted in an outflow of ARS 35,239 million, out of which ARS 31,325 million correspond to discontinued operations and ARS 3,914 million to continued operations, mainly due to (i) the cancellation of loans and capital of debentures of ARS 17,730 million; (ii) the payment of interest on short and long-term loans of ARS 2,203 million; and (iii) ARS 1,972 million due to the repurchase of debentures; partially offset by (iv) borrowing and issuance of debentures for ARS 16,293 million; and (v) ARS 1,686 million for obtaining short-term loans.
 
Capital expenditures
 
Fiscal year ended June 30, 2020
 
During the fiscal year ended June 30, 2020, we invested ARS 11,897 million, as follows: (a) acquisitions and improvements of property, plant and equipment of ARS 6,107 million, primarily i) ARS 357 million in buildings and facilities, ii) ARS 3,679 million in communication networks, iii) ARS 1,903 million in machinery and equipment and others, iv) improvements in our hotels Sheraton Libertador, Llao Llao and Intercontinental (ARS 15 million, ARS 66 million and ARS 48 million, respectively) and v) ARS 39 million in agricultural establishments; (b) improvements in our rental properties for ARS 2,907 million, out of which ARS 2,052 million derive from our Operations Center in Argentina and ARS 855 million derive from the Operations Center in Israel; (c) the development of properties for ARS 2,883 million.
 
Fiscal year ended June 30, 2019
 
During the fiscal year ended June 30, 2019, we invested ARS 20,192 million, as follows: (a) acquisitions and improvements of property, plant and equipment of ARS 7,692 million, primarily i) ARS 118 million in buildings and facilities, ii) ARS 4,951 million in communication networks, iii) ARS 2,553 million in machinery and equipment and others iv) improvements in our hotels Sheraton Libertador, Llao Llao and Intercontinental (ARS 31 million, ARS 16 million and ARS 23 million, respectively); (b) improvements in our rental properties of ARS 2,104 million, primarily in our Operations Center in Israel; (c) the development of properties for ARS 9,759 million, mainly in our Operations Center in Israel; and (d) ARS 637 million related to the acquisition of land reserves.
 
Fiscal year ended June 30, 2018
 
During the fiscal year ended June 30, 2018, we invested ARS 20,523 million (including ARS 5,091 million from Shufersal, whose assets were deconsolidated due to the loss of control and ARS 804 million from business combination), as follows: (a) acquisitions and improvements of property, plant and equipment of ARS 11,369 million, primarily i) ARS 2,934 million in buildings and facilities, mainly in supermarkets in Israel through Shufersal, ii) ARS 2,691 million in communication networks, iii) ARS 5,181 million in machinery and equipment and others, iv) improvements in our hotels Sheraton Libertador, Llao Llao and Intercontinental (ARS 11 million, ARS 20 million and ARS 12 million, respectively), and v) ARS 520 million related with business combinations (mainly from the acquisition of New Pharm); (b) improvements in our rental properties of ARS 2,064 million, primarily in our Operations Center in Israel; (c) the development of properties for ARS 3,756 million, mainly in our Operations Center in Israel; (d) ARS 3,050 million related to the acquisition of land reserves, and (e) ARS 284 million related to business combination.
 
Period ended on September 30, 2020
 
During the period ended September 30, 2020, we made investments for ARS 1,202 million as follows: (a) acquisition and improvements of property, plant and equipment for ARS 1,056 million , mainly related to: i) ARS 40 million in buildings and facilities, ii) ARS 416 million in communication networks, iii) ARS 536 million in machinery, equipment and others, iv) improvements in Llao Llao and Intercontinental hotels (ARS 22 million and ARS 2 million, respectively), and v) ARS 40 million in agricultural establishments; (b) improvements in our rental properties for ARS 146 million, out of which ARS 106 million correspond to our Argentina Operations Center and ARS 40 million to the Israel Operations Center.
 
Period ended on September 30, 2019
 
During the period ended September 30, 2019, we made investments for ARS 3,459 million as follows: (a) acquisition and improvements of property, plant and equipment for ARS 1,732 million , mainly related to: i) ARS 107 million in buildings and facilities, ii) ARS 1,021 million in communication networks, iii) ARS 593 million in machinery, equipment and others, and iv) improvements in our hotels Sheraton Libertador, Llao Llao and Intercontinental (ARS 1 million, ARS 6 million and ARS 4 million, respectively); (b) improvements in our rental properties for ARS 478 million, out of which ARS 249 million correspond to our Argentina Operations Center and ARS 229 million to the Israel Operations Center; (c) properties under development for ARS 1,249 million.
 
Indebtedness
 
The breakdown of the Company’s borrowings as of September 30, 2020 was as follows:


Total as of September 30, 2020


(million of ARS)
 
Non-convertible Notes
  44,538 
Bank loans
  3,629 
Bank overdrafts
  7,110 
Other borrowings (i)
  1,161 
Total borrowings
  56,438 
Non-current
  31,967 
Current
  24,471 
 
  56,438 


Operations Center
Currency
 
Annual Average Interest Rate
 
 
Nominal value
 
 
Book value (in million of ARS)
 
IRSA Commercial Properties’ 2023 Notes
USD
  8.75%
  360 
  27,359 
IRSA’s 2020 Notes – Series I(1)
USD
  10.00%
  181 
  9,885 
IRSA’s 2021 Notes – Series III
ARS
 
Badlar + 600 bps
 
  353 
  366 
IRSA’s 2021 Notes – Series IV
USD
  7.00%
  51 
  3,852 
IRSA’s 2022 Notes – Series V
USD
  9.00%
  9 
  529 
IRSA’s 2021 Notes – Series VI
ARS
 
Badlar + 400 bps
 
  335 
  354 
IRSA’s 2022 Notes – Series VII
USD
  4.00%
  33 
  2.193 
Related Party
ARS
 
Badlar
 
  1 
  29 
Related Party
USD
 
From 5.97% to 14.0%
 
  65 
  406 
Bank loans
USD
  5.95%
  18 
  1,336 
Bank loans
USD
 
Libor + 1.9%
 
  30 
  2,106 
AABE Debt
ARS
 
Libor
 
  120 
  192 
Seller financing
USD
  N/A 
  2 
  178 
Others
USD
 
Libor 1m+2% / 3.5%
 
  7 
  543 
Bank overdrafts
ARS
 
from 39.00% to 109.00%
 
  - 
  7,110 
Total(5)


  56,438 
 
(1) On October 22, 2020, we announced Notes to be issued by exchange for the Existing Notes, Series I Notes, or through the Cash Subscription, for more information see “Recent Developments – Exchange Offer- Issuance of Series VIII and IX Notes.”
(2) The credit line between IRSA CP and IRSA for an amount of USD 104.5 million is not shown due because it is eliminated in consolidation.
 
 
51
 
 
Series II Notes (Issued by IRSA)
 
IRSA’s Notes Class II at 11.50% maturing in 2020 for a total amount of USD 71.4 million were fully repaid on July 20, 2020.
 
Series II Notes (Issued by IRSA CP)
 
On March 23, 2016, IRSA CP issued Notes in an aggregate principal amount of USD360 million under its Global Notes Program. Series II Notes accrue interest semi-annually, at an annual fixed rate of 8.75% and mature on March 23, 2023.
 
IRSA CP’s Notes due 2023 are subject to certain covenants, events of default and limitations, such as the limitation on incurrence of additional indebtedness, limitation on restricted payments, limitation on transactions with affiliates, and limitation on merger, consolidation and sale of all or substantially all assets.
 
To incur additional indebtedness, IRSA CP is required to meet a minimum 2.00 to 1.00 Consolidated Interest Coverage Ratio. The Consolidated Interest Coverage Ratio is defined as Consolidated EBITDA divided by consolidated net interest expense. Consolidated EBITDA is defined as operating income plus depreciation and amortization and other consolidated non-cash charges.
 
The Series II Notes contain financial covenants limiting IRSA CP’s ability to declare or pay dividends in cash or in kind, unless the following conditions are met at the time of payment:
 
a) no Event of Default shall have occurred and be continuing;
 
b) IRSA CP may incur at least USD1.00 worth of additional debt pursuant to the “Restriction on Additional Indebtedness”;
 
c) and the aggregate amount of such dividend exceeds the sum of:
 
i. 100% of cumulative EBITDA for the period (treated as one accounting period) from July 1, 2015 through the last day of the last fiscal quarter ended prior to the date of such Restricted Payment minus an amount equal to 150% of consolidated interest expense for such period; and
 
ii. any reductions of Indebtedness of IRSA on a consolidated basis after the Issue Date any reductions of Indebtedness of after the Issue Date exchanged for to Capital Stock of the IRSA or its Subsidiaries.
 
For more informarion see. “Item 10. Additional Information—D. Exchange Controls”, if Communication “A” 7,106 is extended after March 31, 2021, the maturity of this Note would be affected by such measure.
 
Series I and II Notes
 
On May 15, 2019, IRSA issued the Note Series I under Argentine law for an amount of USD 96.3 million due on November 15, 2020, at a fixed rate of 10%. The proceeds were mainly used to repay preexisting debt.
 
On August 6, 2019, IRSA reopened the Note Series I under Argentine law for an amount of USD 85.2 million, at a price of 103.77%, which resulted in an internal annual rate of return of 8.75% nominal. Also, on the same date, the Notes Series II denominated in Chilean pesos, under writable and payable in dollars, for an amount of CLP 31,502.6 million (equivalent to USD 45 million) at a fixed rate of 10.5% per within 12 months.
 
On August 6, 2020, Class II denominated in Chilean pesos was fully repaid.
 
On September 15, 2020, Communication “A” 7,106 established that companies must refinance maturities of financial debt capital in the period from October 15, 2020 to March 31, 2021. In this sense, the Central Bank will give access to companies for up to 40% of maturities and companies must refinance the rest within at least two years. For more information see. “Item 10. Additional Information—D. Exchange Controls”, if Communication “A” 7,106 is extended after March 31, 2021, the capital outstanding maturity of this Note would be affected by such measure.
 
As a consequence of the new restrictions on access to the Foreign Exchange Market, on October 22, 2020, IRSA launched an exchange offer on its Series I Notes due on November 15, 2020.
 
The exchange offer consisted on two options for the bondholders: i) a cash consideration of USD 0.69622593 for each USD 1 of existing notes presented to the Exchange and the remaining amount until completing USD 1 for each USD 1 of existing notes presented to the Exchange, in notes Series VIII, and ii) a par for par exchange of notes Series IX for each Existing Notes presented to the Exchange.
 
The Exchange Offer expired on November 10, 2020 and the Nominal Value of Existing Notes presented and accepted for the Exchange (for both Series) was USD 178,458,188, which represents 98.31% acceptance. Considering that consent has been obtained for an amount greater than 90% of the capital of the existing notes, the Company made the Non-Essential Proposed Modifications and / or the Essential Proposed Modifications, by means of which the terms and conditions of the existing notes will be modified and replaced.
 
In relation to the Exchange Offer ended on November 10, 2020, on November 12, 2020, IRSA made a partial repayment of Series I Notes for a Nominal Value of USD 178,458,188, after the partial repayment the Nominal Value under circulation was USD 3,060,519.
 
For more information see: “Recent Developments - Exchange Offer- Issuance of Series VIII and IX Notes.”For more information see: “Recent Developments - Exchange Offer- Issuance of Series VIII and IX Notes.”
 
Series III, IV and V (issued by IRSA)
 
On May 21, 2020, we issued in the local market a total amount of USD 65.8 million through the following Notes:
 
Series III: denominated and payable in pesos for ARS 354 million (equivalent at the time of issuance to USD 5.2 million) at a variable rate (private BADLAR + 6.0%) with quarterly payments. The principal will be paid in two installments: the first for an amount equivalent to 30% of the nominal value payable 6 (six) months from the Issue and Settlement Date, and the second for an amount equivalent to 70% of the nominal value payable on the due date, February 21, 2021. Price of issuance was 100.0% of the nominal value.
 
Series IV: denominated in USD and payable in ARS at the applicable exchange rate for USD 51.4 million at a fixed rate of 7.0%, with quarterly payments and principal expiring on May 21, 2021. Price of issuance was 102.0% of the nominal value (IRR 5.03%).
 
Series V: denominated in USD and payable in ARS at the applicable exchange rate for USD 9.2 million at a fixed rate of 9.0%, with quarterly payments and principal expiring on May 21, 2022. Price of issuance was 103.0% of the nominal value (IRR 7.56%).
 
Series VI and VII (issued by IRSA)
 
On July 21, 2020, we issued in the local market a total amount of USD 38.4 million through the following Notes:
 
Series VI: denominated and payable in pesos for ARS 335.2 million (equivalent at the time of issuance to USD 4.7 million) at a variable rate (private BADLAR + 4.0%) with quarterly payments. The principal will be paid in two installments: the first for an amount equivalent to 30% of the nominal value payable 9 (nine) months from the Issue and Settlement Date, and the second for an amount equivalent to 70% of the nominal value payable on the due date, July 21, 2021. Price of issuance was 100.0% of the nominal value.
 
Series VII: denominated in dollars and payable in pesos at the applicable exchange rate for USD 33.7 million at a fixed rate of 4.0%, with quarterly payments and principal expiring on January 21, 2022. Price of issuance was 100.0% of the nominal value.
 
The funds have been used to refinance short-term liabilities.
 
Communication “A” 7,106
 
On September 15, 2020, Communication “A” 7,106 established that companies must refinance maturities of financial debt capital in the period from October 15, 2020 to March 31, 2021. In this sense, the Central Bank will give access to companies for up to 40% of maturities and companies must refinance the rest within at least two years. For more information see. “Item 10. Additional Information—D. Exchange Controls.”
 
C. Research and Development, Patents and Licenses, Etc.
 
We have several trademarks registered with the Instituto Nacional de la Propiedad Industrial, the Argentine institute for industrial property. We do not own any patents nor benefit from licenses from third parties.
 
 
52
 
 
D. Trend Information
 
International Macroeconomic Outlook
 
As reported in the IMF’s “World Economic Outlook,” world GDP is expected to be reduced (4.9)% in 2020 and recover 5.4% in 2021. As with the April 2020 WEO projections, there is a higher-than-usual degree of uncertainty around this forecast. The baseline projection rests on key assumptions about the fallout from the pandemic. In economies with declining infection rates, the slower recovery path in the updated forecast reflects persistent social distancing into the second half of 2020; greater scarring (damage to supply potential) from the larger-than-anticipated hit to activity during the lockdown in the first and second quarters of 2020; and a hit to productivity as surviving businesses ramp up necessary workplace safety and hygiene practices. For economies struggling to control infection rates, a lengthier lockdown will inflict an additional toll on activity. Moreover, the forecast assumes that financial conditions—which have eased following the release of the April 2020 WEO — will remain broadly at current levels. Alternative outcomes to those in the baseline are clearly possible, and not just because of how the pandemic is evolving.
 
All countries including those that have seemingly passed peaks in infections—should ensure that their health care systems are adequately resourced. The international community must vastly step up its support of national initiatives, including through financial assistance to countries with limited health care capacity and channeling of funding for vaccine production as trials advance, so that adequate, affordable doses are quickly available to all countries. Where lockdowns are required, economic policy should continue to cushion household income losses with sizable, well-targeted measures as well as provide support to firms suffering the consequences of mandated restrictions on activity. Where economies are reopening, targeted support should be gradually unwound as the recovery gets underway, and policies should provide stimulus to lift demand and ease and incentivize the reallocation of resources away from sectors likely to emerge persistently smaller after the pandemic.
 
Strong multilateral cooperation remains essential on multiple fronts. Liquidity assistance is urgently needed for countries confronting health crises and external funding shortfalls, including through debt relief and financing through the global financial safety net. Beyond the pandemic, policymakers must cooperate to resolve trade and technology tensions that endanger an eventual recovery from the COVID-19 crisis. Furthermore, building on the record drop in greenhouse gas emissions during the pandemic, policymakers should both implement their climate change mitigation commitments and work together to scale up equitably designed carbon taxation or equivalent schemes. The global community must act now to avoid a repeat of this catastrophe by building global stockpiles of essential supplies and protective equipment, funding research and supporting public health systems, and putting in place effective modalities for delivering relief to the neediest.
 
Argentine macroeconomic context
 
At the end of 2019, the economy faced a severe balance of payments crisis and public debt. Faced with this scenario, the National Government adopted a set of measures designed to face the most immediate manifestations of the crisis and to stabilize the economy. Regarding monetary policy, the Central Bank of Argentina defined a series of guidelines, highlighting the referring to interest rates and exchange rate management. Foreign exchange regulations and the moderation in prices linked to the limited volatility of the exchange rate allowed a marked reduction of the LELIQ rate from 68% to 38% nominal annually. The progress made the financial system better prepared to face the emergency caused by COVID-19.
 
Shopping malls sales reached a total ARS 3,758.5 million in September 2020, which represents a 71.4% decrease as compared to fiscal 2019.
 
The INDEC reported that, for the ten months ended October 31, 2020, industrial activity in Argentina contracted by 9.9% compared to the same period in 2019. The textile industry accumulated a 32.2% contraction during the first ten months of 2020 as compared to the same period last year. Moreover, the monthly estimation of economic activity (“EMAE”) as of September 30, 2020, contracted by 6.9% compared to the same month in 2019.
 
Regarding the balance of payments, in the second quarter of 2020 the current account surplus reached USD 2,824 million, with USD 4,971 million allocated to the goods and services trade balance, and USD 2,484 million to the net primary deficit, and a surplus of USD 337 million to net secondary income.
 
During the second quarter of 2020, the financial account showed net outflow of USD 2,514 million, explained by the net acquisition of financial assets for USD 893 million, and net cancellation of liabilities of USD 1,621 million. The sectors that have explained these outflows have been Other sectors for USD 2,433 million and the Government for USD 1,324 million, partially offsetting by the net income of the Central Bank for USD 1,293 million. The international reserves decreased by USD 793 million during the second quarter of 2020.
 
As of December 18, 2020, the Private Badlar rate in Pesos peaked at 34.31%. As of December 22, 2020, the seller exchange rate quoted by Banco de la Nación Argentina was of ARS 83.25 pesos per USD1.00. As of December 18, 2020, Argentina’s country risk reduced by 466 basis points in year-on-year terms. The debt premium paid by Argentina was at 1,363 basis points as of December 22, 2020, compared to 263 basis points paid by Brazil and 205 basis points paid by Mexico as of that same date.
 
Likewise, in the national and international framework described above, the Company periodically analyzes alternatives to appreciate its shares value. In that sense, the Board of Directors of the Company will continue in the evaluation of financial, economic and / or corporate tools that allow the Company to improve its position in the market in which it operates and have the necessary liquidity to meet its obligations. Within the framework of this analysis, the indicated tools may be linked to corporate reorganization processes (merger, spin-off or a combination of both), disposal of assets in public and / or private form that may include real estate as well as negotiable securities owned by the Company, incorporation of shareholders through capital increases through the public offering of shares to attract new capital, repurchase of shares and instruments similar to those described that are useful to the proposed objectives.
 
Evolution of Shopping Malls in Argentina
 
In September 2020, the Consumer Confidence Index (CCI) showed a 2.4% decline compared to August 2020, and a 4.2% decrease compared to September 2019. Shopping mall sales decrease 82.2% in the fiscal 2020 compared to fiscal 2019.
 
Evolution of Office Properties in Argentina
 
According to Colliers International, as of September 30, 2020, the A+ and A office inventory is 1,827,742 sqm. The vacancy rate was steady at approximately 14.2% during the third quarter of 2020. These values indicate that the market is healthy in terms of its operations, allowing an optimum level of supply with robust values.
 
Compared to the previous quarter, the Premium Offices prices increased in the order of USD 25.5 per sqm compared to the previous quarter. The prices for A+ properties were USD 30.0 per sqm for the second quarter of 2020. In this context, Catalinas presents as the zone with higher prices per sqm, reaching an average of USD 29.2. Likewise, the industry reported a USD/m2 1.2 decreased in rental prices for A+ properties compared to the second quarter of 2020.
 
Evolution of the Hotel industry in Argentina
 
According to the Hotel Vacancy Survey (EOH) prepared by INDEC, at September 2020, overnight stays at hotel and parahotel establishments were estimated at 140 thousand, 96.3% shorter than the same month the previous year. Overnight stays by resident and nonresident travelers decreased by 95.4% and 99.4%, respectively. Total travelers who stayed at hotels during June were 47 thousand, a 97.2% decrease compared to the same month the previous year. The number of resident and nonresident travelers decreased by 96.5% and 99.7%, respectively. The Room Occupancy Rate in September was 80.9%, showing a sharp decrease compared to the same month the previous year. Moreover, the Bed Occupancy Rate for the same period was 95.1%, which represents a sharp decrease compared to September 2019.
 
Where the interest payable is not fixed, the amount disclosed has been determined by reference to the existing conditions at the reporting date.
 
G. Safe Harbor
 
See the discussion at the beginning of this Item 5 and “Forward Looking Statements” in the introduction of this Form 6-K for the forward looking safe harbor provisions.


53


 DIRECTORS, SENIOR MANAGEMENT AND EMPLOYEES
 
Directors
 
The table below shows information about our regular directors and alternate directors as from October 26, 2020:
 
Name
Date of Birth
Position in IRSA
Date appointed
Term expiration
Current position held since
Eduardo S. Elsztain 
01/26/1960
Chairman
2018
2021
1991
Saúl Zang 
12/30/1945
First Vice-Chairman
2018
2021
1994
Alejandro G. Elsztain 
03/31/1966
Second Vice-Chairman
2019
2022
2001
Fernando A. Elsztain 
01/04/1961
Regular Director
2020
2023
1999
Cedric D. Bridger 
11/09/1935
Regular Director
2018
2021
2003
Marcos Fischman 
04/09/1960
Regular Director
2018
2021
2003
Mauricio E. Wior 
10/23/1956
Regular Director
2018
2021
2006
Daniel Ricardo Elsztain
12/22/1972
Regular Director
2020
2023
2007
Oscar Pedro Bergotto 
19/07/1946
Regular Director
2019
2022
2019
Demian Brener 
20/06/1990
Regular Director
2019
2022
2019
Maria Julia Bearzi 
11/15/1975
Regular Director
2019
2022
2019
Liliana L. De Nadai 
01/11/1975
Regular Director
2019
2022
2019
Gastón Armando Lernoud
06/04/1968
Alternate Director
2020
2023
2014
Enrique Antonini 
03/16/1950
Alternate Director
2019
2022
2007
Gabriel A. G. Reznik 
11/18/1958
Alternate Director
2019
2022
2008
David Williams 
12/07/1955
Alternate Director
2019
2022
2008
Ben Iosef Elsztain 
01/16/1997
Alternate Director
2020
2023
2020
Iair Elsztain 
03/05/1995
Alternate Director
2020
2023
2020
 
Oscar Pedro Bergotto, Demian Brener, David Williams, María Julia Bearzi and Liliana De Nadai are independent directors, pursuant to CNV Rules.
 
Employees
 
Operations Center in Argentina
 
As of September 30, 2020, we had 1,373 employees. Our employees of the segments non relating to our Shopping Mall and Offices had 10 employees. Our Shopping Malls segment had 667 employees, including 304 under collective labor agreements. Our Hotels segment had 696 employees, with 555 represented by the Tourism, Hotel and Gastronomic Workers Union (Unión de Trabajadores del Turismo, Hoteleros y Gastronómicos de la República Argentina, UTHGRA).


As of September 30,
 
 
Year ended on June 30,


2020
 
 
2020
 
 
2019
 
 
2018
 
Development and Sale of Properties and Other Non-Shopping Mall Businesses(1)
  10 
  11 
  12 
  31 
Shopping Malls and Offices(2)
  667 
  784 
  865 
  928 
Hotels(1)
  696  
  701  
  832  
  812  
Total 
  1,373  
  1,496  
  1,709  
  1,771  
 
(1) As of March 2019, we were no longer administrators of Consorcio Libertador S.A. and Consorcio Maipu 1300 S.A.
(2) On December 2018, the concession of the Buenos Aires Design shopping mall ended.
(3) Includes Hotel Intercontinental, Sheraton Libertador and Llao Llao.
 
Share Ownership
 
The following table sets forth the amount and percentage of our common shares beneficially owned by our directors, senior managers, and members of the supervisory committee as of September 30, 2020.


Share ownership
 
Name
Position
 
Number of Shares
 
 
Percentage
 
Directors


Eduardo S. Elsztain (1)
Chairman
  365,058,886 
  63.1%
Saúl Zang
Vice-Chairman I
  22 
  0.0%
Alejandro G. Elsztain
Vice- Chairman II
  2,279,357 
  0.4%
Fernando A. Elsztain
Regular Director
   
   
Cedric D. Bridger
Regular Director
   
   
Marcos M. Fischman
Regular Director
   
   
Mauricio E. Wior
Regular Director
   
   
Daniel R. Elsztain
Regular Director
  99,890 
  0.0%
María Julia Bearzi
Regular Director
   
   
Oscar Pedro Bergotto
Regular Director
   
   
Liliana De Nadai
Regular Director
   
   
Damian Brener
Regular Director
   
   
Gaston A. Lernoud
Alternate Director
  4,782 
  0.0%
Enrique Antonini
Alternate Director
   
   
Gabriel A. G. Reznik
Alternate Director
   
   
David Williams
Alternate Director
   
   
Ben Elsztain
Alternate Director
   
   
Iair Elsztain
Alternate Director
  900 
  0.0%
Senior Management


Matías I. Gaivironsky
Chief Financial and Administrative Officer
  43,150 
  0.0%
Jorge Cruces
Chief investment Officer
  18,930 
  0.0%
Supervisory Committee


José D. Abelovich
Member
   
   
Marcelo H. Fuxman
Member
   
   
Noemí I. Cohn
Member
   
   
Roberto D. Murmis
Alternate member
   
   
Paula Sotelo
Alternate member
   
   
Ariela Levy
Alternate member


(1) Includes (i) 356,913,421 common shares beneficially owned by Cresud and ii) 2,188,790 common shares owned by Helmir and (iii) 5,956,675 common shares owned by Consultores Venture Capital Uruguay S.A.
 
Option Ownership
 
No options to purchase common shares have been granted to our Directors, Senior Managers, members of the Supervisory Committee, or Audit Committee.
 
Employee Participation in our share Capital
 
There are no arrangements for involving our employees in our capital stock or related to the issuance of options, common shares or securities, other than those described under the following sections: (i) Item 6 – B. Compensation – Capitalization Plan and (ii) Item 6 – B. Compensation – Mid and Long Term Incentive Program.


54
 
 
 MAJOR SHAREHOLDERS
 
Major Shareholders
 
Information about Major Shareholders
 
Share Ownership
 
The following table sets forth information regarding ownership of our capital stock by each person known to us to own beneficially at least 5% of our common shares, ANSES and all our directors and officers as a group.


Share Ownership as of September 30, 2020
 
Shareholder
 
Number of Shares
 
 
Percentage (2)
 
Cresud (1)
  359,102,211 
  62.1%
Directors and officers (excluding Eduardo Elsztain)
  2,447,031 
  0.4%
ANSES
  25,914,834  
  4.5%
Total
  387,464,076 
  67.0%
 
(1) Eduardo S. Elsztain is the beneficial owner of 177,186,493 common shares of Cresud, representing 35.32% of its total share capital, which include (i) 73,897,991 common shares beneficially owned by IFISA, (ii) 940 common shares owned by Consultores Venture Capital Uruguay S.A. for which Mr. Eduardo S. Elsztain is deemed to be the beneficial owner, (iii) 103,087,210 common shares owned by Agroinvestment S.A. for which Mr. Eduardo S. Elsztain is deemed beneficial owner and (iv) 100,352 common shares directly owned by Mr. Eduardo S. Furthermore, IFISA retains voting power and right of first refusal over an equivalent of 8,669,890 common shares (1.73% of the outstanding) until 02/18/2021. Although Mr. Elsztain does not own a majority of the common shares of Cresud, he is its largest shareholder and exercises substantial influence over it. If Mr. Elsztain is considered to be the beneficial owner of Cresud due to his substantial influence over it, he would be the beneficial owner of 63.1% of our common shares by virtue of his investment in Cresud of 359,102,211 common shares and in Consultores Venture Capital Uruguay S.A. of 5,956,675 common shares. Cresud is a leading Argentine producer of basic agricultural products. Cresud’s common shares began trading in the BYMA on December 12, 1960, under the trading symbol “CRES” and on March 1997 its GDSs began trading in the Nasdaq under the trading symbol “CRESY.” 
(2) As of September 30, 2020, the number of outstanding common shares was 578,676,460.
 
Changes in Share Ownership
 
Shareholder (3)
 
September 30, 2020 (%)
 
 
June 30, 2019 (%)
 
 
June 30, 2018 (%)
 
 
June 30, 2017 (%)
 
 
June 30, 2016 (%)
 
Cresud (1)
  62.1 
  62.1 
  63.4 
  63.4 
  63.4 
Directors and officers (2)
  0.4 
  0.5 
  0.2 
  0.2 
  0.2 
ANSES
  4.5  
  4.5  
  4.5  
  4.5  
  4.5  
Total
  67.0 
  67.1 
  68.1 
  68.1 
  68.1 
 
(1) Eduardo S. Elsztain is the beneficial owner of 177,186,493 common shares of Cresud, representing 35.32% of its total share capital, which include (i) 73,897,991 common shares beneficially owned by IFISA, (ii) 940 common shares owned by Consultores Venture Capital Uruguay S.A. for which Mr. Eduardo S. Elsztain is deemed to be the beneficial owner, (iii) 103,087,210 common shares owned by Agroinvestment S.A. for which Mr. Eduardo S. Elsztain is deemed beneficial owner and (iv) 100,352 common shares directly owned by Mr. Eduardo S. Furthermore, IFISA retains voting power and right of first refusal over an equivalent of 8,669,890 common shares (1.73% of the outstanding) until 02/18/2021. Although Mr. Elsztain does not own a majority of the common shares of Cresud, he is its largest shareholder and exercises substantial influence over it. If Mr. Elsztain is considered to be the beneficial owner of Cresud due to his substantial influence over it, he would be the beneficial owner of 63.1% of our common shares by virtue of his investment in Cresud of 359,102,211 common shares and in Consultores Venture Capital Uruguay S.A. of 5,956,675 common shares.
(2) Includes only direct ownership of our directors and senior management.
(3) As of September 30, 2020, the number of outstanding common shares was 578,676,460.
 
Differences in Voting Rights
 
Our major shareholders do not have different voting rights.
 
Arrangements for change in control
 
We are not aware of any arrangements that may, when in force, result in a change in control.
 
Securities held in the host country
 
As of September 30, 2020, our total issued capital stock outstanding consisted of 578,676,460 common shares. As of September 30, 2020, there were approximately 20,192,273 Global Depositary Shares (representing 201,922,730 of our common shares, or 34.9% of all or our outstanding common shares) held in the United States by approximately 20 registered holders.


55
 
 
 CONTROLS AND PROCEDURES
 
Disclosure Controls and Procedures
 
We maintain disclosure controls and procedures that are designed to ensure that information required to be disclosed in the reports we file or submit under the Exchange Act is recorded, processed, summarized and reported within the time periods specified in the SEC’s rules and forms, and that such information is accumulated and communicated to management, including our Chief Executive Officer and Chief Financial and Administrative Officer, to allow our management to make timely decisions regarding required disclosure. Any controls and procedures, no matter how well designed and operated, can provide only reasonable assurance of achieving the desired control objective. In connection with the preparation of this Form 6-K, we carried out an evaluation under the supervision and with the participation of members of our management team, including our Chief Executive Officer and Chief Financial and Administrative Officer, of the effectiveness of the design and operation of our disclosure controls and procedures (as defined in Rules 13a-15(e) and 15d-15(e) under the Exchange Act) as of June 30, 2020, taking into account the recast of our audited consolidated financial statements as of such date to: (a) present the Audited Consolidated Financial Statements in the measuring unit current at the end of the reporting period as of September 30, 2020 (the most recent period for which financial statements are included in this Form 6-K); and (b) reflect IRSA’s loss of control in IDBD and DIC on September 25, 2020 and, consequently, the deconsolidation of such investees since that date. Based upon this evaluation our Chief Executive Officer and Chief Financial and Administrative Officer concluded that our disclosure controls and procedures as of the end of the period covered by this Form 6-K were effective at the reasonable assurance level.
 
Management’s Annual Report on Internal Control Over Financial Reporting
 
Our management is responsible for establishing and maintaining adequate Internal Control over Financial Reporting (as defined in Rules 13a-15(f) and 15d-15(f) under the Exchange Act). Our Internal Control over Financial Reporting includes a series of procedures designed to provide reasonable assurance regarding the reliability of financial reporting and the preparation of Consolidated Financial Statements for external purposes, in accordance with International Financial Reporting Standards and includes those policies and procedures that (1) pertain to the maintenance of records that, in reasonable detail, accurately and fairly reflect the transactions and dispositions of our assets, (2) provide reasonable assurance that transactions are recorded as necessary to permit preparation of Consolidated Financial Statements in accordance with International Financial Reporting Standards and that a company’s receipts and expenditures are being made only in accordance with authorizations of our management and directors, and (3) provide reasonable assurance regarding prevention or timely detection of unauthorized acquisition, use, or disposition of our assets that could have a material effect on our Consolidated Financial Statements.
 
Because of its inherent limitations, Internal Control over Financial Reporting may not prevent or detect misstatements. Also, projections of any evaluation of effectiveness to future periods are subject to the risk that controls may become inadequate because of changes in conditions, or that the degree of compliance with policies and procedures may deteriorate.
 
Management assessed the effectiveness of our Internal Control over Financial Reporting as of June 30, 2020, taking into account the recast of our audited consolidated financial statements as of such date to: (a) present the Audited Consolidated Financial Statements in the measuring unit current at the end of the reporting period as of September 30, 2020 (the most recent period for which financial statements are included in this Form 6-K); and (b) reflect IRSA’s loss of control in IDBD and DIC on September 25, 2020 and, consequently, the deconsolidation of such investees since that date. In making this assessment, management used the criteria set forth by the Committee of Sponsoring Organizations of the Treadway Commission (COSO) in Internal Control–Integrated Framework (2013). Based on this evaluation, management concluded that our Internal Control over Financial Reporting was effective as of June 30, 2020.
 
Attestation Report of the Registered Public Accounting Firm
 
The effectiveness of the Company’s internal control over financial reporting as of June 30, 2020, taking into account the recast of our audited consolidated financial statements as of such date to: (a) present the Audited Consolidated Financial Statements in the measuring unit current at the end of the reporting period as of September 30, 2020 (the most recent period for which financial statements are included in this Form 6-K); and (b) reflect IRSA’s loss of control in IDBD and DIC on September 25, 2020 and, consequently, the deconsolidation of such investees since that date, has been audited by Price Waterhouse & Co S.R.L, Buenos Aires Argentina- member firm of PricewaterhouseCoopers International Limited, an independent registered public accounting firm, as stated in their report which appears herein.
 
Changes in Internal Control Over Financial Reporting
 
During the fiscal year ended June 30, 2019, we implemented the Consolidation module of the BPC (Business Planning and Consolidation) application by SAP and accordingly we have updated our internal controls over financial reporting, as necessary, to accommodate modifications to our accounting and financial reporting processes and to take advantage of enhanced automated controls provided by this new system.
 
Other than as expressly noted above, there have been no changes in our internal control over financial reporting during the fiscal year ended June 30, 2019 that have materially affected, or are reasonably likely to materially affect, our internal control over financial reporting.
 
Audit Committee Financial Expert
 
Pursuant to the former applicable rules regarding the Capital Markets Law (formerly the Transparency Decree) and the applicable Rules of the CNV at such moment, our board of directors has established on May 2004 an Audit Committee. The main functions of the Audit Committee are to assist the board of directors in performing their duty of exercising due care, diligence and competence in issues relating to us, specifically in the enforcement of the accounting policy and in the issue of accounting and financial information, the management of business risk and of internal control systems, the conduct and ethical soundness of the company’s business, the supervision of the integrity of our financial statements, the compliance by our company with the legal provisions, the independence and capability of the independent auditor and the performance of the internal audit function of our company and of the external auditors. Also, according to the applicable regulations, we may request to our audit committee to render its opinion in certain transactions, and its conditions, as is the case of related party transactions, as may be reasonably considered adequate according to normal market conditions.
 
Since October 31, 2019, the members of the Audit Committee are Oscar Pedro Bergotto, Demian Brener and Maria Julia Bearzi, all of them as independent members. Maria Julia Bearzi is the financial expert in accordance with the relevant SEC rules. We have a fully independent audit committee as per the standard provided in Rule 10 (A)-3(B) (1).
 
Code of Ethics
 
We have adopted a code of ethics that applies to our directors, officers and employees. Our code of ethics is posted in our website www.irsa.com.ar. On July 25, 2005, our Code of Ethics was amended by our Board of Directors. The amendment was filed with the SEC as an exhibit to our annual report on Form 20-F for the fiscal year ended June 30, 2019.
 
If we make any substantive amendment to the code of ethics or grant any waivers, including any implicit waiver to any of its provision we will disclose the nature of such amendment or waiver in a report on Form 6-K or in our next annual report on Form 20-F and we will post it in our website.
 
Audit Committee Pre-Approval Policies and Procedures
 
Audit Committee pre-approves all services and fees provided by the external auditors to ensure auditors’ independence. One of the main tasks of the Audit Committee is to give it opinion in relation to the appointment of the external auditors, proposed by the Board of Directors to the general shareholders’ meeting. In order to accomplish such task, the Audit Committee shall:
 
Require any additional and complementary documentation related to this analysis.
 
Verify the independence of the external auditors;
 
Analyze different kinds of services that the external auditor would provide to the company. This description must also include an estimate of the fees payable for such services, specifically in order to maintain the principle of independence;
 
Inform the fees billed by the external auditor, separating the services related to the audit services and other special services that could be not included in the audit services previously mentioned.
 
Analyze and supervise the working plan of the external auditors considering the business’ reality and the estimated risks;
 
Propose adjustments (if necessary) to such working plan;
 
Hold meetings with the external auditors in order to: (a) analyze the difficulties, results and conclusions of the proposed working plan; (b) analyze eventual possible conflicts of interests, related party transactions, compliance with the legal framework and information transparency; and
 
Evaluate the performance of external auditors and their opinion regarding our Financial Statements.


56
 
 
INDEX OF EXHIBITS
 
Exhibit No.
 
Description of Exhibit
 
99.1
Audited Consolidated Financial Statements as of June 30, 2020 and 2019 and for the fiscal years ended June 30, 2020, 2019 and 2018.
99.2
Unaudited Condensed Interim Consolidated Financial Statements as of September 30, 2020 and for the three-month period ended September 30, 2020 and 2019.
99.3
Summary of investment properties by type as of June 30, 2020 (in accordance with Regulation S-X 12-28 (1)).
99.4
List of Subsidiaries.
 

57
 
 
 SIGNATURES
 
Pursuant to the requirements of the Securities Exchange Act of 1934, the registrant has duly caused this report to be signed on its behalf by the undersigned, thereunto duly authorized.
 
 
IRSA Inversiones y Representaciones Sociedad Anónima


Date January 5, 2021
By: /s/ Matías I. Gaivironsky
 
 Name: Matías I. Gaivironsky
Title: Chief Financial and Administrative Officer 


58
EX-99.1 2 irsarecast.htm ADDITIONAL EXHIBITS irsarecast
 
Index
Report of Independent Registered Public Accounting Firm
 F-1 
 
Glossary
F-2
 
Consolidated Statements of Financial Position 
F-3
 
Consolidated Statements of Income and Other Comprehensive Income 
F-4
 
Consolidated Statements of Changes in Shareholders’ Equity 
F-5
 
Consolidated Statements of Cash Flows 
F-8
 
Notes to Consolidated Financial Statements


Note 1 – The Group’s business and general information 
F-9
 
Note 2 – Summary of significant accounting policies 
F-12
 
Note 3 – Significant judgments, key assumptions and estimates 
F-31
 
Note 4 – Acquisitions and dispositions 
F-32
 
Note 5 – Financial risk management and fair value estimates 
F-40
 
Note 6 – Segment information 
F-47
 
Note 7 – Information about the main subsidiaries 
F-52
 
Note 8 – Investments in associates and joint ventures 
F-53
 
Note 9 – Investment properties 
F-57
 
Note 10 – Property, plant and equipment 
F-60
 
Note 11 – Trading properties 
F-61
 
Note 12 – Intangible assets 
F-62
 
Note 13 – Rights of use of assets 
F-63
 
Note 14 – Financial instruments by category 
F-64
 
Note 15 – Trade and other receivables 
F-68
 
Note 16 – Cash flow information 
F-69
 
Note 17 – Shareholders’ Equity 
F-70
 
Note 18 – Trade and other payables 
F-71
 
Note 19 – Provisions 
F-72
 
Note 20 – Borrowings 
F-74
 
Note 21 – Taxes 
F-76
 
Note 22 – Leases 
F-79
 
Note 23 – Revenues 
F-80
 
Note 24 – Expenses by nature 
F-80
 
Note 25 – Cost of goods sold and services provided 
F-81
 
Note 26 – Other operating results, net 
F-81
 
Note 27 – Financial results, net 
F-81
 
Note 28 – Earnings per share 
F-82
 
Note 29 – Employee benefits and share-based payments 
F-82
 
Note 30 – Related party transactions 
F-84
 
Note 31 – Foreign currency assets and liabilities 
F-89
 
Note 32 – Groups of assets and liabilities held for sale 
F-90
 
Note 33 – Results from discontinued operations 
F-90
 
Note 34 – Economic framework of the Group’s business 
F-91
 
Note 35 – Subsequent Events 
F-94


Report of Independent Registered Public Accounting Firm
 
To the Board of Directors and Shareholders of
IRSA Inversiones y Representaciones Sociedad Anónima
 
Opinions on the Financial Statements and Internal Control over Financial Reporting
 
We have audited the accompanying consolidated statements of financial position of IRSA Inversiones y Representaciones Sociedad Anónima and its subsidiaries (the “Company”) as of June 30, 2020 and 2019, and the related consolidated statements of income and other comprehensive income, changes in shareholders’ equity and cash flows for each of the three years in the period ended June 30, 2020, including the related notes and the summary of investment properties by type as of June 30, 2020 listed in the accompanying index (collectively referred to as the “consolidated financial statements”). We also have audited the Company’s internal control over financial reporting as of June 30, 2020, based on criteria established in Internal Control - Integrated Framework (2013) issued by the Committee of Sponsoring Organizations of the Treadway Commission (COSO).
 
In our opinion, the consolidated financial statements referred to above present fairly, in all material respects, the financial position of the Company as of June 30, 2020 and 2019, and the results of its operations and its cash flows for each of the three years in the period ended June 30, 2020 in conformity with International Financial Reporting Standards as issued by the International Accounting Standards Board. Also in our opinion, the Company maintained, in all material respects, effective internal control over financial reporting as of June 30, 2020, based on criteria established in Internal Control - Integrated Framework (2013) issued by the COSO.
 
Basis for Opinions
 
The Company's management is responsible for these consolidated financial statements, for maintaining effective internal control over financial reporting, and for its assessment of the effectiveness of internal control over financial reporting, included in the accompanying Management’s Annual Report on Internal Control over Financial Reporting appearing in the accompanying Form 6-K. Our responsibility is to express opinions on the Company’s consolidated financial statements and on the Company's internal control over financial reporting based on our audits. We are a public accounting firm registered with the Public Company Accounting Oversight Board (United States) (PCAOB) and are required to be independent with respect to the Company in accordance with the U.S. federal securities laws and the applicable rules and regulations of the Securities and Exchange Commission and the PCAOB.
 
We conducted our audits in accordance with the standards of the PCAOB. Those standards require that we plan and perform the audits to obtain reasonable assurance about whether the consolidated financial statements are free of material misstatement, whether due to error or fraud, and whether effective internal control over financial reporting was maintained in all material respects.
 
Our audits of the consolidated financial statements included performing procedures to assess the risks of material misstatement of the consolidated financial statements, whether due to error or fraud, and performing procedures that respond to those risks. Such procedures included examining, on a test basis, evidence regarding the amounts and disclosures in the consolidated financial statements. Our audits also included evaluating the accounting principles used and significant estimates made by management, as well as evaluating the overall presentation of the consolidated financial statements. Our audit of internal control over financial reporting included obtaining an understanding of internal control over financial reporting, assessing the risk that a material weakness exists, and testing and evaluating the design and operating effectiveness of internal control based on the assessed risk. Our audits also included performing such other procedures as we considered necessary in the circumstances. We believe that our audits provide a reasonable basis for our opinions.
 
Emphasis of Matter
 
As discussed in Note 1, these consolidated financial statements have been recast to (i) restate all amounts into the current unit of measurement as of September 30, 2020, and (ii) reflect the loss of control of the Company’s subsidiary IDBD.
 
As discussed in Note 34 to the consolidated financial statements, there are significant uncertainties related to the impact of the current economic context and COVID-19. Management’s evaluation of the events and conditions and management’s plans to mitigate these matters are also described in Note 34.
 
Definition and Limitations of Internal Control over Financial Reporting
 
A company’s internal control over financial reporting is a process designed to provide reasonable assurance regarding the reliability of financial reporting and the preparation of financial statements for external purposes in accordance with generally accepted accounting principles. A company’s internal control over financial reporting includes those policies and procedures that (i) pertain to the maintenance of records that, in reasonable detail, accurately and fairly reflect the transactions and dispositions of the assets of the company; (ii) provide reasonable assurance that transactions are recorded as necessary to permit preparation of financial statements in accordance with generally accepted accounting principles, and that receipts and expenditures of the company are being made only in accordance with authorizations of management and directors of the company; and (iii) provide reasonable assurance regarding prevention or timely detection of unauthorized acquisition, use, or disposition of the company’s assets that could have a material effect on the financial statements.
 
Because of its inherent limitations, internal control over financial reporting may not prevent or detect misstatements. Also, projections of any evaluation of effectiveness to future periods are subject to the risk that controls may become inadequate because of changes in conditions, or that the degree of compliance with the policies or procedures may deteriorate.
 
 
/s/ PRICE WATERHOUSE & Co. S.R.L
                                                      (Partner)
/s/ Walter Rafael Zablocky
Buenos Aires, Argentina
January 5, 2021
 
We have served as the Company’s auditor since 1992.
 
 
F-1


Glossary
 
The following are not technical definitions, but help the reader to understand certain terms used in the wording of the notes to the Group’s Consolidated Financial Statements.
 
Terms
 
Definitions
BACS
 
Banco de Crédito y Securitización S.A.
BCRA
 
Central Bank of the Argentine Republic
BHSA
 
Banco Hipotecario S.A.
BYMA
 
Buenos Aires Stock Exchange
Cellcom
 
Cellcom Israel Ltd.
Clal
 
Clal Holdings Insurance Enterprises Ltd.
CNV
 
Securities National Commission
CODM
 
Chief Operating Decision Maker
Condor
 
Condor Hospitality Trust Inc.
CPF
 
Collective Promotion Funds
CPI
 
Consumer Price Index
Cresud
 
Cresud S.A.C.I.F. y A.
DFL
 
Dolphin Fund Ltd.
DIC
 
Discount Investment Corporation Ltd.
DIL
 
Dolphin IL Investment Ltd.
DN B.V.
 
Dolphin Netherlands B.V.
Dolphin
 
Dolphin Fund Ltd. and Dolphin Netherlands B.V.
ECLSA
 
E-Commerce Latina S.A.
Efanur
 
Efanur S.A.
EHSA
 
Entertainment Holdings S.A.
ETH
 
C.A.A. Extra Holdings Ltd.
GAV-YAM
 
Gav-Yam Bayside Land Corporation Ltd.
GCBA
 
Autonomous City of Buenos Aires Government
Golan
 
Golan Telecom Ltd.
HASAU
 
Hoteles Argentinos S.A.U.
IAS
 
International Accounting Standards
IASB
 
International Accounting Interpretations Board
IDB Tourism
 
IDB Tourism (2009) Ltd
IDBD
 
IDB Development Corporation Ltd.
IDBH
 
IDB Holdings Corporation Ltd.
IFISA
 
Inversiones Financieras del Sur S.A.
IFRIC
 
International Financial Reporting Standards Interpretation Committee
IFRS
 
International Financial Reporting Standards
IRSA CP
 
IRSA Propiedades Comerciales S.A.
IRSA, “The Company”, “Us”, “We”
 
IRSA Inversiones y Representaciones Sociedad Anónima
ISPRO
 
Ispro The Israeli Properties Rental Corporation Ltd.
Israir
 
Israir Airlines & Tourism Ltd.
Koor
 
Koor Industries Ltd.
Lipstick
 
Lipstick Management LLC
LRSA
 
La Rural S.A.
Metropolitan
 
Metropolitan 885 Third Avenue Leasehold LLC
MPIT
 
Minimum Presumed Income Tax
NCN
 
Non-Convertible Notes
New Lipstick
 
New Lipstick LLC
NFSA
 
Nuevas Fronteras S.A.
NIS
 
New Israeli Shekel
NYSE
 
New York Stock Exchange
OASA
 
OGDEN Argentina S.A.
PBC
 
Property & Building Corporation Ltd.
PBEL
 
PBEL Real Estate LTD
Quality
 
Quality Invest S.A.
Rock Real
 
Rock Real Estate Partners Limited
Shufersal
 
Shufersal Ltd.
Tarshop
 
Tarshop S.A.
TASE
 
Tel Aviv Stock Exchange
TGLT
FACPCE
 
TGLT S.A.
Argentine Federation of Accountant
Tyrus
 
Tyrus S.A.
 
F-2
IRSA Inversiones y Representaciones Sociedad Anónima
 
Consolidated Statements of Financial Position
as of June 30, 2020 and 2019
(All amounts in millions of Argentine Pesos, except otherwise indicated)


Note
  06.30.2020 
  06.30.2019 
ASSETS


Non-current assets


Investment properties
9
  244,966 
  359,056 
Property, plant and equipment
10
  40,618 
  34,347 
Trading properties
11, 25
  5,228 
  8,436 
Intangible assets
12
  29,911 
  27,563 
Right-of-use assets
13
  21,379 
  - 
Other assets
 
  - 
  37 
Investments in associates and joint ventures
8
  80,089 
  47,841 
Deferred income tax assets
21
  681 
  614 
Income tax and MPIT credit
 
  27 
  232 
Restricted assets
14
  2,014 
  4,737 
Trade and other receivables
15
  24,898 
  19,033 
Investments in financial assets
14
  3,782 
  4,444 
Financial assets at fair value through profit or loss 
14
  - 
  6,428 
Derivative financial instruments
14
  153 
  146 
Total non-current assets
 
  453,746 
  512,914 
Current assets


Trading properties
11, 25
  2,493 
  563 
Inventories
25
  5,041 
  1,765 
Restricted assets
14
  6,684 
  6,741 
Income tax and MPIT credit
 
  331 
  600 
Group of assets held for sale
32
  44,868 
  12,378 
Trade and other receivables
15
  39,986 
  34,687 
Investments in financial assets
14
  20,922 
  49,573 
Financial assets at fair value through profit or loss 
14
  3,636 
  17,942 
Derivative financial instruments
14
  227 
  63 
Cash and cash equivalents
14
  97,276 
  93,060 
Total current assets
 
  221,464 
  217,372 
TOTAL ASSETS
 
  675,210 
  730,286 
SHAREHOLDERS’ EQUITY


Shareholders' equity attributable to equity holders of the parent (according to corresponding statement)
 
  61,500 
  49,352 
Non-controlling interest
 
  70,544 
  82,692 
TOTAL SHAREHOLDERS’ EQUITY
 
  132,044 
  132,044 
LIABILITIES


Non-current liabilities


Borrowings
14, 20
  320,616 
  410,853 
Lease liabilities
 
  14,400 
  - 
Deferred income tax liabilities
21
  47,408 
  56,616 
Trade and other payables
14, 18
  2,335 
  2,697 
Provisions
19
  3,297 
  12,329 
Employee benefits
 
  481 
  202 
Derivative financial instruments
14
  59 
  1,582 
Salaries and social security liabilities
 
  210 
  169 
Total non-current liabilities
 
  388,806 
  484,448 
Current liabilities


Trade and other payables
14, 18
  31,943 
  28,559 
Borrowings
14, 20
  84,338 
  70,014 
Lease liabilities
 
  5,242 
  - 
Provisions
19
  2,627 
  2,651 
Group of liabilities held for sale
32
  23,912 
  8,759 
Salaries and social security liabilities
 
  4,419 
  3,241 
Income tax and MPIT liabilities
 
  673 
  532 
Derivative financial instruments
14
  1,206 
  38 
Total current liabilities
 
  154,360 
  113,794 
TOTAL LIABILITIES
 
  543,166 
  598,242 
TOTAL SHAREHOLDERS’ EQUITY AND LIABILITIES
 
  675,210 
  730,286 
 
The accompanying notes are an integral part of these Consolidated Financial Statements.
 
F-3
IRSA Inversiones y Representaciones Sociedad Anónima
 
Consolidated Statements of Income and Other Comprehensive Income
for the fiscal years ended June 30, 2020, 2019 and 2018
(All amounts in millions of Argentine Pesos, except otherwise indicated)


Note
  06.30.2020 
  06.30.2019 
  06.30.2018 
Revenues
23
  15,240 
  20,071 
  19,522 
Costs
24, 25
  (6,359)
  (7,498)
  (7,727)
Gross profit
 
  8,881 
  12,573 
  11,795 
Net gain / (loss) from fair value adjustment of investment properties
9
  36,313 
  (41,737)
  20,627 
General and administrative expenses
24
  (2,365)
  (2,928)
  (2,518)
Selling expenses
24
  (1,306)
  (1,160)
  (1,195)
Other operating results, net
26
  (24)
  (506)
  (27)
Profit / (loss) from operations
 
  41,499 
  (33,758)
  28,682 
Share of profit / (loss) of associates and joint ventures
8
  7,771 
  (7,588)
  (3,551)
Profit / (loss) before financial results and income tax
 
  49,270 
  (41,346)
  25,131 
Finance income
27
  229 
  202 
  808 
Finance costs
27
  (6,629)
  (5,151)
  (4,631)
Other financial results
27
  (6,657)
  2,415 
  (11,832)
Inflation adjustment
 
  97 
  (568)
  (949)
Financial results, net
 
  (12,960)
  (3,102)
  (16,604)
Profit / (loss) before income tax
 
  36,310 
  (44,448)
  8,527 
Income tax (expense) / benefit
21
  (7,216)
  4,845 
  11,455 
Profit / (loss) for the year from continuing operations
 
  29,094 
  (39,603)
  19,982 
(Loss) / profit for the year from discontinued operations
33
  (3,546)
  (1,704)
  15,773 
Profit / (loss) for the year
 
  25,548 
  (41,307)
  35,755 
Other comprehensive income:


Items that may be reclassified subsequently to profit or loss:


Currency translation adjustment
 
  520 
  306 
  (25)
Other comprehensive income for the year from continuing operations
 
  520 
  306 
  (25)
Other comprehensive income / (loss) for the year from discontinued operations
 
  14,748 
  (2,486)
  14,564 
Total other comprehensive income / (loss) for the year
 
  15,268 
  (2,180)
  14,539 
Total comprehensive income / (loss) for the year
 
  40,816 
  (43,487)
  50,294 


Total comprehensive income / (loss) from continuing operations
 
  29,614 
  (39,297)
  19,957 
Total comprehensive income / (loss) from discontinued operations
 
  11,202 
  (4,190)
  30,337 
Total comprehensive income / (loss) for the year
 
  40,816 
  (43,487)
  50,294 


Profit / (loss) for the year attributable to:


Equity holders of the parent
 
  15,340 
  (39,412)
  22,660 
Non-controlling interest
 
  10,208 
  (1,895)
  13,095 


Profit / (loss) from continuing operations attributable to:


Equity holders of the parent
 
  22,065 
  (34,991)
  16,208 
Non-controlling interest
 
  7,029 
  (4,612)
  3,774 


Total comprehensive income / (loss) attributable to:


Equity holders of the parent
 
  14,280 
  (40,421)
  19,040 
Non-controlling interest
 
  26,536 
  (3,066)
  31,254 


Total comprehensive income / (loss) from continuing operations attributable to:


Equity holders of the parent
 
  22,585 
  (34,685)
  15,972 
Non-controlling interest
 
  7,029 
  (4,612)
  3,985 


Profit / (loss) per share attributable to equity holders of the parent:


Basic
 
  26.66 
  (68.55)
  39.39 
Diluted
 
  26.50 
  (68.55)
  39.16 


Profit / (loss) per share from continuing operations attributable to equity holders of the parent:


Basic
 
  38.35 
  (60.86)
  28.17 
Diluted
 
  38.12 
  (60.86)
  28.17 
 
The accompanying notes are an integral part of these Consolidated Financial Statements.


F-4
IRSA Inversiones y Representaciones Sociedad Anónima
 
Consolidated Statements of Changes in Shareholders’ Equity
for the fiscal years ended June 30, 2020, 2019 and 2018
(All amounts in millions of Argentine Pesos, except otherwise indicated)


Attributable to equity holders of the parent


Share capital
 
 
Treasury shares
 
 
Inflation adjustment of share capital and treasury shares (1)
 
 
Share premium
 
 
Additional paid-in capital from treasury shares
 
 
Legal reserve
 
 
Special reserve Resolution CNV 609/12 (2)
 
 
Other reserves (3)
 
 
Retained earnings
 
 
Subtotal
 
 
Non-controlling interest
 
 
Total Shareholders’ equity
 
Balance as of July 1, 2019
  575 
  4 
  14,612 
  15,653 
  83 
  522 
  10,121 
  73,257 
  (65,475)
  49,352 
  82,692 
  132,044 
Prior year adjustments (IFRS 16 and IAS 28) (Note 2.2)
  - 
  - 
  - 
  - 
  - 
  - 
  - 
  - 
  (1,406)
  (1,406)
  (926)
  (2,332)
Restated balance as of July 1, 2019
  575 
  4 
  14,612 
  15,653 
  83 
  522 
  10,121 
  73,257 
  (66,881)
  47,946 
  81,766 
  129,712 
Profit for the year
  - 
  - 
  - 
  - 
  - 
  - 
  - 
  - 
  15,340 
  15,340 
  10,208 
  25,548 
Other comprehensive (loss) / income for the year
  - 
  - 
  - 
  - 
  - 
  - 
  - 
  (1,060)
  - 
  (1,060)
  16,328 
  15,268 
Total comprehensive income for the year
  - 
  - 
  - 
  - 
  - 
  - 
  - 
  (1,060)
  15,340 
  14,280 
  26,536 
  40,816 
Loss absorption
  - 
  - 
  - 
  - 
  - 
  - 
  - 
  (65,081)
  65,081 
  - 
  - 
  - 
Reserve for share-based payments
  - 
  - 
  - 
  - 
  18 
  - 
  - 
  (18)
  - 
  - 
  - 
  - 
Distribution of dividends in shares (See Note 4.A)
  - 
  - 
  - 
  - 
  - 
  - 
  - 
  (634)
  - 
  (634)
  - 
  (634)
Capitalization of irrevocable contributions
  - 
  - 
  - 
  - 
  - 
  - 
  - 
  - 
  - 
  - 
  33 
  33 
Dividend distribution
  - 
  - 
  - 
  - 
  - 
  - 
  - 
  - 
  - 
  - 
  (2,458)
  (2,458)
Decrease due to loss of control (See Note 4.C)
  - 
  - 
  - 
  - 
  - 
  - 
  - 
  - 
  - 
  - 
  (46,617)
  (46,617)
Other changes in equity
  - 
  - 
  - 
  - 
  - 
  - 
  - 
  (125)
  24 
  (101)
  270 
  169 
Incorporation by business combination
  - 
  - 
  - 
  - 
  - 
  - 
  - 


  8,013 
  8,013 
Changes in non-controlling interest
  - 
  - 
  - 
  - 
  - 
  - 
  - 
  9 
  - 
  9 
  3,001 
  3,010 
Balance as of June 30, 2020
  575 
  4 
  14,612 
  15,653 
  101 
  522 
  10,121 
  6,348 
  13,564 
  61,500 
  70,544 
  132,044 
 
(1) Includes Ps. 1 of Inflation adjustment of treasury shares. See Note 17.
(2) Related to CNV General Resolution N° 609/12.
(3) Group’s other reserves for the year ended June 30, 2020 were as follows:


Cost of treasury stock
 
 
Changes in non-controlling interest
 
 
Reserve for share-based payments
 
 
Reserve for future dividends
 
 
Currency translation adjustment reserve
 
 
Hedging instruments
 
 
Special reserve
 
 
Reserve for defined contribution plans
 
 
Other reserves from subsidiaries
 
 
Revaluation surplus
 
 
Total Other reserves
 
Balance as of July 1, 2019
  (177)
  (5,679)
  224 
  1,822 
  282 
  (10)
  76,905 
  (334)
  112 
  112 
  73,257 
Other comprehensive loss for the year
  - 
  - 
  - 
  - 
  (941)
  (384)
  - 
  (87)
  - 
  352 
  (1,060)
Total comprehensive loss for the year
  - 
  - 
  - 
  - 
  (941)
  (384)
  - 
  (87)
  - 
  352 
  (1,060)
Appropriation of retained earnings approved by Shareholders’ meeting held on 10.29.18
  (7)
  - 
  (11)
  - 
  - 
  - 
  - 
  - 
  - 
  - 
  (18)
Distribution of dividends in shares
  - 
  - 
  - 
  - 
  - 
  - 
  (634)
  - 
  - 
  - 
  (634)
Share-based compensation
  - 
  9 
  - 
  - 
  - 
  - 
  - 
  - 
  - 
  - 
  9 
Other changes in equity
  - 
  - 
  - 
  - 
  (125)
  - 
  - 
  - 
  - 
  - 
  (125)
Loss absorption
  - 
  - 
  - 
  - 
  - 
  - 
  (65,081)
  - 
  - 
  - 
  (65,081)
Balance as of June 30, 2020
  (184)
  (5,670)
  213 
  1,822 
  (784)
  (394)
  11,190 
  (421)
  112 
  464 
  6,348 
 
The accompanying notes are an integral part of these Consolidated Financial Statements.


F-5
IRSA Inversiones y Representaciones Sociedad Anónima
 
Consolidated Statements of Changes in Shareholders’ Equity
for the fiscal years ended June 30, 2020, 2019 and 2018
(All amounts in millions of Argentine Pesos, except otherwise indicated)


Attributable to equity holders of the parent


Share capital
 
 
Treasury shares
 
 
Inflation adjustment of share capital and treasury shares (1)
 
 
Share premium
 
 
Additional paid-in capital from treasury shares
 
 
Legal reserve
 
 
Special reserve Resolution CNV 609/12 (2)
 
 
Other reserves (3)
 
 
Retained earnings
 
 
Subtotal
 
 
Non-controlling interest
 
 
Total Shareholders’ equity
 
Balance as of July 1, 2018
  575 
  4 
  14,612 
  15,653 
  83 
  522 
  10,121 
  5,284 
  47,517 
  94,371 
  89,519 
  183,890 
Prior year adjustments (IFRS 9 and 15)
  - 
  - 
  - 
  - 
  - 
  - 
  - 
  - 
  (355)
  (355)
  (6)
  (361)
Balance as of July 1, 2018 (recast)
  575 
  4 
  14,612 
  15,653 
  83 
  522 
  10,121 
  5,284 
  47,162 
  94,016 
  89,513 
  183,529 
Loss for the year
  - 
  - 
  - 
  - 
  - 
  - 
  - 
  - 
  (39,412)
  (39,412)
  (1,895)
  (41,307)
Other comprehensive loss for the year
  - 
  - 
  - 
  - 
  - 
  - 
  - 
  (1,009)
  - 
  (1,009)
  (1,171)
  (2,180)
Total profit / (loss) and other comprehensive income for the year
  - 
  - 
  - 
  - 
  - 
  - 
  - 
  (1,009)
  (39,412)
  (40,421)
  (3,066)
  (43,487)
Incorporation by business combination
  - 
  - 
  - 
  - 
  - 
  - 
  - 
  - 
  - 
  - 
  8 
  8 
Changes in non-controlling interest
  - 
  - 
  - 
  - 
  - 
  - 
  - 
  (1,475)
  - 
  (1,475)
  (247)
  (1,722)
Dividend distribution
  - 
  - 
  - 
  - 
  - 
  - 
  - 
  - 
  (2,811)
  (2,811)
  (3,585)
  (6,396)
Reserve for share-based payments
  - 
  - 
  - 
  - 
  - 
  - 
  - 
  - 
  - 
  - 
  69 
  69 
Capitalization of contributions
  - 
  - 
  - 
  - 
  - 
  - 
  - 
  - 
  - 
  - 
  - 
  - 
Assignment of results according to A.G.O. at 10.31.18
  - 
  - 
  - 
  - 
  - 
  - 
  - 
  70,457 
  (70,457)
  - 
  - 
  - 
Dividends distribution to non-controlling interest in subsidiaries
  - 
  - 
  - 
  - 
  - 
  - 
  - 
  - 
  43 
  43 
  - 
  43 
Balance as of June 30, 2019
  575 
  4 
  14,612 
  15,653 
  83 
  522 
  10,121 
  73,257 
  (65,475)
  49,352 
  82,692 
  132,044 
 
(1) Includes Ps. 1 of Inflation adjustment of treasury stock. See Note 17.
(2) Related to CNV General Resolution N° 609/12.
(3) Group’s other reserves for the year ended June 30, 2019 were as follows:


Cost of treasury stock
 
 
Changes in non-controlling interest
 
 
Reserve for share-based payments
 
 
Reserve for future dividends
 
 
Currency translation adjustment reserve
 
 
Hedging instruments
 
 
Reserve for defined contribution plans
 
 
Special reserve
 
 
Other reserves from subsidiaries
 
 
Revaluation surplus
 
 
Total Other reserves
 
Balance as of July 1, 2018
  (195)
  (4,204)
  242 
  1,822 
  1,166 
  115 
  (334)
  6,448 
  112 
  112 
  5,284 
Other comprehensive loss for the year
  - 
  - 
  - 
  - 
  (884)
  (125)
  - 
  - 
  - 
  - 
  (1,009)
Total comprehensive loss for the year
  - 
  - 
  - 
  - 
  (884)
  (125)
  - 
  - 
  - 
  - 
  (1,009)
Share-based compensation
  18 
  - 
  (18)
  - 
  - 
  - 
  - 
  - 
  - 
  - 
  - 
Assignment of results according to A.G.O. at 10.31.18
  - 
  - 
  - 
  - 
  - 
  - 
  - 
  70,457 
  - 
  - 
  70,457 
Changes in non-controlling interest
  - 
  (1,475)
  - 
  - 
  - 
  - 
  - 
  - 
  - 
  - 
  (1,475)
Balance as of June 30, 2019
  (177)
  (5,679)
  224 
  1,822 
  282 
  (10)
  (334)
  76,905 
  112 
  112 
  73,257 
 
The accompanying notes are an integral part of these Consolidated Financial Statements.


F-6
IRSA Inversiones y Representaciones Sociedad Anónima
 
 
Consolidated Statements of Changes in Shareholders’ Equity
for the fiscal years ended June 30, 2020, 2019 and 2018
(All amounts in millions of Argentine Pesos, except otherwise indicated)


Attributable to equity holders of the parent


Share capital
 
 
Treasury shares
 
 
Inflation adjustment of share capital and treasury shares (1)
 
 
Share premium
 
 
Additional paid-in capital from treasury shares
 
 
Legal reserve
 
 
Special reserve Resolution CNV 609/12 (2)
 
 
Other reserves (3)
 
 
Retained earnings
 
 
Subtotal
 
 
Non-controlling interest
 
 
Total Shareholders’ equity
 
Balance as of July 1, 2017
  575 
  4 
  14,612 
  15,653 
  80 
  522 
  10,121 
  7,255 
  35,195 
  84,017 
  68,836 
  152,853 
Profit for the year
  - 
  - 
  - 
  - 
  - 
  - 
  - 
  - 
  22,660 
  22,660 
  13,095 
  35,755 
Other comprehensive (loss) / income for the year
  - 
  - 
  - 
  - 
  - 
  - 
  - 
  (3,620)
  - 
  (3,620)
  18,159 
  14,539 
Total profit / (loss) and other comprehensive income for the year
  - 
  - 
  - 
  - 
  - 
  - 
  - 
  (3,620)
  22,660 
  19,040 
  31,254 
  50,294 
Changes in non-controlling interest
  - 
  - 
  - 
  - 
  - 
  - 
  - 
  (4,781)
  - 
  (4,781)
  11,372 
  6,591 
Dividend distribution
  - 
  - 
  - 
  - 
  - 
  - 
  - 
  - 
  (4,066)
  (4,066)
  - 
  (4,066)
Reserve for share-based payments
  - 
  - 
  - 
  - 
  3 
  - 
  - 
  4 
  - 
  7 
  119 
  126 
Loss of control of subsidiary
  - 
  - 
  - 
  - 
  - 
  - 
  - 
  (22)
  22 
  - 
  (18,114)
  (18,114)
Repayment of dividends in subsidiaries
  - 
  - 
  - 
  - 
  - 
  - 
  - 
  - 
  154 
  154 
  - 
  154 
Capitalization of contributions
  - 
  - 
  - 
  - 
  - 
  - 
  - 
  - 
  - 
  - 
  18 
  18 
Irrevocable contributions
  - 
  - 
  - 
  - 
  - 
  - 
  - 
  - 
  - 
  - 
  11 
  11 
Dividend distribution to non-controlling interest
  - 
  - 
  - 
  - 
  - 
  - 
  - 
  - 
  - 
  - 
  (3,977)
  (3,977)
Assignment of results according to A.G.O. at 10.31.17
  - 
  - 
  - 
  - 
  - 
  - 
  - 
  6,448 
  (6,448)
  - 
  - 
  - 
Balance as of June 30, 2018
  575 
  4 
  14,612 
  15,653 
  83 
  522 
  10,121 
  5,284 
  47,517 
  94,371 
  89,519 
  183,890 
 
(1) Includes Ps. 1 of Inflation adjustment of treasury stock. See Note 17.
(2) Related to CNV General Resolution N° 609/12.
(3) Group’s other reserves for the year ended June 30, 2018 were as follows:
 
 
Cost of treasury stock
 
Changes in non-controlling interest
 
 
Reserve for share-based payments
 
 
Reserve for future dividends
 
 
Currency translation adjustment reserve
 
 
Hedging instruments
 
 
Reserve for defined contribution plans
 
 
Special reserve
 
 
Other reserves from subsidiaries
 
 
Revaluation surplus
 
 
Total Other reserves
 
Balance as of July 1, 2017
  (203)
  577 
  246 
  1,822 
  4,689 
  115 
  (46)
  - 
  - 
  55 
  7,255 
Other comprehensive loss for the year
  - 
  - 
  - 
  - 
  (3,523)
  - 
  (266)
  - 
  112 
  57 
  (3,620)
Total comprehensive loss for the year
  - 
  - 
  - 
  - 
  (3,523)
  - 
  (266)
  - 
  112 
  57 
  (3,620)
Share-based compensation
  8 
  - 
  (4)
  - 
  - 
  - 
  - 
  - 
  - 
  - 
  4 
Loss of control of subsidiary
  - 
  - 
  - 
  - 
  - 
  - 
  (22)
  - 
  - 
  - 
  (22)
Assignment of results according to A.G.O. at 10.31.17
  - 
  - 
  - 
  - 
  - 
  - 
  - 
  6,448 
  - 
  - 
  6,448 
Changes in non-controlling interest
  - 
  (4,781)
  - 
  - 
  - 
  - 
  - 
  - 
  - 
  - 
  (4,781)
Balance as of June 30, 2018
  (195)
  (4,204)
  242 
  1,822 
  1,166 
  115 
  (334)
  6,448 
  112 
  112 
  5,284 
The accompanying notes are an integral part of these Consolidated Financial Statements.


F-7
IRSA Inversiones y Representaciones Sociedad Anónima
 
Consolidated Statements of Cash Flows
for the fiscal years ended June 30, 2020, 2019 and 2018
 (All amounts in millions of Argentine Pesos, except otherwise indicated)
 
 
Note
  06.30.2020 
  06.30.2019 
  06.30.2018 
Operating activities:


Net cash generated from continuing operating activities before income tax paid
16
  7,043 
  6,315 
  (5,330)
Income tax and MPIT paid
 
  (326)
  (362)
  (1,591)
Net cash generated from / (used in) continuing operating activities
 
  6,717 
  5,953 
  (6,921)
Net cash generated from discontinued operating activities
 
  26,778 
  23,158 
  28,904 
Net cash generated from operating activities
 
  33,495 
  29,111 
  21,983 
Investing activities:


Acquisition of participation in associates and joint ventures
 
  - 
  (94)
  (248)
Contributions and issuance of capital in associates and joint ventures
 
  (2,909)
  - 
  - 
Acquisition and improvements of investment properties
 
  (3,960)
  (4,605)
  (3,878)
Proceeds from sales of investment properties
 
  194 
  43 
  443 
Acquisitions and improvements of property, plant and equipment
 
  (272)
  (162)
  (706)
Proceeds from sales of property, plant and equipment
 
  - 
  - 
  36 
Acquisitions of intangible assets
 
  (46)
  (209)
  (164)
Proceeds from sales of property, plant and equipment
 
  - 
  - 
  (237)
Dividends collected from associates and joint ventures
 
  248 
  235 
  386 
Proceeds from sales of interest held in associates and joint ventures
 
  - 
  6 
  93 
Proceeds from loans granted
 
  - 
  223 
  146 
Payment of acquisition of non controlling interest
 
  (225)
  - 
  19 
Acquisitions of investments in financial assets
 
  (16,591)
  (33,101)
  (35,314)
Proceeds from disposal of investments in financial assets
 
  21,624 
  35,610 
  27,945 
Interest received from financial assets
 
  106 
  629 
  283 
Dividends received from financial assets
 
  (13)
  32 
  601 
Payment for acquisition of other assets
 
  - 
  (3)
  1 
Collection for liquidation of associate
 
  - 
  - 
  31 
Loans granted to related parties
 
  (178)
  (15)
  (1,025)
Loans granted
 
  1,937 
  - 
  (38)
Net cash used in continuing investing activities
 
  (85)
  (1,411)
  (11,626)
Net cash generated from / (used in) discontinued investing activities
 
  43,840 
  13,456 
  (21,244)
Net cash generated from / (used in) investing activities
 
  43,755 
  12,045 
  (32,870)
Financing activities:


  - 
Borrowings and issuance of non-convertible notes
 
  23,777 
  6,670 
  11,310 
Payment of borrowings and non-convertible notes
 
  (29,099)
  (4,311)
  (1,732)
Collections / (Payment) of short term loans, net
 
  2,709 
  (1,091)
  903 
Interests paid
 
  (5,811)
  (5,724)
  (3,922)
Repurchase of non-convertible notes
 
  (2,188)
  (1,654)
  - 
Capital contributions from non-controlling interest in subsidiaries
 
  - 
  - 
  14 
Acquisition of non-controlling interest in subsidiaries
 
  (648)
  (1,057)
  (2,669)
Proceeds from sales of non-controlling interest in subsidiaries
 
  (408)
  - 
  7,249 
Distribution of capital to non-controlling interest in subsidiaries
 
  - 
  - 
  (95)
Borrowings obtained from related parties
 
  - 
  69 
  - 
Dividends paid to non-controlling interest in subsidiaries
 
  (239)
  - 
  (1,106)
Charge for issuance of shares and other equity instruments
 
  - 
  - 
  (3,067)
Adquisition of derivate financial instrument
 
  - 
  - 
  262 
Proceeds from sale at non-controlling interest
 
  408 
  - 
  - 
Net proceeds from derivate financial instrument
 
  5,332 
  659 
  220 
Net cash (used in) / generated from continuing financing activities
 
  (6,167)
  (6,439)
  7,367 
Net cash used in discontinued financing activities
 
  (75,785)
  (23,439)
  (14,001)
Net cash used in financing activities
 
  (81,952)
  (29,878)
  (6,634)
Net increase / (decrease) in cash and cash equivalents from continuing activities
 
  465 
  (1,897)
  (11,180)
Net (decrease) / increase in cash and cash equivalents from discontinued activities
 
  (5,167)
  13,175 
  (6,341)
Net (decrease) / increase in cash and cash equivalents
 
  (4,702)
  11,278 
  (17,521)
Cash and cash equivalents at beginning of year
 
  93,060 
  89,326 
  77,024 
Cash and cash equivalents reclassified as held-for-sale
 
  (484)
  (260)
  (922)
Foreign exchange gain and inflation adjustment on cash and changes in fair value of cash equivalents
 
  9,402 
  (7,284)
  30,745 
Cash and cash equivalents at end of year
14
  97,276 
  93,060 
  89,326 
 
The accompanying notes are an integral part of these Consolidated Financial Statements.


F-8
IRSA Inversiones y Representaciones Sociedad Anónima
 
Notes to Consolidated Financial Statements
(Amounts in millions of Argentine Pesos, except otherwise indicated)
 
1.
The Group’s business and general information
 
A.
Purpose of these consolidated financial statements.
 
These financial statements were prepared to comply with the provisions of the Securities and Exchange Commission (SEC), which require retrospective revision of audited financial statements that are incorporated by reference in a registration statement to reflect a subsequent change in accounting principle (or consistent with staff practice, discontinued operations and changes in segment presentation) if the registration statement also incorporates by reference post-event interim financial statements. The changes incorporated to these consolidated financial statements, as compared to those included in the Company’s Form 20-F for the year ended June 30, 2020 filed with the SEC on November 16, 2020, are the following:
 
All the amounts in Argentine Pesos included in these consolidated financial statements were restated to the current unit of measurement as of September 30, 2020, by applying the general price index.
 
Loss of control and deconsolidation of DIC and IDBD:
 
 
On September 25, 2020, the Group lost control over IDBD and DIC. These consolidated financial statements have been recast to reflect the deconsolidation of DIC and IDBD for all periods presented. See Note 33.
 
Update of the economic framework of the Group’s business until the date of issuance of these financial statements (see Note 34)
 
Update of subsequent events between June 30, 2020 and the date of issuance of these financial statements (see Note 35).
 
B.
General Infomation
 
IRSA was founded in 1943, and it is engaged in a diversified range of real estate activities in Argentina since 1991. IRSA and its subsidiaries are collectively referred to hereinafter as “the Group”. Cresud is our direct parent company and IFIS Limited our ultimate parent company.
 
These Consolidated Financial Statements have been approved for issue by the Board of Directors on January 5, 2021.
 
The Group has established two Operations Centers, Argentina and Israel, to manage its global business, mainly through the following companies:
 
 
F-9


(*) See Note 4 for more information about the change within the Operations Center in Israel.
 
 
Operations Center in Argentina
 
The activities of the Operations Center in Argentina are mainly developed through IRSA and its principal subsidiary, IRSA CP. Through IRSA and IRSA CP, the Group owns, manages and develops 14 shopping malls across Argentina, a portfolio of offices and other rental properties in the Autonomous City of Buenos Aires, and it entered the United States of America (“USA”) real estate market in 2009, mainly through the acquisition of non-controlling interests in office buildings and hotels. Through IRSA or IRSA CP, the Group also develops residential properties for sale. The Group, through IRSA, is also involved in the operation of branded hotels. The Group uses the term “real estate” indistinctively in these Consolidated Financial Statements to denote investment, development and/or trading properties activities. IRSA CP's shares are listed and traded on both the BYMA (BYMA: IRCP) and the NASDAQ (NASDAQ: IRCP). IRSA's shares are listed on the BYMA (Merval: IRSA) and the NYSE (NYSE: IRS).
 
The activities of the Group’s “Others” segment is carried out mainly through BHSA, where IRSA holds, directly or indirectly, a 29.91% interest. BHSA is a commercial bank offering a wide variety of banking activities and related financial services to individuals, small and medium-sized companies and large corporations, including the provision of mortgaged loans. BHSA's shares are listed on the BYMA (BYMA: BHIP).
 
Operations Center in Israel
 
The activities of the Operations Center in Israel were mainly developed through the subsidiaries, IDBD and DIC, whose activities correspond to one of the Israeli largest and most diversified conglomerates, which are involved, through its subsidiaries and other investments, in several markets and industries, including real estate, supermarkets, insurance, telecommunications, and others.; controlling or holding an equity interest in companies such as Clal (Insurance), Cellcom (Telecommunications), Shufersal (Supermarkets), PBC (Real Estate), among others. IDBD is listed in the TASE as a “Debentures Company” in accordance with Israeli law, since some series of bonds are traded in that Exchange. DIC shares are listed in the TASE.
 
IDBD and DIC have certain restrictions and financial agreements in relation to their financial debt, including their bonds and loans with banks and financial institutions. Regarding IDBD's financial position, its cash flow and its ability to meet its financial debt commitments, the following should be considered:
 
As of June 30, 2020, IDBD had a deficit in shareholders’ equity, ongoing negative cash flows from continuing operating activities and a low credit rating, which circumstance may cast significant doubt about IDBD´s ability to continue operating as a going concern. IDBD´s cash flow required to meet its liabilities, including short-term liabilities was based on the realization of assets for which the realization date was not under IDBD´s control. These assets included the current price of Clal’s shares and the impact thereof on swap transaction deposits and the fact that IDBD shall receive, among others, the proceeds from the sale of private investments which were directly owned by IDBD.
 
 
F-10
 
 
As of June 30, 2020, the aggregate principal amount of the (i) IDBD Series 9 Bonds was NIS 901 million (“Series 9”), (ii) IDBD Series 14 Bonds was NIS 889 million, collateralized by DIC shares owned directly or indirectly by IDBD representing 70% of the share capital of DIC (“Series 14”), and (iii) IDBD Series 15 Bonds was NIS 238 million, collateralized by shares of Clal representing 5% of the share capital of Clal (“Series 15”).
 
In July 2019 and in June 2020, each of debenture holders (Series 9 and Series 14) and debenture holders (Series 15), respectively, decided to appoint a representative and legal and economic advisor, inter alia, in order to maintain contact with IDBD and / or third parties and to examine proposals that would be presented to the bondholders in connection with the repayment of IDBD's obligations towards the bondholders and to evaluate IDBD’s financial position and the remedies which may be available to the debenture holders.
 
In June 2020, general meetings of the holders of IDBD's debentures were convened (all of the series, each series separately), where the resolution was not to convene a general meeting which includes in the agenda the decision of making immediately repayable the debentures. The meetings of the debenture holders (Series 9 and Series 15), each decided to pass the said resolution; The meeting of the debenture holders (Series 14), decided not to pass the said resolution, and at a later stage instruct the trustee for debenture holders (Series 14) to postpone the date of the said meeting to September 17, 2020;  
 
In July 2020, Dolphin Netherlands and the controlling interest therein, Mr. Eduardo Elsztain committed vis-à-vis the generality of the debenture holders in IDBD, that subject to defined terms and conditions, during a certain period of time, some transactions would not be executed and/or initiated and/or promoted, and that subject to the provisions of the law, the power of control in corporations that are controlled by the controlling interest in IDBD would not be operated in order to promote any of those actions, unless notification has been delivered in writing to the trustees for debenture holders (Series 9, 14 and 15), at least 14 business days in advance.
 
On August 31, 2019, IDBD 's Audit Committee and the Board of Directors approved the acceptance of an irrevocable commitment by Dolphin Netherlands B.V. (“Dolphin Netherlands”), the controlling interest in IDBD, to make capital injections into IDBD in an overall amount of NIS 210 million, in three equal annual payments on September 2 in each of the years 2019 to 2021, which would be made in consideration for shares in IDBD or as a subordinated loan on similar terms to the subordinated loans that had been provided by the controlling interest.
 
In August 2020, IDBD received a letter from Dolphin Netherlands stating, inter alia, that given the fact that some of IDBD's bondholders are expected to include in their agenda for the bondholders' meetings, a proposal to make the outstanding balances of their bonds immediately due and payable, in preparation for the additional inflow of NIS 70 million scheduled for September 2, 2020, Dolphin Netherlands would examine its undertaking towards IDBD, taking into account the questions that arise from IDBD’s bondholders conducts and intentions. To the said Dolphin Netherlands' letter was attached a letter from IRSA to Dolphin Netherlands, according to which, among other things, IRSA would consider the validity of its undertaking to Dolphin Netherlands to transfer to it (in accordance with Dolphin Netherlands’ request) the amounts required for Dolphin Netherlands to meet its commitment to carry out the capital injections into IDBD on September 2, 2020, as aforementioned.
 
IDBD responded to Dolphin Netherlands’ and IRSA’s letters, noting that, among other things, Dolphin Netherlands' commitment (dated August 29, 2019) towards IDBD is binding and irrevocable, and that there is no basis for not making the capital injections into IDBD, due to other events related to IDBD’s bondholders, which do not fall within the scope of the events listed in the wording of the commitment as expropriating the validity of Dolphin Netherlands' commitment. In addition, it was also mentioned in IDBD’s response letter, that failure to make the payments into IDBD is not acceptable and would leave IDBD with no other choice than to use all its power and rights according to the law to enforce Dolphin Netherlands' commitment as well as IRSA’s undertaking.
 
Following the above mentioned, on September 13, 2020, IDBD submitted a statement of claim against Dolphin Netherlands and against IRSA, in which it has sought to require them to pay it an amount of NIS 70 million (with the addition of linkage differentials and interest in accordance with the law). In tandem with the submission of the lawsuit, as aforesaid, IDBD submitted an urgent petition for placing temporary attachments (in the presence of one party) on Dolphin Netherlands and IRSA (which was not accepted by the Court in the presence of one party and which has been passed on for the respondents to respond to the petition).
 
On June 2, 2020, IDBD received a draft proposal from Dolphin IL for IDBD and for the trustees for IDBD’s debentures (Series 9, 14 and 15) for the strengthening of IDBD 's capital structure, by way of an arrangement between Dolphin, IDBD and the debenture holders, based on an economic contribution to IDBD on Dolphin IL's part, together with a full or partial (as the case may be) redemption of the generality of IDBD's debentures. On June 21, 2020, IDBD received an updated proposal in relation to the abovementioned proposal and on June 28, 2020, Dolphin IL approached each of the trustees for the debentures with a request to put said proposal, with slight amendments, on the agenda of meetings of the debenture holders.
 
On July 6, 2020, the Meeting of debenture holders (Series 9) decided to order the trustee for debenture holders (Series 9) not to accept Dolphin IL's offer.; On July 7, 2020, the Meeting of the debenture holders (Series 14) decided to negotiate for a fixed period of one month in connection with Dolphin IL's proposal, and on July 8, 2020, the Meeting of debenture holders (Series 15) made a similar decision.
 
On September 2, 2020 IDBD received an updated offer from Dolphin IL which was addressed to it and to IDBD’s debenture holders (Series 9, 14 and 15). On September 9, 2020, Dolphin IL updated the commercial terms of its proposal for debenture holders (Series 9), and on September 16, 2020, IDBD received binding offers to debenture 
 
 
F-11
 
holders (Series 14) and debenture holders (Series 15), for the purchase of DIC shares pledged in favor of debenture holders (Series 14) of IDBD, as part of an agreed realization process.
 
As no agreement has been reached, on September 17, 2020, the Series 9 trustee submitted to the District Court in Tel-Aviv-Jaffa (the "Court") a petition to grant an order for the opening of proceedings for IDBD pursuant to the Insolvency and Economic Rehabilitation Law, 5778 – 2018 and to instruct the appointment of a trustee for IDBD pursuant to Section 43 and to grant the trustee any and all authority over the decision making of IDBD (the “Petition”).
 
On September 21, 2020, the Series 14 bondholders approved the immediate fully payment of the remaining balances of such series.
 
On September 22, 2020, IDBD and Dolphin Netherlands submitted an initial response to the Petition, arguing that it is in the best interest of IDBD and its creditors to exhaust the negotiations among the controlling shareholder and its creditors during a short period with the aim to maximize the value of its assets, avoid costs and additional negative effects.
 
In addition, responses by the Series 14 trustee and the Series 15 trustee were filed requesting the enforcement of liens and the appointment of a receiver as well as an urgent hearing, which was scheduled for September 24, 2020.
 
On September 25, 2020, the Court resolved that IDBD is insolvent and therefore it resolved to grant all three orders requested and accordingly, issued an order for the initiation of proceedings and liquidation of IDBD, and has appointed a liquidator to IDBD and interim receivers over the pledged DIC and Clal Shares.
 
 Under IFRS 10 “Consolidated Financial Statements” (“IFRS 10”), an investor controls an investee if and only if the investor has all the following: a) power over the investee; b) exposure, or rights, to variable returns from its involvement with the investee; and c) the ability to use its power over the investee to affect the amount of the investor’s returns. Based on the facts and circumstances outlined above, management believe that, as from September 25, 2020, IRSA lost control over IDBD and DIC (as this term is defined by IFRS 10). Accordingly, the Group’s investment in IDBD and DIC has been deconsolidated in its consolidated financial statements as of and for the three-month period ended September 30, 2020.
 
As further described in Note 1.A), these financial statements have been recast to reflect the loss of control over IDBD and DIC. Accordingly, activities from the Israel Operations Center have been presented in separate line items under “discontinued operations” in the consolidated statements of Income and Comprehensive Income and of Cash Flows for the years ended June 30, 2020, 2019 y 2018. Assets and liabilities from the Israel Operations Center have been presented on a consolidated basis in the Consolidated Statements of Financial Position as of June 30, 2020 and 2019, totaling net assets of Ps. 2,160. (amount attributable to the controlling shareholder) as of June 30, 2020, from which the currency translation adjustment reserve associated of $ 1.657 should be deducted.
 
The assets and liabilities consolidated in this financial statement are as follow:
Current assets: Ps.203,058
Non-current assets: Ps.275,451
Current liabilities: Ps.109,729
Non-current liabilities: Ps.322,050
Total equity: Ps.46,730
Equity Attributable to equity holders of the parent: Ps.2,160
 
The commitments and other restrictions resulting from the indebtedness of IDBD and DIC have no effect on IRSA since said indebtedness has no recourse against IRSA, nor has IRSA guaranteed it with its assets.
 
2.
Summary of significant accounting policies
 
2.1.
Basis of preparation of the Consolidated Financial Statement
 
(a)
Basis of preparation
 
These Consolidated Financial Statements have been prepared in accordance with IFRS issued by IASB and interpretations issued by the IFRIC. All IFRS applicable as of the date of these Consolidated Financial Statements have been applied.
 
IAS 29 "Financial Reporting in Hyperinflationary Economies" requires that the financial statements of an entity whose functional currency is one of a hyperinflationary economy be expressed in terms of the current unit of measurement at the closing date of the reporting period, regardless of whether they are based on the historical cost method or the current cost method. To do so, in general terms, the inflation produced from the date of acquisition or from the revaluation date, as applicable, must be calculated in the non-monetary items. This requirement also includes the comparative information of the financial statements.
 
In order to conclude on whether an economy is categorized as hyper-inflationary in the terms of IAS 29, the standard details a series of factors to be considered, including the existence of an accumulated inflation rate in three years that is approximate or exceeds 100%. It is for this reason that, in accordance with IAS 29, Argentina must be considered a country with high inflation economy starting July 1, 2018.
 
 
F-12


In addition, Law No. 27,468 (published in the Official Gazette on December 4, 2018), amended Section 10 of Law No. 23,928, as amended, and established that the derogation of all the laws or regulations imposing or authorizing price indexation, monetary restatement, cost variation or any other method for strengthening debts, taxes, prices or rates of goods, works or services, does not extend to financial statements, as to which the provisions of Section 62 of the General Companies Law No. 19,550 (1984 revision), as amended, shall continue to apply. Moreover, the referred law repealed Decree No. 1269/2002 dated July 16, 2002, as amended, and delegated to the Argentine Executive Branch the power to establish, through its controlling agencies, the effective date of the referred provisions in connection with the financial statements filed with it. Therefore, under General Resolution 777/2018 (published in the Official Gazette on December 28, 2018) the Argentine Securities Commission (CNV) ordered that issuers subject to its supervision shall apply the inflation adjustment to reflect the financial statements in terms of the measuring unit current at the end of the reporting period set forth in IAS 29 in their annual, interim and special financial statements closed on or after December 31, 2018. Thus, these financial statements have been reported in terms of the measuring unit current as of June 30, 2020 accordingly to IAS 29.
 
Pursuant to IAS 29, the financial statements of an entity whose functional currency is that of a high inflationary economy should be reported in terms of the measuring unit current as of the reporting date of the financial statements. All the amounts included in the statement of financial position which are not stated in terms of the measuring unit current as of the date of the financial statements should be restated applying the general price index. All items in the statement of income should be stated in terms of the measuring unit current as of the date of the financial statements, applying the changes in the general price index occurred from the date on which the revenues and expenses were originally recognized in the financial statements.
 
Adjustment for inflation in the initial balances has been calculated considering the indexes reported by the FACPCE based on the price indexes published by the Argentine Institute of Statistics and Census (INDEC).
 
The principal inflation adjustment procedures are the following:
 
Monetary assets and liabilities that are already recorded at the measuring unitas of the balance sheet’s closing date are not restated because they are already stated in terms of the mesuring unit current as of the date of the financial statements.
Non-monetary assets, and liabilities recorded at cost as of the balance sheet date and equity component are restated by applying the relevant adjustment coefficients.
All items in the statement of income are restated applying the relevant conversion factors.
The effect of inflation in the Company’s net monetary position is included in the statement of income and other comprehensive income/(loss) under Financial results, net, in the item “Inflation adjustment”.
Comparative figures have been adjusted for inflation following the procedure explained in the previous paragraphs.
 
Upon initially applying inflation adjustment, the equity accounts were restated as follows:
 
Capital was restated as from the date of subscription or the date of the most recent inflation adjustment for accounting purposes, whichever is later. The resulting amount was included in the “Comprehensive Inflation adjustment of share capital and treasury shares adjustment” account.
Translation difference was restated in current terms.
Other comprehensive income / (loss) was restated as from each accounting allocation.
The other reserves in the statement of income were restated from the initial application date, i.e., June 30, 2016.
 
In relation to the inflation index to be used and in accordance with the FACPCE Resolution No. 539/18, it will be determined based on the Wholesale Price Index (IPIM) until 2016, considering for the months of November and December 2015 the average variation of Consumer Price indices (CPI) of the Autonomous City of Buenos Aires, because during those two months there were no national IPIM measurements. Then, from January 2017, the National Consumer Price Index (National CPI) will be considered. The tables below show the evolution of these indices in the last two fiscal years and as of June 30, 2020according to official statistics (INDEC) following the guidelines described in Resolution 539/18.
 
Annual price variation
 
June 30, 2018
 
 
June 30, 2019
 
 
June 30, 2020
 
 
Cumulative as of June 30, 2020 (3 years)
 
 
  29%
  56%
  43%
  128%
 
As a consequence of the aforementioned, these financial statements as of June 30, 2020 were restated in accordance with IAS 29.
 
 
F-13
 
 
IDBD and DIC report their quarterly and annual results following the Israeli regulations, whose legal deadlines are after the deadlines in Argentina and since IDBD and DIC fiscal years end differently from IRSA, the results of operations from IDBD and DIC are consolidated with a lag of three months and adjusted for the effects of significant transactions taking place in such period. For these reasons, it is possible to obtain the quarterly results of IDBD and DIC in time so that they can be consolidated by IRSA and reported to the CNV in its consolidated financial statements within the legal deadlines set in Argentina. This way, the Group's consolidated comprehensive income for the year ended June 30, 2020 includes the results of IDBD´s and DIC´s transactions for the 12-month period from April 1, 2019 to March 31, ,2020 adjusted for the significant transactions that occurred between April 1, 2020 and June 30, 2020.
 
(b)
Current and non-current classification
 
The Group presents current and non-current assets, and current and non-current liabilities, as separate classifications in its Statement of Financial Position according to the operating cycle of each activity. Current assets and current liabilities include the assets and liabilities that are either realized or settled within 12 months from the end of the fiscal year.
 
All other assets and liabilities are classified as non-current. Current and deferred tax assets and liabilities (income tax liabilities) are presented separately from each other and from other assets and liabilities, classified as current and non-current, respectively.
 
(c)
Presentation currency
 
The Consolidated Financial Statements are presented in millions of Argentine Pesos. Unless otherwise stated or the context otherwise requires, references to ‘Peso amounts’ or ‘Ps.’, are millions of Argentine Pesos, references to ‘US$’ or ‘US Dollars’ are millions of US Dollars and references to "NIS" are millions of New Israeli Shekel. As of June 30, 2020 and 2019, the exchange rate between the Argentine Peso and the NIS was Ps. 21.568 and Ps. 13 per NIS respectively.
 
(d)
Fiscal year-end
 
The fiscal year begins on July 1st and ends on June 30 of each year.
 
(e)
Accounting criteria
 
See Notes 2.2 to 2.28 with the accounting policies of each item.
 
(f)
Reporting cash flows
 
The Group reports operating activities cash flows using the indirect method. Interest paid is presented within financing activities. Interest received for financing of operating activities is presented within operating activities whereas the rest is presented within investing activities. The acquisitions and disposals of investment properties are disclosed within investing activities as this most appropriately reflects the Group’s business activities. Cash flows in respect to trading properties are disclosed within operating activities because these items are sold in the ordinary course of business.
 
(g)
Use of estimates
 
The preparation of Financial Statements at a certain date requires the Management to make estimations and evaluations affecting the amount of assets and liabilities recorded and contingent assets and liabilities disclosed at such date, as well as income and expenses recorded during the year. Actual results might differ from the estimates and evaluations made at the date of preparation of these Consolidated Financial Statements. The most significant judgments made by Management in applying the Group’s accounting policies and the major estimations and significant judgments are described in Note 3.
 
2.2.
New accounting standards
 
The following standards and amendments have been issued by the IASB. Below we outline the standards and amendments that may potentially have an impact on the Group at the time of application.
 
Standards and amendments adopted by the Group
 
 
F-14
IRSA Inversiones y Representaciones Sociedad Anónima


Standards and amendment
Description
 
Date of mandatory adoption for the Group in the year ended on
 
IFRS 16 "Leases".
Lessees are required to account for all leases under one single model in the balance sheet that is similar to the one used to account for financial leases under IAS 17, including two exceptions for the recognition of leases; low-cost asset leases and short-term leases. Accounting by the lessor has no significant changes.
 
  06-30- 2020 
 Amendment to IAS 28 “Investment in associates and joint ventures”
Requires the adoption of IFRS 9 regarding long-term investments that are essentially part of the net investment of an entity in an associate or joint venture.
 
  06-30- 2020 
Definition of Material - Amendments to IAS 1 and IAS 8
 The IASB has made modifications to IAS 1 “Presentation of Financial Statements” and IAS 8“Accounting policies, changes in accounting estimates and errors” and which requires that the assessment of materiality be consistent for the application of IFRS.
 
  06-30-2020 
Defining a business - Amendments to IFRS 3
The new business definition requires that a business combination contribute significantly to creating products or services.
 
  06-30-2020 
Amendments to IAS 19- Plan amendment, curtailment or settlement.
Clarifies the accounting for defined benefit plan amendments, curtailments or settlements. The amendments require an entity to: (i) determine current service cost and net interest for the remainder of the period after a plan amendment, curtailment or settlement, using updated assumptions at the time of the amendment; (ii) recognize any reduction in a surplus immediately in gains or losses, as part of past service cost or a gain or loss on settlement. In other words, any surplus reduction must be recognized, even if that surplus was not previously recognized because of the impact of the asset ceiling; and (iii) separately recognize any change in the asset ceiling through other comprehensive income.
 
  06-30-2019 
 
The adoption of these standards and amendments has not had a material impact for the Group. Except for the following:
 
IFRS 16: Leases
 
The standard establishes the criteria for recognition and valuation of leases for lessees and lessors. The changes incorporated mainly impact the tenant's accounting. IFRS 16 provides that the lessee recognizes an asset for the right of use and a liability at present value with respect to those contracts that meet the definition of lease agreements according to IFRS 16. In accordance with the standard, a lease agreement is one that provides the right to control the use of an identified asset for a specific period. In order for a company to have control over the use of an identified asset: a) it must have the right to obtain substantially all the economic benefits of the identified asset and b) it must have the right to direct the use of the identified asset.
 
The standard allows excluding the short-term contracts (under 12 months) and those in which the underlying asset has low value, such option has been adopted by the Group. Likewise, the Group has opted to recognize as consideration for the right of use, the amount of Ps. 15,661 as lease liabilities. The commitments under operating leases reported in our consolidated financial statements as of June 30, 2019, amounted to Ps. 17,381 (such difference mainly corresponds to the effect of the discount from future payments and the excluded short-term contracts).
 
Modification to IAS 28 “Investment in associates and joint ventures”
 
In accordance with the amendment to IAS 28, an entity shall implement the provisions of IFRS 9 to Long-term Investments that are essentially part of the entity's net investment in the associate or in the joint venture according to the definitions of said standard. The provisions of IFRS 9 shall apply to such investments with respect to the participation in the losses of an associate or a joint venture, as well as with respect to the recognition of the impairment of an investment in an associate or joint venture. In addition, when applying IFRS 9 to such long-term investments, the entity will make it prior to the adjustments made to the carrying amount of the investment in accordance with IAS 28.
 
The Group opted for an accounting policy where the currency translation adjustments arising from these loans are recorded as part of other comprehensive income.
 
 
F-15
 
 
The effect on retained earnings as of July 1, 2019 arising from the initial adoption of IFRS 16 and IAS 28 is as follows:


07.01.2019


Implementación NIIF 16
 
 
Implementación IAS 28
 
 
Total
 
ASSETS


Non- Current Assets


Investment properties
  459 
  - 
  459 
Right-of-use assets
  15,205 
  - 
  15,205 
Investments in associates and joint ventures
  - 
  (2,131)
  (2,131)
Trade and other receivables
  87 
  - 
  87 
Total Non-Current Assets
  15,751 
  (2,131)
  13,620 
Current assets
  - 
  - 
  - 
Income tax and MPIT credit
  18 
  - 
  18 
Trade and other receivables
  (183)
  - 
  (183)
Group of assets held for sale
  3,360 
  - 
  3,360 
Total current assets
  3,195 
  - 
  3,195 
TOTAL ASSETS
  18,946 
  (2,131)
  16,815 
SHAREHOLDERS’ EQUITY
  - 
  - 
  - 
Capital and reserves attributable to equity holders of the parent
  - 
  - 
  - 
Retained earnings
  (201)
  (1,205)
  (1,406)
Total capital and reserves attributable to equity holders of the parent
  (201)
  (1,205)
  (1,406)
Non-controlling interest
  - 
  (926)
  (926)
TOTAL SHAREHOLDERS’ EQUITY
  (201)
  (2,131)
  (2,332)
LIABILITIES
  - 
  - 
  - 
Non-Current Liabilities
  - 
  - 
  - 
Lease liabilities
  11,435 
  - 
  11,435 
Total Non-Current Liabilities
  11,435 
  - 
  11,435 
Current Liabilities
  - 
  - 
  - 
Lease liabilities
  4,225 
  - 
  4,225 
Trade and other payables
  (96)
  - 
  (96)
Group of liabilities held for sale
  3,583 
  - 
  3,583 
Total Current Liabilities
  7,712 
  - 
  7,712 
TOTAL LIABILITIES
  19,147 
  - 
  19,147 
TOTAL SHAREHOLDERS’ EQUITY AND LIABILITIES
  18,946 
  (2,131)
  16,815 
 
 
F-16
 
 
Standards and amendments not yet adopted by the Group:
 
Standards and amendment
Description
 
Date of mandatory adoption for the Group in the year ended on
 
Covid-19- related lease concessions – Amendments to IFRS 16
As a result of the COVID-19 pandemic, lessees have been granted lease concessions. Such concessions may take a variety of forms, including forgiveness or deferral of rental payments. In May 2020, the IASB amended IFRS 16 – Leases, whereby lessees are permitted to account for the rent concessions as if they were not lease modifications. In several cases, this will result in such concessions being accounted for as variable rent payments within the period in which they are granted.
  06-30- 2021 
 Property, Plant and Equipment: Proceeds before Intended Use – Amendments to IAS 16
Amendment to IAS 16 – Property, Plant and Equipment (PP&E) prohibits deducting from the cost of an item of property, plant and equipment any proceeds from selling items produced while the entity is preparing the asset for its intended use. It also specifies that an entity is “testing whether an item of PPE is functioning properly” when it assesses its technical and physical performance. The financial performance of the asset is not relevant for such assessment.
  06-30- 2023 
Reference to the Conceptual Framework – Amendments to IFRS 3
Some minor amendments were made to IFRS 3 Business combinations to update references to the Conceptual Framework for financial information and add an exception to the recognition principles for liabilities and contingent liabilities within the scope of IAS 37, Provisions, Contingent liabilities and contingent assets and interpretation 21 Levies. The amendments also confirm that contingent assets should not be recognized on the acquisition date.
  06-30-2023 
Annual Improvements to IFRS 2018-2020
The following improvements were issued in May 2020:
IFRS 9 Financial instruments. The amendment clarifies which fees an entity includes when it applies the ‘10 per cent’ test in assessing whether to derecognize a financial liability.
IFRS 16 Leases. The amendment to Illustrative Example 13 removes from the example the illustration of the reimbursement of leasehold improvements by the lessor in order to resolve any potential confusion regarding the treatment of lease incentives that might arise.
IFRS 1 First-time adoption of International Financial Reporting Standards: Entities that have measured their assets and liabilities at the carrying amounts in their parents´ books are also allowed to measure cumulative translation differences using the amounts reported by their parents. This amendment will also apply to associated and joint ventures that have also taken the IFRS 1 exemption.
IAS 41: This amendment removes the requirement for entities to exclude taxation cash flows when measuring the fair value pursuant to IAS 41. This amendment is intended to align with the requirement in the standard to discount cash flows on a post-tax basis.
 
  06-30-2023 
 
The future adoption of these standards and amendments will not have a significant impact on the Group.
 
At the date of issuance of these consolidated financial statements, there are no other standards or modifications issued by the IASB that are not yet effective and are expected to have a significant effect on the Group.
 
2.3.
Scope of consolidation
 
(a)
Subsidiaries
 
Subsidiaries are all entities (including structured entities) over which the Group has control. The Group controls an entity when the Group is exposed to, or has rights to variable returns from its involvement with the entity and has the ability to affect those returns through its power over the entity. The Group also analyzes whether there is control when it does not hold more than 50% of the voting rights of an entity, but does have capacity to define its relevant activities because of de-facto control.
 
The Group uses the acquisition method of accounting to account for business combinations. The consideration transferred for the acquisition of a subsidiary is the fair value of the assets transferred, the liabilities incurred and the equity interests issued by the Group. Acquisition-related costs are expensed as incurred. Identifiable assets acquired and liabilities and contingent liabilities assumed in a business combination are measured initially at their fair values at the acquisition date.
 
The Group recognizes any non-controlling interest in the acquiree on an acquisition-by-acquisition basis either at fair value or at the non-controlling interest’s proportionate share of the acquirer’s net assets. The Group chooses the method to be used on a case-by-case base.
 
The excess of the sum of the consideration transferred, the amount of any non-controlling interest in the acquiree and the acquisition-date fair value of any previous equity interest in the acquiree over the fair value of the identifiable net assets acquired is recorded as goodwill. If the total of consideration transferred, non-controlling interest recognized and previously held interest measured is less than the fair value of the net assets of the subsidiary acquired in the case of a bargain purchase,, the difference is recognized directly in the Statement of Income as “Bargain purchase gains”.
 
The Group conducts its business through several operating and investment companies, the main ones are listed below:
 
 
F-17
IRSA Inversiones y Representaciones Sociedad Anónima


% of ownership interest held by the Group
 
Name of the entity
Country
Main activity
  06.30.2020 
  06.30.2019 
  06.30.2018 
IRSA's direct interest:


IRSA CP (1)
Argentina
Real estate
  80.65%
  83.80%
  86.34%
E-Commerce Latina S.A.
Argentina
Investment
  100.00%
  100.00%
  100.00%
Efanur S.A.
Uruguay
Investment
  100.00%
  100.00%
  100.00%
Hoteles Argentinos S.A.U.
Argentina
Hotel
  100.00%
  100.00%
  80.00%
Inversora Bolívar S.A.
Argentina
Investment
  100.00%
  100.00%
  100.00%
Llao Llao Resorts S.A. (2)
Argentina
Hotel
  50.00%
  50.00%
  50.00%
Nuevas Fronteras S.A.
Argentina
Hotel
  76.34%
  76.34%
  76.34%
Palermo Invest S.A.
Argentina
Investment
  100.00%
  100.00%
  100.00%
Ritelco S.A.
Uruguay
Investment
  100.00%
  100.00%
  100.00%
Tyrus S.A.
Uruguay
Investment
  100.00%
  100.00%
  100.00%
U.T. IRSA y Galerias Pacifico (2)
Argentina
Investment
  50.00%
  50.00%
  50.00%
IRSA CP's direct interest:


Arcos del Gourmet S.A.
Argentina
Real estate
  90.00%
  90.00%
  90.00%
Emprendimiento Recoleta S.A.
Argentina
Real estate
  53.68%
  53.68%
  53.68%
Fibesa S.A. (3)
Argentina
Real estate
  100.00%
  100.00%
  100.00%
Panamerican Mall S.A.
Argentina
Real estate
  80.00%
  80.00%
  80.00%
Shopping Neuquén S.A.
Argentina
Real estate
  99.95%
  99.95%
  99.92%
Torodur S.A.
Uruguay
Investment
  100.00%
  100.00%
  100.00%
EHSA
Argentina
Investment
  70.00%
  70.00%
  70.00%
Centro de Entretenimiento La Plata
Argentina
Real estate
  100.00%
  100.00%
  100.00%
Pareto S.A.
Argentina
design and software development
  69.69%
  69.69%
  - 
La Malteria
Argentina
Real estate
  - 
  100.00%
  - 
Tyrus S.A.'s direct interest:


DFL and DN BV
Bermuda’s / Netherlands
Investment
  97.04%
  96.46%
  91.57%
I Madison LLC
USA
Investment
  - 
  - 
  - 
IRSA Development LP
USA
Investment
  - 
  - 
  - 
IRSA International LLC
USA
Investment
  100.00%
  100.00%
  100.00%
Jiwin S.A.
Uruguay
Investment
  100.00%
  100.00%
  100.00%
Liveck S.A. (7)
Uruguay
Investment
  100.00%
  100.00%
  100.00%
Real Estate Investment Group V LP (REIG V)
Bermuda’s
Investment
  - 
  100.00%
  100.00%
Real Estate Strategies LLC
USA
Investment
  100.00%
  100.00%
  100.00%
Efanur S.A.'s direct interest:


Real Estate Investment Group VII LP (REIG VII)
Bermuda’s
Investment
  100.00%
  100.00%
  100.00%
DFL's and DN BV's direct interest:


IDB Development Corporation Ltd.
Israel
Investment
  100.00%
  100.00%
  100.00%
Dolphin IL Investment Ltd.
Israel
Investment
  100.00%
  100.00%
  100.00%
DIL's direct interest:


Discount Investment Corporation Ltd. (4)
Israel
Investment
  83.72%
  83.77%
  76.57%
IDBD's direct interest:


IDB Tourism (2009) Ltd.
Israel
Tourism services
  100.00%
  100.00%
  100.00%
IDB Group Investment Inc
Israel
Investment
  100.00%
  100.00%
  100.00%
DIC's direct interest:


Property & Building Corporation Ltd.
Israel
Real estate
  72.40%
  68.80%
  64.40%
Cellcom Israel Ltd. (5)
Israel
Telecommunications
  46.20%
  44.10%
  43.14%
Elron Electronic Industries Ltd.
Israel
Investment
  61.06%
  61.06%
  50.30%
Bartan Holdings and Investments Ltd.
Israel
Investment
  55.68%
  55.68%
  55.68%
Epsilon Investment House Ltd.
Israel
Investment
  68.75%
  68.75%
  68.75%
Mehadrin Ltd (8)
Israel
Agricultural
  43.75%
  - 
  - 
PBC's direct interest:


Gav-Yam Bayside Land Corporation Ltd. (6)
Israel
Real estate
  - 
  51.70%
  51.70%
Ispro The Israeli Properties Rental Corporation Ltd.
Israel
Real estate
  100.00%
  100.00%
  100.00%
Matam - Scientific Industries Center Haifa Ltd.
Israel
Real estate
  50.10%
  50.10%
  50.10%
Hadarim Properties Ltd.
Israel
Real estate
  100.00%
  100.00%
  100.00%
Property & Building (Commercial Centers) Ltd.
Israel
Real estate
  100.00%
  100.00%
  100.00%
PBC USA Investments Inc
USA
Real estate
  100.00%
  100.00%
  100.00%
 
(1) Includes interest held through E-Commerce Latina S.A. and Tyrus S.A..
(2)
The Group has consolidated the investment in Llao Llao Resorts S.A. and UT IRSA and Galerías Pacífico considering its equity interest and a shareholder agreement that confers it majority of votes in the decision-making process.
(3) Includes interest held through Ritelco S.A. and Torodur S.A.
(4) Includes Tyrus' equity interest.
(5)
DIC considers it exercises effective control over Cellcom because DIC is the group with the higher percentage of votes (48.5%) vis-à-vis other shareholders, also taking into account the historic voting performance in the Shareholders’ Meetings, as well as the evaluation of the holdings of the remaining shareholders, which are highly atomized.
(6)
Control was lost in September 2019. See Note 4.C.
(7)
Includes Tyrus’ and IRSA S.A.’s equity interests.
(8)
DIC considers that it exercises control because DIC is the group with the higher percentage of votes (43.75%) vis-à-vis other shareholders that are highly atomized.
Except for the aforementioned items the percentage of votes does not differ from the stake.
 
The Group takes into account both quantitative and qualitative aspects in order to determine which non-controlling interests in subsidiaries are considered significant.
 
(b)
Changes in ownership interests in subsidiaries without change of control
 
Transactions with non-controlling interests that do not result in loss of control are accounted for as equity transactions – i.e., as transactions with the owners in their capacity as owners. The recorded value corresponds to the difference between the fair value of the consideration paid and/or received and the relevant share acquired and/or transferred of the carrying value of the net assets of the subsidiary.
 
(c)
Disposal of subsidiaries with loss of control
 
F-18
 
 
When the Group ceases to have control any retained interest in the entity is re-measured at its fair value at the date when control is lost, with changes in carrying amount recognized in profit or loss. The fair value is the initial carrying amount for the purposes of subsequently accounting for the retained interest as an associate, joint venture or financial asset. In addition, any amounts previously recognized in other comprehensive income in respect of that entity are accounted for as if the Group had directly disposed of the related assets or liabilities. This may mean that amounts previously recognized in other comprehensive income are reclassified to profit or loss.
 
(d)
Associates
 
Associates are all entities over which the Group has significant influence but not control, usually representing an interest between 20% and at least 50% of the voting rights. Investments in associates are accounted for using the equity method of accounting, except as otherwise indicated as explained below. Under the equity method, the investment is initially recognized at cost, and the carrying amount is increased or decreased to recognize the investor’s share of the profit or loss of the investee after the date of acquisition. The Group’s investment in associates includes goodwill identified on acquisition.
 
As of each year-end or upon the existence of evidence of impairment, a determination is made as to whether there is any objective indication of impairment in the value of the investments in associates. If this is the case, the Group calculates the amount of impairment as the difference between the recoverable amount of the Associates and its carrying value and recognizes the amount adjacent to "Share of profit / (loss) of associates and joint ventures " in the Statement of Income and Other Comprehensive Income.
 
Profit and losses resulting from transactions between the Group and the associate are recognized in the Group's financial statements only to the extent of the interests in the associates of the unrelated investor. Unrealized losses are eliminated unless the transaction reflects signs of impairment of the value of the asset transferred. The accounting policies of associates are modified to ensure uniformity within Group policies.
 
Note 8 includes summary financial information and other information of the Group's associates.
 
The Group takes into account quantitative and qualitative aspects to determine which investments in associates are considered significant.
 
(e)
Joint arrangements
 
Joint arrangements are arrangements of which the Group and other party or parties have joint control bound by a contractual arrangement. Under IFRS 11, investments in joint arrangements are classified as either joint ventures or joint operations depending on the contractual rights and obligations each investor has rather than the legal structure of the joint arrangement. A joint venture is a joint arrangement whereby the parties that have joint control of the arrangement have rights to the net assets of the arrangement. A joint operation is a joint arrangement whereby the parties that have joint control of the arrangement have rights to the assets, and obligations for the liabilities, relating to the arrangement. The Group has assessed the nature of its joint arrangements and determined them to be joint ventures.
 
Investments in joint ventures are accounted for under the equity method. Under the equity method of accounting, interests in joint ventures are initially recognized in the Consolidated Statements of Financial Position at cost and adjusted thereafter to recognize the Group’s share of post-acquisition profits or losses and other comprehensive income in the Statements of Income and Other Comprehensive Income.
 
The Group determines at each reporting date whether there is any objective evidence that the investment in a joint ventures is impaired. If this is the case, the Group calculates the amount of impairment as the difference between the recoverable amount of the joint venture and its carrying value and recognizes such difference in "Share of profit / (loss) of associates and joint ventures" in the Statements of Income.
 
 
F-19


2.4.
Segment information
 
Operating segments are reported in a manner consistent with the internal reporting provided to the Chief Operating Decision-Maker (“CODM”), responsible for allocating resources and assessing performance. The operating segments are described in Note 6.
 
2.5.
Foreign currency translation
 
(a)
Functional and presentation currency
 
Items included in the Financial Statements of each of the Group’s entities are measured using the currency of the primary economic environment in which the entity operates (‘the functional currency’). The Consolidated Financial Statements are presented in Argentine Pesos, which is the Group’s presentation currency.
 
(b)
Transactions and balances in foreign currency
 
Foreign currency transactions are translated into the functional currency using the exchange rates prevailing at the dates of the transactions. Foreign exchange gains and losses resulting from the settlement of such transactions and from the translation at year-end exchange rates of monetary assets and liabilities nominated in foreign currencies are recognized in the profit or loss for the year.
 
Foreign exchange gains and losses are presented in the Statement of Income within other financial income, as appropriate, unless they have been capitalized.
 
(c)
Group companies
 
The results and financial position of all the Group entities (none of which has the currency of a hyperinflationary economy) that have a functional currency different from the presentation currency are translated into the presentation currency as follows:
 
(i)
assets, liabilities and goodwill for each Statement of Financial Position presented are translated at the closing rate at the date of that financial position;
(ii)
income and expenses for each Statement of Comprehensive Income are translated at average exchange rates (unless this average is not a reasonable approximation of the cumulative effect of the rates prevailing on the transaction dates, in which case income and expenses are translated at the rate on the dates of the transactions); and
(iii)
all resulting exchange differences are recognized in the Statement of Comprehensive Income.
 
The accounting policy of the Group consists in accounting for the translation difference of its subsidiaries by the “step-by-step” method according to IAS 21.
 
2.6.
Investment properties
 
Investment properties are those properties owned by the Group that are held either to earn long-term rental income or for capital appreciation, or both, and that are not occupied by the Group for its own operations. Investment property also includes property that is being constructed or developed for future use as investment property. The Group also classifies as investment properties land whose future use has not been determined yet. The Group’s investment properties primarily comprise the Group’s portfolio of shopping malls and offices, certain property under development and undeveloped land.
 
Where a property is partially owner-occupied, with the rest being held for rental income or capital appreciation, the Group accounts for the portions separately. The portion that is owner-occupied is accounted for as property, plant and equipment under IAS 16 “Property, Plant and Equipment” and the portion that is held for rental income or capital appreciation, or both, is treated as investment properties under IAS 40 “Investment Properties”.
 
Investment properties are measured initially at cost. Cost comprises the purchase price and directly attributable expenditures, such as legal fees, certain direct taxes, commissions and in the case of properties under construction, the capitalization of financial costs.
 
For properties under development, capitalization of costs includes not only financial costs, but also all costs directly attributable to works in process, from commencement of construction until it is completed and property is in condition to start operating.
 
 
F-20
 
 
Direct expenses related to lease contract negotiation (such as payment to third parties for services rendered and certain specific taxes related to execution of such contracts) are capitalized as part of the book value of the relevant investment properties and amortized over the term of the lease.
 
Borrowing costs associated with properties under development or undergoing major refurbishment are capitalized. The finance cost capitalized is calculated using the Group’s weighted average cost of borrowings after adjusting for borrowings associated with specific developments. Where borrowings are associated with specific developments, the amount capitalized is the gross interest incurred on those borrowings less any investment income arising on their temporary investment. Finance cost is capitalized from the commencement of the development work until the date of practical completion. Capitalization of finance costs is suspended if there are prolonged periods when development activity is interrupted. Finance cost is also capitalized on the purchase cost of land or property acquired specifically for redevelopment in the short term but only where activities necessary to prepare the asset for redevelopment are in progress.
 
After initial recognition, investment property is carried at fair value. Investment property that is being redeveloped for continuing use as investment property or for which the market has become less active continues to be measured at fair value. Investment properties under construction are measured at fair value if the fair value is considered to be reliably determinable. On the other hand, properties under construction for which the fair value cannot be determined reliably, but for which the Group expects it to be determinable when construction is completed, are measured at cost less impairment until the fair value becomes reliably determinable or construction is completed, whichever is earlier.
 
Fair values are determined differently depending on the type of property being measured.
 
Generally, for the Operations Center in Argentina, fair value of office buildings and land reserves is based on active market prices, adjusted, if necessary, for differences in the nature, location or condition of the specific asset. If this information is not available, the Group uses alternative valuation methods, such as recent prices on less active markets or discounted cash flow projections. Fair value of office building for the Operations Center in Israel is based on discounted cash flow projections.
 
The fair value of the Group’s portfolio of Shopping Malls is based on discounted cash flow projections. This method of valuation is commonly used in the shopping mall industry in the region where the Group conducts its operations.
 
The fair value of office buildings in the Operations Center in Israel is based on discounted cash flow projections.
 
As required by CNV 576/10 Resolution, valuations are performed as of the financial position date by accredited externals appraisers who have recognized professional qualifications and have recent experience in the location and category of the investment property being valued. These valuations form the basis for the carrying amounts in the Consolidated Financial Statements. The fair value of investment property reflects, among other things, rental income from current leases and other assumptions market participants would make when pricing the property under current market conditions.
 
Subsequent expenditures are capitalized to the asset’s carrying amount only when it is probable that future economic benefits associated with the expenditure will flow to the Group and the cost can be measured reliably. All other repairs and maintenance costs are expensed when incurred. When part of an investment property is replaced, the carrying amount of the replaced part is derecognized.
 
Changes in fair values are recognized in the Statement of Income under the line item “Net gain or (loss) from fair value adjustment of investment properties”.
 
Asset transfers, including assets classified as investments properties which are reclassified under other items or vice-versa, may only be carried out when there is a change of use evidenced by: a) commencement of occupation of real property by the Group, where investment property is transferred to property, plant and equipment; b) commencement of development activities for sale purposes, where investment property is transferred to property for sale; c) the end of Group occupation, where it is transferred from property, plant and equipment to investment properties; or d) commencement of an operating lease transaction with a third party, where properties for sale are transferred to investment property. The value of the transfer is the one that the property had at the time of the transfer and subsequently is valued in accordance with the accounting policy related to the item.
 
The Group may sell its investment property when it considers that such property no longer forms part of the lease business. The carrying value immediately prior to the sale is adjusted to the transaction price, and the adjustment is
 
 
F-21
 
 
recorded in the Statement of Income and other comprehensive income in the line “Net gain from fair value adjustments of investment properties”.
 
Investment properties are derecognized when they are disposed of or when they are permanently withdrawn from use and no future economic benefits are expected to arise from their disposals. The disposal of properties is recognized when the significant risks and rewards have been transferred to the buyer. As for unconditional agreements, proceeds are accounted for when title to property passes to the buyer and the buyer intends to make the respective payment. In the case of conditional agreements, disposal are accounted for when the conditions the agreements is subject to has been met.. Where consideration receivable for the sale of the properties is deferred, it is discounted to present value. The difference between the discounted amount and the amount receivable is treated as interest income and recognized over the period using the effective interest method. Direct expenses related to the sale are recognized in the line "Other operating results, net" in the Statement of Income at the time they are incurred.
 
2.7.
Property, plant and equipment
 
This category primarily comprises, buildings or portions of a building used for administrative purposes, machines, computers, and other equipment, motor vehicles, furniture, fixtures and fittings and improvements to the Group’s corporate offices.
 
The Group has also several hotel properties. Based on the respective contractual arrangements with hotel managers and / or given their direct operators nature, the Group considers it retains significant exposure to the variations in the cash flows of the hotel operations, and accordingly, hotels are treated as owner-occupied properties and classified under "Property, plant and equipment".
 
All property, plant and equipment (“PPE”) is stated at acquisition cost less accumulated depreciation and impairment, if any. The acquisition cost includes expenditures which are directly attributable to the acquisition of the items. For properties under development, capitalization of costs includes not only financial costs, but also all costs directly attributable to works in process, from commencement of construction until it is completed and the property is in conditions to start operating.
 
 
Subsequent costs are included in the asset’s carrying amount or recognized as a separate asset, as appropriate, only when it is probable that future economic benefits associated with the item will flow to the Group and the cost of the item can be measured reliably. Such costs may include the cost of improvements and replacement of parts as they meet the conditions to be capitalized. The carrying amount of those parts that are replaced is derecognized. Repairs and maintenance are charged as incurred in the Statement of Income. Depreciation, based on a component approach, is calculated using the straight-line method to allocate the cost over the assets’ estimated useful lives.
 
The remaining useful life as of June 30, 2020 is as follows:
 
Buildings and facilities
Between 5 and 50 years
Machinery and equipment
Between 3 and 24 years
Communication networks
Between 4 and 20 years
Others
Between 3 and 25 years
 
As of each fiscal year-end, an evaluation is performed to determine the existence of indicators of any decrease in recoverable value or useful life of assets. If there are any indicators, the recoverable amount and/or residual useful life of impaired asset(s) is estimated, and an impairment adjustment is made, if applicable. As of each fiscal year-end, the residual useful life of assets is estimated and adjusted, if necessary. The book amount of an asset is reduced to its recoverable value if the book value greater than its estimated recoverable value.
 
Gains from the sale of these assets are recognized when the significant risks and rewards have transferred to the buyer. This will normally take place on unconditional exchange, generally when legal title passes to the buyer and it is probable that the buyer will pay. For conditional exchanges, sales are recognized when these conditions are satisfied. Gains and losses on disposals are determined by comparing the proceeds net of direct expenses related to such sales, with the carrying amount as of the date of each transaction. Gains and losses from the disposal of property, plant and equipment items are recognized within “Other operating results, net” in the Statement of Income.
 
When assets of property, plant and equipment are transferred to investment property, the difference between the value at cost transferred and the fair value of the investment property is allocated to a reserve within equity.
 
 
F-22
 
 
2.8.
Leases
 
Leases are recorded pursuant to IFRS 16. The Group recognizes an asset for the right of use and a liability at present value with respect to those contracts that meet the definition of lease agreements according to IFRS 16. For the prior periods’ leases were classified at their inception as either operating or finance leases based on the economic substance of the agreement.
 
A Group company is the lessor:
 
Properties leased out to tenants under operating leases are included in “Investment Properties” in the Statement of Financial Position. See Note 2.25 for the recognition of rental income.
 
A Group company is the lessee:
 
The Group acquires certain specific assets (especially machinery, computer equipment and real property exploitation concessions) under leases pursuant to IFRS 16. Assets so acquired are recorded as an asset at the present value of the minimum future lease payments. Capitalized lease assets are depreciated over the shorter of the estimated useful life of the assets and the lease term. The finance charges are charged over the lease period so as to produce a constant periodic rate of interest on the remaining balance of the liability for each period.
 
Leases falling within the IFRS 16 exemption, where the Group acts as lessee are charged to results at the time they accrue. They mainly include contracts for less than one year and/or for non-material items.
 
2.9.
Intangible assets
 
(a)
Goodwill
 
Goodwill represents future economic benefits arising from assets that are not capable of being individually identified and separately recognized by the Group on an acquisition. Goodwill is initially measured as the difference between the fair value of the consideration transferred, plus the amount of non-controlling interest in the acquisition and, in business combinations achieved in stages, the acquisition-date fair value of the previously held equity interest in the acquisition; and the net fair value of the identifiable assets and liabilities assumed on the acquisition date.
 
Goodwill is not amortized but tested for impairment at each fiscal year-end, or more frequently if there is an indication of impairment. For the purpose of impairment testing, assets are grouped at the lowest levels for which there are separately identifiable cash flows, referred to as cash-generating units (“CGU”). In order to determine whether any impairment loss should be recognized, the book value of CGU or CGU groups is compared against its recoverable value. Net book value of CGU and CGU groups include goodwill and assets with limited useful life (such as, investment properties, property, plant and equipment, intangible assets and working capital).
 
If the recoverable amount of the CGU is less than the carrying amount of the unit, the impairment loss is allocated first to reduce the carrying amount of any goodwill allocated to the unit and then to the other assets of the unit pro rata on the basis of the carrying amount of each asset in the unit. Impairment losses recognized for goodwill are not reversed in a subsequent period.
 
The recoverable amount of a CGU is the higher of the fair value less costs-to-sell and the value-in-use. The fair value is the amount at which a CGU may be sold in a current transaction between unrelated, willing and duly informed parties. Value-in-use is the present value of all estimated future cash flows expected to be derived from CGU or CGU groups.
 
Goodwill is assigned to the Group's cash generating units on the basis of operating segments. The recoverable amount of a cash generating unit is determined based on fair value calculations. These calculations use the price of the CGU assets and they are compared with the book values plus the goodwill assigned to each cash generating unit.
 
No material impairment was recorded as a result of the analysis performed. (Note 12)
 
(b)
Computer software
 
F-23
 
 
Acquired computer software licenses are capitalized on the basis of the costs incurred to acquire and bring to use the specific software. These costs are amortized over their estimated useful lives of three years. Costs associated with maintaining computer software programs are recognized as an expense as incurred.
 
(c)
Branding and client relationships
 
This relates to the fair value of brands and client relationships arising at the time of the business combination with IDBD. They are subsequently valued at cost, less the accumulated amortization or impairment. Client relationships have an average twelve-year useful life, while one of the brands have an indefinite useful life and the other ten-year useful life.
 
(d)
Right to receive future units under barter agreements
 
The Group also enters into barter transactions where it normally exchanges undeveloped parcels of land with third-party developers for future property to be constructed on the bartered land. The Group generally receives monetary assets as part of the transactions and/or a right to receive future units to be constructed by developers. Such rights are initially recognized at cost (which is the fair value of the land assigned) and are not adjusted later, unless there is any sign of impairment.
 
At each year-end, the Group reviews the carrying amounts of its intangible assets to determine whether there is any indication that those assets have suffered an impairment loss. If any of such signs exists, the recoverable amount of the asset is estimated in order to determine the extent, if any, of the impairment loss. For intangible assets with indefinite useful lives, the Group annually reviews the existence of an impairment, or more frequently if signs of impairment are identified.
 
2.10.
Trading properties
 
Trading properties comprises those properties either intended for sale or in the process of construction for subsequent sale. Trading properties are carried at the lower of cost and net realizable value. Where there is a change in use of investment properties evidenced by the commencement of development with a view to sale, the properties are reclassified as trading properties at cost, which is the carrying value at the date of change in use. They are subsequently carried at the lower of cost and net realizable value. Cost comprises all costs of purchase, costs of conversion and other costs incurred in bringing the trading properties to their present location and condition.
 
2.11.
Inventories
 
Inventories include assets held for sale in the ordinary course of the Group's business activities, assets in production or construction process for sale purposes, and materials, agricultural products, supplies or other assets held for consumption in the process of producing sales and/or services.
 
Inventories are measured at the lower of cost or net realizable value.
 
Net realizable value is the estimated selling price in the ordinary course of business less selling expenses. It is determined on an ongoing basis, taking into account the product type and aging, based on the accumulated prior experience with the useful life of the product. The Group periodically reviews the inventory and its aging and books an allowance for impairment, as necessary.
 
The cost of consumable supplies, materials and other assets is determined using the weighted average cost method, the cost of inventories of mobile phones, related accessories and spare parts is priced under the moving average method, and the cost of the remaining inventories is priced under the first in, first out (FIFO) method.
 
Cost comprises all costs of purchase, costs of conversion and other costs incurred in bringing the inventories to their present location and condition. Inventories and materials are initially recognized at cash price, and the difference being charged as finance cost.
 
2.12.
Financial instruments
 
The Group classifies financial assets in the following categories: those to be measured subsequently at fair value, and those to be measured at amortized cost. This classification depends on whether the financial asset is an equity investment or a debt investment.
 
 
F-24
 
 
Debt investments
 
A debt investment is classified at amortized cost only if both of the following criteria are met: (i) the objective of the Group’s business model is to hold the asset to collect the contractual cash flows; and (ii) the contractual terms give rise on specified dates to cash derived solely from payments of principal and interest due on the principal outstanding. The nature of any derivatives embedded in the debt investment are considered in determining whether the cash derives solely from payment of principal and interest due on the principal outstanding and are not accounted for separately.
 
If either of the two criteria mentioned in the previous paragraph is not met, the debt instrument is classified at fair value through profit or loss. The Group has not designated any debt investment as measured at fair value through profit or loss to eliminate or significantly reduce an accounting mismatch. Changes in fair values and gains from disposal of financial assets at fair value through profit or loss are recorded within “Financial results, net” in the Statement of Income.
 
Equity investments
 
All equity investments, which are neither subsidiaries nor associate companies nor joint venture of the Group, are measured at fair value. Equity investments that are held for trading are measured at fair value through profit or loss. For all other equity investments, the Group can make an irrevocable election at initial recognition to recognize changes in fair value through other comprehensive income rather than profit or loss. The Group decided to recognize changes in fair value of equity investments through changes in profit or loss.
 
At initial recognition, the Group measures a financial asset at its fair value plus, in the case of a financial asset not at fair value through profit or loss, transaction costs that are directly attributable to the acquisition of the financial asset. Transaction costs of financial assets carried at fair value though profit or loss are expensed in the Statement of Income.
 
In general, the Group uses the transaction price to ascertain the fair value of a financial instrument on initial recognition. In the other cases, the Group records a gain or loss on initial recognition only if the fair value of the financial instrument can be supported by other comparable transactions observable in the market for the same type of instrument or if based on a technical valuation that only inputs observable market data. Unrecognized gains or losses on initial recognition of a financial asset are recognized later on, only to the extent they arise from a change in factors (including time) that market participants would consider upon setting the price.
 
Gains/losses on debt instruments measured at amortized cost and not identified for hedging purposes are charged to income where the financial assets are derecognized or an impairment loss is recognized, and during the amortization process under the effective interest method. The Group is required to reclassify all affected debt investments when and only when its business model for managing those assets changes.
 
The Group assesses at the end of each reporting period the expected losses for impairment of a financial asset or group of financial assets measured at amortized cost. A financial asset or a group of financial assets is impaired and impairment losses are incurred only if there is objective evidence of impairment as a result of one or more events that occurred after the initial recognition of the asset (a ‘loss event’) and that loss event (or events) can be reliably estimated. The amount of the loss is measured as the difference between the asset’s carrying amount and the present value of estimated future cash flows (excluding future credit losses that have not been incurred) discounted at the financial asset’s original effective interest rate.
 
Financial assets and liabilities are offset, and the net amount reported in the statement of financial position, when there is a legally enforceable right to offset the recognized amounts and there is an intention to settle on a net basis, or realize the asset and settle the liability simultaneously.
 
 
2.13.
Derivative financial instruments and hedging activities and options
 
Derivative financial instruments are initially recognized at fair value. The method of recognizing the resulting gain or loss depends on whether the derivative is designated as a hedging instrument, and if so, the nature of the item being hedged.
 
The Group manages exposures to various risks using hedging instruments that provide coverage. The Group does not use derivative financial instruments for speculative purposes. To date, the Group has used put and call options, foreign currency future and forward contracts and interest rate swaps, as appropriate.
 
 
F-25
 
 
The Group’s policy is to apply hedge accounting where it is permissible under IFRS 9, practical to do so and its application reduces volatility, but transactions that may be effective hedges in economic terms may not always qualify for hedge accounting under IFRS 9.
 
The fair values of financial instruments that are traded in active markets are computed by reference to market prices. The fair value of financial instruments that are not traded in an active market is determined by using valuation techniques. The Group uses its judgment to select a variety of methods and make assumptions that are mainly based on market conditions existing at the end of each reporting year.
 
2.14.
Groups of assets and liabilities held for sale
 
The groups of assets and liabilities are classified as held for sale where the Group is expected to recover their value by means of a sale transaction (rather than through use) and where such sale is highly probable. Groups of assets and liabilities held for sale are valued at the lower of their net book value and fair value less selling costs.
 
2.15.
Trade and other receivables
 
Trade receivables are recognized initially at fair value and subsequently measured at amortized cost using the effective interest method.
 
An allowance for doubtful accounts is recorded based on the expected loss of the receivables portfolio. Indicators of doubtful accounts include significant financial distress of the debtor, the debtor potentially filing a petition for reorganization or bankruptcy, or any event of default or past due account.
 
In the case of larger non-homogeneous receivables, the impairment provision is calculated on an individual basis.
 
The Group collectively evaluates smaller-balance homogeneous receivables for impairment. For that purpose, they are grouped on the basis of similar risk characteristics, and account asset type, collateral type, past-due status and other relevant factors are taken into account.
 
The amount of the allowance is the difference between the asset’s carrying amount and the present value of estimated future cash flows, discounted at the original effective interest rate. The carrying amount of the asset is reduced through the use of a separate account, and the amount of the loss is recognized in the Statements of Income within “Selling expenses”. Subsequent recoveries of amounts previously written off are credited against “Selling expenses” in the Statements of Income.
 
2.16.
Other assets
 
Other assets are recognized initially at cost and subsequently measured at the acquisition cost or the net realizable value, the lower.
 
2.17.
Trade and other payables
 
Trade payables are initially recognized at fair value and subsequently measured at amortized cost using the effective interest method.
 
2.18.
Borrowings
 
Borrowings are recognized initially at fair value, net of transaction costs incurred. Borrowings are subsequently stated at amortized cost; any difference between the proceeds (net of transaction costs) and the redemption value is recognized as finance cost over the period of the borrowings using the effective interest method.
 
2.19.
Provisions
 
Provisions are recognized when: (i) the Group has a present (legal or constructive) obligation as a result of past events; (ii) it is probable that an outflow of resources will be required to settle the obligation; and (iii) a reliable estimate of the amount of the obligation can be made. Provisions are not recognized for future operating losses.
 
The Group bases its accruals on up-to-date developments, estimates of the outcomes of the matters and legal counsel´s experience in contesting, litigating and settling matters. As the scope of the liabilities becomes better defined or
 
 
F-26
 
 
more information is available, the Group may be required to change its estimates of future costs, which could have a material adverse effect on its results of operations and financial condition or liquidity.
 
Provisions are measured at the present value of the cash flows expected to be required to settle the obligation using a pre-tax rate that reflects current market assessments of the time value of money and the risks specific to the obligation. The increase in the provisions due to passage of time is recognized in the Statements of Income.
 
2.20.
Irrevocable right of use of the capacity of underwater communication lines
 
Transactions carried out to acquire an irrevocable right of use of the capacity of underwater communication lines are accounted for as service contracts. The amount paid for the rights of use of the communication lines is recognized as “Prepaid expenses” under trade and other receivables, and is amortized over a straight-line basis during the period set forth in the contract (including the option term), which is the estimated useful life of such capacity.
 
2.21.
Employee benefits
 
(a)
Defined contribution plans
 
The Group operates a defined contribution plan, which is a pension plan under which the Group pays fixed contributions into a separate entity. The Group has no legal or constructive obligations to pay further contributions if the fund does not hold sufficient assets to pay all employees the benefits relating to employee service in the current year or prior periods. The contributions are recognized as employee benefit expense in the Statements of Income in the fiscal year they are due.
 
(b)
Termination benefits
 
Termination benefits are payable when employment is terminated by the Group before the normal retirement date, or whenever an employee accepts voluntary redundancy in exchange for these benefits. The Group recognizes termination benefits when it is demonstrably committed to either terminating the employment of current employees according to a detailed formal plan without possibility of withdrawal or as a result of an offer made to encourage voluntary termination as a result of redundancy.
 
(c)
Bonus plans
 
The Group recognizes a liability and an expense for bonuses based on a formula that takes into consideration the profit attributable to the Company’s shareholders after certain adjustments. The Group recognizes a provision where contractually obliged or where there is a past practice that has created a constructive obligation.
 
(d)
Defined benefit plans
 
The Group’s net obligation concerning defined benefit plans are calculated on an individual basis for each plan, estimating the future benefits employees have gained in exchange for their services in the current and prior periods. The benefit is disclosed at its present value, net of the fair value of the plan assets. Calculations are made on an annual basis by a qualified actuary.
 
(e)
Share-based payments
 
The fair value of share-based payments is measured at the date of grant. The Group measures the fair value using the valuation technique that it considers to be the most appropriate to value each class of award. Methods used may include Black-Scholes calculations or other models as appropriate. The valuations take into account factors such as non-transferability, exercise restrictions and behavioral considerations.
 
The fair value of the share-based payment is expensed and charged to income under the straight-line method over the vesting period in which the right to the equity instrument becomes irrevocable (“vesting period”); such value is based on the best available estimate of the number of equity instruments expected to vest. Such estimate is revised if subsequent information available indicates that the number of equity instruments expected to vest differs from original estimates.
 
(f)
Other long-term benefits
 
F-27
 
 
The net obligations of IDBD, DIC and its subsidiaries concerning employee long-term benefits, other than retirement plans, is the amount of the minimum future benefits employees have gained in exchange for their services in the current and prior periods. These benefits are discounted at their present values.
 
2.22.
Current income tax, deferred income tax and minimum presumed income tax
 
Tax expense for the year comprises the charge for tax currently payable and deferred income. Income tax is recognized in the statements of income, except to the extent that it relates to items recognized in other comprehensive income or directly in equity, in which case, the tax is also recognized in other comprehensive income or directly in equity, respectively.
 
Current income tax expense is calculated on the basis of the tax laws enacted or substantially enacted at the date of the Statements of Financial Position in the countries where the Company and its subsidiaries operate and generate taxable income. The Group periodically evaluates positions taken in tax returns with respect to situations in which applicable tax regulation is subject to interpretation. The Group establishes provisions where appropriate on the basis of amounts expected to be paid to the tax authorities.
 
Deferred income tax is recognized, using the deferred tax liability method, on temporary differences arising between the tax bases of assets and liabilities and their carrying amounts in the Consolidated Financial Statements. However, deferred tax liabilities are not recognized if they arise from the initial recognition of goodwill; deferred income tax is not accounted for if it arises from initial recognition of an asset or liability in a transaction other than a business combination that at the time of the transaction affects neither accounting nor taxable profit or loss. Deferred income tax is determined using tax rates (and laws) that have been enacted or substantively enacted by the date of the Statements of Financial Position and are expected to apply when the related deferred income tax asset is realized or the deferred income tax liability is settled.
 
Deferred income tax assets are recognized only to the extent that it is probable that future taxable profit will be available against which the temporary differences can be utilized. Deferred income tax is provided on temporary differences arising on investments in subsidiaries, joint ventures and associates, except for deferred income tax liabilities where the timing of the reversal of the temporary difference is controlled by the Group and it is probable that the temporary difference will not reverse in the foreseeable future.
 
Deferred income tax assets and liabilities are offset when there is a legally enforceable right to offset current tax assets against current tax liabilities and when the deferred income taxes assets and liabilities relate to income taxes levied by the same taxation authority on either the same taxable entity or different taxable entities where there is an intention to settle the balances on a net basis.
 
The Group is able to control the timing of dividends from its subsidiaries and hence does not expect taxable profit. Hence, deferred tax is recognized in respect of the retained earnings of overseas subsidiaries only if at the date of the Statements of Financial Position, dividends have been accrued as receivable a binding agreement to distribute past earnings in future has been entered into by the subsidiary or there are sale plans in the foreseeable future.
 
Entities in Argentina are subject to the Minimum Presumed Income Tax (“MPIT”). Pursuant to this tax regime, an entity is required to pay the greater of the income tax or the MPIT. The MPIT provision is calculated on an individual entity basis at the statutory asset tax rate of 1% and is based upon the taxable assets of each company as of the end of the year, as defined by Argentine law. Any excess of the MPIT over the income tax may be carried forward and recognized as a tax credit against future income taxes payable over a 10-year period. When the Group assesses that it is probable that it will use the MPIT payment against future taxable income tax charges within the applicable 10-year period, recognizes the MPIT as a current or non-current receivable, as applicable, within “Trade and other receivables” in the Statements of Financial Position.
 
The minimum presumed income tax was repealed by Law N ° 27,260 in its article 76 for the periods that begin as of January 1,2020.
 
Regarding the above mentioned, considering Instruction No. 2 of the Federal Administration of Public Revenues (AFIP), it is not appropriate to record the provision of the above mention tax, in the event that accounting and tax losses occur.
 
 
F-28
 
 
2.23.
Cash and cash equivalents
 
Cash and cash equivalents include cash on hand, deposits held with banks, and other short-term highly liquid investments with original maturities of three months or less. Bank overdrafts are not included.
 
2.24.
Revenue recognition
 
The group identifies contracts with customers and evaluates the goods and services committed therein to determine performance obligations and their classification between performance obligations that are satisfied at a given time or over time.
 
Revenue from satisfaction of performance obligations at a given time is recognized when the client obtains control of the committed asset or service considering whether there is a right to collection, if the client has the physical possession, if the client has the legal right and if they have the transferred the risks and benefits.
 
Additionally and in accordance with IFRS 15, the Group recognizes revenues over time from the sales of real estate developments in which there is no alternative use for the asset and the Group has the right to demand payment of the contract. When these conditions are not met, the income is recognized at the time of delivery or deed.
 
Revenue from satisfaction of performance obligations over time for real estate developments is recognized by measuring progress towards compliance with the obligation when it can be measured reliably. For this measurement, the Group uses the resourced method, that is, the effort consumed by the entity and determines the percentage of progress based on the estimate of the total development costs.
 
The Group's revenue is recognized at the probable value of the consideration to which it will be entitled in exchange for transferring the products or services to the customer which is not expected to suffer significant changes.
 
Rental and services - Shopping malls portfolio
 
Revenues derived from business activities developed in the Group’s shopping malls mainly include rental income under operating leases, admission rights, commissions and revenue from several complementary services provided to the Group’s lessees.
 
Rental income from shopping mall, admission rights and commissions, are recognized in the Statements of Income on a straight-line basis over the term of the leases. When lease incentives are granted, they are recognized as an integral part of the net consideration for the use of the property and are therefore recognized on the same straight-line basis.
 
Contingent rents, i.e. lease payments that are not fixed at the inception of a lease, are recorded as income in the periods in which they are known and can be determined. Rent reviews are recognized when such reviews have been agreed with tenants.
 
The Group’s lease contracts also provide that common area maintenance charges and collective promotion funds of the Group’s shopping malls are borne by the corresponding lessees, generally on a proportionally basis. These common area maintenance charges include all expenses necessary for various purposes including, but not limited to, the operation, maintenance, management, safety, preservation, repair, supervision, insurance and enhancement of the shopping malls. The lessor is responsible for determining the need and suitability of incurring a common area expense. The Group makes the original payment for such expenses, which are then reimbursed by the lessees. The Group considers that it acts as a principal in these cases. Service charge income is presented separately from property operating expenses. Property operating expenses are expensed as incurred.
 
Rental and services - Offices and other rental properties
 
Rental income from offices and other rental properties include rental income from offices leased out under operating leases, income from services and expenses recovery paid by tenants.
 
Rental income from offices and other rental properties is recognized in the Statements of Income on a straight-line basis over the term of the leases. When lease incentives are granted, they are recognized as an integral part of the net consideration for the use of the property and are therefore recognized on the same straight-line basis.
 
A substantial portion of the Group’s leases require the tenant to reimburse the Group for a substantial portion of operating expenses, usually a proportionate share of the allocable operating expenses. Such property operating expenses include necessary expenses such as property operating, repairs and maintenance, security, janitorial, insurance,
 
 
F-29
 
 
landscaping, leased properties and other administrative expenses, among others. The Group manages its own rental properties. The Group makes the original payment for these expenses, which are then reimbursed by the lessees. The Group considers that it acts as a principal in these cases. The Group accrues reimbursements from tenants as service charge revenue in the period the applicable expenditures are incurred and is presented separately from property operating expenses. Property operating expenses are expensed as incurred.
 
Revenue from communication services and sale of communication equipment (presented within discontinued operations)
 
Revenue derived from the use of communication networks by the Group, including mobile phones, Internet services, international calls, fixed line calls, interconnection rates, roaming service rates and television, are recognized when the service is provided, proportionally to the extent the transaction has been realized, and provided all other criteria have been met for revenue recognition.
 
Revenue from the sale of mobile phone cards is initially recognized as deferred revenue and then recognized as revenue as they are used or upon expiration, whichever takes place earlier.
 
A transaction involving the sale of equipment to a final user normally also involves a service sale transaction. In general, this type of sale is performed without a contractual obligation by the client to consume telephone services for a minimum amount over a predetermined period. As a result, the Group records the sale of equipment separately of the performance obligations and recognizes revenue pursuant to the transaction value upon delivery of the equipment to the client. Revenue from telephone services is recognized and accounted for as they are provided over time. When the client is bound to make a minimum consumption of services during a predefined period, the contract formalizes a transaction of several elements and, therefore, revenue from the sale of equipment is recorded at an amount that should not exceed its fair value, and is recognized upon delivery of the equipment to the client and provided the criteria for recognition are met. The Group ascertains the fair value of individual elements, based on the price at which it is normally sold, after taking into account the relevant discounts.
 
Revenue derived from long-term contracts is recognized at the present value of future cash flows, discounted at market rates prevailing on the transaction date. Any difference between the original credit and its net present value is accounted for as interest income over the credit term.
 Revenue from agricultural products
 
Revenue from agricultural products is recognized when the product is delivered and at the time all other criteria for revenue recognition have been met.
 
 
Revenue from supermarkets
 
Revenue from the sale of goods in the ordinary course of business is recognized at the fair value of the consideration collected or receivable, net of returns and discounts. When the credit term is short and financing is that typical in the industry, consideration is not discounted. When the credit term is longer than the industry’s average, in accounting for the consideration, the Group discounts it to its net present value by using the client’s risk premium or the market rate. The difference between the fair value and the nominal amount is accounted for under financial income. If discounts are granted and their amount can be measured reliably, the discount is recognized as a reduction of revenue.
 
Revenues from supermarkets have been recognized in discontinued operations. See Note 4.d.
 
2.25.
Cost of sales
 
The cost of sales, includes the acquisition costs and the operational and management costs for shopping malls held by the Group as part of its real estate investments.
 
The Group’s cost of sales in relation to the supply of communication services (which is presented within discontinued operations in these financial statements) mainly includes the costs to purchase equipment, salaries and related expenses, service costs, royalties, ongoing license dues, interconnection and roaming expenses, cell tower lease costs, depreciation and amortization expenses and maintenance expenses directly related to the services provided.
 
The cost of sales of supermarkets (which is presented within discontinued operations in these financial statements), includes the acquisition costs for the products less discounts granted by suppliers, as well as all expenses associated with storing and handling inventories and is classified as discontinued operations.
 
 
F-30


2.26.
Cost of borrowings and capitalization
 
The costs for general and specific loans that are directly attributable to the acquisition, construction or production of suitable assets for which a prolonged period is required to place them in the conditions required for their use or sale, are capitalized as part of the cost of those assets until the assets are substantially ready for use or sale. The general loan costs are capitalized according to the average debt rate of the Group. Foreign exchange differences for loans in foreign currency are capitalized if they are considered an adjustment to interest costs. The interest earned on the temporary investments of a specific loan for the acquisition of qualifying assets are deducted from the eligible costs to be capitalized. The rest of the costs from loans are recognized as expenses in the period in which they are incurred.
 
2.27.
Share capital
 
Ordinary shares are classified as equity. Incremental costs directly attributable to the issue of new ordinary shares or options are shown in equity as a deduction, net of tax, from the proceeds.
 
When any Group’s subsidiary purchases the Company’s equity share capital (treasury shares), the consideration paid, including any directly attributable incremental costs (net of income taxes) is deducted from equity attributable to the Company’s equity holders until the shares are cancelled or reissued. When such ordinary shares are subsequently reissued, any consideration received, net of any directly attributable incremental transaction costs and related income tax effects, is included in equity.
 
Instruments issued by the Group that will be settled by the Company delivering a fixed number of its own equity instruments in exchange for a fixed amount of cash or another financial asset are classified as equity.
 
2.28.
Comparability of information
 
The balances as of June 30, 2019 and 2018 that are disclosed for comparative purposes were restated in accordance with IAS 29, see Note 2.1. Certain items from prior fiscal years have been reclassified for consistency purposes. See Note 4. d. for the loss of control of Shufersal and Note 4.c for the loss of control of Gay-Yam.
 
During the years ended June 30, 2020, 2019 and 2018, the Argentine Peso suffered a decrease in its value compared to the US dollar and other currencies close to 66%, 45% and 73%, respectively, which has an impact on the comparability of the figures exposed in the financial statements, mainly due to the exposure to the exchange rate of our Income and costs of “offices” segment, and our assets and liabilities, nominated in foreign currency of the Argentine operations center, the aforementioned devaluation also had an effect on the total balances of the Israel operations center.
 
 3. Significant judgments, key assumptions and estimates
 
Not all of these significant accounting policies require management to make subjective or complex judgments or estimates. The following is intended to provide an understanding of the policies that management considers critical because of the level of complexity, judgment or estimations involved in their application and their impact on the Consolidated Financial Statements. These judgments involve assumptions or estimates in respect of future events. Actual results may differ from these estimates.
 
 
F-31


Estimation
Main assumptions
Potential implications
Main references
Business combination - Allocation of acquisition prices
Assumptions regarding timing, amount of future revenues and expenses, revenue growth, expected rate of return, economic conditions, discount rate, among other.
Should the assumptions made be inaccurate, the recognized combination may not be correct.
Note 4 – Acquisitions and dispositions
Recoverable amounts of cash-generating units (even those including goodwill), associates and assets.
The discount rate and the expected growth rate before taxes in connection with cash-generating units.
The discount rate and the expected growth rate after taxes in connection with associates.
Cash flows are determined based on past experiences with the asset or with similar assets and in accordance with the Group’s best factual assumption relative to the economic conditions expected to prevail.
Business continuity of cash-generating units.
Appraisals made by external appraisers and valuators with relation to the assets’ fair value, net of realization costs (including real estate assets).
Should any of the assumptions made be inaccurate, this could lead to differences in the recoverable values of cash-generating units.
Note 10 – Property, plant and equipment
Note 12 – Intangible assets
Control, joint control or significant influence
Judgment relative to the determination that the Group holds an interest in the shares of investees (considering the existence and influence of significant potential voting rights), its right to designate members in the executive management of such companies (usually the Board of directors) based on the investees’ bylaws; the composition and the rights of other shareholders of such investees and their capacity to establish operating and financial policies for investees or to take part in the establishment thereof.
Accounting treatment of investments as subsidiaries (consolidation) or associates (equity method)
Note 2.3
Estimated useful life of intangible assets and property, plant and equipment
Estimated useful life of assets based on their conditions.
Recognition of accelerated or decelerated depreciation by comparison against final actual earnings (losses).
Note 10 – Property, plant and equipment
Note 12 – Intangible assets
Fair value valuation of investment properties
Fair value valuation made by external appraisers and valuators. See Note 9.
Incorrect valuation of investment property values
Note 9 – Investment properties
 
Income tax
The Group estimates the income tax amount payable for transactions where the Treasury’s Claim cannot be clearly determined.
Additionally, the Group evaluates the recoverability of assets due to deferred taxes considering whether some or all of the assets will not be recoverable.
Upon the improper determination of the provision for income tax, the Group will be bound to pay additional taxes, including fines and compensatory and punitive interest.
Note 21 – Taxes
Allowance for doubtful accounts
A periodic review is conducted of receivables risks in the Group’s clients’ portfolios. Bad debts based on the expiration of account receivables and account receivables’ specific conditions.
Improper recognition of charges / reimbursements of the allowance for bad debt.
Note 15 – Trade and other receivables
Level 2 and 3 financial instruments
Main assumptions used by the Group are:
 Discounted projected income by interest rate
 Values determined in accordance with the shares in equity funds on the basis of its Financial Statements, based on fair value or investment assessments.
 Comparable market multiple (EV/GMV ratio).
 Underlying asset price (Market price); share price volatility (historical) and market interest-rate (Libor rate curve).
Incorrect recognition of a charge to income / (loss).
Note 14 – Financial instruments by category
 Probability estimate of contingent liabilities.
Whether more economic resources may be spent in relation to litigation against the Group; such estimate is based on legal advisors’ opinions.
Charge / reversal of provision in relation to a claim.
Note 19 – Provisions
Qualitative considerations for determining whether or not the replacement of the debt instrument involves significantly different terms
The entire set of characteristics of the exchanged debt instruments, and the economic parameters represented therein:
Average lifetime of the exchanged liabilities; Extent of effects of the debt terms (linkage to index; foreign currency; variable interest) on the cash flows from the instruments.
Classification of a debt instrument in a manner whereby it will not reflect the change in the debt terms, which will affect the method of accounting recording.
Note 14 – Financial instruments by category
 
4. Acquisitions and disposals
 
Operations Center in Argentina
 
A.
 Distribution of dividends in kind
 
On October 30, 2019, the General Ordinary Shareholders´ Meeting approved the distribution of a dividend in kind for an equivalent of Ps. 517 (representing Ps. 0.89 per share and equivalent of Ps. 634 at current currency as of June 30, 2020) payable in IRSA CP shares. For distribution, the quoted price of the IRSA CP share was taken as of October 29, 2019, which was Ps. 221 per share. The number of shares distributed amounts to 2,341,463. This transaction was accounted for in equity as a decrease in the net equity attributable to the parent company for an amount of Ps.543. The stake of the Group in IRSA CP as at year-end is 80.65%.
 
On October 29, 2018 a General Ordinary and Extraordinary Shareholder’s meeting was held, whereby the distribution of a dividend in kind for an equivalent of Ps. 1,967 payable in shares of IRSA CP S.A. was resolved (representing Ps 2.63 per share and equivalent of Ps. 2,810 at current currency as of June 30, 2020). For the distribution, the value of IRSA CP share was taken as of October 26, 2018, which was Ps. 237 per share. The number of shares distributed amounted to 6,418,182. This transaction was accounted for as an equity transaction generating a decrease in the net equity attributable to the parent for Ps. 1,651.
 
B.
Sale of IRSA CP floors
 
On June 9, 2020, IRSA CP executed the assignment and transfer the right to sign a title deed, with delivery of possession, with respect to two medium-height floors in the tower under construction known as “200 Della Paolera”, located in the Catalinas district of the Autonomous City of Buenos Aires, covering a total area of approximately 2,430 sq. meters and 16 parking lots, located in the building.
 
 
F-32
 
 
The transaction price was set at approximately Ps. 1,264 million (USD 16.9 million), which has already been fully paid.
 
C.
Condor Merger Agreement
 
On July 19, 2019, Condor executed a merger agreement. As per the contractual terms, each common share of Condor, with a par value of USD 0.01 per share, shall be cancelled prior to the merger and converted into the right to receive an amount in cash equivalent of USD 11.10 per common share. Additionally, pursuant to the terms and conditions of the merger agreement, each convertible Class E share shall be automatically cancelled and shall be converted into the right to receive an amount in cash equivalent of USD 10.00 per share.
 
The closing of the transaction, scheduled for March 23, 2020, has not yet taken place.
 
Condor is currently discussing with NexPoint Hospitality Trust the potential amendments to restructure the previously reported acquisition by merger of the company. No assurances may be given with respect to the outcome of such discussions. The Company will continue to review the options and reserves all its rights and remedies under the original merger agreement.
 
As of the date of presentation of these financial statements, the Group has 2,197,023 common shares and 325,752 Series E shares.
 
D.
TGLT – Recapitalization Agreement
 
On August 8, 2019, we entered into certain arrangements with TGLT S.A. (“TGLT”) providing for collaboration in TGLT’s financial restructuring and recapitalization. We participated in the recapitalization agreement whereby TGLT committed: (i) to make a public offer to subscribe Class A preferred shares at a subscription price of USD 1.00 per TGLT share; (ii) to make a public offering of new Class B preferred shares which may be subscribed by (a) the exchange for ordinary shares of TGLT, at an exchange ratio of one Class B preferred share for every 6.94 ordinary shares of the Company and / or (b) the exchange for convertible notes, at an exchange ratio of a Class B preferred share for each USD 1.00 of convertible notes (including accumulated and unpaid interests under the existing convertible notes); and (iii) to grant an option to subscribe new Class C preferred shares in a public offer for cash to be carried out if: (a) the public offer of Class A and Class B preferred shares are consummated and (b) a minimum number of option holders have exercised that option at a subscription price per Class C preferred share of USD 1.00 (or its equivalent in pesos).
 
Likewise, IRSA CP signed as a holder of convertible notes of TGLT an agreement for deferment of payment of interest payable as of February 15, 2019 and August 15, 2019 until November 8, 2019 and an option agreement which may be subscribed Class C preferred shares.
 
Finally, supporting the recapitalization plan, IRSA CP signed with TGLT a subscription commitment for Class A preferred shares under Class A Public Offer to make a contribution in kind of shares of the company La Maltería SA, 100% of its ownership, for an amount up to USD 24 million and promised to exchange its convertible negotiable obligations into preferred Class B shares.
 
In turn, on November 22, 2019, TGLT held a bondholders of convertible negotiable obligations meeting in order to consider the modification of different clauses of the indenture in force at that date, and in line with what was agreed in the recapitalization agreement , IRSA CP voted in favor of the modifications.
 
Under the agreements described above, the successful consummation of the offer by TGLT, and having reached the thresholds of consent of the holders of convertible notes of TGLT, on December 11, 2019, the Company concluded the envisaged process in the recapitalization agreement and related documents through the subscription of preferred Class A shares, integrating them in kind through the contribution of the shares of the company La Maltería SA, 100% of their ownership and, likewise, proceeded to the exchange of the convertible note - including deferred interest and accrued interest from August 15, 2019 to December 11, 2019 - in preferred Class B shares.
 
During the fiscal year 2020, preferred shares were converted into ordinary shares, which is why IRSA CP begin to have significant influence, considering TGLT S.A. as an associate company.
 
E) Sale of Tarshop
 
On February 14, 2019, IRSA CP sold its entire stake in Tarshop to BHSA. Following this acquisition, BHSA became the holder of 100% of the capital stock of said company.
 
 
F-33
 
 
The loss recognized for this transaction was approximately Ps. 191.
 
F) Purchase of equity interest in HASAU (owner of Libertador Hotel)
 
On February 28, 2019, the Group reported the acquisition, from an unrelated third party, of the twenty percent (20%) of HASAU for an amount of US$ 1.2. As a result of this acquisition, IRSA holds 100% of HASAU's share capital. This transaction was accounted for as an equity transaction generating a decrease in the net equity attributable to the controlling shareholders by Ps. 3 restated at the date of these financial statements.
 
Operations Center in Israel
 
A.
Partial sale of Clal
 
Sales and Swap transactions
 
On May 1, 2017, August 30, 2017, January 1, 2018, May 3, 2018, August 30, 2018, and January 2, 2019, continuing with the instructions given by the Israel Capital Market, Insurance and Savings Commission, IDBD sold 5% of its stake in Clal on each occasion and 4.5% on the last one respectively, with a subsequent swap transaction with a 2- year expiration term for each transaction. The consideration for the transactions amounted to approximately NIS 944.5, which is partially restricted according to these agreements until the swap expires. These transactions did not meet the de-recognition criteria so the Group maintains the asset as “Financial assets available for sale” and accounted for the loans as a financial liability.
 
On December 16, 2019, Clal made a public capital increase for 12,066,000 shares at a price of NIS 53.87 per share. IDBD did not take part in such transaction.
 
Additionally, on that date, IDBD sold 200,000 Clal shares at a price of NIS 53.95 per share, representing 0.3% of the new capital stock.
 
On December 18, 2019, IDBD sold 617,017 Clal shares at an average price of NIS 53.77 per share, representing 0.9% of the issued capital stock.
 
Furthermore, a swap transaction carried out by IDBD involving 2,771,309 shares expired in December 2019. The closing price was NIS 52.25 per share.
 
A swap transaction involving 751,000 shares expired within the January-March 2020 period. The closing price was NIS 45.09 per share.
 
Other sales agreements
 
On May 2, 2019, continuing with the instructions given by the Israel Capital Market, Insurance and Savings Commission, IDBD entered into sales agreements with two unrelated parties (the “Buyers”), according to which each of the Buyers will acquire Clal shares representing 4.99% of its share capital at a cash price of NIS 47.7 per share (approximately Ps. 648 per share). In addition, they were granted an option to acquire additional Clal shares for approximately 3% of the issued capital, for a period of 120 days (subject to obtaining a holding permit) at a price of NIS 50 per share.
 
Additionally on the same day, IDBD also entered into an agreement with a third unrelated buyer (the "Additional Buyer"), according to which the Additional Buyer will receive an option from IDBD, valid for a period of 50 days, to acquire approximately 4.99% of Clal shares (and not less than 3%), at a price of NIS 47.7 per share (approximately Ps. 648 per share). Subject to the exercise of the option by the Additional Buyer, the price will be paid 10% in cash and the rest through a loan that will be provided to the Additional Buyer by IDBD and / or by a related entity and / or by a banking corporation and / or financial institution, under the agreed conditions.
 
The aforementioned agreements include, among others, a commitment by the Buyers and the Additional Buyer to not sell the shares acquired during an agreed period of 24 months. It is clarified that each of the Buyers and the Additional Buyer have declared and committed to IDBD that there are no agreements or understandings between them regarding the joint ownership of Clal shares that are subject to the aforementioned agreements.
 
The total amount of Clal shares that can be acquired by the three buyers mentioned above, to the extent that the three agreements are completed and the options are exercised, represents approximately 18% of Clal's share capital.
 
 
F-34
 
 
As of the date of these financial statements, all previously agreed sales transactions have been consummated.
 
On June 28 and July 6, 2020, IDBD sold 4,791,618 Clal shares held by it through swap transactions, at an average price of approximately NIS 30 per share, representing 7.1% of the capital stock.
 
Additionally, on September 3, 2020, IDBD sold 2,376,527 Clal shares at an average price of NIS 32,475 per share, for a total amount of NIS 77.2 million, representing 3.5% of Clal´s capital stock.
 
As a result of the aforementioned transactions, as of this date, IDBD´s holding in Clal represents 4.99% of its capital stock. It no longer has swap transactions and, accordingly, it is no longer considered as Clal interested party within the context of Israel´s Securities Regulations.
 
On February 4, 2020, Dolphin furnished to the financial entities through which IDB carried out the swap transactions of Clal shares in August and November 2018, guarantees of approximately NIS 11 million, which shall be part of the committed deposits that IDB undertook as part of the terms of such transactions. Furthermore, on February 18, it deposited further guarantees in the amount of NIS 9 million. Following the last sale described above, the guarantees were returned.
 
B)           Distribution of dividends in kind by PBC. Purchase of Mehadrin shares and acquisition of control
 
On December 10, 2019, PBC distributed its entire holding in Mehadrin as a dividend in kind and, as a result, DIC holds, directly, a 31.4% interest in Mehadrin. As a consequence of such transaction, Mehadrin became an associate.
 
In January and February 2020, DIC purchased approximately 8.8% of Mehadrin’s capital stock, for a total cost of NIS 39 (approximately Ps. 767); therefore, the interest in Mehadrin has increased from 31.4% to approximately 40.2%. Such acquisitions resulted in DIC obtaining control over Mehadrin, by the end of February, as it has the majority votes while the remaining equity interests are distributed among several shareholders.
 
Additionally, from April to June 2020, DIC purchased an additional 3.5% interest in Mehadrin for NIS 14 (approximately Ps. 298), increasing its interest to 43.7%.
 
Following the taking of control, as mentioned above, since March 9, 2020, the Group has consolidated the operations of this company.
 
Below is a detail of incorporated net assets and income from such transaction. The process for the assessment of the fair value of incorporated net assets has been significantly completed as of June 30, 2020 and it is expected to conclude in the first months of the fiscal year ending June 30, 2021. However, the Management does not foresee any material adjustments to the incorporated net assets detailed below
 
 
F-35
IRSA Inversiones y Representaciones Sociedad Anónima


  06.30.2020 
Fair value of identifiable assets and assumed liabilities:
    
Investment properties
  244 
Property, plant and equipment
  6,576 
Intangible assets
  61 
Investments in associates and joint ventures
  2,023 
Restricted assets
  177 
Income tax and MPIT credit
  157 
Trade and other receivables
  10,993 
Right-of-use assets
  4,327 
Derivative financial instruments
  40 
Inventories
  2,695 
Borrowings
  (7,927)
Deferred income tax liabilities
  (945)
Trade and other payables
  (5,144)
Lease liabilities
  (2,281)
Provisions
  (60)
Employee benefits
  (138)
Salaries and social security liabilities
  (197)
Income tax and MPIT liabilities
  (19)
Cash and cash equivalents
  2,812 
Total identifiable net assets
  13,394 
Non-controlling interest
  (8,013)
Bargain purchase gain (*)
  (405)
Previously held interest
  4,209 
Cash and cash equivalents
  767 
Total consideration
  4,976 
 
(*) Included in “Other operating income, net”
 
C)             
Partial sale of equity interests in Gav-Yam
 
On July 1, 2019, PBC sold approximately 11.7% of Gav-Yam´s capital stock by private agreements. Following this transaction, PBC´s interest in Gav-Yam decreased from 51.7% to 40%. The consideration received for such sale was NIS 46 (approximately $ 6,949, ).
 
Furthermore, on September 1, 2019, PBC sold an additional 5.14%, approximately, of Gav-Yam shares and, as a result, PBC´s interest in Gav-Yam decreased from 40% to 34.9%. As a consequence of such sales, PBC forfeited its right to nominate the majority members of the Board of Directors and to appoint or remove key management members. Accordingly, PBC has lost its control over Gav-Yam and has de-consolidated such investment since such date.
 
Below are the details of the sale:
 
 
  09.30.2019 
Cash received
  15,353 
Remeasurement of the fair value of the remaining investment
  34,627 
Total
  49,980 
Net assets written off including business key
  (30,281)
Gain from sales of a net tax subsidiary, net of taxes (*)
  19,699 
 
(*) Said results are disclosed within discontinued operations, under the caption "other operating results, net"
 
 
F-36
IRSA Inversiones y Representaciones Sociedad Anónima
 
 
The following table details the net assets disposed:
 
 
  09.30.2019 
Investment properties
  167,776 
Property, plant and equipment
  1,141 
Intangible assets
  3,532 
Right-of-use assets
  45 
Investments in associates and joint ventures
  4,733 
Restricted assets
  407 
Trade and other receivables
  1,246 
Investments in financial assets
  14,581 
Trading properties
  167 
Income tax credit
  205 
Cash and cash equivalents
  11,436 
TOTAL ASSETS
  205,269 
Borrowings
  102,749 
Lease liabilities
  45 
Deferred income tax liabilities
  22,770 
Trade and other payables
  2,582 
Employee benefits
  23 
Salaries and social security liabilities
  68 
Income tax and MPIT liabilities
  135 
TOTAL LIABILITIES
  128,372 
Non-controlling interest
  46,616 
Net assets written off including goodwill
  30,281 
 
On January 12, 2020, PBC received a communication from the Ministry of Justice of Israel questioning the loss of control of Gav-Yam in September 2019 and, accordingly, raising its objections to observance by PBC of the concentration law in Israel.
 
In May 2020, PBC agreed to sell approximately 4.96% of Gav-Yam´s capital stock to an unrelated third party. Therefore, its interest in Gav-Yam decreased from 34.9% to 29.9% after the consummation of the sales transaction and it was thus able to overcome the questioning from the Ministry of Justice of Israel.
 
D) Changes in equity interest in Shufersal and loss of control
 
On December 24, 2017, DIC sold Shufersal shares, decreasing its stake from 53.30% to 50.12%. The consideration with respect to the sale of the shares amounted to NIS 169.5 (equivalent to Ps. 2,312). Both transactions were accounted for as an equity transaction generating an increase in equity attributable to the controlling company for
Ps. 783 and Ps. 1,051, respectively.
 
On June 16, 2018, DIC announced the sale of a percentage of its stake in Shufersal to institutional investors which was completed on June 21, 2018. The percentage sold amounted to 16.56% and the net amount of the consideration was approximately NIS 848 (equivalent to Ps. 14,905), consequently DIC lost control of Shufersal, so the Group deconsolidated the subsidiary at that date.
 
Below are the details of the sale:
 
 
  06.30.2018 
Cash received
  15,368 
Remediation of the fair value of the remaining interest
  31,512 
Total
  46,880 
Net assets disposed including goodwill
  (20,350)
Gain from the sale of a subsidiary, net of taxes (*)
  26,530 
 
(*) Includes Ps. 6,304 as a result of the sale and Ps. 20,227 as a result of the re-measurement at the fair value of the new stake, both included in discontinued operations.
 
The following table details the net assets disposed:
 
 
F-37


  06.30.2018 
Investment properties
  11,123 
Property, plant and equipment
  69,420 
Intangible assets
  17,443 
Investments in associates and joint ventures
  960 
Restricted assets
  219 
Trade and other receivables
  35,005 
Investments in financial assets
  301 
Derivative financial instruments
  55 
Inventories
  15,023 
Cash and cash equivalents
  13,354 
TOTAL ASSETS
  162,903 
Borrowings
  51,010 
Deferred income tax liabilities
  6,722 
Trade and other payables
  57,387 
Provisions
  1,103 
Employee benefits
  3,027 
Salaries and social security liabilities
  5,729 
Income tax and MPIT liabilities
  18 
TOTAL LIABILITIES
  124,996 
Non-controlling interest
  17,557 
Net assets disposed including goodwill
  20,350 
 
Additionally, on November 27, 2018, DIC sold 7.5% of the total shares of Shufersal to institutional investors for a consideration of NIS 416 million (approximately Ps. 7,822). After this transaction, the group holding went down to 26.02% approximately. The profit for this sale was NIS 27 (approximately Ps. 463). See Note 34 regarding the sale of the entire equity interest.
 
E) Interest increase in Cellcom
 
On June 27, 2018, Cellcom increased its capital stock in consideration for a gross amount of NIS 280 (approximately Ps. 5,294). DIC participated in such increase and disbursed NIS 145.9 (approximately Ps. 2,757) for 6,314,200 shares.
 
Furthermore, in December 2018, DIC exercised 1.5 million options (Series 1) held by it in Cellcom, for an amount of NIS 31 million (approximately Ps. 567). In December 2019 and February 2020, DIC purchased Cellcom shares for NIS 19 million (approximately Ps. 384). As a consequence of the exercise of the options and the acquisition, DIC interest in Cellcom increased by 0.9%. These transactions were accounted for as equity transactions generating a decrease in the net equity attributable to the controlling company by Ps. 246, .
 
Additionally, on December 5, 2019, Cellcom increased its capital stock with the participation of DIC that purchased almost 50% of the shares issued. The consideration paid amounted to NIS 307 (approximately Ps. 6,471 as of such date). Cellcom issued an aggregate number of 30,600,000 common shares, 7,038,000 Series 3 Options and 6,426,000 Series 4 Options at a price of NIS 1.021 per unit (each unit will represent 100 common shares, 23 Series 3 Options and 21 Series 4 Options).
 
Following the participation of DIC in such issue, the interest percentage was 46.2% of the issued capital stock and approximately 48.5% of the Company´s voting rights (directly and by means of agreements executed with other shareholders of the Company).
 
F) Sale of IDBT subsidiary
 
On August 14, 2018, IDBT´s Board of Directors approved an agreement to sell 50% of a subsidiary of IDBT, entrusted with tourism operations for Israir, for a total price of NIS 26 (approximately Ps. 545), which transaction was consummated on December 31, 2018. Such transaction does not affect the intention to sell IDBT in its entirety. The Group evaluated maintaining the criteria to classify the investment as a discontinued operation pursuant to IFRS 5.
 
G) Agreement to sell plot of land in USA
 
In July 2019, a subsidiary of IDBG signed an agreement to sell a plot of land next to the Tivoli project in Las Vegas for a consideration of US$ 18 million. The sales transaction was not completed at the date of these financial statements.
 
 
F-38
 
 
H) Sale of Real Estate
 
In October 2018, a subsidiary of Ispro signed an agreement for the sale of all of its rights in real estate area of approximately 29 dunams (equivalent to 1 hectare), in which there are 12,700 square meters in the northern industrial zone in Yavneh for NIS 86 million, (equivalent to Ps.6,932). Such agreement has already been executed.
 
I) Interest increase in PBC
 
In December 2018 and February 2019, DIC acquired an additional 4.40% of PBC in the market for NIS 81 million (equivalent to Ps.1,545). The present transactions were accounted for as equity transactions, generating an increase in net equity attributable to the controlling company for Ps. 109. See Note 35
 
J) Repurchase of own shares by DIC
 
In December 2018, DIC's Board of Directors approved a plan to buy back DIC shares, for a period of one year, until December 2020 amounting up to NIS 120 million (approximately Ps.2,689). Acquisition of securities shall be carried out in accordance with market opportunities, dates, prices and quantities, as determined by the management of DIC, in such a way that in any event, the public holdings shall be, at any time, at least 10.1% of the total issued share capital of DIC.
 
Since December 2018 as of the fiscal year-end date, DIC acquired 12.2 million shares for a total amount of NIS 119 million (approximately Ps. 2,196). Additionally, in December 2018, minority shareholders of DIC exercised DIC Series 6 options for an amount of NIS 9 million (approximately Ps.187).
 
As a result of the operations described above, the participation of Dolphin IL in DIC increased approximately by 5.4%. The present transactions were accounted for as equity transactions generating a decrease in the equity attributable to the controlling company for Ps. 143.
 
K) Interest increase in Elron
 
In November and December 2018, DIC acquired an additional 9.2% of Elron in the market for NIS 31 million (equivalent to Ps. 600). Additionally, in June 2020, Elron issued shares to the market and third parties unrelated to the Group acquired an interest in the Company in consideration for NIS 26. These transactions were accounted for as an equity transaction generating a decrease in the equity attributable to the controlling company for Ps. 69.
 
L) Interest increase in DIC
 
On July 5, 2018, Tyrus acquired 2,062,000 of DIC’s shares in the market for a total amount of NIS 20 million (equivalent to Ps. 490), which represent 1.35% of the Company’s outstanding shares at such date. As a result of this transaction, the Group’s equity interest has increased from 76.57% to 77.92%. This transaction was accounted for as an equity transaction generating an increase in the net equity attributable to the controlling company by Ps. 50.
 
Considering was what mentioned in note 4.G. above, the stake of the Group in DIC was approximately 83.77% at June 30, 2020, considering the repurchase of treasury shares.
 
M) Early payment of Ispro bonds
 
In August 2019, the Audit Committee and the Board of Directors of Ispro approved the full advance payment of (Tranche B) corporate bonds, traded on the TASE. The aggregate amount was NIS 131 (approximately Ps. 2,654). The prepayment of these corporate bonds caused Ispro to become a reporting company for TASE and not a listed company.
 
N) Agreement for the sale of Ispro
 
On January 26, 2020, PBC executed an agreement for the sale of all Ispro shares and the rights over the loans granted by the shareholders to ISPRO in consideration for NIS 885. The consummation of the transaction is subject to approval by the Commissioner of Competition pursuant to the Law on Economic Competition, which must be given within a term of 150 days following the execution of the agreement. For this reason, the Group has reclassified the assets and liabilities as available for sale.
 
At the time of the execution of the agreement, the buyer made a deposit of NIS 15 into an account and undertook to deposit an additional amount of NIS 40, following completion of the due diligence process.
 
 
F-39
 
 
On March 23, 2020, the buyer contacted PBC and requested a postponement of the dates specified in the sales agreement. PBC informed the buyer that its request would be considered without detrimentally affecting PBC´s rights and obligations pursuant to the agreement. On March 26, 2020, that is, the date of completion of the due diligence process, the buyer defaulted on its obligation to deposit the second payment installment in an amount of NIS 40, into a trust account.
 
PBC demanded the buyer to cure its default and immediately deposit the second payment installment and proceed with the closing of the transaction in accordance with its terms, without this entailing a limitation on its rights and obligations and any consideration available for the buyer pursuant to the agreement and under the law, until April 20, 2020. Since non-compliance was not occurred until April 20, 2020, the agreement was terminated.
 
In April 2020, PBC executed an agreement with another buyer for NIS 800 involving all ISPRO shares and the rights over the loans granted by PBC to ISPRO. As a consequence of the agreement for the sale of ISPRO´s shares, the Group has reclassified net assets totaling Ps. 16,657 as “Group of Assets available for Sale”. Income to be recognized at the time of the consummation of the transaction shall be NIS 47 (equivalent of Ps. 906 as of the current fiscal year-end).
 
O) Cellcom- Golan Telecom Agreement
 
In February 2020, Cellcom, the shareholders of Golan Telecom and Golan Telecom executed a binding memorandum of understanding for the acquisition of Golan Telecom entire capital stock, for a total amount of NIS 590, payable in 2 installments (NIS 413 at the closing date of the transaction and NIS 177 within a term of 3 years following such closing date). Cellcom shall issue and deposit the Company´s shares for 8.2 million, with a trustee into a trust account (“Shares held in Trust”), as collateral.
 
The transaction provides for standard conditions and representations and is subject to a due diligence process to be performed by Cellcom and the relevant regulatory authorizations and approvals from material third parties. The parties shall carry out negotiations regarding a detailed agreement; however, they are bound to the memorandum of understanding, regardless of whether the agreement may be executed or not. In the event the conditions for the closing of the transaction were not satisfied before December 31, 2020, the memorandum of understanding or the detailed agreement, as applicable, shall be terminated.
 
See Note 35 for further information about the execution of the agreement and the grant of the respective approvals.
 
5. Financial risk management and fair value estimates
 
The Group's activities expose it to a variety of financial risks: market risk (including foreign currency risk, interest rate risk, indexing risk due to specific clauses and other price risks), credit risk, liquidity risk and capital risk. Within the Group, risk management functions are conducted in relation to financial risks associated to financial instruments to which the Group is exposed during a certain period or as of a specific date.
 
The general risk management policies of the Group seek both to minimize adverse potential effects on the financial performance of the Group and to manage and control the financial risks effectively. The Group uses financial instruments to hedge certain risk exposures when deemed appropriate based on its internal management risk policies, as explained below.
 
Given the diversity of characteristics corresponding to the business conducted in its operations centers, the Group has decentralized the risk management policies geographically based on its two operations centers (Argentina and Israel) in order to identify and properly analyze the various types of risks to which each subsidiary is exposed.
 
The Group’s principal financial instruments in the Operation Center in Argentina comprise cash and cash equivalents, receivables, payables, interest bearing assets and liabilities, other financial liabilities, other investments and derivative financial instruments. The Group manages its exposure to key financial risks in accordance with the Group’s risk management policies.
 
The Group’s management framework in the Operation Center in Argentina includes policies, procedures, limits and allowed types of derivative financial instruments. The Group has established a Risk Committee, comprising members of senior management and a member of Cresud’s Audit Committee (Parent Company of IRSA), which reviews and oversees management’s compliance with these policies, procedures and limits and has overall accountability for the identification and management of risk across the Group.
 
 
F-40
 
 
Given the diversity of the activities conducted by IDBD, DIC and its subsidiaries, and the resulting risks, IDBD and DIC manage the exposure to their own key financial risks and those of its wholly-owned subsidiaries (except for IDB Tourism) in conformity with a centralized risk management policy, with the non-wholly owned IDBD and DIC subsidiaries being responsible for establishing the risk policy, taking action to cover market risks and managing their activities in a decentralized way. Both IDBD and DIC as holding and each subsidiary are responsible for managing their own financial risks in accordance with agreed global guidelines. The Chief Financial Officers of each entity are responsible for managing the risk management policies and systems, the definition of hedging strategies, insofar as applicable and based on any restriction that may be apply as a result of financial debt, the supervision of its implementation and the answer to such restrictions. The management framework includes policies, procedures, limits and allowed types of derivative financial instruments.
 
This section provides a description of the principal risks that could have a material adverse effect on the Group’s strategy in each operations center, performance, results of operations and financial condition. The risks facing the businesses, set out below, do not appear in any particular order of potential materiality or probability of occurrence.
 
The analysis of sensitivities to market risks included below are based on a change in one factor while holding all other factors constant. In practice this is unlikely to occur, and changes in some of the factors may be correlated – for example, changes in interest rate and changes in foreign currency rates.
 
This sensitivity analysis provides only a limited, point-in-time view. The actual impact on the Group’s financial instruments may differ significantly from the impact shown in the sensitivity analysis.
 
(a)
Market risk management
 
The market risk is the risk of changes in the market price of financial instruments with which the Group operates. The Group’s market risks arise from open positions in foreign currencies, interest-bearing assets and liabilities and equity securities of certain companies, to the extent that these are exposed to market value movements. The Group sets limits on the exposure to these risks that may be accepted, which are monitored on a regular basis.
 
Foreign Exchange risk and associated derivative financial instruments
 
The Group publishes its Consolidated Financial Statements in Argentine pesos but conducts operations and holds positions in other currencies. As a result, the Group is exposed to foreign currency exchange risk through exchange rate movements, which affect the value of the Group’s foreign currency positions. Foreign exchange risk arises when future commercial transactions or recognized assets or liabilities are denominated in a currency that is not the entity’s functional currency.
 
The real estate, commercial and/or financial activities of the Group’s subsidiaries from the operations center in Argentina have the Argentine Peso as functional currency. An important part of the business activities of these subsidiaries is conducted in that currency, thus not exposing the Group to foreign exchange risk. Other Group's subsidiaries have other functional currencies, principally US Dollar. In the ordinary course of business, the Group, through its subsidiaries, transacts in currencies other than the respective functional currencies of the subsidiaries. These transactions are primarily denominated in US Dollars and New Israeli Shekel. Net financial position exposure to the functional currencies is managed on a case-by-case basis, partly by entering into foreign currency derivative instruments and/or by borrowings in foreign currencies, or other methods, considered adequate by the Management, according to circumstances.
 
Financial instruments are considered sensitive to foreign exchange rates only when they are not in the functional currency of the entity that holds them. The following table shows the net carrying amounts of the Company’s financial instruments nominated in US$ and NIS, broken down by the functional currencies in which the Company operates for the years ended June 30, 2020 and 2019. The amounts are presented in Argentine Pesos, the presentation currency of the Group:
 
1)
Operations Center in Argentina


Net monetary position (liability) / asset
 
Functional currency
 
June 30, 2020
 
 
June 30, 2019


US$
 
 
US$
 
Argentine Peso
  (41,336)
  (22,752)
Uruguayan Peso
  164 
  (295)
Total
  (41,172)
  (23,047)
 
 
F-41
 
 
The Group estimates that, other factors being constant, a 10% appreciation of the US Dollar against the respective functional currencies at year-end for the Operations Center in Argentina would result in a net additional loss before income tax for the years ended June 30, 2020 and 2019 for an amount of Ps. 1,612 and Ps. 2,304, respectively. A 10% depreciation of the US Dollar against the functional currencies would have an equal and opposite effect on the statements of income.
 
On the other hand, the Group also uses derivatives, such as future exchange contracts, to manage its exposure to foreign currency risk. As of June 30, 2020 and 2019 the Group has future exchange contracts pending for an amount of US$ 95 and US$ 22, respectively.
 
2) Operations Center in Israel
 
As of June 30, 2020 and 2019, the net position of financial instruments in US Dollars, which exposes the Group to the foreign currency risk amounts to Ps. (1,425) and Ps. (12,806), respectively. The Group estimates that, other factors being constant, a 10% appreciation of the US Dollar against the Israeli currency would increase loss before income tax for the year ended June 30, 2020 for an amount of Ps. 536 (Ps. 934 loss in 2019).
 
Interest rate risk
 
The Group is exposed to interest rate risk on its investments in debt instruments, short-term and long-term borrowings and derivative financial instruments.
 
The primary objective of the Group’s investment activities is to preserve principal while at the same time maximizing yields without significantly increasing risk. To achieve this objective, the Group diversifies its portfolio in accordance with the limits set by the Group. The Group maintains a portfolio of cash equivalents and short-term investments in a variety of securities, including both government and corporate obligations and money market funds.
 
The Group’s interest rate risk principally arises from long-term borrowings (Note 19). Borrowings issued at variable rates expose the Group to cash flow interest rate risk. Borrowings issued at fixed rates expose the Group to fair value interest rate risk.
 
As of June 30, 2020 and 2019, 95.2% and 94.1% of the Group’s long-term financial loans in this operation center have a fixed interest rate so that IRSA is not significantly exposed to the fluctuation risk of the interest rate.
 
1) Operations Center in Argentina
 
The Group manages this risk by maintaining an appropriate mix between fixed and floating rate interest bearing liabilities. These activities are evaluated regularly to determine that the Group is not exposed to interest rate fluctuations that could adversely impact its ability to meet its financial obligations and to comply with its borrowing covenants.
 
The Group occasionally manages its cash flow interest rate risk exposure by different hedging instruments, including but not limited to interest rate swap, depending on each particular case. For example, interest rate swaps have the economic effect of converting borrowings from floating rates to fixed rates or vice versa.
 
The interest rate risk policy is approved by the Board of Directors. Management analyses the Group’s interest rate exposure on a dynamic basis. Various scenarios are simulated, taking into consideration refinancing, renewal of existing positions and alternative financing sources. Based on these scenarios, the Group calculates the impact on profit and loss of a defined interest rate shift. The scenarios are run only for liabilities that represent the major interest-bearing positions. Trade payables are normally interest-free and have settlement dates within one year. The simulation is done on a regular basis to verify that the maximum potential loss is within the limits set by management.
 
Note 20 shows a breakdown of the Group’s fixed-rate and floating-rate borrowings per currency denomination and functional currency of the subsidiary that holds the loans for the fiscal years ended June 30, 2020 and 2019.
 
The Group estimates that, other factors being constant, a 1% increase in floating rates at year-end would increase net loss before income tax for the years ended June 30, 2020 and 2019 in the amount of Ps. 33.3 and Ps. 33.6, respectively. A 1% decrease in floating rates would have an equal and opposite effect on the Statement of Income.
 
 
F-42
 
 
2) Operations Center in Israel
 
IDBD and DIC manage the exposure to the interest rate risk in a decentralized way and it is monitored regularly by different management offices in order to confirm that there are no adverse effects over their ability to meet their financial obligations and to comply with their borrowings covenants.
 
As of June 30, 2020 and 2019, the 99.4% and 97.1%, respectively, of the Group’s long-term financial borrowings in this operations center are at fixed interest rate, therefore, the Group is not significantly exposed to the interest rate fluctuation risk.
 
The Group estimates that, other factors being constant, a 1% increase in floating rates at year-end would increase net loss before income tax for the year ended June 30, 2020, in approximately Ps. 60 (approximately Ps. 150 in 2019). A 1% decrease in floating rates would have an equal and opposite effect on the Statement of Income.
 
Risk of fluctuations of the Consumer Price Index ("CPI") of Israel
 
The Operations Center in Israel has financial liabilities indexed by the Israeli CPI.
 
Net financial position exposure to the Israeli CPI fluctuations is managed in a decentralized way on a case-by-case basis, by entering into different derivative financial instruments, as the case may be, or by other methods, considered adequate by the Management, based on the circumstances.
 
As of June 30, 2020, 36.9% of the loans are affected by the evolution of the CPI. A 1% increase in the CPI would generate a loss of Ps. 1,112 (Ps.1,617 for 2019) and a decrease of 1% generates a profit of Ps. 1,135 (Ps.1,635 for 2019).
 
Other price risks
 
The Group is exposed to equity securities price risk or derivative financial instruments because of investments held in entities that are publicly traded, which were classified on the Consolidated Statements of Financial Position at “fair value through profit or loss”. The Group regularly reviews the prices evolution of these equity securities in order to identify significant movements.
 
As of June 30, 2020 and 2019 the total value of Group’s investments in shares and derivative financial instruments of public companies amounts to Ps. 20,869 and Ps. 8,595, respectively.
 
In the Operations Center in Israel the investment in Clal is classified on the Statements of Financial Position at “fair value through profit or loss” and represents the most significant IDBD’s exposure to price risk. Neither IDBD or DIC has used hedging against these risks (Note 13). IDBD and DIC regularly review the prices evolution of these equity securities in order to identify significant movements.
 
The Group estimates that, other factors being constant, a 10% decrease in quoted prices of equity securities and in derivative financial instruments portfolio at year-end would generate a loss before income tax for the year ended June 30, 2020, of Ps. 2,086 (Ps. 859 in 2019) for the Operations Center in Argentina and a loss before income tax for the year ended June 30, 2020, of Ps. 464 (Ps. 2,746 in 2019) for the Operations Center in Israel. An increase of 10% on these prices would have an equal and opposite effect in the Statement of Income.
 
(b) Credit risk management
 
The credit risk arises from the potential non-performance of contractual obligations by the parties, with a resulting financial loss for the Group. Credit limits have been established to ensure that the Group deals only with approved counterparties and that counterparty concentration risk is addressed and the risk of loss is mitigated. Counterparty exposure is measured as the aggregate of all obligations of any single legal entity or economic entity to the Group.
 
The Group is subject to credit risk arising from deposits with banks and financial institutions, investments of surplus cash balances, the use of derivative financial instruments and from outstanding receivables
 
In the Operations Center in Argentina, the credit risk is managed on a country-by-country basis. Each local entity is responsible for managing and analyzing the credit risk. In the Operations Center in Israel, under the policy established by IDBD’s board of directors, the management deposits excess cash in local banks which are not company creditors, in order to keep minimum risk values in cash balances.
 
 
F-43
 
 
The Group’s policy in each operations center is to manage credit exposure from deposits, short-term investments and other financial instruments by maintaining diversified funding sources in various financial institutions. All the institutions that operate with the Group are well known because of their experience in the market and high credit quality. The Group places its cash and cash equivalents, investments, and other financial instruments with various high credit quality financial institutions, thus mitigating the amount of credit exposure to any one institution. The maximum exposure to credit risk is represented by the carrying amount of cash and cash equivalents and short-term investments in the Statements of Financial Position.
 
1) Operations Center in Argentina
 
Trade receivables related to leases and services provided by the Group represent a diversified tenant base and account for 94.2% and 99.1% of the Group’s total trade receivables of the operations center as of June 30, 2020 and 2019, respectively. The Group has specific policies to ensure that rental contracts are transacted with counterparties with appropriate credit quality. The majority of the Group’s shopping mall, offices and other rental properties’ tenants are well recognized retailers, diversified companies, professional organizations, and others. Owing to the long-term nature and diversity of its tenancy arrangements, the credit risk of this type of trade receivables is considered to be low. Generally, the Group has not experienced any significant losses resulting from the non-performance of any counterpart to the lease contracts and, as a result, the allowance for doubtful accounts balance is low. Individual risk limits are set based on internal or external ratings in accordance with limits set by the Group. If there is no independent rating, risk control assesses the credit quality of the customer, taking into account its past experience, financial position, actual experience and other factors. Based on the Group’s analysis, the Group determines the size of the deposit that is required from the tenant at inception. Management does not expect any material losses from non-performance by these counterparties. See details on Note 15.
 
On the other hand, property receivables related to the sale of trading properties represent 5.8% and 0.9% of the Group’s total trade receivables as of June 30, 2020 and 2019, respectively. Payments on these receivables have generally been received when due. These receivables are generally secured by mortgages on the properties. Therefore, the credit risk on outstanding amounts is considered very low.
 
2) Operations Center in Israel
 
IDBD’s and DIC’s primary objective for holding derivative financial instruments is to manage currency exchange rate risk and interest rate risk. IDBD and DIC generally enters into derivative transactions with high-credit-quality counterparties and, by policy, limits the amount of credit exposure to each counterparty. The amounts subject to credit risk related to derivative instruments are generally limited to the amounts, if any, by which counterparty’s obligations exceed the obligations that IDBD has with that counterparty. The credit risk associated with derivative financial instruments is representing by the carrying value of the assets positions of these instruments.
 
IDBD and DIC’s policy is to manage credit exposure to trade and other receivables within defined trading limits. All IDBD’s significant counterparties have internal trading limits.
 
Trade receivables from investment and development property activities are primarily derived from leases and services from shopping malls, offices and other rental properties; receivables from the sale of trading properties and investment properties (primarily undeveloped land and non-retail rental properties). IDBD and DIC have a large customer base and is not dependent on any single customer. The credits for sales from the activities of telecommunications and supermarkets do not present large concentrations of credit risk, not depending on a few customers and with most of their transactions in cash or with credit cards (Note 14).
 
(c) Liquidity risk management
 
The Group is exposed to liquidity risks, including risks associated with refinancing borrowings as they mature, the risk that borrowing facilities are not available to meet cash requirements, and the risk that financial assets cannot readily be converted to cash without loss of value. Failure to manage liquidity risks could have a material impact on the Group’s cash flow and Statements of Financial Position.
 
Prudent liquidity risk management implies maintaining sufficient cash, the availability of funding through an adequate amount of committed credit facilities and the ability to close out market positions. Due to the dynamic nature of the underlying businesses, the Group aims to maintain flexibility in funding its existing and prospective debt requirements by maintaining diversified funding sources.
 
 
F-44
 
 
Each operation center monitors its current and projected financial position using several key internally generated reports: cash flow; debt maturity; and interest rate exposure. The Group also undertakes sensitivity analysis to assess the impact of proposed transactions, movements in interest rates and changes in property values on the key profitability, liquidity and balance sheet ratios.
 
The debt of each operation center and the derivative positions are continually reviewed to meet current and expected debt requirements. Each operation center maintains a balance between longer-term and shorter-term financings. Short-term financing is principally raised through bank facilities and overdraft positions. Medium- to longer-term financing comprises public and private bond issues, including private placements. Financing risk is spread by using a variety of types of debt. The maturity profile is managed in accordance with each operation center needs, by spreading the repayment dates and extending facilities, as appropriate.
 
The tables below show financial liabilities, including each operation center derivative financial liabilities groupings based on the remaining period at the Statements of Financial Position to the contractual maturity date. The amounts disclosed in the tables are the contractual undiscounted cash flows and as a result, they do not reconcile to the amounts disclosed on the Statements of Financial Position. However, undiscounted cash flows in respect of balances due within 12 months generally equal their carrying amounts in the Statements of Financial Position, as the impact of discounting is not significant. The tables include both interest and principal flows.
 
Where the interest payable is not fixed, the amount disclosed has been determined by reference to the existing conditions at the reporting date.
 
1)
Operations Center in Argentina
 
June 30, 2020
 
Less than 1 year
 
 
Between 1 and 2 years
 
 
Between 2 and 3 years
 
 
Between 3 and 4 years
 
 
More than 4 years
 
 
Total
 
Trade and other payables
  1,671 
  168 
  74 
  236 
  1 
  2,150 
Borrowings (excluding finance leases liabilities)
  41,342 
  3,534 
  29,368 
  70 
  233 
  74,547 
Purchase obligations
  6,131 
  919 
  635 
  - 
  - 
  7,685 
Finance leases obligations
  57 
  53 
  55 
  58 
  1,390 
  1,613 
Derivative Financial Instruments
  89 
  30 
  6 
  - 
  - 
  125 
Total
  49,290 
  4,704 
  30,138 
  364 
  1,624 
  86,120 


June 30, 2019
 
Less than 1 year
 
 
Between 1 and 2 years
 
 
Between 2 and 3 years
 
 
Between 3 and 4 years
 
 
More than 4 years
 
 
Total
 
Trade and other payables
  2,366 
  360 
  157 
  1 
  416 
  3,300 
Borrowings (excluding finance leases liabilities)
  14,114 
  21,059 
  4,076 
  2,664 
  23,545 
  65,458 
Purchase obligations
  1,967 
  - 
  - 
  - 
  - 
  1,967 
Finance leases obligations
  17 
  6 
  1 
  - 
  - 
  24 
Derivative Financial Instruments
  20 
  12 
  6 
  1 
  - 
  39 
Total
  18,484 
  21,437 
  4,240 
  2,666 
  23,961 
  70,788 
 
 
F-45
 
 
2) Operations Center in Israel
 
June 30, 2020
 
Less than 1 year
 
 
Between 1 and 2 years
 
 
Between 2 and 3 years
 
 
Between 3 and 4 years
 
 
More than 4 years
 
 
Total
 
Trade and other payables
  27,460 
  372 
  66 
  22 
  22 
  27,942 
Borrowings (excluding finance leases liabilities)
  57,368 
  58,565 
  101,243 
  46,347 
  132,433 
  395,956 
Purchase obligations
  5,639 
  4,334 
  3,072 
  1,944 
  7,092 
  22,081 
Finance leases obligations
  6,131 
  919 
  635 
  - 
  - 
  7,685 
Derivative Financial Instruments
  22 
  - 
  - 
  - 
  - 
  22 
Total
  96,620 
  64,190 
  105,016 
  48,313 
  139,547 
  453,686 


June 30, 2019
 
Less than 1 year
 
 
Between 1 and 2 years
 
 
Between 2 and 3 years
 
 
Between 3 and 4 years
 
 
More than 4 years
 
 
Total
 
Trade and other payables
  23,269 
  459 
  220 
  - 
  - 
  23,948 
Borrowings (excluding finance leases liabilities)
  72,291 
  59,049 
  62,560 
  98,217 
  211,136 
  503,253 
Purchase obligations
  37 
  37 
  - 
  - 
  - 
  74 
Finance leases obligations
  4,610 
  1,469 
  807 
  533 
  - 
  7,419 
Derivative Financial Instruments
  37 
  - 
  - 
  - 
  - 
  37 
Total
  100,244 
  61,014 
  63,587 
  98,750 
  211,136 
  534,731 
 
See Note 20 for a description of the commitments and restrictions related to loans and the ongoing renegotiations.
 
(d) Capital risk management
 
The capital structure of the Group consists of shareholders’ equity and net borrowings. The Group’s equity is analyzed into its various components in the statements of changes in equity. Capital is managed so as to promote the long-term success of the business and to maintain sustainable returns for shareholders. The Group seeks to manage its capital requirements to maximize value through the mix of debt and equity funding, while ensuring that Group entities continue to operate as going concerns, comply with applicable capital requirements and maintain strong credit ratings.
 
The Group assesses the adequacy of its capital requirements, cost of capital and gearing (i.e., debt/equity mix) as part of its broader strategic plan. The Group continuously reviews its capital structure to ensure that (i) sufficient funds and financing facilities are available to implement the Group’s property development and business acquisition strategies, (ii) adequate financing facilities for unforeseen contingencies are maintained, and (iii) distributions to shareholders are maintained within the Group’s dividend distribution policy. The Group also protects its equity in assets by obtaining appropriate insurance.
 
The Group’s strategy is to maintain key financing metrics (net debt to total equity ratio or gearing and debt ratio) in order to ensure that asset level performance is translated into enhanced returns for shareholders whilst maintaining an appropriate risk reward balance to accommodate changing financial and operating market cycles.
 
The following tables details the Group’s key metrics in relation to managing its capital structure. The ratios are within the ranges previously established by the Group’s strategy.
 
Operation Center in Argentina
 
 
June 30, 2020
 
 
June 30, 2019
 
Gearing ratio (i)
  56.92%
  40.80%
Debt ratio (ii)
  59.71%
  47.54%
 
Operation Center in Israel


June 30, 2020
 
 
June 30, 2019
 
Gearing ratio (i)
  81.55%
  86.64%
Debt ratio (ii)
  227.18%
  286.90 
 
(i)
Calculated as total of borrowings over total borrowings plus equity attributable equity holders of the parent company.
(ii)
Calculated as total borrowings over total properties (including trading properties, property, plant and equipment, investment properties and rights to receive units under barter agreements).
 
F-46
 
 
6. Segment information
 
IFRS 8 requires an entity to report financial and descriptive information about its reportable segments, which are operating segments or aggregations of operating segments that meet specified criteria. Operating segments are components of an entity about which separate financial information is available that is evaluated regularly by the CODM. According to IFRS 8, the CODM represents a function whereby strategic decisions are made and resources are assigned. The CODM function is carried out by the President of the Group, Mr. Eduardo S. Elsztain. In addition, and due to the acquisition of IDBD, two responsibility levels have been established for resource allocation and assessment of results of the two operations centers, through executive committees in Argentina and Israel.
 
Segment information is reported from two perspectives: geographic presence (Argentina and Israel) and products and services. In each operations center, the Group considers separately the various activities being developed, which represent reporting operating segments given the nature of its products, services, operations and risks. Management believes the operating segment clustering in each operations center reflects similar economic characteristics in each region, as well as similar products and services offered, types of clients and regulatory environments.
 
As from fiscal year 2018, the CODM reviews certain corporate expenses associated with each operation center in an aggregate manner and separately from each of the segments, such expenses have been disclosed in the "Corporate" segment of each operation center. Additionally, as from fiscal year 2018, the CODM also reviews the office business as a single segment and the entertainment business in an aggregate and separate manner from offices, including that concept in the "Others" segment.
 
As further explained in Note 1, on September 25, 2020, the Group lost control over IDBD and DIC, which comprise the entire Operations Center in Israel. Accordingly, segment information in these financial statements has been recast to reflect the deconsolidation of IDBD, DIC and its subsidiaries. Starting on October 1, 2020, the Group has a single geographic segment, located in Argentina.
 
Below is the segment information which was prepared as follows:
 
 Operations Center in Argentina: Within this operations center, the Group operates in the following segments:
 
o
The “Shopping Malls” segment includes results principally comprised of lease and service revenues related to rental of commercial space and other spaces in the shopping malls of the Group.
o
The “Offices” segment includes the operating results from lease revenues of offices, other rental spaces and other service revenues related to the office activities.
o
The “Sales and Developments” segment includes the operating results of the development, maintenance and sales of undeveloped parcels of land and/or trading properties. Real estate sales results are also included.
o
The "Hotels" segment includes the operating results mainly comprised of room, catering and restaurant revenues.
o
The “International” segment includes assets and operating profit or loss from business related to associates Condor (hotels) and New Lipstick (offices).
o
The “Others” segment primarily includes the entertainment activities through ALG Golf Center S.A., La Rural S.A. and TGLT, and the financial activities carried out by BHSA.
o
The “Corporate” segment includes the expenses related to the corporate activities of the Operations Center in Argentina.
 
As of the 2018 fiscal year, the CODM reviews the office business as a single segment and the entertainment business in an aggregate manner and separately from offices, and has been exposed in the "Others" segment.
 
The CODM periodically reviews the results and certain asset categories and assesses performance of operating segments of this operations center based on a measure of profit or loss of the segment composed by the operating income plus the share of profit / (loss) of joint ventures and associates. The valuation criteria used in preparing this information are consistent with IFRS standards used for the preparation of the Consolidated Financial Statements, except for the following:
 
Operating results from joint ventures are evaluated by the CODM applying proportional consolidation method. Under this method the profit/loss generated and assets are reported in the Statement of Income line-by-line based on the percentage held in joint ventures rather than in a single item as required by IFRS. Management believes that the proportional consolidation method provides more useful information to understand the business return. On the other hand, the investment in the joint venture La Rural S.A. is accounted for under the equity method since this method is considered to provide more accurate information in this case.
 
F-47
 
 
Operating results from Shopping Malls and Offices segments do not include the amounts pertaining to building administration expenses and collective promotion funds (“FPC”, as per its Spanish acronym) as well as total recovered costs, whether by way of expenses or other concepts included under financial results (for example default interest and other concepts). The CODM examines the net amount from these items (total surplus or deficit between building administration expenses and FPC and recoverable expenses).
 
The assets’ categories examined by the CODM are: investment properties, property, plant and equipment, trading properties, inventories, right to receive future units under barter agreements, investment in associates and goodwill. The sum of these assets, classified by business segment, is reported under “assets by segment”. Assets are allocated to each segment based on the operations and/or their physical location.
 
Within the Operations Center in Argentina, most revenue from its operating segments is derived from, and their assets are located in, Argentina, except for the share of profit / (loss) of associates included in the “International” segment located in USA.
 
Revenues for each reporting segments derive from a large and diverse client base and, therefore, there is no revenue concentration in any particular segment.
 
 Operations Center in Israel: As explained in Note 1, results of operations and cash flows of the Operations Center in Israel have been presented within discontinued operations in these financial statements. Within this operations center, the Group operates in the following segments:
 
o
The “Real Estate” segment in which, through PBC, the Group operates rental properties and residential properties in Israel, USA and other parts of the world and carries out commercial projects in Las Vegas, USA. In this fiscal year, the Company lost control over Gav-Yam. Income was reclassified to discontinued operations and no longer forms part of this segment in this fiscal year. Such effect was reclassified in the comparative information. As of September 2018, Gav-Yam started to be valued as an associate.
o
The “Supermarkets” segment in which, through Shufersal, the Group operated a supermarket chain in Israel. Upon the loss of control in 2018 this segment was reclassified to discontinued operations and presented as an associate since 2019. Due to the loss of control, it was reclassified to discontinued operations and no longer forms part of the segment for fiscal year 2018.
o
The “Telecommunications” segment includes Cellcom whose main activities include the provision of mobile phone services, fixed line phone services, data, Internet and television, among others.
o
The "Insurance" segment includes the investment in Clal, insurance company which main activities includes pension and social security insurance, among others. As stated in Note 14, the Group does not have control over Clal; therefore, the business is reported in a single line as a financial asset held for sale and valued at fair value.
o
The "Others" segment includes other diverse business activities, such as technological developments, tourism, oil and gas assets, electronics, sale of fruit and others.
o
The “Corporate” segment includes the expenses related with the activities of the holding companies.
 
The CODM periodically reviews the results and certain asset categories and assesses performance of operating segments of this operations center based on a measure of profit or loss of the segment composed by the operating income plus the share of profit / (loss) of associates and joint ventures. The valuation criteria used in preparing this information are consistent with IFRS standards used for the preparation of the Consolidated Financial Statements.
 
Goods and services exchanged between segments are calculated on the basis of established prices. Intercompany transactions between segments, if any, are eliminated.
 
Below is a summary of the Group’s lines of business and a reconciliation between the results from operations as per segment information and the results from operations as per the Statements of Income for the years ended June 30, 2020, 2019 and 2018:


F-48
IRSA Inversiones y Representaciones Sociedad Anónima


June 30, 2020


Operations Center in Argentina
 
 
Operations Center in Israel
 
 
Total
 
 
Joint ventures (1)
 
 
Expensesand collectivepromotion funds
 
 
Elimination of inter-segment transactions and non-reportable assets / liabilities (2)
 
 
Total as per statement of income / statement of financial position
 
Revenues
  11,991 
  - 
  11,991 
  (65)
  3,338 
  (24)
  15,240 
Costs
  (2,940)
  - 
  (2,940)
  57 
  (3,476)
  - 
  (6,359)
Gross profit / (loss)
  9,051 
  - 
  9,051 
  (8)
  (138)
  (24)
  8,881 
Net gain from fair value adjustment of investment properties
  36,596 
  - 
  36,596 
  (283)
  - 
  - 
  36,313 
General and administrative expenses
  (2,317)
  (99)
  (2,416)
  15 
  - 
  36 
  (2,365)
Selling expenses
  (1,325)
  - 
  (1,325)
  19 
  - 
  - 
  (1,306)
Impairment of associates and joint ventures
  - 
  - 
  - 
  - 
  - 
  - 
  - 
Other operating results, net
  (49)
  - 
  (49)
  19 
  18 
  (12)
  (24)
Profit / (loss) from operations
  41,956 
  (99)
  41,857 
  (238)
  (120)
  - 
  41,499 
Share of profit of associates and joint ventures
  7,587 
  - 
  7,587 
  184 
  - 
  - 
  7,771 
Segment profit / (loss)
  49,543 
  (99)
  49,444 
  (54)
  (120)
  - 
  49,270 
Reportable assets
  170,379 
  485,812 
  656,191 
  (745)
  - 
  19,764 
  675,210 
Reportable liabilities
  - 
  (434,048)
  (434,048)
  - 
  - 
  (109,118)
  (543,166)
Net reportable assets
  170,379 
  51,764 
  222,143 
  (745)
  - 
  (89,354)
  132,044 


June 30, 2019


Operations Center in Argentina
 
 
Operations Center in Israel
 
 
Total
 
 
Joint ventures (1)
 
 
Expensesand collectivepromotion funds
 
 
Elimination of inter-segment transactions and non-reportable assets / liabilities (2)
 
 
Total as per statement of income / statement of financial position
 
Revenues
  16,208 
  - 
  16,208 
  (101)
  3,990 
  (26)
  20,071 
Costs
  (3,418)
  - 
  (3,418)
  71 
  (4,151)
  - 
  (7,498)
Gross profit / (loss)
  12,790 
  - 
  12,790 
  (30)
  (161)
  (26)
  12,573 
Net gain from fair value adjustment of investment properties
  (42,639)
  - 
  (42,639)
  902 
  - 
  - 
  (41,737)
General and administrative expenses
  (2,880)
  (115)
  (2,995)
  19 
  - 
  48 
  (2,928)
Selling expenses
  (1,168)
  - 
  (1,168)
  8 
  - 
  - 
  (1,160)
Other operating results, net
  (711)
  - 
  (711)
  209 
  18 
  (22)
  (506)
(Loss) / profit from operations
  (34,608)
  (115)
  (34,723)
  1,108 
  (143)
  - 
  (33,758)
Share of profit of associates and joint ventures
  (6,492)
  - 
  (6,492)
  (1,096)
  - 
  - 
  (7,588)
Segment (loss) / profit
  (41,100)
  (115)
  (41,215)
  12 
  (143)
  - 
  (41,346)
Reportable assets
  120,102 
  576,561 
  696,663 
  (656)
  - 
  34,279 
  730,286 
Reportable liabilities
  - 
  (496,305)
  (496,305)
  - 
  - 
  (101,937)
  (598,242)
Net reportable assets
  120,102 
  80,256 
  200,358 
  (656)
  - 
  (67,658)
  132,044 


June 30, 2018


Operations Center in Argentina
 
 
Operations Center in Israel
 
 
Total
 
 
Joint ventures (1)
 
 
Expensesand collectivepromotion funds
 
 
Elimination of inter-segment transactions and non-reportable assets / liabilities (2)
 
 
Total as per statement of income / statement of financial position
 
Revenues
  14,935 
  - 
  14,935 
  (116)
  4,724 
  (21)
  19,522 
Costs
  (3,016)
  - 
  (3,016)
  74 
  (4,785)
  - 
  (7,727)
Gross profit / (loss)
  11,919 
  - 
  11,919 
  (42)
  (61)
  (21)
  11,795 
Net gain from fair value adjustment of investment properties
  21,764 
  - 
  21,764 
  (1,137)
  - 
  - 
  20,627 
General and administrative expenses
  (2,513)
  (84)
  (2,597)
  44 
  - 
  35 
  (2,518)
Selling expenses
  (1,211)
  - 
  (1,211)
  16 
  - 
  - 
  (1,195)
Other operating results, net
  (57)
  - 
  (57)
  46 
  (2)
  (14)
  (27)
Profit / (loss) from operations
  29,902 
  (84)
  29,818 
  (1,073)
  (63)
  - 
  28,682 
Share of profit of associates and joint ventures
  (4,551)
  - 
  (4,551)
  1,000 
  - 
  - 
  (3,551)
Segment profit / (loss)
  25,351 
  (84)
  25,267 
  (73)
  (63)
  - 
  25,131 
Reportable assets
  164,606 
  606,800 
  771,406 
  331 
  - 
  27,117 
  798,854 
Reportable liabilities
  - 
  (515,728)
  (515,728)
  - 
  - 
  (111,024)
  (626,752)
Net reportable assets
  164,606 
  91,072 
  255,678 
  331 
  - 
  (83,907)
  172,102 
 
(1) Represents the equity value of joint ventures that were proportionately consolidated for information by segment purposes.
 
(2) Includes deferred income tax assets, income tax and MPIT credits, trade and other receivables, investment in financial assets, cash and cash equivalents and intangible assets except for rights to receive future units under barter agreements, net of investments in associates with negative equity which are included in provisions in the amount of Ps. 18, Ps. 9,322 and Ps. 5,870, as of June 30, 2020, 2019 and 2018, respectively.
 
 
F-49
 

Below is a summarized analysis of the lines of business of Group’s operations center in Argentina for the fiscal years ended June 30, 2020, 2019 and 2018:


June 30, 2020


Operations Center in Argentina


Shopping Malls
 
 
Offices
 
 
Sales and developments
 
 
Hotels
 
 
International
 
 
Corporate
 
 
Others
 
 
Total
 
Revenues
  6,389 
  2,539 
  791 
  2,176 
  12 
  - 
  84 
  11,991 
Costs
  (610)
  (149)
  (722)
  (1,340)
  (13)
  - 
  (106)
  (2,940)
Gross profit / (loss)
  5,779 
  2,390 
  69 
  836 
  (1)
  - 
  (22)
  9,051 
Net (loss) / gain from fair value adjustment of investment properties
  (2,266)
  25,067 
  13,111 
  - 
  - 
  - 
  684 
  36,596 
General and administrative expenses
  (892)
  (238)
  (245)
  (394)
  (118)
  (304)
  (126)
  (2,317)
Selling expenses
  (763)
  (90)
  (212)
  (248)
  - 
  - 
  (12)
  (1,325)
Other operating results, net
  (40)
  (30)
  (29)
  (22)
  - 
  - 
  72 
  (49)
Profit / (loss) from operations
  1,818 
  27,099 
  12,694 
  172 
  (119)
  (304)
  596 
  41,956 
Share of profit of associates and joint ventures
  - 
  - 
  - 
  - 
  7,942 
  - 
  (355)
  7,587 
Segment profit
  1,818 
  27,099 
  12,694 
  172 
  7,823 
  (304)
  241 
  49,543 


Investment properties and trading properties
  52,868 
  67,600 
  34,634 
  - 
  331 
  - 
  1,552 
  156,985 
Investment in associates and joint ventures
  - 
  - 
  573 
  - 
  2,157 
  - 
  7,253 
  9,983 
Other operating assets
  297 
  227 
  811 
  1,979 
  - 
  - 
  97 
  3,411 
Operating assets
  53,165 
  67,827 
  36,018 
  1,979 
  2,488 
  - 
  8,902 
  170,379 
 
From all the revenues corresponding to the Operations Center in Argentina, Ps. 11,979 are originated in Argentina, and Ps. 12 in the U.S. No external client represents 10% or more of revenue of any of the reportable segments. From all of the assets corresponding to the Operations Center in Argentina segments, Ps. 167,271 are located in Argentina and Ps. 3,107 in other countries, principally in USA for Ps. 2,488 and Uruguay for Ps. 619.


June 30, 2019


Operations Center in Argentina


Shopping Malls
 
 
Offices
 
 
Sales and developments
 
 
Hotels
 
 
International
 
 
Corporate
 
 
Others
 
 
Total
 
Revenues
  9,195 
  2,409 
  1,205 
  3,179 
  15 
  - 
  205 
  16,208 
Costs
  (835)
  (141)
  (566)
  (1,707)
  (6)
  - 
  (163)
  (3,418)
Gross profit
  8,360 
  2,268 
  639 
  1,472 
  9 
  - 
  42 
  12,790 
Net (loss) / gain from fair value adjustment of investment properties
  (43,687)
  663 
  782 
  - 
  6 
  - 
  (403)
  (42,639)
General and administrative expenses
  (1,017)
  (228)
  (305)
  (530)
  (118)
  (560)
  (122)
  (2,880)
Selling expenses
  (571)
  (107)
  (127)
  (340)
  - 
  - 
  (23)
  (1,168)
Other operating results, net
  (118)
  (43)
  (309)
  123 
  (26)
  - 
  (338)
  (711)
(Loss) / profit from operations
  (37,033)
  2,553 
  680 
  725 
  (129)
  (560)
  (844)
  (34,608)
Share of profit of associates and joint ventures
  - 
  - 
  (40)
  - 
  (3,960)
  - 
  (2,492)
  (6,492)
Segment (loss) / profit
  (37,033)
  2,553 
  640 
  725 
  (4,089)
  (560)
  (3,336)
  (41,100)


Investment properties and trading properties
  54,220 
  34,104 
  29,883 
  2,047 
  291 
  - 
  1,143 
  121,688 
Investment in associates and joint ventures
  11 
  61 
  477 
  - 
  (7,775)
  - 
  5,367 
  (1,859)
Other operating assetsInvestment
  46 
  1 
  198 
  28 
  - 
  - 
  - 
  273 
Operating assets
  54,277 
  34,166 
  30,558 
  2,075 
  (7,484)
  - 
  6,510 
  120,102 
 
From all the revenues corresponding to the Operations Center in Argentina, included in the segments Ps. 15,678 are originated in Argentina, Ps. 515 are originated in Uruguay and Ps. 15 are originated in USA. No external client represents 10% or more of revenue of any of the reportable segments. From all of the assets corresponding to the Operations Center in Argentina segments, Ps. 126,960 are located in Argentina and Ps. (6,858) in other countries, principally in USA for Ps. (7,484) and Uruguay for Ps. 627.
 
 
F-50
IRSA Inversiones y Representaciones Sociedad Anónima


June 30, 2018


Operations Center in Argentina


Shopping Malls
 
 
Offices
 
 
Sales and developments
 
 
Hotels
 
 
International
 
 
Corporate
 
 
Others
 
 
Total
 
Revenues
  10,497 
  1,434 
  324 
  2,633 
  - 
  - 
  47 
  14,935 
Costs
  (892)
  (113)
  (160)
  (1,798)
  - 
  - 
  (53)
  (3,016)
Gross profit / (loss)
  9,605 
  1,321 
  164 
  835 
  - 
  - 
  (6)
  11,919 
Net gain from fair value adjustment of investment properties
  6,746 
  6,728 
  7,900 
  - 
  - 
  - 
  390 
  21,764 
General and administrative expenses
  (917)
  (235)
  (213)
  (524)
  (127)
  (413)
  (84)
  (2,513)
Selling expenses
  (653)
  (153)
  (62)
  (335)
  - 
  - 
  (8)
  (1,211)
Other operating results, net
  (113)
  (24)
  149 
  (43)
  (62)
  - 
  36 
  (57)
Profit / (loss) from operations
  14,668 
  7,637 
  7,938 
  (67)
  (189)
  (413)
  328 
  29,902 
Share of profit of associates and joint ventures
  - 
  - 
  4 
  - 
  (4,763)
  - 
  208 
  (4,551)
Segment profit / (loss)
  14,668 
  7,637 
  7,942 
  (67)
  (4,952)
  (413)
  536 
  25,351 


Investment properties and trading properties
  97,100 
  30,763 
  27,074 
  2,162 
  212 
  - 
  1,435 
  158,746 
Investment in associates and joint ventures
  11 
  61 
  480 
  - 
  (4,165)
  - 
  9,177 
  5,564 
Other operating assets
  61 
  3 
  203 
  29 
  - 
  - 
  - 
  296 
Operating assets
  97,172 
  30,827 
  27,757 
  2,191 
  (3,953)
  - 
  10,612 
  164,606 
 
From all the revenues corresponding to the Operations Center in Argentina, the 100% are originated in Argentina. No external client represents 10% or more of revenue of any of the reportable segments. From all of the assets corresponding to the Operations Center in Argentina segments, Ps. 167,823 are located in Argentina and Ps. (3,216) in other countries, principally in USA for Ps. (3,905) and Uruguay for Ps. 737 million.
 
Below is a summarized analysis of the lines of business of Group’s Operations Center in Israel for the years ended June 30, 2020, 2019 and 2018:


June 30, 2020


Operations Center in Israel


Real Estate
 
 
Supermarkets
 
 
Telecommunications
 
 
Insurance
 
 
Corporate
 
 
Others
 
 
Total
 
Revenues
  - 
  - 
  - 
  - 
  - 
  - 
  - 
Costs
  - 
  - 
  - 
  - 
  - 
  - 
  - 
Gross profit
  - 
  - 
  - 
  - 
  - 
  - 
  - 
Net loss from fair value adjustment of investment properties
  - 
  - 
  - 
  - 
  - 
  - 
  - 
General and administrative expenses
  - 
  - 
  - 
  - 
  (99)
  - 
  (99)
Selling expenses
  - 
  - 
  - 
  - 
  - 
  - 
  - 
Impairment of associates and joint ventures
  - 
  - 
  - 
  - 
  - 
  - 
  - 
Other operating results, net
  - 
  - 
  - 
  - 
  - 
  - 
  - 
Profit from operations
  - 
  - 
  - 
  - 
  (99)
  - 
  (99)
Share of loss of associates and joint ventures
  - 
  - 
  - 
  - 
  - 
  - 
  - 
Segment profit
  - 
  - 
  - 
  - 
  (99)
  - 
  (99)


Operating assets
  164,649 
  30,240 
  150,744 
  3,636 
  19,282 
  117,261 
  485,812 
Operating liabilities
  (157,533)
  - 
  (114,196)
  - 
  (120,196)
  (42,123)
  (434,048)
Operating assets (liabilities), net
  7,116 
  30,240 
  36,548 
  3,636 
  (100,914)
  75,138 
  51,764 


June 30, 2019


Operations Center in Israel


Real Estate
 
 
Supermarkets
 
 
Telecommunications
 
 
Insurance
 
 
Corporate
 
 
Others
 
 
Total
 
Revenues
  - 
  - 
  - 
  - 
  - 
  - 
  - 
Costs
  - 
  - 
  - 
  - 
  - 
  - 
  - 
Gross profit
  - 
  - 
  - 
  - 
  - 
  - 
  - 
Net gain from fair value adjustment of investment properties
  - 
  - 
  - 
  - 
  - 
  - 
  - 
General and administrative expenses
  - 
  - 
  - 
  - 
  (115)
  - 
  (115)
Selling expenses
  - 
  - 
  - 
  - 
  - 
  - 
  - 
Other operating results, net
  - 
  - 
  - 
  - 
  - 
  - 
  - 
Profit from operations
  - 
  - 
  - 
  - 
  (115)
  - 
  (115)
Share of profit of associates and joint ventures
  - 
  - 
  - 
  - 
  - 
  - 
  - 
Segment profit
  - 
  - 
  - 
  - 
  (115)
  - 
  (115)


Operating assets
  326,652 
  24,775 
  117,753 
  24,370 
  44,716 
  38,295 
  576,561 
Operating liabilities
  (253,584)
  - 
  (91,292)
  - 
  (136,275)
  (15,154)
  (496,305)
Operating assets (liabilities), net
  73,068 
  24,775 
  26,461 
  24,370 
  (91,559)
  23,141 
  80,256 
 
 
F-51


June 30, 2018


Operations Center in Israel


Real Estate
 
 
Supermarkets
 
 
Telecommunications
 
 
Insurance
 
 
Corporate
 
 
Others
 
 
Total
 
Revenues
  - 
  - 
  - 
  - 
  - 
  - 
  - 
Costs
  - 
  - 
  - 
  - 
  - 
  - 
  - 
Gross profit
  - 
  - 
  - 
  - 
  - 
  - 
  - 
Net gain from fair value adjustment of investment properties
  - 
  - 
  - 
  - 
  - 
  - 
  - 
General and administrative expenses
  - 
  - 
  - 
  - 
  (84)
  - 
  (84)
Selling expenses
  - 
  - 
  - 
  - 
  - 
  - 
  - 
Other operating results, net
  - 
  - 
  - 
  - 
  - 
  - 
  - 
Profit from operations
  - 
  - 
  - 
  - 
  (84)
  - 
  (84)
Share of profit of associates and joint ventures
  - 
  - 
  - 
  - 
  - 
  - 
  - 
Segment profit
  - 
  - 
  - 
  - 
  (84)
  - 
  (84)


Operating assets
  320,845 
  31,843 
  119,199 
  29,332 
  51,062 
  54,519 
  606,800 
Operating liabilities
  (249,429)
  - 
  (92,885)
  - 
  (167,475)
  (5,939)
  (515,728)
Operating assets (liabilities), net
  71,416 
  31,843 
  26,314 
  29,332 
  (116,413)
  48,580 
  91,072 
 
No external client represents 10% or more of the revenue of any of the reportable segments. From all assets corresponding to the Operations Center in Israel segments, Ps. 89,038 are located in USA
(Ps. 79,848 in 2019 and Ps. 83,609 in 2018), Ps. 0 (Ps. 2,130 in 2019 and Ps. 2,512 in 2018) in India and the remaining are located in Israel.
 
7. Information about the main subsidiaries
 
The Group conducts its business through several operating and holding subsidiaries. The Group considers that the subsidiaries below are the ones with significant non-controlling interests to the Group.


Direct interest of non-controlling interest %
 
 
Current Assets
 
 
Non-current Assets
 
 
Current Liabilities
 
 
Non-current Liabilities
 
 
Net assets
 
 
Book value of non-controlling interests


June 30, 2020
 
Elron
  38.94%
  3,636 
  4,270 
  548 
  153 
  7,205 
  4,467 
PBC
  27.60%
  85,399 
  121,008 
  28,139 
  127,882 
  50,386 
  20,738 
Cellcom (2)
  53.80%
  58,970 
  85,904 
  33,789 
  80,409 
  30,676 
  19,292 
Mehadrin
  56.25%
  14,036 
  19,205 
  15,022 
  3,591 
  14,628 
  8,759 
IRSA CP
  19.35%
  16,067 
  139,497 
  17,680 
  56,526 
  81,358 
  4,402 


June 30, 2019
 
Elron
  38.94%
  4,867 
  4,059 
  569 
  74 
  8,283 
  4,978 
PBC
  31.20%
  68,796 
  254,539 
  27,676 
  224,477 
  71,182 
  51,422 
Cellcom (2)
  55.90%
  49,475 
  63,598 
  29,366 
  61,927 
  21,780 
  13,755 
IRSA CP
  16.20%
  26,443 
  98,186 
  6,241 
  55,899 
  62,489 
  3,351 


Revenues
 
 
Net income / (loss)
 
 
Total comprehensive income / (loss)
 
 
Total comprehensive profit / (loss) attributable to non-controlling interest
 
 
Cash of Operating activities
 
 
Cash of investing activities
 
 
Cash of financial activities
 
 
Net Increase / (decrease) in cash and cash equivalents
 
 
Dividends distribution to non-controlling shareholders


June 30, 2020
 
Elron (3)
  - 
  (1,910)
  (2,007)
  5,964 
  (835)
  377 
  941 
  483 
  - 
PBC (3)
  13,252 
  13,616 
  13,096 
  21,085 
  6,812 
  25,699 
  (21,793)
  10,718 
  1,813 
Cellcom (2)(3)
  60,369 
  (2,226)
  (2,261)
  575 
  16,056 
  (7,993)
  (6,807)
  1,256 
  - 
Mehadrin (3)
  2,101 
  114 
  132 
  270 
  265 
  (75)
  (265)
  (75)
  18 
IRSA CP
  9,218 
  19,543 
  19,814 
  1,145 
  5,264 
  (3,099)
  (3,834)
  (1,669)
  714 


June 30, 2019
 
Elron (3)
  - 
  (1,137)
  (979)
  2,284 
  (1,089)
  223 
  1,440 
  574 
  - 
PBC (3)
  19,444 
  7,485 
  8,155 
  5,630 
  9,776 
  1,154 
  3,150 
  14,080 
  2,516 
Cellcom (2)(3)
  51,174 
  (1,641)
  (1,656)
  (1,455)
  10,792 
  (9,273)
  1,794 
  3,313 
  - 
IRSA CP
  11,655 
  (27,907)
  (27,907)
  (161)
  6,016 
  (5,338)
  (2,832)
  (2,154)
  937 
 
(1) Corresponds to the direct interest from the Group.
(2) DIC considers it exercises effective control over Cellcom because DIC is the group with the higher percentage of votes vis-à-vis other shareholders, also taking into account the historic voting performance in the Shareholders’ Meetings.
(3) Presented within discontinued operations
 
F-52
 
 
Restrictions, commitments and other relevant issues
 
Analysis of the impact of the Concentration Law
 
On December 2013, was published in the Official Gazette of Israel the Promotion of Competition and Reduction of Concentration Law N°, 5774-13 (‘the Concentration Law’) which has material implications for IDBD, DIC and its investors, including the disposal of the controlling interest in Clal. In accordance with the provisions of the law, the structures of companies that make public offer of their securities are restricted to two layers of public companies.
 
In November 2017, Dolphin IL, a subsidiary of Dolphin Netherlands B.V. acquired all the shares owned by IDBD in DIC (See note 4). Thus, the section required by the aforementioned law for the year 2017 is completed.
 
Prior to December 31, 2019 the Group lost control over Gav-Yam and in March 2020 it acquired control over Mehadrin, thus complying with the above-mentioned law.
 
Dolphin arbitration process
 
There is an arbitration process going on between Dolphin and ETH (previous shareholder of IDBD) in relation to certain issues connected to the control obtainment of IDBD (mainly regarding who had the right of purchase and the price of the acquisition). In the arbitration process the parties have agreed to designate Eyal Rosovshy and Giora Erdinas to promote a mediation. On August 17, 2017, a mediation hearing was held and the parties failed to reach an agreement. On January 31, 2018, the parties agreed to follow the process in court. As of the date of presentation of these Consolidated Financial Statements, there have been no other developments in the process and it is still pending resolution. Management, based on the opinion of its legal advisors, considers that the resolution of the present litigation will not have an adverse effect for Dolphin.
 
8. Investments in associates and joint ventures
 
Changes of the Group’s investments in associates and joint ventures for the fiscal years ended June 30, 2020 and 2019 were as follows:


June 30, 2020
 
 
June 30, 2019
 
Beginning of the year
  38,520 
  56,171 
Adjustment previous periods (IFRS 9 and IAS 28)
  (2,131)
  (165)
Increase in equity interest in associates and joint ventures
  3,598 
  751 
Capital contributions
  2,909 
  142 
Capital reduction
  (114)
  (723)
Decrease of interest in associate
  - 
  (7,727)
Deconsolidation (i)
  31,409 
  - 
Share of profit / (loss)
  9,330 
  (7,439)
Currency translation adjustment
  55 
  (435)
Dividends (i)
  (1,959)
  (1,849)
Other comprehensive income
  (1,339)
  - 
Reclassification to held-for-sale
  (2,228)
  - 
Others
  (2)
  (434)
Incorporation by business combination
  2,023 
  228 
End of the year (ii)
  80,071 
  38,520 
 
(i)
Corresponds to the loss of control over Gav-Yam. See Note 4.
(ii)
Includes Ps. (18) and Ps. (9,322) reflecting interests in companies with negative equity as of June 30, 2020 and 2019, respectively, which are disclosed in “Provisions” (see Note 19).
 
Below is a detail of the investments and the values of the stake held by the Group in associates and joint ventures for the years ended as of June 30, 2020 and 2019, as well as the Group's share of the comprehensive results of these companies for the years ended on June 30, 2020, 2019 and 2018:
 
 
F-53
IRSA Inversiones y Representaciones Sociedad Anónima


% ownership interest
 
 
Value of Group's interest in equity
 
 
Group's interest in comprehensive income / (loss)
 
Name of the entity
 
 
June 30, 2020
 
 
June 30, 2019
 
 
June 30, 2018
 
 
June 30, 2020
 
 
June 30, 2019
 
 
June 30, 2020
 
 
June 30, 2019
 
 
June 30, 2018
 
Associates


New Lipstick
  49.96%
  49.96%
  49.90%
  503 
  (9,322)
  8,217 
  (3,444)
  (5,697)
BHSA (1)
  29.91%
  29.91%
  29.91%
  4,385 
  4,792 
  (409)
  (2,596)
  448 
Condor (2)
  18.89%
  18.89%
  28.10%
  1,594 
  1,499 
  129 
  42 
  642 
PBEL
  45.00%
  45.40%
  45.40%
  - 
  2,130 
  - 
  (126)
  448 
Shufersal (4)
  26.02%
  26.02%
  33.56%
  30,263 
  24,775 
  5,614 
  320 
  - 
Mehadrin
  N/A 
  45.41%
  45.41%
  - 
  5,216 
  - 
  (119)
  1,374 
Gav-Yam
  34.90%
  N/A 
  N/A 
  29,365 
  0.00%
  (846)
  - 
  - 
Quality (3)
  50.00%
  50.00%
  50.00%
  2,262 
  2,012 
  199 
  (628)
  943 
La Rural SA
  50.00%
  50.00%
  50.00%
  219 
  109 
  110 
  155 
  (47)
TGLT
  30.50%
  N/A 
  N/A 
  2,217 
  0.00%
  (125)
  0.00%
  0.00%
Other joint ventures
  N/A 
  N/A 
  N/A 
  9,263 
  7,309 
  (3,504)
  (1,478)
  1,379 
Total associates and joint ventures


  80,071 
  38,520 
  9,385 
  (7,874)
  (510)


Latest financial statements issued
 
Name of the entity
Place of business / Country of incorporation
Main activity
 
Common shares 1 vote
 
 
Share capital (nominal value)
 
 
Profit / (loss) for the period
 
 
Shareholders’ equity
 
Associates


New Lipstick
U.S.
Real estate
  N/A 
  - 
  (*) 179 
  (*) (31) 
BHSA
Argentina
Financial
  448,689,072 
  (***) 1.500 
  (***) (1.369) 
  (***) 14.195 
Condor
EE.UU.
Hotel
  2,245,100 
  (*) 232 
  (*) (9) 
  (*) 86 
PBEL
India
Real estate
  1 
  (**) (2) 
  (**) - 
  (**) (2) 
Shufersal
Israel
Retail
  123,917,650 
  (**) 1.399 
  (**) 310 
  (**) 1.930 
Mehadrin
Israel
Agribusiness
  N/A 
  N/A 
  N/A 
  N/A 
Gav-Yam
Israel
Real estate
  639,727 
  (**) 1.356 
  (**) 411 
  (**) 3.496 
Quality
Argentina
Real estate
  163,039,244 
  326 
  398 
  4,457 
La Rural SA
Argentina
Organization of events
  714,498 
  1 
  241 
  352 
TGLT
Argentina
Real estate
  279,502,813 
  925 
  (335)
  6,463 
Other joint ventures
 
 
  - 
  N/A 
  N/A 
  N/A 
 
 
(1)
BHSA is a commercial bank of comprehensive services that offers a variety of banking and financial services for individuals, small and medium businesses and large companies. The market price of the share is 17.15 pesos per share. The effect of the treasury shares in the BHSA portfolio is considered for the calculation.
(2)
Condor is an investment company focused on US hotels. The price of its shares as of June 30, 2020 is US$ 4.10 per share.
(3)
Quality is dedicated to the exploitation of the San Martín property (former property of Nobleza Piccardo S.A.I.C. and F.).
(4)
Shufersal is a company that has supermarkets and pharmacies in Israel, the market price of the share is NIS 22,59 as of June 30, 2020.
 
 (*) 
Amounts in millions of US Dollars under USGAAP. Condor’s year-end falls on December 31, so the Group estimates their interest with a three-month lag, including material adjustments, if any.
(**) 
Amounts in millions of NIS.
(***) 
The balances as of June 30, 2020 correspond to the Financial Statements of BHSA prepared in accordance with BCRA standards.
 
New Lipstick:
 
On August 7, 2020, as a consequence of negotiations conducted in the context of an increased lease price effective as of May 2020, as set forth in the lease (hereinafter, “Ground Lease”), Metropolitan (a company where IRSA holds, indirectly, a 49.96% interest) executed an agreement with the Ground Lease lessor to conclude the relationship and terminate the ground lease, abandoning the administration of the building. As a consequence of the foregoing, Metropolitan derecognised the liability associated to the ground lease, as well as all assets and liabilities associated to the building and the administration. Pursuant to such agreement, Metropolitan was fully released from liability except for (i) claims for liabilities prior to June 1, 2020, from those persons who performed works or rendered services in the Building or for Metropolitan and (ii) claims from persons who had an accident in the property after August 7, 2020.
 
Gav-Yam
 
Considering that, on June 30, 2020, the market value of Gav-Yam was lower than its carrying value, PBC management considered whether there may be signs of impairment of the investment in such company. Based on the management´s review, with the assistance of external advisors, PBC considered that there was no evidence of investment impairment. Some of the factors considered are listed below:
 
The price of Gav-Yam shares has been significantly volatile since mid-March 2020; therefore, the fact that the market cap of the company was lower than the carrying value as of June 30, 2020 has not been considered as tantamount to a significant or sustained decrease;
On August 4, 2020, Aharon Frenkel purchased approximately 8.6% of Gav-Yam´s capital stock at a value of NIS 2,091/share, which circumstance reinforces the management´s conclusions;
Gav-Yam income as of March 31, 2020 and June 30, 2020 show that Gav-Yam is a stable company with a high quality and wide-ranging client portfolio.
 
 
F-54
 
 
Set out below is summarized financial information of the associates and joint ventures considered to be material to the Group:


Current Assets
 
 
Non-current Assets
 
 
Current Liabilities
 
 
Non-current Liabilities
 
 
Net assets
 
 
% of ownership interest held
 
 
Interest in associate and joint venture
 
 
Goodwill and others
 
 
Book value
 
As of 06,30,20


Associates


BHSA
  82,753 
  46,949 
  110,120 
  4,984 
  14,598 
  29.91%
  4,366 
  19 
  4,385 
Gav-Yam
  45,175 
  178,576 
  21,306 
  126,766 
  75,679 
  34.90%
  26,412 
  2,953 
  29,365 
Shufersal
  78,963 
  201,349 
  98,934 
  139,116 
  42,262 
  26.02%
  10,995 
  19,268 
  30,263 
 
Joint ventures


Quality Invest (ii)
  4 
  5,948 
  94 
  1,402 
  4,456 
  50.00%
  2,228 
  34 
  2,262 
As of 06,30,19


Associates


BHSA
  93,863 
  33,130 
  96,366 
  16,458 
  14,169 
  29.91%
  4,238 
  554 
  4,792 
PBEL
  3,416 
  918 
  680 
  13,056 
  (9,402)
  45.00%
  (4,231)
  6,361 
  2,130 
Shufersal
  55,702 
  96,324 
  58,896 
  58,988 
  34,142 
  26.02%
  8,884 
  15,891 
  24,775 
Joint ventures


Quality Invest (ii)
  27 
  5,299 
  128 
  1,241 
  3,957 
  50.00%
  1,979 
  33 
  2,012 
Mehadrin
  12,800 
  16,491 
  14,067 
  4,004 
  11,220 
  45.41%
  5,095 
  121 
  5,216 


Revenues
 
 
Net income / (loss)
 
 
Total comprehensive income / (loss)
 
 
Dividend distribution
 
 
Cash of operating activities
 
 
Cash of investing activities
 
 
Cash of financing activities
 
 
Changes in cash and cash equivalents
 
As of 06,30,20


Associates


BHSA
  14,031 
  (1,369)
  (1,369)
  - 
  5,012 
  40 
  (3,730)
  1,322 
Gav-Yam
  12,435 
  7,283 
  5,874 
  3,862 
  5,475 
  (6,161)
  17,084 
  16,398 
Shufersal
  234,688 
  5,432 
  4,844 
  1,545 
  23,548 
  (2,916)
  (14,849)
  5,783 
 
Joint ventures


Quality Invest (ii)
  19 
  398 
  398 
  - 
  (96)
  - 
  96 
  - 
As of 06,30,19


Associates


BHSA
  18,787 
  946 
  946 
  308 
  180 
  (75)
  (2,069)
  (1,964)
PBEL
  14 
  (280)
  (343)
  - 
  61 
  257 
  (329)
  (11)
Shufersal
  178,319 
  3,406 
  3,388 
  2,635 
  4,799 
  (12,413)
  1,503 
  (6,111)
Joint ventures


Quality Invest (ii)
  39 
  (1,256)
  (1,256)
  - 
  (133)
  - 
  133 
  - 
Mehadrin
  18,656 
  834 
  882 
  - 
  723 
  (298)
  (1,359)
  (934)
 
 
(i)
Information under GAAP applicable in the associate and joint ventures´ jurisdiction.
(ii)
In March 2011, Quality acquired an industrial plant located in San Martín, Province of Buenos Aires. The facilities are suitable for multiple uses. On January 20, 2015, Quality agreed with the Municipality of San Martin on certain re zoning and other urban planning matters (“the Agreement”) to surrender a non-significant portion of the land and a monetary consideration of Ps. 43 million, payable in two installments of Ps. 22 each, the first of which was actually paid on June 30, 2015. In July 2017, the Agreement was amended as follows: 1) a revised zoning plan must be submitted within 120 days as from the amendment date, and 2) the second installment of the monetary considerations was increased to Ps. 76 million payables in 18 equal monthly installments. On March 8, 2018, it was agreed with the well-known Gehl Study (Denmark) - Urban Quality Consultant - the elaboration of a Master Plan, generating a modern concept of New Urban District of Mixed Uses.
 
BHSA
 
BHSA is subject to certain restrictions on the distribution of profits, as required by BCRA regulations.
 
As of June 30, 2020, BHSA has a remnant of 35.2 million Class C treasury shares of a par value of Ps. 1 received in 2009 as a result of certain financial transactions. The Annual Shareholders' Meeting decided to allocate 35.1 million of such shares to an employee compensation plan pursuant to Section 67 of Law 26,831. The remaining shares belong to third party holders of Stock Appreciation Rights, who have failed to produce the documentation required for redemption purposes. As of June 30, 2020, considering the effect of such treasury shares, the Group’s interest in BHSA amounts to 29.91%.
 
The Group estimated that the value in use of its investment in BHSA as of June 30, 2020 and 2019 amounted to Ps. 5,387, Ps. 5,944, respectively. The value in use was estimated based on the present value of future business cash flows. The main assumptions used were the following:
 
 
F-55
 
 
The Group considered 7 years as the horizon for the projection of BHSA cash flows.
The “Private BADLAR” interest rate was projected based on internal data and information gathered from external advisors.
The projected exchange rate was estimated in accordance with internal data and external information provided by independent consultants.
The discount rate used to discount actual dividend flows was 13.82% in 2020 and 14.37% in 2019.
The sensitivity to a 1% increase in the discount rate would be a reduction in the value in use of Ps. 577 for 2020 and of Ps.542 for 2019.
 
Puerto Retiro (joint venture):
 
At present, this 8.3-hectare plot of land, is affected by a zoning regulation defined as U.P. which prevents the property from being used for any purposes other than strictly port activities.
 
Puerto Retiro was involved in a judicial bankruptcy action brought by the National Government. The current Board of Directors would not be held personally liable with regard to this action. Management and legal counsel of the Company believe that there are sufficient legal and technical arguments to consider that the petition for extension of the bankruptcy case will be dismissed by the court. However, in view of the current status of the action, its result cannot be predicted.
 
Moreover, Tandanor filed a civil action against Puerto Retiro S.A. and the other defendants in the criminal case for violation of Section 174 (5) based on Section 173 (7) of the Criminal Code of Argentina. Such action seeks -on the basis of the nullity of the decree that approved the bidding process involving the Dársena Norte property- the restitution of the property and a reimbursement in favor of Tandanor for all such amounts it has allegedly lost as a result of a suspected fraudulent transaction involving the sale of the property. Puerto Retiro has presented the allegation on the merit of the evidence, highlighting that the current shareholders of Puerto Retiro did not participate in any of the suspected acts in the criminal case since they acquired the shares for consideration and in good faith several years after the facts told in the process. Likewise, it was emphasized that the company Puerto Retiro is foreign to the bidding / privatization carried out for the sale of Tandanor shares. On September 7, 2018, the Oral Federal Criminal Court No. 5 rendered a decision. According to the sentence read by the president of the Court, Puerto Retiro won the preliminary objection of limitation filed in the civil action. However, in the criminal case, where Puerto Retiro is not a party, it was ordered, among other issues, the confiscation (“decomiso”) of the property owned by Puerto Retiro known as Planta I. The grounds of the Court`s judgment were read on November 11, 2018. From that moment, all the parties were able to present the appeals. Given this fact, an extraordinary appeal was filed, which was rejected, and as a result, a complaint was filed for a rejected appeal, which was granted. Consequently, the appeal is under study in the Argentine Supreme Court of Justice.
 
In the criminal action, the claimant reported the violation by Puerto Retiro of the injunction ordered by the criminal court consisting in an order to stay (“prohibición de innovar”) and not to contract with respect to the property disputed in the civil action. As a result of this complaint, the Federal Oral Court No. 5 formed an incident and ordered and executed the closure of the property where the lease agreements were being executed (a heliport and a mooring), in order to enforce compliance with the measure before mentioned. As a result of this circumstance, it was learned that the proceedings were turned over to the Criminal Chamber for the allocation of the court to investigate the possible commission of a crime of disobedience. As of the date of issuance of these financial statements there has been no news about the progress of this cause.
 
Faced with the evolution of the legal cases that affect it and based on the reports of its legal advisors, Puerto Retiro Management has decided to register in fiscal year 2019 an allowance equivalent to 100% of the book value of its investment property, without prejudice to reverse it when a favorable ruling is obtained in the interposed actions.
 
 
F-56
IRSA Inversiones y Representaciones Sociedad Anónima
 
 
9. Investment properties
 
Changes in the Group’s investment properties according to the fair value hierarchy for the years ended June 30, 2020 and 2019 were as follows:


June 30, 2020
 
 
June 30, 2019


Level 2
 
 
Level 3
 
 
Level 2
 
 
Level 3
 
Fair value at the beginning of the year
  47,287 
  311,769 
  39,163 
  350,480 
Adjustments previous periods (IFRS 16)
  - 
  459 
  - 
  - 
Additions
  3,811 
  1,979 
  5,561 
  6,939 
Activation of financial costs
  87 
  - 
  234 
  17 
Capitalized leasing costs
  4 
  17 
  12 
  5 
Amortization of capitalized leasing costs (i)
  (6)
  (10)
  (9)
  (14)
Transfers / Reclassification to assets held for sale
  4,899 
  (30,984)
  (749)
  1,216 
Incorporation by business combination
  - 
  263 
  - 
  - 
Deconsolidation (ii)
  (1,824)
  (167,776)
  - 
  - 
Disposals
  (1,873)
  (14,439)
  (77)
  (3,957)
Currency translation adjustment
  15 
  57,556 
  (73)
  (3,211)
Net (loss)/ gain from fair value adjustment
  30,437 
  3,295 
  3,225 
  (39,706)
Fair value at the end of the year
  82,837 
  162,129 
  47,287 
  311,769 
 
(i) Amortization charges of capitalized leasing costs were included in “Costs” in the Statements of Income (Note 23).
(ii) $ 1,694 corresponds to La Maltería and $ 155,846 to Gav-Yam
 
The following is the balance by type of investment property of the Group as of June 30, 2020 and 2019:
 
 
  06.30.2020 
  06.30.2019 
Rental properties
  207,434 
  321,567 
Undeveloped parcels of land
  29,642 
  30,690 
Properties under development
  7,890 
  6,799 
TOTAL
  244,966 
  359,056 
 
 
Certain investment property assets of the Group have been mortgaged or restricted to secure some of the Group’s borrowings and other payables. Book amount of those properties amounts to Ps. 19,560, Ps. 16,547 as June 30, 2020 and 2019, respectively.
 
The following amounts have been recognized in the Statements of Income:
 
 
  06.30.2020 
  06.30.2019 
  06.30.2018 
Rental and services income
  12,279 
  15,723 
  16,594 
Direct operating expenses
  (8,702)
  (8,713)
  (8,273)
Development reimbursements / (expenses)
  121 
  (94)
  (4,450)
Net realized gain from fair value adjustment of investment properties
  16,144 
  10 
  590 
Net unrealized gain from fair value adjustment of investment properties
  20,169 
  (41,747)
  20,037 
 
(i) As of June 30, 2020, $ 504 corresponds to the result realized in previous years. As of June 30, 2018, $ 16 corresponds to results realized in previous years.
 
See note 5 (liquidity schedule) for detail of contractual commitments related to investment properties.
 
Valuation processes
 
The Group’s investment properties were valued at each reporting date by independent professionally qualified appraisers who hold a recognized relevant professional qualification and have experience in the locations and segments of the investment properties appraised. For all investment properties, their current use equates to the highest and best use.
 
Each operations center has a team which reviews the appraisals performed by the independent appraisers (the “review team”). The review team: i) verifies all major and important assumptions relevant to the appraisal in the valuation report from the independent appraisers; ii) assesses property valuation movements compared to the valuation report from the prior period; and iii) holds discussions with the independent appraisers.
 
 
F-57
 
 
Changes in Level 2 and 3 fair values, if any, are analyzed at each reporting date during the valuation discussions between the review team and the independent appraisers. In the case of the Operations Center in Argentina, the Board of Directors ultimately approves the fair value calculation for recording into the Financial Statements. In the case of the Operations Center in Israel, the appraisals are examined by Israel Management and reported to the Financial Statements Committee.
 
Valuation techniques used for the estimation of fair value of the investment property for the Argentina operations center:
 
The Group has defined valuation techniques according to the characteristics of each property and the type of market in which these assets are located, in order to maximize the use of observable information available for the determination of fair value.
 
For the Shopping Malls there is no liquid market for the sale of properties with these characteristics that can be taken as a reference of value. Likewise, the Shopping Malls, being a business denominated in pesos, are highly related to the fluctuation of macroeconomic variables in Argentina, the purchasing power of individuals, the economic cycle of Gross Domestic Product (GDP) growth, the evolution of inflation, among others. Consequently, the methodology adopted by the Group for the valuation of Shopping Malls is the discounted cash flow model (“DCF”), which allows the volatility of the Argentine economy to be taken into account and its correlation with the revenue streams of the Malls and the inherent risk of the Argentine macroeconomy. The DCF methodology contemplates the use of certain unobservable valuation assumptions, which are determined reliably based on the information and internal sources available at the date of each measurement. These assumptions mainly include the following:
 
● Future cash flow projected income based on the current locations, type and quality of the properties, backed by the lease agreements that the Company has signed with its tenants. The Company's revenues are equal to the higher of: i) a Minimum Insured Fixed Value (“VMA”) and ii) a percentage of the tenant's sales in each Shopping Mall. Accordingly, estimates of the evolution of the Gross Domestic Product (“GDP) and the Inflation of the Argentine economy, as provided by an external consultant were used to estimate the evolution of tenant sales, which have a high correlation with these macroeconomic variables. These macroeconomic projections were contrasted with the projections prepared by the International Monetary Fund (“IMF”), the Organization for Economic Cooperation and Development (“OECD”) and with the Survey of Market Expectations (“REM”), which consists of a Survey prepared by the Central Bank of Argentina (BCRA) aimed to local and foreign specialized analysts in order to allow a systematic follow-up of the main short and medium term macroeconomic forecasts on the evolution of the Argentine economy.
 
● The income from all Shopping Malls was considered to grow with the same elasticity in relation to the evolution of the GDP and the projected inflation. The specific characteristics and risks of each Shopping Mall are captured through the use of the historical average EBITDA Margin of each of them.
 
● Cash flows from future investments, expansions or improvements in Shopping Mall were not contemplated.
 
● Terminal value: a perpetuity calculated from the cash flow of the last year of useful life was considered.
 
● The cash flow for concessions was projected until the termination date of the concession stipulated in the current contract.
 
● Given the prevailing inflationary context and the volatility of certain macroeconomic variables, a reference long term interest rate in pesos is not available to discount the projected cash flows from shopping malls. Consequently, the projected cash flows were dollarized through the future ARS / US$ exchange rate curve provided by an external consultant, which are contrasted to assess their reasonableness with those of the IMF, OECD, REM and the On-shore Exchange Rate Futures Market (ROFEX). Finally, dollarized cash flows were discounted with a long-term dollar rate, the weighted average capital cost rate (“WACC”), for each valuation date.
 
● The estimation of the WACC discount rate was determined according to the following components:
 
a) United State Governments Bonds risk-free rate;
b)Industry beta, considering comparable companies from the United States, Brazil, Chile and Mexico, in order to contemplate the Market Risk on the risk-free rate;
c) Argentine country risk considering the EMBI + Index; and
d)Cost of debt and capital structure, considering that information available from the Argentine corporate market (“blue chips”) was determined as a reference, since sovereign bonds have a history of defaults. Consequently, and because IRSA CP, based on its representativeness and market share represents the most important entity in the sector, we have taken its indicators to determine the discount rate.
 
For offices, other rental properties and plot of lands, the valuation was determined using transactions of comparable market assets, since the market for offices and land banks in Argentina is liquid and has market transactions that can be taken as reference. These values are adjusted to the differences in key attributes such as location, property
 
 
F-58
 
 
size and quality of interior fittings. The most significant input to the comparable market approach is the price per square meter that derives from the supply and demand in force in the market at each valuation date.
 
Since September 2019, the real estate market has faced certain changes in terms of its operation as a consequence of the implementation of regulations applicable to the foreign exchange market. In general terms, the measure adopted on September 1, 2019 by the BCRA sets forth that exporters of goods and services should settle foreign currency from abroad in the local exchange market 5 days after the collection of such funds, at the latest. Furthermore, it provides that legal entities residing in Argentina may buy foreign currency without restrictions for imports or payments of debts on the maturity date thereof, although they shall apply for the BCRA´s prior authorization for the purposes of: buying foreign currency in order to form external assets, prepaying debts, making remittances of profits and dividends abroad or transferring funds abroad. Likewise, pursuant to such regulations, access to the market by natural persons for the purchase of dollars was restricted. Afterwards, the BCRA implemented stricter measures, further limiting access to the foreign exchange market (see Note 34 to these consolidated financial statements).
 
At present, purchase and sales transactions for office buildings may be settled in Pesos (by using an implicit foreign exchange rate higher than the official one) or in dollars. However, due to the restrictions applicable to access to dollars to which market participant are subject (most of them are domestic companies and local subsidiaries of foreign companies, all of them subject to the foreign exchange restrictions described above), the chances that a natural person or legal entity may obtain the funds required to execute a transaction in dollars are remote. Consequently, the most probable scenario is that any sale of office buildings/reserves be settled in Pesos at an implicit foreign exchange rate higher than the official one. This is evidenced by the transactions consummated by the Company prior to and after the closing of these financial statements. (See Note 4 and Note 35 to the consolidated financial statements). Therefore, the Company has valued its office buildings and land reserves as of the fiscal year-end taking into account the circumstances described above, which represents a gain with respect to the values previously recorded.
 
In certain situations, it is complex to determine reliably the fair value of developing properties. In order to assess whether the fair value of a developing property can be determined reliably, management considers the following factors, among others:
 
● The provisions of the construction contract.
● The stage of completion.
● Whether the project / property is standard (typical for the market) or non-standard.
● The level of reliability of cash inflows after completion.
● The specific development risk of the property.
● Previous experience with similar constructions.
● Status of construction permits.
 
There were no changes in the valuation techniques during the year.
 
Valuation techniques used to estimate the Fair Value of Investment Properties for the Israel operations center:
 
Valuations were performed using the DCF method. The discount rates used by appraisers in Israel are mainly in the range of 7% - 9% and are established taking into account the type of property, purpose, location, the level of rent compared to the market price and quality of the tenants.
 
When determining the value of office buildings, buildings aimed at to the technology sector and commercial spaces (mainly located in the city center and in high-tech office parks with high-quality tenants), the discount rates mainly used are between 7% to 9%, while for workshop, storage and industry buildings (mainly located in peripheral areas of the city) they are valuated using a discount rate between 7.75% -9%.
 
There were no changes in valuation techniques during the years ended June 30, 2020 and 2019.
 
 
F-59
 
 
The following table presents information regarding the fair value measurements of investment properties using significant unobservable inputs (Level 3):


  Sensitivity (i)                


    06.30.20      
    06.30.19      
Description
Valuation technique
 
Parameters
 
 
Range fiscal year 2019 / (2018)
 
 
Increase
 
 
Decrease
 
 
Increase
 
 
Decrease
 
Rental properties in Israel - Offices (Level 3)
Discounted cash flows
 
Discount rate
 
 
7.50% to 9.75% /
 
  (437)
  581 


 (7.00% to 9.00% )


  (4,108)
  4,686 


Weighted average rental value per square meter (m2) per month, in NIS
 
 
NIS 77 / (NIS 63)/
 
  394 
  (394)


  7,227 
  (7,227)
Rental properties in Israel - Commercial use (Level 3)
Discounted cash flows
 
Discount rate
 
 
7.50% to 7.80% /
 
  (214)
  281 


 (7.00% to 9.00%)


  (2,079)
  2,376 


Weighted average rental value per square meter (m2) per month, in NIS
 
 
NIS 41 / (NIS 87)
 
  177 
  (177)


  3,280 
  (3,280)
Rental properties in Israel - Industrial use (Level 3)
Discounted cash flows
 
Discount rate
 
  N/A 
  N/A 
  N/A 


(7.75% to 9.00%)


  (772)
  877 


Weighted average rental value per square meter (m2) per month, in NIS
 
 
N/A / (NIS 31)
 
  N/A 
  N/A 


  1,731 
  (1,731)
Rental properties in USA - HSBC Building (Level 3)
Discounted cash flows
 
Discount rate
 
  4.75% / (6.25%)
  (6,523)
  8,082 
  (2,348)
  2,487 


Weighted average rental value per square meter (m2) per month, in US$
 
 $US 79 /(US$ 73)
  6,765 
  (6,765)


  5,137 
  (5,137)
Rental properties in USA - Las Vegas project (Level 3)
Discounted cash flows
 
Discount rate
 
  6.50% / (8.50%)
  (1,929)
  2,704 
  (503)
  531 


Weighted average rental value per square meter (m2) per month, in US$
 
 $US 25 /(US$ 33)
  (1,407)
  1,407 


  631 
  (631)
Shopping Malls in Argentina (Level 3)
Discounted cash flows
 
Discount rate
 
  12.18% / (12.10% )
  (4,577)
  5,606 
  (5,025)
  6,267 


Growth rate
 
  2.3% / (3%)
  2,182 
  (1,782)
  2,363 
  (1,896)


Inflation
 
  (*) 
  9,530 
  (7,839)
  4,401 
  (4,028)


Devaluation
 
  (*) 
  (4,430)
  5,415 
  (4,670)
  6,714 
Plot of land in Argentina (Level 3)
Comparable with incidence adjustment
 
Value per square meter (m2)
 
 
Ps. 32,456 / (Ps. 15,408)
 
  2,324 
  (2,324)
  1,438 
  (1,438)


% of incidence
 
  30% / (30%)
  7,747 
  (7,747)
  4,799 
  (4,799)
Properties under development in Israel (Level 3)
Estimated fair value of the investment property after completing the construction
 
Weighted average construction cost per square meter (m2) in NIS
 
 
5,787 NIS/m2 /


 (5,787 NIS/m2)


Annual weighted average discount rate
 
 
7.00% to 9.00% /
 
  (1,407)
  1,407 


(7.00% to 9.00%)


  (988)
  988 
 
(*) For the next 5 years, an average AR$ / US$ exchange rate with an upward trend was considered, starting at Ps. 64.39 (corresponding to the year ended June 30, 2020) and arriving at Ps.262.56. In the long term, a nominal devaluation rate of 2.1% calculated based on the quotient between inflation in Argentina and the United States is assumed. The considered inflation shows a downward trend, which starts at 47.9% (corresponding to the year ended June 30, 2020) and stabilizes at 23.2% after 5 years.
(i) Considering an increase or decrease of: 100 points for the discount and growth rate in Argentina, 10% for the incidence and inflation, 10% for the devaluation, 50 points for the discount rate of Israel and USA, and 1% for the value of the m2.
 
10. Property, plant and equipment
 
Changes in the Group’s property, plant and equipment for the years ended June 30, 2020 and 2019 were as follows:


Year ended June 30, 2020


Agricultural establishments
 
 
Buildings and facilities
 
 
Machinery and equipment
 
 
Communication networks
 
 
Others
 
 
Total
 
Net book amount at the June 30, 2018
  - 
  4,484 
  821 
  23,022 
  5,682 
  34,009 
Costs
  - 
  11,157 
  2,500 
  93,992 
  10,992 
  118,641 
Accumulated depreciation
  - 
  (6,673)
  (1,679)
  (70,970)
  (5,310)
  (84,632)
Balances at June 30, 2018
  - 
  4,484 
  821 
  23,022 
  5,682 
  34,009 
Additions
  - 
  188 
  105 
  4,951 
  2,448 
  7,692 
Disposals
  - 
  - 
  (2)
  (46)
  (17)
  (65)
Currency translation adjustment
  - 
  (104)
  (21)
  (600)
  (50)
  (775)
Transfer
  - 
  205 
  20 
  - 
  (212)
  13 
Depreciation charges (ii)
  - 
  (465)
  (100)
  (4,076)
  (1,886)
  (6,527)
Net book amount at the June 30, 2019
  - 
  4,308 
  823 
  23,251 
  5,965 
  34,347 
Costs
  - 
  11,446 
  2,602 
  98,296 
  13,161 
  125,505 
Accumulated depreciation
  - 
  (7,138)
  (1,779)
  (75,045)
  (7,196)
  (91,158)
Balances at June 30, 2019
  - 
  4,308 
  823 
  23,251 
  5,965 
  34,347 
Additions
  39 
  486 
  71 
  3,679 
  1,832 
  6,107 
Disposals
  - 
  (67)
  (5)
  (3,442)
  (44)
  (3,558)
Incorporation by business combination
  4,332 
  1,738 
  406 
  - 
  100 
  6,576 
Deconsolidation
  - 
  (455)
  (639)
  - 
  (47)
  (1,141)
Reclassification to assets assets held for sale
  - 
  (295)
  - 
  - 
  - 
  (295)
Currency translation adjustment
  334 
  525 
  204 
  3,822 
  1,381 
  6,266 
Transfers
  - 
  (264)
  (16)
  406 
  (406)
  (280)
Depreciation charges (i)
  (19)
  (428)
  (86)
  (4,986)
  (1,885)
  (7,404)
Net book amount at the June 30, 2020
  4,686 
  5,548 
  758 
  22,730 
  6,896 
  40,618 
Costs
  10,226 
  13,003 
  4,826 
  108,657 
  13,880 
  150,592 
Accumulated depreciation
  (5,540)
  (7,455)
  (4,068)
  (85,927)
  (6,984)
  (109,974)
Balances at June 30, 2020
  4,686 
  5,548 
  758 
  22,730 
  6,896 
  40,618 
 
(i) Includes furniture and fixtures and vehicles.
(ii) As of June 30, 2020 and 2019, depreciation charges of property, plant and equipment were recognized: Ps. 6,441 and Ps. 6,972 in "Costs", Ps. 835 and Ps. 440 in "General and administrative expenses" and Ps. 164 and Ps. 115 in "Selling expenses", respectively in the Statements of Income (Note 23). In addition, a depreciation charge in the amount of Ps. 4,323, was recognized in "Discontinued operations" as of June 30, 2018. Likewise, a charge of Ps. 13 has been made in “Discontinued operations” as of June 30, 2020.
 
 
F-60
 
 
11. Trading properties
 
Changes in the Group’s trading properties for the fiscal years ended June 30, 2020 and 2019 were as follows:


Year ended June 30, 2020


Completed properties
 
 
Properties under development
 
 
Undeveloped sites
 
 
Total
 
At June 30, 2018
  6,293 
  13,052 
  4,413 
  23,758 
IFRS 15 adjustments
  (1,677)
  (7,285)
  - 
  (8,962)
Additions
  - 
  3,879 
  66 
  3,945 
Capitalized financial costs
  - 
  18 
  - 
  18 
Currency translation adjustment
  (683)
  (539)
  (235)
  (1,457)
Transfers
  3,736 
  (3,017)
  (662)
  57 
Impairment
  - 
  - 
  (49)
  (49)
Disposals
  (4,777)
  (3,534)
  - 
  (8,311)
At June 30, 2019
  2,892 
  2,574 
  3,533 
  8,999 
Additions
  26 
  1,854 
  606 
  2,486 
Desconsolidation
  - 
  (167)
  - 
  (167)
Capitalized financial costs
  - 
  13 
  - 
  13 
Currency translation adjustment
  324 
  33 
  586 
  943 
Transfers
  1,333 
  (1,066)
  (36)
  231 
Disposals
  (2,394)
  (2,352)
  (38)
  (4,784)
At June 30, 2020
  2,181 
  889 
  4,651 
  7,721 


June 30, 2020
 
 
June 30, 2019
 
Non-current
  5,228 
  8,436 
Current
  2,493 
  563 
Total
  7,721 
  8,999 

(i) Includes Zetol and Vista al Muelle plots of land, which have been mortgaged to secure Group's borrowings. The net book value amounted to Ps. 438 and Ps. 438 as of June 30, 2019 and 2018, respectively. Additionally, the Group has contractual obligations not provisioned related to these plot of lands committed when certain properties were acquired or real estate projects were approved, and amount to Ps. 501 and Ps. 622, respectively. Both projects are expected to be completed in 2029.


F-61
IRSA Inversiones y Representaciones Sociedad Anónima


12. Intangible assets
 
Changes in the Group’s intangible assets for the years ended June 30, 2020 and 2019 were as follows:


Year ended June 30, 2020


Goodwill
 
 
Trademarks
 
 
Licenses
 
 
Customer relations
 
 
Information systems and software
 
 
Contracts and others
 
 
Total
 
Balance at June 30, 2018
  7,459 
  7,366 
  2,816 
  5,509 
  3,988 
  2,542 
  29,680 
Costs
  7,459 
  7,821 
  10,463 
  16,576 
  7,465 
  6,919 
  56,703 
Accumulated amortization
  - 
  (455)
  (7,647)
  (11,067)
  (3,477)
  (4,377)
  (27,023)
Net book amount at June 30, 2018
  7,459 
  7,366 
  2,816 
  5,509 
  3,988 
  2,542 
  29,680 
Additions
  - 
  - 
  - 
  17 
  1,632 
  2,357 
  4,006 
Impairment
  (198)
  - 
  - 
  - 
  - 
  - 
  (198)
Disposals
  - 
  - 
  - 
  - 
  (66)
  - 
  (66)
Currency translation adjustment
  (199)
  (218)
  (105)
  (335)
  (61)
  54 
  (864)
Amortization charges (i)
  - 
  (132)
  (232)
  (1,798)
  (1,388)
  (1,445)
  (4,995)
Balance at June 30, 2019
  7,062 
  7,016 
  2,479 
  3,393 
  4,105 
  3,508 
  27,563 
Costs
  7,062 
  7,604 
  10,192 
  21,832 
  6,945 
  9,270 
  62,905 
Accumulated amortization
  - 
  (588)
  (7,713)
  (18,439)
  (2,840)
  (5,762)
  (35,342)
Net book amount at June 30, 2019
  7,062 
  7,016 
  2,479 
  3,393 
  4,105 
  3,508 
  27,563 
Additions
  - 
  - 
  - 
  - 
  1,661 
  3,192 
  4,853 
Disposals
  - 
  - 
  - 
  (19)
  (147)
  (69)
  (235)
Deconsolidation
  (3,508)
  - 
  - 
  - 
  (24)
  - 
  (3,532)
Assets incorporated by business combination
  - 
  - 
  - 
  41 
  20 
  - 
  61 
Currency translation adjustment
  2,521 
  1,327 
  426 
  464 
  735 
  744 
  6,217 
Amortization charges (i)
  - 
  (131)
  (300)
  (1,214)
  (1,804)
  (1,567)
  (5,016)
Balance at June 30, 2020
  6,075 
  8,212 
  2,605 
  2,665 
  4,546 
  5,808 
  29,911 
Costs
  6,075 
  9,066 
  12,153 
  25,548 
  8,520 
  14,386 
  75,748 
Accumulated amortization
  - 
  (854)
  (9,548)
  (22,883)
  (3,974)
  (8,578)
  (45,837)
Net book amount at June 30, 2020
  6,075 
  8,212 
  2,605 
  2,665 
  4,546 
  5,808 
  29,911 
 
(iii) Amortization charge was recognized in the amount of Ps. 379 and Ps. 1.133 under "Costs", in the amount of Ps. 1,761 and Ps. 1,452 under "General and administrative expenses" and Ps. 2,907 and Ps. 2,409 under "Selling expenses" as of June 30, 2020 and 2019, respectively in the Statements of Income (Note 24).
 
The goodwill allocated to telecommunication in Israel amounts to NIS 268 (Ps. 5,868 at the exchange rate at the end of the financial year 2020), the one assigned to supermarkets amounted to NIS 192 and the assigned to Israel real state amounted to NIS 113. The rest is goodwill that is allocated to the real estate segment of Argentina. The only remained goodwill is the one allocated to Telecomunication.
 
Goodwill impairment test
 
The Group performs an annual impairment test of the goodwill. For fiscal year 2020, the recoverable value obtained for said test corresponding to the CGUs where the goodwill is assigned (Israel's Telecommunications) was calculated based on the fair value (market value) minus the costs of sale.
 
For the fiscal year 2019, based on the significant decrease in the market value of Cellcom and its results in the last financial year, caused by the greater competition in the cell phone market in Israel as a result of the entry of new competitors, the Group calculated the recoverable value at the end of the year of the telecommunications CGU based on the value in use of the assets. This test resulted in the goodwill attributable to Cellcom for an amount of Ps. 4,919 (NIS 268) being recoverable.
 
The value in use as of June 30, 2019, was determined by an independent appraiser and was estimated at Ps. 90,60 (NIS 4,936). There was no impairment.
 
The cash flow was calculated based on the budgets approved by management covering a period of 5 years. Subsequent cash flows were estimated based on the long-term growth rate. The main data and assumptions used in the calculation of the value in use were the following:


June 30, 2019 (NIS)
 
Net value of the CGU net of taxes
 
NIS 294
 
Value of the net operating assets of the telecommunications CGU of Israel (including brands and excluding goodwill)
 
NIS 3,668
 
Value of goodwill of the CGU
 
NIS 268
 
Annual discount rate after tax
  8.5%
Long-term growth rate
  1.5%
Long-term market share
  25%
ARPU (average monthly income per user) during the representative term (excludes income from international hosting and roaming)
 
NIS 55.50
 
 
The recoverable amount of the CGU would be equal to the book value in the scenarios in which the relevant variables are the following, in the event that the rest of the variables remain constant:
 
 
F-62
 
 
Annual net discount rate after taxes 9.20%
ARPU (average monthly income per user) during the representative term (excludes income from international hosting and roaming) NIS 53
 
13. Rights of use of assets
 
Below is the composition of the rights of use of the Group´s assets as of June 30, 2020 and June 30, 2019:


June 30, 2020
 
 
June 30, 2019
 
Real Estate
  4,431 
  - 
Telecommunications
  11,846 
  - 
Machinery and equipment
  14 
  - 
Others
  5,088 
  - 
Total Right-of-use assets
  21,379 
  - 
Non-current
  21,379 
  - 
Total
  21,379 
  - 
 
Changes in the Group´s rights of use during the fiscal year ended June 30, 2020, were as follows:


June 30, 2020
 
 
June 30, 2019
 
IFRS 16 inicial adjustments
  15,205 
  - 
Additions (i)
  8,710 
  - 
Transfer
  170 
  - 
Amortization charges
  (5,072)
  - 
Deconsolidation
  (45)
  - 
Currency translation adjustment
  2,411 
  - 
Total
  21,379 
  - 
 
(i) includes incorporation by business combination
 
Depreciation charge for rights of use is detailed below:


June 30, 2020
 
 
June 30, 2019
 
Real Estate
  579 
  - 
Telecommunications
  3,397 
  - 
Others
  1,096 
  - 
Total depreciation of right-of-use assets
  5,072 
  - 
 
Other charges to income related to rights of use were as follows: Ps. 548 (interest)


June 30, 2020
 
Interests
  (58)
Results from short-term leases
  12,279 


 The average discount rate and the term of liability for lease recognized as of June 30, 2020 are detailed below:
 
       Center of Operations in Argentina 
  Center of Operations in Israel      
 
Average discount rate
 
 
Maturity date
 
 
Average discount rate
 
 
Maturity date
 
  10.61%
  2023-2041 
  3%
  2022-2090 


F-63
 
 
14. Financial instruments by category
 
The following note presents the financial assets and financial liabilities by category and a reconciliation to the corresponding line in the Consolidated Statements of Financial Position, as appropriate. Since the line items “Trade and other receivables” and “Trade and other payables” contain both financial instruments and non-financial assets or liabilities (such as prepayments, trade receivables, trade payables in-kind and tax receivables and payables), the reconciliation is shown in the columns headed “Non-financial assets” and “Non-financial liabilities”. Financial assets and liabilities measured at fair value are assigned based on their different levels in the fair value hierarchy.
 
IFRS 9 defines the fair value of a financial instrument as the amount for which an asset could be exchanged, or a financial liability settled, between knowledgeable, willing parties in an arm’s length transaction. All financial instruments recognized at fair value are allocated to one of the valuation hierarchy levels of IFRS 7. This valuation hierarchy provides for three levels.
 
In the case of Level 1, valuation is based on quoted prices (unadjusted) in active markets for identical assets and liabilities that the Company can refer to at the date of valuation. In the case of Level 2, fair value is determined by using valuation methods based on inputs directly or indirectly observable in the market. If the financial instrument concerned has a fixed contract period, the inputs used for valuation must be observable for the whole of this period. In the case of Level 3, the Group uses valuation techniques not based on inputs observable in the market. This is only permissible insofar as no market data is available. The inputs used reflect the Group’s assumptions regarding the factors which market players would consider in their pricing.
 
The Group’s Finance Division has a team in place in charge of estimating the valuation of financial assets required to be reported in the Consolidated Financial Statements, including the fair value of Level-3 instruments. The team directly reports to the Chief Financial Officer ("CFO"). The CFO and the valuation team discuss the valuation methods and results upon the acquisition of an asset and, as of the end of each reporting period.
 
According to the Group’s policy, transfers among the several categories of valuation are recognized when occurred, or when there are changes in the prevailing circumstances requiring the transfer.
 
Financial assets and financial liabilities as of June 30, 2020 are as follows:


Financial assets at amortized cost
 
 
Financial assets at fair value through profit or loss
 
 
Subtotal financial assets
 
 
Non-financial assets
 
 
Total


Level 1
 
 
Level 2
 
 
Level 3


June 30, 2020


Assets as per Statement of Financial Position


Trade and other receivables (excluding the allowance for doubtful accounts and other receivables)
  53,134 
  - 
  - 
  - 
  53,134 
  15,771 
  68,905 
Investments in financial assets:


  - Public companies’ securities
  - 
  618 
  248 
  - 
  866 
  - 
  866 
  - Private companies’ securities
  - 
  - 
  - 
  3,132 
  3,132 
  - 
  3,132 
  - Deposits
  1,029 
  66 
  - 
  - 
  1,095 
  - 
  1,095 
  - Bonds
  - 
  9,940 
  1,555 
  - 
  11,495 
  - 
  11,495 
  - Investments in financial assets with quotation
  - 
  6,994 
  872 
  250 
  8,116 
  - 
  8,116 
Derivative financial instruments:


  - Foreign-currency future contracts
  - 
  - 
  139 
  - 
  139 
  - 
  139 
  - Others
  66 
  - 
  22 
  153 
  241 
  - 
  241 
Restricted assets (i)
  8,698 
  - 
  - 
  - 
  8,698 
  - 
  8,698 
Financial assets available for sale:


  - Clal
  - 
  3,636 
  - 
  - 
  3,636 
  - 
  3,636 
Cash and cash equivalents:


  - Cash at bank and on hand
  26,562 
  - 
  - 
  - 
  26,562 
  - 
  26,562 
  - Short-term investments
  67,420 
  3,294 
  - 
  - 
  70,714 
  - 
  70,714 
Total assets
  156,909 
  24,548 
  2,836 
  3,535 
  187,828 
  15,771 
  203,599 


F-64


Financial liabilities at amortized cost
 
 
Financial liabilities at fair value through profit or loss
 
 
Subtotal financial liabilities
 
 
Non-financial liabilities
 
 
Total


Level 1
 
 
Level 2
 
 
Level 3


June 30, 2020


Liabilities as per Statement of Financial Position


Trade and other payables
  26,898 
  - 
  - 
  - 
  26,898 
  7,380 
  34,278 
Borrowings (excluding finance leases)
  404,954 
  - 
  - 
  - 
  404,954 
  - 
  404,954 
Derivative financial instruments:


  - Foreign-currency future contracts
  - 
  - 
  149 
  - 
  149 
  - 
  149 
  - Others
  - 
  - 
  1,028 
  22 
  1,050 
  - 
  1,050 
  - Forwards
  - 
  - 
  66 
  - 
  66 
  - 
  66 
Total liabilities
  431,852 
  - 
  1,243 
  22 
  433,117 
  7,380 
  440,497 
 
Financial assets and financial liabilities as of June 30, 2019 were as follows:


Financial assets at amortized cost
 
 
Financial assets at fair value through profit or loss
 
 
Subtotal financial assets
 
 
Non-financial assets
 
 
Total


Level 1
 
 
Level 2
 
 
Level 3


June 30, 2019


Assets as per Statements of Financial Position


Trade and other receivables (excluding the allowance for doubtful accounts and other receivables)
  44,602 
  - 
  - 
  - 
  44,602 
  11,974 
  56,576 
Investments in financial assets:
  - 
  - 
  - 
  - 
  - 
  - 
  - 
  - Public companies’ securities
  - 
  1,472 
  212 
  43 
  1,727 
  - 
  1,727 
  - Private companies’ securities
  - 
  - 
  - 
  2,810 
  2,810 
  - 
  2,810 
  - Deposits
  5,637 
  55 
  - 
  - 
  5,692 
  - 
  5,692 
  - Bonds
  - 
  25,738 
  1,634 
  1,536 
  28,908 
  - 
  28,908 
  - Investments in financial assets with quotation
  - 
  14,209 
  671 
  - 
  14,880 
  - 
  14,880 
Derivative financial instruments
  - 
  - 
  - 
  - 
  - 
  - 
  - 
  - Foreign-currency future contracts
  - 
  - 
  45 
  - 
  45 
  - 
  45 
  - Others
  - 
  - 
  18 
  146 
  164 
  - 
  164 
Restricted assets (i)
  11,478 
  - 
  - 
  - 
  11,478 
  - 
  11,478 
Financial assets available for sale:
  - 
  - 
  - 
  - 
  - 
  - 
  - 
  - Clal
  - 
  24,370 
  - 
  - 
  24,370 
  - 
  24,370 
Cash and cash equivalents:
  - 
  - 
  - 
  - 
  - 
  - 
  - 
  - Cash at bank and on hand
  10,348 
  - 
  - 
  - 
  10,348 
  - 
  10,348 
  - Short term investments
  80,605 
  2,107 
  - 
  - 
  82,712 
  - 
  82,712 
Total assets
  152,670 
  67,951 
  2,580 
  4,535 
  227,736 
  11,974 
  239,710 


Financial liabilities at amortized cost
 
 
Financial liabilities at fair value through profit or loss
 
 
Subtotal financial liabilities
 
 
Non-financial liabilities
 
 
Total


Level 1
 
 
Level 2
 
 
Level 3


June 30, 2019


Liabilities as per Statement of Financial Position


Trade and other payables
  22,723 
  - 
  - 
  - 
  22,723 
  8,533 
  31,256 
Borrowings (excluding finance leases)
  480,867 
  - 
  - 
  - 
  480,867 
  - 
  480,867 
Derivative financial instruments:
  - 


  - Swaps
  - 
  - 
  206 
  - 
  206 
  - 
  206 
  - Others
  - 
  - 
  1,340 
  74 
  1,414 
  - 
  1,414 
Total liabilities
  503,590 
  - 
  1,546 
  74 
  505,210 
  8,533 
  513,743 
 
(i) The fair value of financial assets and liabilities at their amortized cost does not differ significantly from their book value, except for borrowings (Note 20).
 
Liabilities carried at amortized cost also include liabilities under finance leases where the Group is the lessee and which therefore have to be measured in accordance with IAS 17 “Leases”. The categories disclosed are determined by reference to IFRS 9. Finance leases are excluded from the scope of IFRS 7 “Financial Instruments Disclosures”. Therefore, finance leases have been shown separately.
 
The following are details of the book value of financial instruments recognized, which were offset in the statements of financial position:


As of June 30, 2020
 
 
As of June 30, 2019


Gross amounts recognized
 
 
Gross amounts offset
 
 
Net amount presented
 
 
Gross amounts recognized
 
 
Gross amounts offset
 
 
Net amount presented
 
Financial assets


Trade and other receivables (excluding the allowance for doubtful accounts and other receivables)
  55,510 
  (2,376)
  53,134 
  46,929 
  (2,327)
  44,602 
Financial liabilities


Trade and other payables
  29,274 
  (2,376)
  26,898 
  25,050 
  (2,327)
  22,723 
 
Income, expense, gains and losses on financial instruments can be assigned to the following categories:
 
 
F-65


Financial assets / liabilities at amortized cost
 
 
Financial assets / liabilities at fair value through profit or loss
 
 
Total
 
June 30, 2020


Interest income (i)
  216 
  - 
  216 
Interest expense (i)
  (6,347)
  - 
  (6,347)
Foreign exchange gains, net (i)
  (6,722)
  - 
  (6,722)
Dividend income
  15 
  - 
  15 
Fair value gain on financial assets at fair value through profit or loss (i)
  - 
  362 
  362 
Gain on derivative financial instruments, net (i)
  - 
  (393)
  (393)
Other finance costs (i)
  (115)
  - 
  (115)
Total financial instruments
  (12,953)
  (31)
  (12,984)


Financial assets / liabilities at amortized cost
 
 
Financial assets / liabilities at fair value through profit or loss
 
 
Total
 
June 30, 2019


Interest income (i)
  187 
  - 
  187 
Interest expense (i)
  (5,034)
  - 
  (5,034)
Foreign exchange gains, net (i)
  1,080 
  - 
  1,080 
Dividend income
  15 
  - 
  15 
Fair value gain on financial assets at fair value through profit or loss (i)
  - 
  735 
  735 
Gain on derivative financial instruments, net (i)
  - 
  600 
  600 
Other finance costs (i)
  (22)
  - 
  (22)
Total financial instruments
  (3,774)
  1,335 
  (2,439)


Financial assets / liabilities at amortized cost
 
 
Financial assets / liabilities at fair value through profit or loss
 
 
Total
 
June 30, 2018


Interest income (i)
  703 
  - 
  703 
Interest expense (i)
  (4,315)
  - 
  (4,315)
Foreign exchange gains, net (i)
  (14,235)
  - 
  (14,235)
Dividend income
  105 
  - 
  105 
Fair value gain on financial assets at fair value through profit or loss (i)
  - 
  1,970 
  1,970 
Gain on derivative financial instruments, net (i)
  - 
  433 
  433 
Other finance costs (i)
  (41)
  - 
  (41)
Total financial instruments
  (17,783)
  2,403 
  (15,380)
 
(i)
Included within “Financial results, net“in the Statements of Income.
 
Clal
 
Clal is a holding company that mainly operates in the insurance and pension markets and in segments of pension funds. The Company holds assets and other businesses (such as insurance agencies) and is one of the largest insurance groups in Israel. Clal mainly develops its activities in three operating segments: long-term savings, general insurance and health insurance.
 
Given that IDBD failed to meet the requirements set forth to have control over an insurance company, on August 21, 2013, the Commissioner required that IDBD granted an irrevocable power of attorney to Mr. Moshe Tery ("the Trustee") for the 51% of the shareholding capital and vote interests in Clal, thus transferring control over that investee. From such date, IDBD recognized its equity interest in Clal as a financial asset held for sale, at fair value through profit or loss.
 
On December 30, 2014, the Commissioner sent an additional letter setting a term by which IDBD’s control over and equity interests in Clal were to be sold and giving directions as to the Trustee’s continuity in office, among other aspects. Refer to Note 4 and Note 34 of these financial statements for the sale of Clal shares.
 
The following table presents the changes in Level 3 financial instruments as of June 30, 2020 and 2019:
 
 
F-66


Derivative financial instruments - Forwards
 
 
Investments in financial assets - Private companies' securities
 
 
nvestments in financial assets - Others
 
 
Derivative financial instruments
 
 
Total
 
Balances at June 30, 2018
  (55)
  2,796 
  2,222 
  - 
  4,963 
Additions and acquisitions
  - 
  185 
  - 
  - 
  185 
Transfer between levels
  - 
  165 
  (212)
  111 
  64 
Transfer of trade and other receivables
  - 
  - 
  - 
  - 
  - 
Currency translation adjustment
  - 
  (70)
  (32)
  20 
  (82)
Write off
  - 
  - 
  - 
  - 
  - 
Gain / (loss) for the year (i)
  (19)
  (266)
  (399)
  15 
  (669)
Balances at June 30, 2019
  (74)
  2,810 
  1,579 
  146 
  4,461 
Additions and acquisitions
  - 
  38 
  - 
  - 
  38 
Transfer between levels
  - 
  - 
  - 
  378 
  378 
Currency translation adjustment
  (8)
  512 
  114 
  264 
  882 
Write off
  - 
  - 
  (1,052)
  (657)
  (1,709)
Gain / (loss) for the year (i)
  60 
  (228)
  (391)
  22 
  (537)
Balances at June 30, 2020
  (22)
  3,132 
  250 
  153 
  3,513 
 
(i) Included within “Financial results, net” in the Statements of income.
 
During the fiscal years ended June 30, 2020 and 2019, there were no transfers between levels of hierarchy of the fair value. When there are no quoted prices available in an active market, fair values (especially derivative instruments) are based on recognized valuation methods. The Group uses a range of valuation models for the measurement of Level 2 and Level 3 instruments, details of which may be obtained from the following table.
 
Description
Pricing model / method
Parameters
Fair value hierarchy
 
Range
 
Interest rate swaps
Cash flows - Theoretical price
Interest rate futures contracts and cash flows
Level 2
  - 
Investments in financial assets - Other private companies’ securities (*)
Cash flow / NAV - Theoretical price
Projected revenue discounted at the discount rate
The value is calculated in accordance with shares in the equity funds on the basis of their Financial Statements, based on fair value or investments assessments.
Level 3
  1 - 3.5 
Investments in financial assets - Others
Discounted cash flows - Theoretical price
Projected revenue discounted at the discount rate
The value is calculated in accordance with shares in the equity funds on the basis of their Financial Statements, based on fair value or investment assessments.
Level 3
  1 - 3.5 
Derivative financial instruments Forwards
 
Theoretical price
Underlying asset price and volatility
Level 2 and 3
  - 
 
(*) An increase in the discount rate would decrease the value of investments in private companies, while an increase in projected revenues would increase their value.
As of June 30, 2020, there are no changes in economic or business circumstances that affect the fair value of the Group's financial assets and liabilities.
 
 
F-67
IRSA Inversiones y Representaciones Sociedad Anónima
 
 
15. Trade and other receivables
 
Group’s trade and other receivables as of June 30, 2020 and 2019 were as follows:


June 30, 2020
 
 
June 30, 2019
 
Sale, leases and services receivables
  41,397 
  38,172 
Less: Allowance for doubtful accounts
  (4,021)
  (2,856)
Total trade receivables
  37,376 
  35,316 
Prepaid expenses
  14,529 
  8,593 
Borrowings, deposits and others
  10,797 
  4,434 
Advances to suppliers
  1,086 
  1,394 
Tax receivables
  866 
  686 
Others
  230 
  3,297 
Total other receivables
  27,508 
  18,404 
Total trade and other receivables
  64,884 
  53,720 
Non-current
  24,898 
  19,033 
Current
  39,986 
  34,687 
Total
  64,884 
  53,720 
 
Book amounts of Group's trade and other receivables in foreign currencies are detailed in Note 31.
 
The fair value of current receivables approximates their respective carrying amounts because, due to their short-term nature, the effect of discounting is not considered significant.
 
Trade accounts receivables are generally presented in the Statements of Financial Position net of allowances for doubtful accounts. Impairment policies and procedures by type of receivables are discussed in detail in Note 2. Movements on the Group’s allowance for doubtful accounts were as follows:


June 30, 2020
 
 
June 30, 2019
 
Beginning of the year
  2,856 
  1,928 
Adjustments previous periods (IFRS 9)
  - 
  209 
Additions
  1,107 
  840 
Recovery
  (117)
  (66)
Currency translation adjustment
  1,146 
  683 
Deconsolidation
  (22)
  - 
Receivables written off during the period/year as uncollectable
  (772)
  (500)
Transfer to assets held for sale
  (22)
  - 
Incorporation by business combination
  19 
  - 
Inflation adjustment
  (174)
  (238)
End of the year
  4,021 
  2,856 
 
(*) The creation and release of the provision for impaired receivables have been included in “Selling expenses” in the Statements of Income (Note 24).
 
The Group’s trade receivables comprise several classes. The maximum exposure to credit risk at the reporting date is the carrying amount of each class of receivables (see Note 5). The Group also has receivables from related parties neither of them is due nor impaired.
 
Due to the distinct characteristics of each type of receivables, an aging analysis of past due unimpaired and impaired receivables is shown by type and class, as of June 30, 2020 and 2019 (a column of non-past due receivables is also included so that the totals can be reconciled with the amounts appearing on the Statement of Financial Position):


F-68
IRSA Inversiones y Representaciones Sociedad Anónima


Past due


Up to 3 months
 
 
From 3 to 6 months
 
 
Over 6 months
 
 
Non-past due
 
 
Impaired
 
 
Total
 
 
% of representation
 
Leases and services
  419 
  60 
  94 
  2,495 
  748 
  3,816 
  9.22%
Consumer financing
  - 
  - 
  - 
  - 
  17 
  17 
  0.04%
Sale of properties and developments
  203 
  5 
  5 
  767 
  1 
  981 
  2.37%
Agricultural products
  - 
  - 
  - 
  14,721 
  504 
  15,225 
  36.78%
Sale of communication equipment
  1,686 
  284 
  131 
  1,248 
  22 
  3,371 
  8.14%
Telecommunication services
  1,600 
  - 
  481 
  13,177 
  2,729 
  17,987 
  43.45%
Total as of June 30, 2020
  3,908 
  349 
  711 
  32,408 
  4,021 
  41,397 
  100.00%


Leases and services
  452 
  134 
  189 
  2,970 
  508 
  4,253 
  11.14%
Hotel services
  - 
  - 
  - 
  158 
  - 
  158 
  0.42%
Consumer financing
  - 
  - 
  - 
  - 
  25 
  25 
  0.07%
Sale of properties and developments
  92 
  15 
  15 
  2,609 
  28 
  2,759 
  7.23%
Sale of communication equipment
  - 
  - 
  - 
  15,323 
  220 
  15,543 
  40.71%
Telecommunication services
  1,726 
  - 
  532 
  11,101 
  2,075 
  15,434 
  40.43%
Total as of June 30, 2019
  2,270 
  149 
  736 
  32,161 
  2,856 
  38,172 
  100.00%
 
16. Cash flow information
 
Following is a detailed description of cash flows generated by the Group’s operations for the years ended June 30, 2020, 2019 and 2018:
 
 
Note
  06.30.2020 
  06.30.2019 
  06.30.2018 
Profit / (loss) for the period
 
  25,548 
  (41,307)
  35,755 
Loss for the period from discontinued operations
 
  3,546 
  1,704 
  (15,773)
Adjustments for:


  - 
Income tax
18
  7,216 
  (4,845)
  (11,455)
Amortization and depreciation
20
  519 
  402 
  324 
Loss from disposal of property, plant and equipment
 
  - 
  - 
  - 
Net gain / (loss) from fair value adjustment of investment properties
 
  (36,313)
  41,737 
  (20,627)
Share-based compensation
 
  - 
  68 
  4 
Impairment associates
 
  - 
  - 
  - 
Impairment of goodwill
 
  - 
  198 
  - 
Impairment of properties for sale


  - 
Impairment of others assets


  - 
Net gain from disposal of intangible assets
 
  - 
  - 
  - 
Gain from disposal of subsidiary and associates
 
  - 
  162 
  2 
Gain from business combination
 
  - 
  - 
  - 
Financial results, net
 
  14,136 
  2,070 
  1,944 
Provisions and allowances
 
  897 
  980 
  270 
Share of (profit) /loss of associates and joint ventures
7
  (7,771)
  7,588 
  3,551 
Changes in operating assets and liabilities:


  - 
Decrease in inventories
 
  5 
  25 
  309 
Increase in trading properties
 
  (424)
  (937)
  (357)
Increase in restricted assets
 
  (1,254)
  - 
  - 
Decrease / (increase) in trade and other receivables
 
  2,045 
  (49)
  (728)
Decrease in trade and other payables
 
  (328)
  (1,305)
  1,354 
Decrease in salaries and social security liabilities
 
  (207)
  (140)
  161 
Decrease in provisions
 
  (572)
  (85)
  (64)
Net cash generated by continuing operating activities before income tax paid
 
  7,043 
  6,315 
  (5,330)
Net cash generated by discontinued operating activities before income tax paid
 
  27,151 
  24,308 
  29,971 
Net cash generated by operating activities before income tax paid
 
  34,194 
  30,623 
  24,641 
 
The following table shows balances incorporated as result of business combination / deconsolidation or reclassification of assets and liabilities held for sale of subsidiaries:
 
 
F-69
IRSA Inversiones y Representaciones Sociedad Anónima


June 30, 2020
 
 
June 30, 2019
 
Investment properties
  167,513 
  -10,489 
Property, plant and equipment
  -5,433 
  -68,941 
Trading properties
  167 
  - 
Intangible assets
  3,471 
  -14,812 
Investments in associates and joint ventures
  2,710 
  -874 
Restricted assets
  230 
  -219 
Income tax and MPIT credit
  47 
  - 
Trade and other receivables
  -9,746 
  -28,497 
Right-of-use assets
  -4,281 
  - 
Investments in financial assets
  14,581 
  -6,813 
Derivative financial instruments
  -40 
  -55 
Inventories
  -2,695 
  -14,114 
Borrowings
  -94,822 
  50,387 
Deferred income tax liabilities
  -21,753 
  6,693 
Trade and other payables
  2,490 
  54,895 
Lease liabilities
  2,236 
  - 
Provisions
  61 
  1,033 
Employee benefits
  115 
  3,001 
Salaries and social security liabilities
  149 
  5,719 
Income tax expense
  -115 
  17 
Net amount of non-cash assets incorporated / held for sale
  54,885 
  -23,069 
Cash and cash equivalents
  -6,463 
  -13,295 
Non-controlling interest
  54,629 
  17,543 
Goodwill
  -405 
  177 
Net amount of assets incorporated / held for sale
  102,646 
  -18,644 
Seller Financed Amount
  - 
  - 
Net (outflow) inflow of cash and cash equivalents / assets and liabilities held for sale
  102,646 
  -18,644 
 
The following table shows a detail of significant non-cash transactions occurred in the years ended June 30, 2020, 2019 and 2018:
 
 
  06.30.2020 
  06.30.2019 
  06.30.2018 
Decrease in associates and joint ventures through an increase in assets held for sale
  2,230 
  - 
  105 
Increase of investment properties through a decrease of financial assets
  299 
  - 
  9 
Increase of properties for sale through an increase in borrowings
  13 
  18 
  5 
Changes in non-controlling interest through a decrease in trade and other receivables
  - 
  - 
  3,303 
Increase of property, plant and equipment through an increase of trade and other payables
  796 
  919 
  5,231 
Increase of intangible assets through an increase of trade and other payables
  532 
  355 
  12 
Distribution of dividends on shares
  634 
  2,811 
  - 
Decrease in associates and joint ventures through an increase in trade and other receivables
  - 
  - 
  26 
Increase in property, plant and equipment through increased borrowings
  - 
  6 
  22 
Registration of investment properties through a decrease in credits for trade and other receivables
  30 
  618 
  138 
Increase in financial instruments through a decrease in investments in associates and joint ventures
  - 
  - 
  155 
Issuance of NCN
  23 
  3,611 
  - 
Increase in trade and other receivables through increase in borrowings
  - 
  - 
  262 
Distribution of dividends to non-controlling interest pending payment
  1,896 
  (366)
  (3,659)
Decrease of in investments in associates and joint ventures through a decrease in borrowings
  - 
  9 
  477 
Increase of associates due to loss of control in subsidiaries
  1,437 
  - 
  - 
Decrease in borrowings through a decrease in financial assets
  2,642 
  - 
  - 
Increase in investment properties through an increase in trade and other payables
  765 
  759 
  318 
Increase of investment properties through an increase of borrowings
  87 
  251 
  65 
Increase in investment in associates through a decrease in investments in financial assets
  919 
  - 
  - 
Increase in investments in financial assets through a decrease in investment properties
  1,279 
  - 
  - 
Increase in rights of use through an increase in lease liabilities - Adjustment of opening balances (IFRS 16)
  15,205 
  - 
  - 
Increase in rights of use through an increase in lease liabilities
  8,710 
  - 
  - 
 
17. Shareholders’ Equity
 
Share capital and share premium
 
The share capital of the Group is represented by common shares with a nominal value of Ps. 1 per share and one vote each. No other activity has been recorded for the fiscal years ended June 30, 2020, 2019 and 2018 in the capital accounts, other than those related to the acquisition of treasury shares.
 
 
F-70
 
 
Inflation adjustment of share capital and treasury shares
 
The inflation adjustment related to share capital is allocated to an inflation adjustment reserve that forms part of shareholders' equity. The balance of this reserve could be applied only towards the issuance of common stock to shareholders of the Company.
 
Legal reserve
 
According to Law N° 19,550, 5% of the profit of the year is destined to the constitution of a legal reserve until it reaches the legal capped amount (20% of total capital). This legal reserve is not available for dividend distribution and can only be released to absorb losses. The Group reached the legal limit of this reserve.
 
Special reserve
 
The CNV, through General Ruling N° 562/9 and 576/10, has provided for the application of Technical Resolutions N° 26 and 29 of the FACPCE, which adopt the IFRS, as issued by the IASB, for companies subject to the public offering regime ruled by Law 17,811, due to the listing of their shares or corporate notes, and for entities that have applied for authorization to be listed under the mentioned regime. The Group has applied IFRS, as issued by the IASB, for the first time in the year beginning July 1st, 2012, being its transition date July 1st, 2011. Pursuant to CNV General Ruling N° 609/12, the Company set up a special reserve reflecting the positive difference between the balance of retained earnings disclosed in the first Financial Statements prepared according to IFRS and the balance of retained earnings disclosed in the last Financial Statements prepared in accordance with previously effective accounting standards. The reserve recorded amounted to Ps. 425, which as of June 30, 2017 were fully used to absorb the negative balances in the retained earnings account. During fiscal year ended June 30, 2017, the Company’s Board of Directors decided to change the accounting policy of investment property from the cost method to the fair value method, as allowed by IAS 40. For this reason, as of the transition date, figures have been modified and, hence, the special reserve as set forth by General Ruling CNV N° 609/12 has been increased to Ps. 10,121, which may only be reversed to be capitalized or to absorb potential negative balances under retained earnings.
 
Additional paid-in capital from treasury shares
 
Upon sale of treasury shares, the difference between the net realizable value of the treasury shares sold and the acquisition cost will be recognized, whether it is a gain or a loss, under the non-capitalized contribution account and will be known as “Treasury shares trading premium”.
 
Dividends
 
See note 4 to these financial statements on distribution of dividend(s) in kind.
 
18. Trade and other payables
 
Group’s trade and other payables as of June 30, 2019 and 2018 were as follows:


June 30, 2020
 
 
June 30, 2019
 
Trade payables
  20,151 
  18,696 
Advances from sales, leases and services
  2,850 
  4,857 
Construction obligations
  438 
  1,432 
Accrued invoices
  473 
  725 
Deferred income
  153 
  146 
Total trade payables
  24,065 
  25,856 
Dividends payable to non-controlling interest
  241 
  220 
Taxes payable
  171 
  451 
Construction provisions
  - 
  1,562 
Other payables
  9,801 
  3,167 
Total other payables
  10,213 
  5,400 
Total trade and other payables
  34,278 
  31,256 
Non-current
  2,335 
  2,697 
Current
  31,943 
  28,559 
Total
  34,278 
  31,256 
 
The fair value of payables approximates their respective carrying amounts because, due to their short-term nature, the effect of discounting is not considered significant. Fair values are based on discounted cash flows (Level 3).
 
 
F-71
 
 
19. Provisions
 
The Group is subject to claims, lawsuits and other legal proceedings in the ordinary course of business, including claims from clients where a third party seeks reimbursement or damages. The Group’s responsibility under such claims, lawsuits and legal proceedings cannot be estimated with certainty. From time to time, the status of each major issue is evaluated and its potential financial exposure is assessed. If the potential loss involved in the claim or proceeding is deemed probable and the amount may be reasonably estimated, a liability is recorded. The Group estimates the amount of such liability based on the available information and in accordance with the provisions of the IFRS. If additional information becomes available, the Group will make an evaluation of claims, lawsuits and other outstanding proceeding, and will revise its estimates.
 
The following table shows the movements in the Group's provisions categorized by type:


Year ended June 30, 2020


Legal claims (i)
 
 
Investments in associates and joint ventures (ii)
 
 
Site dismantling and remediation
 
 
Other provisions
 
 
Total
 
As of 06.30.18
  2,465 
  5,870 
  395 
  2,285 
  11,015 
Additions (i)
  692 
  4,028 
  - 
  292 
  5,012 
Recovery
  (108)
  (9)
  - 
  - 
  (117)
Used during the period / year
  (365)
  - 
  (17)
  - 
  (382)
Inflation adjustment
  (82)
  - 
  - 
  - 
  (82)
Currency translation adjustment
  (32)
  (568)
  (9)
  143 
  (466)
As of 06.30.19
  2,570 
  9,321 
  369 
  2,720 
  14,980 
Additions
  477 
  - 
  36 
  - 
  513 
Share of los of associates
  - 
  (8,032)
  - 
  - 
  (8,032)
Incorporated by business combination
  60 
  - 
  - 
  - 
  60 
Recovery
  (46)
  (1,086)
  - 
  - 
  (1,132)
Used during the period / year
  (701)
  - 
  - 
  (195)
  (896)
Inflation adjustment
  (73)
  - 
  - 
  - 
  (73)
Currency translation adjustment
  397 
  (185)
  78 
  214 
  504 
As of 06.30.20
  2,684 
  18 
  483 
  2,739 
  5,924 


June 30, 2020
 
 
June 30, 2019
 
Non-Current
  3,297 
  12,329 
Current
  2,627 
  2,651 
Total
  5,924 
  14,980 
 
(i) Additions and recoveries are included in "Other operating results, net".
(ii)  Corresponds to the equity interest in New Lipstick with negative equity in 2019 and Puerto Retiro in 2020 and 2019. Additions and recoveries are included in "Share of profit / (loss) of associates and joint ventures".
(iii) The Group’s companies are required to recognize certain costs related to the dismantling of assets and remediation of sites from the places where such assets are located. The calculation of such expenses is based on the dismantling value for the current year, taking into consideration the best estimate of future changes in prices, inflation, etc. and such costs are capitalized at a risk-free interest rate. Volume projections for retired or built assets are recast based on expected changes from technological rulings and requirements.
(iv) Provisions for other contractual obligations include a series of obligations resulting from a contractual liability or law, regarding which there is a high degree of uncertainty as to the terms and the necessary amounts to discharge such liability.
(v) In November 2009, PBC’s Audit Committee and Board of Directors approved the agreement with Rock Real whereby the latter would look for and propose to PBC the acquisition of commercial properties outside Israel, in addition to assisting in the negotiations and management of such properties. In return, Rock Real would receive 12% of the net income generated by the acquired property. Pursuant to amendment 16 of the Israel Commercial Act 5759-1999, the agreement must be ratified by the Audit Committee before the third year after the effective date; otherwise, it expires. The agreement has not been ratified by the audit committee within such three-year term, so in January 2017 PBC issued a statement that hinted at the expiration of the agreement and informed that it would begin negotiations to reduce the debt. The parties have appointed an arbitrator that should render a decision on the dispute. The remaining corresponds to provisions related to investment properties.
 
IRSA
 
On February 23, 2016, a class action was filed against IRSA, Cresud and some first-line managers and directors at the District Court of the USA for the Central District of California. The complaint, on behalf of people holding American Depositary Receipts of the Company between November 3, 2014 and December 30, 2015, claims presumed violations to the US federal securities laws. In addition, it argues that defendants have made material misrepresentations and made some omissions related to the Company’s investment in IDBD.
 
 
F-72
 
 
Such complaint was voluntarily waived on May 4, 2016 by the plaintiff and filed again on May 9, 2016 with the US District Court for the Eastern District of Pennsylvania.
 
Furthermore, the Companies and some of its first-line managers and directors are defendants in a class action filed on April 29, 2016 with the US District Court for the Eastern District of Pennsylvania. The complaint, on behalf of people holding American Depositary Receipts of the Companies between May 13, 2015 and December 30, 2015, presumes violations to the US federal securities laws. In addition, it argues that defendants have made material misrepresentations and made some omissions related to the investment of the Company's subsidiary, IRSA, in IDBD.
 
Subsequently, the Companies requested the transfer of the claim to the district of New York, which was accepted.
 
On December 8, 2016, the Court appointed the representatives of each presumed class as primary plaintiffs and the lead legal advisor for each of the classes. On February 13, 2017, the plaintiffs of both classes filed a document containing certain amendments. The companies filed a petition requesting that the class action brought by shareholders should be dismissed. On April 12, 2017, the Court suspended the class action filed by shareholders until the Court decides on the petition of dismissal of such class action. Filing information on the motion to dismiss the collective remedy filed by shareholders of IRSA was completed on July 7, 2017.
 
On September 10, 2018, the New York Court issued an order granting the motion to dismiss the IRSA Case in its entirety.
 
On September 24, 2018, Plaintiff in the Cresud Case filed a document acknowledging that the Cresud Class Action complaint should be dismissed for the same reasons set forth in the Court’s September 10, 2018 order in the IRSA Case, subject to a right of appeal.
 
On October 9, 2018, the Plaintiff in the IRSA Case filed a notice of appeal to the United States Court of Appeals for the Second Circuit. On December 12, 2018, Plaintiff in the Cresud Case filed a notice of voluntary dismissal, with prejudice. On December 13, 2018, Plaintiff moved to dismiss the appeal of the IRSA Case in the Second Circuit upon agreement with IRSA and Cresud that the parties shall bear their own costs and fees in the litigation, including the appeal, and that no fees are due. Accordingly, the Second Circuit dismissed Plaintiff’s appeal on December 18, 2018.
 
The IRSA and Cresud cases are fully resolved without any penalty for the Group.
 
Claims against Cellcom and its subsidiaries
 
In the ordinary course of business, Cellcom receives various consumer complaints, mainly through collective actions. They allege excess collections, breach of agreements with customers and failure to comply with established norms or licenses, which could cause harm to consumers.
 
In addition, the Cellcom receives other claims from employees, subcontractors, suppliers and authorities, generally in relation to non-compliance with the provisions of the law with respect to payments upon termination of employment relationships, breach of contracts, violation of copyright and patents or disputes for payments demanded by the authorities.
 
Claims against PBC
 
On July 4, 2017, PBC was served notice from the tax authority of Israel of income tax official assessments based on a “better assessment” of taxes for the years 2012-2015, and concluded that PBC is required to pay approximately
NIS 187 (including interest) since compensation of losses is not admitted.
 
In the opinion of legal advisors to PBC, PBC has sound arguments against the Revenue Administration’s position and will file its objection to it. As of the date of these Consolidated Financial Statements, there is no provision in relation to this claim.
 
DIC class action
 
On October 3, 2018 it was sent an action and a motion to approve that action as a class action (jointly – the "Motion"), which had been filed within the District Court of Tel Aviv Yafo (the "Court") against the Group; against Mr.
 
 
F-73
 
 
Eduardo Elsztain, the controlling person of the Company (the "Controlling Person"), who serves as chairman of the Company's board of directors; against directors serving in the Group who have an interest in the Controlling Person; and against additional directors and officers serving in the Company (all jointly – the "Respondents"), in connection with the exit of the Company's share, on February 1, 2018, from the TA 90 and TA 125 indices, whereon it had been traded on the Tel Aviv Stock Exchange Ltd. up to that date (the "Indices"), by an applicant alleging to have held the Group's shares prior to February 1, 2018.
 
In the Motion, the Court is requested, inter alia, to approve the action as a class action and to charge the Respondents with compensating the members of the group according to the damage caused them. The estimated amount is approximately NIS 17.6 million.
 
DIC believes that it acted lawfully and as required in all that pertains to the subject of the Motion, and accordingly, after having preliminarily reviewed the Group's Motion, believes that it is unfounded.
 
IDBD class action
 
On October 3, 2018, an action and a motion to approve a class action had been filed with the District Court in Tel Aviv Yafo (jointly – the "Motion"). The Motion has been filed, against IDBD, against Dolphin IL, against Mr. Eduardo Elsztain and against the Official Receiver, and in it, the Court was requested to hold that the Transaction was not in compliance with the provisions of the Centralization Law, to appoint a trustee over DIC's shares owned by the respondents and to order the payment of monetary damages to the public shareholders in DIC for the alleged preservation of the pyramidal structure in IDBD, at a scope of between NIS 58 and NIS 73.
 
The bulk of the Applicant's allegations is that the Group continues to be the Controlling Person in DIC (potentially and effectively) even after the completion of the sale of DIC shares to DIL as described in Note 4 in the Annual Financial Statements (the “transaction”) and that the controlling person of IDBD (in his capacity as chairman of the Board of Directors and controlling person of DIC as well) had a personal interest separate from the personal interest of the minority shareholders in DIC, in the manner of implementation of the Centralization Law's provisions, and that he and the Group breached the duty of good faith and the duty of decency toward DIC, and additionally the controlling person of IDBD breached his duty of trust and duty of care toward DIC, this being, allegedly, due to the fact that the decision regarding the preferred alternative for complying with the Centralization Law's Provisions was not brought before DIC's general meeting. The Applicant further alleges deprivation of the minority shareholders in DIC.
 
Having preliminarily reviewed the Motion, the Management believes that it is unfounded and that once the transaction is consummated, IDBD complies with the provisions of the Concentration Law.
 
20. Borrowings
 
The breakdown and the fair value of the Group borrowings as of June 30, 2020 and 2019 was as follows:


Total as of June 30, 2020 (ii)
 
 
Total as of June 30, 2019 (ii)
 
 
Fair value as of June 30, 2020
 
 
Fair value as of June 30, 2019
 
NCN
  340,026 
  410,864 
  271,310 
  405,386 
Bank loans
  60,580 
  62,787 
  48,799 
  60,016 
Bank overdrafts
  2,614 
  432 
  2,614 
  432 
Other borrowings (i)
  1,734 
  6,784 
  1,734 
  9,543 
Total borrowings
  404,954 
  480,867 
  324,457 
  475,377 
Non-current
  320,616 
  410,853 
    
    
Current
  84,338 
  70,014 


  404,954 
  480,867 


(i) Includes financial leases for Ps. 1 and Ps. 26 as of June 30, 2020 and 2019, respectively.
(ii) Includes Ps. 335,532 and Ps. 423,774 as of June 30, 2020 and 2019, respectively, corresponding to the Operations Center in Israel.
 
As of June 30, 2020 and 2019, total borrowings include collateralized liabilities (seller financing, leases and bank loans) of Ps. 8,957 and Ps. 16,547, respectively. These borrowings are mainly collateralized by investment properties and property, plant and equipment of the Group (Notes 9 and 10).
 
Borrowings also include liabilities under finance leases where the Group is the lessee and which therefore were measured in accordance with IAS 17 “Leases”. Information regarding liabilities under finance leases is disclosed in Note 22.
 
 
F-74
 
 
The terms of the loans include standard covenants for this type of financial operations. As of the date of these financial statements, the Group has complied with the covenants contemplated in its respective loan agreements, with the exception of an IDBG loan, which was reclassified to current loans, since it breached a term that determined the IDBD debt rating (company that guaranteed that loan). The amount thereof is NIS 153.
 
The maturity of the Group's borrowings (excluding obligations under finance leases) is as follows:


June 30, 2020
 
 
June 30, 2019
 
Share capital


Less than 1 year
  83,504 
  65,852 
Between 1 and 2 years
  46,202 
  61,358 
Between 2 and 3 years
  118,111 
  50,355 
Between 3 and 4 years
  38,368 
  110,705 
Between 4 and 5 years
  34,710 
  44,314 
Later than 5 years
  83,121 
  143,842 
 
  404,016 
  476,426 
Interest
    
    
Less than 1 year
  834 
  4,162 
Between 1 and 2 years
  - 
  - 
Between 2 and 3 years
  52 
  - 
Between 3 and 4 years
  - 
  215 
Between 4 and 5 years
  27 
  - 
Later than 5 years
  24 
  38 
 
  937 
  4,415 
Leases
  1 
  26 
 
  404,954 
  480,867 
 
The following table shows a breakdown of Group’s borrowing by type of fixed-rate and floating-rate, per currency denomination and per functional currency of the subsidiary that holds the loans for the fiscal years ended June 30, 2020 and 2019.


June 30, 2020
 
Rate per currency
 
Argentine Peso
 
 
US dollar
 
 
Uruguayan Peso
 
 
New Israel Shekel
 
 
Total
 
Fixed rate:


Argentine Peso
  2,615 
  - 
  - 
  - 
  2,615 
New Israel Shekel
  - 
  - 
  - 
  190,137 
  190,137 
US Dollar
  62,762 
  157 
  557 
  280 
  63,756 
Subtotal fixed-rate borrowings
  65,377 
  157 
  557 
  190,417 
  256,508 
Floating rate:
  - 
  - 
  - 
  - 
  - 
Argentine Peso
  960 
  - 
  - 
  - 
  960 
New Israel Shekel
  - 
  - 
  - 
  145,115 
  145,115 
US Dollar
  2,370 
  - 
  - 
  - 
  2,370 
Subtotal floating-rate borrowings
  3,330 
  - 
  - 
  145,115 
  148,445 
Total borrowings as per analysis
  68,707 
  157 
  557 
  335,532 
  404,953 
Finance leases obligations
  1 
  - 
  - 
  - 
  1 
Total borrowings as per Statement of Financial Position
  68,708 
  157 
  557 
  335,532 
  404,954 


June 30, 2019
 
Rate per currency
 
Argentine Peso
 
 
US dollar
 
 
Uruguayan Peso
 
 
New Israel Shekel
 
 
Total
 
Fixed rate:


Argentine Peso
  626 
  - 
  - 
  - 
  626 
New Israel Shekel
  - 
  - 
  - 
  242,851 
  242,851 
US Dollar
  52,466 
  131 
  485 
  12,806 
  65,888 
Subtotal fixed-rate borrowings
  53,092 
  131 
  485 
  255,657 
  309,365 
Floating rate:
  - 
  - 
  - 
  - 
  - 
Argentine Peso
  959 
  - 
  - 
  - 
  959 
New Israel Shekel
  - 
  - 
  - 
  168,115 
  168,115 
US Dollar
  2,402 
  - 
  - 
  - 
  2,402 
Subtotal floating-rate borrowings
  3,361 
  - 
  - 
  168,115 
  171,476 
Total borrowings as per analysis
  56,453 
  131 
  485 
  423,772 
  480,841 
Finance leases obligations
  26 
  - 
  - 
  - 
  26 
Total borrowings as per Statement of Financial Position
  56,479 
  131 
  485 
  423,772 
  480,867 
 
The following describes the debt issuances made by the Group for the years ended June 30, 2020 and 2019:
 
 
F-75


Interest


Entity
Class
Issuance / expansion date
Amount in original currency
Maturity date
rate
Principal payment
Interest payment
 
PBC
SERIE I
jul-18
NIS 507
06/29/2029
3.95% n.a.
At expiration
quarterly
(1)
PBC
SERIE j
may-19
NIS 515
12/31/2029
4.15% n.a.
At expiration
annual
 
Gav - Yam
SERIE H
sep-17
NIS 424
06/30/2034
2.55% n.a.
Annual payments since 2019
biannual
(1)
Gav - Yam
SERIE A
jul-18
NIS 320
10/31/2023
3.55% n.a.
Annual payments since 2021
biannual
 
Gav - Yam
SERIE H
sep-18
NIS 596
06/30/2024
2.55% n.a.
Annual payments since 2019
annual
(1)
Gav - Yam
SERIE A
dic-18
NIS 351
10/31/2023
3.55% n.a.
Annual payments since 2021
biannual
 
Cellcom
SERIE L
jan-18
NIS 401
1/5/2028
2.5% n.a.
Annual payments since 2023
annual
    
Cellcom
SERIE K
jul-18
NIS 220
7/5/2026
3.55% n.a.
Annual payments since 2021
annual
(1)
Cellcom
SERIE K
dic-18
NIS 187
1/7/2026
3.55% n.a.
Annual payments since 2021
annual
(1)
Cellcom
SERIE L
dic-18
NIS 213
1/15/2028
2.50% n.a.
Annual payments since 2023
annual
 
IRSA
Clase I tramo2
aug-19
USD 85
11/15/2028
10.00% n.a.
At expiration
quarterly
(1)
IRSA
Clase II
aug-19
CLP 31,503
8/6/2020
10.50% n.a.
At expiration
quarterly
    
IDBD
Serie 15
nov-19
NIS 237
06/30/2022
4.70% n.a
Two payments
quarterly
 
IRSA
Clase II
may-20
ARS 354
02/19/2021
Badlar.+ 0.6%n.a.
At expiration
quarterly
(1)
IRSA
Case IV
may-20
USD 51
05/19/2021
7% n.a.
At expiration
quarterly
  
IRSA
Clase V
may-20
USD 9
05/19/2022
9% n.a.
At expiration
quarterly
 
 
(1) Corresponds a to an expansion of the series.
 
The following table shows a detail of evolution of borrowing during the years ended June 30, 2020 and 2019:


June 30, 2020
 
 
June 30, 2019
 
Balance at the beginning of the year
  480,867 
  494,615 
Borrowings
  33,018 
  72,743 
Payment of borrowings
  (73,558)
  (61,762)
Collection / (Payment) of short term loans, net
  2,709 
  (1,091)
Interests paid
  (20,620)
  (23,370)
Deconsolidation (see Note 4)
  (102,749)
  - 
Accrued interests
  22,026 
  23,924 
Changes in fair value of third-party loans
  - 
  (29)
Cumulative translation adjustment and exchange differences, net
  64,335 
  (22,280)
Inflation adjustment
  (1,074)
  (1,883)
Balance at the end of the year
  404,954 
  480,867 
 
21. Income tax
 
The Group’s income tax has been calculated on the estimated taxable profit for each year at the rates prevailing in the respective tax jurisdictions. The subsidiaries of the Group in the jurisdictions where the Group operates are required to calculate their income taxes on a separate basis; thus, they are not permitted to compensate subsidiaries’ losses against subsidiaries income.
 
Argentine tax reform
 
Law 27,541 on Solidarity and Production Reactivation, which was published in December 2019, introduced some amendments to different taxes and created the so-called Impuesto para una Argentina Inclusiva y Solidaria (PAIS).
 
The main amendments related to Income Tax that affect the Group companies are:
 
1) In the first and second fiscal years begun after January 1, 2019 (i.e., for the Group’s fiscal years begun on July 1, 2019 and 2020), the profit / loss for tax inflation adjustment shall be allocated as follows: one sixth in the fiscal year of assessment thereof and the other five sixths over the following fiscal years;
 
2) The rate applicable to companies for the third fiscal year commencing after January 1, 2018 (i.e., for the Group’s fiscal years begun on July 1, 2019) is increased from 25% to 30%.
 
Tax inflation adjustment: Law 27,430, which was promulgated by the Argentine Congress on December 29, 2017 in the context of the tax reform, establishes the following rules for the application of the inflation adjustment in income tax: (i) the update of the cost for goods acquired or investments made in the fiscal years that begin as of January 1, 2018 (applicable to IRSA for the year end June 30, 2019), considering the percentage variations of the CPI provided by the National Institute of Statistics and Census (INDEC); and (ii) the application of the adjustment set forth in Title VI of the Income Tax Law when a percentage of variation -of the aforementioned index price - accumulated in thirty-six (36) months prior to the fiscal year end that is liquidated, is greater than 100%, or, with respect to the first, second and third year after its validity, this procedure will be applicable in case the accumulated variation of that index price, calculated from the
 
 
F-76
 
 
beginning of the first of them and until the end of each year, exceeds 55%, 30% and 15% for the first, second and third year of application, respectively. At the end of this year, there has been an accumulative variation of 55.72% in the index price that exceeds the expected condition of 55% for the application of the adjustment in said first year. Consequently, the tax inflation adjustment has been applied and the cost of goods acquired during the year 2019 has been updated as established in article 58 of the Argentine Income Tax Law.
 
US tax reform
 
In December 2017, a bill was passed to reform the Federal Taxation Law in the United States. The reform included a reduction of the corporate tax rate from 35% to 21%, for the tax years 2018 and thereafter. The reform has impact in certain subsidiaries of the Group in the United States.
 
The details of the provision for the Group’s income tax, is as follows:


June 30, 2020
 
 
June 30, 2019
 
 
June 30, 2018
 
Current income tax
  (278)
  (242)
  733 
Deferred income tax
  (6,793)
  5,087 
  10,722 
Minimum presumed income tax
  (145)
  - 
  - 
Income tax from continuing operations
  (7,216)
  4,845 
  11,455 
 
The statutory taxes rates in the countries where the Group operates for all of the years presented are:
 
Tax jurisdiction
 
Income tax rate
Argentina
 
25% - 35%
Uruguay
 
0% - 25%
U.S.A.
 
0% - 40%
Bermuda
 
0%
Israel
 
23% - 24%
 
Below is a reconciliation between income tax expense and the tax calculated applying the current tax rate, applicable in the respective countries, to profit before taxes for years ended June 30, 2020, 2019 and 2018:


June 30, 2020
 
 
June 30, 2019
 
 
June 30, 2018
 
Profit from continuing operations at tax rate applicable in the respective countries (*)
  (11,556)
  12,557 
  (2,971)
Permanent differences:


Share of profit of associates and joint ventures
  957 
  (1,790)
  (199)
Unrecognized tax loss carryforwards (i)
  (898)
  (1,987)
  56 
Changes in fair value of financial instruments
  - 
  - 
  - 
Inflation adjustment permanent difference
  1,787 
  - 
  - 
Tax rate differential
  2,673 
  (88)
  12,762 
Taxable profit of non-argentinian holding subsidiaries
  - 
  615 
  (462)
Non-taxable profit, non-deductible expenses and others
  1,906 
  (600)
  2,269 
Fiscal transparency
  161 
  - 
  - 
Tax inflation adjustment
  (2,246)
  (3,862)
  - 
Income tax from continuing operations
  (7,216)
  4,845 
  11,455 
 
Deferred tax assets and liabilities of the Group as of June 30, 2020 and 2019 will be recovered as follows:


June 30, 2020
 
 
June 30, 2019
 
Deferred income tax asset to be recovered after more than 12 months
  16,219 
  12,929 
Deferred income tax asset to be recovered within 12 months
  936 
  2,230 
Deferred income tax assets
  17,155 
  15,159 


June 30, 2020
 
 
June 30, 2019
 
Deferred income tax liability to be recovered after more than 12 months
  (61,724)
  (50,765)
Deferred income tax liability to be recovered within 12 months
  (2,158)
  (20,396)
Deferred income tax liability
  (63,882)
  (71,161)
Deferred income tax assets (liabilities), net
  (46,727)
  (56,002)
 
The movement in the deferred income tax assets and liabilities during the years ended June 30, 2020 and 2019, without taking into consideration the offsetting of balances within the same tax jurisdiction, is as follows:
 
 
F-77


  06.30.19 
 
Cumulative translation adjustment
 
 
Charged / (Credited) to the statements of income
 
 
Revaluation surplus reserve
 
 
Charged / (Credited) to the revaluation surplus reserve
 
 
Deconsolidation
 
 
Incorporation by business combination
 
  06.30.20 
Assets


Property, plant and equipment
  184 
  1,092 
  (957)
  - 
  - 
  - 
  - 
  319 
Investments
  6 
  - 
  (6)
  - 
  - 
  - 
  - 
  - 
Trade and other payables
  6,164 
  924 
  (901)
  - 
  - 
  (464)
  - 
  5,723 
Tax loss carry-forwards
  7,512 
  1,117 
  661 
  - 
  - 
  (89)
  - 
  9,201 
Others
  1,293 
  180 
  439 
  - 
  - 
  - 
  - 
  1,912 
Subtotal assets
  15,159 
  3,313 
  (764)
  - 
  - 
  (553)
  - 
  17,155 
Liabilities
  - 
  - 
  - 
  - 
  - 
  - 
  - 
  - 
Investment properties and Property, plant and equipment
  (62,662)
  (186)
  (8,503)
  (98)
  386 
  16,119 
  (672)
  (55,616)
Trade and other receivables
  (957)
  - 
  (36)
  - 
  - 
  - 
  - 
  (993)
Investments
  (141)
  - 
  65 
  - 
  - 
  - 
  - 
  (76)
Tax inflation adjustment
  (3,248)
  - 
  (1,404)
  - 
  - 
  - 
  - 
  (4,652)
Borrowings
  (1,140)
  (304)
  416 
  - 
  - 
  - 
  - 
  (1,028)
Intangible assets
  (2,438)
  (550)
  412 
  - 
  - 
  - 
  - 
  (2,576)
Others
  (575)
  (577)
  2,669 
  - 
  - 
  (196)
  (262)
  1,059 
Subtotal liabilities
  (71,161)
  (1,617)
  (6,381)
  (98)
  386 
  15,923 
  (934)
  (63,882)
Assets (Liabilities), net
  (56,002)
  1,696 
  (7,145)
  (98)
  386 
  15,370 
  (934)
  (46,727)
 
 
  06.30.18 
 
Cumulative translation adjustment
 
 
Charged / (Credited) to the statements of income
 
  06.30.19 
Assets


Property, plant and equipment
  247 
  (501)
  438 
  184 
Investments
  - 
  - 
  6 
  6 
Trade and other payables
  4,961 
  214 
  989 
  6,164 
Tax loss carry-forwards
  10,545 
  (283)
  (2,750)
  7,512 
Others
  1,075 
  (66)
  284 
  1,293 
Subtotal assets
  16,828 
  (636)
  (1,033)
  15,159 
Liabilities
  - 
  - 
  - 
  - 
Investment properties and Property, plant and equipment
  (71,686)
  1,694 
  7,330 
  (62,662)
Trade and other receivables
  (574)
  - 
  (383)
  (957)
Investments
  - 
  (17)
  (124)
  (141)
Tax inflation adjustment
  - 
  - 
  (3,248)
  (3,248)
Borrowings
  (1,387)
  101 
  146 
  (1,140)
Intangible assets
  (3,209)
  279 
  492 
  (2,438)
Others
  (2,652)
  683 
  1,394 
  (575)
Subtotal liabilities
  (79,508)
  2,740 
  5,607 
  (71,161)
Assets (Liabilities), net
  (62,680)
  2,104 
  4,574 
  (56,002)
 
Deferred income tax assets are recognized for tax loss carry-forwards to the extent that the realization of the related tax benefits through future taxable profits is probable. Tax loss carry-forwards may have expiration dates or may be permanently available for use by the Group depending on the tax jurisdiction where the tax loss carry-forward is generated. Tax loss carry forwards in Argentina and Uruguay generally expire within 5 years, while in Israel do not expire.
 
As of June 30, 2020, the Group's recognized tax loss carry forward prescribed as follows:
 
Date
 
Total
 
2021
  3 
2022
  12 
2023
  2,998 
2024
  1,277 
2025
  5,175 
Subtotal
  9,465 
Do not expire
  4,074 
Total
  13,539 


In order to fully realize the deferred tax asset, the respective companies of the Group will need to generate future taxable income. To this aim, a projection was made for future years when deferred assets will be deductible. Such projection is based on aspects such as the expected performance of the main macroeconomic variables affecting the business, production issues, pricing, yields and costs that make up the operational flows derived from the regular exploitation of fields and other assets of the group, the flows derived from the performance of financial assets and liabilities and the income generated by the Group’s strategy of crop rotation. Such strategy implies the purchase and/or development of fields in marginal areas or areas with a high upside potential and periodical sale of such properties that are deemed to have reached their maximum appreciation potential.
 
 
F-78
 
 
Based on the estimated and aggregate effect of all these aspects on the companies’ performance, Management estimates that as at June 30, 2020, it is probable that the Company will realize all of the deferred tax assets.
 
The Group did not recognize deferred income tax assets (tax loss carry forwards) of Ps. 486,058 for the Operations Center in Israel and Ps. 141 for the Operations Center in Argentina as of June 30, 2020 and Ps. 345,850 for the Operations Center in Israel and Ps. 7,941 for the Operations Center in Argentina as of June 30, 2019. Although the Management estimates that the business will generate sufficient income, pursuant to IAS 12, management has determined that, as a result of the recent loss history and the lack of verifiable and objective evidence due to the subsidiary’s results of operations history, there is sufficient uncertainty as to the generation of sufficient income to be able to offset losses within a reasonable timeframe, therefore, no deferred tax asset is recognized in relation to these losses.
 
The Group did not recognize deferred income tax liabilities of Ps. 97 and Ps. 93 as of June 30, 2020 and 2019, respectively, related to their investments in foreign subsidiaries, associates and joint ventures. In addition, the withholdings and/or similar taxes paid at source may be creditable against the Group’s potential final tax liability.
 
On June 30, 2020 and 2019, the Group recognized a deferred liability in the amount of Ps. 975 and Ps. 1,010, respectively, related to the potential future sale of one of its subsidiaries shares.
 
IDBD and DIC assess whether it is necessary to recognize deferred tax liabilities for the temporary differences arising in relation to its investments in subsidiaries; in this respect, IDBD, DIC and PBC estimate that if each of them is required to dispose of its respective holdings in subsidiaries, they would not be liable to income tax on the sale and, for such reason, they did not recognize the deferred tax liabilities related to this difference in these Consolidated Financial Statements.
 
22. Leases
 
The Group as lessee
 
Operating leases:
 
In the ordinary course of business, the Group leases property or spaces for administrative or commercial use both in Argentina and Israel under operating lease arrangements. The agreements entered into include several clauses, including but not limited, to fixed, variable or adjustable payments. Some leases were agreed upon with related parties (Note 29).
 
The future minimum payments that the Group must pay under operating leases are as follows:


June 30, 2020
 
 
June 30, 2019
 
 
June 30, 2018
 
No later than one year
  2,485 
  9,326 
  5,202 
Later than one year and not later than five years
  5,669 
  14,545 
  10,717 
Later than five years
  2,582 
  971 
  1,567 
 
  10,736 
  24,842 
  17,486 
 
The Group as lessor
 
Leases:
 
In the Shopping Malls segment and Offices segment of the Operations Center in Argentina and in the Real Estate segment of the Operations Center in Israel, the Group enters into operating lease agreements typical in the business. Given the diversity of properties and lessees, and the various economic and regulatory jurisdictions where the Group operates, the agreements may adopt different forms, such as fixed, variable, adjustable leases, etc. For example, in the Operations Center in Argentina, operating lease agreements with lessees of Shopping Malls generally include escalation clauses and contingent payments. In Israel, agreements tend to be agreed upon for fixed amounts, although in some cases they may include adjustment clauses. Income from leases are recorded in the Statement of Income under rental and service income in all of the filed fiscal years.
 
Rental properties are considered to be investment property. Book value is included in Note 9. The future minimum proceeds under non-cancellable operating leases from Group’s shopping malls, offices and other buildings are as follows:


June 30, 2020
 
 
June 30, 2019
 
 
June 30, 2018
 
No later than one year
  785 
  14,228 
  11,521 
Later than one year and not later than five years
  22,264 
  32,007 
  53,549 
Later than five years
  10,446 
  22,995 
  19,844 
 
  33,495 
  69,230 
  84,914 
 
 
F-79
 
 
23. Revenues


June 30, 2020
 
 
June 30, 2019
 
 
June 30, 2018
 
Income from communication services
  - 
  - 
  - 
Rental and services income
  12,279 
  15,723 
  16,594 
Sales of communication equipment
  - 
  - 
  - 
Sales of trading properties and developments
  785 
  1,169 
  305 
Revenue from hotels operation and tourism services
  2,175 
  3,179 
  2,618 
Income from agricultural products
  - 
  - 
  - 
Other revenues
  1 
  - 
  5 
Total Group’s revenues
  15,240 
  20,071 
  19,522 
 
24. Expenses by nature
 
The Group disclosed expenses in the statements of income by function as part of the line items “Costs”, “General and administrative expenses” and “Selling expenses”. The following tables provide additional disclosure regarding expenses by nature and their relationship to the function within the Group as of June 30, 2020, 2019 and 2018:


Costs
 
 
General and administrative expenses
 
 
Selling expenses
 
 
Total as of June 30, 2020
 
Cost of sale of goods and services
  672 
  - 
  - 
  672 
Salaries, social security costs and other personnel expenses
  2,050 
  860 
  143 
  3,053 
Depreciation and amortization
  350 
  162 
  7 
  519 
Fees and payments for services
  1,186 
  (722)
  355 
  819 
Maintenance, security, cleaning, repairs and others
  1,856 
  244 
  3 
  2,103 
Advertising and other selling expenses
  554 
  - 
  73 
  627 
Taxes, rates and contributions
  487 
  97 
  669 
  1,253 
Interconnection and roaming expenses
  - 
  - 
  - 
  - 
Fees to other operators
  - 
  - 
  - 
  - 
Director´s fees
  - 
  439 
  - 
  439 
Leases and service charges
  143 
  25 
  20 
  188 
Allowance for doubtful accounts, net
  - 
  - 
  333 
  333 
Other expenses
  (939)
  1,260 
  (297)
  24 
Total as of June 30, 2020
  6,359 
  2,365 
  1,306 
  10,030 


Costs
 
 
General and administrative expenses
 
 
Selling expenses
 
 
Total as of June 30, 2019
 
Cost of sale of goods and services
  620 
  - 
  - 
  620 
Salaries, social security costs and other personnel expenses
  2,663 
  1,066 
  162 
  3,891 
Depreciation and amortization
  274 
  123 
  5 
  402 
Fees and payments for services
  160 
  448 
  63 
  671 
Maintenance, security, cleaning, repairs and others
  2,239 
  240 
  5 
  2,484 
Advertising and other selling expenses
  597 
  26 
  95 
  718 
Taxes, rates and contributions
  649 
  98 
  662 
  1,409 
Interconnection and roaming expenses
  - 
  - 
  - 
  - 
Fees to other operators
  - 
  - 
  - 
  - 
Director´s fees
  - 
  715 
  - 
  715 
Leases and service charges
  143 
  35 
  22 
  200 
Allowance for doubtful accounts, net
  - 
  - 
  137 
  137 
Other expenses
  153 
  177 
  9 
  339 
Total as of June 30, 2019
  7,498 
  2,928 
  1,160 
  11,586 


Costs
 
 
General and administrative expenses
 
 
Selling expenses
 
 
Total as of June 30, 2018
 
Cost of sale of goods and services
  234 
  - 
  - 
  234 
Salaries, social security costs and other personnel expenses
  3,110 
  871 
  165 
  4,146 
Depreciation and amortization
  206 
  116 
  2 
  324 
Fees and payments for services
  103 
  452 
  84 
  639 
Maintenance, security, cleaning, repairs and others
  2,456 
  275 
  14 
  2,745 
Advertising and other selling expenses
  746 
  14 
  129 
  889 
Taxes, rates and contributions
  666 
  120 
  572 
  1,358 
Interconnection and roaming expenses
  - 
  - 
  - 
  - 
Fees to other operators
  (1)
  - 
  - 
  (1)
Director´s fees
  - 
  552 
  - 
  552 
Leases and service charges
  112 
  17 
  12 
  141 
Allowance for doubtful accounts, net
  - 
  - 
  210 
  210 
Other expenses
  95 
  101 
  7 
  203 
Total as of June 30, 2018
  7,727 
  2,518 
  1,195 
  11,440 


F-80


25. Cost of goods sold and services provided


Total as of June 30, 2020
 
 
Total as of June 30, 2019
 
 
Total as of June 30, 2018
 
Inventories at the beginning of the period (*)
  10,764 
  25,266 
  32,164 
Adjustments previous periods
  - 
  (8,962)
  - 
Purchases and expenses (**)
  62,015 
  60,423 
  169,167 
Capitalized finance costs
  13 
  18 
  26 
Currency translation adjustment
  8,894 
  (1,519)
  12,072 
Transfers
  216 
  160 
  (754)
Deconsolidation
  (167)
  - 
  (15,023)
Incorporated by business combination
  284 
  - 
  920 
Inventories at the end of the period (*)
  (12,762)
  (10,764)
  (25,266)
Total costs
  69,257 
  64,622 
  173,306 
 
(*) Includes Ps. 2,291 as cost of goods sold from Gav-Yam which was reclassified as discontinued operations in this fiscal year.
 
The following table presents the composition of the Group’s inventories for the years ended June 30, 2020 and 2019:


Total as of June 30, 2020
 
 
Total as of June 30, 2019
 
Real estate
  7,721 
  8,999 
Telecommunications
  1,817 
  1,765 
Fruits
  2,912 
  - 
Others
  312 
  - 
Total inventories at the end of the period (*)
  12,762 
  10,764 
 
(*) Inventories includes trading properties and inventories.
 
26. Other operating results, net


June 30, 2020
 
 
June 30, 2019
 
 
June 30, 2018
 
Gain from disposal of subsidiary and associates (1)
  7 
  (162)
  - 
Donations
  (107)
  (220)
  (167)
Lawsuits and other contingencies
  (117)
  (103)
  (82)
Operating interest expense
  73 
  95 
  24 
Others (2)
  120 
  (116)
  198 
Total other operating results, net
  (24)
  (506)
  (27)
 
(1)
As of June 30, 2018, it includes a favorable ruling entered in a lawsuit in the Operations Center in Israel for an amount of approximately Ps. 1,254. Includes legal costs and expenses.
 
27. Financial results, net


June 30, 2020
 
 
June 30, 2019
 
 
June 30, 2018
 
Finance income:


 - Interest income
  216 
  187 
  703 
 - Dividend income
  15 
  15 
  105 
 - Other finance income
  (2)
  - 
  - 
Total finance income
  229 
  202 
  808 
Finance costs:


 - Interest expenses
  (6,347)
  (5,034)
  (4,315)
 - Loss on debt swap
  - 
  - 
  (251)
 - Other finance costs
  (405)
  (372)
  (103)
Subtotal finance costs
  (6,752)
  (5,406)
  (4,669)
Capitalized finance costs
  123 
  255 
  38 
Total finance costs
  (6,629)
  (5,151)
  (4,631)
Other financial results:


 - Fair value gain of financial assets and liabilities at fair value through profit or loss, net
  362 
  735 
  1,970 
 - Exchange differences, net
  (6,722)
  1,080 
  (14,235)
 - Gain from repurchase of negotiable obligations
  96 
  - 
  - 
 - Gain from derivative financial instruments, net
  (393)
  600 
  433 
Total other financial results
  (6,657)
  2,415 
  (11,832)
 - Inflation adjustment
  97 
  (568)
  (949)
Total financial results, net
  (12,960)
  (3,102)
  (16,604)


F-81
 
 
28. Earnings per share
 
(a) Basic
 
Basic earnings per share amounts are calculated in accordance with IAS 33 "Earning per share" by dividing the profit attributable to equity holders of the Group by the weighted average number of ordinary shares outstanding during the year.


June 30, 2020
 
 
June 30, 2019
 
 
June 30, 2018
 
Profit for the year of continuing operations attributable to equity holders of the parent
  22,065 
  (34,991)
  16,208 
Profit for the year of discontinued operations attributable to equity holders of the parent
  (6,725)
  (4,421)
  6,452 
Profit for the year attributable to equity holders of the parent
  15,340 
  (39,412)
  22,660 
Weighted average number of ordinary shares outstanding
  575 
  575 
  575 
Basic earnings per share
  26.66 
  (68.55)
  39.39 
 
(b) Diluted
 
Diluted earnings per share amounts are calculated by adjusting the weighted average number of ordinary shares outstanding to assume conversion of all dilutive potential shares. The Group holds treasury shares associated with incentive plans with potentially dilutive effect.


June 30, 2020
 
 
June 30, 2019
 
 
June 30, 2018
 
Profit for the year of continuing operations attributable to equity holders of the parent
  22,065 
  (34,991)
  16,208 
Profit for the year of discontinued operations attributable to equity holders of the parent
  (6,725)
  (4,421)
  6,452 
Profit for the year per share attributable to equity holders of the parent
  15,340 
  (39,412)
  22,660 
Weighted average number of ordinary shares outstanding
  579 
  579 
  579 
Diluted earnings per share
  26.50 
  (68.55)
  39.16 
 
29. Employee benefits
 
Incentive Plan - Argentina
 
The Group has an equity incentives plan (“Incentive Plan”), created in September 30, 2011, which is aimed at certain employees, directors and top management of the Company, IRSA CP and Cresud (the “Participants”). Engagement was voluntary and by invitation of the Board of Directors.
 
Under the Incentive Plan, over the years 2011, 2012 and 2013, Participants will be entitled to receive shares ("Contributions") of the Company and Cresud based on a percentage of their annual bonus for the years 2011, 2012 and 2013, providing they remain as employees of the Company for at least five years, among other conditions required, to qualify for such Contributions. Contributions shall be held by the Company and Cresud, and as the conditions established by the Plan are verified, such contributions shall be transferred to the Participants. In spite of this, the economic rights of the shares in the portfolio assigned to said participants will be received by them.
 
Regarding the shares to be delivered by Cresud to the employees of the company and IRSA CP, and for the shares to be delivered by IRSA to Cresud employees, the Group accounts the active or passive position measured at the closing date of the financial statements.
 
As of June 30, 2018, a reserve has been set up under Shareholders’ equity as a result of this Incentive Plan for Ps. 6, based on the market value of the shares to be granted pertaining to the Group’s contributions, proportionately to the period already elapsed for the vesting of shares in the Incentive Plan and adjusted for the probability that any beneficiary should leave the Group before the term and/or the conditions required to qualify for the benefits of said plan are met at each fiscal year-end.
 
For the fiscal years ended June 30, 2019 and 2018, the Group has incurred a charge related to the Incentive Plan of Ps. 0.43 and Ps. 23,38, respectively. As of June 30, 2018, the total expense has been recognized for having completed the necessary period to grant the total stocks for this benefit. The unrecognized expense for the periods ended June 30, 2017 was Ps. 14.64, and no unrecognized expense is pending after that date.
 
Movements in the number of matching shares outstanding under the incentive plan corresponding to the Company´s contributions are as follows:
 
 
F-82


June 30, 2020
 
 
June 30, 2019
 
 
June 30, 2018
 
At the beginning
  3,044,987 
  3,603,427 
  3,776,478 
Additions
  - 
  - 
  - 
Disposals
  - 
  - 
  - 
Granted
  (470,779)
  (558,440)
  (173,051)
At the end
  2,574,208 
  3,044,987 
  3,603,427 
 
The fair value determined at the time of granting the plan after obtaining all the corresponding authorizations was Ps. 25.3 per share of IRSA. This fair value was estimated by taking into account the market price of the shares of the Company on said date.
 
Defined contribution plan - Argentina
 
The Group operates a defined contribution plan (the “Plan”) which covers certain selected managers from Argentina. The Plan was effective as from January 1, 2006. Participants can make pre-tax contributions to the Plan of up to 2.5% of their monthly salary (“Base Contributions”) and up to 15% of their annual bonus (“Extraordinary Contributions”). Under the Plan, the Group matches employee contributions to the plan at a rate of 200% for Base Contributions and 300% for Extraordinary Contributions.
 
All contributions are invested in funds administered outside of the Group. Participants or their assignees, as the case may be, will have access to the 100% of the Company contributions under the following circumstances:
 
(i)
ordinary retirement in accordance with applicable labor regulations;
(ii)
total or permanent incapacity or disability;
(iii)
death.
 
In case of resignation or termination without fair cause, the manager will receive the Group’s contribution only if he or she has participated in the Plan for at least 5 years.
 
Contributions made by the Group under the Plan amount to Ps. 25 and Ps. 54 for the fiscal years ended June 30, 2020 and 2019, respectively.
 
Share base plans associated with certain key members of the management - Israel
 
DIC and Cellcom have granted an options benefit plans to key management personnel. For the years ended June 30, 2020, 2019 and 2018, the Group has incurred an expense in relation to said benefit plans of Ps. 11, Ps. 68 and Ps. 71, respectively.
 
The following table shows the detail of the options pending at year end:


DIC
 
 
Cellcom
 
Exercise price range of outstanding options
 
NIS 6.90 – 12.5
 
 
NIS 15.05 – 27.7
 
Average price of outstanding options
 
NIS 6.72
 
 
NIS 17.8
 
Amount of outstanding options
  2,124,000 
  759,332 
Average remaining useful life
 
4.43 years
 
 
3.4 years
 
 
The fair value of the options was calculated according to the Black-Scholes method, which included assumptions such as the value of the share at the date of granting the plan, expected volatility, expected life of the option or the risk-free rate.
 
Employee benefits - Israel
 
Benefits to hired employees include post-employment benefits, retirement benefits, share-based plans and other short and long-term benefits. The Group’s liabilities in relation to severance pay and/or retirement benefits of Israeli employees are calculated in accordance with Israeli laws.
 
 
F-83


June 30, 2020
 
 
June 30, 2019
 
 
June 30, 2018
 
Present value of unfunded obligations
  - 
  - 
  - 
Present value of funded obligations
  1,467 
  882 
  888 
Total present value of defined benefits obligations (post-employment)
  1,467 
  882 
  888 
Fair value of plan assets
  (1,008)
  (1,340)
  (1,417)
Recognized liability for defined benefits obligations
  459 
  -458 
  -529 
Liability for other long-term benefits
  854 
  734 
  36 
Total recognized liabilities
  1,313 
  276 
  -493 
Assets designed for payment of employee benefits
  (832)
  (735)
  - 
Net position from employee benefits
  481 
  -459 
  -493 
 
30. Related party transactions
 
In the normal course of business, the Group conducts transactions with different entities or parties related to it.
 
Remunerations of the Board of Directors
 
 
The Business Companies Act of Argentina (Law N° 19,550), provides that the remuneration to the Board of Directors, where it is not set forth in the Company’s by-laws, shall be fixed by the Shareholders' Meetings. The maximum amount of remuneration that the members of the Board are allowed to receive, including salary and other performance-based remuneration of permanent technical-administrative functions, may not exceed 25% of the profits.
 
Such maximum amount is limited to 5% where no dividends are distributed to the Shareholders, and will be increased proportionately to the distribution, until reaching such cap where total profits are distributed.
 
Some of the Group's Directors are hired under the Employment Contract Law N° 20,744. This Act rules on certain conditions of the work relationship, including remuneration, salary protection, working hours, vacations, paid leaves, minimum age requirements, workmen protection and forms of suspension and contract termination. The remuneration of directors for each fiscal year is based on the provisions established by the Business Companies Act, taking into consideration whether such directors perform technical-administrative functions and depending upon the results recorded during the fiscal year. Once such amounts are determined, they should be approved by the Shareholders’ Meeting.
 
Senior Management remuneration
 
The members of the Group’s senior management are appointed and removed by the Board of Directors, and perform functions in accordance with the instructions delivered by the Board itself.
 
The Company’s Senior Management in the Operation Center in Argentina is composed of as follows:
 
Name
Date of Birth
Position
Current position since
Eduardo S. Elsztain
01/26/1960
General Manager
1991
Daniel R. Elsztain
12/22/1972
Operating Manager
2012
Jorge Cruces
11/07/1966
Investment Manager
2020
Matías I. Gaivironsky
02/23/1976
Administrative and Financial Manager
2011
 
 
The Company’s Senior Management in the Operation Center in Israel is composed of as follows:
 
Name
Date of Birth
Position
 
Current position since / until
 
Doron Cohen
09/27/1960
General Manager
 
2020
 
Sholem Lapidot (*)
10/22/1979
General Manager
  2016 / 01-2020 
Gil Kotler (*)
10/04/1966
Financial Manager
  2016/ 04-2020 
Aaron Kaufman
03/03/1970
Vice president and General Assessor
  2016 
 
(*) Left their positions this year.
 
The total remuneration paid to members of senior management for their functions consists of a fix salary that takes account of the manager's backgrounds capacity and experience, plus an annual bonus based on their individual performance and the Group's results. Members of senior management participate in defined contributions and share-based incentive plans that are described in Note 28.
 
The aggregate compensation to the Senior Management of the Operations Center in Argentina for the year ended June 30, 2020 amounts to Ps. 13.
 
The aggregate compensation to the Senior Management of the Operations Center in Israel for the year ended June 30, 2020 amounts to Ps. 161.
 
 
F-84
 
 
Corporate Service Agreement with Cresud and IRSA CP
 
Considering that IRSA, Cresud and IRSA CP have operating overlapping areas, the Board of Directors considered it convenient to implement alternatives that allow reducing certain fixed costs of its activity, in order to reduce its impact on operating results, taking advantage of and optimizing the individual efficiencies of each of the companies in the different areas that make up the operational administration.
 
For this purpose, on June 30, 2004, a Framework Agreement for the Exchange of Corporate Services (“Framework Agreement”) was signed, between IRSA, Cresud and IRSA CP, which was periodically modified, the last update being on June 28, 2019.
 
Under this Framework Agreement, corporate services are currently provided in the following areas: Corporate Human Resources, Administration and Finance, Planning, Institutional Relations, Compliance, Shared Services Center, Real Estate Business Administration, Directory to distribute Real Estate, HR Real Estate Business, Security, Corporate Legal Management, Corporate Environment, Technical Management Infrastructure and Services, Purchasing and Contracting, Management and Enabling, Investments, Government Affairs, Hotels, Fraud Prevention, Bolivar, Proxy, General Management to distribute, Directory Security.
 
Under this agreement, the companies entrusted to an external consultant the semi-annual review and evaluation of the criteria used in the process of liquidating corporate services, as well as the distribution bases and supporting documentation used in the aforementioned process, through the preparation of a semi-annual report.
 
It should be noted that the operation under comment allows Cresud, IRSA and IRSA CP to maintain absolute independence and confidentiality in their strategic and commercial decisions, being the allocation of costs and benefits made on the basis of operational efficiency and equity, without pursuing individual economic benefits for each of the companies.
 
Offices and Shopping Malls spaces leases
 
The offices of our President are located at 108 Bolivar, in the Autonomous City of Buenos Aires. The property has been rented to Isaac Elsztain e Hajes S.A., a company controlled by some family members of Eduardo Sergio Elsztain, our president, and to Hamonet S.A., a company controlled by Fernando A. Elsztain, one of our directors, and some of his family members.
 
In addition, BACS, BHN Sociedad de Inversión S.A., BHN Seguros Generales S.A. and BHN Vida S.A. rent offices owned by IRSA CP in different buildings.
 
Furthermore, we also let various spaces in our shopping malls (stores, stands, storage space or advertising space) to third parties and related parties such as Tarshop S.A. and BHSA.
 
Donations granted to Fundación IRSA and Fundación Museo de los Niños
 
Fundación IRSA is a non-profit charity institution that seeks to support and generate initiatives concerning education, the promotion of corporate social responsibility and the entrepreneurial spirit of the youth. It carries out corporate volunteering programs and fosters donations by the employees. The main members of Fundación IRSA's Board of Directors are: Eduardo S. Elsztain (President); Saul Zang (Vice President I), Alejandro Elsztain (Vice President II) and Mariana C. de Elsztain (secretary). It funds its activities with the donations made by us, Cresud and IRSA CP.
 
Fundación Museo de los Niños is a non-profit association, created by the same founders of Fundación IRSA and its Management Board is formed by the same members as Fundación IRSA. Fundación Museo de los Niños acts as special vehicle for the development of "Museo de los Niños, Abasto" and "Museo de los Niños, Rosario". On October 29, 1999, our shareholders approved the award of the agreement “Museo de los Niños, Abasto” to Fundación Museo de los Niños. On October 31, 1997, IRSA CP entered into an agreement with Fundación IRSA whereby it loaned 3,800 square meters of the area built in the Abasto Shopping mall for a total term of 30 years, and on November 29, 2005, shareholders of IRSA CP approved another agreement entered into with Fundación Museo de los Niños whereby 2,670.11 square meters built in the Alto Rosario shopping mall were loaned for a term of 30 years. Fundación IRSA has used the available area to house the museum called “Museo de los Niños, Abasto” an interactive learning center for kids and adults, which was opened to the public in April 1999.
 
 
F-85
 
 
Legal Services
 
The Group hires legal services from Estudio Zang, Bergel & Viñes, at which Saúl Zang was a founding partner and sits at the Board of Directors of the Group companies.
 
Purchase and sale of goods and/or service hiring
 
In the normal course of its business and with the aim of making resources more efficient, in certain occasions purchases and/or hires services which later sells and/or recovers for companies or other related parties, based upon their actual utilization.
 
Sale of advertising space in media
 
Our company and our related parties frequently enter into agreements with third parties whereby we sell/acquire rights of use to advertise in media (TV, radio stations, newspapers, etc.) that will later be used in advertising campaigns. Normally, these spaces are sold and/or recovered to/from other companies or other related parties, based on their actual use.
 
Purchase and sale of financial assets
 
The Group usually invests excess cash in several instruments that may include those issued by related companies, acquired at issuance or from unrelated third parties through secondary market deals.
 
Investment in investment funds managed by BACS
 
The Group invests part of its liquid funds in mutual funds managed by BACS among other entities.
 
Borrowings
 
In the normal course of its activities, the Group enters into diverse loan agreements or credit facilities between the group’s companies and/or other related parties. These borrowings generally accrue interests at market rates.
 
Financial and service operations with BHSA
 
The Group works with several financial entities in the Argentine market for operations including, but not limited to, credit, investment, purchase and sale of securities and financial derivatives. Such entities include BHSA and its subsidiaries. BHSA and BACS usually act as underwriters in Capital Market transactions. In addition, we have entered into agreements with BHSA, who provides collection services for our shopping malls.
 
 
F-86
IRSA Inversiones y Representaciones Sociedad Anónima


The following is a summary presentation of the balances with related parties as of June 30, 2020 and 2019:
 
Related company
 
 June 30, 2020
 
 
 June 30, 2019
 
Description of transaction
 Item
Manibil S.A.
  - 
  - 
 Contributions in advance
 Trade and other receivables
New Lipstick LLC
  - 
  1,354 
 Loans granted
 Trade and other receivables
 
  (83)
  - 
 Loans obtained
 Borrowings
 
  17 
  15 
 Reimbursement of expenses receivables
 Trade and other receivables
Condor
  290 
  255 
 Public companies securities
Trade and other receivables
IRSA Real Estate Strategies LP
  125 
  - 
 Reimbursement of expenses receivables
Trade and other receivables
PBS Real Estate Holdings S.R.L.
  508 
  - 
 Reimbursement of expenses receivables
Trade and other receivables
Other associates and joint ventures
  131 
  2 
 Reimbursement of expenses receivables
 Trade and other receivables
 
  - 
  (18)
 Leases and/or rights of use not yet paid
 Trade and other payables
 
  (29)
  - 
 Loans obtained
 Borrowings
 
  9 
  - 
Management fees receivables
 Trade and other receivables
 
  90 
  18 
 Leases and/or rights of use receivables
 Trade and other receivables
 
  219 
  - 
 Dividends
 Trade and other receivables
 
  (1)
    
Reimbursement of expenses not yet paid
 Trade and other payables
 
  - 
  17 
 Reimbursement of expenses receivables
 Trade and other receivables
Total associates and joint ventures
  1,276 
  1,643 
 
 
Cresud
  (3)
  (57)
 Reimbursement of expenses not yet paid
 Trade and other payables
 
  (264)
  (175)
 Corporate services not yet paid
 Trade and other payables
 
  1,702 
  1,746 
 NCN
 Investments in financial assets
 
  4 
  8 
 Leases and/or rights of use receivables
 Trade and other receivables
 
  (1)
  (2)
 Management fee
 Trade and other payables
 
  (3)
  (5)
 Share-based payments
 Trade and other payables
Total parent company
  1,435 
  1,515 
 
 
Directors
  (137)
  (257)
 Fees for services received
 Trade and other payables
 
  4 
  - 
 Advances
 Trade and other receivables
Others (1)
  - 
  42 
 Leases and/or rights of use receivables
 Trade and other receivables
 
  (57)
  - 
Loans obtained
 Borrowings
 
  19 
  58 
 Reimbursement of expenses receivables
 Trade and other receivables
Total others
  (171)
  (157)
 
 
Total at the end of the year
  2,540 
  3,001 


(1)
 Includes CAMSA., Avenida compras and Avenida Inc., Estudio Zang, Bergel & Viñes, Austral Gold, Fundación IRSA, Hamonet S.A., Museo de los Niños and BHN Vida S.A.
 
Item
 
 June 30, 2020
 
 
 June 30, 2019
 
Trade and other receivables
  1,416 
  1,769 
Investments in financial assets
  1,702 
  1,746 
Borrowings
  (169)
  - 
Trade and other payables
  (409)
  (514)
Total
  2,540 
  3,001 


F-87
IRSA Inversiones y Representaciones Sociedad Anónima
 
 
The following is a summary of the results with related parties for the years ended June 30, 2020, 2019 and 2018: 
 
Related party
 
 June 30, 2020
 
 
 June 30, 2019
 
 
 June 30, 2018
 
Description of transaction
 BACS
  55 
  58 
  3 
 Leases and/or rights of use
 Manibil
  - 
  32 
  98 
 Corporate services
 Tarshop
  - 
  64 
  40 
 Leases and/or rights of use
 
  - 
  1 
  - 
 Commissions
 La Rural S.A.
  - 
  40 
  33 
 Leases and/or rights of use
 Condor
  - 
  - 
  297 
 Financial operations
 Other associates anf joint ventures
  40 
  (1)
  - 
 Financial operations
 Otras asociadas y negocios conjuntos
  10 
  37 
  80 
 Leases and/or rights of use

  (141)
  32 
  404 
 Honorarios y remuneraciones
Total associates and joint ventures
  (36)
  263 
  955 
 
Cresud
  20 
  40 
  14 
 Leases and/or rights of use
Cresud
  (505)
  (588)
  (620)
 Corporate services

  241 
  40 
  380 
 Financial operations
Total parent company
  (244)
  (508)
  (226)
 
 IFISA
  - 
  - 
  - 
 Financial operations
 Directors
  (437)
  (517)
  (569)
 Fees and remunerations
 Taaman
  - 
  - 
  - 
 Corporate services
 Willfood
  - 
  - 
  - 
 Corporate services
 Others (1)
  - 
  - 
  (42)
 Corporate services

  - 
  1 
  40 
 Leases and/or rights of use

  - 
  (1)
  362 
 Financial operations
 Otras (1)
  - 
  (1)
  (36)
 Donationd
 
  (25)
  - 
  - 
 Fees and remuneration
 Otras (1)
  (31)
  (1)
  (40)
 Legal services
Total others
  (493)
  (519)
  (285)
 
Total at the end of the period
  (773)
  (764)
  444 
 
 
(1) It includes Isaac Elsztain e Hijos, CAMSA., Hamonet S.A., Ramat Hanassi, Estudio Zang, Bergel & Viñes, and Fundación IRSA.
 
The following is a summary of the transactions with related parties for the years ended June 30, 2020 and 2019:
 
Related party
 
 
 June 30, 2020
 
 
 June 30, 2019
 
Description of the operation
La Rural S.A.
  - 
  466 
Dividends received
Condor
  34 
  123 
Dividends received
BHSA
  - 
  122 
Dividends received
Mehadrin
  - 
  152 
Dividends received
Manaman
  - 
  114 
Dividends received
Nuevo Puerto Santa Fe S.A.
  41 
  15 
Dividends received
Nave by the sea
  - 
  50 
Dividends received
Shufersal
  431 
  713 
Dividends received
Gav Yam
  1,436 
  - 
Dividends received
Emco
  17 
  94 
Dividends received
Total dividends received
  1,959 
  1,849 
 
Cresud
  (386)
  1,742 
Dividends granted
Helmir
  (24)
  11 
Dividends granted
Total dividends distribution
  (410)
  1,753 
 
Quality
  (51)
  (79)
Capital contributions
Manibil
  (94)
  (33)
Capital contributions
IBC
  (2,746)
  - 
Capitalized loan
Others
  (18)
  (30)
Capital contributions
Total capital contributions
  (2,909)
  (142)
 
TGLT S.A.
  1,501 
  - 
Purchase and exchange of shares
Total other transactions
  1,501 
  - 


F-88
 
 
31. Foreign currency assets and liabilities
 
Book amounts of foreign currency assets and liabilities are as follows:
 
Item / Currency (1)
 
Amount (2)
 
 
Peso exchange rate (3)
 
 
Total as of 06.30.20
 
 
Total as of 06.30.19
 
Assets


Trade and other receivables


US Dollar
  46 
  70.260 
  3,246 
  2,636 
Euros
  12 
  78.867 
  948 
  212 
Receivables with related parties:


US Dollar
  5 
  70.460 
  335 
  257 
Total trade and other receivables
    
    
  4,529 
  3,105 
Investments in financial assets


US Dollar
  55 
  70.260 
  3,879 
  5,179 
Pounds
  1 
  86.896 
  84 
  74 
Investments with related parties:


US Dollar
  19 
  70.460 
  1,305 
  1,746 
Total investments in financial assets
    
    
  5,268 
  6,999 
Derivative financial instruments


US Dollar
  - 
  70.260 
  - 
  18 
Total Derivative financial instruments
    
    
  - 
  18 
Cash and cash equivalents


US Dollar
  199 
  70.260 
  14,015 
  17,844 
Euros
  21 
  78.867 
  1,665 
  111 
Total cash and cash equivalents
    
    
  15,680 
  17,955 
Total Assets
    
    
  25,477 
  28,077 


Liabilities


Trade and other payables


US Dollar
  202 
  70.460 
  14,201 
  11,300 
Euros
  4 
  87.360 
  328 
  55 
Payables to related parties:


US Dollar
  - 
  70.460 
  - 
  22 
Total Trade and other payables
    
    
  14,529 
  11,377 
Borrowings


US Dollar
  931 
  70.460 
  65,590 
  55,636 
Euros
  - 
  - 
  - 
  - 
Borrowings with related parties


US Dollar
  1 
  70.460 
  379 
  931 
Total Borrowings
    
    
  65,969 
  56,567 
Derivative financial instruments


US Dollar
  1 
  70.460 
  102 
  42 
Total derivative financial instruments
    
    
  102 
  42 
Lease liabilities


US Dollar
  0 
  70.460 
  9 
  - 
Total lease liabilities
    
    
  9 
  - 
Total Liabilities
    
    
  80,609 
  67,986 
 
 
(1) Stated in millions of units in foreign currency. Considering foreign currencies those that differ from each Group’s functional currency at each year-end.
(2) Exchange rate as of June 30, of each year according to Banco Nación Argentina records.
(3) The Group uses derivative instruments as complement in order to reduce its exposure to exchange rate movements (see Note 14).
 
 
F-89
 
 
32. Groups of assets and liabilities held for sale
 
As mentioned in Note 4., the investments in Israir and Ispro have been reclassified to "Group of assets and liabilities held for sale".
 
The following table shows the main assets and liabilities classified as held for sale:


June 30, 2020
 
 
June 30, 2019
 
Property, plant and equipment
  38,453 
  6,942 
Intangible assets
  1,467 
  146 
Investments in associates
  241 
  643 
Deferred income tax assets
  876 
  312 
Income tax credits
  - 
  - 
Trade and other receivables
  1,991 
  3,233 
Cash and cash equivalents
  1,840 
  1,102 
Total assets held-for-sale
  44,868 
  12,378 
Trade and other payables
  10,686 
  5,216 
Salaries and social security liabilities
  417 
  - 
Employee benefits
  415 
  311 
Deferred income tax liabilities
  2,103 
  55 
Borrowings
  10,291 
  3,177 
Total liabilities held-for-sale
  23,912 
  8,759 
Total net assets held-for-sale
  20,956 
  3,619 
 
The company obtained a valuation of its investment in Israir for purposes of IRSA’s consolidated financial statements as of June 30, 2020 from an outside appraiser. As a result of the appraisal, the management accounted for an impairment of NIS 13 million (Ps. 284 million). This value represents the consideration that the company expects to receive for its stake in Israir as of June 30, 2020.
 
The management updated the valuation of investment properties of Ispro as a result of an appraisal prepared by an outside appraiser. As a result, the management of such company accounted for an impairment of NIS 33 million (Ps. 722 million) due to the outbreak of the Covid-19, a decrease in expected income from lessees, an expected increase in maintenance costs and a decreased in the CPI compared to the prior valuation.
 
33. Results from discontinued operations
 
The results of discontinued operations include the operations of IDBD / DIC for the years ended June 30, 2020, 2019 and 2018, as further explained in Note 1 A).


June 30, 2020
 
 
June 30, 2019
 
 
June 30, 2018
 
Revenues
  111,485 
  107,316 
  253,256 
Costs
  (79,931)
  (75,102)
  (182,473)
Gross profit
  31,554 
  32,214 
  70,783 
Net (loss) / gain from fair value adjustment of investment properties
  (3,218)
  5,256 
  5,952 
General and administrative expenses
  (10,626)
  (9,835)
  (11,257)
Selling expenses
  (14,556)
  (13,178)
  (46,969)
Impairment of associates
  (2,659)
  - 
  - 
Other operating results, net
  20,112 
  1,069 
  29,098 
Profit from operations
  20,607 
  15,526 
  47,607 
Share of profit / (loss) of associates and joint ventures
  1,559 
  149 
  (111)
Profit before financial results and income tax
  22,166 
  15,675 
  47,496 
Finance income
  1,449 
  2,172 
  1,102 
Finance cost
  (18,330)
  (19,501)
  (25,367)
Other financial results
  (8,650)
  2,075 
  (4,645)
Financial results, net
  (25,531)
  (15,254)
  (28,910)
(Loss) / profit before income tax
  (3,365)
  421 
  18,586 
Income tax
  (181)
  (2,125)
  (2,813)
Loss from discontinued operations
  (3,546)
  (1,704)
  15,773 


(Loss) / profit for the period from discontinued operations attributable to:


Equity holders of the parent
  (6,725)
  (4,421)
  6,452 
Non-controlling interest
  3,179 
  2,717 
  9,321 
Loss per share from discontinued operations attributable to equity holders of the parent:


Basic
  (11.70)
  (7.68)
  11.21 
Diluted
  (11.61)
  (7.64)
  11.15 
 
 
F-90
 
 
34. Economic framework of the Group’s business
 
The Company does business in a complex framework due to the macroeconomic conditions, whose main variables have recently shown high volatility, and also due to regulatory, social and political conditions, both at a national and international level.
 
Its operating income may be affected by the fluctuations in the inflation rate and in the exchange rate at which the peso is converted into other currencies, mainly the US dollar, the variations in interest rates, which have an impact on the cost of capital, the changes in governmental policies, capital controls and other local and international political or economic events.
 
In December 2019, a novel strain of coronavirus (SARS-COV-2) causing a severe acute respiratory syndrome (“COVID-19”) was reported to have surfaced in Wuhan, China. COVID-19 has since spread across the world, including Argentina, and on March 11, 2020, the World Health Organization declared COVID-19 a pandemic. By early November approximately 1,284,519 cases of infections had been confirmed in Argentina. In response, countries have adopted extraordinary measures to contain the spread of the virus, including imposing travel restrictions and closing borders, requiring closures of non-essential businesses, instructing residents to practice social distancing, issuing stay-at-home orders, implementing quarantines and similar actions. The ongoing pandemic and these extraordinary government measures are disrupting global economic activity and resulting in significant volatility in global financial markets. According to the International Monetary Fund (“IMF”), the global economy has recently entered into a recession.
 
The Argentine government has adopted multiple measures in response to the COVID-19 pandemic, including a nationwide mandatory lockdown that began on March 19, 2020 that has been extended several times, most recently through November 8, 2020. The government has also required during the last months the mandatory shutdown of businesses not considered essential. Finally, on November 6, 2020, the government announced the end of the mandatory lockdown for the AMBA (the “Área Metropolitana de Buenos Aires or “AMBA”) and the beginning of the new phase of social distancing. However, Coronavirus cases have risen over the last few months in several regions of the world and the rate of infections is still increasing. Lockdowns return to Europe as cases rise again. Spain, France and the UK have all recorded more than one million cases, and several others are seeing their highest number of new infections since the start of the pandemic.
 
These measures have significantly affected Argentine companies, which have faced drops in income and the deterioration of their flow of payments. In this context, the Argentine Government announced several actions intended to tackle the financial crisis of the companies adversely affected by the COVID-19 pandemic. In addition to the stagnation of the Argentine economy, there is an international crisis caused by the COVID-19 pandemic. In view of this scenario, a severe downturn in the Argentine economy is expected.
 
After several negotiations between the Argentine Government and the bondholders, the Argentine Government announced the execution of an agreement in principle with the main groups of bondholders in order to avoid the default. On August 28, 2020, the Government informed that the holders of 93.55% of the aggregate outstanding principal amount of all bonds have accepted a debt exchange and, on August 31, 2020, the Argentine Government obtained the consents required to exchange and/or amend 99.01% of the aggregate outstanding principal amount of all series of eligible bonds. As of the date of these financial statements, the new bonds are already being traded on the market.
 
However, the Government still faces the challenge of arriving at a successful renegotiation of the debt with the IMF. A favorable outcome for Argentina and the restructuring of its debt with the IMF would have a positive impact on the Argentine economy in the mid- and long-term. On the contrary, failure to reach an agreement with foreign private creditors might lead Argentina to default on its sovereign debt and, as a result, this situation may trigger restrictions on the companies’ ability to obtain new financing.
 
At a local level, the following circumstances may be noted:
 
In June 2020, the Estimador Mensual de Actividad Económica (“EMAE”) reported by the National Institute of Statistics and Census (Instituto Nacional de Estadísticas y Censos or INDEC) recorded a (12.3)% variation compared to the same month in 2019 and a (7.4)% variation compared to the previous month.
 
The market expectations survey prepared by the Central Bank in July 2020 called Relevamiento de Expectativas de Mercado (“REM”) forecasts that the retail inflation rate for 2020 will be 39.5%. The REM analysts foresee a (12.5)% decrease in the real GDP for 2020. In turn, they foresee a recovery in the economy for 2021 that will grow up to 5.6%. The economy is expected to grow during the third quarter of 2020 as the effects of the pandemic are perceived as transitory and economic recovery is expected to start soon.
 
 
F-91
 
 
The year-over-year inflation rate as of June 30, 2020 was 42.8%.
 
From July 2019 to June 2020, the peso depreciated 66% compared to the US dollar at the average wholesale exchange rate quoted by Banco de la Nación Argentina. In view of the foreign exchange restrictions in force since 2019, the gap between the official peso/US dollar exchange rate and the peso/US dollar exchange rate offered in the black market is almost 75%. This has an impact on the level of economic activity and detrimentally affects the reserves of the Argentine Central Bank. In addition, the current foreign exchange restrictions or those that may be imposed in the future may impair the Company’s ability to access the Sole Free FX Market (Mercado Único Libre de Cambio or MULC) to purchase the currency required to meet its financial obligations.
 
On September 15, 2020, the Argentine Central Bank issued Communication “A” 7106 which establishes, among other things, that entities with principal maturities falling due between October 15, 2020 and March 31, 2021 related to the issuance of foreign-currency denominated publicly-registered debt securities in Argentina by private sector clients or by the entities themselves, must submit to the Argentine Central Bank a refinancing plan based on the following criteria: (a) the net amount for which access to the foreign exchange is granted within the original terms must not exceed 40% of the principal amount due, and (b) the remaining principal amount must have been refinanced through new foreign debt with an average life of at least 2 years. Therefore, the Company is analyzing the impact of this provision in order to comply with the Central Bank’s requirements in due time and manner, if applicable.
 
Series I Non-convertible Notes having a par value of USD 181,518,707 and other bank debts shall become due on November 15, 2020.
 
COVID-19 Pandemic
 
As it arises from the ‘Economic framework of the Group’s business’ note, the COVID-19 pandemic is having an adverse impact on both the global and the Argentine economy and the Company’s business. Although the COVID-19 pandemic has had an impact nationwide on the business conducted by the Company, it is still too early to assess the total scope of its impact.
 
Below follows a description of the expected effects of the COVID-19 pandemic on the Company as of the date of these financial statements:
 
In the Operations Center in Argentina:
 
As a consequence of the preventive and mandatory social isolation, shopping malls across the country have been closed since March 20, 2020. Only those stores engaged in essential activities remain open such as pharmacies, supermarkets and banks whereas some food and clothing stores are offering delivery services and selling products on WhatsApp. In May and June, these measures were relaxed and certain activities were resumed in some marketplaces in the Argentine provinces such as Salta, Mendoza, Santa Fe and Córdoba. Actually, the shopping malls Alto Noa, Mendoza Plaza, Alto Rosario, La Ribera and Córdoba Shopping reopened under strict health and safety protocols providing for reduced shopping hours, social distancing and access controls. The shopping mall in Neuquén was reopened in July 2020 whereas the Distrito Arcos shopping mall, a premium open-air outlet in the City of Buenos Aires, was reopened early in August 2020. As of this date, 44% of the square meters of the Company’s Shopping Malls are open. Nevertheless, the uncertainty posed by this situation may cause the closing of stores that have already opened.
 
As a result of the shopping mall closings, the Company has decided to differ the invoicing and collection of the Monthly Guaranteed Amount (Valor Mensual Asegurado or V.M.A.) until September 30, 2020, with some exceptions, and not to collect the collective promotion fund during such period in an attempt to prioritize its long-term relationship with the lessees. Additionally, an increase in the delinquency rate of some lessees has been noticed. The ensuing impact on shopping malls has been a 30.5% decrease in income from rentals and services compared to the previous fiscal year and an 83% decrease compared to the last quarter of the previous fiscal year. Moreover, the allowance for bad debts is Ps. 328 million for the fiscal year ended June 30, 2020 and Ps. 201 million for the last quarter of the fiscal year.
 
As regards the rental of offices, although most of the lessees are working remotely, they are open under strict health and safety protocols. As of this date, the Company has not experienced any collection difficulties.
 
 
F-92


La Rural, the Buenos Aires and Punta del Este Convention Centers and the DIRECTV Arena stadium, which are owned directly or indirectly by the Company, are also closed since March 20. All scheduled conferences have been suspended, most of the fairs and conventions were postponed, and most of the scheduled shows in the DIRECTV Arena stadium have been cancelled. The reopening date of these premises is uncertain as well as the future calendar of fairs, conventions and shows.
 
In order to reduce the risk of the virus spreading and protect public health, the Libertador hotels in the City of Buenos Aires and the Llao Llao hotel in the province of Río Negro are temporarily closed and it is still uncertain when they will reopen and go back to normal operations. As regards Hotel Intercontinental in the city of Buenos Aires, it is operating only under a contingency and emergency plan. The impact of all the above on these financial statements has been a 32% decrease in income compared to the previous fiscal year and a 100% decrease compared to the same quarter of the previous year.
 
In the Operations Center in Israel
 
The COVID-19 pandemic has had a negative impact on the market valuation of IDBD, DIC and operating subsidiaries due to the sharp fall in prices. The mandatory shutdown lasted almost 10 days and was then relaxed under strict health and safety protocols. The effects on the operating businesses have been diverse:
 
o
as regards supermarkets (Shufersal) and agriculture (Mahadrin), the impact has been positive in the short-term as these are considered essential activities;
 
o
as concerns telecommunications (Cellcom), in particular the international roaming service, there has been a decrease in consumption keyed to a significant drop in international tourism. Cellcom has taken actions to reduce such negative effects by cutting back on expenses and investments during the coronavirus crisis period, including staff downsizing measures.
 
o
In PBC, the activities and income from real estate transactions have been adversely affected by the economic situation and the bans on circulation. Consequently, PBC’s cash flow is expected to be somehow vulnerable although it is not possible to estimate as of this date to which extent PBC has made an assessment of its investment properties showing signs of impairment and, as a consequence, a reduction in the value of its properties of Ps. 3,218 has been accounted for.
 
As regards the Group’s financial debt:
 
IRSA must honor the following maturities within the next 12 months: Series II Non-convertible Notes, having a par value of US$ 71.4, due on July 20, 2020; Series II Non-convertible Notes, having a par value of CLP 31,502.6 (equivalent to US$ 41 approximately), due on August 6, 2020; Series I Non-convertible Notes, having a par value of US$ 181.5, due on November 15, 2020, Series III Non-convertible Notes, having a par value of Ps. 381 (equivalent to US$5), due on February 21, 2021, Series IV Non-convertible Notes, having a par value of US$ 51.3, due on May 21, 2021 and a bank debt in an amount equivalent to US$14.3.
 
Our subsidiary, IRSA CP, must honor the maturity of its Series IV Non-convertible Notes, having a par value of US$ 140, which will become due in September 2020 and a bank debt of US$ 23.
 
The short-term financial debts of our subsidiaries, IDBD-DIC, have a nominal value of US$ 202 (including non-convertible notes and borrowing from banks and financial entities). It should be noted that such commitments have no effects on IRSA because such indebtedness is without recourse against IRSA and is not guaranteed by IRSA’s assets as described in Note 1 to these interim consolidated condensed financial statements.
 
In May and July 2020, IRSA issued US$ 105.4 non-convertible notes in the local market intended to refinance its short-term debt. The proceeds of such issuances were used by the Company to repay its Non-convertible Notes due on July and August 2020.
 
 
F-93
 
 
The alternatives that the Company is considering to refinance the repayment of its Non-convertible Notes due in November 2020, February 2021 and June 2021 are a capital increase in an approximate amount of US$ 70 / US$ 100 resolved at the annual shareholders’ meeting held in October 30, 2019 and obtaining financing in the domestic or international capital markets through new issues of debt securities or liability management transactions in the range of US$ 40 and US$ 100, in addition to the transactions already conducted in May and July. In addition, IRSA has a long-standing relationship with banks of the local financial system that may supplement and diversify the Company’s sources of financing in addition to capital market financing. Moreover, as part of our strategy, the Company may sell a portion of its portfolio of assets (hotels and/or land reserves and offices through its subsidiary, IRSA CP) to generate additional funds.
 
Lastly, IRSA CP has granted IRSA a three-year credit facility up to US$ 180, of which US$ 53.4 were used by IRSA on June 30, 2020. IRSA may still use the remaining balance of such facility and receive dividends from such company in its capacity as controlling shareholder of 80.65% of its capital stock. It should be noted that IRSA CP’s cash and cash equivalents (including current financial investments) as of June 30, 2020 amount to US$ 155 and, following the fiscal year-end, it sold office assets worth US$ 128.6. Moreover, it is working on different financing alternatives in pesos with local banks (syndicated loans and/or bilateral loans) in estimated amounts equivalent to USD 50 and USD 100 to discharge its short-term obligations and it may eventually resort to debt transactions in the local capital market.
 
The final effects of the coronavirus outbreak and its impact on the country’s economy is unknown and cannot be reasonably foreseen. Nevertheless, although it has had significant effects in the short-run, it is not expected that they will affect the continuation of business. Although there are short-term economic impacts, it is foreseen that the Company will be able to continue meeting its financial commitments in the following twelve months.
 
The Company is closely monitoring the situation and taking all necessary actions to preserve human life and the Company’s businesses.
 
35. Subsequent events
 
Sale of floors in the Boston Tower
 
On July 15, 2020, IRSA CP entered into a preliminary sales agreement (with delivery of possession) with respect to a medium-height floor in the Boston tower located at Della Paolera 265, Catalinas district, City of Buenos Aires, covering a total area of approximately 1,063 sq. meters and 5 parking lots located in the building. The price of the transaction was Ps. 514.3 (US$ 6.7), which has been paid in full.
 
On August 26, 2020, IRSA CP executed a preliminary sales agreement (with delivery of possession) with respect to 5 floors in the Boston tower located at Della Paolera 265, Catalinas district, City of Buenos Aires, covering a total area of approximately 6,235 sq. meters and 25 parking lots located in the building. The price of the transaction was Ps. 2,758 million (US$ 34.7 million), which has been paid in full.
 
Bouchard Sale
 
On July 30, 2020, IRSA CP sold the entire “Bouchard 710” building, located in the Plaza Roma district of the City of Buenos Aires. The tower has a gross leasable area of 15,014 sq. meters divided into 12 floors for office use and 116 parking lots. The price of the transaction was approximately Ps. 6,782 million (US$ 87 million), which has been paid in full.
 
Issuance of IRSA Non-convertible Notes
 
On July 21, 2020, subsequently to the closing of the fiscal year, the Company issued USD 38.4 Non-convertible Notes in the local market through the following instruments:
 
Ps. 360.9 million (equivalent to USD 4.7 million) Series VI NCNs denominated and payable in Argentine pesos at a variable rate (Private Badlar) + 4.0%, with interest accruing on a quarterly basis. The principal amount is repayable in two installments: the first one -equal to 30% of the par value of the notes- payable on the date that is 9 (nine) months after the Issue and Settlement Date and the second installment -equal to 70% of the par value of the notes- payable on the relevant due date, i.e. July 21, 2021. Notes were issued at 100% of their par value.
 
US$ 33.7 million Series VII NCNs denominated in US$ and payable in Argentine pesos at the applicable exchange rate, at a fixed 4.0% rate, with interest accruing on a quarterly basis. Repayment of capital is due on January 21, 2021. Notes were issued at 100% of their par value. The proceeds will be used to refinance short-term indebtedness.
 
 
F-94


Payment of non-convertible notes
 
On July 20, 2020, the Company paid the twentieth interest installment and the principal installment of the US$ 75 Series II Non-convertible Notes issued on July 20, 2010.
 
On August 6, 2020, the Company paid the second interest installment and the principal installment of the US$ 47 Series II Non-convertible Notes issued on August 6, 2019.
 
Payment of IRSA CP’s Series IV Non-convertible Notes
 
On September 14, 2020, the aggregate principal amount of the Series IV Non-convertible Notes in the amount of Ps. 11,176 (US$ 140) and interest accrued as of such date in the amount of Ps. 144 (US$ 1.8) were paid.
 
Sale of remaining shares in Shufersal
 
On July 22, 2020, DIC accepted a private investors’ offer to purchase its aggregate shares in Shufersal, representing 26% of the capital stock, in the amount of NIS 1,456 million (NIS 23.5 per share). After the sale, DIC does no longer have any equity interest in such company.

Cellcom
 
On August 13, 2020, the Israeli Ministry of Communications approved the acquisition of Golan by Cellcom subject to certain conditions. It is worth noting that by such date the Antitrust Commissioner had already granted clearance.
 
On August 26, 2020, Cellcom informed that it completed the acquisition of Golan in consideration for approximately NIS 545 million in the aggregate, plus the cash equivalents held by Golan as of the closing date less its financial debts, which were paid in full by Cellcom to the Golan shareholders in cash. See information on the agreement in note 4 to these financial statements.
 
Sale of a subsidiary owned by Elron
 
On July 16, 2020, Elron, through the investment held by it in CartiHeal (2009) Ltd. (a company in which Elron holds a 27% interest approx.) ("CartiHeal"), entered into an agreement with Bioventus LLC (an international company engaged in the manufacture of medical devices, "Bioventus"), which is a current shareholder of CartiHeal, providing as follows:
 
● Bioventus will make an additional US$ 15 – US$ 20 investment in CartiHeal, at a company value of USD 180.
 
● Bioventus will be granted a call option to buy 100% of the shares in CartiHeal.
 
● CartiHeal will have a put option to sell 100% of its capital stock to Bioventus.
 
The call option may be exercised at any time after the investment is made. The put option may be exercised subject to pivotal clinical trial success, which includes the successful attainment of certain goals of the secondary trial, subject to obtaining the FDA’s approval of the Agili-C device of CartiHeal, which fully coincides with the success of the trial.
 
Sale of Clal Shares
 
On June 28 and July 6, 2020, IDBD sold 4,791,618 shares in Clal held by it through swap transactions, at an average price of NIS 30/share, representing 7.1% of the capital stock.
 
In addition, on September 3, 2020, IDBD sold 2,376,527 shares in Clal, representing 3.5% of its capital stock, at an average price of NIS 32.475/share, amounting to NIS 77.2 in the aggregate.
 
As a consequence of such transactions, IDBD’s current stake in Clal represents 4.99% of its capital stock and, as a result, IDBD is no longer regarded as an interested party in Clal under the Israeli Securities Regulations.
 
 
F-95
 
 
Increase in the interest held in PBC
 
In July 2020, DIC acquired 1.4% of PBC capital stock in consideration for NIS 18.
 
DIC notes repurchase plan
 
On August 20, 2020, DIC’s Board of Directors approved the extension of its notes repurchase plan (Series F and J) until December 31, 2020 up to NIS 300. Repurchases shall be made on the basis of market opportunities and the scope thereof shall be determined by the management.
 
IDBD financing agreement
 
On August 30, 2019, the Company's Board of Directors approved the signing of a commitment with Dolphin, to make capital contributions for up to the amount of NIS 210, according to the schedule of commitments assumed by Dolphin between September 2019 and September 2021 with IDBD.
 
Dolphin undertook to make contributions to IDBD subject to the occurrence of certain events in accordance with the following scheme: (i) NIS 70 to be contributed immediately; (ii) NIS 70 to be contributed until September 2, 2020 and (iii) NIS 70 to be contributed until September 2, 2021. According to Dolphin's agreement with IDBD, said contributions will have the character of capital contributions resulting in the issuance of new IDBD shares in favor of the parent company or may be granted in the form of a subordinated loan.
 
On September 7, 2020, the Company communicated that, with respect to the capital contributions committed for September 2, 2020 and 2021, it considers that there are doubts regarding the fullfilment of the pre-conditions established for making such contributions. Accordingly, it has resolved not to make the contribution corresponding to 2020.
 
Shareholders’ Meeting
 
On October 26, 2020, the Shareholders’ Meeting has resolved to distribute the amount of ARS 484,000,000 (four hundred and eighty four million Argentine pesos), as dividends payable in shares of IRSA Propiedades Comerciales S.A., a Company’s subsidiary, to the shareholders ratably according to their shareholding interests.
 
Exchange Offer- Issuance of Series VIII and IX Notes
 
As a consequence of the new restrictions on access to the Foreign Exchange Market, IRSA launched an exchange offer on its Series I Notes due on November 15, 2020 (the “Existing Notes”). The abovementioned restrictions to obtain United States dollars established under Communication “A” 7,106 apply for the purchase of foreign currency intended for repayment of principal maturing between October 15, 2020 and March 31, 2021 in respect of the issuance of foreign currency-denominated debt securities registered with official registries in Argentina by private sector clients or the entities themselves. For such purposes, all Eligible Holders (the “Eligible Holders”) were invited by IRSA to Exchange the Existing Notes, Series I Notes.
On October 22, 2020, IRSA announced Notes to be issued in exchange for the Existing Notes, Series I Notes, or through the Cash Subscription (the “Cash Subscription”), as applicable, pursuant to the terms and methods for the exchange of the Existing Notes. The exchange offer consisted on the following two options for the bondholders terms:
 
(i)
A repayment of principal amount of Existing Notes tendered for Exchange, in cash in United States Dollars, in an amount resulting from dividing USD 72,607,482.80 by the total number of Existing Notes tendered in Exchange for the Series VIII, always provided such quotient is less than or equal to USD 1 whereas if such quotient is higher than USD 1 the consideration shall be equal to USD 1 (“Principal Repayment”); which would represent at least 40% of the amount of the Existing Notes tendered and the remaining amount until reaching USD 1 of each USD1 of the Existing Notes tendered for Exchange, in Series VIII Notes. Series VIII Notes to be issued at a fixed nominal interest rate of 10.00% per annum and maturing 3 (three) years after the Date of Issue and Settlement, with annual repayments, denominated and payable in United States Dollars, in a principal amount up to USD 108,911224 to be paid in kind by tendering for exchange of the Existing Notes . In all cases, the sum of (i) and (ii) shall be the equivalent to USD1 per each USD1 of Existing Notes tendered for Exchange.; and
 
(ii)
A par for par exchange of notes Series IX for each Existing Notes presented to the Exchange. Series IX Notes to be issued at a nominal fixed interest rate of 10% per annum, maturing on March 1, 2023, denominated and payable in a principal amount up to USD 108,911,224, that may be increased up to the Maximum Aggregate Principal Amount (the “Maximum Aggregate Principal Amount”), to be paid in kind by tendering for exchange the Existing Notes, or by Subscription in Cash.
 
 
F-96
 
 
For both options interest accrued on the Existing Notes until the Date of Settlement of the Exchange Offer will be paid in cash:
Moreover, the Company offers an early exchange consideration equivalent to USD 0.02 per each USD 1 of Existing Notes tendered and accepted in exchange for Series IX Notes prior to the deadline to receive the consideration for early acceptance (the “Early Exchange Consideration”). Such consideration shall be paid in Pesos on the Date of Issue and Settlement as per the exchange rate reported by Communication “A” 3500 of the Central Bank of Argentina on the business day next preceding the Exchange Expiration Date. For the purposes of receiving the Early Exchange Consideration, the Eligible Holders shall tender the Existing Notes in their possession on or before the Deadline to Receive the Early Exchange Consideration.
 
On November 2, 2020, the Company, announced the results of the Early Bird of Series IX Notes. As of October 30, 2020, deadline for accessing the Early Bird, exchange orders have been submitted for a total amount equivalent to USD 70,971,181 for Series IX Notes.
 
All existing notes presented on or before the above mentioned deadline have been accepted by the Company and will be eligible to receive the consideration on the Issue and Settlement Date.
 
As timely announced, the Exchange Offer would expire on November 5, 2020, unless it is extended by the Company. Finally, on November 6, 2020, the Company decided to extend the Exchange Offer, to November 10, 2020. This extension does not imply a modification to the economic terms of the Exchange Offer.
 
On November 11, 2020, IRSA reported the results of the Exchange Offer. Eligible holders have been presented for a total amount equivalent (for both Classes) to USD 178,458,188, representing 98.31% of the face value of the Existing Notes in Circulation, through the participation of 6,571 orders.
 
SERIES VIII Notes issuance:
 
The Face Value of Existing Notes presented and accepted for the Exchange totaled USD 104,287,243 and the Nominal Value of Series VIII Notes to be issued was USD 31,679,760. The maturity date will be November 12, 2023.
 
According to the terms and subject to the conditions established in the Prospectus Supplement, Eligible Holders whose existing notes have been accepted for the Exchange by the Company, will receive for every USD 1 of Existing Notes submitted to the Exchange, the accrued interest of the existing notes until the settlement and issue date and the following:
 
a. USD 0.69622593 in cash for each USD 1 of Existing Notes presented to the Exchange; and
 
b. The remaining amount until completing 1 USD for each 1 USD of Existing Notes presented to the Exchange, in Notes Series VIII.
 
SERIES IX Notes Issuance:
 
Face Value of Existing Notes presented and accepted for the Exchange totaled USD 74,170,945 and the Nominal Value of Series IX Notes to be issued (together with the Face Value to be issued as a result of the cash subscription) is USD 80,676,505. The maturity date will be March 1, 2023.
 
Modifications to the Terms of the Existing Notes:
 
Pursuant to the terms and conditions specified on the pricing supplement of the Existing Notes, and considering that consent has been obtained for an amount greater than 90% of the principal of the Existing Notes, the Company made the Non-Essential Proposed Modifications and / or the Essential Proposed Modifications, by means of which the terms and conditions of the existing notes will be modified and replaced.
Consequently, by virtue of the implementation of the Proposed Non-Essential Modifications, the entire section of "Certain Commitments" and "Events of Default" was eliminated from the terms and conditions set forth in the prospectus supplements dated May 2, 2019 and dated July 25, 2019 corresponding to the Existing Notes.
 
Additionally, pursuant to the implementation of the Proposed Essential Modifications, the following terms and conditions of the Existing Notes were modified and replaced:
 
- Expiration Date: It will be March 1, 2023.
 
- Interest Payment Dates: will be the same dates reported for Class IX in the Notice of Results.
 
 
F-97
 
 
The terms and conditions of the Series I Notes are not modified by the Proposed Essential Modifications and the Proposed Non-Essential Modifications will maintain their full validity.
 
The implementation of the Proposed Essential Modifications and the Proposed Non-Essential Modifications have been approved by the Company's Board of Directors, dated November 11, 2020.
 
For more information, see "Proposed Modifications to Existing Notes" of the Prospectus and Exchange Supplement.
 
Series I Cancellation:
 
In relation to the Exchange Offer ended on November 10, 2020, and as a result of the settlement of said Exchange, on November 12, 2020, the Company made a partial cancelation for a Nominal Value of USD 178,458,188 of Series I Notes, after the cancellation the Nominal Value under circulation will be USD 3,060,519.
 
Corporate Information: IDBD
 
IDBD has been maintaining negotiations with creditors in order to restructure its financial debt in favorable terms. As of June 30, 2020, the total balance of (i) IDBD's Series 9 Bonds was NIS 901 million (the “Series 9”), (ii) IDBD’s Series 14 Bonds were NIS 889 million guaranteed by IDBD’s 70% of DIC’s shares (the "Series 14"), (iii) IDBD's Series 15 Bonds were NIS 238 million guaranteed by 5% of Clal’s shares (the "Series 15"). Due to lack of agreement, on September 17, 2020, a petition was submitted in the District Court in Tel-Aviv-Jaffa (“The Court”) on the subject of granting of an order for the opening of proceedings by the Trustee for the holders of the Company’s Bonds (Series 9) (“The petition”). Within the framework of the petition, the Court was requested to grant an order for the opening of proceedings for the Company pursuant to Section 18 of the Insolvency and Economic Rehabilitation Law, 5778 – 2018 (“The Law”); to instruct the appointment of a trustee for the Company according to law. On September 21, 2020, the holders of the bonds (Series 14) of IDB Development approved making the entire uncleared balance of IDB Development's bonds (Series 14) repayable immediately. On September 22, 2020, the Company submitted its initial response to the Petition in the Court, in which it argues that it is in the best interest of the company and all its creditors to exhaust the negotiations with the controlling shareholder and its creditors during a short period in order to try and maximize the value of its assets, for the benefit of the creditors and the company, and avoid costs and additional harmful consequences. In addition, the response of Dolphin Netherlands B.V. (the controlling shareholder of the Company) was also submitted, as were responses by the Trustees for the bondholders (Series 15 and Series 14) of the Company to the Petition. It should be mentioned that in tandem to his response, the Trustee of bondholders (Series 14) of the company submitted petitions for the enforcement of a lien and for the appointment of a receiver as well as an urgent petition for the setting of a hearing on the said petitions for a receivership, together with the hearing on the petition, which was set for September 24, 2020. On September 25, 2020, the Court declared the insolvency and liquidation of IDBD and initiated liquidation proceedings. The Court appointed a trustee for the shares of IDBD and a custodian for the shares of DIC and Clal. We are analyzing together with our local and international advisors the decision, including alternatives and courses of action. See Note 1.
 
Boston Tower floor´s sale by IRSA CP
 
On November 5, 2020, IRSA CP has sold and transferred 4 floors of the Boston tower located at 265 Della Paolera Street, in the Catalinas district of the Autonomous City of Buenos Aires for a gross leasable area of approximately 3,892 sqm and 15 garage units located in the building. The transaction price was approximately USD 22.9 million (USD/sqm 5,570), which was paid in full. After this operation, IRSA CP owns 3 floors with an approximate location area of 3,266 m2 in addition to garage units and other complementary spaces.
 
On November 12, 2020, IRSA CP has sold and transferred three floors of the Boston tower located at 265 Della Paolera Street, in the Catalinas district of the Autonomous City of Buenos Aires for a gross leasable area of approximately 3,266 sqm, a retail store of approximately 225 sqm and 15 garage units located in the building. The transaction price was approximately USD 19.1 million (USD/sqm 5,490), which was paid in full. After this operation, IRSA CP has no remaining leasable area in the building, only keeping a space of the first basement.
 
Investors Assembly
 
At the General Ordinary and Extraordinary Shareholders’ Meeting held on October 26, 2020, a distribution of a dividend in kind for ARS 484 million in shares of IRSA Propiedades Comerciales, subsidiary of IRSA.
 
 
F-98
 
 
Exchange of debentures
 
On November 12, 2020, the company carried out an exchange operation of its Series I Notes, for a nominal value of USD 181.5 million
 
Nominal Value of Existing Notes presented and accepted for the Exchange (for both Series): approximately USD 178.5 which represents 98.31% acceptance, through the participation of 6,571 orders.
 
Series VIII: Face Value of Existing Notes presented and accepted for the Exchange: approximately USD 104.3 million.
 
Nominal Value to be Issued: approximately USD 31.7 million.
 
Issuance Price: 100% nominal value.
 
Maturity Date: It will be November 12, 2023.
 
Consideration of the Exchange Offer: eligible holders whose existing notes have been accepted for the Exchange by the Company, will receive for every USD 1 submitted to the Exchange, the accrued interest of the existing notes until the settlement and issue date and the following:
 
A sum of money of approximately USD 72,6 million for repayment of capital of such existing notes presented to the Exchange, in cash, in United States Dollars, which will be equivalent to USD 0.69622593 for each USD 1 of existing notes presented to the Exchange; and
 
The remaining amount until completing 1 USD for each 1 USD of existing notes presented to the Exchange, in notes Series VIII.
 
Annual Nominal Fixed Interest Rate: 10.00%.
 
Amortization: The capital of the Series VIII Notes will be amortized in 3 annual installments (33% of the capital on November 12, 2021, 33% of the capital on November 12, 2022, 34% of the capital on the maturity date of Series VIII).
 
Interest Payment Dates: Interest will be paid quarterly for the expired period as of the issue and settlement date.
 
Payment Address: Payment will be made to an account at Argentine Securities Commission in the Autonomous City of Buenos Aires
 
Series IX: Face Value of Existing Notes presented and accepted for the Exchange: approximately USD 74.2 million.
 
Nominal Value to be Issued (together with the Face Value to be issued as a result of the cash subscription): approximately USD 80.7 million.
 
Issuance Price: 100% nominal value.
 
Maturity Date: It will be March 1, 2023.
 
Consideration of the Exchange Offer: the eligible holders whose existing notes have been accepted for the Exchange by the Company, will receive Series IX Notes for 100% of the capital amount presented for exchange and accepted by the Company and the accrued interest of the existing notes until the settlement and issue date.
 
Early Bird: will consist of the payment of USD 0.02 for each USD 1 of existing notes delivered and accepted in the Exchange on or before the deadline date to Access the Early Bird. Said consideration will be paid in Pesos on the issue and settlement date according to the exchange rate published by Communication “A” 3500 of the Central Bank of Argentina on the business day prior to the expiration date of the Exchange, which is ARS 79.3433 for each USD 1 of Existing Notes delivered and accepted in the Exchange.
 
Annual Nominal Fixed Interest Rate: 10.00%.
 
Amortization: The capital of the Series IX Notes will be amortized in one installment on the maturity date.
 
Interest Payment Dates: Interest will be paid quarterly for the expired period from the issuance and settlement date.
 
Payment Address: Payment will be made to an account at Argentine Securities Commission in New York, United States, for which purpose the Company will make US dollars available to an account reported by the Argentine Securities Commission in said jurisdiction.
 
Modifications to the Terms of the Existing Notes: Considering that consent has been obtained for an amount greater than 90% of the existing notes capital, the Company has modified and replaced the following essential and non-essential terms and conditions of the existing notes.
 
By virtue of the implementation of the Proposed Non-Essential Modifications, the entire section of "Certain Commitments" and "Events of Default" is eliminated from the terms and conditions set forth in the prospectus supplements dated May 2, 2019 and dated July 25, 2019 corresponding to the existing notes.
 
 
F-99


Additionally, pursuant to the implementation of the Proposed Essential Modifications, the following terms and conditions of the Existing Notes are modified and replaced:
 
Expiration Date: It will be March 1, 2023.
 
Interest Payment Dates: will be the same dates reported for Class IX in the Notice of Results.
 
It is clarified that the terms and conditions of the Series I Notes not modified by the Proposed Essential Modifications and the Proposed Non-Essential Modifications will maintain their full validity.
 
Loan to related party
 
On October 23, 2020, Dolphin Netherlands has granted a loan to Yad Leviim Ltd. for a term of 60 days, in a principal amount of USD 16,250,000 at a rate interest of 5% per year. Yad Leviim Ltd. is a company controlling by Eduardo Elsztain.
 
Sale of Manibil S.A. Shares
              On December 22, 2020, the company sold and transferred 217,332,873 (two hundred and seventeen million three hundred thirty-two thousand eight hundred and seventy-three) ordinary Class B shares, nominative not endorsable, with a nominal value of ARS 1 and entitled to one vote per share owned by the Company, representing 49% of the stock capital of MANIBIL SA, a company dedicated to real estate developments. The price for the sale of the shares amounts to Ps. 576,974,387.50 (five hundred seventy-six million nine hundred seventy-four thousand three hundred eighty-seven and fifty cents argentine pesos). After this transaction, IRSA is no longer a shareholder of Manibil S.A. As a repayment of the sale price of the shares, the Company received rights to acquire future real estate assets from Manibil.
 
  
F-100


EX-99.2 3 irsaq1fy21.htm ADDITIONAL EXHIBITS irsaq1fy21


IRSA Inversiones y Representaciones Sociedad Anónima
 
 
Unaudited Condensed Interim Consolidated Financial Statements as of September 30, 2020 and for the three-month period ended as of that date, presented comparatively


 1


Legal information
 
Denomination: IRSA Inversiones y Representaciones Sociedad Anónima.
 
Fiscal year N°: 78, beginning on July 1st, 2019.
 
Legal address: 108 Bolívar St., 1st floor, Autonomous City of Buenos Aires, Argentina.
 
Company activity: Real estate investment and development.
 
Date of registration of the by-laws in the Public Registry of Commerce: June 23, 1943.
 
Date of registration of last amendment of the by-laws in the Public Registry of Commerce: October 29, 2018.
 
Expiration of the Company’s by-laws: April 5, 2043.
 
Registration number with the Superintendence: 213,036.
 
Capital: 578,676,460 shares.
 
Common Stock subscribed, issued and paid up nominal value (in millions of Ps.): 579.
 
Parent Company: Cresud Sociedad Anónima, Comercial, Inmobiliaria, Financiera y Agropecuaria
(Cresud S.A.C.I.F. y A.).
 
Legal Address: 877 Moreno St., 23rd. floor, Autonomous City of Buenos Aires, Argentina.
 
Main activity: Real estate, agricultural, commercial and financial activities.
 
Direct and indirect interest of the Parent Company on the capital stock: 359,102,219 common shares.
 
Percentage of votes of the Parent Company (direct and indirect interest) on the shareholders’ equity: 62.34% (1).


CAPITAL STATUS
 
Type of stock
 
Shares authorized for Public Offering (2)
 
 
Subscribed, issued and paid up nominal value
(in millions of Pesos)
 
Common stock with a face value of Ps. 1 per share and entitled to 1 vote each
  578,676,460 
  579 
 
(1) For computation purposes, treasury shares have been subtracted.
(2) Company not included in the Optional Statutory System of Public Offer of Compulsory Acquisition.
 
 
 2
 
 
Index
 
Glossary  ....
1
Unaudited Condensed Interim Consolidated Statements of Financial Position                                                                                                                              
2
Unaudited Condensed Interim Consolidated Statements of Income and Other Comprehensive Income
3
Unaudited Condensed Interim Consolidated Statements of Changes in Shareholders’ Equity
4
Unaudited Condensed Interim Consolidated Statements of Cash Flows                                                                                                                              
6
Notes to the Unaudited Condensed Interim Consolidated Financial Statements:
 
Note 1 – The Group’s business and general information 
7
Note 2 – Summary of significant accounting policies 
7
Note 3 – Seasonal effects on operations 
9
Note 4 – Acquisitions and disposals 
9
Note 5 – Financial risk management and fair value estimates 
10
Note 6 – Segment information 
10
Note 7 – Investments in associates and joint ventures 
13
Note 8 – Investment properties 
15
Note 9 – Property, plant and equipment 
16
Note 10 – Trading properties 
16
Note 11 – Intangible assets 
16
Note 12 – Right-of-use assets 
17
Note 13 – Financial instruments by category 
17
Note 14 – Trade and other receivables 
18
Note 15 – Cash flow information 
20
Note 16 – Trade and other payables 
21
Note 17 – Borrowings 
22
Note 18 – Provisions 
22
Note 19 – Taxes 
23
Note 20 – Revenues 
23
Note 21 – Expenses by nature 
25
Note 22 – Cost of goods sold and services provided 
25
Note 23 – Other operating results, net 
26
Note 24 – Financial results, net 
26
Note 25 – Related party transactions 
27
Note 26 – CNV General Resolution N° 622 
29
Note 27 – Foreign currency assets and liabilities 
29
Note 28 – Groups of assets and liabilities held for sale 
30
Note 29 – Results from discontinued operations 
30
Note 30 – Other significant events of the period 
31
Note 31 – Subsequent Events 
31
 

 3


Glossary
 
The following are not technical definitions, but help the reader to understand certain terms used in the wording of the notes to the Group´s Financial Statements.
 
Terms
 
Definitions
BACS
 
Banco de Crédito y Securitización S.A.
BCRA
 
Central Bank of the Argentine Republic
BHSA
 
Banco Hipotecario S.A.
Cellcom
 
Cellcom Israel Ltd.
Clal
 
Clal Holdings Insurance Enterprises Ltd.
CNV
 
Securities Exchange Commission
CODM
 
Chief operating decision maker
CPF
 
Collective Promotion Funds
Condor
 
Condor Hospitality Trust Inc.
Cresud
 
Cresud S.A.C.I.F. y A.
DIC
 
Discount Investment Corporation Ltd.
Eclsa
 
E-Comerce Latina S.A.
Efanur
 
Efanur S.A.
Financial Statements
 
Unaudited Condensed Interim Consolidated Financial Statements
Gav-Yam
 
Gav-Yam, Bayside Land Corporation Ltd
Annual Financial Statements
 
Consolidated Financial Statements as of June 30, 2019
HASAU
 
Hoteles Argentinos S.A.U.
IAS
 
International Accounting Standards
IASB
IBC
 
International Accounting Standards Board
Israel Broadband Company
IDBT
 
IDB Tourism (2009) Ltd
IDBD
 
IDB Development Corporation Ltd.
IFISA
 
Inversiones Financieras del Sur S.A.
ISPRO
 
Ispro the Israel Properties Rental Corp. Ltd.
IFRS
 
International Financial Reporting Standards
IRSA, The Company”, “Us”, “We”
 
IRSA Inversiones y Representaciones Sociedad Anónima
IRSA CP
 
IRSA Propiedades Comerciales S.A.
Israir
 
Israir Airlines & Tourism Ltd.
LRSA
Mehadrin
 
La Rural S.A.
Mehadrin Ltd.
Metropolitan
 
Metropolitan 885 Third Avenue Leasehold LLC
MPIT
 
Minimum presumed income tax
NCN
 
Non-convertible notes
New Lipstick
 
New Lipstick LLC
NFSA
 
Nuevas Fronteras S.A.
NIS
 
New Israeli Shekel
PBC
 
Property & Building Corporation Ltd.
PBEL
 
PBEL Real Estate LTD
Quality
 
Quality Invest S.A.
Shufersal
 
Shufersal Ltd.
Tarshop
 
Tarshop S.A.
TGLT
 
TGLT S.A
Tyrus
 
Tyrus S.A.


 4
 
 
IRSA Inversiones y Representaciones Sociedad Anónima 
Unaudited Condensed Interim Consolidated Statements of Financial Position
as of September 30, 2020 and June 30, 2020
(All amounts in millions, except otherwise indicated)
Free translation from the original prepared in Spanish for publication in Argentina


                              Note
 
  09.30.2020 
  06.30.2020 
ASSETS


Non-current assets


Investment properties
  8 
  166,478 
  244,966 
Property, plant and equipment
  9 
  2,338 
  40,618 
Trading properties
  10, 22 
  1,328 
  5,228 
Intangible assets
  11 
  1,186 
  29,911 
Right-of-use assets
  12 
  621 
  21,379 
Investments in associates and joint ventures
  7 
  12,718 
  80,089 
Deferred income tax assets
  19 
  148 
  681 
Income tax and MPIT credit
    
  26 
  27 
Restricted assets
  13 
  - 
  2,014 
Trade and other receivables
  14 
  1,881 
  24,898 
Investments in financial assets
  13 
  506 
  3,782 
Derivative financial instruments
  13 
  - 
  153 
Total non-current assets
    
  187,230 
  453,746 
Current assets


Trading properties
  10, 22 
  218 
  2,493 
Inventories
  22 
  65 
  5,041 
Restricted assets
  13 
  8 
  6,684 
Income tax and MPIT credit
    
  105 
  331 
Group of assets held for sale
  28 
  - 
  44,868 
Trade and other receivables
  14 
  4,998 
  39,986 
Investments in financial assets
  13 
  3,378 
  20,922 
Financial assets held for sale
  13 
  - 
  3,636 
Derivative financial instruments
  13 
  16 
  227 
Cash and cash equivalents
  13 
  4,397 
  97,276 
Total current assets
    
  13,185 
  221,464 
TOTAL ASSETS
    
  200,415 
  675,210 
SHAREHOLDERS’ EQUITY


Shareholders' equity attributable to equity holders of the parent (according to corresponding statement)
    
  70,375 
  61,500 
Non-controlling interest
    
  23,364 
  70,544 
TOTAL SHAREHOLDERS’ EQUITY
    
  93,739 
  132,044 
LIABILITIES


Non-current liabilities


Borrowings
  17 
  31,967 
  320,616 
Lease liabilities
    
  586 
  14,400 
Deferred income tax liabilities
  19 
  42,121 
  47,408 
Trade and other payables
  16 
  1,745 
  2,335 
Provisions
  18 
  145 
  3,297 
Employee benefits
    
  - 
  481 
Derivative financial instruments
  13 
  29 
  59 
Salaries and social security liabilities
    
  33 
  210 
Total non-current liabilities
    
  76,626 
  388,806 
Current liabilities


Trade and other payables
  16 
  5,007 
  31,943 
Borrowings
  17 
  24,471 
  84,338 
Lease liabilities
    
  139 
  5,242 
Provisions
  18 
  108 
  2,627 
Group of liabilities held for sale
  28 
  - 
  23,912 
Salaries and social security liabilities
    
  235 
  4,419 
Income tax and MPIT liabilities
    
  30 
  673 
Derivative financial instruments
  13 
  60 
  1,206 
Total current liabilities
    
  30,050 
  154,360 
TOTAL LIABILITIES
    
  106,676 
  543,166 
TOTAL SHAREHOLDERS’ EQUITY AND LIABILITIES
    
  200,415 
  675,210 
 
The accompanying notes are an integral part of these Unaudited Condensed Interim Consolidated Financial Statements.


By:  
/s/  Eduardo S. Elsztain


President


 5
 
 
IRSA Inversiones y Representaciones Sociedad Anónima 
Unaudited Condensed Interim Consolidated Statements of Income and Other Comprehensive Income
for the three-month periods ended September 30, 2020 and 2019
(All amounts in millions, except otherwise indicated)
Free translation from the original prepared in Spanish for publication in Argentina


 Note
 
  
Three month


  09.30.2020 
  09.30.2019 
Revenues
  20 
  1,609 
  4,487 
Costs
  21, 22 
  (1,097)
  (1,682)
Gross profit
    
  512 
  2,805 
Net gain from fair value adjustment of investment properties
  8 
  24,089 
  12,349 
General and administrative expenses
  21 
  (644)
  (661)
Selling expenses
  21 
  (450)
  (295)
Other operating results, net
  23 
  (18)
  (56)
Profit from operations
    
  23,489 
  14,142 
Share of profit of associates and joint ventures
  7 
  147 
  737 
Profit before financial results and income tax
    
  23,636 
  14,879 
Finance income
  24 
  56 
  83 
Finance costs
  24 
  (1,593)
  (1,782)
Other financial results
  24 
  624 
  (9,152)
Inflation adjustment
    
  (29)
  (393)
Financial results, net
    
  (942)
  (11,244)
Profit before income tax
    
  22,694 
  3,635 
Income tax expense
  19 
  (7,958)
  (2,505)
Profit for the period from continuing operations
    
  14,736 
  1,130 
(Loss) / profit for the period from discontinued operations
  29 
  (6,396)
  13,887 
Profit for the period
    
  8,340 
  15,017 
Other comprehensive income:


Items that may be reclassified subsequently to profit or loss:


Currency translation adjustment
    
  (5,833)
  71 
Other reserves
    
  1,954 
  1,730 
Items that may not be reclassified subsequently to profit or loss, net of income tax:
    
  - 
  - 
Actuarial profit from defined contribution plans
    
  - 
  (11)
Other comprehensive (loss) / income for the period from continuing operations
    
  (3,879)
  1,790 
Other comprehensive (loss) / income for the period from discontinued operations
    
  (4,794)
  14,057 
Total other comprehensive (loss) / income for the period
    
  (8,673)
  15,847 
Total comprehensive (loss) / income for the period
    
  (333)
  30,864 


Total comprehensive income from continuing operations
    
  10,857 
  2,920 
Total comprehensive (loss) / income from discontinued operations
    
  (11,190)
  27,944 
Total comprehensive (loss) / income for the period
    
  (333)
  30,864 


Profit for the period attributable to:


Equity holders of the parent
    
  6,615 
  4,509 
Non-controlling interest
    
  1,725 
  10,508 


Profit from continuing operations attributable to:


Equity holders of the parent
    
  11,679 
  247 
Non-controlling interest
    
  3,057 
  883 


Total comprehensive income / (loss) attributable to:


Equity holders of the parent
    
  2,914 
  3,568 
Non-controlling interest
    
  (3,247)
  27,296 


Total comprehensive income / (loss) from continuing operations attributable to:


Equity holders of the parent
    
  15,034 
  2,062 
Non-controlling interest
    
  (4,177)
  858 


Profit per share attributable to equity holders of the parent:


Basic
    
  11.50 
  7.84 
Diluted
    
  11.42 
  7.84 


Profit per share from continuing operations attributable to equity holders of the parent:


Basic
    
  20.31 
  0.43 
Diluted
    
  20.17 
  0.43 
 
The accompanying notes are an integral part of these Unaudited Condensed Interim Consolidated Financial Statements.


By:  
/s/  Eduardo S. Elsztain


President
 
 
 6
 
 
IRSA Inversiones y Representaciones Sociedad Anónima 
Unaudited Condensed Interim Consolidated Statements of Changes in Shareholders’ Equity
for the three-month period ended September 30, 2020
(All amounts in millions, except otherwise indicated)
Free translation from the original prepared in Spanish for publication in Argentina


Attributable to equity holders of the parent


Share capital
 
 
Treasury shares
 
 
Inflation adjustment of share capital and treasury shares (1)
 
 
Share premium
 
 
Additional paid-in capital from treasury shares
 
 
Legal reserve
 
 
Special reserve Resolution CNV 609/12 (2)
 
 
Other reserves (3)
 
 
Retained earnings
 
 
Subtotal
 
 
Non-controlling interest
 
 
Total Shareholders’ equity
 
Balance as of July 1, 2020
  575 
  4 
  14,613 
  15,653 
  102 
  522 
  10,124 
  6,345 
  13,562 
  61,500 
  70,544 
  132,044 
Profit for the period
  - 
  - 
  - 
  - 
  - 
  - 
  - 
  - 
  6,615 
  6,615 
  1,725 
  8,340 
Other comprehensive loss for the period
  - 
  - 
  - 
  - 
  - 
  - 
  - 
  (3,701)
  - 
  (3,701)
  (4,972)
  (8,673)
Total profit and other comprehensive (loss) / income for the period
  - 
  - 
  - 
  - 
  - 
  - 
  - 
  (3,701)
  6,615 
  2,914 
  (3,247)
  (333)
Capitalisation of irrevocable contributions
  - 
  - 
  - 
  - 
  - 
  - 
  - 
  - 
  - 
  - 
  4 
  4 
Dividend distribution
  - 
  - 
  - 
  - 
  - 
  - 
  - 
  - 
  - 
  - 
  (20)
  (20)
Other changes in equity
  - 
  - 
  - 
  - 
  - 
  - 
  - 
  5,926 
  - 
  5,926 
  (43,846)
  (37,920)
Reserve for share-based payments
  - 
  - 
  - 
  - 
  2 
  - 
  - 
  (2)
  - 
  - 
  - 
  - 
Changes in non-controlling interest
  - 
  - 
  - 
  - 
  - 
  - 
  - 
  35 
  - 
  35 
  (71)
  (36)
Balance as of September 30, 2020
  575 
  4 
  14,613 
  15,653 
  104 
  522 
  10,124 
  8,603 
  20,177 
  70,375 
  23,364 
  93,739 
 
(1) Includes Ps. 1 of Inflation adjustment of treasury shares. See Note 16 to the Annual Financial Statements.
(2) Related to CNV General Resolution N° 609/12.
(3) Group´s other reserves for the period ended September 30, 2020 are comprised as follows:


Cost of treasury stock
 
 
Changes in non-controlling interest
 
 
Reserve for share-based payments
 
 
Reserve for future dividends
 
 
Currency translation adjustment reserve
 
 
Hedging instruments
 
 
Special reserve
 
 
Reserve for defined contribution plans
 
 
Other reserves from subsidiaries
 
 
Revaluation surplus
 
 
Total Other reserves
 
Balance as of July 1, 2020
  (185)
  (5,673)
  212 
  1,822 
  (784)
  (394)
  11,190 
  (422)
  115 
  464 
  6,345 
Other comprehensive loss for the period
  - 
  - 
  - 
  - 
  (3,476)
  (78)
  - 
  (147)
  - 
  - 
  (3,701)
Total comprehensive loss for the period
  - 
  - 
  - 
  - 
  (3,476)
  (78)
  - 
  (147)
  - 
  - 
  (3,701)
Reserve for share-based payments
  1 
  - 
  (3)
  - 
  - 
  - 
  - 
  - 
  - 
  - 
  (2)
Changes in non-controlling interest
  - 
  35 
  - 
  - 
  - 
  - 
  - 
  - 
  - 
  - 
  35 
Other changes in equity
  - 
  (52)
  - 
  - 
  5,034 
  215 
  - 
  784 
  (115)
  60 
  5,926 
Balance as of September 30, 2020
  (184)
  (5,690)
  209 
  1,822 
  774 
  (257)
  11,190 
  215 
  - 
  524 
  8,603 
 
The accompanying notes are an integral part of these Unaudited Condensed Interim Consolidated Financial Statements.


By:  
/s/  Eduardo S. Elsztain


President
 
 
 7
 
 
IRSA Inversiones y Representaciones Sociedad Anónima 
Unaudited Condensed Interim Consolidated Statements of Changes in Shareholders’ Equity
for the three-month period ended September 30, 2019
(All amounts in millions, except otherwise indicated)
Free translation from the original prepared in Spanish for publication in Argentina


Attributable to equity holders of the parent


Share capital
 
 
Treasury shares
 
 
Inflation adjustment of share capital and treasury shares (1)
 
 
Share premium
 
 
Additional paid-in capital from treasury shares
 
 
Legal reserve
 
 
Special reserve Resolution CNV 609/12 (2)
 
 
Other reserves (3)
 
 
Retained earnings
 
 
Subtotal
 
 
Non-controlling interest
 
 
Total Shareholders’ equity
 
Balance as of July 1, 2019
  575 
  4 
  14,613 
  15,653 
  85 
  522 
  10,121 
  73,258 
  (65,479)
  49,352 
  82,692 
  132,044 
Adjustments previous periods (IFRS 9 and 15)
  - 
  - 
  - 
  - 
  - 
  - 
  - 
  - 
  (1,248)
  (1,248)
  (926)
  (2,174)
Balance as of July 1, 2018 (recast)
  575 
  4 
  14,613 
  15,653 
  85 
  522 
  10,121 
  73,258 
  (66,727)
  48,104 
  81,766 
  129,870 
Profit for the period
  - 
  - 
  - 
  - 
  - 
  - 
  - 
  - 
  4,509 
  4,509 
  10,508 
  15,017 
Other comprehensive (loss) / income for the period
  - 
  - 
  - 
  - 
  - 
  - 
  - 
  (941)
  - 
  (941)
  16,788 
  15,847 
Total profit / (loss) and other comprehensive income for the period
  - 
  - 
  - 
  - 
  - 
  - 
  - 
  (941)
  4,509 
  3,568 
  27,296 
  30,864 
Capitalisation of irrevocable contributions
  - 
  - 
  - 
  - 
  - 
  - 
  - 
  - 
  - 
  - 
  11 
  11 
Dividend distribution
  - 
  - 
  - 
  - 
  - 
  - 
  - 
  - 
  - 
  - 
  (18)
  (18)
Decrease due to loss of control
  - 
  - 
  - 
  - 
  - 
  - 
  - 
  - 
  25 
  25 
  (46,419)
  (46,394)
Changes in non-controlling interest
  - 
  - 
  - 
  - 
  - 
  - 
  - 
  (185)
  - 
  (185)
  (74)
  (259)
Balance as of September 30, 2019
  575 
  4 
  14,613 
  15,653 
  85 
  522 
  10,121 
  72,132 
  (62,193)
  51,512 
  62,562 
  114,074 
 
(1) Includes Ps. 1 of Inflation adjustment of treasury shares. See Note 16 to the Annual Financial Statements.
(2) Related to CNV General Resolution N° 609/12.
(3) Group’s other reserves for the period ended September 30, 2019 are comprised as follows:
 
The accompanying notes are an integral part of these Unaudited Condensed Interim Consolidated Financial Statements


Cost of treasury stock
 
 
Changes in non-controlling interest
 
 
Reserve for share-based payments
 
 
Reserve for future dividends
 
 
Currency translation adjustment reserve
 
 
Hedging instruments
 
 
Reserve for defined contribution plans
 
 
Special reserve
 
 
Other reserves from subsidiaries
 
 
Revaluation surplus
 
 
Total Other reserves
 
Balance as of July 1, 2019
  (176)
  (5,678)
  223 
  1,821 
  282 
  (10)
  76,906 
  (334)
  112 
  112 
  73,258 
Other comprehensive loss for the period
  - 
  - 
  - 
  - 
  (866)
  - 
  - 
  - 
  (75)
  - 
  (941)
Total comprehensive loss for the period
  - 
  - 
  - 
  - 
  (866)
  - 
  - 
  - 
  (75)
  - 
  (941)
Share-based compensation
  3 
  - 
  (3)
  - 
  - 
  - 
  - 
  - 
  - 
  - 
  - 
Changes in non-controlling interest
  - 
  (185)
  - 
  - 
  - 
  - 
  - 
  - 
  - 
  - 
  (185)
Balance as of September 30, 2019
  (173)
  (5,863)
  220 
  1,821 
  (584)
  (10)
  76,906 
  (334)
  37 
  112 
  72,132 
 
The accompanying notes are an integral part of these Unaudited Condensed Interim Consolidated Financial Statements.


By:  
/s/  Eduardo S. Elsztain


President


 8


IRSA Inversiones y Representaciones Sociedad Anónima 
Unaudited Condensed Interim Consolidated Statements of Cash Flows
for the three-month periods ended September 30, 2020 and 2019
(All amounts in millions, except otherwise indicated)
Free translation from the original prepared in Spanish for publication in Argentina
 
 
 NOTE
 
                        Note
 
  09.30.2020 
  09.30.2019 
Operating activities:


Net cash generated from continuing operating activities before income tax paid
  15 
  1,138 
  2,926 
Income tax and MPIT paid
    
  (3)
  (197)
Net cash generated from continuing operating activities
    
  1,135 
  2,729 
Net cash generated from discontinued operating activities
    
  2,227 
  7,738 
Net cash generated from operating activities
    
  3,362 
  10,467 
Investing activities:


Acquisition of interest in associates and joint ventures
    
  - 
  (5)
Contributions and issuance of capital in associates and joint ventures
    
  (8)
  (112)
Acquisition and improvements of investment properties
    
  (719)
  (824)
Proceeds from sales of investment properties
    
  9,604 
  - 
Acquisitions and improvements of property, plant and equipment
    
  (45)
  (40)
Acquisitions of intangible assets
    
  (6)
  (7)
Net increase of restricted deposits
    
  - 
  (226)
Dividends collected from associates and joint ventures
    
  - 
  26 
Proceeds from loans granted
    
  - 
  45 
Acquisitions of investments in financial assets
    
  (6,181)
  (11,245)
Proceeds from disposal of investments in financial assets
    
  6,809 
  14,811 
Interest received from financial assets
    
  157 
  202 
Dividends received from financial assets
    
  - 
  4 
Loans granted
    
  - 
  (639)
Net cash generated from continuing investing activities
    
  9,611 
  1,990 
Net cash generated from discontinued investing activities
    
  31,830 
  1,500 
Net cash generated from investing activities
    
  41,441 
  3,490 
Financing activities:


Borrowings and issuance of non-convertible notes
    
  3,466 
  16,293 
Payment of borrowings and non-convertible notes
    
  (20,009)
  (17,730)
Collections of short term loans, net
    
  4,861 
  1,686 
Interests paid
    
  (2,624)
  (2,203)
Repurchase of non-convertible notes
    
  (66)
  (1,972)
Acquisition of non-controlling interest in subsidiaries
    
  (53)
  (246)
Sale of own non-convertible notes
    
  525 
  - 
Net proceeds from derivate financial instrument
    
  (225)
  258 
Net cash (used in) / generated from continuing financing activities
    
  (14,125)
  (3,914)
Net cash generated from /(used in) discontinued financing activities
    
  (13,019)
  (31,325)
Net cash generated from financing activities
    
  (27,144)
  (35,239)
Net (decrease) / increase in cash and cash equivalents from continuing activities
    
  (3,379)
  805 
Net (decrease) / increase in cash and cash equivalents from discontinued activities
    
  21,038 
  (22,087)
Net (decrease) / increase in cash and cash equivalents
    
  17,659 
  (21,282)
Cash and cash equivalents at beginning of period
    
  97,276 
  93,059 
Cash and cash equivalents reclassified as held-for-sale
    
  - 
  36 
Deconsolidation of subsidiaries
    
  (104,164)
  - 


Foreign exchange gain and inflation adjustment on cash and changes in fair value of cash equivalents
    
  (6,374)
  13,875 
Cash and cash equivalents at end of period
  13 
  4,397 
  85,688 
 
The accompanying notes are an integral part of these Unaudited Condensed Interim Consolidated Financial Statements.


By:  
/s/  Eduardo S. Elsztain


 President  
 
 
 9
 
 
  IRSA Inversiones y Representaciones Sociedad Anónima
Notes to the Unaudited Condensed Interim Consolidated Financial Statements
(Amounts in millions, except otherwise indicated)
Free translation from the original prepared in Spanish for publication in Argentina
 
1.
The Group’s business and general information
 
These Financial Statements have been approved for issuance by the Board of Directors, on November 17, 2020.
 
IRSA was founded in 1943, and it is engaged in a diversified range of real estate activities in Argentina since 1991. IRSA and its subsidiaries are collectively referred to hereinafter as “the Group”. Cresud is our direct parent company and IFIS Limited is our ultimate parent company.
 
The Group has established two Operations Centers, Argentina and Israel, to manage its global business, mainly through the following companies, as explained below, the Group has lost control of the Israel Operations Center and it has been deconsolidated as of September 30, 2020:
 
 
  (*) See note 4. to the Annual Financial Statements for more information about the changes within the Operations Center in Israel.
 
Operations Center in Israel
 
 As stated in Note 1. to the consolidated financial statements as of June 30, 2020, on September 25, 2020 the Court decreed the insolvency and liquidation of IDBD and appointed a trustee for its shares along with a custodian over DIC and Clal shares. After this decision, the Board of Directors of IDBD was removed from its functions, therefore, the Group lost control as of that date. For comparability purposes, the results of the Israel Operations Center for the three-month periods ended September 30 have been reclassified to discontinued operations.

 
2.
Summary of significant accounting policies
 
2.1.
Basis of preparation
 
These financial statements have been prepared in accordance with IAS 34 “Interim financial reporting” and should therefore be read in conjunction with the Group's annual Consolidated Financial Statements as of June 30, 2020 prepared in accordance with IFRS. Also, these financial statements include additional information required by Law No. 19,550 and / or regulations of the CNV. Such information is included in the notes to these financial statements, as accepted by IFRS.
 
These financial statements for the interim periods of three month ended September 30, 2020 and 2019 have not been audited. Management considers that they include all the necessary adjustments to fairly present the results of each period. Intermediate period results do not necessarily reflect the proportion of the Group's results for the entire fiscal years.
 
 10


IAS 29 "Financial Reporting in Hyperinflationary Economies" requires that the financial statements of an entity whose functional currency is one of a hyperinflationary economy be expressed in terms of the current unit of measurement at the closing date of the reporting period, regardless of whether they are based on the historical cost method or the current cost method. To do so, in general terms, the inflation produced from the date of acquisition or from the revaluation date, as applicable, must be calculated by non-monetary items. This requirement also includes the comparative information of the financial statements.
 
In order to conclude on whether an economy is categorized as highly inflationary in the terms of IAS 29, the standard details a series of factors to be considered, including the existence of an accumulated inflation rate in three years that approximates or exceed 100%. Accumulated inflation in Argentina in three years is over 100%. For that reason, in accordance with IAS 29, Argentina must be considered a country with a highly inflationary economy starting July 1, 2018.
 
In relation to the inflation index to be used and in accordance with FACPCE Resolution No. 539/18, it is determined based on the Wholesale Price Index (IPIM) until 2016, considering the average variation of the Consumer Price Index (CPI) of the Autonomous City of Buenos Aires for the months of November and December 2015, because during those two months there were no national IPIM measurements. Then, from January 2017, the National Consumer Price Index (National CPI) is considered. The table below presents the index for the period ended September 30, 2020, according to official statistics (INDEC) and following the guidelines described in Resolution 539/18.


As of September 30, 2020 (accumulated three months)
 
Price variation
  8%
 
As a consequence of the aforementioned, these financial statements as of September 30, 2020 were restated in accordance with IAS 29.
 
2.2.
Significant accounting policies
 
The accounting policies applied in the presentation of these Financial Statements are consistent with those applied in the preparation of the Annual Financial Statements, as described in Note 2 to those Financial Statements.
 
2.3.
Comparability of information
 
Balance items as of June 30, 2020 and September 30, 2019 presented in these Unaudited Condensed Interim Consolidated Financial Statements for comparative purposes arise from the financial statements as of and for such periods restated according to IAS 29 (See note 2.1). Certain items from prior periods have been reclassified for consistency purposes regarding the loss of control in IDBD See note 1. to these Financial Statements.
 
2.4.
Use of estimates
 
The preparation of Financial Statements at a certain date requires Management to make estimations and evaluations affecting the amount of assets and liabilities recorded and contingent assets and liabilities disclosed at such date, as well as income and expenses recorded during the period. Actual results might differ from the estimates and evaluations made at the date of preparation of these financial statements. In the preparation of these financial statements, the significant judgments made by Management in applying the Group’s accounting policies and the main sources of uncertainty were the same as the ones applied by the Group in the preparation of the Annual Financial Statements described in Note 3 to those Financial Statements, except for those mentioned in Note 30.
 
 11


3.
Seasonal effects on operations
 
Operations Center in Argentina
 
The operations of the Group’s shopping malls are subject to seasonal effects, which affect the level of sales recorded by lessees. During summer time in Argentina (January and February), the lessees of shopping malls experience the lowest sales levels in comparison with the winter holidays (July) and Christmas and year-end holidays celebrated in December, when they tend to record peaks of sales. Apparel stores generally change their collections during the spring and the fall, which impacts positively on shopping malls sales. Sale discounts at the end of each season also affect the business. As a consequence, for shopping mall operations, a higher level of business activity is expected in the period ranging between July and December, compared to the period between January and June.
 
4.
Acquisitions and disposals
 
Significant acquisitions and disposals for the three-month period ended September 30, 2020 are detailed below. Significant acquisitions and disposals for the fiscal year ended June 30, 2020, are detailed in Note 4 to the Annual Financial Statements.
 
A.
Sale of floors from Boston Tower
 
On July 15, 2020, IRSA CP entered into a preliminary sale agreement (with delivery of possession) with respect to a medium-height floor from Boston tower located at Della Paolera 265, Catalinas district, City of Buenos Aires, covering a total area of approximately 1,063 sq. meters and 5 parking lots located in the building. The price of the transaction was Ps. 477.7 (US$ 6.7), which has been paid in full.
 
On August 26, 2020, IRSA CP executed a preliminary sale agreement (with delivery of possession) with respect to 5 floors from Boston tower located at Della Paolera 265, Catalinas district, City of Buenos Aires, covering a total area of approximately 6,235 sq. meters and 25 parking lots located in the building. The price of the transaction was Ps. 2,562 million (US$ 34.7 million), which has been paid in full.
 
B.
Bouchard sale
 
On July 30, 2020, IRSA CP sold the entire “Bouchard 710” building, located in the Plaza Roma district of the City of Buenos Aires. The tower has a gross leasable area of 15,014 sq. meters divided into 12 floors for office use and 116 parking lots. The price of the transaction was approximately Ps. 6,300 million (US$ 87 million), which has been paid in full.
 
C.
Lipstick Building, New York, United States
 
On August 7, 2020, Metropolitan signed an agreement with the owner of the Ground Lease in which it terminated the relationship, leaving the administration of the building. Accordingly, at June 30, 2020, the Group derecognized Metropolitan's liabilities associated with the ground lease, as well as all the assets and liabilities associated with the building and the administration of the building; and made an agreement with the owner of the Ground Lease that states that Metropolitan is completely released from responsibilities, except for (i) claims for liabilities prior to June 1, 2020 from people who have performed work or provided services in the Building or to Metropolitan and (ii) claims from people who have had an accident on the property dated after August 7, 2020.
 
D.
Condor Merger Agreement
 
On July 19, 2019, Condor entered into a merger agreement with Nextponint Hospitality Trust. In accordance with the contractual terms, each Condor common share, with a par value of USD 0.01 per share, was canceled prior to the merger and became the right to receive a cash amount equivalent to USD 11.10 per share. ordinary action. Additionally, in accordance with the terms and conditions of the merger agreement, each Class E convertible share was automatically canceled and became the right to receive a cash amount equivalent to USD 10.00 per share.
 
 12


The closing of the transaction, which had been scheduled for March 23, 2020, did not occur.
 
On October 14, 2020, Condor entered into an agreement with Nextponint Hospitality Trust and some of its affiliates ("NHT Parties") to resolve any and all claims between them related to the aforementioned merger agreement.
 
Under the agreement with NHT, the Parties will make three payments to Condor in three installments, with the last payment maturing on December 30, 2020 and for a total of USD 7.0 million.
 
As of the date of presentation of these financial statements, the Company has 2,245,100 ordinary shares and 325,752 Series E shares of Condor.
 
E.
Loss of control of IDBD
 
As described in Note 1. to these financial statements, at the end of September 2020, the Group has lost control of IDBD, deconsolidating the related assets and liabilities and reclassifying the operations from this operations center to discontinued operations.
 
The following table details the net assets disposed:
 
 
  09.30.2020 
ASSETS
    
Investment properties
  84,251 
Property, plant and equipment
  34,396 
Trading properties
  5,512 
Intangible assets
  26,194 
Right-of-use assets
  18,530 
Investments in associates and joint ventures
  34,721 
Deferred income tax assets
  407 
Income tax credit
  305 
Restricted assets
  6,021 
Trade and other receivables
  50,669 
Investments in financial assets
  22,680 
Derivative financial instruments
  264 
Inventories
  3,377 
Group of assets held for sale
  39,441 
Cash and cash equivalents
  104,164 
TOTAL ASSETS
  430,932 
Borrowings
  305,070 
Lease liabilities
  16,984 
Deferred income tax liabilities
  11,655 
Trade and other payables
  22,782 
Income tax liabilities
  427 
Provisions
  5,085 
Employee benefits
  447 
Derivative financial instruments
  447 
Salaries and social security liabilities
  3,173 
Group of liabilities held for sale
  20,646 
TOTAL LIABILITIES
  386,716 
TOTAL NET ASSETS
  44,216 
Non-controlling interest
  (43,846)
Result for loss of control
  370 
Recycling of currency translation adjustment and other reserves
  (3,252)
Total result for loss of control (*)
  (2,882)
 
(*) Included within discontinued operations
 
 
5.
Financial risk management and fair value estimates
 
These Financial Statements do not include all the information and disclosures on financial risk management; therefore, they should be read along with Note 5 to the Annual Financial Statements. There have been no changes in risk management or risk management policies applied by the Group since year-end.
 
 13


From June 30, 2020 and up to the date of issuance of these Financial Statements, there have been no significant changes in business or economic circumstances affecting the fair value of the Group's assets or liabilities (either measured at fair value or amortized cost) except for what is mentioned in Note 30 in relation to COVID-19. Furthermore, there have been no transfers between the different hierarchies used to assess the fair value of the Group’s financial instruments, except as mentioned in Note 30.
 
 
6.
Segment information
 
As explained in Note 6 to the Annual Financial Statements, the Group reports its financial performance separately in two Operations Centers. As described in Note 1, the Group lost control of IDBD and has reclassified its results to discontinued operations. Segment information for the period ended September 30, 2019 has been recast for the purposes of comparability with the present period.
 
Below is a summary of the Group’s operating segments and a reconciliation between the operating income according to segment information and the operating income of the Statements of Income and Other Comprehensive Income of the Group for the periods ended September 30, 2020 and 2019:


Three Month ended September 30, 2020


Operations Center in Argentina
 
 
Operations Center in Israel
 
 
Total
 
 
Joint ventures (1)
 
 
Expensesand collectivepromotion funds
 
 
Elimination of inter-segment transactions and non-reportable assets / liabilities (2)
 
 
Total as per statement of income / statement of financial position
 
Revenues
  1,218 
  - 
  1,218 
  (8)
  405 
  (6)
  1,609 
Costs
  (651)
  - 
  (651)
  14 
  (460)
  - 
  (1,097)
Gross profit / (loss)
  567 
  - 
  567 
  6 
  (55)
  (6)
  512 
Net gain from fair value adjustment of investment properties
  24,926 
  - 
  24,926 
  (837)
  - 
  - 
  24,089 
General and administrative expenses
  (649)
  (5)
  (654)
  1 
  - 
  9 
  (644)
Selling expenses
  (451)
  - 
  (451)
  1 
  - 
  - 
  (450)
Impairment of associates and joint ventures
  - 
  - 
  - 
  - 
  - 
  - 
  - 
Other operating results, net
  (25)
  - 
  (25)
  1 
  9 
  (3)
  (18)
Profit / (loss) from operations
  24,368 
  (5)
  24,363 
  (828)
  (46)
  - 
  23,489 
Share of (loss) / profit of associates and joint ventures
  (472)
  - 
  (472)
  619 
  - 
  - 
  147 
Segment profit / (loss)
  23,896 
  (5)
  23,891 
  (209)
  (46)
  - 
  23,636 
Reportable assets
  185,020 
  1,399 
  186,419 
  (954)
  - 
  14,950 
  200,415 
Reportable liabilities
  - 
  (2,355)
  (2,355)
  - 
  - 
  (104,321)
  (106,676)
Net reportable assets
  185,020 
  (956)
  184,064 
  (954)
  - 
  (89,371)
  93,739 


Three Month ended September 30, 2019


Operations Center in Argentina
 
 
Operations Center in Israel
 
 
Total
 
 
Joint ventures (1)
 
 
Expensesand collectivepromotion funds
 
 
Elimination of inter-segment transactions and non-reportable assets / liabilities (2)
 
 
Total as per statement of income / statement of financial position
 
Revenues
  3,609 
  - 
  3,609 
  (25)
  910 
  (7)
  4,487 
Costs
  (740)
  - 
  (740)
  11 
  (953)
  - 
  (1,682)
Gross profit / (loss)
  2,869 
  - 
  2,869 
  (14)
  (43)
  (7)
  2,805 
Net gain from fair value adjustment of investment properties
  12,897 
  - 
  12,897 
  (548)
  - 
  - 
  12,349 
General and administrative expenses
  (651)
  (28)
  (679)
  8 
  - 
  10 
  (661)
Selling expenses
  (300)
  - 
  (300)
  5 
  - 
  - 
  (295)
Other operating results, net
  (65)
  - 
  (65)
  - 
  12 
  (3)
  (56)
Profit / (loss) from operations
  14,750 
  (28)
  14,722 
  (549)
  (31)
  - 
  14,142 
Share of profit of associates and joint ventures
  324 
  - 
  324 
  413 
  - 
  - 
  737 
Segment profit / (loss)
  15,074 
  (28)
  15,046 
  (136)
  (31)
  - 
  14,879 
Reportable assets
  132,844 
  542,703 
  675,547 
  (771)
  - 
  33,893 
  708,669 
Reportable liabilities
  - 
  (480,535)
  (480,535)
  - 
  - 
  (114,060)
  (594,595)
Net reportable assets
  132,844 
  62,168 
  195,012 
  (771)
  - 
  (80,167)
  114,074 
 
(1) Represents the equity value of joint ventures that were proportionately consolidated for segment information.
 
 14


(2) Includes deferred income tax assets, income tax and MPIT credits, trade and other receivables, investment in financial assets, cash and cash equivalents and intangible assets except for rights to receive future units under barter agreements, net of investments in associates with negative equity which are included in provisions in the amount of Ps. 8,482 and Ps. 6,051 as of September 30, 2020 and 2019 respectively.
 
Below is a summarized analysis of the segments from the Group’s Operations Center in Argentina for the periods ended September 30, 2020 and 2019:


Three Month ended September 30, 2020


Operations Center in Argentina


Shopping Malls
 
 
Offices
 
 
Sales and developments
 
 
Hotels
 
 
International
 
 
Corporate
 
 
Others
 
 
Total
 
Revenues
  367 
  541 
  39 
  6 
  263 
  - 
  2 
  1,218 
Costs
  (134)
  (45)
  (97)
  (129)
  (221)
  - 
  (25)
  (651)
Gross profit / (loss)
  233 
  496 
  (58)
  (123)
  42 
  - 
  (23)
  567 
Net gain from fair value adjustment of investment properties
  1,178 
  13,112 
  10,096 
  - 
  2 
  - 
  538 
  24,926 
General and administrative expenses
  (328)
  (87)
  (66)
  (57)
  (17)
  (74)
  (20)
  (649)
Selling expenses
  (73)
  (37)
  (305)
  (19)
  (16)
  - 
  (1)
  (451)
Other operating results, net
  (24)
  (1)
  (6)
  8 
  - 
  - 
  (2)
  (25)
Profit / (loss) from operations
  986 
  13,483 
  9,661 
  (191)
  11 
  (74)
  492 
  24,368 
Share of loss of associates and joint ventures
  - 
  - 
  (8)
  - 
  (386)
  - 
  (78)
  (472)
Segment profit / (loss)
  986 
  13,483 
  9,653 
  (191)
  (375)
  (74)
  414 
  23,896 


Investment properties and trading properties
  54,124 
  72,026 
  43,899 
  - 
  103 
  - 
  1,986 
  172,138 
Investment in associates and joint ventures
  - 
  - 
  565 
  - 
  1,781 
  - 
  7,152 
  9,498 
Other operating assets
  282 
  236 
  809 
  1,954 
  - 
  - 
  103 
  3,384 
Operating assets
  54,406 
  72,262 
  45,273 
  1,954 
  1,884 
  - 
  9,241 
  185,020 
 
(i) For the three-month period ended September 30, 2020, the net gain from fair value adjustment of investment properties was Ps. 2,565. The net impact of the values in pesos of our properties was mainly a consequence of the change in macroeconomic conditions:
(a) gain of Ps.19,713.7 as a consequence of an increase in the projected inflation rate plus GDP, with the resulting increase in the cash flows from shopping malls revenues;
(b) loss of Ps.22,963.3 due to the conversion to dollars of the projected cash flow in pesos according to the exchange rate estimates used in the cash flow;
(c) an increase of 72 basis points in the discount rate, mainly due to an increase in the country-risk rate component of the WACC discount rate used to discount the cash flow, which led to a decrease in the value of the shopping malls of Ps.2,244.
(d) positive impact of Ps.14,539.7 resulting from the conversion into pesos of the value of the shopping malls in dollars based on the exchange rate at the end of the period;
(e) Additionally, due to the impact of the inflation adjustment, Ps. 12,160.3 were reclassified for shopping malls from “Net gain from fair value adjustment” to “Inflation Adjustment” in the Statement of Income and Other Comprehensive Income.
 
The value of our office buildings and other rental properties measured in real terms increased by 11.9% during the three-month period ended as of September 30, 2020, due to a devaluation of the peso which exceeded the period's inflation rate.


Three Month ended September 30, 2019


Operations Center in Argentina


Shopping Malls
 
 
Offices
 
 
Sales and developments
 
 
Hotels
 
 
International
 
 
Corporate
 
 
Others
 
 
Total
 
Revenues
  2,085 
  697 
  83 
  701 
  3 
  - 
  40 
  3,609 
Costs
  (180)
  (37)
  (56)
  (429)
  (4)
  - 
  (34)
  (740)
Gross profit / (loss)
  1,905 
  660 
  27 
  272 
  (1)
  - 
  6 
  2,869 
Net gain from fair value adjustment of investment properties
  601 
  6,845 
  5,153 
  - 
  - 
  - 
  298 
  12,897 
General and administrative expenses
  (257)
  (56)
  (66)
  (107)
  (41)
  (88)
  (36)
  (651)
Selling expenses
  (140)
  (29)
  (53)
  (77)
  - 
  - 
  (1)
  (300)
Other operating results, net
  (27)
  (7)
  (16)
  (4)
  (1)
  - 
  (10)
  (65)
Profit / (loss) from operations
  2,082 
  7,413 
  5,045 
  84 
  (43)
  (88)
  257 
  14,750 
Share of profit / (loss) of associates and joint ventures
  - 
  - 
  1 
  - 
  (228)
  - 
  551 
  324 
Segment profit / (loss)
  2,082 
  7,413 
  5,046 
  84 
  (271)
  (88)
  808 
  15,074 


Investment properties and trading properties
  54,965 
  40,896 
  35,580 
  - 
  116 
  - 
  1,443 
  133,000 
Investment in associates and joint ventures
  - 
  - 
  574 
  - 
  (9,619)
  - 
  5,817 
  (3,228)
Other operating assetsInvestment
  314 
  74 
  198 
  2,155 
  234 
  - 
  97 
  3,072 
Operating assets
  55,279 
  40,970 
  36,352 
  2,155 
  (9,269)
  - 
  7,357 
  132,844 
 
Below is a summarized analysis of the segments from the Group’s Operations Center in Israel for the periods ended September 30, 2020 and 2019:
 
 15


Three Month ended September 30, 2020


Operations Center in Israel


Real Estate
 
 
Supermarkets
 
 
Telecommunications
 
 
Insurance
 
 
Corporate
 
 
Others
 
 
Total
 
Revenues
  - 
  - 
  - 
  - 
  - 
  - 
  - 
Costs
  - 
  - 
  - 
  - 
  - 
  - 
  - 
Gross profit
  - 
  - 
  - 
  - 
  - 
  - 
  - 
Net gain from fair value adjustment of investment properties
  - 
  - 
  - 
  - 
  - 
  - 
  - 
General and administrative expenses
  - 
  - 
  - 
  - 
  (5)
  - 
  (5)
Selling expenses
  - 
  - 
  - 
  - 
  - 
  - 
  - 
Impairment of associates and joint ventures
  - 
  - 
  - 
  - 
  - 
  - 
  - 
Other operating results, net
  - 
  - 
  - 
  - 
  - 
  - 
  - 
Profit from operations
  - 
  - 
  - 
  - 
  (5)
  - 
  (5)
Share of profit of associates and joint ventures
  - 
  - 
  - 
  - 
  - 
  - 
  - 
Segment profit
  - 
  - 
  - 
  - 
  (5)
  - 
  (5)


Operating assets
  - 
  - 
  - 
  - 
  1,399 
  - 
  1,399 
Operating liabilities
  - 
  - 
  - 
  - 
  (2,355)
  - 
  (2,355)
Operating assets (liabilities), net
  - 
  - 
  - 
  - 
  (956)
  - 
  (956)


Three Month ended September 30, 2019


Operations Center in Israel


Real Estate
 
 
Supermarkets
 
 
Telecommunications
 
 
Insurance
 
 
Corporate
 
 
Others
 
 
Total
 
Revenues
  - 
  - 
  - 
  - 
  - 
  - 
  - 
Costs
  - 
  - 
  - 
  - 
  - 
  - 
  - 
Gross profit
  - 
  - 
  - 
  - 
  - 
  - 
  - 
Net gain from fair value adjustment of investment properties
  - 
  - 
  - 
  - 
  - 
  - 
  - 
General and administrative expenses
  - 
  - 
  - 
  - 
  (28)
  - 
  (28)
Selling expenses
  - 
  - 
  - 
  - 
  - 
  - 
  - 
Other operating results, net
  - 
  - 
  - 
  - 
  - 
  - 
  - 
Profit from operations
  - 
  - 
  - 
  - 
  (28)
  - 
  (28)
Share of profit of associates and joint ventures
  - 
  - 
  - 
  - 
  - 
  - 
  - 
Segment profit
  - 
  - 
  - 
  - 
  (28)
  - 
  (28)


Operating assets
  204,587 
  34,536 
  159,317 
  20,065 
  74,195 
  50,003 
  542,703 
Operating liabilities
  (165,817)
  - 
  (127,182)
  - 
  (27,718)
  (159,818)
  (480,535)
Operating assets (liabilities), net
  38,770 
  34,536 
  32,135 
  20,065 
  46,477 
  (109,815)
  62,168 
 
 
7.
Investments in associates and joint ventures
 
Changes in the Group’s investments in associates and joint ventures for the three-month period ended September 30, 2020 and for the year ended June 30, 2020 were as follows:


September 30, 2020
 
 
June 30, 2020
 
Beginning of the period / year
  80,073 
  38,519 
Adjustment previous periods (IFRS 9 and IAS 28)
  - 
  (2,130)
Increase of equity interest in associates and joint ventures
  - 
  3,598 
Capital contributions
  8 
  2,909 
Capital reduction
  - 
  (114)
Decrease of interest in associate (iv)
  (30,980)
  - 
Deconsolidation (iii)
  (34,721)
  31,409 
Share of profit
  662 
  9,330 
Currency translation adjustment
  (2,417)
  57 
Dividends (i)
  - 
  (1,959)
Other comprehensive loss
  (333)
  (1,340)
Reclassification to held-for-sale
  - 
  (2,228)
Others
  409 
  (1)
Incorporation by business combination
  - 
  2,023 
End of the period / year (ii)
  12,701 
  80,073 
 
 
 16
 
   
(i) Note 25.
(ii) As of September 30, 2020 and June 30, 2020 includes Ps. (17) and Ps. (16), reflecting interests in companies with negative equity, which were disclosed in “Provisions” (Note 18).
(iii) The amount as of September 30, 2020 corresponds to the effect of the deconsolidation of IDBD and DIC (See note 4.E).
Regarding the amount as of June 30, 2020, it corresponds to the effect of the deconsolidation of Gav-Yam (See Note 4 to the consolidated Financial Statements as of June 30, 2020)
(iv) Corresponds to the sale of the remaining equity interest in Shufersal in July 2020.


% ownership interest
 
 
Value of Group's interest in equity
 
 
Group's interest in comprehensive income / (loss)
 
Name of the entity
 
September 30, 2020
 
 
June 30, 2020
 
 
September 30, 2020
 
 
June 30, 2020
 
 
September 30, 2020
 
 
September 30, 2019
 
Associates


New Lipstick
  49.96%
  49.96%
  173 
  503 
  (330)
  (2,141)
BHSA
  29.91%
  29.91%
  4,327 
  4,385 
  (60)
  477 
Condor
  18.89%
  18.89%
  1,548 
  1,594 
  (55)
  (17)
PBEL
  N/A 
  45.40%
  - 
  - 
  - 
  - 
Shufersal
  N/A 
  26.02%
  - 
  30,263 
  17 
  - 
Mehadrin
  N/A 
  45.41%
  - 
  - 
  - 
  - 
Gav-Yam
  N/A 
  N/A 
  - 
  29,365 
  28 
  - 
Quality
  50.00%
  50.00%
  2,892 
  2,262 
  622 
  400 
La Rural SA
  50.00%
  50.00%
  235 
  219 
  16 
  81 
TGLT
  30.50%
  N/A 
  2,166 
  2,217 
  (39)
  - 
Other joint ventures
  N/A 
  N/A 
  1,360 
  9,265 
  (1,954)
  19 
Total associates and joint ventures
    
    
  12,701 
  80,073 
  (1,755)
  (1,181)
 
Below is additional information about the Group’s investments in associates and joint ventures:


Latest financial statements issued
 
Name of the entity
Place of business / Country of incorporation
Main activity
 
Common shares 1 vote
 
 
Share capital (nominal value)
 
 
Profit / (loss) for the period
 
 
Shareholders’ equity
 
Associates


New Lipstick
U.S.
Real estate
  N/A 
  - 
  (*) (9) 
  (*) (31) 
BHSA
Argentina
Financial
  448,689,072 
  (***) 1,500 
  (***) (194) 
  (***) 14,001 
Condor
EE.UU.
Hotel
  2,245,100 
  (*) 232 
  (*) (10) 
  (*) 76 
PBEL
India
Real estate
  N/A 
  (**) (2) 
  (**) - 
  (**) (2) 
Shufersal
Israel
Retail
  N/A 
  (**) 1,399 
  (**) 80 
  (**) 1,930 
Mehadrin
Israel
Agropecuaria
  N/A 
  N/A 
  N/A 
  N/A 
Gav-Yam
Israel
Inmobiliaria
  N/A 
  (**) 1,356 
  (**) 68 
  (**) 3,526 
Quality
Argentina
Real estate
  163,039,244 
  406 
  1,243 
  5,717 
La Rural SA
Argentina
Organization of events
  714,498 
  1 
  224 
  327 
TGLT (1)
Argentina
Real estate
  279,502,813 
  925 
  (477)
  6,295 
Other joint ventures
 
 
  N/A 
  N/A 
  N/A 
  N/A 
 
(*) 
Amounts in millions of US Dollars under USGAAP. Condor’s year-end falls on December 31, so the Group estimates their interest with a three-month lag, including material adjustments, if any.
(**) 
Amounts in millions of NIS.
(***) 
Information as of September 30, 2020 according to BCRA's standards.
(1)
Additionally, 21,600,000 preferred class A shares and 24,948,798 preferred class B shares were subscribed, subject to conversion. As of the date of issuance of these financial statements, these preferred shares have not yet been converted.
 
Puerto Retiro (joint venture):
 
There have been no changes to what was informed in Note 8 to the Annual Financial Statements.
 
 17


8.
Investment properties
 
Changes in the Group’s investment properties for the three-month period ended September 30, 2020 and for the year ended June 30, 2020 were as follows:


Three Month ended September 30, 2020
 
 
Year ended June 30, 2020


Rental properties
 
 
Undeveloped parcels of land
 
 
Properties under development
 
 
Total
 
 
Total
 
Fair value at the beginning of the period / year
  207,434 
  33,966 
  3,566 
  244,966 
  359,057 
Adjustments previous periods
  - 
  - 
  - 
  - 
  459 
Additions
  146 
  - 
  - 
  146 
  5,790 
Incorporation by business combination
  - 
  - 
  - 
  - 
  263 
Capitalized finance costs
  - 
  - 
  - 
  - 
  87 
Capitalized leasing costs
  16 
  1 
  - 
  17 
  21 
Amortization of capitalized leasing costs (i)
  (3)
  - 
  - 
  (3)
  (16)
Reclassification to assets held for sale
  - 
  - 
  - 
  - 
  (26,085)
Deconsolidation
  (82,116)
  (854)
  (1,281)
  (84,251)
  (169,600)
Disposals
  (9,607)
  - 
  - 
  (9,607)
  (16,312)
Currency translation adjustment
  (8,628)
  (89)
  (142)
  (8,859)
  57,570 
Net (loss)/ gain from fair value adjustment
  13,909 
  9,326 
  834 
  24,069 
  33,732 
Fair value at the end of the period / year
  121,151 
  42,350 
  2,977 
  166,478 
  244,966 
 
(i)
Amortization charges of capitalized leasing costs were included in “Costs” in the Statements of Income (Note 21).
 
The following amounts have been recognized in the Statements of Income:
 
 
  09.30.2020 
  09.30.2020 
Rental and services income
  1,304 
  3,704 
Direct operating expenses
  (653)
  1,195 
Development reimbursements / (expenses)
  (17)
  (23)
Net realized gain from fair value adjustment of investment properties
  187 
  - 
Net unrealized gain from fair value adjustment of investment properties
  23,902 
  12,349 


Valuation techniques are described in Note 9 to the Annual Financial Statements. There were no changes to such techniques. The Group has reassessed the assumptions September 30, 2020, considering the market conditions existing at that date due to the pandemic described in Note 30, incorporating the effect of the variation in the exchange rate in other assets denominated in US Dollars.
 
 18


9.
Property, plant and equipment
 
Changes in the Group’s property, plant and equipment for the three-month period ended September 30, 2020 and for the year ended June 30, 2019 were as follows:


Three Month ended September 30, 2020
 
 
Year ended June 30, 2020


Agricultural establishments
 
 
Buildings and facilities
 
 
Machinery and equipment
 
 
Communication networks
 
 
Others
 
 
Total
 
 
Total
 
Costs
  10,226 
  13,003 
  4,826 
  108,657 
  13,880 
  150,592 
  125,505 
Accumulated depreciation
  (5,540)
  (7,455)
  (4,068)
  (85,927)
  (6,984)
  (109,974)
  (91,158)
Net book amount at the beginning of the period / year
  4,686 
  5,548 
  758 
  22,730 
  6,896 
  40,618 
  34,347 
Additions
  40 
  64 
  3 
  416 
  533 
  1,056 
  6,107 
Disposals
  - 
  (19)
  (1)
  (40)
  - 
  (60)
  (3,558)
Incorporation by business combination
  - 
  - 
  - 
  - 
  - 
  - 
  6,576 
Impairment / recovery
  (4,373)
  (3,071)
  (570)
  (20,300)
  (6,082)
  (34,396)
  (1,141)
Reclassification to assets assets held for sale
  - 
  (20)
  - 
  - 
  - 
  (20)
  (295)
Currency translation adjustment
  (333)
  (249)
  (44)
  (1,636)
  (487)
  (2,749)
  6,266 
Transfers
  - 
  - 
  - 
  - 
  - 
  - 
  (280)
Depreciation charges (i)
  (20)
  (169)
  (14)
  (1,170)
  (738)
  (2,111)
  (7,404)
Balances at the end of the period / year
  - 
  2,084 
  132 
  - 
  122 
  2,338 
  40,618 
Costs
  5,167 
  9,264 
  4,088 
  80,895 
  8,118 
  107,532 
  150,592 
Accumulated depreciation
  (5,167)
  (7,180)
  (3,956)
  (80,895)
  (7,996)
  (105,194)
  (109,974)
Net book amount at the end of the period / year
  - 
  2,084 
  132 
  - 
  122 
  2,338 
  40,618 
 
(i) As of September 30, 2020, depreciation charges of property, plant and equipment were recognized as follows: Ps. 65 in "Costs" and Ps. 4 in "General and administrative expenses", respectively in the Statement of Income (Note 21). On the other hand, Ps 2.042 has been charged to the result of discontinued operations.
 
 
10.
Trading properties
 
Changes in the Group’s trading properties for the three-month period ended September 30, 2020 and for the year ended June 30, 2020 were as follows:


Three Month ended September 30, 2020
 
 
Year ended June 30, 2020


Completed properties
 
 
Properties under development
 
 
Undeveloped sites
 
 
Total
 
 
Total
 
Beginning of the period / year
  2,180 
  892 
  4,649 
  7,721 
  8,999 
Adjustment previous periods
  - 
  - 
  - 
  - 
  - 
Additions
  - 
  112 
  278 
  390 
  2,486 
Desconsolidation
  (1,526)
  (102)
  (3,884)
  (5,512)
  (167)
Capitalized financial costs
  - 
  - 
  - 
  - 
  13 
Currency translation adjustment
  (140)
  (14)
  (268)
  (422)
  943 
Transfers
  139 
  (139)
  - 
  - 
  231 
Capitalized finance costs
  - 
  - 
  - 
  - 
  - 
Disposals
  (557)
  (74)
  - 
  (631)
  (4,784)
End of the period / year
  96 
  675 
  775 
  1,546 
  7,721 
Non-current


  1,328 
  5,228 
Current


  218 
  2,493 
Total


  1,546 
  7,721 
 
 
 19


11.
Intangible assets
 
Changes in the Group’s intangible assets for the three-month period ended September 30, 2020 and for the year ended June 30, 2020 were as follows:


Three Month ended September 30, 2020
 
 
Year ended June 30, 2020


Goodwill
 
 
Trademarks
 
 
Licenses
 
 
Customer relations
 
 
Information systems and software
 
 
Contracts and others
 
 
Total
 
 
Total
 
Costs
  6,075 
  9,066 
  12,153 
  25,548 
  8,520 
  14,386 
  75,748 
  62,905 
Accumulated amortization
  - 
  (854)
  (9,548)
  (22,883)
  (3,974)
  (8,578)
  (45,837)
  (35,342)
Net book amount at the beginning of the period / year
  6,075 
  8,212 
  2,605 
  2,665 
  4,546 
  5,808 
  29,911 
  27,563 
Additions
  - 
  - 
  - 
  20 
  284 
  634 
  938 
  4,853 
Disposals
  - 
  - 
  - 
  - 
  (79)
  - 
  (79)
  (235)
Impairment
  (5,859)
  (7,607)
  (2,360)
  (2,251)
  (3,514)
  (4,603)
  (26,194)
  (3,532)
Transfers to trading properties
  - 
  - 
  - 
  - 
  - 
  - 
  - 
  - 
Assets incorporated by business combination
  - 
  - 
  - 
  - 
  - 
  - 
  - 
  61 
Currency translation adjustment
  (91)
  (585)
  (186)
  (196)
  (329)
  (388)
  (1,775)
  6,217 
Amortization charges (i)
  - 
  (20)
  (59)
  (238)
  (742)
  (556)
  (1,615)
  (5,016)
Balances at the end of the period / year
  125 
  - 
  - 
  - 
  166 
  895 
  1,186 
  29,911 
Costs
  125 
  814 
  8,929 
  22,395 
  4,338 
  9,478 
  46,079 
  75,748 
Accumulated amortization
  - 
  (814)
  (8,929)
  (22,395)
  (4,172)
  (8,583)
  (44,893)
  (45,837)
Net book amount at the end of the period / year
  125 
  - 
  - 
  - 
  166 
  895 
  1,186 
  29,911 
 
(ii) As of September 30, 2020, amortization charges were recognized in the amount of Ps. 2 in "Costs" and Ps. 27 in "General and administrative expenses", in the Statement of Income (Note 21). On the other hand, Ps 1.586 has been charged to the result of discontinued operations.
 
 
12.
Right-of-use assets
 
The Group’s right-of-use assets as of September 30, 2020 and June 30, 2020 are the following:


September 30, 2020
 
 
June 30, 2020
 
Real Estate
  8 
  4,431 
Telecommunications
  - 
  11,846 
Machinery and equipment
  11 
  14 
Others
  602 
  5,088 
Total Right-of-use assets
  621 
  21,379 
Non-current
  621 
  21,379 
Total
  621 
  21,379 


The depreciation charge of the right-of use-assets is detailed below:


September 30, 2020
 
 
September 30, 2019
 
Real Estate
  397 
  579 
Telecommunications
  2,293 
  3,397 
Others
  646 
  1,096 
Total depreciation of right-of-use assets
  3,336 
  5,072 


 20


13.
Financial instruments by category
 
This note presents the financial assets and financial liabilities by category of financial instrument and a reconciliation to the corresponding line in the Consolidated Statements of Financial Position, as appropriate. Financial assets and liabilities measured at fair value are assigned based on their different levels in the fair value hierarchy. For further information related to fair value hierarchy refer to Note 13 to the Annual Financial Statements. Financial assets and financial liabilities as of September 30, 2020 are the following:


Financial assets at amortized cost
 
 
Financial assets at fair value through profit or loss
 
 
Subtotal financial assets
 
 
Non-financial assets
 
 
Total


Level 1
 
 
Level 2
 
 
Level 3


September 30, 2020


Assets as per Statement of Financial Position


Trade and other receivables (excluding the allowance for doubtful accounts and other receivables)
  4,152 
  - 
  - 
  - 
  4,152 
  3,396 
  7,548 
Investments in financial assets:


  - Public companies’ securities
  - 
  302 
  - 
  177 
  479 
  - 
  479 
  - Bonds
  - 
  2,109 
  - 
  - 
  2,109 
  - 
  2,109 
  - Investments in financial assets with quotation
  10 
  329 
  931 
  26 
  1,296 
  - 
  1,296 
Derivative financial instruments:


  - Warrants
  - 
  - 
  - 
  - 
  - 
  - 
  - 
  - Foreign-currency future contracts
  - 
  - 
  16 
  - 
  16 
  - 
  16 
Restricted assets (i)
  8 
  - 
  - 
  - 
  8 
  - 
  8 
Cash and cash equivalents:


  - Cash at bank and on hand
  4,330 
  - 
  - 
  - 
  4,330 
  - 
  4,330 
  - Short-term investments
  - 
  67 
  - 
  - 
  67 
  - 
  67 
Total assets
  8,500 
  2,807 
  947 
  203 
  12,457 
  3,396 
  15,853 


Financial liabilities at amortized cost
 
 
Financial liabilities at fair value through profit or loss
 
 
Subtotal financial liabilities
 
 
Non-financial liabilities
 
 
Total


Level 1
 
 
Level 2
 
 
Level 3


September 30, 2020


Liabilities as per Statement of Financial Position


Trade and other payables
  3,983 
  - 
  - 
  - 
  3,983 
  2,769 
  6,752 
Borrowings (excluding finance leases)
  56,438 
  - 
  - 
  - 
  56,438 
  - 
  56,438 
Derivative financial instruments:


  - Forwards
  - 
  - 
  89 
  - 
  89 
  - 
  89 
Total liabilities
  60,421 
  - 
  89 
  - 
  60,510 
  2,769 
  63,279 


 21


Financial assets and financial liabilities as of June 30, 2020 were as follows:


Financial assets at amortized cost
 
 
Financial assets at fair value through profit or loss
 
 
Subtotal financial assets
 
 
Non-financial assets
 
 
Total


Level 1
 
 
Level 2
 
 
Level 3


June 30, 2020


Assets as per Statements of Financial Position


Trade and other receivables (excluding the allowance for doubtful accounts and other receivables)
  53,134 
  - 
  - 
  - 
  53,134 
  15,771 
  68,905 
Investments in financial assets:
  - 
  - 
  - 
  - 
  - 
  - 
  - 
  - Public companies’ securities
  - 
  618 
  248 
  - 
  866 
  - 
  866 
  - Private companies’ securities
  - 
  - 
  - 
  3,132 
  3,132 
  - 
  3,132 
  - Deposits
  1,028 
  66 
  - 
  - 
  1,094 
  - 
  1,094 
  - Bonds
  - 
  9,940 
  1,555 
  - 
  11,495 
  - 
  11,495 
  - Investments in financial assets with quotation
  - 
  6,995 
  872 
  250 
  8,117 
  - 
  8,117 
Derivative financial instruments
  - 
  - 
  - 
  - 
  - 
  - 
  - 
  - Foreign-currency future contracts
  - 
  - 
  139 
  - 
  139 
  - 
  139 
  - Others
  66 
  - 
  22 
  153 
  241 
  - 
  241 
Restricted assets (i)
  8,698 
  - 
  - 
  - 
  8,698 
  - 
  8,698 
Financial assets available for sale:
  - 
  - 
  - 
  - 
  - 
  - 
  - 
  - Clal
  - 
  3,636 
  - 
  - 
  3,636 
  - 
  3,636 
Cash and cash equivalents:
  - 
  - 
  - 
  - 
  - 
  - 
  - 
  - Cash at bank and on hand
  26,562 
  - 
  - 
  - 
  26,562 
  - 
  26,562 
  - Short term investments
  67,420 
  3,294 
  - 
  - 
  70,714 
  - 
  70,714 
Total assets
  156,908 
  24,549 
  2,836 
  3,535 
  187,828 
  15,771 
  203,599 


Financial liabilities at amortized cost
 
 
Financial liabilities at fair value through profit or loss
 
 
Subtotal financial liabilities
 
 
Non-financial liabilities
 
 
Total


Level 1
 
 
Level 2
 
 
Level 3


June 30, 2020


Liabilities as per Statement of Financial Position


Trade and other payables
  26,898 
  - 
  - 
  - 
  26,898 
  7,380 
  34,278 
Borrowings (excluding finance leases)
  404,954 
  - 
  - 
  - 
  404,954 
  - 
  404,954 
Derivative financial instruments:
  - 


  - Foreign-currency future contracts
  - 
  - 
  149 
  - 
  149 
  - 
  149 
  - Swaps
  - 
  - 
  1,028 
  22 
  1,050 
  - 
  1,050 
  - Others
  - 
  - 
  66 
  - 
  66 
  - 
  66 
Total liabilities
  431,852 
  - 
  1,243 
  22 
  433,117 
  7,380 
  440,497 


(i) Corresponds to security deposits and escrows.
 
 22


The fair value of financial assets and liabilities at their amortized cost does not differ significantly from their book value, except for borrowings (Note 17). The fair value of payables approximates their respective carrying amounts because, due to their short-term nature, the effect of discounting is not considered significant. Fair values are based on discounted cash flows (Level 3).
 
The valuation models used by the Group for the measurement of Level 2 and Level 3 instruments are no different from those used as of June 30, 2020.
 
As of September 30, 2020, there have been no changes to the economic or business circumstances affecting the fair value of the financial assets and liabilities of the Group.
 
The Group uses a range of valuation models for the measurement of Level 2 and Level 3 instruments. Details of such models are presented in the following table. When no quoted prices are available in an active market, fair values (particularly with derivatives) are based on recognized valuation methods.
 
 
Description
Pricing model / method
Parameters
Fair value hierarchy
 
Range


Promissory note
Theoretical price
Acquisition agreement.
 
Level 2
  - 
Investments in financial assets - Other private companies’ securities
Cash flow / NAV - Theoretical price
Projected revenue discounted at the discount rate /
The value is calculated in accordance with shares in the equity funds on the basis of their Financial Statements, based on fair value or investments assessments.
Level 3
  1 - 3.5 
Investments in financial assets - Others
Discounted cash flow - Theoretical price
Projected revenue discounted at the discount rate /
The value is calculated in accordance with shares in the equity funds on the basis of their Financial Statements, based on fair value or investment assessments.
Level 3
  1 - 3.5 
Derivative financial instruments – Forwards
Theoretical price
Underlying asset price and volatility
Level 2 and 3
  - 


The following table presents the changes in Level 3 instruments as of September 30, 2020 and June 30, 2020:


Derivative financial instruments - Forwards
 
 
Investments in financial assets - Private companies' securities
 
 
nvestments in financial assets - Others
 
 
Investments in financial assets - Public companies
 
 
Derivative financial instruments
 
 
Total as of September 30, 2020
 
 
Total as of June 30, 2020
 
Balances at beginning of the period / year
  (22)
  3,132 
  250 
  - 
  153 
  3,513 
  4,460 
Additions and acquisitions
  - 
  - 
  - 
  - 
  - 
  - 
  38 
Transfer to level 1
  - 
  - 
  - 
  247 
  - 
  247 
  378 
Currency translation adjustment
  - 
  - 
  - 
  - 
  - 
  - 
  883 
Desconsolidation
  22 
  (3,132)
  (219)
  - 
  (153)
  (3,482)
  - 
Write off
  - 
  - 
  - 
  - 
  - 
  - 
  (1,709)
Gain / (loss) for the period / year (i)
  - 
  - 
  (5)
  (70)
  - 
  (75)
  (537)
Balances at the end of the period / year
  - 
  - 
  26 
  177 
  - 
  203 
  3,513 
 
 
(i)
Included within “Financial results, net” in the Statements of Income.
 
 
14.
Trade and other receivables
 
Group’s trade and other receivables as of September 30, 2020 and June 30, 2020 are as follows:
 
 23


September 30, 2020
 
 
June 30, 2020
 
Sale, leases and services receivables
  3,095 
  41,397 
Less: Allowance for doubtful accounts
  (669)
  (4,021)
Total trade receivables
  2,426 
  37,376 
Prepaid expenses
  530 
  14,529 
Borrowings, deposits and others
  1,470 
  10,797 
Advances to suppliers
  886 
  1,086 
Tax receivables
  763 
  866 
Others
  804 
  230 
Total other receivables
  4,453 
  27,508 
Total trade and other receivables
  6,879 
  64,884 
Non-current
  1,881 
  24,898 
Current
  4,998 
  39,986 
Total
  6,879 
  64,884 


Movements on the Group’s allowance for doubtful accounts were as follows:


September 30, 2020
 
 
June 30, 2020
 
Beginning of the period / year
  4,021 
  2,856 
Adjustments previous periods (IFRS 9)
  - 
  - 
Additions
  355 
  1,107 
Recovery
  (72)
  (117)
Currency translation adjustment
  (238)
  1,145 
Deconsolidation
  (3,328)
  (22)
Receivables written off during the period/year as uncollectable
  (20)
  (772)
Transfer to assets held for sale
  - 
  (22)
Incorporation by business combination
  - 
  19 
Inflation adjustment
  (49)
  (173)
End of the period / year
  669 
  4,021 


The creation and release of the allowance for doubtful accounts have been included in “Selling expenses” in the Statement of Income (Note 21).
 
15.
Cash flow information
 
Following is a detailed description of cash flows generated by the Group’s operations for the three month periods ended September 30, 2020 and 2019:


Note
 
 
Three Month ended September 30, 2020
 
 
Three Month ended September 30, 2019
 
Profit for the period


  8,340 
  15,017 
Profit / (Loss) for the period from discontinued operations


  6,396 
  (13,887)
Adjustments for:


Income tax
  19 
  7,958 
  2,505 
Amortization and depreciation
  21 
  122 
  119 
Loss from disposal of property, plant and equipment
    
  - 
  - 
Net gain from fair value adjustment of investment properties
    
  (24,089)
  (12,349)
Financial results, net
    
  (87)
  12,670 
Provisions and allowances
    
  70 
  69 
Share of profit of associates and joint ventures
  7 
  (147)
  (737)
Changes in operating assets and liabilities:


Decrease in inventories
    
  5 
  1 
Decrease / (increase) in trading properties
    
  256 
  (52)
Decrease in restricted assets
    
  1,157 
  - 
(Increase) / decrease in trade and other receivables
    
  (643)
  392 
Increase / (decrease) in trade and other payables
    
  1,885 
  (476)
Decrease in salaries and social security liabilities
    
  (73)
  (160)
Decrease in provisions
    
  (12)
  (186)
Net cash generated by continuing operating activities before income tax paid
    
  1,138 
  2,926 
Net cash generated by discontinued operating activities before income tax paid
    
  2,405 
  7,897 
Net cash generated by operating activities before income tax paid
    
  3,543 
  10,823 
 
 24


The following table presents a detail of significant non-cash transactions occurred in the three-month periods ended September 30, 2020 and 2019:


Three Month ended September 30, 2020
 
 
Three Month ended September 30, 2019
 
Decrease of associates and joint ventures through an increase of trade and other receivables
  - 
  26 
Increase in rights of use through increased lease liabilities
  24 
  - 
Increase of investment properties through a decrease of financial assets
  - 
  299 
Increase of trade and other receivables through a decrease of associates and joint ventures
  11 
  - 
Increase of property, plant and equipment through an increase of trade and other payables
  - 
  618 
Increase of intangible assets through an increase of trade and other payables
  - 
  36 
Increase of investment properties through an increase of borrowings
  81 
  - 
Increase of trading properties through an increase of borrowings
  12 
  5 
Distribution of dividends to non-controlling interest pending payment
  - 
  18 
Decrease of interest in associates and joint ventures
  30.980 
  - 
Increase in investment properties through an increase in trade and other payables
  - 
  499 
Increase of right-of-use assets through a decrease in property, plant and equipment
  - 
  23 
Decrease of investments in associates and joint ventures through a reclassification to assets held for sale
  - 
  4.434 


16.
Trade and other payables
 
Group’s trade and other payables as of September 30, 2020 and June 30, 2020 were as follows:


September 30, 2020
 
 
June 30, 2020
 
Trade payables
  800 
  20,151 
Advances from sales, leases and services
  2,640 
  2,850 
Construction obligations
  - 
  438 
Accrued invoices
  396 
  473 
Deferred income
  - 
  153 
Total trade payables
  3,836 
  24,065 
Dividends payable to non-controlling interest
  - 
  241 
Taxes payable
  215 
  171 
Construction provisions
  - 
  - 
Other payables
  2,701 
  9,801 
Total other payables
  2,916 
  10,213 
Total trade and other payables
  6,752 
  34,278 
Non-current
  1,745 
  2,335 
Current
  5,007 
  31,943 
Total
  6,752 
  34,278 


17.
Borrowings
 
The breakdown of the Group’s borrowings as of September 30, 2020 and June 30, 2020 was as follows:


Total as of September 30, 2020 (ii)
 
 
Total as of June 30, 2020 (ii)
 
 
Fair value as of September 30, 2020
 
 
Fair value as of June 30, 2020
 
NCN
  44,538 
  340,026 
  185,441 
  252,018 
Bank loans
  3,629 
  60,580 
  39,103 
  45,329 
Bank overdrafts
  7,110 
  2,614 
  7,110 
  2,428 
Other borrowings (i)
  1,161 
  1,734 
  1,161 
  1,611 
Total borrowings
  56,438 
  404,954 
  232,815 
  301,386 
Non-current
  31,967 
  320,616 
    
    
Current
  24,471 
  84,338 


  56,438 
  404,954 


 25


Issuance of IRSA Non-convertible Notes
 
On July 21, 2020, subsequently to the closing of the fiscal year, the Company issued USD 38.4 million Non-convertible Notes in the local market through the following instruments:
 
Ps. 335.2 (equivalent to USD 4.7 million) Series VI NCNs denominated and payable in Argentine pesos at a variable rate (Private Badlar) + 4.0%, with interest accruing on a quarterly basis. The principal amount is repayable in two installments: the first one -equal to 30% of the par value of the notes- payable on the date that is 9 (nine) months after the Issue and Settlement Date and the second installment -equal to 70% of the par value of the notes- payable on the relevant due date, i.e. July 21, 2021. Notes were issued at 100% of their par value.
 
US$ 33.7 million Series VII NCNs denominated in US$ and payable in Argentine pesos at the applicable exchange rate, at a fixed 4.0% rate, with interest accruing on a quarterly basis. Repayment of capital is due on January 21, 2021. Notes were issued at 100% of their par value. The proceeds will be used to refinance short-term indebtedness.
 
Payment of non-convertible notes
 
On July 20, 2020, the Company paid the twentieth interest installment and the principal installment of the US$ 75 Series II Non-convertible Notes issued on July 20, 2010.
 
On August 6, 2020, the Company paid the second interest installment and the principal installment of the US$ 47 Series II Non-convertible Notes issued on August 6, 2019.
 
Payment of IRSA CP’s Series IV Non-convertible Notes
 
On September 14, 2020, the aggregate principal amount of the Series IV Non-convertible Notes in the amount of Ps. 10,381 (US$ 140 million) and interest accrued as of such date in the amount of Ps. 134 (US$ 1.8 million) were paid.
 
18.
Provisions
 
The table below shows the movements in the Group's provisions categorized by type:


Legal claims (i)
 
 
Investments in associates and joint ventures (ii)
 
 
Site dismantling and remediation
 
 
Other provisions
 
 
Total
 
 
Total
 
Beginning of period / year
  2,686 
  16 
  482 
  2,740 
  5,924 
  14,980 
Additions
  7 
  - 
  20 
  (79)
  (52)
  513 
Share of loss of associates
  - 
  1 
  (1)
  (1)
  (1)
  (8,032)
Incorporated by business combination
  - 
  - 
  - 
  - 
  - 
  60 
Recovery
  (1)
  - 
  - 
  - 
  (1)
  (1,132)
Used during the period / year
  (44)
  - 
  - 
  (20)
  (64)
  (896)
Inflation adjustment
  (17)
  - 
  - 
  - 
  (17)
  (73)
Desconsolidation
  (2,217)
  - 
  (468)
  (2,400)
  (5,085)
  - 
Currency translation adjustment
  (178)
  - 
  (33)
  (240)
  (451)
  504 
End of period / year
  236 
  17 
  - 
  - 
  253 
  5,924 
Non-current


  145 
  3,297 
Current


  108 
  2,627 
Total


  253 
  5,924 
 
 26


(i) Additions and recovery are included in "Other operating results, net".
(ii) Corresponds to investments in New Lipstick and Puerto Retiro, companies that have negative equity. The increase and recovery is included in "Share of profit of associates and joint ventures ".
.
There were no significant changes to the processes mentioned in Note 18 to the Annual Financial Statements.
 
19.
Taxes
 
The details of the Group’s income tax, is as follows:


September 30, 2020
 
 
September 30, 2019
 
Current income tax
  (5)
  (194)
Deferred income tax
  (7,953)
  (2,311)
Income tax from continuing operations
  (7,958)
  (2,505)


Below is a reconciliation between income tax recognized and the amount which would result from applying the prevailing tax rate on profit before income tax for the three-month periods ended September 30, 2020 and 2019:


Three Month ended September 30, 2020
 
 
Three months ended September 30, 2019
 
Profit from continuing operations at tax rate applicable in the respective countries (*)
  (6,808)
  (1,458)
Permanent differences:
    
    
Share of profit of associates and joint ventures
  (44)
  190 
Unrecognized tax loss carryforwards (i)
  (2,415)
  (808)
Inflation adjustment permanent difference
  446 
  (1,013)
Tax rate differential
  1,636 
  662 
Non-taxable profit, non-deductible expenses and others
  222 
  1,113 
Fiscal transparency
  - 
  149 
Tax inflation adjustment
  (995)
  (1,340)
Income tax from continuing operations
  (7,958)
  (2,505)


(i)
 Corresponds principally to Operations Center in Argentina.
 
The gross movement in the deferred income tax account is as follows:


September 30, 2020
 
 
June 30, 2020
 
Beginning of period / year
  (46,727)
  (56,001)
Use of tax los carryforwards
  - 
  - 
Currency translation adjustment
  1,240 
  1,694 
Incorporated by business combination
  - 
  (933)
Deconsolidation
  11,248 
  15,370 
Charged to the revaluation surplus reserve
  - 
  386 
Revaluation surplus reserve
  - 
  (98)
Deferred income tax charge
  (7,734)
  (7,145)
End of period / year
  (41,973)
  (46,727)
Deferred income tax assets
  148 
  681 
Deferred income tax liabilities
  (42,121)
  (47,408)
Deferred income tax liabilities, net
  (41,973)
  (46,727)


 27
 
 
20.
Revenues


Three months ended September 30, 2020
 
 
Three months ended September 30, 2019
 
Rental and services income
  1,304 
  3,704 
Sales of trading properties and developments
  299 
  80 
Revenue from hotels operation and tourism services
  6 
  703 
Total Group’s revenues
  1,609 
  4,487 


21.
Expenses by nature
 
The Group discloses expenses in the statements of income by function as part of the line items “Costs”, “General and administrative expenses” and “Selling expenses”. The following table provides additional disclosures regarding expenses by nature and their relationship to the function within the Group.


Costs
 
 
General and administrative expenses
 
 
Selling expenses
 
 
Total as of September 30, 2020
 
 
Total as of September 30, 2019
 
Cost of sale of goods and services
  294 
  - 
  - 
  294 
  72 
Salaries, social security costs and other personnel expenses
  368 
  165 
  23 
  556 
  932 
Depreciation and amortization
  72 
  50 
  - 
  122 
  119 
Fees and payments for services
  11 
  59 
  134 
  204 
  150 
Maintenance, security, cleaning, repairs and others
  242 
  46 
  - 
  288 
  583 
Advertising and other selling expenses
  22 
  - 
  2 
  24 
  170 
Taxes, rates and contributions
  59 
  16 
  238 
  313 
  323 
Interconnection and roaming expenses
  - 
  - 
  - 
  - 
  - 
Fees to other operators
  - 
  - 
  - 
  - 
  - 
Director´s fees
  - 
  285 
  - 
  285 
  128 
Leases and service charges
  25 
  9 
  6 
  40 
  53 
Allowance for doubtful accounts, net
  - 
  - 
  45 
  45 
  39 
Other expenses
  4 
  14 
  2 
  20 
  69 
Total as of September 30, 2020
  1,097 
  644 
  450 
  2,191 
    
Total as of September 30, 2019
  1,682 
  661 
  295 
    
  2,638 


22.
Cost of goods sold and services provided


Total as of September 30, 2020
 
 
Total as of September 30, 2019
 
Inventories at the beginning of the period (*)
  12,762 
  22,274 
Adjustments previous periods
  - 
  (8,126)
Purchases and expenses (**)
  7,700 
  41,852 
Capitalized finance costs
  - 
  99 
Currency translation adjustment
  8,262 
  (369)
Transfers
  - 
  (810)
Disposals
  (631)
  (1,231)
Deconsolidation
  (3,377)
  - 
Inventories at the end of the period (*)
  (1,611)
  (11,065)
Total costs
  23,105 
  42,624 


The following table presents the composition of the Group’s inventories as of September 30, 2020 and June 30, 2020:


Total as of September 30, 2020
 
 
Total as of September 30, 2019
 
Real estate
  1,546 
  7,721 
Others
  65 
  - 
Telecommunications
  - 
  5,041 
Total inventories at the end of the period (*)
  1,611 
  12,762 


(*) Inventories include trading properties and inventories.
 
23.
Other operating results, net
 
 28


Three months ended September 30, 2020
 
 
Three months ended September 30, 2019
 
Gain from disposal of subsidiary and associates (1)
  - 
  (8)
Donations
  (19)
  (38)
Lawsuits and other contingencies
  (25)
  (30)
Operating interest expense
  13 
  26 
Others (2)
  13 
  (6)
Total other operating results, net
  (18)
  (56)


24.
Financial results, net


Three months ended September 30, 2020
 
 
Three months ended September 30, 2019
 
Finance income:


 - Interest income
  17 
  83 
 - Dividend income
  12 
  - 
 - Other finance income
  27 
  - 
Total finance income
  56 
  83 
Finance costs:
    
    
 - Interest expenses
  (1,485)
  (1,661)
 - Loss on debt swap
  (5)
  (3)
 - Other finance costs
  (196)
  (164)
Subtotal finance costs
  (1,686)
  (1,828)
Capitalized finance costs
  93 
  46 
Total finance costs
  (1,593)
  (1,782)
Other financial results:
    
    
 - Fair value gain of financial assets and liabilities at fair value through profit or loss, net
  800 
  (456)
 - Exchange differences, net
  (8)
  (8,929)
 - Gain from repurchase of negotiable obligations
  20 
  8 
 - Gain from derivative financial instruments, net
  (188)
  225 
Total other financial results
  624 
  (9,152)
 - Inflation adjustment
  (29)
  (393)
Total financial results, net
  (942)
  (11,244)


 29


25.
Related party transactions
 
The following is a summary of the balances with related parties as of September 30, 2020 and June 30, 2019:
 
Item
 
 September 30, 2020
 
 
 June 30, 2020


Trade and other receivables
  387 
  1,416 
 
 
Investments in financial assets
  2 
  1,702 
 
 
Borrowings
  (29)
  (169)
 
 
Trade and other payables
  (70)
  (410)
 
 
Total
  290 
  2,539 


 Related party
 
 September 30, 2020
 
 
 June 30, 2020
 
 Description of transaction
 Item
Manibil S.A.
  - 
  - 
 Contributions in advance
 Trade and other receivable
New Lipstick LLC
  - 
  - 
 Loans granted
 Trade and other receivable
 
  - 
  (83)
 Loans obtained
 Borrowings
 
  18 
  17 
 Reimbursement of expenses receivable
 Trade and other receivable
Condor
  222 
  290 
 Public companies securities
 Trade and other receivable
IRSA Real Estate Strategies LP
  127 
  125 
 Reimbursement of expenses receivable
 Trade and other receivable
Other associates and joint ventures
  - 
  131 
 Reimbursement of expenses receivable
 Trade and other receivable
 
  - 
  - 
 Leases and/or rights of use payable
 Trade and other payables
 
  (29)
  (29)
 Loans obtained
 Borrowings
 
  - 
  9 
 Management fees
 Trade and other receivable
 
  - 
  90 
  Leases and/or rights of use receivable
 Trade and other receivable
 
  - 
  219 
 Dividends
 Trade and other receivable
 
  (1)
  (1)
 Reimbursement of expenses receivable
 Trade and other payables
 
  - 
  - 
 Reimbursement of expenses payable
 Trade and other receivable
Total associates and joint ventures
  337 
  1,276 
 
 
Cresud
  (4)
  (3)
 Reimbursement of expenses receivable
 Trade and other payables
 
  (48)
  (264)
 Corporate services receivable
 Trade and other payables
 
  2 
  1,702 
 NCN
 Investment in financial assets
 
  4 
  4 
 Leases and/or rights of use receivable
 Trade and other payables
 
  (1)
  (1)
 Management fee
 Trade and other payables
 
  - 
  (3)
 Share based payments
 Trade and other payables
Total parent company
  (47)
  1,435 
 
 
Directors
  (16)
  (137)
 Fees for services received
 Trade and other payables
 
  - 
  4 
Advances
Trade and other receivable
Others (1)
  - 
  - 
  Leases and/or rights of use receivable
 Trade and other receivable
 
  - 
  (57)
 Loans granted
 Trade and other receivable
 
  - 
  (1)
 Reimbursement of expenses payable
 Trade and other payables
 
  16 
  19 
 Reimbursement of expenses receivable
 Trade and other receivable
Total directors and others
  - 
  (172)


  290 
  2,539 


(1)
Includes CAMSA, Estudio Zang, Bergel & Viñes, Austral Gold, Fundación IRSA, Hamonet S.A., CAM Communication LP, Gary Gladstein and Fundación Museo de los Niños.
 
 30


The following is a summary of the results with related parties for the three-month periods ended September 30, 2020 and 2019:
 
Related party
 
 Three Month ended September 30, 2020
 
 
 Three months ended September 30, 2019
 
Description of transaction
 BACS
  28 
  - 
 Leases and/or rights of use
 Manibil
  - 
  - 
 Corporate services
 Tarshop
  - 
  - 
 Leases and/or rights of use
 
  - 
  - 
 Commissions
 La Rural S.A.
  - 
  - 
 Leases and/or rights of use
 Condor
  - 
  - 
 Financial operations
 Other associates anf joint ventures
  - 
  - 
 Financial operations
 Otras asociadas y negocios conjuntos
  9 
  41 
 Leases and/or rights of use

  - 
  (3)
 Corporate services
Otras asociadas y negocios conjuntos
  (9)
  - 
 Honorarios y remuneraciones
Total associates and joint ventures
  28 
  38 
 
Cresud
  4 
  4 
 Leases and/or rights of use

  (204)
  (155)
 Corporate services

  299 
  96 
 Financial operations
Total parent company
  99 
  (55)
 
 Directors
  (515)
  (145)
 Fees and remunerations

  - 
  41 
 Leases and/or rights of use

  - 
  - 
 Financial operations

  - 
  (14)
 Donationd
 
  - 
  (11)
 Corporate services
 
  (20)
  - 
 Fees and remuneration
Total others
  (535)
  (129)
 
Total at the end of the period
  (408)
  (146)


(1)
Includes Isaac Elsztain e Hijos, CAMSA. Hamonet S.A., Ramat Hanassi, Estudio Zang, Bergel y Viñes, Austral Gold, La Rural, New Lipstick, Condor, TGLT and Fundación IRSA.
 
The following is a summary of the transactions with related parties for the three-month periods ended September 30, 2020 and 2019:
 
Related party
 
 Three Month ended September 30, 2020
 
 
 Three months ended September 30, 2019
 
Description of the operation
Condor
  - 
  36 
Dividends received
Total dividends received
  - 
  36 
 
Quality
  8 
  16 
Capital contributions
Manibil
  - 
  94 
Capital contributions
Total capital contributions
  8 
  110 
 
Pareto
  53 
  - 
Purchase and exchange of shares
Total other transactions
  53 
  - 


 31


26.
CNV General Resolution N° 622
 
As required by Section 1°, Chapter III, Title IV of CNV General Resolution N° 622, below there is a detail of the notes to the Unaudited Condensed Interim Consolidated Financial Statements that disclose the information required by the Resolution in Exhibits.
 
Exhibit A - Property, plant and equipment
Note 8 Investment properties and Note 9 Property, plant and equipment
Exhibit B - Intangible assets
Note 11 Intangible assets
Exhibit C - Investment in associates
Note 7 Investments in associates and joint ventures
Exhibit D - Other investments
Note 13 Financial instruments by category
Exhibit E – Provisions
Note 18 Provisions
Exhibit F - Cost of sales and services provided
Note 22 Cost of goods sold and services provided
Exhibit G - Foreign currency assets and liabilities
Note 27 Foreign currency assets and liabilities
 
27.
Foreign currency assets and liabilities
 
Book amounts of foreign currency assets and liabilities are as follows:
 
 
Item / Currency (1)
 
Amount (2)
 
 
Peso exchange rate (3)
 
 
Total as of 09.30.20
 
 
Total as of 06.30.20
 
Assets


Trade and other receivables


US Dollar
  11 
  75.980 
  870 
  3,246 
Euros
  0 
  88.965 
  11 
  948 
Receivables with related parties:


US Dollar
  0 
  76.180 
  18 
  335 
Total trade and other receivables
    
    
  899 
  4,529 
Investments in financial assets


US Dollar
  0 
  75.980 
  10 
  3,879 
Pounds
  3 
  22.223 
  69 
  84 
Investments with related parties:


US Dollar
  16 
  76.180 
  1,212 
  1,305 
Total investments in financial assets
    
    
  1,291 
  5,268 
Derivative financial instruments


US Dollar
  - 
  75.980 
  - 
  - 
Total Derivative financial instruments
    
    
  - 
  - 
Cash and cash equivalents


US Dollar
  22 
  75.980 
  1,689 
  14,015 
Euros
  1 
  88.965 
  1 
  1,665 
Total cash and cash equivalents
    
    
  1,690 
  15,680 
Total Assets
    
    
  3,880 
  25,477 


Liabilities


Trade and other payables


US Dollar
  181 
  76.180 
  13,822 
  14,201 
Euros
  0 
  98.490 
  - 
  328 
Payables to related parties:


US Dollar
  - 
  76.180 
  - 
  - 
Total Trade and other payables
    
    
  13,822 
  14,529 
Borrowings


US Dollar
  241 
  76.180 
  18,385 
  65,590 
Borrowings with related parties


US Dollar
  1 
  76.180 
  67 
  379 
Total Borrowings
    
    
  18,452 
  65,969 
Derivative financial instruments


US Dollar
  0 
  76.180 
  1 
  102 
Total derivative financial instruments
    
    
  1 
  102 
Lease liabilities


US Dollar
  0 
  76.180 
  2 
  - 
Total lease liabilities
    
    
  2 
  - 
Total Liabilities
    
    
  32,277 
  80,600 
 
(1) Considering foreign currencies those that differ from each Group’s subsidiaries functional currency at each period/year-end.
(2) Stated in millions of each foreign currency.
(3) Exchange rates as of September 30, 2020 according to Banco de la Nación Argentina.
 
 32


28.
Groups of assets and liabilities held for sale
 
As mentioned in Note 4.C. to the Annual Financial Statements, the Group had as of June 30, 2020
 has certain assets and liabilities classified as held for sale. The following table presents the main ones:


September 30, 2020
 
 
June 30, 2020
 
Property, plant and equipment
  - 
  38,453 
Intangible assets
  - 
  1,467 
Investments in associates
  - 
  241 
Deferred income tax assets
  - 
  876 
Investment properties
  - 
  - 
Income tax credits
  - 
  - 
Trade and other receivables
  - 
  1,991 
Cash and cash equivalents
  - 
  1,840 
Total assets held-for-sale
  - 
  44,868 
Trade and other payables
  - 
  10,686 
Salaries and social security liabilities
  - 
  417 
Employee benefits
  - 
  416 
Deferred income tax liabilities
  - 
  2,103 
Borrowings
  - 
  10,290 
Total liabilities held-for-sale
  - 
  23,912 
Total net assets held-for-sale
  - 
  20,956 

 
29.
Results from discontinued operations
 
The results of the discontinued operations include the IDBD / DIC operations which were deconsolidated in the current period (see Note 4.E) and the results of the comparative periods have been reclassified.


Three months ended September 30, 2020
 
 
Three months ended September 30, 2019
 
Revenues
  27,124 
  27,100 
Costs
  (22,008)
  (18,143)
Gross profit
  5,116 
  8,957 
Net loss from fair value adjustment of investment properties
  (20)
  - 
General and administrative expenses
  (3,122)
  (2,569)
Selling expenses
  (2,974)
  (3,185)
Other operating results, net
  (1,867)
  19,881 
(Loss) / profit from operations
  (2,867)
  23,084 
Share of profit / (loss) of associates and joint ventures
  515 
  (528)
(Loss) / profit before financial results and income tax
  (2,352)
  22,556 
Finance income
  377 
  317 
Finance cost
  (4,946)
  (7,321)
Other financial results
  327 
  (1,624)
Financial results, net
  (4,242)
  (8,628)
(Loss) / profit before income tax
  (6,594)
  13,928 
Income tax
  198 
  (41)
(Loss) / profit from discontinued operations
  (6,396)
  13,887 


(Loss) / profit for the period from discontinued operations attributable to:
    
    
Equity holders of the parent
  (5,064)
  4,271 
Non-controlling interest
  (1,332)
  9,616 
(Loss) / profit per share from discontinued operations attributable to equity holders of the parent:
    
    
Basic
  (8.81)
  7.42 
Diluted
  (8.81)
  7.36 


(1)
 As of September 30, 2020 corresponds mainly to the loss of control of IDBD; As of September 30, 2019, it mainly corresponds to the result from the loss of control of Gav-Yam and the fair value measurement of the remaining investment.


 33


30.
Other relevant events of the period
 
Economic context in which the company operates
 
The Company does business in a complex framework due to the macroeconomic conditions, whose main variables have recently shown high volatility, and also due to regulatory, social and political conditions, both at a national and international level.
 
Its operating income may be affected by fluctuations in the inflation index and the argentine peso exchange rate against other currencies, mainly the dollar, variations in interest rates which have an impact on the cost of capital, changes in government policies, capital control and other political or economic developments both locally and internationally.
 
In December 2019, a new coronavirus strain (SARS-COV-2), causing a severe acute respiratory syndrome (COVID-19), appeared in Wuhan, China. On March 11, 2020, the World Health Organization declared COVID-19 a pandemic. In response, countries have taken extraordinary actions intended to prevent the spread of the virus, including, travel bans, border shutdowns, closing of non-essential businesses, instructions to residents to practice social distancing and implementation of lockdowns, among others. The ongoing pandemic and these extraordinary governmental actions are affecting the worldwide economy and have rendered global financial markets highly volatile.
 
The first case of COVID-19 in Argentina was reported on March 3, 2020 and until November 8, 2020, more than 1,200,000 cases of infections had been confirmed in Argentina. As a result, the Argentine the National Government implemented a series of health measures of social, preventive and mandatory isolation at the national level that began on March 19, 2020 and extended several times, most recently until November 8, 2020 inclusive in the Metropolitan Area of Buenos Aires although it has been extended in some cities in the interior of the country. Among this measures, that affected the local economy, the following stand out: the extension of the public emergency in health matters, the total closure of borders, the suspension of international and domestic flights, the suspension of medium and long-distance land transport, the suspension of artistic and sports shows, closure of businesses not considered essential, including shopping malls and hotels.
 
These measures have significantly affected Argentine companies, which have faced drops in income and the deterioration of their flow of payments. In this context, the Argentine Government announced several actions intended to tackle the financial crisis of the companies adversely affected by the COVID-19 pandemic. In addition to the stagnation of the Argentine economy, there is an international crisis caused by the COVID-19 pandemic. In view of this scenario, a severe downturn in the Argentine economy is expected.
 
After several negotiations between the Argentine Government and the bondholders, the Argentine Government announced the execution of an agreement in principle with the main groups of bondholders in order to avoid the default. On August 28, 2020, the Government informed that the holders of 93.55% of the aggregate outstanding principal amount of all bonds have accepted a debt exchange and, on August 31, 2020, the Argentine Government obtained the consents required to exchange and/or amend 99.01% of the aggregate outstanding principal amount of all series of eligible bonds. As of the date of these financial statements, the new bonds are already being traded on the market.
 
However, the Government still faces the challenge of arriving at a successful renegotiation of the debt with the IMF. A favorable outcome for Argentina and the restructuring of its debt with the IMF would have a positive impact on the Argentine economy in the mid- and long-term. On the contrary, failure to reach an agreement with foreign private creditors might lead Argentina to default on its sovereign debt and, as a result, this situation may trigger restrictions on the companies’ ability to obtain new financing.
 
At the local environment, the following circumstances may be noted:
 
In August 2020, an indicador called “Monthly Estimator of Economic Activity” (“EMAE”) reported by the National Institute of Statistics and Censuses (“INDEC”), registered a variation of (11.6%) compared to the same month of 2019, and from 1,1% compared to the previous month.
 
The market expectations survey prepared by Central Bank in October 2020, called the Market Expectations Survey (“REM” in Spanish), estimates a retail inflation of 35.8% for 2020. The analysts who confirm the REM forecast a variation in real GDP for 2020 of (11.6)%. In turn, they foresee that in 2021 economic activity will rebound in activity, reaching an economic growth of 4.5%.


 34


The interannual inflation as of September 30, 2020 reached 36.6%.
 
In the period from September 2019 to September 2020, the argentine peso depreciated 32.3% compared to the US dollar at the average wholesale exchange rate quoted byBanco de la Nación Argentina. Given the exchange restrictions in force since August 2019, as of September 30, 2020 the exchange gap between the official peso/US dollar exchange rate and the peso/US dollar exchange rate offered in the black market is almost 82%. This has an impact on the level of economic activity and detrimentally affects the reserves of the of the Argentine Central Bank. In addition, the current foreign exchange restrictions or those that may be imposed in the future may impair the Company’s ability to access the Sole Free FX Market (Mercado Único Libre de Cambio or MULC) to purchase the currency required to meet its financial obligations.
 
On September 15, 2020, the Argentine Central Bank issued Communication “A” 7106 which establishes, among other things, that entities with principal maturities falling due between October 15, 2020 and March 31, 2021 related to the issuance of foreign-currency denominated publicly-registered debt securities in Argentina by private sector clients or by the entities themselves, must submit to the Argentine Central Bank a refinancing plan based on the following criteria: (a) the net amount for which access to the foreign exchange is granted within the original terms must not exceed 40% of the principal amount due, and (b) the remaining principal amount must have been refinanced through new foreign debt with an average life of at least 2 years. It is worth mentioning that for the maturities to be registered from the effective date of the communication (September 16, 2020) and until 12.31.2020, the refinancing plan must be submitted prior to 09.30.2020; and the submission deadline for the remaining maturities -between January 1, 2021 and March 31, 2021, must be submitted with a term of at least 30 calendar days before the maturity of the capital to be refinanced.
 
COVID-19 PANDEMIC
 
As described above, the COVID-19 is having an adverse impact on both the global and the Argentine economy and the Company’s business.
 
Below follows a description of the expected effects of the COVID-19 pandemic on the Company as of the date of these financial statements:
 
Because of the social, preventive and obligatory lockdown, shopping malls throughout the country were closed since March 20, 2020, exclusively remaining operational those stores dedicated to activities considered essential such as pharmacies, supermarkets and banks. The reopening of shopping malls in the interior of the country began during the months of May, June, and July. In August 2020, the Arcos District, an open-air premium outlet in the city of Buenos Aires, was opened and in October 2020, the Group’s shopping malls in City and Greater Buenos Aires were reopened. As of October 31, 2020, all the Group’s shopping malls were open and operating under strict protocols. However the uncertainty posed by this situation may cause the closing of stores that have already opened, as happened in some shopping malls in the interior of the country in previous months due to the increase in cases in those regions.
 
As a result of the shopping mall closings, the Company has decided to differ the invoicing and collection of the Monthly Guaranteed Amount (Valor Mensual Asegurado or V.M.A.) until September 30, 2020, with some exceptions, and not to collect the collective promotion fund during such period in an attempt to prioritize its long-term relationship with the lessees. Additionally, an increase in the delinquency rate of some lessees has been noticedAs a result of the above, the impact on shopping malls is a 82.4% decrease in income from rentals and services during the first quarter of fiscal year 2021 compared to the same period of last fiscal year, and a 12.6% increase compared to the immediately preceding quarter. Additionally, the charge for bad debts in the first quarter of fiscal year 2021 is ARS 40 million and ARS 37 million in the same period of previous fiscal year.
 
In relation rental of offices, although most of the tenants are working in the home office mode, they are operational with strict safety and hygiene protocols. To date, we have not evidenced a deterioration in collections.

 35


La Rural, the Buenos Aires and Punta del Este Convention Centers and the DIRECTV Arena stadium, establishments that the Group owns directly or indirectly, have also been closed since March 20. All planned congresses were suspended, most of the fairs and conventions have been postponed, while the shows scheduled at the DIRECTV Arena stadium were mostly cancelled. The reopening date of these establishments is uncertain, as well as the future agenda of fairs, conventions and shows.
  
The Libertador hotel in the City of Buenos Aires and Llao Llao in the province of Río Negro have temporarily closed since the mandatory lockdown decreed in March 2020, while the Intercontinental Hotel in the City of Buenos Aires has worked only under a contingency and emergency plan. As a result of the above, the impact on these financial statements is a 99% decrease in revenues compared to same period of previous fiscal year After the end of first quarter of fiscal year 2021, on November 16, the Llao Llao Hotel opened its doors operating under strict protocols. It is expected that the hotels in the city of Buenos Aires will gradually begin to restart their activity in the coming months.
 
In financial matters, in May and July 2020, IRSA has issued Notes in the local market for an approximate amount of USD 105.4 million. With those proceeds, the Company canceled its Series II Notes for a nominal value of USD 71.4 million maturing on July 20, 2020 and Series II Notes for a nominal value of CLP 31,502.6 million (equivalent to approximately USD 41 million) maturing on August 6, 2020. On the other hand, IRSA CP canceled its Series IV Notes on September 14 for a nominal value of USD 140 million.
 
The maturity of IRSA Series I notes for a nominal value of USD 181.5 million falls within the period contemplated by communication “A” 7106 of the BCRA mentioned above. In this sense, IRSA presented a proposal to the BCRA in the corresponding terms and carried out an exchange operation through the payment in cash of USD 72.6 million and the issuance of two new series of Notes: Series VIII and Series IX for a nominal value of USD 31.7 million and USD 80.7 million (including USD 6.5 million of new subscriptions). The exchange offer was accepted by 98.3%
 
In the next 12 months, IRSA faces the maturity of its Series III Notes for a nominal value of ARS 354 million (equivalent to USD 4.6 million) maturing on February 21, 2021, Series IV Notes for a nominal value of USD 51.4 million maturing on May 21, 2021, Series VI Notes for a nominal value of ARS 335 million (equivalent to USD 4.4 million) maturing on July 21, 2021, bank overdrafts for an amount equivalent to USD 22.0 million and other banking debt for USD 11.8 million. For its part, IRSA CP has maturities of banking debt for the approximate sum of USD 72.7 million.
 
It is important to mention that IRSA has approved with IRSA CP a credit line for up to USD 180 million over 3 years, of which as of September 30, 2020 IRSA used approximately USD 104.5 million, leaving the balance available. Additionally, at the Annual Shareholders Meeting, held on October 26, 2020, IRSA CP approved the distribution of a cash dividend of ARS 9,700 million that will be paid on November 25. As of September 30, IRSA owned an 80.65% stake in IRSA CP.
 
The final extent of the Coronavirus outbreak and its impact on the country's economy is unknown and difficult to fully predict. However, although it has produced significant short-term effects, they are not expected to affect business continuity and the Company’s ability to meet financial commitments for the next twelve months.
 
The Company is closely monitoring the situation and taking all necessary measures to preserve human life and the Group's businesses.


 36
 
 
31.
Subsequent events
 
Investors Assembly
 
At the General Ordinary and Extraordinary Shareholders’ Meeting held on October 26, 2020, a distribution of a dividend in kind for ARS 484 million in shares of IRSA Propiedades Comerciales, subsidiary of IRSA.
 
Exchange of debentures
 
On November 12, 2020, the company carried out an exchange operation of its Series I Notes, for a nominal value of USD 181.5 million
 
Nominal Value of Existing Notes presented and accepted for the Exchange (for both Series): approximately USD 178.5 which represents 98.31% acceptance, through the participation of 6,571 orders.
 
Series VIII: Face Value of Existing Notes presented and accepted for the Exchange: approximately USD 104.3 million.
 
Nominal Value to be Issued: approximately USD 31.7 million.
 
Issuance Price: 100% nominal value.
 
Maturity Date: It will be November 12, 2023.
 
Consideration of the Exchange Offer: eligible holders whose existing notes have been accepted for the Exchange by the Company, will receive for every USD 1 submitted to the Exchange, the accrued interest of the existing notes until the settlement and issue date and the following:
 
A sum of money of approximately USD 72,6 million for repayment of capital of such existing notes presented to the Exchange, in cash, in United States Dollars, which will be equivalent to USD 0.69622593 for each USD 1 of existing notes presented to the Exchange; and
 
The remaining amount until completing 1 USD for each 1 USD of existing notes presented to the Exchange, in notes Series VIII.
 
Annual Nominal Fixed Interest Rate: 10.00%.
 
Amortization: The capital of the Series VIII Notes will be amortized in 3 annual installments (33% of the capital on November 12, 2021, 33% of the capital on November 12, 2022, 34% of the capital on the maturity date of Series VIII).
 
Interest Payment Dates: Interest will be paid quarterly for the expired period as of the issue and settlement date.
 
Payment Address: Payment will be made to an account at Argentine Securities Commission in the Autonomous City of Buenos Aires
 
Series IX: Face Value of Existing Notes presented and accepted for the Exchange: approximately USD 74.2 million.
 
Nominal Value to be Issued (together with the Face Value to be issued as a result of the cash subscription): approximately USD 80.7 million.
 
Issuance Price: 100% nominal value.
 
Maturity Date: It will be March 1, 2023.
 
Consideration of the Exchange Offer: the eligible holders whose existing notes have been accepted for the Exchange by the Company, will receive Series IX Notes for 100% of the capital amount presented for exchange and accepted by the Company and the accrued interest of the existing notes until the settlement and issue date.
 
Early Bird: will consist of the payment of USD 0.02 for each USD 1 of existing notes delivered and accepted in the Exchange on or before the deadline date to Access the Early Bird. Said consideration will be paid in Pesos on the issue and settlement date according to the exchange rate published by Communication “A” 3500 of the Central Bank of Argentina on the business day prior to the expiration date of the Exchange, which is ARS 79.3433 for each USD 1 of Existing Notes delivered and accepted in the Exchange.
 
Annual Nominal Fixed Interest Rate: 10.00%.
 
Amortization: The capital of the Series IX Notes will be amortized in one installment on the maturity date.
 
Interest Payment Dates: Interest will be paid quarterly for the expired period from the issuance and settlement date.
 
Payment Address: Payment will be made to an account at Argentine Securities Commission in New York, United States, for which purpose the Company will make US dollars available to an account reported by the Argentine Securities Commission in said jurisdiction.
 
Modifications to the Terms of the Existing Notes: Considering that consent has been obtained for an amount greater than 90% of the existing notes capital, the Company has modified and replaced the following essential and non-essential terms and conditions of the existing notes.
 
By virtue of the implementation of the Proposed Non-Essential Modifications, the entire section of "Certain Commitments" and "Events of Default" is eliminated from the terms and conditions set forth in the prospectus supplements dated May 2, 2019 and dated July 25, 2019 corresponding to the existing notes.
 
 37


Additionally, pursuant to the implementation of the Proposed Essential Modifications, the following terms and conditions of the Existing Notes are modified and replaced:
 
Expiration Date: It will be March 1, 2023.
 
Interest Payment Dates: will be the same dates reported for Class IX in the Notice of Results.
 
It is clarified that the terms and conditions of the Series I Notes not modified by the Proposed Essential Modifications and the Proposed Non-Essential Modifications will maintain their full validity.
 
Boston Tower Office Floors Sale
 
On November 5, 2020, IRSA Commercial Properties sold and transferred 4 additional floors for a gross rental area of approximately 3,892 sqm and 15 garage units located in the building. The transaction price was approximately Ps. 1,812 (USD 22.9 million).
 
Finally, on November 12, 2020, the Company sold and transferred the last 3 floors with a rental area of 3,266 m2, a retail store of 228 m2 and 15 parking spaces for a total price of approximately Ps. 1,521 (USD 19.1 million)
 
Loan to related party
 
On October 23, 2020, Dolphin Netherlands has granted a loan to Yad Leviim Ltd. for a term of 60 days, in a principal amount of USD 16,250,000 at a rate interest of 5% per year. Yad Leviim Ltd. is a company controlling by Eduardo Elsztain.
 
 38


EX-99.3 4 irsa-ex994.htm SUMMARY OF INVESTMENT PROPERTIES BY TYPE irsa-ex994
 
Schedule I
 
The following is a summary of the Group’s investment properties as of June 30, 2020 prepared in accordance with SEC Regulation S-X 12-28:


Initial costs
 
 
Subsequent costs
 
 
Costs at end of the year


Name
 
Encumbrances
 
 
Plot of land
 
 
Buildings, facilities and improvements
 
 
Improvements / Additions / Disposals / Transfers
 
 
Plot of land
 
 
Buildings, facilities and improvements
 
 
Total
 
 
Capitalized costs, net
 
 
Fair value adjustments
 
 
Fair Value at the end of the year
 
 
Date of construction
 
Date of acquisition
Rental properties


Operations Center in Argentina


Abasto Shopping
  - 
  206 
  5,338 
  260 
  206 
  5,598 
  5,804 
  3 
  1,524 
  7,331 
 
Nov-98
 
Jul-94
Alto Palermo Shopping
  - 
  183 
  8,604 
  551 
  183 
  9,155 
  9,338 
  5 
  -466 
  8,877 
 
Oct-90
 
Nov-97
Alto Avellaneda
  - 
  365 
  3,518 
  834 
  365 
  4,352 
  4,717 
  9 
  279 
  5,005 
 
Oct-95
 
Dec-1997
Alcorta Shopping
  - 
  220 
  2,471 
  720 
  220 
  3,191 
  3,411 
  1 
  1,828 
  5,240 
 
Jun-92
 
Jun-97
Alto Noa
  - 
  8 
  928 
  173 
  8 
  1,101 
  1,109 
  - 
  137 
  1,246 
 
Sep-94
 
Mar-95
Patio Bullrich
  - 
  177 
  3,250 
  339 
  177 
  3,589 
  3,766 
  1 
  -1,253 
  2,514 
 
Sep-88
 
Oct-98
Alto Rosario
  - 
  794 
  391 
  962 
  794 
  1,353 
  2,147 
  5 
  2,270 
  4,422 
 
Nov-04
 
Nov-04
Mendoza Plaza
  - 
  222 
  1,579 
  1,029 
  222 
  2,608 
  2,830 
  12 
  -757 
  2,085 
 
Jun-94
 
Dec-1994
Dot Baires Shopping
  - 
  677 
  493 
  4,724 
  677 
  5,217 
  5,894 
  6 
  -260 
  5,640 
 
May-09
 
Nov-06
Córdoba Shopping
 
Antichresis
 
  81 
  1,449 
  271 
  81 
  1,720 
  1,801 
  - 
  -438 
  1,363 
 
Mar-90
 
Dec-2006
Distrito Arcos
  - 
  - 
  - 
  2,270 
  - 
  2,270 
  2,270 
  - 
  -234 
  2,036 
  - 
Nov-09
Alto Comahue
  - 
  55 
  156 
  2,557 
  55 
  2,713 
  2,768 
  - 
  -1,408 
  1,360 
  - 
May-06
Patio Olmos
  - 
  167 
  311 
  1 
  167 
  312 
  479 
  1 
  488 
  968 
 
May-95
 
Sep-07
Soleil Premium Outlet
  - 
  179 
  601 
  484 
  179 
  1,085 
  1,264 
  1 
  732 
  1,997 
  - 
Jul-10
Dot building
  - 
  153 
  50 
  2,030 
  153 
  2,080 
  2,233 
  11 
  2,305 
  4,549 
 
Sep-10
 
Nov-06
Bouchard 710
  - 
  1,387 
  741 
  88 
  1,387 
  829 
  2,216 
  3 
  4,583 
  6,802 
  - 
Jun-05
Bouchard 551
  - 
  80 
  47 
  64 
  80 
  111 
  191 
  - 
  143 
  334 
  - 
Mar-07
Intercontinental Plaza
  - 
  42 
  589 
  3 
  42 
  592 
  634 
  1 
  434 
  1,069 
 
Jun-96
 
Nov-97
BankBoston Tower
  - 
  1,282 
  1,033 
  4 
  1,282 
  1,037 
  2,319 
  3 
  4,828 
  7,150 
  - 
Aug-2007
República building
  - 
  1,708 
  1,377 
  8 
  1,708 
  1,385 
  3,093 
  1 
  6,562 
  9,656 
  - 
Apr-2008
La Adela
  - 
  1,251 
  - 
  - 
  1,251 
  - 
  1,251 
  - 
  221 
  1,472 
  - 
Jul-14
Philips Building
  - 
  - 
  1,453 
  1 
  - 
  1,454 
  1,454 
  - 
  1,418 
  2,872 
  - 
Jun-17
Zetta Building
  - 
  462 
  - 
  3,579 
  462 
  3,579 
  4,041 
  128 
  9,109 
  13,278 
  - 
Dec -14
Catalinas Building
  - 
  1,453 
  - 
  4,143 
  1,453 
  4,143 
  5,596 
  255 
  8,730 
  14,581 
  - 
May -10
Others
  - 
  252 
  890 
  414 
  252 
  1,304 
  1,556 
  - 
  3,310 
  4,866 
  n/a 
n/a


Schedule I (Continued)


Initial costs
 
 
Subsequent costs
 
 
Costs at end of the year


Name
 
Encumbrances
 
 
Plot of land
 
 
Buildings, facilities and improvements
 
 
Improvements / Additions / Disposals / Transfers
 
 
Plot of land
 
 
Buildings, facilities and improvements
 
 
Total
 
 
Capitalized costs, net
 
 
Fair value adjustments
 
 
Fair Value at the end of the year
 
 
Date of construction
 
 
Date of acquisition
 
Operations Center in Israel


Tivoli
  - 
  360 
  4,502 
  2,896 
  360 
  7,398 
  7,758 
  - 
  7,855 
  15,613 
 
Apr-11
 
 
Oct-15
 
HSBC
 
Mortgage
 
  13,771 
  5,113 
  655 
  13,771 
  5,768 
  19,539 
  - 
  49,176 
  68,715 
  1927-1984 
 
Oct-15
 
Others
    
  2,843 
  6,441 
  690 
  2,843 
  7,131 
  9,974 
  - 
  -3,581 
  6,393 
  N/A 
  N/A 
Total Rental properties
    
  28,378 
  51,325 
  29,750 
  28,378 
  81,075 
  109,453 
  446 
  97,535 
  207,434 
    
    
Undeveloped parcels of land


Operations Center in Argentina


Building annexed to Dot
  - 
  713 
  - 
  - 
  713 
  - 
  713 
  - 
  3,589 
  4,302 
  - 
 
Nov-06
 
Luján plot of land
  - 
  362 
  - 
  37 
  362 
  37 
  399 
  - 
  634 
  1,033 
  - 
 
May-12
 
Caballito – Ferro
  - 
  783 
  - 
  221 
  783 
  221 
  1,004 
  - 
  2,391 
  3,395 
  - 
 
Nov-97
 
Santa María del Plata
  - 
  3,345 
  - 
  - 
  3,345 
  - 
  3,345 
  - 
  18,161 
  21,506 
  - 
 
Jul-97
 
La Plata plot of land
  - 
  402 
  - 
  - 
  402 
  - 
  402 
  - 
  606 
  1,008 
    
 
Mar-18
 
Intercontinental tower B
  - 
  358 
  - 
  575 
  358 
  575 
  933 
  - 
  225 
  1,158 
  - 
  - 
Others
  - 
  126 
  - 
  72 
  126 
  72 
  198 
  - 
  424 
  622 
  - 
  - 
Operations Center in Israel


Tivoli
  - 
  804 
  - 
  10 
  804 
  10 
  814 
  - 
  128 
  942 
 
Apr-11
 
 
Oct-15
 
Total undeveloped parcels of land
    
  6,893 
  - 
  915 
  6,893 
  915 
  7,808 
  - 
  26,158 
  33,966 


Schedule I (Continued)


Initial costs
 
 
Subsequent costs
 
 
Costs at end of the year


Name
 
Encumbrances
 
 
Plot of land
 
 
Buildings, facilities and improvements
 
 
Improvements / Additions / Disposals / Transfers
 
 
Plot of land
 
 
Buildings, facilities and improvements
 
 
Total
 
 
Capitalized costs, net
 
 
Fair value adjustments
 
 
Fair Value at the end of the year
 
Date of construction
 
Date of acquisition
 
Properties under development


Operations Center in Argentina


PH Office Park
  - 
  - 
  - 
  16 
  - 
  16 
  16 
  - 
  - 
  16 
in progress
  - 
Building annexed to Alto Palermo Shopping
  - 
  605 
  - 
  1,072 
  605 
  1,072 
  1,677 
  - 
  221 
  1,898 
in progress
  - 
EH UT
  - 
  - 
  - 
  114 
  - 
  114 
  114 
  - 
  -33 
  81 
in progress
  - 
Others
    
  - 
  - 
  159 
  - 
  159 
  159 
  - 
  -12 
  147 
 
    
Operations Center in Israel


Tivoli
  - 
  77 
  1,092 
  447 
  77 
  1,539 
  1,616 
  - 
  -192 
  1,424 
in progress
 
Oct-15
 
Total properties under development
    
  682 
  1,092 
  1,808 
  682 
  2,900 
  3,582 
  - 
  -16 
  3,566 
 
    
Total
    
  35,953 
  52,417 
  32,473 
  35,953 
  84,890 
  120,843 
  446 
  123,677 
  244,966 


EX-99.4 5 listofsubsidiariesexhibit.htm ADDITIONAL EXHIBITS listofsubsidiariesexhibit
 
 
 LIST OF SUBSIDIARIES
 
The following table lists our subsidiaries and their jurisdiction of incorporation as of September 30, 2020:


% of ownership interest held by the Group
 
Name of the entity
Country
Main activity
 
As of September 30, 2020
 
IRSA’s direct interest:


IRSA CP(1) 
Argentina
Real estate
  80.65%
E-Commerce Latina S.A. 
Argentina
Investment
  100.00%
Efanur S.A. 
Uruguay
Investment
  100.00%
Hoteles Argentinos S.A.U. 
Argentina
Hotel
  100.00%
Inversora Bolívar S.A. 
Argentina
Investment
  100.00%
Llao Llao Resorts S.A.(2) 
Argentina
Hotel
  50.00%
Nuevas Fronteras S.A. 
Argentina
Hotel
  76.34%
Palermo Invest S.A. 
Argentina
Investment
  100.00%
Ritelco S.A. 
Uruguay
Investment
  100.00%
Tyrus S.A. 
Uruguay
Investment
  100.00%
U.T. IRSA y Galerías Pacifico(2) 
Argentina
Investment
  50.00%
IRSA CP’s direct interest:


Arcos del Gourmet S.A. 
Argentina
Real estate
  90.00%
Emprendimiento Recoleta S.A. 
Argentina
Real estate
  53.68%
Fibesa S.A.(3) 
Argentina
Real estate
  100.00%
Panamerican Mall S.A. 
Argentina
Real estate
  80.00%
Shopping Neuquén S.A. 
Argentina
Real estate
  99.95%
Torodur S.A. 
Uruguay
Investment
  100.00%
EHSA 
Argentina
Investment
  70.00%
Centro de Entretenimiento La Plata
Argentina
Real estate
  100.00%
Pareto S.A. 
Argentina
design and software development
  69.69%
Tyrus S.A.’s direct interest:


DFL and DN BV 
Bermuda’s / Netherlands
Investment
  97.04%
I Madison LLC 
USA
Investment
   
IRSA Development LP 
USA
Investment
   
IRSA International LLC 
USA
Investment
  100.00%
Jiwin S.A. 
Uruguay
Investment
  100.00%
Liveck S.A. 
Uruguay
Investment
  100.00%
Real Estate Investment Group V LP (REIG V)
Bermuda’s
Investment
   
Real Estate Strategies LLC 
USA
Investment
  100.00%
Efanur S.A.’s direct interest:


Real Estate Investment Group VII LP (REIG VII)
Bermuda’s
Investment
  100.00%
 
(1) 
Includes interest held through E-Commerce Latina S.A. and Tyrus S.A..
(2) 
The Company has consolidated the investment in Llao Llao Resorts S.A. and UT IRSA and Galerías Pacífico considering its equity interest and a shareholder agreement that confers it majority of votes in the decision making process.
(3) 
Includes interest held through Ritelco S.A. and Torodur S.A.


GRAPHIC 6 irsaq1fy21000.jpg IMAGE begin 644 irsaq1fy21000.jpg M_]C_X 02D9)1@ ! 0$ 8 !@ #_VP!# @&!@<&!0@'!P<)"0@*#!0-# L+ M#!D2$P\4'1H?'AT:'!P@)"XG("(L(QP<*#7J#A(6&AXB)BI*3E)66EYB9FJ*CI*6FIZBIJK*SM+6VM[BYNL+#Q,7& MQ\C)RM+3U-76U]C9VN'BX^3EYN?HZ>KQ\O/T]?;W^/GZ_\0 'P$ P$! 0$! M 0$! 0 $" P0%!@<("0H+_\0 M1$ @$"! 0#! <%! 0 0)W $" M Q$$!2$Q!A)!40=A<1,B,H$(%$*1H;'!"2,S4O 58G+1"A8D-.$E\1<8&1HF M)R@I*C4V-S@Y.D-$149'2$E*4U155E=865IC9&5F9VAI:G-T=79W>'EZ@H.$ MA8:'B(F*DI.4E9:7F)F:HJ.DI::GJ*FJLK.TM;:WN+FZPL/$Q<;'R,G*TM/4 MU=;7V-G:XN/DY>;GZ.GJ\O/T]?;W^/GZ_]H # ,! (1 Q$ /P#W^BBB@ HH MHH **** "BBB@ HHHH **** "BBB@ HHHH **** "BBB@ HHHH **** "BBB M@ HHHH **** "BBB@ HHHH **** "BBB@ HHHH **** "BBB@ HHJGJMZVG: M7/=I&)&C (4G&22!_6@"Y16/Y_B#_GRL?^_[?X4>?X@_Y\K'_O\ M_A0!L45 MC^?X@_Y\K'_O^W^%'G^(/^?*Q_[_ +?X4 ;%%8_G^(/^?*Q_[_M_A1Y_B#_G MRL?^_P"W^% &Q16/Y_B#_GRL?^_[?X4>?X@_Y\K'_O\ M_A0!L45C^?X@_Y\ MK'_O^W^%'G^(/^?*Q_[_ +?X4 ;%%9NDW]Q>_:H[J&.*:WE\MA&Q8'@'K^-: M5 !1110 4444 %%%% !1110 4444 %%%% !1110 4444 %%%% !1110 4444 M %%%% !1110 4444 %%%% !1110 4444 %%%% !1110 4444 %%%% !1110 M4444 %%%% !1110 4444 %%%% !1110 4444 %%%% !1110 4444 %%%% !1 M110 4444 %%%% !1110 4444 %%%% !1110 4444 %%%% !1110 4444 %%% M% !1110 5D^)O^1=N_HO_H0K6K)\3?\ (NW?T7_T(4 86NZ]JEKJ5S:VDI"I M/"BA(5=PK1LS8!Z]*;!XDOH9=.N+ZZ0V4\>28HUR6QGY^ZGZ5N3:EHD.L"UF M:(7Y9"2YE.%64+N*Y' MTQ]:EF\82"*[G2VCCM[81[I9Y,!2ZALG';G%;KV6DO%*CP6C1B0O("JX#]R? M>F-%H\K2VCI9L2H>2(A>0!@$CTQ0!B2>*I()[I5:.<^8@C#81%'E;SAN^>V: MN!3H4TNY6 M*2..W;S 3'E0">,' //3B@#GH/'"7%A%81F5I"(U!7C:O>R,#>&1,PE M6.R( @;77MUZCJ*FA\3ZC/,MLT%I$V)2\I9MCA3@;#W- %?_ (0[46T[44-[ M$MU/@VY!)6#D$J,_P]JDC\+:O&MB5NK42Q"02/M)"ACGY!T&/6HH_%6K0RI! M;Z5]HC0$R,\NUW_W >M5G\3ZDFI276RW+FT/DVX=MN[=G#GH&Q0!;LO"&IB1 MA?WD$T)?E4!7S%]6]3[T#PIJUO\ :7MI;$W$L>P2R*25&_(7W&WBJMWXHU'4 M[*-5@CM,21"0;V\QR2,[,=5[$FM/7M5U&'7H/L,$\UI9[3<^7@#2 I MSQ0!!IOAG6;1+7[3/9W+I%(C9+*(RSY!0>PXI)?"FK.73[;#ASN6XRWFP8_A M3V/?ZT-XLU39/NM+81NI,$BLV /,V MZ<2P[\5=TW0-3L=7M9VGMWMTC*S%@ M6D8]MI/W1["LY/$NLPQQQVUI!*I)+-.6SDS%!T[8YJ27QIJ$0L%^P0O)+*$N M$5F!0&39N7/4=Z -[1O^0CK/(_X^A_Z *V*Q]&_Y".L\C_CZ'_H K8H **** M "BBB@ HHHH **** "BBB@ HHHH **** "BBB@ HHHH **** "BBB@ HHHH M**** "BBB@ HHHH **** "BBB@ HHHH **** "BBB@ HHHH **** "BBB@ H MHHH **** "BBB@ HHHH **** "BBB@ HHHH **** "BBB@ HHHH **** "BB MB@ HHHH **** "BBB@ HHHH **** "BBB@ HHHH **** "BBB@ HHHH **** M "L?Q2VWPU>MM9L*IPJEC]X=AUK8HH P?[?T4.[>7)O<8=OLKY8>AXYH.N:( M5C4Q/MBY0?9&POTXXK>HH P'U[1)'C>2)V:,Y0M:.2OT^7B@ZSH3!XS Q63E MP;1L-WY^6M^B@# .OZ$"KM&P\M<*QM&^4?EQ3H_%.BS*7B>217ZLMNY#?CBM M6^_Y!]S_ -3W;_ -"- $W]O:,4*&.3:1L(^ROC'ITZ4H\0 M:.J!0D@5?E %J^!C\*W** ,/_A(]''02_P#@*_\ A2-KNBEU=HG+1\J3:-E? MIQ6[10!A>';A+JZU::,2"-KKY2\93/RCUZUNT44 %%%% !1110 4444 %%%% M !1110 4444 %%%% !1110 4444 %%%% !1110 4444 %%%% !1110 4444 M%%%% !1110 4444 %%%% !1110 4444 %%%% !1110 4444 %%%% !1110 4 M444 %%%% !1110 4444 %%%% !1110 4444 %%%% !1110 4444 %%%% !11 M10 4444 %%%% !1110 4444 %%%% !1110 4444 %%%% !1110 4444 %%%% M %>^_P"0?<_]!?^12M/JW M_H1H Z.BBB@ HHHH ***YB\\1ZA/K-SIFAZ>ET]H ;B:5]J*QZ(/?% '3T5S MFG>,M/N-*^U:@1I\R2M!+!*P)20=5R.IJ_%XBTF;2VU)+V+[,C;&8GD-_=(Z MY]J -2BLC_A)]&_LO^TFOXEM?,$3.QQM<_PGT--D\5Z+$;???1K]H 9">@!Z M$^@/O0!LT5SH\86+>*+K0%CE%U!"LHD*_(V[/&?PZU+'XHL8-&L[W4+F&-[E MP]3[4/XDTE-,CU WD9 MMY&VH5Y+-_=QUS[4 :M%86L^)8M-TZSGM8&N[B^D6*TA4[=['D9)Z"G66K7U MO9W-QX@MH;%(<%9%E#*X/]>U &W162GB;1VL#>F_B6 /L9G.-K>A]#5#5/&^ MDZ=X=N=:1VN8;=U1TB'S D@YFN?+2<;D#*0Q'Z4/ <^8"<9'KUH U:*SKK43;ZM!:GRQ&\;2,2?FX M]*BL_$NCZA>"UM;^*65AE0IX;U /(DSX&#T4GH">Q/H: -6BLB;Q1HUO?FQEOXEN%D$ M3(3]UB,@'TS5'_A,[)]>U#14CD%U:1&337B>1/S$R?-O'J,>E &I145O<0W=NEQ;RI+ M#(,HZ'((J6@ HHHH **** "BBB@ HHHH **** "BBB@ HHHH **** "BBB@ MHHHH **** "BBB@ HHHH **** "BBB@ HHHH **** "BBB@ HHHH **** "B MBB@ HHHH **** "BBB@ HHHH **** "BBB@ HHHH **** "BBB@ HHHH *** M* "BBB@ HHHH **** "BBB@"O??\@^Y_ZY-_(UB>!?\ D4;3ZM_Z$:V[[_D' MW/\ UR;^1K$\"_\ (HVGU;_T(T ='1110 4444 %<9):Z[X=\0:E>:7I0U2T MU)Q,R+.L312 8YW=1@=J[.B@#S"]TK4-)72I[BSAO=3O=2>[FM@0%W%0-H)X MR!CFENO!^L7VDW=X;-;>ZGU-;X:?'*O"@ 8W?=W<=>E>F-&CLK,BL5.5)&>1^$KF?2X0=*:*:35H;JXBN9TDRBGD_+P?I4/C3P]X@U2ZOK:RLA-93 M6Z);^7)'&L; \[@1D_A7I-% ''#2=3M/%LEW'8+/;7EA';22B55\ED!Y(/)S MGM69:>']:T:WT&[32HM0FL[1[::U$JKL).0RLW'UKT2B@#@M+\*7T,FDRW=K M 0ES-HNE?:9SJ\UW:>3.D;0AONN,\?A7H5% M '&7^BZ[<:%H5WF*;6=-D6:6-B )N#E<] ??I5;7K+7O%>B()]&?3YK2Z2=+ M+8[:WA5-06U-J-P 2Y*$ @%&'X\D5W%% '*Z M_H&I:YXET]TO)K&QLHFE2> J7:8G;M((/&TUB6?@[5+6.'2YT%[8VNI?:8IY MW7U>C2:?933B>6SMY)ATD:(%A^.* MLT <'<>%+QX/$6+.!I;R]26W8L-S(JJ.3VZ&IKC1]5CU_4'BTY);>^TX1>?Y MJ@QR 8P0>3GUKMJ* .0TSP[<1ZQIMQ=VL+1V]AY#%B&VOW K$_X1[Q'9^'=$ ML(K3S8X%F6Y@AEC5@68E3N;MST%>E44 8/@O3+K1O!^FZ=>H$N((RKJ&# '< M3U'UK>HHH **** "BBB@ HHHH **** "BBB@ HHHH **** "BBB@ HHHH ** M** "BBB@ HHHH **** "BBB@ HHHH **** "BBB@ HHHH **** "BBB@ HHI M-P]1^= "T4FX>H_.CH_.CO]X?G1O7^\ M/SH 6BDWK_>'YT;U_O#\Z %HI-Z_WA^=&]?[P_.@!:*3>O\ >'YT;U_O#\Z M%HI-Z_WA^=&]?[P_.@!:*3>O]X?G1O7^\/SH 6BDWK_>'YTF]?[P_.@!U%-W MK_>'YT;U_O#\Z '44W>O]X?G1O7^\/SH AOO^0?<_P#7)OY&L3P+_P BC:?5 MO_0C6U?.O]GW/S+_ *IN_L:P_ S*/"5IEUZM_$/[QH Z6BF[T_O+^=&]/[R_ MG0 ZBF[T_O+^=&]/[R_G0 ZBF[T_O+^=&]/[R_G0 ZBF[T_O+^=&]/[R_G0 MZBF[T_O+^=&]/[R_G0 ZBF[T_O+^=&]/[R_G0 ZBF[T_O+^=&]/[R_G0 ZBF M[T_O+^=&]/[R_G0 ZBF[T_O+^=&]?[P_.@!U%)O7^\/SHWK_ 'A^= "T4F]? M[P_.C>O]X?G0 M%)O7^\/SHWK_>'YT +12;U_O#\Z-Z_WA^= "T4F]?[P_.C M>O\ >'YT +12;U_O#\Z-Z_WA^= "T4FY?[P_.CH_.CH_.EH **** "BBB@ HHHH **** "BBB@ HHHH **** "BBB@ M HHHH **** "BBB@ I"0.I I:P]:MH;S6-(MKA-\3&4E"2 2%&.E &WO7^\/ MSHWK_>'YUE?\(UH__/BG_?3?XT?\(UH__/BG_?3?XT :N]?[P_.C>O\ >'YU ME?\ "-:/_P ^*?\ ?3?XT?\ "-:/_P ^*?\ ?3?XT 1^(A'-;V4+L#'+>1HZ M[L;E.CI:2LMB@948J0S<''UH D_P"$9T;_ )\E MY&/OM_C1_P (QHW_ #XKR,??;_&IM!).@6!8DGR%SD\]*T: ,@^&M%'6S3D8 M^^W^-)_PC>B<_P"B)R,?ZQO\:JIIEGJ7B#5C>0+-Y?E*F6/ *_6KG_",Z-_S MXIR,?>;_ !H ;_PC>B<_Z(G(Q_K&_P :/^$;T3G_ $1.1S^\;_&G?\(SHW/^ M@ISQ]YO\:/\ A&=&Y_T%.>/O-_C0 W_A&]$Y_P!$3GK^\;_&LB;PSH=SXF^S MS6:/$MGO">8V-V_&>OI6S_PC.C<_Z"G/^TW^-,_X171/.\[^SX_,*[<[FZ?G M0!5_X0CPQ_T#8_\ OZ__ ,51_P (1X8_Z!L?_?U__BJN_P#"-:/_ ,^*?]]- M_C1_PC6C_P#/BG_?3?XT 4O^$(\,?] V/_OZ_P#\51_PA'AC_H&Q_P#?U_\ MXJKO_"-:/_SXI_WTW^-'_"-:/_SXI_WTW^- %+_A!_#!_P"89'_W]?\ ^*I? M^$%\-?\ 0+3_ +^/_C4>K:/I^GI9SVMN(I1=Q+N5CT+=.M=-0!SO_""^&O\ MH%I_W\?_ !I/^$(\,?\ 0-C_ ._K_P#Q5:6O2/%H-])&Q1EA8A@<$56@\.:0 M]O$S62%BH).YNOYT 5O^$(\,?] V/_OZ_P#\51_PA'AC_H&Q_P#?U_\ XJKO M_"-:/_SXI_WTW^-'_",Z/_SXI_WTW^- %+_A"/#'_0-C_P"_K_\ Q5'_ A' MAC_H&Q_]_7_^*J[_ ,(UH_\ SXI_WTW^-'_",Z-_SXI_WTW^- '.:5X(\,7: MWKW&FQNRW>$CTTB,_]M9/_ (JM+_A&M'_Y\4_[Z;_&JUK:0:=XG6WM M$\J&2T9VC!)!;/G_IK)_\ %5G:9\._!DMDS)I *"1U MR\DB]&/'WNE=Q7,70^U_V;;3SK=0S7#/^@/%_W^D_^*K7_P"$9T8?\N*?]]-_C1_PC.C8Q]A3'^\W^- & M1_PK;P9_T!XO^_TG_P 51_PK;P9_T!XO^_TG_P 56O\ \(SHW_/BG_?3?XT? M\(SHW_/BG_?3?XT <]J7P[\'P:7=2QZ1$KI$S*1/)P0/]ZIK/X?>$9;&WD;2 M8BS1J2?.?GC_ 'JV9/"VB2QNCV"%7&&&YN1^=*OA?14556P0!1@?,W3\Z ,O M_A7?@_\ Z!$7_?Z3_P"*H_X5WX/_ .@1%_W^D_\ BJU?^$9T;_GQ3IC[S?XT M?\(SHW_/BG3'WF_QH RO^%=^#_\ H$1?]_I/_BJ/^%=^#_\ H$1?]_I/_BJU M?^$9T;_GQ3IC[S?XT?\ ",Z-_P ^*=,?>;_&@#,_X5SX1(R-'C_[^R?_ !5' M_"N/"7_0&C_[^R?_ !5:'AY1%'?VZ B*&[>.-2<[5 ' ]JV: .5/PY\(#KH\ M8_[;2?\ Q5)_PKOP?_T"(O\ O])_\55M[&VU/Q+>QWD?G+#%$8U9CA!?"]K=Z;Y&F1IYER$?$S\C:>/O5TO_",Z,,?Z"G'3YF_QIC^$]#D:,MI M\9,;;D^9N#^= %/_ (07PM_T#(_^_K__ !5'_""^%O\ H&1?]_7_ /BJO_\ M"-:/_P ^*?\ ?3?XT?\ "-:/_P ^*?\ ?3?XT 4/^$%\+?\ 0,B_[^O_ /%4 M?\(+X6_Z!D7_ ']?_P"*J_\ \(UH_P#SXI_WTW^-'_",Z/\ \^*?]]-_C0!0 M_P"$%\+?] R/_OZ__P 53O\ A _#'_0*3_OX_P#\54M_X?TJ#3KJ:*T5)(XG M=&#-E2%.#UK4TQVDTJS=V+,T"$L>YVB@#&_X0/PQ_P! I/\ OX__ ,52?\(+ MX7!YTN/_ +^O_P#%5TE%]"@\1W<$5DBPBWC8+YK8 MR2>>M;'_ C6A_\ /FG_ '\;_&@>%-#68RC3X]Y4*3N;H.G>G_\ ",Z/_P ^ M*?\ ?3?XT ,_X1K0_P#GS3_OXW^-'_",Z'_SYI_W\;_&G_\ "-:/_P ^*?\ M?3?XT?\ "-:/_P ^*?\ ?3?XT ,_X1G0_P#GS3_OXW^-*/#.B'I9(?\ MHW^ M-._X1K1_^?%/^^F_QJE?:99:75.;_&C_A&M'_Y\4_[Z;_&@!G_ C. MA_\ /FG_ '\;_&C_ (1K0_\ GS3_ +^-_C3_ /A&M'_Y\4_[Z;_&C_A&M'_Y M\4_[Z;_&@!G_ C.A_\ /FG_ '\;_&F^&-D>D&,'"I/*J@MG #'%3?\ "-:/ M_P ^*?\ ?3?XU%%X2T*&/9'I\87).-S=3U[T ;.]?[P_.C>O]X?G63_PB^B_ M\^"?]]-_C1_PB^B_\^"?]]-_C0!K;U_O#\Z-Z_WA^=9/_"+Z+_SX)_WTW^-' M_"+Z+_SX)_WTW^- &L"#T.:6L+P]!%:W6K6\"E(8[D!5R2!\HZ9K=H **** M"BBB@ HHHH **** "BBB@ HHHH **** "BBB@ K(U#_D8=&Y_P">W'_ !6O6 M1J'_ ",.C>*5AFD@@MO,DCF>-@T@4810Q.?H>E36/B2"_U M"2W1/+CBB\QVD;:P]\=Q[U#>>$M-NYY);PF1'F>4JQP S*%_3%1W7A,7_EK= M79=(HFC0A<. PP>?3 '% %[3-?AU+3+B\2-D\AV1T)YR*JV'BVRG;I;0>3#<1"-HUZ9&?F^II+;PS86D=HD*!%M]_" MC[Q8
QG486-2>H_B/-23>"+&2V\II=\N(BOF#*EH\X)7N.>E M %^]\4Z=;3V$,-Q%/)=S(BJK]%;.&^G%3R>)-(2VFF&H0,L)VMA^C8) ^O%9 MJ>#XEN;:1)UB2+RV:.&,*"R @;?[HYZ5!!X)BMQ,R7@%W+(CB0QC!V@@97N< M,]CM! *G/'7FK]AH_]D:5>1^8IWHQV1)LC7@_= M7M[T 6?#_P#R+]AQC]PO\JTJS?#_ /R+]AQC]PO\JTJ .6;6[/2/$NI+>2+$ MLQBPYZ#"=ZT+?Q1I4L$,DEW'$TP+(C-RP'>JD&FQ7?BO4KA^L1B !&0PEAC:[FBM)9)GBCC>09;:VW(^IJB_@NWDN;>X=H97@)51+#D;"V[&,_>SWH MD\%69N+>=?*DDB9O^/B/>,%]_'/!SWH WK;4[*\\[[/=12^0Q67:V=A'4&L^ MQ\46%U%,\SBV$<_D#S#]]NV/K3;;P^MLNH!IXXUO R%(4V* W4D=VYZU!#X. MTZSO[2YMOW*6Z &,=)&' 8^] %]?$VB/YNW4[<^2-TGS_=&<<_CQ2GQ)HP,( M_M*WS.-T7S_>&<$[1( MH@1&C(J#$,>U339O!\#7=U/%.4%Y\M MPFT$%,=%_NGW% #]8U*ROH(8[6YBF>&]A$@4YV_-715R%YH:Z44G61=LMW H MC1-HX;@GU;WKKZ ,SQ%_R+M_T_U+=:KZEKL&A6-A)<1NT"((+!;*.]F\EE*2EN6=2>!GVI8? M!-G!%)M%2.*1M2M MPLI(0EOO8.#^M5Y_"UA(EU''F(3QJF%_AV]#4/\ PB,$D+":;=*ZMO<( ,LP M8X';I0!:A\5:++%)*;Z.)8YS;DRG;\X.,"IG\0Z/&LC/J, 6,X)\3O*BS1;E&\Y8$=_8]J?<>#X)-(_L^*41H93(R[ 4((P5QZ<\4 ;,. MK:?<70MH;N*2&4L+ZWFBF58[>% M(EVIB1PHP [=Q[5._P#R-\(S_P N3_CM[^VM&5B]QG:1T&!FJ%EXEL M9[6&6ZECM9)I7BCC=^6*L5X^N*L:CILMW>V=U!<"&2W8DY3<&!&"*QKCP1!< M"U1[IVCAD,FUESSOWY4]CV^E &[!K&GW4T\-O=1RS0*6D1#DJ!Q5,>(8F;32 M(2([TR#>SJ4:.-<8VJS%CD]SD]:KQ^&'\B"*6^ M8BV,ODF--I4.".?7&: +Y\1Z,+;[0=2M_)#E-^_C<.2*@U?Q"FF ")UDC: M9F#@811DD>I]JR[?P/;PV[B&Z E>5F=E0;2&7:WR^N._K6E?^%['48K59=Q- MK$8X7)R4.,!OJ* +:Z_I1?RS?0I*(_,:-FPRKC)R.W!H;7])6*"4ZA $N#B) MMW#_ $K*'@^W34;B\46TDEPI\QIH=S%BH7KGIQTI$\'1HA"W1'G1^5<*$&WR M_P"[&/X* +K>+=$6_ALA?QM++NQMY VCG)[5J6E[;7\/G6DZ31Y*[D.1D5C+ MX7B@AL4MI54V8=$,D88,K#!#>M7=%TD:/:R0B0,'D+A57:J9[*.PH CT+_6: MKP1_ITG\A6O61H7^LU7C'^G2?R%:] &/9_\ (TZGT_U,/_LU;%8]G_R-.I]/ M]3#]?XJYO5O$6IZ9KMVCNS6,LJ10L%_U3_W??=_2@#O**Y"V\974RR3R:--% M9H<_:&<8V>I'4'/:KNF>)&UB&[,-L8C;QGS"SVZ ME4NI8D6!L[@&P,CM4L_B2]MM?TV*>!1]KA8%(YMT2D,,$MCKB@#L:*YR75+A M)_$""49M1&85/;*9/ZU&][->W]C:/?-;PO8BY:2)MI:3(&,^GM0!N:K_ ,@> M]_Z]Y/\ T$TFE?\ ('LO^N"?^@BFWY_XD5T=^[_1G^8#K\IYIVE?\@>R_P"N M"?\ H(H N5RNC:I)#90V-I:FXN/WDSC=M 3S&'![G/:NJKE-%TN66T@OK2X- MO/\ O(9-R[@R>8QX]#GO0!LG7]*626*2^A26)=TB%N5^M5;[Q7I-IIAO([N& M;<"8D5_]81V%5E\'6_F1+).[V]LYDMTQ\RD_>W-_$#[TEQX/@DN;J:*Y:/[7 M\LXV@Y7' 7^[0!H+XDTG:?-OH(Y$16D0MRN13[_7;+3[>VN995^SW#A5E[#/ M>LE/!=LJV\,EPS6UFP:U7:-R>NYOXOQK:NK&WOGMOG4_9WWA1@@_A0!4MO%. MDSQ)(UW%&LDACBW-]_'<58/B#2%BEE.H0;(7"2-NX5CT!K,E\(0-+,TIH NQ^+-*-R+::Y2&8KOVL> /K1J]S M#<-IQAE5PFHHC;><, <@U7E\*1+'((I-XDA>-USTY[8J)=-?2-(T.TE?S M9Q>QF:7N[X.6- '4UD>)_P#D7+SI]U>O^\*UZR?$PSX=O!C/"\?\"% &JOW1 M]*6N)N]6U*U\5Y\TBQ$R1%=_&"A)^3\/O4^#QM=74U '9T5RB>,9'@DN/L $,44;R9D^;1*BQW"J(D?("^27/..Y%*GC6Y:%1_ M9L7VA\%%%Q\A4IOY;'!QVH [*BN'7QGJ2M>N=,$RAXDMHD?#$L@8Y]O>M*U\ M47%RTA?3OLT=O&6G^T2[64XS\H_B'O0!TU%<9;>-+R^VQ0Z4$G:X,)#S8 7R M]^\''/':I+7Q;,3&ILR\*2K#,YD^?LC4/^1AT;D_\ +;_T 4 4];$7]L0-JN_^ MR_+.S&=@E_V\>W3WK*N-;UY)[R*S7_5))Y4+P995"C8Y/<$YXKMR 1@@'ZT8 M&5=%5E$:+;[,LJ*5.<^I/Y4MIJ_BB>&V;?:3-^^:3R(R MP;:!M3G[IR3^5=Q2 = !]* .+.IZCBVNQ/]LV07!>2.WVA&&,+C/.*SX]2U M^Y6/4FMUFO;>*Z6(QH0C@;=I_G^5>B8 & !1@#H* .(@UW7A;Z?+/VSZXP:ZIYTNM)DGC#;)(2P##!QBK M>!C&*@O/^/&?C_EFW\J *GA__D7[#C'[A?Y5I5F^'_\ D7[#C'[A>/PK2H R M-._Y>.\/_ *!6O61IW_(P:SQWA_\ 0*UZ "BBB@#F_%RMY%G.LHW0REUM MV!VW!QPA(Z'T]ZH:[/JFL06EMIUK(DT2"XG21RF"!\JY[G=79$ ]0#2T 4-) MU#^T+0%T9)HP%F!7 #X&<>V:OT8HH **** ,?Q%_QZ6G)'^F0]/]ZMBL?Q%_ MQZ6G)'^F0]/]ZMB@#,\1?\B[?]/]2W6KUM_QZ0_[B_RJCXB_Y%V_Z?ZENM7K M;_CTA_W%_E0!+1110 5R0N&TWQ9=3,'N89(V>1MIWVX!&!_M*<\>E=;28'H. M: .+CNM5@\3-JT]LXTZ5S:A58YQ_"^WT]Z[..02QJZYPPR,BG44 %%%% !6. M_P#R-\/)_P"/)N/^!BMBL=_^1OAY/_'DW'_ Q0!L5S&0USHY%P\_^FS?/(,' MHW'X=*Z>N:D,AN]'\R6)V^V2\PCY<8;CZT =+1110 5%=*6M9E#.A*$;D^\. M.H]ZEHH XW1=2DT[3;NW2 W#H[BWGC4XN&"YY'8YXJ3PQ-J&F336.J0N&G;[ M1$RN7"AOX2>Q!KK< = *7% !1110 4444 9&A?ZS5>,?Z=)_(5KUD:%_K-5X MQ_ITG\A6O0!CV?\ R-.I]/\ 4P_7^*M-K6!R2T*,2P8Y7N.AK,L_^1IU/I_J M8?\ V:MB@"HNF6*232+:QAI_]:^M3);PQ%S'$B[_O8&,_6I:* ,YM#TTV MTL"VJ(DIRVP8YIRZ+IJQ11BSBV1-N0;>A]:OT4 5EL+19))%MXP\ARYV]:;' MIEE% ($M8A$O1=O YS_.K=% %233+*:Z-S);1M,5VER.2/2F#1M-%JEL+.+R M8VW(F. :O44 4]4P-'O0. +=^G^Z:-*_Y ]E_P!<$_\ 012ZK_R![W_KWD_] M!-)I7_('LO\ K@G_ *"* +E8_AC_ ) =?.IE>+=B,(" .>A.:[6B@#A MG\1:V]O-M:WMY(8X]TD\9";RY#+]< ?G6IH%YJ-QK%Y]MGD\J2-'A@DBVE!W M-=(54]0/RI<#.<4 %%%% !61KOW]+XS_ *?'_(UKUD:[]_2^,_Z?'_(T :]9 M'B?_ )%R\XS\J_\ H0K7K(\3\^'+SC/RKQ_P(4 7!IUF;O[8;:,W)7:9".2* M6#3;*V0I!:Q1J6W85>_K5E?NCZ4M %;^S[3SA+]GC\P)Y8;;_#Z4L-C:V]M] MFBMXTASG8!QUS5BB@"":S@G60/&N9 0S <],=?I56#0]-M[!;)+2,P+@[6&< MD=S[UHT4 59=-LI_,\VVC;S%"ME>H'04@TRR#QN+:/=&A1#CHIZBK=% %6#3 MK.V4+#;1(%)8 +T)XI?[/LQ<1W MH_-C4JC[>0#5FB@#'T;_ )"6L\G_ (^A M_P"@"MBL?1L_VEK/.?\ 2A^'R"MB@ HHHH **** "BBB@ HHHH **** "BBB M@ HHHH **** "LS5--NKVZL[BTOOLLEL7ZQ!PP88[UIT4 8WV#7/^@W'_P" MB_XT?8-<_P"@W'_X"+_C6S10!C?8-<_Z#X^ MM;5% %73;,Z?IMM9F0RF&,(7(QNQWQ5JBB@#%DTC4%U2\O+35!"MR$S&UN'V ME1CKFE^P:Y_T&X__ $7_&MFB@#&^P:Y_P!!N/\ \!%_QH^P:Y_T&X__ $7 M_&MFB@#&^P:Y_P!!N/\ \!%_QH^P:Y_T&X__ $7_&MFB@#&^P:Y_P!!N/\ M\!%_QH^P:Y_T&X__ $7_&MFB@#&^P:Y_P!!N/\ \!%_QH^P:Y_T&X__ $7 M_&MFB@#"GT;5+LP"XU@-'%,DI5;91NVG.,YXK=HHH K:A:"_TZXM"^SSD*;L M9QFLY=.UI$5%UI,* /\ CT7_ !K:HH QOL&N?]!N/_P$7_&C[!KG_0;C_P# M1?\ &MFB@#&^P:Y_T&X__ 1?\:/L&N?]!N/_ ,!%_P :V:* ,;[!KG_0;C_\ M!%_QH^P:Y_T&X_\ P$7_ !K9HH QOL&N?]!N/_P$7_&C[!KG_0;C_P# 1?\ M&MFB@#'^P:W_ -!N/_P$7_&GV>EW46I?;KN_^T.(C$JB(( "<]JU:* "L'^R MI[NUMWA8:?/;W$DB *) 6LRKYK\2]<[CG\/2@"M]@U MS_H-Q_\ @(O^-'V#7/\ H-Q_^ B_XULT4 8WV#7/^@W'_P" B_XT?8-<_P"@ MW'_X"+_C6S10!C?8-<_Z#V>HBW M,R*C(8 _WF_8-<_P"@W'_X"+_C6S10!C?8-<_Z#L3P20R:TA212K8M5!P1CUK6MH!;6D, 8L(D5 3WP,5+1 M0 5A6^C:I9Q>3:ZPJ0AF95-JI(R2>N?>MVB@#&^P:Y_T&X__ $7_&C[!KG_ M $&X_P#P$7_&MFB@#&^P:Y_T&X__ $7_&C[!KG_ $&X_P#P$7_&MFB@#&^P M:Y_T&X__ $7_&C[!KG_ $&X_P#P$7_&MFB@#&^P:Y_T&X__ $7_&C[!KG_ M $&X_P#P$7_&MFB@#&^P:Y_T&X__ $7_&D.D7\]Q;/>:H)HX)5F"+;A/PZ5?JEI@D%HWF"$-YC_ZKIC)Q^/K0!=HHHH **** M"BBB@ HHHH **** "BBB@ HHHH **** "BBB@ HHHH **** "BBB@ HHHH * M*** "BBB@ HHHH **** "BBB@ HHHH **** "BBB@ HHHH **** "BBB@ HH MHH **** "BBB@ HHHH **** "BBB@ HHHH **** "BBB@ HHHH **** "BBB M@ HHHH **** "BBB@ HHHH **** "BBB@ HHHH **** "BBB@ HHHH **** M"BBB@ HHHH **** "BBB@ HHHH *H:1&L=DRK;&W'FN=A.<_,>?QZU?K/T8H M;%O+DFD7SI.9>N=QX^GI0!H4444 %%%% !2$A022 !U)I:P/&RW#^#-56VW^ M8;=L^7][;CG'OB@"W;>(]'O+XV5OJ,$EP#@(K_>/L>A_"M2O,-7DT"X\-:#; MZ+]D?4!<6_D);;?-C.1N)QR/?-0ZAJ]XMUK]POB%X[VQU$1V=C\OSC:ORXZD M')^E 'JM%>5:EK'B"]U^_2&Y6UN+61%M(I)5C1N 22"E0/?6T;P(TR[ISB+'.ZO,-* MU&[U9]U 'IE%>6V&L7KKI&JC6WEU.[OU@N=-&,(A)!79U&,#YJE^VZJC7NLG5Y MB(-<>V2V(&SRL@;30!Z;6=?:]I6FSK!>7T,4S=$+9(]R.P^M.WAU M"_>Y^T2E;9;:0%(E[)(G4'WQ4>@SZ/!KWB)-=DM(]2:\.#=E5+P?\LPI;J,> ME '?HZR(KHP96&00>#2UY5J^K:S<^)+ZVL+N.S2T\D6*F18T(/4X)&X']*NZ MI/J]QJ?B.X&K36W]F1VK101@% [+EL^H- 'HWF(9#&'7S ,E<\X]<4ZO-"B+ MX_\ [4DNG2[ETGSXH?,PLK@= ._TJKXJU!:7D%[#YUO('CW%<@=P<&N>\$PWDFDIJ-]J4UY-U^UZM=12O$HRR*7(7]* /3Z@M+RWOX//M9EEBW%=RGC M(."/S%8/@VZN9;*\M;FY:Y-IU 'K]%>?V]Y<7^KZA>G5;N*PL;5)T@506SLR2?4X[5EZ) MXEU#^U+Y[6>:XBDTU[J*&:19&,@R1PI.W/\ =H ]0FFCMX))I6VQQJ69CV Z MU6?5K-='?5?-!LUB,ID _A'>O-=&OM:O8'N);Y)8)[&5KV)YE9E;;D;5!RN# MQ6SJ;R#X66NW[KK&LF/[A;G]* .DNO%.EV26C7,WE?:4#H&Z[3T^OT%7(=5M MIM4DTY2PG2%9L$<%"< BL35O!.C^(WT^ZNA)NMHU$>QR/E'3'I]13-07R?B% MX?2'.#;3K+SR5"C;G\: .LHHHH **** "BBB@ HHHH **** "BBB@ HHHH * M*** "BBB@ HHHH **** "BBB@ HHHH **** "BBB@ HHHH **** "BBB@ HH MHH **** "BBB@ HHHH **** "BBB@ HHHH **** "BBB@ HHHH **** "BBB M@ HHHH **** "BBB@ HHHH **** "BBB@ HHHH *HZ4SO9L7N$G/FN-Z# ^\ M>/PZ5>JEI:R+:,)88X6\Q_EC.1C<<'ZF@"[1110 4444 %'48-%% %&VT72[ M*Z:ZM=-M(+A\[I8X55CGU(&:I6/A;3;/4;R_>"*XN;FY-R)98E+1D@#"G&<< M5MT4 4[G2--O+E+FYL+6:=/NR20JS+]"1FI_LT \S$$?[W_6?*/F^OK4M% % M.TTG3; L;.PM;82@^?'3/KBIJ* *SZ?927$-P M]I TT Q%(8P6C'^R>WX5'%H^F073W46GVL=P^=\JPJ&;/7)QFKM% #(XHX8Q M'$BH@Z*HP!4:65I'LV6T*^6Q=,(!M8]2/0FIZ* &1PQ0[O*C1-QRVU0,GUJK M-HVEW$4<4VG6DD<;%T5X5(5CR2!C@U=HH B6V@0L5AC!<;6(4N2!S2W^F6^H M:1<::RB.":(Q$(,;01VJ[10!!9V_V2R@MO,:3RD"!FZG Q55-'B7Q!+J[2,\ MKP"%4(&$ ))(]SFM&B@ HHHH **** "BBB@ HHHH **** "BBB@ HHHH *** M* "BBB@ HHHH **** "BBB@ HHHH **** "BBB@ HHHH **** "BBB@ HHHH M **** "BBB@ HHHH **** "BBB@ HHHH **** "BBB@ HK)AAFFU>Z==4D*1 M. ;95&%^7H2?SJ;^S[GRMG]IW&[S-^[:NG2@#0HJB]C<,;C&HSKYH&S" MK^[^G'\Z7[%/YRO]OFVB/84PN"?[W3K0!=HJ@EA/'6@"[16>NGW(CB4ZG<$I(69BJY@X_G0!?HJD;*X,KN+^8*T>P)A<*?[W3K34L;A?LV=1G;RB=^5 M7][]>/Y4 7Z*SSI]R82G]IW 8R;]^U<@?W>G2G/8W#&X(U"=?-&$ 5?W?N./ MYT 7J*I+93B6-S?S%5CV%2%PQ_O'CK34L+E8X%.I3L8V+,Q57VKEA_=/'2@#0K/T8(+%O+AFB M7SI/EEZYW'GZ'M3GL;AA< :C.OFD%,*O[OV''\Z9;Z;<09SJ=S("I&'"GD]^ ME &C15".QN4%ONU&=_*SORJ_O?KQ_*D_L^Y\ID_M.XW&7>'VKD#^[TZ4 :%% M47L;AFN"-1G42J @"K^[]QQ_.E%E<":-_M\Q58RA3"X8_P!X\=: +M%4%L+D M) IU*AXZ4CZ?]E< M.UP5U"91*FU %7]V?4/'6F)I]RL,* M'4[AF1RS.57+C^Z>.E &A15!K"Y*W &I3@RN&0A5_=CT''3ZTXV5P9Y'&H3! M6BV!,+A3_>''6@"[15%;&X5[9CJ,["($."J_O<]SQ_*FG3[KR53^T[C<)=Y? M:N2/[O3I0!H450DL;AQ0@,<#@@?6@"]1110 M 4444 %%%% !1110 4444 %%%% !1110 4444 %%%% !1110 4444 %%%% ! M1110 4444 %%%% !1110 4444 %%%% !1110 4444 %%%% !1110 4444 %% M%% !1110 4444 %%%% !1110 4444 4K,2?;;[?'"JEUV,A^9AM_B]ZNU0LD M"W^H,+=XRTBDNQXD^4*IU/3R;>21@SXD4\1_+W^O2K]4+UXUU/3E M::1&9GVHHX?Y>_TH OT444 %%%% !1110 4444 %%%% !1110 4444 %%%% M!1110 4444 %%%% !1110 4444 %%%% !1110 4444 %%%% !1110 4444 % M%%% !1110 4444 %%%% !1110 4444 %%%)N7U'YT +12;E]1^=&Y?4?G0 M M%)N7U'YT;E]1^= "T4FY?4?G1N7U'YT 4+%HVU'40DTCLLB[E8<)\HX%:%5; M=)DN;IY9$:-V!B '(&.<_C5GAHH *** M* "BBB@ HHHH **** "BBB@ HHHH **** "BBB@ HHHH **** "BBB@ HHHH M **** "BBB@ HHHH **** "BBB@ HHHH ***J7>IV-@RK=W44+,,J';&: += M%9G_ D6C?\ 02MO^^Q1_P )%HW_ $$K;_OL4 :=4KIG&H6(6:-%+/N1A\S_ M "]JA_X2+1_^@E;?]]BJ=UKFDO?V,@NK.149R9#)S'\O4?7I0!OT5F?\)%HW M_02MO^^Q1_PD6C?]!*V_[[% &G169_PD6C?]!*V_[[%'_"1:-_T$K;_OL4 : M=%9G_"1:-_T$K;_OL4?\)%HW_02MO^^Q0!IT5%;W,-W;I<6\J2PR#*.AR&'M M4M !1110 4444 %%%% !1110 4444 %%%% !1110 4444 %%%% !1110 444 M4 %%%% !1110 4444 %%%% !1110 4444 %%%% !1110 4444 %%%% $5T2+ M28CJ(V_E7&OINGVO@V/4_L227/E(Q,KMR2P!SS[UV-W_ ,><_P#US;^59>E6 MD-]X3L[:=28GA3<,^F#_ $H Y!$B3S+J:QLVM3=S6J1*'#C:"0Q.>>E3^$8[ M/6F9+_3X4=H$FC 1X\@CG&3\PSWKHK?1]&_M.:))S+*&:4VYDR(V?JP'8FKN MF:%::6P>-I975/*C:5MQC3^ZOH* .)@-M$PO+VRM#8->36VR,.'0)NPV<\_= MJW9WGAB[17_LS$;MA'61F#?(7'.>N!TKI8?#.G13O(5DD1G=Q#(V41G^\0/4 MY-*OAK3UTXV!$C0;E9 3RF.@'MVH Y:6\\.2R2VUMIP$PMR^6D;*,4+KE<], M=Z?!)H4=G#+<:7NCCBB%S.)&&V1U! "YY!SUKJGT&P:]FNMA1ITV2JN K\;0 M3[XXJN/#FER,3%G8%57B#91F484L.Y H YYKOP]$DK2:+(H*JT0WL3("^SUX M^:G)/X?1C]LT9[9%,BLS2,<,B[B.O(QWK;L/"5E:V^R=Y+B0X^=S]T!M^!Z# M/-7)-'TRXF998UD8,TC(Q_O#:?S% '*0W?A^XMHI(-%,LDTA2-4F8A@$WYW? M2K.G0:7J.NFSCT6,6GV43B8S-NR3C!7-;T>C:=I]O$TCMY=N28VD8?("NW'T MQQ4]KH]G;W4=W;[U81>6,-PRYR,T 4O#EK#9W.KP6Z!(ENN%#$X^4>M;U8^C M?\A'6>G_ !]=O]P5L4 %%%% !1110 4444 %%%% !1110 4444 %%%% !111 M0 4444 %%%% !1110 4444 %%%% !1110 4444 %%%% !1110 4444 %8LL< M!^OWQ0!H_9+;_ )]XO^^!1]DMO^?> M+_O@5-3!+&TC1AU+J,E<\B@#SV&XNHM'&K&[:6;^T/)^SNJF,H9-N, 9X%6M M.UQ4BL ]A%;VQ_\ U5U%OX=TBUNOM,%A$DVXON&>IZG' M2D_X1S1P83]@B_"(*-T9+E-S M'OR,XI]GK>[6K;2KBSMG.11#$L(#*"H;D]^M:T6A:7#"T,=C$L;0^05 X, M><[?IDFIH-,LK:Z>YAMTCF=0K.O4@=* )?LEM_S[Q?\ ? IKVEML;_1X>G]P M58SGI37_ -6WT- &5X7&WPW9 *%PAX P!R:UZR?#/_(N67!'R'K]36M0 444 M4 %%%% !1110 4444 %%%% !1110 4444 %%%% !1110 4444 %%%% !1110 M 4444 %%%% !1110 4444 %%%% !1110 4444 %%%% !1110!#=_\><__7-O MY5GZ&KGPO9JA*N;<_\ US;^54O#W_(O6'&/W*T =6USK]Q'U6Z* ,;1?^0CK/3_CZ[?[ M@K9K&T7_ )".L]/^/KM_N"MF@ HHHH **** "BBB@ HHHH **** "BBB@ HH MHH **** "BBB@ HHHH **** "BBB@ HHHH **** "BBB@ HHHH **** "BBB M@ K(;_D<$Z?\>!^OWQ6O60W_ "."=/\ CP/U^^* ->N'UM=0BU/59;0W$;.+ M=%DB^\ 7 ;'X5VY( ))P!U-95GKUM?S,(;:Z\D%A]I:+$1QU^;- ',W%QK6E M27TT=Q>7,-G<[(XW^=I5>,8^N'-,=_$$6L6]J]U<+@1,C-+@2 G+@KCYB.1] M*[%=7TU[5[H7<)@0X9]W -*-4TZ2>.(74)E?[BYYZ9H X&^&I75O?VW" MPSQS-=0R8"KYG*['4]2$<>I10PA7^5H&"Y/3GJ>:[9=1T\ MW$]NMQ#YL0W2KG[H]Z9_:^FB))!=P^6[[%;/!;TH X>[NO$*&.T%S=+$GF)% M&X2&1.FTMWJ\NJ6#S3PK=1&2 9E7/W: ,?P3 ;71&MWFN'FCF<2).V2AW M'CZ8KHG_ -6WT-06M[:7F\VLTAJ=_]6WT- &5X8Q_PC=E@Y^0_P S M6O63X9S_ ,(Y99&/D/'XFM:@ HHHH **** "BBB@ HHHH **** "BBB@ HHH MH **** "BBB@ HHHH **** "BBB@ HHHH **** "BBB@ HHHH **** "BBB@ M HHHH **** "BBB@"&[_ ./.?_KFW\JI>'O^1>L.,?N5J_<(9+:5%ZLA _*L M'3=0GT[3+>SDTC4&>% C%(P02/0YH Z*BL;^WI/^@+J?_?D?XT?V])_T!=3_ M ._(_P : -FBL;^WI/\ H"ZG_P!^1_C1_;TG_0%U/_OR/\: -FBN?N/%0MI8 M(Y='U0-.^Q!Y(Y.,^M3_ -O2?] 74_\ OR/\: -FBL;^WI/^@+J?_?D?XT?V M])_T!=3_ ._(_P : -FBL;^WI/\ H"ZG_P!^1_C1_;TG_0%U/_OR/\: %T;_ M )".L]/^/KM_N"MBL;05G:74;F:VEMUGN-Z)*,-C:!S6S0 4444 %%%% !11 M10 4444 %%%% !1110 4444 %%%% !1110 4444 %%%% !1110 4444 %%%% M !1110 4444 %%%% !1110 5D'_D<$Z?\>!^OWQ6O5"^TF"_E29I9X9D7:)( M)-C%>N"?2@"W/$L]O)"V0LBE3CT(Q7+C2-:;0I-&=+=8E!$0'_ )"6I_\ @2:/^$?3C_B9:GQ_T\F@#G[GPOJ6ILLUQ!:V^)(>GR-_A5_P"V6?\ S\P?]]BC[99_\_,'_?8H Y77?$.E2ZAHC)=@ MA;O<2$;@;3[5M_\ "3Z-G'VU<_[C?X5!JUW:G4]'Q<08%PV?G']PUK?;+/\ MY^8/^^Q0!0_X2C1L9^W+C_<;_"C_ (2?1LX^VKG_ '&_PJ_]LL_^?F#_ +[% M'VRS_P"?F#_OL4 4/^$HT;&?MJX_W&_PH/B?1@<&]7_OAO\ "K_VRS_Y^8/^ M^Q1]LL_^?F#_ +[% %#_ (2C1?\ G^7_ +X;_"C_ (2C1?\ G^7_ +X;_"M. M.2&8$Q.C@'!*D'%/P/04 9/_ E&B_\ /\O_ 'PW^%'_ E&B_\ /\O_ 'PW M^%:DCQ1+ND9$7IEB *B^V6?_ #\P?]]B@"A_PE&B_P#/\O\ WPW^%'_"4:+_ M ,_R_P#?#?X5?^V6?_/Q!_WV*/MEG_S\P?\ ?8H H?\ "4:+_P _R_\ ?#?X M4?\ "4:+_P _R_\ ?#?X5?\ MEG_ ,_,'_?8H^V6?_/Q!_WV* (['5++4@_V M.X679]X $$?G5RL&SN[4>)]2/VF *88A%+0 4444 %%%% !17)6&H:OK.OZ]:PWZ6D.G7*0QJ( Y8% V23]:U M?[/UK_H.K_X!K_C0!L45C_V?K7_0=7_P#7_&C^S]:_Z#J_\ @&O^- &Q6/JT MER^I:?907)@2?S"[*/F.T C%']GZU_T'5_\ -?\:KRZ'JTUY;W+:Z-\&[;_ M *(O\0P>] %G^Q[O_H+7'Y4?V/=_]!:X_*C[!K.?^0V.O_/HO^-'V#6?^@V. MG_/HO^- !_8]W_T%KC\J/['N_P#H+7'Y4?8-9S_R&Q_X"+_C1]@UG'_(;7_P M$7_&@ _L>[_Z"UQ^5']CW?\ T%KC\JJ:FNLZ;ILUY_:ZR>2H;9]E4;N?K70( M=T:L>X!H RO['N_^@MX]*3_ (1R^_Z#][^E6_L& ML\_\3M?_ $7_&C[!K//_$['M_HB_P"- %7_ (1R^_Z#][^E'_".7V/^0_>_ MI5K[!K//_$['M_HB_P"-0[]3L=8L(;C4%N8;DNI7R F,+G.10!2O?!\^HVQM M[G7+QXB0<<=1S4Z^&[Y5"C7[S@8& *Z.JFJ7$EII5U<1$"2*)F4D<9 H R/^ M$_I1_PCE]_P!!^]_2IX+36I[:.7^VU'F(K8%HO&1]:D^P:SS_ ,3L M>W^B+_C0!4_X1R^_Z#][^E'_ CE]_T'[W]*M_8-9Y_XG8]O]$7_ !H^P:SS M_P 3M?;_ $1?\: *G_".7V?^0_>]?:H-(L=0N%O$EUFX?^)V/;_1%_P :K6NB:M:&XV:X#Y\QF.;1>">O?VH L_V/=_\ 06N/RH_L M>[_Z"UQ^5'V#6<_\AL?^ B_XT?8-9_Z#8Z?\^B_XT ']CW?_ $%KC\J/['N_ M^@M[_Z"UQ^5']CW M?_06N/RJK9'5]2$\R:HD")/)&L8MU; 4X')JU]@UG_H-C_P$7_&@ _L>[_Z" MUQ^5']CW?_06N/RH^P:S_P!!L=?^?1?\:/L&LX_Y#8SZ_9%_QH /['N_^@M< M?E4=E]JM?$#6,MX\\36OG ..0V['6I/L&L_]!L?^ B_XU7_L35O[1^V_VX/, M\GR@"*ZXLYC_ -,V M_E6'H>BZ9/H5E++86SN\2LS&,')]:W+K_CTF_P"N;?RKD-+\13IIFGV5G;1O M.55 9&(4\'ICZ4 ='_8&D?\ 0.MNN?\ 5BC^P-(_Z!UMUS_JQ6#-XX1)%*6Z M[(U_TB-WQ(&#!2JCN036QKNHWNFQQ2VT-O)&S;&\URN">GX4 3?V!I'_ $#K M;KG_ %8H_L#2/^@=;=<_ZL57A\3Z6RNDMY&)HE'F@*VT'(7@D6TC1@$[5'4GT%1P^,-"G<+'? DE0,QL!ST[=Z +?]@Z3_ - ZV_[] MBC^P=)_Z!UM_W[%%]J3VNHV5I%$)&G+%^>54#.?SXK+7Q+<^?-8M9H-06<01 MJ'_=L2N[K[#K0!J?V#I/_0.MO^_8H_L#2,8_LVVQ_P!%E7=\Z]@: +_AZVAM;S M6(X(4B3[5]U!@?<%;M<]X6NTOSJ5U'TDN>1Z': 1^==#0!B>*(8I["UCFC5X MVO(_ME MN+6021-T8?YXH J?\(_H_P#T#;7_ +]BH+W0=)6QN&73;8$1,1B,>E;-5[[_ M )!]S_UR;^1H KZ%_P @&PS_ ,\$_E6A6?H7_( L.,?N$_E6A0 4444 %%%% M ''^$?\ D:O&7_80C_\ 1*UV%DCLUQ(5 "C/&.I-8LGCVZ34H+_U%]T_X_INGUK8K M'\/?ZB^Y'_']-T^M &Q117/ZYK\^F:K964<,*I<*2;BX8K&I! VY'0G/>@#H M**YJ#Q4HUN[LKJ,B*.5(DF094$KG!/O4]SXHM5TZ2XME>:7RI7CC Y;9UH W MJ*Y/3_&-O%IFGOJDA6ZN8TED!"KY0<@+D>F2 *NGQ;8?9[B=4E,4,I@WD !I M <;030!OT5D7?B&UL3;FY5XXYBH+G&$9C@ ]SR<<9H\-:E<:MI'VFY55D\^6 M/"],*Y4?H* ->L?4_P#D.Z+U_P!9+_Z!6Q6/J?\ R'=%Z_ZR7_T"@#8K/UW_ M ) %_P!/]0_7Z5H5GZ[_ ,@"_P"G^H?K]* +%C_R#[;_ *Y+_(58JO8_\@^V M_P"N2_R%6* "BJ.KZBNE:=)=%=[#Y8T_O,>@JA)K5SIEHLVL1VT;2D+#'!(2 M68]OFP* -VBN*E\9R2ZI$MD8I+*5[7:YZ[9&8-^6VMK_ (2>T-M]H$K7K:=I-W>(@ M=H(F<*3@' H N45QMOXNNY;?1[J5+=8;MV\[R]WRJ(R_\0'/%:B^*K62S@N( MK>XD^T#=#&J_,Z 9+8]!0!O45@2^+M,1XUC,DH**[LB\1J3M!/X\5O AE!!R M",@T +1110!C>),?8K7.?^/R'I_O5LUC^(_^/*UZ_P#'Y#T_WJV* "BBB@ H MHHH **** "BBB@ HHHH *Q](_P"0OK7'_+=/_0!6Q6/I'_(7UKC_ );I_P"@ M"@#8KGXO#+PV\EG'J4HL&8LMN8U.W)R?FZGDUT%8_BII5\-7IA=DDV<,K$$? MB.E &6G@A/M1FDU*:3Y=H#1KNQ[MU-:E_P"'XK^2)VGD0QQ^6 .:Y\7NH6& ME6\=E<1-LM6GE9)#-N91D+D^O>H9-;U:R74[GSI)FEN88XK8*/W".HRXSVSG MKQ0!MW?A-;DR&._DA:2Y,Y=8UW#Y0,*>W3K4,O@WS9I=^J3FW9)$CA\M?DW@ M G/4].]4WUW6DM[F23RT^RZ=]I.%R)'R1@GZ#M1!KVJW%Q':131RK*8V-TJ< M+N'*CMD4 :-_X26_U.TNWOY52W,1$)C5@2F<$$],YYQ1)X/@DM+2'[9*'M%_ M">XVH)"]NAW;6^I2VTP59 RQJPZ'C!^M=;=_\ 'G/_ -#A+&T5 -BCREW!A]<8'6K%GX::WNQ=7&H27,VYF9F MC5*IGM].AD25H@)TW,&QQGN?2@"JW@]6DC(U&5$175E2-09 P( MPQZD#.<58?PQ!+:_9Q=R;5CACR ,_NR"/SQ63>:MJ%GJ&N7,%\)H5, MX"H* MJ&P&<$I/KG]*Z:B@#EO\ A#$3)AU& M:,RQ&&Y.Q3YREBQ^G7'%3-X8CM[TZC;^6UQ!$PM4\I5VMMVC+#EN/6NCHH Y MOPC9?V6:62, M;D*'A,#^O- &S!X1CCO#=S7C2SF>*=F$2IN*9P#CZ]:63PE'//)Y][)):O<- M=+;E!\LA[[NIQZ5D7/B76+:)HVC\R24P?O(U \GS <]>,#'4^M6%UO6C/N?R ME6"*!I(U7.\OG//M[4 +/X2OXS"\&JR27!N8F,SQ+^[1%8# Z'K71Z5IJ:79 M^0LC2NSM))(PP7=N2<=JP=)N+QM!UAKR\DN9([F55!&UD4'@<56@UO5HF@D" M^9!YBPB';DD%"=Q/7.10!VM5[_G3KH=/W+_R-9>@:H;JRAENKM))KD!A&%QY M9(Y3\/?FM2^_Y!]S_P!0N!]F0]JN_V9J__ $'Y M/_ 9*LZ%_P @"PZ_ZA.OTK0H QO[,U?_ *#\G_@,E']F:O\ ]!^3_P !DK9H MH QO[,U?_H/R?^ R4?V9J_\ T'Y/_ 9*V:* .*\$1RQ>(O%Z33F>0:A'F0J% MS^Z7L*[6N/\ "/\ R-7C+_L(1_\ HE:["@ HHHH S;[1+74-4L;ZX4.UIOV( MR@@EAC/X5GZCX6_M#4KFY_M"6*"ZC2*>W6-2'53V/4?A7144 8MCH,NF7)^Q MZA)'9E]_V4QJ0.,<-U[5M444 %%%% &5XF_Y%R^Z_P"K[?45I1?ZI/\ =%9O MB7_D7+[K_J^WU%:47^J3_=% #ZQ_#W^HON0?].FZ?6MBL?P]_J+[D'_3INGU MH V*RM:TB;6(#;"],-NZ[98_)5P_Y]*U:* .>C\)6L430I<2^67C?!Y/R#&, M^]00>#O)FD)U.9X#'+''"8UQ&).O/4XS7444 ?NGCM4W_",(NB3Z8ES^[FF>5FDB5_O'.,'CBM^B@#D9? L MO^LE_P#0*V*Q]3_Y#NB]?]9+_P"@4 ;%9^N_\@"__P"N#]?I6A6?KO\ R +_ M +?N'_E0!8L?^0?;?]"[:2ZCG-RR;# =D< M:JI\HL>@Z9W4L?A)XM/BLEU280VTJS6G[ITN,G';&*M:7X?CTN2W9+B23R+<0 , ,C. M];U% '.1^$+6*&2*.XE59(1$W Z[MQ;ZDUT$2"*)(P"",@UC_VMJ?_ $ +C_O\G^-']K:G_P! "X_[_)_C0!IQ6=M MA2*WBC4]55 !2FV@8L6AC)9=C$J.5]#[5E_VMJ?_ $ +C_O\G^-']K:G_P! M"X_[_)_C0!H3V%M<6U;1)G:% A99DP<=^M '145C?VMJ?_0 N/^_R M?XT?VMJ?_0 N/^_R?XT ;-,EACGC,JN,@UD_VMJ?\ T +C_O\ )_C1 M_:VI_P#0 N/^_P G^- &FMG;*,+;Q ;=G"#[OI]* M1_Q]?^R"MFL;08[SSM2GN[1K;SKC=&C.&)7:!GBMF@#'\1?\>EIR!_ID/7_> MK8K(\0Q74MC";2W-Q)'%"Q6&-2Q))"CDGK65_:VI_\ 0 N/^_R?XT?V MMJ?_ $ +C_O\G^- &J]O#(C(\4;(PPRE001Z&E$,2K@1H!@# 4=NE9/]K:G_ M - "X_[_ "?XT?VMJ?\ T +C_O\ )_C0!K+#$A&% MI#)(\BD#*X' /K7144 %4M8BEGT6]B@3S)7A943.-QQP*NT4 8-KJ>I16L$; M:#<[EC56_>IP0/K4O]KZC@_\2&ZX_P"FJ?XULT4 8_\ :^HY'_$BN>?^FJ GRAPHIC 7 irsarecast000.jpg IMAGE begin 644 irsarecast000.jpg M_]C_X 02D9)1@ ! 0$ 8 !@ #_VP!# @&!@<&!0@'!P<)"0@*#!0-# L+ M#!D2$P\4'1H?'AT:'!P@)"XG("(L(QP<*#7J#A(6&AXB)BI*3E)66EYB9FJ*CI*6FIZBIJK*SM+6VM[BYNL+#Q,7& MQ\C)RM+3U-76U]C9VN'BX^3EYN?HZ>KQ\O/T]?;W^/GZ_\0 'P$ P$! 0$! M 0$! 0 $" P0%!@<("0H+_\0 M1$ @$"! 0#! <%! 0 0)W $" M Q$$!2$Q!A)!40=A<1,B,H$(%$*1H;'!"2,S4O 58G+1"A8D-.$E\1<8&1HF M)R@I*C4V-S@Y.D-$149'2$E*4U155E=865IC9&5F9VAI:G-T=79W>'EZ@H.$ MA8:'B(F*DI.4E9:7F)F:HJ.DI::GJ*FJLK.TM;:WN+FZPL/$Q<;'R,G*TM/4 MU=;7V-G:XN/DY>;GZ.GJ\O/T]?;W^/GZ_]H # ,! (1 Q$ /P#W^BBB@ HH MHH **** "BBB@ HHHH **** "BBB@ HHHH **** "BBB@ HHHH **** "BBB M@ HHHH **** "BBB@ HHHH **** "BBB@ HHHH **** "BBB@ HHJGJMZVG: M7/=I&)&C (4G&22!_6@"Y16/Y_B#_GRL?^_[?X4>?X@_Y\K'_O\ M_A0!L45 MC^?X@_Y\K'_O^W^%'G^(/^?*Q_[_ +?X4 ;%%8_G^(/^?*Q_[_M_A1Y_B#_G MRL?^_P"W^% &Q16/Y_B#_GRL?^_[?X4>?X@_Y\K'_O\ M_A0!L45C^?X@_Y\ MK'_O^W^%'G^(/^?*Q_[_ +?X4 ;%%9NDW]Q>_:H[J&.*:WE\MA&Q8'@'K^-: M5 !1110 4444 %%%% !1110 4444 %%%% !1110 4444 %%%% !1110 4444 M %%%% !1110 4444 %%%% !1110 4444 %%%% !1110 4444 %%%% !1110 M4444 %%%% !1110 4444 %%%% !1110 4444 %%%% !1110 4444 %%%% !1 M110 4444 %%%% !1110 4444 %%%% !1110 4444 %%%% !1110 4444 %%% M% !1110 5D^)O^1=N_HO_H0K6K)\3?\ (NW?T7_T(4 86NZ]JEKJ5S:VDI"I M/"BA(5=PK1LS8!Z]*;!XDOH9=.N+ZZ0V4\>28HUR6QGY^ZGZ5N3:EHD.L"UF M:(7Y9"2YE.%64+N*Y' MTQ]:EF\82"*[G2VCCM[81[I9Y,!2ZALG';G%;KV6DO%*CP6C1B0O("JX#]R? M>F-%H\K2VCI9L2H>2(A>0!@$CTQ0!B2>*I()[I5:.<^8@C#81%'E;SAN^>V: MN!3H4TNY6 M*2..W;S 3'E0">,' //3B@#GH/'"7%A%81F5I"(U!7C:O>R,#>&1,PE M6.R( @;77MUZCJ*FA\3ZC/,MLT%I$V)2\I9MCA3@;#W- %?_ (0[46T[44-[ M$MU/@VY!)6#D$J,_P]JDC\+:O&MB5NK42Q"02/M)"ACGY!T&/6HH_%6K0RI! M;Z5]HC0$R,\NUW_W >M5G\3ZDFI276RW+FT/DVX=MN[=G#GH&Q0!;LO"&IB1 MA?WD$T)?E4!7S%]6]3[T#PIJUO\ :7MI;$W$L>P2R*25&_(7W&WBJMWXHU'4 M[*-5@CM,21"0;V\QR2,[,=5[$FM/7M5U&'7H/L,$\UI9[3<^7@#2 I MSQ0!!IOAG6;1+7[3/9W+I%(C9+*(RSY!0>PXI)?"FK.73[;#ASN6XRWFP8_A M3V/?ZT-XLU39/NM+81NI,$BLV /,V MZ<2P[\5=TW0-3L=7M9VGMWMTC*S%@ M6D8]MI/W1["LY/$NLPQQQVUI!*I)+-.6SDS%!T[8YJ27QIJ$0L%^P0O)+*$N M$5F!0&39N7/4=Z -[1O^0CK/(_X^A_Z *V*Q]&_Y".L\C_CZ'_H K8H **** M "BBB@ HHHH **** "BBB@ HHHH **** "BBB@ HHHH **** "BBB@ HHHH M**** "BBB@ HHHH **** "BBB@ HHHH **** "BBB@ HHHH **** "BBB@ H MHHH **** "BBB@ HHHH **** "BBB@ HHHH **** "BBB@ HHHH **** "BB MB@ HHHH **** "BBB@ HHHH **** "BBB@ HHHH **** "BBB@ HHHH **** M "L?Q2VWPU>MM9L*IPJEC]X=AUK8HH P?[?T4.[>7)O<8=OLKY8>AXYH.N:( M5C4Q/MBY0?9&POTXXK>HH P'U[1)'C>2)V:,Y0M:.2OT^7B@ZSH3!XS Q63E MP;1L-WY^6M^B@# .OZ$"KM&P\M<*QM&^4?EQ3H_%.BS*7B>217ZLMNY#?CBM M6^_Y!]S_ -3W;_ -"- $W]O:,4*&.3:1L(^ROC'ITZ4H\0 M:.J!0D@5?E %J^!C\*W** ,/_A(]''02_P#@*_\ A2-KNBEU=HG+1\J3:-E? MIQ6[10!A>';A+JZU::,2"-KKY2\93/RCUZUNT44 %%%% !1110 4444 %%%% M !1110 4444 %%%% !1110 4444 %%%% !1110 4444 %%%% !1110 4444 M%%%% !1110 4444 %%%% !1110 4444 %%%% !1110 4444 %%%% !1110 4 M444 %%%% !1110 4444 %%%% !1110 4444 %%%% !1110 4444 %%%% !11 M10 4444 %%%% !1110 4444 %%%% !1110 4444 %%%% !1110 4444 %%%% M %>^_P"0?<_]!?^12M/JW M_H1H Z.BBB@ HHHH ***YB\\1ZA/K-SIFAZ>ET]H ;B:5]J*QZ(/?% '3T5S MFG>,M/N-*^U:@1I\R2M!+!*P)20=5R.IJ_%XBTF;2VU)+V+[,C;&8GD-_=(Z MY]J -2BLC_A)]&_LO^TFOXEM?,$3.QQM<_PGT--D\5Z+$;???1K]H 9">@!Z M$^@/O0!LT5SH\86+>*+K0%CE%U!"LHD*_(V[/&?PZU+'XHL8-&L[W4+F&-[E MP]3[4/XDTE-,CU WD9 MMY&VH5Y+-_=QUS[4 :M%86L^)8M-TZSGM8&N[B^D6*TA4[=['D9)Z"G66K7U MO9W-QX@MH;%(<%9%E#*X/]>U &W162GB;1VL#>F_B6 /L9G.-K>A]#5#5/&^ MDZ=X=N=:1VN8;=U1TB'S D@YFN?+2<;D#*0Q'Z4/ <^8"<9'KUH U:*SKK43;ZM!:GRQ&\;2,2?FX M]*BL_$NCZA>"UM;^*65AE0IX;U /(DSX&#T4GH">Q/H: -6BLB;Q1HUO?FQEOXEN%D$ M3(3]UB,@'TS5'_A,[)]>U#14CD%U:1&337B>1/S$R?-O'J,>E &I145O<0W=NEQ;RI+ M#(,HZ'((J6@ HHHH **** "BBB@ HHHH **** "BBB@ HHHH **** "BBB@ MHHHH **** "BBB@ HHHH **** "BBB@ HHHH **** "BBB@ HHHH **** "B MBB@ HHHH **** "BBB@ HHHH **** "BBB@ HHHH **** "BBB@ HHHH *** M* "BBB@ HHHH **** "BBB@"O??\@^Y_ZY-_(UB>!?\ D4;3ZM_Z$:V[[_D' MW/\ UR;^1K$\"_\ (HVGU;_T(T ='1110 4444 %<9):Z[X=\0:E>:7I0U2T MU)Q,R+.L312 8YW=1@=J[.B@#S"]TK4-)72I[BSAO=3O=2>[FM@0%W%0-H)X MR!CFENO!^L7VDW=X;-;>ZGU-;X:?'*O"@ 8W?=W<=>E>F-&CLK,BL5.5)&>1^$KF?2X0=*:*:35H;JXBN9TDRBGD_+P?I4/C3P]X@U2ZOK:RLA-93 M6Z);^7)'&L; \[@1D_A7I-% ''#2=3M/%LEW'8+/;7EA';22B55\ED!Y(/)S MGM69:>']:T:WT&[32HM0FL[1[::U$JKL).0RLW'UKT2B@#@M+\*7T,FDRW=K M 0ES-HNE?:9SJ\UW:>3.D;0AONN,\?A7H5% M '&7^BZ[<:%H5WF*;6=-D6:6-B )N#E<] ??I5;7K+7O%>B()]&?3YK2Z2=+ M+8[:WA5-06U-J-P 2Y*$ @%&'X\D5W%% '*Z M_H&I:YXET]TO)K&QLHFE2> J7:8G;M((/&TUB6?@[5+6.'2YT%[8VNI?:8IY MW7U>C2:?933B>6SMY)ATD:(%A^.* MLT <'<>%+QX/$6+.!I;R]26W8L-S(JJ.3VZ&IKC1]5CU_4'BTY);>^TX1>?Y MJ@QR 8P0>3GUKMJ* .0TSP[<1ZQIMQ=VL+1V]AY#%B&VOW K$_X1[Q'9^'=$ ML(K3S8X%F6Y@AEC5@68E3N;MST%>E44 8/@O3+K1O!^FZ=>H$N((RKJ&# '< M3U'UK>HHH **** "BBB@ HHHH **** "BBB@ HHHH **** "BBB@ HHHH ** M** "BBB@ HHHH **** "BBB@ HHHH **** "BBB@ HHHH **** "BBB@ HHI M-P]1^= "T4FX>H_.CH_.CO]X?G1O7^\ M/SH 6BDWK_>'YT;U_O#\Z %HI-Z_WA^=&]?[P_.@!:*3>O\ >'YT;U_O#\Z M%HI-Z_WA^=&]?[P_.@!:*3>O]X?G1O7^\/SH 6BDWK_>'YTF]?[P_.@!U%-W MK_>'YT;U_O#\Z '44W>O]X?G1O7^\/SH AOO^0?<_P#7)OY&L3P+_P BC:?5 MO_0C6U?.O]GW/S+_ *IN_L:P_ S*/"5IEUZM_$/[QH Z6BF[T_O+^=&]/[R_ MG0 ZBF[T_O+^=&]/[R_G0 ZBF[T_O+^=&]/[R_G0 ZBF[T_O+^=&]/[R_G0 MZBF[T_O+^=&]/[R_G0 ZBF[T_O+^=&]/[R_G0 ZBF[T_O+^=&]/[R_G0 ZBF M[T_O+^=&]/[R_G0 ZBF[T_O+^=&]?[P_.@!U%)O7^\/SHWK_ 'A^= "T4F]? M[P_.C>O]X?G0 M%)O7^\/SHWK_>'YT +12;U_O#\Z-Z_WA^= "T4F]?[P_.C M>O\ >'YT +12;U_O#\Z-Z_WA^= "T4FY?[P_.CH_.CH_.EH **** "BBB@ HHHH **** "BBB@ HHHH **** "BBB@ M HHHH **** "BBB@ I"0.I I:P]:MH;S6-(MKA-\3&4E"2 2%&.E &WO7^\/ MSHWK_>'YUE?\(UH__/BG_?3?XT?\(UH__/BG_?3?XT :N]?[P_.C>O\ >'YU ME?\ "-:/_P ^*?\ ?3?XT?\ "-:/_P ^*?\ ?3?XT 1^(A'-;V4+L#'+>1HZ M[L;E.CI:2LMB@948J0S<''UH D_P"$9T;_ )\E MY&/OM_C1_P (QHW_ #XKR,??;_&IM!).@6!8DGR%SD\]*T: ,@^&M%'6S3D8 M^^W^-)_PC>B<_P"B)R,?ZQO\:JIIEGJ7B#5C>0+-Y?E*F6/ *_6KG_",Z-_S MXIR,?>;_ !H ;_PC>B<_Z(G(Q_K&_P :/^$;T3G_ $1.1S^\;_&G?\(SHW/^ M@ISQ]YO\:/\ A&=&Y_T%.>/O-_C0 W_A&]$Y_P!$3GK^\;_&LB;PSH=SXF^S MS6:/$MGO">8V-V_&>OI6S_PC.C<_Z"G/^TW^-,_X171/.\[^SX_,*[<[FZ?G M0!5_X0CPQ_T#8_\ OZ__ ,51_P (1X8_Z!L?_?U__BJN_P#"-:/_ ,^*?]]- M_C1_PC6C_P#/BG_?3?XT 4O^$(\,?] V/_OZ_P#\51_PA'AC_H&Q_P#?U_\ MXJKO_"-:/_SXI_WTW^-'_"-:/_SXI_WTW^- %+_A!_#!_P"89'_W]?\ ^*I? M^$%\-?\ 0+3_ +^/_C4>K:/I^GI9SVMN(I1=Q+N5CT+=.M=-0!SO_""^&O\ MH%I_W\?_ !I/^$(\,?\ 0-C_ ._K_P#Q5:6O2/%H-])&Q1EA8A@<$56@\.:0 M]O$S62%BH).YNOYT 5O^$(\,?] V/_OZ_P#\51_PA'AC_H&Q_P#?U_\ XJKO M_"-:/_SXI_WTW^-'_",Z/_SXI_WTW^- %+_A"/#'_0-C_P"_K_\ Q5'_ A' MAC_H&Q_]_7_^*J[_ ,(UH_\ SXI_WTW^-'_",Z-_SXI_WTW^- '.:5X(\,7: MWKW&FQNRW>$CTTB,_]M9/_ (JM+_A&M'_Y\4_[Z;_&JUK:0:=XG6WM M$\J&2T9VC!)!;/G_IK)_\ %5G:9\._!DMDS)I *"1U MR\DB]&/'WNE=Q7,70^U_V;;3SK=0S7#/^@/%_W^D_^*K7_P"$9T8?\N*?]]-_C1_PC.C8Q]A3'^\W^- & M1_PK;P9_T!XO^_TG_P 51_PK;P9_T!XO^_TG_P 56O\ \(SHW_/BG_?3?XT? M\(SHW_/BG_?3?XT <]J7P[\'P:7=2QZ1$KI$S*1/)P0/]ZIK/X?>$9;&WD;2 M8BS1J2?.?GC_ 'JV9/"VB2QNCV"%7&&&YN1^=*OA?14556P0!1@?,W3\Z ,O M_A7?@_\ Z!$7_?Z3_P"*H_X5WX/_ .@1%_W^D_\ BJU?^$9T;_GQ3IC[S?XT M?\(SHW_/BG3'WF_QH RO^%=^#_\ H$1?]_I/_BJ/^%=^#_\ H$1?]_I/_BJU M?^$9T;_GQ3IC[S?XT?\ ",Z-_P ^*=,?>;_&@#,_X5SX1(R-'C_[^R?_ !5' M_"N/"7_0&C_[^R?_ !5:'AY1%'?VZ B*&[>.-2<[5 ' ]JV: .5/PY\(#KH\ M8_[;2?\ Q5)_PKOP?_T"(O\ O])_\55M[&VU/Q+>QWD?G+#%$8U9CA!?"]K=Z;Y&F1IYER$?$S\C:>/O5TO_",Z,,?Z"G'3YF_QIC^$]#D:,MI M\9,;;D^9N#^= %/_ (07PM_T#(_^_K__ !5'_""^%O\ H&1?]_7_ /BJO_\ M"-:/_P ^*?\ ?3?XT?\ "-:/_P ^*?\ ?3?XT 4/^$%\+?\ 0,B_[^O_ /%4 M?\(+X6_Z!D7_ ']?_P"*J_\ \(UH_P#SXI_WTW^-'_",Z/\ \^*?]]-_C0!0 M_P"$%\+?] R/_OZ__P 53O\ A _#'_0*3_OX_P#\54M_X?TJ#3KJ:*T5)(XG M=&#-E2%.#UK4TQVDTJS=V+,T"$L>YVB@#&_X0/PQ_P! I/\ OX__ ,52?\(+ MX7!YTN/_ +^O_P#%5TE%]"@\1W<$5DBPBWC8+YK8 MR2>>M;'_ C6A_\ /FG_ '\;_&@>%-#68RC3X]Y4*3N;H.G>G_\ ",Z/_P ^ M*?\ ?3?XT ,_X1K0_P#GS3_OXW^-'_",Z'_SYI_W\;_&G_\ "-:/_P ^*?\ M?3?XT?\ "-:/_P ^*?\ ?3?XT ,_X1G0_P#GS3_OXW^-*/#.B'I9(?\ MHW^ M-._X1K1_^?%/^^F_QJE?:99:75.;_&C_A&M'_Y\4_[Z;_&@!G_ C. MA_\ /FG_ '\;_&C_ (1K0_\ GS3_ +^-_C3_ /A&M'_Y\4_[Z;_&C_A&M'_Y M\4_[Z;_&@!G_ C.A_\ /FG_ '\;_&F^&-D>D&,'"I/*J@MG #'%3?\ "-:/ M_P ^*?\ ?3?XU%%X2T*&/9'I\87).-S=3U[T ;.]?[P_.C>O]X?G63_PB^B_ M\^"?]]-_C1_PB^B_\^"?]]-_C0!K;U_O#\Z-Z_WA^=9/_"+Z+_SX)_WTW^-' M_"+Z+_SX)_WTW^- &L"#T.:6L+P]!%:W6K6\"E(8[D!5R2!\HZ9K=H **** M"BBB@ HHHH **** "BBB@ HHHH **** "BBB@ K(U#_D8=&Y_P">W'_ !6O6 M1J'_ ",.C>*5AFD@@MO,DCF>-@T@4810Q.?H>E36/B2"_U M"2W1/+CBB\QVD;:P]\=Q[U#>>$M-NYY);PF1'F>4JQP S*%_3%1W7A,7_EK= M79=(HFC0A<. PP>?3 '% %[3-?AU+3+B\2-D\AV1T)YR*JV'BVRG;I;0>3#<1"-HUZ9&?F^II+;PS86D=HD*!%M]_" MC[Q8
QG486-2>H_B/-23>"+&2V\II=\N(BOF#*EH\X)7N.>E M %^]\4Z=;3V$,-Q%/)=S(BJK]%;.&^G%3R>)-(2VFF&H0,L)VMA^C8) ^O%9 MJ>#XEN;:1)UB2+RV:.&,*"R @;?[HYZ5!!X)BMQ,R7@%W+(CB0QC!V@@97N< M,]CM! *G/'7FK]AH_]D:5>1^8IWHQV1)LC7@_= M7M[T 6?#_P#R+]AQC]PO\JTJS?#_ /R+]AQC]PO\JTJ .6;6[/2/$NI+>2+$ MLQBPYZ#"=ZT+?Q1I4L$,DEW'$TP+(C-RP'>JD&FQ7?BO4KA^L1B !&0PEAC:[FBM)9)GBCC>09;:VW(^IJB_@NWDN;>X=H97@)51+#D;"V[&,_>SWH MD\%69N+>=?*DDB9O^/B/>,%]_'/!SWH WK;4[*\\[[/=12^0Q67:V=A'4&L^ MQ\46%U%,\SBV$<_D#S#]]NV/K3;;P^MLNH!IXXUO R%(4V* W4D=VYZU!#X. MTZSO[2YMOW*6Z &,=)&' 8^] %]?$VB/YNW4[<^2-TGS_=&<<_CQ2GQ)HP,( M_M*WS.-T7S_>&<$[1( MH@1&C(J#$,>U339O!\#7=U/%.4%Y\M MPFT$%,=%_NGW% #]8U*ROH(8[6YBF>&]A$@4YV_-715R%YH:Z44G61=LMW H MC1-HX;@GU;WKKZ ,SQ%_R+M_T_U+=:KZEKL&A6-A)<1NT"((+!;*.]F\EE*2EN6=2>!GVI8? M!-G!%)M%2.*1M2M MPLI(0EOO8.#^M5Y_"UA(EU''F(3QJF%_AV]#4/\ PB,$D+":;=*ZMO<( ,LP M8X';I0!:A\5:++%)*;Z.)8YS;DRG;\X.,"IG\0Z/&LC/J, 6,X)\3O*BS1;E&\Y8$=_8]J?<>#X)-(_L^*41H93(R[ 4((P5QZ<\4 ;,. MK:?<70MH;N*2&4L+ZWFBF58[>% M(EVIB1PHP [=Q[5._P#R-\(S_P N3_CM[^VM&5B]QG:1T&!FJ%EXEL M9[6&6ZECM9)I7BCC=^6*L5X^N*L:CILMW>V=U!<"&2W8DY3<&!&"*QKCP1!< M"U1[IVCAD,FUESSOWY4]CV^E &[!K&GW4T\-O=1RS0*6D1#DJ!Q5,>(8F;32 M(2([TR#>SJ4:.-<8VJS%CD]SD]:KQ^&'\B"*6^ M8BV,ODF--I4.".?7&: +Y\1Z,+;[0=2M_)#E-^_C<.2*@U?Q"FF ")UDC: M9F#@811DD>I]JR[?P/;PV[B&Z E>5F=E0;2&7:WR^N._K6E?^%['48K59=Q- MK$8X7)R4.,!OJ* +:Z_I1?RS?0I*(_,:-FPRKC)R.W!H;7])6*"4ZA $N#B) MMW#_ $K*'@^W34;B\46TDEPI\QIH=S%BH7KGIQTI$\'1HA"W1'G1^5<*$&WR M_P"[&/X* +K>+=$6_ALA?QM++NQMY VCG)[5J6E[;7\/G6DZ31Y*[D.1D5C+ MX7B@AL4MI54V8=$,D88,K#!#>M7=%TD:/:R0B0,'D+A57:J9[*.PH CT+_6: MKP1_ITG\A6O61H7^LU7C'^G2?R%:] &/9_\ (TZGT_U,/_LU;%<+K]]J5CXF MFDTW#.JPO)$!DRJ-V5]J+#QM=7"PBVTV>_$F7:13MVJ>@ /6@#NJ*Y5/&)>_ MCL/L1%S(1& 7X$G=2<=JM2ZG.FHZU"9>+>*)H5[@D'.* .@HKD(?%MT1&HL% ME#-Y2XF&\OC/*XX''6HAXIU.ZN8%2UAAA>VE>9#+EXW5@.O<^U ':45Q5[XH MO)?#M[=P6[1QP(,.LF9F8, ?DQT/K6B^N33IHEPI6%+NX*NN[/R[2<$]CQ0! MTE%:W>06>L.DJ[X)HTCXSM5B 3^M3ZE<2Z5H4[6U]+? MQH V-5_Y ][_ ->\G_H)I-*_Y ]E_P!<$_\ 017,7^HW*OY'G2%&DGMV5CG< MHC)'XUU&E?\ ('LO^N"?^@B@"W7*Z-JDD-E#8VEJ;BX_>3.-VT!/,8<'N<]J MZJN4T72Y9;2"^M+@V\_[R&3/0Y[T ;)U_2EDEBDOH4EB7=(A;E?K M56^\5Z3::8;R.[AFW F)%?\ UA'8567P=;^9$LD[O;VSF2W3'S*3][2[W06;AK1.-Z>H8_Q9]ZWKS3HKQK8L<" M!]X&.#0!2MO%.DSQ)(UW%&LDACBW-]_'<58/B#2%BEE.H0;(7"2-NX5CT!K, ME\(0-+,T2/XCB@#0 MG\6Z5;RIYEPIAD,025.0?,) _#CK4MYXCL;=)Q!-'<3P$"2%'^9<^M48_"," M1HT5R?-7RB'*@CIH NQ^+-*-R+::Y M2&8KOVL> /K1J]S#<-IQAE5PFHHC;><, <@U7E\*1+'((I-XDA>-USTY[ M8J)=-?2-(T.TE?S9Q>QF:7N[X.6- '4UD^)_^1=O.GW5Z_[PK6K)\3_\BY>= M/NKU_P!X4 5#XI@C\1?V0T8SE4#!OFW$9^[Z<=:N-XDT5(7E;4K<1H_ELV_H MV,X^M5+CPR+K5#=O=%82ZRA$3#API .[TYZ56T_P5;68D+S>8\DHD8A <*5 M!(]<'DT ;/\ ;FE^8J?;H=S() -W\)&0:@N?$FG0Z--JD4Z3VT) =D/3) _K M5)?"$"12VZW#BVEB1'7'S;D^Z0>P]14P\-1R6%Y#200R*R1RB(R9X)*;^/H!5@>)=%:V:Y&I6YA5MI?=P#C./RJM?> M&X)[BXNDD*RR-O50<#<(R@_G6=;>#F^R1-->+]N15!94!0#9L(QWX[^M &LG MBO17>[4WT:"UV^8[G"_,,@@]ZM#6M,::.);V%I)4WHH;.5]:Q9O!5JZ2HDBE M&*.JRIN&]5VY/J,=JL6WA=;(R+:SK;Q3H1.D4>/FQ@%3_#]* +C>)=&$(D&H MP,K2&)<-G+@9V_7%.AU[3I)((7NX4N)AE(BW)K+TWP9;6#(YEW2"9IFVH I) M39T]<<_6GQ^$((I0HN&-NT@FE0CYFD4Y!#=AP.* +FC?\A+6><_Z4/\ T 5L M5CZ-_P A+6>2?]*'_H K8H **** "BBB@ HHHH **** "BBB@ HHHH **** M"BBB@ K(U#_D8=&Y/_+;_P! %:]9&H?\C#HW)_Y;?^@"@"GK8B_MB!M5W_V7 MY9V8SL$O^WCVZ>]95QK>O)/>16:_ZI)/*A>#+*H4;')[@G/%=N0",$ _6C S MG% '#_VKXJMOM!;RKHJLHC1;?9EE12ISGU)_*EM-7\43PVS;[29OWS2>1&6# M;0-J<_=.2?RKN*0 #H /I0!Q9U/4<6UV)_MFR"X+R1V^T(PQA<9YQ6?'J6OW M*QZDUNLU[;Q72Q&-"$<#;M/\_P J]$P , "C '04 <1!KNO"WT^6>YL)#),R MR1VZEFD7C 0>H[UX/<5U>U1CY1QTXHP,Y MP,T <7+=ZI)XC768;=CID;"W;>Q#*G.]MGUQ@UU3SI=:3)/&&V20E@&&#C%6 M\#&,5!>?\>,_'_+-OY4 5/#_ /R+]AQC]PO\JTJS?#__ "+]AQC]PO'X5I4 M9&G?\C!K/'>'_P! K7K(T[_D8-9X[P_^@5KT %%%% '-^+E;R+.=91NAE+K; ML#MN#CA"1T/I[U0UV?5-8@M+;3K61)HD%Q.DCE,$#Y5SW.ZNR(!Z@&EH H:3 MJ']H6@+HR31@+,"N 'P,X]LU?HQ10 4444 8_B+_ (]+3DC_ $R'I_O5L5C^ M(O\ CTM.2/\ 3(>G^]6Q0!F>(O\ D7;_ *?ZENM7K;_CTA_W%_E5'Q%_R+M_ MT_U+=:O6W_'I#_N+_*@"6BBB@ KDA<-IOBRZF8/3_P >3 M?_39OGD&#T;C\.E=/7-2&0W>C^9+$[?;)>81\N,-Q]: .EHHHH *BNE+6LRA MG0E"-R?>''4>]2T4 <;HNI2:=IMW;I ;AT=Q;SQJ<7#!<\CL<\5)X8FU#3)I MK'5(7#3M]HB97+A0W\)/8@UUN .@%+B@ HHHH **** ,C0O]9JO&/].D_D*U MZR-"_P!9JO&/].D_D*UZ ,2VC1_%>HEE4E88<''(^]6A)I=C*82]K$?).8_E MQM/M5*S_ .1IU/I_J8?_ &:MB@" 6=L) X@CWABX;;SD]Z9+IMG-=K=26T;3 MJ,"0CG%6J* ,Z'0]-ADF=;5"TV0Y//![?2I5TJP1(D6TB"PDF,;?NYZUH'04V;3;*XM_(EM8WB+;]A7C/K5NB@"HFEV,=PTZ6L M0E9-C-CDKZ4QM(L38-8K;JENQW;5XYSG/YU>HH R-5TRV-E-Z2U>2-]I8>8!\I([TR76M9M8X[65T>\9HSO\C"[#]XD=L5V%)@>@H XFPU M/6KO5-)DN+Q1 )IHIS%%B.3@;0/\:GNWNCK=TRJ3(+J!"HYQ#D_-_/FNOP,8 MP*8+>$3O,(U\UU"LV.2!T% &5X7/_$F54R8$D=86/\29X/\ .MFHX((K:%88 M(UCB0855& *DH *R-=^_I?&?]/C_ )&M>LC7?OZ7QG_3X_Y&@#7K(\3_ /(N M7G3[J]?]X5KUD>)_^1&*666.-5DE(,C 6LRKYK\2]<[CG\/2@"M]@US_ *#< M?_@(O^-'V#7/^@W'_P" B_XULT4 8WV#7/\ H-Q_^ B_XT?8-<_Z#V6HBW,R*K*8 _W< M^I]Z;]@US_H-Q_\ @(O^-;-% &-]@US_ *#:H)HX)5F"+;A ,8'TK3HHH **** "BBB@ HHHH **** "BBB@ HHHH **** " MBBB@ HHHH **** "BBB@ HHHH **** "BBB@ HHHH **** "BBB@ HHHH ** M** "BBB@ HHHH **** "BBB@ HHHH **** "BBB@ HHHH *H:3)YEFS?:OM/ M[UQOQT^8\?ATJ_5+3!(+1O,$(;S'_P!5TQDX_'UH NT444 %%%% !1110 44 M44 %%%% !1110 4444 %%%% !1110 4444 %%%% !1110 4444 %%%% !111 M0 4444 %%%% !1110 4444 %%%% !1110 4444 %%%% !1110 4444 %%%% M!1110 4444 %%%% !1110 4444 %%%% !1110 4444 %%%% !1110 4444 % M%%% !1110 4444 %%%% !1110 4444 %%%% !1110 4444 %%%% !1110 44 M44 %%%% !1110 4444 %4-(C6.R95MC;CS7.PG.?F//X]:OUGZ,4-BWER32+ MYTG,O7.X\?3TH T**** "BBB@ HHK,\1+=-X;U);+=]J-L_E;>N[:<8H :GB M31GO_L*ZE;FX)VA=_!/IGIGVK5KRNZF\-2_#6WMM/^RMJ11%@B0+YZW.>I7[ MP.[/)HU?4[Q)-:\[Q"UI=6$"/;6V0-T@09]VR>U 'JE%>4ZSK>O7>L-;"Z^Q M216<4T ,BQ@R-U;YB-WTK9BEU.\\7SB\U.6&"QT^"X>W@ *NYW9/Z=* .]JM M)J%I$D#M.A2=Q'$RG(9CT (KS/0=&$M+TRR2:G%'/&SAC'\S_+C^&@#UFBO+KG6+W%YJ?]M.FK0: MB8(=,!'S(" $V=2"#G=4FKW>K);>(=8BU>:-M-F4P6^!L7D9!]>M 'IM9^HZ MWIFDF-;^\B@:3[JL>3[X]/>N2N]2FMO'5K]LOGEMIWCCMH;>4 Q.5.?,3.2# MZXI+:72H/'WB Z^ULDK)#]F:\*A3%M.0A;CZXH [N*6.>%)8G5XW&Y64Y!%/ MKR_Q!JNH2>(9M/T^YCM+&WM8WL6258D=F&<\D;@.F!ZU;G;6M0O;I+G5GMI+ M33$G>.WQM,VW.<^E 'H7FQB41&1?,(W!,\D>N/2GUY9;E=3\7>&-6U"]:&>Y MT7>2)-BR2;E.T?7THT+5]?U'Q!%(LAO9(I[9Y5 \H$@*$SD'WQS0!ZG4% MM=P78D,$@?RV*-@="*Y7P,+V\2]U2\U.:YW74\*0G&R-5D(&/?BLB:^OI;+R M;>_:U>;5VA,D:C.WTQ0!Z14%O>6]WYGV>59/+;8^T]#Z5SOA.>[34]=TNXNW MN8K"XC6%Y/O ,@8@_B:Y/S;J/3=4:UO8[>,:H_GJ91&\RX^ZC$X!H ]5HKSN MQN[C7/$=DEOJ=Y;Z;%I:W1A(&]V$F/F/X=NM4=&\27D_B^P:VNYYK>^-P)(I MI$))0$C"J?EYH ]2JG9ZK97^FC4;:X5[0ACYO0?*2#U]P:\Y\)ZKKVI:O9W< MEXKM+)*+NW>5?N D* F@#N].OXM3T^*\A M#".4$KN&#C./Z4Q-3MWU>73,D7,<0E((X*DXR/RKA-5UV\\,Q::T4A:'4=,6 MWLX\<+S8O<).?-<;T&!]X\?ATJ]5+2UD6T82PQPMYC_+&B:5%?&]CTVS2[)R9U@4.3Z[L9JI'X7TT:M\L+:X>/[C2Q*Q7Z9%3K;0)*TJ0Q MK(RA&8*,E1T!/I4M% %*UT?3+&8S6FG6D$ISEXH54\]>0*='I6GPL6BL;9&: M02DK$HRX_BZ=?>K=% %,Z5IS7POC86QNQTG,2[_^^L9J5K.U=)4:WB9)3F12 M@(<^_K4]% %3^R]/^W"]^PVWVL# G\I=^/\ >QFDOM)TW4]GV^PM;K9]WSXE M?;],BKE% %&XT;2[M(4N=.M)EA&(A)"K!!Z#(XJP+6W!8B"(%EV,=@Y7T^E3 M44 59-,L)5@62RMW%N080T0/EX_N\QFK ME% $<,$-NA2&)(U)+%44 9/4TS[%:\?Z-#P^\?(.&]?K[U/10!&D$4)P\<$:,J M",,J $*.B_3VJO!H^F6MR;FWTZTBG)),D<*JV3UY S5VB@"G%I&FPWC7D5A: MI=,QDLO(C6V=2K1JH"X/7@?6K-% &;8:+;VFEVEE/B\% MJ"/0CI^%*FCQ+X@EU=I&>5X!"J$#" $DD>YS6C10 4444 %%%% M!1110 4444 %%%% !1110 4444 %%%% !1110 4444 %%%% !1110 4444 % M%%% !1110 4444 %%%% !1110 4444 %%%% !1110 4444 %%%% !1110 44 M44 %%%% !1110 45DPPS3:O=.NJ2%(G -LJC"_+T)/YU-_9]SY6S^T[C=YF_ M=M7./[O3I0!H451>QN&-QC49U\T#9A5_=_3C^=+]BG\Y7^WS;1'L*87!/][I MUH NT502PN56W!U*=C$V7)5?WGL>/Y4AT^Y,,B#4[@,TFX/M7*C^Z..E &A1 M5)K*X:2=AJ$RB10JJ%7$9]1Q0ME<+)"QU"9A&FUE(7#G^\>.M %VBL]=/N1' M$IU.X)20LS%5RX_NGCI2O87++.!J4ZF1@5(5?W8]!Q_.@"_15(V5P97<7\P5 MH]@3"X4_WNG6FI8W"_9LZC.WE$[\JO[WZ\?RH OT5GG3[DPE/[3N QDW[]JY M _N].E.>QN&-P1J$Z^:,( J_N_</'6F MI87*QP*=2G8QL69BJYD'H>* +]%9[:?/8J@+A#_>''6@"[15);*X$D#'4)R(U(=2JXD/J>/Y4S^S[GR43^T[C M.E &A6?HP06+>7#-$OG2?++USN//T/:G/8W#"X U&=?-(*85 M?W?L./YTRWTVX@SG4[F0%2,.%/)[]* -&BJ$=C_7C^5) M_9]SY3)_:=QN,N\/M7(']WITH T**HO8W#-<$:C.HE4! %7]W[CC^=*+*X$T M;_;YBJQE"F%PQ_O'CK0!=HJ@MA#T/'2D?3[EHID&IW"L M[[E8*N4'H..E &A15)K*G2G-8W!^TXU&<>:04PJ_NOIQ_.@ M"]15+[%<>>)/M\VT1>7LPN"W][IUIJV%ROV;.I3MY3$OE5_>^QX_E0!?HK/; M3[IH'0:G<*S2!PX5YX_E33I]UY*I_:=QN$N\OM7)']WITH T**H26-PXN0NHSIYOW"%7]U] M./YT\6<_FA_MTVT1[-F!@G'WNG6@"Y15".PN42W5M2G/Y4G]G MW/E2)_:=QN:7>'VKE1_=''2@#0HJBUE<-+<,-0G594"HH5<1GU''\Z#]KMY[ M&%9%EC.X3/(0&.!P0/K0!>HHHH **** "BBB@ HHHH **** "BBB@ HHHH * M*** "BBB@ HHHH **** "BBB@ HHHH **** "BBB@ HHHH **** "BBB@ HH MHH **** "BBB@ HHHH **** "BBB@ HHHH **** "BBB@ HHHH **** *5F) M/MM]OCA52Z[&0_,PV_Q>]7:H62!;_4&%N\9:1278\2?*.1_*K] !1110 444 M4 %%%% !1110 4444 %%%% !1110 4444 %%%% !1110 4444 %%%% !1110 M 4444 %%%% !1110 4444 %%%% !1110 4444 %%%% !1110 50O%4ZGIY-O M)(P9\2*>(_E[_7I5^J%Z\:ZGIRM-(C,S[445)89!E'0Y##VJ6@ HHHH **** "BBB@ HHHH **** M"BBB@ HHHH **** "BBB@ HHHH **** "BBB@ HHHH **** "BBB@ HHHH * M*** "BBB@ HHHH **** "BBB@"*Z)%I,1U$;?RKC7TW3[7P;'J?V))+GRD8F M5VY)8 YY]Z[&[_X\Y_\ KFW\JR]*M(;[PG9VTZDQ/"FX9],'^E '((D2>9=3 M6-FUJ;N:U2)0X<;02&)SSTJ?PC'9ZTS)?Z?"CM DT8"/'D$]=%;Z/ MHW]IS1).990S2FW,F1&S]6 [$U=TS0K32V#QM+*ZIY4;2MN,:?W5]!0!Q,!M MHF%Y>V5H;!KR:VV1APZ!-V&SGG[M6[.\\,7:*_\ 9F(W;".LC,&^0N.<]<#I M72P^&=.BG>0K)(C.[B&1LHC/]X@>IR:5?#6GKIQL")&@W*R GE,= /;M0!RT MMYX'-+D8F+.P*JO$&RC,HPI8=R! M0!SS7?AZ))6DT61055HAO8F0%]GKQ\U.2?P^C'[9HSVR*9%9FD8X9%W$=>1C MO6W8>$K*UM]D[R7$AQ\[G[H#;\#T&>:N2:/IEQ,RRQK(P9I&1C_>&T_F* .4 MAN_#]Q;120:*99)I"D:I,Q# )OSN^E6=.@TO4==-G'HL8M/LHG$QF;=DG&"N M:WH]&T[3[>)I';R[ M'+6&SN=7@MT"1+=<*&)Q\H]:WJQ]&_Y".L]/^/KM_N"MB@ HHHH **** "BB MB@ HHHH **** "BBB@ HHHH **** "BBB@ HHHH **** "BBB@ HHHH **** M "BBB@ HHHH **** "BBB@ K%ECCE\7()(T<"Q/WAG^,5M5D-_R."=/^/ _7 M[XH T?LEM_S[Q?\ ? H^R6W_ #[Q?]\"IJ8)8VD:,.I=1DKGD4 >>PW%U%HX MU8W;2S?VAY/V=U4QE#)MQ@#/ JUIVN*D5@'L(K>SFDD5IGC#+N\TJ$SV/_ZJ MZBW\.Z1:W7VF"PB2;<7W#/4]3CI2?\(YHX,)^P1?N6W1CG"G.[./KS0!@+KK M'1_[5^QVAAN+@6\$04;HR7*;F/?D9Q3[/6]VM6VE7%G;.YN)8)9T0!25C#@@ M=NN*W/\ A'='43_Z!"!<']Z.<,0K[PO/#>N>M '+)XH MEN+22XBTVU5(+,W+_O@4U[2VV-_H\/3^X*L9STIK_ZMOH: ,KPN-OANR 4+A#P!@#DUKUD^ M&?\ D7++@CY#U^IK6H **** "BBB@ HHHH **** "BBB@ HHHH **** "BBB M@ HHHH **** "BBB@ HHHH **** "BBB@ HHHH **** "BBB@ HHHH **** M"BBB@ HHHH AN_\ CSG_ .N;?RK/T-7/A>S5"5/SCME?"\J_MGI79QQI$FV-0J^@IU 'F<]OXAU"V MU!;C^US$)8IHXRFUEPPRJG^( 5I7::S')(/MOVF>:^W1RPJ(L_NW4H-Q(^N?QJ74XKK^V]5B2SO&6[L#%%/$O MRAL'C/8UUU% 'G-Q9ZJ=.L[,IK36R6:*%498S!N?,]L5W>GSF6V"F":(Q@(1 M(FW/';VJW10!C:+_ ,A'6>G_ !]=O]P5LUC:+_R$=9Z?\?7;_<%;- !1110 M4444 %%%% !1110 4444 %%%% !1110 4444 %%%% !1110 4444 %%%% !1 M110 4444 %%%% !1110 4444 %%%% !60W_(X)T_X\#]?OBM>LAO^1P3I_QX M'Z_?% &O7#ZVNH1:GJLMH;B-G%NBR1?> +@-C\*[2"P^TM%B(XZ_-F@#F;BXUK2I+Z:.XO+F&SN=D<;_.TJO&,?7#FF._B"+6 M+>U>ZN%P(F1FEP) 3EP5Q\Q'(^E=BNKZ:]J]T+N$P(<,^[@&E&J:=)/'$+J$ MRO\ <7//3- ' WPU*ZM[^SFO+VX6&>.9KJ&3 5?,Y7;CY2!5F0:O//?3PZGJ M0CCU**&$*_RM P7)Z<]3S7;+J.GFXGMUN(?-B&Z5<_='O3/[7TT1)(+N'RW? M8K9X+>E '#W=UXA0QV@N;I8D\Q(KAY-C,^>-YQ\WL*N/_;?VB>X-Y>[TU** M1@_NS$57<0/KFNA?Q'ITD\EM;R)-/#<)#(G3:6[U>75+!YIX5NHC) ,RKG[M M &/X)@-KHC6[S7#S1S.)$G;)0[CQ],5T3_ZMOH:@M;VTO-YM9HY-IP^P]#4[ M_P"K;Z&@#*\,8_X1NRP<_(?YFM>LGPSG_A'++(Q\AX_$UK4 %%%% !1110 4 M444 %%%% !1110 4444 %%%% !1110 4444 %%%% !1110 4444 %%%% !11 M10 4444 %%%% !1110 4444 %%%% !1110 4444 0W?_ !YS_P#7-OY52\/? M\B]8<8_AS0!T5%8W M]O2?] 74_P#OR/\ &C^WI/\ H"ZG_P!^1_C0!LT5C?V])_T!=3_[\C_&C^WI M/^@+J?\ WY'^- &S17/W'BH6TL$D_Z NI_]^1_C M0!LT5C?V])_T!=3_ ._(_P :/[>D_P"@+J?_ 'Y'^- &S16-_;TG_0%U/_OR M/\:/[>D_Z NI_P#?D?XT +HW_(1UGI_Q]=O]P5L5C:"L[2ZCWDA;(612IQZ$8KEQI& MM-H4FC.ENL2@B.=9#EP#D KCOT-:@\/(#_R$M3_\"31_PCZ,8J)]$U"_P!=UB..UCBMI+Z&4W3, M5?"!3A1W'%=-_8"?]!+4_P#P)-'_ CZ9_Y"6I?^!)H YIO">K26JV3>0J6Z M7.R<2'=,90<;ACC&?TJ?6O#FK7&A6NF6*P+$MIY,BK(8R'QC.<W%02>%-7FLELB+=%MH;E(YED.Z8R=-PQQC\:Z;_ (1]/^@E MJ?\ X$FC_A'TQC^TM3_\"30!7TK19M/UR2ZQ&MNUC# %0_QJ3GC\:W7_ -6W MT-9/_"/)C']I:G_X$FC_ (1Z/&#J6IG_ +>30 OAC'_"-V6#GY#_ #-:]065 MG%86<5K "(HAA@ HHHH **** "BBB@ HHHH **** "BBB@ HHHH *** M* "BBB@ HHHH **** "BBB@ HHHH **** "BBHGNK>)MLD\2-Z,X!H EHJ#[ M=:?\_4'_ '\%'VZT_P"?J#_OX* )Z*@^W6G_ #]0?]_!1]NM/^?J#_OX* )Z MQQXJT1AE;]",D9"-V_"M WUIC_CZ@_[^"LKPU=VH\/V@:>$-AN#(/[QH F_X M2C1?^?Y?^^&_PH_X2C1?^?Y?^^&_PJ_]LL_^?F#_ +[%'VRS_P"?F#_OL4 4 M/^$HT7_G^7_OAO\ "C_A*-%_Y_E_[X;_ J_]LL_^?F#_OL4?;+/_GY@_P"^ MQ0!0_P"$HT7_ )_E_P"^&_PH_P"$HT7_ )_E_P"^&_PK12YM9&"I/"S'H X) M-2X'H* ,G_A*-%_Y_E_[X;_"@>*-&)P+U?\ OAO\*UL#T%0?;+/_ )^(/^^Q M0!0_X2?1CC_35YZ?(W^%'_"3Z,>GR-_A1_PD^C''^FKST^1O\*O_;+/_GY@_P"^Q1]L ML_\ GY@_[[% '*Z[XATJ74-$9+L$+=[B0C<#:?:MO_A)]&SC[:N?]QO\*@U: M[M3J>CXN(,"X;/SC^X:UOMEG_P _,'_?8H H?\)1HV,_;EQ_N-_A1_PD^C9Q M]M7/^XW^%7_MEG_S\P?]]BC[99_\_,'_ 'V* *'_ E&C8S]M7'^XW^%!\3Z M,#@WJ_\ ?#?X5?\ MEG_ ,_,'_?8H^V6?_/S!_WV* *'_"4:+_S_ "_]\-_A M1_PE&B_\_P O_?#?X5IQR0S F)T< X)4@XI^!Z"@#)_X2C1?^?Y?^^&_PH_X M2C1?^?Y?^^&_PK4D>*)=TC(B],L0!47VRS_Y^8/^^Q0!0_X2C1?^?Y?^^&_P MH_X2C1?^?Y?^^&_PJ_\ ;+/_ )^(/^^Q1]LL_P#GY@_[[% %#_A*-%_Y_E_[ MX;_"C_A*-%_Y_E_[X;_"K_VRS_Y^8/\ OL4?;+/_ )^(/^^Q0!'8ZI9:D'^Q MW"R[/O @C\ZN5@V=W:CQ/J1^TP!3##CYQ_M5K_;K3_GZ@_[^"@">BH/MUI_ MS]0?]_!1]NM/^?J#_OX* )Z*@^W6G_/U!_W\%'VZT_Y^H/\ OX* )Z*0$$ @ M@@]"*6@ HHHH **** "BN2L-0U?6=?UZUAOTM(=.N4AC40!RP*!LDGZUJ_V? MK7_0=7_P#7_&@#8HK'_L_6O^@ZO_ (!K_C1_9^M?]!U?_ -?\: -BL?5I+E] M2T^R@N3 D_F%V4?,=H!&*/[/UK_H.K_X!K_C5>70]6FO+>Y;71O@W;?]$7^( M8/>@"S_8]W_T%KC\J/['N_\ H+7'Y4?8-9S_ ,AL=?\ GT7_ !H^P:S_ -!L M=/\ GT7_ !H /['N_P#H+7'Y4?V/=_\ 06N/RH^P:SG_ )#8_P# 1?\ &C[! MK./^0VO_ ("+_C0 ?V/=_P#06N/RH_L>[_Z"UQ^55-376=-TV:\_M=9/)4-L M^RJ-W/UKH$.Z-6/< T 97]CW?_06N/RH_L>[_P"@M)8Q;JW"GU- %G^Q[O\ Z"UQ^5']CW?_ $%KC\J/L&L_]!L=/^?1?\:/ ML&L_]!L=?^?1?\: #^Q[O_H+7'Y4?V/=_P#06N/RH^P:SC_D-C/K]D7_ !H^ MP:S_ -!L?^ B_P"- &7<:=J$FOQ62ZU=1Q_93*<#J=V*L_\ ".7W_0?O?TIQ MT35CJ0O?[=Q((3$!]D7&"G_/HO\ C0!5_P"$?^)V/;_1%_QJ'?J=CK%A#<:@MS#/$2#CCJ.:G7PW?*H4:_><# P!71U4U2XDM-*NKB( M@211,RDCC(% &1_PCE]_T'[W]*/^$_I4\%IK4]M'+_;:CS$5L"T7C M(^M2?8-9Y_XG8]O]$7_&@"I_PCE]_P!!^]_2C_A'+[_H/WOZ5;^P:SS_ ,3L M>W^B+_C1]@UGG_B=K[?Z(O\ C0!4_P"$)+K-PY@N MGB4X[#'7\ZTOL&L\_P#$['M_HB_XU6M=$U:T-QLUP'SYC,_M0!9_L M>[_Z"UQ^5']CW?\ T%KC\J/L&LY_Y#8_\!%_QH^P:S_T&QT_Y]%_QH /['N_ M^@MB_XT '] MCW?_ $%KC\J/['N_^@MM;- &1_8 M]W_T%KC\J/['N_\ H+7'Y55LCJ^I">9-42!$GDC6,6ZM@*<#DU:^P:S_ -!L M?^ B_P"- !_8]W_T%KC\J/['N_\ H+7'Y4?8-9_Z#8Z_\^B_XT?8-9Q_R&QG MU^R+_C0 ?V/=_P#06N/RJ.R^U6OB!K&6\>>)K7S@''(;=CK4GV#6?^@V/_ 1 M?\:K_P!B:M_:/VW^W!YGD^3C[(N,9SZT ;]%8_\ 9^M?]!U?_ -?\:/[/UK_ M *#J_P#@&O\ C0!L45C_ -GZU_T'5_\ -?\:/[/UK_H.K_X!K_C0!L45S]R MVK:68)Y=26ZC>9(FB-NJ<,<9R/2N@H **** "BBB@ HHHH **** "BBB@ KG M;/3;*^UG6'N[2*9EF4*TBAL#8*Z*L?2/^0OK7'_+=/\ T 4 3?\ "/Z/_P! MVU_[]BC_ (1_1_\ H&VO_?L5I5S:^([F;3Y-3AM$-CDK&68A\J2"2/3(H TO M^$?T?_H&VO\ W[%'_"/Z/_T#;7_OV*I7'BJP1)H8)HY+Z%%=[ MQFA6Z_=Q/#YK2=0M $G_ C^C_\ 0-M?^_8H7P_HZ@!=-M0!T B%1+XHT9UA M9;U3YTABC&ULLP&2,8STJ:77M,A3?)=HJX=LD'H@RWY4 ']@:1_T#K;CG_5B MC^P-(_Z!UMQ_TS%1?\)+I DM8VO55[O'D!E(WYZ8R*;#XIT6>.9X[U2L(RY* ML.,XXR.>G:@"?^P-(_Z!UMQ_TS%']@:1_P! VVX_Z9BH?^$HT7[5;6QOXUGN M<>3&P(9L].".]:] '.ZIIEA93Z7):VD$,GVZ,;D0 X.2-FV-YKE< M$]/PH F_L#2/^@=;=<_ZL4?V!I'_ $#K;KG_ %8JO#XGTME=);R,31*/- 5M MH.0O!(Y&3BIKG7]-M9?)DN5\XL45 I)+>G H =_8&D$Y.FVO!R/W8H_L'2?^ M@=;?]^Q4%MXETV5UA>X5;CRVD:, G:HZD^@J.'QAH4[A8[X$DJ!F-@.>G;O0 M!;_L'2?^@=;?]^Q1_8.D_P#0.MO^_8HOM2>UU&RM(HA(TY8OSRJ@9S^?%9:^ M);GSYK%K-!J"SB"-0_[MB5W=?8=: -3^P=)_Z!UM_P!^Q1_8&D8Q_9MMC_KF M*QD\7R3@B"R^:WB::[#MC:JL5.WU/!//:FV_C(7DL0MX8RMTC_94+_O"RKN^ M=>P- %_P];0VMYK$<$*1)]J^Z@P/N"MVN>\+7:7YU*ZCZ27/(]#M (_.NAH MQ/%$,4]A:QS1J\;7D.5;H?FJU_8.D_\ 0.MO^_8J#Q%_QZ6G(_X_(>O^]6Q0 M!G?V#I.?^0=;?]^Q1_8.D?\ 0.MO^_8K1K#UO7SI4AB2$/)Y>Y=QP,T 6_[ MTC&/[.MO^_8H_L'2&._5EWB23$94]&!]ZT1XA M@_X1V#5C!(1.!Y<(^\S$X"B@"?\ X1_2,D_V;:Y(P3Y0H_X1_1_^@;:_]^Q5 M9-=%I$S:N]M#^\6-3 Y?+-T4CJ#4W_"1Z3]J>W-XHD3.X%2 ".HSC&?:@!__ M C^C_\ 0-M?^_8H_P"$?T?_ *!MK_W[%,N/$>DVJDS7BK@H.%)/S@E>@[@& MKUG>6]_;+<6L@DB;HP_SQ0!4_P"$?T?_ *!MK_W[%07N@Z2MC<,NFVP(B8C$ M8]*V:KWW_(/N?^N3?R- %?0O^0#89_YX)_*M"L_0O^0!8<8_<)_*M"@ HHHH M **** ./\(_\C5XR_P"PA'_Z)6NPKC_"/_(U>,O^PA'_ .B5KL* "BBB@ HK MGO$6NW6E7EG;VR6A\])'9KB0J %&>,=2:Q9/'MTFI06YL8DCD6$LKE@_SDCC MC Z=Z .[HK#T_5=0U2Z>6VM[8:UDF?[ M(=P!4CH3Z G-:(\4Z6UO=3K,6CMDB=V [2?=H VJ*Y&U\6N);Z>_AD@B2X-M M;1';^]8=<'/7'K6A%XNTV>:&*W,DK20-<.47(C1>"2?8\<4 ;U%8J>);:32& MU*.&1H1RN"/F7&.A5K&&T^TJPZGC)H Z.BN2;Q%>?9?, M5HA-]@^W^41_RSW=<_[M:%UKC[M)%LHV7R&1F/5$V;@: -VL?4_^0[HO7_62 M_P#H%8[^*IDM)+F*2.?RI(U=-N/E9MI/X5L:D0=7&/]R@#8K/UW_D M 7_3_4/U^E:%9^N_\@"_Z?ZA^OTH L6/_(/MO^N2_P A5BJ]C_R#[;_KDO\ M(58H **HZOJ*Z5ITET5WL/EC3^\QZ"J$FM7.F6BS:Q';1M*0L,<$A)9CV^; MH W:*XJ7QG)+JD2V1BDLI7M=KGKMD9@WY;:VO^$GM#;?:!'*89'$=LX'%PQS M@)^7>@#;HKGW\76">7&(YFN6,@-NJY="F-X/TS5K2?$5CK+E;4O@QB6-F7 D M0_Q"@#6HHHH QY_^1NL^1_QZ2?7[RUL5CS_\C=9\C_CTD_\ 0EK8H Q_#G_' ME==/^/R;I_O5L5C^'/\ CRNN1_Q^3=/]ZMB@ HHJGJUZVG:3=WB(':")G"DX M!P* +E%<;;^+KN6WT>ZE2W6&[=O.\O=\JB,O_$!SQ6HOBJUDLX+B*WN)/M W M0QJOS.@&2V/04 ;U%8$OB[3$>-8S)*"BN[(O$:D[03^/%;P(900<@C(- "T4 M44 8WB3'V*USG_C\AZ?[U;-8_B/_ (\K7K_Q^0]/]ZMB@ HHHH **** "BBB M@ HHHH **** "L?2/^0OK7'_ "W3_P! %;%8^D?\A?6N/^6Z?^@"@#8KGXO# M+PV\EG'J4HL&8LMN8U.W)R?FZGDU'XX,X\-D6\C([7$*[EM4GU M#4+25;>UFB,%O;+.S1L91(2Y!7<>>E $J>"$^U&:34II/EV@-&N['NW4UJ7_ M (?BOY(G:>1#''Y8 YKF#K>KVCWR>?+,TUYL3Y5'V==H(Z\8)XYJX^NZPEK M=74AAB%K"#LVY#L3C)/IWXH T+OPFMR9#'?R0M)G>JUAK6J7M_;6*SJT37$B-=K']Y50,,=NIQ M^%4K?Q%?Z=8V3B&26$V[%(@=[O)O88;/S8]"/QH V[_PDM_J=I=O?RJEN8B( M3&K E,X()Z9SSBDE\(6[6EG";V57M!B&3 R'R2&QWZ]*QSXCUI--:Y>U= "",@Y'J*\_LKN=VLE:.X 8VH;,KG&6?.:Z?PP[-IDL6XO' M!,'ZUUMW_ ,><_P#US;^54O#W_(O6 M'.?W*]* ,6Z\"6UQ+&XO&4[?WN8E8NQ8$MD_=)([5O:II<6J60M9798\@G'4 MBK]% ',-X.$L;1S:E,Z+%Y4 V*/*7<&'UQ@=:L6?AIK>[%U<:A))+A[:_P!#?SC%";W$K;]J[=C?>]LUDMJFHVVJZJHU#?"UQ$D;.HVP M(RYW#U':@"^?""/)&R:E*J(LB,(T4&0,",,>X&>E6)/#$$MK]F^U2 +'#'P! MD>601^>*A\&76[2?)FE+W#33."0?F7S"-WTK'M;N]$45W;EVNFGG\PLQ(*(Y MX(_W1Q0!TVIV%Q<:I9W-K(L;HKI(YY*J0<$#O@U0MO"4EO91Q_VM,]U'+YR7 M31*6#GJ3ZY_2JD>J7.HZAH=\0T,5SO\ O5KM]T_2@!:Q=9\.IK#M(;J2"3R]BLJ@[??F MN;TW5M7CL(521MEO;I*WFKN:4M(P()[8 %6+CQ/J\<$RBT)EM"([@JO4MT9< M\8'O0!=NO!HO$62?47DO ZLT[0J=RCHNWI^-: \.P#P]%I/G/B$ QS 896'1 M@*PTU[54FLDNN(I&\O?&%9FR."W_ -C5>QU+7%TO3X4OO.FDBGEFEDC&Y"AX M3 _KS0!LP>$8X[PW?>R26KW#72VY0 M?+(>^[J<>E9%SXEUBVB:-H_,DE,'[R-0/)\P'/7C QU/K5A=;UHS[G\I5@B@ M:2-5SO+YSS[>U "S^$K^,PO!JLDEP;F)C,\2_NT16 P.AZUT>E::FEV?D+(T MKL[222,,%W;DG':L'2;B\;0=8:\O)+F2.YE501M9%!X'%5H-;U:)H) OF0>8 ML(AVY)!0G<3USD4 =K5>_P"=.NAT_@:H;JRAENKM))KD!A&%QY9( MY3\/?FM2^_Y!]S_UR;^1H P=&TW5#H=B4UR11Y"X'V9#VJ[_ &9J_P#T'Y/_ M &2K.A?\@"PZ_ZA.OTK0H QO[,U?_H/R?\ @,E']F:O_P!!^3_P&2MFB@#& M_LS5_P#H/R?^ R4?V9J__0?D_P# 9*V:* .*\$1RQ>(O%Z33F>0:A'F0J%S^ MZ7L*[6N/\(_\C5XR_P"PA'_Z)6NPH **** ,V^T2UU#5+&^N%#M:;]B,H()8 M8S^%9^H^%O[0U*YN?[0EB@NHTBGMUC4AU4]CU'X5T5% &+8Z#+IER?L>H21V M9??]E,:D#C'#=>U;5%% !1110!E>)O\ D7+[K_J^WU%:47^J3_=%9OB7_D7+ M[K_J^WU%:47^J3_=% #ZP-+AN)[&_2WNC;R?;Y3Y@C#<9Z8-;]8_A[_47W7_ M (_INOUH I6'@VWL)?,2Z,6QMH-1FBADBACN%\ MM29?*^Z<]OPKK** .;N?!]O<0,AN&#_:S=H[1JP5B,8P>"*M6OAZ*UO?M238 M;[,8-JQ*J\G.[ [UM44 2FS:,?C70T4 E;& MI*%UO10,@!Y1C_@%;%8^I_\ (=T7C_EI+_Z!0!L5GZ[_ ,@"_P#^N#]?I6A6 M?KO_ " +_M^X?^5 %BQ_Y!]M_P!+3XK)=4F$-M*LUI^Z7,+*21_O=>]=-10! MSEKX2BM[^.^:]EDN%$_F,5 WM+C)QVQBK6E^'X]+DMV2XDD\BW$ # #(SG-; M-% !1110!CS_ /(W6?(_X])./^!+6Q6//_R-UGR/^/23C_@2UL4 8_AS_CRN MN0?],FZ?[U;%8_AS_CRNN0?],FZ?[U;% !574;,:CIUQ9LYC$T90NHR5SWJU M10!S3^$VN+6R@N]3EF^QAEC;RU4X,93G'L];U% '.1^$+6*&2*.XE59(1$W Z[MQ;ZDUT$2"*)(P@-9?]K:G_P! "X_[_)_C1_:VI_\ 0 N/^_R?XT :0LK01^6+ M:$)NW[=@QN]<>M)=65O>"(3Q[A%(LJ<]&'0UG?VMJ?\ T +C_O\ )_C1_:VI M_P#0 N/^_P G^- &MY,>W;Y:@8QP*9:6D-C:I;6Z;(D&%%9G]K:G_P! "X_[ M_)_C1_:VI_\ 0 N/^_R?XT .UW[VE\@?Z?'_ %K7KGKB74M2N;%&TF6W2*Y2 M5Y'E0@ 9[#ZUT- $-W_QYS_]"YC\NXACE3^ZZAA^M)]DMMI'V>+!4*1L'('0?2LS^UM3_P"@ M!YAG,0\R$$1^BY M]!5BL;^UM3_Z %Q_W^3_ !H_M;4_^@!(8KJ6QA-I;FXDCN8Y#&&"DJ#SR: M0ZMJ0Z:#<'_MLG^- &J(8@,"- ,8^Z*#%&0P,:$/PPV_>^M9/]K:G_T +C_O M\G^-']K:G_T +C_O\G^- &FMI;)Y>VWB'E#$>$'R_3TIRV\*%BL,:EB22%') M/6LK^UM3_P"@!&1&1XHV1AAE*@@CT- M*(8E7 C0# & H[=*R?[6U/\ Z %Q_P!_D_QH_M;4_P#H 7'_ '^3_&@#66&) M"Y6- 7.6PH^;ZT"*,8Q&HP(O$-P=,DN(;^Z2:%XY%' C5>:I?Z3A7(>1< ^:GJ/>NEC!$:@]0!FG44 %NDHH QO[7U+_H 77_?U/\:/[7U+_H 77_?U/\:V:* ,;^U] M2_Z %U_W]3_&C^U]2_Z %U_W]3_&MFB@#&_M?4O^@!=?]_4_QH_M?4O^@!=? M]_4_QK9HH QO[7U+_H 77_?U/\:/[7U+_H 77_?U/\:V:* ,;^U]2_Z %U_W M]3_&JQEU"_US3))-(FMX8&D9Y7D4@97 X!KHJ* "J6L12SZ+>Q0)YDKPLJ)G M&XXX%7:* ,&UU/4HK6"-M!N=RQJK?O4X('UJ7^U]1P?^)#=0- GRAPHIC 8 organizationalstructure.jpg IMAGE begin 644 organizationalstructure.jpg M_]C_X 02D9)1@ ! 0$ 8 !@ #_X0 Z17AI9@ 34T *@ @ U$0 $ M ! 0 %$1 0 ! %$2 0 ! #_VP!# @&!@<& M!0@'!P<)"0@*#!0-# L+#!D2$P\4'1H?'AT:'!P@)"XG("(L(QP<*#7J#A(6&AXB)BI*3E)66EYB9FJ*CI*6FIZBI MJK*SM+6VM[BYNL+#Q,7&Q\C)RM+3U-76U]C9VN'BX^3EYN?HZ>KQ\O/T]?;W M^/GZ_\0 'P$ P$! 0$! 0$! 0 $" P0%!@<("0H+_\0 M1$ @$" M! 0#! <%! 0 0)W $" Q$$!2$Q!A)!40=A<1,B,H$(%$*1H;'!"2,S4O 5 M8G+1"A8D-.$E\1<8&1HF)R@I*C4V-S@Y.D-$149'2$E*4U155E=865IC9&5F M9VAI:G-T=79W>'EZ@H.$A8:'B(F*DI.4E9:7F)F:HJ.DI::GJ*FJLK.TM;:W MN+FZPL/$Q<;'R,G*TM/4U=;7V-G:XN/DY>;GZ.GJ\O/T]?;W^/GZ_]H # ,! M (1 Q$ /P#W^BBB@ HHHH **** "BBB@ HHHH **** "BBB@ HHHH **** M"BBB@ HHHH **** "BBB@ HHHH **** "BBB@ HHHH **** "BBB@ JCJUY) M867GQ0I-(98HE1W* EY%09(!P/F]*O5B>*D=]%VQRO$YNK;:Z $J?/CY&01G MZ@T 2BXUS_H':;_X,)/_ (S1]HUW_H&Z;_X'R?\ QFO/XM?\0+%H4IUB_D?4 M+&UG9WAMOLT?KN>)]0LI)5>W:,2VN(RNT*Q1QDCYOX6!_P!OVK.?Q)?:/?7RR)=:FLE] M-% C-%&ENDR7*VYT*='\J M69F=F52L97(0,@=B=XZHH]Z -07&NGIINF_^!\G_ ,9H\[7O^@;IO_@P?_XS M6*?&*QO#(]I* T;!=DJ-$\GGI"%SC>"&9>2!@-R">%:_CF2.]:U?19@8>+B7 MSUV+B81'9_$W)!&0O!['B@#<\[7O^@;IO_@P?_XS09M>_P"@;IW_ ('O_P#& M:Q?^$YW07-S'I-R;2-]L=RP9(W +@DDKQ]SW'SKEASC8U+69+&2%5MXY%GC8 MQ%IMNZ0=$^Z>OK['@T 6-'OVU+3_ +0\(A=9IH'17W -'(T9P<#(RI(X%7ZQ M/"N?['FSU_M&^S_X%2UMT %%%% !1110 4444 %%%% !1110 4444 %%%% ! M1110 4444 %%%% !1110 4444 %%%% !1110 4444 %%%% !1110 4444 %% M%% !1110 4444 %%%% !1110 4444 %%%% !1110 4444 %%%% !1110 444 M4 %%%% !1110 4444 %%%% !1110 4444 %%%% !1110 4444 %%%% !1110 M 4444 %%%% !61XEB2?24CD!*O>6JM@D'!GC[BM>LOQ!_P @Z'_K]M/_ $HC MH YS6$T/P\QM3X=O+N!M/=7,,B&-+:/&Y2))5Z97@ ]>.]:L5EX:,EO.3 LL ML7VB+S9F5V&S!EPQSN"'&\_,!QFJ6OZ):^*=5BC6YLG^QQR*2&#S6TQ*LLBC ML5*#KC.3^.=K'A6^N[>^O]26UOKB2SP8XQ*0LJQ.F8TS@[MYX()&3RV87/$9X!3[W)X P?:H)--\+3RR3/);,SW+JY^UG'GE2K+ M][ ;:<$=<5@Z)X4,EWI>L!;*,Q=8XHBAB @$.%!&588.>F, =LTMAX+DM-.A MTZ.YM&N;6.*-YA)(9&5!M5F4DCD#[F-N1P>!@ Z7R_#L*21M+8XMX19RB28' M8G)"-D\=^#[U0C;PC;W4D0O+17M[92_F79(6*7@"-1L+*&PAO[$2?8[>!LI\V(?,4 ME,@[0,C! ZY !TMSIOAV(21M'!+,MJS&!KC+M$3N)PS=R!\QQT'(Q0^C M^&I)VAF6#[1%""\;7)WJFX/EANS]X [CU(ZUBKX1N;?PW=Z;T$4\Y4%;G"M*2=P7#8!))R!UR%O^01/_P!A&^_] M*I:VJQ?"W_((G_["-]_Z52UM4 %%%% !1110 4444 %%%% !1110 4444 %% M%% !1110 4444 %%%% !1110 4444 %%%% !1110 4444 %%%% !1110 444 M4 %%%% !1110 4444 %%%% !1110 4444 %%%% !1110 4444 %%%% !1110 M 4444 %%%% !1110 4444 %%%% !1110 4444 %%%% !1110 4444 %%%% ! M1110 4444 %%%% !67X@_P"0=#_U^VG_ *41UJ5D^(MXTL.LZH=.MKIT6.9E\VTVS0%I59EBEZ2!P78#DJ0 M,GM5NWEU'[3;BYDU;["TLAMG2%O-X==JR@KD C=RX''4@UN_\)+8?\^^J_\ M@INO_C='_"26'_/OJO\ X*;K_P"-T GZZ+R[M[;S9_)VG[0L4VX'8A9E#;,;1M^ M[\P7@^B_\)+8?\^^J_\ @INO_C='_"2V'_/OJO\ X*;K_P"-T ^+= M-N[RQU!IHS*I=[HP!4][+>IXCM->CLYY(%N#9.%M MYO.\AA@G9M^Z' ?=W''/%;LOBK3+>!YI8M4CBC4L[-I-T H R2?W=-MO%VE7 MEK#=6R:G+!,@DCD32KHJZD9!!\OH1B@#CK:Y\0F)DE;6;F*3#7/G6C*_EBY8 M'8-@&[RMIP!G&<#.*&NO$L-^C-/K3P+]E\E3:,08S+SI5Y4)G.SR MR2Q'&W SNKL/^$EL/^??5?\ P4W7_P ;H/B2Q[6^J_\ @INO_C= #?"O_('F M_P"PC??^E4M;=8WA=)%T9FDBEB\R\NY566-D;8]Q(RDJP!&5(/([ULT %%%% M !1110 4444 %%%% !1110 4444 %%%% !1110 4444 %%%% !1110 4444 M%%%% !1110 4444 %%%% !1110 4444 %%%% !1110 4444 %%%% !1110 4 M444 %%%% !1110 4444 %%%% !1110 4444 %%%% !1110 4444 %%%% !11 M10 4444 %%%% !1110 4444 %%%% !1110 4444 %%%% !1110 4444 %%%% M &7XE_Y%;5_^O*;_ - -4_ O_)/?#7_8*M?_ $4M7/$O_(K:O_UY3?\ H!JI MX%_Y)[X:_P"P5:_^BEH WZ*** "BBB@ HHHH **** "BBB@ HHHH **** "B MBB@ HHHH **** "BBB@ HHHH **** "BBB@ HHHH **** "BBB@ HHHH *** M* "BBB@ HHHH **** "BBB@ HHHH **** "BBB@ HHHH **** "BBB@ HHHH M **** "BBB@ HHHH **** "BBB@ HHHH **** "BBB@ HHHH **** "BBB@ MHHHH **** "BBB@ HHHH **** "BBB@ HHHH **** ,OQ+_R*VK_ /7E-_Z M:I^!?^2>^&O^P5:_^BEJYXE_Y%;5_P#KRF_] -5/ O\ R3WPU_V"K7_T4M & M_1110 4444 %L>+[[0=/G:TATV&.2[N556D9I,E$4,"HX4DD@]@,=: MZNN6;0[S3?%]WK^FB.9=1MXXKNVD?8=\>=CJV#V8@@_GVH S?^$Y30=0U72_ M$!>66P\EX[BWA)\Z*5MJ[E' 8-A3T!R",=*UK?QIIL_VR)HKR"[M94B:TFAV MRN9/]657/(;G!SV.<8-UT+7?$%]Y/]HWUQ8111(Y*11)\%7VO75YJ\D-B+TM;>19W/[Z"18BY99./XO,(Z<8!H VSXYTT) M$KVU^+F2YDM&MA!ND29$+E&VDCE1Q@D'([9-2+XRL3=V]N]K?1":2. R21!5 MCFD0.D; G<&P1VP"<$UD1>'=0MKK19['0-'T];>^>YN+>S<(H!A:+J$&]OFS MT' INL>&]=U#6DNF6VG2WU6"[MG>X9=D*XW($VD!NN3WX^E $R>,8[_ $^X MGNK;4M,BAU==/22+RG+N)?+VG!;"[AAL@<'Y2>M:]]XNT[3IY%F6X-M#,MO< M7BH#%!(V,*QSG^(9(! SR17-W/A;7%TB[L88;20OK_\ :D;&A8KU+&68PX2.1\;0#U].:M67B.UO]1-K!;71C\V6%;K8/*:2 M,D.N#^[_P#' MO:M;3M"OX_$RZH+6'3C)+(UX+:Y+1W:G(0M'@#S/NDM]1SF@"?4];O+CQ?;^ M&-,D6"06IO;NZ9 QCCW!0J \;B3U.0 #P:MBXOM&EN'U*Z-[:MY26>V)1,\C M%@R$+@$_=P<*,9ST)JKJ>@WL/BZV\2Z48GF^RM9W5M*VP2QY#*P;!PP/J.0> MU1^)]$U'Q%I"J;>P,T$\<\-I=CS89=N=RR<="#@<<8S] ":/QOIKK&A@OEN7 MNVLFMO)R\@JHGA^_MWT>2ST#2-/2WU#[7<063A5 $3Q]0@WM\^>@X&*K:5X M7UNS:&:2"U\V+6[F_"?:#AHY5<==O4%AQ^M '1'Q?IXOH;8Q78CN&DCM[D19 MCFD0$LBX.<_*<9 !P<$U/H/B*U\10>?9V]Y';F*.5)9X2BR!L_=)ZD8Y].*Y M?0_!UUHMTX.@Z!<&WEDEMM26-5N7!+%5;Y.&YP7W=.WKTOA*RO=)\+:=I^H1 M11W-K L+>5)O4[> 0<"@"E'XITZU>]=YM3F U(615X,^7(57"J =O(ZY))/ M6M71M=MM;CNC#%/#):3M;SPSJ%=' !YP2,$$'(-&]+U/3-1\1W5U;P@7]Y]IMU2;<2-@7#<<'Y1Z]: $U MOQ+\E/6.24'ROPRN#_OK5W5O%-GI&III\EK?W%T\!N$ M2UMS(2BLJG&._P X/T!]L\_J'@R76/"6JQ7L4D>LWPDD81ZA*(O-_@; POR@ M(!E>B"K.E:=XD/B32=3U6UM,P:8]E=21W)8L[-&V\#:./W?ZT 7?^$WLFU6Q ML(]/U"5;Z:2"WNE1!"[1YW\EP0!@]N<<9J3_ (3/3!<"*2.ZC62"2XMI#&"M MTB?>\O!)) YP0,CD9'-:?;G3AJ;0_1NA) MP"<59T7P7=:3IS6HT#P^MQ;020P:C!&%FN 5*KGY,H<$;CN;..G/ !N#QW8R MVLD\-E?,?[.;48%=%3SXAC=M);J,C.<=>,TFG^)4OVT*:ZCO[2ZO;%[E;1%5 MHW 5222,G/(*@'.#R/3%B\*ZV5TB&6"VC6VT*;3)G6?.V1PH# ;>1\F>WWO: MK=IHNO6EWX7G-E:N-+L'MI@MR1EBB*,97_8_\>]J -33_'.DZ@;9D2ZAAN[1 M[NWGFBVI(B8W G3IFK>B>)[37+AH8;>ZMY!!'UL/"\4$=G#^&O^P5:_\ HI: M.@HHHH **** "DP/2EHH IZCI.FZO L&IZ?:WL*MN$=S"LB@^N&!YJTD:1QK M&B!448"@8 'IBG44 )M'I1@>E+10 F!1@>E+10 F!Z48'I2T4 %)@>E+10 F MT>E&T8QBEHH 3 HP*6B@!,#THP*6B@!,#THVCTI:* *%MH>DV5W)=VNEV4%S M+_K)HH%5W^I R:O;1Z4M% ";1Z48%+10 F!Z48%+10 4444 %%%% !1110 4 M444 %%%% !1110 4444 %%%% !1110 4444 %%%% !1110 4444 %%%% !11 M10 444C.J*69@J@9))P * %HJC_;6E?]!.S_ ._Z_P"-']M:5_T$[/\ [_K_ M (T 7J*H_P!M:5_T$[/_ +_K_C1_;6E?]!.S_P"_Z_XT 7JS'\0:.DKQMJED MKHQ1E,ZY4@X(//4$8J7^VM*_Z"=G_P!_U_QK%\,ZKI2Z7.)+^S#'4+T_-,O0 MW4I!Z^E &K_PD6B_]!:Q_P# A?\ &C_A(M%_Z"UC_P"!"_XT_P#M?2/^@C8_ M]_T_QH_M?2/^@C8_]_T_QH 9_P )%HO_ $%K'_P(7_&C_A(M%_Z"UC_X$+_C M3_[7TC_H(V/_ '_3_&C^U](_Z"-C_P!_T_QH 9_PD6B_]!:Q_P# A?\ &C_A M(M%_Z"UC_P"!"_XU;M[BTNT+VTT$R@X)C8, ?3BIMB_W1^5 &=_PD6B_]!:Q M_P# A?\ &C_A(M%_Z"UC_P"!"_XU:N+JRL]OVF>W@WYV^:X7..N,U!_:^D?] M!&Q_[_I_C0 S_A(M%_Z"UC_X$+_C1_PD6B_]!:Q_\"%_QI_]KZ1_T$;'_O\ MI_C1_:^D?]!&Q_[_ *?XT ,_X2+1?^@M8_\ @0O^-,D\3Z%"NZ36=/12<9:Y M0#^=3?VOI'_01L?^_P"G^-9FLZKI+-IV+^R.+Q"<3)TVM[T 6?\ A+O#G_0> MTW_P*3_&E_X2[PY_T'M-_P# I/\ &K']JZ-_S_V'_?Y/\:/[5T;_ )_[#_O\ MG^- %?\ X2[PY_T'M-_\"D_QH_X2[PY_T'M-_P# I/\ &K']JZ-_S_V'_?Y/ M\:/[5T;_ )_[#_O\G^- %?\ X2[PY_T'M-_\"D_QH_X2[PY_T'M-_P# I/\ M&K2:EI$CJB7MDSL<*JRH23Z=:N>7'_<7\J ,G_A+O#G_ $'M-_\ I/\:/\ MA+O#G_0>TW_P*3_&M;RXQU1/RJC_ &KHW_/_ &'_ '^3_&@"O_PEWAS_ *#V MF_\ @4G^-'_"7>'/^@]IO_@4G^-6/[5T;_G_ +#_ +_)_C1_:NC?\_\ 8?\ M?Y/\: *__"7>'/\ H/:;_P"!2?XTG_"7>'/^@]IG_@4G^-6?[5T;_G_L/^_R M?XT?VKHW_/\ V'_?Y/\ &@"G_P )GX8Z'Q#I0(Z_Z6G^-+_PF?AC_H8M*_\ M Q/\:KZ)J6CBVNM][8@F]N",RIT\QO>M/^T]%_Y_M/\ ^_R?XT 5/^$S\,?] M#%I7_@8G^-'_ F?AC_H8M*_\#$_QJW_ &GHO_/]I_\ W^3_ !H_M/1?^?[3 M_P#O\G^- %3_ (3/PQ_T,6E?^!B?XT?\)GX8_P"ABTK_ ,#$_P :M_VGHO\ MS_:?_P!_D_QJ:WGT^\W?9I;:?;][RF5L9]<4 J11:_ICR/9R MJJ+=(2Q*' SUJIX-\7^&K7P-X?MKC7],AFBTVW22-[M R,(U!!&>"#7:-!# MCF)/^^16+H,NE6WA+17-[%+;M90^58,]ZV?[3T7_G^T_P#[_)_C0!5_ MX3/PQ_T,6E?^!B?XT?\ "9^&/^ABTK_P,3_&K?\ :>B_\_VG_P#?Y/\ &C^T M]%_Y_M/_ ._R?XT 5/\ A,_#'_0Q:5_X&)_C1_PF?AC_ *&+2O\ P,3_ !JW M_:>B_P#/]I__ '^3_&C^T]%_Y_K#_OZG^- %3_A,_#'_ $,6E?\ @8G^-'_" M9^&/^ABTK_P,3_&M@10D B.,@\@A11Y,/_/-/^^10!C_ /"9^&/^ABTK_P # M$_QH_P"$S\,?]#%I7_@8G^-7'U#1XW9'O+%74D,K2H"".QYI/[3T7_G^T_\ M[_)_C0!4_P"$S\,?]#%I7_@8G^-'_"9^&/\ H8M*_P# Q/\ &K?]IZ+_ ,_V MG_\ ?Y/\:/[3T7_G^T__ +_)_C0!4_X3/PQ_T,6E?^!D?^-*OC'PT^=OB#2S MCTNT_P :LG4]%_Y_M/\ ^_R?XUEZ7J6D+J^M$WMB%:XC*YE3!'DITYH N_\ M"7>'/^@]IO\ X%)_C1_PEWAS_H/:;_X%)_C5C^U=&_Y_[#_O\G^-']JZ-_S_ M -A_W^3_ !H K_\ "7>'/^@]IO\ X%)_C1_PEWAS_H/:;_X%)_C5C^U=&_Y_ M[#_O\G^-']JZ-_S_ -A_W^3_ !H K_\ "7>'/^@]IO\ X%)_C1_PEWAS_H/: M;_X%)_C5V"\TVZD,=OD-HDP2^LBVZ/@2IG[Z^] &B/$6C?\ 06L? M^_Z_XT?\)%HO_06L?_ A?\:>-7TC_H(6/_?Y/\:/[7TC_H(V/_?]/\: &?\ M"1:+_P!!:Q_\"%_QH_X2+1?^@M8_^!"_XT_^U](_Z"-C_P!_T_QH_M?2/^@C M8_\ ?]/\: &?\)%HO_06L?\ P(7_ !H_X2+1?^@M8_\ @0O^-/\ [7TC_H(V M/_?]/\:N(8945XRCHP!5EP00>XH H?\ "1:+_P!!:Q_\"%_QH_X2+1?^@M8_ M^!"_XUH[%_NC\JJ2ZEID$K12WMI'(IPRO*H(_#- $/\ PD6B_P#06L?_ (7 M_&C_ (2+1?\ H+6/_@0O^-/_ +7TC_H(V/\ W_3_ !H_M?2/^@C8_P#?]/\ M&@!G_"1:+_T%K'_P(7_&C_A(M%_Z"UC_ .!"_P"-/_M?2/\ H(V/_?\ 3_&C M^U](_P"@C8_]_P!/\: );34[&_:1;.\@N#'C?Y4@;;G.,XZ=#^56ZY:RU;3% M\8ZL_P#:%F$:TM #YRX)#39[^XK;_MK2O^@G9_\ ?]?\: +U%4?[:TK_ *"= MG_W_ %_QH_MK2O\ H)V?_?\ 7_&@"]15'^VM*_Z"=G_W_7_&I(-2L;F3R[>] MMI7QG;'*K'\@: +5%%% !1110 4444 %%%% !1110 4444 %9?B(?\4WJI_Z M(O\ D6M5_P"O.;_T T 6H[2W\M?]'BZ#^ 4[[);_ //O%_WP M*YG7]:UG39[@64MBL,.FO=JLUJ\C%D901E9%R"#Z=?7I56+Q5J\GA>ZU-(HI MA%=");F.RE'[H$!W-MN\S*'<"N6[@\.O=,=^OY@&[]DM_P#GWB_[X%)]BM\_ZB'_ +X%<5.?'6F"X,)@O]Z+NGS;$ M" "3RV+-T.UNNW/'/(YH Z'[);_\^\7_ 'P*/LEO_P ^\7_? KG$\VMYX'6/#R)) MYQ+G<0%3$0(S@\XZD"@#J/LEO_S[Q?\ ? H^R6__ #[Q?]\"N?N?&$*7UFL, M?^@.':XNI!@1@0F4 >^W!.>.?7.);3QCIU]);10+,TEP[(JJ%?&-N3\K'(^8 ML:N$55'G1\*,?\LUK8K*TXYUC5S_TUC_\ 12UJT <_?Q)+ MXXTE9$5A_9MZ<,,_\M+6MG[';_\ /O%_WP*XSQSJUYHFMZ9J%F8O,2SF1A) M\V5>YLT.%0AB1NS@9SC&.:N:=XLFN+S4#(DDL$+_O@5SI\V-U/=A!: P_9=KJKR!XR_.\@9X/ /;N3B@#I M/LEO_P ^\7_? I#9VYQ^XB_[X%4M.UVUU6YN(;42GR I9V3"G<,CW!]C@]^A M!.=#XO@_M#68IRGD6$/VB/R09))(U+*YVC)R&7H.Q4]Z -\6=OC_ (]X?^^! M1]DM_P#GWB_[X%8R^++9IK:,V5X@GV'<<;"2IP1@$9/0#.=L\/C6QN(!)#:W MSRL1Y=L(1YK@QB72#G QD@$ L^(;6!-,C988U87EK@A0#_KXZVU&! M7)WWB*QUFT,-D7D5+BRD\W;\I#31,/<'##@@5U@Z4 *>16%X7M;=O">C,8(B M38P9)0?W!6[7*6ESJ=IX"T.?2DMY9UM;8-#,I_>J54%58,-C'/#$$>U '2?9 M+?\ Y]XO^^!1]DM_^?>+_O@5SMIXI::ZCD/[ZUO-BVT4=OLEBD(D+1R%GQNS M$PZ#!X/K31X_T>0QK!Y\\DEOYXCB52XS'YH4KG(.SGICD#.2!0!TGV2W_P"? M>+_O@4?8[?\ Y]XO^^!6-+XKMX(UEEM+H0ED!F"H47<$(Y#<_P"L48&2>< @ M$U;M=7&JK>QV!,Z+9ZCJ*M,UZT444%KIGVVXR07N-VV,QVYD\W]X(SMVYP Q )..HZY% &Y]DM_^?>+_O@4?9+?_GWB M_P"^!7/MXTM4D;S+6>*".$R22R-&H5A)Y6P_-UW<9Z>_>G6GC2ROY)H[2SOY MV@B2639", ,6"@,3ALE2,J2O&WCN18MYT,2CRT?9'N"XXP#D#':NF:N5T3[-] MD\)_8C,;7^S#Y)G_ -9L\N+;N_VL8S[T =)]DM_^?>+_ +X%'V2W_P"?>+_O M@5EZ7J&HW']K&Y:UD-O\LE;=%=1[MK! XR%;D%2.0W?UXJ*^UG4;#0]*NBMM-/+[.7S$ M6UO?M2.%%J8@LK H7!P3@?*"<,0PQC&2 :?B/Q5)8Z/I6JZ?=VZ6-X^6FEL9 M;DB,Q-(&"1LK?P\^@.3C!H Z;[);_P#/O%_WP*/LEO\ \^\7_? KG8O%Z6=C MI2ZU&L&HWJ*6A@=7"Y8*&'.2I+ \;B 3V!-3CQA8O9BYB@NI V\JJ("S*JAF M<W$4EW]E,X144-Y9DR Y#,-HSD#!!R">,WEU2'5_#]Y4X&\ M#GY,@@@D$8(Z'VX(( !?TS_D%6?_ %P3_P!!%63TJMIO_(*L_P#K@G_H(JR> ME '->$(('T:Y9X8V8ZKJ.2R@_P#+Y-6]]EMLX^SQ<_[ KSJP^V0RQW&FW$CW M*7FKR26)N6"7,:W[@@)G ?#,58#.0 3BKNE:[>B73;+37C\B:!;AWU.:1Y7$ MK.!MWONRNT97G.0/EX) .Y-K;#_EWB_[X%-^S6W_ #[Q?]\"N8T;Q'J.I:C' M:3268+1QM\D##+*&$Z_ZP\JX4>V[!R:FL;ZRL_$FMB;4&RTT$:12W;N S*.$ M0DA^-(X]/V!MS(T\DD MDQ:ZDB*)D]< $'G'3: 1MLCQ-K-Q?VJF?3X8UNI(ID,9PX\IG0"0.5'3&1D\ M9P.5H [7[-;?\^\7_? H^RVW_/O%_P!\"O/[_P 2W]WX4OW@O+6S6'23(0)6 M^T,YMRX>.0L> WR\@G@G<",5I1:O+J_@#5;VXO8XF6&8*+>1HI;WNFMUGG5E!7S5()V@G MY0W/S9SM. #3FBB3QUI7E1HF=-O<[5 S^]M:Z <"N9@"CQ9H82>2=1I5[B:3 M[S_O;7D\#^5=/0!E:^JO:VBL 5-[ "#_ +XJ\+.W_P"?>+_O@5C^,=0ATG0? M[2N QAM)HYY-HR=JMN./P%16NJZO;VD>H:HMFUI-"'6.U1A(DC%0D>2Q#YW$ M;OE&<< '@ W?LEO_ ,^\7_? H^R6_P#S[Q?]\"L(>-=.-U%;>1>^!@D M Z'[);_\^\7_ 'P*/L=O_P ^\7_? K)L/$]MJ=^MG;6UV90A>4O#L6+#,A!8 MG!.Y&&%S^7-<_+XOU5+R\L@\7VB+5$M8W_LBY:'RF*CYI0VP/\XZL/NXQ\PP M =L+.W_YX0_]\"C[);_\^\7_ 'P*QG\76""9F6?8@+(^P!90)!&2ISV<@S?"N8O."8QN)*9XQU&.I7(!T7V2W_ .?>+_O@ M4?9+?_GWB_[X%.HFL+BYDL+R2*VCB9YX8E"ONA$Q;:7.P;?[QZD+DD@% M'\9M%J%Q#(@\L7@AM_*A9S,GV43\L2H1CSC/IC!Y( .J^QV__/O%_P!\"L7P M)_R3[PV?72K7_P!%+2:7XLCU)+,-I]U!-(RZ MU1CC)H [\6ML?^7>+_O@4OV2W_Y]XO\ O@5Y MY:^,KO3M+T:-;F"X+W!@F^T;G9T-P(E99MV"HSPY#,^,X')#M-\?:I>B*&9M M)@FNH;>6.+_O@4GV:V _X]XO^ M^!7,V_B6]FUNVM'-C)$\HMY8H"2X/D^;YRL3S$3\H&WWW?PU@Z]/#*(2(T&0.2> 5SG'I0!Z%]EMBW_ ![Q?]\"G_9+?_GWB_[X M%<3>>)K^SN[JWLGTY$CFF427,\DN1'%&RC&1RVXC@\'G#+_O@5F7UO%'K6D&. M-$)ED&54#_EFU(O^1:U7_KSF_\ 0#6G69XB_P"1:U7_ *\YO_0# M0!E>(+'3!$UYJ-]=0K-;_8PD/S,X8@E44*69CCH,GK3K#2M-OUDOK"^OE$L@ M9]KF,B95VEF0J"KXX92 "1@BIM:L+R:ZT?4;)$FDL)F=X'?9YB-&4.#T##=D M9X/(R*SM;TC5-6EAE:VC"F)UC02X:UE+*4FR.K ].1T&030!JQ>&;&*,QEI M9(VCD4K+M8;G8L[\C[Q)R>WM0OAZ 6FEVQNKLKIKJ\#LX+$A2HW$CGY6(]>> M3FN0E\(ZB/->*PD:8MFS*MJV9CYES/+,& 90O(+8Z$8'HH-17GAR M\-O?)%8YNWN0T=U%=>6'A$P=$*@C[J#;@]A@<$UG_P#",:^=1O9!9Q1Q3WEE M7J-+$J1 NTJQQ1[@,C:5"KYI 9^A(P035: MV\)ZK%HWDR1.]\60RR&X0QR2JK*9I!!Z# ST *]]X:T'3K%[R_NKI;&W3=('F(0_NO*W,%Y M)*8&.A],UI_\([:SBS:>ZO+@6LBRQ^9+D$J05/ [%1TZ\YR" M-HK?YO.F4HP;Y< ;3G@Y)]L"I?#O]I6^D6=IJ5MBXAB\MY1(K!]O"MQW83+$0IPR-TSS@@\$$CG.#');ZI<: M3:6$P)F81"ZN4*;>!EB%/!!(QC'()H S[;0S=:K8:I:-;7&G_9HTBN'8&3RL M'(P8SG<#U#+UZ<OO3_#-IJ.D MV!TRZB,D,-Q(MO/O7)A)++D#IC.W [ 'V'14 I,A0QS+( Z;8_+X..Z\'/H/2NDHH Y/4_#]EIT M,=Y L@=9;2WC5GR(X_M$/RCOCY%ZD]\8R<]6.E97B/\ Y!2?]?EK_P"E$=:H MZ4 +7/Z)9_;?!>AQF:6+;:6[YC(!.$4XY!XKH*R/"W_(HZ+_ ->$'_H H BF M\+Z?)/-/$DEO--<+=/)"^#YJJ4W#TRI(..N<]>:;I/A6RT1H_P"SY+J*-8T1 MXC,6638FQ6;/)(4 =?X1Z"MZB@#G+KP=IMU9VUL3-%';;A&$<' 9@V.0<8(& M,=ACI3=,.D_VKJ-M9WERU_,#YDC1D'"'!V,5"OM9\$C=@G!Z8KI#7*V6F:A8 M:_<7D$#16LBRM- +@/',Y;*-&K?<8C.[H">QZT 6%TG2K2+1] %W,CV8$]I% MO&YUBP.3CD#%EN54R>8BB08C)D$I"Y' +@''/3 P*S=5T?5 M+S4XM9C5Q'(UN) M9OMU]MEG:=HO,7;O(QGA<\<8&<9 -9]O\/\ 2+=8$4W)CAA$ 5I CZBL)=C,CR.[XRQV8YP!V K9JIJ?\ R"[O_K@__H)H 73?^059_P#7!/\ MT$59/2JVF_\ (*L_^N"?^@BK)Z4 <[X.BC.CW$A13(-4U(!L<@?;9^]= 88B MRL8T+)]TE1D?2L+P;_R [G_L*ZE_Z6S5T% #1'&IR$4$9Y ]>33/LMOYOF^1 M%YF<[]@SGZU+10!F)HUK'K!U, K)Y(AV +L !)!Z=4RH)0C;1O7:).03]T>U '8?9;<@9@B( VCY!P/2@6\ 1D$,85OO+M& M#]:D7[HI: (/L=KMV_9H=N.M(Q M_P! R]_]&VM;M85W_P CWI/_ &#;W_T;:UNT 9'B**.>RMHI8UDC>\A5T<9# M N,@CN*@C\*V:6'V)IKR2!$6.#?-DP!2"NP]<@JO)R>!S5K7?]19_P#7[!_Z M&*U* .=E\(V.3^- '->&7T:\N9+W2Y[ MYV$(1Q Z*6);?R..M6F\-V[13QF\O MQ>+>/AU_P!8"",?+TRJ M\>WUK&M?#=S,?#PO[$/':"<7$33!D^;[F5SAN>>0<'FL<>$M=%@8/LL0=(+: M($7(Q+)&DJ%W&.5.Y.A#< CE0* .N7P_IL<-R4NI4C.\<2J5A!?>X&1P"PY! MR,#'3BN?TK0-/BU.X$MPR6<\D3:2%'GAFW8^N/EYJM/#/<7>I7$(F$>JFT%F69B0R$EF*'F,* M.H('(P>3@@%V7P#I,UJMJSW0A4(-H=2#LB,0)R.3L./P!&#S4P\%V'GI*\]W M(4G6XP[K@NL1A!.%_P">9Q72T4 8FF:)]@NX/D7R;*V%K;2&4M(R<$[AM &- MH Z_A4/@3_DGOAK_ +!5K_Z*6NAKGO G_)/?#7_8*M?_ $4M '0UB:/!#,-0 M\V)),7\V-Z@XY%;=9&A=-1_Z_P";^8H TFM;=U4-!$P484% >:/0K MY[ MN.: &"W@!)$,8RNT_*.GI]*0V=L=N;>$[1@90<5-10!%]F@'2&/[NW[@Z>GT MK.OU5-8T954*HED ' _=-6M65J/_(:T?_KK)_Z*:@#5HHHH **** "BBB@ MHHHH **** "BBB@ K,\1?\BUJO\ UYS?^@&M.H;JVCO+::WF7=%,AC=6O^Z*=@5S_P#PANE@8^U:Y_X/;W_X[2_\(;IG_/UKG_@]O?\ MX[0!OX'I1@5@?\(;IG_/UKG_ (/;W_X[1_PANF?\_6N?^#V]_P#CM &_M'I1 MM'I6!_PANF?\_6N?^#V]_P#CM'_"&Z9_S]:Y_P"#V]_^.T ;^T>E&T>E8'_" M&Z9_S]:Y_P"#V]_^.T?\(;IG_/UKG_@]O?\ X[0!OX'I1@5@?\(;IG_/UKG_ M (/;W_X[1_PANF?\_6N?^#V]_P#CM %O3^-9UC_KK'_Z*6M6L[3-%M-'69;0 MW+><^]WN;N6XS6[!7*E@3&RD@E%X/I5+_A#=,_Y^M<_P#![>__ !V@ M#H:*Y_\ X0W3/^?K7/\ P>WO_P =H_X0W3/^?K7/_![>_P#QV@#?VCTHP/2L M#_A#=,_Y^M<_\'M[_P#':/\ A#=,_P"?K7/_ >WO_QV@#?P/2EKG_\ A#=, M_P"?K7/_ >WO_QVC_A#=,_Y^M<_\'M[_P#': .@HKG_ /A#=,_Y^M<_\'M[ M_P#':/\ A#=,_P"?K7/_ >WO_QV@"UXC_Y!*?\ 7Y:_^E$=:HZ5@#P;I0DB MD,NK2&*1956;6+N1-RL&4E6E(." <$$<5OJ"!S0 M9'A;_D4=%_Z\(/_ $!: MUB,J1Z^]<[%X(TB"%(HIM9CC10J(FMW@"@< "7@4 ='17/_ /"&Z9_S]:Y_ MX/;W_P".T?\ "&Z9_P _6N?^#V]_^.T =!2;1Z5@?\(;IG_/UKG_ (/;W_X[ M1_PANF?\_6N?^#V]_P#CM &_M&,8H Z5@?\(;IG_/UKG_@]O?\ X[1_PANF M?\_6N?\ @]O?_CM '045S_\ PANF?\_6N?\ @]O?_CM'_"&Z9_S]:Y_X/;W_ M ..T =!6':_\CWJW_8-LO_1EU4?_ ANF?\ /UKG_@]O?_CM7-*T"RT>>>>U M^U-+.J)))U '245 MS_\ PANF?\_6N?\ @]O?_CM'_"&Z9_S]:Y_X/;W_ ..T =!00#UKG_\ A#=, M_P"?K7/_ >WO_QVC_A#=,_Y^M<_\'M[_P#': -_:/2C:/2L#_A#=,_Y^M<_ M\'M[_P#':/\ A#=,_P"?K7/_ >WO_QV@#H**Y__ (0W3/\ GZUS_P 'M[_\ M=H_X0W3/^?K7/_![>_\ QV@#H*J:G_R"[O\ ZX/_ .@FLK_A#=,_Y^M<_P#! M[>__ !VFOX*TIU*M<:VRL,$'7+T@_P#D6@#8TW_D%6?_ %P3_P!!%63TIL4: MPPI$@PB*%4>@%.(S0!@>#?\ D!W/_85U+_TMFKH*Y[_A#-)\R9TDU6'SI7F= M(-8NXDWNQ9B%60*,L2> .M+_ ,(;IG_/UKG_ (/;W_X[0!T%%<__ ,(;IG_/ MUKG_ (/;W_X[1_PANF?\_6N?^#V]_P#CM &^RJZE6 *D8(/>HA:6P>-Q;Q!X ME*1ML&44XR >P.!^0K%_X0W3/^?K7/\ P>WO_P =H_X0W3/^?K7/_![>_P#Q MV@#H**Y__A#=,_Y^M<_\'M[_ /':/^$-TS_GZUS_ ,'M[_\ ': .@HKG_P#A M#=,_Y^M<_P#![>__ !VC_A#=,_Y^M<_\'M[_ /': 'W?_(]Z3_V#;W_T;:UN MUC6'AC3M-U!;Z!K^2X6)HE>ZU&XN-JL5+ "1V R47D#L*V!TH S-=_U%G_U^ MP?\ H8K3%5-3TVWU:R-K="7RRROF&=X7!4Y!#H0PY'8UE?\ "&Z9_P _6M_A MKM[_ /': .AHZ]:Y_P#X0W3/^?K7/_![>_\ QVC_ (0W3/\ GZUS_P 'M[_\ M=H W\"C ]*P/^$-TS_GZUS_P>WO_ ,=H_P"$-TS_ )^M<_\ ![>__': -_:/ M2C:#VK _X0W3/^?K7/\ P>WO_P =H_X0W3/^?K7/_![>_P#QV@#H**Y__A#= M,_Y^M<_\'M[_ /':/^$-TS_GZUS_ ,'M[_\ ': .@KGO G_)/?#7_8*M?_12 MT?\ "&Z9_P _6N?^#V]_^.UL:?8P:986UC:)Y=M;1+#$FXMM10 HR>3P.] % MFLC0NFH_]?\ -_,5KUA7'A+3+B[FN3+JD3S.9'%OJUU"A)ZG8D@4?@* -VBN M?_X0W3/^?K7/_![>_P#QVC_A#=,_Y^M<_P#![>__ !V@#H*0@'K6!_PANF?\ M_6N?^#V]_P#CM'_"&Z9_S]:Y_P"#V]_^.T ;*V=JBQJMO$%C8L@"#"L?>IZY__A#=,_Y^M<_\'M[_ /':/^$-TS_GZUS_ ,'M[_\ ': .@HKG_P#A M#=,_Y^M<_P#![>__ !VC_A#=,_Y^M<_\'M[_ /': .@K*U'_ )#6C_\ 763_ M -%-53_A#=,_Y^M<_P#![>__ !VIK/PQI]A>1W<3ZC+-&"$^U:E<7"KG@D+( M[#/OB@#:HHHH **** "BBB@ HHHH **** "BBB@ HHHH **** "BBB@ HHHH M **** "BBB@ HHHH **** "BBB@ HHHH **** "BBB@ HHHH **** "BBB@ MHHHH **** "BBB@ HHHH 1JS/#1C/A72##=O>1&RAV7,@(:8;!ASGG)Z_C6F MU4=#%P/#^FB[MHK:Y%K$)H(0 D3[1N5<<8!R!CL* +]%%% !1110 4444 %% M%% !1110 4444 %%%% !1110 4444 %%%% !1110 4444 %%%% !1110 444 M4 %%%% !1110 4444 %%%% !1110 4444 %%%% !1110 4444 %%%% !1110 M 4444 %%%% !1110 4444 %%%% !1110 4444 %%%% !1110 4444 %%%% ! M1110 4444 %%%% !1110 4444 %%%% !1110 4444 %%%% !1110 4444 %% M%% "-67X8^R_\(GH_P!B>5[3[##Y#S??9-@VEO?&,UJ&J6B&Z.@Z<;TPF[-M M'YY@_P!67VC=M_VVMX\; MI7//?@ $D]@,T :]%<[%XBN[75+73];L(;*2\W"VE@N3-$S*NXJ6*H5; ) MQ@X/-:5MK>EWER+:VU*SFN"AD$4T&;A5F4F$?[?/R]#UJ*7Q'HL,32RZSIT<:OY;.UT@"M@':3GK@@X]Z -6BL M9_$^E+KJZ)]N@&HM 9UB+@97MWYXR<#L":?#K5M;Z+:WVJ:AIT(E1G(IMQKFEVHMVN M-3LH5N!F R3JOFCKEW0=@76*..,9>61CA44=R M2:JPZMK2W-M'?Z)'#%<2;%D@N_-,8VDYD!1<=,?*6'/6@#>HK/CUK3)6N534 M;-C:C-P%G4F$>K\_+^-07/B;1K2RO+N35+0Q648DN"DRL8P1D9 .1GMZ]J - M>BLB/Q-HSZ?:WQU6R2VN^()'N$ <], YP3G(P.X-6FU;3X[M;1[ZU6Y9@BPF M90Y8C. NLP6YGLEMV@DDD1Y")B05P5'3:,G)^E/M]7T^ M\G^SVM_:SS^6)?+BF5FV'HV HKEM5\47^G^,M'T*+3+>:'4P[+ M%&C$8!?Y/+.>#Q\W/M6N-?TDFY']J6.;4$W ^T)^Y Z[^?EQ[T :5%93^)-% MBC,DNL:>D8E,.YKE /,'5%+J_M;=YSMA6:54,A]%R>?P MH NT5B6&L7-UXDU;3)88ECLEA:-T8DN'#'GTZ=*?+K]K%J%U UQ!%%8Q++>3 M2N%6+=G:"2< X&M &Q167_;VG31VPM=3T^2:\5C:+]H4B'VF?PWI;7%Y'>S-:1&2ZB.4G;8,NOLQY'UH T: M*** "BBB@ KE/%FFWKZKX>UNSMVN3I5T[S0)]YHI(VC9E'&$T MRUEM[VSDN))+O[,R*JE95P), -N)48!..IZ5Z]-$987C65XRRE0Z8RN>XR", MCW%9^@:#!X=T:'2[6XN)K>$GRS.5+ $YQD =R: /.[73S)H4L]Y8^(&U*RTF M6Q:&:R7RP64#:GEQ@R@L 0&,LJD;@@(V]CQZ5%I\% MXOA6P>WLM6358M/%M+976F2M!=*KL5B8E04([-D ;AUKU[;1MH Y3QOIE]J6 MDZ=?3-;6VC;[T >1II;3^'KB>ZL?$+ZK9Z//8&&:S7R\NF-J>7&#*"X4 M@@G'4XYJ.^M+RZN98+/2M15)_!D]E@V,L:FY."J$E0 W#=?ZU[!M]Z3;0!YA M?VLUY.D=_:Z\NF:CI45F5L[)692-P=) Z,T>0RX88ZH//)'%=QM]Z4#!S0!Q6M.+?XE:;=RV%[+: MII5S'++#922IEGC95)52"2$;CZ>M<[X:BGM]3\!A=+U&W^SZ9-;WC-I\J"-R MJ !R5P,LIY/I[UZN1DTFV@#AO$7FM\4O"@#S7Q#9^=$D6G:)<0B[T6X03PV+%R[!?W3*1A"=H)+#/RX%9PTN[N8 MELM6M]?^PZCI=I"B6=JC;2B8:.0LA:,[OF!RHYZY%>M[:-OO0!R&@&1/&^NJ M]M>HK6]JJS36[A)"BD-B0J%8Y8=.O44>'K)X/%7C"WNXPPN[F*X0,,B2)H53 MIZ HP_"NOVU$UI$]Q'.R_O8P0K X(!ZCW'L: .5\':9>6)ELKRV=+?26>TL9 M9/\ EK$Q#!A]%V)GU5JF\#6TL-MK$\C$Q7FKW$]N/2/(7\B48_C732P+-&T; MYV-P1GJ*6*%(8UCC4(B#"JHP /2@"2BBB@ HHHH **** "BBB@ HHHH **** M "BBB@ HHHH **** "BBB@ HHHH **** "BBB@ HHHH **** "BBB@ HHHH M**** "BBB@ HHHH **** "BBB@ HHHH **** "BJUSJ-E9R11W5W! \IQ&LL M@4OTZ9Z]1^8IIU33U>=#?6P:W&9E\U/QH NT55&I6)GB@%[;F:9=T MH&>14?]LZ7]G:X_M*T\E7V-)YZ[0WH3G&?:@"]158ZC8BX^S_ &RW M\_9O\KS5W;?7&>?PH N453_M;3@L M[&_M0+/QI?[3L#)#&+VV+SC="OFKF0>JC/(^E %NBJ/]LZ7Y M,DW]HVGE1ML=_/7:K>A.>#[4_P#M73Q>R>8(O-7<4Z[L9SCWH MT5 MG_V]HYMDN1JMC]G=_+67[0FQG_N@YQGVJ4ZKIPFGA-_:B6!=\R&9=T:^K#/ MYZF@"W15'^VM*\NWD&I692Y;; WGKB4^BG/S?A2G6-,!N0=0M ;7_CXS,O[G M_>Y^7\: +M%4AK&F%K=1J-H6N1F >&/4J>>: .AHJH=4T\7,ML;ZV$\2>9)%YJ[D7^\1G('O48US23!#/_:= MGY,[;(I//7;(WHIS@GZ4 7Z*I'6-,$ERAU"T#VHW7"F9?F_"@"[15#^W-)$4\IU.S\NW8),_GKB)CP QS\ISZT M[^V-,-W%:#4+4W,T?FQ0^E %VBLS_A(M$^QF\_MC3_ +*) M/*,WVE-@?^[NSC/M4QU?31=M:'4+7[2L?FF'SEWA,9W;W&HVAFN8Q)!&)UW2H1D,HSEACN*B_ MX2+1/LDEW_;&G_9HY/+>;[2FQ7_NELX!]J -.BJ7]KZ:;P68U"U-T8_-$/G+ MO*?WMN01S0-=T@S6L(U2R,M MVN^V3SUW3+ZH,_,/<4 :%%9?_"2:%]EGNO[9T_[/;OY1QQ0!>HK)_P"$I\/?V>-0_MW3 M/L1E\D7/VN/R_,QG;NSC=CG'7%3OKFDQW=S:/J=FMS:Q&:XA:=0\,8 )9ESE M5P0T.+E1<)F$YQ\XS\O/K0!H44@((R.AI: "BBB@ HHHH **** "BBB@ HHH MH **** "BBB@ HHHH **** "BBB@ HHHH **** "BBB@ HHHH **** "BBB@ M HHHH **** "BBB@ HHHH **** "BBB@ HHHH **** "BBB@#&NHK27Q9IWF MVKR7"V5R8YNJ(N^#<#_M$[2/]UJU/L\.6/E)E^&^4?-]:I2L_P#PDEDHO$2, MVEP6M3]Z0[X<./93'M)R5VC!/K4U% $?D1%]_EKOQC=M& M<4W[+!M"^3'M!R%VC /K4U% $1MXB6)C0EQACM'(]Z/LT.%'E)A/N_*/E^E2 MT4 1?9H?F_=)\_WOE'S?6E^SQ;E81IE!A3M'R_2I** (?LL&TKY2;23'S\B_-UXZ_6I** &>3'E3L7Y>G XI/(CP1L7!Z\=:DHH C\F/(;8N M1P#BFK:P)$L2Q1B->BA1@?A4U% #/*3).U6N6OIUZT^B@!GE+QQTZ4>4O/ YZ\4^B@! MGEKD' R/:CRDQC:/RI]% #/+7T_&CREQC''I3Z* &>6N2<#GVH\I./E''3CI M3Z* &>4O/ YZ\4H0#IVIU% ";:-O-+10 F*-M+10 FT5F^('AA\.ZG+/+-%" MEI*TDD/WT4(]:=4=9,XT2_-HT*W(MI/*:;'EA]IQNSQC.,^U %T<" MEI!T%+0 4444 %%%% !1110 4444 %%%% !1110 4444 %%%% !1110 4444 M %%%% !1110 4444 %%%% !1110 4444 %%%% !1110 4444 %%%% !1110 M4444 %%%% !1110 4444 9DP_P"*FL3]AWXL[@?;,G]U\\/[OT^?K_VSK3K+ MF*?\)18 WC(_V.YQ:8.)1O@RY]UX'_;0UJ4 %%%% !1110 4444 %%%% !11 M10 4444 %%%% !1110 4444 %%%% !1110 4444 %%%% !1110 4444 %%%% M !1110 4444 %%%9NL75U;QVR6;Q)+/<+%NEC+@ @D\ CT]: -*BLK[/KG_0 M3L?_ !;_P".T?9]<_Z"=C_X M_\=H U:*ROL^N?]!.Q_P# %O\ X[1]GUS_ M *"=C_X M_\ ': -6BLK[/KG_03L?_ %O_CM'V?7/^@G8_\ @"W_ ,=H U:S M/$?D_P#"-:K]IADGM_L?6YX[Z>UMM%U"],&T/) \ M4$C./GD4]".U;-96F_\ (8UC_KK'_P"BEH A_MK4/^A6U?\ [^VG_P ?H_MK M4/\ H5M7_P"_MI_\?K;HH Q/[:U#_H5M7_[^VG_Q^C^V]0_Z%?5_^_MI_P#' MZVZYKQ/;QS:AH!%/%-_]LN+2XLKZ[:WNEN'S%L.4')P5SQM MZ'.*CN(=5U"75)H--6>[DTJUG='OI(&BF99,E !C.0.Z]!0!V)U.[:ZCN#X3 MU4S(C(K[[3*JQ!(!\_H2J_D*E_MK4/\ H5M7_P"_MI_\?J7PS=B_\,Z7=BX> MX$UK&_G2+AGRHY(]:UJ ,3^VM0_Z%;5_^_MI_P#'Z/[:U#_H5M7_ ._MI_\ M'ZVZ* ,G3]8DO;^:TFTR\L9HHTEQ<-$=RL6 QY;M_=/7%:HZ5DQ_\C?=_P#7 MA#_Z,EK7H **** "BBB@ HHHH **** "BBB@ HHHH **** "BBB@ HHHH ** M** "BBB@ HHHH **** "BBB@ HHHH **** "LO6?]9IG_7ZG_H+5J5EZS_K- M,_Z_4_\ 06H U*H:SJ]KH>FR:A>^:+>(C>T<;.1GV49J_7.>.X9[GP;?VUK; M37$\H54CA3&,R)#<1-&SJ#@E=P&['&<=,U? MMIS/;QS/%) 74,8Y)=+O!87<&GZ7%/)+.Z-'+(73;Y< M8'SYQDD\=!C)Z4=&@U]/^$=>X@NFD%K;QW:SAPR,"=YW;L9[D,#NXP: /1,B MC(]:\UL(]<;2I#)H^KPWL1@2_#W"E+H+(#(8?FR2REN3MXP*D33-6AUBVO%A MOVTA=2D,=NSL76W>WVD,I.=OFY(!Z9!XH ]&R*@2[@G>X2&4.]N_ERJO)5MJ MMCZ[64_C7E2V.NKI-X#9:TEY'IEN+<%W;_2$E<$KABN=I0^XSGG-=9X/TV33 M=0\2R2V,9YSD-D4 =!I.K6^L6[3VJSB-)&C)EB9/F4E M6 R.<$$?A6AN'K7FT=O?2IHD8L=41(]7NY+M DB P2-,RE@",@EHS[?G5BQT MW4Q;:3@[AZBHIKJ"W>%)I51I MG\N,,<;FP6P/P4G\*\VN]+UL>*[M2GB,11DM8O930"U\KRL!6+#S,YSQDY.# MQUJ./1=6FOM'GOM.N9HK+5&9G0L&,9M=NX*6)0;P <,03DC@T >I9%&X>M>6 M6=AJ0TJ!+FTUEIGTR\23)E),WF PY.?O;0V#[C/:G):^(+C7M/EU)/$1A,-L M\363PI&A" 2K/N'F [@Q^4\AA0!Z=+/%!#)-*ZI'&I9V)X4#J:?0T[3=:L]4EGAMI&\ZW($T M4L;1NF>F58 X/8]ZS?$GZ]J%_JVOZ;:7]JI@@M$AB*)!F@#TRJ&H:38:@T M,MW;B5[O^-<5IVEZA:Z?IE_;P:]+*)Y(7AU2=/-$4@P&=8R$ M 5L$=2%)]@$N]/U:'QS;QA?$!T^)X3:R6 M'M,\-:UIL>IV>E*()IGF"3KSY@<@N5)(W9!.>OTK4N?#&BW=Q<3W%A'))< + M,2S?O ,X##.".3Q[FN!T;3]5ATBRM[VPU,6@M+I%C@+QO%<&=F5F (/*$8;H M.,9*8]/SKT/PS# M]F\-:;"T$D#1VZ(TVA<-)(2XC>6%T#HIPQ!8#)!(XZU!9^$QINN1:S]LWR(MP9U\G M_6-*RLQ&#QC8H P>!W)S6)H7@U]7\*V<.L27$1BMYH88O*\J2W+OR^3G+# Q MP!@GKF@#I'\6Z1$WERRS1R^8R#< -X7G;UZ^AJ&?PE<7EW!>W.IB2\CG@D>3[. &6'<54 -QD MNQ)]^,#BHY_! NM>75)]0>1DGEE16C!8))$8VCW9X4 Y&,>^>M #M-\6V=[; MV-]/B?:+8PI+?7.)V,C$)%$L: L<E<>^B33^-+O6]/FCBOK?%NPE0LDL31H<'!!!! ((]^#F@#9&KM9QR MOK"16NV39&T;EQ*-H;(&,^N1CC%1S>+/#\#!9=7LU/E+-S*.(V&0V>P('6HK MS2-2N+VPU%;J 7=J9!Y9C/E%' !'7.!CJ>.M1OXLT& M.-9'U6W7>7"J7PV4&7&WJ"O?TKF-/\)WNK:1I.HS72VU];6=JELHA8!?+=9" M)%8Y/*@8XQSCK6LOA>\.OVVJO<6XD%XUU/&D;!3^Y$("\^G))ZF@"S?^-=#L M=.OKM;Q9_L<+3-'%EF8 [>/4;OE)' /6DLKO1H=1U2\CN+5&D2!KD MYBLP. MS>">I&-H !^M8$_P\O+K[5YVHP[I["YLRRQ-C][(LBL%S@8VX( &:TKKPIJ- MWJ-U>F^MXY)/L;Q;8B0)("Q^8$\J2Q'MQ0!K_P#"4Z%B+&IVY:4NL:!OG9D^ M\-O7([BF:[KC:?X2N]=T]8;I(;H[UE_\(G?C78=76ZMA-]I MDN9H_+8*6:%8@%Y]%!)/4FIYO#=]-\/6\-_:+<7#69M#/L;9MQMW8SG.* -# M5=H*"1L5EA!(+,0 !QTR:K:IXECM]0TVULYK=Y)[J.*='#;E5P3Q MTPV,'![=J@U;0=8UK3I;2YO;:)0D?E+"C%2ZR*^YLG)^X ,?WCUJ,>%K];MR ME]!Y+ZFNI'?"2P? #)]X<<<'J.G- &O",>+KO_KP@_\ 1DM;%8-@+D>)[D7; MQO-]ABR8U*K_ *V7& 2>V.];U !1110 4444 %%%% !1110 4444 %%%% !1 M110 4444 %%%% !1110 4444 %%%% !1110 4444 %%%% !1110 5B>)+NWL M8M/N+NXBMX$O4+RRN%5>&ZD\"MNDP#0!C?\ "8>&?^ABTC_P-C_QH_X3#PS_ M -#'I'_@;'_\56U10!B_\)AX9_Z&/2/_ -C_P#BJ/\ A,/#/_0QZ1_X&Q__ M !5;5% &+_PF'AG_ *&/2/\ P-C_ /BJ/^$P\,_]#'I'_@;'_P#%5M44 8A\ M7^&?^ACTC_P-C_\ BJ!XO\,#_F8](_\ V/_ !K;HH Q/^$Q\,_]#%I'_@;' M_P#%4O\ PF'AG_H8](_\#8__ (JH1_R4!A_U"U_]&FN@H Q?^$P\,_\ 0QZ1 M_P"!L?\ \51_PF'AG_H8](_\#8__ (JMJB@#%_X3#PS_ -#'I'_@;'_\51_P MF'AG_H8](_\ V/_ .*K:HH Q?\ A,/#/_0QZ1_X&Q__ !5'_"8>&?\ H8]( M_P# V/\ ^*K:HH Q?^$P\,_]#%I'_@;'_P#%4>&KJWO+2[N+6>*>"2\F*21. M&5AN[$<&MJDP,YQ0 M%%% !1110 4444 %%%% !1110 4444 %%%% !1110 M4444 %%%% !1110 4444 %%%% !29I>U<]/=ZO<^*+S3;*[M+:"VLK>?,MLT MK,TCS*>0ZX $0[=S0!T&:,UC_9/$/_08T_\ \%S?_':/LGB'_H,:?_X+F_\ MCM &QFC-8_V3Q#_T&-/_ /!(?^@QI__@N;_P".T ;!Y%9LVBVT]U+ M,' P. <=*A^R>(?^@QI__@N;_P".T?9/$/\ T&-/_P#!(?^@QI_\ MX+F_^.T?9/$/_08T_P#\%S?_ !V@#/\ $NG#3O"VKWMK?:BEQ;64TT3?;9#A ME0D'!.#R*T(=#@:%"UWJ))4'_C]E_P#BJR?$]EKK^$]8275K%HVL9PZII[ D M>6V<'S3@_@:TH+7Q#Y$>-8T\#:/^8H_^!TO_P 51_85 MO_S]ZC_X'2__ !51_9/$/_08T_\ \%S?_':/LGB'_H,:?_X+F_\ CM $G]A6 M_P#S]ZC_ .!TO_Q5']A6_P#S]ZC_ .!TO_Q51_9/$/\ T&-/_P#!(?^@QI_\ X+F_^.T?9/$/_08T M_P#\%S?_ !V@#8S1FL?[)XA_Z#&G_P#@N;_X[2&U\0@9_MC3S_W#F_\ CU & MU16/I=QJ/]K7EC?W%O/Y4$,R/# 8OOM("""S?\\Q^=;% !1110 4444 %%%% M !1110 4444 %%%% !112'@4 +12 Y]*,T +129HS0 M%)FC- "T4F:,T +1 M29HS0 M%)FC- "T4F:,T +12W_QJC[1KG_0+L?\ P/;_ .-5HB9#&)-PV$9W M9XQ56+6-.GT[^T8KV!K'!/V@2#R\ X/S=.M $!N-=Q_R#+'_ ,#F_P#C59T% MMKT7B*]U,Z?8%+BTM[<)]M?(,;S,3_JN_FC\JW[6\M[V!9[6:.>%ONR1N&4_ M0CBIZ ,K[1KG_0+L?_ ]O_C5'VC7/^@78_\ @>W_ ,:K5HH ROM&N?\ 0+L? M_ ]O_C5'VC7/^@78_P#@>W_QJM6B@#%N;_6K>VEG?2[+9$A=MM\V< 9_YY5J MV\GG6\\G_H)I^G_\@ZU_ZY)_(4 6#TK);4=0DO[F MVLK"WE6W*JSRW)C))4'@!&[$=ZUZRM-_Y#&L?]=8_P#T4M !]HUS_H%V/_@> MW_QJC[1KG_0+L?\ P/;_ .-5;O=2LM.17O;N"V5CA3-*J!CZ#)JNOB'16N/L MZZM8&;=M\L7*;L^F,YS0 S[1KG_0+L?_ /;_P"-4?:-<_Z!=C_X'M_\:J2Z MUW2;&IV=O,!GRY;A$;'T)S5J6[MX+8W,TT<< &XR.X"@>N3Q0!BZM'KV MHZ/?6*Z=8(US;R0AC?,0I92,_P"J]ZM1S:XD:K_9EB=H S]N;_XU5BUUS2;^ M;R;/4[.YEQG9#.CMCZ U?H ROM&N?] NQ_\ ]O_ (U1]HUS_H%V/_@>W_QJ MM1B%4L>@&34=O<174$<\#K)%(H9'4Y# \@T 9_VC7/\ H%V/_@>W_P :H^T: MY_T"['_P/;_XU6K10!EV>H7:_F1QJA;;EG<(.<''+#M5<7.N?] N MQ_\ YO_ (U2>(_^04G_ %^6O_I1'6J.E &7]HUS_H%V/_@>W_QJC[1KG_0+ ML?\ P/;_ .-5=NKZTL(?.O+F&VBSC?-($7/U/%4F\2Z&L@C.L:>'.,*;I,\C M(XS0 ?:-<_Z!=C_X'M_\:H-QKF/^098_^!S?_&JFN];TNP9%O=1M+9G7<@FG M5"P]1D]*M17$4\2RPR+)&XRKHP(8>Q% &'%'KR:S=7W]G6!6:WAA"_;GR"C2 M'/\ JN_F#\JN?:-<_P"@78_^![?_ !JK7]J6/VMK3[9;_:5&3#YJ[P/]W.:M M@Y&: ,K[1KG_ $"['_P/;_XU1]HUS_H%V/\ X'M_\:K5HH ROM&N?] NQ_\ M ]O_ (U5>_U36-/TZYO9M+LS%;Q-,X2^8DA02D2],=ZM_V)J'_0TZO_WZM/\ XQ0!M45B_P!B:A_T-.K_ /?JT_\ MC%']B:A_T-.K_P#?JT_^,4 ;5(>E8W]B:A_T-.K_ /?JT_\ C%']B:A_T-.K M_P#?JT_^,4 9'A?PQH5UX2T:XN-(LI9I;&!Y)'@4LS&,$DGU)K6_X1#PY_T M]/\ _ =?\*ALO#%U86-O9V_B;5T@@C6*-?+M3M51@#_4^@J?^Q-0_P"AIU?_ M +]6G_QB@!/^$0\.?] /3_\ P'7_ H_X1#PY_T ]/\ _ =?\*7^Q-0_Z&G5 M_P#OU:?_ !BC^Q-0_P"AIU?_ +]6G_QB@!/^$0\.?] /3_\ P'7_ H_X1#P MY_T ]/\ _ =?\*7^Q-0_Z&G5_P#OU:?_ !BH?LU_IVJZ'/^@'I_\ X#K_ (4?\(AX<_Z >G_^ ZUM#I4= MRS):S,IPRH2#Z'% &3_PB'AS_H!Z?_X#K_A1_P (AX<_Z >G_P#@.O\ A5?3 MM,U.[TVUN7\4:J'EA1V"Q6N 2 >/W/2K/]B:A_T-.K_]^K3_ .,4 )_PB'AS M_H!Z?_X#K_A1_P (AX<_Z >G_P#@.O\ A2_V)J'_ $-.K_\ ?JT_^,4?V)J' M_0TZO_WZM/\ XQ0 G_"(>'/^@'I__@.O^%9.L^$/#C7NBQ'1+#RY+UE=?(7# M#[/,<'CU /X5K_V)J'_0TZO_ -^K3_XQ4,WAJ[N)())/$^KEH)#)&?+M?E8J MRY_U/HS#\: (_P#A ?"/_0N:;_X#K1_P@/A'_H7--_\ =:L_P!AZA_T-.K_ M /?JT_\ C%+_ &)J'_0TZO\ ]^K3_P",4 5?^$!\(_\ 0N:;_P" ZT?\(#X1 M_P"ARWGV*^6&*65$5]IMX9,'8JC[TC=J *__ K_ ,(YS_PCFFYZ?\>Z MTO\ P@/A'_H7-,_\!UKI*P_$4MWY^BVEK>RV?VR^,,LL*HS;1!-)@;U8=47M M0!7_ .$!\(_]"YIO_@.M'_" ^$?^A3$<#CU)_.MC^P]0_Z&G5_^_5I_\8J&#PS= M6SSO%XFU96GD\V0^7:_,VT+G_4^BB@";_A$/#G_0#T__ ,!U_P */^$0\.?] M /3_ /P'7_"E_L34/^AIU?\ []6G_P 8H_L34/\ H:=7_P"_5I_\8H 3_A$/ M#G_0#T__ ,!U_P */^$0\.?] /3_ /P'7_"E_L34/^AIU?\ []6G_P 8H_L3 M4/\ H:=7_P"_5I_\8H 3_A$?#G_0#T__ ,!U_P */^$0\.?] /3_ /P'7_"J MNIV.I:=IL]XGB74Y6A7>$DBMMK8['$(./H172*,"@#%_X1'PY_T!-/\ _ =? M\*/^$0\.?] /3_\ P'7_ I=<:Z\_2K6UO9;/[7=F)Y850N%$,KX&]6'5!VH M_L34/^AIU?\ []6G_P 8H 3_ (1#PY_T ]/_ / =?\*/^$0\.?\ 0#T__P ! MU_PI?[$U#_H:=7_[]6G_ ,8H_L34/^AIU?\ []6G_P 8H 3_ (1#PY_T ]/_ M / =?\*/^$0\.?\ 0#T__P !U_PI?[$U#_H:=7_[]6G_ ,8H_L34/^AIU?\ M[]6G_P 8H ;X?L[:PN=6M[2"."!;H;8XUVJ,Q(>E;E8$7AN[ADFDC\3:LK3- MOD/EVOS' 7_GCZ 5+_8FH?\ 0TZO_P!^K3_XQ0!M45B_V)J'_0TZO_WZM/\ MXQ1_8FH?]#3J_P#WZM/_ (Q0!M45B_V)J'_0TZO_ -^K3_XQ6?KMEJNE^'M2 MU&'Q-J;RVEK+.BR16I4E4+ '$(...Q% '59!Z44BC I: "BBB@ K+\1?\@&Y M_P" _P#H0K4K*\1\Z#<_\ _]"% &7X^2YD\+,(%=X?M$!NT099K?S%\P>XVY MR/3-9_BB?P_<>%-7O+*6RDEATN>%);EE$Z MK;&Y\Z2YV+L! .?E.,$U>BU6 6]NUZT5E<2JI:WFE7;B&UEBQ&$"O;EPP)^;I-XV\R28YS[_K74VOB'2;F34%2^MP+";R;AFD4!&P.O/ YQSW!':K;:G8 M*8PU]; R ,@,J_,#T(YYZ&@#S!/%-U9:+9PV&M6L-O;>&DO$5$C8^:@5=K$Y MR#C& ??TT]3\5:J9M:BL;TDK92W-E);B&5!L0,!C&X$Y.2058?=(-=VNJ:? M)&[I?6S*A"L1*I )Z \]ZAAU6!I+B1[FR%FD<;I,MP#D-GENP'3!R<\^E 'G M^J^-=1CUIK:RURW^SS7VGQ1L8XVPDVX2;3T., Y.<9JU<^*=4L-<-HVL12K$ M9;:9I8HT172WWA]@^?)8'.2%(. .,UZ ]_9QR0QO=0J\QQ$K2 &0_P"R._X4 MZ.ZMYV=(IHY&C;:X1@2I'4'T- 'EMOX^U*'3H)I=4ANVN-'LKR8I"A-JSR!) MG"KR0JDL0+[N&*QA@\3VGV:X$SP:M)$ DS*R[(CA"I.#SMV[L< M8P:[-M6>4W#6T=N8H;A;?S)I]@9MP#XX/3) ]2"..M3?;9C(J#[(SU7L,G/:@!U^[/H-VS$$FUI.?3O6[?Z_=Z;I M@U"XTJ0V\:"2?9*"T:$]0#]X@)(8M0:W,)^S)<):/N #SS3[B\LK_0K:]U73["_7P],DQU%/,(0RQE$9=Z_-MQUST/!KLO M 4,-SX TZVFM&$,)**LQW!_+D.UQP/E)4,O' QZ5-_PFMG';F[NK>:"S>WEN M;:5B#YZ1D9X'0D$%0>H/U G;Q*T,=Z;JP>*2Q$(95:Z4"0VJ2/M:3N!\I/)X[G(%68]?U6/4K6* M76 ^G-=3VHOA'$%G'DAXVSC&\,2O'RDKT[5U.LZO+IB63P6HN5NKA+<'SMFT MO]T]#QUJ;4]:L-':S2_N8H'NY?*B#N!N;!/?MQ^HH XK1/$VJZO+Y9U^UB$. MD07DA:W0GS"'$F_D< @$XVXP!QW+'QCJ4J^'YI+R-H[^RB:1HQ&565E)9G0X M; (ZH<+@[AT(ZR;7TB\4V.C1I%+]H25I)%F!:)D"G!7'<-ZUH:K?KIUEY[(T MC%UCCC4\R.Q 51]2>O;K0!YBGC?5)-+AE;Q%;)+/H4^H;A%%\DT3*H49[-N. M0"*]/TN\_M#2[2\#*WGPI)E#E3D \57?5(;1G_M&YLK6,!%#-<@?.020 M<@8Z<>O/3%)-K$,-]#$#')"\OV>21)03%*?NJR^_3ZD<>,^] 'E5G.^G MR>%XOMUGIJ_:M0:S&H)D1VIW",%=Z'!'3GICZ5TO@8W!\)ZK!9JAGBN[E8+E M1B&X=OG$D8Z!-S8QR/E/)ZUV4NI6,()EO($ C\T[I ,)_>^GO52P\0Z5?V%O M?0W]OY$Z!T9I5&03@=_7CZ\4 <'9WL/_ @VC6ENVGKK27$!N;6^@,DWV@R* M'$P+JS:?)+# @6UCW<2\[N>-OS9'()Z M<][_ &C8^5-+]LM_+@8K*_FC$9'4,>Q^M-;5-/5$9KZV"R %"95PP/3'/.: M.%3Q'JPOK2&?5@MG*]Y;QW8CC N-BJT4@.W&[EA@<$J3CM679>--*C_P 4EK/_ %XS_P#H!J\=0LU>&-KN /.,Q*9!F3_='?\ "J7B@_\ %):U M_P!>,_\ Z U /$>D8YOXOUI?^$CTC_G_B_6M0=*6@#(_P"$GT8'_D(P_K1_ MPD^B_P#01A_6M>B@#FM)NX;WQOJT]O()(FTRR 8?]=;NNEK L_\ D?M8_P"P M78_^C;NM^@ HHHH **Q-;U6]T_4-,MK2VMY?MTSP[IIBFPK&TF>%.<[".W45 MSUOX\FN4L9/L]A;17)N(VDNK[8@DA;:VUMF&4]CQ]* .\HKD++QF^H6.FFVL M ;R_GFAAC,V(RL6=TH?&2A !!QSN%;UATI)')O63.T?_ *"*OUQ>E>)I?,@TF"W@DEMT MM$>-[C;*R2*A,BKCE5#'//\ "15GP]XNBU!=034IK6WNK:^NK=8T8\I"Q!;G MO@9/\J .KHK"U/Q9I5CH]Y?QW<5Q]FLC>B.-P2\>"5(]CC -1Z5KR+:Q-JNI M:?YERP: Q*T8*GHI#$\YR.O..E '0T5E)XFT.6+S8]5M'C/\:R@COW_X"?R- M/DUJP>Z>P@OK9K_:2D)?DD+GG'L03WP: -*BN?:@#=HK&?7( MCH$&J01M(+@1B&(G!9W(55)[+-JFE0S6T41E$C$")V)^_ST M(QMZ&@#H*P/#_P#R&?%/_843_P!([:H[W7S9IJ=V+FRGM-/D!N$B),D,6W+[ MN?O Y;&!\HQUJ3PZ0VK^*&4@@ZFA!'_7G;4 ;]8>O?\ (8\,?]A-_P#TDN*W M*P]>_P"0QX8_[";_ /I)<4 ;E%%% !16-KNNC29]-LXH/M%]J,YAMXMVT?*I M=F8]E"@] 3TXI8]2N+:28:K!#:PHJE)TFWHY.[*C(!R,?K0!L45QNK^++BVF MNSIPL[FU32)=0ADW$[V1@,'';]<^E;=GK]@8[&&ZO+>*]N8HV$.[!+,N< 'Z M' ]J ->BLMO$>BHEP[ZI:*ENN^5FE "+G&2?3/'UIW_"0Z/YWD_VE;>9YHAV M;QD.<87ZG(QZT :5%(#GI2T 97B3_D7;[_KD:U:RO$G_ "+M]_UR-:M &-K/ M_(6\/?\ 80?_ -)9ZV:QM9_Y"WA[_L(/_P"DL];- !1110 45A>(=]M=9%\#<,5_=FX,VY3@\E25X[YI\'A._M=0M;L6>G1QVVM37X*RX* MPNC*0/DX.3DCIQUKO\"C ]* .7M$+Z=XDO@&$-X\DD.1CJ@#1K['_/O)_P"@FI-/_P"0=:_]075V\3>8",*5$;<*1R"1DC''=LOAJZFN9(',/V&;48M2D<.=X=-A*@ M8Z%T!SGH<5UV*,#TH XJ/PM=S6EE8ZC':SV6G64MI%&)&!N0RA%WI/-;?B!)Y-.L;MHOGL[J&YFCBR_R@X?'&3@$GIDXZ9K>VCTHP* M.-F\-S:C>^(+F+[-#%J45N]I+KO M_KPA_P#1DM:] &3XC_Y!2?\ 7Y:_^E$=9>MZ/?7_ (B6Y6SL[BR_LRXLW2>7 M[[2-&PRNT@K^[P?K6IXC_P"04G_7Y:_^E$=:N : .!TOP;>K81:;?1VL=L=& M2PD>"4EED5B0ZC:.A.0?7M5C5/#VO7FGZ7.:[; ]*-H]* .%@\(WL&IV,D"VEK;0JJ20QN70*(F3Y0RYW L0&# M#(SD5EGP-JW]E&U-KICRGP^=+\TRGF0'AC\GW<']:].P*,#TH \ZO/"6O3W< M]U:I9V^);258%NY(UF\J-T9&9%!7[X((SR@XJ&Z\#:A+!J*6NFZ7;276D-9 MI.[;9&D+E '.Z!I=]I^IZW0:5>6WV>UCD,DK[[9X,X,?R_,"?FQE<$GUYZS7FG;P M;K9N(T1_L=R $?<-NUL'.!R1@GT]ZW-H]*RO%'_(HZU_UXS_ /HMJ -4=*6D M'2EH **** ,"S_Y'[6/^P78_^C;NM^L"S_Y'[6/^P78_^C;NM^@ HHHH Y[Q M+H3ZY=:6'M[&YL[6=I9X+M2RR@QLF,8(XWYY]!]:9?:/>KJNF3:5!I\=G8PR M1+ Y*#YPHP JX 7I[]L5T> >HHP* .)L/!-UID%G<6MW;)J%K>3W*((2+<) M-]^%5SE5Z$'L1G':NKLUN\,]XT0<]$BY5?Q(!)_#T_&Y28% "T444 %9>I_\ MA;1O^OB3_P!$O6I67J?_ "%M&_Z^)/\ T2] &I4%Y_QY3_\ 7-OY5/4-W_QY M3_\ 7-OY4 <4_A>XURQTV2:2T"P_9I[6ZV$7%H%2/Y!I]AX4U M2TFC\R:T:/\ MBYU%\,V=LH<;1QR1YAY]AZ\=3HO_("T_P#Z]H__ $$5>P/2 M@#S]O!.KC2I;*.\L0K:&='&4?IR!)GMPI)O!-Y-XDM]6:/0I3LA\[ M[78^=-$T?>&0X*YP.H.#R*[S ]*,#TH X8^#=0;PQI^F"[@CN;190)XW=2"_ M0@CL,G*D$-T/J)8_">IQZS#?M>VTAANGG50IC#AH3'@JOR[L_P 6")@RCGD [1GTS4A69==/B81N;5M/ M$ M@C>?OW[L;<8SGC]:ZC HVCTH Y5M'NK3P=I]JL?FW5E)#'+_Q"=8GM9K>*+4K&WMXO-#AD\MV.WVCTHP M/2@#A=0T"_$'BM&:%I?$>V"%8PS>5F 0DL<= %W9_#K6SX8B%OJ/B2%22L>H MQJ"?06=M70E01R,U@^'_ /D,^*?^PHG_ *1VU &_6'KW_(8\,?\ 83?_ -)+ MBMRL/7O^0QX8_P"PF_\ Z27% &Y1110!A^(-"?5+C3-0M)U@U#3)VFMWD71R#CZ5E>*/"]_XGT^W$[Z:+BTN5N(;>YM_M%LY"LI$BG!;(<] M,8&/6NQI,"@#A9?!NH&!HHFTN%6TB6PV6T)AB1Y&W$J@SA1Z9S4ECX4UFSU$ M$7VGMIT_D27,$EL7>.6.-4W1-D 9"+RP.,<5VV!1@>E ' 2^ [^3PTND&\M\ MVNFRZ=:S;2"R/M&YQZ@(.!D$\\59O?#&LWEUJ<^^Q4WTUE*1O?Y# RL1]WG) M7 ]*[; HP/2@ 7I2T44 97B3_D7;[_KD:U:RO$G_ "+M]_UR-:M &-K/_(6\ M/?\ 80?_ -)9ZV:QM9_Y"WA[_L(/_P"DL];- !1110!B:Y87]WJ&E7-D+8BR MF>9A,[+OS&\>!@''W\_@*S+G0]6N+G3IQ_9\0M;F>;RHR^,21LF <XRW\ Z MA!97UE:7=LT4^G6]DKRE@5,;LQ; '0[S@=L#K7HF!1@>E "(6V+N #8YP>*= M110 5B^,/^1)U_\ [!UQ_P"BVK:K%\8?\B3K_P#V#KC_ -%M0!LCI2T@Z4M M!1110 5!>6D5]:26TZEHI!A@&*G\QR/PJ>B@#(_X1RR_Y[ZG_P"#2Y_^.4?\ M(Y9?\]]3_P#!I<__ !RM>B@#(_X1RR_Y[ZG_ .#2Y_\ CE'_ CEE_SWU/\ M\&ES_P#'*UZ* ,C_ (1RR_Y[ZG_X-+G_ ..4?\(Y9?\ /?4__!I<_P#QRM>B M@#(_X1RR_P">^I_^#2Y_^.4?\(Y9?\]]3_\ !I<__'*UZ* ,C_A'++_GOJ?_ M (-+G_XY1_PCEE_SWU/_ ,&ES_\ '*UZ* ,9_#-A(C(TNI,K#!#:GG^L MK6CC6*-8T&%48 ]J?10 AZ5FW&A65S=27+F[263&\P7LT0;'3(1@,UIT4 9' M_".67_/?4_\ P:7/_P ^I_^#2Y_^.5KT4 9'_".67_/?4__ :7/_QRC_A'++_GOJ?_ (-+ MG_XY6O10!D?\(Y9?\]]3_P#!I<__ !RC_A'++_GOJ?\ X-+G_P".5KT4 9]E MH]K83R3P?:&ED4(S3W,DQP"2 -['')/3UK0'2BB@"O?64.H6C6UPI:)B"0KE M3D$$$$$$$$ \'M5#_A'+'_GMJ?\ X-+G_P".5KT4 9'_ CEE_SWU/\ \&ES M_P#'*/\ A'++_GOJ?_@TN?\ XY6O10!D?\(Y9?\ /?4__!I<_P#QRC_A'++_ M )[ZG_X-+G_XY6O10!D?\(Y9?\]]3_\ !I<__'*/^$^I_\ @TN?_CE: M]% &1_PCEE_SWU/_ ,&ES_\ '*/^$^I_P#@TN?_ (Y6O10!D?\ ".67 M_/?4_P#P:7/_ ,<_\ US;^53 8H/- '/:1X@TF+1K& M.2_A1TMXU96.""%&15W_ (231O\ H(P?]]5IXQ2T 9?_ DFC?\ 01@_[ZH_ MX231O^@C!_WU6I10!E_\))HW_01@_P"^J/\ A)-&_P"@C!_WU6I10!E_\))H MW_01@_[ZH_X231O^@C!_WU6I10!E_P#"2:-_T$8/^^J/^$DT;_H(P?\ ?5:E M% &4?$FC?]!&#_OJJ7AB5+C4/$EQ$VZ&74T:-P.& M+=21Z\@C\*Z'%+B@ K MG_$LR6U_X=N9FV0Q:DQDM &6/$FC8_Y",'_ 'U2 M_P#"2:-_T$8/^^JT\4M &7_PDFC?]!&#_OJC_A)-&_Z",'_?5:E% &7_ ,)) MHW_01@_[ZH_X231O^@C!_P!]5J44 9?_ DFC?\ 01@_[ZH_X231O^@C!_WU M6I10!E_\))HW_01@_P"^J/\ A)-&_P"@C!_WU6I10!S>N:WIEWHMU;V]Y%+- M(FU$0Y+$]JZ,'(S00#2C@4 86OSQV][H=Q,VR&*_9I'/10;>903^) _&K/\ MPDFC?]!&#_OJM/:,YI: ,O\ X231O^@C!_WU1_PDFC?]!&#_ +ZK4HH R_\ MA)-&_P"@C!_WU1_PDFC?]!&#_OJM2B@#+_X231O^@C!_WU1_PDFC?]!&#_OJ MM2B@#+_X231O^@C!_P!]4?\ "2:-_P!!&#_OJM2B@#+_ .$DT;_H(P?]]5D^ M*-