2020FYfalse0000009326P3YP3Ybcpc:OperatingLeaseAndFinanceLeaseRightOfUseAssetbcpc:OperatingLeaseAndFinanceLeaseRightOfUseAssetbcpc:OperatingLeaseAndFinanceLeaseRightOfUseAssetbcpc:OperatingLeaseAndFinanceLeaseRightOfUseAssetbcpc:OperatingAndFinanceLeaseLiabilityCurrentbcpc:OperatingAndFinanceLeaseLiabilityCurrentbcpc:OperatingAndFinanceLeaseLiabilityCurrentbcpc:OperatingAndFinanceLeaseLiabilityCurrentbcpc:OperatingAndFinanceLeaseLiabilityNoncurrentbcpc:OperatingAndFinanceLeaseLiabilityNoncurrentbcpc:OperatingAndFinanceLeaseLiabilityNoncurrentbcpc:OperatingAndFinanceLeaseLiabilityNoncurrent00000093262020-01-012020-12-31iso4217:USD00000093262020-06-30xbrli:shares00000093262021-02-1100000093262020-12-3100000093262019-12-31iso4217:USDxbrli:shares00000093262019-01-012019-12-3100000093262018-01-012018-12-3100000093262017-12-310000009326us-gaap:RetainedEarningsMember2017-12-310000009326us-gaap:AccumulatedOtherComprehensiveIncomeMember2017-12-310000009326us-gaap:CommonStockMember2017-12-310000009326us-gaap:TreasuryStockMember2017-12-310000009326us-gaap:AdditionalPaidInCapitalMember2017-12-310000009326us-gaap:RetainedEarningsMember2018-01-012018-12-310000009326us-gaap:AdditionalPaidInCapitalMember2018-01-012018-12-310000009326us-gaap:AccumulatedOtherComprehensiveIncomeMember2018-01-012018-12-3100000093262018-12-310000009326us-gaap:TreasuryStockMember2018-01-012018-12-310000009326us-gaap:CommonStockMember2018-01-012018-12-310000009326us-gaap:RetainedEarningsMember2018-12-310000009326us-gaap:AccumulatedOtherComprehensiveIncomeMember2018-12-310000009326us-gaap:CommonStockMember2018-12-310000009326us-gaap:TreasuryStockMember2018-12-310000009326us-gaap:AdditionalPaidInCapitalMember2018-12-310000009326us-gaap:RetainedEarningsMember2019-01-012019-12-310000009326us-gaap:AdditionalPaidInCapitalMember2019-01-012019-12-310000009326us-gaap:AccumulatedOtherComprehensiveIncomeMember2019-01-012019-12-310000009326us-gaap:TreasuryStockMember2019-01-012019-12-310000009326us-gaap:CommonStockMember2019-01-012019-12-310000009326us-gaap:RetainedEarningsMember2019-12-310000009326us-gaap:AccumulatedOtherComprehensiveIncomeMember2019-12-310000009326us-gaap:CommonStockMember2019-12-310000009326us-gaap:TreasuryStockMember2019-12-310000009326us-gaap:AdditionalPaidInCapitalMember2019-12-310000009326us-gaap:RetainedEarningsMember2020-01-012020-12-310000009326us-gaap:AdditionalPaidInCapitalMember2020-01-012020-12-310000009326us-gaap:AccumulatedOtherComprehensiveIncomeMember2020-01-012020-12-310000009326us-gaap:TreasuryStockMember2020-01-012020-12-310000009326us-gaap:CommonStockMember2020-01-012020-12-310000009326us-gaap:RetainedEarningsMember2020-12-310000009326us-gaap:AccumulatedOtherComprehensiveIncomeMember2020-12-310000009326us-gaap:CommonStockMember2020-12-310000009326us-gaap:TreasuryStockMember2020-12-310000009326us-gaap:AdditionalPaidInCapitalMember2020-12-310000009326us-gaap:DifferenceBetweenRevenueGuidanceInEffectBeforeAndAfterTopic606Member2018-01-012018-12-310000009326srt:MinimumMemberus-gaap:BuildingMember2020-01-012020-12-310000009326srt:MaximumMemberus-gaap:BuildingMember2020-01-012020-12-310000009326srt:MinimumMemberus-gaap:EquipmentMember2020-01-012020-12-310000009326srt:MaximumMemberus-gaap:EquipmentMember2020-01-012020-12-310000009326bcpc:HumanNutritionAndHealthMember2020-12-310000009326bcpc:HumanNutritionAndHealthMember2019-12-310000009326bcpc:AnimalNutritionAndHealthMember2020-12-310000009326bcpc:AnimalNutritionAndHealthMember2019-12-310000009326bcpc:SpecialtyProductsMember2020-12-310000009326bcpc:SpecialtyProductsMember2019-12-310000009326bcpc:IndustrialProductsMember2020-12-310000009326bcpc:IndustrialProductsMember2019-12-310000009326srt:MinimumMemberus-gaap:CustomerListsMember2020-01-012020-12-310000009326srt:MaximumMemberus-gaap:CustomerListsMember2020-01-012020-12-310000009326srt:MinimumMemberus-gaap:TrademarksAndTradeNamesMember2020-01-012020-12-310000009326srt:MaximumMemberus-gaap:TrademarksAndTradeNamesMember2020-01-012020-12-310000009326srt:MinimumMemberus-gaap:DevelopedTechnologyRightsMember2020-01-012020-12-310000009326srt:MaximumMemberus-gaap:DevelopedTechnologyRightsMember2020-01-012020-12-310000009326srt:MinimumMemberbcpc:RegulatoryRegistrationCostsMember2020-01-012020-12-310000009326srt:MaximumMemberbcpc:RegulatoryRegistrationCostsMember2020-01-012020-12-310000009326srt:MinimumMemberbcpc:PatentsTradeSecretsMember2020-01-012020-12-310000009326srt:MaximumMemberbcpc:PatentsTradeSecretsMember2020-01-012020-12-310000009326srt:MinimumMemberbcpc:OtherIntangibleAssetsExcludingRegulatoryRegistrationCostsAndPatentsTradeSecretsMember2020-01-012020-12-310000009326srt:MaximumMemberbcpc:OtherIntangibleAssetsExcludingRegulatoryRegistrationCostsAndPatentsTradeSecretsMember2020-01-012020-12-310000009326bcpc:HumanNutritionAndHealthMember2019-01-012019-12-310000009326us-gaap:DesignatedAsHedgingInstrumentMemberus-gaap:InterestRateSwapMember2019-05-280000009326us-gaap:DesignatedAsHedgingInstrumentMemberus-gaap:CurrencySwapMember2019-05-280000009326bcpc:ZumbroRiverBrandIncMember2019-01-012019-12-310000009326bcpc:ZumbroRiverBrandIncMember2019-12-130000009326bcpc:ZumbroRiverBrandIncMember2020-05-012020-05-310000009326bcpc:ZumbroRiverBrandIncMemberbcpc:HumanNutritionAndHealthMember2019-12-130000009326us-gaap:CustomerRelationshipsMemberbcpc:ZumbroRiverBrandIncMember2019-12-130000009326bcpc:ZumbroRiverBrandIncMemberus-gaap:DevelopedTechnologyRightsMember2019-12-130000009326us-gaap:TradeNamesMemberbcpc:ZumbroRiverBrandIncMember2019-12-130000009326us-gaap:CustomerRelationshipsMemberbcpc:ZumbroRiverBrandIncMember2019-12-132019-12-130000009326us-gaap:TradeNamesMemberbcpc:ZumbroRiverBrandIncMember2019-12-132019-12-130000009326bcpc:ZumbroRiverBrandIncMemberus-gaap:DevelopedTechnologyRightsMember2019-12-132019-12-13xbrli:pure0000009326bcpc:ChemogasHoldingNVAndSubsidiariesMember2019-05-27iso4217:EUR0000009326bcpc:ChemogasHoldingNVAndSubsidiariesMember2019-05-272019-05-270000009326us-gaap:CustomerRelationshipsMemberbcpc:ChemogasHoldingNVAndSubsidiariesMember2019-05-270000009326us-gaap:DevelopedTechnologyRightsMemberbcpc:ChemogasHoldingNVAndSubsidiariesMember2019-05-270000009326us-gaap:TradeNamesMemberbcpc:ChemogasHoldingNVAndSubsidiariesMember2019-05-270000009326us-gaap:CustomerRelationshipsMemberbcpc:ChemogasHoldingNVAndSubsidiariesMember2020-01-012020-12-310000009326us-gaap:TradeNamesMemberbcpc:ChemogasHoldingNVAndSubsidiariesMember2020-01-012020-12-310000009326us-gaap:DevelopedTechnologyRightsMemberbcpc:ChemogasHoldingNVAndSubsidiariesMember2020-01-012020-12-310000009326bcpc:ChemogasAndZumbroRiverBrandIncMember2020-01-012020-12-310000009326bcpc:ChemogasAndZumbroRiverBrandIncMember2019-01-012019-12-310000009326us-gaap:GeneralAndAdministrativeExpenseMember2020-01-012020-12-310000009326us-gaap:GeneralAndAdministrativeExpenseMember2019-01-012019-12-310000009326us-gaap:GeneralAndAdministrativeExpenseMember2018-01-012018-12-310000009326us-gaap:CostOfSalesMember2020-01-012020-12-310000009326us-gaap:CostOfSalesMember2019-01-012019-12-310000009326us-gaap:CostOfSalesMember2018-01-012018-12-310000009326us-gaap:OperatingExpenseMember2020-01-012020-12-310000009326us-gaap:OperatingExpenseMember2019-01-012019-12-310000009326us-gaap:OperatingExpenseMember2018-01-012018-12-31bcpc:plan0000009326bcpc:OmnibusIncentivePlan2017Member2020-12-310000009326bcpc:StockPlan1999Member2020-12-310000009326bcpc:OmnibusIncentivePlan2017Member2020-01-012020-12-310000009326us-gaap:EmployeeStockOptionMemberbcpc:OmnibusIncentivePlan2017Member2020-12-310000009326srt:DirectorMemberbcpc:OmnibusIncentivePlan2017Member2020-01-012020-12-310000009326bcpc:EmployeeMemberus-gaap:PerformanceSharesMember2020-01-012020-12-310000009326us-gaap:EmployeeStockOptionMember2020-01-012020-12-310000009326us-gaap:EmployeeStockOptionMember2019-01-012019-12-310000009326us-gaap:EmployeeStockOptionMember2018-01-012018-12-310000009326bcpc:EmployeeMemberus-gaap:PerformanceSharesMember2019-01-012019-12-310000009326bcpc:EmployeeMemberus-gaap:PerformanceSharesMember2018-01-012018-12-310000009326srt:MinimumMemberus-gaap:RestrictedStockMemberbcpc:EmployeeMember2020-01-012020-12-310000009326srt:MaximumMemberus-gaap:RestrictedStockMemberbcpc:EmployeeMember2020-01-012020-12-310000009326srt:MinimumMembersrt:DirectorMemberus-gaap:RestrictedStockMember2020-01-012020-12-310000009326srt:MaximumMembersrt:DirectorMemberus-gaap:RestrictedStockMember2020-01-012020-12-310000009326us-gaap:EmployeeStockOptionMember2019-12-310000009326us-gaap:EmployeeStockOptionMember2018-12-310000009326us-gaap:EmployeeStockOptionMember2017-12-310000009326us-gaap:EmployeeStockOptionMember2020-12-310000009326bcpc:ExercisePriceRange1Member2020-01-012020-12-310000009326bcpc:ExercisePriceRange1Member2020-12-310000009326bcpc:ExercisePriceRange2Member2020-01-012020-12-310000009326bcpc:ExercisePriceRange2Member2020-12-310000009326bcpc:ExercisePriceRange3Member2020-01-012020-12-310000009326bcpc:ExercisePriceRange3Member2020-12-310000009326us-gaap:RestrictedStockMember2019-12-310000009326us-gaap:RestrictedStockMember2018-12-310000009326us-gaap:RestrictedStockMember2017-12-310000009326us-gaap:RestrictedStockMember2020-01-012020-12-310000009326us-gaap:RestrictedStockMember2019-01-012019-12-310000009326us-gaap:RestrictedStockMember2018-01-012018-12-310000009326us-gaap:RestrictedStockMember2020-12-310000009326us-gaap:PerformanceSharesMember2019-12-310000009326us-gaap:PerformanceSharesMember2018-12-310000009326us-gaap:PerformanceSharesMember2017-12-310000009326us-gaap:PerformanceSharesMember2020-01-012020-12-310000009326us-gaap:PerformanceSharesMember2019-01-012019-12-310000009326us-gaap:PerformanceSharesMember2018-01-012018-12-310000009326us-gaap:PerformanceSharesMember2020-12-310000009326us-gaap:LandMember2020-12-310000009326us-gaap:LandMember2019-12-310000009326us-gaap:BuildingMember2020-12-310000009326us-gaap:BuildingMember2019-12-310000009326us-gaap:EquipmentMember2020-12-310000009326us-gaap:EquipmentMember2019-12-310000009326us-gaap:ConstructionInProgressMember2020-12-310000009326us-gaap:ConstructionInProgressMember2019-12-310000009326srt:NorthAmericaMember2020-12-310000009326srt:NorthAmericaMember2019-12-310000009326srt:EuropeMember2020-12-310000009326srt:EuropeMember2019-12-310000009326us-gaap:CustomerListsMember2020-12-310000009326us-gaap:CustomerListsMember2019-12-310000009326us-gaap:TrademarksAndTradeNamesMember2020-12-310000009326us-gaap:TrademarksAndTradeNamesMember2019-12-310000009326us-gaap:DevelopedTechnologyRightsMember2020-12-310000009326us-gaap:DevelopedTechnologyRightsMember2019-12-310000009326srt:MinimumMemberus-gaap:OtherIntangibleAssetsMember2020-01-012020-12-310000009326srt:MaximumMemberus-gaap:OtherIntangibleAssetsMember2020-01-012020-12-310000009326us-gaap:OtherIntangibleAssetsMember2020-12-310000009326us-gaap:OtherIntangibleAssetsMember2019-12-310000009326bcpc:StGabrielCCCompanyLLCMember2020-12-310000009326bcpc:EastmanChemicalCompanyMemberbcpc:StGabrielCCCompanyLLCMember2020-12-31bcpc:vote0000009326bcpc:StGabrielCCCompanyLLCMember2020-01-012020-12-310000009326bcpc:StGabrielCCCompanyLLCMember2019-01-012019-12-310000009326bcpc:StGabrielCCCompanyLLCMember2018-01-012018-12-310000009326bcpc:StGabrielCCCompanyLLCMember2019-12-310000009326us-gaap:SecuredDebtMember2018-06-270000009326us-gaap:RevolvingCreditFacilityMember2018-06-2700000093262018-06-270000009326us-gaap:SecuredDebtMember2020-01-012020-12-310000009326us-gaap:SecuredDebtMember2019-05-232019-05-230000009326us-gaap:SecuredDebtMember2019-12-132019-12-130000009326us-gaap:RevolvingCreditFacilityMember2020-01-012020-12-310000009326bcpc:RevolvingCreditAgreementMember2020-12-310000009326bcpc:RevolvingCreditAgreementMembersrt:MinimumMember2020-01-012020-12-310000009326bcpc:RevolvingCreditAgreementMembersrt:MaximumMember2020-01-012020-12-310000009326bcpc:RevolvingCreditAgreementMember2020-01-012020-12-3100000093262018-04-012018-06-300000009326us-gaap:EmployeeStockOptionMember2020-01-012020-12-310000009326us-gaap:EmployeeStockOptionMember2019-01-012019-12-310000009326us-gaap:EmployeeStockOptionMember2018-01-012018-12-310000009326us-gaap:DomesticCountryMember2020-12-310000009326us-gaap:StateAndLocalJurisdictionMember2020-12-31bcpc:numberOfReportableSegmentsbcpc:facility0000009326us-gaap:OperatingSegmentsMemberbcpc:HumanNutritionAndHealthMember2020-12-310000009326us-gaap:OperatingSegmentsMemberbcpc:HumanNutritionAndHealthMember2019-12-310000009326us-gaap:OperatingSegmentsMemberbcpc:AnimalNutritionAndHealthMember2020-12-310000009326us-gaap:OperatingSegmentsMemberbcpc:AnimalNutritionAndHealthMember2019-12-310000009326us-gaap:OperatingSegmentsMemberbcpc:SpecialtyProductsMember2020-12-310000009326us-gaap:OperatingSegmentsMemberbcpc:SpecialtyProductsMember2019-12-310000009326us-gaap:CorporateNonSegmentMember2020-12-310000009326us-gaap:CorporateNonSegmentMember2019-12-310000009326us-gaap:OperatingSegmentsMemberbcpc:HumanNutritionAndHealthMember2020-01-012020-12-310000009326us-gaap:OperatingSegmentsMemberbcpc:HumanNutritionAndHealthMember2019-01-012019-12-310000009326us-gaap:OperatingSegmentsMemberbcpc:HumanNutritionAndHealthMember2018-01-012018-12-310000009326us-gaap:OperatingSegmentsMemberbcpc:AnimalNutritionAndHealthMember2020-01-012020-12-310000009326us-gaap:OperatingSegmentsMemberbcpc:AnimalNutritionAndHealthMember2019-01-012019-12-310000009326us-gaap:OperatingSegmentsMemberbcpc:AnimalNutritionAndHealthMember2018-01-012018-12-310000009326us-gaap:OperatingSegmentsMemberbcpc:SpecialtyProductsMember2020-01-012020-12-310000009326us-gaap:OperatingSegmentsMemberbcpc:SpecialtyProductsMember2019-01-012019-12-310000009326us-gaap:OperatingSegmentsMemberbcpc:SpecialtyProductsMember2018-01-012018-12-310000009326us-gaap:CorporateNonSegmentMember2020-01-012020-12-310000009326us-gaap:CorporateNonSegmentMember2019-01-012019-12-310000009326us-gaap:CorporateNonSegmentMember2018-01-012018-12-310000009326us-gaap:MaterialReconcilingItemsMember2020-01-012020-12-310000009326us-gaap:MaterialReconcilingItemsMember2019-01-012019-12-310000009326us-gaap:MaterialReconcilingItemsMember2018-01-012018-12-310000009326bcpc:ProductSalesMember2020-01-012020-12-310000009326bcpc:ProductSalesMember2019-01-012019-12-310000009326bcpc:ProductSalesMember2018-01-012018-12-310000009326bcpc:CoManufacturingMember2020-01-012020-12-310000009326bcpc:CoManufacturingMember2019-01-012019-12-310000009326bcpc:CoManufacturingMember2018-01-012018-12-310000009326bcpc:BillAndHoldMember2020-01-012020-12-310000009326bcpc:BillAndHoldMember2019-01-012019-12-310000009326bcpc:BillAndHoldMember2018-01-012018-12-310000009326bcpc:ConsignmentMember2020-01-012020-12-310000009326bcpc:ConsignmentMember2019-01-012019-12-310000009326bcpc:ConsignmentMember2018-01-012018-12-310000009326us-gaap:ProductMember2020-01-012020-12-310000009326us-gaap:ProductMember2019-01-012019-12-310000009326us-gaap:ProductMember2018-01-012018-12-310000009326us-gaap:RoyaltyMember2020-01-012020-12-310000009326us-gaap:RoyaltyMember2019-01-012019-12-310000009326us-gaap:RoyaltyMember2018-01-012018-12-310000009326country:US2020-01-012020-12-310000009326country:US2019-01-012019-12-310000009326country:US2018-01-012018-12-310000009326us-gaap:NonUsMember2020-01-012020-12-310000009326us-gaap:NonUsMember2019-01-012019-12-310000009326us-gaap:NonUsMember2018-01-012018-12-31bcpc:revenue_sub-stream0000009326us-gaap:CurrencySwapMember2020-01-012020-12-310000009326us-gaap:CurrencySwapMember2019-01-012019-12-310000009326us-gaap:CurrencySwapMember2018-01-012018-12-310000009326us-gaap:AccumulatedTranslationAdjustmentMember2019-12-310000009326us-gaap:AccumulatedGainLossNetCashFlowHedgeParentMember2019-12-310000009326us-gaap:AccumulatedDefinedBenefitPlansAdjustmentMember2019-12-310000009326us-gaap:AccumulatedTranslationAdjustmentMember2020-01-012020-12-310000009326us-gaap:AccumulatedGainLossNetCashFlowHedgeParentMember2020-01-012020-12-310000009326us-gaap:AccumulatedDefinedBenefitPlansAdjustmentMember2020-01-012020-12-310000009326us-gaap:AccumulatedTranslationAdjustmentMember2020-12-310000009326us-gaap:AccumulatedGainLossNetCashFlowHedgeParentMember2020-12-310000009326us-gaap:AccumulatedDefinedBenefitPlansAdjustmentMember2020-12-310000009326us-gaap:DefinedBenefitPostretirementHealthCoverageMember2019-12-310000009326us-gaap:DefinedBenefitPostretirementHealthCoverageMember2018-12-310000009326us-gaap:DefinedBenefitPostretirementHealthCoverageMember2020-01-012020-12-310000009326us-gaap:DefinedBenefitPostretirementHealthCoverageMember2019-01-012019-12-310000009326us-gaap:DefinedBenefitPostretirementHealthCoverageMember2020-12-310000009326us-gaap:DefinedBenefitPostretirementHealthCoverageMember2018-01-012018-12-310000009326bcpc:CentralStatesSoutheastAndSouthwestAreasPensionFundMember2020-01-012020-12-310000009326bcpc:CentralStatesSoutheastAndSouthwestAreasPensionFundMember2019-01-012019-12-310000009326bcpc:CentralStatesSoutheastAndSouthwestAreasPensionFundMember2018-01-012018-12-310000009326bcpc:ChemogasDefinedPensionPlanMemberus-gaap:PensionPlansDefinedBenefitMember2020-12-310000009326bcpc:ChemogasDefinedPensionPlanMemberus-gaap:PensionPlansDefinedBenefitMember2019-12-310000009326bcpc:ChemogasDefinedPensionPlanMemberus-gaap:PensionPlansDefinedBenefitMember2018-12-310000009326bcpc:ChemogasDefinedPensionPlanMemberus-gaap:PensionPlansDefinedBenefitMember2020-01-012020-12-310000009326bcpc:ChemogasDefinedPensionPlanMemberus-gaap:PensionPlansDefinedBenefitMember2019-01-012019-12-310000009326us-gaap:MoneyMarketFundsMemberus-gaap:FairValueInputsLevel1Member2020-12-310000009326us-gaap:MoneyMarketFundsMemberus-gaap:FairValueInputsLevel1Member2019-12-310000009326us-gaap:MoneyMarketFundsMember2020-12-310000009326us-gaap:MoneyMarketFundsMember2019-12-310000009326us-gaap:DerivativeFinancialInstrumentsLiabilitiesMemberus-gaap:CurrencySwapMember2020-12-310000009326us-gaap:DerivativeFinancialInstrumentsLiabilitiesMemberus-gaap:CurrencySwapMember2019-12-310000009326us-gaap:InterestRateSwapMemberus-gaap:DerivativeFinancialInstrumentsLiabilitiesMember2020-12-310000009326us-gaap:InterestRateSwapMemberus-gaap:DerivativeFinancialInstrumentsLiabilitiesMember2019-12-310000009326bcpc:ServicesProvidedMemberus-gaap:CorporateJointVentureMember2020-01-012020-12-310000009326bcpc:ServicesProvidedMemberus-gaap:CorporateJointVentureMember2019-01-012019-12-310000009326bcpc:ServicesProvidedMemberus-gaap:CorporateJointVentureMember2018-01-012018-12-310000009326us-gaap:CorporateJointVentureMemberbcpc:RawMaterialsSoldMember2020-01-012020-12-310000009326us-gaap:CorporateJointVentureMemberbcpc:RawMaterialsSoldMember2019-01-012019-12-310000009326us-gaap:CorporateJointVentureMemberbcpc:RawMaterialsSoldMember2018-01-012018-12-310000009326us-gaap:CorporateJointVentureMember2020-01-012020-12-310000009326us-gaap:CorporateJointVentureMember2019-01-012019-12-310000009326us-gaap:CorporateJointVentureMember2018-01-012018-12-310000009326us-gaap:CorporateJointVentureMember2020-12-310000009326us-gaap:CorporateJointVentureMember2019-12-31bcpc:tranche0000009326bcpc:LesseeOperatingLeaseTrancheOneMembersrt:MinimumMember2020-12-310000009326bcpc:LesseeOperatingLeaseTrancheOneMembersrt:MaximumMember2020-12-310000009326bcpc:LesseeOperatingLeaseTrancheOneMember2020-12-310000009326bcpc:LesseeOperatingLeaseTrancheTwoMembersrt:MinimumMember2020-12-310000009326bcpc:LesseeOperatingLeaseTrancheTwoMembersrt:MaximumMember2020-12-310000009326bcpc:LesseeOperatingLeaseTrancheTwoMember2020-12-310000009326bcpc:LesseeOperatingLeaseTrancheThreeMembersrt:MinimumMember2020-12-310000009326bcpc:LesseeOperatingLeaseTrancheThreeMembersrt:MaximumMember2020-12-310000009326bcpc:LesseeOperatingLeaseTrancheThreeMember2020-12-310000009326bcpc:LesseeOperatingLeaseTrancheFourMember2020-12-310000009326us-gaap:DesignatedAsHedgingInstrumentMemberus-gaap:InterestRateSwapMemberbcpc:PayFixedInterestRateMember2019-05-280000009326us-gaap:InterestRateSwapMemberus-gaap:InterestExpenseMember2020-01-012020-12-310000009326us-gaap:InterestRateSwapMemberus-gaap:InterestExpenseMember2019-01-012019-12-310000009326us-gaap:DesignatedAsHedgingInstrumentMemberbcpc:PayFixedInterestRateMemberus-gaap:CurrencySwapMember2019-05-280000009326us-gaap:DesignatedAsHedgingInstrumentMemberbcpc:ReceiveFixedInterestRateMemberus-gaap:CurrencySwapMember2019-05-280000009326us-gaap:DesignatedAsHedgingInstrumentMemberus-gaap:InterestExpenseMemberus-gaap:CurrencySwapMember2020-01-012020-12-310000009326us-gaap:DesignatedAsHedgingInstrumentMemberus-gaap:InterestExpenseMemberus-gaap:CurrencySwapMember2019-01-012019-12-310000009326us-gaap:DerivativeFinancialInstrumentsLiabilitiesMember2020-12-310000009326us-gaap:DerivativeFinancialInstrumentsLiabilitiesMember2019-12-310000009326us-gaap:InterestRateSwapMember2020-01-012020-12-310000009326us-gaap:InterestRateSwapMember2019-01-012019-12-3100000093262020-01-012020-03-3100000093262020-04-012020-06-3000000093262020-07-012020-09-3000000093262020-10-012020-12-3100000093262019-01-012019-03-3100000093262019-04-012019-06-3000000093262019-07-012019-09-3000000093262019-10-012019-12-310000009326us-gaap:AllowanceForCreditLossMember2017-12-310000009326us-gaap:InventoryValuationReserveMember2017-12-310000009326us-gaap:AllowanceForCreditLossMember2018-01-012018-12-310000009326us-gaap:InventoryValuationReserveMember2018-01-012018-12-310000009326us-gaap:AllowanceForCreditLossMember2018-12-310000009326us-gaap:InventoryValuationReserveMember2018-12-310000009326us-gaap:AllowanceForCreditLossMember2019-01-012019-12-310000009326us-gaap:InventoryValuationReserveMember2019-01-012019-12-310000009326us-gaap:AllowanceForCreditLossMember2019-12-310000009326us-gaap:InventoryValuationReserveMember2019-12-310000009326us-gaap:AllowanceForCreditLossMember2020-01-012020-12-310000009326us-gaap:InventoryValuationReserveMember2020-01-012020-12-310000009326us-gaap:AllowanceForCreditLossMember2020-12-310000009326us-gaap:InventoryValuationReserveMember2020-12-31
UNITED STATES
SECURITIES AND EXCHANGE COMMISSION
Washington, D.C. 20549
FORM 10-K
(Mark One)
| | | | | |
| ☑ | ANNUAL REPORT PURSUANT TO SECTION 13 OR SECTION 15(d) OF THE SECURITIES EXCHANGE ACT OF 1934 |
| For the fiscal year ended December 31, 2020 |
| OR |
| ☐ | TRANSITION REPORT PURSUANT TO SECTION 13 OR 15(d) OF THE SECURITIES EXCHANGE ACT OF 1934 |
| For the transition period from _____ to _____ |
Commission file number: 1-13648
_______________________________________________________________________________________________________________
Balchem Corporation
(Exact name of Registrant as specified in its charter)
| | | | | | | | |
| Maryland | | 13-2578432 |
| (State or other jurisdiction of incorporation or organization) | | (I.R.S. Employer Identification Number) |
| | | | | | | | |
52 Sunrise Park Road, New Hampton, NY 10958 |
| (Address of principal executive offices) (Zip Code) |
Registrant’s telephone number, including area code: (845) 326-5600 |
|
| Securities registered pursuant to Section 12(b) of the Act: |
| | |
| Title of each class | Trading symbol | Name of each exchange on which registered |
| Common Stock, par value $.06-2/3 per share | BCPC | Nasdaq Global Market |
| | |
| Securities registered pursuant to Section 12(g) of the Act: None |
Indicate by check mark whether the Registrant is a well-known seasoned issuer, as defined in Rule 405 of the Securities Act.
Yes ☑ No ☐
Indicate by check mark whether the Registrant is not required to file reports pursuant to Section 13 or Section 15(d) of the Act.
Yes ☐ No ☑
Indicate by check mark whether the Registrant (1) has filed all reports required to be filed by Section 13 or 15(d) of the Securities Exchange Act of 1934 during the preceding 12 months (or such shorter period that the Registrant was required to file such reports), and (2) has been subject to such filing requirements for the past 90 days. Yes ☑ No ☐
Indicate by check mark whether the registrant has submitted electronically every Interactive Data File required to be submitted pursuant to Rule 405 of Regulation S-T (§232.405 of this chapter) during the preceding 12 months (or for such shorter period that the registrant was required to submit such files).
Yes ☑ No ☐
Indicate by check mark whether the Registrant is a large accelerated filer, an accelerated filer, a non-accelerated filer, or a smaller reporting company. See the definitions of “large accelerated filer,” “accelerated filer,” “smaller reporting company,” and “emerging growth company” in Rule 12b-2 of the Exchange Act.
| | | | | | | | | | | |
| (Check one): | Large accelerated filer ☑ | Accelerated filer ☐ | |
| | Non-accelerated filer ☐ | Smaller reporting company ☐ | Emerging growth company ☐ |
If an emerging growth company, indicate by check mark if the registrant has elected not to use the extended transition period for complying with any new or revised financial accounting standards provided pursuant to Section 13(a) of the Exchange Act. ☐
Indicate by check mark whether the registrant has filed a report on and attestation to its management's assessment of the effectiveness of its internal control over financial reporting under Section 404(b) of the Sarbanes-Oxley Act (15 U.S.C. 7262(b)) by the registered public accounting firm that prepared or issued its audit report. ☑
Indicate by check mark whether the Registrant is a shell company (as defined in Rule 12b-2 of the Exchange Act).
Yes ☐ No ☑
The aggregate market value of the common stock, par value $.06-2/3 per share (the “Common Stock”), issued and outstanding and held by non-affiliates of the Registrant, based upon the closing price for the Common Stock on the NASDAQ Global Market on June 30, 2020 was approximately $3,046,000,000. For purposes of this calculation, shares of the Registrant held by directors and officers of the Registrant and under the Registrant’s 401(k)/profit sharing plan have been excluded.
The number of shares outstanding of Common Stock was 32,392,805 as of February 11, 2021.
DOCUMENTS INCORPORATED BY REFERENCE
Selected portions of the Registrant’s proxy statement for its 2021 Annual Meeting of Stockholders (the “2021 Proxy Statement”) to be filed with the Securities and Exchange Commission pursuant to Regulation 14A within 120 days after Registrant’s fiscal year-end of December 31, 2020 are incorporated by reference in Part III of this Annual Report on Form 10-K to the extent stated therein.
Cautionary Statement Regarding Forward-Looking Statements
This Annual Report on Form 10-K contains “forward-looking statements” within the meaning of Section 21E of the Securities Exchange Act of 1934, as amended. Forward-looking statements are not statements of historical facts, but rather reflect our current expectations or beliefs concerning future events and results. We generally use the words “believes,” “expects,” “intends,” “plans,” “anticipates,” “likely,” “will,” “estimates,” “project” and similar expressions to identify forward-looking statements. Such forward-looking statements, including those concerning our expectations, involve risks, uncertainties and other factors, some of which are beyond our control, which may cause our actual results, performance or achievements, or industry results, to be materially different from any future results, performance or achievements expressed or implied by such forward-looking statements. The risks, uncertainties and factors that could cause our results to differ materially from our expectations and beliefs include, but are not limited to, those factors set forth in this Annual Report on Form 10-K under “Item 1A. - Risk Factors” below.
We cannot assure you that the expectations or beliefs reflected in these forward-looking statements will prove correct. We undertake no obligation to publicly update or revise any forward-looking statements, whether as a result of new information, future events or otherwise. You are cautioned not to unduly rely on such forward-looking statements when evaluating the information presented in this Annual Report on Form 10-K and all subsequent written and oral forward-looking statements made by us or persons acting on our behalf are expressly qualified in their entirety by the cautionary statements contained herein.
BALCHEM CORPORATION
ANNUAL REPORT ON FORM 10-K
TABLE OF CONTENTS
PART I
Item 1. Business (All amounts in thousands, except share and per share data)
General:
Balchem Corporation (“Balchem,” the “Company,” “we” or “us”), was incorporated in the State of Maryland in 1967. We develop, manufacture, distribute and market specialty performance ingredients and products for the nutritional, food, pharmaceutical, animal health, medical device sterilization, plant nutrition and industrial markets. Previously, our four reportable segments were: Human Nutrition and Health, Animal Nutrition and Health, Specialty Products, and Industrial Products. However, effective in the first quarter of 2020, in order to align with our strategic focus on health and nutrition, allocation of resources, and evaluation of operating performance, and given the 2019 reduction in portfolio scale of Industrial Products, we have revised our reporting segment structure to three reportable segments: Human Nutrition and Health, Animal Nutrition and Health, and Specialty Products. These reportable segments are strategic businesses that offer products and services to different markets. This realignment has been retrospectively applied. Sales and production of products outside of our reportable segments and other minor business activities are included in "Other and Unallocated" and applied retroactively to 2019 and 2018. There was no change to the Consolidated Financial Statements as a result of the change to the reportable segments. We expect that the new reportable segment structure will provide investors greater understanding of and alignment with our strategic focus. In order to ensure appropriate transparency and visibility into the financial performance of the Company, sufficient detail will continue to be provided relative to Other and Unallocated, including material contributions from oil and gas and other industrial market activities.
We sell our products through our own sales force, independent distributors and sales agents. Financial information concerning our business, business segments and geographic information appears in Management’s Discussion and Analysis of Financial Condition and Results of Operations under Item 7 below and in the Notes to our Consolidated Financial Statements included under Item 8 below, which information is incorporated herein by reference.
Human Nutrition & Health
The Human Nutrition & Health ("HNH") segment provides human grade choline nutrients and mineral amino acid chelated products through this segment for nutrition and health applications. Choline is recognized to play a key role in the development and structural integrity of brain cell membranes in infants, processing dietary fat, reproductive development and neural functions, such as memory and muscle function. The Company's mineral amino acid chelates, specialized mineral salts, and mineral complexes are used as raw materials for inclusion in premier human nutrition products. Proprietary technology has been combined to create an organic molecule in a form the body can readily assimilate. Sales growth for human nutrition applications is reliant on differentiation from lower-cost competitive products through scientific data, intellectual property and customers' appreciation of brand value. Consequently, the Company makes investments in such activities for long-term value differentiation. This segment also serves the food and beverage industry for beverage, bakery, dairy, confectionary, and savory manufacturers. The Company partners with its customers from ideation through commercialization to bring on-trend beverages, baked goods, confections, dairy and meat products to market. The Company has expertise in trends analysis and product development. When combined with its strong manufacturing capabilities in customized spray dried and emulsified powders, extrusion and agglomeration, blended lipid systems, liquid flavor delivery systems, juice and dairy bases, chocolate systems, as well as ice cream bases and variegates, the Company is a one-stop solutions provider for beverage and dairy product development needs. Additionally, this segment provides microencapsulation solutions to a variety of applications in food, pharmaceutical and nutritional ingredients to enhance performance of nutritional fortification, processing, mixing, and packaging applications and shelf-life. Major product applications are baked goods, refrigerated and frozen dough systems, processed meats, seasoning blends, confections, sports and protein bars, dietary plans, and nutritional supplements. The Company also creates cereal systems for ready-to-eat cereals, grain-based snacks, and cereal based ingredients.
Animal Nutrition & Health
The Company’s Animal Nutrition & Health ("ANH") segment provides nutritional products derived from its microencapsulation and chelation technologies in addition to basic choline chloride. For ruminant animals, the Company’s microencapsulated products boost health and milk production, delivering nutrient supplements that are biologically available, providing required nutritional levels. The Company’s proprietary chelation technology provides enhanced nutrient absorption for various species of production and companion animals and is marketed for use in animal feed throughout the world. ANH also manufactures and supplies choline chloride, an essential nutrient for monogastric animal health, predominantly to the poultry, pet and swine industries. Choline, which is manufactured and sold in both dry and aqueous forms, plays a vital role in the metabolism of fat. In poultry, choline deficiency can result in reduced growth rates and perosis in young birds, while in swine production choline is a necessary and required component of gestating and lactating sow diets for both liver health and prevention of leg deformity.
Sales of value-added encapsulated products are highly dependent on overall industry economics as well as the Company's ability to leverage the results of university and field research on the animal health and production benefits of our products. Management believes that success in the commodity-oriented basic choline chloride marketplace is highly dependent on the Company’s ability to maintain its strong reputation for excellent product quality and customer service. The Company continues to drive production efficiencies in order to maintain its competitive-cost position to effectively compete in a competitive global marketplace.
Specialty Products
Ethylene oxide, at the 100% level and blended with carbon dioxide, is sold as a sterilant gas, primarily for use in the health care industry. It is used to sterilize a wide range of medical devices because of its versatility and effectiveness in treating hard or soft surfaces, composites, metals, tubing and different types of plastics without negatively impacting the performance of the device being sterilized. The Company’s 100% ethylene oxide product and blends are distributed worldwide in specially designed, reusable and recyclable drum and cylinder packaging, to assure compliance with safety, quality and environmental standards as outlined by the applicable regulatory agencies in the countries our products are shipped to. The Company’s inventory of these specially built drums and cylinders, along with its five filling facilities, represents a significant capital investment. Contract sterilizers and medical device manufacturers are principal customers for this product. The Company also sells single use canisters with 100% ethylene oxide for use in sterilizing re-usable devices typically processed in autoclave units in hospitals. As a fumigant, ethylene oxide blends are highly effective in killing bacteria, fungi, and insects in spices and other seasoning materials.
The Company also distributes a number of other gases for various uses, most notably propylene oxide and ammonia. Propylene oxide is marketed and sold in the U.S. as a fumigant to aid in the control of insects and microbiological spoilage; and to reduce bacterial and mold contamination in certain shell and processed nut meats, processed spices, cacao beans, cocoa powder, raisins, figs and prunes. The Company distributes its propylene oxide product in the U.S. primarily in recyclable, single-walled, carbon steel cylinders according to standards outlined by the EPA and the DOT. Propylene oxide is also sold worldwide to customers in approved reusable and recyclable drum and cylinder packaging for various chemical synthesis applications, such as increasing paint durability and manufacturing specialty starches and textile coatings. Ammonia is used primarily as a refrigerant, and also for heat treatment of metals and various chemical synthesis applications, and is distributed in reusable and recyclable drum and cylinder drum and cylinder packaging approved for use in the countries these products are shipped to. The Company's inventory of cylinders for these products also represents a significant capital investment.
The Company’s micronutrient agricultural nutrition business sells chelated minerals primarily into high value crops. The Company has a unique and patented two-step approach to solving mineral deficiency in plants to optimize health, yield and shelf-life. First, the Company determines optimal mineral balance for plant health. The Company then has a foliar applied Metalosate® product range, utilizing patented amino acid chelate technology. Its products quickly and efficiently deliver mineral nutrients. As a result, the farmer/grower gets healthier crops that are more resistant to disease and pests, larger yields and healthier food for the consumer with extended shelf life for produce being shipped long distances.
Acquisitions
On December 13, 2019, we completed an acquisition of Zumbro River Brand, Inc. ("Zumbro"), headquartered in Albert Lea, Minnesota. We made payments of $52,403 on the acquisition date, amounting to $47,058 to the former shareholders and $5,345 to Zumbro's lenders to pay Zumbro debt. Considering the cash acquired of $686, net payments made to the former shareholders equaled $46,372. In May 2020, we received an adjustment for working capital acquired of $561. The acquisition was primarily financed through the Company's Credit Agreement (Refer to Note 8, "Revolving Loan"). Zumbro specializes in developing, marketing, and manufacturing agglomerated and extruded products for the food and beverage industry and is a market leader in high protein and specialty extruded snacks, cereals, and crisps, marketed under the brands Z-Crisps®, Whey-Os™, Whey-Vs™, and Z-Texx Complete™. Zumbro is integrated within Balchem's HNH Segment.
On May 27, 2019, we acquired 100 percent of the outstanding common shares of Chemogas Holding NV, a privately held specialty gases company headquartered in Grimbergen, Belgium ("Chemogas"). We made payments of approximately €99,503 (translated to $111,324) on the acquisition date, amounting to approximately €88,579 (translated to $99,102) to the former shareholders and approximately €10,924 (translated to $12,222) to Chemogas' lender to pay off all Chemogas bank debt. Considering the cash acquired of €3,943 (translated to $4,412), net payments made to the former shareholders were €84,636 (translated to $94,690). The acquisition was primarily financed through our Credit Agreement (Refer to Note 8, "Revolving Loan"). Chemogas, through its subsidiary companies, has been a leader in the packaging and distribution of a wide variety of specialty gases, most notably ethylene oxide, primarily in the European and Asian markets, for medical device sterilization. Through its operational and logistical excellence, Chemogas supports its customers' needs across more than 70 countries. With the acquisition, we significantly expand our geographic presence in the packaged ethylene oxide market, enabling us to offer
worldwide service and support to its medical device sterilization customers within the Specialty Products segment. The Chemogas sites in Europe and Asia, along with Balchem's sites in the United States form a global network of facilities.
Raw Materials
The raw materials utilized by us in the manufacture of our products are sourced from suppliers both domestically and internationally. Such raw materials include materials derived from petrochemicals, minerals, metals, agricultural commodities and other readily available commodities and are subject to price fluctuations due to market conditions. We are not experiencing any current difficulties in procuring such materials and do not anticipate any such problems; however, we cannot assure that will always be the case.
Intellectual Property
We currently hold 99 patents in the United States and overseas and use certain trade-names and trademarks. We also use know-how, trade secrets, formulae, and manufacturing techniques that assist in maintaining competitive positions of certain of our products. Formulae and know-how are of particular importance in the manufacture of a number of our proprietary products. We believe that certain of our patents, in the aggregate, are advantageous to our business. However, it is believed that no single patent or related group of patents is currently so material to us that the expiration or termination of any single patent or group of patents would materially affect our business. Our U.S. patents expire between 2021 and 2034. We believe that our sales and competitive position are dependent primarily upon the quality of our products, technical sales efforts and market conditions, rather than on patent protection.
Seasonality
While in general, the businesses of our segments are not seasonal to any material extent, the plant nutrition business within Specialty Products is a seasonal business with the vast majority of sales occurring in the first half of the year, based on the planning season in the northern hemisphere.
Backlog
At December 31, 2020, we had a total backlog of $64,811 (comprised of $52,293 for the HNH segment; $8,620 for the ANH segment; $3,557 for the Specialty Products segment, and $341 for other), as compared to a total backlog of $46,841 at December 31, 2019 (comprised of $36,996 for the HNH segment; $6,161 for the ANH segment; $2,752 for the Specialty Products segment and $932 for other). It has generally been our policy and practice to maintain an inventory of finished products and/or component materials for our segments to enable us to ship products within two months after receipt of a product order. All orders in the current backlog are expected to be filled in the 2021 fiscal year.
Competition
Our competitors include many large and small companies, some of which have greater financial, research and development, production and other resources than us. Competition in the supplement, food and beverage markets we serve are based primarily on product performance, customer support, quality, service and price. The development of new and improved products is important to our success. This competitive environment requires substantial investments in product and manufacturing process research and development. In addition, the winning and retention of customer acceptance of our food and nutrition products involve substantial expenditures for application testing, either internally or at customer/prospect sites, and sales efforts. Our competition in this market includes a variety of ingredient and nutritional supplement companies many of which are privately-held. Therefore, it is difficult to assess the size of all of our segment competitors or where we rank in comparison to such privately-held competitors.
Competition in the animal feed and industrial markets we serve are based primarily on product performance, customer support, quality, service and price. The markets for our products are subject to competitive risks because these markets are highly price competitive. Our competition in this market includes a variety of animal nutrition and health ingredient companies, along with certain industrial companies, many of which are privately-held. Therefore, we are unable to assess the size of all of our competitors or where we rank in comparison to such privately-held competitors.
In the Specialty Products segment, our products face competition from alternative sterilizing technologies and products. Competition in this marketplace is based primarily on medical device compositions, product performance, customer support, quality, service and price. Our competition in this market includes sterilization companies, a number of which are privately-held.
Research & Development
During the years ended December 31, 2020, 2019 and 2018, we incurred research and development expenses of approximately $10,332, $11,377, and $11,592, respectively, on Company-sponsored research and development for new products, improvements to existing products, and manufacturing processes. We have historically funded our research and development programs with funds available from current operations with the intent of recovering those costs from profits derived from future sales of products resulting from, or enhanced by, the research and development effort.
We prioritize our product development activities in an effort to allocate resources to those product candidates that, we believe, have the greatest commercial potential. Factors we consider in determining the products to pursue include projected markets and needs, status of our proprietary rights, technical feasibility, expected and known product attributes, and estimated costs to bring the product to market.
Capital Projects
We continue to invest in projects across all production facilities and capital expenditures were approximately $32,080, $25,790, and $19,170 for 2020, 2019 and 2018, respectively. In 2020, we invested $16,856 on projects expected to provide favorable returns on investment, including expanded capacity in key product lines in the HNH segment. In addition, we invested $3,297 for environmental, health, safety, and security upgrades to our facilities as well as $3,252 in automation projects that improved safety and quality of our operations. In 2019, we invested $6,437 to expand capacity in key product lines in the HNH segment and to invest in several other large projects including a new quality and research and development lab. In addition, we invested $3,739 for environmental, health, safety, and security upgrades to our facilities. In 2018, we invested $5,662 to expand capacity in key product lines in the HNH segment along with upgrading automation systems in our manufacturing sites to drive efficiencies. In addition, we invested $3,137 for environmental, health, safety, and security upgrades to our facilities. Capital expenditures are projected to range from $30,000 to $40,000 for 2021.
Environmental / Regulatory Matters
The Federal Insecticide, Fungicide and Rodenticide Act (“FIFRA”), a health and safety statute, requires that certain products within our Specialty Products segment must be registered with the EPA because they are considered pesticides. In order to obtain a registration, an applicant typically must demonstrate, through extensive test data, that its product will not cause unreasonable adverse effects on human health or the environment. We hold EPA registrations permitting us to sell ethylene oxide as a medical device sterilant and spice fumigant, and propylene oxide as a fumigant of nuts and spices.
In April 2008, the EPA issued a RED (“Reregistration Eligibility Decision”) for ethylene oxide which permitted the continued use of ethylene oxide “to sterilize medical or laboratory equipment, pharmaceuticals, and aseptic packaging, or to reduce microbial load on musical instruments, cosmetics, whole and ground spices and other seasoning materials and artifacts, archival material or library objects”. In 2013, the EPA has initiated a new registration review of ethylene oxide, in line with and part of the registration review scheduled for a large number of other pesticides. When the Final Work Plan was issued in March 2014, the EPA anticipated that this registration review process would take approximately seven years. In December 2016, the EPA issued its Integrated Risk Information System (“IRIS”) assessment of ethylene oxide (the "IRIS Assessment"), another aspect of EPA’s safety review of ethylene oxide. In November 2020, the EPA issued a Draft Human Health Risk Assessment for Ethylene Oxide (Draft HHRA). In this Draft HHRA, the EPA presented multiple perspectives on risk extrapolation, including the IRIS Assessment. While acknowledging the necessity of maintaining the critical uses of ethylene oxide, based on the range of unit risk provided in this qualitative assessment, the EPA has stated that there should be further mitigation measures implemented which will likely require some label changes. Several mitigation measures are under consideration and the EPA anticipates issuance of a Proposed Interim Decision (PID) later this year. We believe that EPA intends to reregister ethylene oxide for the uses stated above with the mitigation measures potentially impacting certain users, including Balchem and its customers. The product, when used as a sterilant for certain medical devices, has no known equally effective substitute. In October 2019, the U.S. Food and Drug Administration, in a public statement said, "Although medical devices can be sterilized by several methods, ethylene oxide is the most common method of sterilization of medical devices in the U.S. and is a well-established and scientifically-proven method of preventing harmful microorganisms from reproducing and causing infections." Management believes the lack of availability of this product could not be easily tolerated by various medical device manufacturers or the health care industry due to the resultant infection potential.
Similarly, the EPA issued a RED for propylene oxide in August 2006. At that time, the EPA “determined that products containing the active ingredient PPO [propylene oxide] are eligible for reregistration provided that…risk mitigation measures…are adopted.” Our product label was amended as required to reflect these mitigation measures and also to show that propylene oxide has been reclassified as a restricted use pesticide. In 2013, the EPA initiated a new registration review of propylene oxide, in line with and part of the registration review scheduled for a large number of other pesticides. A Final Work Plan was issued in March 2014, and
EPA anticipated that this review process would take approximately seven years. In October 2020, the EPA issued both the Proposed Interim Registration Review Decision (PID) and Draft Risk Assessment (DRA) for Propylene Oxide (PPO). Based on these documents we believe that the use of propylene oxide to treat nuts and spices will continue to be permitted with minimal changes to the current approved label and, to date, it appears that significant additional mitigation measures will not be required.
Our facility in Verona, Missouri, while held by a prior owner, was designated by the EPA as a Superfund site and placed on the National Priorities List in 1983, because of dioxin contamination on portions of the site. Remediation was conducted by the prior owner under the oversight of the EPA and the Missouri Department of Natural Resources (“MDNR”). While we must maintain the integrity of the capped areas in the remediation areas on the site, the prior owner is responsible for completion of any further Superfund remedy. We are indemnified by the sellers under our May 2001 asset purchase agreement covering our acquisition of the Verona, Missouri facility for potential liabilities associated with the Superfund site and one of the sellers, in turn, has the benefit of certain contractual indemnification by the prior owner that executed the above-described Superfund remedy. In September 2020, BCP Ingredients, Inc. (“BCP”), the Company subsidiary that operates the site received a General Notice Letter from the EPA regarding BCP’s potential liability for 1,4 dioxane contamination at the site. We currently believe that the 1,4 dioxane contamination is associated with the former owner’s operations and have engaged experts to study site conditions and hydrogeology in connection with preparing our response to the notice.
In connection with normal operations at our plant facilities, we are required to maintain environmental and other permits, including those relating to the ethylene oxide operations.
We believe we are in compliance in all material respects with federal, state, local and international provisions that have been enacted or adopted regulating the discharge of materials into the environment or otherwise relating to the protection of the environment. Such compliance includes the maintenance of required permits under air pollution regulations and compliance with requirements of the Occupational Safety and Health Administration. The cost of such compliance has not had a material effect upon the results of our operations or our financial condition.
We produce products which are required to be manufactured in conformity with current Good Manufacturing Practice (“cGMP”) regulations as interpreted and enforced by the FDA, through third party contract arrangement. Modifications, enhancements or changes in contracted manufacturing facilities or procedures relating to our pharmaceutical products are, in many circumstances, subject to FDA approval, which may be subject to a lengthy application process or which we may be unable to obtain. Any contracted manufacturing facilities that manufacture our pharmaceutical products are periodically subject to inspection by the FDA and other governmental agencies, and operations at these facilities could be interrupted or halted if the results of these inspections are unsatisfactory.
Human Capital
Our employees are our most valued asset and fundamental to our success. As of December 31, 2020, we employed approximately 1,342 full-time employees worldwide, with approximately 18% covered by collective bargaining agreements. We believe that we have been successful in attracting skilled and experienced personnel in a competitive environment and that our human capital resources are adequate to perform all business functions.
Health and Safety
Protecting the workplace environment and the health and safety of our employees, contractors, visitors, and neighbors is our top priority. Our recordable injury rate, which was defined by recordable injuries per 200,000 hours worked, was 1.04 in 2020. We continually upgrade our facilities to reduce risks and establish procedures with appropriate personnel protection for the safety of our employees. Our safety program is structured around five pillars: process safety, personal safety, industrial hygiene, transportation safety and environmental safety, and focuses on driving higher ownership and engagement from employees and contractors.
In response to the COVID-19 pandemic, we effectively deployed our Crisis Management Plan and activated our Crisis Management Team (CMT), to manage the day-to-day activities and make timely decisions related to the safety of our employees, customers, and the communities in which we operate. We implemented significant changes which comply with government orders and Centers for Disease Control and Prevention (CDC) guidelines. These changes include instituting travel restrictions, a mandatory work from home policy for all of our office employees, and additional safety measures for all of our manufacturing and research and development employees.
Diversity and Inclusion
We recognize that our best performance is achieved when our teams are diverse, and accordingly, diversity and inclusion are important elements of Balchem's Human Resources strategy. We strive to promote inclusion through the implementation of inclusive leadership training across the Company and are committed to increasing representation of minorities throughout the organization. In 2020, our total workforce consisted of 77% male and 23% female among all employees and 48% male and 52% female when excluding supply chain and operations functions. With the support of our Board of Directors, we continue to explore additional diversity and inclusion initiatives.
Training and Well-Being Programs
We strive to develop employee skills and knowledge, which includes training for job-specific technical knowledge, regulatory requirements, and company policies, such as the Company's Code of Conduct, anti-harassment and discrimination, foreign corrupt practices, antitrust, and various other compliance topics. Our sponsored employee Continuing Learning program offers a broad base of assistance for employees, including learning and development courses. Employees have access to healthy lifestyle discounts through our Wellness Center, as well as debt, legal, and financial counseling. Leadership programs, peak performance training and multiple online services and courses enable our employees to choose their own learning paths and work towards achieving their goals for education, finances, and overall well-being.
Performance Review, Compensation and Benefits
Our annual performance review process is an important, objective-based dialogue to foster continuous growth and development by providing an opportunity to establish goals and deliver feedback relative to each employee's performance. Balchem's annual review process is closely aligned with a formal succession planning and talent review process designed to identify and develop the next generation of leaders.
We are dedicated to providing full-time employees with a competitive compensation package that includes medical, dental, vision, and prescription benefits in addition to a 401(k) matching program. Balchem also provides financial support for health and wellness programs such as online financial wellness content, sponsored weight loss programs and subsidized gym memberships. We also provide generous time off and leave benefits, which are important to help ensure employees can enjoy a healthy balance between work and family time.
For the year ended December 31, 2020, our turnover rate was 7% for salaried employees with an average length of service of over 9 years. We are continuing to improve employee retention with effective employment engagement efforts, a productive performance review process, and competitive compensation.
Available Information
Our headquarters is located at 52 Sunrise Park Road, New Hampton, NY 10958. Our telephone number is (845) 326-5600 and our Internet website address is www.balchem.com. All reports we file with the SEC such as our Annual Reports on Form 10-K, Quarterly Reports on Form 10-Q and Current Reports on Form 8-K, and amendments to such reports, are available free of charge via EDGAR through the SEC's website at www.sec.gov.
Item 1A. Risk Factors
Our business is subject to a high degree of risk and uncertainty, including the following risks and uncertainties, which could adversely affect our business, financial condition, results of operation, cash flows and the trading price of our Common Stock:
Our business, results of operations, financial condition, cash flows and stock price can be adversely affected by pandemics, epidemics or other public health emergencies, such as COVID-19.
Our business, results of operations, financial condition, cash flows and stock price can be adversely affected by pandemics, epidemics or other public health emergencies, such as COVID-19. The COVID-19 outbreak has resulted in governments around the world implementing increasingly stringent measures to help control the spread of the virus, including quarantines, "shelter in place" and "stay at home" orders, travel restrictions, business curtailments, school closures, and other measures. In addition, government and central banks in several parts of the world have enacted fiscal and monetary stimulus measures to counteract the impacts of COVID-19.
Our businesses have been deemed "essential" under the orders issued by federal, state and local governments. Although we have continued to operate our facilities to date consistent with federal guidelines and state and local orders, the outbreak of COVID-19 or similar viruses and any preventive or protective actions taken by governmental authorities may have a material adverse effect
on our operations, supply chain, customers, and transportation networks, including business shutdowns or disruptions. The extent to which viruses such as COVID-19 may adversely impact our business depends on future developments, which are highly uncertain and unpredictable, depending upon the severity and duration of the outbreak and the effectiveness of actions taken globally to contain or mitigate their effects. Any resulting financial impact cannot be estimated reasonably at this time, but may materially adversely affect our business, results of operations, financial condition and cash flows. Additionally, concerns over the economic impact of COVID-19 have caused extreme volatility in financial and other capital markets which has and may continue to adversely impact our stock price and may affect our ability to access capital markets. To the extent the COVID-19 pandemic adversely affects our business and financial results, it may also have the effect of heightening many of the other risks described within this report. We will continue to implement mitigation strategies as needed to protect the long-term sustainability of our company.
Global economic conditions may adversely affect our business, operating results and financial condition.
Unfavorable changes in economic conditions, including inflation, recession, changes in tariffs and trade relations amongst international trading partners, or other changes in economic conditions, may adversely impact the markets in which we operate. These conditions may make it extremely difficult for our customers, our vendors and us to accurately forecast and plan future business activities, and they could cause U.S. and foreign businesses to slow spending on our products which would reduce our revenues and profitability. Furthermore, during challenging economic times our customers may face issues gaining timely access to sufficient credit, which could result in an impairment of their ability to make timely payments to us. If that were to occur, we may be required to increase our allowance for doubtful accounts and cash flow would be negatively impacted. We cannot predict the timing, depth or duration of any economic slowdown or subsequent economic recovery, worldwide, or in the markets in which we operate. Also, at any point in time we have funds in our cash accounts that are with third party financial institutions. These balances in the U.S., Italy, Belgium, Malaysia, Australia, Philippines, and Singapore could exceed the Federal Deposit Insurance Corporation (“FDIC”), Fondo Interbancario di Tutela dei Depositi (“FITD”), Financial Services and Markets Authority ("FSMA"), Perbadanan Insurans Deposit Malaysia ("PIDM"), Australian Prudential Regulation Authority ("APRA"), Philippine Deposit Insurance Corporation ("PDIC"), and Singapore Deposit Insurance Corporation ("SDIC") insurance limits, respectively. While we monitor the cash balances in our accounts, these balances could be impacted if the underlying financial institutions fail or could be subject to other adverse conditions in the financial markets. Additionally, our future results of operations could be adversely affected by changes in the effective tax rate as a result of a change in the mix of earnings in jurisdictions with differing statutory tax rates, changes in tax laws, regulations and judicial rulings or changes in the interpretation thereof.
Increased competition could hurt our business and financial results.
We face competition in our markets from a number of large and small companies, some of which have greater financial, research and development, production and other resources than we do. Our competitive position is based principally on performance, quality, customer support, service, breadth of product line, manufacturing or packaging technology and the selling prices of our products. Our competitors may improve the design and performance of their products and introduce new products with competitive price and performance characteristics. We expect to do the same to maintain our current competitive position and market share.
The loss of governmental permits and approvals would materially harm some of our businesses.
Pursuant to applicable environmental and safety laws and regulations, we are required to obtain and maintain certain governmental permits and approvals, including EPA registrations under FIFRA for two of our products. We maintain EPA FIFRA registrations for ethylene oxide as a medical device sterilant and spice fumigant and for propylene oxide as a fumigant of nuts and spices. The registrations for both products are in the final stages of a FIFRA registration review process begun in 2013. Recent draft documents indicate that the EPA intends to continue the registrations for both ethylene oxide and propylene oxide with certain additional mitigation measures. The EPA may re-examine the registrations in the future in accordance with the provisions of FIFRA. Any future failure of the EPA to allow reregistration of ethylene oxide or propylene oxide would have a material adverse effect on our business and financial results.
Commercial supply of pharmaceutical products that we may develop, subject to cGMP manufacturing regulations, will be performed by third-party cGMP manufacturers. Modifications, enhancements or changes in third-party manufacturing facilities or procedures of our pharmaceutical products are, in many circumstances, subject to FDA approval, which may be subject to a lengthy application process or which we may be unable to obtain. Any third-party cGMP manufacturers that we may use are periodically subject to inspection by the FDA and other governmental agencies, and operations at these facilities could be interrupted or halted if the results of these inspections are unsatisfactory. Failure to comply with the FDA or other governmental regulations can result in fines, unanticipated compliance expenditures, recall or seizure of products, total or partial suspension of production, enforcement actions, injunctions and criminal prosecution, which could have a material adverse effect on our business and financial results.
Permits and approvals may be subject to revocation, modification or denial under certain circumstances. Our operations or activities (including the status of compliance by the prior owner of the Verona, Missouri facility under Superfund remediation) could result in administrative or private actions, revocation of required permits or licenses, or fines, penalties or damages, which could have an adverse effect on us. In addition, we cannot predict the extent to which any legislation or regulation may affect the market for our products or our cost of doing business.
Raw material shortages or price increases could adversely affect our business and financial results.
The principal raw materials that we use in the manufacture of our products can be subject to price fluctuations due to market conditions. Such raw materials include materials derived from petrochemicals, minerals, metals, agricultural commodities and other commodities. While the selling prices of our products tend to increase or decrease over time with the cost of raw materials, these changes may not occur simultaneously or to the same degree. At times, we may be unable to pass increases in raw material costs through to our customers due to certain contractual obligations. Such increases in the price of raw materials, if not offset by product price increases, or substitute raw materials, would have an adverse impact on our profitability. We believe we have reliable sources of supply for our raw materials under normal market conditions. We cannot, however, predict the likelihood or impact of any future raw material shortages. Any shortages or unforeseen price increases could have a material adverse impact on our results of operations.
Concerns about ethylene oxide emissions have resulted in certain state actions against certain of our customers that are currently impacting these customers’ ability to use the ethylene oxide process to sterilize medical devices, which may, in turn, affect sales to these customers.
Certain of the Company’s customers who use ethylene oxide in the USA for the sterilization of medical devices have received ongoing state and local scrutiny for environmental concerns at their facilities. This scrutiny is associated with the IRIS Assessment described in the “Environmental / Regulatory Matters” Section above, which deemed exposure to ethylene oxide as unsafe at levels far below those found in the environment. The EPA began using the IRIS Assessment in 2020 to regulate change to existing permissible emissions’ limits at certain non-sterilization ethylene oxide users and producers, and is expected to finalize rules during 2021 or 2022 that will regulate sterilization users. Additionally, some state and local regulators have drawn their own conclusions from the IRIS Assessment, which has resulted in certain state actions against our customers that are currently impacting, or have impacted at some point, these customers’ ability to use the ethylene oxide process to sterilize medical devices. Because of these actions, one customer facility has been shut down permanently, another was shut down for a period of months and has since restarted, and other customers have taken or are expected to take voluntary downtime to install new abatement equipment. The installation of the new abatement equipment is being done ahead of what is expected to be changes in the EPA regulations. The Company remains confident that the sterilization industry will be able to install abatement equipment to satisfy the new forthcoming EPA requirements. The Company is working with various stakeholders to ensure the EPA considers all available assessments to appropriately quantify ethylene oxide's risks. While the Company believes that EPA will, as it has in the past, ultimately regulate to lower emissions levels based on a combined consideration of the various assessments available and that industry will then adopt practices and procedures to ensure compliance with these new regulations, there is no assurance that this will be the case.
Our financial success depends in part on the reliability and sufficiency of our manufacturing facilities.
Our revenues depend on the effective operation of our manufacturing, packaging, and processing facilities. The operation of our facilities involves risks, including the breakdown, failure, or substandard performance of equipment, power outages, the improper installation or operation of equipment, explosions, fires, natural disasters, failure to achieve or maintain safety or quality standards, work stoppages, supply or logistical outages, and the need to comply with environmental and other directives of governmental agencies. The occurrence of material operational problems, including, but not limited to, the above events, could adversely affect our profitability during the period of such operational difficulties.
Our business exposes us to potential product liability claims and recalls, which could adversely impact our financial condition and performance.
Our development, manufacture and sales of food ingredient, pharmaceutical and nutritional supplement products involve an inherent risk of exposure to product liability claims, product recalls, product seizures and related adverse publicity. A product liability judgment against us could also result in substantial and unexpected expenditures, affect consumer confidence in our products, and divert management’s attention from other responsibilities. Although we maintain product liability insurance coverage in amounts we believe are customary within the industry, there can be no assurance that this level of coverage is adequate or that we will be able to continue to maintain our existing insurance or obtain comparable insurance at a reasonable cost, if at all. A product recall or a partially or completely uninsured judgment against us could have a material adverse effect on results of operations and financial condition.
We face risks associated with our sales to customers and manufacturing operations outside the United States.
For the year ended December 31, 2020, approximately 27% of our net sales consisted of sales outside the United States. In addition, we conduct a portion of our manufacturing outside the United States. The majority of our foreign sales occur through our foreign subsidiaries and the remainder of our foreign sales result from exports to foreign distributors, resellers and customers. Our foreign sales and operations are subject to a number of risks, including: longer accounts receivable collection periods; the impact of recessions and other economic conditions in economies outside the United States; export duties and quotas; changes in tariffs and trade relations including but not limited to those associated with the North American Free Trade Agreement and the exit of the United Kingdom from the European Union; unexpected changes in regulatory requirements; certification requirements; environmental regulations; reduced protection for intellectual property rights in some countries; potentially adverse tax consequences; political and economic instability; and preference for locally produced products. These factors could have a material adverse impact on our ability to increase or maintain our international sales.
We may, from time to time, experience problems in our labor relations.
In North America, approximately 92 employees, or 8% of our North American workforce, as of December 31, 2020, are represented by a union under a single collective bargaining agreement, which was re-negotiated and is effective as of July 12, 2020. It will expire in 2025. In Europe, approximately 122 employees at our Marano, Ticino, Italy facility are covered by a national collective bargaining agreement, which expires in 2022. Approximately 23 employees at our Bertinoro, Italy facility are also covered by a national collective bargaining agreement, which expired in 2019 and is currently under negotiation. We believe that our present labor relations with all our union employees are satisfactory, however, our failure to renew these agreements on reasonable terms could result in labor disruptions and increased labor costs, which could adversely affect our financial performance. Similarly, if our relations with the union portion of our workforce do not remain positive, such employees could initiate a strike, work stoppage or slowdown in the future. In the event of such an action, we may not be able to adequately meet the needs of our customers using our remaining workforce and our operations and financial condition could be adversely affected. Additionally, other portions of our workforce could become subject to union campaigns.
Our international operations subject us to currency translation risk and currency transaction risk which could cause our results to fluctuate from period to period.
The financial condition and results of operations of our foreign subsidiaries are reported in Euros, Canadian Dollars, Malaysian Ringgits, Singapore Dollars, Australian Dollars, and Philippine Pesos and then translated into U.S. dollars at the applicable currency exchange rate for inclusion in our consolidated financial statements. Exchange rates between these currencies in recent years have fluctuated and may do so in the future. Furthermore, we incur currency transaction risk whenever we enter into either a purchase or a sales transaction using a currency different than the functional currency. Given the volatility of exchange rates, we may not be able to effectively manage our currency transactions and/or translation risks. Volatility in currency exchange rates could impact our business and financial results.
On May 28, 2019, we entered into a cross-currency swap to manage foreign exchange risk related to our investment in Chemogas. Although we utilize risk management tools, such as derivative instruments, to mitigate market fluctuations in foreign currencies, any changes in strategy in regard to risk management tools can also affect revenue, expenses and results of operations and there can be no assurance that such measures will result in cost savings or that all market fluctuation exposure will be eliminated.
Our debt instruments impose operating and financial restrictions which could have an adverse impact on our business and results of operations.
Our incurrence of indebtedness could have negative consequences to us, including limiting our ability to borrow additional monies for our working capital, capital expenditures, acquisitions, debt service requirements or other general corporate purposes; limiting our flexibility in planning for, or reacting to, changes in our operations, our business or the industries in which we compete; our leverage may place us at a competitive disadvantage by limiting our ability to invest in the business or in further research and development; making us more vulnerable to downturns in our business or the economy; and there would be a material adverse effect on our business and financial condition if we were unable to service our indebtedness or obtain additional financing, as needed.
Our ability to make payments on our indebtedness depends on our ability to generate cash in the future. If we do not generate sufficient cash flow to meet our debt service and working capital requirements, we may need to seek additional financing or sell assets. This may make it more difficult for us to obtain financing on terms that are acceptable to us, or at all. Without any such financing, we could be forced to sell assets to make up for any shortfall in our payment obligations under unfavorable circumstances.
Interest payable in accordance with our five-year senior secured revolving credit agreement (the "Credit Agreement") is based on a fluctuating rate. In light of potential fluctuations, we are exposed to risk resulting from adverse changes in interest rates.
On May 28, 2019, we entered into an interest rate swap to protect us against adverse fluctuations in interest rates by reducing its exposure to variability in cash flows relating to interest payments on a portion of our outstanding debt. We use LIBOR ("the London interbank offered rate") as a reference rate in the derivative agreements. LIBOR is the basic rate of interest used in lending between banks on the London interbank market and is widely used as a reference for setting the interest rate on loans globally. On July 27, 2017, the United Kingdom’s Financial Conduct Authority (FCA), which regulates LIBOR, announced that it intends to phase out LIBOR by the end of 2021. FCA further announced that it has commitments from panel banks to continue to contribute to LIBOR through the end of calendar 2021, but that the FCA will not use its powers to compel contributions beyond that date. While we expect that reasonable alternatives to LIBOR will be implemented prior to the 2021 target date or that the 2021 cessation date may be extended, we cannot predict the consequences and timing of these developments and the impact to our business. In preparation for the potential phase out of LIBOR, we may need to renegotiate our financial obligations and derivative instruments that utilize LIBOR. However, these efforts may not be successful in mitigating the legal and financial risk from changing the reference rate in our legacy agreements. Furthermore, the discontinuation of LIBOR may adversely impact our ability to manage and hedge exposures to fluctuations in interest rates using derivative instruments.
Adverse publicity or consumer concern regarding the safety or quality of food products containing our products, or health concerns, whether with our products, products in the same general class as our products or for food products containing our products, may result in the loss of sales. Also, consumer preferences for products containing our products may change.
We are dependent upon consumers’ perception of the safety, quality and possible dietary benefits of products containing our food ingredient products. As a result, substantial negative publicity concerning our products or other foods and beverages in which our products are used could lead to a loss of consumer confidence in those products, removal of those products from retailers’ shelves and reduced sales and prices of our products. Product quality issues, actual or perceived, or allegations of product contamination, even when false or unfounded, could hurt the image of our products or of brands of products containing our products, and cause consumers to choose other products. Further, any product recall, whether our own or by a third party, whether due to real or unfounded allegations, could impact demand on food products containing our products or even our products. Any of these events could have a material adverse effect on our business, results of operations and financial condition. Consumer preferences, as well as trends, within the food industries change often and our failure to anticipate, identify or react to changes in these preferences and trends could, among other things, lead to reduced demand and price reductions, and could have an adverse effect on our business, results of operations and financial condition. While we continue to diversify our product offerings, developing new products entails risks and we cannot be certain that demand for our products and products containing our products will continue at current levels or increase in the future.
We may not be able to successfully consummate and manage acquisition, joint venture and divestiture activities which could have an impact on our results.
From time to time, we may acquire other businesses, enter into joint ventures and, based on an evaluation of our business portfolio, divest existing businesses. These acquisitions, joint ventures and divestitures may present financial, managerial and operational challenges, including diversion of management attention from existing businesses, difficulty with integrating or separating personnel and financial and other systems, increased expenses, assumption of unknown liabilities and indemnities, and potential disputes with the buyers or sellers. In addition, we may be required to incur asset impairment charges (including charges related to tangible assets, goodwill and other intangible assets) in connection with acquired businesses which may reduce our profitability. If we are unable to consummate such transactions, or successfully integrate and grow acquisitions and achieve contemplated revenue synergies and cost savings, our financial results could be adversely affected. Additionally, joint ventures inherently involve a lesser degree of control over business operations, thereby potentially increasing the financial, legal, operational and/or compliance risks.
Technology failures or cyber security breaches could have an adverse effect on the Company’s operations.
We rely on information technology systems to process, transmit, store, and protect electronic information. For example, a significant portion of the communications between our personnel, customers, and suppliers depend on information technology. Our information technology systems may be vulnerable to a variety of interruptions due to events beyond our control including, but not limited to, natural disasters, terrorist attacks, telecommunications failures, computer viruses, hackers, and other security issues. We have technology and information security processes and disaster recovery plans in place to mitigate our risk to these vulnerabilities; however, these measures may not be adequate to ensure that our operations will not be disrupted, should such an event occur.
Item 1B. Unresolved Staff Comments
None.
Item 2. Properties
Our corporate headquarters is located in New Hampton, New York. Our operations are conducted at our owned and leased facilities throughout the U.S. and other foreign countries. These facilities house manufacturing and warehousing operations, as well as administrative offices. We have total 32 locations across the world and some of these locations serve multiple segments.
The following is a summary of our principal properties:
| | | | | | | | | | | | | | | | | | | | | | | | | | |
| Segment | | Location | | Administrative | | Manufacturing | | Warehousing |
| Corporate | | 4 U.S. cities | | 4 | | - | | - |
| HNH | | 14 U.S. cities and 3 foreign countries | | 2 | | 12 | | 3 |
| ANH | | 5 U.S. cities and 4 foreign countries | | 1 | | 8 | | - |
| Specialty Products | | 5 U.S. cities and 7 foreign countries | | 2 | | 9 | | 1 |
| Other | | 1 U.S. city and 1 foreign country | | - | | 2 | | - |
We believe that our production facilities and related machinery and equipment, are well maintained, suitable for their purpose, and adequate to support our businesses.
Item 3. Legal Proceedings
We are involved in legal proceedings through the normal course of business. Management believes that any unfavorable outcome related to these proceedings will not have a material effect on our financial position, results of operations or liquidity.
Item 4. Mine Safety Disclosures
None.
PART II
Item 5. Market for the Registrant’s Common Equity, Related Stockholder Matters and Issuer Purchases of Equity Securities
Market Information
The Common Stock is listed on the Nasdaq Global Market under the symbol “BCPC.”
On February 11, 2021 the closing price for the Common Stock on the Nasdaq Global Market was $119.13.
Record Holders
As of February 11, 2021, the approximate number of holders of record of Common Stock was 69. Such number does not include stockholders who hold their stock in street name.
Dividends
We declared cash dividends of $0.58 and $0.52 per share on Common Stock during our fiscal years ended December 31, 2020 and 2019, respectively.
Performance Graph
The graph below sets forth the cumulative total stockholder return on the Common Stock (referred to in the table as “BCPC”) for the five years ended December 31, 2020, the overall stock market return during such period for shares comprising the Russell 2000® Index (which we believe includes companies with market capitalization similar to that of us), and the overall stock market return during such period for shares comprising the Dow Jones U.S. Specialty Chemicals Index, in each case assuming a comparable initial investment of $100 on December 31, 2015 and the subsequent reinvestment of dividends. The Russell 2000® Index measures the performance of the shares of the 2000 smallest companies included in the Russell 3000® Index. In light of our industry segments, we do not believe that published industry-specific indices are necessarily representative of stocks comparable to us. Nevertheless, we consider the Dow Jones U.S. Specialty Chemicals Index to be potentially useful as a peer group index with respect to us. The performance of the Common Stock shown on the graph below is historical only and not necessarily indicative of future performance.
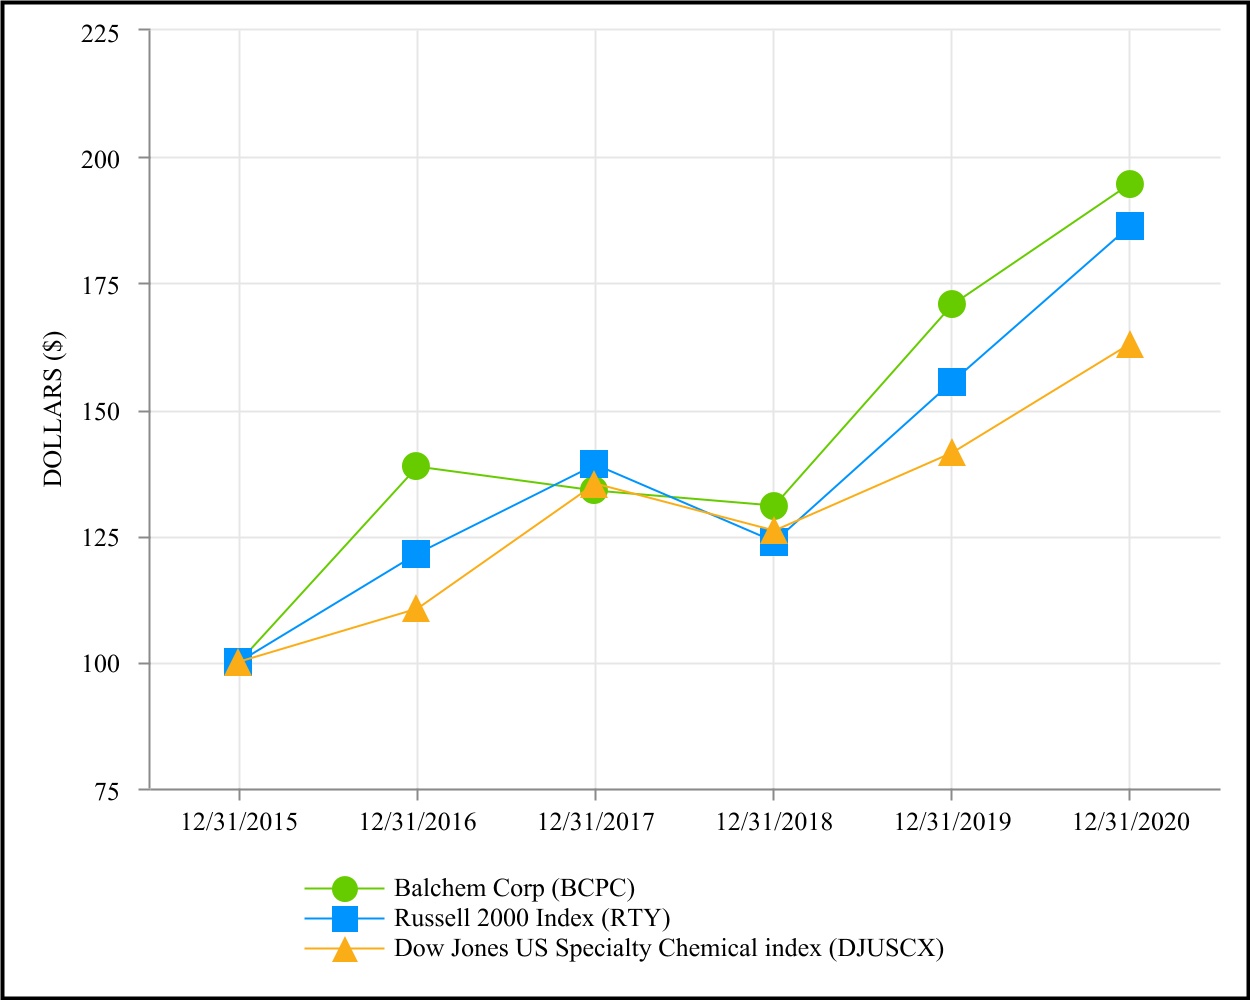
Issuer Purchase of Equity Securities
The following table summarizes the share repurchase activity for the year ended December 31, 2020:
| | | | | | | | | | | | | | | | | | | | | | | | | | | | | |
| | | Total Number of Shares Purchased (1) | | Average Price Paid Per Share | | Total Number of Shares Purchased as Part of Publicly Announced Programs(1) | | Approximate Dollar Value of Shares that May Yet Be
Purchased Under the
Plans or Programs |
| January 1-31, 2020 | | 578 | | | $ | 106.82 | | | 578 | | | $ | 142,144,718 | |
| February 1-29, 2020 | | 7,646 | | | $ | 108.39 | | | 7,646 | | | $ | 143,400,590 | |
| March 1-31, 2020 | | — | | | $ | — | | | — | | | $ | 143,400,590 | |
| First Quarter | | 8,224 | | | | | 8,224 | | | |
| | | | | | | | |
| April 1-30, 2020 | | 131 | | | $ | 99.85 | | | 131 | | | $ | 132,093,163 | |
| May 1-31, 2020 | | 13,947 | | | $ | 86.39 | | | 13,947 | | | $ | 113,085,173 | |
| June 1-30, 2020 | | 10,203 | | | $ | 89.79 | | | 10,203 | | | $ | 116,619,193 | |
| Second Quarter | | 24,281 | | | | | 24,281 | | | |
| | | | | | | | |
| July 1-31, 2020 | | — | | | $ | — | | | — | | | $ | 116,619,193 | |
| August 1-31, 2020 | | — | | | $ | — | | | — | | | $ | 116,619,193 | |
| September 1-30, 2020 | | 31,224 | | | $ | 94.72 | | | 31,224 | | | $ | 120,063,231 | |
| Third Quarter | | 31,224 | | | | | 31,224 | | | |
| | | | | | | | |
| October 1-31, 2020 | | — | | | $ | — | | | — | | | $ | 120,063,231 | |
| November 1-30, 2020 | | 69,467 | | | $ | 102.60 | | | 69,467 | | | $ | 122,917,453 | |
| December 1-31, 2020 | | 3,433 | | | $ | 103.02 | | | 3,433 | | | $ | 123,071,229 | |
| Fourth Quarter | | 72,900 | | | | | 72,900 | | | |
| | | | | | | | | |
| Total | | 136,629 | | | | | 136,629 | | | |
| | | | | | | | | |
(1) We have an approved stock repurchase program. The total authorization under this program is 3,763,038 shares. Since the inception of the program in June 1999, a total of 2,568,396 shares have been purchased, of which 76,084 shares remained in treasury at December 31, 2020. There is no expiration for this program. |
Item 6. Selected Financial Data
The selected statements of operations data set forth below for the years ended December 31, 2020, 2019 and 2018 and the selected balance sheet data as of December 31, 2020 and 2019 have been derived from our Consolidated Financial Statements included elsewhere herein. The selected financial data for the years ended December 31, 2017 and 2016 and as of December 31, 2018, 2017 and 2016 have been derived from audited Consolidated Financial Statements not included herein, but which were previously filed with the SEC. The following information should be read in conjunction with Item 7 — “Management’s Discussion and Analysis of Financial Condition and Results of Operations” and the Consolidated Financial Statements and notes thereto included elsewhere herein.
| | | | | | | | | | | | | | | | | | | | | | | | | | | | | | | | |
| (In thousands, except per share data) | | | | | | | | | | |
| | | | | | | | | | |
| Year ended December 31, | | 2020 | | 2019 | | 2018 | | 2017 | | 2016 |
| Statement of Operations Data | | | | | | | | | | |
| Net sales | | $ | 703,644 | | | $ | 643,705 | | | $ | 643,679 | | | $ | 594,790 | | | $ | 553,204 | |
| Earnings before income tax expense | | 106,417 | | | 96,478 | | | 99,030 | | | 88,488 | | | 82,934 | |
| Income tax expense (benefit) | | 21,794 | | | 16,807 | | | 20,457 | | | (1,583) | | | 26,962 | |
| Net earnings | | 84,623 | | | 79,671 | | | 78,573 | | | 90,071 | | | 55,972 | |
| Basic net earnings per common share | | $ | 2.63 | | | $ | 2.48 | | | $ | 2.45 | | | $ | 2.83 | | | $ | 1.78 | |
| Diluted net earnings per common share | | $ | 2.60 | | | $ | 2.45 | | | $ | 2.42 | | | $ | 2.79 | | | $ | 1.75 | |
| | | | | | | | | | |
| At December 31, | | 2020 | | 2019 | | 2018 | | 2017 | | 2016 |
| Balance Sheet Data | | | | | | | | | | |
| Total assets | | $ | 1,165,843 | | | $ | 1,155,682 | | | $ | 981,355 | | | $ | 963,636 | | | $ | 948,626 | |
| Long-term debt (including current portion) | | 163,569 | | | 248,569 | | | 156,000 | | | 218,964 | | | 280,490 | |
| Other long-term obligations | | 10,517 | | | 7,827 | | | 7,372 | | | 5,847 | | | 6,896 | |
| Total Stockholders' equity | | 828,233 | | | 743,667 | | | 691,618 | | | 616,881 | | | 521,033 | |
| Dividends per common share | | $ | 0.58 | | | $ | 0.52 | | | $ | 0.47 | | | $ | 0.42 | | | $ | 0.38 | |
Item 7. Management’s Discussion and Analysis of Financial Condition and Results of Operations
(All amounts in thousands, except share and per share data)
The following discussion and analysis of our financial condition and results of operations should be read in conjunction with our Consolidated Financial Statements and the related notes included in this report. Refer to Part II, Item 7 in our Annual Report on Form 10-K for the fiscal year ended December 31, 2019 (filed with the SEC on February 21, 2020) for additional discussion of our financial condition and results of operations for the year ended December 31, 2018, as well as our financial condition and results of operations for the year ended December 31, 2019 compared to the year ended December 31, 2018. Those statements in the following discussion that are not historical in nature should be considered to be forward-looking statements that are inherently uncertain. See “Cautionary Statement Regarding Forward-Looking Statements.”
Overview
We develop, manufacture, distribute and market specialty performance ingredients and products for the nutritional, food, pharmaceutical, animal health, medical device sterilization, plant nutrition and industrial markets. Previously, our four reportable segments were: Human Nutrition and Health, Animal Nutrition and Health, Specialty Products, and Industrial Products. However, effective in the first quarter of 2020, in order to align with our strategic focus on health and nutrition, allocation of resources, and evaluation of operating performance, and given the 2019 reduction in portfolio scale of Industrial Products, we have revised our reporting segment structure to three reportable segments: Human Nutrition and Health, Animal Nutrition and Health, and Specialty Products. These reportable segments are strategic businesses that offer products and services to different markets. This realignment has been retrospectively applied. Sales and production of products outside of our reportable segments and other minor business activities are included in "Other and Unallocated" and applied retroactively to 2019 and 2018. There was no change to the Consolidated Financial Statements as a result of the change to the reportable segments. We expect that the new reportable segment structure will provide investors greater understanding of and alignment with our strategic focus. In order to ensure appropriate transparency and visibility into the financial performance of the Company, sufficient detail will continue to be provided relative to Other and Unallocated, including material contributions from oil and gas and other industrial market activities.
COVID-19 Response
The COVID-19 response effort has been a primary focus for us since early in the first quarter. Our focus has been on employee safety first, keeping our manufacturing sites operational, satisfying customer needs, preserving cash and ensuring strong liquidity, and responding to changes in this dynamic market environment as appropriate. To date, all of our manufacturing sites are operating at near normal conditions enabling us to supply our customers with the important products and services they need, our
research and development teams are advancing our innovation efforts, and all of our other employees are effectively carrying on their responsibilities and functions remotely.
While impact on demand has not been material to our Company, we are continuing to watch the markets that we serve closely. We have stress tested our balance sheet under various significant downturn scenarios and, given our relatively low net debt position, cash on hand, access to our undrawn revolving credit facility, and expected free cash flows, we are satisfied with the strength of our balance sheet as we continue through this uncertain market environment.
After a short pause in implementation of our new ERP system across the company due to the pandemic in the second quarter, we successfully resumed our implementation efforts during the second half of 2020, adding a total of five additional sites onto the new system since the pause. We now have approximately 92% of our revenue on the new system and expect full conversion by 2021.
Segment Results
We sell products for all three segments through our own sales force, independent distributors, and sales agents.
The following tables summarize consolidated net sales by segment and business segment earnings from operations for the three years ended December 31, 2020, 2019 and 2018 (in thousands):
| | | | | | | | | | | | | | | | | | | | |
| Business Segment Net Sales | | | | | | |
| | 2020 | | 2019 | | 2018 |
| Human Nutrition & Health | | $ | 400,330 | | | $ | 347,433 | | | $ | 341,237 | |
| Animal Nutrition & Health | | 192,191 | | | 177,557 | | | 175,693 | |
| Specialty Products | | 103,566 | | | 92,257 | | | 75,808 | |
Other and Unallocated (1) | | 7,557 | | | 26,458 | | | 50,941 | |
| Total | | $ | 703,644 | | | $ | 643,705 | | | $ | 643,679 | |
| | | | | | |
| Business Segment Earnings From Operations | | | | | | |
| | 2020 | | 2019 | | 2018 |
| Human Nutrition & Health | | $ | 61,397 | | | $ | 48,429 | | | $ | 48,037 | |
| Animal Nutrition & Health | | 29,979 | | | 25,868 | | | 26,607 | |
| Specialty Products | | 26,801 | | | 28,513 | | | 25,254 | |
Other and Unallocated (1) | | (7,030) | | | (257) | | | 7,202 | |
| Total | | $ | 111,147 | | | $ | 102,553 | | | $ | 107,100 | |
| | | | | | |
(1) Other and Unallocated consists of a few minor businesses which individually do not meet the quantitative thresholds for separate presentation and corporate expenses that have not been allocated to a segment. Unallocated corporate expenses consist of: (i) Transaction and integration costs, ERP implementation costs, and unallocated legal fees totaling $2,410, $3,436 and $1,786 for years ended December 31, 2020, 2019 and 2018, respectively, and (ii) Unallocated amortization expense of $1,606, $551, and $0 for years ended December 31, 2020, 2019, and 2018, respectively, related to an intangible asset in connection with a company-wide ERP system implementation. |
Acquisitions
On December 13, 2019, the Company completed an acquisition of Zumbro. The Company made payments of $52,403 on the acquisition date, amounting to $47,058 to the former shareholders and $5,345 to Zumbro's lenders to pay Zumbro debt. Considering the cash acquired of $686, net payments made to the former shareholders were $46,372. In May 2020, we received an adjustment for working capital acquired of $561. Zumbro is integrated within the HNH Segment.
On May 27, 2019, we acquired Chemogas. We made payments of approximately €99,503 (translated to $111,324) on the acquisition date, amounting to approximately €88,579 (translated to $99,102) to the former shareholders and approximately €10,924 (translated to $12,222) to Chemogas' lender to pay off all Chemogas bank debt. Considering the cash acquired of €3,943 (translated to $4,412), net payments made to the former shareholders were €84,636 (translated to $94,690). Chemogas is integrated within the Specialty Products Segment.
RESULTS OF OPERATIONS
(All amounts in thousands, except share and per share data)
Fiscal Year 2020 compared to Fiscal Year 2019
Net Earnings
| | | | | | | | | | | | | | | | | | | | | | | | | | |
| (in thousands) | | 2020 | | 2019 | | Increase
(Decrease) | | % Change |
| Net sales | | $ | 703,644 | | | $ | 643,705 | | | $ | 59,939 | | | 9.3 | % |
| Gross margin | | 223,897 | | | 211,367 | | | 12,530 | | | 5.9 | % |
| Operating expenses | | 112,750 | | | 108,814 | | | 3,936 | | | 3.6 | % |
| Earnings from operations | | 111,147 | | | 102,553 | | | 8,594 | | | 8.4 | % |
| Other expenses | | 4,730 | | | 6,075 | | | (1,345) | | | (22.1) | % |
| Income tax expense | | 21,794 | | | 16,807 | | | 4,987 | | | 29.7 | % |
| Net earnings | | $ | 84,623 | | | $ | 79,671 | | | $ | 4,952 | | | 6.2 | % |
Net Sales
| | | | | | | | | | | | | | | | | | | | | | | | | | |
| | | | Increase
(Decrease) | | |
| (in thousands) | | 2020 | | 2019 | | | % Change |
| Human Nutrition & Health | | $ | 400,330 | | | $ | 347,433 | | | $ | 52,897 | | | 15.2 | % |
| Animal Nutrition & Health | | 192,191 | | | 177,557 | | | 14,634 | | | 8.2 | % |
| Specialty Products | | 103,566 | | | 92,257 | | | 11,309 | | | 12.3 | % |
| Other | | 7,557 | | | 26,458 | | | (18,901) | | | (71.4) | % |
| Total | | $ | 703,644 | | | $ | 643,705 | | | $ | 59,939 | | | 9.3 | % |
•The increase in net sales within the HNH segment for 2020 as compared to 2019 was primarily driven by higher sales within food and beverage markets, strong sales growth of chelated minerals and choline nutrients, and beneficial impact from the Zumbro acquisition we closed in December 2019, partially offset by lower sales to food service-related markets and the elimination of sales associated with the Reading, Pennsylvania manufacturing site that we divested in 2019.
•The increase in net sales within the ANH segment for 2020 compared to 2019 was primarily the result of higher volumes in both the ruminant species and monogastric species, including companion animal, markets and a favorable mix.
•The increase in Specialty Products segment sales for 2020 compared to 2019 was primarily due to the incremental contribution of Chemogas and higher plant nutrition sales, partially offset by lower legacy ethylene oxide sales, which were negatively impacted by reduced elective surgical procedures during the pandemic.
•Sales relating to business formerly included in the Industrial Products segment decreased from the prior year due to a decline in shale fracking activity.
Gross Margin
| | | | | | | | | | | | | | | | | | | | | | | | | | |
| (in thousands) | | 2020 | | 2019 | | Increase
(Decrease) | | % Change |
| Gross margin | | $ | 223,897 | | | $ | 211,367 | | | $ | 12,530 | | | 5.9 | % |
| % of net sales | | 31.8 | % | | 32.8 | % | | | | |
Gross margin as a percentage of sales decreased in 2020 compared to 2019 primarily due to mix, partially offset by certain lower raw material costs.
Operating Expenses
| | | | | | | | | | | | | | | | | | | | | | | | | | |
| (in thousands) | | 2020 | | 2019 | | Increase
(Decrease) | | % Change |
| Operating expenses | | $ | 112,750 | | | $ | 108,814 | | | $ | 3,936 | | | 3.6 | % |
| % of net sales | | 16.0 | % | | 16.9 | % | | | | |
The increase in operating expenses was primarily due to incremental operating expenses related to the Chemogas and Zumbro acquisitions and the prior year benefiting from the timing of an insurance recovery. These increases were partially offset by lower selling expenses driven by reduced travel and lower bad debt expenses.
Earnings From Operations
| | | | | | | | | | | | | | | | | | | | | | | | | | |
| (in thousands) | | 2020 | | 2019 | | Increase
(Decrease) | | % Change |
| Human Nutrition & Health | | $ | 61,397 | | | $ | 48,429 | | | $ | 12,968 | | | 26.8 | % |
| Animal Nutrition & Health | | 29,979 | | | 25,868 | | | 4,111 | | | 15.9 | % |
| Specialty Products | | 26,801 | | | 28,513 | | | (1,712) | | | (6.0) | % |
| Other and unallocated | | (7,030) | | | (257) | | | (6,773) | | | 2635.4 | % |
| Earnings from operations | | $ | 111,147 | | | $ | 102,553 | | | $ | 8,594 | | | 8.4 | % |
| | | | | | | | |
| % of net sales (operating margin) | | 15.8 | % | | 15.9 | % | | | | |
•Earnings from operations for the HNH segment increased primarily due to the aforementioned higher sales and lower selling expenses as a result of reduced travel and lower bad debt expenses.
•ANH segment earnings from operations increased primarily due to the aforementioned higher sales, certain lower raw material costs, and lower selling expenses due to reduced travel, partially offset by an increase in certain compensation-related costs.
•The decrease in earnings from operations for the Specialty Products segment was primarily due to lower legacy ethylene oxide sales, mix, and higher operating expenses primarily related to the acquisition of Chemogas.
•The decrease in other and unallocated was driven primarily by lower earnings from the business formerly reported in the Industrial Products segment, as well as increased unallocated amortization related to a company-wide ERP implementation.
Other Expenses (Income)
| | | | | | | | | | | | | | | | | | | | | | | | | | |
| (in thousands) | | 2020 | | 2019 | | Increase
(Decrease) | | % Change |
| Interest expense, net | | $ | 4,439 | | | $ | 5,959 | | | $ | (1,520) | | | (25.5) | % |
| Other, net | | 291 | | | 116 | | | 175 | | | 150.9 | % |
| | $ | 4,730 | | | $ | 6,075 | | | $ | (1,345) | | | (22.1) | % |
Interest expense for 2020 and 2019 was primarily related to outstanding borrowings under our credit facility.
Income Tax Expense
| | | | | | | | | | | | | | | | | | | | | | | | | | |
| (in thousands) | | 2020 | | 2019 | | Increase
(Decrease) | | % Change |
| Income tax expense (benefit) | | $ | 21,794 | | | $ | 16,807 | | | $ | 4,987 | | | 29.7 | % |
| Effective tax rate | | 20.5 | % | | 17.4 | % | | | | |
Our effective tax rate for 2020 and 2019 was 20.5% and 17.4%, respectively. The increase was primarily due to a reduction in certain tax credits.
LIQUIDITY AND CAPITAL RESOURCES
(All amounts in thousands, except share and per share data)
Contractual Obligations
The Company’s contractual obligations as of December 31, 2020, are summarized in the table below:
| | | | | | | | | | | | | | | | | | | | | | | | | | | | | | | | |
| | | Payments due by period |
Contractual Obligations | | Total | | 2021 | | 2022-2023 | | 2024-2025 | | Thereafter |
Operating lease obligations (1) | | $ | 11,602 | | | $ | 3,258 | | | $ | 4,120 | | | $ | 1,541 | | | $ | 2,683 | |
Purchase obligations (2) | | 50,716 | | | 50,716 | | | — | | | — | | | — | |
Debt obligations (3) | | 163,569 | | | — | | | 163,569 | | | — | | | — | |
Interest payment obligations (4) | | 5,098 | | | 2,238 | | | 2,860 | | | — | | | — | |
| Total | | $ | 230,985 | | | $ | 56,212 | | | $ | 170,549 | | | $ | 1,541 | | | $ | 2,683 | |
| | | | | | | | | | |
(1) Principally includes obligations associated with future minimum non-cancelable operating lease obligations. |
| | | | | | | | | | |
(2) Principally includes open purchase orders with vendors for inventory not yet received or recorded on our balance sheet. |
| | | | | | | | | | |
(3) Consists of contractual obligations under the Credit Agreement, which was effective on June 27, 2018 and expires on June 27, 2023. |
| | | | | | | | | | |
(4) Includes interest payments on debt obligations based on interest rates at December 31, 2020, and the assumption that there will be no prepayments of principal. This interest is related to the Credit Agreement that expires on June 27, 2023, and the Contractual Obligations table reflects this expiration date and related current contractual obligations. |
The table above excludes a $5,335 liability for uncertain tax positions, including the related interest and penalties, recorded in accordance with ASC 740-10, as we are unable to reasonably estimate the timing of settlement, if any.
We know of no current or pending demands on, or commitments for, our liquid assets that will materially affect our liquidity.
We expect our operations to continue generating sufficient cash flow to fund working capital requirements and necessary capital investments. We are actively pursuing additional acquisition candidates. We could seek additional bank loans or access to financial markets to fund such acquisitions, our operations, working capital, necessary capital investments or other cash requirements should we deem it necessary to do so.
Cash
Cash and cash equivalents increased to $84,571 at December 31, 2020 from $65,672 at December 31, 2019. At December 31, 2020, we had $55,036 of cash and cash equivalents held by our foreign subsidiaries. It is our intention to permanently reinvest these funds in foreign operations by continuing to make additional plant related investments, and potentially invest in partnerships or acquisitions; therefore, we do not currently expect to repatriate these funds to fund U.S. operations or obligations. However, if these funds are needed for U.S. operations, we could be required to pay additional withholding taxes to repatriate them. Working capital was $172,460 at December 31, 2020 as compared to $162,688 at December 31, 2019, an increase of $9,772. Working capital reflects the payment of the 2019 declared dividend in 2020 of $16,705, net payments on the revolving debt of $85,000, capital expenditures and intangible assets acquired of $33,828, and the purchase of treasury stock for the amount of $13,463.
| | | | | | | | | | | | | | | | | | | | | | | | | | |
| (in thousands) | | 2020 | | 2019 | | Increase
(Decrease) | | % Change |
| Cash flows provided by operating activities | | $ | 150,494 | | | $ | 124,461 | | | $ | 26,033 | | | 20.9 | % |
| Cash flows used in investing activities | | (34,591) | | | (156,225) | | | 121,634 | | | 77.9 | % |
| Cash flows (used in) provided by financing activities | | (101,164) | | | 43,385 | | | (144,549) | | | 333.2 | % |
Operating Activities
The increase in cash flows from operating activities was primarily due to beneficial changes in assets and liabilities, increased earnings, and higher depreciation and amortization.
Investing Activities
We continue to invest in corporate projects, improvements across all production facilities, and intangible assets. Total investments in property, plant and equipment and intangible assets were $33,828 and $28,413 for the years ended December 31, 2020 and 2019, respectively.
Financing Activities
We borrowed $10,000 against the revolving loan and made total debt payments of $95,000 during 2020, resulting in $336,431 available under the Credit Agreement as of December 31, 2020.
We have an approved stock repurchase program. The total authorization under this program is 3,763,038 shares. Since the inception of the program in June 1999, a total of 2,568,396 shares have been purchased, of which 76,084 shares and 203,879 shares remained in treasury at December 31, 2020, and 2019, respectively. We repurchase shares from employees in connection with settlement of transactions under our equity incentive plans. We also intend to acquire shares from time to time at prevailing market prices if and to the extent we deem it is advisable to do so based on our assessment of corporate cash flow, market conditions and other factors.
Proceeds from stock options exercised were $14,155 and $4,839 for the years ended December 31, 2020 and 2019, respectively. Dividend payments were $16,705 and $15,135 during 2020 and 2019, respectively.
Other Matters Impacting Liquidity
We currently provide postretirement benefits in the form of two retirement medical plans, as discussed in Note 15 – Employee Benefit Plans. The liability recorded in other long-term liabilities on the consolidated balance sheets as of December 31, 2020 and December 31, 2019 was $1,374 and $1,076, respectively, and the plans are not funded. Historical cash payments made under these plans have typically been less than $100 per year. We do not anticipate any changes to the payments made in the current year for the plans.
On June 1, 2018, we established an unfunded, nonqualified deferred compensation plan maintained for the benefit of a select group of management or highly compensated employees. Assets of the plan are held in a rabbi trust, which are included in non-current assets on our balance sheet. They are subject to additional risk of loss in the event of bankruptcy or insolvency of the Company. The deferred compensation liability as of December 31, 2020 and December 31, 2019 was $3,581 and $1,982, respectively, and is included in other long-term obligations on our balance sheet.
Chemogas has an unfunded defined benefit plan. The plan provides for the payment of a lump sum at retirement or payments in case of death of the covered employees. The amount recorded for these obligations on our balance sheet as of December 31, 2020 and December 31, 2019 was $950 and $596, respectively, and was included in other long-term obligations.
Related Party Transactions
We were engaged in related party transactions with St. Gabriel CC Company, LLC for the years ended December 31, 2020 and December 31, 2019. Refer to Note 18, "Related Party Transactions".
Critical Accounting Policies
Our management is required to make certain estimates and assumptions during the preparation of consolidated financial statements in accordance with accounting principles generally accepted in the United States of America. These estimates and assumptions impact the reported amount of assets and liabilities and disclosures of contingent assets and liabilities as of the date of the consolidated financial statements. Estimates and assumptions are reviewed periodically, and the effects of revisions are reflected in the consolidated financial statements in the period they are determined to be necessary. Actual results could differ from those estimates.
Our “critical accounting policies” are those that require application of management's most difficult, subjective or complex judgments, often as a result of the need to make estimates about the effect of matters that are inherently uncertain and that may change in subsequent periods. Management considers the following accounting policies to be critical.
Revenue Recognition
Revenue for each of our business segments is recognized when control of the promised goods is transferred to our customers, in an amount that reflects the consideration we expect to realize in exchange for those goods. We report amounts billed to customers related to shipping and handling as revenue and include costs incurred for shipping and handling in cost of sales. Amounts received for unshipped merchandise are not recognized as revenue but rather they are recorded as customer deposits and are included in current liabilities. In instances of shipments made on consignment, revenue is recognized when control is transferred to the customer.
ASC 606, Revenue from Contracts with Customers, was adopted for the fiscal year beginning on January 1, 2018. Per the standard, revenue-generating contracts are assessed to identify distinct performance obligations, allocating transaction prices to those performance obligations, and criteria for satisfaction of a performance obligation. The standard allows for recognition of revenue only when we have satisfied a performance obligation through transferring control of the promised good or service to a customer. Control, in this instance, may mean the ability to prevent other entities from directing the use of, and receiving benefit from, a good or service. The standard indicates that an entity must determine at contract inception whether it will transfer control of a promised good or service over time or satisfy the performance obligation at a point in time through analysis of the following criteria: (i) the entity has a present right to payment, (ii) the customer has legal title, (iii) the customer has physical possession, (iv) the customer has the significant risks and rewards of ownership and (v) the customer has accepted the asset. We assess collectability based primarily on the customer’s payment history and on the creditworthiness of the customer.
Inventories
Inventories are valued at the lower of cost (first in, first out or average) or net realizable value and have been reduced by an allowance for excess or obsolete inventories. The write-down of potentially obsolete or slow-moving inventory is recorded based on management’s assumptions about future demand and market conditions.
Long-lived assets
Long-lived assets, such as property, plant, and equipment and intangible assets with finite lives, are reviewed for impairment whenever events or changes in circumstances indicate that the carrying amount of an asset may not be recoverable. Recoverability of assets to be held and used is measured by a comparison of the carrying amount of an asset to estimated undiscounted future cash flows expected to be generated by the asset. If the carrying amount of an asset exceeds its estimated future cash flows, an impairment charge is recognized by the amount by which the carrying amount of the asset exceeds the fair value of the asset, which is generally based on discounted cash flows. For the year ended December 31, 2019, we incurred impairment charges of $1,026 in connection with a restructuring in the HNH segment.
Goodwill represents the excess of costs over fair value of assets of businesses acquired. ASC 350, “Intangibles-Goodwill and Other,” requires the use of the acquisition method of accounting for a business combination and defines an intangible asset. Goodwill and intangible assets acquired in a business combination and determined to have an indefinite useful life are not amortized but are instead assessed for impairment annually and more frequently if events and circumstances indicate that the asset might be impaired, in accordance with the provisions of ASC 350. We performed our annual test as of October 1. ASC 350 also requires that intangible assets with estimable useful lives be amortized over their respective estimated useful lives to their estimated residual values, and reviewed for impairment if events and circumstances indicate that the asset might be impaired.
In January 2017, the FASB issued ASU No. 2017-04, “Simplifying the Test for Goodwill Impairment” (“ASU 2017-04”), which addresses changes to the testing for goodwill impairment by eliminating Step 2 of the process. A goodwill impairment test will now be performed by comparing the fair value of a reporting unit with its carrying amount. An impairment charge should be recognized for the amount by which the carrying amount exceeds the reporting unit’s fair value. The guidance is effective for annual and interim goodwill impairment tests in fiscal years beginning after December 15, 2019. We adopted the new standard on January 1, 2020. This ASU did not have a significant impact on our consolidated financial statements.
As of October 1, 2020 and 2019, we opted to bypass the qualitative assessment and proceeded directly to performing the quantitative goodwill impairment test. We assessed the fair values of our reporting units by utilizing the income approach, based on a discounted cash flow valuation model as the basis for our conclusions. Our estimates of future cash flows included
significant management assumptions such as revenue growth rates, operating margins, discount rates, estimated terminal values and future economic and market conditions. Our assessment concluded that the fair values of the reporting units exceeded their carrying amounts, including goodwill. Accordingly, the goodwill of the reporting units was not considered impaired as of October 1, 2020. However, during the second quarter of 2020, we recorded a goodwill impairment charge of $1,228 related to business formerly included in the Industrial Products segment. Refer to Note 6, "Intangible Assets". We may resume performing the qualitative assessment in subsequent periods.
Accounts Receivable
We market our products worldwide to a diverse customer base, principally throughout the Americas, Europe, and Asia. We grant credit terms in the normal course of business to our customers and perform on-going credit evaluations of our customers. In June 2016, the FASB issued ASU No. 2016-13, "Financial Instruments - Credit Losses (Topic 326): Measurement of Credit Losses on Financial Instruments", which requires that credit losses be reported based on expected losses instead of the incurred loss model. Based on this ASU, customers' credit limits are adjusted based upon their reasonably expected credit worthiness which is determined through review of their payment history, their current credit information, and any foreseeable future events. Collections and payments from customers are continuously monitored and allowances for doubtful accounts for estimated losses resulting from the inability of the Company’s customers to make required payments are maintained. Estimated losses are based on historical experience, any specific customer collection issues identified, and any reasonably expected future adverse events. If the financial condition of our customers were to deteriorate resulting in an impairment of their ability to make payments, additional allowances and related bad debt expense may be required.
Post-employment Benefits
We provide life insurance, health care benefits, and defined benefit pension plan payments for certain eligible retirees and health care benefits for certain retirees’ eligible survivors. The costs and obligations related to these benefits reflect our assumptions as to health care cost trends and key economic conditions including discount rates, expected rate of return on plan assets, and expected salary increases. The cost of providing plan benefits also depends on demographic assumptions including retirements, mortality, turnover, and plan participation. If actual experience differs from these assumptions, the cost of providing these benefits could increase or decrease.
In accordance with ASC 715, “Compensation-Retirement Benefits,” we are required to recognize the overfunded or underfunded status of a defined benefit post retirement plan (other than a multiemployer plan) as an asset or liability in our statement of financial position, and to recognize changes in that funded status in the year in which the changes occur through comprehensive income.
Intangible Assets with Finite Lives
The useful life of an intangible asset is based on our assumptions regarding expected use of the asset; the relationship of the intangible asset to another asset or group of assets; any legal, regulatory or contractual provisions that may limit the useful life of the asset or that enable renewal or extension of the asset’s legal or contractual life without substantial cost; the effects of obsolescence, demand, competition and other economic factors; and the level of maintenance expenditures required to obtain the expected future cash flows from the asset and their related impact on the asset’s useful life. If events or circumstances indicate that the life of an intangible asset has changed, it could result in higher future amortization charges or recognition of an impairment loss. For the year ended December 31, 2020, there were no triggering events which required intangible asset impairment reviews.
Income Taxes
Income taxes are accounted for under the asset and liability method. Deferred tax assets and liabilities are measured using enacted tax rates in effect for the fiscal year in which those temporary differences are expected to be recovered or settled. Valuation allowances would be established when necessary to reduce deferred tax assets to the amount expected to be realized. In evaluating our ability to recover our deferred tax assets, in full or in part, we consider all available positive and negative evidence, including our past operating results, our forecast of future market growth, forecasted earnings, future taxable income, and prudent and feasible tax planning strategies. The assumptions utilized in determining future taxable income require significant judgment and are consistent with the plans and estimates we are using to manage the underlying businesses.
We recognize uncertain income tax positions taken on income tax returns at the largest amount that is more likely than not to be sustained upon audit by the relevant taxing authority. An uncertain income tax position will not be recognized if it has less than a 50% likelihood of being sustained.
Our policy for recording interest and penalties associated with uncertain tax positions is to record such items as a component of our income tax provision.
As of December 31, 2020, we have federal and state income tax net operating loss (NOL) carryforwards of $2,367 and $1,026, respectively. The federal NOL will not expire. The state NOL will expire between 2025 to 2034. We believe that the benefit from the state NOL carryforwards will be realized, therefore a valuation allowance is not required to be established on these assets. However, we also acquired an insignificant amount of NOL carryforwards with the acquisition of Chemogas. These NOLs are not expected to be realized and therefore a valuation allowance on these items was established.
We consider the undistributed earnings of certain non-U.S. subsidiaries to be indefinitely reinvested outside of the United States on the basis of estimates that future domestic cash generation will be sufficient to meet future domestic cash needs and our specific plans for reinvestment of those subsidiary earnings. We project that our foreign earnings will be utilized offshore for working capital and future foreign growth. The determination of the unrecognized deferred tax liability on those undistributed earnings is not practicable due to our legal entity structure and the complexity of U.S. and local country tax laws. If we decide to repatriate the undistributed foreign earnings, we will need to recognize the income tax effects in the period we change our assertion on indefinite reinvestment.
Stock-based Compensation
We account for stock-based compensation in accordance with the provisions of ASC 718, “Compensation-Stock Compensation.” Under the fair value recognition provisions of this statement, share-based compensation cost is measured at the grant date based on the value of the award and is recognized as expense over the vesting period. Determining the fair value of share-based awards at the grant date requires judgment, including estimating our stock price volatility, employee stock option exercise behaviors and employee option forfeiture rates. Expected volatilities are based on historical volatility of our stock. The expected term of the options is based on our historical experience of employees’ exercise behavior. As stock-based compensation expense recognized in the Consolidated Statements of Earnings is based on awards ultimately expected to vest, the amount of expense has been reduced for estimated forfeitures. ASC 718 allows for forfeitures to be estimated at the time of grant and revised, if necessary, in subsequent periods if actual forfeitures differ from those estimates. Forfeitures were estimated based on historical experience. If factors change and we employ different assumptions in the application of ASC 718, the compensation expense that we record in future periods may differ significantly from what we have recorded in the current period. See Note 3 in Notes to Consolidated Financial Statements for additional information.
New Accounting Pronouncements
See Note 1 in Notes to Consolidated Financial Statements regarding recent accounting pronouncements.
Item 7A. Quantitative and Qualitative Disclosures About Market Risk
Our cash and cash equivalents are held primarily in certificates of deposit and money market investment funds. In the second quarter of 2019, we entered into an interest rate swap and cross-currency swap for hedging purposes. Refer to details noted below (see Note 20). Additionally, as of December 31, 2020, our borrowings were under a revolving loan bearing interest at a fluctuating rate as defined by the Credit Agreement plus an applicable rate. The applicable rate is based upon our consolidated net leverage ratio, as defined in the Credit Agreement. A 100 basis point increase or decrease in interest rates, applied to our borrowings at December 31, 2020, would result in an increase or decrease in annual interest expense and a corresponding reduction or increase in cash flow of approximately $1,636. We are exposed to commodity price risks, including prices of our primary raw materials. Our objective is to seek a reduction in the potential negative earnings impact of raw material pricing arising in our business activities. We manage these financial exposures, where possible, through pricing and operational means. Our practices may change as economic conditions change.
Interest Rate Risk
We have exposure to market risk for changes in interest rates, including the interest rate relating to our credit agreement dated June 27, 2018. In the second quarter of 2019, we began to manage our interest rate exposure through the use of derivative instruments. All of our derivative instruments are utilized for risk management purposes, and are not used for trading or
speculative purposes. We have hedged a portion of our floating interest rate exposure using an interest rate swap (see Note 20 to our consolidated financial statements). As of December 31, 2020, the notional amount of our outstanding interest rate swap was $108,569.
Foreign Currency Exchange Risk
The financial condition and results of operations of our foreign subsidiaries are reported in Euros, Canadian Dollars, Malaysian Ringgits, Singapore Dollars, Australian Dollars, and Philippine Pesos and then translated into U.S. dollars at the applicable currency exchange rate for inclusion in our consolidated financial statements. Therefore, we are exposed to foreign currency exchange risk related to these currencies. Specifically, we are exposed to changes in exchange rates between the U.S. dollar and Euro. In the second quarter of 2019, we entered into a cross-currency swap, with a notional amount of $108,569, which we designated as a hedge of our net investment in Chemogas.
Item 8. Financial Statements and Supplementary Data
| | | | | | | | |
| Index to Financial Statements and Supplementary Data: | | Page Numbers |
| | |
| | |
| | |
| | |
| | |
| | |
| | |
| | |
| | |
Report of Independent Registered Public Accounting Firm
To the Stockholders and the Board of Directors of Balchem Corporation
Opinions on the Financial Statements and Internal Control Over Financial Reporting
We have audited the accompanying consolidated balance sheets of Balchem Corporation and subsidiaries (the Company) as of December 31, 2020 and 2019, and the related consolidated statements of earnings, comprehensive income, stockholders’ equity and cash flows for each of the three years in the period ended December 31, 2020, and the related notes and schedule listed at Item 8 (collectively, the financial statements). We also have audited the Company’s internal control over financial reporting as of December 31, 2020, based on criteria established in Internal Control — Integrated Framework issued by the Committee of Sponsoring Organizations of the Treadway Commission in 2013.
In our opinion, the financial statements referred to above present fairly, in all material respects, the financial position of the Company as of December 31, 2020 and 2019, and the results of their operations and their cash flows for each of the years in the three-year period ended December 31, 2020, in conformity with accounting principles generally accepted in the United States of America. Also in our opinion, the Company maintained, in all material respects, effective internal control over financial reporting as of December 31, 2020, based on criteria established in Internal Control — Integrated Framework issued by the Committee of Sponsoring Organizations of the Treadway Commission in 2013.
Basis for Opinions
The Company’s management is responsible for these financial statements, for maintaining effective internal control over financial reporting, and for its assessment of the effectiveness of internal control over financial reporting, included in the accompanying Management’s Report on Internal Control Over Financial Reporting. Our responsibility is to express an opinion on the Company's financial statements and an opinion on the Company’s internal control over financial reporting based on our audits. We are a public accounting firm registered with the Public Company Accounting Oversight Board (United States) (PCAOB) and are required to be independent with respect to the Company in accordance with U.S. federal securities laws and the applicable rules and regulations of the Securities and Exchange Commission and the PCAOB.
We conducted our audits in accordance with the standards of the PCAOB. Those standards require that we plan and perform the audits to obtain reasonable assurance about whether the financial statements are free of material misstatement, whether due to error or fraud, and whether effective internal control over financial reporting was maintained in all material respects.
Our audits of the financial statements included performing procedures to assess the risks of material misstatement of the financial statements, whether due to error or fraud, and performing procedures that respond to those risks. Such procedures included examining, on a test basis, evidence regarding the amounts and disclosures in the financial statements. Our audits also included evaluating the accounting principles used and significant estimates made by management, as well as evaluating the overall presentation of the financial statements. Our audit of internal control over financial reporting included obtaining an understanding of internal control over financial reporting, assessing the risk that a material weakness exists, and testing and evaluating the design and operating effectiveness of internal control based on the assessed risk. Our audits also included performing such other procedures as we considered necessary in the circumstances. We believe that our audits provide a reasonable basis for our opinions.
Definition and Limitations of Internal Control Over Financial Reporting
A company’s internal control over financial reporting is a process designed to provide reasonable assurance regarding the reliability of financial reporting and the preparation of financial statements for external purposes in accordance with generally accepted accounting principles. A company’s internal control over financial reporting includes those policies and procedures that (1) pertain to the maintenance of records that, in reasonable detail, accurately and fairly reflect the transactions and dispositions of the assets of the company; (2) provide reasonable assurance that transactions are recorded as necessary to permit preparation of financial statements in accordance with generally accepted accounting principles, and that receipts and expenditures of the company are being made only in accordance with authorizations of management and directors of the company; and (3) provide reasonable assurance regarding prevention or timely detection of unauthorized acquisition, use or disposition of the company’s assets that could have a material effect on the financial statements.
Because of its inherent limitations, internal control over financial reporting may not prevent or detect misstatements. Also, projections of any evaluation of effectiveness to future periods are subject to the risk that controls may become inadequate because of changes in conditions, or that the degree of compliance with the policies or procedures may deteriorate.
Critical Audit Matter
The critical audit matter communicated below is a matter arising from the current period audit of the consolidated financial statements that was communicated or required to be communicated to the audit committee and that: (1) relates to accounts or disclosures that are material to the consolidated financial statements and (2) involved our especially challenging, subjective, or complex judgments. The communication of the critical audit matter does not alter in any way our opinion on the consolidated financial statements, taken as a whole, and we are not, by communicating the critical audit matter below, providing separate opinions on the critical audit matter or on the accounts or disclosures to which it relates.
Valuation of Reporting Units for Goodwill Impairment Testing
As described in Note 1 and 6 to the financial statements, the Company’s goodwill balance was $529 million as of December 31, 2020. The Company performed an annual goodwill impairment test as of October 1, 2020 using a quantitative evaluation for each of their reporting units. The Company determines the fair value of its reporting units using the income approach, based on a discounted cash flow valuation model. To test for goodwill impairment, the Company compares fair value of each reporting unit to its carrying value. When estimating the fair value of each reporting unit management makes significant estimates and assumptions related to a number of factors. The Company considers the impact of factors that are specific to each of the reporting units such as industry and economic changes as well as projected revenue and expense growth rates based upon annual budgets and longer-range strategic plans, which are highly sensitive to changes in domestic and foreign economic conditions, and the selection of appropriate discount rates.
Given the significant estimates and assumptions management makes to estimate the fair value of the reporting units and the sensitivity of the operations to changes in U.S. and foreign economic conditions, we identified management’s assumptions related to the revenue and expense growth rates, the discount rates, and the terminal value calculation utilized in the valuation of the reporting units utilized in the Company’s goodwill impairment tests as a critical audit matter. Auditing the reasonableness of management’s estimates and assumptions required a high degree of auditor judgment and an increased extent of effort, including the need to involve our fair value specialists.
Our audit procedures related to revenue and expense growth rates, discount rates, and the terminal value calculation utilized in the valuation of the Company’s reporting units included the following, among others:
•We obtained an understanding of the relevant controls related to the valuation of the Company’s reporting units and tested such controls for design and operating effectiveness, including management review controls related to revenue and expense growth rates and the selection of appropriate discount rates.
•We evaluated the reasonableness of management’s forecasted revenue and expense growth rates by comparing actual results to management’s historical forecasts.
•Due to the uncertain U.S and foreign economic growth, we evaluated the reasonableness of management’s forecasts of revenue and expense growth rates by comparing the forecasts to (1) the historical results, (2) internal communications to management and the Board of Directors, and (3) external communications made by management to analysts and investors.
•We evaluated changes in the regulatory environment using industry reports containing analysis of the Company’s markets and assessed whether these changes were reflected in management’s forecasts of revenue and expense growth rates.
•With the assistance of our fair value specialists, we evaluated the reasonableness of the discount rates and tested the relevance and reliability of source information underlying the determination of the discount rates, tested the mathematical accuracy of the calculation, and developed a range of independent estimates and compared those to the discount rates selected by management.
•With the assistance of our fair value specialists, we evaluated the reasonableness and tested the mathematical accuracy of the terminal value calculation.
/s/ RSM US LLP
We have served as the Company's auditor since 2004.
| | |
| New York, New York |
| February 19, 2021 |
BALCHEM CORPORATION
Consolidated Balance Sheets
December 31, 2020 and 2019
(Dollars in thousands, except share and per share data)
| | | | | | | | | | | |
| 2020 | | 2019 |
| Current assets: | | | |
| Cash and cash equivalents | $ | 84,571 | | | $ | 65,672 | |
Accounts receivable, net of allowance for doubtful accounts of $2,092 and $2,080 at December 31, 2020 and 2019, respectively | 98,214 | | | 93,444 | |
| Inventories, net | 70,620 | | | 83,893 | |
| Prepaid expenses | 6,598 | | | 4,385 | |
| Prepaid income taxes | 3,447 | | | 5,098 | |
| Other current assets | 3,438 | | | 2,454 | |
| Total current assets | 266,888 | | | 254,946 | |
| | | |
| Property, plant and equipment, net | 228,096 | | | 216,859 | |
| | | |
| Goodwill | 529,463 | | | 523,998 | |
| Intangible assets with finite lives, net | 121,660 | | | 143,924 | |
| Right of use assets | 8,410 | | | 7,338 | |
| Other assets | 11,326 | | | 8,617 | |
| Total assets | $ | 1,165,843 | | | $ | 1,155,682 | |
| | | |
| Liabilities and Stockholders’ Equity | | | |
| Current liabilities: | | | |
| Trade accounts payable | $ | 23,742 | | | $ | 37,267 | |
| Accrued expenses | 29,655 | | | 24,604 | |
| Accrued compensation and other benefits | 19,753 | | | 11,057 | |
| Dividends payable | 18,941 | | | 16,855 | |
| Lease liabilities - current | 2,337 | | | 2,475 | |
| Total current liabilities | 94,428 | | | 92,258 | |
| | | |
| Revolving loan | 163,569 | | | 248,569 | |
| Deferred income taxes | 51,359 | | | 56,431 | |
| Lease liabilities - non-current | 6,079 | | | 4,827 | |
| Derivative liabilities | 11,658 | | | 2,103 | |
| Other long-term obligations | 10,517 | | | 7,827 | |
| Total liabilities | 337,610 | | | 412,015 | |
| | | |
| Commitments and contingencies (note 16) | | | |
| | | |
| Stockholders’ equity: | | | |
Preferred stock, $25 par value. Authorized 2,000,000 shares; none issued and outstanding | — | | | — | |
Common stock, $.0667 par value. Authorized 120,000,000 shares; 32,448,705 shares issued and 32,372,621 outstanding at December 31, 2020 and 32,405,796 shares issued and 32,201,917 shares outstanding at December 31, 2019, respectively | 2,164 | | | 2,161 | |
| Additional paid-in capital | 173,029 | | | 174,218 | |
| Retained earnings | 656,740 | | | 590,921 | |
| Accumulated other comprehensive income/(loss) | 4,173 | | | (5,564) | |
Treasury stock, at cost: 76,084 and 203,879 shares at December 31, 2020 and 2019, respectively | (7,873) | | | (18,069) | |
| Total stockholders’ equity | 828,233 | | | 743,667 | |
| | | |
| Total liabilities and stockholders’ equity | $ | 1,165,843 | | | $ | 1,155,682 | |
See accompanying notes to consolidated financial statements.
BALCHEM CORPORATION
Consolidated Statements of Earnings
Years Ended December 31, 2020, 2019 and 2018
(In thousands, except per share data)
| | | | | | | | | | | | | | | | | |
| 2020 | | 2019 | | 2018 |
| | | | | |
| Net sales | $ | 703,644 | | | $ | 643,705 | | | $ | 643,679 | |
| | | | | |
| Cost of sales | 479,747 | | | 432,338 | | | 439,427 | |
| | | | | |
| Gross margin | 223,897 | | | 211,367 | | | 204,252 | |
| | | | | |
| Operating expenses: | | | | | |
| Selling expenses | 58,630 | | | 60,932 | | | 57,219 | |
| Research and development expenses | 10,332 | | | 11,377 | | | 11,592 | |
| General and administrative expenses | 43,788 | | | 36,505 | | | 28,341 | |
| 112,750 | | | 108,814 | | | 97,152 | |
| | | | | |
| Earnings from operations | 111,147 | | | 102,553 | | | 107,100 | |
| | | | | |
| Other expenses: | | | | | |
| | | | | |
| Interest expense, net | 4,439 | | | 5,959 | | | 7,611 | |
| Other, net | 291 | | | 116 | | | 459 | |
| 4,730 | | | 6,075 | | | 8,070 | |
| | | | | |
| Earnings before income tax expense | 106,417 | | | 96,478 | | | 99,030 | |
| | | | | |
| Income tax expense | 21,794 | | | 16,807 | | | 20,457 | |
| | | | | |
| Net earnings | $ | 84,623 | | | $ | 79,671 | | | $ | 78,573 | |
| | | | | |
| Basic net earnings per common share | $ | 2.63 | | | $ | 2.48 | | | $ | 2.45 | |
| | | | | |
| Diluted net earnings per common share | $ | 2.60 | | | $ | 2.45 | | | $ | 2.42 | |
See accompanying notes to consolidated financial statements.
BALCHEM CORPORATION
Consolidated Statements of Comprehensive Income
Years Ended December 31, 2020, 2019 and 2018
(In thousands)
| | | | | | | | | | | | | | | | | | | | |
| | 2020 | | 2019 | | 2018 |
| | | | | | |
| Net earnings | | $ | 84,623 | | | $ | 79,671 | | | $ | 78,573 | |
| | | | | | |
| Other comprehensive income/(loss), net of tax: | | | | | | |
| Net foreign currency translation adjustment | | 12,829 | | | (891) | | | (2,982) | |
Unrealized loss on cash flow hedge, net of taxes of $809 and $372 at December 31, 2020 and 2019, respectively | | (2,285) | | | (1,399) | | | — | |
Net change in postretirement benefit plan, net of taxes of $127, $101, and $434 at December 31, 2020, 2019 and 2018, respectively | | (807) | | | 328 | | | 1,022 | |
| Other comprehensive income/(loss), net of tax | | 9,737 | | | (1,962) | | | (1,960) | |
| | | | | | |
| Comprehensive income | | $ | 94,360 | | | $ | 77,709 | | | $ | 76,613 | |
See accompanying notes to consolidated financial statements.
BALCHEM CORPORATION
Consolidated Statements of Stockholders’ Equity
Years Ended December 31, 2020, 2019 and 2018
(Dollars in thousands, except share and per share data)
| | | | | | | | | | | | | | | | | | | | | | | | | | | | | | | | | | | | | | | | | | | | | | | |
| Total
Stockholders'
Equity | | Retained
Earnings | | Accumulated
Other
Comprehensive
Income (Loss) | | Common Stock | | Treasury Stock | | Additional
Paid-in
Capital |
| Shares | | Amount | Shares | | Amount |
| Balance - December 31, 2017 | $ | 616,881 | | | $ | 464,639 | | | $ | (1,642) | | | 32,019,605 | | | $ | 2,135 | | | — | | | — | | | $ | 151,749 | |
| | | | | | | | | | | | | | | |
| Net earnings | 78,573 | | | 78,573 | | | — | | | — | | | — | | | — | | | — | | | — | |
| Other comprehensive loss, net of cumulative effect of accounting change | (1,960) | | | — | | | (1,960) | | | — | | | — | | | — | | | — | | | — | |
Dividends ($.47 per share) | (15,185) | | | (15,185) | | | — | | | — | | | — | | | — | | | — | | | — | |
| Treasury shares purchased | (1,394) | | | — | | | — | | | — | | | — | | | (16,755) | | | $ | (1,394) | | | — | |
| Shares and options issued under stock plans | 14,703 | | | — | | | — | | | 237,310 | | | 16 | | | 16,049 | | | 1,338 | | | 13,349 | |
| | | | | | | | | | | | | | | |
| Balance - December 31, 2018 | 691,618 | | | 528,027 | | | (3,602) | | | 32,256,915 | | | 2,151 | | | (706) | | | (56) | | | 165,098 | |
| | | | | | | | | | | | | | | |
| Net earnings | 79,671 | | | 79,671 | | | — | | | — | | | — | | | — | | | — | | | — | |
| Other comprehensive loss | (1,962) | | | — | | | (1,962) | | | — | | | — | | | — | | | — | | | — | |
Dividends ($.52 per share) | (16,777) | | | (16,777) | | | — | | | — | | | — | | | — | | | — | | | — | |
| Treasury shares purchased | (21,321) | | | — | | | — | | | — | | | — | | | (240,995) | | | (21,321) | | | — | |
| Shares and options issued under stock plans | 12,438 | | | — | | | — | | | 148,881 | | | 10 | | | 37,822 | | | 3,308 | | | 9,120 | |
| | | | | | | | | | | | | | | |
| Balance - December 31, 2019 | 743,667 | | | 590,921 | | | (5,564) | | | 32,405,796 | | | 2,161 | | | (203,879) | | | (18,069) | | | 174,218 | |
| | | | | | | | | | | | | | | |
| Net earnings | 84,623 | | | 84,623 | | | — | | | — | | | — | | | — | | | — | | | — | |
| Other comprehensive income | 9,737 | | | — | | | 9,737 | | | — | | | — | | | — | | | — | | | — | |
Dividends ($.58 per share) | (18,804) | | | (18,804) | | | — | | | — | | | — | | | — | | | — | | | — | |
| Treasury shares purchased | (13,463) | | | — | | | — | | | — | | | — | | | (136,629) | | | (13,463) | | | — | |
| Shares and options issued under stock plans | 22,473 | | | — | | | — | | | 42,909 | | | 3 | | | 264,424 | | | 23,659 | | | (1,189) | |
| | | | | | | | | | | | | | | |
| Balance - December 31, 2020 | $ | 828,233 | | | $ | 656,740 | | | $ | 4,173 | | | 32,448,705 | | | $ | 2,164 | | | (76,084) | | | $ | (7,873) | | | $ | 173,029 | |
See accompanying notes to consolidated financial statements.
BALCHEM CORPORATION
Consolidated Statements of Cash Flows
Years Ended December 31, 2020, 2019 and 2018
(In thousands)
| | | | | | | | | | | | | | | | | |
| | 2020 | | 2019 | | 2018 |
| Cash flows from operating activities: | | | | | |
| Net earnings | $ | 84,623 | | | $ | 79,671 | | | $ | 78,573 | |
| | | | | |
| Adjustments to reconcile net earnings to net cash provided by operating activities: | | | | | |
| Depreciation and amortization | 51,281 | | | 45,862 | | | 44,666 | |
| Stock compensation expense | 8,303 | | | 7,596 | | | 6,413 | |
| Deferred income taxes | (4,627) | | | (3,563) | | | (5,403) | |
| Provision for doubtful accounts | 140 | | | 1,776 | | | 43 | |
| Unrealized loss/(gain) on foreign currency transactions and deferred compensation | 173 | | | 72 | | | (141) | |
| Asset impairment charge | 1,915 | | | 1,140 | | | 1,801 | |
| Loss/(Gain) on disposal of assets | 153 | | | (3,134) | | | (3,244) | |
| Changes in assets and liabilities, net of acquired balances | | | | | |
| Accounts receivable | (3,599) | | | 11,623 | | | (7,773) | |
| Inventories | 13,923 | | | (11,401) | | | (6,016) | |
| Prepaid expenses and other current assets | (2,856) | | | 477 | | | 1,517 | |
| Accounts payable and accrued expenses | (992) | | | 1,134 | | | 5,988 | |
| Income taxes | 1,859 | | | (5,664) | | | 1,121 | |
| Other | 198 | | | (1,128) | | | 1,152 | |
| Net cash provided by operating activities | 150,494 | | | 124,461 | | | 118,697 | |
| | | | | |
| Cash flows from investing activities: | | | | | |
| Capital expenditures and intangible assets acquired | (33,828) | | | (28,413) | | | (19,723) | |
| Cash paid for acquisitions, net of cash acquired | — | | | (141,062) | | | (17,399) | |
| Proceeds from sale of business and assets | 87 | | | 11,523 | | | 966 | |
| Proceeds from insurance | — | | | 2,727 | | | 4,165 | |
| Purchase of convertible notes | (850) | | | (1,000) | | | — | |
| Net cash used in investing activities | (34,591) | | | (156,225) | | | (31,991) | |
| | | | | |
| Cash flows from financing activities: | | | | | |
| Proceeds from revolving loan | 10,000 | | | 168,569 | | | 210,750 | |
| Principal payments on revolving loan | (95,000) | | | (76,000) | | | (54,750) | |
| Principal payments on finance lease | (151) | | | — | | | — | |
| Principal payments on long-term debt | — | | | — | | | (219,500) | |
| Principal payment on acquired debt | — | | | (17,567) | | | (19) | |
| Cash paid for financing costs | — | | | — | | | (1,374) | |
| Proceeds from stock options exercised | 14,155 | | | 4,839 | | | 8,272 | |
| Dividends paid | (16,705) | | | (15,135) | | | (13,432) | |
| Purchase of treasury stock | (13,463) | | | (21,321) | | | (1,394) | |
| Net cash (used in) provided by financing activities | (101,164) | | | 43,385 | | | (71,447) | |
| | | | | |
| Effect of exchange rate changes on cash | 4,160 | | | (217) | | | (1,407) | |
| | | | | |
| Increase in cash and cash equivalents | 18,899 | | | 11,404 | | | 13,852 | |
| | | | | |
| Cash and cash equivalents beginning of period | 65,672 | | | 54,268 | | | 40,416 | |
| Cash and cash equivalents end of period | $ | 84,571 | | | $ | 65,672 | | | $ | 54,268 | |
Supplemental Cash Flow Information - see Note 13
See accompanying notes to consolidated financial statements.
BALCHEM CORPORATION
Notes to Consolidated Financial Statements
(All amounts in thousands, except share and per share data)
NOTE 1 - BUSINESS DESCRIPTION AND SUMMARY OF SIGNIFICANT ACCOUNTING POLICIES
Business Description
Balchem Corporation (“Balchem” or the “Company”), including, unless the context otherwise requires, its wholly-owned subsidiaries, incorporated in the State of Maryland in 1967, is engaged in the development, manufacture and marketing of specialty performance ingredients and products for the food, nutritional, feed, pharmaceutical, agricultural, and medical sterilization industries.
Principles of Consolidation
The consolidated financial statements include the financial statements of the Company and its subsidiaries. All significant intercompany balances and transactions have been eliminated in consolidation. Certain reclassifications have been made to prior period amounts to conform with the current period's presentation.
Revenue Recognition
Revenue for each of the Company’s business segments is recognized when control of the promised goods is transferred to our customers, in an amount that reflects the consideration we expect to realize in exchange for those goods. The Company reports amounts billed to customers related to shipping and handling as revenue and includes costs incurred for shipping and handling in cost of sales. Amounts received for unshipped merchandise are not recognized as revenue but rather they are recorded as customer deposits and are included in current liabilities. In instances of shipments made on consignment, revenue is recognized when control is transferred to the customer.
Accounting Standards Codification ("ASC") 606, Revenue from Contracts with Customers, was adopted for the fiscal year beginning on January 1, 2018. Per the standard, revenue-generating contracts are assessed to identify distinct performance obligations, allocating transaction prices to those performance obligations, and criteria for satisfaction of a performance obligation. The standard allows for recognition of revenue only when we have satisfied a performance obligation through transferring control of the promised good or service to a customer. Control, in this instance, may mean the ability to prevent other entities from directing the use of, and receiving benefit from, a good or service. The standard indicates that an entity must determine at contract inception whether it will transfer control of a promised good or service over time or satisfy the performance obligation at a point in time through analysis of the following criteria: (i) the entity has a present right to payment, (ii) the customer has legal title, (iii) the customer has physical possession, (iv) the customer has the significant risks and rewards of ownership and (v) the customer has accepted the asset. The Company assesses collectability based primarily on the customer’s payment history and on the creditworthiness of the customer. The impact to revenues as a result of applying ASC 606 was an increase of $338 for the year ended December 31, 2018.
Cash and Cash Equivalents
The Company considers all highly liquid investments with a maturity of three months or less to be cash equivalents. The Company has funds in its cash accounts that are with third party financial institutions, primarily in certificates of deposit and money market funds. The Company's balances of cash and cash equivalents in the U.S., Italy, Belgium, Malaysia, Australia, Philippines, and Singapore exceed the Federal Deposit Insurance Corporation (“FDIC”), Fondo Interbancario di Tutela dei Depositi (“FITD”), Financial Services and Markets Authority ("FSMA"), Perbadanan Insurans Deposit Malaysia ("PIDM"), Australian Prudential Regulation Authority ("APRA"), Philippine Deposit Insurance Corporation ("PDIC"), and Singapore Deposit Insurance Corporation ("SDIC") insurance limits, respectively.
Accounts Receivable
Credit terms are granted in the normal course of business to the Company’s customers and on-going credit evaluations are performed on the Company’s customers. In June 2016, the FASB issued ASU No. 2016-13, "Financial Instruments - Credit Losses (Topic 326): Measurement of Credit Losses on Financial Instruments", which requires that credit losses be reported based on expected losses instead of the incurred loss model. Based on this ASU, customers' credit limits are adjusted based upon their reasonably expected credit worthiness which is determined through review of their payment history, their current credit information, and any foreseeable future events. Collections and payments from customers are continuously monitored and
allowances for doubtful accounts for estimated losses resulting from the inability of the Company’s customers to make required payments are maintained. Estimated losses are based on historical experience, any specific customer collection issues identified, and any reasonably expected future adverse events. If the financial condition of our customers were to deteriorate resulting in an impairment of their ability to make payments, additional allowances and related bad debt expense may be required.
Inventories
Inventories are valued at the lower of cost (first in, first out or average) or net realizable value and have been reduced by an allowance for excess or obsolete inventories. Cost elements include material, labor and manufacturing overhead.
Property, Plant and Equipment and Depreciation
Property, plant and equipment are stated at cost.
Depreciation of plant and equipment is calculated using the straight-line method over the estimated useful lives of the assets as follows:
| | | | | |
| Buildings | 15-25 years |
| Equipment | 2-28 years |
Expenditures for repairs and maintenance are charged to expense. Alterations and major overhauls that extend the lives or increase the capacity of plant assets are capitalized. When assets are retired or otherwise disposed of, the cost of the assets and the related accumulated depreciation are removed from the accounts and any resultant gain or loss is included in earnings from operations.
Business Concentrations
Financial instruments that subject the Company to credit risk consist primarily of accounts receivable and money market investments. Investments are managed within established guidelines to mitigate risks. Accounts receivable subject the Company to credit risk partially due to the concentration of amounts due from customers. The Company extends credit to its customers based upon an evaluation of the customers’ financial condition and credit histories. In 2020, 2019 and 2018, no customer accounted for more than 10% of total net sales or accounts receivable.
Goodwill and Acquired Intangible Assets
Goodwill represents the excess of costs over fair value of assets of businesses acquired. ASC 350, “Intangibles-Goodwill and Other,” requires the use of the acquisition method of accounting for a business combination and defines an intangible asset. Goodwill and intangible assets acquired in a business combination and determined to have an indefinite useful life are not amortized but are instead assessed for impairment annually and more frequently if events and circumstances indicate that the asset might be impaired, in accordance with the provisions of ASC 350. The Company performed its annual test as of October 1. ASC 350 also requires that intangible assets with estimable useful lives be amortized over their respective estimated useful lives to their estimated residual values, and reviewed for impairment if events and circumstances indicate that the asset might be impaired.
In January 2017, the FASB issued ASU No. 2017-04, “Simplifying the Test for Goodwill Impairment” (“ASU 2017-04”), which addresses changes to the testing for goodwill impairment by eliminating Step 2 of the process. A goodwill impairment test will now be performed by comparing the fair value of a reporting unit with its carrying amount. An impairment charge should be recognized for the amount by which the carrying amount exceeds the reporting unit’s fair value. The guidance is effective for annual and interim goodwill impairment tests in fiscal years beginning after December 15, 2019. The Company adopted the new standard on January 1, 2020.
As of October 1, 2020 and 2019, the Company opted to bypass the qualitative assessment and proceeded directly to performing the quantitative goodwill impairment test. The Company assessed the fair values of its reporting units by utilizing the income approach, based on a discounted cash flow valuation model as the basis for its conclusions. The Company's estimates of future cash flows included significant management assumptions such as revenue growth rates, operating margins, discount rates, estimated terminal values and future economic and market conditions. The Company's assessment concluded that the fair values of the reporting units exceeded their carrying amounts, including goodwill. Accordingly, the goodwill of the reporting units was not considered impaired as of October 1, 2020. However, during the second quarter of 2020, the Company recorded a goodwill impairment charge of $1,228 related to business formerly included in the Industrial Products segment. Refer to Note 6, "Intangible Assets". The Company may resume performing the qualitative assessment in subsequent periods.
The Company had goodwill in the amount of $529,463 and $523,998 as of December 31, 2020 and December 31, 2019, respectively, subject to the provisions of ASC 350, “Intangibles-Goodwill and Other.”
| | | | | | | | |
| Goodwill at December 31, 2018 | | $ | 447,995 | |
| Goodwill as a result of the Acquisitions - see Note 2 | | 77,392 | |
| Impact due to change in foreign exchange rates | | (1,389) | |
| Goodwill at December 31, 2019 | | 523,998 | |
| Goodwill as a result of the Acquisitions – see Note 2 | | 432 | |
| Goodwill impairment - see Note 6 | | (1,228) | |
| Impact due to change in foreign exchange rates | | 6,261 | |
| Goodwill at December 31, 2020 | | $ | 529,463 | |
| | | | | | | | | | | | | | |
| | | December 31, 2020 | | December 31, 2019 |
| HNH | | $ | 424,051 | | | $ | 423,600 | |
| ANH | | 17,824 | | | 17,189 | |
| Specialty Products | | 87,539 | | | 81,981 | |
| Other and Unallocated | | 49 | | | 1,228 | |
| Total | | $ | 529,463 | | | $ | 523,998 | |
The following intangible assets with finite lives are stated at cost and are amortized either on an accelerated basis or on a straight-line basis over the following estimated useful lives:
| | | | | | | | |
| | | Amortization Period
(in years) |
| Customer relationships and lists | | 10 - 20 |
| Trademarks & trade names | | 2 - 17 |
| Developed technology | | 5 - 12 |
| Regulatory registration costs | | 5 - 10 |
| Patents & trade secrets | | 15 - 17 |
| Other | | 3 - 18 |
Income Taxes
Income taxes are accounted for under the asset and liability method. Deferred tax assets and liabilities are measured using enacted tax rates in effect for the fiscal year in which those temporary differences are expected to be recovered or settled. Valuation allowances would be established when necessary to reduce deferred tax assets to the amount expected to be realized. In evaluating our ability to recover our deferred tax assets, in full or in part, we consider all available positive and negative evidence, including our past operating results, our forecast of future market growth, forecasted earnings, future taxable income, and prudent and feasible tax planning strategies. The assumptions utilized in determining future taxable income require significant judgment and are consistent with the plans and estimates we are using to manage the underlying businesses.
We recognize uncertain income tax positions taken on income tax returns at the largest amount that is more likely than not to be sustained upon audit by the relevant taxing authority. An uncertain income tax position will not be recognized if it has less than a fifty percent likelihood of being sustained.
Our policy for recording interest and penalties associated with uncertain tax positions is to record such items as a component of our income tax provision.
Use of Estimates
Management of the Company is required to make certain estimates and assumptions during the preparation of consolidated financial statements in accordance with accounting principles generally accepted in the United States of America. These estimates and assumptions impact the reported amount of assets and liabilities and disclosures of contingent assets and liabilities as of the date of the consolidated financial statements and revenues and expenses during the reporting period. Estimates and assumptions
are reviewed periodically, and the effects of revisions are reflected in the consolidated financial statements in the period they are determined to be necessary. Actual results could differ from those estimates.
Fair Value of Financial Instruments
The Company has a number of financial instruments, none of which are held for trading purposes. The estimated fair value amounts have been determined by the Company using available market information and appropriate valuation methodologies. Considerable judgment is required in interpreting market data to develop the estimates of fair value, and, accordingly, the estimates are not necessarily indicative of the amounts that the Company could realize in a current market exchange. The carrying value of debt approximates fair value as the interest rate is based on market and the Company’s consolidated leverage ratio. The Company’s financial instruments also include cash equivalents, accounts receivable, accounts payable and accrued liabilities, and are carried at cost which approximates fair value due to the short-term maturity of these instruments.
In addition, non-current assets includes rabbi trust funds related to the Company's deferred compensation plan. The money market and rabbi trust funds are valued using level one inputs, as defined by ASC 820, "Fair Value Measurement."
The Company also has derivative financial instruments, consisting of a cross-currency swap and an interest rate swap, which are included in either derivative asset or derivative liability, in the consolidated balance sheets (see Note 20, "Derivative Instruments and Hedging Activities"). The fair values of these derivative instruments are determined based on Level 2 inputs, using significant inputs that are observable either directly or indirectly, including interest rate curves and implied volatilities.
Cost of Sales
Cost of sales are primarily comprised of raw materials and supplies consumed in the manufacture of product, as well as manufacturing labor, maintenance labor, depreciation expense, and direct overhead expense necessary to convert purchased materials and supplies into finished product. Cost of sales also includes inbound freight costs, outbound freight costs for shipping products to customers, warehousing costs, quality control and obsolescence expense.
Selling, General and Administrative Expenses
Selling expenses consist primarily of compensation and benefit costs, amortization of customer relationships and lists, trade promotions, advertising, commissions and other marketing costs. General and administrative expenses consist primarily of payroll and benefit costs, occupancy and operating costs of corporate offices, depreciation and amortization expense on non-manufacturing assets, information systems costs and other miscellaneous administrative costs.
Research and Development
Research and development costs are expensed as incurred.
Net Earnings Per Common Share
Basic net earnings per common share is calculated by dividing net income by the weighted average number of common shares outstanding during the period. Diluted net earnings per common share is calculated in a manner consistent with basic net earnings per common share except that the weighted average number of common shares outstanding also includes the dilutive effect of stock options outstanding, unvested restricted stock, and unvested performance shares (using the treasury stock method).
Stock-based Compensation
The Company has stock-based employee compensation plans, which are described more fully in Note 3. The Company accounts for stock-based compensation in accordance with ASC 718, “Compensation-Stock Compensation,” which requires all share-based payments, including grants of stock options, to be recognized in the income statement as an operating expense, based on their fair values. The Company estimates the fair value of each option award on the date of grant using a Black-Scholes based option-pricing model. Estimates of and assumptions about forfeiture rates, terms, volatility, interest rates and dividend yields are used to calculate stock-based compensation. A significant change to these estimates could materially affect the Company’s operating results.
Impairment of Long-lived Assets
Long-lived assets, such as property, plant, and equipment, and purchased intangibles subject to amortization, are reviewed for impairment whenever events or changes in circumstances indicate that the carrying amount of an asset may not be recoverable. Recoverability of assets to be held and used is measured by a comparison of the carrying amount of an asset to estimated
undiscounted future cash flows expected to be generated by the asset. If the carrying amount of an asset exceeds its estimated future cash flows, an impairment charge is recognized by the amount by which the carrying amount of the asset exceeds the fair value of the asset, which is generally based on discounted cash flows. For the year ended December 31, 2019, we incurred impairment charges of $1,026 in connection with a restructuring in the HNH segment.
Derivative Instruments and Hedging Activities
The Company is exposed to market fluctuations in interest rates as well as variability in foreign exchange rates. In May 2019, the Company entered into an interest rate swap with JP Morgan Chase, N.A. (the "Swap Counterparty") and a cross-currency swap with JP Morgan Chase, N.A. (the "Bank Counterparty"). The Company's primary objective for holding derivative financial instruments is to manage interest rate risk and foreign currency risk. The Company does not enter into derivative financial instruments for trading or speculative purposes.
On May 28, 2019, the Company entered into a pay-fixed, receive-floating interest rate swap with a notional amount of $108,569 and a maturity date of June 27, 2023. The Company's risk management objective and strategy with respect to the interest rate swap is to protect the Company against adverse fluctuations in interest rates by reducing its exposure to variability in cash flows relating to interest payments on a portion of its outstanding debt. The Company is meeting its objective since changes in the cash flows of the interest rate swap are expected to exactly offset the changes in the cash flows attributable to fluctuations in the contractually specified interest rate on the interest payments associated with the Credit Agreement.
At the same time, the Company also entered into a cross-currency swap to manage foreign exchange risk related to the Company's net investment in Chemogas. This derivative has a notional amount of $108,569, an effective date of May 28, 2019, and a maturity date of June 27, 2023.
The derivative instruments are with the above single counterparty and are subject to a contractual agreement that provides for the net settlement of all contracts through a single payment in a single currency in the event of default on or termination of any one contract. As such, the derivative instruments are categorized as a master netting arrangement and presented as a net derivative asset or derivative liability on the consolidated balance sheet.
On a quarterly basis, we assess the effectiveness of the hedging relationships for the interest rate swap and cross-currency swap by reviewing the critical terms indicated in the applicable agreement. As of December 31, 2020, we assessed the hedging relationships and determined them to be highly effective. As such, the net change in fair values of the interest rate swap, that qualify as cash flow hedge, was recorded in accumulated other comprehensive income/(loss) and is subsequently reclassified into interest expense as interest payments are made on our debt. For the cross-currency swap, the amounts that have not yet been recognized in earnings remained in the cumulative translation adjustment section of accumulated other comprehensive income until the hedged net investment is sold or liquidated in accordance with paragraphs 815-35-35-5A, "Derivatives and Hedging - Net Investment Hedges", and 830-30-40-1 through 40-1A, "Foreign Currency Matters - Derecognition". Refer to Note 20, "Derivative Instruments and Hedging Activities" for detailed information about our derivative financial instruments.
New Accounting Pronouncements
Recently Issued Accounting Standards
In March 2020, the FASB issued Accounting Standards Update ("ASU") 2020-04, "Reference Rate Reform (Topic 848): Facilitation of the Effects of Reference Rate Reform on Financial Reporting." This ASU provides temporary optional guidance to ease the potential burden in accounting for reference rate reform. The new guidance provides optional expedients and exceptions for applying generally accepted accounting principles to contract modifications and hedging relationships, subject to meeting certain criteria, that reference LIBOR or another reference rate expected to be discontinued. The ASU is intended to help stakeholders during the global market-wide reference rate transition period. Therefore, this standards update is in effect from March 12, 2020 through December 31, 2022. In January 2021, the FASB issued Accounting Standards Update ("ASU") 2021-01, "Reference Rate Reform (Topic 848): Scope." This ASU clarifies that certain optional expedients and exceptions in Topic 848 for contract modifications and hedge accounting apply to derivatives that are affected by the discounting transition. The ASU also amends the expedients and exceptions in Topic 848 to capture the incremental consequences of the scope clarification and to tailor the existing guidance to derivative instruments affected by the discounting transition. The Company is currently evaluating the impact of this pronouncement on the consolidated financial statements and disclosures.
In December 2019, the FASB issued Accounting Standards Update ("ASU") 2019-12, "Income Taxes (Topic 740): Simplifying the Accounting for Income Taxes." The amendments in this Update simplify the accounting for income taxes by removing certain exceptions to the general principles in Topic 740. The amendments also improve consistent application of and simplify GAAP
for other areas of Topic 740 by clarifying and amending existing guidance. The effective date of this Update is for fiscal years beginning after December 15, 2020, and interim periods within those fiscal years. Early adoption is permitted. The Standard may be adopted either using the prospective or retrospective transition approach and could also be applied on a modified retrospective basis through a cumulative-effect adjustment to retained earnings as of the beginning of the fiscal year of adoption. The Company is currently evaluating the impact of this pronouncement on the Company’s consolidated financial statements and disclosures.
Recently Adopted Accounting Standards
In August 2018, the FASB issued ASU 2018-15, “Customer’s Accounting for Implementation Costs Incurred in a Cloud Computing Arrangement that is a Service Contract.” The guidance requires implementation costs incurred by customers in cloud computing arrangements to be deferred over the noncancelable term of the cloud computing arrangements plus any optional renewal periods (1) that are reasonably certain to be exercised by the customer or (2) for which exercise of the renewal option is controlled by the cloud service provider. The effective date of this pronouncement is for fiscal years beginning after December 15, 2019, and interim periods within those fiscal years. The standard may be adopted either using the prospective or retrospective transition approach. The Company adopted the new standard on January 1, 2020. The standard update did not have a significant impact on the Company’s consolidated financial statements and disclosures.
In August 2018, the FASB issued ASU 2018-14, “Disclosure Framework-Changes to the Disclosure Requirements for Defined Benefit Plans,” which modifies the disclosure requirements for employers that sponsor defined benefit pension or other postretirement benefit plans. The guidance removes disclosures that are no longer considered cost beneficial, clarifies the specific requirements of disclosures and adds disclosure requirements identified as relevant. This update should be applied on a retrospective basis to all periods presented and is effective for fiscal years ending after December 15, 2020. Early adoption is permitted. The Company adopted the new standard on January 1, 2020. The standard update did not have a significant impact on the Company's consolidated financial statements and disclosures.
In August 2017, the FASB issued ASU No. 2017-12, Derivatives and Hedging (Topic 815): Targeted Improvements to Accounting for Hedging Activities. The guidance was issued with the objective of improving the financial reporting of hedging relationships to better portray the economic results of companies' risk management activities in its financial statements, as well as simplifying the application of hedge accounting guidance especially in the area of assessment of effectiveness of the hedge. In April 2019, the FASB issued ASU 2019-04, "Codification Improvements to Topic 815, Derivative and Hedging", which further clarified ASU 2017-12. The amendments are effective for fiscal years beginning after December 15, 2018, and interim periods within those fiscal years. The Company adopted the new standards in the second quarter of 2019, upon entering into derivative transactions. Refer to Note 20, "Derivative Instruments and Hedging Activities."
In January 2017, the FASB issued ASU No. 2017-04, “Simplifying the Test for Goodwill Impairment” (ASU 2017-04), which addresses changes to the testing for goodwill impairment by eliminating Step 2 of the process. The guidance is effective for annual and interim goodwill impairment tests in fiscal years beginning after December 15, 2019. The Company adopted the new standard on January 1, 2020. This ASU did not have a significant impact on the Company’s consolidated financial statements.
In June 2016, the FASB issued ASU No. 2016-13, "Financial Instruments - Credit Losses (Topic 326): Measurement of Credit Losses on Financial Instruments", which requires that credit losses be reported based on expected losses instead of the incurred loss model. The update made several consequential amendments to the codification which requires the accounting for available-for-sale debt securities to be individually assessed for credit losses when fair value is less than the amortized cost basis. The FASB subsequently issued ASU 2019-04, ASU 2019-05, and ASU 2019-11, all of which further clarified ASU 2016-13. The Company adopted the new standard and related updates on January 1, 2020. The adoption did not have a significant impact on the consolidated financial statements.
In February 2016, the FASB issued ASU No. 2016-02, “Leases” (“ASU 2016-02”), which was clarified by ASU 2018-11 and addresses the recognition of assets and liabilities that arise from all leases. The guidance requires lessees to recognize right-of-use ("ROU") assets and lease liabilities for most leases in the Consolidated Balance Sheets and is effective for annual and interim periods beginning after December 15, 2018. The Company adopted the new standard on January 1, 2019 and elected the optional transition method to account for the impact of the adoption with a cumulative-effect adjustment in the period of adoption. The new standard provides a number of optional practical expedients in transition. The Company elected the “package of practical expedients”, which permits it not to reassess under the new standard its prior conclusions about lease identification, lease classification and initial direct costs. The Company did not elect the use-of-hindsight or the practical expedient pertaining to land easements, the latter not being applicable to the Company. The new standard also provides practical expedients for an entity’s ongoing accounting. The Company elected the short-term lease recognition exemption for all leases that qualify, which means for those leases that qualify, the Company will not recognize ROU assets or lease liabilities. The Company also elected the practical expedient to not separate lease and non-lease components for all of its leases. In March 2019, the FASB issued ASU 2019-01,
"Leases (Topic 842): Codification Improvements," which further clarifies the determination of fair value of leases and modifies transition disclosure requirements for changes in accounting principles. The effective date of the amendments is for fiscal years beginning after December 15, 2019, and interim periods within those fiscal years. The ASU was adopted by the Company on January 1, 2020 and did not have a significant impact on its consolidated financial statements and disclosures. Refer to Note 19, "Leases."
NOTE 2 – SIGNIFICANT ACQUISITIONS AND DIVESTITURES
Acquisitions
On December 13, 2019, the Company completed the acquisition of Zumbro. The Company made payments of $52,403 on the acquisition date, amounting to $47,058 to the former shareholders and $5,345 to Zumbro's lenders to pay Zumbro debt. Considering the cash acquired of $686, net payments made to the former shareholders were $46,372. In May 2020, the Company received an adjustment for working capital acquired of $561.
The estimated goodwill of $18,505 arising from the acquisition consists largely of expected synergies, including the combined entities' experience and technical problem-solving capabilities, and acquired workforce. The goodwill is assigned to Human Nutrition & Health ("HNH") and $4,723 is deductible for income taxes.
The following table summarizes the estimated fair values of the assets acquired and liabilities assumed:
| | | | | | | | |
| Cash and cash equivalents | | $ | 686 | |
| Accounts receivable | | 3,314 | |
| Inventories | | 4,052 | |
| Prepaid & other current assets | | 521 | |
| Property, plant and equipment | | 15,245 | |
| Right of use assets | | 3,181 | |
| Customer relationships | | 8,200 | |
| Developed technology | | 4,400 | |
| Trade name | | 2,300 | |
| Other non-current assets | | 10 | |
| Accounts payable & accrued expenses | | (1,651) | |
| Lease liabilities | | (3,181) | |
| Debt | | (5,345) | |
| Deferred income taxes | | (3,740) | |
| Goodwill | | 18,505 | |
| Amount paid to shareholders | | 46,497 | |
| Zumbro debt paid on purchase date | | 5,345 | |
| Total amount paid on acquisition date | | $ | 51,842 | |
The estimated valuation of the fair value of tangible and intangible assets acquired and liabilities assumed are based on management's estimates and assumptions that are subject to change. In preparing our fair value estimates of the intangible assets and certain tangible assets acquired, management, among other things, consulted an independent advisor. Valuation methods utilized included cost and market approaches for property, plant and equipment, excess earnings method for customer relationships and the relief from royalty method for other intangible assets.
Customer relationships are amortized over a 15-year period utilizing an accelerated method based on the estimated average customer attrition rate. Trade name and developed technology are amortized over 10 years and 12 years, respectively, utilizing the straight-line method as the consumption pattern of the related economic benefits cannot be reliably determined.
The Company is indemnified for tax liabilities prior to the acquisition date. Indemnified tax liabilities will create an indemnification asset (receivable). An indemnification asset balance has not been established.
On May 27, 2019, the Company acquired 100 percent of the outstanding common shares of Chemogas. The Company made payments of approximately €99,503 (translated to $111,324) on the acquisition date, amounting to approximately €88,579 (translated to $99,102) to the former shareholders and approximately €10,924 (translated to $12,222) to Chemogas' lender to pay Chemogas bank debt. Considering the cash acquired of €3,943 (translated to $4,412), net payments made to the former shareholders were €84,636 (translated to $94,690).
The goodwill of $59,319 that arose on the acquisition date consists largely of expected synergies, including the combined entities' experience and technical problem-solving capabilities, and acquired workforce. The goodwill is assigned to the Specialty Products segment and is not tax deductible for income tax purposes.
The following table summarizes the estimated fair values of the assets acquired and liabilities assumed:
| | | | | | | | |
| Cash and cash equivalents | | $ | 4,412 | |
| Accounts receivable | | 4,176 | |
| Inventories | | 957 | |
| Property, plant and equipment | | 15,972 | |
| Customer relationships | | 39,158 | |
| Developed technology | | 2,461 | |
| Trade name | | 1,119 | |
| Other assets | | 1,491 | |
| Accounts payable | | (3,261) | |
| Bank debt | | (12,222) | |
| Other liabilities | | (1,030) | |
| Pension obligation (net) | | (594) | |
| Deferred income taxes | | (12,856) | |
| Goodwill | | 59,319 | |
| Amount paid to shareholders | | 99,102 | |
| Chemogas bank debt paid on purchase date | | 12,222 | |
| Total amount paid on acquisition date | | $ | 111,324 | |
The valuation of the fair value of tangible and intangible assets acquired and liabilities assumed are based on management’s estimates and assumptions. In preparing our fair value estimates of the intangible assets and certain tangible assets acquired, management, among other things, consulted an independent advisor. Valuation methods utilized included cost and market approaches for property, plant and equipment, excess earnings method for customer relationships and the relief from royalty method for other intangible assets.
Customer relationships are amortized over a 20-year period utilizing an accelerated method based on the estimated average customer attrition rate. Trade name and developed technology are amortized over 2 years and 10 years, respectively, utilizing the straight-line method as the consumption pattern of the related economic benefits cannot be reliably determined.
The Company is indemnified for tax liabilities prior to the acquisition date. Indemnified tax liabilities will create an indemnification asset (receivable). At this time, an indemnification asset balance has not been established.
In connection with Chemogas and Zumbro acquisitions, the Company incurred transaction and integration costs of $1,480 and $1,947 for the year ended December 31, 2020 and 2019, respectively.
In 2018, the Company, through its subsidiary, Balchem Italia, completed one immaterial acquisition, Bioscreen Technologies Srl.
Total transaction and integration costs related to recent acquisitions, including the Chemogas and Zumbro acquisitions described above, are recorded in general and administrative expenses. These costs amounted to $2,011, $2,273, and $1,786 for the years ended December 31, 2020, 2019 and 2018, respectively.
Divestiture
On September 6, 2019, the Company sold an insignificant portion of its business. As a result of the transaction, the Company recorded a gain on sale, which was immaterial to the consolidated financial statements and included in general and administrative expenses. Operating results for the portion of the business sold were insignificant relative to the Company’s consolidated financial results for year ended December 31, 2019.
NOTE 3 - STOCKHOLDERS’ EQUITY
STOCK-BASED COMPENSATION
All share-based payments, including grants of stock options, are recognized in the statements of earnings as operating expenses, based on their fair values.
The Company has made an estimate of expected forfeitures, based on its historical experience, and is recognizing compensation cost only for those stock-based compensation awards expected to vest.
The Company’s results for the years ended December 31, 2020, 2019 and 2018 reflected the following compensation cost and such compensation cost had the following effects on net earnings:
| | | | | | | | | | | | | | | | | | | | |
| | | Increase/(Decrease) for the
Year Ended, December 31 |
| | | 2020 | | 2019 | | 2018 |
| Cost of sales | | $ | 1,115 | | | $ | 1,147 | | | $ | 973 | |
| Operating expenses | | 7,188 | | | 6,449 | | | 5,440 | |
| Net earnings | | (6,332) | | | (5,884) | | | (4,965) | |
On December 31, 2020, the Company had one share-based compensation plan under which awards may be granted, which is described below.
In June 2017, the Company adopted the Balchem Corporation 2017 Omnibus Incentive Plan (“2017 Plan”) for officers, employees and directors of the Company and its subsidiaries. The 2017 Plan replaced the 1999 Stock Plan and amendments and restatements thereto (collectively to be referred to as the “1999 Plan"), which expired on April 9, 2018. No further awards will be made under the 1999 Plan, and the shares that remained available for grant under the 1999 Plan will only be used to settle outstanding awards granted under the 1999 Plan and will not become available under the 2017 Plan. The 2017 Plan is administered by the Compensation Committee of the Board of Directors of the Company. The 2017 Plan provides as follows: (i) for a termination date of June 13, 2027; (ii) the authorization of 1,600,000 shares for future grants (which represents a reduction from the 6,000,000 shares authorized for grant under the 1999 Plan); (iii) for the making of grants of stock options, stock appreciation rights, restricted stock awards, restricted stock units, and other stock-based awards, as well as for the making of cash performance awards; (iv) except as provided in an employment agreement as in effect on the effective date of the 2017 Plan, no automatic acceleration of outstanding awards upon the occurrence of a change in control of the Company; (v) certain annual limits on the number of shares and amount of cash that may be granted; (vii) for dividends or dividend equivalents otherwise payable on an unvested award to accrue and be paid only at such time as the vesting conditions applicable to the underlying award have been satisfied; (vii) for certain discretionary compensation recovery if the Company is required to prepare an accounting restatement of its financial statements due to the Company’s material noncompliance with any financial reporting requirements under the securities laws; and (viii) for compliance with the requirements of Section 409A of the Internal Revenue Code of 1986, as amended (the “Internal Revenue Code” or the “Code”). No option will be exercisable for longer than ten years after the date of grant.
The shares to be issued upon exercise of the outstanding options have been approved, reserved and are adequate to cover all exercises. As of December 31, 2020, the 2017 Plan had 873,256 shares available for future awards.
The Company has Restricted Stock Grant Agreements with the Company's non–employee directors and certain employees. Under the Restricted Stock Grant Agreements, certain shares of the Common Stock have been granted, ranging from 70 shares to 54,000 shares, to its non-employee directors and certain employees, subject to time-based vesting requirements.
The Company also has performance share (“PS”) awards, which provide the recipients the right to receive a certain number of shares of the Common Stock in the future, subject to an (1) EBITDA performance hurdle, where vesting is dependent upon the Company achieving a certain EBITDA percentage growth over the performance period, and (2) relative total shareholder return
(“TSR”) where vesting is dependent upon the Company’s TSR performance over the performance period (typically three years) relative to a comparator group consisting of the Russell 2000 index constituents.
The fair value of each option award issued under the Company’s stock plans is estimated on the date of grant using a Black-Scholes based option-pricing model that uses the assumptions noted in the following table. Expected volatilities are based on historical volatility of the Company’s stock. The expected term of the options is based on the Company’s historical experience of employees’ exercise behavior. Dividend yields are based on the Company’s historical dividend yields. Risk-free interest rates are based on the implied yields currently available on U.S. Treasury zero coupon issues with a remaining term equal to the expected life.
| | | | | | | | | | | | | | | | | | | | |
| | Year Ended December 31, |
| Weighted Average Assumptions: | | 2020 | | 2019 | | 2018 |
| Expected Volatility | | 26.9 | % | | 24.0 | % | | 26.8 | % |
| Expected Term (in years) | | 3.9 | | 4.0 | | 4.4 |
| Risk-Free Interest Rate | | 1.3 | % | | 2.5 | % | | 2.6 | % |
| Dividend Yield | | 0.5 | % | | 0.6 | % | | 0.6 | % |
The value of the restricted shares is based on the fair value of the award at the date of grant.
Performance Share expense is measured based on the fair value at the date of grant utilizing a Black-Scholes methodology to produce a Monte-Carlo simulation model which allows for the incorporation of the performance hurdles that must be met before the Performance Share vests. The assumptions used in the fair value determination were risk free interest rates of 1.4%, 2.5%, and 2.4%; dividend yields of 0.5%, 0.5%, and 0.5%; volatilities of 24%, 24%, and 27%; and initial TSR’s of 10.9%, -5.9%, and -10.5% in each case for the years ended December 31, 2020, 2019, and 2018, respectively. Expense is based on the estimated number of shares expected to vest, assuming the requisite service period is rendered and the probable outcome of the performance condition is achieved. The estimate is revised if subsequent information indicates that the actual number of shares likely to vest differs from previous estimates. Expense is ultimately adjusted based on the actual achievement of service and performance targets. The Performance Shares will cliff vest 100% at the end of the third year following the grant in accordance with the performance metrics set forth.
Compensation expense for stock options and stock awards is recognized on a straight-line basis over the vesting period, generally three years for stock options, three to four years for employee restricted stock awards, three years for employee performance share awards, and three to four years for non-employee director restricted stock awards.
A summary of stock option plan activity for 2020, 2019, and 2018 for all plans is as follows:
| | | | | | | | | | | | | | | | | | | | | | | | | | | | | | | | | | | | | | |
| | 2020 | | 2019 | | 2018 |
| | # of
Shares
(000s) | | Weighted Average
Exercise Price | | # of
Shares
(000s) | | Weighted Average
Exercise Price | | # of
Shares
(000s) | | Weighted Average
Exercise Price |
| Outstanding at beginning of year | | 951 | | | $ | 68.18 | | | 887 | | | $ | 61.59 | | | 946 | | | $ | 55.44 | |
| Granted | | 174 | | | 111.75 | | | 197 | | | 85.13 | | | 148 | | | 74.57 | |
| Exercised | | (256) | | | 55.26 | | | (112) | | | 43.67 | | | (198) | | | 41.71 | |
| Forfeited | | (11) | | | 92.94 | | | (17) | | | 80.88 | | | (6) | | | 74.90 | |
| Cancelled | | — | | | — | | | (4) | | | 70.90 | | | (3) | | | 48.54 | |
| Outstanding at end of year | | 858 | | | $ | 80.58 | | | 951 | | | $ | 68.18 | | | 887 | | | $ | 61.59 | |
| | | | | | | | | | | | |
| Exercisable at end of year | | 494 | | | $ | 69.04 | | | 581 | | | $ | 59.29 | | | 490 | | | $ | 50.50 | |
The aggregate intrinsic value for outstanding stock options was $29,735, $31,814 and $16,192 at December 31, 2020, 2019 and 2018, respectively, with a weighted average remaining contractual term of 6.7 at December 31, 2020. Exercisable stock options at December 31, 2020 had an aggregate intrinsic value of 22,805 with a weighted average remaining contractual term of 5.4.
Other information pertaining to option activity during the years ended December 31, 2020, 2019 and 2018 is as follows:
| | | | | | | | | | | | | | | | | | | | |
| | | Years Ended December 31, |
| | | 2020 | | 2019 | | 2018 |
| Weighted-average fair value of options granted | | $ | 24.36 | | | $ | 18.51 | | | $ | 18.62 | |
| Total intrinsic value of stock options exercised ($000s) | | $ | 12,698 | | | $ | 6,135 | | | $ | 10,456 | |
Additional information related to stock options outstanding under all plans at December 31, 2020 is as follows:
| | | | | | | | | | | | | | | | | | | | | | | | | | | | | | | | |
| | | | | Options Outstanding | | Options Exercisable |
Range of Exercise
Prices | | Shares
Outstanding
(000s) | | Weighted
Average
Remaining
Contractual
Term | | Weighted
Average
Exercise
Price | | Number
Exercisable
(000s) | | Weighted
Average
Exercise
Price |
$29.06 - $57.17 | | 53 | | | 2.5 | | $ | 43.01 | | | 53 | | | $ | 43.01 | |
$58.52 - $85.33 | | 488 | | | 6.5 | | 71.96 | | | 304 | | | 66.10 | |
$85.40 - $113.24 | | 317 | | | 7.7 | | 100.11 | | | 137 | | | 85.61 | |
| | | 858 | | | 6.7 | | $ | 80.58 | | | 494 | | | $ | 69.04 | |
Non-vested restricted stock activity for the years ended December 31, 2020, 2019 and 2018 is summarized below:
| | | | | | | | | | | | | | | | | | | | | | | | | | | | | | | | | | | | | | |
| | 2020 | | 2019 | | 2018 |
| | | Shares (000s) | | Weighted
Average Grant
Date Fair
Value | | Shares (000s) | | Weighted
Average Grant
Date Fair
Value | | Shares (000s) | | Weighted
Average Grant
Date Fair
Value |
| Non-vested balance at beginning of year | | 138 | | | $ | 80.03 | | | 79 | | | $ | 72.75 | | | 66 | | | $ | 65.66 | |
| Granted | | 46 | | | 110.53 | | | 73 | | | 85.69 | | | 42 | | | 77.50 | |
| Vested | | (21) | | | 67.60 | | | (8) | | | 58.52 | | | (27) | | | 62.74 | |
| Forfeited | | (4) | | | 91.91 | | | (6) | | | 84.65 | | | (2) | | | 74.57 | |
| Non-vested balance at end of year | | 159 | | | $ | 90.71 | | | 138 | | | $ | 80.03 | | | 79 | | | $ | 72.75 | |
Non-vested performance share activity for the years ended December 31, 2020, 2019 and 2018 is summarized below:
| | | | | | | | | | | | | | | | | | | | | | | | | | | | | | | | | | | | | | |
| | 2020 | | 2019 | | 2018 |
| | | Shares (000s) | | Weighted
Average Grant
Date Fair
Value | | Shares (000s) | | Weighted
Average Grant
Date Fair
Value | | Shares (000s) | | Weighted
Average Grant
Date Fair
Value |
| Non-vested balance at beginning of year | | 70 | | | $ | 81.26 | | | 53 | | | $ | 75.61 | | | 39 | | | $ | 72.62 | |
| Granted | | 20 | | | 126.46 | | | 33 | | | 81.79 | | | 32 | | | 71.27 | |
| Vested | | (8) | | | 104.15 | | | (9) | | | 65.54 | | | (15) | | | 58.78 | |
| Forfeited | | (11) | | | 82.71 | | | (7) | | | 60.85 | | | (3) | | | 72.55 | |
| Non-vested balance at end of year | | 71 | | | $ | 91.99 | | | 70 | | | $ | 81.26 | | | 53 | | | $ | 75.61 | |
As of December 31, 2020, 2019 and 2018, there was $14,154, $11,643 and $8,565, respectively, of total unrecognized compensation cost related to non-vested share-based compensation arrangements granted under the plans. As of December 31, 2020, the unrecognized compensation cost is expected to be recognized over a weighted-average period of approximately 1.4 years. We estimate that share-based compensation expense for the year ended December 31, 2021 will be approximately $10,900.
REPURCHASE OF COMMON STOCK
The Company has an approved stock repurchase program. The total authorization under this program is 3,763,038 shares. Since the inception of the program in June 1999, a total of 2,568,396 shares have been purchased, of which 76,084 shares and 203,879 shares remained in treasury at December 31, 2020, and 2019, respectively. The Company repurchases shares from employees in connection with settlement of transactions under the Company's equity incentive plans. The Company also intends to acquire shares from time to time at prevailing market prices if and to the extent it deems it is advisable to do so based on its assessment of corporate cash flow, market conditions and other factors. During 2020, 2019, and 2018, the Company purchased 136,629, 240,995, and 16,755 shares, respectively, from employees on a net-settlement basis to provide cash to employees to cover the associated employee payroll taxes and from open market purchases. These shares were purchased at an average cost of $98.54, $88.47, and $83.08 per share, respectively.
NOTE 4 - INVENTORIES
Inventories, net of reserves at December 31, 2020 and 2019 consisted of the following:
| | | | | | | | | | | | | | |
| | | 2020 | | 2019 |
| Raw materials | | $ | 24,536 | | | $ | 27,439 | |
| Work in progress | | 3,050 | | | 2,102 | |
| Finished goods | | 43,034 | | | 54,352 | |
| Total inventories | | $ | 70,620 | | | $ | 83,893 | |
On a regular basis, the Company evaluates its inventory balances for excess quantities and obsolescence by analyzing demand, inventory on hand, sales levels and other information. Based on these evaluations, inventory balances are reserved, if necessary. The reserve for inventory was $2,782 and $4,281 at December 31, 2020 and 2019, respectively.
NOTE 5 - PROPERTY, PLANT AND EQUIPMENT
Property, plant and equipment at December 31, 2020 and 2019 are summarized as follows:
| | | | | | | | | | | | | | |
| | | 2020 | | 2019 |
| Land | | $ | 12,215 | | | $ | 11,588 | |
| Building | | 86,873 | | | 79,261 | |
| Equipment | | 247,884 | | | 237,898 | |
| Construction in progress | | 31,240 | | | 14,594 | |
| | | 378,212 | | | 343,341 | |
| Less: Accumulated depreciation | | 150,116 | | | 126,482 | |
| Property, plant and equipment, net | | $ | 228,096 | | | $ | 216,859 | |
Geographic Area Data - Long-Lived Assets (excluding intangible assets):
| | | | | | | | | | | | | | |
| | | 2020 | | 2019 |
| United States | | $ | 187,719 | | | $ | 178,895 | |
| Foreign Countries | | 40,377 | | | 37,964 | |
| Total | | $ | 228,096 | | | $ | 216,859 | |
Depreciation expense was $22,990, $19,791 and $18,998 for the years ended December 31, 2020, 2019 and 2018, respectively.
NOTE 6 - INTANGIBLE ASSETS
The Company had goodwill in the amount of $529,463 and $523,998 as of December 31, 2020 and 2019, respectively, subject to the provisions of ASC 350, “Intangibles-Goodwill and Other.” The increase in goodwill is primarily due to foreign exchange translation adjustments and an adjustment related to the Zumbro acquisition, partially offset by an impairment of $1,228 related to business formerly included in the Industrial Products segment.
As of December 31, 2020 and 2019, the Company had identifiable intangible assets as follows:
| | | | | | | | | | | | | | | | | | | | | | | | | | | | | | | | |
| | | | 2020 | | 2019 |
| | | Amortization
Period
(In years) | | Gross
Carrying
Amount | | Accumulated
Amortization | | Gross
Carrying
Amount | |
Accumulated
Amortization |
| Customer relationships & lists | | 10-20 | | $ | 243,557 | | | $ | 158,051 | | | $ | 239,578 | | | $ | 139,863 | |
| Trademarks & trade names | | 2-17 | | 43,208 | | | 24,974 | | | 43,102 | | | 20,477 | |
| Developed technology | | 5-12 | | 21,674 | | | 13,693 | | | 20,206 | | | 11,008 | |
| Other | | 3-18 | | 21,624 | | | 11,685 | | | 20,962 | | | 8,576 | |
| | | | | $ | 330,063 | | | $ | 208,403 | | | $ | 323,848 | | | $ | 179,924 | |
Amortization of identifiable intangible assets was $27,811, $25,789 and $24,988 for 2020, 2019 and 2018, respectively. Assuming no change in the gross carrying value of identifiable intangible assets, the estimated amortization expense is approximately $24,392 in 2021, $22,430 in 2022, $19,501 in 2023, $10,800 in 2024, and $6,540 in 2025. At December 31, 2020 and 2019, there were no identifiable intangible assets with indefinite useful lives as defined by ASC 350, “Intangibles-Goodwill and Other.” Identifiable intangible assets are reflected in the Company’s consolidated balance sheets under Intangible assets with finite lives, net. There were no changes to the useful lives of intangible assets subject to amortization in 2020 and 2019.
The Federal Insecticide, Fungicide and Rodenticide Act, (“FIFRA”), a health and safety statute, requires that certain products within our specialty products segment must be registered with the U.S. Environmental Protection Agency (the "EPA") because they are considered pesticides. Costs of such registrations are included as other in the table above.
NOTE 7 – EQUITY-METHOD INVESTMENT
In 2013, the Company and Eastman Chemical Company (formerly Taminco Corporation) formed a joint venture (66.66% / 33.34% ownership), St. Gabriel CC Company, LLC, to design, develop, and construct an expansion of the Company’s St. Gabriel aqueous choline chloride plant. The Company contributed the St. Gabriel plant, at cost, and all continued expansion and improvements are funded by the owners. The joint venture became operational as of July 1, 2016. St. Gabriel CC Company, LLC is a Variable Interest Entity (VIE) because the total equity at risk is not sufficient to permit the joint venture to finance its own activities without additional subordinated financial support. Additionally, voting rights (2 votes each) are not proportionate to the owners’ obligation to absorb expected losses or receive the expected residual returns of the joint venture. The Company will receive up to 2/3 of the production offtake capacity and absorbs operating expenses approximately proportional to the actual percentage of offtake. The joint venture is accounted for under the equity method of accounting since the Company is not the primary beneficiary as the Company does not have the power to direct the activities of the joint venture that most significantly impact its economic performance. The Company recognized a loss of $575, $388, and $569 for the years ended December 31, 2020, 2019, and 2018, respectively, relating to its portion of the joint venture’s expenses in other expense. The carrying value of the joint venture at December 31, 2020 and 2019 is $4,971 and $4,513, respectively, and is recorded in other assets.
NOTE 8 – REVOLVING LOAN
On June 27, 2018, the Company and a bank syndicate entered into the Credit Agreement, which replaced the existing credit facility that had provided for a senior secured term loan of $350,000 and a revolving loan of $100,000. The Credit Agreement, which expires on June 27, 2023, provides for revolving loans up to $500,000 (collectively referred to as the “loans”). The loans may be used for working capital, letters of credit, and other corporate purposes and may be drawn upon at the Company’s discretion. The initial proceeds from the Credit Agreement were used to repay the outstanding balance of $210,750 on its senior secured term loan, which was due May 2019. On May 23, 2019, the Company drew down $108,569 to fund the Chemogas acquisition (see Note 2, "Significant Acquisitions and Divestitures"). In connection with these additional borrowings, the Company entered into an interest rate swap to protect against adverse fluctuations in interest rates (see Note 20, "Derivative Instruments and Hedging Activities"). On December 13, 2019, the Company drew down $45,000 to fund the Zumbro acquisition (see Note 2, "Significant Acquisitions and Divestitures"). As of December 31, 2020, the total balance outstanding on the Credit Agreement amounted to $163,569. There are no installment payments required on the revolving loans; they may be voluntarily prepaid in whole or in part without premium or penalty, and all outstanding amounts are due on the maturity date.
Amounts outstanding under the Credit Agreement are subject to an interest rate equal to a fluctuating rate as defined by the Credit Agreement plus an applicable rate. The applicable rate is based upon the Company’s consolidated net leverage ratio, as defined in the Credit Agreement, and the interest rate was 1.273% at December 31, 2020. The Company is also required to pay a
commitment fee on the unused portion of the revolving loan, which is based on the Company’s consolidated net leverage ratio as defined in the Credit Agreement and ranges from 0.15% to 0.275% (0.175% at December 31, 2020). The unused portion of the revolving loan amounted to $336,431 at December 31, 2020. The Company is also required to pay, as applicable, letter of credit fees, administrative agent fees, and other fees to the arrangers and lenders.
Costs associated with the issuance of the revolving loans are capitalized and amortized on a straight-line basis over the term of the Credit Agreement. Costs associated with the issuance of the extinguished debt instrument were capitalized and amortized over the term of the respective financing arrangement using the effective interest method. Capitalized costs net of accumulated amortization totaled $703 and $986 at December 31, 2020 and 2019, respectively, and are included in other assets on the consolidated balance sheets. Amortization expense pertaining to these costs totaled $282 for each of the years ended December 31, 2020 and 2019 and $680 for the year ended December 31, 2018, and is included in interest expense in the accompanying consolidated statements of earnings. In 2018, such interest expense included a write off $363 of deferred financing costs in connection with the extinguished debt in the second quarter of 2018.
The Credit Agreement contains quarterly covenants requiring the consolidated leverage ratio to be less than a certain maximum ratio and the consolidated interest coverage ratio to exceed a certain minimum ratio. At December 31, 2020, the Company was in compliance with these covenants. Indebtedness under the Company’s loan agreements are secured by assets of the Company.
NOTE 9 - NET EARNINGS PER COMMON SHARE
The following presents a reconciliation of the net earnings and shares used in calculating basic and diluted net earnings per common share:
| | | | | | | | | | | | | | | | | | | | |
| | Year Ended December 31, |
| | 2020 | | 2019 | | 2018 |
| Net Earnings - Basic and Diluted | | $ | 84,623 | | | $ | 79,671 | | | $ | 78,573 | |
| | | | | | |
| Share (000s) | | | | | | |
| Weighted Average Common Shares - Basic | | 32,176 | | | 32,136 | | | 32,093 | |
| Effect of Dilutive Securities – Stock Options, Restricted Stock, and Performance Shares | | 327 | | | 369 | | | 352 | |
| Weighted Average Common Shares - Diluted | | 32,503 | | | 32,505 | | | 32,445 | |
| | | | | | |
| Net Earnings Per Share - Basic | | $ | 2.63 | | | $ | 2.48 | | | $ | 2.45 | |
| Net Earnings Per Share - Diluted | | $ | 2.60 | | | $ | 2.45 | | | $ | 2.42 | |
The number of anti-dilutive shares were 204,672, 12,250, and 188,470 for 2020, 2019, and 2018. Anti-dilutive shares could potentially dilute basic earnings per share in future periods and therefore, were not included in diluted earnings per share.
The Company has some share-based payment awards that have non-forfeitable dividend rights. These awards are restricted shares and they participate on a one-for-one basis with holders of Common Stock. These awards have an immaterial impact as participating securities with regard to the calculation using the two-class method for determining earnings per share.
NOTE 10 - INCOME TAXES
The Company’s effective tax rate for 2020, 2019 and 2018 was 20.5%, 17.4%, and 20.7%, respectively. The increase from 2019 to 2020 is primarily due to a reduction in certain tax credits.
On March 27, 2020 Congress passed the Coronavirus Aid, Relief, and Economic Security Act, and on December 31, 2020 Congress passed an additional round of COVID relief legislation as part of the Bipartisan-Bicameral Omnibus COVID Relief Deal. The Company has reviewed the change in law and determined that it does not have a significant impact on the Company’s tax provision or financial statements. In addition, Balchem will continue to evaluate and analyze the impact of the U.S. Tax Cuts and Jobs Act that was enacted on December 22, 2017 and the additional guidance that has been issued, and may be issued, by the U.S. Department of Treasury, the SEC, and/or the Financial Accounting Standards Board ("FASB") regarding this act.
The Company considers the undistributed earnings of certain non-U.S. subsidiaries to be indefinitely reinvested outside of the United States on the basis of estimates that future domestic cash generation will be sufficient to meet future domestic cash needs
and the Company's specific plans for reinvestment of those subsidiary earnings. The Company projects that its foreign earnings will be utilized offshore for working capital and future foreign growth. The determination of the unrecognized deferred tax liability on those undistributed earnings is not practicable due to its legal entity structure and the complexity of U.S. and local country tax laws. If the Company decides to repatriate the undistributed foreign earnings, it will need to recognize the income tax effects in the period it changes its assertion on indefinite reinvestment.
Income tax expense consists of the following:
| | | | | | | | | | | | | | | | | | | | |
| | | 2020 | | 2019 | | 2018 |
| Current: | | | | | | |
| Federal | | $ | 19,249 | | | $ | 17,757 | | | $ | 18,296 | |
| Foreign | | 3,399 | | | 1,609 | | | 4,060 | |
| State | | 3,590 | | | 818 | | | 3,880 | |
| Deemed Repatriation | | — | | | — | | | (970) | |
| Deferred: | | | | | | |
| Federal | | (3,017) | | | (3,707) | | | (3,788) | |
| Foreign | | 167 | | | 67 | | | (69) | |
| State | | (1,594) | | | 263 | | | (952) | |
| Total income tax provision | | $ | 21,794 | | | $ | 16,807 | | | $ | 20,457 | |
The provision for income taxes differs from the amount computed by applying the Federal statutory rate of 21% for 2020, 2019, and 2018 to earnings before income tax expense due to the following:
| | | | | | | | | | | | | | | | | | | | |
| | | 2020 | | 2019 | | 2018 |
| Income tax at Federal statutory rate | | $ | 22,348 | | | $ | 20,260 | | | $ | 20,796 | |
| State income taxes, net of Federal income taxes | | 2,288 | | | (244) | | | 2,742 | |
| Stock Options | | (1,529) | | | (222) | | | (1,293) | |
| GILTI | | — | | | 2,507 | | | 1,027 | |
| FDII | | (1,400) | | | (1,922) | | | — | |
| Deemed Repatriation | | — | | | — | | | (970) | |
| Patent Box Decree (related to prior years) | | — | | | (1,948) | | | — | |
| Foreign Tax Credits | | — | | | (1,125) | | | (1,136) | |
| Other | | 87 | | | (499) | | | (709) | |
| Total income tax provision | | $ | 21,794 | | | $ | 16,807 | | | $ | 20,457 | |
The tax effects of temporary differences that give rise to significant portions of the deferred tax assets and deferred tax liabilities at December 31, 2020 and 2019 were as follows:
| | | | | | | | | | | | | | |
| | | 2020 | | 2019 |
| Deferred tax assets: | | | | |
| Inventories | | $ | 1,470 | | | $ | 1,844 | |
| Restricted stock and stock options | | 3,862 | | | 4,097 | |
| Lease liabilities | | 1,641 | | | 1,456 | |
| Currency and interest rate swap | | 2,831 | | | 442 | |
| Other | | 3,308 | | | 3,935 | |
| Total deferred tax assets | | 13,112 | | | 11,774 | |
| Deferred tax liabilities: | | | | |
| Amortization | | $ | 32,872 | | | $ | 28,589 | |
| Depreciation | | 27,897 | | | 37,075 | |
| Prepaid expenses | | 915 | | | 465 | |
| Right of use assets | | 1,926 | | | 1,461 | |
| Other | | 731 | | | 584 | |
| Total deferred tax liabilities | | 64,341 | | | 68,174 | |
| | | | |
| Valuation allowance | | 130 | | | 31 | |
| | | | |
| Net deferred tax liability | | $ | 51,359 | | | $ | 56,431 | |
In assessing the realizability of deferred tax assets, management considers whether it is more likely than not that some portion or all of the deferred tax assets will not be realized. The ultimate realization of deferred tax assets is dependent upon the generation of future taxable income during the periods in which those temporary differences become deductible. Management considers the scheduled reversal of deferred tax liabilities, projected future taxable income and tax planning strategies in making this assessment. Based upon the level of historical taxable income and projections for future taxable income over the periods in which the deferred tax assets are deductible, management believes it is more likely than not the Company will not realize the benefits of these deductible differences. The amount of deferred tax asset realizable, however, could change if management’s estimate of future taxable income should change.
As of December 31, 2020, the Company has federal and state income tax net operating loss (NOL) carryforwards of $2,367 and $1,026, respectively, The federal NOL will not expire. The state NOL carryforwards will expire between 2025 and 2034. The Company believes that the benefit from the state NOL carryforwards will be realized, therefore a valuation allowance is not required to be established on these assets. However, the Company also acquired an insignificant amount of NOL carryforwards with the acquisition of Chemogas. These NOLs are not expected to be realized and therefore a valuation allowance on these items was established.
The Company considers the undistributed earnings of certain non-U.S. subsidiaries to be indefinitely reinvested outside of the United States on the basis of estimates that future domestic cash generation will be sufficient to meet future domestic cash needs and specific plans for reinvestment of those subsidiary earnings. The Company projects that foreign earnings will be utilized offshore for working capital and future foreign growth. The determination of the unrecognized deferred tax liability on those undistributed earnings is not practicable due to the Company's legal entity structure and the complexity of U.S. and local country tax laws. If Balchem decides to repatriate the undistributed foreign earnings, the income tax effects will need to be recognized in the period the Company changes its assertion on indefinite reinvestment.
Provisions of ASC 740-10 clarify whether or not to recognize assets or liabilities for tax positions taken that may be challenged by a tax authority. A reconciliation of the beginning and ending amount of unrecognized tax benefits, which is included in other long-term obligations on the Company’s consolidated balance sheets, is as follows:
| | | | | | | | | | | | | | | | | | | | |
| | | 2020 | | 2019 | | 2018 |
| Balance at beginning of period | | $ | 4,762 | | | $ | 5,709 | | | $ | 4,781 | |
| Increases for tax positions of prior years | | 267 | | | 431 | | | 1,366 | |
| Decreases for tax positions of prior years | | (391) | | | (1,978) | | | (1,185) | |
| Increases for tax positions related to current year | | 697 | | | 600 | | | 747 | |
| Balance at end of period | | $ | 5,335 | | | $ | 4,762 | | | $ | 5,709 | |
All of Balchem's unrecognized tax benefits, if recognized in future periods, would impact the Company's effective tax rate in such future periods.
The Company recognizes both interest and penalties as part of the income tax provision. During the years ended December 31, 2020, 2019 and 2018, these amounted to approximately $232, $132 and $207, respectively. As of December 31, 2020 and 2019, accrued interest and penalties were $1,845 and $1,612, respectively.
Balchem files income tax returns in the U.S. and in various states and foreign countries. In the major jurisdictions where the Company operates, it is generally no longer subject to income tax examinations by tax authorities for years before 2016 and management does not anticipate any material change in the total amount of unrecognized tax benefits to occur within the next twelve months.
NOTE 11 - SEGMENT INFORMATION
Previously, the Company's four reportable segments were: Human Nutrition and Health, Animal Nutrition and Health, Specialty Products, and Industrial Products. However, effective in the first quarter of 2020, in order to align with the Company's strategic focus on health and nutrition, allocation of resources, and evaluation of operating performance, and given the 2019 reduction in portfolio scale of Industrial Products, the Company has revised its reporting segment structure to three reportable segments: Human Nutrition and Health, Animal Nutrition and Health, and Specialty Products. These reportable segments are strategic businesses that offer products and services to different markets. This realignment has been retrospectively applied. Sales and production of products outside of our reportable segments and other minor business activities are included in "Other and Unallocated" and applied retroactively to 2019 and 2018. There was no change to the Consolidated Financial Statements as a result of the change to the reportable segments. The Company expects that the new reportable segment structure will provide investors greater understanding of and alignment with the Company’s strategic focus. In order to ensure appropriate transparency and visibility into the financial performance of the Company, sufficient detail will continue to be provided relative to Other and Unallocated, including material contributions from oil and gas and other industrial market activities.
Human Nutrition & Health
The Human Nutrition & Health ("HNH") segment provides human grade choline nutrients and mineral amino acid chelated products through this segment for nutrition and health applications. Choline is recognized to play a key role in the development and structural integrity of brain cell membranes in infants, processing dietary fat, reproductive development and neural functions, such as memory and muscle function. The Company's mineral amino acid chelates, specialized mineral salts, and mineral complexes are used as raw materials for inclusion in premier human nutrition products. Proprietary technology has been combined to create an organic molecule in a form the body can readily assimilate. Sales growth for human nutrition applications is reliant on differentiation from lower-cost competitive products through scientific data, intellectual property and customers' appreciation of brand value. Consequently, the Company makes investments in such activities for long-term value differentiation. This segment also serves the food and beverage industry for beverage, bakery, dairy, confectionary, and savory manufacturers. The Company partners with its customers from ideation through commercialization to bring on-trend beverages, baked goods, confections, dairy and meat products to market. The Company has expertise in trends analysis and product development. When combined with its strong manufacturing capabilities in customized spray dried and emulsified powders, extrusion and agglomeration, blended lipid systems, liquid flavor delivery systems, juice and dairy bases, chocolate systems, as well as ice cream bases and variegates, the Company is a one-stop solutions provider for beverage and dairy product development needs. Additionally, this segment provides microencapsulation solutions to a variety of applications in food, pharmaceutical and nutritional ingredients to enhance performance of nutritional fortification, processing, mixing, and packaging applications and shelf-life. Major product applications are baked goods, refrigerated and frozen dough systems, processed meats, seasoning blends,
confections, sports and protein bars, dietary plans, and nutritional supplements. The Company also creates cereal systems for ready-to-eat cereals, grain-based snacks, and cereal based ingredients.
Animal Nutrition & Health
The Company’s Animal Nutrition & Health ("ANH") segment provides nutritional products derived from its microencapsulation and chelation technologies in addition to basic choline chloride. For ruminant animals, the Company’s microencapsulated products boost health and milk production, delivering nutrient supplements that are biologically available, providing required nutritional levels. The Company’s proprietary chelation technology provides enhanced nutrient absorption for various species of production and companion animals and is marketed for use in animal feed throughout the world. ANH also manufactures and supplies choline chloride, an essential nutrient for monogastric animal health, predominantly to the poultry, pet and swine industries. Choline, which is manufactured and sold in both dry and aqueous forms, plays a vital role in the metabolism of fat. In poultry, choline deficiency can result in reduced growth rates and perosis in young birds, while in swine production choline is a necessary and required component of gestating and lactating sow diets for both liver health and prevention of leg deformity.
Sales of value-added encapsulated products are highly dependent on overall industry economics as well as the Company's ability to leverage the results of university and field research on the animal health and production benefits of our products. Management believes that success in the commodity-oriented basic choline chloride marketplace is highly dependent on the Company’s ability to maintain its strong reputation for excellent product quality and customer service. The Company continues to drive production efficiencies in order to maintain its competitive-cost position to effectively compete in a competitive global marketplace.
Specialty Products
Ethylene oxide, at the 100% level and blended with carbon dioxide, is sold as a sterilant gas, primarily for use in the health care industry. It is used to sterilize a wide range of medical devices because of its versatility and effectiveness in treating hard or soft surfaces, composites, metals, tubing and different types of plastics without negatively impacting the performance of the device being sterilized. The Company’s 100% ethylene oxide product and blends are distributed worldwide in specially designed, reusable and recyclable drum and cylinder packaging, to assure compliance with safety, quality and environmental standards as outlined by the applicable regulatory agencies in the countries our products are shipped to. The Company’s inventory of these specially built drums and cylinders, along with its five filling facilities, represents a significant capital investment. Contract sterilizers and medical device manufacturers are principal customers for this product. The Company also sells single use canisters with 100% ethylene oxide for use in sterilizing re-usable devices typically processed in autoclave units in hospitals. As a fumigant, ethylene oxide blends are highly effective in killing bacteria, fungi, and insects in spices and other seasoning materials.
The Company also distributes a number of other gases for various uses, most notably propylene oxide and ammonia. Propylene oxide is marketed and sold in the U.S. as a fumigant to aid in the control of insects and microbiological spoilage; and to reduce bacterial and mold contamination in certain shell and processed nut meats, processed spices, cacao beans, cocoa powder, raisins, figs and prunes. The Company distributes its propylene oxide product in the U.S. primarily in recyclable, single-walled, carbon steel cylinders according to standards outlined by the EPA and the DOT. Propylene oxide is also sold worldwide to customers in approved reusable and recyclable drum and cylinder packaging for various chemical synthesis applications, such as increasing paint durability and manufacturing specialty starches and textile coatings. Ammonia is used primarily as a refrigerant, and also for heat treatment of metals and various chemical synthesis applications, and is distributed in reusable and recyclable drum and cylinder drum and cylinder packaging approved for use in the countries these products are shipped to. The Company's inventory of cylinders for these products also represents a significant capital investment.
The Company’s micronutrient agricultural nutrition business sells chelated minerals primarily into high value crops. The Company has a unique and patented two-step approach to solving mineral deficiency in plants to optimize health, yield and shelf-life. First, the Company determines optimal mineral balance for plant health. The Company then has a foliar applied Metalosate® product range, utilizing patented amino acid chelate technology. Its products quickly and efficiently deliver mineral nutrients. As a result, the farmer/grower gets healthier crops that are more resistant to disease and pests, larger yields and healthier food for the consumer with extended shelf life for produce being shipped long distances.
The segment information is summarized as follows:
Business Segment Assets
| | | | | | | | | | | | | | |
| | | 2020 | | 2019 |
| Human Nutrition & Health | | $ | 717,232 | | | $ | 731,963 | |
| Animal Nutrition & Health | | 157,454 | | | 144,524 | |
| Specialty Products | | 190,449 | | | 189,750 | |
Other and Unallocated (1) | | 100,708 | | | 89,445 | |
| Total | | $ | 1,165,843 | | | $ | 1,155,682 | |
Business Segment Net Sales
| | | | | | | | | | | | | | | | | | | | |
| | | 2020 | | 2019 | | 2018 |
| Human Nutrition & Health | | $ | 400,330 | | | $ | 347,433 | | | $ | 341,237 | |
| Animal Nutrition & Health | | 192,191 | | | 177,557 | | | 175,693 | |
| Specialty Products | | 103,566 | | | 92,257 | | | 75,808 | |
Other and Unallocated (2) | | 7,557 | | | 26,458 | | | 50,941 | |
| Total | | $ | 703,644 | | | $ | 643,705 | | | $ | 643,679 | |
Business Segment Earnings Before Income Taxes
| | | | | | | | | | | | | | | | | | | | |
| | 2020 | | 2019 | | 2018 |
| Human Nutrition & Health | | $ | 61,397 | | | $ | 48,429 | | | $ | 48,037 | |
| Animal Nutrition & Health | | 29,979 | | | 25,868 | | | 26,607 | |
| Specialty Products | | 26,801 | | | 28,513 | | | 25,254 | |
Other and Unallocated (2) | | (7,030) | | | (257) | | | 7,202 | |
| Interest and other expense | | (4,730) | | | (6,075) | | | (8,070) | |
| Total | | $ | 106,417 | | | $ | 96,478 | | | $ | 99,030 | |
Depreciation/Amortization
| | | | | | | | | | | | | | | | | | | | |
| | | 2020 | | 2019 | | 2018 |
| Human Nutrition & Health | | $ | 32,117 | | | $ | 30,558 | | | $ | 33,594 | |
| Animal Nutrition & Health | | 7,187 | | | 6,552 | | | 5,606 | |
| Specialty Products | | 9,699 | | | 7,401 | | | 4,092 | |
Other and Unallocated (2) | | 2,278 | | | 1,351 | | | 1,374 | |
| Total | | $ | 51,281 | | | $ | 45,862 | | | $ | 44,666 | |
| | | | | | |
Capital Expenditures
| | | | | | | | | | | | | | | | | | | | |
| | | 2020 | | 2019 | | 2018 |
| Human Nutrition & Health | | $ | 22,758 | | | $ | 18,159 | | | $ | 8,881 | |
| Animal Nutrition & Health | | 6,039 | | | 3,921 | | | 6,021 | |
| Specialty Products | | 2,860 | | | 3,003 | | | 2,356 | |
Other and Unallocated (2) | | 423 | | | 707 | | | 1,912 | |
| Total | | $ | 32,080 | | | $ | 25,790 | | | $ | 19,170 | |
| | |
(1) Other and Unallocated assets consist of certain cash, capitalized loan issuance costs, other assets, investments, and income taxes, which the Company does not allocate to its individual business segments. It also includes assets associated with a few minor businesses which individually do not meet the quantitative thresholds for separate presentation. |
(2) Other and Unallocated consists of a few minor businesses which individually do not meet the quantitative thresholds for separate presentation and corporate expenses that have not been allocated to a segment. Unallocated corporate expenses consist of: (i) Transaction and integration costs, ERP implementation costs, and unallocated legal fees totaling $2,410, $3,436 and $1,786 for years ended December 31, 2020, 2019 and 2018, respectively, and (ii) Unallocated amortization expense of $1,888, $833, and $680 for years ended December 31, 2020, 2019, and 2018, respectively, related to an intangible asset in connection with a company-wide ERP system implementation and capitalized loan issuance costs that was included in interest expense in Company's consolidated statement of earnings. |
NOTE 12 - REVENUE
Revenue Recognition
Revenues are recognized when control of the promised goods is transferred to customers, in an amount that reflects the consideration we expect to realize in exchange for those goods.
The following table presents revenues disaggregated by revenue source. Sales and usage-based taxes are excluded from revenues.
| | | | | | | | | | | | | | | | | | | | |
| | | 2020 | | 2019 | | 2018 |
| Product Sales | | $ | 666,193 | | | $ | 609,741 | | | $ | 607,879 | |
| Co-manufacturing | | 29,063 | | | 24,087 | | | 24,259 | |
| Bill and Hold | | 1,158 | | | 3,218 | | | 4,612 | |
| Consignment | | 2,939 | | | 2,299 | | | 2,442 | |
| Product Sales Revenue | | 699,353 | | | 639,345 | | | 639,192 | |
| Royalty Revenue | | 4,291 | | | 4,360 | | | 4,487 | |
| Total Revenue | | $ | 703,644 | | | $ | 643,705 | | | $ | 643,679 | |
The following table presents revenues disaggregated by geography, based on the billing addresses of customers:
| | | | | | | | | | | | | | | | | | | | |
| | | 2020 | | 2019 | | 2018 |
| United States | | $ | 516,347 | | | $ | 475,033 | | | $ | 482,691 | |
| Foreign Countries | | 187,297 | | | 168,672 | | | 160,988 | |
| Total | | $ | 703,644 | | | $ | 643,705 | | | $ | 643,679 | |
Product Sales Revenues
The Company’s primary operation is the manufacturing and sale of health and wellness ingredient products, in which the Company receives an order from a customer and fulfills that order. The Company’s product sales are considered point-in-time revenue and consist of four sub-streams: product sales, co-manufacturing, bill and hold, and consignment.
Under the co-manufacturing agreements, the Company is responsible for the manufacture of a finished good where the customer provides the majority of the raw materials. The Company controls the manufacturing process and the ultimate end-product before it is shipped to the customer. Based on these factors, the Company has determined that it is the principal in these agreements and therefore revenue is recognized in the gross amount of consideration the Company expects to be entitled for the goods provided.
Royalty Revenues
Royalty revenue consists of agreements with customers to use the Company’s intellectual property in exchange for a sales-based royalty. Royalties are considered over time revenue and are recorded in the HNH segment.
Contract Liabilities
The Company records contract liabilities when cash payments are received or due in advance of performance, including amounts which are refundable.
The Company’s payment terms vary by the type and location of customers and the products offered. The term between invoicing and when payment is due is not significant. For certain products or services and customer types, the Company requires payment before the products are delivered to the customer.
Practical Expedients and Exemptions
The Company generally expenses sales commissions when incurred because the amortization period would have been one year or less. These costs are recorded within selling and marketing expenses.
The Company does not disclose the value of unsatisfied performance obligations for (i) contracts with an original expected length of one year or less and (ii) contracts for which the Company recognizes revenue at the amount to which it has the right to invoice for products shipped.
NOTE 13 - SUPPLEMENTAL CASH FLOW INFORMATION
Cash paid during the year for:
| | | | | | | | | | | | | | | | | | | | |
| | 2020 | | 2019 | | 2018 |
| Income taxes | | $ | 22,637 | | | $ | 21,771 | | | $ | 20,593 | |
| Interest | | $ | 4,666 | | | $ | 5,674 | | | $ | 6,940 | |
Non-cash financing activities:
| | | | | | | | | | | | | | | | | | | | |
| | | 2020 | | 2019 | | 2018 |
| Dividends payable | | $ | 18,941 | | | $ | 16,855 | | | $ | 15,220 | |
NOTE 14 – ACCUMULATED OTHER COMPREHENSIVE INCOME
The changes in accumulated other comprehensive income (loss) were as follows:
| | | | | | | | | | | | | | | | | | | | |
| | | Years Ended December 31, |
| | | 2020 | | 2019 | | 2018 |
| Net foreign currency translation adjustment | | $ | 12,829 | | | $ | (891) | | | $ | (2,982) | |
| | | | | | |
| Net change of cash flow hedge (see Note 20 for further information) | | | | | | |
| Unrealized loss on cash flow hedge | | (3,094) | | | (1,771) | | | — | |
| Tax | | 809 | | | 372 | | | — | |
| Net of tax | | (2,285) | | | (1,399) | | | — | |
| | | | | | |
| Net change in postretirement benefit plan (see Note 15 for further information) | | | | | | |
| Prior service (credit)/cost and (gain)/loss arising during the period | | (503) | | | 199 | | | 522 | |
| Amortization of prior service credit/(cost) | | 74 | | | 74 | | | 74 | |
| Amortization of gain/(loss) | | (50) | | | (46) | | | (8) | |
| Total before tax | | (479) | | | 227 | | | 588 | |
| Tax | | 127 | | | 101 | | | 434 | |
Adjustment (1) | | (455) | | | — | | | — | |
| Net of tax | | (807) | | | 328 | | | 1,022 | |
| | | | | | |
| Total other comprehensive income/(loss) | | $ | 9,737 | | | $ | (1,962) | | | $ | (1,960) | |
(1) One-time adjustment to the postretirement account.
Included in "Net foreign currency translation adjustment" were $4,882 and $262 of losses related to a net investment hedge, net of taxes of $1,579 and $70 for the years ended December 31, 2020 and 2019, respectively. There were no hedging activities during the year ended December 31, 2018. See Note 20, "Derivative Instruments and Hedging Activities."
Accumulated other comprehensive income/(loss) at December 31, 2020 consisted of the following:
| | | | | | | | | | | | | | | | | | | | | | | | | | |
| | | Foreign currency
translation
adjustment | | Cash flow hedge | | Postretirement benefit plan | | Total |
| Balance December 31, 2019 | | $ | (5,176) | | | $ | (1,399) | | | $ | 1,011 | | | (5,564) | |
| Other comprehensive gain/(loss) | | 12,829 | | | (2,285) | | | (807) | | | 9,737 | |
| Balance December 31, 2020 | | $ | 7,653 | | | $ | (3,684) | | | $ | 204 | | | 4,173 | |
NOTE 15 - EMPLOYEE BENEFIT PLANS
Defined Contribution Plans
During 2020, the Company sponsored two 401(k) savings plans for eligible employees. The plans allow participants to make pretax contributions and the Company matches certain percentages of those pretax contributions. One of the plans has a discretionary profit sharing portion and matches 401(k) contributions with shares of the Company’s Common Stock. All amounts contributed to the plans are deposited into a trust fund administered by independent trustees. The Company provided for profit sharing contributions and matching 401(k) savings plan contributions of $1,022 and $3,751 in 2020, $592 and $3,451 in 2019, and $825 and $3,153 in 2018, respectively.
Postretirement Medical Plans
The Company provides postretirement benefits in the form of two unfunded postretirement medical plans; one that is under a collective bargaining agreement and covers eligible retired employees of the Verona, Missouri facility and a plan for those named as executive officers in the Company’s proxy statement. The Company uses a December 31 measurement date for its postretirement medical plans. In accordance with ASC 715, “Compensation—Retirement Benefits,” the Company is required to recognize the over funded or underfunded status of a defined benefit post retirement plan (other than a multiemployer plan) as an asset or liability in its statement of financial position, and to recognize changes in that funded status in the year in which the changes occur through comprehensive income.
The actuarial recorded liabilities for such unfunded postretirement benefits are as follows:
Change in benefit obligation:
| | | | | | | | | | | | | | |
| | | 2020 | | 2019 |
| Benefit obligation at beginning of year | | $ | 1,076 | | | $ | 1,174 | |
| Initial adoption of new plan | | — | | | — | |
| Service cost with interest to end of year | | 68 | | | 63 | |
| Interest cost | | 26 | | | 39 | |
| Participant contributions | | 23 | | | 35 | |
| Benefits paid | | (27) | | | (162) | |
| Actuarial gain | | 208 | | | (73) | |
| Benefit obligation at end of year | | $ | 1,374 | | | $ | 1,076 | |
Change in plan assets:
| | | | | | | | | | | | | | |
| | | 2020 | | 2019 |
| Fair value of plan assets at beginning of year | | $ | — | | | $ | — | |
| Employer (reimbursement)/contributions | | 4 | | | 127 | |
| Participant contributions | | 23 | | | 35 | |
| Benefits paid | | (27) | | | (162) | |
| Fair value of plan assets at end of year | | $ | — | | | $ | — | |
Amounts recognized in consolidated balance sheet:
| | | | | | | | | | | | | | |
| | | 2020 | | 2019 |
| Accumulated postretirement benefit obligation | | $ | (1,374) | | | $ | (1,076) | |
| Fair value of plan assets | | — | | | — | |
| Funded status | | (1,374) | | | (1,076) | |
| Unrecognized prior service cost | | N/A | | N/A |
| Unrecognized net (gain)/loss | | N/A | | N/A |
| Net amount recognized in consolidated balance sheet (after ASC 715) (included in other long-term obligations) | | $ | 1,374 | | | $ | 1,076 | |
| Accrued postretirement benefit cost (included in other long-term obligations) | | N/A | | N/A |
Components of net periodic benefit cost:
| | | | | | | | | | | | | | | | | | | | |
| | | 2020 | | 2019 | | 2018 |
| Service cost with interest to end of year | | $ | 68 | | | $ | 63 | | | $ | 78 | |
| Interest cost | | 26 | | | 39 | | | 44 | |
| Amortization of prior service credit | | 74 | | | 74 | | | 74 | |
| Amortization of gain | | (50) | | | (46) | | | (8) | |
| Total net periodic benefit cost | | $ | 118 | | | $ | 130 | | | $ | 188 | |
Estimated future employer contributions and benefit payments are as follows:
| | | | | | | | |
| Year | | |
| 2021 | | $ | 99 | |
| 2022 | | 98 | |
| 2023 | | 81 | |
| 2024 | | 100 | |
| 2025 | | 93 | |
| Years 2026-2030 | | 495 | |
Defined Benefit Pension Plans
The Company contributes to one multiemployer defined benefit plan under the terms of a collective-bargaining agreement covering its union-represented employees of the Verona, Missouri facility. The risks of participation in this multiemployer plan are different from single-employer plans in the following aspects: (a) assets contributed to the multiemployer plan by one employer may be used to provide benefits to employees of other participating employers, (b) if a participating employer stops contributing to the plan, the unfunded obligations of the plan may be borne by the remaining participating employers, and (c) if the Company was to stop participating in its multiemployer plan, the Company would be required to pay that plan an amount based on the underfunded status of the plan, referred to as the withdrawal liability.
The Company’s participation in this plan for the annual period ended December 31, 2020 is outlined in the table below. The “EIN/Pension Plan Number” column provides the Employee Identification Number (EIN). The zone status is based on information that the Company received from the plan and is certified by the plan’s actuary. Among other factors, plans in the red zone or critical and declining zone are generally less than 65 percent funded, plans in the yellow zone are less than 80 percent funded, and plans in the green zone are at least 80 percent funded. The “FIP/RP Status Pending/Implemented” column indicates plans for which a financial improvement plan (FIP) or a rehabilitation plan (RP) is either pending or has been implemented. The last column lists the expiration date of the collective-bargaining agreement to which the plan is subject. Finally, the period-to-period comparability of the contributions for 2020 and 2019 was affected by a 4.0% increase in the 2020 contribution rate. There have been no other significant changes that affect the comparability of 2020 and 2019 contributions. The Company does not represent more than 5% of the contributions to this pension fund.
| | | | | | | | | | | | | | | | | | | | | | | | | | | | | | | | | | | | | | | | | | | | | | | | | | | | | | | | |
Pension
Fund | | EIN/Pension
Plan
Number | | Pension Plan Protection Act Zone Status | | FIP/RP Status
Pending/ Implemented | | Contributions of Balchem Corporation | | Surcharge
Imposed | | Expiration Date of Collective-
Bargaining
Agreement |
| 2020 | | 2019 | | | 2020 | | 2019 | | 2018 | |
Central States,
Southeast and
Southwest Areas
Pension Fund | | 36-6044243 | | Critical & Declining as of 1/1/20 | | Critical & Declining as of 1/1/19 | | Implemented | | $774 | | $676 | | $614 | | No | | 7/12/2025 |
On May 27, 2019, the Company acquired Chemogas, which has an unfunded defined benefit pension plan. The plan provides for the payment of a lump sum at retirement or payments in case of death of the covered employees. The amount recorded for these obligations on the Company's balance sheet as of December 31, 2020 and 2019 was $950 and $596, respectively, and was included in other long-term obligations.
The actuarial recorded liabilities for such unfunded defined benefit pension plan are as follows:
Change in benefit obligation:
| | | | | | | | | | | | | | |
| | | 2020 | | 2019 |
| Benefit obligation at beginning of year | | $ | 1,738 | | | $ | — | |
| Acquisitions | | — | | | 1,738 | |
| Service cost with interest to end of year | | 104 | | | — | |
| Interest cost | | 20 | | | — | |
| Participant contributions | | 21 | | | — | |
| Benefits paid | | (11) | | | — | |
| Actuarial gain | | 18 | | | — | |
| Exchange rate changes | | 163 | | | — | |
| Benefit obligation at end of year | | $ | 2,053 | | | $ | 1,738 | |
Change in plan assets:
| | | | | | | | | | | | | | |
| | | 2020 | | 2019 |
| Fair value of plan assets at beginning of year | | $ | 895 | | | $ | — | |
| Acquisitions | | — | | | 895 | |
| Actual return on plan assets | | 57 | | | — | |
| Employer (reimbursement)/contributions | | 57 | | | — | |
| Participant contributions | | 21 | | | — | |
| Benefits paid | | (11) | | | — | |
| Exchange rate changes | | 84 | | | — | |
| Fair value of plan assets at end of year | | $ | 1,103 | | | $ | 895 | |
Amounts recognized in consolidated balance sheet:
| | | | | | | | | | | | | | |
| | | 2020 | | 2019 |
| Benefit obligation | | $ | (2,053) | | | $ | (1,738) | |
| Fair value of plan assets | | 1,103 | | | 895 | |
| Funded status | | (950) | | | (843) | |
| Unrecognized prior service cost | | N/A | | N/A |
| Unrecognized net (gain)/loss | | N/A | | 247 | |
| Net amount recognized in consolidated balance sheet (after ASC 715) (included in other long-term obligations) | | $ | 950 | | | $ | 596 | |
| Accrued postretirement benefit cost (included in other long-term obligations) | | N/A | | N/A |
Components of net periodic benefit cost:
| | | | | | | | | | | | | | |
| | | 2020 | | 2019 |
| Service cost with interest to end of year | | $ | 104 | | | $ | — | |
| Interest cost | | 20 | | | — | |
| Expected return on plan assets | | (14) | | | — | |
| Amortization of prior service credit | | — | | | — | |
| Amortization of gain | | — | | | — | |
| Total net periodic benefit cost | | $ | 110 | | | $ | — | |
Estimated employer contributions to the plan in 2021 are $59.
Estimated future benefit payments are as follows:
| | | | | | | | |
| Year | | |
| 2021 | | $ | 2 | |
| 2022 | | — | |
| 2023 | | — | |
| 2024 | | — | |
| 2025 | | — | |
| Years 2026-2030 | | 25 | |
Assumptions to determine benefit obligations:
| | | | | | | | | | | | | | |
| | | 2020 | | 2019 |
| Discount rate | | 0.75 | % | | 1.00 | % |
Assumptions to determine net cost:
| | | | | | | | | | | | | | |
| | | 2020 | | 2019 |
| Discount rate | | 1.00 | % | | N/A |
| Expected return on assets | | 1.00 | % | | N/A |
Deferred Compensation Plan
On June 1, 2018, the Company established an unfunded, non-qualified deferred compensation plan maintained for the benefit of a select group of management or highly compensated employees. Assets of the plan are held in a rabbi trust, which are subject to additional risk of loss in the event of bankruptcy or insolvency of the Company. The deferred compensation liability as of December 31, 2020 and 2019 was $3,581 and $1,982, respectively, and was included in other long-term obligations on the Company's balance sheet.
NOTE 16 - COMMITMENTS AND CONTINGENCIES
Aggregate future minimum rental payments required under non-cancelable operating leases at December 31, 2020 are as follows:
| | | | | | | | |
| Year | | |
| 2021 | | $ | 3,258 | |
| 2022 | | 2,323 | |
| 2023 | | 1,797 | |
| 2024 | | 1,002 | |
| 2025 | | 539 | |
| Thereafter | | 2,683 | |
| Total minimum lease payments | | $ | 11,602 | |
The Company’s Verona, Missouri facility, while held by a prior owner, was designated by the EPA as a Superfund site and placed on the National Priorities List in 1983, because of dioxin contamination on portions of the site. Remediation was conducted by the
prior owner under the oversight of the EPA and the Missouri Department of Natural Resources. While the Company must maintain the integrity of the capped areas in the remediation areas on the site, the prior owner is responsible for completion of any further Superfund remedy. The Company is indemnified by the sellers under its May 2001 asset purchase agreement covering its acquisition of the Verona, Missouri facility for potential liabilities associated with the Superfund site. In September 2020, BCP Ingredients, Inc. "(BCP"), the Company subsidiary that operates the site received a General Notice Letter from the EPA regarding BCP's potential liability for 1,4 dioxane contamination at the site. BCP currently believes that the 1,4 dioxane contamination is associated with the former owner’s operations and has engaged experts to study site conditions and hydrogeology in connection with preparing its response to the notice.
From time to time, the Company is a party to various litigation, claims and assessments. Management believes that the ultimate outcome of such matters will not have a material effect on the Company’s consolidated financial position, results of operations, or liquidity.
NOTE 17 – FAIR VALUE OF FINANCIAL INSTRUMENTS
The Company has a number of financial instruments, none of which are held for trading purposes. The Company estimates that the fair value of all financial instruments at December 31, 2020 and 2019 does not differ materially from the aggregate carrying values of its financial instruments recorded in the accompanying consolidated balance sheets. The estimated fair value amounts have been determined by the Company using available market information and appropriate valuation methodologies. Considerable judgment is necessarily required in interpreting market data to develop the estimates of fair value, and, accordingly, the estimates are not necessarily indicative of the amounts that the Company could realize in a current market exchange. The carrying value of debt approximates fair value as the interest rate is based on market and the Company’s consolidated leverage ratio. The Company’s financial instruments also include cash equivalents, accounts receivable, accounts payable, and accrued liabilities, which are carried at cost and approximate fair value due to the short-term maturity of these instruments. Cash and cash equivalents at December 31, 2020 and 2019 included $817 and $808 in money market funds, respectively.
Non-current assets at December 31, 2020 and December 31, 2019 included $3,582 and $1,982, respectively, of rabbi trust funds related to the Company's deferred compensation plan. The money market and rabbi trust funds are valued using level one inputs, as defined by ASC 820, “Fair Value Measurement.”
The Company also has derivative financial instruments, consisting of a cross-currency swap and an interest rate swap, which are included in derivative assets or derivative liabilities, in the consolidated balance sheets (see Note 20, "Derivative Instruments and Hedging Activities"). The fair values of these derivative instruments are determined based on Level 2 inputs, using significant inputs that are observable either directly or indirectly, including interest rate curves and implied volatilities. The derivative liability related to the cross-currency swap was $6,793 and $332 at December 31, 2020 and December 31, 2019, respectively. The derivative liability related to the interest rate swap was $4,865 and $1,771 at December 31, 2020 and December 31, 2019, respectively.
NOTE 18 – RELATED PARTY TRANSACTIONS
The Company provides services on a contractual agreement to St. Gabriel CC Company, LLC. These services include accounting, information technology, quality control, and purchasing services, as well as operation of the St. Gabriel CC Company, LLC plant. The Company also sells raw materials to St. Gabriel CC Company, LLC. These raw materials are used in the production of finished goods that are, in turn, sold by Saint Gabriel CC Company, LLC to the Company for resale to unrelated parties. As such, the sale of these raw materials to St. Gabriel CC Company, LLC in this scenario lacks economic substance and therefore the Company does not include them in net sales within the consolidated statements of earnings.
The services the Company provided amounted to $3,396, $3,883, and $3,694, respectively, for the years ended December 31, 2020, 2019, and 2018. The raw materials purchased and subsequently sold amounted to $13,495, $24,786, and $31,107, respectively, for the years ended December 31, 2020, 2019, and 2018. These services and raw materials are primarily recorded in cost of goods sold net of the finished goods received from St. Gabriel CC Company, LLC of $12,190, $18,598, and $22,540, respectively for the years ended December 31, 2020, 2019, and 2018. At December 31, 2020 and 2019, the Company had receivables of $2,809 and $4,840, respectively, recorded in accounts receivable from St. Gabriel CC Company, LLC for services rendered and raw materials sold and payables of $2,239 and $3,230, respectively, for finished goods received recorded in accounts payable in 2020 and accrued expenses in 2019. In addition, the Company had receivables in the amount of $72, related to non-contractual monies owed from St. Gabriel CC Company, LLC, recorded in receivables as of December 31, 2020. There was no such receivable as of December 31, 2019. The Company had payables in the amount of $296 and $366 related to non-
contractual monies owed to St. Gabriel CC Company, LLC, recorded in accounts payable as of December 31, 2020 and accrued expenses as of December 31, 2019.
NOTE 19 – LEASES
The Company has both real estate leases and equipment leases. The main types of equipment leases include forklifts, trailers, printers and copiers, railcars, and trucks. Leases are categorized as both operating leases and finance leases. As a result of electing the practical expedient within ASU 2016-02, variable lease payments are combined and recognized on the balance sheet in the event that those charges and any related increases are explicitly stated in the lease. Such payments include common area maintenance charges, property taxes, and insurance charges and are recorded in the ROU asset and corresponding liability when the payments are stated in the lease with (a) fixed or in-substance fixed amounts, or (b) a variable payment based on an index or rate. Due to the acquisitive nature of the Company and the potential for synergies upon integration of acquired entities, the Company determined that the reasonably certain criterion could not be met for any renewal periods beginning two years from December 31, 2020. In addition, the Company has historically not been exercising purchase options with equipment leases as it does not make economic sense to buy the equipment. Instead, the Company has historically replaced the equipment with a new lease. Therefore, the Company determined that the reasonably certain criterion could not be met as it relates to purchase options. The Company has no residual value guarantees in lease transactions.
The Company did not identify any embedded leases. As indicated above, the Company elected the practical expedient to combine lease and non-lease components and recognizes the combined amount on the consolidated balance sheet. Management determined that since the Company has a centralized treasury function, the parent company would either fund or guarantee a subsidiary's loan for borrowing over a similar term. As such, the Company's management determined it is appropriate to utilize a corporate based borrowing rate for all locations. The Company developed four tranches of leases based on lease terms and these tranches reflect the composition of the current lease portfolio. The Company's borrowing history shows that interest rates of a term loan or a line of credit depend on the duration of the loan rather than the nature of the assets purchased by those funds. Based on this understanding, the Company elected to use a portfolio approach to discount rates, applying corporate rates to the tranches of leases based on lease terms. Based on the Company's risk rating, the company applied the following discount rates for new leases entered into during 2020: (1) 1-2 years, 3.45% (2) 3-4 years, 4.04% (3) 5-9 years, 4.38% and (4) 10+ years, 5.10%.
In connection with the acquisition of Zumbro, the Company assumed a finance lease commitment for a warehouse, with an expiration date of March 31, 2033. The warehouse can be purchased at a pre-determined price beginning in 2023. At December 31, 2020, the Company had a finance lease liability of $2,631, which was recorded under lease liabilities (current and non-current) in the consolidated balance sheet.
Right of use assets and lease liabilities at December 31, 2020 and 2019 are summarized as follows:
| | | | | | | | | | | | | | |
| Right of use assets | | 2020 | | 2019 |
| Operating leases | | $ | 5,838 | | | $ | 7,338 | |
| Finance leases | | 2,572 | | | — | |
| Total | | $ | 8,410 | | | $ | 7,338 | |
| | | | | | | | | | | | | | |
| Lease liabilities - current | | 2020 | | 2019 |
| Operating leases | | $ | 2,178 | | | $ | 2,475 | |
| Finance leases | | 159 | | | — | |
| Total | | $ | 2,337 | | | $ | 2,475 | |
| | | | | | | | | | | | | | |
| Lease liabilities - non-current | | 2020 | | 2019 |
| Operating leases | | $ | 3,607 | | | $ | 4,827 | |
| Finance leases | | 2,472 | | | — | |
| Total | | $ | 6,079 | | | $ | 4,827 | |
For the year ended December 31, 2020 and 2019, the Company's total lease costs were as follows, which included both amounts recognized in profits or losses during the period and amounts capitalized on the balance sheet, and the cash flows arising from lease transactions:
| | | | | | | | | | | | | | |
| | Year ended December 31 |
| | 2020 | | 2019 |
| Lease Cost | | | | |
| Operating lease cost | | $ | 3,105 | | | $ | 3,181 | |
| | | | |
| Finance Lease cost | | | | |
| Amortization of ROU asset | | 210 | | | — | |
| Interest on lease liabilities | | 137 | | | — | |
| Total finance lease | | 347 | | | — | |
| | | | |
| Total lease cost | | $ | 3,452 | | | $ | 3,181 | |
| | | | |
| Cash paid for amounts included in the measurement of lease liabilities | | | | |
| Operating cash flows from operating leases | | $ | 2,864 | | | $ | 3,216 | |
| Operating cash flows from finance leases | | 137 | | | — | |
| Financing cash flows from finance leases | | 151 | | | — | |
| | $ | 3,152 | | | $ | 3,216 | |
| | | | |
| ROU assets obtained in exchange for new operating lease liabilities, net of ROU asset disposals | | $ | 1,042 | | | $ | 10,173 | |
| ROU assets obtained in exchange for new finance lease liabilities, net of ROU asset disposals | | $ | 2,782 | | | $ | — | |
| | | | |
| Weighted-average remaining lease term - operating leases | | 4.15 years | | 4.93 years |
| Weighted-average remaining lease term - finance leases | | 12.25 years | | n/a |
| | | | |
| Weighted-average discount rate - operating leases | | 4.5 | % | | 4.6 | % |
| Weighted-average discount rate - finance leases | | 5.1 | % | | n/a |
Rent expense charged to operations under operating lease agreements for 2020, 2019, and 2018 aggregated approximately $3,105, $3,181, and $3,917, respectively.
NOTE 20 – DERIVATIVE INSTRUMENTS AND HEDGING ACTIVITIES
The Company is exposed to market fluctuations in interest rates as well as variability in foreign exchange rates. In May 2019, the Company entered into an interest rate swap (cash flow hedge) with the Swap Counterparty and a cross-currency swap (net investment hedge) with the Bank Counterparty. The Company's primary objective for holding derivative financial instruments is to manage interest rate risk and foreign currency risk.
On May 28, 2019, the Company entered into a pay-fixed (2.05%), receive-floating interest rate swap with a notional amount of $108,569 and a maturity date of June 27, 2023. The Company's risk management objective and strategy with respect to the interest rate swap is to protect the Company against adverse fluctuations in interest rates by reducing its exposure to variability in cash flows relating to interest payments on a portion of its outstanding debt. The Company is meeting its objective since changes in the cash flows of the interest rate swap are expected to exactly offset the changes in the cash flows attributable to fluctuations in the contractually specified interest rate on the interest payments associated with the Credit Agreement. The net interest expense related to the interest rate swap contract was $1,593 for the year ended December 31, 2020 and the net interest income
related to the interest rate swap contract was $40 for the year ended December 31, 2019. These amounts were recorded in the condensed consolidated statements of operations under interest expense, net.
At the same time, the Company also entered into a pay-fixed (0.00%), receive-fixed (2.05%) cross-currency swap to manage foreign exchange risk related to the Company's net investment in Chemogas. The derivative has a notional amount of $108,569, an effective date of May 28, 2019, and a maturity date of June 27, 2023. The interest income related to the cross-currency swap contract was $2,275 and $1,317 for the years ended December 31, 2020 and 2019, respectively, which were recorded in the condensed consolidated statements of operations under interest expense, net.
The derivative instruments are with a single counterparty and are subject to a contractual agreement that provides for the net settlement of all contracts through a single payment in a single currency in the event of default on or termination of any one contract. As such, the derivative instruments are categorized as a master netting arrangement and presented as a net derivative asset or derivative liability on the consolidated balance sheets.
As of December 31, 2020 and 2019, the fair value of the derivative instruments is presented as follows in the Company's condensed consolidated balance sheets:
| | | | | | | | | | | | | | |
| Derivative liabilities | | 2020 | | 2019 |
| Interest rate swap | | $ | 4,865 | | | $ | 1,771 | |
| Cross-currency swap | | 6,793 | | | 332 | |
| Derivative liabilities | | $ | 11,658 | | | $ | 2,103 | |
On a quarterly basis, the Company assesses whether the hedging relationship related to the interest rate swap is highly effective at achieving offsetting changes in cash flow attributable to the risk being hedged based on the following factors: (1) the key features and terms as enumerated above for the interest rate swap and hedged transactions match during the period (2) it is probable that the Swap Counterparty will not default on its obligations under the swap, and (3) the Company performs a qualitative review each quarter to assess whether the relationship qualifies for hedge accounting.
In addition, on a quarterly basis the Company assesses whether the hedging relationship related to the cross-currency swap is highly effective based on the following evaluations: (1) the Company will always have a sufficient amount of non-functional currency (EUR) net investment balance to at least meet the cross-currency notional amount until the maturity date of the hedge (2) it is probable that the Swap Counterparty will not default on its obligations under the swap, and (3) the Company performs a qualitative review each quarter to assess whether the relationship qualifies for hedge accounting.
If any mismatches arise for either the interest rate swap or cross-currency swap, the Company will perform a regression analysis to determine if the hedged transaction is highly effective. If determined not to be highly effective, the Company will discontinue hedge accounting.
As of December 31, 2020, the Company assessed the hedging relationships for the interest rate swap and cross-currency swap and determined them to be highly effective. As such, the net change in fair values of the derivative instruments was recorded in accumulated other comprehensive income.
Losses and gains on our hedging instruments are recognized in accumulated other comprehensive income (loss) and categorized as follows for the year ended December 31, 2020 and 2019:
| | | | | | | | | | | | | | | | | | | | |
| | Location within Statements of Comprehensive Income | | Year ended December 31 |
| | | 2020 | | 2019 |
| Cash flow hedge (interest rate swap), net of tax | | Unrealized (loss) on cash flow hedge, net | | $ | (2,285) | | | $ | (1,399) | |
| Net investment hedge (cross-currency swap), net of tax | | Net foreign currency translation adjustment | | (4,882) | | | (262) | |
| | | | $ | (7,167) | | | $ | (1,661) | |
NOTE 21 - QUARTERLY FINANCIAL INFORMATION (UNAUDITED)
(In thousands, except per share data)
| | | | | | | | | | | | | | | | | | | | | | | | | | | | | | | | | | | | | | | | | | | | | | | | | | |
| | | 2020 | | 2019 |
| | | First
Quarter | | Second
Quarter | | Third
Quarter | | Fourth
Quarter | | First
Quarter | | Second
Quarter | | Third
Quarter | | Fourth
Quarter |
| Net sales | | $ | 174,436 | | | $ | 173,355 | | | $ | 175,140 | | | $ | 180,713 | | | $ | 157,029 | | | $ | 161,554 | | | $ | 158,595 | | | $ | 166,527 | |
| Gross margin | | 55,331 | | | 55,380 | | | 56,368 | | | 56,818 | | | 49,095 | | | 53,918 | | | 54,008 | | | 54,346 | |
| Earnings before income taxes | | 24,490 | | | 25,973 | | | 27,907 | | | 28,047 | | | 24,793 | | | 24,881 | | | 24,436 | | | 22,368 | |
| Net earnings | | 19,768 | | | 21,125 | | | 21,568 | | | 22,162 | | | 18,783 | | | 19,829 | | | 20,676 | | | 20,383 | |
| Basic net earnings per common share | | $ | .62 | | | $ | .66 | | | $ | .67 | | | $ | .69 | | | $ | .58 | | | $ | .62 | | | $ | .64 | | | $ | .64 | |
| Diluted net earnings per common share | | $ | .61 | | | $ | .65 | | | $ | .66 | | | $ | .68 | | | $ | .58 | | | $ | .61 | | | $ | .64 | | | $ | .63 | |
BALCHEM CORPORATION
Valuation and Qualifying Accounts
Years Ended December 31, 2020, 2019 and 2018
(In thousands)
| | | | | | | | | | | | | | |
| | Allowance
for Doubtful Accounts | | Inventory
Reserve |
| Balance - December 31, 2017 | | $ | 431 | | | $ | 2,315 | |
| Additions charged (credited) to costs and expenses | | 43 | | | 898 | |
Adjustments/deductions (a) | | 136 | | | (638) | |
| | | | |
| Balance - December 31, 2018 | | 610 | | | 2,575 | |
| Additions charged (credited) to costs and expenses | | 1,776 | | | 7,069 | |
Adjustments/deductions (a) | | (306) | | | (5,363) | |
| | | | |
| Balance - December 31, 2019 | | 2,080 | | | 4,281 | |
| Additions charged (credited) to costs and expenses | | 140 | | | 5,964 | |
Adjustments/deductions (a) | | (128) | | | (7,463) | |
| | | | |
| Balance - December 31, 2020 | | $ | 2,092 | | | $ | 2,782 | |
| | | | |
(a) Represents write-offs and other adjustments |
| | | | |
| | | | |
| | | | |
| | | | |
| | | | |
| | | | |
| | | | |
| | | | |
| | | | |
Item 9. Changes in and Disagreements with Accountants on Accounting and Financial Disclosure
None.
Item 9A. Controls and Procedures
Disclosure Controls and Procedures
We maintain “disclosure controls and procedures,” as such term is defined in Rules 13a-15(e) and 15d-15(e) under the Securities Exchange Act of 1934 (the “Exchange Act”), that are designed to ensure that information required to be disclosed by us in reports that we file or submit under the Exchange Act is recorded, processed, summarized, and reported within the time periods specified in SEC rules and forms, and that such information is accumulated and communicated to our management, including our Chief Executive Officer and Chief Financial Officer, as appropriate, to allow timely decisions regarding required disclosure. In designing and evaluating our disclosure controls and procedures, management recognized that disclosure controls and procedures, no matter how well conceived and operated, can provide only reasonable, not absolute, assurance that the objectives of the disclosure controls and procedures are met. Additionally, in designing disclosure controls and procedures, our management necessarily was required to apply its judgment in evaluating the cost-benefit relationship of possible disclosure controls and procedures. The design of any disclosure controls and procedures also is based in part upon certain assumptions about the likelihood of future events, and there can be no assurance that any design will succeed in achieving its stated goals under all potential future conditions.
Our management, with the participation of our Chief Executive Officer and Chief Financial Officer, has evaluated the effectiveness of the design and operation of our disclosure controls and procedures as of December 31, 2020. Based on that evaluation, our Chief Executive Officer and Chief Financial Officer have concluded that, as of such date, our disclosure controls and procedures were effective.
Management’s Report on Internal Control Over Financial Reporting
Our management is responsible for establishing and maintaining adequate internal control over financial reporting. Our internal control over financial reporting is a process designed under the supervision of our principal executive and principal financial officers to provide reasonable assurance regarding the reliability of financial reporting and the preparation of our financial statements for external reporting purposes in accordance with U.S. generally accepted accounting principles.
Our internal control over financial reporting includes policies and procedures that pertain to the maintenance of records that, in reasonable detail, accurately and fairly reflect transactions and dispositions of assets; provide reasonable assurances that transactions are recorded as necessary to permit preparation of financial statements in accordance with U.S. generally accepted accounting principles, and that receipts and expenditures are being made only in accordance with authorizations of our management and our directors; and provide reasonable assurance regarding prevention or timely detection of unauthorized acquisition, use or disposition of our assets that could have a material effect on our financial statements.
Because of its inherent limitations, internal control over financial reporting may not prevent or detect misstatements. In addition, projections of any evaluation of controls effectiveness to future periods are subject to the risk that controls may become inadequate because of changes in conditions or deterioration in the degree of compliance with policies or procedures.
We completed the Zumbro and Chemogas acquisitions in 2019. As of December 31, 2020, management's assessment of and conclusion of the effectiveness of our internal controls over financial reporting of both Zumbro and Chemogas have been completed. Therefore, management's assessment of and conclusion of the effectiveness of our internal control over financial reporting also includes the internal controls over financial reporting of both Zumbro and Chemogas.
As of December 31, 2020, management used the criteria set forth by the Committee of Sponsoring Organizations of the Treadway Commission (COSO) in the 2013 Internal Control-Integrated Framework (New Framework) to conduct an assessment of the effectiveness of our internal control over financial reporting. Based on this assessment, management has determined that our internal control over financial reporting was effective as of December 31, 2020.
Attestation Report of Registered Public Accounting Firm
The independent registered public accounting firm of RSM US LLP has issued an attestation report on our internal control over financial reporting, which is included herein.
Changes in Internal Control Over Financial Reporting
There has been no significant change in our internal control over financial reporting that has materially affected, or is reasonably likely to materially affect, our internal control over financial reporting.
Item 9B. Other Information
None.
PART III
Item 10. Directors, Executive Officers of the Registrant, and Corporate Governance.
(a) Directors of the Company.
The required information is to be set forth in our Proxy Statement for the 2021 Annual Meeting of Stockholders (the “2021 Proxy Statement”) under the captions “Nominees for Election as Director" and "Directors Not Standing for Election", which information is hereby incorporated herein by reference.
(b) Executive Officers of the Company.
The required information is to be set forth in the 2021 Proxy Statement under the captions "Continuing Directors' Biographical Information" (as to Theodore L. Harris, the Company's Chief Executive Officer and President) and "Named Executive Officers" (as to the Company's other executive officers), which information is hereby incorporated herein by reference.
(c) Section 16(a) Beneficial Ownership Reporting Compliance.
The required information is to be set forth in the 2021 Proxy Statement under the caption “Section 16(a) Beneficial Ownership Reporting Compliance,” which information is hereby incorporated herein by reference.
(d) Code of Ethics.
The required information is to be set forth in the 2021 Proxy Statement under the caption “Codes of Business Conduct and Ethics,” which information is hereby incorporated herein by reference. Our Code of Ethics for Senior Financial Officers is available on the Corporate Governance page in the Investor Relations section of our website, www.balchem.com.
(e) Corporate Governance.
The required information is to be set forth in the 2021 Proxy Statement under the captions “Nomination of Directors,” and “Committees of the Board of Directors,” which information is hereby incorporated herein by reference.
Item 11. Executive Compensation.
The information required by this Item is to be set forth in the 2021 Proxy Statement under the captions “Executive Compensation,” “Compensation Committee Report,” and “Compensation Committee Interlocks and Insider Participation,” which information is hereby incorporated herein by reference.
Item 12. Security Ownership of Certain Beneficial Owners and Management and Related Stockholder Matters.
The information required by this Item is to be set forth in the 2021 Proxy Statement under the caption “Security Ownership of Certain Beneficial Owners and of Management” and the caption “Equity Compensation Plan Information,” all of which information is hereby incorporated herein by reference.
Item 13. Certain Relationships and Related Transactions and Director Independence.
The information required by this Item is to be set forth in the 2021 Proxy Statement under the caption “Related Party Transactions,” and “Director Independence,” which information is hereby incorporated herein by reference.
Item 14. Principal Accountant Fees and Services.
The information required by this Item is to be set forth in the 2021 Proxy Statement under the caption “Proposal 2 - Ratification of Appointment of Independent Registered Public Accounting Firm,” which information is hereby incorporated herein by reference.
PART IV
Item 15. Exhibits and Financial Statement Schedules.
The following documents are filed as part of this Form 10-K:
| | | | | | | | | | | |
| 1. | | Financial Statements | Page Number |
| | | |
| | | |
| | | |
| | | |
| | | |
| | | |
| | | |
| | | |
| | | |
| | | |
| | | |
| | | |
| | | |
| | | |
| | | |
| 2. | | Financial Statement Schedules | |
| | | |
| | | |
| | | |
| 3. | | Exhibits | |
| | | |
| 3.1 | | |
| | | | |
| 3.2 | | |
| | | | |
| 3.3 | | |
| | | | |
| 3.4 | | |
| | | |
| 10.1 | | |
| | | |
| 10.2 | | |
| | | | |
| 10.3 | | |
| | | | | | | | | | | |
| | | |
| 10.4 | | |
| | | | |
| 10.5 | | |
| | | |
| 10.6 | | |
| | | |
| 10.7 | | |
| | | |
| 10.8 | | |
| | | |
| 10.9 | | Securities Purchase Agreement among (a) Balchem, (b) Chemogas Gilde B.V., a limited liability company organized and existing under the laws of The Netherlands, (c) Dirk Battig, (d) Dirk Van den Borre, (e) Eric Matthijs, (f) Christophe Marque, (g) Adamo Pia (h) Jurgen De Smet, and (i) Sebastien Verwilghen, dated as of May 2, 2019 (incorporated by reference to the Company’s Current Report on Form 8-K dated May 6, 2019) (certain exhibits and schedules to the Securities Purchase Agreement have been omitted pursuant to Item 601(b)(2) of Regulation S-K and the Company will furnish a copy of any such omitted exhibit or Schedule to the SEC upon Request)). |
| | | |
| 10.10 | | |
| | | |
| 21 | | | |
| | | |
| 23.1 | | |
| | | |
| 31.1 | | |
| | | |
| 31.2 | | |
| | | |
| 32.1 | | |
| | | |
| 32.2 | | |
| | | |
| 101.INS | | XBRL Instance Document | |
| | | |
| 101.SCH | | XBRL Taxonomy Extension Schema Document | |
| | | |
| 101.CAL | | XBRL Taxonomy Extension Calculation Linkbase Document | |
| | | | | | | | | | | |
| | | |
| 101.DEF | | XBRL Taxonomy Extension Definition Linkbase Document | |
| | | |
| 101.LAB | | XBRL Taxonomy Extension Label Linkbase Document | |
| | | |
| 101.PRE | | XBRL Taxonomy Extension Presentation Linkbase Document | |
| | | |
| 104 | | Cover Page Interactive Data File (formatted as Inline XBRL and contained in Exhibit 101) | |
| | | |
| * Each of the Exhibits noted by an asterisk is a management compensatory plan or arrangement. | |
SIGNATURES
Pursuant to the requirements of Section 13 or 15(d) of the Securities Exchange Act of 1934, the registrant has caused this report to be signed on its behalf by the undersigned, thereunto duly authorized.
| | | | | |
| Date: February 19, 2021 | BALCHEM CORPORATION |
| | By:/s/ Theodore L. Harris |
| | Theodore L. Harris, President and |
| | Chief Executive Officer |
SIGNATURES
Pursuant to the requirements of the Securities Exchange Act of 1934, this report has been signed by the following persons on behalf of the registrant and in the capacities and on the dates indicated.
| | | | | |
| /s/ Theodore L. Harris | |
| Theodore L. Harris, President and |
| Chief Executive Officer (Chairman) |
| Date: February 19, 2021 | |
| | |
| /s/ Martin Bengtsson | |
| Martin Bengtsson, Chief Financial Officer |
| and Treasurer (Principal Financial Officer) |
| Date: February 19, 2021 | |
| |
| /s/ William A. Backus | |
| William A. Backus, Chief Accounting Officer |
| (Principal Accounting Officer) |
| Date: February 19, 2021 | |
| | |
| /s/ Paul D. Coombs | |
| Paul D. Coombs, Director |
| Date: February 19, 2021 | |
| | |
| /s/ David B. Fischer | |
| David B. Fischer, Director |
| Date: February 19, 2021 | |
| | |
| /s/ Daniel E. Knutson | |
| Daniel E. Knutson, Director |
| Date: February 19, 2021 | |
| |
| /s/ Joyce Lee | |
| Joyce Lee, Director |
| Date: February 19, 2021 | |
| | |
| /s/ Perry W. Premdas | |
| Perry W. Premdas, Director |
| Date: February 19, 2021 | |
| | |
| /s/ Dr. John Televantos | |
| Dr. John Televantos, Director |
| Date: February 19, 2021 | |
| | |
| /s/ Matthew Wineinger | |
| Matthew Wineinger, Director |
| Date: February 19, 2021 | |