UNITED STATES
SECURITIES
AND EXCHANGE COMMISSION
Washington,
D.C. 20549
FORM
8-K
CURRENT
REPORT
Pursuant
to Section 13 OR 15(d) of the Securities Exchange Act of 1934
Date
of Report (Date of earliest event reported): January 24, 2017
POLARIS INDUSTRIES INC.
(Exact
name of Registrant as specified in its charter)
Minnesota |
1-11411 |
41-1790959 |
(State of Incorporation) |
(Commission File Number) |
(I.R.S. Employer Identification No.) |
2100 Highway 55
Medina, Minnesota 55340
(Address of
principal executive offices)
(Zip Code)
(763) 542-0500
(Registrant’s
telephone number, including area code)
Check the appropriate box below if the Form 8-K filing is intended to simultaneously satisfy the filing obligation of the registrant under any of the following provisions:
⃞ Written communications pursuant to Rule 425 under the Securities Act (17 CFR 230.425)
⃞ Soliciting material pursuant to Rule 14a-12 under the Exchange Act (17 CFR 240.14a-12)
⃞ Pre-commencement communications pursuant to Rule 14d-2(b) under the Exchange Act (17 CFR 240.14d-2(b))
⃞ Pre-commencement communications pursuant to Rule 13e-4(c) under the Exchange Act (17 CFR 240.13e-4(c))
Item 2.02 Results of Operations and Financial Condition.
On January 24, 2017, Polaris Industries Inc. (the “Company”) issued a press release announcing the Company’s fourth quarter and full year 2016 financial results for the reporting period ended December 31, 2016. On January 24, 2017, the Company also hosted its quarterly earnings conference call, which was accessible to the public. A recording of the conference call will be available through the end of the business day on February 7, 2017 by dialing 855-859-2056 in the U.S. and Canada, or 404-537-3406 for international calls and entering passcode 45015597, and on the Company’s website at http://ir.polaris.com.
A copy of the Company’s press release is furnished as Exhibit 99.1 attached hereto and a copy of the presentation materials discussed during the conference call is being furnished as Exhibit 99.2 to this Current Report on Form 8-K.
Item 7.01 Regulation FD Disclosure.
The disclosures set forth in Item 2.02 above are hereby incorporated by reference into this Item 7.01.
Item 9.01 Financial Statements and Exhibits.
(d) Exhibits.
99.1 | Press Release dated January 24, 2017 of Polaris Industries Inc. | |
99.2 | Presentation materials dated January 24, 2017 of Polaris Industries Inc. |
The information contained in this Current Report is furnished and not deemed to be filed for purposes of Section 18 of the Securities and Exchange Act of 1934, as amended, or otherwise subject to the liabilities of that section. The information in this Current Report shall not be incorporated by reference into any filing or other document pursuant to the Securities Act of 1933, as amended, except as shall be expressly set forth by specific reference in such filing or document.
SIGNATURES
Pursuant to
the requirements of the Securities Exchange Act of 1934, the registrant
has duly caused this report to be signed on its behalf by the
undersigned thereunto duly authorized.
Date: |
January 24, 2017 |
|
POLARIS INDUSTRIES INC. | ||
/s/ Michael T. Speetzen |
||
Michael T. Speetzen |
||
Executive Vice President – Finance and Chief Financial Officer of Polaris Industries Inc. |
EXHIBIT INDEX
Exhibit Number |
Description |
|
99.1 |
Press Release dated January 24, 2017 of Polaris Industries Inc. |
|
99.2 |
Presentation materials dated January 24, 2017 of Polaris Industries Inc. |
Exhibit 99.1
CONTACT:
Polaris Industries Inc.
Richard Edwards, 763-542-0500
Polaris Reports 2016 Fourth Quarter and Full Year Results
Sales for the fourth quarter of 2016 increased 10% to $1,217.8 million including Transamerican Auto Parts (“TAP”) sales of $108.7 million
Fourth quarter 2016 reported net income was $0.97 per diluted share; adjusted net income for the same period was $1.18 per diluted share, in-line with expectations
ORV dealer inventory was down 11%, year-over-year; total dealer inventory was down 8%
Full year 2016 reported net income was $3.27 per diluted share; adjusted net income for the same period was $3.48 per diluted share, in-line with previously issued guidance. Sales for the full year of 2016 decreased 4% to $4,516.6 million
Polaris announced guidance for the full year 2017. Adjusted net income is expected to be in the range of $4.25 to $4.50 per diluted share with sales for the full year 2017 expected in the range of up 10% to 13%.
Note: the results and guidance in this release, including the highlights above, include references to non-GAAP operating measures, which are identified by the word “adjusted” preceding the measure. A reconciliation of GAAP to non-GAAP measures can be found at the end of this release.
MINNEAPOLIS--(BUSINESS WIRE)--January 24, 2017--Polaris Industries Inc. (NYSE: PII) today reported fourth quarter 2016 sales of $1,217.8 million up 10 percent from $1,105.6 million for the fourth quarter of 2015. Fourth quarter 2016 reported net income was $62.6 million, or $0.97 per diluted share, compared with $110.7 million, or $1.66 per diluted share, for the 2015 fourth quarter. Adjusted net income for the quarter ended December 31, 2016, excluding purchase accounting adjustments and certain costs related to the acquisition of TAP, was $76.1 million, or $1.18 per diluted share.
For the full year ended December 31, 2016 the Company reported sales of $4,516.6 million, a decrease of 4 percent versus $4,719.3 million in the prior year. Reported net income was $212.9 million, or $3.27 per diluted share, compared with $455.4 million, or $6.75 per diluted share, for the full year 2015. Adjusted net income, excluding purchase accounting adjustments and certain costs related to the acquisition of TAP was $226.5 million, or $3.48 per diluted share, for the year ended December 31, 2016.
On November 10, 2016, the Company completed the acquisition of TAP, a vertically integrated manufacturer, distributor, retailer and installer of off-road Jeep and truck accessories, for an aggregate consideration of $669 million.
“2016 was a difficult and challenging year for Polaris, but our culture is geared to deal head on with adversity and learn from it, and that’s what we did in 2016. In response to a series of recalls, we took the necessary steps to ensure that Polaris vehicles deliver the quality, safety and performance that our customers expect. We are relying on these enhanced improvements, consistent execution, and aggressive innovation to regain our footing as the ‘Best in Powersports’,” commented Scott Wine.
“Our team worked incredibly hard in 2016 to serve our Off Road Vehicle customers and dealers, and that work is accelerating into 2017. It is a very competitive ORV market and we will aggressively execute and revitalize our broad set of tools that built the most successful armada in Powersports. Significant progress was made across our businesses, including mid-twenty percent growth in Indian Motorcycle® retail sales and an eight percent reduction in dealer inventories year-over-year, while at the same time, reducing factory inventory 16 percent excluding acquisitions, and improving operating cash flow by 30 percent in 2016. Further, we completed the Taylor Dunn acquisition in the work space and TAP in the aftermarket space, executing our strategy to enhance profitable growth opportunities in adjacent markets. We continued to enhance our Quality and Safety organization, production in our new facility in Huntsville, Alabama is ramping up to become the enabler to our go to market Retail Flow Management (RFM) process, and lean initiatives across our network drove approximately $150 million in gross Value Improvement (“VIP”) savings during the year.”
“The entire Polaris team is committed to superior execution, improved product safety and quality, enhanced dealer relations, and earning the trust our customers and stakeholders place in the Polaris brand, in 2017 and beyond. We are accelerating our research and development investments to again win the ORV product game, focusing on the successful integration of TAP, and developing our competitive position in Motorcycles, all of which will drive increasing shareholder value in the future.”
Fourth Quarter Segment Results (in thousands) |
||||||||||||||||||||||
Reporting segment sales includes their respective parts, garments and accessories ("PG&A") related sales | ||||||||||||||||||||||
Three months ended December 31, | Year ended December 31, | |||||||||||||||||||||
2016 | 2015 | Change | 2016 | 2015 | Change | |||||||||||||||||
Sales |
||||||||||||||||||||||
Off-Road Vehicles/Snowmobiles | $ | 904,971 | $ | 862,032 | 5 | % | $ | 3,357,496 | $ | 3,708,933 | (9 | )% | ||||||||||
Motorcycles | 105,735 | 162,558 | (35 | )% | 708,497 | 698,257 | 1 | % | ||||||||||||||
Global Adjacent Markets | 98,384 | 81,028 | 21 | % | 341,937 | 312,100 | 10 | % | ||||||||||||||
Other | 108,699 | - | N/M | 108,699 | - | N/M | ||||||||||||||||
Total Sales | $ | 1,217,789 | $ | 1,105,618 | 10 | % | $ | 4,516,629 | $ | 4,719,290 | (4 | )% | ||||||||||
Gross profit |
||||||||||||||||||||||
Off-Road Vehicles/Snowmobiles | $ | 259,199 | $ | 262,827 | (1 | )% | $ | 930,181 | $ | 1,190,630 | (22 | )% | ||||||||||
% of sales | 28.6 | % | 30.5 | % | -185 bps | 27.7 | % | 32.1 | % | -440 bps | ||||||||||||
Motorcycles | 1,560 | 24,025 | (94 | )% | 91,401 | 97,261 | (6 | )% | ||||||||||||||
% of sales | 1.5 | % | 14.8 | % | -1,330 bps | 12.9 | % | 13.9 | % | -103 bps | ||||||||||||
Global Adjacent Markets | 28,986 | 22,223 | 30 | % | 95,149 | 84,211 | 13 | % | ||||||||||||||
% of sales | 29.5 | % | 27.4 | % | +204 bps | 27.8 | % | 27.0 | % | +84 bps | ||||||||||||
Other | 19,842 | - | - | 19,842 | - | - | ||||||||||||||||
% of sales | 18.3 | % |
- |
- |
18.3 | % | - | - | ||||||||||||||
Corporate | 3,185 | 1,199 | 166 | % | (30,950 | ) | (33,060 | ) | (6 | )% | ||||||||||||
Total gross profit | $ | 312,772 | $ | 310,274 | 1 | % | $ | 1,105,623 | $ | 1,339,042 | (17 | )% | ||||||||||
% of sales | 25.7 | % | 28.1 | % | -238 bps | 24.5 | % | 28.4 | % | -389 bps | ||||||||||||
Off-Road Vehicle (“ORV”) and Snowmobile segment sales, including their respective PG&A related sales, were $905.0 million for the fourth quarter of 2016, compared with $862.0 million for the fourth quarter for the prior year. Gross profit decreased one percent to $259.2 million, or 28.6 percent of sales, in the fourth quarter of 2016, compared to $262.8 million, or 30.5 percent of sales, in the fourth quarter of 2015. Gross profit percentage declined primarily due to higher promotional spending and increased warranty expense.
ORV wholegood sales for the fourth quarter 2016 increased three percent as the Company’s model year 2017 vehicle revalidations were completed and shipments resumed, including the RZR Turbo vehicles which have higher average selling prices. Polaris North American ORV unit retail sales for the fourth quarter 2016 were down mid-single digits percent from the 2015 fourth quarter, which included consumer purchases for side-by-side vehicles down low-single digits percent and ATV retail sales down about ten percent. The North American ORV industry was flat compared to the fourth quarter last year. ORV dealer inventory was down 11 percent in the 2016 fourth quarter compared to the same period last year.
Snowmobile wholegood sales in the fourth quarter 2016 increased 13 percent due to the timing of shipments, year-over-year and a favorable mix of higher priced snowmobiles shipped during the quarter.
Motorcycle segment sales, including its PG&A related sales, decreased 35 percent in the 2016 fourth quarter to $105.7 million. Both Indian and Victory reported lower sales in the fourth quarter due to difficult comparables as product availability for all brands improved significantly in the 2015 fourth quarter, and as the Company reduced motorcycle production in the 2016 fourth quarter to complete the final paint system upgrade in Spirit Lake, IA. Slingshot® sales were down due to low product availability related to recall activity. Gross profit for the fourth quarter 2016 decreased 94 percent to $1.6 million compared to $24.0 million in the fourth quarter of 2015 due to lower production rates and higher warranty expense.
North American consumer retail demand for the Polaris motorcycle segment, including Victory®, Indian Motorcycle® and Slingshot®, was down mid-single digits percent during the 2016 fourth quarter while the overall motorcycle industry retail sales, 900cc and above, declined low-single digits percent in the 2016 fourth quarter. Indian Motorcycles retail sales increased about 20 percent while Victory retail sales were down mid-single digits percent during the quarter. Slingshot retail sales were down significantly due to tough comparable in the fourth quarter last year as the Company experienced unseasonably strong retail sales in the initial year of Slingshot product availability in 2015.
Global Adjacent Markets segment sales along with its PG&A related sales, increased 21 percent to $98.4 million in the 2016 fourth quarter compared $81.0 in the 2015 fourth quarter. Gross profit increased 30 percent to $29.0 million, or 29.5 percent of sales, in the fourth quarter of 2016, compared to $22.2 million, or 27.4 percent of sales, in the fourth quarter of 2015. Sales and gross profit were up primarily due to increased sales in the Company’s Defense business in the 2016 fourth quarter. Sales to military customers were up approximately 95 percent driving the quarter. Work and Transportation group wholegood sales were up seven percent during the fourth quarter of 2016 primarily due to increased Aixam sales and Taylor-Dunn sales.
Supplemental Data:
Parts, Garments, and Accessories (“PG&A”) sales, which are included in each of the three respective reporting segments, excluding TAP sales of $108.7 million, increased nine percent for the 2016 fourth quarter. All three reporting segments experienced higher PG&A sales during the quarter primarily due to higher parts sales during the quarter.
International sales to customers outside of North America totaled $178.2 million for the fourth quarter of 2016, including PG&A, down two percent, from the same period in 2015. International sales on a constant currency basis were flat for the 2016 fourth quarter.
Gross profit increased one percent to $312.8 million for the fourth quarter of 2016 from $310.3 million in the fourth quarter of 2015, including the negative impact of $8.8 million in purchase accounting adjustments related to the TAP acquisition. As a percentage of sales, gross profit margin was 25.7 percent compared with 28.1 percent of sales for the fourth quarter of 2015. Adjusted gross profit was $321.6 million, or 26.4 percent of sales. Increased warranty and promotional costs and negative foreign exchange impacts, partially offset by favorable product mix and product cost reduction efforts, were the primary reasons for the gross margin erosion.
Operating expenses increased 38 percent for the fourth quarter of 2016 to $233.3 million from $169.1 million, including $12.7 million in TAP deal-related expenses. Excluding these costs, operating expenses increased primarily due to higher general and administrative expenses from higher product liability expenses, increased research and development expenses for ongoing product refinement and innovation and the addition of operating expenses from acquisitions.
Income from financial services was $19.3 million for the fourth quarter of 2016, up seven percent compared with $18.0 million for the fourth quarter 2015. The increase is attributable to higher penetration rates in the retail credit portfolio and higher income from the sale of extended service contracts.
Non-operating other expense, net, which primarily relates to foreign currency exchange rate movements and the corresponding effects on foreign currency transactions related to the Company’s foreign subsidiaries, was $6.2 million for the fourth quarter of 2016, versus $3.4 million in the fourth quarter of 2015.
The provision for income taxes for the fourth quarter of 2016 was $22.9 million, compared with $40.4 million for the fourth quarter of 2015, or 26.8 percent, versus 26.7 percent of pretax income for the fourth quarter of 2015.
Financial Position and Cash Flow
Net cash provided by operating activities was $571.8 million for the full 2016 year, compared with $440.2 million for the year ended December 31, 2015 due to lower working capital requirements. Total debt at the end of 2016, including capital lease obligations and notes payable, was $1,141.9 million. The Company’s debt-to-total capital ratio was 57 percent at December 31, 2016, compared to 32 percent a year ago. Cash and cash equivalents were $127.3 million at December 31, 2016, compared with $155.3 million at December 31, 2015.
Share Buyback Activity
During the fourth quarter 2016, the Company repurchased and retired 1,105,500 shares of its common stock for $91.4 million, bringing total share repurchases to 2,908,000 shares or $245.8 million for the full year 2016. As of December 31, 2016, the Company currently has authorization from its Board of Directors to repurchase up to an additional 7.5 million shares of Polaris stock.
2017 Business Outlook
The Company expects full year 2017 adjusted net income to be in the range of $4.25 to $4.50 per diluted share, compared with adjusted net income of $3.48 per diluted share for 2016. Full year 2017 sales are anticipated to increase in the range of 10 percent to 13 percent over 2016 sales of $4,516.6 million.
Wind down of Victory Motorcycles
Polaris announced on January 9, 2017 its intention to wind down its Victory® Motorcycles operations. The decision is expected to improve the long-term profitability of Polaris and its global motorcycle business, while materially improving the Company’s competitive position in the industry. The Company will record one-time costs associated with supporting Victory dealers in selling their remaining inventory, the disposal of factory inventory, tooling, and other physical assets, and the cancellation of various supplier arrangements. These one-time costs will be recorded in the 2017 income statement in respective sales, gross profit and operating expense beginning in the first quarter of 2017. These costs will be excluded from Polaris’ 2017 sales and earnings guidance on a non-GAAP basis.
Use of Non-GAAP Financial Information
This release and our related earnings call include a discussion of the Company’s 2016 fourth quarter and full year 2016 results on a constant currency basis, which is a non-GAAP measure, as well as on a GAAP basis. For purpose of comparison, the results on a constant currency basis uses the respective prior year exchange rates for the comparative period to enhance the visibility of the underlying business trends, excluding the impact of translation arising from foreign currency exchange rate fluctuations.
This press release also contains certain non-GAAP financial measures, consisting of “adjusted gross profits, operating expenses, net income and net income per diluted share” as measures of our operating performance. Management believes these measures may be useful in performing meaningful comparisons of past and present operating results, to understand the performance of its ongoing operations and how management views the business. Reconciliations of adjusted non-GAAP measures to reported GAAP measures are included in the financial schedules contained in this press release. These measures, however, should not be construed as an alternative to any other measure of performance determined in accordance with GAAP.
Fourth Quarter and Full Year Conference Call and Webcast Presentation
Today at 9:00 AM (CST) Polaris Industries Inc. will host a conference call and webcast to discuss the 2016 results released this morning and expectations for 2017. The call will be hosted by Scott Wine, Chairman and CEO; Ken Pucel, Executive Vice President – Operations, Engineering and Lean; and Mike Speetzen, Executive Vice President – Finance and CFO. A slide presentation and link to the webcast will be posted on the Polaris Investor Relations website at http://ir.polaris.com.
To listen to the conference call by phone, dial 877-706-7543 in the U.S. and Canada, or 478-219-0273 internationally. The Conference ID is # 45015597.
A replay of the conference call will be available approximately two hours after the call for a one-week period by accessing the same link on our website, or by dialing 855-859-2056 in the U.S. and Canada, or 404-537-3406 internationally.
About Polaris
Polaris Industries Inc. (NYSE: PII) is a global powersports leader with annual 2016 sales of $4.5 billion. Polaris fuels the passion of riders, workers and outdoor enthusiasts with our RANGER®, RZR® and POLARIS GENERAL™ side-by-side off-road vehicles; our SPORTSMAN® and POLARIS ACE® all-terrain off-road vehicles; VICTORY® and INDIAN MOTORCYCLE® midsize and heavyweight motorcycles; SLINGSHOT® moto-roadsters; and Polaris RMK®, INDY®, SWITCHBACK® and RUSH® snowmobiles. Polaris enhances the riding experience with parts, garments and accessories sold under multiple recognizable brands, and has a growing presence globally in adjacent markets with products including military and commercial off-road vehicles, quadricycles, and electric vehicles. www.polaris.com
Except for historical information contained herein, the matters set forth in this news release, including management’s expectations regarding 2017 future sales, shipments, net income, and net income per share, and operational initiatives are forward-looking statements that involve certain risks and uncertainties that could cause actual results to differ materially from those forward-looking statements. Potential risks and uncertainties include such factors as the Company’s ability to successfully implement its manufacturing operations expansion initiatives, product offerings, promotional activities and pricing strategies by competitors; economic conditions that impact consumer spending; acquisition integration costs; product recalls, warranty expenses; impact of changes in Polaris stock price on incentive compensation plan costs; foreign currency exchange rate fluctuations; environmental and product safety regulatory activity; effects of weather; commodity costs; uninsured product liability claims; uncertainty in the retail and wholesale credit markets; performance of affiliate partners; changes in tax policy and overall economic conditions, including inflation, consumer confidence and spending and relationships with dealers and suppliers. Investors are also directed to consider other risks and uncertainties discussed in documents filed by the Company with the Securities and Exchange Commission. The Company does not undertake any duty to any person to provide updates to its forward-looking statements.
(summarized financial data follows)
POLARIS INDUSTRIES INC. CONSOLIDATED STATEMENTS OF INCOME (In Thousands, Except Per Share Data) (Unaudited) |
|||||||||||||||
Three months ended December 31, | Years ended December 31, | ||||||||||||||
2016 | 2015 | 2016 | 2015 | ||||||||||||
Sales | $ | 1,217,789 | $ | 1,105,618 | $ | 4,516,629 | $ | 4,719,290 | |||||||
Cost of sales | 905,017 | 795,344 | 3,411,006 | 3,380,248 | |||||||||||
Gross profit | 312,772 | 310,274 | 1,105,623 | 1,339,042 | |||||||||||
Operating expenses: | |||||||||||||||
Selling and marketing | 97,423 | 76,159 | 342,235 | 316,669 | |||||||||||
Research and development | 48,870 | 41,734 | 185,126 | 166,460 | |||||||||||
General and administrative | 87,039 | 51,179 | 306,442 | 209,077 | |||||||||||
Total operating expenses | 233,332 | 169,072 | 833,803 | 692,206 | |||||||||||
Income from financial services | 19,303 | 17,958 | 78,458 | 69,303 | |||||||||||
Operating income | 98,743 | 159,160 | 350,278 | 716,139 | |||||||||||
Non-operating expense: | |||||||||||||||
Interest expense | 5,601 | 2,608 | 16,319 | 11,456 | |||||||||||
Equity in loss of other affiliates | 1,434 | 2,086 | 6,873 | 6,802 | |||||||||||
Other expense, net | 6,249 | 3,368 | 13,835 | 12,144 | |||||||||||
Income before income taxes | 85,459 | 151,098 | 313,251 | 685,737 | |||||||||||
Provision for income taxes | 22,878 | 40,416 | 100,303 | 230,376 | |||||||||||
Net income | $ | 62,581 | $ | 110,682 | $ | 212,948 | $ | 455,361 | |||||||
Net income per share: | |||||||||||||||
Basic | $ | 0.98 | $ | 1.69 | $ | 3.31 | $ | 6.90 | |||||||
Diluted | $ | 0.97 | $ | 1.66 | $ | 3.27 | $ | 6.75 | |||||||
Weighted average shares outstanding: | |||||||||||||||
Basic | 63,578 | 65,415 | 64,296 | 66,020 | |||||||||||
Diluted | 64,327 | 66,592 | 65,158 | 67,484 |
POLARIS INDUSTRIES INC. CONSOLIDATED BALANCE SHEETS (In Thousands) (Unaudited) |
|||||||
December 31, |
December 31, |
||||||
Assets | |||||||
Current Assets: | |||||||
Cash and cash equivalents | $ | 127,325 | $ | 155,349 | |||
Trade receivables, net | 174,832 | 150,778 | |||||
Inventories, net | 746,534 | 710,001 | |||||
Prepaid expenses and other | 91,636 | 90,619 | |||||
Income taxes receivable | 50,662 | 46,175 | |||||
Total current assets | 1,190,989 | 1,152,922 | |||||
Property and equipment, net | 727,596 | 650,678 | |||||
Investment in finance affiliate | 94,009 | 99,073 | |||||
Deferred tax assets | 188,471 | 166,538 | |||||
Goodwill and other intangible assets, net | 792,979 | 236,117 | |||||
Other long-term assets | 105,553 | 80,331 | |||||
Total assets | $ | 3,099,597 | $ | 2,385,659 | |||
Liabilities and Shareholders' Equity | |||||||
Current Liabilities: | |||||||
Current portion of debt, capital lease obligations and notes payable | $ | 3,847 | $ | 5,059 | |||
Accounts payable | 273,742 | 299,660 | |||||
Accrued expenses: | |||||||
Compensation | 122,214 | 106,486 | |||||
Warranties | 119,274 | 56,474 | |||||
Sales promotions and incentives | 158,562 | 141,057 | |||||
Dealer holdback | 117,574 | 123,276 | |||||
Other | 162,432 | 88,030 | |||||
Income taxes payable | 2,106 | 6,741 | |||||
Total current liabilities | 959,751 | 826,783 | |||||
Long term income taxes payable | 26,391 | 23,416 | |||||
Capital lease obligations | 17,538 | 19,660 | |||||
Long-term debt | 1,120,525 | 436,757 | |||||
Deferred tax liabilities | 9,127 | 13,733 | |||||
Other long-term liabilities | 90,497 | 74,188 | |||||
Total liabilities | $ | 2,223,829 | $ | 1,394,537 | |||
Deferred compensation | 8,728 | 9,645 | |||||
Total shareholders’ equity | 867,040 | 981,477 | |||||
Total liabilities and shareholders’ equity | $ | 3,099,597 | $ | 2,385,659 |
POLARIS INDUSTRIES INC. CONSOLIDATED STATEMENTS OF CASH FLOWS (In Thousands) (Unaudited) |
||||||||
Year ended December 31, | ||||||||
2016 | 2015 | |||||||
Operating Activities: | ||||||||
Net income | $ | 212,948 | $ | 455,361 | ||||
Adjustments to reconcile net income to net cash provided by operating activities: | ||||||||
Depreciation and amortization | 167,512 | 152,138 | ||||||
Noncash compensation | 57,927 | 61,929 | ||||||
Noncash income from financial services | (30,116 | ) | (29,405 | ) | ||||
Deferred income taxes | (26,056 | ) | (16,343 | ) | ||||
Tax effect of share-based compensation exercises | (3,578 | ) | (34,654 | ) | ||||
Other, net | 13,462 | 6,802 | ||||||
Changes in operating assets and liabilities: | ||||||||
Trade receivables | 2,030 | 48,798 | ||||||
Inventories | 111,999 | (148,725 | ) | |||||
Accounts payable | (62,693 | ) | (46,095 | ) | ||||
Accrued expenses | 145,261 | 9,182 | ||||||
Income taxes payable/receivable | (1,997 | ) | (247 | ) | ||||
Prepaid expenses and others, net | (14,916 | ) | (18,510 | ) | ||||
Net cash provided by operating activities | 571,783 | 440,231 | ||||||
Investing Activities: | ||||||||
Purchase of property and equipment | (209,137 | ) | (249,485 | ) | ||||
Investment in finance affiliate, net | 35,179 | 19,440 | ||||||
Investment in other affiliates | (11,595 | ) | (17,848 | ) | ||||
Acquisition of businesses, net of cash acquired | (723,705 | ) | (41,195 | ) | ||||
Net cash used for investing activities | (909,258 | ) | (289,088 | ) | ||||
Financing Activities: | ||||||||
Borrowings under debt arrangements / capital lease obligations | 3,232,137 | 2,631,067 | ||||||
Repayments under debt arrangements / capital lease obligations | (2,552,760 | ) | (2,385,480 | ) | ||||
Repurchase and retirement of common shares | (245,816 | ) | (293,616 | ) | ||||
Cash dividends to shareholders | (140,336 | ) | (139,285 | ) | ||||
Proceeds from stock issuances under employee plans | 3,578 | 32,535 | ||||||
Tax effect of proceeds from share-based compensation exercises | 17,690 | 34,654 | ||||||
Net cash provided by (used for) financing activities | 314,493 | (120,125 | ) | |||||
Impact of currency exchange rates on cash balances | (5,042 | ) | (13,269 | ) | ||||
Net increase (decrease) in cash and cash equivalents | (28,024 | ) | 17,749 | |||||
Cash and cash equivalents at beginning of period | 155,349 | 137,600 | ||||||
Cash and cash equivalents at end of period | $ | 127,325 | $ | 155,349 |
POLARIS INDUSTRIES INC. Reconciliation of GAAP "Reported" Results to "Adjusted" Results (unaudited) |
||||||||||||||||||||||||||||||||
Q4 2016 |
Reported GAAP Measures | Adjustments | Adjusted Measures | |||||||||||||||||||||||||||||
Q4 2016 |
Q4 2015 |
$ |
% |
Q4 2016 |
Q4 2015 |
Q4 2016 |
Q4 2015 |
$ |
% |
|||||||||||||||||||||||
Sales | $ | 1,217,789 | $ | 1,105,618 | $ | 112,171 | 10 | % | $ | - | - | $ | 1,217,789 | $ | 1,105,618 | $ | 112,171 | 10 | % | |||||||||||||
Gross Profit | 312,772 | 310,274 | 2,498 | 1 | % |
8,803 |
(1) |
- | 321,575 | 310,274 | 11,301 | 4 | % | |||||||||||||||||||
Gross Profit % | 25.7% | 28.1% | - |
(238) |
26.4% | 28.1% | - |
(165) |
||||||||||||||||||||||||
Operating Exp. | 233,332 | 169,072 | 64,260 | 38 | % | (12,651 |
)(2) |
- | 220,681 | 169,072 | 51,609 | 31 | % | |||||||||||||||||||
Net Income | 62,581 | 110,682 | (48,101 | ) | (43 | %) |
13,515 |
(3) |
- | 76,096 | 110,682 | (34,586 | ) | (31 | %) | |||||||||||||||||
Diluted EPS | $ | 0.97 | $ | 1.66 | $ | (0.69 | ) | (42 | %) | $ | 0.21 | - | $ | 1.18 | $ | 1.66 | $ | (0.48 | ) | (29 | %) | |||||||||||
FY 2016 |
Reported GAAP Measures | Adjustments | Adjusted Measures | |||||||||||||||||||||||||||||
FY 2016 |
FY 2015 |
$ |
% |
FY 2016 |
FY 2015 |
FY 2016 |
FY 2015 |
$ Chg |
% |
|||||||||||||||||||||||
Sales | $ | 4,516,629 | $ | 4,719,290 | $ | (202,661 | ) | (4 | %) | $ | - | - | $ | 4,516,629 | $ | 4,719,290 | $ | (202,661 | ) | (4 | %) | |||||||||||
Gross Profit | 1,105,623 | 1,339,042 | (233,419 | ) | (17 | %) |
8,803 |
(1) |
- | 1,114,426 | 1,339,042 | (224,616 | ) | (17 | %) | |||||||||||||||||
Gross Profit % | 24.5% | 28.4% | - |
(389) |
24.7% | 28.4% | - |
(370) |
||||||||||||||||||||||||
Operating Exp. | 833,803 | 692,206 | 141,597 | 20 | % | (12,651 |
)(2) |
- | 821,152 | 692,206 | 128,946 | 19 | % | |||||||||||||||||||
Net Income | 212,948 | 455,361 | (242,413 | ) | (53 | %) |
13,515 |
(3) |
- | 226,463 | 455,361 | (228,898 | ) | (50 | %) | |||||||||||||||||
Diluted EPS | $ | 3.27 | $ | 6.75 | $ | (3.48 | ) | (52 | %) | $ | 0.21 | - | $ | 3.48 | $ | 6.75 | $ | (3.27 | ) | (48 | %) |
Adjustments: |
(1) Represents inventory step-up related to the TAP acquisition |
(2) Represents the acquisition costs and integration expenses related to the TAP acquisition |
(3) The company used its estimated statutory tax rate of ~37% for the non-GAAP adjustments |
2017 Adjusted Guidance: 2017 guidance excludes the pre-tax effect of TAP inventory step-up purchase accounting of approx. $15 million, acquisition integration costs of approx. $15 million and the impacts associated with the Victory wind down which could be in a range of $50 to $70 million in 2017. The Company is in the process of finalizing its analysis of the anticipated total costs to wind down the Victory motorcycle business and will provide more clarity as the analysis is completed and the costs are incurred throughout the year. 2017 sales guidance excludes any Victory wholegoods sales as the Company is exiting the brand beginning in 2017. |
Exhibit 99.2
Fourth Quarter & Full Year 2016 Earnings Results January 24, 2017 POLARIS INDUSTRIES INC.
Richard Edwards Director of Investor Relations Fourth Quarter & Full Year 2016 Earnings Results January 24, 2017 POLARIS INDUSTRIES INC. Q4 & FY'16 Earnings 2
Except for historical information contained herein, the matters set forth in this document, including but not limited to management’s expectations regarding future sales, shipments, margins, currencies, net income and cash flow, the opportunities for expansion and diversification of the Company’s business and the Company’s guidance on earnings per share are forward-looking statements that involve certain risks and uncertainties that could cause actual results to differ materially from those forward-looking statements. Potential risks and uncertainties include such factors as product offerings, promotional activities and pricing strategies by competitors; manufacturing operation expansion initiatives; acquisition integration costs; product recalls; warranty expenses; foreign currency exchange rate fluctuations; environmental and product safety regulatory activity; effects of weather; commodity costs; uninsured product liability claims; uncertainty in the retail and wholesale credit markets; performance of affiliate partners; changes in tax policy and overall economic conditions, including inflation, consumer confidence and spending and relationships with dealers and suppliers. Investors are also directed to consider other risks and uncertainties discussed in our 2015 annual report and Form 10-K and subsequent Form 10-Qs filed by the Company with the Securities and Exchange Commission. The Company does not undertake any duty to any person to provide updates to its forward-looking statements.The data source for retail sales figures included in this presentation is registration information provided by Polaris dealers in North America and compiled by the Company or Company estimates. The Company must rely on information that its dealers supply concerning retail sales, and other retail sales data sources and this information is subject to revision.Non-GAAP Measures - Constant Currency Reporting. This presentation includes information regarding the Company’s 2016 actual results and 2017 full year expectations on a constant currency basis, which is a non-GAAP measure, as well as on a GAAP basis. For purpose of comparison, the results on a constant currency basis uses the respective prior year exchange rates for the comparative period to enhance the visibility of the underlying business trends, excluding the impact of translation arising from foreign currency exchange rate fluctuations.This presentation also contains certain non-GAAP financial measures, consisting of “adjusted” gross profit, operating expenses, net income and net income per diluted share” as measures of our operating performance. Management believes these measures may be useful in performing meaningful comparisons of past and present operating results, to understand the performance of its ongoing operations and how management views the business. Reconciliations of adjusted non-GAAP measures to reported GAAP measures are included in the financial schedules contained in this presentation. These measures, however, should not be construed as an alternative to any other measure of performance determined in accordance with GAAP. Safe Harbor Q4 & FY'16 Earnings 3
Throughout this presentation, the word “Adjusted” is used to refer to GAAP results minus the following: TAP Inventory step-up purchase accountingTAP acquisition costs and integration expensesImpacts associated with the Victory wind downBeginning in 2017 a new reporting segment called “Aftermarket” was established which includes TAP plus our 5 aftermarket brands; 509, Klim, Kolpin, Pro Armor and Trail Tech, that were previously included in the ORV/Snowmobiles and Motorcycles reporting segments. 2016 sales and gross profit results will be reclassified to account for the fourth segment beginning in 2017 for comparison purposes.See slide 5 for GAAP to non-GAAP reconciliations Key Definitions Q4 & FY'16 Earnings 4
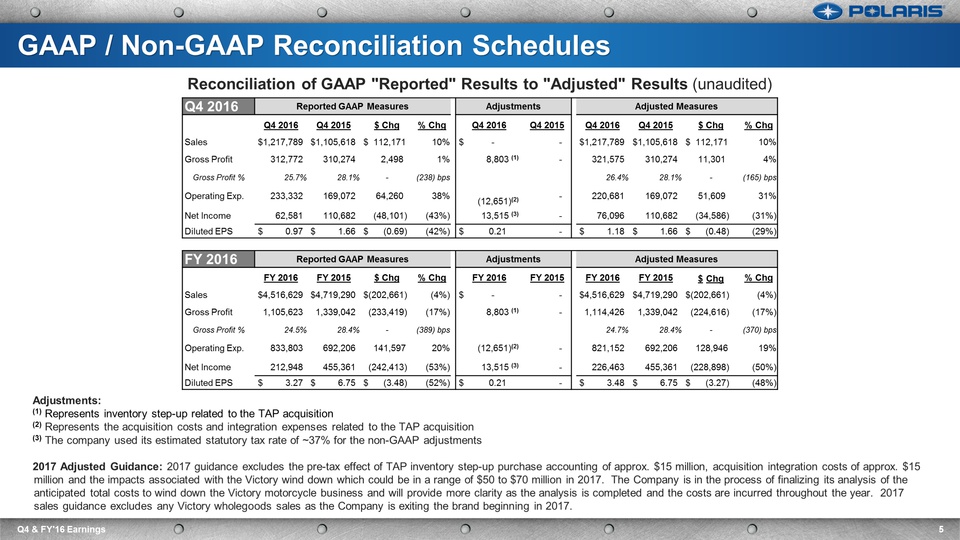
GAAP / Non-GAAP Reconciliation Schedules Reconciliation of GAAP "Reported" Results to "Adjusted" Results (unaudited) Q4 2016 Reported GAAP Measures Adjustments Adjusted Measures Q4 2016 Q4 2015 $ Chg % Chg Q4 2016 Q4 2015 Q4 2016 Q4 2015 $ Chg % Chg Sales $1,217,789 $1,105,618 $ 112,171 10% $ - - $1,217,789 $1,105,618 $ 112,171 10% Gross Profit 312,772 310,274 2,498 1% 8,803 (1) - 321,575 310,274 11,301 4% Gross Profit % 25.7% 28.1% - (238) bps 26.4% 28.1% - (165) bps Operating Exp. 233,332 169,072 64,260 38% (12,651)(2) - 220,681 169,072 51,609 31% Net Income 62,581 110,682 (48,101) (43%) 13,515 (3) - 76,096 110,682 (34,586) (31%) Diluted EPS $ 0.97 $ 1.66 $ (0.69) (42%) $ 0.21 - $ 1.18 $ 1.66 $ (0.48) (29%) FY 2016 Reported GAAP Measures Adjustments Adjusted Measures FY 2016 FY 2015 $ Chg % Chg FY 2016 FY 2015 FY 2016 FY 2015 $ Chg % Chg Sales $4,516,629 $4,719,290 $(202,661) (4%) $ - - $4,516,629 $4,719,290 $(202,661) (4%) Gross Profit 1,105,623 1,339,042 (233,419) (17%) 8,803 (1) - 1,114,426 1,339,042 (224,616) (17%) Gross Profit % 24.5% 28.4% - (389) bps 24.7% 28.4% - (370) bps Operating Exp. 833,803 692,206 141,597 20% (12,651)(2) - 821,152 692,206 128,946 19% Net Income 212,948 455,361 (242,413) (53%) 13,515 (3) - 226,463 455,361 (228,898) (50%) Diluted EPS $ 3.27 $ 6.75 $ (3.48) (52%) $ 0.21 - $ 3.48 $ 6.75 $ (3.27) (48%) Adjustments:(1) Represents inventory step-up related to the TAP acquisition(2) Represents the acquisition costs and integration expenses related to the TAP acquisition(3) The company used its estimated statutory tax rate of ~37% for the non-GAAP adjustments2017 Adjusted Guidance: 2017 guidance excludes the pre-tax effect of TAP inventory step-up purchase accounting of approx. $15 million, acquisition integration costs of approx. $15 million and the impacts associated with the Victory wind down which could be in a range of $50 to $70 million in 2017. The Company is in the process of finalizing its analysis of the anticipated total costs to wind down the Victory motorcycle business and will provide more clarity as the analysis is completed and the costs are incurred throughout the year. 2017 sales guidance excludes any Victory wholegoods sales as the Company is exiting the brand beginning in 2017. Q4 & FY'16 Earnings 5
Scott W. Wine Chairman & CEO Fourth Quarter & Full Year 2016 Earnings Results January 24, 2017 POLARIS INDUSTRIES INC. Q4 & FY'16 Earnings 6
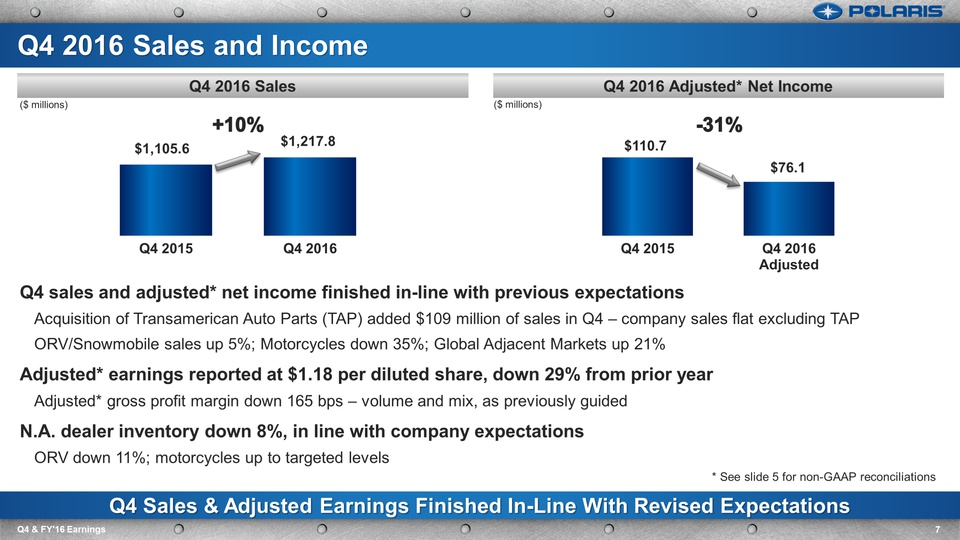
Q4 sales and adjusted* net income finished in-line with previous expectations Acquisition of Transamerican Auto Parts (TAP) added $109 million of sales in Q4 – company sales flat excluding TAP ORV/Snowmobile sales up 5%; Motorcycles down 35%; Global Adjacent Markets up 21% Adjusted* earnings reported at $1.18 per diluted share, down 29% from prior year Adjusted* gross profit margin down 165 bps – volume and mix, as previously guided N.A. dealer inventory down 8%, in line with company expectations ORV down 11%; motorcycles up to targeted levels Q4 Sales & Adjusted Earnings Finished In-Line With Revised Expectations Q4 2016 Adjusted* Net Income Q4 2016 Sales Q4 2016 Sales and Income -31% ($ millions) ($ millions) +10% * See slide 5 for non-GAAP reconciliations Q4 & FY'16 Earnings 7
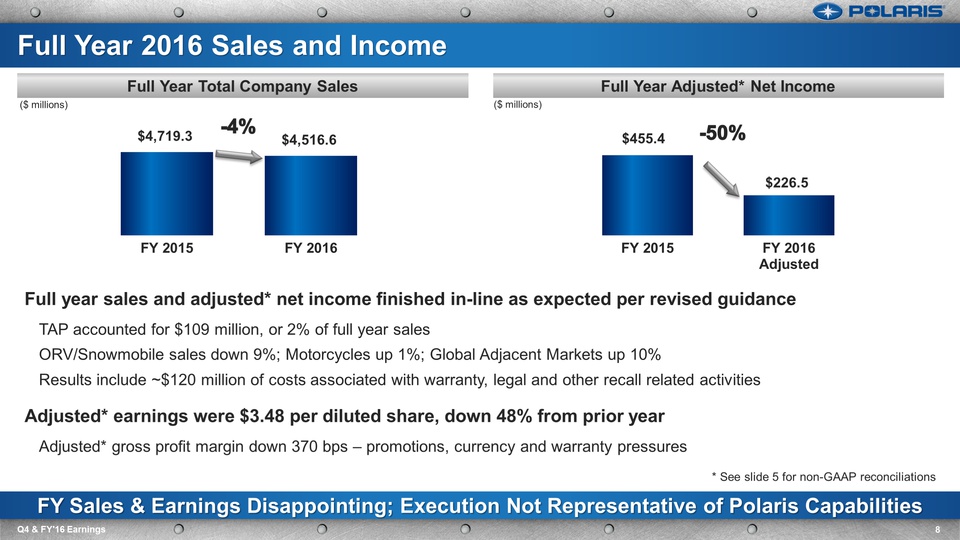
Full year sales and adjusted* net income finished in-line as expected per revised guidance TAP accounted for $109 million, or 2% of full year sales ORV/Snowmobile sales down 9%; Motorcycles up 1%; Global Adjacent Markets up 10% Results include ~$120 million of costs associated with warranty, legal and other recall related activities Adjusted* earnings were $3.48 per diluted share, down 48% from prior year Adjusted* gross profit margin down 370 bps – promotions, currency and warranty pressures FY Sales & Earnings Disappointing; Execution Not Representative of Polaris Capabilities Full Year Adjusted* Net Income Full Year Total Company Sales Full Year 2016 Sales and Income -50% ($ millions) ($ millions) -4% * See slide 5 for non-GAAP reconciliations Q4 & FY'16 Earnings 8
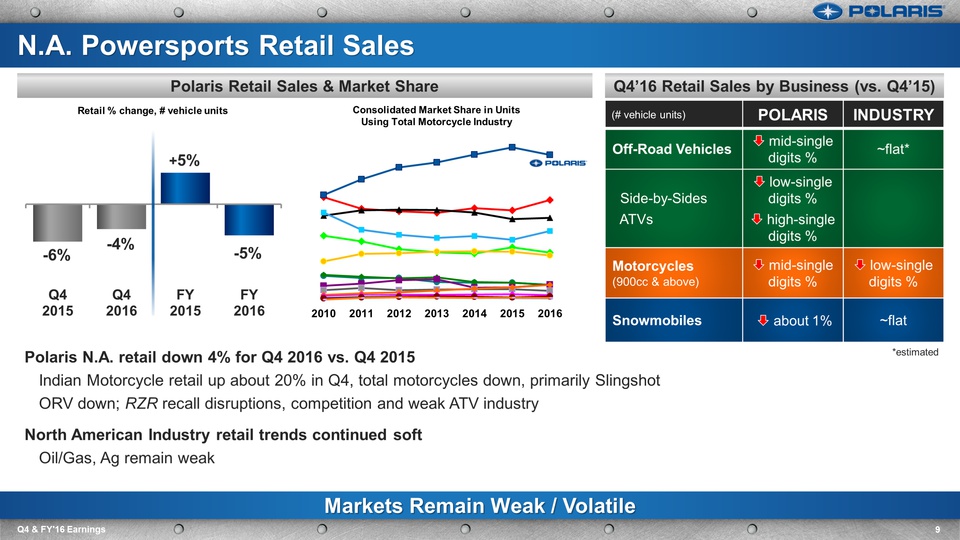
Polaris N.A. retail down 4% for Q4 2016 vs. Q4 2015 Indian Motorcycle retail up about 20% in Q4, total motorcycles down, primarily Slingshot ORV down; RZR recall disruptions, competition and weak ATV industry North American Industry retail trends continued soft Oil/Gas, Ag remain weak Markets Remain Weak / Volatile Q4’16 Retail Sales by Business (vs. Q4’15) Polaris Retail Sales & Market Share N.A. Powersports Retail Sales (# vehicle units) POLARIS INDUSTRY Off-Road Vehicles mid-single digits % ~flat* Side-by-Sides ATVs low-single digits % high-single digits % Motorcycles (900cc & above) mid-single digits % low-single digits % Snowmobiles about 1% ~flat *estimated Retail % change, # vehicle units Consolidated Market Share in UnitsUsing Total Motorcycle Industry Q4 & FY'16 Earnings 9
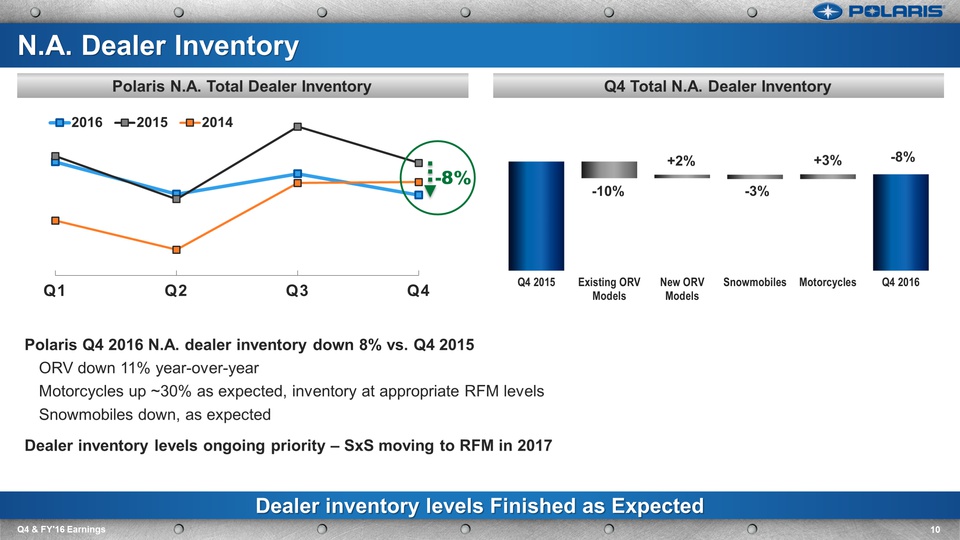
Polaris Q4 2016 N.A. dealer inventory down 8% vs. Q4 2015 ORV down 11% year-over-year Motorcycles up ~30% as expected, inventory at appropriate RFM levels Snowmobiles down, as expected Dealer inventory levels ongoing priority – SxS moving to RFM in 2017 Dealer inventory levels Finished as Expected Q4 Total N.A. Dealer Inventory Polaris N.A. Total Dealer Inventory N.A. Dealer Inventory -8% -8% Q4 & FY'16 Earnings 10
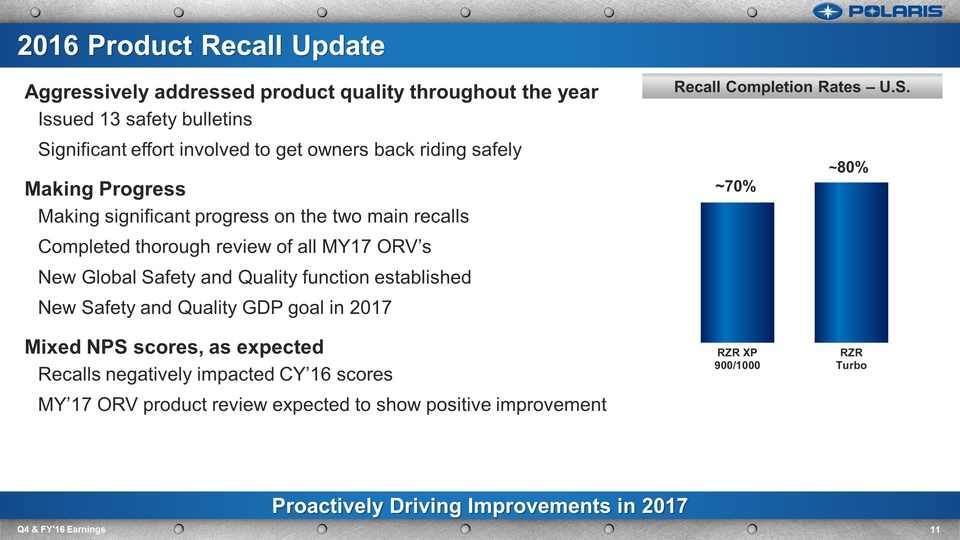
Aggressively addressed product quality throughout the year Issued 13 safety bulletins Significant effort involved to get owners back riding safely Making ProgressMaking significant progress on the two main recalls Completed thorough review of all MY17 ORV’s New Global Safety and Quality function established New Safety and Quality GDP goal in 2017 Mixed NPS scores, as expected Recalls negatively impacted CY’16 scores MY’17 ORV product review expected to show positive improvement Proactively Driving Improvements in 2017 2016 Product Recall Update Recall Completion Rates – U.S. Q4 & FY'16 Earnings 11
Very Passionate People Who Supported Victory Reason for Decision The company has lost money since inception in 1998 Sales of Victory are down ~20 percent from the peak in 2012 Limited investment dollars to support all three motorcycle brands Indian Motorcycle brand much more recognizable worldwide Positive impact on remaining motorcycle business Increased focus on remaining two brands (Indian/Slingshot) Increased R&D for product development acceleration Remove financial pressure of an unprofitable brand Victory Motorcycle Exit Q4 & FY'16 Earnings 12
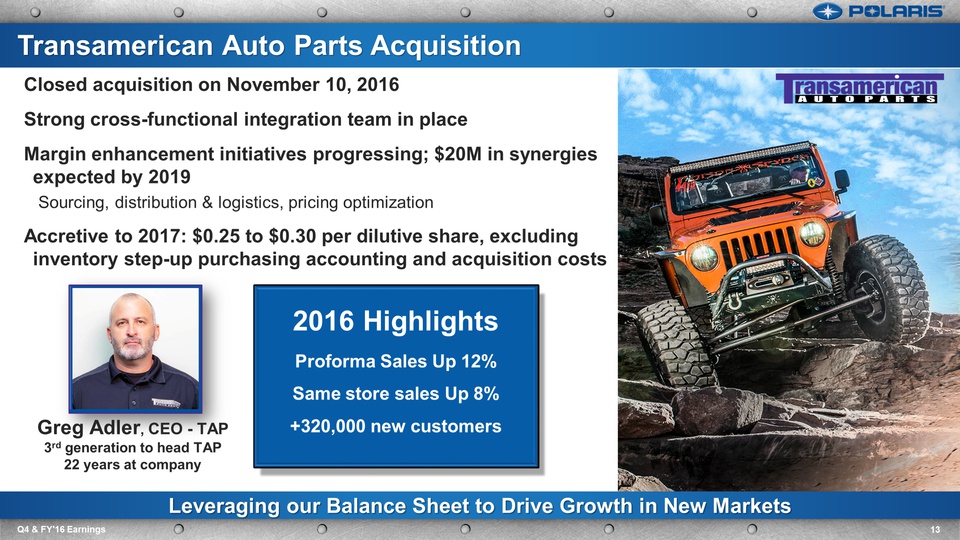
Closed acquisition on November 10, 2016 Strong cross-functional integration team in place Margin enhancement initiatives progressing; $20M in synergies expected by 2019 Sourcing, distribution & logistics, pricing optimization Accretive to 2017: $0.25 to $0.30 per dilutive share, excluding inventory step-up purchasing accounting and acquisition costs Transamerican Auto Parts Acquisition Greg Adler, CEO - TAP 3rd generation to head TAP 22 years at company 2016 Highlights Proforma Sales Up 12% Same store sales Up 8% +320,000 new customers Leveraging our Balance Sheet to Drive Growth in New Markets Q4 & FY'16 Earnings 13
Strategic Objectives Best in Powersports PLUS 5-8% annual organic growth Growth through Adjacencies >$2B from acquisitions & new markets Global Market Leadership >33% of Polaris revenue LEAN Enterprise is Competitive Advantage Significant Quality, Delivery & Cost Improvement Strong Financial Performance Sustainable, profitable growth Net Income Margin >10% Vision & Strategy Remain Unchanged, Reviewing Financial Goals Given Recent Performance >$8 Billion by 2020 12% CAGR >10% of Sales by 2020 13% CAGR = Under Review Q4 & FY'16 Earnings 14
Mike Speetzen EVP Finance & CFO Fourth Quarter & Full Year 2016 Earnings Results January 24, 2017 POLARIS INDUSTRIES INC. Q4 & FY'16 Earnings 15
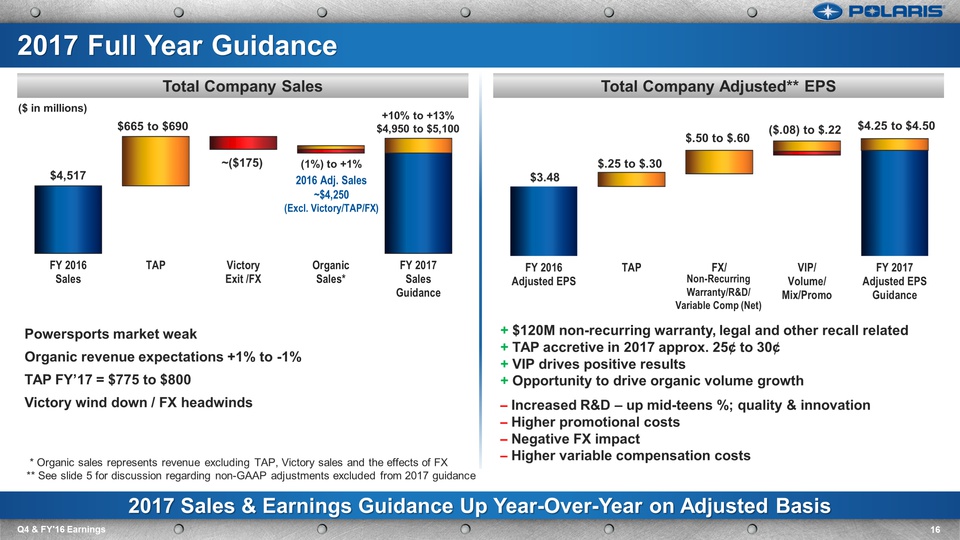
Powersports market weak Organic revenue expectations +1% to -1% TAP FY’17 = $775 to $800 Victory wind down / FX headwinds 2017 Sales & Earnings Guidance Up Year-Over-Year on Adjusted Basis Total Company Adjusted** EPS Total Company Sales 2017 Full Year Guidance + $120M non-recurring warranty, legal and other recall related + TAP accretive in 2017 approx. 25¢ to 30¢ + VIP drives positive results + Opportunity to drive organic volume growth – Increased R&D – up mid-teens %; quality & innovation – Higher promotional costs – Negative FX impact – Higher variable compensation costs ($ in millions) Non-Recurring Warranty/R&D/Variable Comp (Net) (1%) to +1% +10% to +13% $4,950 to $5,100 * Organic sales represents revenue excluding TAP, Victory sales and the effects of FX ** See slide 5 for discussion regarding non-GAAP adjustments excluded from 2017 guidance 2016 Adj. Sales ~$4,250 (Excl. Victory/TAP/FX) Q4 & FY'16 Earnings 16
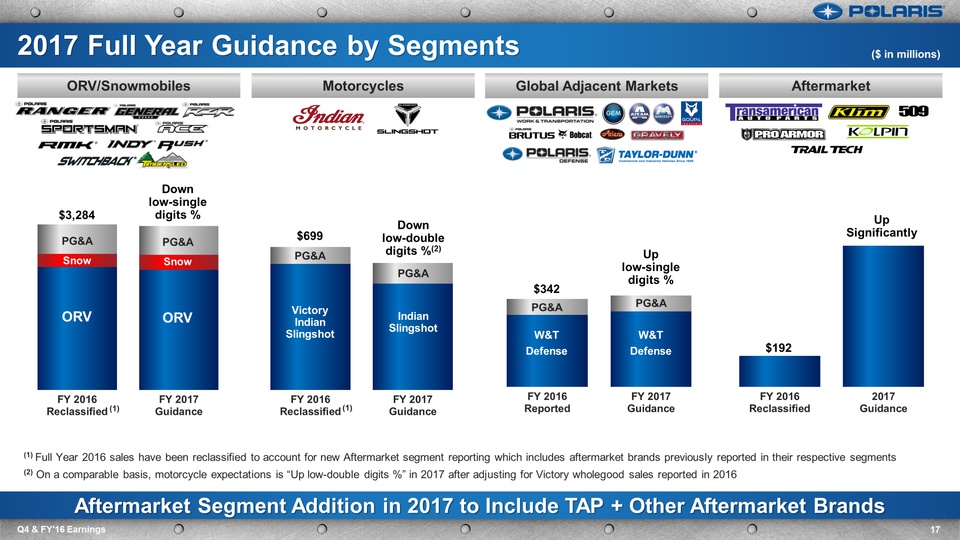
Aftermarket ORV/Snowmobiles Aftermarket Segment Addition in 2017 to Include TAP + Other Aftermarket Brands 2017 Full Year Guidance by Segments Global Adjacent Markets Motorcycles Down low-single digits % $3,284 ORV PG&A Snow ORV PG&A Snow PG&A $699 VictoryIndianSlingshot PG&A Down low-double digits %(2) IndianSlingshot PG&A PG&A W&T Defense W&T Defense Up low-single digits % $342 Up Significantly $192 ($ in millions) (1) (1) (1) Full Year 2016 sales have been reclassified to account for new Aftermarket segment reporting which includes aftermarket brands previously reported in their respective segments (2) On a comparable basis, motorcycle expectations is “Up low-double digits %” in 2017 after adjusting for Victory wholegood sales reported in 2016 Q4 & FY'16 Earnings 17
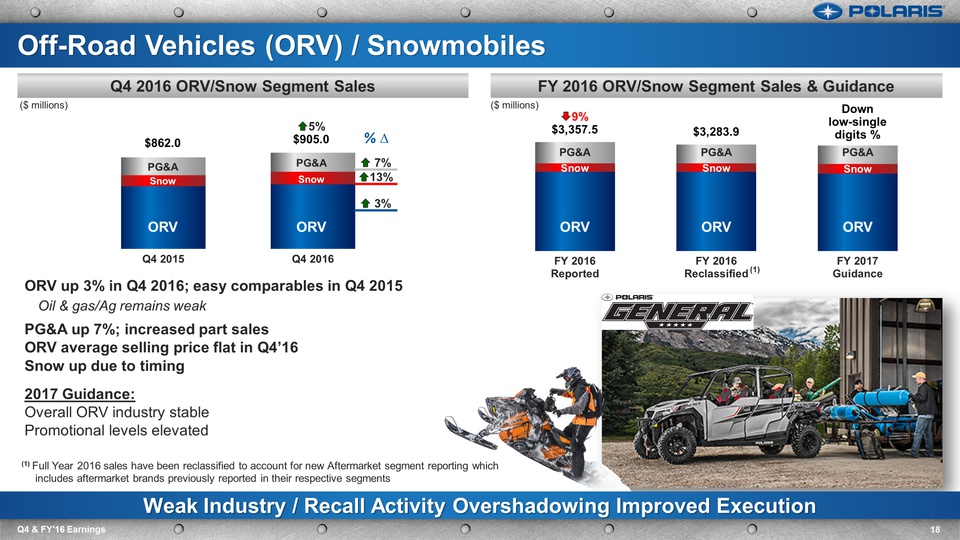
FY 2016 ORV/Snow Segment Sales & Guidance Q4 2016 ORV/Snow Segment Sales ORV up 3% in Q4 2016; easy comparables in Q4 2015 Oil & gas/Ag remains weak PG&A up 7%; increased part sales ORV average selling price flat in Q4’16 Snow up due to timing 2017 Guidance: Overall ORV industry stable Promotional levels elevated Off-Road Vehicles (ORV) / Snowmobiles 5% $905.0 ORV PG&A Snow $862.0 ORV PG&A Snow 7% 13% 3% % ∆ 9%$3,357.5 ORV PG&A Snow ORV ORV PG&A Snow PG&A Snow Down low-single digits % $3,283.9 ($ millions) ($ millions) (1) (1) Full Year 2016 sales have been reclassified to account for new Aftermarket segment reporting which includes aftermarket brands previously reported in their respective segments Weak Industry / Recall Activity Overshadowing Improved Execution Q4 & FY'16 Earnings 18
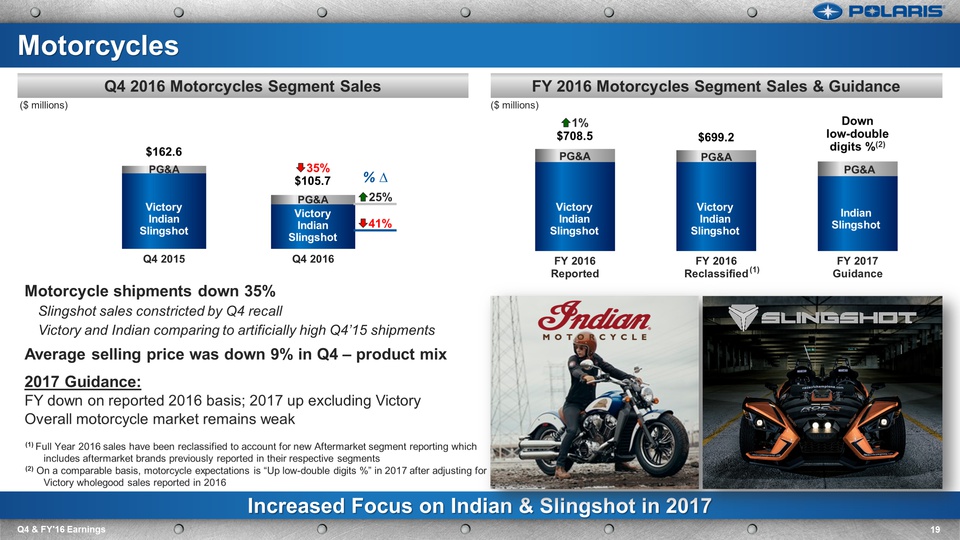
FY 2016 Motorcycles Segment Sales & Guidance Q4 2016 Motorcycles Segment Sales Increased Focus on Indian & Slingshot in 2017 Motorcycles Motorcycle shipments down 35% Slingshot sales constricted by Q4 recall Victory and Indian comparing to artificially high Q4’15 shipments Average selling price was down 9% in Q4 – product mix 2017 Guidance: FY down on reported 2016 basis; 2017 up excluding Victory Overall motorcycle market remains weak 35%$105.7 PG&A $162.6 PG&A 25% 41% % ∆ 1%$708.5 PG&A PG&A PG&A Down low-double digits %(2) $699.2 VictoryIndianSlingshot VictoryIndianSlingshot IndianSlingshot VictoryIndianSlingshot VictoryIndianSlingshot (1) ($ millions) ($ millions) (1) Full Year 2016 sales have been reclassified to account for new Aftermarket segment reporting which includes aftermarket brands previously reported in their respective segments (2) On a comparable basis, motorcycle expectations is “Up low-double digits %” in 2017 after adjusting for Victory wholegood sales reported in 2016 Q4 & FY'16 Earnings 19
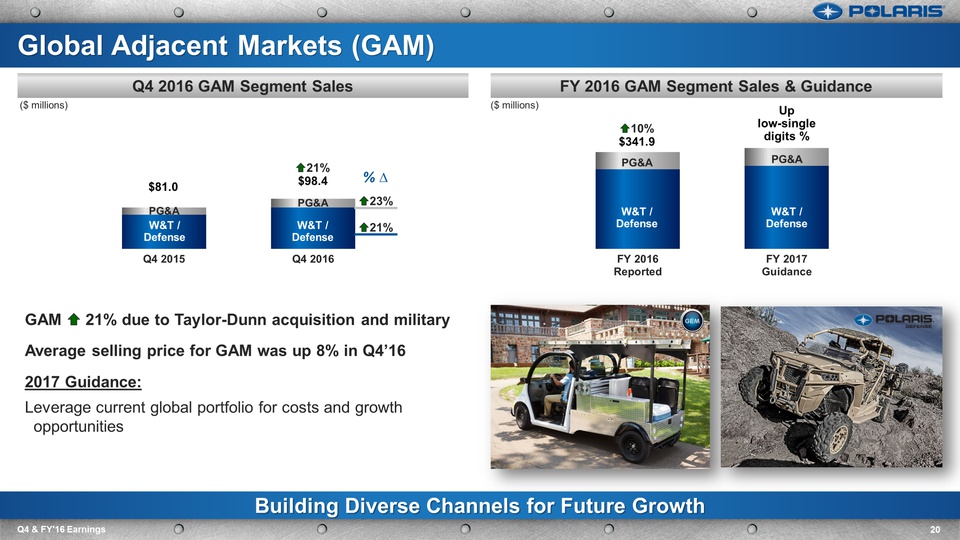
FY 2016 GAM Segment Sales & Guidance Q4 2016 GAM Segment Sales Global Adjacent Markets (GAM) GAM 21% due to Taylor-Dunn acquisition and military Average selling price for GAM was up 8% in Q4’16 2017 Guidance: Leverage current global portfolio for costs and growth opportunities 21%$98.4 PG&A $81.0 PG&A 23% 21% % ∆ 10%$341.9 PG&A PG&A Up low-single digits % W&T /Defense W&T /Defense ($ millions) ($ millions) W&T /Defense W&T /Defense Building Diverse Channels for Future Growth Q4 & FY'16 Earnings 20
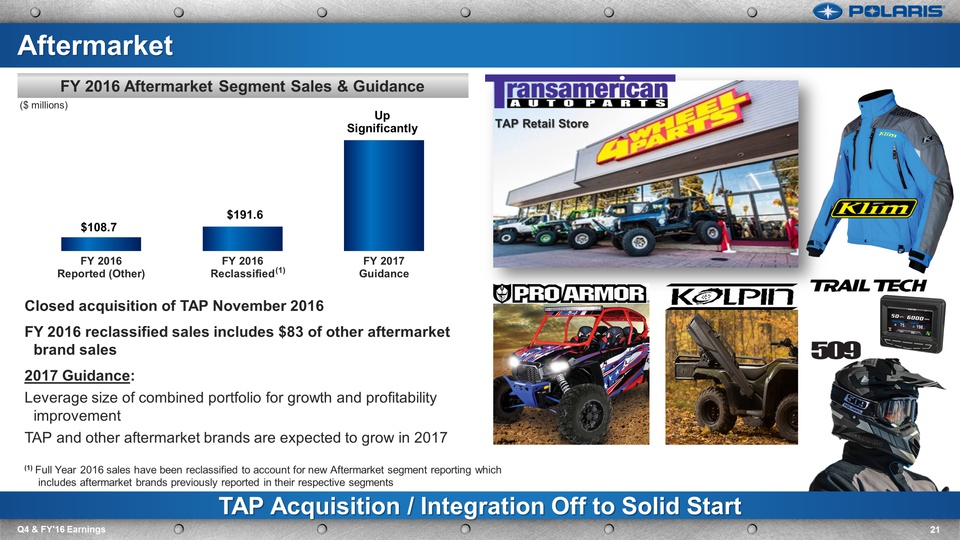
FY 2016 Aftermarket Segment Sales & Guidance TAP Acquisition / Integration Off to Solid Start Aftermarket UpSignificantly $191.6 (1) ($ millions) (1) Full Year 2016 sales have been reclassified to account for new Aftermarket segment reporting which includes aftermarket brands previously reported in their respective segments $108.7 Closed acquisition of TAP November 2016 FY 2016 reclassified sales includes $83 of other aftermarket brand sales 2017 Guidance: Leverage size of combined portfolio for growth and profitability improvement TAP and other aftermarket brands are expected to grow in 2017 TAP Retail Store Q4 & FY'16 Earnings 21
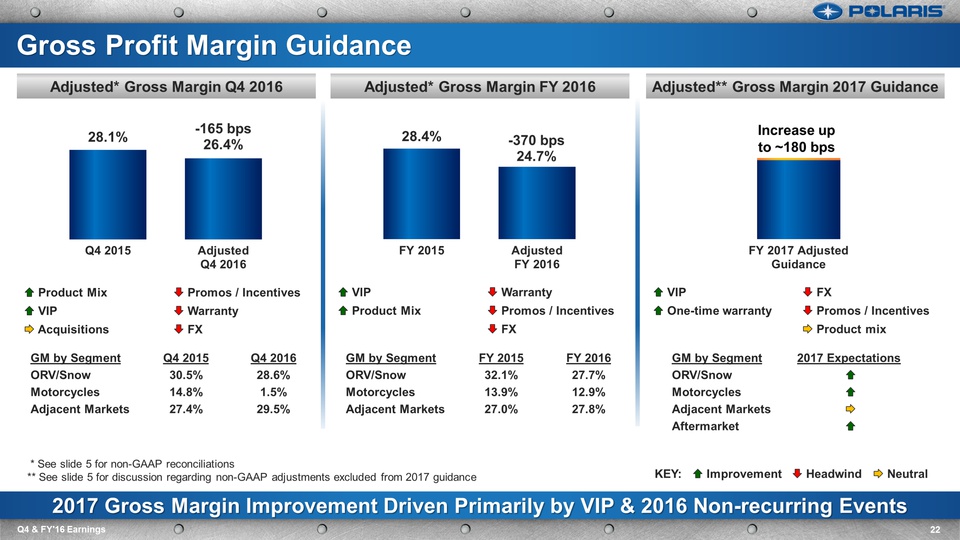
Adjusted** Gross Margin 2017 Guidance Adjusted* Gross Margin FY 2016 Adjusted* Gross Margin Q4 2016 2017 Gross Margin Improvement Driven Primarily by VIP & 2016 Non-recurring Events Gross Profit Margin Guidance Increase up to ~180 bps KEY: Improvement Headwind Neutral * See slide 5 for non-GAAP reconciliations** See slide 5 for discussion regarding non-GAAP adjustments excluded from 2017 guidance Product Mix VIP Acquisitions Promos / Incentives Warranty FX VIP Product Mix Warranty Promos / Incentives FX VIP One-time warranty FX Promos / Incentives Product mix GM by Segment Q4 2015 Q4 2016 ORV/Snow 30.5% 28.6% Motorcycles 14.8% 1.5% Adjacent Markets 27.4% 29.5% GM by Segment FY 2015 FY 2016 ORV/Snow 32.1% 27.7% Motorcycles 13.9% 12.9% Adjacent Markets 27.0% 27.8% GM by Segment 2017 Expectations ORV/Snow Motorcycles Adjacent Markets Aftermarket Q4 & FY'16 Earnings 22
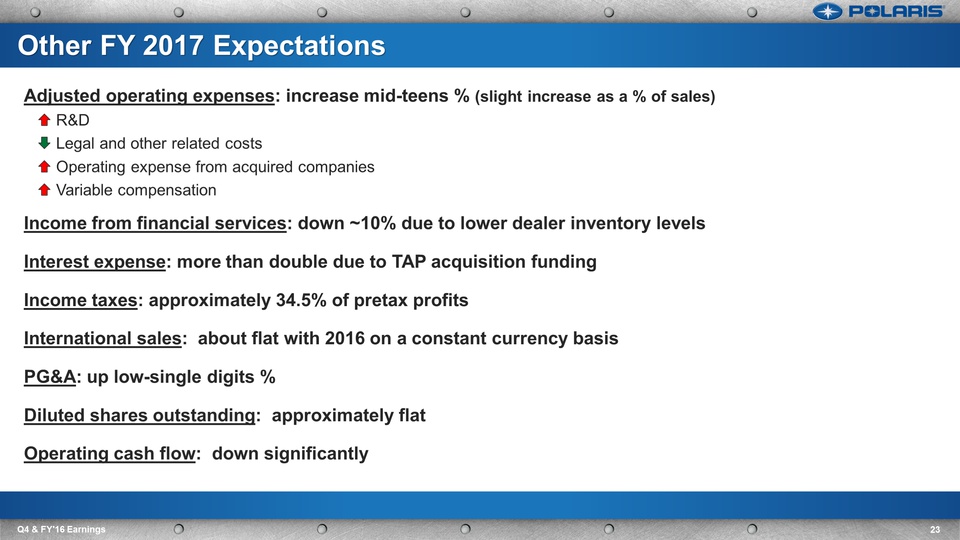
Adjusted operating expenses: increase mid-teens % (slight increase as a % of sales) R&D Legal and other related costs Operating expense from acquired companies Variable compensation Income from financial services: down ~10% due to lower dealer inventory levels Interest expense: more than double due to TAP acquisition funding Income taxes: approximately 34.5% of pretax profits International sales: about flat with 2016 on a constant currency basis PG&A: up low-single digits % Diluted shares outstanding: approximately flat Operating cash flow: down significantly Other FY 2017 Expectations Q4 & FY'16 Earnings 23
Scott W. Wine Chairman & CEO Fourth Quarter & Full Year 2016 Earnings Results January 24, 2017 POLARIS INDUSTRIES INC. Q4 & FY'16 Earnings 24
2017 - Regaining Footing as the ‘Best in Powersports” U.S economy stable - new administration brings uncertainty near-term Powersports competitors aggressive – ORV product positioning improved Safety & Quality fundamentals in place TAP integration proceeding on plan Indian Motorcycles outpacing industry VIP/RFM implementation building competitive advantage Closing Comments Q4 & FY'16 Earnings 25
Thank You Questions?
Q4 Supplemental Sales Performance – PG&A, International Q4 Financial Position Income from Financial Services Supplemental Data Q4 & FY'16 Earnings 27
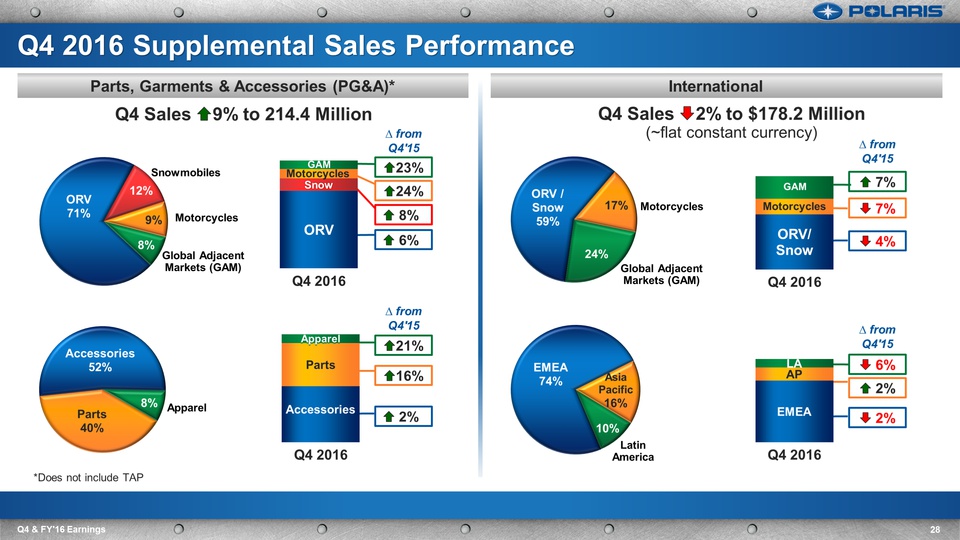
International Parts, Garments & Accessories (PG&A)* Q4 2016 Supplemental Sales Performance Motorcycles Global Adjacent Markets (GAM) Snowmobiles Motorcycles Global Adjacent Markets (GAM) Apparel 8% 23% LatinAmerica 24% 21% 7% 7% 6% 2% 4% 2% 6% 16% 2% Q4 Sales 9% to 214.4 Million ∆ from Q4'15 ∆ from Q4'15 Q4 Sales 2% to $178.2 Million (~flat constant currency) ∆ from Q4'15 ∆ from Q4'15 *Does not include TAP Q4 & FY'16 Earnings 28
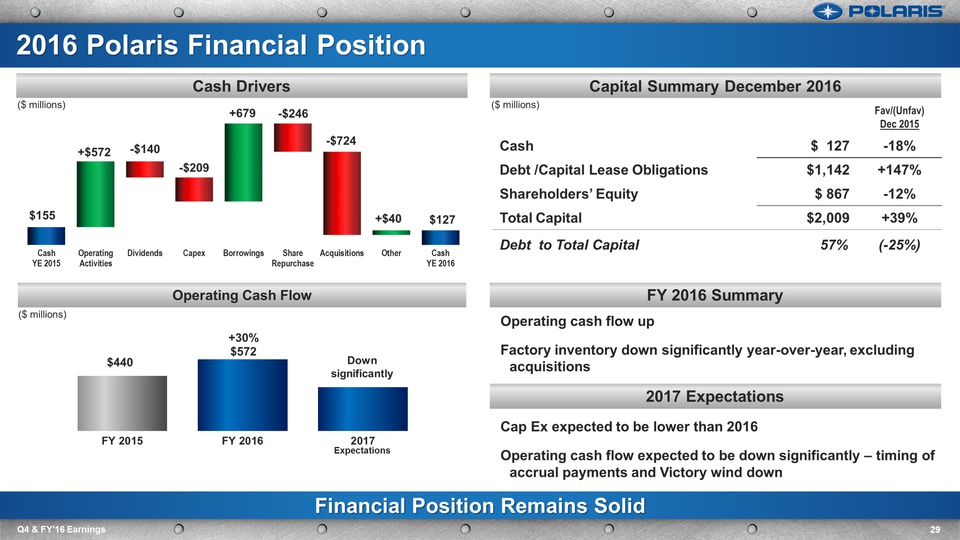
2016 Polaris Financial Position Capital Summary December 2016 Cash Drivers Fav/(Unfav) Dec 2015 Cash $127 -18% Debt /Capital Lease Obligations $1,142 +147% Shareholders’ Equity $867 -12% Total Capital $2,009 +39% Debt to Total Capital 57% (-25%) 2015 Operating cash flow up Factory inventory down significantly year-over-year, excluding acquisitions Cap Ex expected to be lower than 2016 Operating cash flow expected to be down significantly – timing of accrual payments and Victory wind down Operating Cash Flow Financial Position Remains Solid Down significantly ($ millions) ($ millions) ($ millions) Expectations FY 2016 Summary 2017 Expectations Q4 & FY'16 Earnings 29
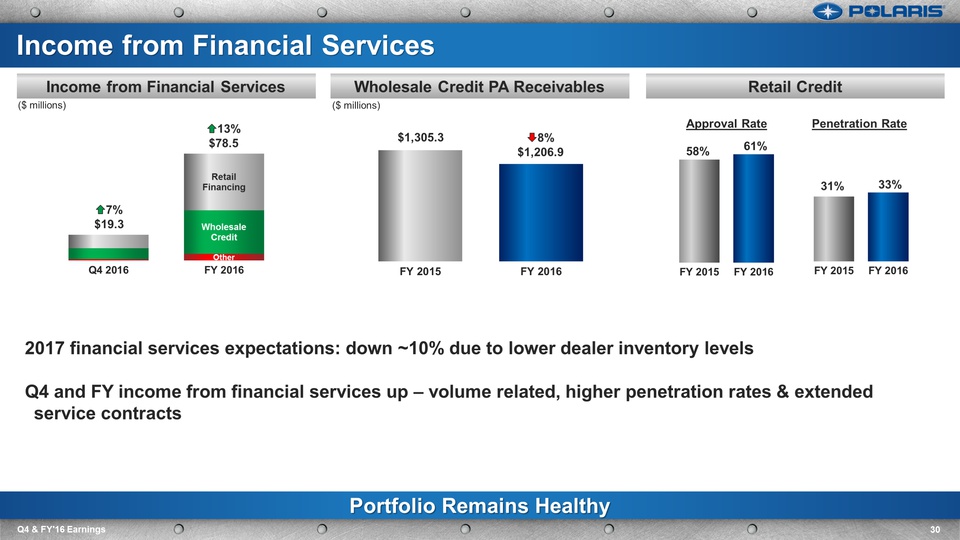
Retail Credit Wholesale Credit PA Receivables Income from Financial Services Portfolio Remains Healthy Income from Financial Services 2017 financial services expectations: down ~10% due to lower dealer inventory levels Q4 and FY income from financial services up – volume related, higher penetration rates & extended service contracts 7%$19.3 13%$78.5 8%$1,206.9 $1,305.3 ($ millions) ($ millions) Approval Rate Penetration Rate Q4 & FY'16 Earnings 30
O0=?6L_5+Z&.0
MWUD!)+M,DJ6]YMRPQR "?+<_W2.1UXJSI=\TL1TJ[M1-/! L,_G8#N2 V]L\
M<@\8X)K&N=671KLSZEIAAMBB(6\LAMQ)&W/\7ID_WL4 1WNNV6E^1:7]IY$3
M0^8EO'*$ J2*3UW+D#IW/-=)X;TR[UDO;:M<2QM&
MOF19B&TH #SG[R^XZ"@#F] TV[:11>2N$)7?9PS,^QL\-&<=_P"[^M=1%X=^
MV1O<74H2!969)8SO6,XP5''WL?AUQ4\%O!J5RR3W\%M$DG[PQW?EQ!<=8]V#
MG_9[]*6XURWT]5LY+H0VC@O'$+;,L[ X5@F5+'A6\S^'J!@F@#FM5O[35C!#>V"2I!(89
M+C8NUP>N"<*ZY['#>]#72:2\5QY-S&PC"J%0LCGD)L8' YP!SP.!4=_>WEO+
M \^NQHR.=D,,!#22;,-E2I 7OGK4]WJ\MI9"T&I+#&2N87C!!)7<9%49"GD=
MQ] : *&E7%MK,@BU>T87
:1/"Q(Y*D8/RXQMZUF-*LNHRZOJNDRW5_+-A(A"J,X!P[KQ
MSC@9SCM0!8EM+?2K^XNY&$-['&LA:/3
M[D!+,.C@ =/FQ^=:":@TWD!(C &!$BSY8,54@;<=3DCD>E9=DE[8WD4L,D)@
MG;;F)]K)P2,;NN3U^E6?].6%(#:F,.5;?(%;S#D[BN.G'4]* )X&:2("18T<
M ),I3DG<,#GJ/>IY)M.M)+A%
E4=(U864LLDFIJLL9(VSVSA-GW6C+$!0N3D'D8&/E(8>E &;IT^H:=KMQ;KH4
M>EQ&XE=%#&,3H2 X! VD[L'.>_UK5B\.WD&M2:FVGRHP ,3LZO\ .1@$E3RH
M'FKL4+O8N%^T06%M(94BD<, 1]U^3@DC*XQCN:;#KGA[Q-ICO9+=WKF;%M
M'+;& L>@; P-JX(+\@D#GF@!OB" ZQID*2KO:.5Y(S @4*X&&8D\*W'4\'WJ
M!8+:[LTUG3;^(Z<0?FNH3&)&'WE..I/;..:L?V1H5G>26<6JK+,,/(0N"N6&
MU608W@'//UI=
_P!FQC3[NQ22Z4[(_)C(^7T)_3-9>M:K9Z/;SM=J9[QSYD:L0/*)
MZ9('! X7ZUK^(7 MUNXH1<7;+@_O1SSP<#J >>.M<3;W4]FC7-];S37DLQ,:
M2KEY6SU_P7M0$2?4C:Q>3?ZQ+Y-V8O,5O+^:*(C[JKG[Y[DGITKCM>\3MJ^K
M0V-NGE6MNJ^6L8QN .0/J3SBKWBJ>X$+:;LQ)+())"P!*-UV;L9!'2L-XT
M@BB