Exhibit 15.2
Annual Report and Financial Statements 2021
Annual report and financial statements 2021
About us
RELX
is a global provider of information-based analytics and decision tools for professional and business customers, enabling them to make better decisions, get better results and be more productive. Our purpose is to benefit society by developing products that help researchers advance scientific knowledge; doctors and nurses improve the lives of patients; lawyers promote the rule of law and achieve justice and fair results for their clients; businesses and governments prevent fraud; consumers access financial services and get fair prices on insurance; and customers learn about markets and complete transactions.
Our purpose guides our actions beyond the products that we develop. It defines us as a company. Every day across RELX our employees are inspired to undertake initiatives that make unique contributions to society and the communities in which we operate.
Forward-looking statements
This Annual Report contains forward-looking statements within the meaning of Section 27A of the US Securities Act of 1933, as amended, and Section 21E of the US Securities Exchange Act of 1934, as amended. These statements are subject to risks and uncertainties that could cause actual results or outcomes of RELX PLC (together with its subsidiaries, "RELX", "we" or "our") to differ materially from those expressed in any forward-looking statement. We consider any statements that are not historical facts to be "forward-looking statements". The terms "outlook", "estimate", "forecast", "project", "plan", "intend", "expect", "should", "could", "will", "believe", "trends" and similar expressions may indicate a forward-looking statement. Important factors that could cause actual results or outcomes to differ materially from estimates or forecasts contained in the forward-looking statements include, among others: the impact of the Covid-19 pandemic as well as other pandemics or epidemics; current and future economic, political and market forces; changes in law and legal interpretations affecting RELX intellectual property rights and internet communications; regulatory and other changes regarding the collection, transfer or use of third-party content and data; changes in the payment model for RELX products; demand for RELX products and services; competitive factors in the industries in which RELX operates; inability to realise the future anticipated benefits of acquisitions; significant failure or interruption of RELX systems; exhibitors’ and attendees’ ability and desire to attend face-to-face events and availability of event venues; changes in economic cycles, severe weather events, natural disasters and terrorism; compromises of RELX cyber security systems or other unauthorised access to our databases; failure of third parties to whom RELX has outsourced business activities; inability to retain high-quality employees and management; legislative, fiscal, tax and regulatory developments; exchange rate fluctuations; and other risks referenced from time to time in the filings of RELX PLC with the US Securities and Exchange Commission. You should not place undue reliance on these forward-looking statements, which speak only as of the date of this Annual Report. Except as may be required by law, we undertake no obligation to publicly update or release any revisions to these forward-looking statements to reflect events or circumstances after the date of this Annual Report or to reflect the occurrence of unanticipated events.
RELX |
1 | |
| | ||
Contents

To download the full Annual Report and Financial
Statements, and for further information about
our businesses visit
relx.com


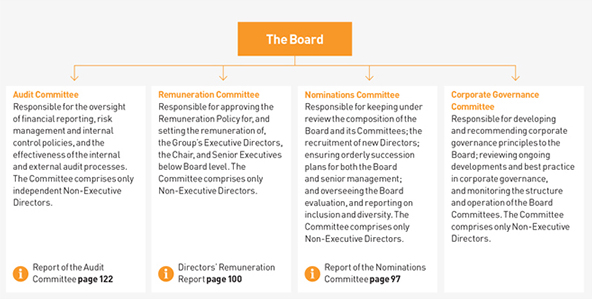
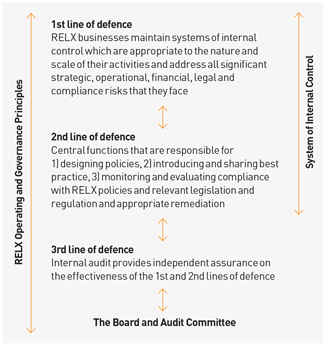
 Audit Committee
 Remuneration Committee
 Nominations Committee
 Corporate Governance Committee
 Committee Chair


 www.frc.org.uk