
HUANENG POWER INTERNATIONAL, INC.
Annual Report On Form 20-F
2015
|
As filed with the Securities and Exchange Commission on April 15, 2016
|
SECURITIES AND EXCHANGE COMMISSION
Washington, D.C. 20549
_______________________
FORM 20-F
(Mark One)
|
|
¨
|
REGISTRATION STATEMENT PURSUANT TO SECTION 12(b) OR (g) OF THE SECURITIES EXCHANGE ACT OF 1934
|
|
OR
|
|
|
þ
|
ANNUAL REPORT PURSUANT TO SECTION 13 OR 15 (d) OF THE SECURITIES EXCHANGE ACT OF 1934 FOR THE FISCAL YEAR ENDED DECEMBER 31, 2015
|
|
OR
|
|
|
¨
|
TRANSITION REPORT PURSUANT TO SECTION 13 OR 15 (d) OF THE SECURITIES EXCHANGE ACT OF 1934
|
|
OR
|
|
|
¨
|
SHELL COMPANY REPORT PURSUANT TO SECTION 13 OR 15(d) OF THE SECURITIES EXCHANGE ACT OF 1934
|
Date of event requiring this shell company report
For the transaction period form _______to ______________
Commission file number: 1-13314
HUANENG POWER INTERNATIONAL, INC.
(Exact name of Registrant as specified in its charter)
PEOPLE’S REPUBLIC OF CHINA
(Jurisdiction of incorporation or organization)
HUANENG BUILDING
6 FUXINGMENNEI STREET, XICHENG DISTRICT, BEIJING, PEOPLE’S REPUBLIC OF CHINA
(Address of principal executive offices)
Mr. Du Daming
HUANENG BUILDING,
6 FUXINGMENNEI STREET, XICHENG DISTRICT, BEIJING, PEOPLE’S REPUBLIC OF CHINA
Tel: +86 (10) 6322 6999 Fax: +86 (10) 6322 6888
(Name, Telephone, Email and/or Facsimile number and Address of Company Contact Person)
Securities registered or to be registered pursuant to Section 12(b) of the Act.
|
Title of Each Class
|
|
Name of each exchange
on which registered
|
|
American Depositary Shares Each Representing 40 Overseas Listed Shares
|
|
New York Stock Exchange
|
|
Overseas Listed Shares with Par Value of RMB1.00 Per Share
|
|
New York Stock Exchange*
|
Securities registered or to be registered pursuant to Section 12(g) of the Act.
NONE
(Title of Class)
_______________________
Securities for which there is a reporting obligation pursuant to Section 15(d) of the Act.
NONE
(Title of Class)
_______________________
Indicate the number of outstanding shares of each of the issuer’s classes of capital or common stock as of the close of the period covered by the annual report:
|
|
Domestic A Shares with Par Value of RMB1.00 Per Share
|
|
10,500,000,000
|
|
|
Overseas Listed Shares with Par Value of RMB1.00 Per Share
|
|
4,700,383,440
|
Indicate by check mark if the registrant is a well-known seasoned issuer, as defined in Rule 405 of the Securities Act.
Yes þ No ¨
If this report is an annual or transition report, indicate by check mark if the registrant is not required to file reports pursuant to Section 13 or 15(d) of the Securities Exchange Act of 1934.
Yes ¨ No þ
Note - Checking the box above will not relieve any registrant required to file reports pursuant to Section 13 or 15(d) of the Securities Exchange Act of 1934 from their obligations under those Sections.
Indicate by check mark whether the registrant (1) has filed all reports required to be filed by Section 13 or 15(d) of the Securities Exchange Act of 1934 during the preceding 12 months (or for such shorter period that the registrant was required to file such reports), and (2) has been subject to such filing requirements for the past 90 days.
Yes þ No ¨
Indicate by check mark whether the registrant has submitted electronically and posted on its corporate Web site, if any, every Interactive Data File required to be submitted and posted pursuant to Rule 405 of Regulation S-T (§232.405 of this chapter) during the preceding 12 months (or for such shorter period that the registrant was required to submit and post such files).
Yes ¨ No ¨
Indicate by check mark whether the registrant is a large accelerated filer, an accelerated filer, or a non-accelerated filer. See definition of “accelerated filer and large accelerated filer” in Rule 12b-2 of the Exchange Act. (Check one):
|
Large accelerated filer þ
|
|
Accelerated filer ¨
|
|
Non-accelerated filer ¨
|
Indicate by check mark which basis of accounting the registrant has used to prepare the financial statements included in this filing:
|
U.S. GAAP ¨
|
|
International Financial Reporting Standards as issued by the International Accounting Standards Board þ
|
|
Other ¨
|
If “Other” has been checked in response to the previous question, indicate by check mark which financial statement item the registrant has elected to follow.
Item 17 ¨ Item 18 ¨
If this is an annual report, indicate by check mark whether the registrant is a shell company (as defined in Rule 12b-2 of the Exchange Act).
Yes ¨ No þ
(APPLICABLE ONLY TO ISSUERS INVOLVED IN BANKRUPTCY PROCEEDINGS DURING THE PAST FIVE YEARS)
Indicate by check mark whether the registrant has filed all documents and reports required to be filed by Sections 12, 13 or 15(d) of the Securities Exchange Act of 1934 subsequent to the distribution of securities under a plan confirmed by a court.
Yes ¨ No ¨
________________________________
* Not for trading, but only in connection with the registration of American Depositary Shares
TABLE OF CONTENTS
|
PART I
|
|
1
|
||||||
|
|
|
ITEM 1
|
|
Identity of Directors, Senior Management and Advisers
|
|
1
|
||
|
|
|
ITEM 2
|
|
Offer Statistics and Expected Timetable
|
|
1
|
||
|
|
|
ITEM 3
|
|
Key Information
|
|
1
|
||
|
|
|
|
|
A.
|
|
Selected financial data
|
|
1
|
|
|
|
|
|
B.
|
|
Capitalization and indebtedness
|
|
3
|
|
|
|
|
|
C.
|
|
Reasons for the offer and use of proceeds
|
|
3
|
|
|
|
|
|
D.
|
|
Risk factors
|
|
3
|
|
|
|
ITEM 4
|
|
Information on the Company
|
|
12
|
||
|
|
|
|
|
A.
|
|
History and development of the Company
|
|
12
|
|
|
|
|
|
B.
|
|
Business overview
|
|
15
|
|
|
|
|
|
C.
|
|
Organizational structure
|
|
28
|
|
|
|
|
|
D.
|
|
Property, plants and equipment
|
|
29
|
|
|
|
ITEM 4A
|
|
Unresolved Staff Comments
|
|
65
|
||
|
|
|
ITEM 5
|
|
Operating and Financial Reviews and Prospects
|
|
65
|
||
|
|
|
|
|
A.
|
|
General
|
|
65
|
|
|
|
|
|
B.
|
|
Operating results
|
|
67
|
|
|
|
|
|
C.
|
|
Financial position
|
|
83
|
|
|
|
|
|
D.
|
|
Liquidity and cash resources
|
|
84
|
|
|
|
|
|
E.
|
|
Trend information
|
|
88
|
|
|
|
|
|
F.
|
|
Employee benefits
|
|
89
|
|
|
|
|
|
G.
|
|
Guarantees for loans and restricted assets
|
|
90
|
|
|
|
|
|
H.
|
|
Off-balance sheet arrangements
|
|
90
|
|
|
|
|
|
I.
|
|
Performance of significant investments and their prospects
|
|
90
|
|
|
|
|
|
J.
|
|
Tabular disclosure of contractual obligations and commercial commitments
|
|
91
|
|
|
|
|
|
K.
|
|
Impairment sensitivity analysis
|
|
92
|
|
|
|
|
|
L.
|
|
Prospects for 2016
|
|
93
|
|
|
|
ITEM 6
|
|
Directors, Senior Management and Employees
|
|
93
|
||
|
|
|
|
|
A.
|
|
Directors, members of the supervisory committee and senior management
|
|
93
|
|
|
|
|
|
B.
|
|
Compensation for Directors, Supervisors and Executive Officers
|
|
97
|
|
|
|
|
|
C.
|
|
Board practice
|
|
98
|
|
|
|
|
|
D.
|
|
Employees
|
|
99
|
|
|
|
|
|
E.
|
|
Share ownership
|
|
99
|
|
|
|
ITEM 7
|
|
Major Shareholders and Related Party Transactions
|
|
99
|
||
|
|
|
|
|
A.
|
|
Major shareholders
|
|
100
|
|
|
|
|
|
B.
|
|
Related party transactions
|
|
102
|
|
|
|
|
|
C.
|
|
Interests of experts and counsel
|
|
110
|
|
|
|
ITEM 8
|
|
Financial Information
|
|
110
|
||
|
|
|
|
|
A.
|
|
Consolidated statements and other financial information
|
|
110
|
|
|
|
|
|
B.
|
|
Significant changes
|
|
110
|
|
|
|
ITEM 9
|
|
The Offer and Listing
|
|
111
|
||
|
|
|
|
|
A.
|
|
Offer and listing details and markets
|
|
111
|
|
|
|
ITEM 10
|
|
Additional Information
|
|
112
|
||
|
|
|
|
|
A.
|
|
Share capital
|
|
112
|
|
|
|
|
|
B.
|
|
Memorandum and articles of association
|
|
112
|
|
|
|
|
|
C.
|
|
Material contracts
|
|
119
|
|
|
|
|
|
D.
|
|
Exchange controls
|
|
119
|
|
|
|
|
|
E.
|
|
Taxation
|
|
120
|
|
|
|
|
|
F.
|
|
Dividends and paying agents
|
|
126
|
|
|
|
|
|
G.
|
|
Statement by experts
|
|
126
|
|
|
|
|
|
H.
|
|
Documents on display
|
|
126
|
|
|
|
|
|
I.
|
|
Subsidiary information
|
|
126
|
|
|
|
ITEM 11
|
|
Quantitative and Qualitative Disclosures About Market Risk
|
|
126
|
||
|
|
|
ITEM 12
|
|
Description of Securities Other than Equity Securities
|
|
133
|
||
i
|
|
|
|
|
A.
|
|
Debt Securities
|
|
133
|
|
|
|
|
|
B.
|
|
Warrants and Rights
|
|
133
|
|
|
|
|
|
C.
|
|
Other Securities
|
|
133
|
|
|
|
|
|
D.
|
|
American Depositary Shares
|
|
133
|
|
PART II
|
|
134
|
|
|
|
ITEM 13
|
|
Defaults, Dividend Arrearages and Delinquencies
|
|
134
|
|
|
|
ITEM 14
|
|
Material Modifications to the Rights of Security Holders and Use of Proceeds
|
|
134
|
|
|
|
ITEM 15
|
|
Controls and Procedures
|
|
134
|
|
|
|
ITEM 16
|
|
Reserved
|
|
136
|
|
|
|
ITEM 16A
|
|
Audit Committee Financial Expert
|
|
136
|
|
|
|
ITEM 16B
|
|
Code of Ethics
|
|
136
|
|
|
|
ITEM 16C
|
|
Principal Accountant Fees and Services
|
|
136
|
|
|
|
ITEM 16D
|
|
Exemptions from the Listing Standards for Audit Committees
|
|
137
|
|
|
|
ITEM 16E
|
|
Purchases of Equity Securities by the Issuer and Affiliated Purchasers
|
|
137
|
|
|
|
ITEM 16F
|
|
Change in Registrant’s Certifying Accountant
|
|
137
|
|
|
|
ITEM 16G
|
|
Corporate Governance
|
|
137
|
|
|
|
ITEM 16H
|
|
Mine Safety Disclosure
|
|
141
|
|
|
|
ITEM 17
|
|
Financial Statements
|
|
141
|
|
|
|
ITEM 18
|
|
Financial Statements
|
|
141
|
|
|
|
ITEM 19
|
|
Exhibits
|
|
141
|
ii
INTRODUCTION
We maintain our accounts in Renminbi Yuan (“Renminbi” or “RMB”), the lawful currency of the People’s Republic of China (the “PRC” or “China”). References herein to “US$” or “U.S. dollars” are to United States Dollars, references to “HK$” are to Hong Kong Dollars, and references to “S$” are to Singapore Dollars. References to ADRs and ADSs are to American Depositary Receipts and American Depositary Shares, respectively. Translations of amounts from Renminbi to U.S. Dollars are solely for the convenience of the reader. Unless otherwise indicated, any translations from Renminbi to U.S. Dollars or from U.S. Dollars to Renminbi were translated at the average rate announced by the People’s Bank of China (the “PBOC Rate”) on December 31, 2015 of US$1.00 to RMB6.4936. No representation is made that the Renminbi or U.S. Dollar amounts referred to herein could have been or could be converted into U.S. Dollars or Renminbi, as the case may be, at the PBOC Rate or at all.
References to “A Shares” are to common tradable shares issued to domestic shareholders.
References to the “central government” refer to the national government of the PRC and its various ministries, agencies and commissions.
References to the “Company”, “we”, “our” and “us” include, unless the context requires otherwise, Huaneng Power International, Inc. and the operations of our power plants and our construction projects.
References to “HIPDC” are to Huaneng International Power Development Corporation and, unless the context requires otherwise, include the operations of the Company prior to the formation of the Company on June 30, 1994.
References to “Huaneng Group” are to China Huaneng Group.
References to the “key contracts” refer to coal purchase contracts entered into between the Company and coal suppliers for the amount of coals at the annual national coal purchase conferences attended by, among others, representatives of power companies, coal suppliers and railway authorities. These conferences were coordinated and sponsored by National Development and Reform Commission (“NDRC”). The Company enjoys priority railway transportation services with respect to coal purchased under such contracts. Starting from 2008, NDRC ceased to coordinate the annual national coal purchase conferences. At the end of each year subsequent to 2008, the National Railway Administration (previously, the Ministry of Railways) will promulgate the railway transportation capacity plan for the next year. References to the “key contracts” for the year 2008 and thereafter refer to coal purchase contracts entered into between the Company and coal suppliers under the guidance of such railway transportation capacity plan, which, once confirmed by the National Railway Administration, secures the railway transportation capacity for the coal purchased thereunder. Starting from the beginning of 2013, key contracts were terminated pursuant to a notice issued by the PRC Government in December 2012.
References to “local governments” in the PRC are to governments at all administrative levels below the central government, including provincial governments, governments of municipalities directly under the central government, municipal and city governments, county governments and township governments.
References to “our power plants” are to the power plants that are wholly owned by the Company or to the power plants in which the Company owns majority equity interests.
References to the “PRC Government” include the central government and local governments.
References to “provinces” include provinces, autonomous regions and municipalities directly under the central government.
iii
References to “Singapore” are to the Republic of Singapore.
References to the “State Plan” refer to the plans devised and implemented by the PRC Government in relation to the economic and social development of the PRC.
References to “tons” are to metric tons.
Previously, the Overseas Listed Foreign Shares were also referred to as the “Class N Ordinary Shares” or “N Shares”. Since January 21, 1998, the date on which the Overseas Listed Foreign Shares were listed on The Stock Exchange of Hong Kong Limited by way of introduction, the Overseas Listed Foreign Shares have been also referred to as “H Shares”.
iv
GLOSSARY
|
actual generation
|
The total amount of electricity generated by a power plant over a given period of time.
|
|
auxiliary power
|
Electricity consumed by a power plant in the course of generation.
|
|
availability factor
|
For any period, the ratio (expressed as a percentage) of a power plant’s available hours to the total number of hours in such period.
|
|
available hours
|
For a power plant for any period, the total number of hours in such period less the total number of hours attributable to scheduled maintenance and planned overhauls as well as to forced outages, adjusted for partial capacity outage hours.
|
|
capacity factor
|
The ratio (expressed as a percentage) of the gross amount of electricity generated by a power plant in a given period to the product of (i) the number of hours in the given period multiplied by (ii) the power plant’s installed capacity.
|
|
demand
|
For an integrated power system, the amount of power demanded by consumers of energy at any point in time.
|
|
dispatch
|
The schedule of production for all the generating units on a power system, generally varying from moment to moment to match production with power requirements. As a verb, to dispatch a plant means to direct the plant to operate.
|
|
GW
|
Gigawatt. One million kilowatts.
|
|
GWh
|
Gigawatt-hour. One million kilowatt-hours. GWh is typically used as a measure for the annual energy production of large power plants.
|
|
installed capacity
|
The manufacturers’ rated power output of a generating unit or a power plant, usually denominated in MW.
|
|
kV
|
Kilovolt. One thousand volts.
|
|
kW
|
Kilowatt. One thousand watts.
|
|
kWh
|
Kilowatt-hour. The standard unit of energy used in the electric power industry. One kilowatt-hour is the amount of energy that would be produced by a generator producing one thousand watts for one hour.
|
|
MVA
|
Million volt-amperes. A unit of measure used to express the capacity of electrical transmission equipment such as transformers.
|
|
MW
|
Megawatt. One million watts. The installed capacity of power plants is generally expressed in MW.
|
|
MWh
|
Megawatt-hour. One thousand kilowatt-hours.
|
|
peak load
|
The maximum demand on a power plant or power system during a specific period of time.
|
|
planned generation
|
An annually determined target gross generation level for each of our operating power plants used as the basis for determining planned output.
|
v
|
total output
|
The actual amount of electricity sold by a power plant in a particular year, which equals total generation less auxiliary power.
|
|
transmission losses
|
Electric energy that is lost in transmission lines and therefore is unavailable for use.
|
vi
PART I
|
ITEM 1
|
Identity of Directors, Senior Management and Advisers
|
Not applicable.
|
ITEM 2
|
Offer Statistics and Expected Timetable
|
Not applicable.
|
ITEM 3
|
Key Information
|
|
A.
|
Selected financial data
|
Our consolidated data of financial position as of December 31, 2015 and 2014 and the consolidated income statement and cash flow data for each of the years in the three-year period ended December 31, 2015 are derived from the historical financial statements included herein. Our consolidated data of financial position as of December 31, 2013, 2012 and 2011 and consolidated income statement and cash flow data for each of the years in the two-year period ended December 31, 2012, are derived from the historical financial statements not included herein. The Selected Financial Data should be read in conjunction with the consolidated financial statements and “Item 5 Operating and Financial Reviews and Prospects”. The financial statements have been prepared in accordance with International Financial Reporting Standards (“IFRS”) as issued by the International Accounting Standards Board. The Selected Financial Data may not be indicative of future earnings, cash flows or financial position.
|
|
|
Year Ended December 31,
|
|
||||||||||||||||
|
|
|
2011
|
|
|
2012
|
|
|
2013
|
|
|
2014
|
|
2015
|
||||||
|
RMB in thousands except per share data
|
|
(RMB)
|
|
|
(RMB)
|
|
|
(RMB)
|
|
|
(RMB)
|
|
(RMB)
|
||||||
|
Consolidated Income Statement Data
|
|
|
|
|
|
|
|
|
|
|
|
|
|||||||
|
|
|
|
|
|
|
|
|
|
|
|
|
|
|||||||
|
Operating revenue
|
|
|
133,420,769
|
|
|
|
133,966,659
|
|
|
|
133,832,875
|
|
|
125,406,855
|
|
128,904,873
|
|||
|
Tax and levies on operations
|
|
|
(484,019
|
)
|
|
|
(672,040
|
)
|
|
|
(1,043,855
|
)
|
|
(932,485
|
)
|
(1,157,760
|
) | ||
|
Operating expenses
|
|
|
(124,189,148
|
)
|
|
|
(116,337,679
|
)
|
|
|
(108,677,981
|
)
|
|
(99,199,728
|
)
|
(98,604,187
|
) | ||
|
Profit from operations
|
|
|
8,747,602
|
|
|
|
16,956,940
|
|
|
|
24,111,039
|
|
|
25,274,642
|
|
29,142,926
|
|||
|
Interest income
|
|
|
166,183
|
|
|
|
175,402
|
|
|
|
170,723
|
|
|
159,550
|
|
160,723
|
|||
|
Financial expenses, net
|
|
|
(7,659,712
|
)
|
|
|
(9,063,875
|
)
|
|
|
(7,693,363
|
)
|
|
(7,823,606
|
)
|
(7,970,070)
|
|||
|
Other investment income
|
|
|
93,460
|
|
|
|
187,131
|
|
|
|
224,908
|
|
|
80,580
|
|
115,238
|
|||
|
(Loss)/Gain on fair value changes of financial assets/ liabilities
|
|
|
(727
|
)
|
|
|
(1,171
|
)
|
|
|
(5,701
|
)
|
|
42,538
|
|
(16,742
|
) | ||
|
Share of profits less losses of associates and joint ventures
|
|
|
703,561
|
|
|
|
622,358
|
|
|
|
615,083
|
|
|
1,315,876
|
|
1,525,975
|
|||
|
Profit before income tax expense
|
|
|
2,050,367
|
|
|
|
8,876,785
|
|
|
|
17,422,689
|
|
|
19,049,580
|
|
22,958,050
|
|||
|
Income tax expense
|
|
|
(868,927
|
)
|
|
|
(2,510,370
|
)
|
|
|
(4,522,671
|
)
|
|
(5,487,208
|
)
|
(5,698,943
|
) | ||
|
Net profit
|
|
|
1,181,440
|
|
|
|
6,366,415
|
|
|
|
12,900,018
|
|
|
13,562,372
|
|
17,259,107
|
|||
|
Attributable to:
|
|
|
|
|
|
|
|
|
|
|
|
|
|
|
|
||||
|
Equity holders of the Company
|
|
|
1,180,512
|
|
|
|
5,512,454
|
|
|
|
10,426,024
|
|
|
10,757,317
|
|
13,651,933
|
|||
|
Non-controlling interests
|
|
|
928
|
|
|
|
853,961
|
|
|
|
2,473,994
|
|
|
2,805,055
|
|
3,607,174
|
|||
|
Basic earnings per share
|
|
|
0.08
|
|
|
|
0.39
|
|
|
|
0.74
|
|
|
0.76
|
|
0.94
|
|||
|
Diluted earnings per share
|
|
|
0.08
|
|
|
|
0.39
|
|
|
|
0.74
|
|
|
0.76
|
|
0.94
|
|||
1
|
|
|
As of December 31,
|
|||||||||||||||||
|
|
|
2011
|
|
|
2012
|
|
|
2013
|
|
|
2014
|
|
2015
|
|
|||||
|
RMB in thousands
|
|
(RMB)
|
|
|
(RMB)
|
|
|
(RMB)
|
|
|
(RMB)
|
|
(RMB)
|
|
|||||
|
|
|
|
|
|
|
|
|
|
|
|
|
|
|
|
|
||||
|
Consolidated Financial Position Data
|
|
|
|
|
|
|
|
|
|
|
|
|
|
|
|
||||
|
|
|
|
|
|
|
|
|
|
|
|
|
|
|
|
|
||||
|
Current assets
|
|
|
36,417,338
|
|
|
|
36,086,261
|
|
|
|
34,186,911
|
|
|
37,865,284
|
|
|
|
33,565,403
|
|
|
Property, plant and equipment
|
|
|
177,968,001
|
|
|
|
177,013,627
|
|
|
|
181,415,181
|
|
|
188,379,057
|
|
|
|
219,673,070
|
|
|
Available-for-sale financial assets
|
|
|
2,301,167
|
|
|
|
3,052,822
|
|
|
|
3,111,164
|
|
|
4,333,377
|
|
|
|
5,077,863
|
|
|
Investments in associates and joint ventures
|
|
|
13,588,012
|
|
|
|
14,596,771
|
|
|
|
16,678,694
|
|
|
17,626,910
|
|
|
|
19,745,192
|
|
|
Land use rights and other non-current assets
|
|
|
8,820,722
|
|
|
|
9,316,455
|
|
|
|
9,593,252
|
|
|
10,636,352
|
|
|
|
14,384,078
|
|
|
Power generation license
|
|
|
3,904,056
|
|
|
|
4,084,506
|
|
|
|
3,837,169
|
|
|
3,720,959
|
|
|
|
3,679,175
|
|
|
Deferred income tax assets
|
|
|
526,399
|
|
|
|
532,387
|
|
|
|
652,358
|
|
|
884,274
|
|
|
|
1,064,391
|
|
|
Goodwill
|
|
|
13,890,179
|
|
|
|
14,417,543
|
|
|
|
12,758,031
|
|
|
11,725,555
|
|
|
|
11,677,182
|
|
|
Total assets
|
|
|
257,415,874
|
|
|
|
259,100,372
|
|
|
|
262,232,760
|
|
|
275,171,768
|
|
|
|
308,866,354
|
|
|
Current liabilities
|
|
|
(96,597,620
|
)
|
|
|
(93,594,320
|
)
|
|
|
(98,978,845
|
)
|
|
(104,846,121
|
)
|
|
|
(123,836,633)
|
|
|
Non-current liabilities
|
|
|
(101,260,501
|
)
|
|
|
(99,545,710
|
)
|
|
|
(88,060,941
|
)
|
|
(85,542,941
|
)
|
|
|
(83,336,032)
|
|
|
Total liabilities
|
|
|
(197,858,121
|
)
|
|
|
(193,140,030
|
)
|
|
|
(187,039,786
|
)
|
|
(190,389,062
|
)
|
|
|
(207,172,665)
|
|
|
Total equity
|
|
|
59,557,753
|
|
|
|
65,960,342
|
|
|
|
75,192,974
|
|
|
84,782,706
|
|
|
|
101,693,689
|
|
|
|
|
Year Ended December 31,
|
|
||||||||||||||||
|
|
|
2011
|
|
|
2012
|
|
|
2013
|
|
|
2014
|
|
2015
|
|
|||||
|
RMB in thousands except per share data
|
|
(RMB)
|
|
|
(RMB)
|
|
|
(RMB)
|
|
|
(RMB)
|
|
(RMB)
|
|
|||||
|
|
|
|
|
|
|
|
|
|
|
|
|
|
|
|
|
||||
|
Consolidated Cash Flow Data
|
|
|
|
|
|
|
|
|
|
|
|
|
|
|
|
||||
|
|
|
|
|
|
|
|
|
|
|
|
|
|
|
|
|
||||
|
Purchase of property, plant and equipment
|
|
|
(16,673,632
|
)
|
|
|
(15,474,614
|
)
|
|
|
(17,691,382
|
)
|
|
(19,858,216
|
)
|
|
|
(24,191,285)
|
|
|
Net cash provided by operating activities
|
|
|
20,949,155
|
|
|
|
26,928,082
|
|
|
|
40,239,429
|
|
|
33,320,067
|
|
|
|
42,362,708
|
|
|
Net cash used in investing activities
|
|
|
(21,664,831
|
)
|
|
|
(15,309,604
|
)
|
|
|
(19,054,250
|
)
|
|
(19,470,813
|
)
|
|
|
(33,015,012)
|
|
|
Net cash provided by / (used in) financing activities
|
|
|
69,648
|
|
|
|
(9,816,900
|
)
|
|
|
(22,240,088
|
)
|
|
(10,894,180)
|
)
|
|
|
(14,140,659)
|
|
|
|
|
|
|
|
|
|
|
|
|
|
|
|
|
|
|
|
|
|
|
|
Other Company Data
|
|
|
|
|
|
|
|
|
|
|
|
|
|
|
|
|
|
|
|
|
|
|
|
|
|
|
|
|
|
|
|
|
|
|
|
|
|
|
|
|
|
Dividend declared per share
|
|
|
0.05
|
|
|
|
0.21
|
|
|
|
0.38
|
|
|
0.38
|
|
|
|
0.47
|
|
|
Number of ordinary shares (‘000)
|
|
|
14,055,383
|
|
|
|
14,055,383
|
|
|
|
14,055,383
|
|
|
14,420,383
|
|
|
|
15,200,383
|
|
2
|
B.
|
Capitalization and indebtedness
|
Not applicable.
|
C.
|
Reasons for the offer and use of proceeds
|
Not applicable.
|
D.
|
Risk factors
|
Risks relating to our business and the PRC’s power industry
Government regulation of on-grid power tariffs and other aspects of the power industry may adversely affect our business
Similar to electric power companies in other countries, we are subject to governmental and electric grid regulations in virtually all aspects of our operations, including the amount and timing of electricity generations, the setting of on-grid tariffs, the performance of scheduled maintenance, and the compliance with power grid control and dispatch directives as well as environment protection regulations. There can be no assurance that these regulations will not change in the future in a manner which could adversely affect our business.
The on-grid tariffs for our planned output are subject to a review and approval process involving the NDRC and the relevant provincial government. Since April 2001, the PRC Government has been implementing an on-grid tariff-setting mechanism based on the operating terms of power plants as well as the average costs of comparable power plants. Pursuant to the NDRC circular issued in June 2004, the on-grid tariffs for our newly built power generating units commencing operation from June 2004 have been set on the basis of the average cost of comparable units adding tax and reasonable return in the regional grid. Any future reductions in our tariffs, or our inability to raise tariffs (for example, to cover any increased costs we may have to incur) as a result of the new on-grid tariff-setting mechanism, may adversely affect our revenue and profit.
In addition, the PRC Government started a program in 1999 to effect power sales through competitive bidding in some of the provinces where we operate our power plants. The on-grid tariffs for power sold through competitive bidding are generally lower than the pre-approved on-grid tariffs for planned output. In the more recent few years, power sales through competitive bidding only accounted for a small portion of our overall power sales. Nevertheless, the PRC Government is seeking to expand the program. Any increased power sales through competitive bidding may reduce our on-grid tariffs and may adversely affect our revenue and profits.
Furthermore, the PRC Government started in 2009 to promote the practice of direct power purchase by large power end-users. Pursuant to the circular jointly issued by NDRC, the State Electricity Regulatory Commission (“SERC”) and China National Energy Administration in June 2009, the direct power purchase price consists of direct transaction price, on-grid dispatch and distribution price and governmental levies and charges, in which the direct transaction price shall be freely determined through negotiation between the power generation company and the large power end-user. The price of direct power purchase shall be subject to the supply and demand in the power market. Furthermore, the scale and mode of the transaction are also subject to the structure and level of development of local economy. In terms of power generation companies engaged in direct power purchase, direct power sales constitute a portion of the total power sales, thus affecting the on-grid power sales of the Company. For the past few years, the PRC Government continued the reform in the area of direct power purchase by large power end-users. Although the direct power purchase may act as an alternative channel for our power sales, there is uncertainty as to the effect of the practice of direct power purchase over our operating results.
The on-grid tariff-setting mechanism is evolving with the reforming of the PRC electric power industry. There is no assurance that it will not change in a manner which could adversely affect our business and results of operations. See “Item 4 Information of the Company – B. Business Overview – Pricing Policy”.
3
If our power plants receive less dispatching than planned generation, the power plants will sell less electricity than planned
Our profitability depends, in part, upon each of our power plants generating electricity to meet the planned generation, which in turn will be subject to local demand for electric power and dispatching to the grids by the dispatch centers of the local grid companies.
The dispatch of electric power generated by a power plant is controlled by the dispatch center of the applicable grid companies pursuant to a dispatch agreement with us and to governmental dispatch regulations. In each of the markets we operate, we compete against other power plants for power sales. No assurance can be given that the dispatch centers will dispatch the full amount of the planned generation of our power plants. A reduction by the dispatch center in the amount of electric power dispatched relative to a power plant’s planned generation could have an adverse effect on the profitability of our operations. However, we have not encountered any such event in the past.
In August 2007, the General Office of the State Council issued a notice, promoting the energy saving electricity dispatch policy, which provides dispatching priority to electricity generated from renewable resources over electricity generated from unrenewable resources. For past years, the government made continuous effort to improve energy saving, emission reduction and resources allocation. In 2015, the NDRC and China National Energy Administration jointly issued Guidelines on Improving Electric Power Operations and Deepening Clean Energy Generation confirming a system ensuring the full-priced purchasing of renewable energy, and requests furthering the electric power differentiation system on coal-fired units. We cannot assure that such implementation will not result in any decrease in the amount of the power dispatched by any of our power plants.
The power industry reform may affect our business
The PRC Government in 2002 announced and started to implement measures to further reform the power industry, with the ultimate goal of creating a more open and fair power market. As part of the reform, five power generation companies, including Huaneng Group, were created or restructured to take over all the power generation assets originally belonging to the State Power Corporation of China. In addition, two grid companies were created to take over the power transmission and distribution assets originally belonging to the State Power Corporation of China. An independent power supervisory commission, the SERC, was created to regulate the power industry. There might be further reforms, and it is uncertain how these reform measures and any further reforms will be implemented and impact our business.
In December 2012, the PRC Government issued a notice to further reform the coal pricing mechanism, which mandated (1) the termination of all key coal purchase contracts between power generation companies and coal suppliers, and the abolition of national guidance of the railway transportation capacity plan, and (2) the cancellation of the dual-track coal pricing system, effective from January 1, 2013. For a detailed discussion of the reform, see “Item 4 Information on the Company – B. Business overview – Pricing policy”. There can be no assurance that such coal pricing reform will not adversely affect our results of operation. In 2013, the PRC Government continued the reform in power industry. In July 2013, China National Energy Administration issued the Notice on Direct Purchases between Power End-users and Power Generation Companies, which officially implemented the direct purchases programs by large end-users. On March 15, 2015, the Opinions of CPC Central Committee and State Council Regarding Further Deepening Reform of the Electricity System was released, according to which the reform will be focused and directed to orderly liberalize the tariff of the competitive markets other than electricity transmission and distribution, gradually allow investment from private investors in power distribution and selling businesses, consistently open the power generation market other than those for non-profit purpose or under regulation, push for independent and regulated operation of the parties involved in electricity transactions, continue the study of regional power grid construction and the transmission and distribution system suitable for China, further strengthen government regulations for enhanced power coordination and planning, and further improve safe and efficient operation of electricity and reliable power supply. These reforms will have a profound impact on the business models of power generation enterprises and may intensify the competition which
4
may adversely affect our business. In November 2015, the NDRC and China Energy Administration issued six official documents regarding electricity system reform, namely Opinions on Deepening Electricity Price Reform, Opinions on Furthering Electricity Market Development, Opinions on Establishing and Institutionalizing Electricity Purchasing Organizations, Opinions on Orderly Open Up Electricity Generation and Consumption, Opinions on Deepening Electricity Sales Reform and Guidelines on Fortifying and Institutionalizing the Management of Coal-fired Power Plants, further confirming the direction of the newest round of reforms of the electricity system. These reform actions will influence the operations of power generation companies and may intensify competition, which may negatively impact our company.
We are effectively controlled by Huaneng Group and HIPDC, whose interests may differ from those of our other shareholders
Huaneng Group, directly or indirectly holds 13.83% of our total outstanding shares, and HIPDC directly holds 33.33% of our total outstanding shares. As Huaneng Group is HIPDC’s parent company, they may exert effective control over us acting in concert. Their interests may sometimes conflict with those of our other minority shareholders. There is no assurance that Huaneng Group and HIPDC will always vote their shares, or direct the directors nominated by them to act in a way that will benefit our other minority shareholders.
Disruption in coal supply and its transportation as well as increase in coal price may adversely affect the normal operation of our power plants
A substantial majority of our power plants are fueled by coal. The coal supply for our power plants is arranged through free negotiation between power companies, coal suppliers, and railway authorities. Thus, any material disruption in coal supply and its transportation may adversely affect our operations. To date, we have not experienced shutdowns or reduced electricity generation caused by inadequate coal supply or transportation services.
In addition, our results of operations are sensitive to the fluctuation of coal price. For the past few years, the Chinese coal market was showing a surplus in production, resulting in a significantly decreased coal price. However, there is no assurance that coal prices will not increase in the future, and if the price does increase, there is no assurance that we will be able to adjust our power tariff to pass on the increase in the coal price in time. Although the government has established a coal-electricity price linkage mechanism to allow power generation companies to increase their power tariffs to cope with the increase in the coal price, the implementation of the mechanism involves uncertainties. For a detailed discussion of the coal-electricity price linkage mechanism, see “Item 4 Information on the Company – B. Business overview – Pricing policy”.
Power plant development, acquisition and construction are a complex and time-consuming process, the delay of which may negatively affect the implementation of our growth strategy
We develop, construct, manage and operate large power plants. Our success depends upon our ability to secure all required PRC Government approvals, power sales and dispatch agreements, construction contracts, fuel supply and transportation and electricity transmission arrangements. Delay or failure to secure any of these could increase cost or delay or prevent commercial operation of the affected power plant. Although each of our power plants in operation and the power plants under construction received all required PRC Government approvals in a timely fashion, no assurances can be given that all the future projects will receive approvals in a timely fashion or at all. In addition, due to national policies and related regulations promoting environment-friendly energy, the approval requirements and procedures for thermal power plant are becoming increasingly stringent, which may negatively affect the approval process of our new projects and therefore negatively affect the implementation of our growth strategy.
We have generally acted as, and intend to continue to act as, the general contractor for the construction of our power plants. As with any major infrastructure construction effort, the construction of a power plant involves many risks, including shortages of equipment, material and labor, labor disturbances, accidents, inclement weather, unforeseen engineering, environmental, geological, delays and other problems and unanticipated cost increases, any
5
of which could give rise to delays or cost overruns. Construction delays may result in loss of revenues. Failure to complete construction according to specifications may result in liabilities, decrease power plant efficiency, increase operating costs and reduce earnings. Although the construction of each of our power plants was completed on or ahead of schedule and within its budget, no assurance can be given that construction of future projects will be completed on schedule or within budget.
In addition, from time to time, we may acquire existing power plants from HIPDC, Huaneng Group or other parties. The timing and the likelihood of the consummation of any such acquisitions will depend, among other things, on our ability to obtain financing and relevant PRC Government approvals and to negotiate relevant agreements for terms acceptable to us.
Substantial capital is required for investing in or acquiring new power plants and failure to obtain capital on reasonable commercial terms will increase our finance cost and cause delay in our expansion plans
An important component of our growth strategy is to develop new power plants and acquire operating power plants and related development rights from HIPDC, Huaneng Group or other companies on commercially reasonable terms. Our ability to arrange financing and the cost of such financing depend on numerous factors, including general economic and capital market conditions, credit availability from banks or other lenders, investor confidence in us and the continued success of our power plants. Although we have not been materially affected by inflation in the past, there is no assurance that we would not be affected in the future. In 2015, the PBOC repeatedly cut down money market rate and reserve ratio to stabilize China's money supply. We expect that the PBOC will continue to implement a prudent monetary policy, with moderate and timely adjustments in 2016, which will help the Company to manage its financing costs. The interest bearing debts of the Company are mostly denominated in Renminbi, changes in benchmark lending interest rate published by the PBOC will have a direct impact on the Company's cost of debt. In the Singaporean capital market, the SOR interest rate will continue to rise as a result of increase in the interest rates for U.S. dollar denominated loan as well as depreciation of Singapore dollar, which will likely increase the financing costs of Tuas Power. The change of the benchmark lending interest rates published by the PBOC will have direct impact on the borrowing costs of the Company. As a result, we may not be able to carry out our expansion plans due to the failure to obtain financing or increased financing costs. Furthermore, although we have historically been able to obtain financing on terms acceptable to us, there can be no assurance that financing for future power plant developments and acquisitions will be available on terms acceptable to us or, in the event of an equity offering, that such offering will not result in substantial dilution to existing shareholders.
Operation of power plants involves many risks and we may not have enough insurance to cover the economic losses if any of our power plants’ ordinary operation is interrupted
The operation of power plants involves many risks and hazards, including breakdown, failure or substandard performance of equipment, improper installation or operation of equipment, labor disturbances, natural disasters, environmental hazards and industrial accidents. The occurrence of material operational problems, including but not limited to the above events, may adversely affect the profitability of a power plant.
Our power plants in the PRC currently maintain insurance coverage that is typical in the electric power industry in the PRC and in amounts that we believe to be adequate. Such insurance, however, may not provide adequate coverage in certain circumstances. In particular, in accordance with industry practice in the PRC, our power plants in the PRC do not generally maintain business interruption insurance, or any third party liability insurance other than that included in construction all-risks insurance or erection all-risks insurance to cover claims in respect of bodily injury or property or environment damage arising from accidents on our property or relating to our operation. Although each of our power plants has a good record of safe operation, there is no assurance that the afore-mentioned accidents will not occur in the future.
6
If the PRC Government adopts new and stricter environmental laws and additional capital expenditure is required for complying with such laws, the operation of our power plants may be adversely affected and we may be required to make more investment in compliance with these environmental laws
Most of our power plants, being coal-fired power plants, discharge pollutants into the environment. We are subject to central and local government environmental protection laws and regulations, which currently impose base-level discharge fees for various polluting substances and graduated schedules of fees for the discharge of waste substances. The amounts of discharge fees are determined by the local environmental protection authority based on the periodic inspection of the type and volume of pollution discharges. In addition, such environmental protection laws and regulations also set up the goal for the overall control on the discharge volume of key polluting substances. These laws and regulations impose fines for violations of laws, regulations or decrees and provide for the possible closure by the central government or local government of any power plant which fails to comply with orders requiring it to cease or cure certain activities causing environmental damage. Also, the PRC Government requires thermal power plants to equip all units with desulphurization and denitrification facilities, and sets higher antidust standards. In September 2014, the NDRC, the Ministry of Environmental Protection and the National Energy Administration jointly issued the 2014-2020 Action Plans for Energy Saving, Emission Reduction and Renovation of Coal-fired Generation Units, imposing stricter requirements for efficient and clean development of coal-fired generating plants. Such stringent standards, together with the increase in the discharge fees, will result in the increases in the environmental protection expenditure and operating costs of power plants and may have adverse impact on our operating results.
We attach great importance to the environmental related matters of our existing power plants and our power plants under construction. We have implemented a system that is designed to control pollution caused by our power plants, including the establishment of an environmental protection office at each power plant, adoption of relevant control and evaluation procedures and the installation of certain pollution control equipment. We believe our environmental protection systems and facilities for the power plants are adequate for us to comply with applicable central government and local government environmental protection laws and regulations. However, the PRC Government may impose new, stricter laws and regulations on environmental protection, which may adversely affect our operations.
The PRC is a party to the Framework Convention on Climate Change (“Climate Change Convention”), which is intended to limit or capture emissions of “greenhouse” gases, such as carbon dioxide. Ceilings on such emissions could limit the production of electricity from fossil fuels, particularly coal, or increase the costs of such production. At present, ceilings on the emissions of “greenhouse” gases have not been assigned to developing countries under the Climate Change Convention. Therefore, the Climate Change Convention would not have a major effect on us in the short term because the PRC as a developing country is not obligated to reduce its emissions of “greenhouse” gases at present, and the PRC Government has not adopted relevant control standards and policies. If the PRC were to agree to such ceilings, or otherwise reduce its reliance on coal-fired power plants, our business prospects could be adversely affected. In addition, pilot carbon emission trading programs have been conducted in certain regions and are expected to be gradually implemented throughout China. This may also adversely affect our business and financial prospects in the future.
Our business benefits from certain PRC Government tax incentives. Expiration of, or changes to, the incentives could adversely affect our operating results
Prior to January 1, 2008, according to the relevant income tax law, domestic enterprises were, in general, subject to statutory income tax of 33% (30% enterprise income tax and 3% local income tax). If these enterprises are located in certain specified locations or cities, or are specifically approved by State Administration of Taxation, a lower tax rate would be applied. Effective from January 1, 1999, in accordance with the practice notes on the PRC income tax laws applicable to foreign invested enterprises investing in energy and transportation infrastructure businesses, a reduced enterprise income tax rate of 15% (after the approval of State Administration of Taxation) was applicable across the country. We applied this rule to all of our wholly owned operating power plants after obtaining the approval of State Administration of Taxation. In addition, certain power plants were exempted from enterprise income tax for two years starting from the first profit-making year, after offsetting all tax losses carried forward
7
from the previous years (at most of five years), followed by a 50% reduction of the applicable tax rate for the next three years. The statutory income tax was assessed individually based on each of their results of operations.
On March 16, 2007, the Enterprise Income Tax Law of PRC, or the New Enterprise Income Tax Law, was enacted, and became effective on January 1, 2008. The New Enterprise Income Tax Law imposes a uniform income tax rate of 25% for domestic enterprises and foreign invested enterprises. Therefore, our power plants subject to a 33% income tax rate prior to January 1, 2008 are subject to a lower tax rate of 25% starting on January 1, 2008. With regard to our power plants entitled to a reduced enterprise income tax rate of 15% prior to January 1, 2008, their effective tax rate gradually increased to 25% within a five-year transition period commencing on January 1, 2008. Accordingly, the effective tax rate of our wholly owned power plants has increased over time. In addition, although our power plants entitled to tax exemption and reduction under the income tax laws and regulations that are effective prior to the New Enterprise Income Tax Law will continue to enjoy such preferential treatments until the expiration of the same, newly established power plants will not be able to benefit from such tax incentives, unless they can satisfy specific qualifications, if any, provided by then effective laws and regulations on preferential tax treatment.
The increase of applicable income tax rate and elimination of the preferential tax treatment with regard to certain of our power plants may adversely affect our financial condition and results of operations. Moreover, our historical operating results may not be indicative of our operating results for future periods as a result of the expiration of the tax benefits currently available to us.
In addition, according to the New Enterprise Income Tax Law and its implementation rules, any dividends derived from the distributable profits accumulated from January 1, 2008 and paid to the shareholders who are non-resident enterprises in the PRC will be subject to the PRC withholding tax at the rate of 10%. The withholding tax will be exempted if such dividends are derived from the distributable profits accumulated before January 1, 2008. Under a notice issued by the State Administration of Taxation of the PRC on November 6, 2008, we are required to withhold PRC income tax at the rate of 10% on annual dividends paid for 2008 and later years payable to our H Share investors who are non-resident enterprises.
Fluctuations in exchange rates could have an adverse effect on our results of operations and your investment
As a power producer operating mainly in China, we collect most of our revenues in Renminbi and have to convert Renminbi into foreign currencies to (i) repay some of our borrowings which are denominated in foreign currencies, (ii) purchase foreign made equipment and parts for repairs and maintenance, (iii) purchase fuel from overseas suppliers, and (iv) pay out dividend to our overseas shareholders.
The value of the Renminbi against the U.S. dollar and other currencies may fluctuate and is affected by, among other things, changes in China’s political and economic conditions. The conversion of Renminbi into foreign currencies, including U.S. dollars, is based on rates set by the PBOC. On July 21, 2005, the PRC government introduced a floating exchange rate system to allow the value of Renminbi to fluctuate within a regulated band based on market supply and demand and by reference to a basket of foreign currencies. Renminbi appreciated by more than 20% against the U.S. dollar between July 2005 and July 2008. Between July 2008 and June 2010, this appreciation halted and the exchange rate between the Renminbi and the U.S. dollar remained within a narrow band. On June 19, 2010, the PBOC decided to further promote the reform of the Renminbi exchange rate formation mechanism, and improve the flexibility of Renminbi exchange rate. The Company and its subsidiaries (both domestic and overseas) have debts denominated in foreign currencies, fluctuations in the exchange rates of Renminbi and Singapore dollar into foreign currencies creates exchange risk for the Company. With the internationalization process and RMB joining the SDR, RMB exchange rate may continue to fluctuate in the future. In August 2015, the PBOC perfected its midpoint rate determination mechanism, which led to a 2% depreciation of Renminbi against the U.S. dollar. However, it is difficult to predict how market forces or PRC or U.S. government policy may impact the exchange rate between the Renminbi and the U.S. dollar in the future. There remains significant international pressure on the PRC Government to further liberalize its currency policy, which could result in further fluctuations in the value of the Renminbi against the U.S. dollar. However, there is no assurance that there will not be a devaluation of Renminbi in the future. If there is such devaluation, our debt servicing cost will increase and the return to our overseas investors may decrease.
8
Our revenues from SinoSing Power Pte. Ltd. (“SinoSing Power”) and its subsidiaries are collected in Singapore dollars. However, commencing from 2008, the operating results of SinoSing Power and its subsidiaries were consolidated into our financial statements, which use Renminbi as the presentation currency. As a result, we are exposed to foreign exchange fluctuations between Renminbi and the Singapore dollar. Appreciation of Renminbi against the Singapore dollar may cause adverse impact on our operation results and foreign translation difference.
The audit report included in this annual report is prepared by an auditor who is not inspected by the Public Company Accounting Oversight Board and, as such, you are deprived of the benefits of such inspection
Auditors of companies that are registered with the U.S. Securities and Exchange Commission and traded publicly in the United States, including our independent registered public accounting firm, must be registered with the U.S. Public Company Accounting Oversight Board (United States) (the “PCAOB”) and are required by the laws of the United States to undergo regular inspections by the PCAOB to assess their compliance with the laws of the United States and professional standards. Because we have substantial operations within the People’s Republic of China and the PCAOB is currently unable to conduct inspections of the work of our auditors as it relates to those operations without the approval of the Chinese authorities, our auditor’s work related to our operations in China is not currently inspected by the PCAOB. In May 2013, PCAOB announced that it had entered into a Memorandum of Understanding on Enforcement Cooperation with the China Securities Regulatory Commission (“CSRC”) and the PRC Ministry of Finance, which establishes a cooperative framework between the parties for the production and exchange of audit documents relevant to investigations undertaken by PCAOB, the CSRC or the PRC Ministry of Finance in the United States and the PRC, respectively. PCAOB continues to be in discussions with the CSRC and the PRC Ministry of Finance to permit joint inspections in the PRC of audit firms that are registered with PCAOB and audit Chinese companies that trade on U.S. exchanges.
This lack of PCAOB inspections of audit work performed in China prevents the PCAOB from regularly evaluating audit work of any auditors that was performed in China including that performed by our auditors. As a result, investors may be deprived of the full benefits of PCAOB inspections. Investors may lose confidence in our reported financial information and procedures and the quality of our financial statements.
The Chinese member firm of the KPMG network, of which our independent registered public accounting firm is also a member, may be temporarily suspended from practicing before the SEC. If a delay in completion of our audit process occurs as a result, we could be unable to timely file certain reports with the SEC, which may lead to the delisting of our stock
On January 22, 2014, Judge Cameron Elliot, an SEC administrative law judge, issued an initial decision suspending the Chinese member firms of the “Big Four” accounting firms, including KPMG network, from, among other things, practicing before the SEC for six months. In February 2014, the initial decision was appealed. While under appeal and in February 2015, the Chinese member firms of “Big Four” accounting firms reached a settlement with the SEC. As part of the settlement, each of the Chinese member firms of “Big Four” accounting firms agreed to settlement terms that include a censure; undertakings to make a payment to the SEC; procedures and undertakings as to future requests for documents by the US SEC; and possible additional proceedings and remedies should those undertakings not be adhered to.
Our independent registered public accounting firm currently relies on the Chinese member firm of the KPMG network for assistance in completing the audit work associated with our operations in China. If the settlement terms are not adhered to, Chinese member firms of “Big Four” accounting firms may be suspended from practicing before the SEC which could in turn delay the timely filing of our financial statements with the SEC. In addition, it could be difficult for us to timely identify and engage another qualified independent auditor. A delinquency in our filings with the SEC may result in NYSE initiating delisting procedures, which could adversely harm our reputation and have other material adverse effects on our overall growth and prospect.
9
Forward-looking information may prove inaccurate
This document contains certain forward-looking statements and information relating to us that are based on the beliefs of our management as well as assumptions made by and information currently available to our management. When used in this document, the words “anticipate,” “believe,” “estimate,” “expect,” “going forward” and similar expressions, as they relate to us or our management, are intended to identify forward-looking statement. Such statements reflect the current views of our management with respect to future events and are subject to certain risks, uncertainties and assumptions, including the risk factors described in this document. Should one or more of these risks or uncertainties materialize, or should underlying assumptions prove incorrect, actual results may vary materially from those described herein as anticipated, believed, estimated or expected. We do not intend to update these forward-looking statements.
There can be no assurance that we will not be passive foreign investment company, or PFIC, for United States federal income tax purposes for any taxable year, which could subject United States investors in the ADSs or our H shares to significant adverse United States income tax consequences.
We will be a “passive foreign investment company,” or “PFIC,” if, in the case of any particular taxable year, either (a) 75% or more of our gross income for such year consists of certain types of “passive” income or (b) 50% or more of the average quarterly value of our assets (as determined on the basis of fair market value) during such year produce or are held for the production of passive income (the “asset test”). For United States federal income tax purposes, and based upon our income and assets, we do not believe that we were classified as a PFIC for the taxable year ended December 31, 2015, and do not anticipate becoming one in the forseeable future.
While we do not expect to become a PFIC, because the value of our assets for purposes of the asset test may be determined by reference to the market price of the ADSs, fluctuations in the market price of the ADSs may cause us to become a PFIC for the current or subsequent taxable years. The determination of whether we will be or become a PFIC will also depend, in part, on the composition of our income and assets. Under circumstances where we determine not to deploy significant amounts of cash for active purposes, our risk of being a PFIC may substantially increase. Because there are uncertainties in the application of the relevant rules and PFIC status is a factual determination made annually after the close of each taxable year, there can be no assurance that we will not be a PFIC for the current taxable year or any future taxable year.
If we are a PFIC in any taxable year, a U.S. holder (as defined in “Item 10. Additional Information—E. Taxation—United States federal income tax considerations”) may incur significantly increased United States income tax on gain recognized on the sale or other disposition of the ADSs or H shares and on the receipt of distributions on the ADSs or H shares to the extent such gain or distribution is treated as an “excess distribution” under the United States federal income tax rules and such holders may be subject to burdensome reporting requirements. Further, if we are a PFIC for any year during which a U.S. holder holds the ADSs or our H shares, we generally will continue to be treated as a PFIC for all succeeding years during which such U.S. holder holds the ADSs or our H shares. For more information see “Item 10. Additional Information—E. Taxation—Passive Foreign Investment Company Considerations.”
Risks relating to doing business in the PRC
China’s economic, political and social conditions as well as government policies could significantly affect our business
As of December 31, 2015, the majority of our business, assets and operations are located in China. The economy of China differs from the economies of most developed countries in many respects, including government involvement, control of foreign exchange, and allocation of resources.
The economy of China has been transitioning from a planned economy to a more market-oriented economy. After multiple years of strenuous and sustained economic restructuring reforms, China has become a leading player in the global economy and a major contributing force to the economic revival and growth worldwide.
10
The PRC Government has implemented economic reform measures emphasizing utilization of market forces in the development of the economy of China and a higher level of autonomy for the private sector. Some of these measures will benefit the overall economy of China, but may have a negative effect on us for a short term. For example, our operating results and financial condition may be adversely affected by changes in taxation, changes in power tariff for our power plants, changes in the usage and costs of State-controlled transportation services, and changes in State policies affecting the power industry.
Interpretation of PRC laws and regulations involves significant uncertainties
The PRC legal system is based on written statutes and their interpretation by the Supreme People’s Court. Prior court decisions may be cited for reference but have limited value as precedents.
We are subject to certain PRC regulations governing PRC companies that are listed overseas. These regulations contain certain provisions that are required to be included in the articles of association of these PRC companies and are intended to regulate the internal affairs of these companies. The PRC regulatory agencies are intensifying their efforts to protect interests of shareholders. We are listed in three exchanges. Given that each exchange and jurisdiction has different rules for shareholder protection, it is our policy to adopt the strictest standards of these listing rules. Some of these standards are incorporated in our articles of association and bylaws with the view to providing most protection for the interests of our shareholders.
Risks relating to our operations in Singapore
Our operations in Singapore are subject to a number of risks, including, among others, risks relating to electricity pricing, dispatching, fuel supply, project development, capital expenditure, environmental regulations, government policies, and Singapore’s economic, political and social conditions. Any of these risks could materially and adversely affect our business, prospects, financial condition and results of operations.
Fluctuation in demand and intensified competition may adversely affect Tuas Power’s business and results of operations.
Our operations in Singapore depend on market demand and are subject to competition. Overall power system demand grew by 1% in 2015 over 2014. The future growth is highly dependent on sustained recovery in the Singapore and global economies. The liberalization of Singapore’s power market and the further deregulation of its power industry have resulted in more intense competition among the power generation companies in Singapore. Tuas Power Group, or Tuas Power, one of our wholly owned business units, is one of the three largest power generation companies in Singapore. If Tuas Power is unable to compete successfully against other power generation companies in Singapore, its business, prospects, financial condition and results of operations may be adversely affected. A newly constructed 400MW of new generating capacity by a new entrant entered commercial operation in the Singapore market in 2015. To enhance its competitiveness, Tuas Power itself had added 405.9MW of new generating capacity in 2013.
An electricity futures market was also established through an incentive scheme by the authority to market makers (MM) in the futures market. This has attracted independent retailers which are expected to exert some price competition in the retail market. A Demand Response (DR) scheme is currently being established which could potentially introduce further price competition in the wholesale generation market in Singapore.
TP Utilities Pte Ltd (“TPU”), an entity in Tuas Power Group, sells utilities, such as steam, industrial water and demineralized water to industrial customers for their direct consumption. The timing for those potential investors to site their premises is uncertain due to economic situations. The demand of the utilities by these customers may vary as well. Therefore, it is necessary for TPU to understand the customers’ demand and timing to arrive at a demand projection. The facilities will be developed in stages and/or in modules to provide sufficient capacity matching the demand. Customers are required to pay minimum capacity payment charges to mitigate the demand risk.
Regulatory changes of the vesting regime in Singapore could expose Tuas Power to electricity price volatility and adversely affect its business and results of operations
11
Tuas Power derives its revenue mainly from sale of electricity to the National Electricity Market of Singapore (the “NEMS”) through a bidding process and vesting contracts under which a significant portion of power sales is predetermined by the Energy Market Authority (“EMA”). The vesting contract regime in Singapore is targeted at mitigation of market power in the wholesale electricity spot market. The regime achieves this objective by assigning a quantity of vesting contracts to generating companies, thereby limiting their incentives to exercise whatever level of market power they may possess. Vesting contracts are a form of bilateral contract imposed/vested on the major power generation companies in Singapore. Vesting contract price is set by the EMA, which is Singapore’s power market regulator. Vesting contract price is set at the long run marginal cost of the most efficient base-loaded technology plant employed in Singapore and is reviewed every two years. On a quarterly basis, the EMA allows for the vesting contract price to be adjusted to account for inflation and changes in fuel prices. Such a mechanism helps protect the profit margins of the power generating companies in the Singapore market, such as Tuas Power, to a large degree. The quantity of each power generation company’s capacity reserved for vesting contracts depends on the proportion of such power generation company’s capacity to the total capacity in the NEMS system. A portion of the volume under the Vesting Contract Scheme has also been allocated to the LNG Vesting Scheme - an incentive scheme where players who have committed to an the initial tranche of LNG for Singapore are allocated electricity sale contracts. The contract quantity and price are recalculated every three months. By the end of 2015, the vesting contract has been rolled back to 25% of system demand (inclusive of the LNG Vesting Scheme). Following an appeal by some of the players in the market, the vesting contract level has been maintained at 25% for 2016. In addition, the EMA has been tasked by the Minister for Trade and Industry to conduct a comprehensive review of the vesting contract regime.
The fuel cost of Tuas Power is exposed to volatility of international fuel price and foreign currency risk
The fuel for Tuas Power consists of natural gas, coal, biomass, fuel oil and diesel oil. Since the procurement price of natural gas is closely linked to oil price and the procurement price of coal and biomass is linked to a coal index, the fuel cost of Tuas Power is exposed to the volatility of international oil and coal prices. In addition, the commitments for the purchase of fuel are denominated in U.S. dollars, which further exposes Tuas Power to foreign currency risk. Any increase in fuel price and/or appreciation of the U.S. dollar against the Singapore dollar will translate into an increase in fuel cost for Tuas Power. Part of this increase can be passed through electricity sale contracts and utilities sale contracts, while fuel and foreign exchange hedging strategies done appropriately will mitigate the impact of such increase. No assurance can be given that such increase will not adversely affect results of its operation. Tuas Power is highly dependent upon the import of gas via pipelines from Indonesia. Any disruption of such supply would impact the normal operation of Tuas Power significantly. This risk has been mitigated through Tuas Power’s contract to buy LNG for its incremental needs, although there is no assurance that, in the event of fuel supply shortfall, Tuas Power’s operations will not be adversely affected. The rapid and sharp fall in the price of oil over the course of 2015 has resulted in wide variation in the price for its various sources of gas supply within the same month.
|
ITEM 4
|
Information on the Company
|
|
A.
|
History and development of the Company
|
Our legal and commercial name is Huaneng Power International, Inc. Our head office is at Huaneng Building, 6 Fuxingmennei Street, Xicheng District, Beijing, People’s Republic of China and our telephone number is (8610) 63226999. We were established in June 1994 as a company limited by shares organized under the laws of the People’s Republic of China.
On April 19, 2006, we carried out the reform to convert all non-tradable domestic shares to tradable domestic shares. According to the reform plan, Huaneng Group and HIPDC offered three shares to each holder of A Shares for every ten shares held by them. The total number of shares offered in connection with the reform was 150,000,000 shares. As a result, all non-tradable domestic shares were permitted to be listed on the stock exchange for trading with certain selling restrictions. The period of selling restrictions is sixty months for the non-tradable shares held by Huaneng Group and HIPDC, and one year for most non-tradable shares held by others starting from
12
April 19, 2006. All such selling restrictions were released by April 19, 2011. The reform did not affect the rights of shareholders of our overseas listed foreign shares.
In 2010, we increased our share capital through non-public issuances of new shares, including A shares and H shares. With the approval from shareholders and relevant PRC governmental authorities, we were authorized to issue (i) not exceeding 1,500 million new A shares by way of placement to not more than 10 designated investors including Huaneng Group, which would subscribe for no more than 500 million new A shares, and (ii) no more than 500 million new H Shares to China Hua Neng Hong Kong Company Limited (“Hua Neng HK”). On December 23, 2010, we completed the non-public issuance of 1,500 million new A shares (ordinary shares with a par value of RMB1 per share) to 10 designated investors, including Huaneng Group, at the issuance price of RMB5.57 per share. The shares subscribed by Huaneng Group are subject to a lock-up period of 36 months, and the shares subscribed by other designated investors are subject to a lock-up period of 12 months. On December 28, 2010, we completed the placement of 500 million H shares (ordinary shares with a par value of RMB1 per share) to Hua Neng HK at the subscription price of HK$4.73 per share. On November 13, 2014, we issued a total of 365 million H Shares to nine placees, at an issue price of HK$8.60 per share. After these non-public issuances, we have a total share capital of approximately 14.42 billion shares.
On December 31, 2009, we entered into an equity transfer contract with Shandong Electric Power Corporation (“Shandong Power”) and Shandong Luneng Development Group Company Limited (“Luneng Development”) to acquire various interests and preliminary stage projects in nine entities. As of December 31, 2011, the operating results of all the nine entities were consolidated into ours.
On January 4, 2011, we entered into an equity transfer agreement relating to the acquisition of Fushun Suzihe Hydropower Development Company Limited (“Fushun Suzihe Hydropower”) with its existing shareholders, pursuant to which we agreed to acquire the entire equity interest in Fushun Suzihe Hydropower with an aggregate consideration of RMB50 million. Fushun Suzihe Hydropower has a planned hydropower capacity of 37.5 MW (3 x 12.5 MW). In September 2012, unit I of Suzihe Hydropower passed trial run.
On June 29, 2011, we entered into an equity transfer agreement relating to the transfer of Huaneng Jilin Biological Power Generation Limited Company (“Jilin Biological”) with Huaneng Jilin Power Generation Co., Ltd. and Huaneng Group, pursuant to which we agreed to transfer the entire equity interest in Jilin Biological with an aggregate consideration of approximately RMB106 million.
On August 9, 2011, we entered into a capital increase agreement with China Huaneng Finance Limited Liability Company (“Huaneng Finance”), pursuant to which we subscribed for its own part of the newly increased registered capital of Huaneng Finance for a consideration of RMB600 million. The equity interest held by us in Huaneng Finance remains unchanged, representing 20% of the equity interests of Huaneng Finance.
On October 25, 2011, we entered into a capital increase agreement with Huaneng Group, GreenGen Co., Ltd. (“GreenGen”) and Tianjin Jinneng Investment Company (“Tianjin Jinneng”), pursuant to which our Company made a capital contribution of RMB264 million to the registered capital of Huaneng (Tianjin) Coal Gasification Power Generation Co., Ltd., which was jointly funded by GreenGen and Tianjin Jinneng immediately prior to the capital increase. We hold 35.97% of the equity interests in Coal Gasification Co after the completion of the capital increase.
On January 11, 2013, we entered into an equity transfer agreement with Huaneng Group, pursuant to which we agreed to acquire a 50% interest in China Huaneng Group Fuel Co., Ltd. (“Fuel Company”) from Huaneng Group for a consideration of approximately RMB108 million. On the same day, we entered into a capital increase agreement with Huaneng Group and the Fuel Company, pursuant to which we agreed to make a capital injection of RMB1.4 billion into the Fuel Company after the completion of the acquisition.
As resolved at the 2010 annual general meeting held on May 17, 2011, our Company has been given a mandate to apply to the competent authority for a quota of the non-public issuance of debt financing instruments with a principal amount not exceeding RMB10 billion within 12 months from the date of obtaining an approval at
13
the general meeting (to be issued within such period on a rolling basis). On September 8, 2011, we received the approval from the competent authority. On November 7, 2011, we completed the issuance of the first tranche of non-public issuance of debt financing instruments in the amount of RMB5 billion with a maturity period of 5 years, a unit face value of RMB100 and an interest rate of 5.74%. On January 5, 2012, we completed the issuance of the second tranche of the non-public issuance of debt financing instruments in the amount of RMB5 billion with a maturity period of 3 years, a unit face value of RMB100 and an interest rate of 5.24%. On June 4, 2013, we completed the issuance of the third tranche of non-public issuance of debt financing instruments in the amount of RMB5 billion with a maturity period of 3 years and an interest rate of 4.82%.
As resolved at the 2010 Annual General Meeting on May 17, 2011, our Company has been given a mandate to issue one or multiple tranches of financing instruments of RMB-denominated debt instruments of a principal amount up to RMB5 billion in or outside PRC within 12 months from the date of approval at the general meeting. On April 19, 2012, we received an approval regarding the issuance of RMB-denominated debt instruments in Hong Kong in the sum of RMB5 billion issued by the NDRC, approving our Company to issue the RMB-denominated debt instruments in Hong Kong in an aggregate amount of up to RMB5 billion, with an effective period of one year from the date of approval. On January 30, 2013, our Company and the managers entered into a subscription agreement in relation to the proposed issuance of RMB1.5 billion bonds due 2016 with an interest rate of 3.85% (“RMB Bonds”). The RMB Bonds are listed and traded on the Hong Kong Stock Exchange effective from February 5, 2013.
As resolved at the 2012 annual general meeting on June 19, 2013, our Company has been given a mandate to issue one or more tranches of super short-term notes within the PRC in a principal amount not exceeding RMB30 billion on a rolling basis within 24 months of approval by the general shareholders’ meeting. on August 22, September 10 and November 3, 2014, we issued super short-term notes in three installments at principal amount of RMB2 billion, RMB3 billion and RMB3 billion and with nominal annual interest rate of 4.63%, 4.63% and 4.00%, respectively. All these series of notes were denominated in RMB, issued at par value, and would mature in 270 days from issuance.
As resolved at the 2012 annual general meeting on June 19, 2013, our Company has been given a mandate to issue one or more tranches of short-term notes in the PRC in a principal amount not exceeding RMB 15 billion on a rolling basis within 24 months of approval by the general shareholders’ meeting. On April 25 and November 14, 2014, we issued unsecured short-term bonds in two installments each at principal amount of RMB5 billion with nominal annual interest rate of 4.90% and 3.98%, respectively. Each of the bonds was denominated in RMB, issued at par value, and would mature in 365 days from issuance.
As resolved at the 2012 annual general meeting held on June 19, 2013, our Company has been given a mandate to issue non-public debt financing instruments in the PRC in a principal amount of not exceeding RMB10 billion within 24 months from the date of obtaining an approval at the general meeting. On July 11, 2014, we issued mid-term notes at principal amount of RMB4 billion with nominal annual interest rate of 5.30%. The notes were denominated in RMB, issued at par value, and would mature in five years from issuance.
As resolved at the second meeting of the 8th session of the board of the Company on October 13, 2014 and adopted at the third extraordinary general meeting of the Company, we entered into the Huaneng Group Interests Transfer Agreement with Huaneng Group, and the HIPDC Interests Transfer Agreement and the Chaohu Power Interests Transfer Agreement with HIPDC. Pursuant to these transfer agreements, we acquired from Huaneng Group 91.8% interests of Hainan Power, 75% interests of Wuhan Power, 53.45% interests of Suzhou Thermal Power, 97% interests of Dalongtan Hydropower and 100% interests of Hualiangting Hydropower at a total price of RMB7.338 billion, and acquire from HIPDC 60% interests of Chaohu Power, 100% interests of Ruijin Power, 100% interests of Anyuan Power, 100% interests of Jingmen Thermal Power and 100% interest of Yingcheng Thermal Power Interests at a total price of RMB1.938 billion. The total consideration is RMB9.647 billion after adjustment of the profits generated from the date of valuation to the acquisition date in accordance with the equity transfer agreements. The transaction was completed in January 2015.
On November 20, 2015, we issued a total of 780 million new H shares by way of placement at the issuance price of HKD7.32 per share. The aggregate consideration received for these shares was approximately HKD5.71 billion. After this issuance, our total share capital increased from 14,420,383,440 shares to 15,200,383,440 shares, including an increase in our total share capital for H shares from 3,920,383,440 shares to 4,700,383,440 shares.
14
See “Item 5 Operating and Financial Reviews and Prospects – Liquidity and Cash Resources” for a description of our principal capital expenditures since the beginning of the last three financial years.
|
B.
|
Business overview
|
We are one of the China’s largest independent power producers. As of March 31, 2016, we had controlling generating capacity of 82,381MW, and a total generating capacity of 74,826 MW on an equity basis.
Operations in China
We are engaged in developing, constructing, operating and managing power plants throughout China. Our domestic power plants are located in 22 provinces, provincial-level municipalities and autonomous regions. We also have a wholly owned power company in Singapore.
In 2015, the Company actively responded to the new environment and new demand arising from the development of the power market, implemented and progressed the relevant work, maintained stable overall production safety and made efforts on cost control. The operating result of the Company reached a record high while the Company continued to fulfill the duties of providing sufficient, reliable and green power to the society.
In 2015, new generating units with a total installed capacity of 3,988 MW were put into operation. In 2015, our total domestic power generation from all operating power plants on a consolidated basis amounted to 320.529 billion kWh, representing a 8.9% increase from 2014. The annual average utilization hours of our generating units reached 4,147 hours. Our fuel cost per unit of power sold by domestic power plants decreased by 13.68% from the previous year to RMB 173.67 per MWh.
We believe our significant capability in the development and construction of power projects, as exemplified in the completion of our projects under construction ahead of schedule, and our experience gained in the successful acquisitions of power assets in recent years will enable us to take full advantage of the opportunities presented in China’s power market.
With respect to the acquisition or development of any project, we will consider, among other factors, changes in power market conditions, and adhere to prudent commercial principles in the evaluation of the feasibility of the project. In addition to business development strategies, we will continue to enhance our profit enhancement by relentlessly strengthening our cost control, especially in respect of fuel costs and construction costs, so as to hedge against fluctuations in fuel price and increase competitiveness in the power market.
Operations in Singapore
Tuas Power, one of our wholly owned business units, operates in Singapore and is engaged in the business of generation, wholesale and retail of power and other relating utilities. Tuas Power is comprised of Tuas Power Ltd (“TPL”), the investment holding company, and seven subsidiaries. Among those subsidiaries, Tuas Power Generation Pte. Ltd. (“TPG”) is the electricity generation company that owns 100% of Tuas Power Supply Pte Ltd (“TPS”), which is the retail arm of TPG. Separately, TPU, a wholly owned subsidiary of TPL is engaged in the business of production and supply of utilities to industrial customers at Tembusu, Jurong Island in Singapore, as well as the generation of electricity dispatched to the electricity wholesale market. We have consolidated Tuas Power’s results of operations since March 2008. The total assets and revenue of Singapore operations represented approximately 8.94% and 7.87%, respectively, of our consolidated total assets and revenue as of and for the year ended December 31, 2015. In 2015, the power generated by Tuas Power in Singapore accounted for 21.7% of the total power generated in Singapore, marginally lower than 2014.
Development of power plants
15
The process of identifying potential sites for power plants, obtaining government approvals, completing construction and commencing commercial operations is usually lengthy. However, because of our significant experience in developing and constructing power plants, we have been able to identify promising power plant projects and to obtain all required PRC Government approvals in a timely manner.
Opportunity identification and feasibility study
We initially identify an area in which additional electric power is needed by determining its existing installed capacity and projected demand for electric power. The initial assessment of a proposed power plant involves a preliminary feasibility study. The feasibility study examines the proposed power plant’s land use requirements, access to a power grid, fuel supply arrangements, availability of water, local requirements for permits and licenses and the ability of potential customers to afford the proposed power tariff. To determine projected demand, factors such as economic growth, population growth and industrial expansion are used. To gauge the expected supply of electricity, the capacities of existing plants and plants under construction or development are studied.
Approval process
Prior to July 2004, any project proposal and supporting documents for new power plants had to first be submitted to the NDRC for approval and then be submitted to the State Council. In July 2004, the State Council of the PRC reformed the fixed asset investment regulatory system in China. Under the new system, new projects in the electric power industry that do not use government funds will no longer be subject to the examination and approval procedure. Instead, they will only be subject to a confirmation and registration process. Coal-fired projects will be subject to confirmation by the NDRC. Wind power projects with installed capacity of 50 MW or above shall be subject to confirmation and registration with the relevant department of the central government, while wind power projects with installed capacity lower than 50 MW shall be subject to confirmation and registration with relevant local government departments. Wind power projects confirmed by local government departments at provincial level shall also be filed with the NDRC and China National Energy Administration.
In November 2014, pursuant to the Catalogue of Investment Projects Approved by the Government (2014 Version) issued by the State Council, administrative approval power for certain activities in the energy sector has been delegated to a lower level. The administrative approval power for thermal power stations has been delegated to the provincial level (with coal-fired thermal power station projects being subject to national-level administrative approval based on state-promulgated constructions plans limited by total volume), the administrative approval power for heat power stations has been delegated to the local level (with condensing steam heat power station projects being subject to provincial-level administrative approval based on state-promulgated constructions plans limited by total volume), and the administrative approval power for wind power plants delegated to the local level subject to state-promulgated constructions plans limited by total volume as well as the scope as set out in the annual developmental guides. The Interim Measures for Supervision and Administration of Photovoltaic Power Station Projects issued by China National Energy Administration in 2013 requires that photovoltaic power station projects be regulated by on a filing-based system by the provincial-level energy supervisory departments in accordance with regulations related to investment projects issued by the State Council.
Joint venture power projects are subject to additional governmental approvals. Approval by Ministry of Commerce is also required when foreign investment is involved.
From 2014, China National Energy Administation has placed stringent control on coal-fired projects within the Beijing-Tianjian-Hebei region, the Yangtze River Delta Region and the Pearl River Delta Region. All new coal –fired generating projects, other than those involving co-generation, were prohibited from being approved. Multi coal-fired generating units with a total capacity of more than 300 MWh may be reconstructed into large capacity units based on the principles of equivalent replacement for coal but reduction in replacement pollutant emission.
16
Permits and contracts
In developing a new power plant, we and third parties are required to obtain permits before commencement of the project. Such permits include operating licenses and similar approvals related to plant site, land use, construction, and environment. To encourage the cooperation and support of the local governments of the localities of the power plants, it has been and will be our policy to seek investment in such power plants by the relevant local governments.
Power plant construction
We have generally acted as the general contractor for the construction of our power plants. Equipment procurement and installation, site preparation and civil works are subcontracted to domestic and foreign subcontractors through a competitive bidding process. All of our power plants were completed on or ahead of schedule, enabling certain units to enter service and begin generating income earlier than the estimated in-service date.
Import duties
Under the relevant PRC laws and regulations, foreign invested enterprises (“FIE”), will be entitled to import duty exemption in respect of self-use imported equipment and raw materials for investment projects that fall into the encouraged category under the Catalogue for the Guidance of Foreign Investment Industries (the “Catalogue”). Pursuant to the current Catalogue, effective on January 30, 2012, construction and operation of power stations using integrated gasification combined cycle, circulating fluidized bed with a generating capacity of 300MW or above, pressurized fluidized bed combustor with a generating capacity of 100MW or above and other clean combustion technologies belong to the category of encouraged projects. Therefore, all of our construction projects that meet the conditions for encouraged projects under the current catalogue are eligible for import-duty exemption for imported generating units.
Pursuant to the Interim Rules to Promote Structural Adjustment of Industries issued in December 2005 and Guidance Catalogue for Structural Adjustment of Industries effective on June 1, 2011, our power plants construction projects with independent legal person status belonging to an encouraged category of investments are eligible for exemption from import duty and related value-added tax with regard to the imported equipments used in such projects, subject to the approval of the relevant government authorities.
Plant start-up and operation
We have historically operated and intend to continue to operate our power plants. Our power plants have established management structures based on modern management techniques. We select the superintendent for a new power plant from the senior management of our operating plants early in the construction phase of the new plant, invest in the training of operational personnel, adopt management techniques that improve efficiency and structure our plant bonus program to reward efficient and cost-effective operation of the plant in order to ensure the safety, stability and high availability factor of each power plant. Our senior management meets several times a year with the superintendents of the power plants as a group, fostering a team approach to operations, and conducts annual plant performance reviews with the appropriate superintendent, during which opportunities to enhance the power plant’s performance and profitability are evaluated.
After a coal-fired generating unit is constructed, the contractor tests its installation and systems. Following such tests, the contractor puts the unit through a continuous 168-hour trial run at full load. After successfully passing the continuous 168-hour test and obtaining approval from the local governments, the unit may commence its commercial operation. Trial run of a wind power project consists of two phases: (i) trial run of single wind power generating unit and (ii) trial run of the entire wind power project as a whole. After successfully passing the trial run, the wind power project may commence its commercial operation.
Development of Power Plants in Singapore
17
The Singapore electricity industry had traditionally been vertically integrated and owned by the government. Since 1995, steps have been taken to liberalize the power industry, including the incorporation of the Public Utilities Board (“PUB”) in 1995, establishment of Singapore Electricity Pool (“SEP”) in 1998, formation of Energy Market Authority (“EMA”) in 2001, and the evolvement of the SEP into the New Electricity Market of Singapore (“NEMS”) in 2003. The EMA is a statutory body responsible for the economic, technical and competition regulation of the gas and electricity industry in Singapore. In carrying out its functions as the regulator of the power sector, EMA is empowered under the Electricity Act to issue and enforce licenses, codes of practices and performance standards. Energy Market Company Pte Ltd. (the “EMC”) is the market company licensed to operate the wholesale market, or the NEMS.
In Singapore, a company is required to hold a generation license issued by the EMA if it generates electricity by means of one or more generating units with capacity of 10 MW or above. If connected to the power grid, the generating unit(s) must be registered with the EMC and will have to compete with other power generation companies to secure dispatch in the NEMS.
To ensure adequate electricity supply in Singapore, the EMA targets a minimum reserve margin (the excess of generating capacity over peak electricity demand) of 30% based on a loss of load probability (a measure of the probability that a system demand will exceed capacity during a given period, often expressed as the estimated number of days over a year) of three days per year. The 30% required reserve margin is to cater for scheduled maintenance as well as forced outages of generating units in the system. If the reserve margin falls below the required 30% due to demand growth and/or plant retirements, it would be an indication that new generation investments in generation units are needed to maintain system security.
The EMA intends to keep the increase and decrease in generating capacity commercially driven as far as practicable. As a precaution against the risk of insufficient generating capacity in the system to maintain system security, the EMA has planned to put in place a capacity assurance scheme to incentivize new generation planting in case new generating capacity that is required to maintain system security is not forthcoming from the market. EMA has not provided any update to the proposed scheme but given the current oversupply of capacity, it is not anticipated that the scheme will be put into place anytime soon.
By most measures of market power, the Singapore market is highly concentrated, as the three largest power generation companies account for approximately 70% of total power capacity. It is therefore unlikely that the EMA will allow the three largest power generation companies to increase their licensed capacity and these generation companies will have to rely on the optimization of their existing capacity within license capacities to improve efficiency and forestall any new entrant.
New entrants as well as existing competitors have invested in new generating capacity or repowering of existing plants to take advantage of the LNG Vesting Scheme. This will impact the market negatively as these new capacities compete for market share as well as to avoid the take-or-pay penalties arising out of an oversupplied market.
In late 2015, EMA released a consultation paper on “Preparing for Future Power Generation Investments in Singapore”. In it, EMA stated its intention to provide information on the long term outlook of the energy market, proposed enhancements to the regulatory approval process for new and existing generation assets to give greater visibility on the capacity coming on-stream, and proposed a framework to allocate land for new generation assets.
We are in the process of developing the Tembusu Multi-Utilities Complex (the “TMUC”) in Singapore. The TMUC is expected to consist of a co¬generation plant, a desalination plant and a wastewater treatment facility, with a total installed capacity of 165 MW. The complex will be developed in multiple phases in order to meet customers’ demand. Phase 1 consists of 1 x 450 t/h coal-biomass co-fired circulated fluidized bed boiler, 2 x 200 t/h diesel/natural gas fired boilers and 1 x 101MW steam turbine-generator, and other components of the plant. Phase 2A consists of 1 x 450 t/h coal-biomass co-fired circulated fluidized bed boiler, 1 x 200 t/h diesel/natural gas fired boiler and 1 x 32MW steam turbine-generator, and other components of plant. Phase 1 and Phase IIA commenced commercial operations in March 2013 and June 2014 respectively. The first train of 62.5 m³/h wastewater treatment facility commenced commercial operation in September 2015. TPL owns 100% equity interest in this project.
18
Pricing policy
Pricing policy in China
Prior to April 2001, the on-grid tariffs for our planned output were designed to enable us to recover all operating and debt servicing costs and to earn a fixed rate of return. Since April 2001, however, the PRC Government has gradually implemented a new on-grid tariff-setting mechanism based on the operating terms of power plants as well as the average costs of comparable power plants.
On July 3, 2003, the State Council approved the tariff reform plan and made it clear that the long-term objective of the reform is to establish a standardized and transparent tariff-setting mechanism.
Pursuant to the NDRC circular issued in June 2004, on-grid tariffs for newly built power generating units commencing operation from June 2004 should be set on the basis of the average cost of comparable units adding tax and reasonable return in the regional grid. It provides challenges and incentives for power generation companies to control costs for building new generating units.
On March 28, 2005, the NDRC issued the Interim Measures on Regulation of On-grid Tariff, the Interim Measures on Regulation of Transmission and Distribution Tariff, and the Interim Measures on Regulation of End-user Tariff, or collectively the “Interim Measures”, to provide guidance for the reform of tariff-setting mechanism in the transition period. Under the Interim Measures, tariff is classified into on-grid tariff, transmission and distribution tariff and end-user tariff. Transmission and distribution tariff will be instituted by the government. End-user tariff will be based on on-grid tariff and transmission and distribution tariff. The government is responsible for regulating and supervising power tariffs based on the principles of promoting efficiency, encouraging investment and improving affordability.
In December 2004, the NDRC proposed and the State Council approved the establishment of a linkage mechanism between coal and power prices, pursuant to which, the NDRC may adjust power tariffs if the change of the average coal price reaches 5% within a period of six months compared with the preceding same period. The change in a period, if less than 5%, will be carried forward to the future periods until the accumulated amounts reach 5%. With a goal to encourage power generation companies to reduce cost and improve efficiency, only around 70% of coal price increases will be allowed to pass to end-users through an increase of power tariffs, and power generation companies will bear the remaining 30%. In May 2005, the NDRC activated the coal-electricity price linkage mechanism for the first time to increase on-grid tariffs and end-user tariffs in the northeastern region, central region, eastern region, northwestern region and southern region. We accordingly increased the on-grid tariffs of our power plants in the northeastern region, central region, eastern region and northwestern region on May 1, 2005 and in the southern region on July 15, 2005. In June 2006, the coal-electricity price linkage mechanism was reactivated by the NDRC to increase on-grid tariffs and end-user tariffs in the northeastern region, central region, eastern region, northwestern region and southern region. We accordingly increased the on-grid tariffs of most of our power plants in the same regions on June 30, 2006.
In May 2007, NDRC and the State Environment Protection Administration jointly promulgated Interim Administrative Measures on Electricity Price of Coal-fired Generating Units installed with Desulphurization Facilities and the Operations of Such Facilities, which provided that a premium for desulphurization may be charged on the price of the electricity generated by generating units installed with desulphurization facilities on and from the date on which such desulphurization facilities are tested and accepted by a relevant environment protection regulator. Such pricing policy is also applicable to the old generating units which are installed with desulphurization facilities. The new measures are more stringent on the regulation of the coal-fired power plants with desulphurization facilities, setting forth the categories under which the price including a desulphurization premium will be offset or otherwise penalized based on the ratio of utilization of the relevant desulphurization facilities on an annual basis. As of December 31, 2013, all of our existing coal-fired generating units have installed and operated the desulphurization facilities and enjoyed the desulphurization premium.
19
In June 2008, NDRC issued Notice of Raising the Power Tariff, pursuant to which, the power tariff in provincial grids nationwide was increased by an average of RMB0.025 per kWh. In August 2008, NDRC issued Notice of Raising the On-grid Tariffs of the Thermal Power Plants, pursuant to which, the on-grid tariff of thermal power plants, including plants fueled by coal, oil, gas and co-generation, was increased by an average of RMB0.02 per kWh.
On February 25, 2009, NDRC, SERC and China National Energy Administration jointly promulgated the Notice regarding Cleaning up the Concessional Tariff Scheme, pursuant to which, (i) the concessional tariff scheme at the local level is banned, and (ii) certain measures, such as direct purchase by large end-users and adopting peak and off-peak power pricing policy, will be carried out to reduce enterprises’ power cost. In addition, the notice emphasizes the supervision and inspection over the setting of power tariffs. On October 11, 2009, in order to promote a fair market condition and the optimization of electric power resources, NDRC, SERC and China National Energy Administration jointly promulgated the Circular on Regulating the Administration of Electric Power Transaction Tariff to regulate the tariff-setting mechanism for the on-grid tariff, transmission and distribution tariff and end-user tariff and clean up the local preferential power tariffs provided to high energy consumption companies. Pursuant to a notice issued by NDRC, with effect from November 20, 2009, certain adjustments on the on-grids tariffs have been made in various regions of China in order to resolve the inconsistencies in tariffs, rationalize the tariff structure and promote the development of renewable energy.
In 2010, the PRC Government started to implement the direct power purchase policy. As of December 31, 2013, some of the provinces where we operate power plants are approved by the NDRC to implement the direct power purchase by large power end-users. In addition, during 2010 SERC issued several circulars and notices to regulate the trans-provincial and interregional transaction of power and/or power generation right, in which the power purchase price shall be freely determined by negotiation through market pricing mechanism. In December 2012, SERC issued another circular to further regulate the trans-provincial and interregional transaction of power and/or power generation right.
In May 2011, NDRC issued a notice, increasing the on-grid tariffs of thermal power plants to partially compensate the increased costs incurred by thermal power plants resulting from increases in coal prices. Different adjustments on tariffs were made in different provinces. In November 2011, PRC Government made further nationwide adjustments on power tariffs, including an average of RMB0.026 per kWh increase in on-grid tariff for thermal power plants. In December 2012, NDRC issued a notice, which provided that, from January 1, 2013, NDRC would provide a RMB0.008 per kWh denitrification premium for all coal-fired generating units equipped with denitrification facilities that are inspected and accepted by authorized national or provincial authority.
In March 2012, the PRC Government issued a notice, which mandated the confirmation method for the power generation projects, subsidy standards and fund appropriation standards relating to the application for subsidy for renewable energy power price of power generation projects. In December 2012, the PRC Government issued the Notice on the Guidelines of Enhancing the Reform of Marketization of Coal Used for Power Generation to further reform the coal pricing mechanism. Effective January 1, 2013, all key coal purchase contracts between power generation companies and coal suppliers were terminated and contracts are directly negotiated between power generation companies and coal suppliers without the interference of local governments. According to the notice, the NDRC will no longer issue inter-provincial guidance on the railway transportation capacity plan. In addition, the dual-track coal pricing system, which included the government regulated mandatory annual contract pricing and spot market prices for the remaining coal production output of each coal supplier, was abolished due to the narrowing gap between the government regulated coal contract price and the spot market price. Pursuant to the notice, future coal contract prices will be determined by the market and freely negotiated between power generation companies and coal suppliers. Furthermore, the coal-electricity price linkage mechanism will continue to be implemented and constantly improved. Once the coal price fluctuates for more than 5% on an annual basis, on-grid tariff would be adjusted accordingly. The notice also mandates that power generation companies absorb 10% of the coal price fluctuations as compared to 30% prior to 2013. Given the narrow gap between the key contract coal price and the spot market price, the overall on-grid tariff was not adjusted.
20
In September 2013, NDRC issued the Notice on the Adjustment of Power Tariff for Power Generation Companies and Related Matters, pursuant to which the on-grid tariffs for coal-fired generating units were lowered, by a national average of RMB0.013 per kWh, and the on-grid tariff for gas turbine power plants were slightly increased. The Notice also increased the power tariff for power-generating companies that are equipped with denitrification facilities and dust-removal facilities.
In March 2014, the NDRC and the Ministry of Environmental Protection jointly issued the Measures to Monitor the Operation of Environmental Protection Tariffs and Facilities Regarding Coal-fired Generating Units, under which the standard on-grid electricity tariff incorporating environmental protection element will no longer be applicable to coal-fired generating units unless the coal-fired power generating enterprise has completed renovation for environmental protection acceptable after testing. In August 2014, the NDRC issue the Notice to Further Resolve Conflicts Regarding Environmental Protection Tariff, under which the standard on-grid tariff for coal-fired power generating units is lowered with the view to resolve the environmental protection tariffs conflicts such as denitrification and dedusting of coal-fired power generation enterprises, and setting the tariff subsidy for denitrification and dedusting at RMB0.01/kWh and RMB0.002/kWh, respectively. In December 2014, the NDRC issued the Notice Regarding Adjusting Standard On-grid Tariff for Onshore Wind Powers, under which the standard on-grid tariff for each of Class I, Class II and Class III wind powers is lowered by RMB0.02, and the tariff for Class IV wind power remain unchanged at RMB0.61/kWh. In December 2014, the NDRC issued the Notice Regarding Certain issues of On-grid Tariff of Natural Gas Powers, defining the principles to formulate and modify the tariff of electricity generated by natural gas, aiming to regulate on-grid tariff administration and used facilitate healthy and orderly growth of natural gas power generating sector in China.
In April 2015, the NDRC issued the Notice on Reducing On-grid Tariff for Coal-fired Power and Commercial and Industrial Power Tariff in order to release the pressure on tariffs for natural gas and for companies that utilize denitration or dedusting techniques or with extremely low emissions, to lower commercial and industrial power tariff, and to moderately lower on-grid tariff for coal-fired power, the power tariff in provincial grids nationwide was decreased by an average of RMB0.02 per kWh.
In December 2015, the NDRC issued the Notice on Issues of Perfecting the Mechanism of Coal-electricity Price Linkage, confirming the annual cycle of the mechanism, the NDRC’s leading role in implementing the mechanism, and provinces and cities’ executor role in implementing the mechanism. The coal-electricity prices with which the mechanism of coal-electricity price linkage is in line are indexed to the national thermal coal price index. The benchmark coal price is the provincial average price in China’s thermal coal price index of 2014. And the benchmark tariff is in principle the on-grid tariff in line with the benchmark coal price. The tariff adjustment may be triggered after the annual review based on the calculations according to the formula given by Policy of the Mechanism of Coal-electricity Price Linkage. Also in December 2015, the NDRC issued the Notice on Reducing On-grid Tariff for Coal-fired Power and General Commercial and Industrial Power Tariff, which ordered a decrease of national on-grid tariffs for coal power and general commercial and industrial power tariff by an average of RMB0.03 per kWh, based on the relevant regulations prescribed in the mechanism of coal-electricity price linkage. In the same month of 2015, the NDRC also issued the Notice on Improving On-grid Tariff Policy for Wind Power and Photovoltaic Power, which established a policy that the benchmark on-grid tariffs for wind power and photovoltaic power decrease in line with the development of these two types of power plants. To further indicate the investment expectation, the Notice confirmed the benchmark on-grid tariffs for wind power of 2016 and 2018. The 2016 benchmark on-grid tariff for photovoltaic power has been confirmed, yet that of 2017 and onward will be confirmed at a later stage.
In terms of power tariff for wind power projects, pursuant to the applicable policies and regulations, the PRC is categorized into four wind-resource zones, and the onshore wind power projects approved after August 1, 2009 and in the same zone are subject to the same standard on-grid tariff applicable to that zone. In addition, the power grid companies are generally required to purchase all of the electricity generated by wind power generating units.
Pricing Policy in Singapore
Pricing Policy of Electricity in Singapore
21
All licensed power plants in Singapore sell their plant output into the NEMS under a half-hourly competitive bidding process, during which a clearing price is determined based on the projected system demand. All successful bids/power plants that are cleared in each half hour will be dispatched automatically by control signals from the Power System Operator, a division of the EMA, and in turn will receive the cleared price as determined earlier. The cleared price paid to the power plants is the nodal price at their point of injection, and the Market Clearing Engine, the computer software that creates dispatch schedules and determines market clearing prices, automatically produces a different price at each node on the network. A Demand Response scheme is being introduced where demand could be curtailed in response to high prices in return for a share of the total savings arising out of lower prices as a result of demand being reduced.
As there is no certainty in the price or the dispatch levels for any power plants, operators of power plants may enter into short- or long-term financial arrangements with other counterparties or their own subsidiary company involved in the electricity retail market (to end consumers of electricity) to secure stability in their revenue stream and manage the commercial risks associated with operations in a competitive market.
In addition, the major power generation companies, including Tuas Power, are obliged to hold vesting contracts. Vesting contracts are a form of bilateral contract imposed/vested on the generation companies who had been licensed by the EMA before the establishment of NEMS. Market Support Services Licensee is the counterparty to all of the vesting contracts, and the vesting contracts are settled between the parties through the EMC’s settlement system. The quantity of each power generation company’s capacity covered by vesting contracts depends on the proportion of its capacity to total capacity in the NEMS system. Vesting contract price is set by the EMA at the long-run marginal cost and is adjusted by the EMA on a periodic basis for changes in the long-run marginal cost and on a quarterly basis for inflation and changes in fuel prices. Such mechanism helps protect the profit margins of the power generation companies in the Singapore market to a large degree. The contract quantity and price are currently recalculated every three months. The existing Vesting Contract Scheme has been reduced to an intermediate level of 30% of system demand in first half of 2015 and 25% in second half of 2015 (from 40% in 2014). Following an appeal by some of the players in the market, the vesting contract level has been maintained at 25% for 2016 (instead of the originally intended 20%). In addition, the EMA has been tasked by the Minister to conduct a comprehensive review of the vesting contract regime. This translates into increased exposure to a more volatile pool price. The authority is further considering introducing a demand response scheme where loads can choose to participate in peak load shaving and share in part of the consumer surplus. An Electricity Futures Market is also being contemplated. Going forward, we intend to monitor and evaluate the impact of such market on our business.
The gross pool design adopted in NEMS means all quantity sold by retailers to contestable consumers (currently defined as customers with average monthly usage more than of 4,000kWh) has to be in turn purchased from the pool. The retailers pay for their electricity purchases at the Uniform Singapore Energy Price, which is a weighted average of nodal prices and is determined on a half-hourly basis in the NEMS.
Pricing Policy of Utilities in Singapore
Utilities supply to industrial customers is based on long-term contracts. The pricing of utilities has both fixed and variable components.
Power sales
Each of our power plants has entered into a written agreement with the local grid companies for the sales of its planned power output. Generally, the agreement has a fixed term of one year and provides that the annual utilization hours of the power plant will be determined with reference to the average annual utilization hours of the similar generating units connected to the same grid.
In 2003, SERC and the State Administration of Commerce and Industry jointly promulgated a model contract form (the “Model Contract Form”) for use by power grid companies and power generation companies in connection with electricity sale and purchase transactions. The Model Contract Form contains provisions on the
22
parties’ rights and obligations, amount of electricity subject to purchase, payment method and liabilities for breach of contract, etc. We believe that the publication of the Model Contract Form has facilitated the negotiation and execution of electricity purchase contracts between power grid companies and power generation companies in a fair, transparent and efficient manner. In 2015, a majority of the agreements entered into between our power plants and the local grid companies were based on the Model Contract Form.
From 2008, with the purpose of improving energy usage efficiency, the government implemented an optimized-dispatch electricity policy in some provinces in China, as a result of which, the utilization hours of low energy consumption and low pollution generating units have been improved. We believe that our large generating units with high efficiency and low emission are competitive in the market.
The PRC Government started in 1999 to experiment with a program to effect power sales through competitive bidding in some provinces. Furthermore, the PRC Government started in 2009 to experiment with a program for direct power purchase by large power end-users, and has promulgated relevant rules governing the price and method of direct power purchase transactions as well as the market entrance and exit mechanism. In accordance with the above policies, we are conducting research on the program for direct power purchases by large power end-users. In July 2013, China National Energy Administration issued the Notice on Direct Purchases between Power End-users and Power Generation Companies, which officially implemented the direct purchases programs by large end-users. Among the provinces where we operate our power plants, seven of them, namely Shanxi, Jiangsu, Henan, Hunan, Guangdong, Fujian, and Gansu, started the direct purchase program in 2013, and four of them, namely Jiangxi, Yunnan, Hubei and Liaoning, are actively promoting the direct purchase pilot program. In 2014, the programs were also implemented in Zhejiang and Anhui. In addition to these regions, the direct purchase program by large end-users was also implemented in Liaoning, Jiangxi, Hubei and Chongqing in 2015.
In general, establishing liberalized power markets may be the general trend in China’s power market reform, which is conducive to creating a competition environment that is fair, transparent and equitable.
The following table sets forth the average power tariff (RMB/MWh) of electric power sold by our power plants in China, for each of the five years ended December 31 through 2015 and the approved power tariff for 2016.
|
|
|
Year Ended December 31,
|
|
|||||||||||||||||||||
|
|
|
2011
|
|
|
2012
|
|
|
2013
|
|
|
2014
|
|
|
2015
|
|
|
2016
|
|
||||||
|
|
|
Average
Tariff
|
|
|
Average
Tariff
|
|
|
Average
Tariff
|
|
|
Average
Tariff
|
|
|
Average
Tariff
|
|
|
Approved
Tariff
|
|
||||||
|
Liaoning Province
|
|
|
|
|
|
|
|
|
|
|
|
|
|
|
|
|
|
|
||||||
|
Dalian Power Plant
|
|
|
382.84
|
|
|
|
409.18
|
|
|
|
407.89
|
|
|
|
394.50
|
|
|
|
375.55
|
368.50
|
|
|||
|
Dandong Power Plant
|
|
|
383.08
|
|
|
|
405.73
|
|
|
|
401.09
|
|
|
|
393.06
|
|
|
|
371.45
|
368.50
|
|
|||
|
Yingkou Power Plant
|
|
|
394.82
|
|
|
|
409.35
|
|
|
|
406.85
|
|
|
|
399.33
|
|
|
|
378.32
|
368.50
|
|
|||
|
Yingkou Co-generation
|
|
|
391.92
|
|
|
|
397.59
|
|
|
|
396.96
|
|
|
|
399.21
|
|
|
|
365.04
|
368.50
|
|
|||
|
Wafangdian Wind Power
|
|
|
610.00
|
|
|
|
610.82
|
|
|
|
632.85
|
|
|
|
609.68
|
|
|
|
598.12
|
620.00
|
|
|||
|
Changtu Wind Power
|
|
|
—
|
|
|
|
610.00
|
|
|
|
605.30
|
|
|
|
602.82
|
|
|
|
590.93
|
610.00
|
|
|||
|
Suzihe Hydropower
|
|
|
—
|
|
|
|
364.25
|
|
|
|
330.00
|
|
|
|
330.00
|
|
|
|
329.96
|
330.00
|
|
|||
|
Inner Mongolia Autonomous Region
|
|
|
|
|
|
|
|
|
|
|
|
|
|
|
|
|
|
|
|
|
||||
|
Huade Wind Power
|
|
|
528.45
|
|
|
|
520.00
|
|
|
|
520.00
|
|
|
|
520.00
|
|
|
|
520.00
|
520.00
|
|
|||
|
Hebei Province
|
|
|
|
|
|
|
|
|
|
|
|
|
|
|
|
|
|
|
|
|
||||
|
Shang’an Power Plant
|
|
|
408.20
|
|
|
|
434.63
|
|
|
|
431.15
|
|
|
|
429.39
|
|
|
|
401.79
|
357.57
|
|
|||
|
Kangbao Wind Powert
|
|
|
—
|
|
|
|
536.72
|
|
|
|
534.47
|
|
|
|
538.84
|
|
|
|
538.14
|
540.00
|
|
|||
|
Gansu Province
|
|
|
|
|
|
|
|
|
|
|
|
|
|
|
|
|
|
|
|
|
||||
|
Pingliang Power Plant
|
|
|
306.36
|
|
|
|
336.12
|
|
|
|
332.16
|
|
|
|
322.72
|
|
|
|
259.51
|
297.80
|
|
|||
|
Jiuquan Wind Power
|
|
|
—
|
|
|
|
520.60
|
|
|
|
520.60
|
|
|
|
520.60
|
|
|
|
473.12
|
520.60
|
|
|||
|
Jiuquan II Wind Power
|
|
|
—
|
|
|
|
—
|
|
|
|
—
|
|
|
|
540.00
|
|
|
|
497.75
|
540.00
|
|
|||
|
Yumen Wind Power
|
—
|
—
|
—
|
520.60
|
472.01
|
520.60
|
||||||||||||||||||
| Yigang Wind Power |
—
|
—
|
—
|
—
|
—
|
580.00 | ||||||||||||||||||
|
Beijing Municipality
|
|
|
|
|
|
|
|
|
|
|
|
|
|
|
|
|
|
|
|
|
||||
|
Beijing Co-generation
|
|
|
481.35
|
|
|
|
494.00
|
|
|
|
529.47
|
|
|
|
514.72
|
|
|
|
480.70
|
462.60
|
|
|||
|
Beijing Co-generation CCGT
|
|
|
—
|
|
|
|
—
|
|
|
|
468.79
|
|
|
|
882.33
|
|
|
|
959.91
|
650.00
|
|
|||
|
Tianjin Municipality
|
|
|
|
|
|
|
|
|
|
|
|
|
|
|
|
|
|
|
|
|
||||
|
Yangliuqing Co-generation
|
|
|
414.23
|
|
|
|
438.03
|
|
|
|
483.73
|
|
|
|
434.28
|
|
|
|
416.54
|
383.80
|
|
|||
|
Lingang Co-generation CCGT
|
|
|
—
|
|
|
|
—
|
|
|
|
—
|
|
|
|
—
|
|
|
|
817.57
|
730.00
|
|
|||
|
Shanxi Province
|
|
|
|
|
|
|
|
|
|
|
|
|
|
|
|
|
|
|
|
|
||||
|
Yushe Power Plant
|
|
|
363.66
|
|
|
|
396.56
|
|
|
|
393.37
|
|
|
|
391.22
|
|
|
|
334.87
|
331.50
|
|
|||
23
|
|
|
Year Ended December 31,
|
|
|||||||||||||||||||||
|
|
|
2011
|
|
|
2012
|
|
|
2013
|
|
|
2014
|
|
|
2015
|
|
|
2016
|
|
||||||
|
|
|
Average
Tariff
|
|
|
Average
Tariff
|
|
|
Average
Tariff
|
|
|
Average
Tariff
|
|
|
Average
Tariff
|
|
|
Approved
Tariff
|
|||||||
|
Zuoquan Power Plant
|
|
|
—
|
|
|
|
383.25
|
|
|
|
389.83
|
|
|
|
382.01
|
|
|
|
333.25
|
320.50
|
|
|||
|
Dongshan CCGT
|
—
|
—
|
—
|
—
|
703.80
|
607.50
|
||||||||||||||||||
|
Shandong Province
|
|
|
|
|
|
|
|
|
|
|
|
|
|
|
|
|
|
|
|
|
||||
|
Dezhou Power Plant
|
|
|
443.20
|
|
|
|
468.90
|
|
|
|
464.89
|
|
|
|
463.36
|
|
|
|
445.44
|
398.70
|
|
|||
|
Jining Power Plant
|
|
|
422.91
|
|
|
|
459.63
|
|
|
|
455.46
|
|
|
|
446.73
|
|
|
|
429.20
|
377.30
|
|
|||
|
Xindian Power Plant
|
|
|
426.77
|
|
|
|
453.75
|
|
|
|
453.35
|
|
|
|
448.55
|
|
|
|
432.30
|
379.60
|
|
|||
|
Weihai Power Plant
|
|
|
435.32
|
|
|
|
461.89
|
|
|
|
474.38
|
|
|
|
461.18
|
|
|
|
440.45
|
393.51
|
|
|||
|
Rizhao Power Plant Phase II
|
|
|
420.06
|
|
|
|
446.90
|
|
|
|
446.38
|
|
|
|
441.59
|
|
|
|
422.33
|
372.90
|
|
|||
|
Zhanhua Co-generation
|
|
|
419.76
|
|
|
|
450.55
|
|
|
|
446.56
|
|
|
|
434.71
|
|
|
|
424.66
|
372.90
|
|
|
Henan Province
|
|
|
|
|
|
|
|
|
|
|
|
|
|
|
|
|
|
|
||||||
|
Qinbei Power Plant
|
|
|
412.75
|
|
|
|
441.43
|
|
|
|
437.01
|
|
|
|
435.42
|
|
|
|
401.65
|
355.10
|
|
|||
|
Luoyang Cogeneration Power Plant
|
—
|
—
|
—
|
—
|
384.33
|
365.10
|
||||||||||||||||||
|
Jiangsu Province
|
|
|
|
|
|
|
|
|
|
|
|
|
|
|
|
|
|
|
|
|
||||
|
Nantong Power Plant
|
|
|
425.97
|
|
|
|
441.25
|
|
|
|
435.69
|
|
|
|
436.00
|
|
|
|
430.98
|
378.00
|
|
|||
|
Nanjing Power Plant
|
|
|
442.54
|
|
|
|
442.17
|
|
|
|
436.35
|
|
|
|
463.50
|
|
|
|
453.08
|
378.00
|
|
|||
|
Taicang Power Plant Phase I
|
|
|
424.09
|
|
|
|
430.43
|
|
|
|
432.81
|
|
|
|
419.19
|
|
|
|
387.68
|
378.00
|
|
|||
|
Taicang Power Plant Phase II
|
|
|
429.44
|
|
|
|
443.88
|
|
|
|
427.58
|
|
|
|
395.38
|
|
|
|
387.68
|
378.00
|
|
|||
|
Huaiyin Power Plant
|
|
|
438.72
|
|
|
|
458.25
|
|
|
|
449.87
|
|
|
|
438.98
|
|
|
|
450.81
|
378.00
|
|
|||
|
Jinling Power Plant
|
|
|
|
|
|
|
|
|
|
|
|
|
|
|
|
|
|
|
|
|
||||
|
CCGT
|
|
|
587.53
|
|
|
|
581.35
|
|
|
|
585.53
|
|
|
|
606.21
|
|
|
|
712.13
|
575.00
|
|
|||
|
Coal-fired
|
|
|
417.99
|
|
|
|
427.34
|
|
|
|
428.38
|
|
|
|
408.24
|
|
|
|
385.24
|
388.00
|
|
|||
|
CCGT Co-generation
|
|
|
—
|
|
|
|
—
|
|
|
|
635.42
|
|
|
|
690.00
|
|
|
|
760.99
|
584.00
|
|
|||
|
Qidong Wind Power
|
|
|
519.09
|
|
|
|
542.65
|
|
|
|
541.34
|
|
|
|
555.92
|
|
|
|
556.76
|
549.67
|
|
|||
|
Rudong Wind Power
|
|
|
—
|
|
|
|
—
|
|
|
|
610.00
|
|
|
|
610.00
|
|
|
|
610.00
|
610.00
|
|
|||
|
*Suzhou Thermal Power
|
—
|
—
|
—
|
508.66
|
489.38
|
457.00
|
||||||||||||||||||
|
Shanghai Municipality
|
|
|
|
|
|
|
|
|
|
|
|
|
|
|
|
|
|
|
|
|
||||
|
Shidongkou I
|
|
|
441.11
|
|
|
|
457.18
|
|
|
|
453.27
|
|
|
|
438.21
|
|
|
|
435.48
|
394.10
|
|
|||
|
Shidongkou II
|
|
|
422.25
|
|
|
|
442.13
|
|
|
|
442.00
|
|
|
|
437.54
|
|
|
|
410.35
|
395.80
|
|
|||
|
Shanghai CCGT(2)
|
|
|
665.00
|
|
|
|
674.00
|
|
|
|
820.92
|
|
|
|
866.20
|
|
|
|
937.13
|
705.60
|
|
|||
|
Shidongkou Power
|
|
|
457.20
|
|
|
|
463.85
|
|
|
|
462.02
|
|
|
|
449.92
|
|
|
|
427.42
|
404.80
|
|
|||
|
Chongqing Municipality
|
|
|
|
|
|
|
|
|
|
|
|
|
|
|
|
|
|
|
|
|
||||
|
Luohuang Power Plant
|
|
|
410.86
|
|
|
|
448.95
|
|
|
|
448.57
|
|
|
|
440.90
|
|
|
|
427.84
|
379.60
|
|
|||
|
Liangjiang CCGT
|
|
|
—
|
|
|
|
—
|
|
|
|
—
|
|
|
|
—
|
|
|
|
872.20
|
629.00
|
|
|||
|
Zhejiang Province
|
|
|
|
|
|
|
|
|
|
|
|
|
|
|
|
|
|
|
|
|
||||
|
Yuhuan Power Plant
|
|
|
462.49
|
|
|
|
491.37
|
|
|
|
484.79
|
|
|
|
468.71
|
|
|
|
452.99
|
412.30
|
|
|||
|
Tongxiang CCGT(2)
|
|
|
—
|
|
|
|
—
|
|
|
|
—
|
|
|
|
1,298.37
|
|
|
|
1,278.17
|
600.00
|
|
|||
|
Changxing Power Plant
|
|
|
—
|
|
|
|
—
|
|
|
|
—
|
|
|
|
431.03
|
|
|
|
487.93
|
432.30
|
|
|||
|
Si’an Photovaltaic
|
—
|
—
|
—
|
—
|
1,125.67
|
1,100.00
|
||||||||||||||||||
|
Hunan Province
|
|
|
|
|
|
|
|
|
|
|
|
|
|
|
|
|
|
|
|
|
||||
|
Yueyang Power Plant
|
|
|
465.74
|
|
|
|
506.87
|
|
|
|
505.13
|
|
|
|
495.31
|
|
|
|
480.55
|
447.10
|
|
|||
|
Xiangqi Hydropower
|
|
|
—
|
|
|
|
390.00
|
|
|
|
390.00
|
|
|
|
410.00
|
|
|
|
410.00
|
410.00
|
|
|||
|
Subaoding Wind Power
|
|
|
—
|
|
|
|
—
|
|
|
|
—
|
|
|
|
494.00
|
|
|
|
611.72
|
610.00
|
|
|||
|
Guidong Wind Power
|
—
|
—
|
—
|
—
|
610.00
|
610.00
|
||||||||||||||||||
|
Hubei Province
|
|
|
|
|
|
|
|
|
|
|
|
|
|
|
|
|
|
|
|
|
||||
|
Enshi Maweigou Hydropower
|
|
|
437.03
|
|
|
|
360.00
|
|
|
|
356.96
|
|
|
|
366.59
|
|
|
|
379.26
|
370.00
|
|
|||
|
*Jingmen Thermal Power
|
—
|
—
|
—
|
432.20
|
444.09
|
398.10
|
||||||||||||||||||
|
*Yingcheng Thermal Power
|
—
|
—
|
—
|
—
|
477.26
|
398.10
|
||||||||||||||||||
|
*Wuhan Power Plant
|
—
|
—
|
—
|
461.99
|
435.47
|
400.76
|
||||||||||||||||||
|
*Dalongtan Hydropower
|
—
|
—
|
—
|
366.89
|
374.80
|
370.00
|
||||||||||||||||||
|
Jieshan Wind Power
|
—
|
—
|
—
|
—
|
610.00
|
610.00
|
||||||||||||||||||
|
Jiangxi Province
|
|
|
|
|
|
|
|
|
|
|
|
|
|
|
|
|
|
|
|
|
||||
|
Jinggangshan Power Plant
|
|
|
447.05
|
|
|
|
483.90
|
|
|
|
482.95
|
|
|
|
468.92
|
|
|
|
443.73
|
401.18
|
|
|||
|
Jianggongling Wind Power
|
|
|
—
|
|
|
|
—
|
|
|
|
—
|
|
|
|
610.00
|
|
|
|
610.00
|
610.00
|
|
|||
|
*Ruijin Power
|
—
|
—
|
—
|
466.57
|
441.24
|
399.30
|
||||||||||||||||||
|
*Anyuan Power
|
—
|
—
|
—
|
—
|
424.63
|
399.30
|
||||||||||||||||||
24
|
|
|
Year Ended December 31,
|
|
|||||||||||||||||||||
|
|
|
2011
|
|
|
2012
|
|
|
2013
|
|
|
2014
|
|
|
2015
|
|
|
2016
|
|
||||||
|
|
|
Average
Tariff
|
|
|
Average
Tariff
|
|
|
Average
Tariff
|
|
|
Average
Tariff
|
|
|
Average
Tariff
|
|
|
Approved
Tariff
|
|||||||
|
Anhui Province
|
|
|
|
|
|
|
|
|
|
|
|
|
|
|
|
|
|
|
|
|
||||
|
*Chaohu Power Plant
|
|
|
—
|
|
|
|
—
|
|
|
|
—
|
|
|
|
412.93
|
|
|
|
409.79
|
369.30
|
|
|||
|
*Hualiangting Hydropower
|
|
|
—
|
|
|
|
—
|
|
|
|
—
|
|
|
|
346.85
|
|
|
|
392.89
|
406.90
|
|
|||
|
Fujian Province
|
|
|
|
|
|
|
|
|
|
|
|
|
|
|
|
|
|
|
|
|
||||
|
Fuzhou Power Plant
|
|
|
425.38
|
|
|
|
445.64
|
|
|
|
442.81
|
|
|
|
441.83
|
|
|
|
392.29
|
381.42
|
|
|||
|
Guangdong Province
|
|
|
|
|
|
|
|
|
|
|
|
|
|
|
|
|
|
|
|
|
||||
|
Shantou Power Plant
|
|
|
522.91
|
|
|
|
542.97
|
|
|
|
541.39
|
|
|
|
529.99
|
|
|
|
498.01
|
472.76
|
|
|||
|
Haimen
|
|
|
498.77
|
|
|
|
529.06
|
|
|
|
514.30
|
|
|
|
503.18
|
|
|
|
483.38
|
450.50
|
|
|||
|
Haimen Power
|
|
|
—
|
|
|
|
—
|
|
|
|
—
|
|
|
|
479.55
|
|
|
|
485.46
|
450.50
|
|
|||
|
Yunnan Province
|
|
|
|
|
|
|
|
|
|
|
|
|
|
|
|
|
|
|
|
|
||||
|
Diandong Energy
|
|
|
345.43
|
|
|
|
359.58
|
|
|
|
371.30
|
|
|
|
401.59
|
|
|
|
435.58
|
335.80
|
|
|||
|
Diandong Yuwang
|
|
|
345.31
|
|
|
|
361.70
|
|
|
|
377.41
|
|
|
|
395.96
|
|
|
|
545.42
|
335.80
|
|
|||
|
Fuyuan Wind Power
|
|
|
—
|
|
|
|
—
|
|
|
|
—
|
|
|
|
610.00
|
|
|
|
600.61
|
610.00
|
|
|||
| Guizhou Province | ||||||||||||||||||||||||
| Panxian Wind Power |
—
|
—
|
—
|
—
|
—
|
610.00
|
||||||||||||||||||
|
Hainan Province
|
|
|
|
|
|
|
|
|
|
|
|
|
|
|
|
|
|
|
|
|
||||
|
*Haikou Power Plant
|
|
|
—
|
|
|
|
—
|
|
|
|
—
|
|
|
|
474.14
|
|
|
|
457.71
|
419.80
|
|
|||
|
*Dongfang Power Plant
|
|
|
—
|
|
|
|
—
|
|
|
|
—
|
|
|
|
482.69
|
|
|
|
460.53
|
419.80
|
|
|||
|
*Nanshan CCGT
|
|
|
—
|
|
|
|
—
|
|
|
|
—
|
|
|
|
439.84
|
|
|
|
629.32
|
665.80
|
|
|||
|
*Gezhen Hydropower
|
|
|
—
|
|
|
|
—
|
|
|
|
—
|
|
|
|
392.63
|
|
|
|
399.78
|
400.00
|
|
|||
|
*Wenchang Wind Power
|
|
|
—
|
|
|
|
—
|
|
|
|
—
|
|
|
|
619.72
|
|
|
|
571.95
|
610.00
|
|
___________________________________________
Notes:
|
(1)
|
The power plants marked * are Newly Acquired Entities of the Company in January 2015, and the comparative figures thereof are solely for reference purposes.
|
|
(2)
|
The tariff of Shanghai Combined Cycle and Tongxiang Combined Cycle consist of on-grid settlement price and capacity subsidy income.
|
Power sales in Singapore
According to the latest available update from EMA, the total licensed capacity in commercial operation for the first quarter of 2015 in Singapore was 12,889 MW. In 2015, the peak demand for electricity was 6,696 MW against 2014’s 6,849MW. The power market in Singapore is competitive, and power generation companies compete to sell their power output into NEMS through a bidding process with hedging via vesting contracts and retail sales. At the end of December 31, 2015, power sold through vesting contracts represented approximately 25% of total system demand. The existing Vesting Contract Scheme will be maintained at 25% of system demand for 2016. EMA has been tasked by the Minister to do a comprehensive review of the Vesting Regime. The decrease in allocated vsting contract volumes will have to be made up through increased retail sales, or otherwise, be translated into increased exposure to more volatile pool prices.
The volatility in the sales price of the revenue associated with the sale of electricity in the NEMS is effectively managed via vesting contracts and direct retail sales which is carried out through a Tuas Power’s subsidiary. The effective tariffs Tuas Power received for its electricity output is thus largely dependent on the vesting contract prices and volumes as well as prices secured under retail sales. The Minister has also indicated the year of 2018 for the start of Full Retail Contestability.
Utility sales in Singapore
In 2015, TMUC sold 1,988,927 MT of steam to customers, representing an increase of 9% as compared to 1,824,638 MT in 2014.
Fuel supply arrangements
In 2015, the majority of our power plants were fueled by coal, gas and oil.
Coal
Our coal supply for our coal-fired power plants is mainly obtained from numerous coal producers in Shanxi Province, Inner Mongolia Autonomous Region and Gansu Province. We also obtain coal from overseas suppliers.
25
For past years, as part of its efforts to make a transition from a comprehensive planned economy to a “socialist market economy”, the PRC has experimented with a variety of methods of setting coal prices. In 1996, the government allowed coal prices to fluctuate within a range around a reference price for coal allocated under the State Plan to be used in electricity generation, and set maximum allowable prices in various coal-producing areas for coal used in electricity generation.
From 2002 to 2003, there was no longer an official State Plan for coal supplies, but the government continued to coordinate the coal prices at the annual national coal purchase conferences attended by, among others, representatives of each of power companies, coal suppliers, and the railway authorities and sponsored and coordinated by NDRC. Power companies obtain allocations for coal on a plant-by-plant basis. Each of the power plants then signs supply contracts with the coal suppliers, and with the railway and shipping companies for the amount of coal and transportation allocated to them. From 2004 to 2008, although such annual coal purchase conferences continue to be held, only key contracts are negotiated and executed at such conferences. Starting from 2009, in furtherance of the coal purchase reform, NDRC ceased to coordinate annual coal purchase conference and took measures to reduce government’s involvement in the coal supply negotiation. NDRC will no longer make allocation of coal supply to power companies, but instead will consolidate and publish overall framework for the coal demand and supply. The price and amount of coal supply will be determined based on the free negotiation between power companies, coal suppliers, and the railway authorities.
In 2011, the average coal price increased significantly. We purchased 144.72 million tons of coal and consumed 144.07 million tons of coal. In 2011, we adjusted the thresholds of key contracts in accordance with the NDRC’s catalogue and criteria. Of our total coal purchases, 26.13% was purchased under the key contracts and the remainder was purchased in the open market. The coal purchase price for our Company, including transportation costs and miscellaneous expenses, averaged approximately RMB637.22 per ton. Our average unit fuel cost in 2011 increased by 9.24% from that in 2010.
In 2012, the average coal price decreased significantly. We purchased 133.47 million tons of coal and consumed 133.93 million tons of coal. Of our total coal purchases, 28.1% was purchased under the key contracts and the remainder was purchased in the open market. The coal purchase price for our Company, including transportation costs and miscellaneous expenses, averaged approximately RMB598.27 per ton. Our average unit fuel cost in 2012 decreased by 7.6% from that in 2011.
In December 2012, the PRC Government issued a notice to further reform coal price, which mandated (1) the termination of all key coal purchase contracts between power generation companies and coal suppliers under the guidance of railway transportation capacity plan, and (2) the termination of the dual pricing system for coal pricing, from the beginning of 2013.
In 2013, as a result of the termination of the key contracts, coal prices in PRC fluctuated wildly. The Bohai-Rim Steam Coal Price Index (“BSPI”) decreased from RMB633 per ton in the beginning of 2013 to RMB530 per ton in early October 2013, and increased again to RMB631 per ton by the end of 2013. The coal purchase price for our Company, including transportation costs and miscellaneous expenses, averaged approximately RMB531.37 per ton. Our average unit fuel cost in 2013 decreased by 12.5% from that in 2012
In 2014, the average coal purchase price decreased significantly while the quality of the purchased coals saw marked improvement. We purchased 120.7 million tons of coal and consumed a total of 134.9 million tons of coal. Of our total coal purchases, 52% was purchased under annual contracting arrangements, and the remainder was purchased in the open market. The coal purchase price for our Company, including transportation costs and miscellaneous expenses, averaged approximately RMB494.86 per ton in 2014. Our average unit fuel cost in 2014 decreased by 7.96% from that in 2013.
In 2015, the average coal purchasing price decreased significantly from the previous year. We purchased 130.56 million tons of coal and consumed 132.12 million tons of coal. Of our total coal purchases, 48% was purchased under annual contracting arrangements and the remainder was purchased in the open market.
26
The coal purchase price for our Company, including transportation costs and miscellaneous expenses, averaged approximately RMB408.71 per ton in 2015. Our average unit fuel cost in 2015 decreased by 13.68% from that in 2014.
Singapore’s Tuas Power used coal as primary fuel for its TMUC’s cogeneration plants. Coal is procured from coal producers in Indonesia via two long-term coal supply contracts with 10 years and 15 years term respectively. The prices are indexed to the Global Coal Newcastle Index.
Gas
Currently, the Company has nine Combined Cycle Gas Turbine Power Plants (“CCGT”) in China, including:
1. Huaneng Shanghai Combined Cycle Gas Turbine Power Plant (“Shanghai CCGT”) with gas supply transported through the pipeline of “West-East Gas Transport Project”;
2. Huaneng Jiangsu Jinling Combined Cycle Gas Turbine Power Plant (“Jinling CCGT”) with gas supply transported through the pipeline of “West-East Gas Transport Project”;
3. Huaneng Jiangsu Jinling Combined Cycle Gas Turbine Co-generation Power Plant (“Jinling CCGT Co-generation”) with gas supply transported through the pipeline of “West-East Gas Transport Project”;
4. Huaneng Beijing Co-generation CCGT Power Plant (“Beijing Co-generation CCGT”) with gas supply transported through Shaanxi-Beijing Pipeline;
5. Huaneng Zhejiang Tongxiang Combined Cycle Gas Turbine Power Plant (“Tongxiang CCGT”), with gas supply transported through the pipeline of “West-East Gas Transport Project”;
6. Huaneng Chongqing Liangjiang Combined Cycle Gas Turbine Power Plant (“Liangjiang CCGT”) with gas supply transported through the pipeline of “West-East Gas Transport Project”;
7. Huaneng Tianjin Lingang Combined Cycle Gas Turbine Co-generation Power Plant (“Lingang CCGT Co-generation”) with gas supply by CNOOC Tianjin Trading Branch;
8. Huaneng Shanxi Dongshan Combined Cycle Gas Turbine Power Plant (“Dongshan CCGT”) with gas supply transported through Shaanxi-Beijing Pipeline II; and
9. Huaneng Hainnan Nanshan Combined Cycle Gas Turbine Power Plant (“Nanshan CCGT”) with gas supply by CNOOC Hainan Branch.
Also, the Tuas Power in Singapore has five gas-fired combined cycle generating units and three gas-fired backup boilers. The piped gas for Tuas Power is provided by Pavilion Gas Pte Ltd and Sembcorp Gas Pte Ltd., whereas LNG is provided by BG Singapore Gas Marketing Pte Ltd.
Oil
Tuas Power maintains operation of one 600 MW oil-fired steam generating unit. The oil supply for Tuas Power is purchased from the open market. With the increased competition from new gas-fired CCPs, fuel oil consumption is expected to be marginal at best and therefore future purchases, if any, will be on a spot basis. Diesel, as backup fuel for oil-fired unites, is also purchased on a spot basis.
Repairs and maintenance
27
Each of our power plants has a timetable for routine maintenance, regular inspections and repairs. Such timetables and the procedures for the repairs and maintenance of generating units comply with the relevant regulations promulgated by the former Ministry of Electricity Power.
Pursuant to our procedures, generating units are currently operating on a cycle of four to six years. In each cycle, there are four different levels of maintenance:
|
|
(i)
|
regular checks and routine maintenance are carried out throughout the period during which generating unit is in operation;
|
|
|
(ii)
|
a small-scale servicing is performed every year, which takes approximately 20 days;
|
|
|
(iii)
|
a medium-scale check-up is carried out between the two overhauls, the length of which depends on the actual condition of the generating unit at the time of the check-up and the inspections and improvements to be carried out; and
|
|
|
(iv)
|
a full-scale overhaul is conducted at the end of each operating cycle, which takes approximately 60 days.
|
|
C.
|
Organizational structure
|
We are 33.33% owned by HIPDC, which in turn is a subsidiary of Huaneng Group. Huaneng Group was established in 1988 with the approval of the State Council. Huaneng Group also holds a 13.83% equity interest in us besides HIPDC. In 2002, Huaneng Group was restructured as one of the five independent power generation group companies to take over the power generation assets originally belonging to the State Power Corporation of China. Huaneng Group has a registered capital of RMB20 billion and is controlled and managed by the central government. Huaneng Group is principally engaged in development, investment, construction, operation and management of power plants; organizing the generation and sale of power (and heat); and the development, investment, construction, production and sale of products in relation to energy, transportation, new energy and environmental protection industries.
HIPDC was established in 1985 as a joint venture controlled by Huaneng Group. HIPDC is engaged in developing, investing, operating and constructing power plants in China. Some of the power plants currently owned and operated by us were originally built and later transferred to us by HIPDC. Both Huaneng Group and HIPDC have agreed to give us preferential rights in the power development business and power assets transfers. See “Item 7.A. Major shareholders” for details.
The following organizational chart sets forth the organizational structure of HIPDC and us as of March 31, 2016:
28
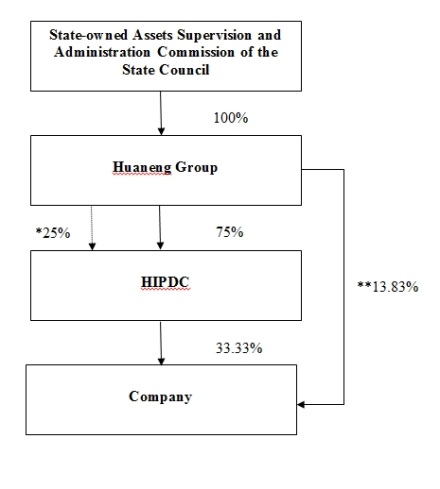
___________________________________________
Notes:
|
*
|
Huaneng Group indirectly holds 100% equity interests in Pro-Power Investment Limited through its wholly owned subsidiary, China Hua Neng Hong Kong Company Limited, and Pro-Power Investment Limited in turn holds 25% equity interests in HIPDC. As a result, Huaneng Group indirectly holds additional 25% equity interests in HIPDC.
|
|
**
|
Of the 13.83% equity interest, 10.23% was directly held by Huaneng Group, 3.11% was held by Huaneng Group through its wholly owned subsidiary, China Hua Neng Hong Kong Company Limited, and the remaining approximately 0.49% was held by Huaneng Group through its subsidiary, China Huaneng Finance Corporation Limited.
|
For a detailed discussion of the Company’s subsidiaries, see Note 9 to the Financial Statements.
|
D.
|
Property, plants and equipment
|
The following table presents certain summary information on our power plants as of March 31, 2016.
|
Plant or Expansion
|
|
Actual
In-service Date
|
|
Current
Installed
Capacity
|
|
Ownership
|
|
Attributable
Capacity
|
|
Type
of Fuel
|
||
|
(Names as defined below)
|
|
|
|
(MW)
|
|
%
|
|
MW
|
|
|
||
|
|
|
|
|
|
|
|
|
|
|
|
|
|
|
Liaoning Province
|
|
|
|
|
|
|
|
|
|
|
|
|
|
Dalian Power Plant
|
|
Phase I
|
|
Unit I: Sep. 1988
|
|
2 x 350
|
|
100%
|
|
700
|
|
Coal
|
|
|
|
|
|
Unit II: Dec. 1988
|
|
|
|
|
|
|
|
|
|
|
|
Phase II
|
|
Unit III: Jan. 1999
|
|
2 x 350
|
|
100%
|
|
700
|
|
Coal
|
|
|
|
|
|
Unit IV: Jan. 1999
|
|
|
|
|
|
|
|
|
|
Dandong Power Plant
|
|
|
|
Unit I: Jan. 1999
|
|
2 x 350
|
|
100%
|
|
700
|
|
Coal
|
|
|
|
|
|
Unit II: Jan. 1999
|
|
|
|
|
|
|
|
|
|
Yingkou Power Plant
|
|
Phase I
|
|
Unit I: Jan. 1996
|
|
2 x 320
|
|
100%
|
|
640
|
|
Coal
|
|
|
|
|
|
Unit II: Dec. 1996
|
|
|
|
|
|
|
|
|
|
|
|
Phase II
|
|
Unit III: Aug. 2007
|
|
2 x 600
|
|
100%
|
|
1,200
|
|
Coal
|
|
|
|
|
|
Unit IV: Oct. 2007
|
|
|
|
|
|
|
|
|
|
Yingkou Co-generation
|
|
|
|
Unit I: Dec. 2009
|
|
2 x 330
|
|
100%
|
|
660
|
|
Coal
|
|
|
|
|
|
Unit II: Dec. 2009
|
|
|
|
|
|
|
|
|
29
|
Plant or Expansion
|
|
Actual
In-service Date
|
|
Current
Installed
Capacity
|
|
Ownership
|
|
Attributable
Capacity
|
|
Type
of Fuel
|
||
|
(Names as defined below)
|
|
|
|
(MW)
|
|
%
|
|
MW
|
|
|
||
|
|
|
|
|
|
|
|
|
|
|
|
|
|
|
Wafangdian Wind Power
|
|
|
|
24 turbines: Jun. 2011
|
|
48
|
|
100%
|
|
48
|
|
Wind
|
|
Changtu Wind Power
|
|
|
|
33 turbines: Nov. 2012
|
|
97.5
|
|
100%
|
|
97.5
|
|
Wind
|
|
|
|
|
24 turbines: Oct. 2014
|
|
||||||||
|
Suzihe Hydropower
|
|
|
|
2012
|
|
3 x 12.5
|
|
100%
|
|
37.5
|
|
Hydro
|
|
Inner Mongolia
|
|
|
|
|
|
|
|
|
|
|
|
|
|
Autonomous Region
|
|
|
|
|
|
|
|
|
|
|
|
|
|
Huade Wind Power
|
|
Phase I
|
|
33 turbines: Dec. 2009
|
|
49.5
|
|
100%
|
|
49.5
|
|
Wind
|
|
|
|
Phase II
|
|
33 turbines: Jun. 2011
|
|
49.5
|
|
100%
|
|
49.5
|
|
Wind
|
|
Hebei Province
|
|
|
|
|
|
|
|
|
|
|
|
|
|
Shang’ an Power Plant
|
|
Phase I
|
|
Unit I: Aug. 1990
|
|
2 x 350
|
|
100%
|
|
700
|
|
Coal
|
|
|
|
|
|
|
|
|
|
|
|
|
|
|
|
|
|
|
|
Unit II: Dec. 1990
|
|
|
|
|
|
|
|
|
|
|
|
Phase II
|
|
Unit III: Oct. 1997
|
|
2 x 330
|
|
100%
|
|
660
|
|
Coal
|
|
|
|
|
|
Unit IV: Oct. 1997
|
|
|
|
|
|
|
|
|
|
|
|
Phase III
|
|
Unit V: Jul. 2008
|
|
2 x 600
|
|
100%
|
|
1,200
|
|
Coal
|
|
|
|
|
|
Unit VI: Aug. 2008
|
|
|
|
|
|
|
|
|
|
Kangbao Wind Power
|
|
Phase I
|
|
33 turbines: Jan. 2011
|
|
49.5
|
|
100%
|
|
49.5
|
|
Wind
|
|
Gansu Province
|
|
|
|
|
|
|
|
|
|
|
|
|
|
Pingliang Power Plant
|
|
|
|
Unit I: Sep. 2000
|
|
3 x 325
|
|
65%
|
|
633.75
|
|
Coal
|
|
|
|
|
|
Unit II: Jun. 2001
|
|
|
|
|
|
|
|
|
|
|
|
|
|
Unit III: Jun. 2003
|
|
|
|
|
|
|
|
|
|
|
|
|
|
Unit IV: Nov. 2003
|
|
1 x 330
|
65%
|
214.5
|
Coal
|
|||
|
|
|
|
|
Unit V: Feb. 2010
|
|
2 x 600
|
65%
|
780
|
Coal
|
|||
|
|
|
|
|
Unit VI: March 2010
|
|
|||||||
|
Jiuquan Wind Power
|
|
|
|
259 turbines: Dec. 2011
|
|
401
|
100%
|
401
|
Wind
|
|||
|
Jiuquan II Wind Power
|
|
|
100 turbines: Dec. 2014
|
|
200
|
100%
|
200
|
Wind
|
||||
|
100 turbines: Jun.2015
|
|
200
|
100%
|
200
|
Wind
|
|||||||
|
Yumen Wind Power
|
24 turbines: Jun. 2015
|
|
48
|
100%
|
48
|
Wind
|
||||||
|
67 turbines: Jun. 2015
|
|
100.5
|
100%
|
100.5
|
Wind
|
|||||||
|
Yigang Wind Power
|
|
96 turbines: Dec. 2015
|
192
|
100%
|
192
|
Wind
|
||||||
|
Beijing Municipality
|
|
|
|
|
|
|
|
|
|
|
|
|
|
Beijing Co-generation
|
|
|
|
Unit I: Jan. 1998
|
|
2 x 165
|
|
41%
|
|
135.3
|
|
Coal
|
|
|
|
|
|
Unit II: Jan. 1998
|
|
|
|
|
|
|
|
|
|
|
|
|
|
Unit III: Dec. 1998
|
|
2 x 220
|
|
41%
|
|
180.4
|
|
Coal
|
|
|
|
|
|
Unit IV: Jun. 1999
|
|
|
|
|
|
|
|
|
|
|
|
|
|
Unit V: Apr. 2004
|
|
1 x 75
|
|
41%
|
|
30.75
|
|
Coal
|
|
Beijing Co-generation
|
|
|
|
Unit I: Dec. 2011
|
|
2 x 306.9
|
|
41%
|
|
251.66
|
|
Gas
|
|
CCGT
|
|
|
|
|
|
|
|
|
|
|
|
|
|
|
|
|
|
Unit II: Dec. 2011
|
|
|
|
|
|
|
|
|
|
|
|
|
|
Unit III: Dec. 2011
|
|
1 x 309.6
|
|
41%
|
|
126.94
|
|
Gas
|
30
|
Plant or Expansion
|
|
Actual
In-service Date
|
|
Current
Installed
Capacity
|
|
Ownership
|
|
Attributable
Capacity
|
|
Type
of Fuel
|
||
|
(Names as defined below)
|
|
|
|
(MW)
|
|
%
|
|
MW
|
|
|
||
|
Tianjin Municipality
|
|
|
|
|
|
|
|
|
|
|
|
|
|
Yangliuqing Co-generation
|
|
|
|
Unit I: Dec. 1998
|
|
4 x 300
|
|
55%
|
|
660
|
|
Coal
|
|
|
|
|
|
Unit II: Sep. 1999
|
|
|
|
|
|
|
|
|
|
|
|
|
|
Unit III: Dec. 2006
|
|
|
|
|
|
|
|
|
|
|
|
|
|
Unit IV: May 2007
|
|
|
|
|
|
|
|
|
|
Lingang Co-generation CCGT
|
|
|
|
Unit I: Dec. 2014
|
|
1 x 313
1 x 150
|
|
100
|
|
463
|
|
Gas
|
|
Shanxi Province
|
|
|
|
|
|
|
|
|
|
|
|
|
|
Yushe Power Plant
|
|
Phase I
|
|
Unit I: Jun. 1994
|
|
2 x 100
|
|
60%
|
|
120
|
|
Coal
|
|
|
|
|
|
Unit III: Dec. 1994
|
|
|
|
|
|
|
|
|
|
|
|
Phase II
|
|
Unit IV: Oct. 2004
|
|
2 x 300
|
|
60%
|
|
360
|
|
Coal
|
|
|
|
|
|
Unit II: Nov. 2004
|
|
|
|
|
|
|
|
|
|
Zuoquan Power Plant
|
|
|
|
Unit I: Dec. 2011
|
|
2 x 673
|
|
80%
|
|
1,076.8
|
|
Coal
|
|
|
|
|
|
Unit II: Jan. 2012
|
|
|
|
|
|
|
|
|
|
Dongshan CCGT
|
Unit I: Oct. 2015
|
2 x297.7
|
100%
|
595.4
|
Gas
|
|||||||
|
Unit II: Oct. 2015
|
||||||||||||
|
Unit III: Oct. 2015
|
263.6
|
100%
|
263.6
|
Gas
|
||||||||
|
Shandong Province
|
|
|
|
|
|
|
|
|
|
|
|
|
|
Dezhou Power Plant
|
|
Phase I
|
|
Units I: 1992
|
|
1 x 330
|
|
100%
|
|
330
|
|
Coal
|
|
|
|
|
|
Unit II: 1992
|
|
1 x 320
|
|
100%
|
|
320
|
|
Coal
|
|
|
|
Phase II
|
|
Units III: Jun. 1994
|
|
1 x 330
|
|
100%
|
|
330
|
|
Coal
|
|
|
|
|
|
Unit IV: May 1995
|
|
1 x 320
|
|
100%
|
|
320
|
|
Coal
|
|
|
|
Phase III
|
|
Units V: Jun. 2002
|
|
2 x 700
|
|
100%
|
|
1,400
|
|
Coal
|
|
|
|
|
|
Unit VI: Oct. 2002
|
|
|
|
|
|
|
|
|
|
Jining Power Plant
|
|
Coal-fired
|
|
Unit V: Jul. 2003
|
|
2 x 135
|
|
100%
|
|
270
|
|
Coal
|
|
|
|
|
|
Unit VI: Aug. 2003
|
|
|
|
|
|
|
|
|
|
|
|
Co-generation
|
|
Unit I: Nov. 2009
|
|
2 x 350
|
|
100%
|
|
700
|
|
Coal
|
|
|
|
|
|
Unit II: Dec. 2009
|
|
|
|
|
|
|
|
|
|
Xindian Power Plant
|
|
Phase III
|
|
Unit V: Sep 2006
|
|
2 x 300
|
|
95%
|
|
570
|
|
Coal
|
|
|
|
|
|
Unit VI: Nov. 2006
|
|
|
|
|
|
|
|
|
|
Weihai Power Plant
|
|
Phase II
|
|
Units III: Mar. 1998
|
|
2 x 320
|
|
60%
|
|
384
|
|
Coal
|
|
|
|
|
|
Unit IV: Nov. 1998
|
|
|
|
|
|
|
|
|
|
|
|
Phase III
|
|
Unit V: Dec. 2012
|
|
2 x 680
|
|
60%
|
|
816
|
|
Coal
|
|
|
|
|
|
Unit VI: Dec. 2012
|
|
|
|
|
|
|
|
|
|
Rizhao Power Plant
|
|
Phase II
|
|
2008
|
|
2 x 680
|
|
100%
|
|
1,360
|
|
Coal
|
|
|
|
|
|
|
|
|
|
|
|
|
||
|
Zhanhua Co-generation
|
|
|
|
Jul. 2005
|
|
2 x 165
|
|
100%
|
|
330
|
|
Coal
|
|
|
|
|
|
|
|
|
|
|
|
|||
|
Henan Province
|
|
|
|
|
|
|
|
|
|
|
|
|
|
Qinbei Power Plant
|
|
Phase I
|
|
Unit I: Nov. 2004
|
|
2 x 600
|
|
60%
|
|
720
|
|
Coal
|
|
|
|
|
|
Unit II: Dec. 2004
|
|
|
|
|
|
|
|
|
|
|
|
Phase II
|
|
Unit III: Nov. 2007
|
|
2 x 600
|
|
60%
|
|
720
|
|
Coal
|
|
|
|
|
|
Unit IV: Nov. 2007
|
|
|
|
|
|
|
|
|
|
|
|
Phase III
|
|
Unit V: Mar. 2012
|
|
2 x 1000
|
|
60%
|
|
1,200
|
|
Coal
|
|
|
|
|
|
Unit VI: Feb. 2013
|
|
|
|
|
|
|
|
|
|
Luoyang Co-generation Power Plant
|
Unit I: May. 2015
|
2 x 350
|
80%
|
560
|
Coal
|
|||||||
|
Unit II: Jun. 2015
|
||||||||||||
31
|
Plant or Expansion
|
|
Actual
In-service Date
|
|
Current
Installed
Capacity
|
|
Ownership
|
|
Attributable
Capacity
|
|
Type
of Fuel
|
|
(Names as defined below)
|
|
|
|
(MW)
|
|
%
|
|
MW
|
|
|
|
Jiangsu Province
|
|
|
|
|
|
|
|
|
|
|
|
|
|
Nantong Power Plant
|
|
Phase I
|
|
Unit I: Sep. 1989
|
|
2 x 352
|
|
100%
|
|
704
|
|
Coal
|
|
|
|
|
|
Unit II: Mar. 1990
|
|
|
|
|
|
|
|
|
|
|
|
Phase II
|
|
Unit III: Jul. 1999
|
|
2 x 350
|
|
100%
|
|
700
|
|
Coal
|
|
|
|
|
|
Unit IV: Oct. 1999
|
|
|
|
|
|
|
|
|
|
Nanjing Power Plant
|
|
|
|
Unit I: Mar. 1994
|
|
2 x 320
|
|
100%
|
|
640
|
|
Coal
|
|
|
|
|
|
Unit II: Oct. 1994
|
|
|
|
|
|
|
|
|
|
Taicang Power Plant
|
|
Phase I
|
|
Unit I: Dec. 1999
|
|
2 x 320
|
|
75%
|
|
480
|
|
Coal
|
|
|
|
|
|
Unit II: Apr. 2000
|
|
|
|
|
|
|
|
|
|
|
|
Phase II
|
|
Unit III: Jan. 2006
|
|
2 x 630
|
|
75%
|
|
945
|
|
Coal
|
|
|
|
|
|
Unit IV: Feb. 2006
|
|
|
|
|
|
|
|
|
32
|
Plant or Expansion
|
|
Actual
In-service Date
|
|
Current
Installed
Capacity
|
|
Ownership
|
|
Attributable
Capacity
|
|
Type
of Fuel
|
||
|
(Names as defined below)
|
|
|
|
(MW)
|
|
%
|
|
MW
|
|
|
||
|
Huaiyin Power Plant
|
|
Phase II
|
|
Unit III: Jan. 2005
|
|
2 x 330
|
|
63.64%
|
|
420
|
|
Coal
|
|
|
|
|
|
Unit IV: Mar. 2005
|
|
|
|
|
|
|
|
|
|
|
|
Phase III
|
|
Unit V: May 2006
|
|
2 x 330
|
|
63.64%
|
|
420
|
|
Coal
|
|
|
|
|
|
Unit VI: Sep. 2006
|
|
|
|
|
|
|
|
|
|
Jinling Power Plant
|
|
CCGT
|
|
Unit I: Dec. 2006
|
|
2 x 390
|
|
60%
|
|
468
|
|
Gas
|
|
|
|
|
|
Unit II: Mar. 2007
|
|
|
|
|
|
|
|
|
|
|
|
CCGT
Cogeneration
|
|
Unit I: April. 2013 Unit II: May. 2013
|
|
2 x 126.7
2 x 64.6
|
|
51%
|
|
195.1
|
|
Gas
|
|
Jinling Coal-fired
|
|
|
|
Unit III: Dec. 2009
|
|
2 x 1,030
|
|
60%
|
|
1,236
|
|
Coal
|
|
|
|
|
|
Unit IV: Aug. 2012
|
|
|
|
|
|
|
|
|
|
Qidong Wind Power
|
|
Phase I
|
|
61 turbines: Mar. 2009
|
|
91.5
|
|
65%
|
|
59.5
|
|
Wind
|
|
|
|
Phase II
|
|
25 turbines: Jan. 2011
|
|
50
|
|
65%
|
|
32.5
|
|
Wind
|
|
|
|
|
|
22 turbines: Jun. 2012
|
|
44
|
|
65%
|
|
28.6
|
|
Wind
|
|
Rudong Wind Power
|
|
|
|
24 turbines: Nov. 2013
|
|
48
|
|
90%
|
|
24.48
|
|
Wind
|
|
Suzhou Co-generation
|
|
|
|
Unit I: Aug. 2006
|
|
2 x 60
|
|
53.45%
|
|
64.14
|
|
Coal
|
|
|
|
|
|
Unit II: Oct. 2006
|
|
|
|
|
|
|
|
|
| Tongshan Wind Power | Mar. 2016 | 48 | 100% | 48 | Wind | |||||||
| Mar. 2016 | 1.5 | 100% | 1.5 | Wind | ||||||||
|
Shanghai Municipality
|
|
|
|
|
|
|
|
|
|
|
|
|
|
Shidongkou I
|
|
|
|
Unit I: Feb. 1988
|
|
4 x 325
|
|
100%
|
|
1,300
|
|
Coal
|
|
|
|
|
|
Unit II: Dec. 1988
|
|
|
|
|
|
|
|
|
|
|
|
|
|
Unit III: Sep. 1989
|
|
|
|
|
|
|
|
|
|
|
|
|
|
Unit IV: May 1990
|
|
|
|
|
|
|
|
|
|
Shidongkou II
|
|
|
|
Unit I: Jun. 1992
|
|
2 x 600
|
|
100%
|
|
1,200
|
|
Coal
|
|
|
|
|
|
Unit II: Dec. 1992
|
|
|
|
|
|
|
|
|
|
Shidongkou Power
|
|
|
|
Unit I: Oct. 2011
|
|
2 x 660
|
|
50%
|
|
660
|
|
Coal
|
|
|
|
|
|
Unit II: Oct. 2011
|
|
|
|
|
|
|
|
|
|
Shanghai CCGT
|
|
|
|
Unit I: May 2006
|
|
3 x 390
|
|
70%
|
|
819
|
|
Gas
|
|
|
|
|
|
Unit II: Jun. 2006
|
|
|
|
|
|
|
|
|
|
|
|
|
|
Unit III: Jul. 2006
|
|
|
|
|
|
|
|
|
|
Chongqing Municipality
|
|
|
|
|
|
|
|
|
|
|
|
|
|
Luohuang Power Plant
|
|
Phase I
|
|
Unit I: Sep. 1991
|
|
2 x 360
|
|
60%
|
|
432
|
|
Coal
|
|
|
|
|
|
Unit II: Feb. 1992
|
|
|
|
|
|
|
|
|
|
|
|
Phase II
|
|
Unit III: Dec. 1998
|
|
2 x 360
|
|
60%
|
|
432
|
|
Coal
|
|
|
|
|
|
Unit IV: Dec. 1998
|
|
|
|
|
|
|
|
|
|
|
|
Phase III
|
|
Unit V: Dec. 2006
|
|
2 x 600
|
|
60%
|
|
720
|
|
Coal
|
|
|
|
|
|
Unit VI: Jan. 2007
|
|
|
|
|
|
|
|
|
|
Liangjiang CCGT
|
|
|
|
Unit I: Oct. 2014
|
|
2 x 467
|
|
100%
|
|
934
|
|
Gas
|
|
|
|
|
|
Unit II: Dec. 2014
|
|
|
|
|
|
|
|
|
|
Zhejiang Province
|
|
|
|
|
|
|
|
|
|
|
|
|
|
Changxing Power Plant
|
|
|
|
Unit I: Dec. 2014
|
|
2 x 660
|
|
100%
|
|
1320
|
|
Coal
|
|
|
|
|
|
Unit II: Dec. 2014
|
|
|
|
|
|
|
|
|
|
Yuhuan Power Plant
|
|
Phase I
|
|
Unit I: Nov. 2006
|
|
2 x 1,000
|
|
100%
|
|
2,000
|
|
Coal
|
|
|
|
|
|
Unit II: Dec. 2006
|
|
|
|
|
|
|
|
|
|
|
|
Phase II
|
|
Unit III: Nov. 2007
|
|
2 x 1,000
|
|
100%
|
|
2,000
|
|
Coal
|
|
|
|
|
|
Unit IV: Nov. 2007
|
|
|
|
|
|
|
|
|
|
Tongxiang CCGT
|
|
|
|
Unit I: Sep. 2014
|
|
1 x 258.4
|
|
95%
|
|
245.48
|
|
Gas
|
|
|
|
|
|
Unit II: Sep. 2014
|
|
1 x 200
|
|
95%
|
|
190
|
|
Gas
|
33
|
Plant or Expansion
|
|
Actual
In-service Date
|
|
Current
Installed
Capacity
|
|
Ownership
|
|
Attributable
Capacity
|
|
Type
of Fuel
|
||
|
(Names as defined below)
|
|
|
|
(MW)
|
|
%
|
|
MW
|
|
|||
|
Si’an Photovoltaic
|
|
|
|
Dec. 2014
|
|
5
|
|
100%
|
|
5
|
|
Solar
|
|
Mar. 2015
|
5
|
|
100%
|
|
5
|
|
Solar
|
|||||
|
Hunan Province
|
|
|
|
|
|
|
|
|
|
|
|
|
|
Yueyang Power Plant
|
|
Phase I
|
|
Unit I: Sep. 1991
|
|
2 x 362.5
|
55%
|
398.75
|
Coal
|
|||
|
|
|
|
|
Unit II: Dec. 1991
|
|
|||||||
|
|
|
Phase II
|
|
Unit III: Mar. 2006
|
|
2 x 300
|
55%
|
330
|
Coal
|
|||
|
|
|
|
|
Unite IV: May 2006
|
|
|||||||
|
|
|
Phase III
|
|
Unit V: Jan. 2011
|
|
2 x 600
|
55%
|
660
|
Coal
|
|||
|
|
|
|
|
Unit VI: Aug. 2012
|
|
|||||||
|
Xiangqi Hydropower
|
|
|
|
Unit I: Dec. 2011
|
|
4 x 20
|
100%
|
80
|
Hydro
|
|||
|
|
|
|
|
Unit II: May 2012
|
|
|||||||
|
|
|
|
|
Unit III: Jul. 2012
|
|
|||||||
|
|
|
|
|
Unit IV: Aug. 2012
|
|
|||||||
|
Subaoding Wind Power
|
|
|
|
40 turbines: Dec. 2014
|
|
75
|
100%
|
75
|
Wind
|
|||
|
35 turbines: May. 2015
|
|
75
|
100%
|
75
|
Wind
|
|||||||
|
Guidong Wind Power
|
42 turbines: Aug. 2015
|
48
|
100%
|
48
|
Wind
|
|||||||
|
18 turbines: Sep. 2015
|
36
|
100%
|
36
|
Wind
|
34
|
Plant or Expansion
|
|
Actual
In-service Date
|
|
Current
Installed Capacity
|
|
Ownership
|
|
Attributable
Capacity
|
|
Type
of Fuel
|
||
|
(Names as defined below)
|
|
|
|
|
|
(MW)
|
|
%
|
|
MW
|
|
|
|
Hubei Province
|
|
|
|
|
|
|
|
|
|
|
|
|
|
Enshi Maweigou Hydropower
|
|
|
|
Dec. 2011
|
|
3 x 5
|
100%
|
15
|
Hydro
|
|||
|
Dec. 2015
|
2 x 20
|
100%
|
40
|
Hydro
|
||||||||
|
Dalongtan Hydropower
|
|
|
|
Unit I: May 2006
|
|
3 x12
|
97%
|
34.92
|
Hydro
|
|||
|
|
|
|
|
Unit II: Aug. 2005
|
|
1 x 1.6
|
97%
|
1.55
|
Hydro
|
|||
|
|
|
|
|
Unit III: Mar. 2006
|
|
|||||||
|
Wuhan Power Plant
|
|
Phase I
|
|
Unit I: Jun. 1993
|
|
2 x 300
|
75%
|
450
|
Coal
|
|||
|
|
|
|
|
Unit II: Jan. 1994
|
|
|||||||
|
|
|
Phase II
|
|
Unit III: May 1997
|
|
2 x 330
|
75%
|
495
|
Coal
|
|||
|
|
|
|
|
Unite IV: Dec. 1997
|
|
|||||||
|
|
|
Phase III
|
|
Unit V: Oct. 2006
|
|
2 x 600
|
75%
|
900
|
Coal
|
|||
|
|
|
|
|
Unit VI: Dec. 2006
|
|
|
|
|
|
|
|
|
|
Jingmen Co-generation
|
|
|
|
Unit I: Nov. 2014
|
|
2 x 350
|
|
100%
|
|
700
|
|
Coal
|
|
|
|
|
|
Unit II: Oct. 2014
|
|
|
|
|
|
|
|
|
|
Yingcheng Co-generation
|
|
|
|
Unit II: Jan. 2015
|
|
1 x 350
|
|
100%
|
|
350
|
|
Coal
|
|
Jieshan Wind Power
|
24 turbines: Jun. 2015
|
48
|
100%
|
48
|
Wind
|
|||||||
|
Jiangxi Province
|
|
|
|
|
|
|
|
|
|
|
|
|
|
Jinggangshan Power Plant
|
|
Phase I
|
|
Unit I: Dec. 2000
|
|
2 x 300
|
|
100%
|
|
600
|
|
Coal
|
|
|
|
|
|
Unit II: Aug. 2001
|
|
|
|
|
|
|
|
|
|
|
|
Phase II
|
|
Unit III: Nov. 2009
|
|
2 x 660
|
|
100%
|
|
1,320
|
|
Coal
|
|
|
|
|
|
Unit IV: Dec. 2009
|
|
|
|
|
|
|
|
|
|
Jianggongling Wind Power
|
|
|
|
24 turbines: Dec. 2014
|
|
48
|
|
100%
|
|
48
|
|
Wind
|
|
Ruijin Power Plant
|
|
|
|
Unit I: May 2008
|
|
2 x 350
|
|
100%
|
|
700
|
|
Coal
|
|
|
|
|
|
Unit II: Aug. 2008
|
|
|||||||
|
Anyuan Power Plant
|
Unit I: Jun. 2015
|
2 x 660
|
100%
|
1,320
|
Coal
|
|||||||
|
Unit II: Aug. 2015
|
||||||||||||
|
Anhui Province
|
|
|
|
|
|
|
|
|
|
|
|
|
|
Chaohu Power Plant
|
|
|
|
Unit I: May 2008
|
|
2 x 600
|
|
60%
|
|
720
|
|
Coal
|
|
|
|
|
|
Unit II: Aug. 2008
|
|
|
|
|
|
|
|
|
|
Hualiangting Hydropower
|
|
Phase I
|
|
Unit I: Oct. 1981
|
|
2 x 10
|
|
100%
|
|
20
|
|
Hydro
|
|
|
|
|
|
Unit II: Nov. 1981
|
|
|
|
|
|
|
|
|
|
|
|
Phase II
|
|
Unit III: Nov. 1987
|
|
2 x 10
|
|
100%
|
|
20
|
|
Hydro
|
|
|
|
|
|
Unit IV: Nov. 1987
|
|
|
|
|
|
|
|
|
|
Fujian Province
|
|
|
|
|
|
|
|
|
|
|
|
|
|
Fuzhou Power Plant
|
|
Phase I
|
|
Unit I: Sep. 1988
|
|
2 x 350
|
|
100%
|
|
700
|
|
Coal
|
|
|
|
|
|
Unit II: Dec. 1988
|
|
|
|
|
|
|
|
|
|
|
|
Phase II
|
|
Unit III: Oct. 1999
|
|
2 x 350
|
|
100%
|
|
700
|
|
Coal
|
|
|
|
|
|
Unit IV: Oct. 1999
|
|
|
|
|
|
|
|
|
|
|
|
Phase III
|
|
Unit V: Jul. 2010
|
|
2 x 660
|
|
100%
|
|
660
|
|
Coal
|
|
Guangdong Province
|
|
|
|
|
|
|
|
|
|
|
|
|
|
Shantou Power Plant
|
|
Phase I
|
|
Unit VI: Oct. 2011 Unit I: Jan. 1997
|
|
2 x 300
|
|
100%
|
|
600
|
|
Coal
|
|
|
|
|
|
Unit II: Jan. 1997
|
|
|
|
|
|
|
|
|
|
|
|
Phase II
|
|
Unit III: Oct. 2005
|
|
1 x 600
|
|
100%
|
|
600
|
|
Coal
|
|
Haimen
|
|
|
|
Unit I: Jul. 2009
|
|
2 x 1,036
|
|
100%
|
|
2,072
|
|
Coal
|
|
|
|
|
|
Unit II: Oct. 2009
|
|
|
|
|
|
|
|
|
|
Haimen Power
|
|
|
|
Unit I: Mar. 2013
|
|
2 x 1,036
|
|
80%
|
|
1,657.6
|
|
Coal
|
|
|
|
|
|
Unit II: Mar. 2013
|
|
|
|
|
|
|
|
|
35
|
Plant or Expansion
|
|
Actual
In-service Date
|
|
Current
Installed
Capacity
|
|
Ownership
|
|
Attributable
Capacity
|
|
Type
of Fuel
|
||
|
(Names as defined below)
|
|
|
|
(MW)
|
|
%
|
|
MW
|
|
|||
|
Yunnan Province
|
|
|
|
|
|
|
|
|
|
|
|
|
|
Diandong Energy
|
|
Phase I
|
|
Unit I: Feb. 2006
|
|
2 x 600
|
|
100%
|
|
1,200
|
|
Coal
|
|
|
|
|
|
Unit II: Jul. 2006
|
|
|
|
|
|
|
|
|
|
|
|
Phase II
|
|
Unit III: Nov. 2006
|
|
2 x 600
|
|
100%
|
|
1,200
|
|
Coal
|
|
|
|
|
|
Unit IV: May 2007
|
|
|
|
|
|
|
|
|
|
Yuwang Energy
|
|
Phase I
|
|
Unit I: Jul. 2009
|
|
2 x 600
|
|
100%
|
|
1,200
|
|
Coal
|
|
|
|
|
|
Unit II: Feb. 2010
|
|
|
|
|
|
|
|
|
|
Fuyuan Wind Power
|
|
|
|
20 turbines: Dec. 2014
|
|
40
|
|
100%
|
|
40
|
|
Wind
|
|
24 turbines: Dec. 2014
|
|
48
|
|
100%
|
|
48
|
|
Wind
|
||||
|
Hainan Province
|
|
|
|
|
|
|
|
|
|
|
|
|
|
Haikou Power Plant
|
|
|
|
Unit IV: May 2000
|
|
2 x 138
|
|
91.8%
|
|
253.368
|
|
Coal
|
|
|
|
|
|
Unit V: May 1999
|
|
|
|
|
|
|
|
|
|
|
|
|
|
Unit VIII: Apr. 2006
|
|
2 x 330
|
|
91.8%
|
|
605.88
|
|
Coal
|
|
|
|
|
|
Unit IX: May 2007
|
|
|
|
|
|
|
|
|
|
Dongfang Power Plant
|
|
Phase I
|
|
Unit I: Jun. 2009
|
|
2 x 350
|
|
91.8%
|
|
642.6
|
|
Coal
|
|
|
|
|
|
Unit II: Dec. 2009
|
|
|
|
|
|
|
|
|
|
|
|
Phase II
|
|
Unit III: May 2012
|
|
2 x 350
|
|
91.8%
|
|
642.6
|
|
Coal
|
|
|
|
|
|
Unit IV: Dec. 2012
|
|
|
|
|
|
|
|
|
|
Nanshan Co-generation
|
|
|
|
Unit I: Apr. 1995
|
|
2 x 50
|
|
91.8%
|
|
91.8
|
|
Gas
|
|
|
|
|
|
Unit II: Apr. 1995
|
|
|
|
|
|
|
|
|
|
|
|
|
|
Unit III: Oct. 2003
|
|
2 x 16
|
|
91.8%
|
|
29.370
|
|
Gas
|
|
|
|
|
|
Unit IV: Oct. 2003
|
|
|
|
|
|
|
|
|
|
Gezhen Hydropower
|
|
|
|
Unit I: Nov. 2009
|
|
2 x 40
|
|
91.8%
|
|
73.40
|
|
Hydro
|
|
|
|
|
|
Unit II: Nov. 2009
|
|
|
|
|
|
|
|
|
|
|
|
|
|
Unit III: Dec. 2009
|
|
2 x 1
|
|
91.8%
|
|
1.836
|
|
Hydro
|
|
|
|
|
|
Unit IV: Dec. 2009
|
|
|
|
|
|
|
|
|
|
Wenchang Wind Power
|
|
|
|
34 turbines: Jan. 2009
|
|
51.5
|
|
91.8%
|
|
47.277
|
|
Wind
|
|
Guizhou
|
||||||||||||
|
Panxian Wind Power
|
12 turbines: Dec. 2015
|
|
24
|
|
100%
|
|
24
|
|
Wind
|
|||
|
Singapore
|
|
|
|
Unit I: Mar. 1999
|
|
1 x 600
|
|
100%
|
|
600
|
|
Oil
|
|
Tuas Power
|
|
|
|
Unit III: Nov. 2001
|
|
4 x 367.5
|
|
100%
|
|
1,470
|
|
Gas
|
|
|
|
|
|
Unit IV: Jan. 2002
|
|
|
|
|
|
|
|
|
|
|
|
|
|
Unit V: Feb. 2005
|
|
|
|
|
|
|
|
|
|
|
|
|
|
Unit VI: Sep. 2005
|
|
|
|
|
|
|
|
|
|
|
|
|
|
Unit VII: Dec. 2013
|
|
405.9
|
|
100%
|
|
405.9
|
|
Gas
|
|
TMUC
|
|
Phase I
|
|
Feb. 2013
|
|
1 x 101
|
|
100%
|
|
101
|
|
Coal & biomass
|
|
|
|
Phase IIA
|
|
Jun. 2014
|
|
1 x 32.5
|
|
100%
|
|
32.5
|
|
Coal & biomass
|
The following table presents the availability factors and the capacity factors of our coal-fired operating power plants in China for the years ended December 31, 2013, 2014 and 2015.
|
Coal-fired Power Plant
|
|
Availability factor (%)
|
|
|
Capacity factor (%)
|
|
||||||||||||||||||
|
|
|
2013
|
|
|
2014
|
|
|
2015
|
|
|
2013
|
|
|
2014
|
|
|
2015
|
|
||||||
|
Liaoning Province
|
|
|
|
|
|
|
|
|
|
|
|
|
|
|
|
|
|
|
||||||
|
Dalian
|
|
|
97.03
|
|
|
|
97.76
|
92.95
|
|
|
|
50.71
|
|
|
|
54.13
|
49.04
|
|
||||||
|
Dandong
|
|
|
96.77
|
|
|
|
95.89
|
100
|
|
|
|
50.79
|
|
|
|
52.14
|
49.74
|
|
||||||
|
Yingkou
|
|
|
92.05
|
|
|
|
94.16
|
93.34
|
|
|
|
45.42
|
|
|
|
49.64
|
48.86
|
|
||||||
36
|
Coal-fired Power Plant
|
|
Availability factor (%)
|
|
|
Capacity factor (%)
|
|
||||||||||||||||||
|
|
|
2013
|
|
|
2014
|
|
|
2015
|
|
|
2013
|
|
|
2014
|
|
|
2015
|
|||||||
|
Yingkou Co-generation
|
|
|
98.08
|
|
|
|
100
|
100
|
|
|
|
60.2
|
|
|
|
52.63
|
53.35
|
|
||||||
|
Hebei Province
|
|
|
|
|
|
|
|
|
|
|
|
|
|
|
|
|
||||||||
|
Shang’an
|
|
|
97.91
|
|
|
|
98.15
|
95.50
|
|
|
|
66.84
|
|
|
|
63.52
|
66.74
|
|
||||||
|
Gansu Province
|
|
|
|
|
|
|
|
|
|
|
|
|
|
|
|
|
||||||||
|
Pingliang
|
|
|
91.48
|
|
|
|
94.63
|
88.83
|
|
|
|
46.79
|
|
|
|
51.85
|
27.76
|
|
||||||
|
Beijing Municipality
|
|
|
|
|
|
|
|
|
|
|
|
|
|
|
|
|
||||||||
|
Beijing
|
|
|
95.13
|
|
|
|
94.48
|
85.60
|
|
|
|
59.53
|
|
|
|
54.79
|
53.01
|
|
||||||
|
Tianjin Municipality
|
|
|
|
|
|
|
|
|
|
|
|
|
|
|
|
|
|
|
|
|
|
|
|
|
|
Yangliuqing
|
|
|
94.8
|
|
|
|
93.9
|
95.02
|
|
|
|
67.88
|
|
|
|
62.95
|
54.02
|
|
||||||
|
Shanxi Province
|
|
|
|
|
|
|
|
|
|
|
|
|
|
|
|
|
||||||||
|
Yushe
|
|
|
94.98
|
|
|
|
92.53
|
93.18
|
|
|
|
60.64
|
|
|
|
61.22
|
53.32
|
|
||||||
|
Zuoquan
|
|
|
91.69
|
|
|
|
92.93
|
90.93
|
|
|
|
56.67
|
|
|
|
50.88
|
47.71
|
|
||||||
|
Shandong Province
|
|
|
|
|
|
|
|
|
|
|
|
|
|
|
|
|
||||||||
|
Dezhou
|
|
|
95.51
|
|
|
|
97.01
|
97.01
|
|
|
|
65.87
|
|
|
|
64.46
|
60.83
|
|
||||||
|
Jining
|
|
|
95.74
|
|
|
|
92.03
|
92.03
|
|
|
|
59.43
|
|
|
|
55.56
|
57.58
|
|
||||||
|
Weihai
|
|
|
94.63
|
|
|
|
95.87
|
97.04
|
|
|
|
64.84
|
|
|
|
65.83
|
64.03
|
|
||||||
|
Xindian
|
|
|
90.94
|
|
|
|
87.15
|
89.12
|
|
|
|
61.92
|
|
|
|
62.83
|
60.08
|
|
||||||
|
Rizhao II
|
|
|
92.58
|
|
|
|
91.27
|
92.22
|
|
|
|
65.26
|
|
|
|
64.23
|
66.91
|
|
||||||
|
Zhanhua Co-generation
|
|
|
95.01
|
|
|
|
95.63
|
94.33
|
|
|
|
54.62
|
|
|
|
57.92
|
51.98
|
|
||||||
|
Henan Province
|
|
|
|
|
|
|
|
|
|
|
|
|
|
|
|
|
||||||||
|
Qinbei
|
|
|
95.12
|
|
|
|
92.85
|
97.18
|
|
|
|
60.47
|
|
|
|
50.92
|
46.22
|
|
||||||
|
Jiangsu Province
|
|
|
|
|
|
|
|
|
|
|
|
|
|
|
|
|
||||||||
|
Nantong
|
|
|
92.49
|
|
|
|
90.6
|
91.41
|
|
|
|
68.14
|
|
|
|
55.67
|
50.15
|
|
||||||
|
Nanjing
|
|
|
93.82
|
|
|
|
94.45
|
93.54
|
|
|
|
71.21
|
|
|
|
62.52
|
47.59
|
|
||||||
|
Taicang
|
|
|
98.09
|
|
|
|
99.99
|
94.39
|
|
|
|
74.41
|
|
|
|
65.2
|
60.57
|
|
||||||
|
Huaiyin
|
|
|
90.79
|
|
|
|
91.4
|
91.40
|
|
|
|
67.22
|
|
|
|
58.26
|
50.28
|
|
||||||
|
Jinling Coal-fired
|
|
|
89.49
|
|
|
|
88.66
|
89.82
|
|
|
|
72.72
|
|
|
|
64.1
|
64.99
|
|
||||||
|
Suzhou Co-generation
|
95.27
|
94.27
|
98.42
|
77.01
|
76.71
|
75.10
|
||||||||||||||||||
|
Shanghai Municipality
|
|
|
|
|
|
|
|
|
|
|
|
|
|
|
|
|
||||||||
|
Shidongkou I
|
|
|
95.81
|
|
|
|
98.53
|
95.43
|
|
|
|
71.14
|
|
|
|
52.96
|
44.44
|
|
||||||
|
Shidongkou II
|
|
|
93.42
|
|
|
|
90.15
|
92.57
|
|
|
|
64.83
|
|
|
|
50.71
|
51.15
|
|
||||||
|
Chongqing Municipality
|
|
|
|
|
|
|
|
|
|
|
|
|
|
|
|
|
||||||||
|
Luohuang
|
|
|
93.57
|
|
|
|
94.84
|
94.44
|
|
|
|
63.21
|
|
|
|
48.21
|
42.23
|
|
||||||
|
Zhejiang Province
|
|
|
|
|
|
|
|
|
|
|
|
|
|
|
|
|
|
|
|
|
|
|
||
|
Changxing
|
94.8
|
93.9
|
97.69
|
-
|
29.82
|
47.03
|
||||||||||||||||||
|
Yuhuan
|
|
|
92.76
|
|
|
|
95.45
|
95.53
|
|
|
|
72.07
|
|
|
|
63.22
|
55.43
|
|
||||||
|
Hubei Province
|
|
|
|
|
|
|
|
|
|
|
|
|
|
|
|
|
||||||||
|
Wuhan Power
|
|
|
99.53
|
92.17
|
95.36
|
57.24
|
53.06
|
46.53
|
|
|||||||||||||||
|
Jingmen Thermal Power
|
|
|
-
|
100
|
98.09
|
-
|
34.28
|
26.80
|
|
|||||||||||||||
|
Yingcheng Thermal Power
|
|
|
-
|
-
|
100
|
-
|
-
|
33.52
|
|
|||||||||||||||
|
Hunan Province
|
|
|
|
|
|
|
|
|
|
|
|
|
|
|
|
|
||||||||
|
Yueyang
|
|
|
99.99
|
|
|
|
99.97
|
98.94
|
|
|
|
45.02
|
|
|
|
39.27
|
35.04
|
|
||||||
|
Jiangxi Province
|
|
|
|
|
|
|
|
|
|
|
|
|
|
|
|
|
||||||||
|
Jinggangshan
|
|
|
92.59
|
|
|
|
95.03
|
92.92
|
|
|
|
57.69
|
|
|
|
50.5
|
53.47
|
|
||||||
|
Anhui Province
|
|
|
|
|
|
|
|
|
|
|
|
|
|
|
|
|
||||||||
|
Chaohu Power
|
|
|
92.59
|
|
|
|
95.03
|
95.50
|
|
|
|
57.69
|
|
|
|
50.5
|
55.62
|
|
||||||
|
Fujian Province
|
|
|
|
|
|
|
||||||||||||||||||
|
Fuzhou
|
|
|
93.83
|
|
|
|
94.53
|
91.62
|
|
|
|
63.52
|
|
|
|
58.66
|
45.72
|
|
||||||
|
Guangdong Province
|
|
|
|
|
|
|
|
|
|
|
|
|
|
|
|
|
||||||||
|
Shantou
|
|
|
97.85
|
|
|
|
96.55
|
98.42
|
|
|
|
59.55
|
|
|
|
50.75
|
43.29
|
|
||||||
|
Haimen
|
|
|
96.1
|
|
|
|
96.99
|
96.53
|
|
|
|
55.76
|
|
|
|
53.09
|
45.98
|
|
||||||
|
Yunnan Province
|
|
|
|
|
|
|
|
|
|
|
|
|
|
|
|
|
||||||||
|
Diandong
|
|
|
94.25
|
|
|
|
94.92
|
98.68
|
|
|
|
35.8
|
|
|
|
28.32
|
19.00
|
|
||||||
|
Yuwang
|
|
|
93.92
|
|
|
|
95.36
|
96.79
|
|
|
|
43.31
|
|
|
|
34.88
|
15.07
|
|
||||||
|
Hainan Province
|
|
|
|
|||||||||||||||||||||
|
Haikou
|
|
|
93.92
|
|
|
|
95.36
|
96.02
|
|
|
|
43.31
|
|
|
|
34.88
|
87.47
|
|
37
|
Coal-fired Power Plant
|
|
Availability factor (%)
|
|
|
Capacity factor (%)
|
|
||||||||||||||||||
|
|
|
2013
|
|
|
2014
|
|
|
2015
|
|
|
2013
|
|
|
2014
|
|
|
2015
|
|||||||
|
Dongfang
|
|
94.25
|
|
|
94.92
|
92.73
|
|
|
35.8
|
|
|
28.32
|
74.05
|
|
______________________________________
Note:
|
(1)
|
The details of our operating power plants, construction projects and related projects as of March 31, 2016 are described below.
|
38
Power Plants in Liaoning Province
Dalian Power Plant
Huaneng Dalian Power Plant (“Dalian Power Plant”) is located on the outskirts of Dalian, on the coast of Bohai Bay. Dalian Power Plant, including Phase I and Phase II, has an installed capacity of 1,400 MW and consists of four 350 MW coal-fired generating units which commenced operations in 1988 and 1999 respectively. We hold 100% equity interest in Dalian Power Plant.
The coal supply for Dalian Power Plant is obtained from several coal producers located mostly in Northern Shanxi Province. The coal is transported by rail from the mines to Qinhuangdao port and shipped by special 27,000 ton automatic unloading ships to the wharf at the Dalian Power Plant. The wharf is owned and maintained by the Dalian Port Authority and is capable of handling 30,000 ton vessels. Dalian Power Plant typically stores 200,000 tons of coal on site.
In 2015, Dalian Power Plant obtained 75.6% of its total consumption of coal from annual contracts and the remainder from the open market. The average coal purchase price for Dalian Power Plant in 2015 was RMB417.54 (2014: RMB488.89) per ton.
Dalian Power Plant sells its electricity to Liaoning Electric Power Company.
Dandong Power Plant
Huaneng Dandong Power Plant (“Dandong Power Plant”) is located on the outskirts of the city of Dandong in Liaoning. Dandong Power Plant had originally been developed by HIPDC which, pursuant to the Reorganization Agreement, transferred all its rights and interests therein to us effective December 31, 1994. In March 1997, we began the construction of Dandong Power Plant, which comprises two 350 MW coal-fired generating units. We hold 100% equity interest in Dandong Power Plant.
The coal supply for Dandong Power Plant is obtained from several coal producers in Northern Shanxi Province. The coal is transported by rail from the mines to Qinhuangdao port and shipped by barge to the Dandong port in Dandong, where it is unloaded and transported to Dandong Power Plant using special coal handling facilities. The wharf is owned and maintained by Dandong Power Plant and is capable of handling 28,000 ton vessels. Dandong Power Plant typically stores 220,000 tons of coal on site.
In 2015, Dandong Power Plant obtained 37.1% of its total consumption of coal from annual contracts and the remainder from the open market. The average coal purchase price for Dandong Power Plant in 2015 was RMB396.52 (2014: RMB461.38) per ton.
Dandong Power Plant sells its electricity to Liaoning Electric Power Company.
Yingkou Power Plant
Huaneng Yingkou Power Plant (“Yingkou Power Plant”) is located in Yingkou City in Liaoning Province. Yingkou Power Plant Phase I has an installed capacity of 640 MW and consists of two 320 MW supercritical coal-fired generating units which commenced operations in January and December 1996, respectively. Yingkou Power Plant Phase II has an installed capacity of 1,200MW and consists of two 600 MW coal-fired generating units which commenced operations in August and October 2007, respectively. We hold 100% equity interest in Yingkou Power Plant.
The coal supply for Yingkou Power Plant is mainly obtained from Shanxi Province. Yingkou Power Plant typically stores 400,000 tons of coal on site. In 2015, Yingkou Power Plant obtained 53.2% of its total consumption
39
of coal from annual contracts and the remainder from the open market. The average coal purchase price for Yingkou Power Plant in 2015 was RMB427.85 (2014: RMB482.94) per ton.
Yingkou Power Plant sells its electricity to Liaoning Electric Power Company.
Yingkou Co-generation
Huaneng Yingkou Co-generation Power Plant (“Yingkou Co-generation”) is located in Yingkou City in Liaoning Province. Yingkou Co-generation Power Plant has an installed capacity of 660 MW and consists of two 330 MW generating units which commenced operation in December 2009. We hold 100% equity interest in Yingkou Co-generation Power Plant.
The coal supply for Yingkou Co-generation Power Plant is mainly obtained from Inner Mongolia Autonomous Region. Yingkou Co-generation Power Plant typically stores 140,000 tons of coal on site. In 2015, Yingkou Co-generation Power Plant obtained 98.8% of its total consumption of coal from annual contracts and the remainder from the open market The average coal purchase price for Yingkou Co-generation Power Plant in 2015 was RMB384.98 (2014: RMB398.55) per ton.
Yingkou Co-generation Power Plant sells its electricity to Liaoning Electric Power Company.
Wafangdian Wind Power
Dalian Wafangdian Wind Power Plant (“Wafangdian Wind Power”) is located in Dalian City in Liaoning Province. The installed capacity of phase I of Wafangdian Wind Power Plant is 48 MW and consists of 24 turbines. It commenced operation in June 2011. We hold 100% equity interest in Wafangdian Wind Power Plant.
Wafangdian Wind Power sells its electricity to Liaoning Electric Power Company.
Suzihe Hydropower
Liaoning Suzihe Hydropower Plant (“Suzihe Hydropower”) is located in Liaoning Province. The installed capacity of Suzihe Hydropower Plant is 37.5 MW and consists of three 12.5 MW generating units. Unit I (12.5 MW) of Suzihe Hydropower commenced operation in August 2012. We hold 100% equity interest in Suzihe Hydropower.
Changtu Wind Power
Huaneng Liaoning Changtu Wind Power Plant (“Changtu Wind Power”) is located in Liaoning Province. Phase I of the Changtu Wind Power commenced operation in November 2012, with an installed capacity of 49.5 MW, consisting of 33 wind power turbines of 1.5 MW each. Phase II of the Changtu Wind Power commenced operation in October 2014 , with an installed capacity of 48 MW, consisting of 24 wind power turbines of 2 MW each. We hold 100% of the equity interest in Changtu Wind Power.
Construction Project in Liaoning Province
Yingkou Xianrendao Co-generation Power Project. In December 2013, the project of Yingkou Xianrendao Co-generation Power Plant was approved by the Development and Reform Commission of Liaoning Province. We hold 100% equity interest in this project. The project is planned to have two sets of high temperature back-pressure turbo-generating units of 50 MW each.
We plan to build photovoltaic projects in Dandong and Yingkou, which are located in Liaoning Province. We hold 100% equity interest in the projects. They are planned to have an installed capacity of 20 MW.
Power Plant in Inner Mongolia Autonomous Region
40
Huade Wind Power
Huaneng Huade Wind Power Plant (“Huade Wind Power”) is located in Huade, Inner Mongolia Autonomous Region. Phase I of Huade Wind Power has an installed capacity of 49.5 MW and consists of 33 wind power turbines which commenced operation in 2009. Phase II of Huade Wind Power has an installed capacity of 49.5 MW and consists of 33 wind power turbines which commenced operation in June 2011. We hold 100% equity interest in Huade Wind Power Plant.
Huade Wind Power sells its electricity to Inner Mongolia Power (Group) Co., Ltd.
Power Plants in Hebei Province
Shang’an Power Plant
Huaneng Shang’an Power Plant (“Shang’an Power Plant”) is located on the outskirts of Shijiazhuang. Shang’an Power Plant has been developed in three separate expansion phases. The Shang’an Power Plant Phase I has an installed capacity of 700 MW and consists of two 350 MW coal-fired generating units which commenced operations in 1990. Shang’an Power Plant Phase II shares with the Shang’an Power Plant Phase I certain facilities, such as coal storage facilities and effluence pipes, which have been built to accommodate the requirements of plant expansions. The Shang’an Power Plant Phase II utilizes two 300 MW coal-fired generating units, which commenced operation in 1997. The Shang’an Power Plant Phase III has an installed capacity of 1,200 MW and consists of two 600 MW supercritical coal-fired generating units which commenced operations in July and August 2008, respectively. Unit 5 of Shang’an Power Plant is the first 600MW supercritical air-cooling unit which commenced operation in the PRC. We hold 100% equity interest in Shang’an Power Plant.
The coal supply for Shang’an Power Plant is obtained from numerous coal producers in Central Shanxi Province, which is approximately 64 kilometers from Shang’an Power Plant. The coal is transported by rail from the mines to the Shang’an Power Plant. We own and maintain the coal unloading facilities which are capable of unloading 10,000 tons of coal per day. Shang’an Power Plant typically stores 300,000 tons of coal on site.
In 2015, Shang’an Power Plant obtained 93.9% of its total consumption of coal from annual contracts and the remainder from the open market. The average coal purchase price for Shang’an Power Plant in 2015 was RMB319.33 (2014: RMB442.91) per ton.
Shang’an Power Plant sells its electricity to Hebei Electric Power Company.
Kangbao Wind Power
Huaneng Kangbao Wind Power Plant (“Kangbao Wind Power”) consists of 33 wind power turbines with a total installed capacity of 49.5 MW. In January 2011, the Phase I of Kangbao Wind Power with a total generation capacity of 49.5MW completed the trial run. We hold 100% equity interest in Kangbao Wind Power.
Kangbao Wind Power sells its electricity to Beijing-Tianjin-Tanggu Electric Power Company.
Construction Project in Hebei Province
Zhuolu Dabao Wind Power. In September 2014, the project of Zhuolu Dabao Wind Power was approved by the Development and Reform Commission of Hebei Province. We hold 100% equity interest in this project. The project is planned to have an installed capacity of 48 MW consisting of 24 wind power turbines of 2 MW each.
Kangbao Xitan 20MW Distributed Photovoltaic Power Project. This project is located at Kangbao County, Zhangjiakou City of Hebei Province. In September 2014, it was approved by the Development and Reform
41
Commission of Hebei Province. We hold 100% equity interest in this project. It is planned to have an installed capacity of 20 MW.
Power Plant in Gansu Province
Pingliang Power Plant
Huaneng Pingliang Power Plant (“Pingliang Power Plant”) is located in Pingliang City of Gansu Province. Pingliang Power Plant consists of three 325 MW and one 330 MW coal-fired generating units which commenced operation in 2000, 2001 and June and November 2003 respectively. The installed capacity of Unit I, Unit II and Unit III of Pingliang Power Plant were expanded from 300 MW to 325 MW in January 2010, respectively. The installed capacity of Unit IV of Pingliang Power Plant was expanded from 300 MW to 330 MW in January 2011. Pingliang Power Plant Phase II consists of two 600 MW generating units with a total installed capacity of 1200 MW, which commenced operation in February 2010 and March 2010, respectively. We hold 65% equity interest in Pingliang Power Plant.
The coal supply for Pingliang Power Plant is obtained from local coal mines. Pingliang Power Plant typically stores 230,000 tons of coal on site. In 2015, Pingliang Power Plant obtained 90.9% of its coal supplies from annual contracts and the remainder from the open market. The average coal purchase price for Pingliang Power Plant in 2015 was RMB256.44 (2014: RMB358.47) per ton.
Pingliang Power Plant sells its electricity to Gansu Electric Power Company.
Jiuquan Wind Power
Jiuquan Wind Power Plant (“Jiuquan Wind Power”) consists of 234 wind power turbines of 1.5 MW each and 25 wind power turbines of 2 MW each. In December 2011, all the wind power plants completed the trial run. We hold 100% equity interest in Jiuquan Wind Power.
Jiuquan Wind Power sells its electricity to Gansu Electric Power Company.
Jiuquan II Wind Power
Jiuquan II Wind Power Plant (“Jiuquan II Wind Power ”) is located in Gansu Province. Zone A of this plant commenced operation in December 2014, with an installed capacity of 200 MW in operating, consisting of 100 wind power turbines of 2 MW each. Zone B of this plant commenced operation in June 2015, with an installed capacity of 200 MW in operating, consisting of 100 wind power turbines of 2 MW each. We hold 100% equity interest in Jiuquan II Wind Power.
Jiuquan II Wind Power sells its electricity to Gansu Electric Power Company.
Yumen Wind Power
Yumen Wind Power Plant (“Yumen Wind Power”) is located in Gansu Province. This plant commenced operation in June 2015, with an installed capacity of 148.5 MW, consisting of 67 wind power turbines of 1.5 MW each and 24 wind power turbines of 2 MW each. We hold 100% equity interest in Yumen Wind Power.
Yumen Wind Power sells its electricity to Gansu Electric Power Company.
Yigang Wind Power
Yigang Wind Power (“Yigang Wind Power”) is located in Gansu Province. This plant commenced operation in December 2015, with an installed capacity of 192 MW, consisting of 96 wind power turbines of 2 MW each. We hold 100% equity interest in Yigang Wind Power.
42
The Phase I of Yigang Wind Power sells its electricity to Gansu Electric Power Company.
Power Plant in Beijing Municipality
Beijing Co-generation
Huaneng Beijing Co-generation Power Plant (“Beijing Co-generation”) is located in Beijing Municipality. Beijing Co-generation has an installed capacity of 845 MW and consists of two 165 MW generating units, two 220 MW generating units and one 75 MW generating units which commenced operation in January 1998, December 1998, June 1999 and April 2004, respectively. We hold 41% equity interest in Beijing Cogeneration and believe we exercise effective control over Beijing Co-generation.
The coal supply for Beijing Co-generation is mainly obtained from Inner Mongolia Autonomous Region. Beijing Co-generation typically stores 165,000 tons of coal on site. In 2015, Beijing Co-generation obtained 86.2% of its total consumption of coal from annual contracts and the remainder from the open market. The average coal purchase price for Beijing Co-generation in 2015 was RMB422.39 (2014: RMB501.97) per ton.
Beijing Co-generation sells its electricity to North China Electric Power Company.
Beijing Co-generation CCGT
Beijing Co-generation CCGT consists of one set of “two on one” F-grade gas and steam combined cycle generating units with a power generation capacity of 923.4 MW, heat supply capacity of 650 MW and heat supply area of approximately 13,000,000 square metres. High-standard denitrification, noise reduction, water treatment and other environmental protection facilities were constructed concurrently. In December 2011, Beijing Co-generation CCGT completed its trial run. Beijing Co-generation CCGT sells its electricity to North China Electric Company.
Being the first project commencing construction among the four major co-generation centers in Beijing, Beijing Co-generation CCGT firstly introduced the most efficient world-class F-grade gas turbine in the PRC, thus setting a new record of the maximum heat supply capacity, minimum power consumption for power generation and highest annual thermal efficiency for the same type of generating units in the PRC and attaining a leading and international class design standard in the PRC.
Power Plant in Tianjin Municipality
Yangliuqing Co-generation
Tianjin Huaneng Yangliuqing Co-generation Power Plant (“Yangliuqing Co-generation”) is located in Tianjin Municipality. Yangliuqing Co-generation has an installed capacity of 1,200 MW and consists of four 300 MW coal-fired co-generation units which commenced operation in December 1998, September 1999, December 2006 and May 2007, respectively. We hold 55% equity interest in Yangliuqing Co-generation.
The coal supply for Yangliuqing Co-generationis mainly obtained from Shanxi Province and Inner Mongolia Autonomous Region. Yangliuqing Co-generation typically stores 300,000 tons of coal on site. In 2015, Yangliuqing Co-generation obtained 87.7% of its total consumption of coal from annual contracts and the remainder from the open market. The average coal purchase price for Yangliuqing Co-generation in 2015 was RMB369.26 (2014: RMB458.42) per ton.
Yangliuqing Co-generation sells its electricity to North China Electric Company.
Lingang Co-generation CCGT
43
Lingang Co-generation CCGT is located in Tianjin Municipality. The first set of generating units of Lingang Co-generation CCGT commenced operation in December 2014, with an installed capacity of 463 KW. We hold 100% equity interest in the Lingang Co-generation CCGT. The gas supply for Lingang Co-generation CCGT is transported through the pipeline of “Shannxi-Gansu-Ningxia Transport Project.”
Lingang Co-generation CCGT sells its electricity to North China Electric Company.
Power Plant in Shanxi Province
Yushe Power Plant
Huaneng Yushe Power Plant (“Yushe Power Plant”) is located in Yushe County of Shanxi Province. Yushe Power Plant Phase I has an installed capacity of 200 MW and consists of two 100 MW coal-fired generating units which commenced operations in August and December 1994, respectively. Two 300 MW coal-fired generating units of Yushe Power Plant Phase II commenced operations in October and November 2004, respectively. Yushe Power Plant Phase I was shut down in 2011. We hold 60% equity interest in Yushe Power Plant.
The coal supply for Yushe Power Plant is obtained from several coal producers located mostly in Shanxi Province. Yushe Power Plant typically stores 500,000 tons of coal on site. In 2015, Yushe Power Plant obtained approximately 37.5% of its total consumption of coal from annual contracts and the remainder from the open market. The average coal purchase price for Yushe Power Plant in 2015 was RMB194.96 (2014: RMB273.51) per ton.
Yushe Power Plant sells its electricity to Shanxi Electric Power Company.
Zuoquan Power Plant
Shanxi Huaneng Zuoquan Power Plant (“Zuoquan Power Plant”) is located in Zuoquan County of Shanxi Province. Zuoquan Power Plant has an installed capacity of 1,346 MW and consists of two 673 MW coal-fired generating units which commenced operations in December 2011 and January 2012, respectively. We hold 80% equity interest in Zuoquan Power Plant.
Zuoquan Power Plant typically stores 200,000 tons of coal on site. In 2015, Zuoquan Power Plant obtained approximately26.0% of its total consumption of coal from annual contracts and the remainders from the open market. The average coal purchase price for Zuoquan Power Plant in 2015 was RMB256.99 (2014: RMB341.60) per ton.
Zuoquan Power Plant sells its electricity to Shanxi Electric Power Company.
Dongshan Combined Cycle Gas Turbine Power Plant
Dongshan Combined Cycle Gas Turbine Power Project (“Dongshan CCGT”) is located at Taiyuan City of Shanxi Province. Dongshan CCGT commenced operation in October 2015 with an installed capacity of 859 KW, consisting of one 2×F Class gas-steam combined cycle co-generating unit. We hold 100% equity interest in the plant.
Dongshan CCGT sells its electricity to Shanxi Electric Power Company.
Power Plants in Shandong Province
Dezhou Power Plant
44
Huaneng Dezhou Power Plant (“Dezhou Power Plant”) is located in Dezhou City, near the border between Shandong and Hebei Provinces, close to an industrial zone that is an important user of electric power for industrial and commercial purposes. Dezhou Power Plant is comprised of three phases, with Phase I consisting of one 320MW and one 330MW coal-fired generating units, Phase II consisting of one 330MW and one 320MW coal-fired generating units, and Phase III consisting of two 700 MW coal-fired generating units. The installed capacity of Unit IV was upgraded from 300 MW to 320 MW in January 2009. We hold 100% equity interest in Dezhou Power Plant.
Dezhou Power Plant is approximately 200 km from Taiyuan, Shanxi Province, the source of the plant’s coal supply. The plant is located on the Taiyuan-Shijiazhuang-Dezhou rail line, giving it access to transportation facilities for coal. Dezhou Power Plant typically stores 400,000 tons of coal on site. In 2015, Dezhou Power Plant obtained approximately 57.2% of its total consumption of coal from annual contracts and the remainder from the open market. The average coal purchase price for Dezhou Power Plant in 2015 was RMB370.37 (2014: RMB497.30) per ton. The plant is connected to the main trunk rail line at Dezhou by a dedicated 3.5 km spur line owned by us.
Dezhou Power Plant sells its electricity to State Grid Shandong Electric Power Company.
Jining Power Plant
Huaneng Jining Power Plant (“Jining Power Plant”) is located in Jining City, near the Jining load center and near numerous coal mines. Yanzhou coal mine, which is adjacent to the plant, alone has annual production of approximately 20 million tons. Jining Power Plant typically stores 100,000 tons of coal on site.
Jining Power Plant currently consists of two coal-fired generating units, with an aggregate installed capacity of 270 MW. In addition, Jining Power Plant (Co-generation) has an installed capacity of 700 MW and consists of two 350 MW generating units which commenced operation in November and December 2009, respectively. We hold 100% equity interest in Jining Power Plant.
In 2015, Jining Power Plant obtained approximately 29.6% of its total consumption of coal from annual contracts and the remainder from the open market. The average coal purchase price for Jining Power Plant in 2015 was RMB370.51 (2014: RMB482.55) per ton.
Jining Power Plant sells its electricity to State Grid Shandong Electric Power Company.
Xindian Power Plant
Huaneng Xindian Power Plant (“Xindian Power Plant”) is located in Zibo City of Shandong Province. Xindian Power Plant has an installed capacity of 450 MW and consists of two 225 MW coal-fired generating units which commenced operations in December 2001 and January 2002, respectively, and were shut down in September 2009. Xindian Power Plant Phase III Expansion consists of two 300 MW generating units with a total installed capacity of 600 MW, which were put into operation in September and November 2006, respectively. We hold 95% equity interest in Xindian Power Plant.
The coal supply for Xindian Power Plant is obtained from several coal producers located mostly in Shanxi Province. Xindian Power Plant typically stores 250,000 tons of coal on site. In 2015, Xindian Power Plant obtained 9.2% of its total consumption of coal from annual contracts and the remainder from the open market. The average coal purchase price for Xindian Power Plant in 2015 was RMB372.93 (2014: RMB491.23) per ton.
Xindian Power Plant sells its electricity to State Grid Shandong Electric Power Company.
Weihai Power Plant
45
Huaneng Weihai Power Plant (“Weihai Power Plant”) is located approximately 16 km southeast of Weihai City, on the shore of the Bohai Gulf. Its location provides access to cooling water for operations and transportation of coal as well as ash and slag disposal facilities. We hold 60% equity interest in Weihai Power Plant, the remaining 40% interest of which is owned by Weihai Power Development Bureau (“WPDB”).
Weihai Power Plant Phase I consists of two 125 MW generating units (Units I and II), and Phase II consists of two 320 MW generating units (Units III and IV). Unit I began commercial operation in May 1994 and was shut down in December 2008, and Unit II began commercial operation in January 1995 and was shut down in November 2008. Unit III and Unit IV commenced operation in March and November 1998, respectively. Each of the Units III and IV was upgraded from 300 MW to 320 MW in January 2009. Weihai Power Plant Phase III consists of two 680 MW generating units which commenced operations in December 2012. The coal supply for Weihai Power Plant is obtained from Shanxi Province and Inner Mongolia. Weihai Power Plant typically stores 160,000 tons of coal on site. In 2015, Weihai Power Plant obtained approximately 12.4% of its total consumption of coal from annual contracts and the remainder from the open market. The average coal purchase price for Weihai Power Plant in 2015 was RMB419.15 (2014: RMB496.83) per ton.
Weihai Power Plant sells its electricity to State Grid Shandong Electric Power Company.
Rizhao Power Plant
Huaneng Rizhao Power Plant (“Rizhao Power Plant”) is located in Rizhao City of Shandong Province. Rizhao Power Plant currently has an aggregate installed capacity of 2,060 MW. Rizhao Power Plant Phase I has an installed capacity of 700 MW and consists of two 350 MW coal-fired generating units which both commenced operations in April 2000. We hold 44% equity interests in Phase I of Rizhao Power Plant.
We hold 100% equity interest in Phase II of Rizhao Power Plant, which commenced operation in December 2008 and consists of two 680 MW supercritical coal-fired generating units. The coal supply for Phase II of Rizhao Power Plant is obtained from Shanxi Province. Phase II of Rizhao Power Plant typically stores 200,000 tons of coal on site. In 2015, Phase II of Rizhao Power Plant obtained 0.1% of its total consumption of coal from annual contracts and the remainder from the open market. The average coal purchase price for Phase II of Rizhao Power Plant in 2015 was RMB456.98 (2014: RMB538.31) per ton.
Rizhao Power Plant sells its electricity to State Grid Shandong Electric Power Company.
Zhanhua Co-generation
Shandong Zhanhua Co-generation Limited Company (“Zhanhua Co-generation”) is located in Zhanhua City of Shandong Province. Zhanhua Co-generation currently has an aggregate installed capacity of 330 MW, consisting of two generating units which commenced operations in July 2005. We hold 100% equity interest in Zhanhua Co-generation.
The coal supply for Zhanhua Co-generation is mainly obtained from Inner Mongolia Autonomous Region. Zhanhua Co-generation typically stores 90,000 tons of coal on site. In 2015, Zhanhua Co-generation obtained 35.1% of its total consumption of coal from annual contracts and the remainder from the open market. The average coal purchase price for Zhanhua Co-generation in 2015 was RMB334.29 (2014: RMB434.15 ) per ton.
Zhanhua Co-generation sells its electricity to State Grid Shandong Electric Power Company.
Power Plant in Henan Province
Qinbei Power Plant
46
Huaneng Qinbei Power Plant (“Qinbei Power Plant”) is located in Jiyuan City of Henan Province. Its installed capacity is 2,400 MW which consists of four 600 MW supercritical coal-fired generating units. Two units commenced operations in November and December 2004, and the other two units commenced operation in November 2007. In March 2012 and February 2013, two 1,000 MW domestic ultra-supercritical coal-fired generating units of the Phase III of Qinbei Power Plant commenced operation, respectively. We hold 60% equity interest in Qinbei Power Plant.
The coal supply for Qinbei Power Plant is obtained from Shanxi Province. Qinbei Power Plant typically stores 270,000 tons of coal on site. In 2015, Qinbei Power Plant obtained 86.2% of its total consumption of coal from annual contracts and the remainder from the open market. The average coal purchase price for Qinbei Power Plant in 2015 was RMB352.53 (2014: RMB495.59) per ton.
Qinbei Power Plant sells its electricity to Henan Electric Power Company.
Luoyang Co-generation Power Plant
Luoyang Co-generation Power Plant (“Luoyang Co-generation Power Plant”) is located at Luoyang City of Henan Province. The project has an installed capacity of 700 MW, consisting of two sets of 350MW coal-fired generation units, which commenced operation in May and June 2015, respectively. We hold 80% equity interest in this plant.
The coal supply for Luoyang Co-generation Power Plant is obtained from Henan and Shaanxi. Luoyang Co-generation Power Plant typically stores 120,000 tons of coal on site. In 2015, Luoyang Co-generation Power Plant obtained 38.48% of its total consumption of coal from annual contracts and the remainder from the open market. The average coal purchase price for Luoyang Co-generation Power Plant in 2015 was RMB307.29 per ton.
Luoyang Co-generation Power Plant sells its electricity to Henan Electric Power Company.
Construction Project in Henan Province
Mianchi Cogeneration Power Plant project. In September 2012, Henan Huaneng Mianchi Cogeneration Power Plant project was approved by the National Development and Reform Commission. The project is planned to consist of two sets of 350MW coal-fired cogeneration units. We hold 51% equity interest in this project.
Zhumadian Guoji Wind Power. In March 2013, Zhumadian Guoji Wind Power project was approved by the Development and Reform Commission of Henan Province. The project is planned to have an installed capacity of 32 MW, consisting of 16 wind power turbines of 2 MW each.
Power Plants and Projects in Jiangsu Province
Nantong Power Plant
Huaneng Nantong Power Plant (“Nantong Power Plant”) is located in Nantong City. Nantong Power Plant, including Phase I, Phase II and Phase III, has an installed capacity of 2,454 MW and consists of two 352 MW, two 350 MW and one 1,050 MW coal-fired generating units which commenced operations in 1989, 1990 1999 and 2014. We hold 100% equity interest in Phase I and Phase II of Nantong Power Plant and 35% equity interest in Phase III of Nantong Power Plant.
The coal supply for Nantong Power Plant is obtained from several coal producers located mostly in Northern Shanxi Province. The coal is transported by rail from the mines to Qinhuangdao port and then shipped to the Nantong Power Plant. Nantong Power Plant typically stores 300,000 tons of coal on site.
47
In 2015, Nantong Power Plant obtained 35.0% of its total consumption of coal from annual contracts and the remainder from the open market. The average coal purchase price for Nantong Power Plant in 2015 was RMB415.40 (2014: RMB506.88) per ton.
Nantong Power Plant sells its electricity to Jiangsu Electric Power Company.
Nanjing Power Plant
Huaneng Nanjing Power Plant (“Nanjing Power Plant”) has an installed capacity of 640 MW consisting of two 320 MW coal-fired generating units which commenced operations in March and October 1994, respectively. We hold 100% equity interest in Nanjing Power Plant.
The coal supply for the Nanjing Power Plant is obtained from several coal producers located in the Shanxi and Anhui Provinces. The coal is transported by rail from the mines to Yuxikou Port and Pukou Port and shipped to the plant’s own wharf facilities. The wharf is capable of handling 6,000 ton vessels. Nanjing Power Plant typically stores 120,000 tons of coal on site and consumes 5,000 tons of coal per day when operating at maximum generating capacity.
In 2015, Nanjing Power Plant obtained approximately 48.7% of its total consumption of coal from annual contracts and the remainder from the open market. The average coal purchase price for Nanjing Power Plant in 2015 was RMB440.36 (2014: RMB555.62) per ton.
Nanjing Power Plant sells its electricity to Jiangsu Electric Power Company.
Taicang Power Plant
Huaneng Taicang Power Plant (“Taicang Power Plant”) is located in the vicinity of Suzhou, Wuxi and Changzhou, which is the most affluent area in Jiangsu Province. Taicang Power Plant is an ancillary facility of the China-Singapore Suzhou Industrial Park. Taicang Power Plant Phase I consists of two 300 MW coal-fired generating units, which commenced operations in December 1999 and April 2000 respectively. Taicang Phase II Expansion consists of two 600 MW coal-fired generating units, which commenced operations in January and February 2006, respectively. In April 2008, the installed capacities of the four units of Taicang Power Plant were upgraded to 320 MW, 320 MW, 630 MW and 630 MW, respectively, which increased the total installed capacity of Taicang Power Plant to 1,900 MW. We hold 75% equity interest in Taicang Power Plant.
The coal supply for Taicang Power Plant is primarily from Shenhua in Inner Mongolia and Datong in Shanxi Province. Taicang Power Plant typically stores 350,000 tons of coal on site. In 2015, Taicang Power Plant obtained approximately 21.9% of its total consumption of coal from annual contracts and the remainder from the open market. The average coal purchase price for Taicang Power Plant in 2015 was RMB395.68 (2014: RMB491.01) per ton.
Taicang Power Plant sells its electricity to Jiangsu Electric Power Company.
Huaiyin Power Plant
Huaneng Huaiyin Power Plant (“Huaiyin Power Plant”) is located in the Center of the Northern Jiangsu Power Grid. The plant’s two 220 MW coal-fired generating units commenced operation in November 1993 and August 1994, respectively. In order to reduce energy consumption and increase capacity, one generating unit of Huaiyin Power Plant was upgraded in October 2001, which increased the maximum generating capacity of that unit to 220 MW. In 2002, upgrading of the second generating unit was completed, and the actual generating capacity of Huaiyin Power Plant is 440 MW. The other two 330 MW coal-fired generating units of Huaiyin Power Plant Phase II Expansion commenced operations in January and March 2005, respectively. Huaiyin Power Plant Phase III consists of two 330 MW coal-fired generating units, and which were put into operation in May and September 2006,
48
respectively. We hold 100% equity interest in Phase I and 63.64% equity interest in Phase II and Phase III of Huaiyin Power Plant. Unit I and Unit II of Huaiyin Power Plant were shut down in December 2007 and January 2009, respectively.
The coal supply for the Huaiyin Power Plant is primarily from Anhui Province, Henan Province and Shanxi Province. Huaiyin Power Plant typically stores 180,000 tons of coal on site. In 2015, Huaiyin Power Plant obtained approximately 76.8% of its total consumption of coal from annual contracts and the remainder from the open market. The average coal purchase price for Huaiyin Power Plant in 2015 was RMB440.49 (2014: RMB556.52) per ton.
Huaiyin Power Plant sells its electricity to Jiangsu Electric Power Company.
Jinling Power Plant
Huaneng Nanjing Jinling Power Plant (“Jinling Power Plant”) is located in Nanjing, Jiangsu. Jinling Power Plant (CCGT) consists of two 390 MW gas-fired generating units, which commenced operation in December 2006 and March 2007, respectively. We hold 60% equity interest in Jinling Power Plant (CCGT). The gas supply for Jinling Power Plant (CCGT) is transported through the pipeline of “West-East Gas Transport Project”.
Jinling Power Plant (Coal-fired) consists of two 1,030 MW domestic ultra-supercritical coal-fired generating units, which commenced operation in December 2009 and August 2012, respectively. We hold 60% equity interest in Phase I and Phase II of Jinling Power Plant (Coal-fired). The coal supply for Jinling Power Plant (Coal-fired) is primarily from Shanxi Province and Inner Mongolia Autonomous Region. Jinling Power Plant (Coal-fired) typically stores 300,000 tons of coal on site. In 2015, Jinling Power Plant (Coal-fired) obtained approximately 21.1% of its total consumption of coal from annual contracts and the remainder from the open market. The average coal purchase price for Jinling Power Plant (Coal-fired) in 2015 was RMB421.31 (2014: RMB532.62) per ton.
Jinling Power Plant sells its electricity to Jiangsu Electric Power Company.
Qidong Wind Power
Huaneng Qidong Wind Power Plant (“Qidong Wind Power”) is located in Nantong City, Jiangsu. Qidong Wind Power Phase I has an installed capacity of 91.5 MW and commenced operation in March 2009. The first stage and second stage of the Phase II Project of Qidong Wind Power with a total generation capacity of 50 MW and 44 MW respectively commenced operation in January 2011 and June 2012, respectively. We hold 65% equity interest in Qidong Wind Power.
Qidong Wind Power Plant sells its electricity to Jiangsu Electric Power Company.
Jinling CCGT Co-generation
Jinling CCGT Co-generation is located in Nanjing, Jiangsu. The plant comprises of two 191 MW class (E grade) combined cycle gas turbine cogeneration units and the corresponding support facilities. The two units commenced operation in April 2013 and May 2013, respectively. We hold 51% equity interest in Jinling CCGT Co-generation. The gas supply for this plant is transported through the pipeline of “West-East Gas Transport Project”.
Jinling CCGT Co-generation sells its electricity to Jiangsu Electric Power Company.
Rudong Wind Power
Rudong Wind Power Plant (“Rudong Wind Power”) is located in Rudong, Jiangsu. Phase I of the plant has a total installed generation capacity of 48MW. It commenced operations in November 2013. We hold 90% equity interest in Rudong Wind Power .
49
Rudong Wind Power sells its electricity to Jiangsu Electric Power Company.
Tongshan Wind Power
Tongshan Wind Poer Plant (“Tongshan Wind Power”) is located in Tongshan, Jiangsu Province. Phase I of the plant has an installed capacity of 50 MW. It commenced operation in March 2016. We hold 70% equity interest in Tongshan Wind Power.
Tongshan Wind Power sells its electricity to Jiangsu Electric Power Company.
Suzhou Co-generation
Huaneng Suzhou Co-generation Power Plant (“Suzhou Co-generation”) is located in Suzhou City in Jiangsu Province. Suzhou Co¬generation has an installed capacity of 120 MW and consists of two 60 MW coal-fired generating units which commenced operation in 2006. We hold 53.45% equity interest in Suzhou Co-generation. We acquired the power plant in January, 2015 from Huaneng Group.
The coal supply for Suzhou Co-generation is obtained from Shanxi, Inner Mongolia and partially imported coal.Suzhou Co-generation typically stores 30,000 tons of coal on site. In 2015, Suzhou Co-generation obtained 52.1% of its total consumption of coal from annual contracts and the remainder from the open market. The average coal purchase price for Suzhou Co-generation in 2015 was RMB426.30 per ton.
Suzhou Co-generation sells its electricity to Jiangsu Electric Power Company.
Taicang Coal Pier Project
Suzhou Port Taicang Terminal Zone Huaneng Coal Pier (“Taicang Coal Pier Project”) is located in Taicang, Suzhou. The Taicang Coal Pier Project has one berth of 100,000 dead weight tonnage (“DWT”) and one berth of 50,000 DWT for coal discharging, four berths of 5,000 DWT each and six berths of 1,000 DWT each for coal loading. The above facilities have commenced trial operation in 2013. We hold 100% equity interest in this project.
Construction Project in Jiangsu Province
Suzhou Gasfired Co-generation Project. In October 2012, Huaneng Suzhou gas-fired Co-generation Project was approved by the Jiangsu Province Development and Reform Commission. We hold 100% equity interest in this project. The Project is planned to consist of two sets of 255MW class (E-class) combined cycle gas turbine cogeneration units.
Nanjing Chemical Industry Park Co-generation Power Project. In October 2013, Nanjing Chemical Industry Park Co-generation Power Project was approved by the Development and Reform Commission of Jiangsu Province. We hold 80% equity interest in the project. The project is planned to have an installed capacity of 100 MW, consisting of three high temperature and pressure coal-fired boiler of 480t/h and two extraction back-pressure turbines of 50 MW.
Tongshan Wind Power Project. Tongshan Wind Power Project was approved by the Development and Reform Commission of Jiangsu Province in November 2014. We hold 70% equity interest in the project. Tongshan Wind Power Project is planned to have an installed capacity of 49.5 MW, consisting of 24 wind power turbines of 2 MW and one wind power turbines of 1.5 MW.
Luhe Wind Power Phase I Project. Luhe Wind Power Phase I Project was approved by the Development and Reform Commission of Jiangsu Province in December 2013. We hold 100% equity interest in the project. The Project is planned to have an installed capacity of 49.5 MW, consisting of 24 wind power turbines of 2 MW and one wind power turbines of 1.5 MW.
Power Plants in Shanghai Municipality
Shidongkou I
50
Huaneng Shanghai Shidongkou First Power Plant (“Shidongkou I”) is located in the northern region of the Shanghai Power Grid. The plant comprises four 325 MW coal-fired generating units, which commenced operation in February and December 1988, September 1989 and May 1990 respectively, and has a total installed capacity of 1,300 MW. The installed capacities of Unit II and Unit III were expanded from 300 MW to 325 MW in September 2007 and January 2008, respectively. The installed capacities of Unit I and Unit V were expanded from 300 MW and 320 MW to 325 MW and 325 MW in January 2010, respectively. We hold 100% equity interest in Shidongkou I.
The coal supply for Shidongkou I is primarily from Shanxi Province, Anhui Province and Henan Province. Shidongkou I Power Plant typically stores 150,000 tons of coal on site. In 2015, Shidongkou I obtained 17.2% of its total consumption of coal from annual contracts and the remainder from the open market. The average coal purchase price for Shidongkou I in 2015 was RMB337.15 (2014: RMB417.05) per ton.
Shidongkou I sells its electricity to State Grid Shanghai Municipal Electric Power Company.
Shidongkou II
Huaneng Shanghai Shidongkou Second Power Plant (“Shidongkou II”) is located in the northern suburbs of Shanghai. Shidongkou II has an installed capacity of 1,200 MW and consists of two 600 MW coal-fired super-critical units which commenced operations in June and December 1992, respectively. We hold 100% equity interest in Phase I of Shidongkou II. Phase II of Shidongkou II has an installed capacity of 1,320 MW and consists of two 660 MW coal-fired super-critical units which commenced operations in October 2011. We hold 50% equity interest in Phase II of Shidongkou II.
The coal supply for Shidongkou II is obtained from several coal producers located mostly in Northern Shanxi Province. The coal is transported by rail from the mines to Qinhuangdao port or Tianjin port and shipped to the plant’s own wharf facilities. The wharf is capable of handling 35,000 ton vessels. Shidongkou II typically stores 180,000 tons of coal on site.
In 2015, Shidongkou II obtained 24.36% of its total consumption of coal from annual contracts and the remainder from the open market. The average coal purchase price for Shidongkou II in 2015 was RMB386.06 (2014: RMB484.76) per ton.
Shidongkou II sells its electricity to State Grid Shanghai Municipal Electric Power Company.
Shanghai CCGT
Shanghai CCGT is located in Baoshan District of Shanghai Municipality. Shanghai CCGT consists of three 390 MW gas-fired combined-cycle generating units with a total installed capacity of 1,170 MW, which were put into operation in May, June and July 2006, respectively. We hold 70% equity interest in Shanghai CCGT.
The gas supply for Shanghai CCGT is transported through the pipeline of “West-East Gas Transport Project”. Shanghai CCGT generates electricity during the peak load periods and sells its electricity to State Grid Shanghai Municipal Electric Power Company.
Power Plant in Chongqing Municipality
Luohuang Power Plant
Huaneng Luohuang Power Plant (“Luohuang Power Plant”) is located in Chongqing Municipality. Each of Phase I and Phase II of Luohuang Power Plant has an installed capacity of 720 MW and consists of two 360 MW coal-fired generating units. The two units in Phase I commenced operation in September 1991 and February 1992 respectively, and the two units in Phase II commenced operation in December 1998. Luohuang Power Plant Phase
51
III consist of two 600 MW coal-fired generating units with an installed capacity of 1,200 MW, which were put into operation in December 2006 and January 2007, respectively. We hold 60% equity interest in Luohuang Power Plant.
The coal supply for Luohuang Power Plant is obtained from Chongqing Municipality. Luohuang Power Plant typically stores 450,000 tons of coal on site. In 2015, Luohuang Power Plant obtained 98.4% of its coal supplies from annual contracts and the remainder from the open market. The average coal purchase price for Luohuang Power Plant in 2015 was RMB432.97 (2014: RMB527.64) per ton.
Luohuang Power Plant sells its electricity to Chongqing Municipal Electric Power Company.
Liangjiang CCGT
Liangjiang CCGT is located in Chongqing Municipality. Two generating units of this plant commenced operation in October and December 2014, respectively, with an installed capacity of 934 MW. We hold 100% equity interest in Liangjiang CCGT. The gas supply for Liangjiang CCGT is transported though pipeline of “West-East Gas Transport Project.”
Liangjing CCGT sells its electricity to State Grid Chongqing Municipal Electric Power Company.
Power Plants in Zhejiang Province
Yuhuan Power Plant
Huaneng Yuhuan Power Plant (“Yuhuan Power Plant”) is located in Taizhou of Zhejiang Province. Yuhuan Power Plant Phase I consists of two 1,000 MW ultra-supercritical coal-fired generating units with a total installed capacity of 2,000 MW. Unit I and Unit II were put into operation in November 2006 and December 2006, respectively. Yuhuan Power Plant Phase II consists of two 1,000 MW ultra-supercritical coal-fired generating units with a total installed capacity of 2,000 MW, which commenced operations in November 2007. We hold 100% equity interest in Yuhuan Power Plant.
The coal supply for Yuhuan Power Plant is primarily obtained from Shanxi Province and Inner Mongolia Autonomous Region. Yuhuan Power Plant typically stores 500,000 tons of coal on site. In 2015, Yuhuan Power Plant obtained 64.4% of its total consumption of coal from annual contracts and the remainder from the open market. The average coal purchase price for Yuhuan Power Plant in 2015 was RMB474.23 (2014: RMB557.96) per ton.
Yuhuan Power Plant sells its electricity to State Grid Zhejiang Electric Power Company.
Changxing “Replacing Small Units with Large Ones” Project
Changxing Power Plant “Replacing Small Units with Large Ones” Project is located in Changxing County of Zhejiang Province. Changxing “Replacing Small Units with Large Ones” Project commenced operation in December 2014, with an installed capacity of 1,320 MW. This is the first project of ultra-supercritical coal-fired generating units of the Company. We hold 100% equity interest in the project.
The coal supply for Changxing Power Plant is primarily obtained from Inner Mongolia,Hebei and partially imported coal.Changxing Power Plant typically stores 150,000 tons of coal on site. In 2015, Changxing Power Plant obtained 94.8% of its total consumption of coal from annual contracts and the remainder from the open market. The average coal purchase price for Changxing Power Plant in 2015 was RMB484.53 per ton.
Tongxiang CCGT
52
Tongxiang CCGT is located in Tongxiang City of Zhejiang Province. The plant commenced operation in September 2014 with an installed capacity of 458.4 MW. We hold 95% equity interest in the Tongxiang CCGT. The gas supply for Tongxiang CCGT is transported though pipeline of “West-East Gas Transport Project.”
Tongxiang CCGT sells its electricity to State Grid Zhejiang Electric Power Company.
Si’an Photovoltaic
Si’an 10MW Distributed Photovoltaic Power Project (“Si’an Photovoltaic”) is located in Changxing County of Zhejiang Province. Part of the project commenced operation in December 2014, with an installed capacity of 5 MW. In March 2015, the rest of the project commenced operation in March 2015, with an installed capacity of 5 MW. We hold 100% equity interest in Si’an Photovoltaic.
Power Plant in Hunan Province
Yueyang Power Plant
Huaneng Yueyang Power Plant (“Yueyang Power Plant”) is located in Yueyang City of Hunan Province. Yueyang Power Plant Phase I has an installed capacity of 725 MW and consists of two 362.5 MW sub-critical coal-fired generating units which commenced operation in September and December 1991 respectively. Yueyang Power Plant Phase II consists of two 300MW coal-fired generating units with installed capacity of 600 MW, which were put into operation in March and May 2006, respectively. Huaneng Yueyang Power Plant Phase III (“Yueyang Power Plant Phase III”) consists of two 600 MW generating units with a total installed capacity of 1,200 MW. In January 2011 and August 2012, Unit 5 and Unit 6 of Yueyang Power Plant Phase III, two 600MW coalfired generating units, commenced operation, respectively. We hold 55% equity interest in Yueyang Power Plant.
The coal supply for Yueyang Power Plant is obtained from Datong in Shanxi Province. Yueyang Power Plant typically stores 500,000 tons of coal on site. In 2015, Yueyang Power Plant obtained 27.7% of its total consumption of coal from annual contracts and the remainder from the open market. The average coal purchase price for Yueyang Power Plant in 2015 was RMB436.55 (2014: RMB554.65) per ton.
Yueyang Power Plant sells its electricity to State Grid Hunan Electric Power Company.
Xiangqi Hydropower
Huaneng Yongzhou Xiangqi Hydropower Station (“Xiangqi Hydropower”) is located in Xiangqi County of Hunan Province. Xiangqi Hydropower consists of four 20 MW hydraulic generating units with a total installed capacity of 80 MW. In December 2011, Unit I of Xiangqi Hydropower with an installed capacity of 20 MW passed a trial run. Unit I and Unit II of Yongzhou Xiangqi Hydropower with an installed capacity of 20 MW each commenced operation in December 2011 and May 2012, respectively. Unit III and Unit IV of Xiangqi Hydropower with an installed capacity of 20 MW commenced operation in May and August 2012, respectively. We hold 100% equity interest in Xiangqi Hydropower.
Xiangqi Hydropower sells its electricity to Hunan Electric Power Company.
Subaoding Wind Power
Subaoding Wind Power (“Subaoding Wind Power”) is located between Hongjiang City and Dongkou County in Hunan. Part of the Subaoding Wind Power commenced operation in December 2014, with an installed capacity of 80MW, consisting of 40 wind power turbines of 2 MW. The rest of the Subaoding Wind Power commenced operation in March 2015, with an installed capacity of 70 MW, consisting of 35 wind power turbine of 2 MW each. As of the date of this report, all of the wind power turbines have commenced operation with a total installed capacity of 150 MW. We hold 100% equity interest in the Subaoding Wind Power.
53
Subaoding Wind Power sells its electricity to Hunan Electric Power Company.
Guidong Wind Power
Guidong Wind Power (“Guidong Wind Power ”) is located at Guidong County of Hunan Province. Guidong Wind Power commenced operation in 2015, with an installed capacity of 84 MW, consisting of 42 wind power turbines of 2 MW each. We hold 100% equity interest in this plant.
Guidong Wind Power sells its electricity to Hunan Electric Power Company.
Power Plant in Hubei Province
Enshi Maweigou Hydropower
Hubei Enshi Maweigou Hydropower Station (“Enshi Maweigou Hydropower”) is located in Enshi City of Hubei Province. We entered into an equity transfer agreement to acquire Enshi Maweigou Hydropower on September 30, 2011. Enshi Maweigou Hydropower consists of three 5 MW hydraulic generating units and two 20 MW hydraulic generating units with a total installed capacity of 55 MW. We hold 100% equity interest in Enshi Maweigou Hydropower.
Enshi Maweigou Hydropower sells its electricity to Hubei Electric Power Company.
Wuhan Power Plant
Huaneng Wuhan Power Plant (“ Wuhan Power Plant”) is located in Wuhan City in Hubei Province. Wuhan Power Plant has an installed capacity of 2,460 MW and consists of two 300 MW coal-fired generating units which commenced operation in 1993 and 1994, two 330 MW coal-fired generating units which commenced operation in 1997, and two 600 MW coal-fired generating units which commenced operation in 2006. We hold 75% equity interest in Wuhan Power Plant. We acquired the power plant in January, 2015 from Huaneng Group.
Wuhan Power Plant sells its electricity to Hubei Electric Power Company.
Dalongtan Hydropower
Huaneng Dalongtan Hydropower Station (“ Dalongtan Hydropower”) is located in Enshi City of Hubei Province. Dalongtan Hydropower has an installed capacity of 37.6 MW. We hold 97% equity interest in Dalongtan Hydropower. We acquired the power plant in January, 2015 from Huaneng Group.
Dalongtan Hydropower sells its electricity to Hubei Electric Power Company.
Jingmen Co-generation
Huaneng Jingmen Co-generation Power Plant (“ Jingmen Co-generation”) is located in Jingmen City in Hubei Province. Jingmen Co-generation has an installed capacity of 700 MW and consists of two 350 MW coal-fired generating units which commenced operation in 2014. We hold 100% equity interest in Jingmen Co-generation. We acquired the power plant in January, 2015 from HIPDC.
The coal supply for Jingmen Co-generation is obtained from Shaanxi and Gansu. Jingmen Co-generation typically stores 90,000 tons of coal on site. In 2015, Jingmen Co-generation obtained 71.6% of its total consumption of coal from annual contracts and the remainder from the open market. The average coal purchase price for Jingmen Co-generation in 2015 was RMB399.46 per ton.
Jingmen Co-generation sells its electricity to Hubei Electric Power Company.
54
Yingcheng Co-generation
Huaneng Yingcheng Co-generation Power Plant (“ Yingcheng Co-generation”) is located in Yingcheng City in Hubei Province. Yingcheng Co-generation has an installed capacity of 350 MW which commenced operation in January 2015. We hold 100% equity interest in Yingcheng Co-generation. We acquired the power plant in January, 2015 from HIPDC.
The coal supply for Yingcheng Co-generation is obtained from Shanxi and Shaanxi.Yingcheng Co-generation typically stores 50,000 tons of coal on site. In 2015, Yingcheng Co-generation obtained 2.9% of its total consumption of coal from annual contracts and the remainder from the open market. The average coal purchase price for Yingcheng Co-generation in 2015 was RMB 516.10 per ton.
Yingcheng Co-generation sells its electricity to Hubei Electric Power Company.
Jieshan Wind Power
Jieshan Wind Power Plant (“Jieshan Wind Power”) is located at Suixian County of Hubei Province. The Phase I of Jieshan Wind Power commenced operation in June 2015, with an installed capacity of 48 MW, consisting of 24 wind power turbines of 2 MW. We hold 100% equity interest in the Jieshan Wind Power.
Jieshan Wind Power sells its electricity to Hubei Electric Power Company.
Construction Projects in Hubei Province
Yingcheng “Replacing Small Units with Large Ones” Project. The project was approved by the National Development and Reform Commission in July 2011. We hold 100% equity interest in the project. Currently, an ultra-supercritical coal-fired generating units of 50 MW is under construction.
Phase II of Jieshan Wind Power Plant (“Jieshan Phase II”). Jieshan Phase II was approved by the Development and Reform Commission of Hubei Province in May 2014. We hold 100% equity interest in the project. The project is planned to have an installed capacity of 72 MW, consisting of 36 wind power turbines of 2 MW each.
Power Plant in Jiangxi Province
Jinggangshan Power Plant
Huaneng Jinggangshan Power Plant (“Jinggangshan Power Plant”) is located in Ji’an City of Jiangxi Province. Jinggangshan Power Plant has an installed capacity of 1,920 MW and consists of two 300 MW coal-fired generating units which commenced operation in December 2000 and August 2001 respectively, and two 660 MW generating units which commenced operation in November and December 2009, respectively. We hold 100% equity interest in Jinggangshan Power Plant.
The coal supply for Jinggangshan Power Plant is obtained from Henan Province, Anhui Province and Jiangxi Province. Jinggangshan Power Plant typically stores 255,000 tons of coal on site. In 2015, Jinggangshan Power Plant obtained 70.2% of its total coal consumption from annual contracts and the remainder from the open market. The average coal purchase price for Jinggangshan Power Plant in 2015 was RMB532.70 (2014: RMB631.58) per ton.
Jinggangshan Power Plant sells its electricity to Jiangxi Electric Power Company.
Jianggongling Wind Power
55
Jianggongling Wind Power Plant (“Jiangongling Wind Power”) is located in Jiujiang Municipality of Jiangxi Province. Jianggongling Wind Power commenced operation in December 2014, with an installed capacity of 48 MW, consisting of 24 wind power turbine of 2 MW. We hold 100% equity interest in the Jianggongling Wind Power.
Ruijin Power Plant
Huaneng Ruijin Power Plant (“ Ruijin Power Plant”) is located in Ruijin City in Jiangxi Province. Ruijin Power Plant has an installed capacity of 700 MW and consists of two 350 MW coal-fired generating units which commenced operation in 2008. We hold 100% equity interest in Ruijin Power Plant. We acquired the power plant in January, 2015 from HIPDC.
The coal supply for Ruijin Power Plant is obtained from Shanxi, Shaanxi, and partially imported coal. Ruijin Power Plant typically stores 110,000 tons of coal on site. In 2015, Ruijin Power Plant obtained 56.4% of its total consumption of coal from annual contracts and the remainder from the open market. The average coal purchase price for Ruijin Power Plant in 2015 was RMB 555.52 per ton.
Ruijin Power Plant sells its electricity to Jiangxi Electric Power Company.
Anyuan Power Plant
Anyuan Power Plant “Replacing Small Units with Large Ones” Project (“Anyuan Power Plant”) is located at Pingxiang City of Jiangxi Province. The plant has a total installed capacityof 1,320 MW, consisting of two ultra supercritical units with second reheat cycle of 660 MW each. Anyuan Power Plant is the first project equipped with 660MW ultra supercritical unit with second reheat cycle. We acquired 100% equity interest of the power plant in January, 2015.
The coal supply for Anyuan Power Plant is obtained from Gansu and Shanxi. Ruijin Power Plant typically stores 130,000 tons of coal on site. In 2015, Anyuan Power Plant obtained 52.9% of its total consumption of coal from annual contracts and the remainder from the open market. The average coal purchase price for Ruijin Power Plant in 2015 was RMB 460.08 per ton.
Anyuan Power Plant sells its electricity to Jiangxi Electric Power Company.
Power Plant in Anhui Province
Chaohu Power Plant
Huaneng Chaohu Power Plant (“ Chaohu Power Plant”) is located in Chaohu City in Anhui Province. Chaohu Power Plant has an installed capacity of 1200 MW and consists of two 600 MW coal-fired generating units which commenced operation in 2008. We hold 60% equity interest in Chaohu Power Plant. We acquired the power plant in January, 2015 from HIPDC.
The coal supply for Chaohu Power Plant is obtained from Shandong and Gansu. Chaohu Power Plant typically stores 110,000 tons of coal on site. In 2015, Chaohu Power Plant obtained 68.16% of its total consumption of coal from annual contracts and the remainder from the open market. The average coal purchase price for Chaohu Power Plant in 2015 was RMB440.56 per ton.
Chaohu Power Plant sells its electricity to Anhui Electric Power Company.
Hualiangting Hydropower
56
Huaneng Hualiangting Hydropower Plant (“ Hualiangting Hydropower”) is located in Anqing City in Anhui Province. Hualiangting Hydropower has an installed capacity of 40 MW which commenced operation in 1981 and 1987. We hold 100% equity interest in Hualiangting Hydropower. We acquired the power plant in January, 2015 from Huaneng Group.
Hualiangting Hydropower sells its electricity to Anhui Electric Power Company.
Construction Project in Anhui Province
Shijing Wind Power Plant in Huaining County. The project of Shijing Wind Power Plant in Huaining County was approved by the Development and Reform Commission of Anhui Province. We hold 100% equity interest of the project. The project is planned to have an installed capacity of 50 MW, consisting of 25 wind power turbines of 2 MW.
Power Plant in Fujian Province
Fuzhou Power Plant
Huaneng Fuzhou Power Plant (“Fuzhou Power Plant”) is located on the south bank of the Min River, southeast of the city of Fuzhou. Fuzhou Power Plant has been developed in three phases. The Fuzhou Power Plant Phase I and Phase II utilize four 350 MW coal-fired generating units with an installed capacity of 1,400 MW, and commenced operations in 1988 and 1999, respectively. The Fuzhou Power Plant Phase III consists of two 600 MW generating units with a total installed capacity of 1,200 MW, and commenced operations in 2010 and 2011, respectively. The capacity of Unit V and Unit VI of the Fuzhou Power Plant Phase III was expanded to 660 MW per unit since January 2012. We hold 100% equity interest in Fuzhou Power Plant.
The coal supply for Fuzhou Power Plant is obtained from several coal producers located mostly in Northern Shanxi Province. The coal is transported by rail from the mines to Qinhuangdao port and by ship down to the east coast of China and up to the Min River to a wharf located at Fuzhou Power Plant. We own and maintain the wharf, which is capable of handling vessels of up to 20,000 tons and of unloading 10,000 tons to 15,000 tons of coal per day. Fuzhou Power Plant typically stores 180,000 tons of coal on site.
In 2015, the Fuzhou Power Plant obtained 13.5% of its total consumption of coal from annual contracts and the remainder from the open market. The average coal purchase price for Fuzhou Power Plant in 2015 was RMB431.36 (2014: RMB529.91 ) per ton.
Fuzhou Power Plant sells its electricity to Fujian Electricity Power Company.
Construction Projects in Fujian Province
Luoyuan Power Plant. Luoyuan Power Plant was approved by the NDRC in December 2014. We hold 100% equity interest in the project. The project is planed to have an installed capacity of 1,320 MW, consisting of two ultra supercritical coal-generating units of 660 MW each.
Jiangjunmao Operating Zone Phase I Project in the Port of Fuzhou Luoyuan Bay Area. Jiangjunmao Operating Zone Phase I Project in the Port of Fuzhou Luoyuan Bay Area was approved by the NDRC. We entered into an asset transfer agreement in December 2009 to purchase the Jiangjunmao Operating Zone Phase I Project in the Port of Fuzhou Luoyuan Bay Area. We hold 100% equity interest in the project. The project is planned to build a dock with a loading capacity of 0.15 million tons and annual throughput of 10 million tons.
The Project of Bili Operating Zone Number Six Ship Berth in the Port of Fuzhou Luoyuan Bay Area. The Project of Bili Operating Zone Number Six Ship Berth in the Port of Fuzhou Luoyuan Bay Area was approved by the Development and Reform Commission of Fujian Province in July 2010. We entered into an asset transfer
57
agreement in December 2009 to purchase the Project of Bili Operating Zoon Number Six Ship Berth in the Port of Fuzhou Luoyuan Bay Area. We hold 100% equity interest in the project. The project is planned to build a ship berth with a loading capacity of 0.05 million tons and annual throughput of 2.3 million tons.Power Plants in Guangdong Province.
Power Plants in Guangdong Province
Shantou Power Plant
Huaneng Shantou Coal-Fired Power Plant (“Shantou Power Plant”) had originally been developed and constructed by HIPDC which transferred all its rights and interests therein to us effective on December 31, 1994. Located on the outskirts of the city of Shantou, Shantou Power Plant was set up with the support of the Shantou municipal government and the Guangdong provincial government. Shantou Power Plant Phase I consists of two 300 MW coal-fired generating units with boilers, which commenced operation in January 1997. Shantou Power Plant Phase II consists of one 600 MW coal-fired generating unit and commenced operation in October 2005. We hold 100% equity interest in Shantou Power Plant.
The coal supply for Shantou Power Plant is obtained from several coal producers located mostly in the northern area of Shanxi Province. The coal is transported by rail from the mines to Qinhuangdao port and by ship down the east coast of China to the wharf located at Shantou Power Plant, which is maintained by the Shantou Port Authority and is capable of handling 35,000 ton vessels. The Shantou Power Plant typically stores 300,000 tons of coal on site.
In 2015, the Shantou Power Plant obtained 7.4% of its total consumption of coal from annual contracts and the remainder from the open market. The average coal purchase price for Shantou Power Plant in 2015 was RMB430.14 (2014: RMB516.82) per ton.
Shantou Power Plant sells its electricity to Guangdong Electric Power Company.
Haimen Power Plant
Huaneng Haimen Power Plant (“Haimen Power Plant”) is located in Shantou City, Guangdong Province. Haimen Power Plant has an installed capacity of 4,144 MW and consists of four 1,036 MW generating units. The first two generating units commenced operation in July 2009 and October 2009, respectively. We hold 100% equity interest in the first two generating units. The other two generation units commenced operation at the beginning of 2013. We hold 80% equity interest in the other two generating units.
The coal supply for Haimen Power Plant is mainly imported from Indonesia. Haimen Power Plant typically stores 400,000 tons of coal on site. In 2015, Haimen Power Plant obtained 4.1% of its total consumption of coal from annual contracts and the remainder from the open market. The average coal purchase price for Haimen Power Plant in 2015 was RMB498.17 (2014: RMB530.99) per ton.
Haimen Power Plant sells its electricity to Guangdong Electric Power Company.
Power Plants in Yunnan Province
Diandong Energy
Yunnan Diandong Energy Limited Company (“Diandong Energy”) is located in Qujing City, Yunnan Province. Diandong Energy has an installed capacity of 2,400 MW and consists of four 600 MW generating units which commenced operation in February 2006, July 2006, November 2006 and May 2007, respectively. We hold 100% equity interest in Diandong Energy.
58
The coal supply for Diandong Energy is mainly obtained from Yunnan and Guizhou Provinces. Diandong Energy typically stores 1,200,000 tons of coal on site. In 2015, Diandong Energy obtained 25.7% of its total consumption of coal from annual contracts and the remainder from the open market. The average coal purchase price for Diandong Energy in 2015 was RMB371.25 (2014: RMB468.62) per ton.
Diandong Energy sells its electricity to Yunnan Electric Power Company.
Yuwang Energy
Yunnan Diandong Yuwang Energy Limited Company (“Yuwang Energy”) is located in Qujing City, Yunnan Province. Yuwang Energy has an installed capacity of 1,200 MW and consists of two 600 MW generating units which commenced operation in July 2009 and February 2010, respectively. We hold 100% equity interest in Yuwang Energy.
The coal supply for Yuwang Energy is mainly obtained from Yunnan and Guizhou Provinces. Yuwang Energy typically stores 600,000 tons of coal on site. In 2015, Yuwang Energy obtained 56.5% of its total consumption of coal from annual contracts and the remainder from the open market. The average coal purchase price of coal for Yuwang Energy in 2015 was RMB341.80 (2014: RMB454.56) per ton.
Yuwang Energy sells its electricity to Yunnan Electric Power Company.
Fuyuan Wind Power
Fuyuan Wind Power Plant (“Fuyuan Wind Power”) is located in the Fuyuan County of Qujing Municipality of Yunnan Province. Fuyuan Wind Power commenced operation in November 2014 and December 2015, consisting of 20 wind power turbines of 2 MW each and 24 wind power turbines of 2 MW each. We hold 100% equity interest in Fuyuan Wind Power.
Fuyuan Wind Power sells its electricity to Yunnan Electric Power Company.
Construction Project in Yunnan Province
Fuyuan Wind Power also has new wind projects under construction, with installed capacity of 96 MW, consisting of 48 wind power turbines of 2 MW each. We hold 100% equity interest in the project.
Power Plants in Hainan Province
Haikou Power Plant
Huaneng Haikou Power Plant (“ Haikou Power Plant”) is located in Haikou City in HainanProvince. Haikou Power Plant has an installed capacity of 936 MW and consists of two 138 MW coal-fired generating units which commenced operation in 1999, 2000, and two 330 MW coal-fired generating units which commenced operation in 2006. We hold 91.8% equity interest in Haikou Power Plant. We acquired the power plant in January, 2015 from Huaneng Group.
The coal supply for Haikou Power Plant is mainly obtained from Inner Mongolia, Shanxi, and partially imported coal. Haikou Power Plant typically stores 120,000 tons of coal on site. In 2015, Haikou Power Plant
59
obtained 27.5% of its total consumption of coal from annual contracts and the remainder from the open market. The average coal purchase price of coal for Haikou Power Plant in 2015 was RMB428.82 per ton.
Haikou Power Plant sells its electricity to Hainan Electric Power Company.
Dongfang Power Plant
Huaneng Dongfang Power Plant (“ Dongfang Power Plant”) is located in Dongfang City in Hainan Province. Dongfang Power Plant has an installed capacity of 1400 MW and consists of four 350 MW coal-fired generating units which commenced operation in 2009, 2012. We hold 91.8% equity interest in Dongfang Power Plant. We acquired the power plant in January, 2015 from Huaneng Group.
The coal supply for Dongfang Power Plant is mainly obtained from Shanxi and partially imported coal. Dongfang Power Plant typically stores 160,000 tons of coal on site. In 2015, Dongfang Power Plant obtained 27.9% of its total consumption of coal from annual contracts and the remainder from the open market. The average coal purchase price of coal for Dongfang Power Plant in 2015 was RMB431.69 per ton.
Dongfang Power Plant sells its electricity to Hainan Electric Power Company.
Nanshan Co-generation
Huaneng Nanshan Co-generation Power Plant (“ Nanshan Co-generation”) is located in Sanya City in Hainan Province. Nanshan Co-generation has an installed capacity of 132 MW which commenced operation in 2003. We hold 91.8% equity interest in Nanshan Co-generation. We acquired the power plant in January, 2015 from Huaneng Group.
Nanshan Co-generation sells its electricity to Hainan Electric Power Company.
Gezhen Hydropower Plant
Huaneng Gezhen Hydropower Plant (“ Gezhen Hydropower Plant”) is located in Dongfang City in Hainan Province. Gezhen Hydropower Plant has an installed capacity of 82 MW which commenced operation in 2009. We hold 91.8% equity interest in Gezhen Hydropower Plant. We acquired the power plant in January, 2015 from Huaneng Group.
Gezhen Hydropower Plant sells its electricity to Hainan Electric Power Company.
Wenchang Wind Power
Huaneng Wenchang Wind Power Plant (“ Wenchang Wind Power”) is located in Wenchang City in Hainan Province. Wenchang Wind Power has an installed capacity of 51.5 MW and consists of 33 turbines with each capacity of 1.5 MW which commenced operation in 2008, and one turbine with capacity of 2 MW which commenced operation in 2015. We hold 91.8% equity interest in Wenchang Wind Power. We acquired the power plant in January, 2015 from Huaneng Group.
Wenchang Wind Power sells its electricity to Hainan Electric Power Company.
Construction Project in Guangxi Province
Distribution Energy Project of Guilin World Tourism City. Distribution Energy Project of Guilin World Tourism City was approved by the Development and Reform Commission of Guangxi Autonomous. We hold 100 % equity interest in the project. The project consists of four co-generating units of 42 MW, three dual pressure waste-
60
heat boilers, three condensing turbo-generating units of 21 MW and one back-pressure turbo- generating unit of 6 MW.
Power Plant in Guizhou
Panxian Wind Power
Panxian Wind Power (“Panxian Wind Power”) is located at Panxian county of Guizhou Province. It commenced operation in December 2015, with an installed capacity of 24 MW, consisting of 12 wind power turbine of 2 MW each. We hold 100 % equity interest in Panxian Wind Power.
Panxian Wind Power sells its electricity to Guizhou Electric Power Company.
Power Plant in Singapore
Tuas Power
With a licensed generating capacity of 2,670MW, Tuas Power is one of the three largest power generation companies in Singapore. It currently has an installed operation generating capacity of 2,609MW, comprising of 1,876 MW gas-fired combined cycle generating units, 133 MW of coal-biomass fired steam turbine generating units and 600 MW of oil-fired steam generating unit.
Supply of coal is procured from coal producers in Indonesia via two long-term coal supply contracts with 10 years and 15 years term respectively. Supply of gas is obtained from Pavilion Gas Pte Ltd, Sembcorp Gas Pte Ltd and BG Singapore Gas Marketing Pte Ltd. Oil supply, if required, is obtained through the spot market.
Competition and Dispatch
All power plants in China are subject to dispatch conducted by various dispatch centers. A dispatch center is required to dispatch electricity pursuant to the Regulations on the Administration of Electric Power Dispatch Networks and Grids, issued by the State Council with effect from November 1, 1993, and in accordance with its agreements with power plants subject to its dispatch. Power generation companies are also required to enter into on-grid dispatch agreements with power grid companies. As a result, there is competition for favorable dispatch treatment in the PRC electric power industry, especially during the off-peak load periods. More efficient power plants usually operate at higher output than less efficient power plants. We believe that in order to increase system stability, large and efficient power plants such as ours will be preferred as base load plants to generate power for the grids to which they connect. We believe that our dispatch arrangements with the local power corporations and dispatch centers, superior quality equipment, lower coal consumption rate, higher efficiency of plant operation, lower emission levels and larger capacity represent competitive advantages in the markets in which we operate.
Since 2002, we have been facing competition from four other major power generation groups: China Power Investment Corporation, China Huadian Power Corporation, China Guodian Power Corporation and China Datang Power Corporation, which were created following the break-up of the former State Electric Corporation in 2002. Although we were not affected by this reform measure, as we have developed good working relationship with the dispatch centers and the relevant government departments in the areas where our power plants are located, there can be no assurance that such good working relationships will not be adversely affected as more power generation companies compete for favorable dispatch treatment.
As power generation companies were separated from power grid companies and more competitors entered into the market, the SERC issued the Interim Measures Regarding Promotion of Openness, Fairness and Equitableness of Power Dispatch, requiring power dispatch centers to treat all competitors indiscriminately in respect of dispatch administration and information disclosure, except in cases where safe and stable operation of the electric power system requires different treatment.
61
In 2008, with the purpose of improving energy usage efficiency, the government implemented an electricity-optimized dispatch policy in Henan Province, Sichuan Province, Jiangsu Province, Guangdong Province and Guizhou Province on a pilot basis, and plans to roll out to others if the trial operation is successful. In addition, as of December 31, 2014, in all regions in which we operate power plants, the government’s power administrative departments make power generation plan policies with the aim to improve the planned utilization hours of the environment-protecting and energy-saving units. In 2015, the NDRC and China Energy Administration jointly issued the Guidelines on Improving Electric Power Operations and Deepening Clean Energy Generation, which confirms a system that aims to ensure the full-priced acquisitions of renewable energy and ensure that the hours of usage for high-efficiency energy-saving generators be significantly higher than that for coal-fired generators. And the Guidelines also demands within a certain time period an increase of the hours of usage for coal-fired generators, of which the emission level is close to or reaches the cap level of gas turbine.
Competition and Dispatch in Singapore
Following the introduction of LNG into Singapore, new players as well as incumbents have invested in new gas-fired generating capacities to compete in the Singapore electricity market. Tuas Power competes in the NEMS using its portfolio of gas-fired, coal-biomass fired and oil-fired generating units. It was able to maintain a market share of approximately 21.69% in the NEMS for 2015. Its major competitors include Senoko Energy (formerly Senoko Power) which is owned by a Japanese/French consortium led by Marubeni Group, YTL PowerSeraya that is owned by YTL Group of Malaysia, SembCorp Cogen and Keppel Merlimau Cogen and PacificLight Power Pte Ltd. A new entrant, Tuaspring, entered the market in 2015. Tuas Power’s investment in its new combined cycle will allow it to maintain its leadership position in Singapore’s power industry.
In the NEMS, power generation companies compete to generate and sell electricity every half-hour by offering their capacity (specifying price/quantity pairs). The EMC, the operator of Singapore’s wholesale electricity market, determines the least-cost dispatch quantities and the corresponding market-clearing or spot prices based on the offers made by power generation companies. The spot prices in the NEMS reflect the least-cost market solution for the dispatch of energy and provision of operating reserves. In general, this means that each power generation company that submitted an offer below the spot price will be dispatched, and a power generation company that submitted an offer above the spot price will not be dispatched. The spot price that a power generation company receives is a nodal price, which may vary according to their location on the network to reflect the cost of transmission losses or network constraints.
Environmental Regulation
We are subject to the PRC Environmental Protection Law, the regulations of the State Council issued thereunder, the PRC Law on the Prevention and Treatment of Water Pollution, the PRC Law on the Prevention and Treatment of Air Pollution, the Emission Standard of Air Pollutants for Thermal Power Plants thereunder and the PRC Law on Ocean Environment Protection (collectively the “National Environmental Laws”) and the environmental rules promulgated by the Local Governments in whose jurisdictions our various power plants are located (the “Local Environmental Rules”). According to the National Environmental Laws, the State Environmental Protection Bureau sets national environmental protection standards and local environmental protection bureaus may set stricter local standards. Enterprises are required to comply with the stricter of the two standards.
At present, new projects are subject to the environmental evaluation approval. The project proposal is required to be submitted to the State Environmental Protection Administration (“SEPA”) for approval.
Effective July 1, 2003, all power plants in China became subject to the pollutant discharge levy system, pursuant to which discharge fees are levied based on the actual amount of pollutants discharged. As a result, all of our power plants are now required to pay discharge fees in such manner. Since 2008, certain provinces have raised the rates of waste disposal fees. In 2013, 2014 and 2015, we paid to the local governments total discharge fees of approximately RMB475 million, RMB387 million and RMB311 million respectively.
62
In 2011, the PRC Government promulgated a New Emission Standards of Air Pollutants for Thermal Power Plants, which implement more stringent standards on discharge of polluting substances by thermal power plants. These restrictive standards govern both the total sulfur dioxide and nitrous oxide emissions from the power plant and the emission density of each chimney, and also require thermal power plants to equip all units with denitrification facilities by the end of 2015.
In September 2013, the State Council issued the Air Pollution Prevention Action Plan (the “Plan”), setting forth stricter requirements for air pollution prevention and control. Local government departments have released local rules and regulations under the Plan, some of which require higher emission standards than the national ones. Carbon emission trading has been conducted in certain regions on a trial basis and could be gradually introduced to an expanded market in the future. On July 1, 2014, the new pollutants emission standards for thermal power plants and the dust emission standards in key regions will also come into effect. In September 2014, the NDRC, the Ministry of Environmental Protection and the National Energy Administration jointly issued the 2014-2020 Action Plan for Energy Saving, Emission Reduction and Renovation of Coal-fired Generation Units, imposing more strict requirements for efficient and clean development of coal-fired generating plants.
In order to meet with the requirements of the New Emission Standards, we have installed flue gas desulphurization (“FGD”) facilities and denitrification facilities with all of our newly constructed generating units. We have also carried out sulfur disposal reform on the existing generating units. As of the end of 2012, we have installed and operated desulphurization facilities on all our existing coal-fired generating units. By the end of 2014, all coal-fired generating units of the Company have been renovated to include denetrification facilities.
In order to reduce fly ash, we use very high-efficiency electrostatic precipitators and conduct efficiency improvement and renovations according to increasingly strict state and local emission standards. Each power plant is also equipped with a wastewater treatment facility to treat water used by the power plant before it is released into the river or the sea. We pay discharge fees on the basis of measurements made at discharge points of each plant where waste is released. All of the disposal equipment and facilities for sulfur dioxide, fly ash, wastewater, nitrogen oxides, smoke dust and noise in our existing power plants completely satisfy the existing national standards.
We believe we have implemented systems that are adequate to control environmental pollution caused by our facilities. In addition to the measures identified above, each power plant has its own environment protection office and staff responsible for monitoring and operating the environmental protection equipment. The environmental protection departments of the local governments monitor the level of emissions and base their fee assessments on the results of their tests.
We believe our environmental protection systems and facilities for the power plants are adequate for us to comply with the currently effective national and local environmental protection regulations. It is expected that the PRC Government will impose additional and stricter regulations to implement the emission plan which would require additional expenditure in compliance with environmental regulations.
Environmental Regulation in Singapore
Tuas Power’s generation operations are subjected to Singapore’s Environmental Protection and Management Act and Environmental Public Health Act. The former sets out requirements pertaining to control of pollution and management of hazardous substance while the latter focuses mainly on proper waste management.
Tuas Power Station
To address the environmental concerns and regulatory requirements, Tuas Power Station has put in place an environmental management system. All generating units are equipped with pollution control facilities. Stage I steam plant burn low sulfur content fuel oil and employ an electro-precipitator to control sulfur dioxide and particulate emissions. Stage II combined-cycle plants burn natural gas and are fitted with low-nitrogen oxide burners to control nitrogen oxide emissions. Source emission test are conducted annually and the results are submitted to National Environment Agency (NEA) Pollution Control Department.
63
Tuas Power Station has a dedicated wastewater treatment plant to treat its oily wastewater and process wastewater prior to discharge into the sea. The treatment processes are automated to prevent accidental adverse discharge and critical parameters are monitored on a real-time basis. Trade effluent testing is performed annually and the results are shared with the Pollution Control Department.
Land contamination is prevented through well-designed storage and containment procedures. Specific areas for storage of waste and hazardous substances are designated within the power plant.
Waste generated in Tuas Power Station plants is identified and managed accordingly. Waste with residual value, such as waste oil, is resold to licensed collectors for reuse while other waste is disposed through licensed disposal contractors.
Hazardous substances which have potential to cause environmental pollution are controlled within the power plant compound. A-hazardous substance permit, issued by the Pollution Control Department, is required to store the hazardous substances in the premises. Operators who handle these chemicals are competent and the storage concept of these substances is designed to prevent and mitigate the impact of any abnormal release. Regular audits are conducted to ensure these hazardous substances are managed properly and the findings and recommendations for improvements are reported to the Pollution Control Department.
TMUC
TMUC utilises an efficient cogeneration process where about 80% of the useful energy from the plant is used to produce steam for industrial customers and the remaining 20% is converted to electricity for internal use and transmission to the national grid. The overall plant system efficiency is up to 70%.
The TMUC plant is designed to comply with stringent environmental standards set by the local authority. TMUC adopts the circulating fluidized bed boiler technology that enable use of high percentage of carbon neutral biomass (palm kernel shell and woodchips) co-fired with clean coal (low sulphur and low ash) to reduce carbon footprint significantly to the same level as oil-fired plant and lower the sulphur and nitrogen oxides emission. High efficiency bag filters are installed to ensure low particulates emission.
Coal, biomass and ash handling, transfer and storage systems at TMUC are fully enclosed to prevent any fugitive dust during unloading, storage and handling operation. Coal and ash are stored in silo while biomass is stored in enclosed warehouse.
Fly ash and bed ash generated from the CFB boilers are fully recycled and processed for use as value-added construction materials.
Oily wastewater and coal/ash washing wastewater are treated prior to discharge. Online monitoring of oil-in-water and suspended solids (through turbidity meter) are carried out for oily wastewater and coal/ash washing wastewater respectively to prevent accidental discharge. Chemical/regeneration wastewater is neutralized prior to discharge. Online monitoring of pH is conducted to prevent accidental discharge. Stop-gates are strategically installed at drain to prevent poor quality effluent/water from entering the sea
Insurance
We currently maintain property all-risks insurance and machinery-breakdown insurance for all of our power plants, and construction all-risks insurance or erection all-risks insurance for all of our newly built and expansion projects as well as large-scaled upgrading projects. Our current insurance coverage on our property, plant and equipment (including construction all-risk insurance and excluding those properties, plants and equipment in Shandong Province, Gansu Province and Diandong Energy) is mainly maintained with Yongcheng Property and Casualty Insurance Company, and co-insured by PICC Property and Casualty Company Ltd. and China Pacific Property Insurance Co., Ltd., which amounted to approximately RMB429.05 billion. In 2015, we renewed the liabilities insurance for our directors and officers with a coverage of US$10 million.
64
We do not maintain any third-party liability insurance to cover claims in respect of bodily injury or property or environment damage arising from accidents on our property or relating to our operation other than the third-party additional risk insurance included in construction all-risk insurance or erection all-risk insurance. We do not usually carry business interruption insurance either, which is not customarily carried by power companies in the PRC. We believe that our insurance coverage is adequate and is standard for the power industry in China. Please refer to the section entitled “Risk factors – Risks relating to our business and the PRC’s power industry – Operation of power plants involves many risks and we may not have enough insurance to cover the economic losses if any of our power plant’s ordinary operation is interrupted.”
Tuas Power purchases key insurance policies, such as industrial all-risks insurance (including business interruption insurance coverage), public and products liability insurance, directors’ and officers’ liability insurance, pollution legal liability insurance and marine cargo insurance. Total insured value under industril all-risks insurance is S$4.3 billion for 2016.
|
ITEM 4A
|
Unresolved Staff Comments
|
None.
|
ITEM 5
|
Operating and Financial Reviews and Prospects
|
|
A.
|
General
|
The principal activities of the Company are investment, construction, operation and management of power plants. The Company provides consistent and reliable electricity supply to customers through grid operators where its operating plants are located. The Company is committed to scientific development through increasing economic efficiency, enhancing returns for shareholders, conserving resources and protecting the environment. The Company also attaches importance to social responsibilities and makes active contribution to the building of a harmonious society.
Since its incorporation, the Company has continued to expand its operational scale. The Company has been a leader in its industry in terms of competitiveness, resource utilization efficiency and environmental protection. The Company is Asia’s largest listed power producer and China’s most dynamic power generator. Its power generation operations are widely located with coverage in the Northeast China Grid, the Northern China Grid, the Northwest China Grid, the Eastern China Grid, the Central China Grid, the Southern China Grid, and the overseas market in Singapore.
Looking back in 2015, with strong support from its shareholders and the employees, the Company made active and concerted efforts to respond to the changes in power, coal and capital markets by expanding overseas market, improving marketing analysis and enhancing internal management with focuses on key operations, thorough planning and sound internal control. These efforts have contributed to growth of the Company in various aspects in 2015. Throughout 2015, the Company maintained its leading position in major technological and economic indices and utilization hours through safe production and active marketing activities. Its fuel management was strengthened, fuel costs were considerably reduced, and financial costs were effectively controlled. Marked improvement was noticeable in the Company’s growth quality because of its active power generation restructuring efforts. The Company has also made new developments in energy saving, ultra-low emission and technological renovation, diligently fulfilling its social responsibilities as a reliable provider of sufficient, stable and environmentally-friendly power to the society.
Critical accounting policies
65
The Company and its subsidiaries have identified the policies below as critical to our business operations and the understanding of our results of operations. The impact of and any associated risks related to these policies on the business operations are discussed throughout the Operating and Financial Reviews and Prospects where such policies affect our reported and expected financial results. For a detailed discussion on the application of these and other accounting policies, see Note 2 to the Financial Statements in Item 18 of this Annual Report on Form 20-F. Note that our preparation of this Annual Report on Form 20-F requires us to make estimates and assumptions that affect the reported amount of assets and liabilities, disclosure of contingent assets and liabilities at the date of our financial statements, and the reported amount of revenue and expenses during the reported periods. There can be no assurance that actual results will not differ from those estimates.
Depreciation of property, plant and equipment
Depreciation of property, plant and equipment is provided based on book value of assets less estimated residual value over estimated useful life using a straight-line method. For the impaired property, plant and equipment, depreciation is provided based on book value after deducting the impairment provision over estimated useful life of assets. The estimated useful lives are as follows:
|
|
|
2015
|
|
Dam
|
|
8 – 50 years
|
|
Port facilities
|
|
20 – 40 years
|
|
Buildings
|
|
8 – 30 years
|
|
Electric utility plant in service
|
|
5 – 30 years
|
|
Transportation facilities
|
|
8 – 27 years
|
|
Others
|
|
5 – 14 years
|
Where parts of an item of property, plant or equipment have different useful lives, the cost of the item is allocated on a reasonable basis between the parts and each part is depreciated separately. At the end of each year, the Company and its subsidiaries review the estimated useful life, residual value and the depreciation method of the property, plant and equipment and make adjustment when necessary.
Useful life of power generation license
The Company and its subsidiaries acquired the power generation license as part of the business combination with Tuas Power. The power generation license is initially recognized at fair value at the acquisition date. The license has an indefinite useful life and is not amortized. The assessment that the license has an indefinite useful life is based on the expected renewal of power generation license without significant restriction and cost, together with the consideration on related future cash flows generated and the expectation of continuous operations. It is tested annually for impairment and carried at cost less accumulated impairment loss. Useful life of the power generation license is reviewed by the Company and its subsidiaries each financial period to determine whether events and circumstances continue to support the indefinite useful life assessment.
Impairment of non-financial assets
The carrying amounts of property, plant and equipment, intangible assets with definite useful lives, land use rights, mining rights and long-term equity investments not accounted for as financial assets are reviewed at each reporting date to determine whether there is any indication of impairment. If any such indication exists, then the asset’s recoverable amount is estimated. Goodwill and indefinite-lived intangible assets are tested for impairment annually regardless of whether there are indications of impairment or more frequently if events or changes in circumstances indicate a potential impairment. An impairment loss is recognized if the carrying amount of an asset or cash-generating unit (“CGU”) exceeds its recoverable amount.
The recoverable amount of an asset or CGU is the greater of its value in use and its fair value less cost to sell. For impairment testing, assets are grouped together into the smallest group of assets that generate cash inflows from continuing use that are largely independent of the cash inflows of other assets or CGUs.
66
Subject to an operating segment ceiling test, CGUs to which goodwill has been allocated are aggregated so that the level at which impairment testing is performed reflects the lowest level at which goodwill is monitored for internal reporting purposes.
Goodwill acquired in a business combination is allocated to groups of CGUs that are expected to benefit from the synergies of the combination.
Impairment losses are recognized in profit or loss. Impairment losses recognised in respect of CGUs are allocated first to reduce the carrying amount of any goodwill allocated to the CGU (group of CGUs), and then to reduce the carrying amounts of the other assets in the CGU (group of CGUs) on a pro rata basis, except that the carrying value of an asset will not be reduced below its individual fair value less costs of disposal (if measurable) or value in use (if determinable).
An impairment loss in respect of goodwill is not reversed. Except for goodwill, all impaired non-financial assets are subject to review for possible reversal of impairment at each reporting date. A reversal of an impairment loss is limited to the asset’s carrying amount that would have been determined had no impairment loss been recognized in prior year. Reversals of impairment losses are credited to profit or loss in the year in which the reversals are recognized.
Principal accounting policies
Except as described below, the principal accounting policies adopted are consistent with those applied in the annual financial statements for the year ended December 31, 2014 described in those annual financial statements.
The Company and its subsidiaries have adopted the following new amendments to standards that are first effective for the current accounting period:
|
|
·
|
Amendments to IAS 19, Employee benefits – Defined benefit plans: Employee contributions
|
|
|
·
|
Annual Improvements to IFRSs 2010-2012 Cycle
|
|
|
·
|
Annual Improvements to IFRSs 2011-2013 Cycle
|
None of these developments have had a material effect on how the Company and its subsidiaries’ results and financial position for the current or prior periods have been prepared or presented. The Company and its subsidiaries has not applied any new standard or interpretation that is not yet effective for current accounting period.
New accounting pronouncements
For a detailed discussion of new accounting pronouncements, see Note 2(ab) to the Financial Statements.
|
B.
|
Operating results
|
Our financial statements are prepared under IFRS as issued by IASB. The following management’s discussion and analysis is based on the financial information prepared under IFRS.
Year ended December 31, 2015 compared with year ended December 31, 2014
67
|
|
|
For the Year Ended December 31,
|
|
|
|
|
||||||
|
|
|
2015
|
|
|
2014
|
|
|
Increased/ (Decreased)
|
|
|||
|
|
|
RMB’000
|
|
|
RMB’000
|
|
|
|
%
|
|
||
|
Operating revenue
|
|
128,904,873
|
|
|
125,406,855
|
|
|
|
2.79
|
|
||
|
Tax and levies on operations
|
|
(1,157,760)
|
|
|
(932,485
|
)
|
|
|
24.16
|
|
||
|
Operating expenses
|
|
|
|
|
|
|
|
|
||||
|
Fuel
|
|
(59,242,367)
|
|
|
(64,762,908
|
)
|
|
|
(8.52)
|
|
||
|
Maintenance
|
|
(4,556,361)
|
|
|
(3,729,912
|
)
|
|
|
22.16
|
|
||
|
Depreciation
|
|
(14,411,632)
|
|
|
(11,646,683
|
)
|
|
|
23.74
|
|
||
|
Labor
|
|
(7,751,551)
|
|
|
(6,259,588
|
)
|
|
|
23.83
|
|
||
|
Service fees on transmission and transformer facilities of HIPDC
|
|
(140,771)
|
|
|
(140,771
|
)
|
|
|
0.00
|
|
||
|
Purchase of electricity
|
|
(3,581,517)
|
|
|
(5,055,076
|
)
|
|
|
(29.15)
|
|
||
|
Others
|
|
(8,919,988)
|
|
|
(7,604,790
|
)
|
|
|
17.29
|
|
||
|
Total operating expenses
|
|
(98,604,187)
|
|
|
(99,199,728
|
)
|
|
|
(0.60)
|
|
||
|
|
|
|
|
|
|
|
|
|
||||
|
Profit from operations
|
|
29,142,926
|
|
|
25,274,642
|
|
|
|
15.31
|
|
||
|
|
|
|
|
|
|
|
|
|
||||
|
Interest income
|
|
160,723
|
|
|
159,550
|
|
|
|
0.74
|
|
||
|
Financial expenses, net
|
|
|
|
|
|
|
|
|
||||
|
Interest expense
|
|
(7,945,734)
|
|
|
(7,814,114
|
)
|
|
|
1.68
|
|
||
|
Exchange gain and bank charges , net
|
|
(24,336)
|
|
|
(9,492
|
)
|
|
|
156.38
|
|
||
|
Total financial expenses, net
|
|
(7,970,070)
|
|
|
(7,823,606
|
)
|
|
|
1.87
|
|
||
|
Share of profits less losses of associates and joint ventures
|
|
1,525,975
|
|
|
1,315,876
|
|
|
|
15.97
|
|
||
|
(Loss) / gain on fair value changes of financial assets / liabilities
|
|
(16,742)
|
|
|
42,538
|
|
|
|
(139.36)
|
|
||
|
Other investment income
|
|
115,238
|
|
|
80,580
|
|
|
|
43.01
|
|
||
|
Profit before income tax expense
|
|
22,958,050
|
|
|
19,049,580
|
|
|
|
20.52
|
|
||
|
Income tax expense
|
|
(5,698,943)
|
|
|
(5,487,208
|
)
|
|
|
3.86
|
|
||
|
Net Profit
|
|
17,259,107
|
|
|
13,562,372
|
|
|
|
27.26
|
|
||
|
Attributable to:
|
|
|
|
|
|
|
|
|
||||
|
-Equity holders of the Company
|
|
13,651,933
|
|
|
10,757,317
|
|
|
|
26.91
|
|
||
|
-Non-controlling interests
|
|
3,607,174
|
|
|
2,805,055
|
|
|
|
28.60
|
|
||
Total power generated by the Company’s domestic operating power plans for the year on consolidated basis amounted to 320.529 billion kWh, representing an increase of 8.9% year-on-year. The electricity sold amounted to 301.979 billion kWh, representing an increase of 8.8% year-on-year. Newly acquired entities and newly operated generating units mainly contributed to the power generation growth of the Company.
The annual average utilization hours of the Company’s domestic power plants reached 4,147 hours. In most of the areas where the Company’s coal-fired power plants are located, the utilization hours of the Company was in a leading position within those areas.
2015 operating results
In January 2015, the Company completed the acquisition under common control of the subsidiaries of Huaneng Group including Huaneng Hainan Power Inc. (“Hainan Power”), Huaneng Wuhan Power Generation Co., Ltd. (“Wuhan Power”), Huaneng Suzhou Thermal Power Co., Ltd. (“Suzhou Thermal Power”), Enshi Qingjiang Dalongtan Hydropower Development Co., Ltd. (“Dalongtan Hydropower”) and Huaneng Hualiangting Hydropower Co., Ltd. (“Hualiangting Hydropower”), and the subsidiaries of HIPDC including Huaneng Chaohu Power Generation Co., Ltd. (“Chaohu Power”), Huaneng Ruijin Power Generation Co., Ltd. (“Ruijin Power”), Huaneng Anyuan Power Generation Co., Ltd. (“Anyuan Power”), Huaneng Jingmen Thermal Power Co., Ltd. (“Jingmen Thermal Power”) and Huaneng Yingcheng Thermal Power Co., Ltd. (“Yingcheng Thermal Power”)
68
(collectively, the “Newly Acquired Entities”). The aforementioned entities were included in the consolidated financial statements.
The power generation of the Company’s domestic power plants for the year ended December 31, 2015 is listed below (in billion kWh):
|
Domestic Power Plant
|
|
Power generation
in 2015
|
|
|
Power generation
in 2014
|
|
|
Change
|
||||
|
Liaoning Province
|
|
|
|
|
|
|
|
|
||||
|
Dalian
|
|
|
5.921
|
|
|
|
6.423
|
|
|
|
(7.82)
|
%
|
|
Dandong
|
|
|
3.050
|
|
|
|
3.197
|
|
|
|
(4.60)
|
%
|
|
Yingkou
|
|
|
7.875
|
|
|
|
7.980
|
|
|
|
(1.32)
|
%
|
|
Yingkou Co-generation
|
|
|
3.085
|
|
|
|
3.043
|
|
|
|
1.38
|
%
|
|
Wafangdian Wind Power
|
|
|
0.094
|
|
|
|
0.099
|
|
|
|
(5.05)
|
%
|
|
Suzihe Hydropower
|
|
|
0.051
|
|
|
|
0.040
|
|
|
|
27.50
|
%
|
|
Changtu Wind Power
|
|
|
0.196
|
|
|
|
0.127
|
|
|
|
54.33
|
%
|
|
Inner Mongolia Autonomous Region
|
|
|
|
|
|
|
|
|
|
|||
|
Huade Wind Power
|
|
|
0.193
|
|
|
|
0.217
|
|
|
|
(11.06)
|
%
|
|
Hebei Province
|
|
|
|
|
|
|
|
|
|
|||
|
Shang’an
|
|
|
12.519
|
|
|
|
12.836
|
|
|
|
(2.47)
|
%
|
|
Kangbao Wind Power
|
|
|
0.097
|
|
|
|
0.085
|
|
|
|
14.12
|
%
|
|
Gansu Province
|
|
|
|
|
|
|
|
|
|
|||
|
Pingliang
|
|
|
6.020
|
|
|
|
9.129
|
|
|
|
(34.06)
|
%
|
|
Jiuquan Wind Power
|
|
|
0.438
|
|
|
|
0.838
|
|
|
|
(47.73)
|
%
|
|
Jiuquan II Wind Power
|
|
|
0.444
|
|
|
|
0.039
|
|
|
|
1038.46
|
%
|
|
Yumen Wind Power
|
|
|
0.150
|
|
|
|
-
|
-
|
||||
|
Yigang Wind Power
|
|
|
0.001
|
|
|
|
-
|
-
|
||||
|
Beijing Municpality
|
|
|
|
|
|
|
|
|
|
|||
|
Beijing Co-generation
|
|
|
3.924
|
|
|
|
4.456
|
|
|
|
(11.94)
|
%
|
|
Beijing Co-generation CCGT
|
|
|
4.159
|
|
|
|
4.051
|
|
|
|
2.67
|
%
|
|
Tianjin Municipality
|
|
|
|
|
|
|
|
|
|
|||
|
Yangliuqing Co-genertion
|
|
|
5.427
|
|
|
|
6.572
|
|
|
|
(17.42)
|
%
|
|
Lingang CCGT Co-generation
|
|
|
1.966
|
|
|
|
0.126
|
|
|
|
1460.32
|
%
|
|
Shanxi Province
|
|
|
|
|
|
|
|
|
|
|||
|
Yushe
|
|
|
2.750
|
|
|
|
2.608
|
|
|
|
5.44
|
%
|
|
Zuoquan
|
|
|
5.625
|
|
|
|
5.999
|
|
|
|
(6.23)
|
%
|
|
Dongshan CCGT
|
|
|
1.139
|
|
|
|
-
|
|
|
|
-
|
|
|
Shandong Province
|
|
|
|
|
|
|
|
|
|
|||
|
Dezhou
|
|
|
14.388
|
|
|
|
15.348
|
|
|
|
(6.25)
|
%
|
|
Jining
|
|
|
4.893
|
|
|
|
5.096
|
|
|
|
(3.98)
|
%
|
|
Xindian
|
|
|
3.158
|
|
|
|
3.303
|
|
|
|
(4.39)
|
%
|
|
Weihai
|
|
|
10.894
|
|
|
|
11.771
|
|
|
|
(7.45)
|
%
|
|
Rizhao Phase II
|
|
|
7.499
|
|
|
|
8.236
|
|
|
|
(8.95)
|
%
|
|
Zhanhua Co-generation
|
|
|
1.503
|
|
|
|
1.674
|
|
|
|
(10.22)
|
%
|
|
Henan Province
|
|
|
|
|
|
|
|
|
|
|||
|
Qinbei
|
|
|
18.710
|
|
|
|
20.366
|
|
|
|
(8.13)
|
%
|
|
Luoyang Co-generation
|
|
|
1.485
|
|
|
|
-
|
-
|
||||
|
Jiangsu Province
|
|
|
|
|
|
|
|
|
|
|
|
|
|
Nantong
|
|
|
6.167
|
|
|
|
6.752
|
|
|
|
(8.66)
|
%
|
|
Nanjing
|
|
|
2.736
|
|
|
|
3.154
|
|
|
|
(13.25)
|
%
|
|
Taicang
|
|
|
10.081
|
|
|
|
11.174
|
|
|
|
(9.78)
|
%
|
|
Huaiyin
|
|
|
5.813
|
|
|
|
6.486
|
|
|
|
(10.38)
|
%
|
|
Jinling CCGT
|
|
|
2.581
|
|
|
|
1.895
|
|
|
|
36.20
|
%
|
|
Jinling Coal-fired
|
|
|
11.728
|
|
|
|
11.567
|
|
|
|
1.39
|
%
|
|
Jinling Co-generation
|
|
|
1.711
|
|
|
|
1.358
|
|
|
|
25.99
|
%
|
|
Rudong Wind Power
|
|
|
0.095
|
|
|
|
0.113
|
|
|
|
(15.93)
|
%
|
|
Qidong Wind Power
|
|
|
0.340
|
|
|
|
0.379
|
|
|
|
(10.29)
|
%
|
|
Suzhou Thermal Power
|
|
|
0.789
|
|
|
|
0.806
|
|
|
|
(2.1)
|
%
|
|
Shanghai Municipality
|
|
|
|
|
|
|
|
|
|
|||
|
Shidongkou I
|
|
|
5.060
|
|
|
|
5.665
|
|
|
|
(10.68)
|
%
|
|
Shidongkou II
|
|
|
5.252
|
|
|
|
5.190
|
|
|
|
1.19
|
%
|
|
Shidongkou Power
|
|
|
6.039
|
|
|
|
6.018
|
|
|
|
0.35
|
%
|
|
Shanghai CCGT
|
|
|
1.775
|
|
|
|
2.097
|
|
|
|
(15.36)
|
%
|
|
Chongqing Municipality
|
|
|
|
|
|
|
|
|
|
|||
|
Luohuang
|
|
|
9.767
|
|
|
|
10.862
|
|
|
|
(10.08)
|
%
|
|
Liangjiang CCGT
|
|
|
0.938
|
|
|
|
0.246
|
|
|
|
281.30
|
%
|
69
|
Domestic Power Plant
|
|
Power generation
in 2015
|
|
|
Power generation
in 2014
|
|
|
Change
|
||||
|
Zhejiang Province
|
|
|
|
|
|
|
|
|
|
|||
|
Yuhuan
|
|
|
18.957
|
|
|
|
21.771
|
|
|
|
(12.93)
|
%
|
|
Changxing
|
|
|
5.438
|
|
|
|
0.488
|
|
|
|
1014.34
|
%
|
|
Tongxiang CCGT
|
|
|
0.270
|
|
|
|
0.171
|
|
|
|
57.89
|
%
|
|
Si’an Photovoltaic
|
|
|
0.008
|
|
|
|
-
|
|
|
|
-
|
|
|
Hunan Province
|
|
|
|
|
|
|
|
|
|
|||
|
Yueyang
|
|
|
7.859
|
|
|
|
8.553
|
|
|
|
(8.11)
|
%
|
|
Xiangqi Hydropower
|
|
|
0.363
|
|
|
|
0.310
|
|
|
|
17.10
|
%
|
|
Subaoding Wind Power
|
|
|
0.318
|
|
|
|
0.020
|
|
|
|
1490.00
|
%
|
| Guidong Wind Power | 0.069 | - | - | |||||||||
|
Hubei Province
|
|
|
|
|
|
|
|
|
|
|||
|
Enshi Maweigou Hydropower
|
|
|
0.063
|
|
|
|
0.042
|
|
|
|
50.00
|
%
|
|
Jingmen Thermal Power
|
1.930
|
0.530
|
264.1
|
%
|
||||||||
|
Yingcheng Thermal Power
|
1.062
|
-
|
-
|
|||||||||
|
Wuhan Power Plant
|
10.027
|
9.760
|
2.7
|
%
|
||||||||
|
Dalongtan Hydropower
|
0.086
|
0.102
|
(15.8)
|
%
|
||||||||
|
Jieshan Wind Power
|
0.054
|
-
|
-
|
|||||||||
|
Jiangxi Province
|
|
|
|
|
|
|
|
|
|
|||
|
Jinggangshan
|
|
|
8.993
|
|
|
|
9.244
|
|
|
|
(2.72)
|
%
|
|
Jianggongling Wind Power
|
|
|
0.090
|
|
|
|
0.001
|
|
|
|
8900.00
|
%
|
|
Ruijin Power
|
3.289
|
3.329
|
(1.2)
|
%
|
||||||||
|
Anyuan Power
|
3.015
|
-
|
-
|
|||||||||
|
Anhui Province
|
||||||||||||
|
Chaohu Power Plant
|
5.847
|
6.807
|
(14.1)
|
%
|
||||||||
|
Hualiangting Hydropower
|
0.129
|
0.097
|
32.9
|
%
|
||||||||
|
Fujian Province
|
|
|
|
|
|
|
|
|
|
|||
|
Fuzhou
|
|
|
10.892
|
|
|
|
13.925
|
|
|
|
(21.78)
|
%
|
|
Guangdong Province
|
|
|
|
|
|
|
|
|
|
|||
|
Shantou
|
|
|
4.550
|
|
|
|
5.200
|
|
|
|
(12.50)
|
%
|
|
Haimen
|
|
|
7.631
|
|
|
|
12.270
|
|
|
|
(37.81)
|
%
|
|
Haimen Power
|
|
|
8.770
|
|
|
|
6.152
|
|
|
|
42.56
|
%
|
|
Yunnan Province
|
|
|
|
|
|
|
|
|
|
|||
|
Diandong Energy
|
|
|
3.994
|
|
|
|
5.953
|
|
|
|
(32.91)
|
%
|
|
Yuwang Energy
|
|
|
1.585
|
|
|
|
3.651
|
|
|
|
(56.59)
|
%
|
|
Fuyuan Wind Power
|
|
|
0.147
|
|
|
|
0.022
|
|
|
|
568.18
|
%
|
|
Guizhou Province
|
|
|
|
|
|
|
|
|
|
|||
|
Panxian Wind Power
|
|
|
0.0003
|
|
|
|
-
|
|
|
|
-
|
|
|
Hainan Province
|
||||||||||||
|
Haikou Power Plant
|
7.047
|
6.424
|
9.7
|
%
|
||||||||
|
Dongfang Power Plant
|
9.081
|
10.079
|
(9.9)
|
%
|
||||||||
|
Nanshan Power Plant
|
0.248
|
0.273
|
(9.0)
|
%
|
||||||||
|
Gezhen Hydropower
|
0.093
|
0.202
|
(53.9)
|
%
|
||||||||
|
Wenchang Wind Power
|
0.099
|
0.083
|
19.4
|
%
|
||||||||
|
Total
|
|
|
320.529
|
|
|
|
294.388
|
|
|
|
8.9
|
%
|
|
Note:
|
The total amount of power generation in 2014 does not include amount of power generation from Newly Acquired Entities.
|
The Company’s growth of power generation within China mainly originated from the capacity contribution from the Newly Acquired Entities and power plants newly put into production. The main reasons for the decrease in some of the Company’s power plants are as follows: firstly, as a result of the slowdown of the economy and the deepening of China’s economic restructuring, nation-wide electricity consumption in China declined, which led to the decrease of utilization hours. Secondly, the commencement of operations of multiple West-to-East UHV transmission lines has squeezed the generation potential of thermal power generators in the coastal regions in southeastern China. Thirdly, the lower temperature in summer 2015 resulted in lower electricity demand for cooling, while the heating demand in winter also failed to increase significantly. Fourthly, the commencement of operation of many nuclear power units in Liaoning, Zhejiang, Fujian and other provinces reduced the power output of the thermal power generating units in such regions. For the year ended December 31, 2015, the accumulated power generation of Tuas Power Ltd., the Company’s wholly owned subsidiary in Singapore, accounted for a market share of 21.7% in Singapore, representing a decrease of 0.1% compared to the same period last year of 21.8%.
70
In respect of the tariff, the Company’s average tariff of domestic power plants for the year ended December 31, 2015 was RMB443.26 per MWh, down by RMB11.69 per MWh from the year ended December 31, 2014. SinoSing Power’s average tariff for 2015 was RMB625.88 per MWh, representing a decrease of 32.02% from the same period last year.
In respect of fuel costs, the decrease of coal market price and effective cost control of the Company contributed to reduced fuel costs of the Company. Compared with 2014, the Company’s domestic fuel cost per unit of power sold decreased by 13.68% to RMB173.67 per MWh.
Combining the foregoing factors, for the year ended December 31, 2015, the Company registered operating revenue of RMB128.905 billion, representing an increase of 2.79% from RMB125.407 billion of last year, and net profit attributable to equity holders of RMB13.652 billion, representing an increase of 26.91% from RMB10.757 billion of last year.
For the year ended December 31, 2015, the profit attributable to equity holders of the Company from domestic operations was RMB13.711 billion, representing an increase of RMB3.082 billion from RMB10.629 billion for the same period last year. The increase was primarily attributable to the decrease of domestic fuel costs and the profits contributed by the Newly Acquired Entities and the operation of new generating units. The loss attributable to equity holders of the Company from its operations in Singapore was RMB59 million. This is because of the continued oversupply in Singapore’s power market as result of commenced operations of many generators during the recent years, which led to a continued reduction of local power tariff and significantly decreased the profit margin per unit of power sold.
Operating revenue and tax and levies on operations
Operating revenue mainly consists of revenue from electricity sold. For the year ended December 31, 2015, the consolidated operating revenue of the Company and its subsidiaries amounted to RMB128.905 billion, representing an increase of 2.79% from RMB125.407 billion for the year ended December 31, 2014. The operating revenue from domestic operations of the Company increased by RMB7.725 billion over the same period of last year, while the operating revenue from the Newly Acquired Entities and the operation of new generating units was RMB21.228 billion.
The operating revenue from operations of the Company in Singapore decreased by RMB4.227 billion over the same period of last year, which was mainly attributable to the continued oversupply in Singpore’s power market, which has led to continued decline of the profit margin per unit of power sold.
The following table sets forth the average tariff rate of the Company’s power plants, as well as percentage changes from 2014 to 2015.
|
|
|
Average tariff rate (VAT inclusive) (RMB/MWh)
|
||||||||||
|
Power Plant
|
|
2015
|
|
|
2014
|
|
|
Change
|
||||
|
Liaoning Province
|
|
|
|
|
|
|
|
|
|
|||
|
Dalian
|
|
|
375.55
|
|
|
|
394.50
|
|
|
|
(4.80)
|
%
|
|
Dandong
|
|
|
371.45
|
|
|
|
393.06
|
|
|
|
(5.50)
|
%
|
|
Yingkou
|
|
|
378.32
|
|
|
|
399.33
|
|
|
|
(5.26)
|
%
|
|
Yingkou Co-generation
|
|
|
365.04
|
|
|
|
399.21
|
|
|
|
(8.56)
|
%
|
|
Wafangdian Wind Power
|
|
|
598.12
|
|
|
|
609.68
|
|
|
|
(1.90)
|
%
|
|
Suzihe Hydropower
|
|
|
329.96
|
|
|
|
330.00
|
|
|
|
(0.01)
|
%
|
|
Changtu Wind Power
|
|
|
590.93
|
|
|
|
602.82
|
|
|
|
(1.97)
|
%
|
|
Inner Mongolia Autonomous Region
|
|
|
|
|
|
|
|
|
|
|||
|
Huade Wind Power
|
|
|
520.00
|
|
|
|
520.00
|
|
|
|
—
|
|
|
Hebei Province
|
|
|
|
|
|
|
|
|
|
|||
|
Shang’an
|
|
|
401.79
|
|
|
|
429.39
|
|
|
|
(6.43)
|
%
|
|
Kangbao Wind Power
|
|
|
538.14
|
|
|
|
538.84
|
|
|
|
(0.13)
|
%
|
|
Gansu Province
|
|
|
|
|
|
|
|
|
|
|||
|
Pingliang
|
|
|
259.51
|
|
|
|
322.72
|
|
|
|
(19.59)
|
%
|
71
|
|
|
Average tariff rate (VAT inclusive) (RMB/MWh)
|
||||||||||
|
Power Plant
|
|
2015
|
|
|
2014
|
|
|
Change
|
||||
|
Jiuquan Wind Power
|
|
|
473.12
|
|
|
|
520.60
|
|
|
|
(9.12)
|
%
|
|
Jiuquan II Wind Power
|
|
|
497.75
|
|
|
|
540.00
|
|
|
|
(7.82)
|
%
|
|
Yumen Wind Power
|
|
|
472.01
|
|
|
|
520.60
|
|
|
|
(9.33)
|
%
|
|
Beijing Municipality
|
|
|
|
|
|
|
|
|
|
|||
|
Beijing Co-generation (Coal-fired)
|
|
|
480.70
|
|
|
|
514.71
|
|
|
|
(6.61)
|
%
|
|
Beijing Co-generation (Combined Cycle)
|
|
|
959.91
|
|
|
|
882.33
|
|
|
|
8.79
|
%
|
|
Tianjin Municipality
|
|
|
|
|
|
|
|
|
|
|
|
|
|
Yangliuqing Co-generation
|
|
|
416.54
|
|
|
|
434.28
|
|
|
|
(4.08)
|
%
|
|
Lingang Co-generation CCGT
|
|
|
817.57
|
|
|
|
—
|
|
|
|
—
|
|
|
Shanxi Province
|
|
|
|
|
|
|
|
|
|
|||
|
Yushe
|
|
|
334.87
|
|
|
|
391.22
|
|
|
|
(14.40)
|
%
|
|
Zuoquan
|
|
|
333.25
|
|
|
|
382.01
|
|
|
|
(12.76)
|
%
|
|
Dongshan CCGT
|
|
|
703.80
|
|
|
|
—
|
|
|
|
—
|
|
|
Shandong Province
|
|
|
|
|
|
|
|
|
|
|
||
|
Dezhou
|
|
|
445.44
|
|
|
|
463.36
|
|
|
|
(3.87)
|
%
|
|
Jining
|
|
|
429.20
|
|
|
|
446.73
|
|
|
|
(3.92)
|
%
|
|
Xindian
|
|
|
432.30
|
|
|
|
448.55
|
|
|
|
(3.65)
|
%
|
|
Weihai
|
|
|
440.45
|
|
|
|
461.18
|
|
|
|
(4.49)
|
%
|
|
Rizhao Phase II
|
|
|
422.33
|
|
|
|
441.59
|
|
|
|
(4.36)
|
%
|
|
Zhanhua Co-generation
|
|
|
424.66
|
|
|
|
434.71
|
|
|
|
(2.31)
|
%
|
|
Henan Province
|
|
|
|
|
|
|
|
|
|
|||
|
Qinbei
|
|
|
401.65
|
|
|
|
435.42
|
|
|
|
(7.76)
|
%
|
|
Luoyang Co-generation
|
|
|
384.33
|
—
|
—
|
|||||||
|
Jiangsu Province
|
|
|
|
|
|
|
|
|
|
|||
|
Nantong
|
|
|
430.98
|
|
|
|
436.00
|
|
|
|
(1.15)
|
%
|
|
Nanjing
|
|
|
453.08
|
|
|
|
436.50
|
|
|
|
3.80
|
%
|
|
Taicang I
|
|
|
387.68
|
|
|
|
419.19
|
|
|
|
(7.52)
|
%
|
|
Taicang II
|
|
|
387.68
|
|
|
|
395.38
|
|
|
|
(1.95)
|
%
|
|
Huaiyin
|
|
|
450.81
|
|
|
|
443.04
|
|
|
|
1.75
|
%
|
|
Jinling Coal-fired
|
|
|
385.24
|
|
|
|
408.24
|
|
|
|
(5.63)
|
%
|
|
Jinling Combined-Circle
|
|
|
712.13
|
|
|
|
606.21
|
|
|
|
17.47
|
%
|
|
Jinling Combined-Cycle Cogeneration
|
|
|
760.99
|
|
|
|
690.00
|
|
|
|
10.29
|
%
|
|
Suzhou Thermal Power
|
|
|
489.38
|
|
|
|
508.66
|
|
|
|
(3.79)
|
%
|
|
Qidong Wind Power
|
|
|
556.76
|
|
|
|
555.92
|
|
|
|
0.15
|
%
|
|
Rudong Wind Power
|
|
|
610.00
|
|
|
|
610.00
|
|
|
|
0.00
|
%
|
|
Shanghai Municipality
|
|
|
|
|
|
|
|
|
|
|||
|
Shidongkou I
|
|
|
435.48
|
|
|
|
438.21
|
|
|
|
(0.62)
|
%
|
|
Shidongkou II
|
|
|
410.35
|
|
|
|
437.54
|
|
|
|
(6.21)
|
%
|
|
Shanghai CCGT
|
|
|
937.13
|
|
|
|
866.20
|
|
|
|
8.19
|
%
|
|
Shidongkou Power
|
|
|
427.42
|
|
|
|
449.92
|
|
|
|
(5.00)
|
%
|
|
Chongqing Municipality
|
|
|
|
|
|
|
|
|
|
|||
|
Luohuang
|
|
|
427.84
|
|
|
|
440.21
|
|
|
|
(2.81)
|
%
|
|
Liangjiang CCGT
|
|
|
872.20 |
|
|
|
—
|
|
|
|
—
|
|
|
Zhejiang Province
|
|
|
|
|
|
|
|
|
|
|||
|
Yuhuan
|
|
|
452.99
|
|
|
|
468.71
|
|
|
|
(3.35)
|
%
|
|
Changxing
|
|
|
487.93
|
|
|
|
431.03
|
|
|
|
13.20
|
%
|
|
Tongxiang Combined-cycle
|
|
|
1,278.17
|
|
|
|
1,298.37
|
|
|
|
(1.56)
|
%
|
|
Si’an PV
|
|
|
1,125.67
|
—
|
—
|
|||||||
|
Hunan Province
|
|
|
|
|
|
|
|
|
|
|||
|
Yueyang
|
|
|
480.55
|
|
|
|
495.31
|
|
|
|
(2.98)
|
%
|
|
Xiangqi Hydropower
|
|
|
410.00
|
|
|
|
410.00
|
|
|
|
0.00
|
%
|
|
Subaoding Wind Power
|
|
|
611.72
|
|
|
|
494.00
|
|
|
|
23.83
|
%
|
|
Guidong Wind Power
|
|
|
610.00
|
—
|
—
|
|||||||
|
Hubei Province
|
|
|
|
|
|
|
|
|
|
|||
|
Enshi Maweigou Hydropower
|
|
|
379.26
|
|
|
|
366.59
|
|
|
|
3.46
|
%
|
|
Jingmen Thermal Power
|
|
|
444.09
|
|
|
|
432.20
|
|
|
|
2.75
|
%
|
|
Yingcheng Thermal Power
|
|
|
477.26
|
|
|
|
—
|
|
|
|
—
|
|
|
Wuhan Power
|
|
|
435.47
|
|
|
|
461.99
|
|
|
|
(5.74)
|
%
|
|
Dalongtan Hydropower
|
|
|
374.80
|
|
|
|
366.89
|
|
|
|
2.16
|
%
|
|
Jieshan Wind Power
|
|
|
610.00
|
|
|
|
—
|
|
|
|
—
|
|
|
Jiangxi Province
|
|
|
|
|
|
|
|
|
|
|||
|
Jinggangshan
|
|
|
443.73
|
|
|
|
468.92
|
|
|
|
(5.37)
|
%
|
|
Jianggongling Wind Power
|
|
|
610.00
|
|
|
|
610.00
|
|
|
|
—
|
|
|
Ruijin Power
|
|
|
441.24
|
466.57
|
(5.43)
|
%
|
||||||
|
AnyuanPower
|
|
|
424.63
|
—
|
—
|
|||||||
|
Anhui Province
|
|
|
|
|
|
|
|
|
|
|||
|
Chaohu Power Plant
|
|
|
409.79
|
|
|
|
412.93
|
|
|
|
(0.76)
|
%
|
72
|
|
|
Average tariff rate (VAT inclusive) (RMB/MWh)
|
||||||||||
|
Power Plant
|
|
2015
|
|
|
2014
|
|
|
Change
|
||||
|
Hualiangting
|
|
|
392.89
|
|
|
|
346.85
|
|
|
|
13.27
|
%
|
|
Fujian Province
|
|
|
|
|
|
|
|
|
|
|||
|
Fuzhou
|
|
|
392.29
|
|
|
|
441.83
|
|
|
|
(11.21)
|
%
|
|
Guangdong Province
|
|
|
|
|
|
|
|
|
|
|||
|
Shantou Coal-fired
|
|
|
498.01
|
|
|
|
529.99
|
|
|
|
(6.03)
|
%
|
|
Haimen
|
|
|
483.38
|
|
|
|
503.18
|
|
|
|
(3.93)
|
%
|
|
Haimen Power
|
|
|
485.46
|
|
|
|
479.55
|
|
|
|
1.23
|
%
|
|
Guizhou Province
|
|
|
|
|
|
|
|
|
|
|||
|
Panxian Wind Power
|
|
|
—
|
—
|
—
|
|||||||
|
Yunnan Province
|
|
|
|
|
|
|
|
|
|
|||
|
Diandong Energy
|
|
|
435.58
|
|
|
|
401.59
|
|
|
|
8.46
|
%
|
|
Yuwang Energy
|
|
|
545.42
|
|
|
|
395.96
|
|
|
|
37.75
|
%
|
|
Fuyuan Wind Power
|
|
|
600.61
|
|
|
|
610.00
|
|
|
|
(1.54)
|
%
|
|
Hainan Province
|
|
|
|
|
|
|
|
|
|
|
||
|
Haikou
|
|
|
457.71
|
|
|
|
474.14
|
|
|
|
(3.47)
|
%
|
|
Dongfang
|
|
|
460.53
|
|
|
|
482.69
|
|
|
|
(4.59)
|
%
|
|
Nanshan Combined Cycle
|
|
|
629.32
|
|
|
|
439.84
|
|
|
|
(43.08)
|
%
|
|
Gezhen Hydropower
|
|
|
399.78
|
|
|
|
392.63
|
|
|
|
1.82
|
%
|
|
Wenchang Wind Power
|
|
|
571.95
|
|
|
|
619.72
|
|
|
|
(7.71)
|
%
|
|
Domestic total
|
|
|
443.26
|
|
|
|
454.95
|
|
|
|
(2.57)
|
%
|
|
Singapore
|
|
|
|
|
|
|
|
|
|
|||
|
SinoSing Power
|
|
|
625.88
|
|
|
|
920.74
|
|
|
|
(32.02)
|
%
|
|
Note 1:
|
The tariff of Shanghai Combined Cycle and Tongxiang Combined Cycle consists of on-grid settlement price and capacity subsidy income.
|
Tax and levies on operations mainly consist of surcharges of value-added tax. According to relevant administrative regulations, these surcharges include City Construction Tax and Education Surcharges calculated at prescribed percentages on the amounts of the value-added tax paid. For the year ended December 31, 2015, the tax and levies on operations of the Company and its subsidiaries were RMB1.158 billion, representing an increase of RMB226 million from RMB932 million for the same period of last year, of which the tax and levies on operations attributable to the Newly Acquired Entities and new generating units accounted for RMB136 million.
Operating expenses
For the year ended December 31, 2015, the total operating expenses of the Company and its subsidiaries was RMB98.604 billion, representing a decrease of 0.60% from the same period last year. The operating expenses in domestic operations of the Company increased by RMB3.08 billion, or 3.61%, from the same period last year, of which the Newly Acquired Entities and the new generating units accounted for RMB15.349 billion; the costs attributable to the existing entities decreased by RMB12.269 billion, which was primarily attributable to the decreased fuel costs for domestic operations in China.
The operating expenses from operations in Singapore operations decreased by RMB3.676 billion, or 26.45%, from the same period last year, which was mainly due to the decline of fuel costs resulting from decreased natural gas price.
Fuel costs
Fuel costs represented the largest portion of the operating expenses for the Company and its subsidiaries. For the year ended December 31, 2015, fuel costs of the Company and its subsidiaries decreased by 8.52% to RMB59.242 billion from RMB64.763 billion for the year ended December 31, 2014. The fuel costs of domestic operations decreased by RMB3.394 billion, which was primarily attributable to the decreased coal price in the domestic market together with the expansion of the Company. The fuel costs of the Newly Acquired Entities and new generating units were RMB9.855 billion and the fuel costs of the existing generating units decreased by RMB13.249 billion from same period last year. Fuel costs in Singapore decreased by RMB2.126 billion from the same period last year, mainly due to the decline of fuel costs resulting from decreased natural gas price. For the year ended December 31, 2015, the average price (excluding tax) of natural fuel coal consumed of the Company and its domestic subsidiaries was RMB366.30 per ton, representing a decrease of 15.77% from RMB434.88 per ton for the year ended December 31, 2014. The fuel cost per unit of power sold by the Company’s coal-fired power plants in China decreased by 13.68% to RMB173.67/MWh from RMB201.19/MWh in 2014.
73
Maintenance
For the year ended December 31, 2015, the maintenance expenses of the Company and its subsidiaries amounted to RMB4.556 billion, representing an increase of RMB826 million from RMB3.730 billion for the year ended December 31, 2014. The maintenance expenses of domestic operations increased by RMB792 million compared to the same period last year. The maintenance expenses of Singapore operations increased by RMB34 million compared to the same period last year.
Depreciation
For the year ended December 31, 2015, depreciation expenses of the Company and its subsidiaries increased by 23.74% to RMB14.412 billion, compared to RMB11.647 billion in the year ended December 31, 2014; the increase was mainly due to the expansion of the Company’s operations. The depreciation expenses of domestic operations increased by RMB2.81 billion compared to the same period last year, of which the Newly Acquired Entities and new generating units accounted for RMB2.637 billion. The depreciation expenses of the operations in Singapore decreased by RMB44 million compared to the same period last year.
Labor
Labor costs consist of salaries to employees and contributions payable for employees’ housing funds, medical insurance, pension and unemployment insurance, as well as training costs. For the year ended December 31, 2015, the labor costs of the Company and its subsidiaries amounted to RMB7.752 billion, representing an increase of RMB1.492 billion from RMB6.260 billion for the year ended December 31, 2014. This is mainly attributable to labor cost of the Newly Acquired Entities and new generating units, and increase of the salaries linked to the performance of the Company. The labor costs of the Newly Acquired Entities and new generating units were RMB1.242 billion. Labor costs for Singapore operations decreased by RMB10 million compared to the same period last year.
Other operating expenses (including electricity power purchase costs and service fees paid to HIPDC)
Other operating expenses include environmental protection expenses, land fee, insurance premiums, office expenses, amortization, Tuas Power’s electricity power purchase costs, impairment losses, government subsidies and net losses on disposal of properties, plant and equipment. For the year ended December 31, 2015, other operating expenses (including electricity power purchase costs and service fees paid to HIPDC) of the Company and its subsidiaries was RMB12.642 billion, representing a decrease of RMB158 million from RMB12.800 billion for the year ended December 31, 2014. The other operating expenses from domestic operations of the Company and its subsidiaries increased by RMB1.371 billion, of which RMB876 million was from the Newly Acquired Entities and new generating units; the other operating expenses of the existing entities increased by RMB495 million compared to the same period last year. The impairment loss increased RMB968 million compared to the same period last year, mainly consisting of the impairment loss of goodwill, property, plant and equipment and mining rights of Diandong Energy, Yuwang Energy, Pingliang and other entities; the costs of entrusted power generation of certain subsidiaries decreased by RMB114 million; expenses for non-maintenance materials decreased by RMB90 million, pollutants discharge fees decreased by RMB86 million and water-resources fees decreased by RMB53 million compared to the same period last year. Other operating expenses of the operations in Singapore decreased by RMB1.53 billion compared to the same period last year. The electricity purchase cost decreased by RMB1.474 billion compared to the same period last year, which was mainly due to the decrease in purchase volume and price of electricity in retail business.
Financial expenses
Financial expenses consist of interest expense, bank charges and net exchange differences.
74
Interest expenses
For the year ended December 31, 2015, the interest expenses of the Company and its subsidiaries were RMB7.946 billion, representing an increase of 1.68% from RMB7.814 billion for the year ended December 31, 2014. The interest expenses from domestic operations of the Company and its subsidiaries increased by RMB106 million. The interest expenses from the Newly Acquired Entities and new generating units were RMB1.384 billion and those incurred by the existing entities in China decreased by RMB1.278 billion. The interest expenses of Singapore operations increased by RMB26 million compared to the same period last year.
Net exchange differences and bank charges
For the year ended December 31, 2015, the Company and its subsidiaries recognised a net loss of RMB24 million in net exchange gains and bank charges, representing a net loss increase of RMB15 million compared with the net loss of RMB9 million for the year ended December 31, 2014, mainly because of the decrease of exchange gain resulting from weaken exchange rate between RMB and U.S. dollar for domestic operations. The operations in Singapore recognised net gains of RMB170 million from net exchange difference and bank charges, representing a net gain increase of RMB120 million from the net gain of RMB50 million in the last year, mainly due to the strengthen exchange rate between U.S. dollar and Singapore dollar.
Share of profits less losses of associates and joint ventures
For the year ended December 31, 2015, the share of profits less losses of associates and joint ventures was RMB1.526 billion, representing an increase of RMB210 million from RMB1.316 billion for the year ended December 31, 2014, mainly due to increased profit of associates and joint ventures.
Income tax expenses
For the year ended December 31, 2015, the Company and its subsidiaries recognized income tax expense of RMB5.699 billion, representing an increase of RMB212 million from RMB5.487 billion for the year ended December 31, 2014. The income tax expense for the domestic operations increased by RMB476 million, primarily attributable to the increase of pre-tax profit. The income tax expenses of the operations in Singapore decreased by RMB264 million, mainly attributable to RMB204 million of income tax credit granted by Singapore government in the current period.
Net profit, profit attributable to the equity holders of the Company and non-controlling interests
For the year ended December 31, 2015, the Company and its subsidiaries achieved a net profit of RMB17.259 billion, representing an increase of RMB3.697 billion, or 27.26%, from RMB13.562 billion for the year ended December 31, 2014; the net profit attributable to equity holders of the Company was RMB13.652 billion, representing an increase of RMB2.895 billion from RMB10.757 billion for the year ended December 31, 2014.
The net profit attributable to equity holders of the Company from domestic operations increased by RMB3.082 billion, mainly contributable to the decrease of domestic fuel cost and profits contributed by the Newly Acquired Entities and new generating units. The loss attributable to equity holders of the Company from operations in Singapore was RMB59 million.. This is mainly because of the continued oversupply in Singapore’s power and natural gas generation market as result of commenced operations of many generators during the recent years, which led to a continued reduction of local power tariff and significantly decreased profitability of the Company’s operations in Singapore.
The profit attributable to non-controlling interests of the Company increased from RMB3.607 billion in 2015 from RMB2.805 billion in 2014, mainly attributable to the increased profit of the non-wholly owned subsidiaries.
75
Year ended December 31, 2014 compared with year ended December 31, 2013
|
|
|
For the Year Ended December 31,
|
|
|
|
|
||||||
|
|
|
2014
|
|
|
2013
|
|
|
Increased/ (Decreased)
|
|
|||
|
|
|
RMB’000
|
|
|
RMB’000
|
|
|
|
%
|
|
||
|
Operating revenue
|
|
|
125,406,855
|
|
|
|
133,832,875
|
|
|
|
(6.30)
|
|
|
Tax and levies on operations
|
|
|
(932,485
|
)
|
|
|
(1,043,855
|
)
|
|
|
(10.67)
|
|
|
Operating expenses
|
|
|
|
|
|
|
|
|
|
|
|
|
|
Fuel
|
|
|
(64,762,908
|
)
|
|
|
(73,807,817
|
)
|
|
|
(12.25)
|
|
|
Maintenance
|
|
|
(3,729,912
|
)
|
|
|
(3,856,975
|
)
|
|
|
(3.29)
|
|
|
Depreciation
|
|
|
(11,646,683
|
)
|
|
|
(11,293,522
|
)
|
|
|
3.13
|
|
|
Labor
|
|
|
(6,259,588
|
)
|
|
|
(5,762,884
|
)
|
|
|
8.62
|
|
|
Service fees on transmission and transformer facilities of HIPDC
|
|
|
(140,771
|
)
|
|
|
(140,771
|
)
|
|
|
0.00
|
|
|
Purchase of electricity
|
|
|
(5,055,076
|
)
|
|
|
(4,955,603
|
)
|
|
|
2.01
|
|
|
Others
|
|
|
(7,604,790
|
)
|
|
|
(8,860,409
|
)
|
|
|
(14.17)
|
|
|
Total operating expenses
|
|
|
(99,199,728
|
)
|
|
|
(108,677,981
|
)
|
|
|
(8.72)
|
|
|
|
|
|
|
|
|
|
|
|
|
|
|
|
|
Profit from operations
|
|
|
25,274,642
|
|
|
|
24,111,039
|
|
|
|
4.83
|
|
|
|
|
|
|
|
|
|
|
|
|
|
|
|
|
Interest income
|
|
|
159,550
|
|
|
|
170,723
|
|
|
|
(6.54)
|
|
|
Financial expenses, net
|
|
|
|
|
|
|
|
|
|
|
|
|
|
Interest expense
|
|
|
(7,814,114
|
)
|
|
|
(7,787,472
|
)
|
|
|
0.34
|
|
|
Exchange (loss) / gain and bank charges , net
|
|
|
(9,492
|
)
|
|
|
94,109
|
|
|
|
(110.69)
|
|
|
Total financial expenses, net
|
|
|
(7,823,606
|
)
|
|
|
(7,693,363
|
)
|
|
|
1.69
|
|
|
Share of profits less losses of associates and joint ventures
|
|
|
1,315,876
|
|
|
|
615,083
|
|
|
|
113.93
|
|
|
Gain / (loss) on fair value changes of financial assets / liabilities
|
|
|
42,538
|
|
|
|
(5,701
|
)
|
|
|
846.15
|
|
|
Other investment income
|
|
|
80,580
|
|
|
|
224,908
|
|
|
|
(64.17)
|
|
|
Profit before income tax expense
|
|
|
19,049,580
|
|
|
|
17,422,689
|
|
|
|
9.34
|
|
|
Income tax expense
|
|
|
(5,487,208
|
)
|
|
|
(4,522,671
|
)
|
|
|
21.33
|
|
|
Net Profit
|
|
|
13,562,372
|
|
|
|
12,900,018
|
|
|
|
5.13
|
|
|
Attributable to:
|
|
|
|
|
|
|
|
|
|
|
|
|
|
-Equity holders of the Company
|
|
|
10,757,317
|
|
|
|
10,426,024
|
|
|
|
3.18
|
|
|
-Non-controlling interests
|
|
|
2,805,055
|
|
|
|
2,473,994
|
|
|
|
13.38
|
|
|
|
|
|
13,562,372
|
|
|
|
12,900,018
|
|
|
|
5.13
|
|
For the year ended December 31, 2014, the Company’s total power generation on a consolidated basis amounted to 304.869 billion kWh, of which, the domestic power generation of the Company amounted to 294.388 billion kWh, representing a decrease of 7.27% year-on-year. Total electricity sold by the Company’s power plants within China was 277.538 billion kWh, representing a decrease of 7.49% over the same period last year.
The main reasons for the decrease in the Company’s power output are as follows: firstly, China’s economic growth slowed in 2014 and power consumption growth nationwide declined correspondingly. Secondly, the commencement of operation of a number of ultra-high voltage west-to-east power transmission lines in China reduced the power market for thermal power generating units in the southeast coastal regions where a high proportion of thermal power generating units owned the Company are located. Thirdly, most of China experienced a sharp decrease of temperature during the summer in 2014 compared with the same period of 2013 and an increase in rainfall, thus resulting in a lower demand for electricity and a significant decline in power output compared with the higher number registered in 2013. Fourthly, the commencement of operation of many hydropower generating units in the southwest region as well as the abundant water supply in the same region contributed to a significant increase in hydro-power generations, which has reduced the market for thermal power generating units in Yunnan Province as well as Shanghai, Zhejiang, Jiangsu and Guangdong. Meanwhile, power output from thermal power generating
76
units in Liaoning and Fujian were affected by the commencement of operation of large nuclear generating units in these two provinces.
The power generation of the Company’s domestic power plants for the year ended December 31, 2014 is listed below (in billion kWh):
|
Domestic Power Plant
|
|
Power generation
in 2014
|
|
|
Power generation
in 2013
|
|
|
Change
|
||||
|
Liaoning Province
|
|
|
|
|
|
|
|
|
|
|||
|
Dalian
|
|
|
6.423
|
|
|
|
6.132
|
|
|
|
4.74
|
%
|
|
Dandong
|
|
|
3.197
|
|
|
|
3.115
|
|
|
|
2.64
|
%
|
|
Yingkou
|
|
|
7.980
|
|
|
|
7.321
|
|
|
|
9.00
|
%
|
|
Yingkou Co-generation
|
|
|
3.043
|
|
|
|
3.329
|
|
|
|
(8.58
|
)%
|
|
Wafangdian Wind Power
|
|
|
0.099
|
|
|
|
0.111
|
|
|
|
(11.21
|
)%
|
|
Suzihe Hydropower
|
|
|
0.040
|
|
|
|
0.027
|
|
|
|
48.51
|
%
|
|
Changtu Wind Power
|
|
|
0.127
|
|
|
|
0.093
|
|
|
|
37.04
|
%
|
|
Inner Mongolia Autonomous Region
|
|
|
|
|
|
|
|
|
|
|
|
|
|
Huade Wind Power
|
|
|
0.217
|
|
|
|
0.226
|
|
|
|
(4.14
|
)%
|
|
Hebei Province
|
|
|
|
|
|
|
|
|
|
|
|
|
|
Shang’an
|
|
|
12.836
|
|
|
|
13.633
|
|
|
|
(5.85
|
)%
|
|
Kangbao Wind Power
|
|
|
0.085
|
|
|
|
0.080
|
|
|
|
6.39
|
%
|
|
Gansu Province
|
|
|
|
|
|
|
|
|
|
|
|
|
|
Pingliang
|
|
|
9.129
|
|
|
|
10.144
|
|
|
|
(10.00
|
)%
|
|
Jiuquan Wind Power
|
|
|
0.838
|
|
|
|
0.887
|
|
|
|
(5.49
|
)%
|
|
Jiuquan II Wind Power
|
|
|
0.039
|
|
|
|
–
|
|
|
|
–
|
|
|
Beijing Municpality
|
|
|
|
|
|
|
|
|
|
|
|
|
|
Beijing Co-generation
|
|
|
4.456
|
|
|
|
4.686
|
|
|
|
(4.92
|
)%
|
|
Beijing Co-generation CCGT
|
|
|
4.051
|
|
|
|
3.980
|
|
|
|
1.79
|
%
|
|
Tianjin Municipality
|
|
|
|
|
|
|
|
|
|
|
|
|
|
Yangliuqing Co-genertion
|
|
|
6.572
|
|
|
|
6.851
|
|
|
|
(4.07
|
)%
|
|
Lingang CCGT Co-generation
|
|
|
0.126
|
|
|
|
–
|
|
|
|
–
|
|
|
Shanxi Province
|
|
|
|
|
|
|
|
|
|
|
|
|
|
Yushe
|
|
|
2.608
|
|
|
|
2.951
|
|
|
|
(11.62
|
)%
|
|
Zuoquan
|
|
|
5.999
|
|
|
|
6.682
|
|
|
|
(10.22
|
)%
|
|
Shandong Province
|
|
|
|
|
|
|
|
|
|
|
|
|
|
Dezhou
|
|
|
15.348
|
|
|
|
15.405
|
|
|
|
(0.37
|
)%
|
|
Jining
|
|
|
5.096
|
|
|
|
5.050
|
|
|
|
0.91
|
%
|
|
Xindian
|
|
|
3.303
|
|
|
|
3.254
|
|
|
|
1.49
|
%
|
|
Weihai
|
|
|
11.771
|
|
|
|
11.361
|
|
|
|
3.61
|
%
|
|
Rizhao Phase II
|
|
|
8.236
|
|
|
|
7.775
|
|
|
|
5.93
|
%
|
|
Zhanhua Co-generation
|
|
|
1.674
|
|
|
|
1.761
|
|
|
|
(4.93
|
)%
|
|
Henan Province
|
|
|
|
|
|
|
|
|
|
|
|
|
|
Qinbei
|
|
|
20.366
|
|
|
|
21.927
|
|
|
|
(7.12
|
)%
|
|
Jiangsu Province
|
|
|
|
|
|
|
|
|
|
|
|
|
|
Nantong
|
|
|
6.752
|
|
|
|
7.951
|
|
|
|
(15.08
|
)%
|
|
Nanjing
|
|
|
3.154
|
|
|
|
3.678
|
|
|
|
(14.24
|
)%
|
|
Taicang
|
|
|
11.174
|
|
|
|
11.445
|
|
|
|
(2.37
|
)%
|
|
Huaiyin
|
|
|
6.486
|
|
|
|
7.244
|
|
|
|
(10.47
|
)%
|
|
Jinling CCGT
|
|
|
1.895
|
|
|
|
2.400
|
|
|
|
(21.03
|
)%
|
|
Jinling Coal-fired
|
|
|
11.567
|
|
|
|
12.811
|
|
|
|
(9.71
|
)%
|
|
Jinling Co-generation
|
|
|
1.358
|
|
|
|
1.115
|
|
|
|
21.81
|
%
|
|
Rudong Wind Power
|
|
|
0.113
|
|
|
|
0.012
|
|
|
|
839.76
|
%
|
|
Qidong Wind Power
|
|
|
0.379
|
|
|
|
0.350
|
|
|
|
8.33
|
%
|
|
Shanghai Municipality
|
|
|
|
|
|
|
|
|
|
|
|
|
|
Shidongkou I
|
|
|
5.665
|
|
|
|
7.875
|
|
|
|
(28.06
|
)%
|
|
Shidongkou II
|
|
|
5.190
|
|
|
|
6.708
|
|
|
|
(22.63
|
)%
|
|
Shidongkou Power
|
|
|
6.018
|
|
|
|
7.603
|
|
|
|
(20.85
|
)%
|
|
Shanghai CCGT
|
|
|
2.097
|
|
|
|
1.974
|
|
|
|
6.23
|
%
|
|
Chongqing Municipality
|
|
|
|
|
|
|
|
|
|
|
|
|
|
Luohuang
|
|
|
10.862
|
|
|
|
14.278
|
|
|
|
(23.93
|
)%
|
|
Liangjiang CCGT
|
|
|
0.246
|
|
|
|
–
|
|
|
|
–
|
|
77
|
Domestic Power Plant
|
|
Power generation
in 2014
|
|
|
Power generation
in 2013
|
|
|
Change
|
||||
|
Zhejiang Province
|
|
|
|
|
|
|
|
|
|
|||
|
Yuhuan
|
|
|
21.771
|
|
|
|
24.819
|
|
|
|
(12.28
|
)%
|
|
Changxing
|
|
|
0.488
|
|
|
|
–
|
|
|
|
–
|
|
|
Tongxiang CCGT
|
|
|
0.171
|
|
|
|
–
|
|
|
|
–
|
|
|
Si’an Photovoltaic
|
|
|
0.000
|
|
|
|
–
|
|
|
|
–
|
|
|
Hunan Province
|
|
|
|
|
|
|
|
|
|
|
|
|
|
Yueyang
|
|
|
8.553
|
|
|
|
9.958
|
|
|
|
(14.10
|
)%
|
|
Xiangqi Hydropower
|
|
|
0.310
|
|
|
|
0.267
|
|
|
|
16.16
|
%
|
|
Subaoding Wind Power
|
|
|
0.020
|
|
|
|
–
|
|
|
|
–
|
|
|
Hubei Province
|
|
|
|
|
|
|
|
|
|
|
|
|
|
Enshi Maweigou Hydropower
|
|
|
0.042
|
|
|
|
0.045
|
|
|
|
(7.41
|
)%
|
|
Jiangxi Province
|
|
|
|
|
|
|
|
|
|
|
|
|
|
Jinggangshan
|
|
|
9.244
|
|
|
|
9.702
|
|
|
|
(4.72
|
)%
|
|
Jianggongling Wind Power
|
|
|
0.001
|
|
|
|
–
|
|
|
|
–
|
|
|
Fujian Province
|
|
|
|
|
|
|
|
|
|
|
|
|
|
Fuzhou
|
|
|
13.925
|
|
|
|
14.666
|
|
|
|
(5.05
|
)%
|
|
Guangdong Province
|
|
|
|
|
|
|
|
|
|
|
|
|
|
Shantou
|
|
|
5.200
|
|
|
|
5.614
|
|
|
|
(7.37
|
)%
|
|
Haimen
|
|
|
12.270
|
|
|
|
18.105
|
|
|
|
(32.20
|
)%
|
|
Haimen Power
|
|
|
6.152
|
|
|
|
–
|
|
|
|
–
|
|
|
Yunnan Province
|
|
|
|
|
|
|
|
|
|
|
|
|
|
Diandong Energy
|
|
|
5.953
|
|
|
|
7.527
|
|
|
|
(20.92
|
)%
|
|
Yuwang Energy
|
|
|
3.651
|
|
|
|
4.553
|
|
|
|
(19.82
|
)%
|
|
Fuyuan Wind Power
|
|
|
0.022
|
|
|
|
–
|
|
|
|
–
|
|
|
Total
|
|
|
294.388
|
|
|
|
317.481
|
|
|
|
(7.27
|
)%
|
In 2014, the power generated by Singapore operations accounted for 21.8% of the total power generated in Singapore, representing an increase of 1.2 percentage points from 2013.
In respect of the tariff, the Company’s average tariff of domestic power plants for the year ended December 31, 2014 was RMB454.95 per MWh, representing an increase of RMB0.57 per MWh from the year ended December 31, 2013. SinoSing Power’s average tariff for 2014 was RMB920.74 per MWh, representing a decrease by 7.42% from the same period last year.
In respect of fuel cost, the decrease of coal price and effective cost controls of the Company contributed to reduced fuel costs of the Company. Compared to last year, the unit fuel cost of power sold of the Company’s domestic power plants decreased by 7.96% to RMB201.19 per MWh.
Combining the foregoing factors, the operating revenue of the Company and its subsidiaries for the year ended December 31, 2014 remained generally the same as last year at approximately RMB125.407 billion, representing a decrease of 6.30% from RMB133.833 billion of last year. For the year ended December 31, 2014, the Company and its subsidiaries recorded a net profit attributable to equity holders of the Company of RMB10.757 billion, representing an increase of 3.18% from the profit of RMB10.426 billion for the year ended December 31, 2013.
For the year ended December 31, 2014, the profit attributable to equity holders of the Company from domestic power plants was RMB 10.629 billion, representing an increase of RMB 0.316 billion compared to RMB10.313 billion for the same period last year. The increase was primarily attributable to the combined effect of the decrease of coal market price and the decrease of power generation.
For the year ended December 31, 2014, the profit attributable to equity holders of the Company from Singapore operations was RMB 0.128 billion, increased by RMB 0.015 billion compared to the same period last year.
78
Operating revenue
Operating revenue mainly consists of revenue from power sold. For the year ended December 31, 2014, the consolidated operating revenue of the Company and its subsidiaries amounted to RMB125.407 billion, representing a decrease of 6.30% from RMB133.833 billion for the year ended December 31, 2013. The operating revenue from domestic operations of the Company decreased by RMB8.557 billion over the same period of last year, which is mainly because of reduced power generations. The operation of new generation capabilities contributed RMB1.655 billion to the consolidated revenue of the Company, while the operating revenue generated from existing generating units decreased by RMB10.212 billion.
The operating revenue of Singapore operations increased by RMB0.131 billion for the year ended December 31, 2014 from last year, which is mainly because of increased power output from operation of new generating units and increase of revenue generated from steam sales.
The following table sets forth the average tariff rate of the Company’s power plants, as well as percentage changes from 2013 to 2014.
|
|
|
Average tariff rate (VAT inclusive) (RMB/MWh)
|
||||||||||
|
Power Plant
|
|
2014
|
|
|
2013
|
|
|
Change
|
||||
|
Liaoning Province
|
|
|
|
|
|
|
|
|
|
|||
|
Dalian
|
|
|
394.50
|
|
|
|
407.89
|
|
|
|
(3.28)
|
%
|
|
Dandong
|
|
|
393.06
|
|
|
|
401.09
|
|
|
|
(2.00)
|
%
|
|
Yingkou
|
|
|
399.33
|
|
|
|
406.85
|
|
|
|
(1.85)
|
%
|
|
Yingkou Co-generation
|
|
|
399.21
|
|
|
|
396.96
|
|
|
|
0.57
|
%
|
|
Wafangdian Wind Power
|
|
|
609.68
|
|
|
|
632.85
|
|
|
|
(3.66)
|
%
|
|
Suzihe Hydropower
|
|
|
330.00
|
|
|
|
330.00
|
|
|
|
0.00
|
%
|
|
Changtu Wind Power
|
|
|
602.82
|
|
|
|
605.30
|
|
|
|
(0.41)
|
%
|
|
Inner Mongolia Autonomous Region
|
|
|
|
|
|
|
|
|
|
|
|
|
|
Huade Wind Power
|
|
|
520.00
|
|
|
|
520.00
|
|
|
|
0.00
|
%
|
|
Hebei Province
|
|
|
|
|
|
|
|
|
|
|
|
|
|
Shang’an
|
|
|
429.39
|
|
|
|
431.15
|
|
|
|
(0.41)
|
%
|
|
Kangbao Wind Power
|
|
|
538.84
|
|
|
|
534.47
|
|
|
|
0.82
|
%
|
|
Gansu Province
|
|
|
|
|
|
|
|
|
|
|
|
|
|
Pingliang
|
|
|
322.72
|
|
|
|
332.16
|
|
|
|
(2.84)
|
%
|
|
Jiuquan Wind Power
|
|
|
520.60
|
|
|
|
520.60
|
|
|
|
0.00
|
%
|
|
Jiuquan II Wind Power
|
|
|
540.00
|
|
|
|
—
|
|
|
|
—
|
|
|
Beijing Municipality
|
|
|
|
|
|
|
|
|
|
|
|
|
|
Beijing Co-generation
|
|
|
699.19
|
|
|
|
500.06
|
|
|
|
39.82
|
%
|
|
Tianjin Municipality
|
|
|
|
|
|
|
|
|
|
|
|
|
|
Yangliuqing Co-generation
|
|
|
434.28
|
|
|
|
438.73
|
|
|
|
(1.01)
|
%
|
|
Shanxi Province
|
|
|
|
|
|
|
|
|
|
|
|
|
|
Yushe
|
|
|
391.22
|
|
|
|
393.37
|
|
|
|
0.55
|
%
|
|
Zuoquan
|
|
|
382.01
|
|
|
|
389.83
|
|
|
|
(2.01)
|
%
|
|
Shandong Province
|
|
|
|
|
|
|
|
|
|
|
|
|
|
Dezhou
|
|
|
463.36
|
|
|
|
464.89
|
|
|
|
(0.33)
|
%
|
|
Jining
|
|
|
446.73
|
|
|
|
455.46
|
|
|
|
(1.92)
|
%
|
|
Xindian
|
|
|
448.55
|
|
|
|
453.35
|
|
|
|
(1.06)
|
%
|
|
Weihai
|
|
|
461.18
|
|
|
|
474.38
|
|
|
|
(2.78)
|
%
|
|
Rizhao Phase II
|
|
|
441.59
|
|
|
|
446.38
|
|
|
|
(1.07)
|
%
|
|
Zhanhua Co-generation
|
|
|
434.71
|
|
|
|
446.56
|
|
|
|
(2.65)
|
%
|
|
Henan Province
|
|
|
|
|
|
|
|
|
|
|
|
|
|
Qinbei
|
|
|
435.42
|
|
|
|
437.01
|
|
|
|
(0.36)
|
%
|
|
Jiangsu Province
|
|
|
|
|
|
|
|
|
|
|
|
|
|
Nantong
|
|
|
436.00
|
|
|
|
435.69
|
|
|
|
0.07
|
%
|
|
Nanjing
|
|
|
436.50
|
|
|
|
436.35
|
|
|
|
0.03
|
%
|
|
Taicang I
|
|
|
419.19
|
|
|
|
432.81
|
|
|
|
(3.15)
|
%
|
|
Taicang II
|
|
|
395.38
|
|
|
|
427.58
|
|
|
|
(7.53)
|
%
|
|
Huaiyin
|
|
|
443.04
|
|
|
|
449.87
|
|
|
|
(1.52)
|
%
|
|
Jinling Coal-fired
|
|
|
408.24
|
|
|
|
428.38
|
|
|
|
4.70
|
%
|
|
Jinling Combined-Circle
|
|
|
606.21
|
|
|
|
585.53
|
|
|
|
3.53
|
%
|
|
Jinling Combined-Cycle Cogeneration
|
|
|
690.00
|
|
|
|
635.42
|
|
|
|
8.59
|
%
|
|
Qidong Wind Power
|
|
|
555.92
|
|
|
|
541.34
|
|
|
|
2.69
|
%
|
|
Rudong Wind Power
|
|
|
610.00
|
|
|
|
610.00
|
|
|
|
0.00
|
%
|
79
|
|
|
Average tariff rate (VAT inclusive) (RMB/MWh)
|
||||||||||
|
Power Plant
|
|
2014
|
|
|
2013
|
|
|
Change
|
||||
|
Shanghai Municipality
|
|
|
|
|
|
|
|
|
|
|
|
|
|
Shidongkou I
|
|
|
438.21
|
|
|
|
453.27
|
|
|
|
3.32
|
%
|
|
Shidongkou II
|
|
|
437.54
|
|
|
|
442.00
|
|
|
|
(1.01)
|
%
|
|
Shanghai CCGT
|
|
|
866.20
|
|
|
|
820.92
|
|
|
|
5.52
|
%
|
|
Shidongkou Power
|
|
|
449.92
|
|
|
|
462.02
|
|
|
|
(2.62)
|
%
|
|
Chongqing Municipality
|
|
|
|
|
|
|
|
|
|
|
|
|
|
Luohuang
|
|
|
440.21
|
|
|
|
448.57
|
|
|
|
(1.86)
|
%
|
|
Zhejiang Province
|
|
|
|
|
|
|
|
|
|
|
|
|
|
Yuhuan
|
|
|
468.71
|
|
|
|
484.79
|
|
|
|
(3.32)
|
%
|
|
Changxing
|
|
|
431.03
|
|
|
|
—
|
|
|
|
—
|
|
|
Tongxiang Combined-cycle
|
|
|
1,298.37
|
|
|
|
—
|
|
|
|
—
|
|
|
Hunan Province
|
|
|
|
|
|
|
|
|
|
|
|
|
|
Yueyang
|
|
|
495.31
|
|
|
|
505.13
|
|
|
|
(1.94)
|
%
|
|
Xiangqi Hydropower
|
|
|
410.00
|
|
|
|
390.00
|
|
|
|
5.13
|
%
|
|
Subaoding Wind Power
|
|
|
494.00
|
|
|
|
—
|
|
|
|
—
|
|
|
Hubei Province
|
|
|
|
|
|
|
|
|
|
|
|
|
|
Enshi Maweigou Hydropower
|
|
|
366.59
|
|
|
|
356.96
|
|
|
|
2.70
|
%
|
|
Jiangxi Province
|
|
|
|
|
|
|
|
|
|
|
|
|
|
Jinggangshan
|
|
|
468.92
|
|
|
|
482.95
|
|
|
|
(2.91)
|
%
|
|
Jianggongling Wind Power
|
|
|
610.00
|
|
|
|
—
|
|
|
|
—
|
|
|
Fujian Province
|
|
|
|
|
|
|
|
|
|
|
|
|
|
Fuzhou
|
|
|
441.83
|
|
|
|
442.81
|
|
|
|
(0.22)
|
%
|
|
Guangdong Province
|
|
|
|
|
|
|
|
|
|
|
|
|
|
Shantou Coal-fired
|
|
|
529.99
|
|
|
|
541.39
|
|
|
|
(2.11)
|
%
|
|
Haimen
|
|
|
503.18
|
|
|
|
514.30
|
|
|
|
(2.16)
|
%
|
|
Haimen Power
|
|
|
479.55
|
|
|
|
—
|
|
|
|
—
|
|
|
Yunnan Province
|
|
|
|
|
|
|
|
|
|
|
|
|
|
Diandong Energy
|
|
|
401.59
|
|
|
|
371.30
|
|
|
|
8.16
|
%
|
|
Yuwang Energy
|
|
|
395.96
|
|
|
|
377.41
|
|
|
|
4.91
|
%
|
|
Fuyuan Wind Power
|
|
|
610.00
|
|
|
|
—
|
|
|
|
—
|
|
|
Domestic total
|
|
|
454.95
|
|
|
|
454.38
|
|
|
|
0.13
|
%
|
|
Singapore
|
|
|
|
|
|
|
|
|
|
|
|
|
|
SinoSing Power
|
|
|
920.74
|
|
|
|
994.54
|
|
|
|
(7.42)
|
%
|
|
Note 1:
|
The tariff of Shanghai Combined Cycle and Tongxiang Combined Cycle consists of on-grid settlement price and capacity subsidy income.
|
Tax and levies on operations
Tax and levies on operations mainly consists of taxes associated with value-added tax surcharges. According to relevant administrative regulations, these surcharges include City Construction Tax and Education Surcharges calculated at prescribed percentages on the amounts of the value-added tax paid. For the year ended December 31, 2014, the tax and levies on operations amounted to RMB0.932 billion, representing a decrease of RMB0.112 billion from RMB1.044 billion for the same period of last year. This is largely due to reduced surcharges resulting from less value added tax payment by the Company during the same period.
Operating expenses
For the year ended December 31, 2014, the total operating expenses of the Company and its subsidiaries was RMB99.200 billion, representing a decrease of 8.72% from the same period last year.
The operating costs and expenses in domestic power plants of the Company decreased by RMB9.659 billion, or 10.17%, from the same period last year, which was primarily attributable to the reduced market price of coal in the PRC.
The operating expenses of Singapore operations increased by RMB0.181 billion, or 1.32%, for the year ended December 31, 2014 from last year. This is mainly because of the commencement of new generating unit in 2014.
Fuel
80
Fuel cost represents the majority of the operating expense for the Company and its subsidiaries. For the year ended December 31, 2014, fuel cost of the Company and its subsidiaries decreased by 12.25% to RMB64.763 billion from RMB73.808 billion for the year ended December 31, 2013. The fuel costs of domestic power plants decreased by RMB9.384 billion from last year, which was primarily attributable to the lowered coal price in the domestic market.
For the year ended December 31, 2014, the average unit price (excluding tax) of fuel coal was RMB434.88 per ton, representing a decrease of 6.86% from RMB466.91 per ton for the year ended December 31, 2013. The fuel cost per unit of power sold by the Company’s domestic coal-fired power plant decreased by 7.96% from RMB218.59/MWh in 2013 to RMB201.19/MWh in 2014.
Fuel costs of Singapore operations was increased by RMB0.339 billion from last year, mainly due to increased fuel costs as a result of increased power generation in Singapore.
Maintenance
For the year ended December 31, 2014, the maintenance expenses of the Company and its subsidiaries amounted to RMB3.730 billion, representing a decrease of RMB0.127 billion from RMB3.857 billion for the year ended December 31, 2013. The maintenance expenses of domestic operations decreased by RMB0.128 billion. The maintenance expenses of Singapore operations increased by approximately RMB1 million.
Depreciation
For the year ended December 31, 2014, depreciation expenses of the Company and its subsidiaries increased by 3.13% to RMB11.647 billion from RMB11.294 billion for the year ended December 31, 2013. The depreciation expenses of the new generation units were RMB0.186 billion.
Labor
Labor costs consist of salaries to employees and contributions payable for employees’ housing fund, medical insurance, pension and unemployment insurance, as well as training costs and others. For the year ended December 31, 2014, the labor costs of the Company and its subsidiaries amounted to RMB6.260 billion, representing an 8.62% increase from RMB5.763 billion for the year ended December 31, 2013. This is mainly attributable to the operation of new generation units of the Company, increase of mandatory social insurance contribution, and the increase of employees’ performance-related salaries.
Other operating expenses (including purchase of electricity and service fees paid to HIPDC)
Other operating expenses include environmental protection expenses, land fee, insurance premiums, office expenses, amortization, Tuas Power’s purchase of electricity, assets impairment losses and non-operating expenses and net loss on disposals of property, plant and equipment. For the year ended December 31, 2014, other operating expenses (including purchase cost of electricity) of the Company and its subsidiaries was RMB12.800 billion, representing a decrease of RMB1.157 billion from RMB13.957 billion for the year ended December 31, 2013.
Other operating expenses from domestic operations of the Company decreased by RMB0.843 billion, due to a subsidy in its amount of RMB0.534 billion from the government, of which RMB0.462 billion was earmarked by Ministry of Finance for Tuas Power and TMUC, a decrease of RMB0.469 billion of asset disposal losses of certain subsidiaries largely due to technical renovations for energy saving and safe production, a decrease of RMB0.154 billion for pollution discharge fees and expenses for non-maintenance materials such as desulfurization. The combination of the aforementioned factors led to a decrease in operating expenses, nonwithstanding an increase of RMB0.055 billion from costs of entrusted power generation of certain subsidiaries. The impairment loss for the Company’s operation in China increased by RMB1.012 billion, mainly due to the impairment of goodwill arisen from the acquisition of Diandong Energy and Diandong Yuwang as well as the assets impairment of Yingkou port.
81
Other operating expenses of Singapore operations decreased by RMB0.314 billion. The assets impairment in the operations in Singapore decreased by RMB0.347 billion largely due to the provision of goodwill impairment last year.
Financial expenses
Financial expenses consist of interest expense, bank charges and net exchange differences.
Interest expense
For the year ended December 31, 2014, the interest expenses of the Company and its subsidiaries were RMB7.814 billion, representing an increase of 0.35% from RMB7.787 billion for the year ended December 31, 2013. The interest expenses from domestic operations increased by RMB0.049 billion.
Net exchange differences and bank charges
For the year ended December 31, 2014, the Company and its subsidiaries registered net losses of RMB9 million in exchange difference and bank charges, representing a net decrease of RMB103 million compared with the net gains of RMB94 million for the year ended December 31, 2013, mainly because of decrease of exchange gain resulting from weaken of exchange rate between Renminbi and U.S. dollar.
The operations in Singapore registered a net gains of RMB50 million from exchange difference and bank charge, representing an increase of RMB55 million from the net loss of RMB5 million in the last year, mainly due to the strengthen exchange rate between U.S. dollar and Singapore dollar.
Share of profit of associates and joint ventures
For the year ended December 31, 2014, the share of profit of associates and joint ventures was RMB1.316 billion, representing an increase of RMB0.701 billion from RMB0.615 billion from last year, mainly due to increased profit from associates and joint ventures.
Income tax expense
For the year ended December 31, 2014, the Company and its subsidiaries recorded an enterprise income tax expense of RMB5.487 billion, representing an increase of RMB0.964 billion from RMB4.523 billion for the year ended December 31, 2013. The enterprise income tax expense of domestic operations increased by RMB0.999 billion, which was primarily due to the increase of pre-tax profit. The income tax expense of Singapore operations decreased by approximately RMB35 million.
Net Profit, Profit attributable to the equity holders of the Company and non-controlling interests
For the year ended December 31, 2014, the Company and its subsidiaries achieved a net profit of RMB13.562 billion, representing an increase of RMB0.662 billion or 5.13% from RMB12.900 billion for the year ended December 31, 2013. For the year ended December 31, 2014, the profit attributable to equity holders of the Company was RMB10.757 billion, representing an increase of RMB0.331 billion from RMB0.426 billion for the year ended December 31, 2013.
The profit attributable to equity holders of the Company from domestic operations increased by RMB0.316 billion, which was mainly due to the effect of lowered coal market price, which helped to offset the impact of reduced power generation. The profit attributable to equity holders of the Company from Singapore operations was RMB0.128 billion, representing an increase of RMB0.015 million from the same period last year.
82
The profit attributable to non-controlling interests of the Company increased from RMB2.474 billion for the year ended December 31, 2013 to RMB2.805 billion for the year ended December 31, 2014. This was mainly attributable to the increased profit of the non-wholly owned subsidiaries of the Company.
|
C.
|
Financial position
|
Comparison of assets items
As of December 31, 2015, consolidated total assets of the Company and its subsidiaries were RMB308.866 billion, representing an increase of 12.24% from RMB275.172 billion as of December 31, 2014.
As of December 31, 2015, total assets of the domestic operations increased by RMB34.975 billion to RMB281.245 billion, including a net increase of RMB38.765 billion in non-current assets, which was mainly attributable to the consolidation of the Newly Acquired Entities and the capital expenditure on construction projects.
As of December 31, 2015, total assets of the operations in Singapore were RMB27.622 billion, representing a decrease of RMB1.280 billion from the same period last year. Non-current assets decreased by 3.16% to RMB23.606 billion, primarily attributable to depreciation of property, plant and equipment. Current assets decreased by 11.26% to RMB4.016 billion, mainly attributable to the decrease incash and cash equivalents and accounts receivable resulting from revenue decline.
Comparison of liability items
As of December 31, 2015, consolidated total liabilities of the Company and its subsidiaries were RMB207.173 billion, representing an increase of 8.82% from RMB190.389 billion as of December 31, 2014, of which RMB20.884 billion from the Newly Acquired Entities.
As of December 31, 2015, interest-bearing debts of the Company and its subsidiaries totaled RMB171.775 billion. The interest-bearing debts consist of long-term loans (including those maturing within a year), long-term bonds (including those maturing within a year), short-term loans, short-term bonds payable and finance leases payable. The interest-bearing debts denominated in foreign currencies other than functional currency amounted to RMB3.566 billion.
As of December 31, 2015, the total liabilities of the operations in Singapore were RMB15.853 billion, representing a decrease of 6.64% from RMB16.980 billion as of December 31, 2014, mainly attributable to the decrease in long-term loans.
Comparison of equity items
Excluding the impact of profit and profit appropriations, total equity attributable to equity shareholders of the Company increased as of December 31, 2015, including increase of RMB4.684 billion from new share issuance, increase of post-tax impact of RMB1.237 billion from reduced fair value of available-for-sale financial asset, decrease of RMB133 million n from foreign currency translation, and increase of RMB2.899 billion from non-controlling interests.
Major financial position ratios
|
|
|
2015
|
|
|
2014
|
|
||
|
Current ratio
|
|
|
0.27
|
|
|
|
0.36
|
|
|
Quick ratio
|
|
|
0.23
|
|
|
|
0.30
|
|
|
Ratio of liability to shareholders’ equity
|
|
|
2.46
|
|
|
|
2.71
|
|
|
Multiples of interest earned
|
|
|
3.55
|
|
|
|
3.21
|
|
|
|
|
|
|
|
|
|
|
|
|
Formula of the financial ratios:
|
|
|
|
|
|
|
|
|
|
Current ratio = balance of current assets as of the year end / balance of current liabilities as of the year end
|
|
|
|
|
|
|
|
|
|
Quick ratio = (balance of current assets as of the year end – net inventories as of the year end) / balance of current liabilities as of the year end
|
|
|
|
|
|
|
|
|
|
Ratio of liabilities to shareholders' equity = balance of liabilities as of the year end / balance of shareholders' equity (excluding non-controlling interests) as of the year end
|
|
|
|
|
|
|
|
|
|
Multiples of interest earned = (profit before tax + interest expense) / interest expenditure (inclusive of capitalized interest)
|
|
|
|
|
|
|
|
|
83
The current ratio and quick ratio remained at relatively low levels as of December 31, 2015 and 2014 decrease as of December 31, 2015 was mainly attributable to the increase of current liabilities especially short-term loan and long-term loan maturing with a year. The ratio of liabilities to shareholders’ equity at the end of 2015 decreased from the beginning of 2015 primarily due to the increased shareholders’ equity as a result of profit increase and issuance of new shares. The multiples of interest earned increased, primarily attributable to the increase of net profit for the year ended December 31, 2015.
|
D.
|
Liquidity and cash resources
|
The primary sources of funding for the Company and its subsidiaries have been cash provided by internal funds from operating activities, short-term and long-term loans and proceeds from issuances of bonds, and the primary use of funds have been for working capital, capital expenditure and repayments of short-term and long-term borrowings.
Cash flows from operating activities
|
|
|
For the Year Ended December 31,
|
|
|||||||||
|
|
|
2015
|
|
|
2014
|
|
|
2013
|
|
|||
|
|
|
RMB’000
|
|
|
RMB’000
|
|
|
RMB’000
|
|
|||
|
Cash flows from operating activities
|
|
|
|
|
|
|
|
|
|
|||
|
Profit before income tax expense
|
|
|
22,958,050
|
19,049,580
|
|
|
|
17,422,689
|
|
|||
|
Non-cash items adjustments
|
|
|
24,484,383
|
20,391,789
|
|
|
|
20,575,691
|
|
|||
|
Changes in working capital
|
|
|
1,013,467
|
(226,180
|
)
|
|
|
6,777,910
|
|
|||
|
Interest received
|
|
|
102,813
|
97,374
|
|
|
|
100,278
|
|
|||
|
Income tax expense paid
|
|
|
(6,196,005
|
) |
(5,992,496
|
)
|
|
|
(4,637,139
|
)
|
||
|
Net cash provided by operating activities
|
|
|
42,362,708
|
33,320,067
|
|
|
|
40,239,429
|
|
|||
For the year ended December 31, 2015, net cash provided by operating activities of the Company and its subsidiaries was RMB42.363 billion, of which RMB0.871 billion was provided by the operating activities in Singapore.
Cash flows used in investing activities
|
|
|
For the Year Ended December 31,
|
|
|||||||||
|
|
|
2015
|
|
|
2014
|
|
|
2013
|
|
|||
|
|
|
RMB’000
|
|
|
RMB’000
|
|
|
RMB’000
|
|
|||
|
Cash flows used in investing activities
|
|
|
|
|
|
|
|
|
|
|||
|
Payment for the purchase of property, plant and equipment
|
|
|
(24,191,285
|
) |
(19,858,216
|
)
|
|
|
(17,691,382
|
)
|
||
|
Proceeds from disposals of property, plant and equipment
|
|
|
109,013
|
70,712
|
|
|
|
166,459
|
|
|||
|
Prepayments of land use rights
|
|
|
(136,045
|
) |
(500,100
|
)
|
|
|
(5,947
|
)
|
||
|
Payment for the purchase of other non-current assets
|
|
|
(6,981
|
) |
(21,576
|
)
|
|
|
(32,601
|
)
|
||
|
Cash dividend received
|
|
|
937,189
|
565,334
|
|
|
|
408,166
|
|
|||
|
Payment for investment in associates and joint ventures
|
|
|
(889,780
|
) |
(266,877
|
)
|
|
|
(2,017,853
|
)
|
||
|
Cash paid for acquiring available-for-sale financial assets
|
|
|
-
|
-
|
|
|
|
(200,000
|
)
|
|||
|
Cash consideration paid for acquisitions of subsidiaries, net of cash acquired
|
|
|
(8,887,882)
|
(17,991
|
)
|
|
|
36,599
|
|
|||
|
Cash received from disposal of trading securities
|
|
|
-
|
-
|
|
|
|
102,784
|
|
|||
|
Cash received from disposal of a subsidiary
|
|
|
-
|
503,809
|
|
|
|
6,199
|
|
|||
|
Others
|
|
|
50,759
|
54,092
|
|
|
|
173,326
|
|
|||
|
Net cash used in investing activities
|
|
|
(33,015,012)
|
(19,470,813
|
)
|
|
|
(19,054,250
|
)
|
84
The net cash used in investing activities increased by RMB13.544 billion compared to the year ended December 31, 2014, mainly attributable to the consideration paid for the Newly Acquired Entities from business combination under common control.
Cash flows from financing activities
|
|
|
For the Year Ended December 31,
|
|
|||||||||
|
|
|
2015
|
|
|
2014
|
|
|
2013
|
|
|||
|
|
RMB’000
|
|
|
RMB’000
|
|
|
RMB’000
|
|
||||
|
Cash flows from financing activities
|
|
|
|
|
|
|
|
|
|
|||
|
Issuance of short-term bonds
|
|
|
18,980,000
|
17,971,000
|
|
|
|
24,950,000
|
|
|||
|
Repayments of short-term bonds
|
|
|
(18,000,000)
|
(15,000,000
|
)
|
|
|
(45,000,000
|
)
|
|||
|
Proceeds from short-term loans
|
|
|
67,298,044
|
61,503,204
|
|
|
|
41,314,000
|
|
|||
|
Repayments of short-term loans
|
|
|
(62,600,955)
|
(55,896,200
|
)
|
|
|
(30,869,290
|
)
|
|||
|
Proceeds from long-term loans
|
|
|
9,943,689
|
9,647,090
|
|
|
|
5,091,175
|
|
|||
|
Repayments of long-term loans
|
|
|
(12,799,719)
|
(17,522,953
|
)
|
|
|
(12,889,078
|
)
|
|||
|
Issuance of long-term bonds
|
|
|
-
|
3,988,000
|
|
|
|
6,485,000
|
|
|||
|
Repayment of long-term bonds
|
|
|
(5,000,000)
|
(5,700,000
|
)
|
|
|
-
|
|
|||
|
Interest paid
|
|
|
(8,677,316)
|
(8,097,216
|
)
|
|
|
(8,290,433
|
)
|
|||
|
Net proceeds from the issuance of new H shares
|
|
|
4,684,314
|
2,453,986
|
|
|
|
-
|
|
|||
|
Net capital injection from non-controlling interests of the subsidiaries
|
|
|
623,107
|
606,719
|
|
|
|
868,225
|
|
|||
|
Government grants
|
|
|
322,011
|
188,406
|
|
|
|
274,472
|
|
|||
|
Dividends paid to shareholders of the Company
|
|
|
(5,535,655)
|
(5,341,046
|
)
|
|
|
(2,951,631
|
)
|
|||
|
Dividends paid to non-controlling interests of the subsidiaries
|
|
|
(2,954,194)
|
(1,474,329
|
)
|
|
|
(539,876
|
)
|
|||
|
Proceeds from sales leaseback classified as finance lease
|
|
|
100,000
|
1,500,000
|
|
|
|
-
|
|
|||
|
Repayment of state-owned fund received from China Huaneng Group in prior years
|
|
|
-
|
-
|
|
|
|
(640,485
|
)
|
|||
|
Cash received from disposal of non-controlling interests of a subsidiary
|
|
|
-
|
384,702
|
|
|
|
-
|
|
|||
|
Others
|
|
|
(523,985)
|
(105,543
|
)
|
|
|
(42,167
|
)
|
|||
|
Net cash used in financing activities
|
|
|
(14,140,659)
|
(10,894,180
|
)
|
|
|
(22,240,088
|
)
|
|||
Net cash used in financing activities increased by RMB3.246 billion, mainly attributable to repayment of loans and bonds using the increased amount of cash inflow from operating activities. The Company expects to continue its focus on construction projects with large investment amount in 2016.
Net cash outflow used in financing activities in 2014 amounted to RMB10.894 billion, which was largely attributable to repayment of short-term and long-term borrowings.
Net cash outflow used in financing activities in 2013 amounted to RMB22.240 billion, which was primarily attributable to the decreased drawdown of loans, accelerated repayment of its borrowings and increased dividends payment of the Company in 2013, as a result of the increase in cash provided by operating activities.
85
Cash and cash equivalents
|
|
|
For the Year Ended December 31,
|
|
|||||||||
|
|
|
2015
|
|
|
2014
|
|
|
2013
|
|
|||
|
|
|
RMB’000
|
|
|
RMB’000
|
|
|
RMB’000
|
|
|||
|
Effect of exchange rate
|
|
|
32,846
|
(58,379
|
)
|
|
|
(108,806
|
)
|
|||
|
Net increase / (decrease) in cash and cash equivalents
|
|
|
(4,760,117
|
) |
2,896,695
|
|
|
|
(1,163,715
|
)
|
||
|
Cash and cash equivalents, beginning of the year
|
|
|
12,238,367
|
9,341,672
|
|
|
|
10,505,387
|
|
|||
|
Cash and cash equivalents as of the end of the year
|
|
|
7,478,250
|
12,238,367
|
|
|
|
9,341,672
|
|
|||
As of December 31, 2015, the cash and cash equivalents of the Company and its subsidiaries denominated in Renminbi, Singapore dollar and U.S. dollar were RMB5.788 billion, RMB1.130 billion and RMB0.560 billion, respectively.
As of December 31, 2014, the cash and cash equivalents of the Company and its subsidiaries denominated in Renminbi, HK dollar, Singapore dollar and U.S. dollar were RMB7.976 billion, RMB2.445 billion, RMB1.064 billion and RMB0.753 billion, respectively.
As of December 31, 2013, the cash and cash equivalents of the Company and its subsidiaries denominated in Renminbi, Singapore dollar, U.S. dollar, and Japanese Yen were RMB7.689 billion, RMB1.110 billion, RMB0.543 billion and RMB0. 015 million, respectively.
Capital expenditure and cash resources
Capital expenditures on acquisition activities
In October 2014, the Company signed agreements to acquire 91.8%, 75%, 53.45%, 97% and 100% of the equity interests of Hainan Power, Wuhan Power, Suzhou Thermal Power, Dalongtan Hydropower, and Hualiangting Hydropower, which were owned by Huaneng Group; and acquire 60%, 100%, 100%, 100% and 100% of the equity interests of Chaohu Power, Ruijin Power, Anyuan Power, Jingmen Thermal Power and Yingcheng Thermal Power, which were owned by HIPDC. In accordance with the equity transfer agreements, the total consideration is RMB9.276 billion, after adjustment of the profits generated from the date of valuation to the acquisition date, the total consideration is RMB9.647 billion, which were settled in cash in 2015. The aforementioned acquired entities has been included in the Company’s consolidated financial statements from the date of acquisition.
Capital expenditures for infrastructure construction and renovation projects
The capital expenditures for the year ended December 31, 2015 were RMB24.334 billion, mainly for construction and renovation of projects, including RMB1.683 billion for Taiyuan Dongshan Combined Cycle project, RMB1.471 billion for Anyuan Power project, RMB1.170 billion for Mianchi Co-generation project, RMB1.004 billion for Luoyuan Power project, RMB950 million for Luoyang Co-generation project, RMB812 million for Nanjing Co-generation project, RMB706 million for Beijing Co-generation project, RMB672 million for Yingcheng Co-generation project, RMB644 million for Lingang Combined Cycle project, RMB617 million for Tongwei Wind Power project, RMB571 million for Jiuquan Wind Power II project, RMB538 million for Shang’an project, RMB483 million for Changxing project, RMB467 million for Subaoding Wind Power project, RMB452 million for Yuhuan project, RMB426 million for Diandong Energy project, RMB410 million for Xianrendao Co-generation project, RMB403 million for Guidong Wind Power project, RMB390 million for Liangjiang Combined Cycle project, and RMB337 million for Dezhou project. The capital expenditures of the Company’s operations in Singapore were RMB251 million. The expenditures on other projects were RMB9.877 billion.
The above capital expenditures were sourced mainly from internal capital, cash flows provided by operating activities, debt and equity financings.
The Company expects to have significant capital expenditures in the next few years. During the course, the Company will make active efforts to improve project planning process on a commercially viable basis. The Company will also actively develop newly planned projects to pave the way for its long-term growth. The Company expects to finance the above capital expenditures through internal funding, cash flows provided by operating activities, and debt and equity financing.
86
The cash requirements, usage plans and cash resources of the Company for the next year are as following:
|
Capital Expenditure Project
|
|
Capital expenditure Plan for 2016
(RMB100 million)
|
|
Cash resources arrangements
|
|
Financing costs and note on use
|
|
|
|
|
|
|
|
|
|
Thermal power projects
|
|
69.7
|
|
Including internal cash resources and bank loans
|
|
Within the floating range of benchmark lending interest rates of the PBOC
|
|
Hydropower projects
|
|
0.9
|
|
Including internal cash resources and bank loans
|
|
Within the floating range of benchmark lending interest rates of the PBOC
|
|
Wind power projects
|
|
68.2
|
|
Including internal cash resources and bank loans
|
|
Within the floating range of benchmark lending interest rates of the PBOC
|
|
Coal mining projects
|
|
8.9
|
|
Including internal cash resources and bank loans
|
|
Within the floating range of benchmark lending interest rates of the PBOC
|
|
Photovoltaic power projects
|
|
12.2
|
|
Including internal cash resources and bank loans
|
|
Within the floating range of benchmark lending interest rates of the PBOC
|
|
Others
|
|
11.1
|
|
Including internal cash resources and bank loans
|
|
Within the floating range of benchmark lending interest rates of the PBOC
|
|
Technology renovation
|
|
78.7
|
|
Including internal cash resources and bank loans
|
|
Within the floating range of benchmark lending interest rates of the PBOC
|
Cash resources and anticipated financing costs
The Company expects to finance its capital expenditure and acquisition costs primarily through internal capital, cash flow from operating activities, and debt and equity financing.
Good operating results and sound credit status provide the Company with strong financing capabilities. As of December 31, 2015, the undrawn available banking facilities available to the Company and its subsidiaries amount to approximately RMB235.7 billion, which are granted by Bank of China, Construction Bank of China and China Development Bank, etc.
The Company completed issuances of unsecured short-term bonds in two installments between April 10, 2015 and August 18, 2015, at a principal amount of RMB5 billion and RMB3 billion with nominal annual interest rates of 4.44% and 3.17%, respectively. Each of the bonds was denominated in RMB, issued at par value, and would mature in 366 days from issuance.
The Company completed issuances of unsecured super short-term notes in four installments on June 10, June 15, June 25, and July 7, 2015, at a principal amount of RMB2 billion, RMB2 billion, RMB2 billion and RMB5 billion and with nominal annual interest rates of 3.11%, 3.1%, 3.38% and 3.05%, respectively. All these series of notes were denominated in RMB, issued at par value, and would mature in 270 days from issuance.
As of December 31, 2015, short-term loans of the Company and its subsidiaries totaled RMB49.883 billion (2014: RMB43.529 billion). Loans from banks were charged at interest rates ranging from 3.19% to 5.60% per annum (2014: 4.00% to 6.00%). Short-term bonds payable by the Company and its subsidiaries totaled RMB19.348 billion (2014: RMB18.245 billion).
As of December 31, 2015, long-term loans of the Company and its subsidiaries totaled RMB78.379 billion (2014: RMB65.031 billion), including RMB denominated loans of RMB62.441 billion (2014: RMB48.413 billion), U.S. dollar denominated loans of approximately US$473 million (2014: US$542 million), Euro denominated loans of approximately €49 million (2014: €58 million), and Singaporean dollar denominated borrowings of S$2.697 billion (2014: S$2.774 billion). The U.S. dollar denominated loans charged at floating interest rate were US$473 million (2014: US$539 million), and all of the loans denominated in Singapore dollar were floating-rate
87
borrowings. For the year ended December 31, 2015, long-term bank loans of the Company and its subsidiaries had interest rates ranging from 0.75% to 6.55% per annum (2014: 0.81% to 6.55%).
The Company and its subsidiaries will closely monitor any change in the exchange rate and interest rate markets and cautiously assess the currency and interest rate risks.
Combining the current development of the power generation industry and the growth of the Company, the Company will make continuous efforts to not only meet cash requirements of daily operations, constructions and acquisitions, but also to establish an optimal capital structure to minimize the cost of capital and manage financial risks through effective financial management activities, thus maintaining sustainable and stable returns to the shareholders.
Other financing requirements
The objective of the Company is to bring long-term steadily growing returns to shareholders. In line with this objective, the Company follows a proactive, stable and balanced dividend policy. In accordance with the profit appropriation plan of the board of directors of the Company (subject to the approval of the shareholders at the annual general meeting), the Company expects to pay a cash dividend of RMB7.144 billion for 2015.
Maturity profile of loans
The following table sets forth the maturity profile of the Company’s borrowings as of December 31, 2015.
|
Maturity Profile
(RMB billion)
|
|
2016
|
|
|
2017
|
|
|
2018
|
|
|
2019
|
|
|
2020
|
|
|||||
|
|
|
|
|
|
|
|
|
|
|
|
|
|
|
|
|
|||||
|
Principal amount planned for repayment
|
|
|
92.735
|
|
|
|
15.390
|
|
|
|
13.203
|
|
|
|
13.221
|
6.407
|
|
|||
|
Interest amount planned for repayment
|
|
|
6.385
|
|
|
|
3.419
|
|
|
|
2.767
|
|
|
|
2.133
|
1.531
|
|
|||
|
Total
|
|
|
99.120
|
|
|
|
18.809
|
|
|
|
15.970
|
|
|
|
15.354
|
7.938
|
|
|||
_____________________________________
|
Note:
|
The amount of the principal to be repaid in 2016 is relatively large because of the maturity of short-term loans and short-term bonds.
|
|
E.
|
Trend information
|
The major trend of the electricity power market
It is predicted by China Electricity Council that, in 2016, total electricity consumption nationwide will grow by 1% to 2% and 2016 will see newly installed generating capacity of approximately 100 million KW, of which non-petrochemical energy capacity is 52 million kW, representing a higher percentage to around 36% of the total installed capacity; the full-aperture installed capacity nationwide is expected to reach 1.61 billion kW, an 6.5% increase compared to that of 2014, of which capacity for hydropower, nuclear power, wind power and solar power is 330 million kW, 34.5 million kW, 150 million kW and 57 million kW respectively.
In 2016, electricity supply and demand in China will generally be easing, with abundant surplus capacity in Northeast and Northwest region, balanced supply and demand in Northern region where several provinces are abundant, and broadly balanced supply in Central, Eastern, and Southern regions, where a number of provinces are abundant. Based on the mid-value of the growth rate of total electricity consumption ranging from 1% to 2%, in 2016 the annual power generation utilization hours are expected to be around 3,700 hours, and the utilization hours of thermal generating equipment are estimated to be 4,000 hours.
88
The trend of the fuel supply
2016 will likely see a slow growth in China’s economy and slow demand for electric power. The utilization hours of thermal power will further drop and the oversupply situation in coal industry will likely remain unchanged, and airfreight and railway capacity will likely remain loose. However, the coal market still has uncertainties: the government will set out to carry out “Supply Side” reform to reduce overcapacity and cut down “zombie enterprises” and such potential negative fluctuation in the coal supply will likely bring certain degree of risks to the fuel cost control.
The Company will closely monitor the changes in policies and coal market, enhance its cooperation with competitive major mines, continuously explore new sourcing channels, conduct bidding of existing commodities, perfect the imported coal business, strengthen the refining management of the fuel and strive to control fuel costs.
The trend of capital market and foreign exchange
The interest-bearing debts of the Company are mostly denominated in RMB. The interest rates applicable to RMB loan contracts will be determined and regularly adjusted based on the adjustment of benchmark lending interest rates published by the PBOC. The PBOC will continue to exercise a stable and elastic moderate currency policy, which will help reduce financing costs of the Company.
In the Singaporean capital market, the SOR interest rate will continue to rise as a result of increase of US dollar lending rates as well as depreciation of Singapore dollar, which is anticipated to increase the financing costs of Tuas Power.
We will closely watch the changes in domestic and overseas capital marketsand maintain its good reputation on the capital markets, make reasonable financing arrangements, explore new financing methods, and strive to control financing costs.
|
F.
|
Employee benefits
|
As of December 31, 2015, the Company and its subsidiaries had 42,039 employees within and outside the PRC. The Company and its subsidiaries provide employees with competitive remuneration and link such remuneration to operating results to provide incentives for the employees. Currently, the Company and its subsidiaries do not have any stock or option based incentive plan.
Based on the development plans of the Company and its subsidiaries and the requirements of individual positions, together with consideration of specific characteristics of individual employees, the Company and its subsidiaries tailored various training programs for their employees on management, technological and other skills. These programs enhanced the comprehensive skills of the employees.
All employees of the Company have entered into labor contracts with the Company. The Company’s standard contract includes description of the position, responsibilities, compensations and causes of termination. The terms of the labor contracts vary and they generally range from one to five years. The contracts are typically renewable upon expiration by mutual agreement of the Company and the relevant employee.
The Company is unionized, both at its head office and with respect to all power plants. Labor unions are intended to protect the rights of employees, while allowing the Company to achieve economic objectives. They encourage employees’ participation in the Company’s decision-making process, and serve as mediators in any dispute between the Company and its employees. The Company has experienced no occurrence of any strike or labor dispute which have impact upon the Company’s operations. The Company believes that the Company and its employees are in a good relationship.
Compensation of our employees consists of salaries, bonuses and allowances. Compensation is linked to performance of the Company as well as the individual employees. Our employees are also entitled to certain education, healthcare and other benefits and allowances provided by the Company.
89
The Company maintains social security schemes for its employees pursuant to government regulations. These social security benefits are subject to changes in the relevant law and policy.
Based on the development plans of the Company and its subsidiaries and the requirements of individual positions, together with the consideration of specific characteristics of individual employees, the Company and its subsidiaries tailored various training programs for their employees on management skills, technical skills and marketing skills. These programs have enhanced both the knowledge and operational skills of the employees.
|
G.
|
Guarantees for loans and restricted assets
|
As of December 31, 2015, the Company provided guarantees of approximately RMB12.366 billion for the long-term bank borrowings of Tuas Power.
As of December 31, 2015, the details of secured loans of the Company and its subsidiaries were as follows:
|
|
(1)
|
As of December 31, 2015, short-term loans of RMB307 million represented the notes receivable that were discounted with recourse. As these notes receivable had not yet matured, the proceeds received were recorded as short-term loans.
|
|
|
(2)
|
As of December 31, 2015, a long-term loan of approximately RMB18 million of a subsidiary of the Company was secured by territorial water use right with net book value of RMB78.38 million.
|
|
|
(3)
|
As of December 31, 2015, a long-term loan of RMB67 million of a subsidiary of the Company was secured by certain property, plant and equipment with net book value of RMB150 million.
|
|
|
(4)
|
As of December 31, 2015, the long-term loans of approximately RMB9.558 billion were secured by future electricity revenue of the Company and its subsidiaries.
|
|
|
(5)
|
As of December 31, 2015, the restricted bank deposits of the Company and its subsidiaries were RMB60 million.
|
|
|
(6)
|
As of 31 December 2015, notes payable of RMB13.70 million were secured by bank acceptance notes receivable of the Company and its subsidiaries with net book value amounted to RMB13.70 million.
|
|
H.
|
Off-balance sheet arrangements
|
As of December 31, 2015, there were no off-balance sheet arrangements which have or are reasonably likely to have an effect on our financial condition, changes in financial condition, revenues or expenses, results of operations, liquidity, capital expenditures or capital resources that are material to investors.
|
I.
|
Performance of significant investments and their prospects
|
The Company acquired a 25% equity interest in Shenzhen Energy Group for RMB2.39 billion on April 22, 2003. In 2011, Shenzhen Energy Group divided into a remainder company Shenzhen Energy Group and a new company Shenzhen Energy Management Company, and the Company holds 25% equity interests in each of the two successors. The Company acquired 200 million shares from Shenzhen Energy Corporation (“Shenzhen Energy”), a subsidiary of Shenzhen Energy Group, in December 2007. Shenzhen Energy allotted shares with its capital surplus in 2011. In February 2013, Shenzhen Energy merged Shenzhen Energy Management Corporation through the
90
combination of a directional seasoned offering and cash payment to the shareholders of Shenzhen Energy Management Corporation, Shenzhen State-owned Assets Administration Commission and the Company. After the merger, the Company directly held 661 million shares of Shenzhen Energy, representing 25.02% of its equity interests. In 2015, Shenzhen Energy distributed 5 shares of stock dividend out of every 10 shares to its shareholders, therefore the Company held 992 million shares of Shenzhen Energy. These investments brought a profit of RMB426 million for the Company for the year ended December 31, 2015 under IFRS. This investment is expected to provide steady returns to the Company.
The Company held directly 60% equity interest in Sichuan Hydropower as of December 31, 2006. In January 2007, Huaneng Group increased its capital investment in Sichuan Hydropower by RMB615 million, thus reducing the Company’s equity interest in Sichuan Hydropower to 49% and making Huaneng Group the controlling shareholder of Sichuan Hydropower. This investment brought a profit of RMB151 million for the year ended December 31, 2015 under IFRS. This investment is expected to provide steady returns to the Company.
|
J.
|
Tabular disclosure of contractual obligations and commercial commitments
|
A summary of payments due by period of our contractual obligations and commercial commitments as of December 31, 2015 is shown in the tables below. A more complete description of these obligations and commitments is included in the Notes to Financial Statements as referenced below.
|
Contractual Cash Obligations
(RMB in millions)
|
|
2016
|
|
|
|
2017-2018
|
|
|
|
2019-2020
|
|
|
Thereafter
|
|
|
Total
|
|
|||
|
|
|
|
|
|
|
|
|
|
|
|
|
|
|
|
|
|
|
|||
|
Long-term loans from Huangeng Group and its subsidiaries(1)
|
|
|
2,437
|
|
|
|
130
|
|
|
|
4
|
|
|
|
125
|
|
|
|
2,696
|
|
|
Long-term bank loans and other loans(1)
|
|
|
9,914
|
|
|
|
21,163
|
|
|
|
15,624
|
|
|
|
28,982
|
|
|
|
75,683
|
|
|
Long-term bonds(2)
|
|
|
11,500
|
|
|
|
7,300
|
|
|
|
4,000
|
|
|
|
-
|
|
|
|
22,800
|
|
|
Interest payments
|
|
|
3,355
|
|
|
|
5,119
|
|
|
|
3,449
|
|
|
|
4,317
|
|
|
|
16,240
|
|
|
Operating Lease – Head Offce(3)
|
|
|
117
|
|
|
|
29
|
|
|
|
-
|
|
|
|
-
|
|
|
|
146
|
|
|
Operating Lease – Huabei Branch(3)
|
|
|
6
|
|
|
|
13
|
|
|
|
-
|
|
|
|
-
|
|
|
|
19
|
|
|
Operating Lease – Nanjing Power Plant(3)
|
|
|
2
|
|
|
|
4
|
|
|
|
4
|
|
|
|
63
|
|
|
|
73
|
|
|
Operating Lease – Liaoning Branch(3)
|
|
|
1
|
|
|
|
-
|
|
|
|
-
|
|
|
|
-
|
|
|
|
1
|
|
|
Operating Lease – Hebei Branch(3)
|
|
|
1
|
|
|
|
1
|
|
|
|
-
|
|
|
|
-
|
|
|
|
2
|
|
|
Operating Lease – Liaoning Wind Power Branch(3)
|
|
|
1
|
|
|
|
-
|
|
|
|
-
|
|
|
|
-
|
|
|
|
1
|
|
|
Operating Lease – Dezhou Power Plant(3)
|
|
|
34
|
|
|
|
68
|
|
|
|
68
|
|
|
|
112
|
|
|
|
282
|
|
| Operating Lease – Xingang Heating Co., Ltd.(3) | 24 | - | - | - | 24 | |||||||||||||||
| Operating Lease – Hualu Sea Transportation Ltd.(3) | 16 | - | - | - | 16 | |||||||||||||||
|
Operating Lease – Tuas Power Generation Pte Ltd.(3)
|
|
|
26
|
|
|
|
50
|
|
|
|
50
|
|
|
|
887
|
|
|
|
1,013
|
|
|
|
|
|
27,434
|
|
|
|
33,877
|
|
|
|
23,199
|
|
|
|
34,486
|
|
|
|
118,996
|
|
|
Other commercial commitments
|
|
|
|
|
|
|
|
|
|
|
|
|
|
|
|
|
|
|
|
|
|
(RMB in millions)
|
|
|
2016
|
|
|
|
2017-2018
|
|
|
|
2019-2020
|
|
|
Thereafter
|
|
|
Total
|
|
||
|
Long – term gas purchase contract(4)
|
|
|
7,649
|
|
|
|
15,380
|
|
|
|
15,390
|
|
|
|
61,543
|
|
|
|
99,962
|
|
|
Other commitments(3)
|
|
|
20,388
|
|
|
|
-
|
|
|
|
-
|
|
|
|
-
|
|
|
|
20,388
|
|
|
|
|
|
28,037
|
|
|
|
15,380
|
|
|
|
15,390
|
|
|
|
61,543
|
|
|
|
120,350
|
|
___________________________________________
Notes:
|
(1)
|
See Note 23 to the Financial Statements, “Long-term Loans”.
|
|
(2)
|
See Note 24 to the Financial Statements, “Long-term Bonds”.
|
91
|
(3)
|
See Note 38 to the Financial Statements, “Commitments”.
|
|
(4)
|
The numbers shown in the table above were calculated based on the minimum purchases stipulated in the long-term gas contracts disclosed in Note 38 to the Financial Statements.
|
The Company and its subsidiaries have various defined contribution plans in accordance with the local conditions and practices in the provinces in which they operate. The Company and its subsidiaries pay fixed contributions into separate entities (funds) and will have no further payment obligations if the funds do not hold sufficient assets to pay all employee benefits relating to employee service in the current and prior periods.
Disclosures of the pension plans, including the contribution amounts, are included in Note 36 to the Financial Statements.
|
K.
|
Impairment sensitivity analysis
|
Goodwill impairment
The Company and its subsidiaries conducts impairment test on each individually goodwill at the end of each year. In 2015, due to continuous operating loss of the power plant assets as a result of oversupply of local power market and intense competition which led to lower utilization hours and tariff, and the effect of deteriorating coal market price on the coal assets under construction, the goodwill arising from the acquisition of Diandong Energy was fully impaired based on the impairment testing result. The above mentioned goodwill impairment provided in 2015 approximately amounted to RMB1.106 billion in total.
For goodwill allocated to CGUs in the PRC, changes of assumptions in tariff and fuel price could have affected the results of goodwill impairment assessment. As of December 31, 2015, if tariff had decreased by 1% or 5% from management’s estimates with other variables constant with the expectations, the Company and its subsidiaries would have to further recognize impairment against goodwill by approximately RMB14 million and RMB180 million, respectively. If fuel price had increased by 1% or 5% from the management’s estimates with other variables constant with the expectations, the Company and its subsidiaries would have to further recognize impairment against goodwill by approximately RMB11 million and approximately RMB59 million, respectively.
Impairment of property, plant and equipment and mining rights
The Company and its subsidiaries test its property, plant and equipment and mining rights suffered any impairment whenever any impairment indication exists.
In 2015, impairment losses for certain property, plant and equipment and mining rights of approximately RMB1.808 billion have been recognized. Factors leading to the impairment of operating projects primarily included lower utilization hours and tariff of two coal-fired power plants as a result of oversupply of electricity in two provinces, as well as low utilization hours of a hydropower plant as a result of the low level of water inflow to the main dam. And as a result of the low demand of coal-fired power in local market, the management estimated the possibility of further development of a coalfired power project was remote, therefore the project under construction was fully impaired.
Changes of assumptions in tariff and fuel price will affect the result of property, plant and equipment and mining rights impairment assessment. For power plants assets that are subject to impairment testing, as at December 31, 2015, if tariff had decreased by 1% or 5% from management’s estimates with other variables constant with the expectations, the Company and its subsidiaries would have to further recognize impairment against property, plant and equipment by approximately RMB224 million and RMB1,566 million, respectively. If fuel price had increased by 1% or 5% from the management’s estimates with other variables constant with the expectations, the impairment against property, plant and equipment and mining rights of the Company and its subsidiaries would decrease totalling by approximately RMB112 million and RMB54 million, respectively.
92
|
L.
|
Prospects for 2016
|
In 2016, the Company will further enhance its market awareness, reformation awareness, innovation awareness and risk awareness. Under the guidance of China’s “Thirteenth Five-Year Plan”, we will attach more emphasis on market competition, green development and standardized management, in an effort to constantly improve the profitability, competitiveness and sustainable development of the Company.
With respect to the power market, the Company will further serve the market by increasing revenue and enhancing efficiency, actively taking part in market competition and participating in the development of the electricity market. With an aim to increase our market share and efficiency, we will strive for a leading position in the region in terms of utilization hours benchmarking. We will strive to achieve power generation of 315 billion kWh and 3,950 utilization hours in China for the year 2016. With respect to the fuel market, the Company will adhere to the principle of market-oriented development, improve the refined management of fuel, and further reduce fuel cost. With respect to the capital market, the Company will actively respond to changes in the financial market, expand financing channels, develop financial products, strengthen internal control over capital and improve capital usage efficiency, and maintain the Company’s leading position in the industry in terms of financing cost. With respect to innovative development, the Company will further facilitate its transformation by pushing forward technological innovation and institutional innovation.
|
ITEM 6
|
Directors, Senior Management and Employees
|
|
A.
|
Directors, members of the supervisory committee and senior management
|
Directors
The table below sets forth certain information concerning our directors as of March 31, 2016. The current term for all of our directors is three years, which will expire in 2017.
|
Name
|
|
Age
|
|
Position with us
|
|
Cao Peixi
|
|
60
|
|
Chairman of the Board of Directors
|
|
Guo Junming
|
|
50
|
|
Vice Chairman of the Board of Directors
|
|
Liu Guoyue
|
|
52
|
|
Executive Director, President
|
|
Li Shiqi
|
|
59
|
|
Director
|
|
Huang Jian
|
|
53
|
|
Director
|
|
Fan Xiaxia
|
|
53
|
|
Executive Director, Vice President
|
|
Mi Dabin
|
|
47
|
|
Director
|
|
Guo Hongbo
|
|
47
|
|
Director
|
|
Zhu Yousheng
|
|
50
|
|
Director
|
|
Li Song
|
|
58
|
|
Director
|
|
Li Zhensheng
|
|
71
|
|
Independent Director
|
|
Zhang Shouwen
|
|
49
|
|
Independent Director
|
|
Yue Heng
|
41
|
Independent Director
|
||
|
Geng Jianxin
|
|
61
|
|
Independent Director
|
|
Xia Qing
|
|
58
|
|
Independent Director
|
CAO Peixi, aged 60, is the Chairman of the Company. He is also the President of Huaneng Group and the Chairman of HIPDC and Huaneng Renewables Corporation Limited. He graduated from Shandong University, majoring in electrical engineering. He holds a postgraduate degree of master in engineering awarded by the Party School of the Central Committee, and is a researcher-grade senior engineer.
GUO Junming, aged 50, is the Vice Chairman of the Company, the Chief Accountant of Huaneng Group and a Director of HIPDC. He was the Chief Accountant of Huaneng Group and the Chairman of the Supervisory Committee of the Company. He graduated from Shanxi Finance and Economic Institute, majoring in business finance and accounting, and holds a bachelor’s degree. He is a senior accountant.
93
LIU Guoyue, aged 52, is an Executive Director and the President of the Company, the Vice President of Huaneng Group, an Executive Director of Huaneng International Power Fuel Limited Liability Company, the Chairman of Shanghai Times Shipping Limited Company, a Director of SinoSing Power Pte. Ltd., and the chairman of Tuas Power Ltd., Tuas Power Supply Pte Ltd. and Tuas Power Utilities Pte Ltd.. He graduated from North China Electric Power University, majoring in thermal engineering. He holds a Doctor’s degree in engineering. He is a senior engineer.
LI Shiqi, aged 59, is a Director of the Company, a Director and the President of HIPDC., and the Director of the Business Development Department of Huaneng Group. He was the Chairman of Huaneng Carbon Assets Management Company Limited. Mr. Li graduated from Renmin University of China, majoring in finance, and holds a diploma degree. He is a senior accountant.
HUANG Jian, aged 53, is a Director of the Company, an assistant to the President of Huaneng Group, a Director of Huaneng Capital Services Co., Ltd. and the Chairman of the Supervisory Committee of Huaneng Renewables Corporation Limited. Mr. Huang graduated from the Department of Accounting of Institute of Fiscal Science of the Ministry of Finance with a postgraduate degree of master in economics. He is a senior accountant.
FAN Xiaxia, aged 53, is an Executive Director and the Vice President of the Company. He graduated from the Economic Management School of Tsinghua University with an EMBA degree. He is a senior engineer.
MI Dabin, aged 47, is a Director of the Company, the Vice President of Hebei Construction & Investment Group Co., Ltd. and the Chairman of Hebei Construction & Energy Investment Co., Ltd.. He was the Chief Engineer, Vice President and President of Qinhuangdao Power Generation Co., Ltd., the President of Qinhuangdao Thermal Power Generation Co., Ltd., an assistant to the President and the Head of Production and Operation Department of Hebei Construction & Investment Group Co., Ltd., the President of Qinhuangdao Power Generation Co., Ltd. and Qinhuangdao Thermal Power Generation Co., Ltd.. He graduated from North China Electric Power University, majoring in power engineering, and holds a master’s degree. He is a senior engineer.
GUO Hongbo, aged 47, is a Director of the Company and the Chairman of Liaoning Energy Investment (Group) Limited Liability Company. He was the assistant to the president, vice president, executive vice president, a director, the president and vice chairman of Liaoning Energy Investment (Group) Limited Liability Company. Mr. Guo graduated from Jilin University with a master’s degree in administrative management, and holds an MBA degree from Macau University of Science and Technology. He is a professor-grade senior engineer.
ZHU Yousheng, aged 50, is a Director of the Company and Vice President of Jiangsu Province Investment Management Limited Liability Company. He was the project manager of Jiangsu Province Investment Management Limited Liability Company, Vice President of Xutang Power Limited Liability Company and the Vice President of the Production Safety Department and President of Jiangsu Province Investment Management Limited Liability Company. He graduated from Nanjing University of Aeronautics and Astronautics specializing in power engineering, and is a master degree postgraduate, researcher-grade senior engineer.
LI Song, aged 58, is a Director of the Company, the Vice President of Fujian Investment and Development Group Co., Ltd., Vice Chairman of CNOOC Fujian Natural Gas Co. Ltd., Vice Chairman of CNOOC Fujian Gas Power Generation Co. Ltd. and CNOOC Fujian Zhangzhou Natural Gas Company Limited and a Director of Fujian Futou Renewable Energy Co., Ltd. She graduated from Xiamen Jimei Finance and Commerce College majoring in Finance, Open College of Party School of the Central Committee majoring in Economic Management, and holds a bachelor’s degree from Party School of the Central Committee. She is an accountant.
LI Zhensheng, aged 71, is an Independent Director of the Company and TGOOD Electric Co., Ltd. He was the Head of Shanxi Electric Power and Industrial Bureau, the Chief of Rural Power Department of State Power
94
Corporation, the Chief Economist and Consultant of State Grid Corporation. Mr. Li graduated from Hebei University of Technology with a bachelor’s degree. He is also a professor-grade senior engineer.
ZHANG Shouwen, aged 49, is an Independent Director of the Company and a Professor and Doctoral Mentor in the Law School of Peking University, the Director of Economic Law Institute of Peking University, the Vice President and Secretary General of the Economic Law Research Society of China Law Society, an Independent Director of Guoxin Securities Co., Ltd. and an Independent Director of Minmetals Development Co., Ltd.. He was a lecturer and Associate Professor of the Law School of Peking University. He graduated from the Law School of Peking University with a PhD in Laws.
YUE Heng, aged 41, is an Independent Director of the Company, a Professor, Dean and Doctorate Mentor of Accounting Department of Guanghua Management School of Peking University, and an Independent Director of Sinopharm, Jingjin Filter Press Group Limited and Beijing United Media Information Technology Co., Ltd. He is the winner of the first session of China National Funds for Distinguished Young Scientists, the winner of New Century Excellent Talents of the Ministry of Education 2012, the leading accounting talent of Ministry of Finance, the Councilor of Accounting Society of China and the Deputy Editor-in-Chief of CJAS magazine of Accounting Society of China. He was the Assistant Professor, Associate Professor and Professor of Accounting Department of Guanghua Management School of Peking University. He graduated from Tulane University in the United States with a doctor’s degree in accounting.
GENG Jianxin, aged 61, is an Independent Director of the Company, a Professor and Doctorate Mentor of Renmin University of China, an Independent Director of Shenzhen Tat Fook Technology Co., Ltd. and Beijing Shouhang Resources Saving Co., Ltd.. He was an assistant accountant of the Geophysical Exploration Company of the Ministry of Metallurgical Industry and associate professor of Hebei University of Economics and Business. He graduated from the Renmin University of China specializing in accounting and holds a doctor’s degree
XIA Qing, aged 58, an Independent Director of the Company, a professor and chairman of the Academic Degrees Committee of the Electrical Engineering Department of Tsinghua University and an Independent Director of Tellhow Sci-Tech Co. Ltd. He was an Independent Director of Datang International Power Generation Co., Ltd. and Yunnan Wenshan Electric Power Co., Ltd.. He graduated from Tsinghua University specializing in electric power system and automation and holds a doctor’s degree.
Supervisors
The table below sets forth certain information concerning our supervisors as of March 31, 2016. The current term for all of our supervisors is three years, which will expire in 2017.
|
Name
|
|
Age
|
|
Position with us
|
|
Ye Xiangdong
|
|
48
|
|
Chairman of the Board of Supervisors
|
|
Mu Xuan
|
|
40
|
|
Vice Chairman of the Board of Supervisors
|
|
Zhang Mengjiao
|
|
51
|
|
Supervisor
|
|
Gu Jianguo
|
|
49
|
|
Supervisor
|
|
Wang Zhaobin
|
|
60
|
|
Supervisor
|
|
Zhang Ling
|
|
55
|
|
Supervisor
|
YE Xiangdong, aged 48, is the Chairman of the Board of Supervisors of the Company, the Vice President of Huaneng Group, a Director of HIPDC, the Executive Director of Huaneng Coal Mining Corporation Company and the Chairman of Xi'an Thermal Power Research Institute Co., Ltd.. He was the Executive Director and President of Huaneng Hulunbeier Energy Development Company Ltd. and the Chief Engineer of Huaneng Group. He graduated from Chongqing University, majoring in thermal energy, and holds a master’s degree in Engineering. He is a senior engineer.
MU Xuan, aged 40, is the Vice Chairman of the Board of Supervisors of the Company and the Vice President of Dalian Construction Investment Group Co., Ltd. He was the Officer of Finance Department, the Deputy Head and
95
Head of Budget and Finance Department of Dalian Construction Investment Co., Ltd., the Vice President of Dalian Changxing Island Development and Construction Investment Co., Ltd., the Assistant to the President of Dalian Construction Investment Group Co., Ltd. He graduated from Dongbei University of Finance and Economics, majoring in Technical Economy and Management, and holds a master’s degree.
ZHANG Mengjiao, aged 51, is a Supervisor of the Company and the Manager of the Finance Department of HIPDC. She was the Deputy Manager of the Finance Department of the Company. She graduated from Xiamen University, majoring in accounting. She holds a master’s degree in economics and is a senior accountant.
GU Jianguo, aged 49, is a Supervisor of the Company, the Chairman of Nantong Investment & Management Limited Company and the Vice President of Nantong State-owned Assets Investment Holdings Co., Ltd.. Mr. Gu was the Chief of Nantong Investment Management Centre, and a Director and the President of Nantong Investment & Management Limited Company. He graduated from Shanghai Jiao Tong University with a master’s degree. He is an economist.
WANG Zhaobin, aged 60, is a Supervisor of the Company and the Chairman of the Labour Union. He was the Manager of the Administration Department and the Chairman of the Labour Union of the Company. He graduated from China Beijing Municipal Communist Party School, majoring in economic management, and holds a bachelor’s degree. He is a senior corporate culture specialist.
ZHANG Ling, aged 55, is a Supervisor. She was the Manager of the Audit and Supervisory Department of the Company. She graduated from Zhongnan University of Finance and Economics with a bachelor’s degree in management, majoring in financial. She is a senior accountant.
Other Executive Officers
GU Biquan, aged 58, is the Vice President and General Counsel of the Company. He was the Vice President and Secretary to the Board of the Company. He graduated from Beijing Radio and Television University, majoring in Electronics, and holds a college degree. He is an engineer.
ZHOU Hui, aged 52, is the Vice President of the Company. She was the Vice President and Chief Accountant of the Company. She graduated from Renmin University of China, majoring in Financial Accounting, and holds a master’s degree in Economics. She is a senior accountant.
ZHAO Ping, aged 53, is the Vice President of the Company. He was the Chief Engineer of the Company. He graduated from Tsinghua University, majoring in thermal engineering, with a master’s degree in science and an EMBA degree. He is a researcher-grade senior engineer.
DU Daming, aged 49, is the Vice President and the Secretary to the Board of Directors of the Company. He was the Vice President and General Counsel of the Company. He graduated from North China Electric Power University, majoring in electric system and automation, with a master’s degree in science. He is a senior engineer.
WU Senrong, aged 54, is currently the Head of the Discipline Inspection Group of the Company. He was the Head of the Discipline Inspection Group and Vice President of the Company. He graduated from the Economic Management School of Tsinghua University with an EMBA degree. He is a researcher-grade senior engineer.
SONG Zhiyi, aged 55, is the Vice President of the Company. He was the Head of Construction Department of Huaneng Group. He graduated from the Guanghua Management Institute of Peking University, majoring in business administration, with a bachelor’s degree and an MBA degree. He is a senior engineer.
LI Jianmin, aged 54, is the Vice President of the Company. He was the Deputy Chief Economist of the Company. He graduated from North China Electricity College, majoring in power plant and electricity system, with a bachelor’s degree in science. He is a researcher-grade senior engineer.
96
LIU Ranxing, aged 53, is the Vice President of the Company. He was the President of Huaneng Energy & Communications Holdings Co., Ltd. He graduated from Harbin Institute of Technology, majoring in management engineering, with a master’s degree in science. He is a researcher-grade senior engineer.
HUANG Lixin, aged 49, is the Chief accountant of the Company (commencement of term of office: January 2016). He was the Manager of the Finance Department of the Company, and the Head of the Finance Department of Huaneng Group. He graduated from the Economic Management School of Tsinghua University with an EMBA degree. He is a senior accountant.
HE Yong, aged 57, is the Chief Engineer of the Company. He was the Deputy Chief Engineer of the Company. He graduated from Wuhan University, majoring in corporate management, with a master’s degree in management. He is a researcher-grade senior engineer.
|
B.
|
Compensation for Directors, Supervisors and Executive Officers
|
The table below sets forth the compensation on individual basis for the directors, supervisors and other executive officers for the year ended December 31, 2015:
|
Name
|
|
Position with the Company
|
|
Pre-tax Remuneration Paid by the Company in 2015(2)
|
|
|
|
|
|
(RMB in thousand)
|
|
Directors
|
|
|
|
|
|
Mr. Cao Peixi
|
|
Chairman of the Board of Directors
|
|
-
|
|
Mr. Guo Junming
|
|
Vice Chairman of the Board of Directors
|
|
-
|
|
Mr. Liu Guoyue
|
|
Executive Director and President
|
|
929
|
|
Mr. Li Shiqi
|
|
Director
|
|
-
|
|
Mr. Huang Jian
|
|
Director
|
|
-
|
|
Mr. Fan Xiaxia
|
|
Executive Director and Vice President
|
|
981
|
|
Mr. Mi Dabin
|
|
Director
|
|
65
|
|
Mr. Guo Hongbo
|
|
Director
|
|
12
|
| Mr Xu Zujian(3) | Director | 24 | ||
|
Mr. Zhu Yousheng
|
|
Director
|
|
24
|
|
Ms. Li Song
|
|
Director
|
|
65
|
|
Mr. Li Zhensheng
|
|
Independent Director
|
|
74
|
| Mr. Qi Yudong(3) |
Independent Director
|
6 | ||
|
Mr. Zhang Shouwen
|
|
Independent Director
|
|
74
|
|
Mr. Yue Heng
|
|
Independent Director
|
|
100
|
| Ms. Zhang Lizi(3) |
Independent Director
|
30 | ||
|
Mr. Geng Jianxin
|
|
Independent Director
|
|
37
|
|
Mr. Xia Qing
|
|
Independent Director
|
|
37
|
|
Sub-total:
|
|
|
|
2,458
|
|
|
|
|
|
|
|
Supervisors
|
|
|
|
|
|
Mr. Ye Xiangdong
|
|
Chairman of the Board of Supervisors
|
|
-
|
|
Mr. Mu Xuan
|
|
Vice Chairman of the Board of Supervisors
|
|
65
|
|
Ms. Zhang Mengjiao
|
|
Supervisor
|
|
-
|
|
Mr. Gu Jianguo
|
|
Supervisor
|
|
49
|
|
Mr. Wang Zhaobin
|
|
Supervisor
|
|
786
|
|
Ms. Zhang Ling
|
|
Supervisor
|
|
450
|
|
|
|
|
|
|
|
Sub-total
|
|
|
|
1,350
|
|
|
|
|
|
|
|
Other Executive officers
|
|
|
|
|
|
Mr. Gu Biquan
|
|
Vice President and General Counsel
|
|
845
|
|
Ms. Zhou Hui
|
|
Vice President
|
|
845
|
|
Mr. Zhao Ping
|
|
Vice President
|
|
845
|
|
Mr. Du Daming
|
|
Vice President and Secretary to the Board of Directors
|
|
845
|
|
Mr. Wu Senrong
|
|
Head of Discipline Inspection Group
|
|
845
|
|
Mr. Song Zhiyi
|
|
Vice President
|
|
835
|
|
Mr. Li Jianmin
|
|
Vice President
|
|
845
|
|
Mr. Liu Ranxing(1)
|
|
Vice President
|
|
628
|
|
Mr. Huang Lixin
|
|
Chief Accountant
|
|
-
|
97
|
Name
|
|
Position with the Company
|
|
Pre-tax Remuneration Paid by the Company in 2015(2)
|
|
|
|
|
|
(RMB in thousand)
|
|
Mr. He Yong
|
Chief Engineer
|
845
|
||
|
|
|
|
|
|
|
Sub-total:
|
|
|
|
7,378
|
|
Total
|
|
|
|
11,186
|
___________________________________________
Notes:
|
(1)
|
Mr. Liu Ranxing was appointed on March 24, 2015.
|
|
(2)
|
The remuneration paid by the Company in 2015 includes fees, basic salaries, performance salaries and pension. Please see Note 37 to the Item 18 Financial Statements, “Directors’, supervisors’ and senior management’s emoluments”.
|
|
(3)
|
Resigned on June 25, 2015.
|
The total remuneration paid to our directors, supervisors and executive officers is comprised of basic salaries, performance salaries and pension. Of these, performance salaries account for approximately 50% of the total remuneration. In addition, directors and supervisors who are also officers or employees of the Company receive certain other benefits, such as subsidized or free health care services, housing and transportation, which are customarily provided by large enterprises in the PRC to their employees. Each of the Company’s independent directors receives annual after-tax cash compensation of RMB60,000. We do not have any service contract with any director that provides for benefits upon termination of employment. In 2014, no option was granted to the directors or the supervisors.
|
C.
|
Board practice
|
We, in accordance with the resolutions passed at a shareholders’ general meeting, have set up four board committees, namely, the Audit Committee, the Strategy Committee, the Nomination Committee, and the Remuneration and Appraisal Committee, and formulated the working regulations for each committees in accordance with relevant rules and regulations. All committees operate in accordance with the working rules and utilize their members’ specific backgrounds, experience and industry expertise to provide advice to the board, so as to enhance our operation efficiency and to make the decision-making process better informed.
The main duties of the Audit Committee are to assist our board in performing its statutory and fiduciary duties of supervising our accounting, financial reporting, internal control and compliance, including but not limited to, assisting our board in ensuring (i) the authenticity of our financial statements; (ii) our compliance with the applicable laws and regulations; (iii) the qualification and independence of our independent auditors; (iv) the performances of our independent auditors and internal auditing department and (v) the control and management of the related-party transactions of the Company.
The main duties of the Strategy Committee are to advise on, and conduct research in relation to, our long-term development strategies and decisions regarding significant investments.
The main duties of the Nomination Committee are to conduct research and provide advice in relation to the requirements for selection of directors and managers and the relevant procedures, to search for qualified candidates for the positions of director and manager, to examine the candidates for the positions of director and manager and to advise matters in relation thereto.
The main duties of the Remuneration and Appraisal Committee are to conduct research on the appraisal guidelines for directors and managers, to carry out performance appraisals and provide advice accordingly, and to conduct research on the remuneration policies and proposals regarding the directors and senior management.
The members of Audit Committee are Mr. Yue Heng (Chairman), Mr. Li Zhensheng, Mr. Zhang Shouwen, Mr. Geng Jianxin and Mr. Xia Qing.
98
The members of Strategy Committee are Mr. Liu Guoyue (Chairman), Mr. Li Shiqi, Mr. Huang Jian, Mr. Fan Xiaxia, Mr. Li Zhensheng and Mr. Xia Qing.
The members of Nomination Committee are Mr. Li Zhensheng (Chairman), Mr. Fan Xiaxia, Mr. Mi Dabin, Ms. Li Song, Mr. Zhang Shouwen, Mr. Yue Heng and Mr. Geng Jianxin.
The members of Remuneration and Appraisal Committee are Mr. Geng Jianxin (Chairman), Mr. Liu Guoyue, Mr. Guo Hongbo, Mr. Zhu Yousheng, Mr. Li Zhensheng, Mr. Yue Heng and Mr. Xia Qing.
|
D.
|
Employees
|
As of December 31, 2015, we have 42,039 employees. Of these, 290 are headquarters management staff, 11,339 are power plant personnel directly involved in the management and operation of the power plants, and the remainder are maintenance personnel, ancillary service workers and others. Over 72% our work force graduated from university or technical college. As of December 31, 2013 and 2014, we had approximately 37,729 and 37,737 employees, respectively.
We conduct continuing education programs for our employees at our head office and at each power plant. We provide training in foreign language, computer, accounting and other areas to our professionals and technicians in their relevant fields. Employees are trained in accordance with the different requirements for professional and managerial positions.
Our labor force is employed through individual labor contracts. Currently, all employees are employed under labor contracts, which specify the employee’s position, responsibilities, remuneration and grounds for termination. Short-term labor contracts have fixed terms of typically one to five years, at the end of which they may be renewed by agreement of both the Company and the employee.
The contract system imposes discipline, provides incentives to adopt better work methods, and provides us with a greater degree of management control over our work force. We believe that, by linking remuneration to productivity, the contract system has also improved employee morale.
Each of our power plants has a trade union and the employees of our headquarters are also members of a trade union. These trade unions protect employees’ rights, aim to fulfill our economic objectives, encourage employees to participate in management decisions and mediate disputes between us and union members. We have not been subject to any strikes or other labor disturbances interfering with our operations, and we believe that our relationships with our employees are good.
Total remuneration of our employees includes salaries, bonuses and allowances. The employees also receive certain benefits in the form of education and health services subsidized by the Company and other miscellaneous subsidies.
In compliance with the relevant regulations, we and our employees participate in the local government pension plan under which all the employees are entitled to pension payments upon retirement. See Note 34 to the Financial Statements.
The Company also participates in the social insurance program administered by the social security institution, under which all employees are entitled to certain social insurance benefits, subject to adjustments in accordance with relevant PRC regulations. The Company is in compliance with all social insurance regulations and has no overdue obligations for any social insurance contribution.
|
E.
|
Share ownership
|
None of our directors, supervisors or senior management owns any of our shares.
99
|
ITEM 7
|
Major Shareholders and Related Party Transactions
|
|
A.
|
Major shareholders
|
Our outstanding ordinary shares consist of A Shares and H Shares, each with a par value of RMB1.00 per share. The following table sets forth certain information regarding our major shareholders as of March 31, 2016.
|
Shareholder
|
|
Number of shares
|
|
|
Approximate percentage in the total issued domestic share capital %
|
|
|
Approximate percentage in the total issued share capital %
|
|
|||
|
Huaneng International Power Development Corporation
|
|
|
5,066,662,118
|
|
|
|
48.25
|
|
|
|
33.33
|
|
|
China Huaneng Group(1)
|
|
|
1,629,264,402
|
|
|
|
15.52
|
|
|
|
10.72
|
|
|
Hebei Provincial Construction Investment Company
|
|
|
603,000,000
|
|
|
|
5.74
|
|
|
|
3.97
|
|
|
China Hua Neng Hong Kong Company Limited
|
|
|
472,000,000
|
|
|
|
-
|
(2)
|
|
|
3.11
|
|
___________________________________________
Notes:
|
(1)
|
Of the 1,629,264,402 shares, 74,139,853 domestic shares through its controlling subsidiary, Huaneng Finance Corporation Limited.
|
|
(2)
|
472,000,000 shares are H shares and represent 10.04% of the total issued H shares of the Company and 3.11% of the total issued share capital of the Company.
|
In 2006, all of our shareholders of non-tradable domestic shares except HIPDC transferred a total of approximately 1.1 billion shares to Huaneng Group, representing 9.24% of our total issued shares. Among others, HPCIC transferred approximately 301 million shares to Huaneng Group, and decreased its shareholdings in the Company to 5.00%.
On April 19, 2006, we carried out our reform plan to convert all non-tradable domestic shares into tradable domestic shares. According to the plan, Huaneng Group and HIPDC transferred a total of 150 million A Shares to our shareholders. As a result, the direct shareholdings of Huaneng Group and HIPDC decreased to 8.75% and 42.03%, respectively.
In June and July of 2008, through its wholly owned subsidiary, China Hua Neng Hong Kong Company Limited, Huaneng Group acquired 20 million H shares from the open market. As a result, the shareholding of Huaneng Group increased to 8.92%.
In 2010, we increased our share capital through non-public issuances of new shares, including A shares and H shares. With the approval of shareholders and relevant PRC governmental authorities, we were authorized to issue (i) not exceeding 1,500 million new A shares by way of placement to not more than 10 designated investors, including Huaneng Group, which would subscribe for no more than 500 million new A shares, and (ii) no more than 500 million new H Shares to China Hua Neng Hong Kong Company Limited (“Hua Neng HK”). On December 23, 2010, we completed the non-public issuance of 1,500 million new A shares (ordinary shares with a par value of RMB1 per share) to 10 designated investors, including Huaneng Group, at the issuance price of RMB5.57 per share. The shares subscribed by Huaneng Group are subject to a lock-up period of 36 months.
100
On December 28, 2010, we completed the placement of 500 million H shares (ordinary shares with a par value of RMB1 per share) to Hua Neng HK at the subscription price of HK$4.73 per share.
On November 13, 2014, we completed placement of 365 million H Shares at the price of HK$8.60 per share.
On November 20, 2015, we completed placement of 780 million H Shares at the price of HK$7.32 per share.
Before we were established in 1994, HIPDC and seven other promoters entered into the Shareholders’ Agreement dated May 31, 1994 (the “Shareholders’ Agreement”) which, among other things, grants to HIPDC the right to vote all the shares owned by each of the other promoters so as to enable HIPDC to have majority voting rights in general meetings for so long as we are in existence. In addition, directors designated by HIPDC will have majority representation on our board of directors and each of the other promoters will have one representative designated by it appointed as a member of our board of directors. The Shareholders’ Agreement also provides that for so long as we are in existence (i) HIPDC and the other signatories to the Shareholders’ Agreement will maintain their combined shareholdings to ensure their collective majority control of the Company, (ii) HIPDC has certain priority rights to purchase the shares held by the other signatories to the Shareholders’ Agreement, (iii) if HIPDC does not exercise its priority rights to purchase such shares, each of the signatories to the Shareholders’ Agreement other than HIPDC shall have a priority right to purchase such shares on a pro rata basis, and (iv) no shares may be sold or transferred unless their transferees agree to abide by the terms of the Shareholders’ Agreement. As a result of the Shareholders’ Agreement, HIPDC holds 70.09% of the total voting rights of the outstanding shares and, subject to the Shareholders’ Agreement, has the power to control the election of all of our directors and to direct our management and policies.
On May 12, 2006, HIPDC and other promoters (including the shareholders who assumed the rights and obligations of original promoters as a result of share transfer) entered into an amendment to the Shareholders’ Agreement, pursuant to which each promoter shall be entitled to exercise its own voting rights at the shareholders’ general meeting. Consequently, HIPDC currently holds 35.14% of our total voting rights. Since HIPDC’s parent company, Huaneng Group, currently holds, directly or indirectly, 14.87% of our total voting rights, HIPDC is able to exert control over us when acting in concert with Huaneng Group.
Huaneng Group and HIPDC had previously given a non-compete undertaking to us during our initial public offering of A shares in 2001, in order to support our business development, to integrate relevant quality assets and to avoid business competition. In September 2010, we received from Huaneng Group an undertaking on relevant matters for further avoidance of business competition. While Huaneng Group will continue to perform its undertakings previously given, Huaneng Group further undertakes that: (i) it shall treat us as the only platform for ultimate integration of the conventional energy business of Huaneng Group; (ii) with respect to the conventional energy business assets of Huaneng Group located in Shandong Province, Huaneng Group undertakes that it will take approximately 5 years to improve the profitability of such assets and when the terms become appropriate, it will invest those assets into us. We have a right of first refusal to acquire from Huaneng Group the newly developed, acquired or invested projects which are engaged in the conventional energy business of Huaneng Group located in Shandong Province; (iii) with respect to the other non-listed conventional energy business assets of Huaneng Group located in other provincial administrative regions, Huaneng Group undertakes that it will take approximately 5
101
years, and upon such assets meeting the conditions for listing, it will invest such assets into us in order to support our sustainable and stable development; and (iv) Huaneng Group will continue to perform each of its undertakings to support the development of its subordinated listed companies.
On June 28, 2014, pursuant to Guideline No. 4 for the Supervision of Listed Companies No.4 - Commitments and Their Fulfillment by Listed Companies and Their Actual Controllers, Shareholders, Related Parties and Acquirers issued by CSRC, Huaneng Group strengthened its aforementioned non-competing undertaking in the following ways: (i) it shall treat us as the only platform for integrating the conventional energy business of Huaneng Group; (ii) with respect to the conventional energy business assets of Huaneng Group located in Shandong Province, Huaneng Group undertakes that by the end of 2016, it will inject such assets into the our Company when the profitability of such assets has been improved and meets our internal requirements for the listing of our assets, which include clear delineation of assets and shares ownership between our Company and Huaneng Group, absence of decrease in earnings per share of the Company after the injection and any unlawful events of significance, appreciation of state-owned assets, and certain waivers of shareholder rights by Huaneng Group; (iii) with respect to the other non-listed conventional energy business assets of Huaneng Group in other provincial administrative regions, Huaneng Group undertook that by the end of 2016, upon such assets meeting the our aforementioned internal requirements, the Group will inject such assets into the Company, with a view to supporting the Company’s continuous and stable development; and (iv) Huaneng Group will continue to perform each of its undertakings to support the development of its subordinated listed companies. The period of such undertakings is between June 28, 2014 and December 31, 2016.
On October 13, 2014, the Company signed a number of equity transfer agreements with each of Huaneng Group and HIPDC, pursuant to which the Company acquired the equity interests of ten power companies in total held by Huaneng Group and HIPDC for the consideration of approximately RMB9.276 billion. This transaction further reduced the business competition between the Company and major shareholder, and honoring the undertakings provided by major shareholder to support the development of the Company.
|
B.
|
Related party transactions
|
Guarantees
The table below sets forth information on guarantees provided by Huaneng Group, HIPDC and the Company to the related parties in 2015 for the purposes of financing their operation, construction and renovation.
|
Guarantor
|
|
Guarantee
|
|
Interest Rate
|
|
Largest Amount Outstanding
in 2015
|
|
Amount Outstanding As of December 31, 2015
|
|
||
|
|
|
|
|
(%)
|
|
(RMB)
|
|
(RMB)
|
|
||
|
Huaneng Group
|
|
The Company
|
|
6.36
|
|
|
16,315,897.41
|
|
|
0.00
|
|
|
(Ultimate Parent of the Company)
|
|
The Company
|
|
LIBOR + 0.075
|
|
|
19,358,422.02
|
|
|
0.00
|
|
|
|
|
Yangliuqing Power Company(1)
|
|
2.15
|
|
|
254,845,628.27
|
|
|
213,993,985.80
|
|
| Hainan Power | 4.17 | 625,000,000.00 | 500,000,000.00 | ||||||||
|
HIPDC
|
|
The Company
|
|
5.00
|
|
|
2,000,000,000.00
|
|
|
2,000,000,000.00
|
|
| Ruijin Power | 4.86 | 264,000,000.00 | 228,000,000.00 | ||||||||
|
The Company
|
|
Tuas Power Company(1)
|
|
SIBOR+1.65
|
|
|
11,216,464,042.81
|
|
|
10,784,837,243.69
|
|
|
|
|
Tuas Power Company(1)
|
|
SIBOR+1.65
|
|
|
1,644,866,718.16
|
|
|
1,581,569,715.30
|
|
______________________________________________
Note:
|
(1)
|
These entities are subsidiaries of the Company.
|
102
Loans
The table below sets forth the loans made by Huaneng Group, subsidiaries of Huaneng Group, and the Company to the related parties in 2015 for the purposes of financing their operation, construction and renovation.
|
Lender
|
Borrower
|
Interest Rate
|
Largest Amount Outstanding
in 2015
|
Outstanding Balance as of December 31, 2015
|
|||||||
|
%
|
(RMB)
|
(RMB)
|
|||||||||
|
Huaneng Finance
|
The Company
|
5.04
|
200,000,000
|
-
|
|||||||
|
Huaneng Finance
|
The Company
|
4.82
|
200,000,000
|
-
|
|||||||
|
Huaneng Finance
|
Weihai Power
|
4.82
|
100,000,000
|
-
|
|||||||
|
Huaneng Finance
|
Weihai Power
|
3.92
|
100,000,000
|
100,000,000
|
|||||||
|
Huaneng Finance
|
Xindian Power
|
4.37
|
100,000,000
|
100,000,000
|
|||||||
|
Huaneng Finance
|
Xindian Power
|
4.85
|
100,000,000
|
-
|
|||||||
|
Huaneng Finance
|
Tongxiang CGGT
|
4.13
|
100,000,000
|
100,000,000
|
|||||||
|
Huaneng Finance
|
Huaiyin II Power
|
3.92
|
150,000,000
|
150,000,000
|
|||||||
|
Huaneng Finance
|
Huaiyin II Power
|
5.04
|
100,000,000
|
-
|
|||||||
|
Huaneng Finance
|
Suzhou Power
|
5.04
|
160,000,000
|
-
|
|||||||
|
Huaneng Finance
|
Suzhou Power
|
3.92
|
40,000,000
|
40,000,000
|
|||||||
|
Huaneng Finance
|
Qinbei Power
|
4.59
|
200,000,000
|
200,000,000
|
|||||||
|
Huaneng Finance
|
Qinbei Power
|
4.59
|
200,000,000
|
-
|
|||||||
|
Huaneng Finance
|
Yushe Power
|
4.13
|
100,000,000
|
100,000,000
|
|||||||
|
Huaneng Finance
|
Yushe Power
|
4.14
|
100,000,000
|
-
|
|||||||
|
Huaneng Finance
|
Yushe Power
|
4.13
|
130,000,000
|
-
|
|||||||
|
Huaneng Finance
|
Yushe Power
|
4.35
|
100,000,000
|
-
|
|||||||
|
Huaneng Finance
|
Luohuang Power
|
4.82
|
200,000,000
|
-
|
|||||||
|
Huaneng Finance
|
Luohuang Power
|
3.92
|
200,000,000
|
200,000,000
|
|||||||
|
Huaneng Finance
|
Luohuang Power
|
3.92
|
100,000,000
|
100,000,000
|
|||||||
|
Huaneng Finance
|
Luohuang Power
|
3.92
|
100,000,000
|
100,000,000
|
|||||||
|
Huaneng Finance
|
Pingliang Power
|
3.92
|
100,000,000
|
100,000,000
|
|||||||
|
Huaneng Finance
|
Pingliang Power
|
5.60
|
100,000,000
|
-
|
|||||||
|
Huaneng Finance
|
Pingliang Power
|
4.37
|
100,000,000
|
100,000,000
|
|||||||
|
Huaneng Finance
|
Yangliuqing Power
|
3.92
|
200,000,000
|
200,000,000
|
|||||||
|
Huaneng Finance
|
Yangliuqing Power
|
4.59
|
200,000,000
|
-
|
|||||||
|
Huaneng Finance
|
Yangliuqing Power
|
3.92
|
500,000
|
500,000
|
|||||||
|
Huaneng Finance
|
Hualiangting Power
|
4.85
|
10,000,000
|
-
|
|||||||
|
Huaneng Finance
|
Hualiangting Power
|
4.13
|
5,000,000
|
5,000,000
|
|||||||
|
Huaneng Finance
|
Wuhan Power
|
4.59
|
200,000,000
|
200,000,000
|
|||||||
|
Huaneng Finance
|
Suzhou CCGT
|
5.08
|
100,000,000
|
-
|
|||||||
|
Huaneng Finance
|
Suzhou CCGT
|
5.08
|
100,000,000
|
-
|
|||||||
|
Huaneng Finance
|
Suzhou CCGT
|
4.85
|
30,000,000
|
-
|
|||||||
|
Huaneng Finance
|
Suzhou CCGT
|
4.13
|
100,000,000
|
100,000,000
|
|||||||
|
Huaneng Finance
|
Suzhou CCGT
|
4.13
|
100,000,000
|
100,000,000
|
|||||||
|
Huaneng Finance
|
Suzhou CCGT
|
4.13
|
30,000,000
|
30,000,000
|
|||||||
|
Huaneng Finance
|
Anyuan Power
|
5.08
|
50,000,000
|
-
|
|||||||
|
Huaneng Finance
|
Anyuan Power
|
5.08
|
50,000,000
|
-
|
|||||||
|
Huaneng Finance
|
Hainan Power
|
5.08
|
200,000,000
|
-
|
|||||||
|
Huaneng Finance
|
Hainan Power
|
5.08
|
100,000,000
|
-
|
|||||||
|
Huaneng Finance
|
Hainan Power
|
4.37
|
100,000,000
|
-
|
|||||||
|
Huaneng Finance
|
Hainan Power
|
4.37
|
50,000,000
|
-
|
|||||||
|
Huaneng Finance
|
Jingmen Power
|
5.32
|
200,000,000
|
200,000,000
|
|||||||
|
Huaneng Finance
|
Yingcheng Thermal Power
|
4.82
|
150,000,000
|
150,000,000
|
|||||||
|
Huaneng Finance
|
The Company
|
4.50
|
267,000,000
|
-
|
|||||||
|
Huaneng Finance
|
Yangliuqing Power
|
5.40
|
150,000,000
|
-
|
|||||||
|
Huaneng Finance
|
Wuhan Power
|
6.32
|
200,000,000
|
-
|
|||||||
|
Huaneng Finance
|
Dalongtan Hydropower
|
5.84
|
30,000,000
|
30,000,000
|
|||||||
|
Huaneng Finance
|
Qingdao Co-generation
|
4.75
|
60,000,000
|
60,000,000
|
|||||||
|
Huaneng Finance
|
Qingdao Co-generation
|
4.66
|
75,000,000
|
75,000,000
|
|||||||
|
Huaneng Finance
|
Hainan Power
|
4.41
|
206,000,000
|
166,000,000
|
103
|
Lender
|
Borrower
|
Interest Rate
|
Largest Amount Outstanding
in 2015
|
Outstanding Balance as of December 31, 2015
|
|||||||
|
%
|
(RMB)
|
(RMB)
|
|
Huaneng Group
|
The Company
|
4.28
|
640,484,600
|
640,484,600
|
|||||||
|
Huaneng Group
|
Wuhan Power
|
5.54
|
24,530,000
|
24,530,000
|
|||||||
|
Huaneng Clean Energy
|
The Company
|
4.14
|
150,000,000
|
-
|
|||||||
|
Hua Neng HK
|
Beijing Co-Generation
|
5.40
|
100,000,000
|
-
|
|||||||
|
Beijing Co-Generation
|
The Company
|
5.60
|
100,000,000
|
-
|
|||||||
|
Beijing Co-Generation
|
The Company
|
4.14
|
50,000,000
|
-
|
|||||||
|
Beijing Co-Generation
|
The Company
|
4.14
|
200,000,000
|
-
|
|||||||
|
Beijing Co-Generation
|
The Company
|
4.14
|
50,000,000
|
-
|
|||||||
|
Beijing Co-Generation
|
The Company
|
3.92
|
180,000,000
|
180,000,000
|
|||||||
|
Beijing Co-Generation
|
The Company
|
3.92
|
130,000,000
|
130,000,000
|
|||||||
|
Beijing Co-Generation
|
The Company
|
4.14
|
500,000,000
|
-
|
|||||||
|
Beijing Co-Generation
|
The Company
|
4.14
|
450,000,000
|
-
|
|||||||
|
Beijing Co-Generation
|
The Company
|
4.14
|
70,000,000
|
-
|
|||||||
|
Jinling Power
|
Jinling CCGT
|
6.00
|
100,000,000
|
-
|
|||||||
| Huaneng International Power Fuel | The Company | 5.10 | 200,000,000 | - | |||||||
| Huaneng International Power Fuel | The Company | 3.92 | 100,000,000 | 100,000,000 | |||||||
| Huaneng International Power Fuel | The Company | 3.92 | 200,000,000 | 200,000,000 | |||||||
|
HIPDC
|
Chaohu Power
|
5.30
|
800,000,000
|
800,000,000
|
|||||||
|
HIPDC
|
Chaohu Power
|
5.54
|
300,000,000
|
-
|
|||||||
|
HIPDC
|
Chaohu Power
|
4.28
|
210,000
|
210,000
|
|||||||
|
HIPDC
|
Anyuan Power
|
5.30
|
100,000,000
|
100,000,000
|
|||||||
|
HIPDC
|
Ruijin Power
|
5.54
|
400,000,000
|
-
|
|||||||
|
HIPDC
|
Ruijin Power
|
5.30
|
300,000,000
|
300,000,000
|
|||||||
|
HIPDC
|
Jingmen Power
|
5.30
|
300,000,000
|
300,000,000
|
|||||||
|
HIPDC
|
Yingcheng Thermal Power
|
5.30
|
200,000,000
|
200,000,000
|
|||||||
|
The Company
|
Diandong Energy
|
4.60
|
40,000,000
|
-
|
|||||||
|
The Company
|
Yuwang Energy
|
4.60
|
10,000,000
|
-
|
|||||||
|
The Company
|
Qingdao Co-generation
|
4.60
|
50,000,000
|
-
|
|||||||
|
The Company
|
Xindian Power
|
4.60
|
1,285,000,000
|
1,285,000,000
|
|||||||
|
The Company
|
Subaoding Wind Power
|
4.60
|
50,000,000
|
50,000,000
|
|||||||
|
The Company
|
Nanjing CCGT
|
6.00
|
400,000,000
|
-
|
|||||||
|
The Company
|
Luoyuan Power
|
4.35
|
250,000,000
|
250,000,000
|
|||||||
|
The Company
|
Changtu Wind Power
|
4.35
|
153,000,000
|
35,000,000
|
|||||||
|
The Company
|
Linggang Co-generation CCGT
|
4.37
|
400,000,000
|
400,000,000
|
|||||||
|
The Company
|
Huanyin II Power
|
5.35
|
1,200,000,000
|
-
|
|||||||
|
The Company
|
Guidong Wind Power
|
5.49
|
10,000,000
|
-
|
|||||||
|
The Company
|
Jiangxi Clean Energy
|
5.49
|
10,000,000
|
-
|
|||||||
|
The Company
|
Suzihe Hydropower
|
4.35
|
400,890,000
|
400,890,000
|
|||||||
|
The Company
|
Mianchi Co-generation
|
5.06
|
80,000,000
|
-
|
|||||||
|
The Company
|
Zuoquan Power
|
4.60
|
300,000,000
|
-
|
|||||||
|
The Company
|
Shantou Haimen Power
|
4.60
|
240,000,000
|
-
|
|||||||
|
The Company
|
Suzhou CCGT
|
4.69
|
67,264,000
|
-
|
|||||||
|
The Company
|
Yushe Power
|
4.35
|
265,000,000
|
-
|
|||||||
|
The Company
|
Guilin Power
|
4.35
|
20,000,000
|
20,000,000
|
|||||||
|
The Company
|
Hualu Sea Transportation
|
5.10
|
35,000,000
|
-
|
|||||||
|
The Company
|
Luoyang Co-generation
|
6.49
|
20,000,000
|
-
|
|||||||
|
The Company
|
Taicang Power
|
6.16
|
200,000,000
|
-
|
|||||||
|
The Company
|
Liangjiang CCGT
|
5.60
|
30,000,000
|
-
|
|||||||
|
The Company
|
Zhanhua Co-generation
|
6.00
|
750,000,000
|
-
|
|||||||
|
The Company
|
Guanyun Co-generation
|
4.35
|
64,000,000
|
64,000,000
|
|||||||
|
The Company
|
Huade Wind Power
|
6.03
|
34,000,000
|
-
|
|||||||
|
The Company
|
Dongshan CCGT
|
5.61
|
50,000,000
|
-
|
|||||||
|
The Company
|
Changxing Power
|
5.10
|
18,000,000
|
-
|
|||||||
|
The Company
|
Qinbei Power
|
4.60
|
1,600,000,000
|
-
|
|||||||
|
The Company
|
Yingkou Co-generation
|
4.35
|
500,000,000
|
310,000,000
|
104
|
Lender
|
Borrower
|
Interest Rate
|
Largest Amount Outstanding
in 2015
|
Outstanding Balance as of December 31, 2015
|
|||||||
|
%
|
(RMB)
|
(RMB)
|
|
The Company
|
Fujian Harbour
|
4.35
|
1,551,800,000
|
1,551,800,000
|
|||||||
|
The Company
|
Tongxiang CCGT
|
4.74
|
80,000,000
|
-
|
|||||||
|
The Company
|
Luhe Wind Power
|
6.03
|
20,000,000
|
-
|
|||||||
|
The Company
|
Panxian Wind Power
|
4.95
|
10,000,000
|
-
|
|||||||
|
The Company
|
Fuyuan Wind Power
|
5.35
|
20,000,000
|
-
|
|||||||
|
The Company
|
Anyuan Power
|
4.35
|
50,000,000
|
50,000,000
|
|||||||
|
The Company
|
Pingliang Power
|
5.60
|
970,000,000
|
-
|
|||||||
|
The Company
|
Huaining Wind Power
|
6.60
|
10,000,000
|
-
|
|||||||
|
The Company
|
Rudong Wind Power
|
4.35
|
100,000,000
|
100,000,000
|
|||||||
|
The Company
|
Jiuquan II Wind Power
|
5.60
|
100,000,000
|
-
|
|||||||
|
The Company
|
Wafangdian Wind Power
|
5.60
|
142,500,000
|
-
|
|||||||
|
The Company
|
Qidong Wind Power
|
4.35
|
360,000,000
|
360,000,000
|
|||||||
|
The Company
|
Jieshan Wind Power
|
4.35
|
20,000,000
|
20,000,000
|
|||||||
|
The Company
|
Taihang Power
|
4.35
|
50,000,000
|
50,000,000
|
|||||||
|
The Company
|
Haimen Port
|
4.35
|
410,000,000
|
410,000,000
|
|||||||
|
The Company
|
Yuwang Energy
|
4.35
|
100,000,000
|
100,000,000
|
|||||||
|
The Company
|
Diandong Energy
|
4.60
|
90,000,000
|
-
|
|||||||
|
The Company
|
Yushe Power
|
4.35
|
340,000,000
|
-
|
|||||||
|
The Company
|
Jiangxi Clean Energy
|
6.03
|
5,000,000
|
-
|
|||||||
|
The Company
|
Shantou Haimen Power
|
4.60
|
160,000,000
|
-
|
|||||||
|
The Company
|
Zuoquan Power
|
4.60
|
600,000,000
|
-
|
|||||||
|
The Company
|
Mianchi Co-generation
|
5.06
|
100,000,000
|
-
|
|||||||
|
The Company
|
Guidong Wind Power
|
4.60
|
40,000,000
|
-
|
|||||||
|
The Company
|
Rudong Wind Power
|
4.35
|
100,000,000
|
100,000,000
|
|||||||
|
The Company
|
Pingliang Power
|
5.60
|
1,250,000,000
|
-
|
|||||||
|
The Company
|
Anyuan Power
|
4.35
|
90,000,000
|
90,000,000
|
|||||||
|
The Company
|
Fuyuan Wind Power
|
5.61
|
30,000,000
|
-
|
|||||||
|
The Company
|
Panxian Wind Power
|
4.95
|
10,000,000
|
-
|
|||||||
|
The Company
|
Dongshan CCGT
|
5.61
|
30,000,000
|
-
|
|||||||
|
The Company
|
Huade Wind Power
|
4.60
|
200,000,000
|
-
|
|||||||
|
The Company
|
Liangjiang CCGT
|
5.32
|
200,000,000
|
-
|
|||||||
|
The Company
|
Taicang Power
|
5.60
|
100,000,000
|
-
|
|||||||
|
The Company
|
Luoyang Co-generation
|
6.46
|
80,000,000
|
-
|
|||||||
|
The Company
|
Hualu Sea Transportation
|
5.06
|
130,000,000
|
130,000,000
|
|||||||
|
The Company
|
Zhanhua Co-generation
|
6.00
|
200,000,000
|
-
|
|||||||
|
The Company
|
Tongxiang CCGT
|
4.80
|
230,000,000
|
-
|
|||||||
|
The Company
|
Yingkou Xianrendao Co-generation
|
6.16
|
40,000,000
|
-
|
|||||||
|
The Company
|
Huanyin II Power
|
4.35
|
450,000,000
|
450,000,000
|
|||||||
|
The Company
|
Suzhou CCGT
|
4.35
|
220,000,000
|
220,000,000
|
|||||||
|
The Company
|
Xiangqi Hydropower
|
5.76
|
10,000,000
|
-
|
|||||||
|
The Company
|
Xindian Power
|
4.60
|
150,000,000
|
-
|
|||||||
|
The Company
|
Qingdao Co-generation
|
4.60
|
20,000,000
|
-
|
|||||||
|
The Company
|
Luoyuan Power
|
4.35
|
100,000,000
|
100,000,000
|
|||||||
|
The Company
|
Qidong Wind Power
|
4.35
|
40,000,000
|
40,000,000
|
|||||||
|
The Company
|
Wafangdian Wind Power
|
4.35
|
112,500,000
|
112,500,000
|
|||||||
|
The Company
|
Diandong Energy
|
4.60
|
73,000,000
|
-
|
|||||||
|
The Company
|
Yuwang Energy
|
4.35
|
11,000,000
|
11,000,000
|
|||||||
|
The Company
|
Jiangxi Clean Energy
|
5.76
|
10,000,000
|
-
|
|||||||
|
The Company
|
Shantou Haimen Power
|
4.60
|
110,000,000
|
-
|
|||||||
|
The Company
|
Yushe Power
|
4.35
|
160,000,000
|
-
|
|||||||
|
The Company
|
Guidong Wind Power
|
4.60
|
60,000,000
|
-
|
|||||||
|
The Company
|
Mianchi Co-generation
|
5.06
|
20,000,000
|
-
|
|||||||
|
The Company
|
Zuoquan Power
|
4.60
|
500,000,000
|
-
|
|||||||
|
The Company
|
Pingliang Power
|
5.60
|
100,000,000
|
-
|
|||||||
|
The Company
|
Panxian Wind Power
|
4.95
|
20,000,000
|
-
|
|||||||
|
The Company
|
Fuyuan Wind Power
|
5.34
|
70,000,000
|
-
|
105
|
Lender
|
Borrower
|
Interest Rate
|
Largest Amount Outstanding
in 2015
|
Outstanding Balance as of December 31, 2015
|
|||||||
|
%
|
(RMB)
|
(RMB)
|
|
The Company
|
Qinbei Power
|
4.28
|
1,400,000,000
|
1,400,000,000
|
|||||||
|
The Company
|
Dongshan CCGT
|
4.60
|
11,000,000
|
-
|
|||||||
|
The Company
|
Liangjiang CCGT
|
5.35
|
200,000,000
|
-
|
|||||||
|
The Company
|
Yushe Power
|
4.13
|
500,000,000
|
500,000,000
|
|||||||
|
The Company
|
Luoyuan Power
|
4.13
|
417,000,000
|
417,000,000
|
|||||||
|
The Company
|
Haimen Port
|
5.49
|
160,000,000
|
-
|
|||||||
|
The Company
|
Jiangxi Clean Energy
|
4.60
|
20,000,000
|
20,000,000
|
|||||||
|
The Company
|
Dongshan CCGT
|
4.35
|
34,000,000
|
-
|
|||||||
|
The Company
|
Huade Wind Power
|
4.35
|
68,000,000
|
30,000,000
|
|||||||
|
The Company
|
Liangjiang CCGT
|
5.08
|
100,000,000
|
-
|
|||||||
|
The Company
|
Fuyuan Wind Power
|
5.06
|
30,000,000
|
-
|
|||||||
|
The Company
|
Panxian Wind Power
|
4.60
|
54,000,000
|
54,000,000
|
|||||||
|
The Company
|
Zuoquan Power
|
4.60
|
1,000,000,000
|
-
|
|||||||
|
The Company
|
Mianchi Co-generation
|
5.06
|
50,000,000
|
-
|
|||||||
|
The Company
|
Yushe Power
|
4.35
|
140,000,000
|
140,000,000
|
|||||||
|
The Company
|
Shantou Haimen Power
|
4.60
|
730,000,000
|
-
|
|||||||
|
The Company
|
Yuwang Energy
|
5.76
|
100,000,000
|
-
|
|||||||
|
The Company
|
Diandong Energy
|
4.60
|
210,000,000
|
210,000,000
|
|||||||
|
The Company
|
Yushe Power
|
4.13
|
365,000,000
|
365,000,000
|
|||||||
|
The Company
|
Zhanhua Co-generation
|
4.37
|
300,000,000
|
-
|
|||||||
|
The Company
|
Tongxiang CCGT
|
4.80
|
80,000,000
|
80,000,000
|
|||||||
|
The Company
|
Yingkou Xianrendao Co-generation
|
6.16
|
16,250,000
|
-
|
|||||||
|
The Company
|
Qingdao Co-generation
|
4.60
|
50,000,000
|
50,000,000
|
|||||||
|
The Company
|
Xindian Power
|
4.60
|
570,000,000
|
455,000,000
|
|||||||
|
The Company
|
Suzhou CCGT
|
4.35
|
30,000,000
|
30,000,000
|
|||||||
|
The Company
|
Xiangqi Hydropower
|
5.89
|
100,000,000
|
-
|
|||||||
|
The Company
|
Diandong Energy
|
4.60
|
150,000,000
|
-
|
|||||||
|
The Company
|
Yuwang Energy
|
5.06
|
40,000,000
|
-
|
|||||||
|
The Company
|
Mianchi Co-generation
|
5.06
|
50,000,000
|
-
|
|||||||
|
The Company
|
Panxian Wind Power
|
4.35
|
10,000,000
|
10,000,000
|
|||||||
|
The Company
|
Fuyuan Wind Power
|
5.06
|
32,000,000
|
-
|
|||||||
|
The Company
|
Huade Wind Power
|
4.35
|
140,000,000
|
140,000,000
|
|||||||
|
The Company
|
Dongshan CCGT
|
4.35
|
120,000,000
|
-
|
|||||||
|
The Company
|
Liangjiang CCGT
|
4.35
|
231,000,000
|
231,000,000
|
|||||||
|
The Company
|
Xiangqi Hydropower
|
5.89
|
10,000,000
|
-
|
|||||||
|
The Company
|
Haimen Port
|
5.10
|
120,000,000
|
-
|
|||||||
|
The Company
|
Xiangqi Hydropower
|
4.60
|
200,000,000
|
-
|
|||||||
|
The Company
|
Yuwang Energy
|
4.60
|
60,000,000
|
-
|
|||||||
|
The Company
|
Diandong Energy
|
5.49
|
100,000,000
|
-
|
|||||||
|
The Company
|
Zuoquan Power
|
4.35
|
1,900,000,000
|
1,900,000,000
|
|||||||
|
The Company
|
Yushe Power
|
4.79
|
140,000,000
|
140,000,000
|
|||||||
|
The Company
|
Dongshan CCGT
|
4.35
|
80,000,000
|
80,000,000
|
|||||||
|
The Company
|
Tongxiang CCGT
|
4.35
|
400,000,000
|
400,000,000
|
|||||||
|
The Company
|
Xiangqi Hydropower
|
4.60
|
20,000,000
|
-
|
|||||||
|
The Company
|
Liangjiang CCGT
|
4.35
|
230,000,000
|
230,000,000
|
|||||||
|
The Company
|
Fuyuan Wind Power
|
5.35
|
40,000,000
|
-
|
|||||||
|
The Company
|
Dongshan CCGT
|
4.35
|
165,000,000
|
165,000,000
|
|||||||
|
The Company
|
Diandong Energy
|
5.06
|
20,000,000
|
-
|
|||||||
|
The Company
|
Yuwang Energy
|
4.60
|
60,000,000
|
-
|
|||||||
|
The Company
|
Yushe Power
|
4.35
|
100,000,000
|
50,000,000
|
|||||||
|
The Company
|
Haimen Port
|
5.10
|
280,000,000
|
-
|
|||||||
|
The Company
|
Xiangqi Hydropower
|
4.35
|
20,000,000
|
20,000,000
|
|||||||
|
The Company
|
Liangjiang CCGT
|
4.35
|
130,000,000
|
130,000,000
|
|||||||
|
The Company
|
Yuwang Energy
|
4.60
|
60,000,000
|
-
|
|||||||
|
The Company
|
Diandong Energy
|
5.06
|
150,000,000
|
-
|
|||||||
|
The Company
|
Yushe Power
|
6.03
|
140,000,000
|
-
|
106
|
Lender
|
Borrower
|
Interest Rate
|
Largest Amount Outstanding
in 2015
|
Outstanding Balance as of December 31, 2015
|
|||||||
|
%
|
(RMB)
|
(RMB)
|
|
The Company
|
Shantou Haimen Power
|
4.35
|
70,000,000
|
70,000,000
|
|||||||
|
The Company
|
Xiangqi Hydropower
|
4.35
|
20,000,000
|
20,000,000
|
|||||||
|
The Company
|
Diandong Energy
|
4.60
|
100,000,000
|
-
|
|||||||
|
The Company
|
Yuwang Energy
|
5.06
|
250,000,000
|
-
|
|||||||
|
The Company
|
Shantou Haimen Power
|
4.35
|
330,000,000
|
330,000,000
|
|||||||
|
The Company
|
Yushe Power
|
5.76
|
200,000,000
|
-
|
|||||||
|
The Company
|
Haimen Port
|
5.61
|
24,000,000
|
-
|
|||||||
|
The Company
|
Shantou Haimen Power
|
4.35
|
300,000,000
|
300,000,000
|
|||||||
|
The Company
|
Yuwang Energy
|
4.60
|
480,000,000
|
-
|
|||||||
|
The Company
|
Diandong Energy
|
4.60
|
200,000,000
|
-
|
|||||||
|
The Company
|
Xiangqi Hydropower
|
4.35
|
200,000,000
|
200,000,000
|
|||||||
|
The Company
|
Diandong Energy
|
4.60
|
200,000,000
|
-
|
|||||||
|
The Company
|
Yuwang Energy
|
4.60
|
87,000,000
|
-
|
|||||||
|
The Company
|
Diandong Energy
|
4.60
|
148,000,000
|
-
|
|||||||
|
The Company
|
Diandong Energy
|
4.60
|
1,100,000,000
|
-
|
|||||||
|
The Company
|
Diandong Energy
|
4.60
|
200,000,000
|
-
|
|||||||
|
The Company
|
Enshi Maweigou Hydropower
|
4.75
|
10,000,000
|
10,000,000
|
|||||||
|
The Company
|
Luohuang Power
|
4.28
|
34,500,000
|
34,500,000
|
|||||||
|
The Company
|
Yueyang Power
|
4.28
|
14,780,000
|
14,780,000
|
|||||||
|
The Company
|
Dalian Power
|
4.51
|
21,000,000
|
21,000,000
|
|||||||
|
The Company
|
Yangliuqing Power
|
4.28
|
4,390,000
|
4,390,000
|
|||||||
|
The Company
|
Shidoukou Power Company
|
4.50
|
5,160,000
|
-
|
|||||||
|
The Company
|
Changtu Wind Power
|
4.51
|
118,000,000
|
118,000,000
|
|||||||
|
The Company
|
Dalongtan Hydropower
|
4.75
|
5,000,000
|
5,000,000
|
|||||||
|
The Company
|
Enshi Maweigou Hydropower
|
4.99
|
12,000,000
|
12,000,000
|
|||||||
|
The Company
|
Huaqing Energy
|
4.51
|
32,000,000
|
32,000,000
|
|||||||
|
The Company
|
Yingkou Xianrendao Co-generation
|
4.51
|
40,000,000
|
40,000,000
|
|||||||
|
The Company
|
Haimen Port
|
4.51
|
160,000,000
|
160,000,000
|
|||||||
|
The Company
|
Qinbei Power
|
4.28
|
4,200,000
|
4,200,000
|
|||||||
|
The Company
|
Yingkou Xianrendao Co-generation
|
5.20
|
700,000,000
|
700,000,000
|
|||||||
|
The Company
|
Linggang Co-generation CCGT
|
4.51
|
530,000,000
|
530,000,000
|
|||||||
|
The Company
|
Huade Wind Power
|
4.75
|
170,000,000
|
170,000,000
|
|||||||
|
The Company
|
Pingliang Power
|
4.75
|
2,320,000,000
|
2,320,000,000
|
|||||||
|
The Company
|
Yushe Power
|
4.51
|
140,000,000
|
140,000,000
|
|||||||
|
The Company
|
Hualu Sea Transportation
|
4.75
|
35,000,000
|
35,000,000
|
|||||||
|
The Company
|
Enshi Maweigou Hydropower
|
4.75
|
115,250,000
|
115,250,000
|
|||||||
|
The Company
|
Huanyin II Power
|
4.51
|
450,000,000
|
450,000,000
|
|||||||
|
The Company
|
Shantou Haimen Power
|
5.46
|
1,000,000,000
|
850,000,000
|
|||||||
|
The Company
|
Yushe Power
|
4.51
|
200,000,000
|
200,000,000
|
|||||||
|
The Company
|
Panxian Wind Power
|
4.75
|
5,000,000
|
5,000,000
|
|||||||
|
The Company
|
Shantou Haimen Power
|
5.46
|
120,000,000
|
120,000,000
|
|||||||
|
The Company
|
Qingdao Co-generation
|
4.66
|
12,000,000
|
12,000,000
|
|||||||
|
The Company
|
Zhanhua Co-generation
|
4.75
|
1,250,000,000
|
1,250,000,000
|
|||||||
|
The Company
|
Enshi Maweigou Hydropower
|
4.75
|
100,000,000
|
100,000,000
|
|||||||
|
The Company
|
Shantou Haimen Power
|
5.46
|
600,000,000
|
600,000,000
|
|||||||
|
The Company
|
Fuyuan Wind Power
|
5.23
|
10,000,000
|
-
|
|||||||
|
The Company
|
Dongshan CCGT
|
4.51
|
50,000,000
|
50,000,000
|
|||||||
|
The Company
|
Dongshan CCGT
|
4.51
|
150,000,000
|
150,000,000
|
|||||||
|
The Company
|
Xiangqi Hydropower
|
4.75
|
120,000,000
|
120,000,000
|
|||||||
|
The Company
|
Dongshan CCGT
|
4.51
|
234,396,000
|
234,396,000
|
|||||||
|
The Company
|
Dongshan CCGT
|
4.51
|
65,604,000
|
65,604,000
|
|||||||
|
The Company
|
Yuwang Energy
|
4.51
|
100,000,000
|
100,000,000
|
|||||||
|
The Company
|
Yuwang Energy
|
4.75
|
227,000,000
|
227,000,000
|
|||||||
|
The Company
|
Yuwang Energy
|
4.75
|
1,047,000,000
|
1,047,000,000
|
|||||||
|
The Company
|
Yuwang Energy
|
4.75
|
100,500,000
|
100,500,000
|
107
|
Lender
|
Borrower
|
Interest Rate
|
Largest Amount Outstanding
in 2015
|
Outstanding Balance as of December 31, 2015
|
|||||||
|
%
|
(RMB)
|
(RMB)
|
|
The Company
|
Diandong Energy
|
3.95
|
1,000,000,000
|
1,000,000,000
|
|||||||
|
The Company
|
Diandong Energy
|
4.75
|
210,000,000
|
210,000,000
|
|||||||
|
The Company
|
Yuwang Energy
|
4.75
|
88,000,000
|
88,000,000
|
|||||||
|
The Company
|
Diandong Energy
|
4.75
|
100,000,000
|
100,000,000
|
|||||||
|
The Company
|
Diandong Energy
|
4.75
|
300,000,000
|
300,000,000
|
|||||||
|
The Company
|
Diandong Energy
|
4.75
|
2,271,000,000
|
2,271,000,000
|
|||||||
|
The Company
|
Diandong Energy
|
4.75
|
100,000,000
|
100,000,000
|
|||||||
|
The Company
|
Diandong Energy
|
4.75
|
100,000,000
|
100,000,000
|
|||||||
|
Wuhan Power
|
Dalongtan Hydropower
|
4.37
|
4,000,000
|
4,000,000
|
|||||||
|
Qinbei Power
|
The Company
|
5.60
|
150,000,000
|
-
|
|||||||
|
Huaiyin Power
|
Huanyin II Power
|
4.35
|
300,000,000
|
300,000,000
|
|||||||
|
Huaiyin Power
|
Huanyin II Power
|
5.35
|
100,000,000
|
45,000,000
|
|||||||
|
Yueyang Power
|
The Company
|
5.08
|
490,000,000
|
-
|
|||||||
|
Yueyang Power
|
Xiangqi Hydropower
|
6.00
|
10,000,000
|
-
|
|||||||
|
Yumen Wind Power
|
The Company
|
5.60
|
80,000,000
|
-
|
|||||||
|
Yumen Wind Power
|
The Company
|
3.92
|
70,000,000
|
70,000,000
|
|||||||
|
Jiuquan Wind Power
|
The Company
|
5.60
|
190,000,000
|
-
|
|||||||
|
Jiuquan Wind Power
|
The Company
|
3.92
|
100,000,000
|
100,000,000
|
|||||||
|
Jiuquan Wind Power
|
The Company
|
3.92
|
190,000,000
|
190,000,000
|
|||||||
|
Yangliuqing Power
|
The Company
|
5.35
|
20,000,000
|
-
|
|||||||
|
Yangliuqing Power
|
The Company
|
4.14
|
40,000,000
|
-
|
|||||||
|
Yangliuqing Power
|
The Company
|
4.14
|
30,000,000
|
-
|
|||||||
|
Yangliuqing Power
|
The Company
|
4.14
|
130,000,000
|
-
|
|||||||
|
Xi’an Thermal
|
Diandong Energy
|
4.37
|
100,000,000
|
-
|
|||||||
|
Xi’an Thermal
|
Diandong Energy
|
4.37
|
100,000,000
|
-
|
Lease Agreement
Pursuant to a leasing agreement and a supplemental agreement entered into by Huaneng Property Co., Ltd. (formerly known as Beijing Huaneng Mansion Construction and Management Co., Ltd.) and us on April 1, 2010 and July 1, 2011, respectively, Huaneng Construction agreed to lease the designated offices of Huaneng Mansion to us until March 31, 2014. On April 1, 2014, we renewed the leasing agreement with Huaneng Property Co., Ltd. with a total leasing area of 30,428.70 square meters for three years. After renewal, such leasing agreement will expire on March 31, 2017 and the annual rent is RMB116.62 million. On April 1, 2015, we entered into a supplemental agreement with Huaneng Property Co., Ltd. in connection with the leasing agreement with Huaneng Property Co., Ltd. on April 1, 2010, pursuant to which the total leasing area increased by 37 square meters from 30,428.70 square meters to 30,465.70 square meters and the annual rent is RMB116.76 million.
Transactions with Huaneng Group
On November 19, 2014, we entered into the Framework Agreement with Huaneng Group, our ultimate controlling shareholder, for a term commencing on January 1, 2015 and expiring on December 31, 2015. Pursuant to the Huaneng Group Framework Agreement, we will conduct the following transactions with Huaneng Group and its subsidiaries and associates: (i) purchase of ancillary equipment and parts; (ii) purchase of coal and transportation services; (iii) sale of products; (iv) leasing of facilities, land and office spaces; (v) purchase of technical services, engineering contracting services and other services; (vi) provision of entrusted sale services; (vii) deposits of the Company and its subsidiaries; and (viii) entrusted sale service. On November 19, 2014, we renewed the Huaneng Group Framework Agreement with Huaneng Group, for a term commencing on January 1, 2015 and expiring on December 31, 2015.
Transactions with Huaneng Finance
On April 22, 2014, we entered into the Huaneng Finance Framework Agreement with Huaneng Finance, a subsidiary of Huaneng Group, for a term commencing on January 1, 2015 and expiring on December 31, 2017. Pursuant to the Huaneng Finance Framework Agreement, we will enter into the following transactions with Huaneng Finance: (i) placing cash deposits by us with Huaneng Finance; (ii) provision of discounting services by Huaneng Finance to us; and (iii) provision of loan advancement by Huaneng Finance to us. Such transactions will be conducted on an on-going basis and will constitute continuing connected transactions under the Hong Kong Listing Rules. During the period from 2015 to 2017, the maximum outstanding balance of the deposits to be placed with Huaneng Finance under the Huaneng Finance Framework Agreement, on a daily basis, will not exceed RMB8 billion. As of December 31, 2015, we placed with Huaneng Finance current deposits of approximately RMB4,599.92 million, which bore interest rates ranging from 0.35% to 1.35% per annum.
108
Entrusted Management Agreement with Huaneng Group
We have entered into certain entrusted management agreement with Huaneng Group in connection with mutual management of electricity assets. Services under such entrusted management arrangements include preliminary project planning, annual budget and comprehensive planning, power marketing, production management of power plants, construction management, financial management, human resources and labor wages management, administration management, legal service management, assets operation and shareholding management, information disclosure management, related party transaction management, risk and internal control management, general supervision, comprehensive affairs management and reporting/co-ordination management. By entering into these entrusted management arrangements, we aim to further improve the overall and management efficiency of our electricity assets in several provinces via the province level management system of Huaneng Group.
Coal purchases and service fee occurred for transportation
In 2015, we paid RMB13,856.19 million, RMB327.54 million, RMB1,342.66 million, RMB1,879.29 million and RMB2,103.73 million, respectively, to China Huaneng Group Fuel Co., Ltd., Huaneng Energy & Communications Holdings Co., Ltd. and its subsidiaries, Rizhao Power Company, Gansu Huating Coal Power Co., Ltd. and Shanghai Time Shipping for coal purchase and service fees incurred for transportation.
Transactions with Huaneng Group and HIPDC
On October 13, 2014, we entered into certain agreements with Huaneng Group on the transfer of equity interests in certain companies previously owned by Huaneng Group, pursuant to which we acquired from Huaneng Group 91.8% equity interests in Huaneng Hainan Power Inc., 75% equity interests in Huaneng Wuhan Power Generation Co. Ltd., 53.45% equity interests in Huaneng Suzhou Thermal Power Co. Ltd., 97% equity interests in Enshi Qingjiang Dalongtan Hydropower Development Co. Ltd. and 100% equity interests in Huaneng Hualiangting Hydropower Co., Ltd. for the consideration of RMB7,337,647,400.
On October 13, 2014, we entered into certain agreements with HIPDC on the transfer of equity interests in certain companies previously owned by HIPDC, pursuant to which we acquired from HIPDC 60% equity interests in Huaneng Chaohu Power Generation Co. Ltd., 100% equity interests in Huaneng Ruijin Power Generation Co., Ltd., 100% equity interests in Huaneng Anyuan Power Generation Co., Ltd., 100% equity interests in Huaneng Jingmen Thermal Power Co., Ltd. and 100% equity interests in Huaneng Yingcheng Thermal Power Co., Ltd. for the consideration of RMB1,938,178,900.
We have completed these transactions in January 2015.
Establishing Joint Venture with Hua Neng HK
On November 19, 2014, we entered into a joint venture contract with Hua Neng HK to jointly establish Huaneng Rudong Baxianjiao Offshore Wind Power Company Limited (“Baxianjiao Wind Power”), pursuant to which, Baxianjiao Wind Power shall have registered capital of RMB610 million, we will hold 70% of its equity interest and contribute capital of RMB427 million, and Hua Neng HK will hold 30% of its equity interest and contribute capital equivalent to RMB183 million by U.S. dollars cash remittance.
For a detailed discussion of related party transactions, see Note 35 to the Financial Statements.
109
|
C.
|
Interests of experts and counsel
|
Not applicable.
|
ITEM 8
|
Financial Information
|
|
A.
|
Consolidated statements and other financial information
|
See pages F-1 to F-105.
Legal proceedings
Other than that disclosed under “Item 5. Operating and Financial Reviews and Prospects – G. Guarantees for loans and restricted assets”, we are not a defendant in any material litigation or arbitration and no litigation or claim of material importance is known to us or any member of the Board of Directors of us to be pending or threatened against us.
Dividend distribution policy
Our articles of association clearly define our cash dividend policy, i.e. when our earnings and accumulative undistributable profits for the current year are positive, and on the condition that our cash flow can satisfy our normal operation and sustainable development, we shall adopt a cash dividend appropriation policy on the principle that the cash dividend payout will not be less than 50% of the distributable profit realized in the then-current year’s consolidated financial statement.
Our Board of Directors will determine the payment of dividends, if any, with respect to our shares on a per share basis. Any final dividend for a financial year shall be subject to shareholders’ approval. The Board may declare interim and special dividends at any time under general authorization by a shareholders’ ordinary resolution. A decision to declare or to pay any dividends in the future, and the amount of any dividends, will depend on our results of operations, cash flows, financial condition, future prospects and other factors which our Directors may determine as important.
For holders of our H shares, cash dividend payments, if any, shall be declared by our Board of Directors in Renminbi and paid in HK Dollars. The depositary will convert the HK Dollar dividend payments and distribute them to holders of ADSs in U.S. dollars, less expenses of conversion.
Dividends may be paid only out of our distributable profits (less allocation to the statutory funds of 10% of our net income determined in accordance with PRC GAAP) and may be subject to any applicable PRC withholding tax. Our Articles of Association limit our distributable profits to the lower of the amounts determined in accordance with PRC GAAP, and IFRS. Subject to the above, we expect to carry a positive, balanced and stable dividend distribution policy.
Our board has proposed a cash dividend of RMB0.47 per ordinary share (tax inclusive) for the year ended December 31, 2015, which is equivalent to RMB18.8 per ADS. The total dividend to be paid upon approval amounts to approximately RMB7,144 million.
|
B.
|
Significant changes
|
Except as disclosed elsewhere in this annual report, we have not experienced any significant changes since the date of our audited consolidated financial statements included in this annual report.
110
|
ITEM 9
|
The Offer and Listing
|
|
A.
|
Offer and listing details and markets
|
The Company’s ADSs have been listed on the New York Stock Exchange since October 6, 1994. The table below sets forth, for the periods indicated, the high and low closing prices of the ADSs on the New York Stock Exchange
|
|
|
|
|
Closing Price per ADS
|
|
|||||
|
|
|
|
|
High
|
|
|
Low
|
|
||
|
|
|
|
|
(US$)
|
|
|
(US$)
|
|
||
|
2011
|
|
|
|
|
23.87
|
|
|
|
15.67
|
|
|
2012
|
|
|
|
|
37.15
|
|
|
|
21.02
|
|
|
2013
|
|
|
|
|
49.37
|
|
|
|
33.83
|
|
|
2014
|
|
|
|
|
56.44
|
|
|
|
31.51
|
|
|
2015
|
61.13
|
32.76
|
||||||||
|
|
|
|
|
|
|
|
|
|
|
|
|
2014
|
|
First Quarter
|
|
|
39.06
|
|
|
|
31.51
|
|
|
|
|
Second Quarter
|
|
|
45.24
|
|
|
|
39.17
|
|
|
|
|
Third Quarter
|
|
|
49.21
|
|
|
|
43.66
|
|
|
|
|
Fourth Quarter
|
|
|
56.44
|
|
|
|
42.65
|
|
|
|
|
|
|
|
|
|
|
|
|
|
|
2015
|
|
First Quarter
|
|
|
59.94
|
44.20
|
|
|||
|
|
|
Second Quarter
|
|
|
61.13
|
48.79
|
|
|||
|
|
|
Third Quarter
|
|
|
52.48
|
41.50
|
|
|||
|
|
|
Fourth Quarter
|
|
|
49.77
|
32.76
|
|
|||
|
|
|
|
|
|
|
|
|
|
|
|
|
2016
|
|
First Quarter
|
|
|
36.81
|
29.44
|
|
|||
|
|
|
|
|
|
|
|
|
|
|
|
|
2015
|
|
October
|
|
|
49.77
|
42.82
|
|
|||
|
|
|
November
|
|
|
43.45
|
35.56
|
|
|||
|
|
|
December
|
|
|
36.66
|
32.76
|
|
|||
|
|
|
|
|
|
|
|||||
|
2016
|
|
January
|
|
|
34.92
|
30.84
|
|
|||
|
|
|
February
|
|
|
33.21
|
29.44
|
|
|||
|
|
|
March
|
|
|
36.81
|
31.96
|
|
|||
__________________________________________
Source: Reuters
Each ADS represents 40 H shares. As of March 31, 2016, there were 112 registered holders of American Depositary Receipts evidencing ADS.
On January 21, 1998, we listed our H shares on the Hong Kong Stock Exchange. On February 26, 1998, we placed 250 million H Shares at the price of HK$4.40 per H share or US$22.73 per ADS. In May 2004, we affected a two-for-one stock split by way of a stock dividend for all our outstanding shares including H shares. The table below sets forth, for the periods indicated, the high and low closing prices of H shares on the Hong Kong Stock Exchange.
|
|
|
|
|
Closing Price per H Share
|
|
|||||
|
|
|
|
|
High
|
|
|
Low
|
|
||
|
|
|
|
|
(HK$)
|
|
|
(HK$)
|
|
||
|
2011
|
|
|
|
|
4.65
|
|
|
|
3.02
|
|
|
2012
|
|
|
|
|
7.19
|
|
|
|
4.13
|
|
|
2013
|
|
|
|
|
9.64
|
|
|
|
6.21
|
|
|
2014
|
|
|
|
|
10.92
|
|
|
|
6.21
|
|
|
2015
|
|
|
|
|
11.76
|
6.40
|
|
|||
111
|
|
|
|
|
Closing Price per H Share
|
|
|||||
|
|
|
|
|
High
|
|
|
Low
|
|
||
|
|
|
|
|
(HK$)
|
|
|
(HK$)
|
|||
|
2014
|
|
First Quarter
|
|
|
7.61
|
|
|
|
6.21
|
|
|
|
|
Second Quarter
|
|
|
8.75
|
|
|
|
7.57
|
|
|
|
|
Third Quarter
|
|
|
9.52
|
|
|
|
8.48
|
|
|
|
|
Fourth Quarter
|
|
|
10.92
|
|
|
|
8.30
|
|
|
|
|
|
|
|
|
|
|
|
|
|
|
2015
|
|
First Quarter
|
|
|
11.30
|
8.54
|
|
|||
|
|
|
Second Quarter
|
|
|
11.76
|
9.37
|
|
|||
|
|
|
Third Quarter
|
|
|
9.89
|
9.22
|
|
|||
|
|
|
Fourth Quarter
|
|
|
9.59
|
6.40
|
|
|||
|
|
|
|
|
|
|
|
|
|
|
|
|
2016
|
|
First Quarter
|
|
|
7.12
|
5.72
|
|
|||
|
|
|
|
|
|
|
|||||
|
2015
|
|
October
|
|
|
9.59
|
8.43
|
|
|||
|
|
|
November
|
|
|
8.41
|
6.76
|
|
|||
|
|
|
December
|
|
|
7.1
|
6.40
|
|
|||
|
|
|
|
|
|
|
|||||
|
2016
|
|
January
|
|
|
6.89
|
5.91
|
|
|||
|
|
|
February
|
|
|
6.49
|
5.72
|
|
|||
|
|
|
March
|
|
|
7.12
|
6.10
|
|
As of March 31, 2016, there were 399 registered holders of H Shares.
|
ITEM 10
|
Additional Information
|
|
A.
|
Share capital
|
Not applicable.
|
B.
|
Memorandum and articles of association
|
The following is a brief summary of certain provisions of our Articles of Association, as amended, the Company Law and certain other applicable laws and regulations of the PRC. Such summary does not purport to be complete. For further information, you and your advisors should refer to the text of our Articles of Association, as amended, and to the texts of the applicable laws and regulations.
Objects and Purposes
We are a joint stock limited company established in accordance with the Standard Opinion for Joint Stock Limited Companies (the “Standard Opinion”) and certain other relevant laws and regulations of the PRC. We are registered with the PRC State Administration for Industry and Commerce with business license number Qi Gu Guo Zi No. 000496. Article 10 of our Articles of Association provides that our scope of businesses includes, among other things, investment, construction, operation and management of power plants; development, investment and operation of other export-oriented enterprises related to power plants; and production and supply of thermal heat.
Directors
Our directors shall be elected at our shareholders’ general meeting. Because the shares do not have cumulative voting rights, a holder of a majority of the shares is able to elect all of the directors. Our directors shall be elected for a term of three years and may serve consecutive terms upon re-election, except that independent directors may only serve a maximum of two consecutive terms of six years. Our directors are not required to hold any shares in us, and there is no age limit requirement for the retirement or non-retirement of our directors.
Where a director is materially interested, directly or indirectly, in a contract, transaction or arrangement (including any proposed contract, transaction or arrangement) with us, he or she shall declare the nature and extent of his or her interests to the board of directors at the earliest opportunity, whether or not such contract, transaction or arrangement is otherwise subject to the approval of the board. A director shall not vote, and shall not be counted in
112
the quorum of the meeting, on any resolution concerning any contract, transaction or arrangement where the director owns material rights or interests therein. A director is deemed to be interested in a contract, transaction or arrangement in which his associate (as defined by Article 133 of the Articles of Association) is interested.
Unless the interested director discloses his interests to the board and the contract, transaction or arrangement in which the director is materially interested is approved by the board at a meeting in which the director neither votes nor is counted in the quorum, such contract, transaction or arrangement may be revoked by us except with respect to a bona fide party thereto who does not have notice of the director’s interests.
We are prohibited from making loans or providing guarantees to our directors and their associates except where such loan or guarantee is made or provided under a service contract as approved by our shareholders at the shareholders’ general meeting and to meet expenditure requirement incurred or to be incurred by the director for the purposes of the Company or for the purpose of enabling the director to perform his or her duties properly.
Matters relating to the remuneration of our directors shall be determined by the shareholders’ general meeting.
Dividends
Distribution of dividends may be proposed by our board of directors for approval by an ordinary resolution of our shareholders at the shareholders’ general meeting. The Articles of Association allows for cash dividends, stock dividends and combination of cash and stock dividends.
Dividends may only be distributed after allowance has been made for:
|
|
·
|
recovery of losses, if any;
|
|
|
·
|
allocations to the statutory surplus reserve fund; and
|
|
|
·
|
allocations to a discretionary surplus reserve fund.
|
The allocation to the statutory surplus reserve fund is 10% of our net income determined in accordance with the PRC accounting rules. Where the accumulated statutory surplus reserve fund has reached 50% or more of our registered capital, no allocation is needed.
The Articles of Association require that cash dividends and other distribution with respect of H Shares be declared in Renminbi and paid by the Company in U.S. dollars or Hong Kong dollar in terms of the H Shares listed on the Hong Kong Stock Exchange. The Articles of Association further stipulate that for dividends and other distributions paid in currencies other than Renminbi, we shall use an exchange rate equal to the median closing exchange rate of Renminbi for such currencies announced by the PBOC for two working days in the week preceding the date on which such dividends or other distributions are declared.
We will appoint receiving agents to receive, on behalf of the holders of H Shares, any dividend distributions and all other money owing by us in respect of such shares (Receiving Agents). The Receiving Agents will comply with the laws and regulations of the applicable stock exchanges on which our shares are listed. Any Receiving Agent appointed on behalf of the holders of H Shares listed on the Hong Kong Stock Exchange will be a company registered as a trust corporation under the Trustee Ordinance of Hong Kong.
Dividends payments may be subject to PRC withholding tax.
113
Voting Rights and Shareholders’ Meetings
Our board of directors shall convene a shareholders’ annual general meeting once every year and within six months from the end of the preceding financial year. Our board shall convene an extraordinary general meeting within two months after the occurrence of any one of the following events:
where the number of directors is less than the number required by the PRC Company Law or two-thirds of the number specified in our Articles of Association;
|
|
·
|
where our unrecovered losses reach one-third of the total amount of our share capital;
|
|
|
·
|
where shareholder(s) holding 10% or more of our issued shares so request(s);
|
|
|
·
|
whenever our board deems necessary or our supervisory committee so requests; or
|
|
|
·
|
other circumstances as provided in the Articles of Association.
|
Resolutions proposed by shareholder(s) holding 3% or more of the total number of voting shares shall be included in the agenda for the relevant annual general meeting if (i) they are submitted to the board of directors no later than 10 days before the annual general meeting is to be held and (ii) they are matters which fall within the scope of the functions and powers of shareholders’ general meeting and have clear subject and concrete terms to be voted upon. The board of directors shall publish a supplementary notice of annual general meeting specifying the resolutions proposed to other shareholders. Upon publication of the supplementary notice, no alteration to the proposed resolutions or addition of other proposed resolutions will be accepted.
All shareholders’ meetings must be convened by our board by written notice given to shareholders not less than 45 days before the meeting. Based on the written replies received by us 20 days before a shareholders’ meeting, we shall calculate the number of voting shares represented by shareholders who have indicated that they intend to attend the meeting. When the number of voting shares represented by those shareholders amount to more than one-half of our total voting shares, we shall convene the shareholders’ general meeting. Otherwise, we shall, within five days before holding the shareholders’ general meeting, inform the shareholders again of the motions to be considered and the date and venue of the meeting by way of a public announcement. After the announcement is made, the shareholders’ meeting may be convened. The accidental omission by us to give notice of a meeting to, or the non-receipt of notice of a meeting by, a shareholder will not invalidate the proceedings at that shareholders’ meeting.
Shareholders at meetings have the power, among other things, to examine and approve our profit distribution plans and plans to recover losses, the annual budget, an increase or reduction of registered share capital, the reports of our board of directors and supervisory committee, the issuance of debentures, and the plans for merger, division, dissolution or liquidation; to elect or remove our directors and supervisors who are not elected as employees’ representatives; and to review and amend our Articles of Association. In addition, the rights of a class of shareholders may not be modified or abrogated, unless approved by a special resolution of shareholders at a general shareholders’ meeting and by a special resolution of shareholders of that class of shares at a separate meeting. Our Articles of Association enumerate, without limitation, certain amendments which would be deemed to be a modification or abrogation of the rights of a class of shareholders, including increasing or decreasing the number of shares of such class or the number of shares of a class with voting or distribution rights or privileges equal or superior to the shares of such class, removing or reducing rights to receive dividends in a particular currency, and creating shares with voting or distribution rights or privileges equal or superior to the shares of such class.
Each share is entitled to one vote on all such matters submitted to a vote of our shareholders at the shareholders’ general meetings, except for meetings of a special class of shareholders where only holders of shares of the affected class are entitled to vote on the basis of one vote per share of the affected class.
114
Shareholders are entitled to attend and vote at meetings either in person or by proxy. Proxies must be in writing and deposited at our legal address, or such other place as is specified in the meeting notice, not less than 24 hours before the start of the meeting at which the proxy proposes to vote or the time appointed for the passing of the relevant resolution(s). When the instrument appointing a proxy is executed by the shareholder’s attorney-in-fact, such proxy when deposited must be accompanied by a notary-certified copy of the relevant power of attorney or other authority under which the proxy was executed.
Except for those actions discussed below which require supermajority votes (“special resolutions”), resolutions of the shareholders are passed by a simple majority of the voting shares held by shareholders who are present in person or by proxy. Special resolutions must be passed by more than two-thirds of the voting shares held by shareholders who are present in person or by proxy.
The following decisions must be adopted by special resolution:
|
|
·
|
an increase or reduction of our registered share capital or the issuance of shares, including stock distributions, of any class, warrants and other similar securities;
|
|
|
·
|
issuance of debentures;
|
|
|
·
|
our division, merger, dissolution, liquidation and change of the legal form;
|
|
|
·
|
amendments to our Articles of Association;
|
|
|
·
|
acquisition or disposal of material assets or providing a guarantee in the amount exceeding 30% of our most recent audited total assets within one year;
|
|
|
·
|
adjustments to our profit distribution policy; and
|
|
|
·
|
any other matters our shareholders have resolved by way of an ordinary resolution at a general meeting to be of a nature which may have a material impact on us and should be adopted by special resolution.
|
In addition, amendments to the Articles of Association require the approval and consent of the relevant PRC authorities.
All other actions taken by the shareholders, including the appointment and removal of our directors and supervisors and the declaration of cash dividend payments, will be decided by an ordinary resolution of the shareholders.
Any shareholder resolution which is in violation of any laws or regulations of the PRC will be null and void.
Liquidation Rights
In the event of our liquidation, the ordinary shares held by overseas shareholders will rank pari passu with the ordinary shares held by the domestic shareholders, and any of our assets remaining after payments (in order of priority) of (a) the costs of liquidation (b) wages and social insurance fees payable to or for our employees for the past three years prior to the date of liquidation; (c) overdue taxes and tax surcharges, funds and other amounts payable pursuant to the applicable administrative regulations; and (d) bank loans, corporate bonds and other debts, will be divided among our shareholders in accordance with the class of shares and their proportional shareholdings.
Further Capital Call
Shareholders are not liable to make any further contribution to the share capital other than according to the terms, which were agreed to by the subscriber of the relevant shares at the time of subscription.
115
Increases in Share Capital and Preemptive Rights
The Articles of Association require the approval by a special resolution of the shareholders prior to authorizing, allotting, issuing or granting shares, securities convertible into shares or options, warrants or similar rights to subscribe for any shares or such convertible securities. New issues of shares must also be approved by the relevant PRC authorities.
Shareholders do not have preemptive rights with respect to new issues of shares of the Company.
Reduction of Share Capital and Purchase by Us of Our Shares and General Mandate to Repurchase Shares
We may reduce our registered share capital only upon obtaining the approval of the shareholders by a special resolution and, in certain circumstances, of relevant PRC authorities. The number of H Shares which may be purchased is subject to the Hong Kong Takeovers and Share Repurchase Codes.
Restrictions on Large or Controlling Shareholders
Our Articles of Association provide that, in addition to any obligation imposed by laws and administration regulations or required by the listing rules of the stock exchanges on which our shares are listed, a controlling shareholder shall not exercise his voting rights in a manner prejudicial to the interests of the shareholders generally or of some part of the shareholders:
|
|
(1)
|
to relieve a director or supervisor from his or her duty to act honestly in our best interests;
|
|
|
(2)
|
to approve the expropriation by a director or supervisor (for his or her own benefit or for the benefit of another person) of our assets in any way, including, without limitation, opportunities which may benefit us; or
|
|
|
(3)
|
to approve the expropriation by a director or supervisor (for his or her own benefit or for the benefit of another person) of the individual rights of other shareholders, including, without limitation, rights to distributions and voting rights (save according to a restructuring of our Company which has been submitted for approval by the shareholders in a general meeting in accordance with our Articles of Association).
|
A controlling shareholder, however, will not be precluded by our Articles of Association or any laws and administrative regulations or the listing rules of the stock exchanges on which our shares are listed from voting on these matters.
A controlling shareholder is defined by our Articles of Association as a shareholder whose capital contribution represents 50% or more of the total capital of our Company, or a shareholder whose shares represent 50% or more of the total issued share capital of our Company, or a shareholder whose capital contribution or shares are less than 50% but obtains significant voting rights to influence the result of the shareholder’s general meeting or the resolutions passed thereby.
Disclosure
The Listing Agreement imposes a requirement on us to keep the Hong Kong Stock Exchange, our shareholders and other holders of our listed securities informed as soon as reasonably practicable of any information relating to us and our subsidiaries, including information on any major new developments which are not public knowledge, which:
|
|
·
|
is necessary to enable them and the public to appraise the position of us and our subsidiaries;
|
|
|
·
|
is necessary to avoid the establishment of a false market in its securities; and
|
116
|
|
·
|
might be reasonably expected to materially affect market activity in and the price of its securities.
|
There are also requirements under the Listing Rules for us to obtain prior shareholders’ approval and/or to disclose to shareholders details of certain acquisitions or disposals of assets and other transactions (including transactions with controlling shareholders).
Sources of Shareholders’ Rights
The PRC’s legal system is based on written statutes and is a system in which decided legal cases have little precedent value. Prior to the effectiveness of the Company Law, the PRC did not have a comprehensive body of laws governing joint stock limited companies. The rights and obligations of our shareholders are principally contained in our constitutive documents and the Standard Opinion, under which we were established. In December 1993, the Standing Committee of the 8th National People’s Congress adopted the PRC Company Law, which superseded the Standard Opinion. In accordance with Article 229 of the Company Law, we must comply with the relevant requirements of the Company Law within an unspecified time period. As a result, we amended our Articles of Association pursuant to the Company Law on June 6, 1995. On October 27, 2005, the Company Law was amended by the Standing Committee of the 10th National People’s Congress, and came into force on January 1, 2006.
Currently, the primary sources of shareholder’s rights are our Articles of Association, as amended, the PRC Company Law and the Listing Rules of the Hong Kong Stock Exchange, which, among other things, impose certain standards of conduct, fairness and disclosure on us, our directors and our controlling shareholders. To facilitate the offering and listing of shares of PRC companies overseas, and to regulate the behavior of companies whose shares are listed overseas, the State Council Securities Committee and the State Commission for Restructuring the Economic System issued on August 27, 1994 the Mandatory Provisions for Articles of Association of Company Listing Overseas (the “Mandatory Provisions”). These Mandatory Provisions become entrenched in that, once they are incorporated into the Articles of Association of a PRC Company, any amendment to those provisions will only become effective after approval by the State-owned Assets Supervision and Administration Commission of the State Council. The Listing Rules require a number of additional provisions to the Mandatory Provisions to be included in the Articles of Association of PRC companies listing H Shares on the Hong Kong Stock Exchange (the “Additional Provisions”). The Mandatory Provisions and the Additional Provisions have been incorporated into our Articles of Association.
In addition, upon the listing of and for so long as the H Shares are listed on the Hong Kong Stock Exchange, we are subject to the relevant ordinances, rules and regulations applicable to companies listed on the Hong Kong Stock Exchange, including the Listing Rules of the Hong Kong Stock Exchange, the Securities (Disclosure of Interests) Ordinance (the “SDI Ordinance”), the Securities (Insider Dealing) Ordinance and the Hong Kong Codes on Takeovers and Mergers and Share Repurchases (the “Hong Kong Takeovers and Repurchase Codes”).
Enforceability of Shareholders’ Rights
There has not been any public disclosure in relation to the enforcement by holders of H Shares of their rights under constitutive documents of joint stock limited companies or the Company Law or in the application or interpretation of the PRC or Hong Kong regulatory provisions applicable to the PRC joint stock limited companies.
The Company Law, as amended in October 2005 and effective in January 2006, has granted shareholders with the rights to bring derivative suits. Within the Company Law, shareholders holding more than 1 percent of the shares of the company for more than 180 consecutive days are entitled to request the supervisory committee (in terms of directors and senior management) or the board of directors (in terms of supervisors) to bring legal proceedings, or bring legal proceedings in their own name on behalf of the company where it is in emergency and the company will be subject to irreparable loss if not to do so, against directors, supervisors or senior management
117
who fail to comply with the laws and regulations or the company’s Articles of Association in the course of performing their duties and cause loss to the company;
Our Articles of Association provide that all differences or claims:
|
|
·
|
between a holder of H Shares and us;
|
|
|
·
|
between a holder of H Shares and any of our directors, supervisors, general managers or other senior officers; or
|
|
|
·
|
between a holder of H Shares and a holder of domestic ordinary shares, arising from any provision of our Articles of Association, any right or obligation conferred or imposed by the Company Law or any other relevant law or administrative regulation which concerns our affairs
|
must, with certain exceptions, be referred to arbitration at either the China International Economic and Trade Arbitration Commission in the PRC or the Hong Kong International Arbitration Center. Our Articles of Association provide that such arbitration will be final and conclusive. In June 1999, an arrangement was made between the People’s Courts of the PRC and the courts of Hong Kong to mutually enforce arbitration rewards rendered in the PRC and Hong Kong according to their respective laws. This new arrangement was approved by the Supreme Court of the PRC and the Hong Kong Legislative Council and became effective on February 1, 2000.
The holders of H Shares will not be able to bring actions on the basis of violations of the Listing Rules and must rely on the Hong Kong Stock Exchange to enforce its rules. The SDI Ordinance establishes certain obligations in relation to disclosure of shareholder’s interests in Hong Kong listed companies, the violation of which is subject to prosecution by the Securities and Futures Commission of Hong Kong. The Hong Kong Takeovers and Repurchase Codes do not have the force of law and are the only standards of commercial conduct considered acceptable for takeover and merger transactions and share repurchases in Hong Kong as established by the Securities and Futures Commission and the securities and futures industry in Hong Kong.
We have appointed CT Corporation System, New York, as our agent to receive service of process with respect to any action brought against us in certain courts in New York under the United States federal and New York State’s securities laws. However, as the PRC does not have treaties providing for the reciprocal recognition and enforcement of judgments of courts within the United States, the United Kingdom, Japan or most other of the Organization for Economic Cooperation and Development countries, administrative actions brought by regulatory authorities, such as the Commission, and other actions which result in foreign court judgments, could (assuming such actions are not required by PRC law and the Articles of Association to be arbitrated) only be enforced in the PRC on a reciprocal basis or according to relevant international treaties to which China is a party if such judgments or rulings do not violate the basic principles of the law of the PRC or the sovereignty, security and public interest of the society of the PRC, as determined by a People’s Court of the PRC which has the jurisdiction for recognition and enforcement of judgments. We have been advised by our PRC counsel, Haiwen & Partners, that there is uncertainty as to the enforceability in the PRC of actions to enforce judgments of United States courts arising out of or based on the ownership of H Shares or ADSs, including judgments arising out of or based on the civil liability provisions of United States federal or state securities laws.
Restrictions on Transferability and the Share Register
As provided in the Articles of Associations we may refuse to register a transfer of H Shares listed on Hong Kong Stock Exchange unless:
|
|
·
|
a fee (for each instrument of transfer) of HK dollar 2.50, or any higher fee as agreed by the Hong Kong Stock Exchange, has been paid to us;
|
|
|
·
|
the instrument of transfer only involves H Shares;
|
118
|
|
·
|
the stamp duty chargeable on the instrument of transfer has been paid;
|
|
|
·
|
the relevant share certificate and upon the reasonable request of the board of directors, any evidence in relation to the right of the transferor to transfer the shares have been submitted;
|
|
|
·
|
if it is intended to transfer the shares to joint owners, then the maximum number of joint owners must not exceed four;
|
|
|
·
|
we do not have any lien on the relevant shares.
|
We are required to maintain an original share register for holders of H Shares in Hong Kong and a copy of the register at our legal address. Shareholders have the right to inspect and, for a reasonable charge, to copy the share register. No transfers of ordinary shares shall be recorded in our share register within 20 days prior to the date of a shareholders’ general meeting or within 5 days prior to the record date established for the purpose of distributing a dividend.
We have appointed Hong Kong Registrars Limited to act as the registrar of our H Shares. This registrar maintains our register of holders of H Shares in Hong Kong and enters transfers of shares in such register upon the presentation of the documents described above.
|
C.
|
Material contracts
|
See “Item 7. Major Shareholders and Related Party Transactions — B. Related Party Transactions” for certain arrangements we have entered into with HIPDC and Huaneng Group.
|
D.
|
Exchange controls
|
The existing foreign exchange regulations have significantly reduced government foreign exchange controls for transactions under the current account, including trade and service related foreign exchange transactions and payment of dividends. We may undertake current account foreign exchange transactions without prior approval from the State Administration of Foreign Exchange or its local branch offices. The PRC Government has stated publicly that it intends to make the Renminbi freely convertible in the future. However, we cannot predict whether the PRC Government will continue its existing foreign exchange policy and when the PRC Government will allow free conversion of Renminbi to foreign currency.
Foreign exchange transactions under the capital account, under most circumstances, including principal payments in respect of foreign currency-denominated obligations, continue to be subject to significant foreign exchange controls and require the approval of the State Administration of Foreign Exchange or its local branch offices. These limitations could affect our ability to obtain foreign exchange through debt or equity financing, or to obtain foreign exchange for capital expenditures.
The conversion of Renminbi into foreign currencies, including U.S. dollars, is based on rates set by the PBOC. On July 21, 2005, the PRC government introduced a floating exchange rate system to allow the value of Renminbi to fluctuate within a regulated band based on market supply and demand and by reference to a basket of foreign currencies. Renminbi appreciated by more than 20% against the U.S. dollar between July 2005 and July 2008. Between July 2008 and June 2010, this appreciation halted and the exchange rate between the Renminbi and the U.S. dollar remained within a narrow band. On June 19, 2010, the PBOC decided to further promote the reform of the Renminbi exchange rate formation mechanism, and improve the flexibility of the Renminbi exchange rate. Since June 2010, Renminbi has regained steady appreciation against the U.S. dollar, which was reversed by slight depreciation of the Renminbi against the U.S. dollar at the turn to and early 2014. On March 15, 2014, the PBOC announced to further widen the Remninbi’s daily trading band against the U.S. dollar from 1% to 2% on either side of the daily reference rate, allowing for greater fluctuations of the exchange rate. It is difficult to predict how market
119
forces or PRC or U.S. government policy may impact the exchange rate between the Renminbi and the U.S. dollar in the future. There remains significant international pressure on the PRC Government to further liberalize its currency policy, which could result in further fluctuations in the value of the Renminbi against the U.S. dollar. However, there is no assurance that there will not be a devaluation of Renminbi in the future. If there is such a devaluation, our debt servicing cost will increase and the return to our overseas investors may decrease.
The following table sets forth information concerning exchange rates between the Renminbi and the U.S. dollar for the periods indicated:
|
|
|
Noon Buying Rate
|
|
|||||||||||||||
|
Period
|
|
End
|
|
|
Average(1)
|
|
|
High
|
|
|
Low
|
|
||||||
|
|
|
|
|
|
|
|
(RMB per US$1.00)
|
|
|
|
|
|||||||
|
2011
|
|
|
|
|
6.2939
|
|
|
|
6.4475
|
|
|
|
6.2939
|
|
|
|
6.6364
|
|
|
2012
|
|
|
|
|
6.2301
|
|
|
|
6.2990
|
|
|
|
6.2221
|
|
|
|
6.3879
|
|
|
2013
|
|
|
|
|
6.0537
|
|
|
|
6.1412
|
|
|
|
6.0537
|
|
|
|
6.2438
|
|
|
2014
|
|
|
|
|
6.2046
|
|
|
|
6.1704
|
|
|
|
6.0402
|
|
|
|
6.2591
|
|
|
2015
|
|
|
|
|
6.4778
|
6.2869
|
6.4896
|
6.1870
|
|
|||||||||
|
|
|
October
|
|
|
6.3180
|
6.3505
|
6.3591
|
6.3180
|
|
|||||||||
|
|
|
November
|
|
|
6.3883
|
6.3640
|
6.3945
|
6.3180
|
|
|||||||||
|
|
|
December
|
|
|
6.4778
|
6.4491
|
6.4896
|
6.3883
|
|
|||||||||
|
2016
|
|
January
|
|
|
6.5752
|
6.5726
|
6.5932
|
6.5219
|
|
|||||||||
|
|
|
February
|
|
|
6.5525
|
6.5501
|
6.5795
|
6.5154
|
|
|||||||||
|
|
|
March
|
|
6.4480
|
6.5027
|
6.5500
|
6.4480
|
|
||||||||||
|
|
|
April (through April 8, 2016)
|
|
6.4628
|
6.4720
|
6.4780
|
6.4599
|
|
||||||||||
__________________________________
Source: Federal Reserve Statistical Release, Board of Governors of the Federal Reserve System.
Note:
|
(1)
|
Annual averages are calculated by using the average of the exchange rates on the last day of each month during the relevant year. Monthly averages are calculated by using the average of the daily rates during the relevant month.
|
|
E.
|
Taxation
|
The following is a summary of (i) certain tax consequences from acquiring, owning and disposing of the H Shares and ADSs based on tax laws of the PRC, the United States and the Income Tax Treaty between the PRC and the United States (the “Tax Treaty”) as in effect on the date of this annual report, and is subject to changes in PRC or United States law, including changes that could have retroactive effect, and (ii) the principal PRC taxes to which we are subject. The following summary does not take into account or discuss the tax laws of any countries or regions other than the PRC and the United States, nor does it take into account the individual circumstances of an investor. This summary does not purport to be a complete technical analysis or examination of all potential tax effects relevant to an investment in the H Shares or ADSs and current and prospective investors in all jurisdictions of the H Shares or ADSs are advised to consult their tax advisors as to PRC, United States or other tax consequences of the purchase, ownership and disposition of the H Shares or ADSs. This summary also does not purport to be a complete technical analysis or examination of all potential PRC taxes that may be levied upon us.
PRC tax considerations
Tax on dividends
Individual investors
According to the current PRC tax regulations, dividends paid by PRC companies to individual investors are ordinarily subject to a PRC withholding tax levied at a flat rate of 20%. For a foreign individual who has no domicile or does not stay in the territory of China or who has no domicile but has stayed in the territory of China for less than one year, the receipt of dividends from a company in China is normally subject to a withholding tax of 20% unless reduced or exempted by applicable laws and tax treaties.
120
Enterprises
In accordance with the New Enterprise Income Tax Law that became effective on January 1, 2008, dividends derived from the revenues accumulated from January 1, 2008 and paid by PRC companies to non-resident enterprises are generally subject to a PRC withholding tax levied at a rate of 10% unless exempted or reduced pursuant to an applicable double-taxation treaty or other exemptions. Dividends paid by PRC companies to resident enterprises, including enterprises established under the laws of non-PRC jurisdictions but whose “de facto management body” is located in the PRC, are not subject to any PRC withholding tax, unless the dividends are derived from the publicly traded shares which have not been held continuously by the resident enterprises for twelve months. According to the Notice on the Issues Concerning Withholding the Enterprise Income Tax on the Dividends Paid by Chinese Resident Enterprise to H Share Holders Which Are Overseas Non-resident Enterprises issued by the State Administration of Taxation on November 6, 2008, Chinese resident enterprises are required to withhold PRC enterprise income tax at the rate of 10% on dividends paid for 2008 and later years payable to their respective H Shares holders who are non-resident enterprises.
Capital gains tax on sales of shares
In accordance with the New Enterprise Income Tax Law, capital gains realized by foreign enterprises which are non-resident enterprises in China upon the sale of overseas shares are generally subject to a PRC withholding tax levied at a rate of 10%, unless exempted or reduced pursuant to an applicable double-taxation treaty or other exemptions. The capital gains realized by resident enterprises, including enterprises established under the laws of non-PRC jurisdictions but whose “de facto management body” is located in the PRC, upon the sales of overseas shares are subject to the PRC enterprise income tax.
Tax treaties
Non-PRC Investors residing in countries which have entered into double-taxation treaties with the PRC may be entitled to a reduction of the withholding tax imposed on the payment of dividends to such Foreign Holders of us. The PRC currently has double-taxation treaties with a number of countries, including Australia, Canada, France, Germany, Japan, Malaysia, the Netherlands, Singapore, the United Kingdom and the United States.
Stamp tax
Under the Provisional Regulations of The People’s Republic of China Concerning Stamp Tax, which became effective in October 1988, PRC stamp tax should not be imposed on the transfer of H Shares or ADSs of PRC publicly traded companies.
Taxation of the Company
Income tax
Prior to January 1, 2008, according to the relevant income tax law, foreign invested enterprises were, in general, subject to a statutory income tax of 33% (30% enterprise income tax and 3% local income tax). If these enterprises are located in certain specified locations or cities, or are specifically approved by the State Administration of Taxation, a lower tax rate would be applied. Effective from January 1, 1999, in accordance with the practice notes on the PRC income tax laws applicable to foreign invested enterprises investing in energy and transportation infrastructure businesses, a reduced enterprise income tax rate of 15% (after the approval of State Administration of Taxation) was applicable across the country. We applied this rule to all of our wholly owned operating power plants after obtaining the approval of the State Administration of Taxation. In addition, certain power plants were exempted from the enterprise income tax for two years starting from the first profit-making year, after offsetting all tax losses carried forward from the previous years (at most of five years), followed by a 50% reduction of the applicable tax rate for the next three years. The statutory income tax was assessed individually based on each of their results of operations.
121
On March 16, 2007, the Enterprise Income Tax Law of PRC, or the New Enterprise Income Tax Law, was enacted, and became effective on January 1, 2008. The New Enterprise Income Tax Law imposes a uniform income tax rate of 25% for domestic enterprises and foreign invested enterprises. Therefore, our power plants that were subject to a 33% income tax rate prior to January 1, 2008 are subject to a lower tax rate of 25% starting on January 1, 2008. With regard to our power plants entitled to a reduced enterprise income tax rate of 15% prior to January 1, 2008, their effective tax rate is being gradually increased to 25% within a five-year transition period commencing on January 1, 2008. Accordingly, the effective tax rate of our wholly owned power plants will increase over time. In addition, although our power plants entitled to tax exemption and reduction under the income tax laws and regulations that are effective prior to the New Enterprise Income Tax Law will continue to enjoy such preferential treatments until the expiration of the same, newly established power plants will not be able to benefit from such tax incentives, unless they can satisfy specific qualifications, if any, provided by then effective laws and regulations on preferential tax treatment.
Pursuant to Measures for the Collection and Administration of Consolidated Payment of Enterprises Income Tax on Trans-Regional Operation, effective on January 1, 2013, the Company and its branches calculate and pay income tax on a combined basis according to relevant tax laws and regulations. The income tax of subsidiaries remains to be calculated individually based on their individual operating results.
Value-added tax
Since January 1, 1994, the government has implemented a turnover tax system applicable to FIEs. Under the turnover tax provisions, we have to collect from our electricity customers and pay to the PRC tax authorities a value-added tax (“VAT”) on our sales. The tax rate on sales of electricity by us is 17% of total sales. The amount of VAT payable by us is the VAT on sales reduced by the VAT paid by us on our purchases of coal, fuel and other inputs.
Effective from January 1, 2009, VAT payers are allowed to credit against output VAT in respect of input VAT on fixed assets purchased or self-manufactured based on the relevant VAT credit receipts in accordance with the revised VAT regulations and its implementation rules.
In addition, effective from August 1, 2012, according to the relevant regulations of Ministry of Finance of PRC and State Administration of Taxation, nine pilot regions including Shanghai, Beijing, Tianjin, Jiangsu Province, Anhui Province, Zhejiang Province, Fujian Province, Hubei Province and Guangdong Province have been under the pilot program for the transformation from Business Tax to VAT since January 1, 2012 and all other regions have been since August 1, 2013 for specified industry. The applicable tax rate of VAT for the Company and its subsidiaries in respect of the lease of tangible movable properties, transportation industry and other modern services industries are 17%, 11% and 6%, respectively.
United States federal income tax considerations
The following discussion is a summary of United States federal income tax considerations relating to the ownership and disposition of our H shares or ADSs by a U.S. Holder (as defined below). This discussion is based upon existing United States federal income tax law, which is subject to differing interpretations or change, possibly with retroactive effect. This discussion does not address all aspects of United States federal income taxation which may be important to particular holders in light of their particular circumstances, such as holders subject to special tax rules including: banks or other financial institutions, insurance companies, broker-dealers, traders in securities that elect mark-to-market treatment, partnerships and their partners, regulated investment companies, real estate investment trusts, cooperatives, pension plans, tax-exempt organizations (including private foundations), holders who are not U.S. Holders, holders who own (directly, indirectly, or constructively) 10% or more of the voting power or value of our stock, holders that hold H shares or ADSs as part of a straddle, hedge, conversion, constructive sale, or other integrated transaction for United States federal income tax purposes, holders who acquired their ADSs or H shares pursuant to any employee share option or otherwise as compensation, or holders that have a functional currency other than the United States dollar, all of whom may be subject to tax rules that differ significantly from
122
those summarized below. In addition, this discussion does not address any state, local, non-United States, non-income tax (such as the United States federal gift and estate tax), or alternative minimum tax considerations or the Medicare tax. This discussion only addresses holders that hold their H shares or ADSs as “capital assets” (generally, property held for investment) under the United States Internal Revenue Code of 1986, as amended (the “Code”). U.S. Holders are urged to consult their tax advisors regarding the United States federal, state, local, and non-United States income and other tax considerations relating to the ownership and disposition of our H shares or ADSs.
For purposes of this summary, a U.S. Holder is a beneficial owner of H shares or ADSs that is, for United States federal income tax purposes:
|
|
·
|
an individual who is a citizen or resident of the United States;
|
|
|
·
|
a corporation (or other entity treated as a corporation for United States federal income tax purposes) created in or organized under the laws of the United States or any State thereof or the District of Columbia;
|
|
|
·
|
an estate the income of which is includible in gross income for United States federal income tax purposes regardless of its source; or
|
|
|
·
|
a trust (a) the administration of which is subject to the primary supervision of a United States court and which has one or more United States persons who have the authority to control all substantial decisions of the trust or (b) a trust that has otherwise elected to be treated as a United States person under the Code.
|
If a partnership (including any entity treated as a partnership for United States federal income tax purposes) is a beneficial owner of H shares or ADSs, the tax treatment of a partner in such partnership will depend upon the status of the partner and the activities of the partnership. Partnerships and partners of a partnership holding our H shares or ADSs are urged to consult their tax advisors regarding the United States federal income tax considerations relating to the ownership and disposition of our H shares or ADSs.
For United States federal income tax purposes, it is generally expected that a U.S. Holder of ADSs will be treated as the beneficial owner of the underlying shares represented by the ADSs. The remainder of this discussion assumes that a holder of ADSs will be treated in this manner. Accordingly, deposits or withdrawals of H shares for ADSs will generally not be subject to United States federal income tax.
Passive Foreign Investment Company Considerations
A non-United States corporation, such as our Company, will be a “passive foreign investment Company” (a “PFIC”), for United States federal income tax purposes for any taxable year, if either (a) 75% or more of its gross income for such year consists of certain types of “passive” income or (b) 50% or more of its average quarterly assets as generally determined on the basis of fair market value during such year produce or are held for the production of passive income. For this purpose, cash and assets readily convertible into cash are categorized as passive assets and the Company’s unbooked intangibles are taken into account for determining the value of its assets. We will be treated as owning a proportionate share of the assets and earning a proportionate share of the income of any other corporation in which we own, directly or indirectly, more than 25% (by value) of the stock.
We do not believe that we were classified as a PFIC for the taxable year ended December 31, 2015. The determination of whether we will be or become a PFIC will depend, in part, upon the composition of our income and our assets (which are subject to change from year to year) and the market price of our ADSs (of which we cannot control). Although we do not expect that our business plans will change in a manner that will affect our PFIC status, no assurance can be given in this regard. Because there are uncertainties in the application of the relevant rules and PFIC status is a fact-intensive determination made on an annual basis, no assurance may be given with respect to our PFIC status for any taxable year.
123
The discussion below under “Dividends” and “Sale or Other Disposition” of H shares or ADSs assumes that we will not be classified as a PFIC for United States federal income tax purposes. See the discussion below under the heading “Passive Foreign Investment Company Rules” for a brief summary of the PFIC rules.
Dividends
The gross amount of any cash distributions (including the amount of any tax withheld) paid on our H shares or ADSs out of our current or accumulated earnings and profits, as determined under United States federal income tax principles, will be subject to tax as dividend income on the day actually or constructively received by a U.S. Holder, in the case of H shares, or by the depositary bank, in the case of ADSs. Because we do not intend to determine our earnings and profits on the basis of United States federal income tax principles, any distribution paid will generally be reported as a “dividend” for United States federal income tax purposes. A non-corporate recipient of dividend income will generally be subject to tax on dividend income from a “qualified foreign corporation” at a reduced capital gains rate rather than the marginal tax rates generally applicable to ordinary income provided that certain holding period requirements are met.
A non-U.S. corporation (other than a corporation that is classified as a PFIC for the taxable year in which the dividend is paid or the preceding taxable year) generally will be considered to be a qualified foreign corporation (i) if it is eligible for the benefits of a comprehensive tax treaty with the United States which the Secretary of Treasury of the United States determines is satisfactory for purposes of this provision and which includes an exchange of information program or (ii) with respect to any dividend it pays on stock which is readily tradable on an established securities market in the United States. There is currently a tax treaty in effect between the United States and the People’s Republic of China (the “U.S.-PRC Treaty”) which the Secretary of Treasury of the United States determined is satisfactory for these purposes and we believe that we are eligible for the benefits of such treaty. Additionally, our ADSs (but not our H shares) trade on the New York Stock Exchange, an established securities market in the United States and the ADSs are expected to be readily tradable for so long as they continue to be listed on the New York Stock Exchange. Thus, while we presently believe that we are a qualified foreign corporation for purposes of the reduced treaty rate, there can be no assurance that the dividends we pay on our H shares or ADSs will meet the conditions required for the reduced tax rate in the current taxable year or future taxable years. Dividends received on H shares or ADSs will not be eligible for the dividends received deduction allowed to corporations. U.S. Holders are urged to consult their tax advisors regarding the rate of tax that will apply to them with respect to dividends (if any) received from U.S.
Dividends paid in non-United States currency will be includible in income in a United States dollar amount based on the exchange rate prevailing at the time of receipt of such dividends by the depositary, in the case of ADSs, or by the U.S. Holder, in the case of H shares held directly by such U.S. Holder, regardless of whether the non-United States currency is actually converted into United States dollars at that time. Gain or loss, if any, recognized on a subsequent sale, conversion or other disposition of the non-United States currency will generally be United States source income or loss.
Dividends received on H shares or ADSs will generally be treated, for United States foreign tax credit purposes, as foreign source income and generally will constitute passive category income. A U.S. Holder may be eligible, subject to a number of complex limitations, to claim a foreign tax credit in respect of any non-United States withholding taxes imposed on dividends received on H shares or ADSs. U.S. Holders who do not elect to claim a foreign tax credit for foreign income tax withheld may instead claim a deduction, for United States federal income tax purposes, in respect of such withholdings, but only for a year in which the U.S. Holder elects to do so for all creditable foreign income taxes. U.S. Holders are urged to consult their tax advisors regarding the availability of the foreign tax credit under their particular circumstances.
Sale or Other Disposition of H shares or ADSs
A U.S. Holder will generally recognize capital gain or loss upon the sale or other disposition of H shares or ADSs in an amount equal to the difference between the amount realized upon the disposition and the U.S. Holder’s adjusted tax basis in such H shares or ADSs. Any capital gain or loss will be long-term if the H shares or ADSs have
124
been held for more than one year and will generally be United States source gain or loss for United States foreign tax credit purposes. If any PRC tax were to be imposed on any gain from the disposition of H shares or ADSs between U.S. Holder that is eligible for the benefits of the U.S.PRC Treaty may elect to treat the gain as non-United States source gain or loss. The deductibility of a capital loss may be subject to limitations. U.S. Holders are urged to consult their tax advisors regarding the tax credit purposes if a non-U.S. withholding tax is imposed on a disposition of our H shares or ADSs, including the availability of the foreign tax credit under their particular circumstances.
U.S. Holders that receive currency other than the United States dollar upon the sale or other disposition of H shares will realize an amount equal to the United States dollar value of the non-United States currency on the date of such sale or other disposition, or if the shares are traded on an established securities market, in the case of cash basis and electing accrual basis taxpayers, the settlement date. U.S. Holders will recognize currency gain or loss if the United States dollar value of the currency received on the settlement date differs from the amount realized. U.S. Holders will have a tax basis in the currency received equal to the United States dollar amount at the spot rate on the settlement date. Generally, any gain or loss realized by U.S. Holders on a subsequent conversion or disposition of such currency will be United States source ordinary income or loss.
Passive Foreign Investment Company Rules
If we were to be classified as a PFIC in any taxable year, a special tax regime will apply to both (a) any “excess distribution” by us to a U.S. Holder (generally, the U.S. Holder’s ratable portion of distributions in any year which are greater than 125% of the average annual distribution received by such U.S. Holder in the shorter of the three preceding years or the U.S. Holder’s holding period for our H shares or ADSs) and (b) any gain realized on the sale or other disposition of the H shares or ADSs. Under this regime, any excess distribution and realized gain will be treated as ordinary income and will be subject to tax as if (a) the excess distribution or gain had been realized ratably over the U.S. Holder’s holding period, (b) the amount deemed realized in each year had been subject to tax in each year of that holding period at the highest marginal rate for such year (other than income allocated to the current period or any taxable period before we became a PFIC, which would be subject to tax at the U.S. Holder’s regular ordinary income rate for the current year and would not be subject to the interest charge discussed below), and (c) the interest charge generally applicable to underpayments of tax had been imposed on the taxes deemed to have been payable in those years. In addition, dividends made to a U.S. Holder will not qualify for the lower rates of taxation applicable to long-term capital gains discussed above under “Dividends”.
The above results may be eliminated if a “mark-to-market” election is available and a U.S. Holder validly makes such an election. If the election is made, such holder generally will be required to take into account the difference, if any, between the fair market value and its adjusted tax basis in H shares or ADSs at the end of each taxable year as ordinary income or ordinary loss (to the extent of any net mark-to-market gain previously included in income). In addition, any gain from a sale or other disposition of H shares or ADSs will be treated as ordinary income, and any loss will be treated as ordinary loss (to the extent of any net mark-to-market gain previously included in income).
We do not intend to provide information necessary for U.S. Holders to make qualified electing fund elections, which, if available, would result in tax treatment different from (and generally less adverse than) the general tax treatment for PFICs described above.
As discussed above under “Dividends,” dividends that we pay on the ADSs or our H shares will not be eligible for the reduced tax rate that applies to qualified dividend income if we are a PFIC for the taxable year in which the dividend is paid or the preceding taxable year. In addition, if a U.S. Holder owns the ADSs or our H shares during any taxable year that we are a PFIC, such holder would generally be required to file an annual IRS Form 8621. Each U.S. Holder is advised to consult its tax advisors regarding the potential tax consequences to such holder if we are or become a PFIC, including the possibility of making a mark-to-market election.
Information Reporting
125
U.S. Holders may be subject to information reporting to the United States Internal Revenue Service with respect to dividends on and proceeds from the sale or other disposition of our H shares or ADSs. U.S. Holders are urged to consult their tax advisors regarding the application of the United States information reporting and backup rules to their particular circumstances.
Certain U.S. Holders who hold “specified foreign financial assets”, including stock of a non-U.S. corporation that is not held in an account maintained by a U.S. “financial institution”, whose aggregate value exceeds $50,000 during the tax year, may be required to attach to their tax returns for the year certain specified information. An individual who fails to timely furnish the required information may be subject to a penalty. U.S. Holders are urged to consult their tax advisors regarding their reporting obligations under this legislation.
|
F.
|
Dividends and paying agents
|
Not applicable.
|
G.
|
Statement by experts
|
Not applicable.
|
H.
|
Documents on display
|
We are subject to the information reporting requirements of the Securities Exchange Act of 1934 (the “Exchange Act”) and, in accordance with the Act, file certain reports and other information with the SEC. You may read and copy any report, statement or other information filed by us at the SEC’s public reference rooms in Washington, D.C., New York and Chicago, Illinois. Please call the SEC at 1-800-0330 for further information on the public reference rooms. Our reports and other information filed with the SEC are also available to the public from commercial document retrieval services and the website maintained by the SEC at http://www.sec.gov.
|
I.
|
Subsidiary information
|
Not applicable.
|
ITEM 11
|
Quantitative and Qualitative Disclosures About Market Risk
|
Our primary market risk exposures are fluctuations of fuel prices, foreign exchange rates and interest rates.
Equity price risk
The available-for-sale financial assets of the Company and its subsidiaries are exposed to equity security price risk.
Detailed information relating to the available-for-sale financial assets is disclosed in Note 10 to the financial statements. The Company has a supervisor in the supervisory committee of the most significant investment in available-for-sale financial assets (China Yangtze Power Co., Ltd.) and may exercise protective rights. The Company also closely monitors the pricing trends in the open market in determining its long-term strategic stakeholding decisions.
The Company and its subsidiaries are exposed to fuel price risk on fuel purchases. In particular, SinoSing Power and its subsidiaries use fuel oil swap to hedge against such a risk and designate them as cash flow hedges. Please refer to Note 14 to the financial statements for details.
Foreign exchange rate risk
126
A portion of our Renminbi revenues are converted into other currencies to (i) repay our debts denominated in currencies other than RMB, and (ii) pay for imported equipment.
The exchange rate of Renminbi to foreign currencies may fluctuate and is affected by, among other things, changes in China’s political and economic conditions. The conversion of Renminbi into foreign currencies, including U.S. dollars, is based on rates set by the PBOC. On July 21, 2005, the PRC government introduced a floating exchange rate system to allow the value of Renminbi to fluctuate within a regulated band based on market supply and demand and by reference to a basket of foreign currencies. Renminbi appreciated by more than 20% against the U.S. dollar between July 2005 and July 2008. Between July 2008 and June 2010, this appreciation halted and the exchange rate between the Renminbi and the U.S. dollar remained within a narrow band. On June 19, 2010, the PBOC decided to further promote the reform of the Renminbi exchange rate formation mechanism, and improve the flexibility of the Renminbi exchange rate. Since June 2010, the Renminbi has regained steady appreciation against the U.S. dollar, which was reversed by a slight depreciation of Renminbi against the U.S. dollar at the turn to and early 2014. On March 15, 2014, the PBOC announced to further widen the Remninbi’s daily trading band against the U.S. dollar from 1% to 2% on either side of the daily reference rate, allowing for greater fluctuations of the exchange rate. It is difficult to predict how market forces or PRC or U.S. government policy may impact the exchange rate between the Renminbi and the U.S. dollar in the future. There remains significant international pressure on the PRC Government to further liberalize its currency policy. We cannot assure you that any future movements in the exchange rate of the Renminbi against the U.S. dollar and other currencies will not adversely affect our results of operations and financial conditions.
SinoSing Power and its subsidiaries are exposed to foreign exchange risk on fuel purchases that is denominated primarily in U.S. dollars. They use forward exchange contracts to hedge almost all of their estimated foreign exchange exposure in respect of forecast fuel purchases over the following three months. The Company and its subsidiaries account for their forward foreign currency contracts as cash flow hedges.
The following table provides information, by maturity date, regarding our foreign currency sensitive financial instruments, which consist of bank balances and cash, short-term and long-term debt obligations, capital commitments and forward exchange contracts as of December 31, 2015 and average interest rates for the year ended December 31, 2015.
(RMB expressed in millions, except interest rate and exchange rate)
|
|
|
As of December 31, 2015
|
|
|||||||||||||||||||||||||||||
|
|
|
Expected Maturity Date
|
|
|
Total
|
|
|
Fair Value
|
|
|||||||||||||||||||||||
|
|
|
2016
|
|
|
2017
|
|
|
2018
|
|
|
2019
|
|
|
2020
|
|
|
Thereafter
|
|
|
|
|
|
|
|
||||||||
|
On-balance sheet financial instruments
|
|
|
|
|
|
|
|
|
|
|
|
|
|
|
|
|
|
|
|
|
|
|
|
|
||||||||
|
Bank balances and cash:
|
|
|
|
|
|
|
|
|
|
|
|
|
|
|
|
|
|
|
|
|
|
|
|
|
||||||||
|
In U.S. Dollar
|
|
|
560
|
-
|
-
|
-
|
-
|
-
|
560
|
560
|
|
|||||||||||||||||||||
|
In Japanese Yen
|
|
|
0.205
|
-
|
-
|
-
|
-
|
-
|
0.205
|
0.205
|
|
|||||||||||||||||||||
|
In Hong Kong Dollar
|
|
|
0.128
|
-
|
-
|
-
|
-
|
-
|
0.128
|
0.128
|
|
|||||||||||||||||||||
|
|
|
|
|
|||||||||||||||||||||||||||||
|
Debts
|
|
|
|
|||||||||||||||||||||||||||||
|
Fixed rate bank loans
|
|
|
|
|||||||||||||||||||||||||||||
|
(Japanese Yen)
|
|
|
6
|
6
|
6
|
6
|
6
|
122
|
152
|
81
|
|
|||||||||||||||||||||
|
Average interest rate
|
|
|
1.380
|
1.380
|
1.380
|
1.380
|
1.380
|
1.380
|
—
|
—
|
|
|||||||||||||||||||||
127
|
|
|
As of December 31, 2015
|
|
|||||||||||||||||||||||||||||
|
|
|
Expected Maturity Date
|
|
|
Total
|
|
|
Fair Value
|
|
|||||||||||||||||||||||
|
|
|
2016
|
|
|
2017
|
|
|
2018
|
|
|
2019
|
|
|
2020
|
|
|
Thereafter
|
|
|
|
|
|
|
|||||||||
|
Fixed rate bank loans(Euro)
|
|
|
66
|
66
|
60
|
42
|
32
|
78
|
344
|
288
|
|
|||||||||||||||||||||
|
Average interest rate
|
|
|
2.085
|
2.085
|
2.079
|
2.048
|
2.014
|
2.013
|
—
|
—
|
|
|||||||||||||||||||||
|
|
|
|
|
|||||||||||||||||||||||||||||
|
Variable rate bank and other loans
|
|
|
|
|||||||||||||||||||||||||||||
|
(U.S. Dollar)
|
|
|
389
|
389
|
389
|
389
|
389
|
1,125
|
3,070
|
3,070
|
|
|||||||||||||||||||||
|
Average interest rate
|
|
|
1.380
|
1.380
|
1.380
|
1.380
|
1.380
|
1.380
|
—
|
—
|
|
|||||||||||||||||||||
|
|
|
|
|
|
|
|
|
|
|
|
|
|
|
|
|
|
|
|
|
|
|
|
|
|
|
|
|
|
|
|
|
|
|
Gas purchase commitments (U.S. Dollar)
|
|
|
3,579
|
3,621
|
3,621
|
3,621
|
3,631
|
14,502
|
32,575
|
32,575
|
|
|
|
|
As of December 31, 2015
|
|
|||||||||||||||||||||||||||||
|
|
|
Expected Maturity Date
|
|
|
Total
|
|
|
Fair Value
|
|
|||||||||||||||||||||||
|
|
|
2016
|
|
|
2017
|
|
|
2018
|
|
|
2019
|
|
|
2020
|
|
|
Thereafter
|
|
|
|
|
|
|
|
||||||||
|
Forward exchange contracts
(Receive US $ / Pay S$)
|
|
|
|
|
|
|
|
|
|
|
|
|
|
|
|
|
|
|
|
|
|
|
|
|
|
|
|
|
|
|
|
|
|
Contract amount
|
|
|
2,105
|
528
|
140
|
27
|
-
|
-
|
2,800
|
139
|
|
|||||||||||||||||||||
|
Average Contractual Exchange Rate
|
|
|
1.36
|
1.34
|
1.37
|
1.39
|
-
|
-
|
—
|
—
|
|
|||||||||||||||||||||
|
|
|
As of December 31, 2014
|
|
|||||||||||||||||||||||||||||
|
|
|
Expected Maturity Date
|
|
|
Total
|
|
Fair Value
|
|
||||||||||||||||||||||||
|
|
|
2015
|
|
2016
|
|
2017
|
|
2018
|
|
2019
|
|
Thereafter
|
|
|
|
|
|
|
||||||||||||||
|
On-balance sheet financial instruments
|
|
|||||||||||||||||||||||||||||||
|
Bank balances and cash:
|
|
|
|
|
|
|
|
|
|
|
|
|
|
|
|
|
|
|
|
|
|
|
|
|
||||||||
|
In U.S.Dollar
|
|
|
753
|
|
|
-
|
|
|
|
-
|
|
|
|
-
|
|
|
-
|
|
|
-
|
753
|
753
|
|
|||||||||
|
In Japanese Yen
|
|
|
0.004
|
-
|
-
|
-
|
-
|
-
|
0.004
|
0.004
|
|
|||||||||||||||||||||
|
In Hong Kong Dollar
|
|
|
2,445
|
-
|
-
|
-
|
-
|
-
|
2,445
|
2,445
|
|
|||||||||||||||||||||
|
|
|
|
|
|||||||||||||||||||||||||||||
|
Debts
|
|
|
|
|||||||||||||||||||||||||||||
|
Fixed rate bank loans
|
|
|
|
|||||||||||||||||||||||||||||
|
(U.S. Dollar)
|
|
|
16
|
-
|
-
|
-
|
-
|
-
|
16
|
16
|
|
|||||||||||||||||||||
|
Average interest rate
|
|
|
6.360
|
-
|
-
|
-
|
-
|
-
|
—
|
—
|
|
|||||||||||||||||||||
|
|
|
|
|
|||||||||||||||||||||||||||||
|
Fixed rate bank loans(Euro)
|
|
|
70
|
70
|
70
|
63
|
44
|
115
|
432
|
373
|
|
|||||||||||||||||||||
|
Average interest rate
|
|
|
2.065
|
2.065
|
2.065
|
2.071
|
2.102
|
2.137
|
—
|
—
|
|
|||||||||||||||||||||
|
|
|
|
|
|||||||||||||||||||||||||||||
|
Variable rate bank and other loans
|
|
|
|
|||||||||||||||||||||||||||||
|
(U.S. Dollar)
|
|
|
408
|
389
|
389
|
389
|
389
|
1,334
|
3,298
|
3,298
|
|
|||||||||||||||||||||
|
Average interest rate
|
|
|
1.696
|
1.740
|
1.740
|
1.740
|
1.740
|
1.740
|
—
|
—
|
|
|||||||||||||||||||||
|
|
|
|
|
|||||||||||||||||||||||||||||
|
Gas purchase commitments (U.S. Dollar)
|
|
|
6,247
|
6,247
|
6,336
|
6,336
|
6,336
|
33,529
|
65,031
|
65,031
|
|
128
|
|
|
Expected Maturity Date
|
|
Total
|
|
Fair Value
|
||||||||||||||||||||||||||
|
|
|
2015
|
|
2016
|
|
2017
|
|
2018
|
|
2019
|
|
Thereafter
|
|
|
|
|
|
|
||||||||||||||
|
Forward exchange contracts
(Receive US$/Pay S$)
|
|
|
|
|
|
|
|
|
|
|
|
|
|
|
|
|
|
|
|
|
|
|
|
|
|
|
|
|
|
|
|
|
|
Contract amount
|
|
|
2,481
|
688
|
182
|
-
|
-
|
-
|
3,351
|
117
|
|
|||||||||||||||||||||
|
Average Contractual Exchange Rate
|
|
|
1.28
|
1.26
|
1.26
|
-
|
-
|
-
|
—
|
—
|
|
|||||||||||||||||||||
|
|
|
|
|
|
|
|
|
|
|
|
|
|
|
|
|
|
|
|
|
|
|
|
|
|
|
|
|
|
|
|
|
|
Note:
|
(1)
|
The interest rates for variable rate bank and other loans are calculated based on the individual year beginning indices.
|
The outstanding balance of the Company’s loans denominated in foreign currencies has changed continually as a result of repayments of the loans by the Company according to agreed-upon repayment schedules. The loans denominated in U.S. dollars decreased from RMB3.31 billion as of December 31, 2014 to RMB3.07 billion as of December 31, 2015. The loans denominated in Euros decreased from RMB431 million as of December 31, 2014 to RMB344 million as of December 31, 2015.
Interest rate risk
We are exposed to interest rate risk primarily resulting from fluctuations in interest rates on our debts. Upward fluctuations in interest rates increase the cost of new variable rate debts and the interest cost of outstanding floating rate borrowings.
At present, the interest rate of the Company’s loans denominated in RMB is subject to the change of the benchmark interest rate published and adjusted by the PBOC. Different interest rate levels correspond to loans with different terms. New loan contracts entered into hereafter will be subject to current benchmark interest rates. A portion of the Company’s loans denominated in foreign currency are fixed rate loans, which are not subject to the changes in market interest rates. Due to the loans borrowed in relation to the acquisition of SinoSing Power, the portion of the loans denominated in foreign currency with floating interest rates increased, which subjects the finance cost of the Company to the fluctuation of market interest rates. In 2009, the Company entered into a floating-to-fixed interest rate swap agreement to hedge against the cash flow interest rate risk of part of the loan. According to the interest rate swap agreement, the Company agrees with the counterparty to settle the difference between fixed contract rates and floating rate interest amounts calculated by reference to the agreed notional amounts quarterly until 2019. The notional amount of the outstanding interest rate swap at December 31, 2015 was US$240 million.
In 2009, Tuas Power completed its refinancing, through which all of its outstanding loans denominated in U.S. dollars were refinanced through loans denominated in Singapore dollars, matching the functional currency of its operation. The loans borrowed by Tuas Power were denominated in Singapore dollars, and the majority of them are with floating interest rates, which subjects the finance cost of the Company to the fluctuation of market interest rates. In 2012 and 2013, TPG also entered into a number of floating-to-fixed interest rate swap agreements to hedge
129
against the cash flow interest rate risk of the loan. According to these interest rate swap agreements, TPG agrees with the counterparty to settle the difference between fixed contract rates and floating rate interest amounts calculated by reference to the agreed notional amount semi-annually until 2020. The notional amount of the outstanding interest rate swap at December 31, 2015 was S$1,399.8 million.
The table below provides information about the Company and its subsidiaries’ derivative financial instruments and other financial instruments that are sensitive to changes in interest rates, including interest rate swaps and debt obligations. For debt obligations, the table presents principal cash flows and related weighted average interest rates by expected maturity dates. For interest rate swaps, the table presents notional amounts and weighted average interest rates by expected (contractual) maturity dates. Notional amounts are used to calculate the contractual payments to be exchanged under the contract. Weighted average variable rates are based on implied forward rates in the yield curve at the reporting date.
(RMB expressed in millions, except interest rates)
|
|
|
As of December 31, 2015
|
|
|||||||||||||||||||||||||||||
|
|
|
Expected Maturity Date
|
|
|
Total
|
|
|
Fair Value
|
|
|||||||||||||||||||||||
|
|
|
2016
|
|
|
2017
|
|
|
2018
|
|
|
2019
|
|
|
2020
|
|
|
Thereafter
|
|
|
|
|
|
|
|
||||||||
|
Debts
|
|
|
|
|
|
|
|
|
|
|
|
|
|
|
|
|
|
|
|
|
|
|
|
|
||||||||
|
Fixed rate shareholder’s, bank and other loans
|
|
|
5,359
|
3,703
|
4,361
|
5,457
|
3,121
|
8,595
|
30,596
|
30,528
|
|
|||||||||||||||||||||
|
Average interest rate
|
|
|
4.884
|
4.908
|
4.937
|
4.968
|
4.966
|
4.966
|
—
|
—
|
|
|||||||||||||||||||||
|
|
|
|
|
|||||||||||||||||||||||||||||
|
Variable rate bank and other loans
|
|
|
56,876
|
8,390
|
4,840
|
3,830
|
3,554
|
20,177
|
97,667
|
97,668
|
|
|||||||||||||||||||||
|
Average interest rate
|
|
|
3.897
|
3.742
|
3.634
|
3.537
|
3.435
|
3.435
|
—
|
—
|
|
|||||||||||||||||||||
|
|
|
|
|
|||||||||||||||||||||||||||||
|
Short-term bonds
|
|
|
19,348
|
-
|
-
|
-
|
-
|
-
|
19,348
|
19,348
|
|
|||||||||||||||||||||
|
Average interest rate
|
|
|
4.387
|
-
|
-
|
-
|
-
|
-
|
—
|
—
|
|
|||||||||||||||||||||
|
|
|
|
|
|||||||||||||||||||||||||||||
|
Long-term bonds
|
|
|
11,481
|
3,287
|
3,981
|
3,993
|
-
|
-
|
22,742
|
23,155
|
|
|||||||||||||||||||||
|
Average interest rate
|
|
|
5.621
|
5.395
|
5.370
|
5.370
|
-
|
-
|
—
|
—
|
|
|||||||||||||||||||||
|
|
|
As of December 31, 2015
|
|
|||||||||||||||||||||||||||||
|
|
|
Notional Amount Expected Maturity Date
|
|
|
Total
|
|
|
Fair Value
|
|
|||||||||||||||||||||||
|
|
|
2016
|
|
|
2017
|
|
|
2018
|
|
|
2019
|
|
|
2020
|
|
|
Thereafter
|
|
|
|
|
|
|
|
||||||||
|
Debts
|
|
|
|
|
|
|
|
|
|
|
|
|
|
|
|
|
|
|
|
|
|
|
|
|
||||||||
|
Interest Rate Derivatives (US$)
|
|
|
|
|
|
|
|
|
|
|
|
|
|
|
|
|
|
|
|
|
|
|
|
|
||||||||
|
Variable to Fixed
|
|
|
208
|
208
|
208
|
934
|
-
|
-
|
1,558
|
(80
|
)
|
|||||||||||||||||||||
|
Average receive rate
|
|
|
1.89%
|
2.71%
|
3.14%
|
3.29%
|
-
|
-
|
—
|
—
|
|
|||||||||||||||||||||
|
Average pay rate
|
|
|
4.40%
|
4.40%
|
4.40%
|
4.40%
|
-
|
-
|
—
|
—
|
|
|||||||||||||||||||||
|
|
|
|
|
|||||||||||||||||||||||||||||
|
Interest Rate Derivatives (S$)
|
|
|
|
|||||||||||||||||||||||||||||
|
Variable to Fixed
|
|
|
188
|
1,331
|
1,082
|
170
|
3,650
|
-
|
6,421
|
(38
|
)
|
|||||||||||||||||||||
|
Average receive rate
|
|
|
1.62%
|
1.84%
|
2.02%
|
2.22%
|
2.35%
|
-
|
—
|
—
|
|
|||||||||||||||||||||
|
Average pay rate
|
|
|
2.452%
|
2.468%
|
2.508%
|
2.531%
|
2.531%
|
-
|
—
|
—
|
|
|||||||||||||||||||||
130
|
|
|
As of December 31, 2014
|
|
|||||||||||||||||||||||||||||
|
|
|
Expected Maturity Date
|
|
|
Total
|
|
|
Fair Value
|
|
|||||||||||||||||||||||
|
|
|
2015
|
|
|
2016
|
|
|
2017
|
|
|
2018
|
|
|
2019
|
|
|
Thereafter
|
|
|
|
|
|
|
|
||||||||
|
Debts
|
|
|
|
|
|
|
|
|
|
|
|
|
|
|
|
|
|
|
|
|
|
|
|
|
||||||||
|
Fixed rate shareholder’s, bank and other loans
|
|
|
16,386
|
3,932
|
3,991
|
4,554
|
5,602
|
12,936
|
47,401
|
47,261
|
|
|||||||||||||||||||||
|
Average interest rate
|
|
|
6,646
|
7,183
|
8,140
|
7,022
|
5,469
|
5,469
|
—
|
—
|
|
|||||||||||||||||||||
|
|
|
|
|
|||||||||||||||||||||||||||||
|
Variable rate bank and other loans
|
|
|
34,536
|
5,065
|
5,302
|
1,114
|
1,268
|
13,875
|
61,160
|
61,160
|
|
|||||||||||||||||||||
|
Average interest rate
|
|
|
3.542
|
3.216
|
2.594
|
2.556
|
2.498
|
2.498
|
—
|
—
|
||||||||||||||||||||||
|
|
|
|
|
|||||||||||||||||||||||||||||
|
Short-term bonds
|
|
|
18,245
|
-
|
-
|
-
|
-
|
-
|
18,245
|
18,245
|
|
|||||||||||||||||||||
|
Average interest rate
|
|
|
4.784
|
-
|
-
|
-
|
-
|
-
|
—
|
—
|
|
|||||||||||||||||||||
|
|
|
|
|
|||||||||||||||||||||||||||||
|
Long-term bonds
|
|
|
5,021
|
11,479
|
3,279
|
3,974
|
3,993
|
-
|
27,746
|
28,032
|
|
|||||||||||||||||||||
|
Average interest rate
|
|
|
5.494
|
5.621
|
5.395
|
5.370
|
5.370
|
-
|
—
|
—
|
|
|||||||||||||||||||||
|
|
|
As of December 31, 2014
|
|
|||||||||||||||||||||||||||||
|
|
|
Notional Amount Expected Maturity Date
|
|
|
Total
|
|
|
Fair Value
|
|
|||||||||||||||||||||||
|
|
|
2015
|
|
|
2016
|
|
|
2017
|
|
|
2018
|
|
|
2019
|
|
|
Thereafter
|
|
|
|
|
|
|
|
||||||||
|
Debts
|
|
|
|
|
|
|
|
|
|
|
|
|
|
|
|
|
|
|
|
|
|
|
|
|
||||||||
|
Interest Rate Derivatives (US$)
|
|
|
|
|
|
|
|
|
|
|
|
|
|
|
|
|
|
|
|
|
|
|
|
|
||||||||
|
Variable to Fixed
|
|
|
196
|
196
|
196
|
196
|
881
|
-
|
1,665
|
(99
|
)
|
|||||||||||||||||||||
|
Average receive rate
|
|
|
1.48%
|
2.43%
|
3.23%
|
3.56%
|
3.73%
|
-
|
—
|
—
|
|
|||||||||||||||||||||
|
Average pay rate
|
|
|
4.40%
|
4.40%
|
4.40%
|
4.40%
|
4.40%
|
-
|
—
|
—
|
|
|||||||||||||||||||||
|
|
|
|
|
|||||||||||||||||||||||||||||
|
Interest Rate Derivatives (S$)
|
|
|
|
|||||||||||||||||||||||||||||
|
Variable to Fixed
|
|
|
190
|
190
|
1,347
|
1,094
|
172
|
3,692
|
6,685
|
(224)
|
|
|||||||||||||||||||||
|
Average receive rate
|
|
|
0.51%
|
0.76%
|
1.10%
|
1.45%
|
1.73%
|
1.90%
|
—
|
—
|
|
|||||||||||||||||||||
|
Average pay rate
|
|
|
2.452%
|
2.452%
|
2.468%
|
2.508%
|
2.531%
|
2.531%
|
—
|
—
|
|
|||||||||||||||||||||
Note:
|
(1)
|
The interest rates for variable rate bank and other loans are calculated based on the individual year beginning indices.
|
As of December 31, 2015, the Company’s floating rate loans denominated in foreign currency amounted to RMB3,070 million, accounting for approximately 86.09% of the total foreign loans, most of which was denominated in U.S. dollars, and the average credit spread is 99 bps. In addition, SinoSing Power’s loans denominated in Singapore dollars are floating rate loans and amounted to RMB12,372 million as of December 31, 2015. The interest rates of the loans denominated in U.S. dollars and Singapore dollars are relatively low at the current market
131
condition and it is not expected that a significant fluctuation would occur within the foreseeable period, thus it is not expected to cause any material adverse effect on the finance cost of the Company. The Company has paid special attention to the trend of the international interest rate market by keeping up with the market conditions and predicting the future trend, and has made efforts to explore the feasibility of risk management by application of derivative financial instruments. The Company expects to implement the relevant plan according to its internal approval procedures and use interest rate swaps and other derivative financial instruments to control its interest rate risk upon appropriate time.
Commodity price risk
We are exposed to fuel price risk on fuel purchases. SinoSing Power and its subsidiaries use fuel oil swap to hedge against such risk. The table below provides information about the fuel swap contracts that are sensitive to changes in fuel prices, including contract volumes, the weighted average contract prices, and the total contract amount by expected maturity dates.
(RMB expressed in millions, except interest rates and exchange rates)
|
|
|
As of December 31, 2015
|
|
||||||||||||||||||||||||||||||
|
|
|
Expected Maturity Date
|
|
|
Total
|
|
|
Fair Value
|
|
||||||||||||||||||||||||
|
|
|
2016
|
|
|
2017
|
|
|
2018
|
|
|
2019
|
|
|
2020
|
|
|
Thereafter
|
|
|
|
|
|
|
|
|||||||||
|
Fuel swap contracts
|
|
|
|
|
|
|
|
|
|
|
|
|
|
|
|
|
|
|
|
|
|
|
|
|
|||||||||
|
Contract Volumes (MT)
|
|
930,660
|
204,205
|
54,855
|
10,210
|
-
|
-
|
1,199,930
|
-
|
|
|||||||||||||||||||||||
|
Weighted Average Price (US$/MT)
|
|
338.59
|
408.86
|
389.49
|
389.54
|
-
|
-
|
—
|
—
|
|
|||||||||||||||||||||||
|
Contract Amount (RMB million)
|
|
2,044
|
541
|
139
|
26
|
-
|
-
|
2,750
|
(1,141)
|
|
|||||||||||||||||||||||
|
|
|
-
|
|
||||||||||||||||||||||||||||||
|
Contract Volumes (BBL)
|
|
361,100
|
-
|
-
|
-
|
-
|
-
|
361,100
|
-
|
|
|||||||||||||||||||||||
|
Weighted Average Price (US$/BBL)
|
|
48.54
|
-
|
-
|
-
|
-
|
-
|
—
|
—
|
|
|||||||||||||||||||||||
|
Contract Amount (RMB million)
|
|
114
|
-
|
-
|
-
|
-
|
-
|
114
|
-
|
|
|||||||||||||||||||||||
|
|
|
As of December 31, 2014
|
|
|||||||||||||||||||||||||||||
|
|
|
Expected Maturity Date
|
|
|
Total
|
|
|
Fair Value
|
|
|||||||||||||||||||||||
|
|
|
2015
|
|
|
2016
|
|
|
2017
|
|
|
2018
|
|
|
2019
|
|
|
Thereafter
|
|
|
|
|
|
|
|
||||||||
|
Fuel swap contracts
|
|
|
|
|
|
|
|
|
|
|
|
|
|
|
|
|
|
|
|
|
|
|
|
|
||||||||
|
Contract Volumes (MT)
|
|
|
631,530
|
207,775
|
54,965
|
-
|
-
|
-
|
894,270
|
-
|
|
|||||||||||||||||||||
|
Weighted Average Price (US$/MT)
|
|
|
531.01
|
545.44
|
551.09
|
-
|
-
|
-
|
—
|
—
|
|
|||||||||||||||||||||
|
Contract Amount (RMB million)
|
|
|
2,056
|
695
|
186
|
-
|
-
|
-
|
2,937
|
(991)
|
|
|||||||||||||||||||||
|
Contract Volumes (BBL)
|
927,900
|
-
|
-
|
-
|
-
|
-
|
927,900
|
-
|
||||||||||||||||||||||||
|
Weighted Average Price (US$BBL)
|
90.47
|
-
|
-
|
-
|
-
|
-
|
—
|
—
|
||||||||||||||||||||||||
|
Contract Amount (RMB million)
|
515
|
-
|
-
|
-
|
-
|
-
|
515
|
17
|
||||||||||||||||||||||||
132
For other detailed information of the market risk, please refer to the Note 3(a)(i) to the “Financial Statements”.
|
ITEM 12
|
Description of Securities Other than Equity Securities
|
|
A.
|
Debt Securities
|
Not applicable.
|
B.
|
Warrants and Rights
|
Not applicable.
|
C.
|
Other Securities
|
Not applicable.
|
D.
|
American Depositary Shares
|
Depositary Fees and Charges
Under the terms of the Deposit Agreement for Huaneng Power International, Inc.’s American Depositary Shares (ADSs), an ADS holder may have to pay the following services fees to the Depositary:
|
Services
|
|
Fees
|
|
Issuance of ADSs
|
|
$5.00 (or less) per 100 ADSs (or portion of 100 ADSs) issued
|
|
Cancellation of ADSs
|
|
$5.00 (or less) per 100 ADSs (or portion of 100 ADSs) canceled
|
|
Distribution of cash dividends or other cash distributions
|
|
$2.00 (or less) per 100 ADSs (or portion of 100 ADSs) held
|
|
Distribution of ADSs pursuant to stock dividends, free stock distributions or exercises of rights
|
|
$5.00 (or less) per 100 ADSs (or portion of 100 ADSs) held
|
|
Distribution of securities other than ADSs or rights to purchase additional ADSs
|
|
$5.00 (or less) per 100 ADSs (or portion of 100 ADSs) held
|
An ADS holder will also be responsible to pay certain fees and expenses incurred by the Depositary and certain taxes and governmental charges such as:
|
|
·
|
taxes and other governmental charges;
|
|
|
·
|
such registration fees as may from time to time be in effect for the registration of transfers of H Shares generally on the H Share register of the Company or Foreign Registrar and applicable to transfers of H Shares to the name of the Depositary or its nominee or the Custodian or its nominee on the making of deposits or withdrawals;
|
|
|
·
|
such cable, telex and facsimile transmission expenses as are expressly provided in the Deposit Agreement;
|
|
|
·
|
such expenses as are incurred by the Depositary in the conversion of foreign currency; and
|
133
|
|
·
|
any other charge payable by the Depositary, any of the Depositary’s agents, including the Custodian, or the agents of the Depositary’s agents in connection with the servicing of H Shares or other Deposited Securities.
|
Depositary Payments for the Year 2015
In 2015, we received the payment of US$30,520 (inclusive of withholding tax) from the Bank of New York Mellon, the Depositary for our ADR program, for the reimbursement of our expenses related to investors’ relation activities and training activities.
PART II
|
ITEM 13
|
Defaults, Dividend Arrearages and Delinquencies
|
None.
|
ITEM 14
|
Material Modifications to the Rights of Security Holders and Use of Proceeds
|
None.
|
ITEM 15
|
Controls and Procedures
|
Disclosure Controls and Procedures
Our management, with the participation of our principal executive officer and principal financial officer, has evaluated the effectiveness of our disclosure controls and procedures (as defined in Rules 13a-15(e) and 15d-15(e) of the U.S. Securities Exchange Act of 1934, as amended (the “Exchange Act”)) as of December 31, 2015 (the “Evaluation Date”), the end of the fiscal year covered by this annual report. Based on this evaluation, our principal executive officer and principal financial officer have concluded that, as of the Evaluation Date, our disclosure controls and procedures were effective.
Management’s Report on Internal Control over Financial Reporting
Our management is responsible for establishing and maintaining adequate internal control over financial reporting, as defined in the Exchange Act Rules 13a-15(f) and 15d-15(f). The Company conducted an evaluation of the effectiveness of the design and implementation of our internal control over financial reporting based upon the framework in Internal Control-Integrated Framework (2013) issued by the Committee of Sponsoring Organizations of the Treadway Commission as of the end of the period covered by this annual report. The evaluation is conducted under the supervision and with the participation of our management including principal executive officer and principal financial officer of the Company. Based on that evaluation, our management has concluded that our internal control over financial reporting was effective as of December 31, 2015. The effectiveness of the Company’s internal control over financial reporting as of December 31, 2015 has been audited by KPMG, an independent registered public accounting firm, as stated in their report which appears herein.
Because of its inherent limitations, internal control over financial reporting may only provide reasonable assurance for preventing or detecting misstatements. In addition, projections of any evaluation of effectiveness of our internal control over financial reporting to future periods are subject to the risk that controls may become inadequate because of changes in conditions, or that the degree of compliance with the policies and procedures may deteriorate.
Report of Independent Registered Public Accounting Firm
134
The Board of Directors and Shareholders of Huaneng Power International, Inc.:
We have audited Huaneng Power International, Inc.’s internal control over financial reporting as of December 31, 2015, based on criteria established in Internal Control – Integrated Framework (2013) issued by the Committee of Sponsoring Organizations of the Treadway Commission (COSO). The management of Huaneng Power International, Inc. is responsible for maintaining effective internal control over financial reporting and for its assessment of the effectiveness of internal control over financial reporting, included in the accompanying Management’s Report on Internal Control over Financial Reporting. Our responsibility is to express an opinion on the internal control over financial reporting of Huaneng Power International, Inc. based on our audit.
We conducted our audit in accordance with the standards of the Public Company Accounting Oversight Board (United States). Those standards require that we plan and perform the audit to obtain reasonable assurance about whether effective internal control over financial reporting was maintained in all material respects. Our audit included obtaining an understanding of internal control over financial reporting, assessing the risk that a material weakness exists, and testing and evaluating the design and operating effectiveness of internal control based on the assessed risk. Our audit also included performing such other procedures as we considered necessary in the circumstances. We believe that our audit provides a reasonable basis for our opinion.
A company’s internal control over financial reporting is a process designed to provide reasonable assurance regarding the reliability of financial reporting and the preparation of financial statements for external purposes in accordance with generally accepted accounting principles. A company’s internal control over financial reporting includes those policies and procedures that (1) pertain to the maintenance of records that, in reasonable detail, accurately and fairly reflect the transactions and dispositions of the assets of the company; (2) provide reasonable assurance that transactions are recorded as necessary to permit preparation of financial statements in accordance with generally accepted accounting principles, and that receipts and expenditures of the company are being made only in accordance with authorizations of management and directors of the company; and (3) provide reasonable assurance regarding prevention or timely detection of unauthorized acquisition, use, or disposition of the company’s assets that could have a material effect on the financial statements.
Because of its inherent limitations, internal control over financial reporting may not prevent or detect misstatements. Also, projections of any evaluation of effectiveness to future periods are subject to the risk that controls may become inadequate because of changes in conditions, or that the degree of compliance with the policies or procedures may deteriorate.
In our opinion, Huaneng Power International, Inc. maintained, in all material respects, effective internal control over financial reporting as of December 31, 2015, based on criteria established in Internal Control – Integrated Framework (2013) issued by the Committee of Sponsoring Organizations of the Treadway Commission (COSO).
We also have audited, in accordance with the standards of the Public Company Accounting Oversight Board (United States), the consolidated statements of financial position of Huaneng Power International, Inc. and subsidiaries as of December 31, 2015 and 2014, and the related consolidated statements of comprehensive income, changes in equity, and cash flows for each of the years in the three-year period ended December 31, 2015, and our report dated March 22, 2016 expressed an unqualified opinion on those consolidated financial statements.
/s/ KPMG
Hong Kong, China
March 22, 2016
Changes in Internal Control over Financial Reporting
135
During the year ended December 31, 2015, no changes occurred in our internal controls over financial reporting that materially affected, or is reasonably likely to materially affect, our internal controls over financial reporting.
|
ITEM 16
|
Reserved
|
|
ITEM 16A
|
Audit Committee Financial Expert
|
The Board of Directors has determined that Mr. Yue Heng and Mr. Qi. Yudong qualify as Audit Committee Financial Experts in accordance with the terms of Item 16A of Form 20-F. We held election at expiration of office terms of the Board in 2014 and adjusted the members of the Audit Committee accordingly. Mr. Yue Heng and Mr. Qi Yudong were respectively qualified as Financial Experts at the first Board meeting of 18th session of the Board in September 2014. On June 25, 2015, Mr. Geng Jianxin replaced Mr. Qi Yudong as an independent director of the Board. The Board of Directors has determined that Mr. Geng Jianxin qualifies as an Audit Committee Financial Expert in accordance with the terms of Item 16A of Form 20-F. See “Item 6 Directors, Senior Management and Employees – A. Directors, members of the supervisory committee and senior management”.
|
ITEM 16B
|
Code of Ethics
|
Although, as of the date of this annual report, we do not have, in form, a code of ethics that applies to the Company’s principal executive officer, principal financial officer and principal accounting officer (collectively, the “Senior Corporate Officers”), we believe that, as a substantive matter, the Senior Corporate Officers are subject to a set of written requirements under the PRC law that are substantially similar to the ethical standards described under Item 16B (b) of Form 20-F. Joint stock companies that are incorporated in China and listed on both PRC and foreign stock exchanges are heavily regulated by the central government. To a large extent, these requirements, which are designed to promote honest and ethical conduct and compliance with applicable laws and regulations by the directors and senior executives of such companies, are not merely ethical requirements, but more importantly, statutory obligations that are legally binding on these individuals under the PRC Company Law, relevant rules and regulations promulgated by China Securities Regulatory Commission and the Mandatory Provisions of Articles of Association of Overseas Listed Companies.
|
ITEM 16C
|
Principal Accountant Fees and Services
|
KPMG has served as our independent registered public accounting firm for the fiscal years ended December 31, 2015 and 2014, for which audited consolidated financial statements appear in this annual report on Form 20-F.
The following table shows information about fees payable by us to KPMG in 2014 and 2015, respectively.
|
(RMB million)
|
|
For the Year Ended
December 31,
|
|
|||||
|
|
|
2015
|
|
|
2014
|
|
||
|
|
|
|
|
|
|
|
||
|
Audit fees
|
|
|
29.2
|
|
|
|
26.2
|
|
|
Audit-related fees
|
|
|
-
|
|
|
|
1.5
|
|
|
Tax fees
|
|
|
0.4
|
|
|
|
0.4
|
|
|
All other fees
|
|
|
0.7
|
|
|
|
2.0
|
|
|
Total
|
|
|
30.3
|
|
|
|
30.1
|
|
136
Tax Fees
Services provided primarily consist of tax compliance services.
All Other Fees
Provision of other assurance and advisory service.
Audit Committee Pre-approval Policies and Procedures
The Audit Committee of the Company’s Board of Directors is responsible, among other things, for the oversight of the external auditors subject to the requirements of the PRC Law and the Company’s Articles of Association. The Audit Committee has adopted a policy regarding pre-approval of audit and permissible non-audit services to be provided by our independent auditors (the “Policy”). Under the Policy, proposed services either (i) may be pre-approved by the Audit Committee without consideration of specific case-by-case services (“general pre-approval”); or (ii) require the specific pre-approval of the Audit Committee (“specific pre-approval”). General pre-approval applies to services of recurring and predictable nature. These types of services, once approved by the Audit Committee in the beginning, will not require further approval in the future, except when actual fees and expenses exceed pre-approved budget levels. In such a case, the Audit Committee may authorize one of its members to approve budget increases subject to the requirement that such member provide a report on his decision to approve or deny an application for budget increases to the Audit Committee at an Audit Committee meeting held immediately after such member grants or denies the approval.
Specific pre-approval applies to all other services. These services must be approved by the Audit Committee on a case-by-case basis after an application including proposed budget and scope of services to be provided by our independent auditors is submitted to the Audit Committee.
For 2015, all of the services provided by KPMG were pre-approved by the Audit Committee.
|
ITEM 16D
|
Exemptions from the Listing Standards for Audit Committees
|
Not applicable.
|
ITEM 16E
|
Purchases of Equity Security by the Issuer and Affiliated Purchasers
|
Not applicable.
|
ITEM 16F
|
Change in Registrant's Certifying Accountant
|
Not applicable.
|
ITEM 16G
|
Corporate Governance
|
Comparison of New York Stock Exchange corporate governance rules and China corporate governance rules for listed companies: under the amended Corporate Governance Rules of New York Stock Exchange (“NYSE”), foreign issuers (including the Company) listed on the NYSE are required to disclose a summary of the significant differences between their domestic corporate governance rules and NYSE corporate governance rules that would apply to a U.S. domestic issuer. A summary of such differences is listed below:
137
|
NYSE corporate governance rules
|
|
Corporate governance rules applicable to the domestically listed companies in China and the Company’s governance practices
|
|
Director Independence
|
|
|
|
|
|
|
|
A listed company must have a majority of independent directors on its board of directors.
No director qualifies as “independent” unless the board of directors affirmatively determines that the director has no material relationship with the listed company (either directly or as a partner, shareholder or officer of an organization that has a relationship with the company). In addition, a director must meet certain standards to be deemed independent. For example, a director is not independent if the director is, or has been within the last three years, an employee of the listed company, or an immediate family member is, or has been within the last three years, an executive officer of the listed company, or if the director has received, or has an immediate family member who has received, during any twelve-month period within the last three years, more than US$120,000 in direct compensation from the listed company, other than director and committee fees and pension or other forms of deferred compensation for prior service (provided such compensation is not contingent in any way on continued service).
|
|
It is required in China that any listed company must establish an independent director system and set forth specific requirements for the qualification of independent directors. For example, an independent director shall not hold any other position in the listed Company other than being a director and shall not be influenced by the main shareholders or the controlling persons of the listed company, or by any other entities or persons with whom the listed company has a significant relationship. The Company has complied with the relevant Chinese corporate governance rules and has implemented internal rules governing the independence and responsibilities of independent directors. The Company determines the independence of independent directors every year.
|
|
|
|
|
|
To empower non-management directors to serve as a more effective check on management, the non-management directors of each listed company must meet at regularly scheduled executive sessions without management.
|
|
No similar requirements.
|
|
Nominating/Corporate Governance Committee
|
|
|
|
|
|
|
|
Listed companies must have a nominating/corporate governance committee composed entirely of independent directors.
|
|
The board of directors of a listed company may, through the resolution of the shareholders’ meeting, establish a nominating committee composed entirely of directors, of which the independent directors shall be the majority and the convener. The Company has established a nominating committee.
|
|
|
|
|
|
The nominating/corporate governance committee must have a written charter that addresses the committee’s purposes and responsibilities which, at minimum, must be to: search for eligible people for the board of directors, select and nominate directors for the next session of the shareholders’ annual meeting, study and propose corporate governance guidelines, supervise the evaluation of the board of directors and management, and evaluate the performance of the committee every year.
|
|
Relevant responsibilities of the nominating/corporate governance committee are similar to those stipulated by the NYSE rules, but the main responsibilities do not include the research and recommendation of corporate governance guidelines, the supervision of the evaluation of the board of directors and management, or the annual evaluation of the committee.
|
138
|
Compensation Committee
|
|
|
|
|
|
|
|
Listed companies must have a compensation committee composed entirely of independent directors.
|
|
The board of directors of a listed company can, through the resolution of shareholders’ meeting, have a compensation and evaluation committee composed entirely of directors, of whom the independent directors are the majority and act as the convener.
|
|
|
|
|
|
The compensation committee must have a written charter that addresses, at least, the following purposes and responsibilities:
|
|
The responsibilities are similar to those stipulated by the NYSE rules, but the committee is not required to produce a report on the executive compensation or make an annual performance evaluation of the committee. The board of directors of the Company has established a compensation and evaluation committee composed mainly of independent directors who act as the convener, and the committee has a written charter.
|
|
|
|
|
|
(1) review and approve the corporate goals associated with CEO’s compensation, evaluate the performance of the CEO in fulfilling these goals, and, either as a committee or together with the other independent directors (as directed by the board) based on such evaluation, determine and approve the CEO’s compensation level;
|
|
|
|
|
|
|
|
(2) make recommendations to the board with respect to non-CEO executive officer compensation, and incentive-compensation and equity-based plans that are subject to board approval;
|
|
|
|
|
|
|
|
(3) produce a committee report on executive compensation as required by the SEC to be included in the annual proxy statement or annual report filed with the SEC.
|
|
|
|
|
|
|
|
The charter must also include the requirement for an annual performance evaluation of the compensation committee.
The compensation committee may, in its sole discretion, retain or consult a compensation consultant, independent legal counsel or other advisor. The compensation committee shall be directly responsible for the appointment, compensation and oversight of the work of such advisor. A listed company must provide for appropriate funding for payment of reasonable compensation to such advisor. The compensation committee may select such advisor to the compensation committee only after taking into consideration all factors relevant to that person’s independence from management.
|
|
|
139
|
Audit Committee
|
|
|
|
|
|
|
|
Listed companies must have an audit committee that satisfies the requirements of Rule 10A-3 of Exchange Act. It must have a minimum of three members, and all audit committee members must satisfy the requirements for independence set forth in Section 303A.02 of NYSE Corporate Governance Rules as well as the requirements of Rule 10A-3(b)(1) of the Exchange Act.
|
|
The board of directors of a listed company can, through the resolution of the shareholders’ meeting, establish an audit committee composed entirely of directors, of which the independent directors are the majority and act as the convener, and, at minimum, one independent director is an accounting professional.
|
|
|
|
|
|
The audit committee must have a written charter that specifies the purpose of the audit committee is, at minimum, to assist the board oversight of the integrity of financial statements, the Company’s compliance with legal and regulatory requirements, qualifications and independence of independent auditors and the performance of the listed company’s internal audit function and independent auditors.
|
|
The responsibilities of the audit committee are similar to those stipulated by the NYSE rules, but according to the domestic practices, the Company is not required to make an annual performance evaluation of the audit committee, and the audit committee is not required to prepare an audit report to be included in the Company’s annual proxy statement. The Board of Directors of the Company has established an audit committee that satisfies relevant domestic requirements and the audit committee has a written charter.
|
|
The written charter must also require the audit committee to prepare an audit committee report as required by the SEC to be included in the listed company’s annual proxy statement as well as an annual performance evaluation of the audit committee.
|
|
|
|
|
|
|
|
The written charter must also specify the duties and responsibilities of the audit committee, which, at a minimum, must include those set out in Rules 10A-3(b)(2), (3), (4) and (5) of the Exchange Act, as well as other duties and responsibilities, such as to obtain and review a report by the independent auditor at least annually, meet to review and discuss the listed company’s annual audited financial statements and quarterly financial statements with management and independent auditor.
|
|
|
|
|
|
|
|
Each listed company must have an internal audit department.
|
|
China has a similar regulatory provision, and the Company has an internal audit department.
|
|
|
|
|
|
Shareholder approval of equity compensation plan
|
|
|
|
|
|
|
|
Shareholders must be given the opportunity to vote on all equity-compensation plans and material revisions thereto, except for, among others, plans that are made available to shareholders generally, such as typical dividend reinvestment plan, certain awards and plans in the context of mergers and acquisitions.
|
|
The relevant regulations of China require the board of directors to propose plans on the amount and types of director compensation for the shareholders’ meeting to approve. The compensation plan of executive officers is subject to approval by the board and announced at the shareholders’ meeting and disclosed to the public upon the approval of the board of directors.
|
|
|
|
|
|
Corporate governance guidelines
|
|
|
|
|
|
|
|
Listed companies must adopt and disclose corporate governance guidelines, involving director qualification standards, director responsibilities, director compensation, director continuing education, annual performance evaluation of the board of directors, etc.
|
|
CSRC has issued the Corporate Governance Rules, with which the Company has complied.
|
140
|
Code of ethics for directors, officers and employees
|
|
|
|
|
|
|
|
Listed companies must adopt and disclose a code of business conduct and ethics for directors, officers and employees, and promptly disclose any waivers of the code for directors or executive officers. Each code of business conduct and ethics must require that any waiver of the code for executive officers or directors may be made only by the board or a board committee.
|
|
China does not have such requirement for a code for ethics. But, the directors and officers must perform their legal responsibilities in accordance with the Company Law of PRC, relative requirements of CSRC and Mandatory Provisions to the Charter of Companies Listed Overseas.
|
|
|
|
|
|
Each listed company’s CEO must certify to the NYSE each year that he or she is not aware of any violation by the listed company of NYSE corporate governance listing standards and he or she must promptly notify the NYSE in writing of any non-compliance with any applicable provisions of Section 303A.
|
|
No similar requirements.
|
|
ITEM 16H
|
Mine Safety Disclosure
|
Not applicable.
|
ITEM 17
|
Financial Statements
|
Not applicable.
|
ITEM 18
|
Financial Statements
|
See page F-1 through F-106 following Item 19.
|
ITEM 19
|
Exhibits
|
|
1.1
|
|
Articles of Association amended and adopted by the Shareholders’ meeting in June 2015.
|
|
8
|
|
A list of subsidiaries.
|
|
12.1
|
|
Certifications of Principal Executive Officer pursuant to Rule 13a-14(a) promulgated under the U.S. Securities Exchange Act of 1934.
|
|
12.2
|
|
Certifications of Principal Financial Officer pursuant to Rule 13a-14(a) promulgated under the U.S. Securities Exchange Act of 1934.
|
|
13.1
|
|
Certification pursuant to 18 U.S.C. § 1350, as adopted pursuant to Section 906 of the Sarbanes-Oxley Act of 2002.
|
141
THIS PAGE IS INTENTIONALLY LEFT BLANK
142
Report of Independent Registered Public Accounting Firm
The Board of Directors and Shareholders of Huaneng Power International, Inc.:
We have audited the accompanying consolidated statements of financial position of Huaneng Power International, Inc. and subsidiaries as of December 31, 2015 and 2014, and the related consolidated statements of comprehensive income, changes in equity, and cash flows for each of the years in the three-year period ended December 31, 2015. These consolidated financial statements are the responsibility of the Company’s management. Our responsibility is to express an opinion on these consolidated financial statements based on our audits.
We conducted our audits in accordance with the standards of the Public Company Accounting Oversight Board (United States). Those standards require that we plan and perform the audit to obtain reasonable assurance about whether the financial statements are free of material misstatement. An audit includes examining, on a test basis, evidence supporting the amounts and disclosures in the financial statements. An audit also includes assessing the accounting principles used and significant estimates made by management, as well as evaluating the overall financial statement presentation. We believe that our audits provide a reasonable basis for our opinion.
In our opinion, the consolidated financial statements referred to above present fairly, in all material respects, the financial position of Huaneng Power International, Inc. and subsidiaries as of December 31, 2015 and 2014, and the results of their operations and their cash flows for each of the years in the three-year period ended December 31, 2015, in conformity with International Financial Reporting Standards as issued by the International Accounting Standards Board.
We also have audited, in accordance with the standards of the Public Company Accounting Oversight Board (United States), the internal control over financial reporting of Huaneng Power International, Inc. as of December 31, 2015, based on criteria established in Internal Control – Integrated Framework (2013) issued by the Committee of Sponsoring Organizations of the Treadway Commission (COSO), and our report dated March 22, 2016 expressed an unqualified opinion on the effectiveness of the Company’s internal control over financial reporting.
/s/ KPMG
Hong Kong, China
March 22, 2016
143
Huaneng Power International, Inc.
Consolidated Statements of Comprehensive Income
For the years ended 31 December 2015, 2014 and 2013
(Prepared in accordance with International Financial Reporting Standards)
(Amounts expressed in thousands of RMB, except per share data)
|
For the year ended 31 December
|
||||||||||||||||
|
Note
|
2015
|
2014
|
2013
|
|||||||||||||
|
RMB
|
RMB
|
RMB
|
||||||||||||||
|
Operating revenue
|
5 | 128,904,873 | 125,406,855 | 133,832,875 | ||||||||||||
|
Tax and levies on operations
|
(1,157,760 | ) | (932,485 | ) | (1,043,855 | ) | ||||||||||
|
Operating expenses
|
||||||||||||||||
|
Fuel
|
6 | (59,242,367 | ) | (64,762,908 | ) | (73,807,817 | ) | |||||||||
|
Maintenance
|
(4,556,361 | ) | (3,729,912 | ) | (3,856,975 | ) | ||||||||||
|
Depreciation
|
(14,411,632 | ) | (11,646,683 | ) | (11,293,522 | ) | ||||||||||
|
Labor
|
(7,751,551 | ) | (6,259,588 | ) | (5,762,884 | ) | ||||||||||
|
Service fees on transmission and transformer facilities of HIPDC
|
(140,771 | ) | (140,771 | ) | (140,771 | ) | ||||||||||
|
Purchase of electricity
|
(3,581,517 | ) | (5,055,076 | ) | (4,955,603 | ) | ||||||||||
|
Others
|
6 | (8,919,988 | ) | (7,604,790 | ) | (8,860,409 | ) | |||||||||
|
Total operating expenses
|
(98,604,187 | ) | (99,199,728 | ) | (108,677,981 | ) | ||||||||||
|
Profit from operations
|
29,142,926 | 25,274,642 | 24,111,039 | |||||||||||||
|
Interest income
|
160,723 | 159,550 | 170,723 | |||||||||||||
|
Financial expenses, net
|
||||||||||||||||
|
Interest expense
|
6 | (7,945,734 | ) | (7,814,114 | ) | (7,787,472 | ) | |||||||||
|
Exchange gain and bank charges, net
|
(24,336 | ) | (9,492 | ) | 94,109 | |||||||||||
|
Total financial expenses, net
|
(7,970,070 | ) | (7,823,606 | ) | (7,693,363 | ) | ||||||||||
|
Share of profits less losses of associates and joint ventures
|
8 | 1,525,975 | 1,315,876 | 615,083 | ||||||||||||
|
(Loss) /gain on fair value changes of financial assets/liabilities
|
(16,742 | ) | 42,538 | (5,701 | ) | |||||||||||
|
Other investment income
|
115,238 | 80,580 | 224,908 | |||||||||||||
|
Profit before income tax expense
|
6 | 22,958,050 | 19,049,580 | 17,422,689 | ||||||||||||
|
Income tax expense
|
32 | (5,698,943 | ) | (5,487,208 | ) | (4,522,671 | ) | |||||||||
|
Net profit
|
17,259,107 | 13,562,372 | 12,900,018 | |||||||||||||
The accompanying notes are an integral part of these financial statements.
F-1
Huaneng Power International, Inc.
Consolidated Statements of Comprehensive Income (Continued)
For the years ended 31 December 2015, 2014 and 2013
(Prepared in accordance with International Financial Reporting Standards)
(Amounts expressed in thousands of RMB, except per share data)
|
For the year ended 31 December
|
|||||||||||||
|
Note
|
2015
|
2014
|
2013
|
||||||||||
|
RMB
|
RMB
|
RMB
|
|||||||||||
|
Other comprehensive income/(loss), net of tax
|
|||||||||||||
|
Items that may be reclassified subsequently to profit or loss:
|
|||||||||||||
|
Fair value changes of available-for-sale financial asset
|
558,261 | 840,289 | (106,244 | ) | |||||||||
|
Shares of other comprehensive income/ (loss) of investees accounted for under the equity method
|
678,793 | 87,579 | (35,481 | ) | |||||||||
|
Effective portion of cash flow hedges
|
51,922 | (789,915 | ) | 417,891 | |||||||||
|
Translation differences of the financial statements of foreign operations
|
(133,116 | ) | (377,889 | ) | (782,063 | ) | |||||||
|
Other comprehensive income/(loss), net of tax
|
1,155,860 | (239,936 | ) | (505,897 | ) | ||||||||
|
Total comprehensive income
|
18,414,967 | 13,322,436 | 12,394,121 | ||||||||||
|
Net profit attributable to:
|
|||||||||||||
|
- Equity holders of the Company
|
13,651,933 | 10,757,317 | 10,426,024 | ||||||||||
|
- Non-controlling interests
|
3,607,174 | 2,805,055 | 2,473,994 | ||||||||||
| 17,259,107 | 13,562,372 | 12,900,018 | |||||||||||
|
Total comprehensive income attributable to:
|
|||||||||||||
|
- Equity holders of the Company
|
14,807,889 | 10,517,694 | 9,920,884 | ||||||||||
|
- Non-controlling interests
|
3,607,078 | 2,804,742 | 2,473,237 | ||||||||||
| 18,414,967 | 13,322,436 | 12,394,121 | |||||||||||
|
Earnings per share attributable to the equity holders of the Company (expressed in RMB per share)
|
|||||||||||||
|
- Basic and diluted
|
33
|
0.94 | 0.76 | 0.74 | |||||||||
The accompanying notes are an integral part of these financial statements.
F-2
Huaneng Power International, Inc.
Consolidated Statements of Financial Position
As at 31 December 2015 and 2014
(Prepared in accordance with International Financial Reporting Standards)
(Amounts expressed in thousands of RMB)
|
As at 31 December
|
||||||||||||
|
Note
|
2015
|
2014
|
||||||||||
|
RMB
|
RMB
|
|||||||||||
|
ASSETS
|
||||||||||||
|
Non-current assets
|
||||||||||||
|
Property, plant and equipment
|
7 | 219,673,070 | 188,379,057 | |||||||||
|
Investments in associates and joint ventures
|
8 | 19,745,192 | 17,626,910 | |||||||||
|
Available-for-sale financial assets
|
10 | 5,077,863 | 4,333,377 | |||||||||
|
Land use rights
|
11 | 8,313,766 | 4,953,844 | |||||||||
|
Power generation license
|
12 | 3,679,175 | 3,720,959 | |||||||||
|
Mining rights
|
13 | 1,646,271 | 1,922,655 | |||||||||
|
Deferred income tax assets
|
30 | 1,064,391 | 884,274 | |||||||||
|
Derivative financial assets
|
14 | 45,044 | 40,598 | |||||||||
|
Goodwill
|
15 | 11,677,182 | 11,725,555 | |||||||||
|
Other non-current assets
|
16 | 4,378,997 | 3,719,255 | |||||||||
|
Total non-current assets
|
275,300,951 | 237,306,484 | ||||||||||
|
Current assets
|
||||||||||||
|
Inventories
|
17 | 5,422,732 | 6,702,274 | |||||||||
|
Other receivables and assets
|
18 | 4,087,989 | 3,411,720 | |||||||||
|
Accounts receivable
|
19 | 16,377,401 | 14,881,963 | |||||||||
|
Derivative financial assets
|
14 | 139,468 | 261,135 | |||||||||
|
Bank balances and cash
|
34 | 7,537,813 | 12,608,192 | |||||||||
|
Total current assets
|
33,565,403 | 37,865,284 | ||||||||||
|
Total assets
|
308,866,354 | 275,171,768 | ||||||||||
The accompanying notes are an integral part of these financial statements.
F-3
Huaneng Power International, Inc.
Consolidated Statements of Financial Position (Continued)
As at 31 December 2015 and 2014
(Prepared in accordance with International Financial Reporting Standards)
(Amounts expressed in thousands of RMB)
|
As at 31 December
|
||||||||||||
|
Note
|
2015
|
2014
|
||||||||||
|
RMB
|
RMB
|
|||||||||||
|
EQUITY AND LIABILITIES
|
||||||||||||
|
Capital and reserves attributable to equity holders of the Company
|
||||||||||||
|
Share capital
|
20 | 15,200,383 | 14,420,383 | |||||||||
|
Capital surplus
|
24,815,489 | 19,622,199 | ||||||||||
|
Surplus reserves
|
21 | 8,140,030 | 7,196,349 | |||||||||
|
Currency translation differences
|
(1,327,839 | ) | (1,194,819 | ) | ||||||||
|
Retained earnings
|
37,313,885 | 30,085,379 | ||||||||||
| 84,141,948 | 70,129,491 | |||||||||||
|
Non-controlling interests
|
17,551,741 | 14,653,215 | ||||||||||
|
Total equity
|
101,693,689 | 84,782,706 | ||||||||||
|
Non-current liabilities
|
||||||||||||
|
Long-term loans
|
23 | 66,028,023 | 57,638,458 | |||||||||
|
Long-term bonds
|
24 | 11,261,322 | 22,725,535 | |||||||||
|
Deferred income tax liabilities
|
30 | 2,494,143 | 1,810,755 | |||||||||
|
Derivative financial liabilities
|
14 | 430,089 | 649,513 | |||||||||
|
Other non-current liabilities
|
25 | 3,122,455 | 2,718,680 | |||||||||
|
Total non-current liabilities
|
83,336,032 | 85,542,941 | ||||||||||
|
Current liabilities
|
||||||||||||
|
Accounts payable and other liabilities
|
26 | 26,185,764 | 27,035,864 | |||||||||
|
Taxes payable
|
27 | 2,071,471 | 1,858,024 | |||||||||
|
Dividends payable
|
788,895 | 431,681 | ||||||||||
|
Salary and welfare payables
|
313,284 | 171,262 | ||||||||||
|
Derivative financial liabilities
|
14 | 874,852 | 832,727 | |||||||||
|
Short-term bonds
|
28 | 19,347,706 | 18,244,806 | |||||||||
|
Short-term loans
|
29 | 49,883,489 | 43,529,004 | |||||||||
|
Current portion of long-term loans
|
23 | 12,351,205 | 7,392,433 | |||||||||
|
Current portion of long-term bonds
|
24 | 11,480,661 | 5,020,760 | |||||||||
|
Current portion of other non-current liabilities
|
25 | 539,306 | 329,560 | |||||||||
|
Total current liabilities
|
123,836,633 | 104,846,121 | ||||||||||
|
Total liabilities
|
207,172,665 | 190,389,062 | ||||||||||
|
Total equity and liabilities
|
308,866,354 | 275,171,768 | ||||||||||
These financial statements were approved for issue by the Board of Directors on 22 March 2016 and were signed on its behalf.
The accompanying notes are an integral part of these financial statements.
F-4
Huaneng Power International, Inc.
Consolidated Statements of Changes in Equity
For the years ended 31 December 2015, 2014 and 2013
(Prepared in accordance with International Financial Reporting Standards)
(Amounts expressed in thousands of RMB)
|
Attributable to equity holders of the Company
|
||||||||||||||||||||||||||||||||||||||||||||||||
|
Capital surplus
|
||||||||||||||||||||||||||||||||||||||||||||||||
|
Share capital
|
Share premium
|
Hedging reserve
|
Available-for-sale financial assets revaluation reserve
|
Other capital reserve
|
Subtotal
|
Surplus reserves
|
Currency translation differences
|
Retained earnings
|
Total
|
Non-controlling interests
|
Total equity
|
|||||||||||||||||||||||||||||||||||||
|
Balance as at 1 January 2013
|
14,055,383 | 16,881,764 | (719,085 | ) | 492,976 | 1,063,422 | 17,719,077 | 7,085,454 | (35,937 | ) | 17,306,157 | 56,130,134 | 9,830,208 | 65,960,342 | ||||||||||||||||||||||||||||||||||
|
Profit for the year ended 31 December 2013
|
- | - | - | - | - | - | - | - | 10,426,024 | 10,426,024 | 2,473,994 | 12,900,018 | ||||||||||||||||||||||||||||||||||||
|
Other comprehensive (loss)/income:
|
||||||||||||||||||||||||||||||||||||||||||||||||
|
Fair value changes from available-for-sale financial asset - gross
|
- | - | - | (141,658 | ) | - | (141,658 | ) | - | - | - | (141,658 | ) | - | (141,658 | ) | ||||||||||||||||||||||||||||||||
|
Fair value changes from available-for-sale financial asset - tax
|
- | - | - | 35,414 | - | 35,414 | - | - | - | 35,414 | - | 35,414 | ||||||||||||||||||||||||||||||||||||
|
Shares of other comprehensive loss of investees accounted for under the equity method - gross
|
- | - | - | (47,236 | ) | - | (47,236 | ) | - | - | - | (47,236 | ) | - | (47,236 | ) | ||||||||||||||||||||||||||||||||
|
Shares of other comprehensive loss of investees accounted for under the equity method - tax
|
- | - | - | 11,755 | - | 11,755 | - | - | - | 11,755 | - | 11,755 | ||||||||||||||||||||||||||||||||||||
|
Changes in fair value of effective portion of cash flow hedges - gross
|
- | - | 303,472 | - | - | 303,472 | - | - | - | 303,472 | - | 303,472 | ||||||||||||||||||||||||||||||||||||
|
Changes in fair value of effective portion of cash flow hedges - tax
|
- | - | (54,371 | ) | - | - | (54,371 | ) | - | - | - | (54,371 | ) | - | (54,371 | ) | ||||||||||||||||||||||||||||||||
|
Cash flow hedges recorded in shareholders’ equity reclassified to inventories - gross
|
- | - | 7,116 | - | - | 7,116 | - | - | - | 7,116 | - | 7,116 | ||||||||||||||||||||||||||||||||||||
|
Cash flow hedges recorded in shareholders’ equity reclassified to inventories - tax
|
- | - | (1,210 | ) | - | - | (1,210 | ) | - | - | - | (1,210 | ) | - | (1,210 | ) | ||||||||||||||||||||||||||||||||
|
Cash flow hedges recorded in shareholders’ equity reclassified to exchange gain and bank charges, net - gross
|
- | - | (1,759 | ) | - | - | (1,759 | ) | - | - | - | (1,759 | ) | - | (1,759 | ) | ||||||||||||||||||||||||||||||||
|
Cash flow hedges recorded in shareholders’ equity reclassified to exchange gain and bank charges, net - tax
|
- | - | 299 | - | - | 299 | - | - | - | 299 | - | 299 | ||||||||||||||||||||||||||||||||||||
|
Cash flow hedges recorded in shareholders’ equity reclassified to interest expense - gross
|
- | - | 203,673 | - | - | 203,673 | - | - | - | 203,673 | - | 203,673 | ||||||||||||||||||||||||||||||||||||
|
Cash flow hedges recorded in shareholders’ equity reclassified to interest expense - tax
|
- | - | (39,329 | ) | - | - | (39,329 | ) | - | - | - | (39,329 | ) | - | (39,329 | ) | ||||||||||||||||||||||||||||||||
|
Currency translation differences
|
- | - | - | - | - | - | - | (781,306 | ) | - | (781,306 | ) | (757 | ) | (782,063 | ) | ||||||||||||||||||||||||||||||||
|
Total comprehensive income/(loss) for the year ended 31 December 2013
|
- | - | 417,891 | (141,725 | ) | - | 276,166 | - | (781,306 | ) | 10,426,024 | 9,920,884 | 2,473,237 | 12,394,121 | ||||||||||||||||||||||||||||||||||
|
Dividends relating to 2012
|
- | - | - | - | - | - | - | - | (2,951,631 | ) | (2,951,631 | ) | (635,307 | ) | (3,586,938 | ) | ||||||||||||||||||||||||||||||||
|
Capital injections from non-controlling
|
- | 40,005 | - | - | - | 40,005 | - | - | - | 40,005 | 828,220 | 868,225 | ||||||||||||||||||||||||||||||||||||
|
interests of subsidiaries
|
||||||||||||||||||||||||||||||||||||||||||||||||
|
Acquisitions of subsidiaries
|
- | - | - | - | - | - | - | - | - | - | 254,750 | 254,750 | ||||||||||||||||||||||||||||||||||||
|
Acquisitions of non-controlling interests
|
- | - | - | - | - | - | - | - | (556 | ) | (556 | ) | (8,799 | ) | (9,355 | ) | ||||||||||||||||||||||||||||||||
|
Others*
|
- | (688,180 | ) | - | - | - | (688,180 | ) | - | - | 9 | (688,171 | ) | - | (688,171 | ) | ||||||||||||||||||||||||||||||||
|
Balance as at 31 December 2013
|
14,055,383 | 16,233,589 | (301,194 | ) | 351,251 | 1,063,422 | 17,347,068 | 7,085,454 | (817,243 | ) | 24,780,003 | 62,450,665 | 12,742,309 | 75,192,974 | ||||||||||||||||||||||||||||||||||
*Others mainly represented state-owned fund allocated from government budget received from the Ministry of Finance of PRC through China Huaneng Group (“国有资本经营预算资金”) of approximately RMB640 million in previous years, which was repaid to China Huaneng Group in 2013 and subsequently lent to the Company as an entrusted loan pursuant to relevant regulation in the PRC.
The accompanying notes are an integral part of these financial statements.
F-5
Huaneng Power International, Inc.
Consolidated Statements of Changes in Equity (Continued)
For the years ended 31 December 2015, 2014 and 2013
(Prepared in accordance with International Financial Reporting Standards)
(Amounts expressed in thousands of RMB)
|
Attributable to equity holders of the Company
|
||||||||||||||||||||||||||||||||||||||||||||||||
|
Capital surplus
|
||||||||||||||||||||||||||||||||||||||||||||||||
|
Share capital
|
Share premium
|
Hedging reserve
|
Available-for-sale financial assets revaluation reserve
|
Other capital reserve
|
Subtotal
|
Surplus reserves
|
Currency translation differences
|
Retained earnings
|
Total
|
Non-controlling interests
|
Total equity
|
|||||||||||||||||||||||||||||||||||||
|
Balance as at 1 January 2014
|
14,055,383 | 16,233,589 | (301,194 | ) | 351,251 | 1,063,422 | 17,347,068 | 7,085,454 | (817,243 | ) | 24,780,003 | 62,450,665 | 12,742,309 | 75,192,974 | ||||||||||||||||||||||||||||||||||
|
Profit for the year ended 31 December 2014
|
- | - | - | - | - | - | - | - | 10,757,317 | 10,757,317 | 2,805,055 | 13,562,372 | ||||||||||||||||||||||||||||||||||||
|
Other comprehensive income/ (loss):
|
||||||||||||||||||||||||||||||||||||||||||||||||
|
Fair value changes from available-for-sale financial asset - gross
|
- | - | - | 1,120,385 | - | 1,120,385 | - | - | - | 1,120,385 | - | 1,120,385 | ||||||||||||||||||||||||||||||||||||
|
Fair value changes from available-for-sale financial asset - tax
|
- | - | - | (280,096 | ) | - | (280,096 | ) | - | - | - | (280,096 | ) | - | (280,096 | ) | ||||||||||||||||||||||||||||||||
|
Shares of other comprehensive income of investees accounted for under the equity method - gross
|
- | - | - | 116,972 | - | 116,972 | - | - | - | 116,972 | - | 116,972 | ||||||||||||||||||||||||||||||||||||
|
Shares of other comprehensive income of investees accounted for under the equity method - tax
|
- | - | - | (29,393 | ) | - | (29,393 | ) | - | - | - | (29,393 | ) | - | (29,393 | ) | ||||||||||||||||||||||||||||||||
|
Changes in fair value of effective portion of cash flow hedges - gross
|
- | - | (1,479,632 | ) | - | - | (1,479,632 | ) | - | - | - | (1,479,632 | ) | - | (1,479,632 | ) | ||||||||||||||||||||||||||||||||
|
Changes in fair value of effective portion of cash flow hedges - tax
|
- | - | 254,590 | - | - | 254,590 | - | - | - | 254,590 | - | 254,590 | ||||||||||||||||||||||||||||||||||||
|
Cash flow hedges recorded in shareholders’ equity reclassified to inventories - gross
|
- | - | 371,725 | - | - | 371,725 | - | - | - | 371,725 | - | 371,725 | ||||||||||||||||||||||||||||||||||||
|
Cash flow hedges recorded in shareholders’ equity reclassified to inventories - tax
|
- | - | (63,193 | ) | - | - | (63,193 | ) | - | - | - | (63,193 | ) | - | (63,193 | ) | ||||||||||||||||||||||||||||||||
|
Cash flow hedges recorded in shareholders’ equity reclassified to exchange gain and bank charges, net - gross
|
- | - | (51,772 | ) | - | - | (51,772 | ) | - | - | - | (51,772 | ) | - | (51,772 | ) | ||||||||||||||||||||||||||||||||
|
Cash flow hedges recorded in shareholders’ equity reclassified to exchange gain and bank charges, net - tax
|
- | - | 8,801 | - | - | 8,801 | - | - | - | 8,801 | - | 8,801 | ||||||||||||||||||||||||||||||||||||
|
Cash flow hedges recorded in shareholders’ equity reclassified to interest expense - gross
|
- | - | 209,652 | - | - | 209,652 | - | - | - | 209,652 | - | 209,652 | ||||||||||||||||||||||||||||||||||||
|
Cash flow hedges recorded in shareholders’ equity reclassified to interest expense - tax
|
- | - | (40,086 | ) | - | - | (40,086 | ) | - | - | - | (40,086 | ) | - | (40,086 | ) | ||||||||||||||||||||||||||||||||
|
Currency translation differences
|
- | - | - | - | - | - | - | (377,576 | ) | - | (377,576 | ) | (313 | ) | (377,889 | ) | ||||||||||||||||||||||||||||||||
|
Total comprehensive (loss)/income for the year ended 31 December 2014
|
- | - | (789,915 | ) | 927,868 | - | 137,953 | - | (377,576 | ) | 10,757,317 | 10,517,694 | 2,804,742 | 13,322,436 | ||||||||||||||||||||||||||||||||||
|
Dividends relating to 2013
|
- | - | - | - | - | - | - | - | (5,341,046 | ) | (5,341,046 | ) | (1,739,740 | ) | (7,080,786 | ) | ||||||||||||||||||||||||||||||||
|
Issuance of new H shares, net of issuance expenses
|
365,000 | 2,088,986 | - | - | - | 2,088,986 | - | - | - | 2,453,986 | - | 2,453,986 | ||||||||||||||||||||||||||||||||||||
|
Capital injections from non-controlling interests of subsidiaries
|
- | - | - | - | - | - | - | - | - | - | 606,719 | 606,719 | ||||||||||||||||||||||||||||||||||||
|
Appropriation of surplus reserve
|
- | - | - | - | - | - | 110,895 | - | (110,895 | ) | - | - | - | |||||||||||||||||||||||||||||||||||
|
Acquisitions of a subsidiary
|
- | - | - | - | - | - | - | - | - | - | 2,631 | 2,631 | ||||||||||||||||||||||||||||||||||||
|
Disposal of a subsidiary
|
- | - | - | - | - | - | - | - | - | - | (99,958 | ) | (99,958 | ) | ||||||||||||||||||||||||||||||||||
|
Disposal of non-controlling interests of a subsidiary
|
- | - | - | - | 48,192 | 48,192 | - | - | - | 48,192 | 336,512 | 384,704 | ||||||||||||||||||||||||||||||||||||
|
Balance as at 31 December 2014
|
14,420,383 | 18,322,575 | (1,091,109 | ) | 1,279,119 | 1,111,614 | 19,622,199 | 7,196,349 | (1,194,819 | ) | 30,085,379 | 70,129,491 | 14,653,215 | 84,782,706 | ||||||||||||||||||||||||||||||||||
The accompanying notes are an integral part of these financial statements.
F-6
Huaneng Power International, Inc.
Consolidated Statements of Changes in Equity (Continued)
For the years ended 31 December 2015, 2014 and 2013
(Prepared in accordance with International Financial Reporting Standards)
(Amounts expressed in thousands of RMB)
|
Attributable to equity holders of the Company
|
||||||||||||||||||||||||||||||||||||||||||||||||
|
Capital surplus
|
||||||||||||||||||||||||||||||||||||||||||||||||
|
Share capital
|
Share premium
|
Hedging reserve
|
Available-for-sale financial assets revaluation reserve
|
Other capital reserve
|
Subtotal
|
Surplus reserves
|
Currency translation differences
|
Retained earnings
|
Total
|
Non-controlling interests
|
Total equity
|
|||||||||||||||||||||||||||||||||||||
|
Balance as at 1 January 2015
|
14,420,383 | 18,322,575 | (1,091,109 | ) | 1,279,119 | 1,111,614 | 19,622,199 | 7,196,349 | (1,194,819 | ) | 30,085,379 | 70,129,491 | 14,653,215 | 84,782,706 | ||||||||||||||||||||||||||||||||||
|
Profit for the year ended 31 December 2015
|
- | - | - | - | - | - | - | - | 13,651,933 | 13,651,933 | 3,607,174 | 17,259,107 | ||||||||||||||||||||||||||||||||||||
|
Other comprehensive income/ (loss):
|
||||||||||||||||||||||||||||||||||||||||||||||||
|
Fair value changes from available-for-sale financial asset - gross
|
- | - | - | 744,348 | - | 744,348 | - | - | - | 744,348 | - | 744,348 | ||||||||||||||||||||||||||||||||||||
|
Fair value changes from available-for-sale financial asset - tax
|
- | - | - | (186,087 | ) | - | (186,087 | ) | - | - | - | (186,087 | ) | - | (186,087 | ) | ||||||||||||||||||||||||||||||||
|
Shares of other comprehensive income of investees accounted for under the equity method - gross
|
- | - | - | 904,007 | - | 904,007 | - | - | - | 904,007 | - | 904,007 | ||||||||||||||||||||||||||||||||||||
|
Shares of other comprehensive income of investees accounted for under the equity method - tax
|
- | - | - | (225,214 | ) | - | (225,214 | ) | - | - | - | (225,214 | ) | - | (225,214 | ) | ||||||||||||||||||||||||||||||||
|
Changes in fair value of effective portion of cash flow hedges - gross
|
- | - | (962,683 | ) | - | - | (962,683 | ) | - | - | - | (962,683 | ) | - | (962,683 | ) | ||||||||||||||||||||||||||||||||
|
Changes in fair value of effective portion of cash flow hedges - tax
|
- | - | 166,135 | - | - | 166,135 | - | - | - | 166,135 | - | 166,135 | ||||||||||||||||||||||||||||||||||||
|
Cash flow hedges recorded in shareholders’ equity reclassified to inventories - gross
|
- | - | 1,003,778 | - | - | 1,003,778 | - | - | - | 1,003,778 | - | 1,003,778 | ||||||||||||||||||||||||||||||||||||
|
Cash flow hedges recorded in shareholders’ equity reclassified to inventories - tax
|
- | - | (170,642 | ) | - | - | (170,642 | ) | - | - | - | (170,642 | ) | - | (170,642 | ) | ||||||||||||||||||||||||||||||||
|
Cash flow hedges recorded in shareholders’ equity reclassified to exchange gain and bank charges, net - gross
|
- | - | (137,859 | ) | - | - | (137,859 | ) | - | - | - | (137,859 | ) | - | (137,859 | ) | ||||||||||||||||||||||||||||||||
|
Cash flow hedges recorded in shareholders’ equity reclassified to exchange gain and bank charges, net - tax
|
- | - | 23,436 | - | - | 23,436 | - | - | - | 23,436 | - | 23,436 | ||||||||||||||||||||||||||||||||||||
|
Cash flow hedges recorded in shareholders’ equity reclassified to interest expense - gross
|
- | - | 161,124 | - | - | 161,124 | - | - | - | 161,124 | - | 161,124 | ||||||||||||||||||||||||||||||||||||
|
Cash flow hedges recorded in shareholders’ equity reclassified to interest expense - tax
|
- | - | (31,367 | ) | - | - | (31,367 | ) | - | - | - | (31,367 | ) | - | (31,367 | ) | ||||||||||||||||||||||||||||||||
|
Currency translation differences
|
- | - | - | - | - | - | - | (133,020 | ) | - | (133,020 | ) | (96 | ) | (133,116 | ) | ||||||||||||||||||||||||||||||||
|
Total comprehensive income /(loss) for the year ended 31 December 2015
|
- | - | 51,922 | 1,237,054 | - | 1,288,976 | - | (133,020 | ) | 13,651,933 | 14,807,889 | 3,607,078 | 18,414,967 | |||||||||||||||||||||||||||||||||||
|
Dividends relating to 2014 (Note 22)
|
- | - | - | - | - | - | - | - | (5,479,746 | ) | (5,479,746 | ) | (3,285,330 | ) | (8,765,076 | ) | ||||||||||||||||||||||||||||||||
|
Issuance of new H shares, net of issuance expenses (Note 20)
|
780,000 | 3,904,314 | - | - | - | 3,904,314 | - | - | - | 4,684,314 | - | 4,684,314 | ||||||||||||||||||||||||||||||||||||
|
Capital injections from non-controlling interests of subsidiaries
|
- | - | - | - | - | - | - | - | - | - | 623,107 | 623,107 | ||||||||||||||||||||||||||||||||||||
|
Transfer to surplus reserve (Note 21)
|
- | - | - | - | - | - | 943,681 | - | (943,681 | ) | - | - | - | |||||||||||||||||||||||||||||||||||
|
Business combinations (Note 39)
|
- | - | - | - | - | - | - | - | - | - | 1,934,865 | 1,934,865 | ||||||||||||||||||||||||||||||||||||
|
Others
|
- | - | - | - | - | - | - | - | - | - | 18,806 | 18,806 | ||||||||||||||||||||||||||||||||||||
|
Balance as at 31 December 2015
|
15,200,383 | 22,226,889 | (1,039,187 | ) | 2,516,173 | 1,111,614 | 24,815,489 | 8,140,030 | (1,327,839 | ) | 37,313,885 | 84,141,948 | 17,551,741 | 101,693,689 | ||||||||||||||||||||||||||||||||||
The accompanying notes are an integral part of these financial statements.
F-7
Huaneng Power International, Inc.
Consolidated Statements of Cash Flows
For the years ended 31 December 2015, 2014 and 2013
(Prepared in accordance with International Financial Reporting Standards)
(Amounts expressed in thousands of RMB)
|
For the year ended 31 December
|
||||||||||||
|
2015
|
2014
|
2013
|
||||||||||
|
RMB
|
RMB
|
RMB
|
||||||||||
|
CASH FLOWS FROM OPERATING ACTIVITIES
|
||||||||||||
|
Profit before income tax expense
|
22,958,050 | 19,049,580 | 17,422,689 | |||||||||
|
Adjustments to reconcile profit before income tax expense to net cash provided by operating activities:
|
||||||||||||
|
Depreciation
|
14,411,632 | 11,646,683 | 11,293,522 | |||||||||
|
Provision for impairment loss on property, plant and equipment
|
1,047,641 | 1,358,522 | 472,921 | |||||||||
|
Provision for impairment loss on investment in an associate
|
178,131 | 120,050 | - | |||||||||
|
Provision for impairment loss on goodwill
|
1,105,649 | 641,061 | 980,513 | |||||||||
|
Provision for impairment loss on mining right
|
760,296 | - | - | |||||||||
|
Provision for impairment loss on land use right
|
- | - | 6,804 | |||||||||
|
Amortization of land use rights
|
213,206 | 133,069 | 139,609 | |||||||||
|
Amortization of other non-current assets
|
92,775 | 99,528 | 112,384 | |||||||||
|
Amortization of employee housing subsidies
|
940 | 940 | 940 | |||||||||
|
(Reversal)/recognition of provision for doubtful accounts
|
(3,392 | ) | 4,577 | (2,610 | ) | |||||||
|
Recognition/(reversal) of provision for inventory obsolescence
|
1,828 | (2,647 | ) | (824 | ) | |||||||
|
Loss /(gain) on fair value changes of financial assets/liabilities
|
16,742 | (42,538 | ) | 5,701 | ||||||||
|
Other investment income
|
(115,238 | ) | (80,580 | ) | (224,908 | ) | ||||||
|
Net loss on disposals of property, plant and equipment
|
438,321 | 427,034 | 897,222 | |||||||||
|
Unrealized exchange loss/ (gain), net
|
166,148 | (34,769 | ) | (107,249 | ) | |||||||
|
Share of profits less losses of associates and joint ventures
|
(1,525,975 | ) | (1,315,876 | ) | (615,083 | ) | ||||||
|
Interest income
|
(160,723 | ) | (159,550 | ) | (170,723 | ) | ||||||
|
Interest expense
|
7,945,734 | 7,814,114 | 7,787,472 | |||||||||
|
Others
|
(89,332 | ) | (217,829 | ) | 106,484 | |||||||
|
Changes in working capital:
|
||||||||||||
|
Inventories
|
2,106,821 | (195,853 | ) | 517,837 | ||||||||
|
Other receivables and assets
|
72,925 | (64,288 | ) | 992,322 | ||||||||
|
Accounts receivable
|
(175,429 | ) | 466,878 | (846,214 | ) | |||||||
|
Restricted cash
|
499,899 | (243,624 | ) | (7,091 | ) | |||||||
|
Accounts payable and other liabilities
|
(2,932,761 | ) | (1,417,668 | ) | 4,598,219 | |||||||
|
Taxes payable
|
1,366,209 | 1,245,941 | 1,442,845 | |||||||||
|
Salary and welfare payables
|
75,803 | (17,566 | ) | (26,492 | ) | |||||||
|
Interest received
|
102,813 | 97,374 | 100,278 | |||||||||
|
Income tax expense paid
|
(6,196,005 | ) | (5,992,496 | ) | (4,637,139 | ) | ||||||
|
Net cash provided by operating activities
|
42,362,708 | 33,320,067 | 40,239,429 | |||||||||
The accompanying notes are integral part of these financial statements.
F-8
Huaneng Power International, Inc.
Consolidated Statements of Cash Flows (Continued)
For the years ended 31 December 2015, 2014 and 2013
(Prepared in accordance with International Financial Reporting Standards)
(Amounts expressed in thousands of RMB)
|
For the year ended 31 December
|
||||||||||||
|
2015
|
2014
|
2013
|
||||||||||
|
RMB
|
RMB
|
RMB
|
||||||||||
|
CASH FLOWS FROM INVESTING ACTIVITIES
|
||||||||||||
|
Payment for the purchase of property, plant and equipment
|
(24,191,285 | ) | (19,858,216 | ) | (17,691,382 | ) | ||||||
|
Proceeds from disposal of property, plant and equipment
|
109,013 | 70,712 | 166,459 | |||||||||
|
Prepayments of land use rights
|
(136,045 | ) | (500,100 | ) | (5,947 | ) | ||||||
|
Payment for the purchase of other non-current assets
|
(6,981 | ) | (21,576 | ) | (32,601 | ) | ||||||
|
Cash dividends received
|
937,189 | 565,334 | 408,166 | |||||||||
|
Payment for investment in associates and joint ventures
|
(889,780 | ) | (266,877 | ) | (2,017,853 | ) | ||||||
|
Cash paid for acquiring available-for-sale financial assets
|
- | - | (200,000 | ) | ||||||||
|
Cash consideration paid for acquisitions of subsidiaries, net of cash acquired (Note 39)
|
(8,887,882 | ) | (17,991 | ) | 36,599 | |||||||
|
Cash received from disposal of trading securities
|
- | - | 102,784 | |||||||||
|
Cash received from disposal of subsidiaries
|
- | 503,809 | 6,199 | |||||||||
|
Others
|
50,759 | 54,092 | 173,326 | |||||||||
|
Net cash used in investing activities
|
(33,015,012 | ) | (19,470,813 | ) | (19,054,250 | ) | ||||||
The accompanying notes are integral part of these financial statements.
F-9
Huaneng Power International, Inc.
Consolidated Statements of Cash Flows (Continued)
For the years ended 31 December 2015, 2014 and 2013
(Prepared in accordance with International Financial Reporting Standards)
(Amounts expressed in thousands of RMB)
|
For the year ended 31 December
|
|||||||||||||
|
Note
|
2015
|
2014
|
2013
|
||||||||||
|
RMB
|
RMB
|
RMB
|
|||||||||||
|
CASH FLOWS FROM FINANCING ACTIVITIES
|
|||||||||||||
|
Issuance of short-term bonds
|
18,980,000 | 17,971,000 | 24,950,000 | ||||||||||
|
Repayments of short-term bonds
|
(18,000,000 | ) | (15,000,000 | ) | (45,000,000 | ) | |||||||
|
Proceeds from short-term loans
|
67,298,044 | 61,503,204 | 41,314,000 | ||||||||||
|
Repayments of short-term loans
|
(62,600,955 | ) | (55,896,200 | ) | (30,869,290 | ) | |||||||
|
Proceeds from long-term loans
|
9,943,689 | 9,647,090 | 5,091,175 | ||||||||||
|
Repayments of long-term loans
|
(12,799,719 | ) | (17,522,953 | ) | (12,889,078 | ) | |||||||
|
Issuance of long-term bonds
|
- | 3,988,000 | 6,485,000 | ||||||||||
|
Repayments of long-term bonds
|
(5,000,000 | ) | (5,700,000 | ) | - | ||||||||
|
Interest paid
|
(8,677,316 | ) | (8,097,216 | ) | (8,290,433 | ) | |||||||
|
Net proceeds from the issuance of new H shares
|
4,684,314 | 2,453,986 | - | ||||||||||
|
Net capital injection from non-controlling interests of subsidiaries
|
623,107 | 606,719 | 868,225 | ||||||||||
|
Government grants
|
322,011 | 188,406 | 274,472 | ||||||||||
|
Dividends paid to shareholders of the Company
|
(5,535,655 | ) | (5,341,046 | ) | (2,951,631 | ) | |||||||
|
Dividends paid to non-controlling interests of subsidiaries
|
(2,954,194 | ) | (1,474,329 | ) | (539,876 | ) | |||||||
|
Proceeds from sales leaseback classified as finance lease
|
100,000 | 1,500,000 | - | ||||||||||
|
Repayment of state-owned fund received from China Huaneng Group in prior years
|
- | - | (640,485 | ) | |||||||||
|
Cash received from disposal of non-controlling interests of a subsidiary
|
- | 384,702 | - | ||||||||||
|
Others
|
(523,985 | ) | (105,543 | ) | (42,167 | ) | |||||||
|
Net cash used in financing activities
|
(14,140,659 | ) | (10,894,180 | ) | (22,240,088 | ) | |||||||
|
Effect of exchange rate fluctuations on cash held
|
32,846 | (58,379 | ) | (108,806 | ) | ||||||||
|
NET (DECREASE)/ INCREASE IN CASH AND CASH EQUIVALENTS
|
(4,760,117 | ) | 2,896,695 | (1,163,715 | ) | ||||||||
|
Cash and cash equivalents as at beginning of the year
|
12,238,367 | 9,341,672 | 10,505,387 | ||||||||||
|
CASH AND CASH EQUIVALENTS AS AT END OF THE YEAR
|
34
|
7,478,250 | 12,238,367 | 9,341,672 | |||||||||
The accompanying notes are integral part of these financial statements.
F-10
HUANENG POWER INTERNATIONAL, INC.
NOTES TO THE FINANCIAL STATEMENTS
(Prepared in accordance with International Financial Reporting Standards)
(Amounts expressed in thousands of RMB unless otherwise stated)
|
1
|
Company organization and principal activities
|
Huaneng Power International, Inc. (the “Company”) was incorporated in the People’s Republic of China (the “PRC”) as a Sino-foreign joint stock limited company on 30 June 1994. The registered address of the Company is Huaneng Building, 6 Fuxingmennei Street, Xicheng District, Beijing, the PRC. The Company and its subsidiaries are principally engaged in the generation and sale of electric power to the respective regional or provincial grid companies in the PRC and in the Republic of Singapore (“Singapore”). The Company conducts its business in Singapore through SinoSing Power Pte Ltd. (“SinoSing Power”) and its subsidiaries.
The directors consider Huaneng International Power Development Corporation (“HIPDC”) and China Huaneng Group (“Huaneng Group”) as the parent company and ultimate parent company of the Company, respectively. Both HIPDC and Huaneng Group are incorporated in the PRC. HIPDC does not produce financial statements available for public use.
|
2
|
Principal accounting policies
|
The principal accounting policies adopted in the preparation of these financial statements are set out below. These policies have been consistently applied to all the years presented, unless otherwise stated.
|
|
(a)
|
Basis of preparation
|
These financial statements have been prepared in accordance with International Financial Reporting Standards (“IFRS”) as issued by the International Accounting Standards Board (the “IASB”) and the disclosure requirement of the Hong Kong Companies Ordinance. These financial statements also comply with the applicable disclosure provisions of the Rules Governing the Listing of Securities on the Stock Exchange of Hong Kong Limited. These financial statements have been prepared under the historical cost convention, as modified by the revaluation of available-for-sale financial assets and derivative financial assets and liabilities.
The preparation of financial statements in conformity with IFRS requires the use of certain critical accounting estimates. It also requires management to exercise its judgment in the process of applying the Company and its subsidiaries’ accounting policies. The areas involving a higher degree of judgment or complexity, or areas where assumptions and estimates are significant to the financial statements are disclosed in Note 4.
As at and for the year ended 31 December 2015, a portion of the Company and its subsidiaries’ funding requirements for capital expenditures were satisfied by short-term financing. Consequently, as at 31 December 2015, the Company and its subsidiaries have net current liabilities of approximately RMB90.3 billion. Taking into consideration of the expected operating cash flows of the Company and its subsidiaries and the undrawn available banking facilities of approximately RMB235.7 billion as at 31 December 2015, the Company and its subsidiaries are expected to refinance certain of its short term loans and bonds and also to consider alternative sources of financing, where applicable and when needed. Therefore, the directors of the Company are of the opinion that the Company and its subsidiaries will be able to meet its liabilities as and when they fall due within the next twelve months and accordingly, these consolidated financial statements are prepared on a going concern basis.
F-11
|
2
|
Principal accounting policies (Continued)
|
|
|
(a)
|
Basis of preparation (Continued)
|
Except as described below, the principal accounting policies adopted are consistent with those applied in the annual financial statements for the year ended 31 December 2014 described in those annual financial statements.
The Company and its subsidiaries have adopted the following new amendments to standards that are first effective for the current accounting period:
|
|
•
|
Amendments to IAS 19, Employee benefits - Defined benefit plans: Employee contributions
|
|
|
•
|
Annual Improvements to IFRSs 2010-2012 Cycle
|
|
|
•
|
Annual Improvements to IFRSs 2011-2013 Cycle
|
None of these developments have had a material effect on how the Company and its subsidiaries’ results and financial position for the current or prior periods have been prepared or presented. The Company and its subsidiaries have not applied any new standard or interpretation that is not yet effective for current accounting period.
|
|
(b)
|
Consolidation
|
The consolidated financial statements include the financial statements of the Company and all of its subsidiaries.
Subsidiaries are investees over which the Company and its subsidiaries have the power to exercise control. The Company and its subsidiaries control an entity when it is exposed, or have rights to variable returns from their involvement with the entity and have the ability to affect those returns through their power over the entity. In assessing whether the Company and its subsidiaries have power, only substantive rights (held by the Company and its subsidiaries and other parties) are considered.
Subsidiaries are consolidated from the date when control is transferred to the Company and its subsidiaries. They are de-consolidated from the date when control ceases. Intra-group balances, transactions and cash flows, and any unrealised income and expenses arising from intra-group transactions, are eliminated in full in preparing the consolidated financial statements. Unrealised gains arising from transactions with equity accounted investees are eliminated against the investment to the extent of the Company and its subsidiaries’ interest in the investee. Unrealised losses are eliminated in the same way as unrealised gains, but only to the extent that there is no evidence of impairment. The portion of the shareholders’ equity of the subsidiaries, which is not attributable directly or indirectly to the parent company, is separately presented as non-controlling interests in the shareholders’ equity in the consolidated financial statements.
When there is any inconsistency on the accounting policies or financial period adopted between subsidiaries and the Company, the financial statements of subsidiaries are adjusted according to the accounting policies or financial period adopted by the Company.
F-12
|
2
|
Principal accounting policies (Continued)
|
|
|
(b)
|
Consolidation (Continued)
|
|
|
(i)
|
Business combinations
|
The acquisition method is used to account for the business combinations of the Company and its subsidiaries (including business combination under common controls). The consideration transferred for the acquisition of a subsidiary is the fair values of the assets transferred, the liabilities incurred to the former owners of the acquiree and the equity interests issued by the Company and its subsidiaries. The consideration transferred includes the fair value of any asset or liability resulting from a contingent consideration arrangement. Acquisition-related costs are expensed as incurred. Identifiable assets acquired and liabilities and contingent liabilities assumed in a business combination are measured initially at their fair values at the acquisition date. On an acquisition-by-acquisition basis, the Company and its subsidiaries recognize any non-controlling interests in the acquiree either at fair value or at the non-controlling interest’s proportionate share of the recognized amounts of acquiree’s identifiable net assets. The excess of the consideration transferred, the amount of any non-controlling interest in the acquiree and the acquisition-date fair value of any previous equity interest in the acquiree over the fair value of the identifiable net assets acquired is recorded as goodwill (Note 2(i)). If this consideration is lower than the fair value of the net assets of the subsidiary acquired, the difference is recognized in profit or loss.
|
|
(ii)
|
Changes in ownership interests in subsidiaries without change of control
|
Transactions with non-controlling interests that do not result in loss of control are accounted for as equity transactions – that is, as transactions with the equity owners in their capacity as owners. The difference between fair value of any consideration paid and the relevant share acquired of the carrying value of net assets of the subsidiary is recorded in equity. Gains or losses on disposals to non-controlling interests are also recorded in equity.
|
|
(iii)
|
Associates and joint ventures
|
Associates are investees over which the Company and its subsidiaries have significant influence on the financial and operating decisions. A joint venture is an arrangement whereby the Company and its subsidiaries and other parties contractually agree to share control of the arrangement, and have rights to the net assets of the arrangement.
Investments in associates and joint ventures are initially recognized at cost and are subsequently measured using the equity method of accounting, unless it is classified as held for sale (or included in a disposal group that is classified as held for sale). The excess of the initial investment cost over the proportionate share of the fair value of identifiable net assets of investee acquired is included in the initial investment cost (Note 2(i)). Any shortfall of the initial investment cost to the proportionate share of the fair value of identifiable net assets of investee acquired is recognized in current period profit or loss and long-term investment cost is adjusted accordingly.
F-13
|
2
|
Principal accounting policies (Continued)
|
|
|
(b)
|
Consolidation (Continued)
|
|
|
(iii)
|
Associates and joint ventures (Continued)
|
When applying equity method, the Company and its subsidiaries adjust net profit or loss of the investees, including the fair value adjustments on the net identifiable assets of the associates and joint ventures and the adjustments to align with the accounting policies of the Company and the Company’s financial reporting periods. Current period investment income is then recognized based on the proportionate share of the Company and its subsidiaries in the investees’ net profit or loss. Net losses of investees are recognized to the extent of the carrying value of long-term equity investments and any other constituting long-term equity investments in investees that in substance form part of the investments in the investees. The Company and its subsidiaries continue to recognize investment losses and provision if they bear additional obligations which meet the recognition criteria.
The Company and its subsidiaries adjust the carrying amount of the investment and directly recognize into related other comprehensive income based on their proportionate share on the movements of the investees’ other comprehensive income except net profit or loss, given there is no change in shareholding ratio.
When the investees appropriate profit or declare dividends, the carrying value of long-term equity investments are reduced correspondingly by the proportionate share of the distribution.
The Company and its subsidiaries determine at each reporting date whether there is any objective evidence that the investment in the associate or the joint venture is impaired. If this is the case, the Company and its subsidiaries calculate the amount of impairment as the difference between the recoverable amount of the associate or the joint venture and its carrying value and recognize the amount in the consolidated statement of comprehensive income.
Profits or losses resulting from transactions between the Company and its subsidiaries and the associates and joint ventures are recognized in the Company and its subsidiaries’ financial statements only to the extent of the unrelated third party investor’s interests in the associates and joint ventures. Loss from transactions between the Company and its subsidiaries and the associates and joint ventures is fully recognized and not eliminated when there is evidence for asset impairment.
If an investment in an associate becomes an investment in a joint venture or vice versa, retained interest is not remeasured. Instead, the investment continues to be accounted for under the equity method.
Gains and losses arising from dilution of investments in associates and joint ventures are recognized in the consolidated statement of comprehensive income.
In the Company’s statement of financial position, investments in associates and joint ventures are stated at cost less provision for impairment losses (Note 2(j)) unless classified as held for sale (or included in a disposal group that is classified as held for sale). Investment income from investments in associates and joint ventures is accounted for by the Company based on dividends received and receivable.
F-14
|
2
|
Principal accounting policies (Continued)
|
|
|
(b)
|
Consolidation (Continued)
|
|
|
(iii)
|
Associates and joint ventures (Continued)
|
In all other cases, when the Company and its subsidiaries cease to have significant influence over an associate or joint control over a joint venture, it is accounted for as a disposal of the entire interest in that investee, with a resulting gain or loss being recognized in profit or loss. Any interest retained in that former investee at the date when significant influence or joint control is lost is recognized at fair value and this amount is regarded as the fair value on initial recognition of a financial asset (Note 2(k)).
|
|
(c)
|
Separate financial statements of the Company
|
Investments in subsidiaries are accounted for at cost less impairment unless classified as held for sale (or included in a disposal group that is classified as held for sale). Cost also includes direct attributable costs of investment. Investment income is recognized when the subsidiaries declare dividend.
|
|
(d)
|
Segment reporting
|
The Company and its subsidiaries determine the operating segment based on the internal organization structure, management requirement and internal reporting system for purposes of presenting reportable segment information.
An operating segment represents a component of the Company and its subsidiaries that meets all the conditions below: (i) the component earns revenue and incurs expenses in its daily operating activities; (ii) chief operating decision maker of the Company and its subsidiaries regularly reviews the operating results of the component in order to make decisions on allocating resources and assessing performance; (iii) the financial position, operating results, cash flows and other related financial information of the component are available. When the two or more operating segments exhibit similar economic characteristics and meet certain conditions, the Company and its subsidiaries combine them as one reportable segment.
|
|
(e)
|
Foreign currency translation
|
|
|
(i)
|
Functional and presentation currency
|
Items included in the financial statements of each of the Company and its subsidiaries are measured using the currency of the primary economic environment in which the entity operates (the “functional currency”). The consolidated financial statements are presented in Renminbi (“RMB”), which is the Company’s functional and presentation currency.
F-15
|
2
|
Principal accounting policies (Continued)
|
|
|
(e)
|
Foreign currency translation (Continued)
|
|
|
(ii)
|
Transactions and balances
|
Foreign currency transactions are translated into the functional currency using the spot exchange rate on the transaction dates. As at the end of reporting period, foreign currency monetary items are translated into functional currency at the spot exchange rate as at the end of reporting period. Exchange differences are directly expensed in current period profit or loss unless they arises from foreign currency loans borrowed for purchasing or construction of qualifying assets which is eligible for capitalization or they arise from monetary items that qualify as hedging instruments in cash flow hedges which are recorded in other comprehensive income to the extent that the hedge is effective.
|
|
(iii)
|
Foreign subsidiaries
|
The operating results and financial position of the foreign subsidiaries are translated into presentation currency as follows:
Asset and liability items in each statement of financial position of foreign operations are translated at the closing rates at the end of reporting period; equity items excluding retained earnings are translated at the spot exchange rates at the date of the transactions. Income and expense items in the statement of comprehensive income of the foreign operations are translated at average exchange rates approximating the rate on transaction dates. All resulting translation differences are recognized in other comprehensive income.
The cash flows denominated in foreign currencies and cash flows of overseas subsidiaries are translated at average exchange rates approximating the rates at the dates when cash flows incurred. The effect of the foreign currency translation on the cash and cash equivalents is presented in the statement of cash flows separately.
On the disposal of a foreign operation (that is, a disposal of the Company and its subsidiaries’ entire interest in a foreign operation, or a disposal involving loss of control over a subsidiary that includes a foreign operation, a disposal involving loss of joint control over a joint ventures that includes a foreign operation, or a disposal involving loss of significant influence over an associate that includes a foreign operation), all of the exchange differences accumulated in equity in respect of that operation attributable to the equity holders of the Company are reclassified to profit or loss.
In the case of a partial disposal that does not result in the Company and its subsidiaries losing control over a subsidiary that includes a foreign operation, the proportionate share of accumulated exchange differences are re-attributed to non-controlling interests and are not recognized in profit or loss. For all other partial disposals (that is, reductions in the Company and its subsidiaries’ ownership interest in associates or joint venture that includes a foreign operation that do not result in the Company and its subsidiaries losing significant influence or joint control), the proportionate share of the accumulated exchange difference is reclassified to profit or loss.
F-16
|
2
|
Principal accounting policies (Continued)
|
|
|
(f)
|
Property, plant and equipment
|
Property, plant and equipment consists of dam, port facilities, buildings, electric utility plant in service, transportation facilities, others and construction-in-progress (“CIP”). Property, plant and equipment acquired or constructed are initially recognized at cost and carried at the net value of cost less accumulated depreciation and accumulated impairment loss, unless classified as held for sale (or included in a disposal group that is classified as held for sale).
Cost of CIP comprises construction expenditures, other expenditures necessary for the purpose of preparing the CIP for its intended use, those borrowing costs incurred before the assets are ready for intended use that are eligible for capitalization. CIP is not depreciated until such time as the relevant asset is completed and ready for its intended use.
Subsequent costs about property, plant and equipment are included in the asset’s carrying amount only when it is probable that future economic benefits associated with the item will flow to the Company and its subsidiaries and the cost of the item can be measured reliably. The carrying amount of the replaced part is derecognized. Other subsequent expenditures not qualified for capitalization are charged in the current period profit or loss when they are incurred.
Depreciation of property, plant and equipment is provided based on book value of the asset less estimated residual value over the estimated useful life using straight-line method. For those impaired property, plant and equipment, depreciation is provided based on book value after deducting impairment provision over the estimated useful life of the asset. The estimated useful lives are as follows:
|
Estimated useful lives
|
||
|
Dam
|
8 – 50 years
|
|
|
Port facilities
|
20 – 40 years
|
|
|
Buildings
|
8 – 30 years
|
|
|
Electric utility plant in service
|
5 – 30 years
|
|
|
Transportation facilities
|
8 – 27 years
|
|
|
Others
|
5 – 14 years
|
Where parts of an item of property, plant and equipment have different useful lives, the cost of the item is allocated on a reasonable basis between the parts and each part is depreciated separately. At the end of each year, the Company and its subsidiaries review the estimated useful lives, residual values and the depreciation method of the property, plant and equipment and make adjustment when necessary.
Property, plant and equipment is derecognized when it is disposed of, or is not expected to bring economic benefit through use or disposal. The amount of disposal income arising from sale, transfer, disposal or write-off of the property, plant and equipment less book value and related tax expenses is recorded in ‘operating expenses – others’ in the statement of comprehensive income.
The carrying amount of property, plant and equipment is written down immediately to its recoverable amount when its carrying amount is greater than its recoverable amount (Note 2(j)).
F-17
|
2
|
Principal accounting policies (Continued)
|
|
|
(g)
|
Power generation license
|
The Company and its subsidiaries acquired the power generation license as part of the business combination with Tuas Power Ltd. (“Tuas Power”). The power generation license is initially recognized at fair value at the acquisition date. The license has an indefinite useful life and is not amortized. The assessment that the license has an indefinite useful life is based on the expected renewal of power generation license without significant restriction and cost, together with the consideration on related future cash flows generated and the expectation of continuous operations. It is tested annually for impairment and carried at cost less accumulated impairment loss. Useful life of the power generation license is reviewed by the Company and its subsidiaries each financial period to determine whether events and circumstances continue to support the indefinite useful life assessment.
|
|
(h)
|
Mining rights
|
Mining rights are stated at cost less accumulated amortization and impairment losses (Note 2(j)) and are amortized based on the units of production method utilizing only recoverable coal reserves as the depletion base, unless the mining rights are classified as held for sale (or included in a disposal group that is classified as held for sale).
|
|
(i)
|
Goodwill
|
Goodwill arising from the acquisitions of subsidiaries, associates and joint ventures represents the excess of the consideration transferred, the amount of any non-controlling interest in the acquiree and the acquisition-date fair value of any previous equity interest in the acquiree over the Company and its subsidiaries’ share of the net fair value of the net identifiable assets, liabilities and contingent liabilities of the acquiree at the date of acquisition.
Goodwill is stated at cost less accumulated impairment losses. Goodwill arising on a business combination is allocated to each cash-generating unit, or groups of cash generating units, that is expected to benefit from the synergies of the combination and is tested annually for impairment (Note 2(j)).
On disposal of a cash generating unit during the year, any attributable amount of purchased goodwill is included in the calculation of the profit or loss on disposal.
|
|
(j)
|
Impairment of non-financial assets
|
The carrying amounts of property, plant and equipment, mining rights, intangible assets with definite useful lives, land use rights and long-term equity investments not accounted for as financial assets are reviewed at each reporting date to determine whether there is any indication of impairment. If any such indication exists, then the asset’s recoverable amount is estimated. Goodwill and indefinite-lived intangible assets are tested for impairment annually regardless of whether there are indications of impairment or more frequently if events or changes in circumstances indicate a potential impairment. An impairment loss is recognized if the carrying amount of an asset or cash-generating unit (“CGU”) exceeds its recoverable amount.
The recoverable amount of an asset or CGU is the greater of its value in use and its fair value less cost to sell. For impairment testing, assets are grouped together into the smallest group of assets that generates cash inflows from continuing use that are largely independent of the cash inflows of other assets or CGUs.
F-18
|
2
|
Principal accounting policies (Continued)
|
|
|
(j)
|
Impairment of non-financial assets (Continued)
|
Subject to an operating segment ceiling test, CGUs to which goodwill has been allocated are aggregated so that the level at which impairment testing is performed reflects the lowest level at which goodwill is monitored for internal reporting purposes.
Goodwill acquired in a business combination is allocated to groups of CGUs that are expected to benefit from the synergies of the combination.
Impairment losses are recognized in profit or loss. Impairment losses recognized in respect of CGUs are allocated first to reduce the carrying amount of any goodwill allocated to the CGU (group of CGUs), and then to reduce the carrying amounts of the other assets in the CGU (group of CGUs) on a pro rata basis, except that the carrying value of an asset will not be reduced below its individual fair value less costs of disposal (if measurable) or value in use (if determinable).
An impairment loss in respect of goodwill is not reversed. Except for goodwill, all impaired non-financial assets are subject to review for possible reversal of impairment at each reporting date. A reversal of an impairment loss is limited to the asset’s carrying amount that would have been determined had no impairment loss been recognized in prior year. Reversals of impairment losses are credited to profit or loss in the year in which the reversals are recognized.
|
|
(k)
|
Financial assets
|
Financial assets are classified in the following categories at initial recognition: at fair value through profit or loss, loans and receivables and available-for-sale. The classification depends on the intention and ability of the Company and its subsidiaries to hold the financial assets.
|
|
(i)
|
Financial assets at fair value through profit or loss
|
Financial assets at fair value through profit or loss include financial assets held for trading and designated upon initial recognition as at fair value through profit or loss. A financial asset is classified in this category if acquired principally for the purpose of selling in the short term. Derivatives are classified as held for trading unless they are designated as hedges. Assets in this category are classified as current assets if expected to be settled within 12 months; otherwise, they are classified as non-current.
|
|
(ii)
|
Loans and receivables
|
Loans and receivables refer to the non-derivative financial assets for which there is no quotation in the active market with fixed or determinable amount. They are included in current assets, except for maturities greater than 12 months after the end of reporting period which are classified as non-current assets. Loans and receivables are primarily included in as ‘accounts receivable’, ‘other receivables and assets’and ‘other non-current assets’ in the statement of financial position.
F-19
|
2
|
Principal accounting policies (Continued)
|
|
|
(k)
|
Financial assets (Continued)
|
|
|
(iii)
|
Available-for-sale financial assets
|
Available-for-sale financial assets are non-derivative financial assets that are either designated in this category or not classified in any of the other categories. They are included in current assets when management intends to dispose of the available-for-sale financial assets within 12 months of the end of reporting period.
|
|
(iv)
|
Recognition and measurement
|
Regular purchases and sales of financial assets are recognized at fair value initially on trade-date – the date on which the Company and its subsidiaries commit to purchase or sell the asset. Transaction costs relating to financial assets at fair value through profit or loss are directly expensed in the profit or loss as incurred. Transaction costs for other financial assets are included in the carrying amount of the asset at initial recognition. Financial assets are derecognized when the rights to receive cash flows from the financial assets have expired or have been transferred and all risks and rewards related to the ownership of the financial assets have been transferred to the transferee.
Financial assets at fair value through profit or loss and available-for-sale are subsequently measured at fair value. When an active market exists for a financial instrument, fair value is determined based on quoted prices in the active market. When no active market exists, fair value is determined by using valuation techniques. When applying valuation techniques, the Company and its subsidiaries maximize the use of relevant observable inputs and minimize the use of unobservable inputs.
Changes in the fair value of financial assets at fair value through profit or loss are recorded in ‘gain/(loss) on fair value changes of financial assets/liabilities’.
Investments in equity instruments that do not have a quoted market price in an active market and whose fair value cannot be reliably measured are measured at cost. Loans and receivables are carried at amortized cost using the effective interest method.
Except for impairment loss and translation differences on monetary financial assets, changes in the fair value of available-for-sale financial assets are recognized in other comprehensive income. When these financial assets are derecognized, the accumulated fair value adjustments recognized in equity are included in the statement of comprehensive income as ‘other investment income’. Dividends on available-for-sale financial assets are recorded in ‘other investment income’ when the right of the Company and its subsidiaries to receive payments is established.
F-20
|
2
|
Principal accounting policies (Continued)
|
|
|
(k)
|
Financial assets (Continued)
|
|
|
(v)
|
Impairment of financial assets
|
Except for financial assets at fair value through profit or loss, the Company and its subsidiaries perform assessment on the book value of financial assets at the end of reporting period. Provision for impairment is made when there is objective evidence showing that a financial asset is impaired.
For investments in subsidiaries, associates and joint ventures, the impairment loss is measured by comparing the recoverable amount of the investment with its carrying amount. The impairment loss is reversed if there has been a favourable change in the estimates used to determine the recoverable amount.
In the case of equity investments classified as available for sale, a significant or prolonged decline in the fair value of the investment below its cost is evidence that the assets are impaired. If any such evidence exists for available-for-sale financial assets, the cumulative loss, measured as the difference between the acquisition cost and the current fair value, less any impairment loss on that financial asset previously recognized in profit or loss, is removed from equity and recognized in profit or loss. Impairment losses recognized in the profit or loss on equity instruments are not reversed through the profit or loss.
When financial assets carried at amortized cost are impaired, the carrying amount of the financial assets is reduced to the present value of estimated future cash flows (excluding future credit losses that have not been incurred) discounted at the financial asset’s original effective interest rate. The impaired amount is recognized as assets impairment loss in the current period. If there is objective evidence that the value of the financial assets has recovered as a result of objective changes in circumstances occurring after the impairment loss was originally recognized, the originally recognized impairment loss is reversed through profit or loss. For the impairment test of receivables, please refer to Note 2(l).
|
|
(vi)
|
Derivative financial instruments and hedging activities
|
Derivatives are initially recognized at fair value on the date a derivative contract is entered into and are subsequently remeasured at their fair value. Gain or loss arising from subsequent change in the fair value of derivative financial instruments is recognized in profit or loss except for the effective portions of gain or loss on the derivative financial instruments designated as cash flow hedges which are recognized directly in other comprehensive income. Cash flow hedge represents a hedge against the exposure to variability in cash flows, which such cash flow is originated from a particular risk associated with highly probable forecast transactions and variable rate borrowings and which could affect the statement of comprehensive income.
F-21
|
2
|
Principal accounting policies (Continued)
|
|
|
(k)
|
Financial assets (Continued)
|
|
|
(vi)
|
Derivative financial instruments and hedging activities (Continued)
|
The hedged items of cash flow hedge are the designated items with respect to the risks associated with future cash flow change resulting from variability in cash flows of a recognized asset or liability or a highly probable forecast transaction or the foreign currency risk of a committed future transaction. Hedging instruments are designated derivative for cash flow hedge whose cash flows are expected to offset changes in the cash flows of a hedged item.
The full fair value of a hedging derivative is classified as a non-current asset or liability when the remaining maturity of the hedge item is more than 12 months.
The Company and its subsidiaries document their assessments, both at hedge inception and on an ongoing basis, of whether the derivatives that are used in hedging transactions are highly effective in offsetting changes in cash flows of hedged items. The Company and its subsidiaries apply ratio analysis method to evaluate the ongoing effectiveness of the cash flow hedge.
The effective portion of changes in the fair value of derivatives that are designated and qualify as cash flow hedges are recognized in other comprehensive income. The gain or loss relating to the ineffective portion is recognized immediately in the statement of comprehensive income within ‘gain/(loss) on fair value changes of financial assets/liabilities’.
Amounts accumulated in equity are reclassified to the profit or loss in the periods when the hedged item affects profit or loss. The gain or loss relating to the effective portion of interest rate swaps hedging variable rate borrowings is recognized in the statement of comprehensive income within ‘interest expense’. The gain or loss relating to the effective portion of exchange forward hedging foreign currency denominated payables is recognized in the statement of comprehensive income within ‘exchange gain/(loss) and bank charges, net’. However, when the forecast transaction that is hedged results in the recognition of a non-financial asset, the gains and losses previously deferred in equity are transferred from equity and included in the initial measurement of the cost of the asset. In the case where the Company and its subsidiaries expect all or a portion of net loss previously recognized directly in other comprehensive income will not be recovered in future financial periods, the irrecoverable portion will be reclassified into profit or loss.
When a hedging instrument expires or is sold, terminated or exercised or when a hedge no longer meets the criteria for hedge accounting, the Company and its subsidiaries will discontinue hedge accounting. Any cumulative gain or loss existing in equity at that time remains in equity and is subsequently recognized when the forecast transaction is ultimately recognized in the profit or loss. When a forecast transaction is no longer expected to occur, the cumulative gain or loss that was reported in equity is immediately transferred to the statement of comprehensive income within ‘gain/(loss) on fair value changes of financial assets/liabilities’.
F-22
|
2
|
Principal accounting policies (Continued)
|
|
|
(l)
|
Loans and receivables
|
Loans and receivables, which primarily include accounts receivable, other receivables and other non-current assets, are recognized initially at fair value. Loans and receivables are subsequently measured at amortized cost less provision for doubtful debts using the effective interest method.
The Company and its subsidiaries establish an allowance for impairment that represents its estimate of incurred losses in respect of receivables. The main components of this allowance are a specific loss component that relates to individually significant exposures, and a collective loss component established for groups of similar assets in respect of losses that have been incurred but not yet identified. The collective loss allowance is determined based on historical data of payment statistics for similar financial assets.
When there is objective evidence that the Company and its subsidiaries will not be able to collect all amounts due according to the original terms of the receivables, impairment test is performed and related provision for doubtful accounts is made based on the shortfall between carrying amounts and respective present value of estimated future cash flows. The carrying amounts of the receivables are reduced through the use of allowance accounts, and the amount of the provision is recognized in the statement of comprehensive income within ‘operating expenses – others’. When a receivable is uncollectible, it is written off against the allowance account for the receivable. Subsequent recoveries of amounts previously written off are credited against ‘operating expenses – others’ in the statement of comprehensive income.
|
|
(m)
|
Inventories
|
Inventories include fuel for power generation, materials for repairs and maintenance and spare parts, and are stated at lower of cost and net realizable values.
Inventories are initially recorded at cost and are charged to fuel costs or repairs and maintenance, respectively when used, or capitalized to property, plant and equipment when installed, as appropriate, using weighted average cost basis. Cost of inventories includes costs of purchase and transportation costs.
When the forecast transaction that is hedged results in the recognition of the inventory, the gains and losses previously deferred in equity are transferred from equity and included in the initial measurement of the cost of the inventory.
Provision for inventory obsolescence is determined by the excess of cost over net realizable value. Net realizable values are determined based on the estimated selling price less estimated conversion costs during power generation, selling expenses and related taxes in the ordinary course of business.
F-23
|
2
|
Principal accounting policies (Continued)
|
|
|
(n)
|
Related parties
|
Parties are considered to be related if one party has the ability, directly or indirectly, to control the other party or exercise significant influence over the other party in making financial and operating decisions. Parties are also considered to be related if they are subject to common control or jointly control of the same third party; one party is controlled or jointly controlled by a third party and the other party is an associate or a joint venture of the same third party.
|
|
(o)
|
Cash and cash equivalents
|
Cash and cash equivalents listed in the statement of cash flows represents cash in hand, call deposits held with banks and other financial institutions, and other short-term (3 months or less), highly-liquid investments that are readily convertible to known amounts of cash and are subject to an insignificant risk of changes in value. Bank overdrafts that are repayable on demand and form an integral part of the cash management are also included as a component of cash and cash equivalents for the purpose of the consolidated statement of cash flow.
|
|
(p)
|
Borrowings
|
Borrowings are recognized initially at fair value less transaction costs and subsequently measured at amortized cost using the effective interest method. Borrowings are classified as current liabilities unless the Company and its subsidiaries have an unconditional right to defer settlement of the liability for at least 12 months after the end of reporting period.
|
|
(q)
|
Borrowing costs
|
General and specific borrowing costs directly attributable to the acquisition, construction or production of qualifying assets, which are assets that necessarily take a substantial period of time to get ready for their intended use or sale, are added to the cost of those assets. The capitalization of borrowing costs as part of the cost of a qualifying asset commences when expenditure for the asset is being incurred, borrowing costs are being incurred and activities that are necessary to prepare the asset for its intended use or sale are in progress. Capitalization of borrowing costs is suspended or ceases when substantially all the activities necessary to prepare the qualifying asset for its intended use or sale are interrupted or complete.
The amount of specific borrowing costs capitalized is net of the investment income on any temporary investment of the funds pending expenditure on the asset.
All other borrowing costs are recognized in profit or loss in the period in which they are incurred.
|
|
(r)
|
Payables
|
Payables primarily include accounts payable and other liabilities, and are recognized initially at fair value and subsequently measured at amortized cost using the effective interest method.
F-24
|
2
|
Principal accounting policies (Continued)
|
|
|
(s)
|
Taxation
|
|
|
(i)
|
Value-added tax (“VAT”)
|
The domestic power, heat and coal sales of the Company and its subsidiaries are subject to VAT. VAT payable is determined by applying 17% (or 13% on heat) on the taxable revenue after offsetting deductible input VAT of the period.
According to the relevant regulations of Ministry of Finance of PRC and State Administration of Taxation, certain pilot regions have been under the Pilot Program for the transformation from Business Tax to VAT since 1 January 2012 and all other regions since 1 August 2013 for specified industry. The applicable tax rate of VAT for the Company and its subsidiaries in respect of the lease of tangible movable properties, transportation industry and other modern services industry are 17%, 11% and 6%, respectively.
|
|
(ii)
|
Goods and service tax (“GST”)
|
The power sales of the subsidiaries in Singapore are subject to goods and service tax of the country where they operate. GST payable is determined by applying 7% on the taxable revenue after offsetting deductible GST of the period.
|
|
(iii)
|
Current and deferred income tax
|
The income tax expense for the period comprises current and deferred income tax. Income tax expense is recognized in profit or loss, except to the extent that it relates to items recognized in other comprehensive income or directly in equity. In this case, the tax is also recognized in other comprehensive income or directly in equity, respectively.
Deferred income tax assets and liabilities are recognized based on the differences between tax bases of assets and liabilities and respective book values (temporary differences). For deductible tax losses or tax credit that can be brought forward in accordance with tax law requirements for deduction of taxable income in subsequent years, it is considered as temporary differences and related deferred income tax assets are recognized. No deferred income tax liability is recognized for temporary difference arising from initial recognition of goodwill. For those temporary differences arising from initial recognition of an asset or liability in a non-business combination transaction that affects neither accounting profit nor taxable profit (or deductible loss) at the time of the transaction, no deferred income tax asset and liability is recognized. The temporary differences relating to investments in subsidiaries to the extent that, in the case of taxable differences, the Company and its subsidiaries control the timing of the reversal and it is probable that the differences will not reverse in the foreseeable future, or in the case of deductible differences, unless it is probable that they will reverse in the future.
F-25
|
2
|
Principal accounting policies (Continued)
|
|
|
(s)
|
Taxation (Continued)
|
|
|
(iii)
|
Current and deferred income tax (Continued)
|
The Company and its subsidiaries recognize deferred income tax assets to the extent that it is probable that taxable profit will be available to offset the deductible temporary difference, deductible tax loss and tax credit.
At the end of reporting period, deferred income tax assets and liabilities are measured at the tax rates that are expected to apply to the period when the asset is realized or liability is settled.
The carrying amount of a deferred tax asset is reviewed at the end of each reporting period and is reduced to the extent that it is no longer probable that sufficient taxable profits will be available to allow the related tax benefit to be utilised. Any such reduction is reversed to the extent that it becomes probable that sufficient taxable profits will be available.
Deferred income tax assets and deferred income tax liabilities are offset when meeting all the conditions below:
|
|
(1)
|
The Company and its subsidiaries have the legal enforceable right to offset current income tax assets and current income tax liabilities;
|
|
|
(2)
|
Deferred income tax assets and deferred income tax liabilities are related to the income tax levied by the same tax authority of the Company and its subsidiaries.
|
|
|
(t)
|
Employee benefits
|
Employee benefits include all expenditures relating to the employees for their services. The Company and its subsidiaries recognize employee benefits as liabilities during the accounting period when employees render services and allocates to related cost of assets and expenses based on different beneficiaries.
In connection with pension obligations, the Company and its subsidiaries operate various defined contribution plans in accordance with the local conditions and practices in the countries and provinces in which they operate. A defined contribution plan is a pension plan under which the Company and its subsidiaries pay fixed contributions into a separate publicly administered pension insurance plan on mandatory and voluntary bases. The Company and its subsidiaries have no legal or constructive obligations to pay further contributions if the fund does not hold sufficient assets to pay all employees the benefits relating to employee service in the current and prior periods. The contributions are recognized as employee benefit when incurred. Prepaid contributions are recognized as assets to the extent that a cash refund or a reduction in the future payment is available.
F-26
|
2
|
Principal accounting policies (Continued)
|
|
|
(u)
|
Government grants
|
Government grants are recognized when the Company and its subsidiaries fulfill the conditions attaching to them and they are probable to be received. When government grants are received in the form of monetary assets, they are measured at the amount received or receivable. When the grant is in the form of non-monetary assets, it is measured at fair value. When fair value cannot be measured reliably, nominal amount is assigned.
Asset-related government grant is recognized as deferred income and is amortized evenly in profit or loss over the useful lives of related assets.
Income-related government grant that is used to compensate subsequent related expenses or losses of the Company and its subsidiaries are recognized as deferred income and recorded in the profit or loss when related expenses or losses incurred. When the grant is used to compensate expenses or losses that were already incurred, they are directly recognized in current period profit or loss.
|
|
(v)
|
Revenue and income recognition
|
Revenue and income are recognized based the following methods:
Revenue and income are recognized when it is probable that the economic benefits associated with the transaction will flow to the Company and its subsidiaries and the amount of the revenue and income can be measured reliably.
|
|
(i)
|
Electricity sales revenue
|
Electricity sales revenue represents the fair value of the consideration received or receivable for electricity sold in the ordinary course of the activities of the Company and its subsidiaries (net of VAT or GST). Revenue is earned and recognized upon transmission of electricity to the customers or the power grid controlled and owned by the respective regional or provincial grid companies.
|
|
(ii)
|
Coal sales revenue
|
Coal sales revenue represents the fair value of the consideration received or receivable for the sale of the coal in the ordinary course of the activities of the Company and its subsidiaries. Coal sales revenue is recognized when the coal is delivered to the customers and there is no unfulfilled obligation that could affect the customer’s acceptance of the coal.
|
|
(iii)
|
Service revenue
|
Service revenue refers to amounts received from service of port loading, conveying and transportation. The Company and its subsidiaries recognize revenue when the relevant service is provided.
|
|
(iv)
|
Dividend income
|
Dividend income from unlisted investments is recognized when the shareholder’s right to receive payment is established. Dividend income from listed investments is recognized when the share price of the investment goes ex-dividend.
F-27
|
2
|
Principal accounting policies (Continued)
|
|
|
(v)
|
Revenue and income recognition (Continued)
|
|
|
(v)
|
Interest income
|
Interest income from deposits is recognized on a time proportion basis using effective interest method. Interest income from the finance lease is recognized on a basis that reflects a constant periodic rate of return on the net investment in the finance lease.
|
|
(w)
|
Leases
|
Leases where all the risks and rewards incidental to ownership of the assets are in substance transferred to the lessees are classified as finance leases. All other leases are operating leases.
|
|
(i)
|
Operating leases (lessee)
|
Operating lease expenses are capitalized or expensed on a straight-line basis over the lease term.
The cost of acquiring land held under an operating lease is amortized on a straight-line basis over the period of the lease term.
|
|
(ii)
|
Finance lease
|
The Company and its subsidiaries recognize the aggregate of the minimum lease receipts and the initial direct costs on the lease inception date as the receivable. The difference between the aggregate of the minimum lease receipts and the initial direct costs and sum of their respective present values is recognized as unrealized finance income. The Company and its subsidiaries adopt the effective interest method to allocate such unrealized finance income over the lease term. At the end of reporting period, the Company and its subsidiaries present the net amount of finance lease receivable after deducting any unrealized finance income in non-current assets and current assets, respectively.
Please refer to Note 2(k)(v) for impairment test on finance lease receivables.
Where the Company and its subsidiaries acquire the use of assets under finance leases, the amounts representing the fair value of the leased asset, or, if lower, the present value of the minimum lease payments, of such assets are included in fixed assets and the corresponding liabilities, net of finance charges, are recorded as obligations under finance leases. Depreciation is provided at rates which write off the cost or valuation of the assets over the term of the relevant lease or, where it is likely the Company and its subsidiaries will obtain ownership of the asset, the life of the asset, as set out in note 2(f). Impairment losses are accounted for in accordance with the accounting policy as set out in note 2(j). Finance charges implicit in the lease payments are charged to profit or loss over the period of the leases so as to produce an approximately constant periodic rate of charge on the remaining balance of the obligations for each accounting period. Contingent rentals are charged to profit or loss in the accounting period in which they are incurred.
F-28
|
2
|
Principal accounting policies (Continued)
|
|
|
(x)
|
Purchase of electricity
|
The overseas subsidiary of the Company recognizes electricity purchase cost when it purchases the electricity and transmits to its customers.
|
|
(y)
|
Financial guarantee contracts
|
The Company issues financial guarantee contracts that transfer significant insurance risk. Financial guarantee contracts are those contracts that require the issuer to make specified payments to reimburse the holders for losses they incur because specified debtors fail to make payments when due in accordance with the original or modified terms of debt instruments. Where the Company issues a financial guarantee, the fair value of the guarantee is initially recognized as deferred income within accounts payable and other liabilities. The fair value of financial guarantees issued at the time of issuance is determined by reference to fees charged in an arm’s length transaction for similar services, when such information is obtainable, or is otherwise estimated by reference to interest rate differentials, by comparing the actual rates charged by lenders when the guarantee is made available with the estimated rates that lenders would have charged, had the guarantees not been available, where reliable estimates of such information can be made. Where consideration is received or receivable for the issuance of the guarantee, the consideration is recognized in accordance with the Company’s policies applicable to that category of asset. Where no such consideration is received or receivable, an immediate expense is recognized in profit or loss on initial recognition of any deferred income. The amount of the guarantee initially recognized as deferred income is amortized in profit or loss over the term of the guarantee as income from financial guarantees issued.
|
|
(z)
|
Dividend distribution
|
Dividend distribution to the shareholders of the Company and its subsidiaries is recognized as a liability in the period when the dividend is approved in the shareholders’ meeting.
|
|
(aa)
|
Contingencies
|
Contingent liabilities are not recognized in the financial statements. They are disclosed unless the possibility of an outflow of resources embodying economic benefits is remote. Contingent assets are not recognized in the financial statements but disclosed when an inflow of economic benefit is probable.
|
|
(ab)
|
Standards and amendments to published standards that are not yet effective but relevant to the Company and its subsidiaries
|
The following are standards or amendments to existing standards that have been published and are mandatory for the accounting periods beginning on or after 1 January 2016, but the Company and its subsidiaries have not early adopted:
F-29
|
2
|
Principal accounting policies (Continued)
|
|
|
(ab)
|
Standards and amendments to published standards that are not yet effective but relevant to the Company and its subsidiaries (Continued)
|
|
|
·
|
IFRS 14, ‘Regulatory deferral accounts’, which will be effective for accounting periods beginning on or after 1 January 2016.
|
|
|
·
|
Amendments to IFRS 11, ‘Accounting for acquisitions of interests in joint operations’, which will be effective for accounting periods beginning on or after 1 January 2016.
|
|
|
·
|
Amendments to IAS 16 and IAS 38, ‘Clarification of acceptable methods of depreciation and amortization’, which will be effective for accounting periods beginning on or after 1 January 2016.
|
|
|
·
|
Amendments to IAS 27, ‘Equity method in separate financial statements’, which will be effective for accounting periods beginning on or after 1 January 2016.
|
|
|
·
|
Amendments to IFRS 10 and IAS 28, ‘Sale or contribution of assets between an investor and its associate or joint venture’, which will be effective for accounting periods beginning on or after 1 January 2016.
|
|
|
·
|
Annual improvements to IFRSs 2012-2014 Cycle, which will be effective for accounting periods beginning on or after 1 January 2016.
|
|
|
·
|
Amendments to IAS 1 and IAS 7, ‘Disclosure initiative’, which will be effective for accounting periods beginning on or after 1 January 2016 and 1 January 2017 respectively.
|
|
|
·
|
Amendments to IAS 12, ‘Recognition of deferred tax assets for unrealised losses’, which will be effective for accounting periods beginning on or after 1 January 2017.
|
|
|
·
|
IFRS 15, ‘Revenue from contracts with customers’, which will be effective for accounting periods beginning on or after 1 January 2018.
|
|
|
·
|
IFRS 9, ‘Financial instrument’, which will be effective for accounting periods beginning on or after 1 January 2018.
|
|
|
·
|
IFRS 16, ‘Leases’, which will be effective for accounting periods beginning on or after 1 January 2019.
|
The Company and its subsidiaries have not assessed full impact of adoption of these standards or amendments upon their effective date.
|
3
|
Financial and capital risks management
|
|
|
(a)
|
Financial risk management
|
Risk management, including the management on the financial risks, is carried out under the instructions of the Strategic Committee of Board of Directors and the Risk Management Team. The Company works out general principles for overall management as well as management policies covering specific areas. In considering the importance of risks, the Company identifies and evaluates risks at head office and individual power plant level, and requires analysis and proper communication of the information collected periodically.
SinoSing Power and its subsidiaries are subject to financial risks that are different from the entities operating within the PRC. They have a series of controls in place to maintain the cost of risks occurring and the cost of managing the risks at an acceptable level. Management continually monitors the risk management process to ensure that an appropriate balance between risk and control is achieved. SinoSing Power and its subsidiaries have their written policies and financial authorization limits in place which are reviewed periodically. These financial authorization limits seek to mitigate and eliminate operational risks by setting approval thresholds required for entering into contractual obligations and investments.
F-30
|
3
|
Financial and capital risks management (Continued)
|
|
|
(a)
|
Financial risk management (Continued)
|
|
|
(i)
|
Market risk
|
|
|
(1)
|
Foreign exchange risk
|
Foreign exchange risk of the entities operating within the PRC primarily arises from loans denominated in foreign currencies of the Company and its subsidiaries. SinoSing Power and its subsidiaries are exposed to foreign exchange risk on accounts payable and other payables that are denominated primarily in US$, a currency other than Singapore dollar (“S$”), their functional currency. Please refer to Note 23, 26 and 29 for details. The Company and its subsidiaries manage exchange risk through closely monitoring interest and exchange market.
As at 31 December 2015, if RMB had weakened/strengthened by 5% (2014 and 2013: 5%) against US$ and 3% (2014 and 2013: 3%) against EUR (“€”) with all other variables constant, the Company and its subsidiaries would further recognize exchange loss/gain amounted RMB144 million (2014 and 2013: RMB155 million and RMB186 million) and RMB10 million (2014 and 2013: RMB13 million and RMB19 million), respectively. The ranges of such sensitivity disclosed above were based on the observation on the historical trend of related exchange rates during the previous year under analysis.
As at 31 December 2015, if S$ had weakened/strengthened by 10% (2014 and 2013: 10%) against US$ with all other variables constant, the Company and its subsidiaries would further recognize exchange loss/gain amounted RMB2 million (2014 and 2013: RMB6 million and RMB12 million), respectively. The ranges of such sensitivity disclosed above were based on the management’s experience and forecast.
SinoSing Power and its subsidiaries also are exposed to foreign exchange risk on fuel purchases that are denominated primarily in US$. They substantially hedge their estimated foreign currency exposure in respect of forecast fuel purchases over the following three months using primarily foreign currency contracts.
|
|
(2)
|
Price risk
|
The available-for-sale financial assets of the Company and its subsidiaries are exposed to equity security price risk.
Detailed information relating to the available-for-sale financial assets is disclosed in Note 10. The Company has a supervisor in the supervisory committee of the most significant investment in available-for-sale financial assets (China Yangtze Power Co., Ltd. (“Yangtze Power”)) and may exercise protective rights. The Company also closely monitors the pricing trends in the open market in determining its long-term strategic stakeholding decisions.
The Company and its subsidiaries are exposed to fuel price risk on fuel purchases. In particular, SinoSing Power and its subsidiaries use fuel oil swap to hedge against such a risk and designate them as cash flow hedges. Please refer to Note 14 for details.
F-31
|
3
|
Financial and capital risks management (Continued)
|
|
|
(a)
|
Financial risk management (Continued)
|
|
|
(i)
|
Market risk (Continued)
|
|
|
(3)
|
Cash flow interest rate risk
|
The interest rate risk of the Company and its subsidiaries primarily arises from long-term loans. Loans borrowed at variable rates expose the Company and its subsidiaries to cash flow interest rate risk. The exposures of these risks are disclosed in Note 23 to the financial statements. The Company and its subsidiaries have entered into interest rate swap agreements with banks to hedge against a portion of cash flow interest rate risk.
As at 31 December 2015, if interest rates on RMB-denominated borrowings had been 50 basis points higher/lower with all other variables held constant, interest expense for the year would have been RMB410 million (2014 and 2013: RMB380 million and RMB389 million) higher/lower. If interest rates on US$-denominated borrowings had been 50 basis points higher/lower with all other variables held constant, interest expense for the year would have been RMB8 million (2014 and 2013: RMB8 million and RMB9 million) higher/lower. If interest rates on S$-denominated borrowings had been 100 basis points higher/lower with all other variables held constant, interest expense for the year would have been RMB60 million (2014 and 2013: RMB58 million and RMB64 million) higher/lower. The ranges of such sensitivity disclosed above were based on the observation on the historical trend of related interest rates during the previous year under analysis.
The Company has entered into a floating-to-fixed interest rate swap agreement to hedge against cash flow interest rate risk of a loan. According to the interest rate swap agreement, the Company agrees with the counterparty to settle the difference between fixed contract rates and floating-rate interest amounts calculated by reference to the agreed notional amounts quarterly until 2019. Tuas Power Generation Pte Ltd. (“TPG”) also entered into a number of floating-to-fixed interest rate swap agreements to hedge against cash flow interest rate risk of a loan. According to the interest rate swap agreements, TPG agrees with the counterparty to settle the difference between fixed contract rates and floating-rate interest amounts calculated by reference to the agreed notional amount semi-annually until 2020. Please refer to Note 14 for details.
|
|
(ii)
|
Credit risk
|
Credit risk arises from bank deposits, accounts receivable, other receivables and other non-current assets. The maximum exposures of other non-current assets, other receivables, accounts receivable and bank deposits are disclosed in Note 16, 18, 19 and 34 to the financial statements, respectively.
Bank deposits are placed with reputable banks and financial institutions. In addition, a significant portion is deposited with a non-bank financial institution which is a related party of the Company. The Company has a director on the Board of this non-bank financial institution and exercises influence. Corresponding maximum exposures of these bank deposits are disclosed in Note 35(a)(i) to the financial statements.
F-32
|
3
|
Financial and capital risks management (Continued)
|
|
|
(a)
|
Financial risk management (Continued)
|
|
|
(ii)
|
Credit risk (Continued)
|
Most of the power plants of the Company and its subsidiaries operating within the PRC sell electricity generated to their sole customers, the power grid companies of their respective provinces or regions where the power plants operate. These power plants communicate with their individual grid companies periodically and believe that adequate provision for doubtful accounts have been made in the financial statements.
Singapore subsidiaries derive revenue mainly from sale of electricity to the National Electricity Market of Singapore operated by Energy Market Company Pte Ltd., which does not have high credit risk. Singapore subsidiaries also derive revenue mainly from retailing electricity to consumers with monthly consumption of more than 4,000kWh. These customers engage in a wide spectrum of manufacturing and commercial activities in a variety of industries. Singapore subsidiaries hold cash deposits of RMB172.51 million (2014: RMB157.80 million) and guarantees from creditworthy financial institutions as a security from these customers.
|
|
(iii)
|
Liquidity risk
|
Liquidity risk management is to primarily ensure the ability of the Company and its subsidiaries to meet its liabilities as and when they are fall due. The liquidity reserve comprises the undrawn borrowing facility and cash and cash equivalents available as at each month end in meeting its liabilities.
The Company and its subsidiaries maintain flexibility in funding by cash generated by their operating activities and availability of committed credit facilities.
Financial liabilities due within 12 months are presented as current liabilities in the statement of financial position. The cash flows of derivative financial liabilities, and repayment schedules of the long-term loans and long-term bonds are disclosed in Note 14, 23 and 24, respectively.
|
|
(b)
|
Fair value estimation
|
|
|
(i)
|
Fair value measurements
|
The table below analyses financial instruments carried at fair value, by valuation method. The different levels have been defined as follows:
|
|
·
|
Level 1- Quoted prices (unadjusted) in active markets for identical assets or liabilities.
|
|
|
·
|
Level 2- Inputs other than quoted prices included within level 1 that are observable for the asset or liability, either directly (that is, as prices) or indirectly (that is, derived from prices).
|
|
|
·
|
Level 3- Inputs for the asset or liability that are not based on observable market data (that is, unobservable inputs).
|
F-33
|
3
|
Financial and capital risks management (Continued)
|
|
|
(b)
|
Fair value estimation (Continued)
|
|
|
(i)
|
Fair value measurements (Continued)
|
The following table presents the assets and liabilities that are measured at fair value at 31 December 2015.
|
Level 1
|
Level 2
|
Level 3
|
Total
|
|||||||||||||
|
Assets
|
||||||||||||||||
|
Financial assets at fair value through profit or loss
|
||||||||||||||||
|
– Trading derivatives (Note 14)
|
- | 40,843 | - | 40,843 | ||||||||||||
|
Derivatives used for hedging (Note 14)
|
- | 143,669 | - | 143,669 | ||||||||||||
|
Available-for-sale financial assets
|
||||||||||||||||
|
– Equity securities (Note 10)
|
3,492,510 | - | - | 3,492,510 | ||||||||||||
|
Total assets
|
3,492,510 | 184,512 | - | 3,677,022 | ||||||||||||
|
Liabilities
|
||||||||||||||||
|
Financial liabilities at fair value through profit or loss
|
||||||||||||||||
|
– Trading derivatives (Note 14)
|
- | 23,391 | - | 23,391 | ||||||||||||
|
Derivatives used for hedging (Note 14)
|
- | 1,281,550 | - | 1,281,550 | ||||||||||||
|
Total liabilities
|
- | 1,304,941 | - | 1,304,941 | ||||||||||||
The following table presents the assets and liabilities that are measured at fair value at 31 December 2014.
|
Level 1
|
Level 2
|
Level 3
|
Total
|
|||||||||||||
|
Assets
|
||||||||||||||||
|
Financial assets at fair value through profit or loss
|
||||||||||||||||
|
– Trading derivatives (Note 14)
|
- | 184,756 | - | 184,756 | ||||||||||||
|
Derivatives used for hedging (Note 14)
|
- | 116,977 | - | 116,977 | ||||||||||||
|
Available-for-sale financial assets
|
||||||||||||||||
|
– Equity securities (Note 10)
|
2,748,162 | - | - | 2,748,162 | ||||||||||||
|
Total assets
|
2,748,162 | 301,733 | - | 3,049,895 | ||||||||||||
|
Liabilities
|
||||||||||||||||
|
Financial liabilities at fair value through profit or loss
|
||||||||||||||||
|
– Trading derivatives (Note 14)
|
- | 149,989 | - | 149,989 | ||||||||||||
|
Derivatives used for hedging (Note 14)
|
- | 1,332,251 | - | 1,332,251 | ||||||||||||
|
Total liabilities
|
- | 1,482,240 | - | 1,482,240 | ||||||||||||
F-34
|
3
|
Financial and capital risks management (Continued)
|
|
|
(b)
|
Fair value estimation (Continued)
|
|
|
(i)
|
Fair value measurements (Continued)
|
The fair value of financial instruments traded in active markets is based on quoted market prices at the end of reporting period. A market is regarded as active if quoted prices are readily and regularly available from an exchange, dealer, broker, industry group, pricing service, or regulatory agency, and those prices represent actual and regularly occurring market transactions on an arm’s length basis. The quoted market price used for financial assets held by the Company and its subsidiaries is the current bid price. These instruments are included in level 1. As at 31 December 2015 and 2014, instrument included in level 1 is an equity investment in Yangtze Power classified as available for sale.
The fair value of financial instruments that are not traded in an active market is determined by using valuation techniques. These valuation techniques maximize the use of relevant observable inputs and minimize the use of unobservable inputs. If all significant inputs required to fair value an instrument are observable, the instrument is included in level 2.
If one or more of the significant inputs is not based on observable market data, the instrument is included in level 3.
Specific valuation techniques used to value financial instruments include:
|
|
·
|
The forward exchange contracts and fuel oil swaps are both valued using quoted market prices or dealer quotes for similar instruments.
|
|
|
·
|
The fair value of interest rate swaps is calculated as the present value of the estimated future cash flows based on observable yield curves.
|
Instruments included in level 2 comprise forward exchange contracts, fuel oil swaps and interest rate swaps.
Yangtze Power suspended trading of its stock from 12 June 2015 to 15 November 2015 in Shanghai Stock Exchange, and as a result there is no quoted market price available during the period. The Company determined the fair value of available-for-sale financial asset by considering observable market data for comparable companies, and transferred the available-for-sale financial asset from level 1 to level 2 fair value hierarchy. After resumption of trading on 16 November 2015, the Company transferred the available-for sale financial asset from level 2 to level 1 fair value hierarchy. Except for above, during the year ended 31 December 2015 there is no transfers of financial instruments between level 1 and level 2, or transfers into or out of level 3.
|
|
(ii)
|
Fair value disclosures
|
|
|
The carrying value less provision for doubtful accounts of accounts receivable, other receivables and assets, accounts payable and other liabilities, short-term bonds and short-term loans approximated their fair values. The fair value of financial liabilities for disclosure purposes is estimated by discounting the future contractual cash flows at the current market interest rate that is available to the Company and its subsidiaries for similar financial instruments.
|
F-35
|
3
|
Financial and capital risks management (Continued)
|
|
|
(b)
|
Fair value estimation (Continued)
|
|
|
(ii)
|
Fair value disclosures (Continued)
|
The estimated fair value of long-term loans and long-term bonds (both including current maturities) was approximately RMB78.31 billion and RMB23.15 billion as at 31 December 2015 (2014: RMB64.89 billion and RMB28.03 billion), respectively. The aggregate book value of these liabilities was approximately RMB78.38 billion and RMB22.74 billion as at 31 December 2015 (2014: RMB65.03 billion and RMB27.75 billion), respectively.
|
|
(c)
|
Capital risk management
|
The objectives of the Company and its subsidiaries when managing capital are to safeguard the ability of the Company and its subsidiaries in continuing as a going concern in order to provide returns for shareholders and benefits for other stakeholders and to maintain an optimal capital structure to reduce the cost of capital.
The Company and its subsidiaries monitor capital by using debt ratio analysis. This ratio is calculated as total liabilities (sum of current liabilities and non-current liabilities) divided by total assets as shown in the consolidated statement of financial position. During 2015, the strategy of the Company and its subsidiaries remained unchanged from 2014. The debt ratio of the Company and its subsidiaries as at 31 December 2015 was 67.08% (2014: 69.19%).
|
4
|
Critical accounting estimates and judgments
|
Estimates and judgments are continually evaluated and are based on historical experience and other factors, including expectations of future events that are believed to be reasonable under the circumstances.
The Company and its subsidiaries make estimates and assumptions concerning the future. The resulting accounting estimates will, by definition, seldom equal the related actual results. The estimates and assumptions that have a significant risk of causing a material adjustment to the carrying amounts of assets and liabilities within the next financial year are discussed below.
|
|
(a)
|
Accounting estimates on impairment of goodwill and power generation license
|
The Company and its subsidiaries perform test annually whether goodwill and power generation license have suffered any impairment in accordance with the accounting policies stated in Notes 2(g) and 2(j), respectively. The recoverable amounts of CGU or CGUs to which goodwill and the power generation license have been allocated are determined based on value-in-use calculations. These calculations require the use of estimates (Note 12 and 15). It is reasonably possible, based on existing knowledge, that outcomes within the next financial period that are different from assumptions could require a material adjustment to the carrying amounts of goodwill and power generation license.
F-36
|
4
|
Critical accounting estimates and judgments (Continued)
|
|
|
(a)
|
Accounting estimates on impairment of goodwill and power generation license (Continued)
|
For goodwill allocated to CGUs in the PRC, changes of assumptions in tariff and fuel price could have affected the results of goodwill impairment assessment. As at 31 December 2015, if tariff had decreased by 1% or 5% from management’s estimates with other variables constant with the expectations, the Company and its subsidiaries would have to further recognize impairment against goodwill by approximately RMB14 million and RMB180 million, respectively. If fuel price had increased by 1% or 5% from the management’s estimates with other variables constant with the expectations, the Company and its subsidiaries would have to further recognize impairment against goodwill by RMB11 million and RMB59 million, respectively.
For the sensitivity analysis of power generation license of Tuas Power and goodwill, please refer to Note 12 and 15.
|
|
(b)
|
Useful life of power generation license
|
As at year end, management of the Company and its subsidiaries assessed that the estimated useful life for its power generation license is indefinite. This assessment is based on the expected renewal of power generation license without significant restriction and cost, together with the consideration on related future cash flows generated and the expectation of continuous operations. Based on existing knowledge, outcomes within the next financial period that are different from assumptions could require a change to the carrying amount of power generation license.
|
|
(c)
|
Useful lives of property, plant and equipment
|
Management of the Company and its subsidiaries determines the estimated useful lives of property, plant and equipment and respective depreciation. The accounting estimate is based on the expected wears and tears incurred during power generation. Wears and tears can be significantly different following renovation each time. When the useful lives differ from the original estimated useful lives, management will adjust the estimated useful lives accordingly. It is possible that the estimates made based on existing experience are different to the actual outcomes within the next financial period and could cause a material adjustment to the depreciation and carrying amount of property, plant and equipment.
|
|
(d)
|
Estimated impairment of property, plant and equipment and mining rights
|
The Company and its subsidiaries test whether property, plant and equipment and mining rights suffered any impairment whenever an impairment indication exists. In accordance with Note 2(j), an impairment loss is recognized for the amount by which the carrying amount of the asset exceeds its recoverable amount. It is reasonably possible, based on existing knowledge, that outcomes within the next financial period that are different from assumptions could require a material adjustment to the carrying amount of property, plant and equipment and mining rights.
F-37
|
4
|
Critical accounting estimates and judgments (Continued)
|
|
|
(d)
|
Estimated impairment of property, plant and equipment and mining rights (Continued)
|
Changes of assumptions in tariff and fuel price will affect the result of property, plant and equipment and mining rights impairment assessment. For power plants assets that are subject to impairment testing, as at 31 December 2015, if tariff had decreased by 1% or 5% from management’s estimates with other variables constant with the expectations, the Company and its subsidiaries would have to further recognize impairment against property, plant and equipment by approximately RMB224 million and RMB1,566 million, respectively. If fuel price had increased by 1% or 5% from the management’s estimates with other variables constant with the expectations, the impairment against property, plant and equipment and mining rights of the Company and its subsidiaries would decrease totaling by approximately RMB112 million and RMB54 million, respectively.
|
|
(e)
|
Approval of construction of new power plants
|
The receiving of the ultimate approvals from National Development and Reform Commission (“NDRC”) on certain power plant construction projects of the Company and its subsidiaries is a critical estimate and judgment of the directors. Such estimates and judgments are based on initial approval documents received as well as their understanding of the projects. Based on historical experience, the directors believe that the Company and its subsidiaries will receive final approvals from NDRC on the related power plant projects. Deviation from the estimate and judgment could result in significant adjustment to the carrying amount of property, plant and equipment.
|
|
(f)
|
Deferred tax assets
|
The Company and its subsidiaries recognized the deferred tax assets to the extent that it is probable that future taxable profit will be available against which the asset can be utilized, using tax rates that are expected to be applied in the period when the asset is recovered. The management assesses the deferred tax assets based on the expected amount and timing of future taxable profit, the enacted tax laws and applicable tax rates. It is reasonably possible, based on existing knowledge, the outcomes within the next financial period that are different from assumptions could require a material adjustment to the carrying amount of deferred tax assets.
F-38
|
5
|
Revenue and segment information
|
Revenues recognized during the year are as follows:
|
For the year ended 31 December
|
||||||||||||
|
2015
|
2014
|
2013
|
||||||||||
|
Sales of power and heat
|
127,849,408 | 124,561,854 | 132,478,643 | |||||||||
|
Port service
|
211,685 | 204,763 | 352,988 | |||||||||
|
Transportation service
|
104,721 | 135,256 | 133,147 | |||||||||
|
Others
|
739,059 | 504,982 | 868,097 | |||||||||
|
Total
|
128,904,873 | 125,406,855 | 133,832,875 | |||||||||
Directors and certain senior management of the Company perform the function as the chief operating decision maker (collectively referred to as the “senior management”). The senior management reviews the internal reporting of the Company and its subsidiaries in order to assess performance and allocate resources. The Company has determined the operating segments based on these reports. The reportable segments of the Company are the PRC power segment, Singapore segment and all other segments (mainly including port and transportation operations). No operating segments have been aggregated to form a reportable segment.
Senior management assesses the performance of the operating segments based on a measure of profit before income tax expense under China Accounting Standard for Business Enterprises (“PRC GAAP”) excluding dividend income received from available-for-sale financial assets and operating results of the centrally managed and resource allocation functions of headquarters (“Segment results”). Other information provided, except as noted below, to the senior management of the Company is measured under PRC GAAP.
Segment assets exclude prepaid income tax, deferred income tax assets, available-for-sale financial assets and assets related to the centrally managed and resource allocation functions of headquarters that are not attributable to any operating segment (“corporate assets”). Segment liabilities exclude current income tax liabilities, deferred income tax liabilities and liabilities related to the centrally managed and resource allocation functions of headquarters that are not attributable to any operating segment (“corporate liabilities”). These are part of the reconciliation to total assets and liabilities of consolidated statement of financial position.
F-39
|
5
|
Revenue and segment information (Continued)
|
All sales among the operating segments were performed at market price or close to market price, and have been eliminated as internal transactions when preparing consolidated financial statements.
|
(Under PRC GAAP)
|
||||||||||||||||
|
PRC power
|
Singapore
|
All other
|
||||||||||||||
|
segment
|
segment
|
segments
|
Total
|
|||||||||||||
|
For the year ended 31 December 2015
|
||||||||||||||||
|
Total revenue
|
118,418,506 | 10,143,793 | 588,266 | 129,150,565 | ||||||||||||
|
Inter-segment revenue
|
- | - | (245,692 | ) | (245,692 | ) | ||||||||||
|
Revenue from external customers
|
118,418,506 | 10,143,793 | 342,574 | 128,904,873 | ||||||||||||
|
Segment results
|
24,073,432 | (313,253 | ) | (281,457 | ) | 23,478,722 | ||||||||||
|
Interest income
|
93,324 | 66,898 | 501 | 160,723 | ||||||||||||
|
Interest expense
|
(7,181,116 | ) | (452,034 | ) | (163,325 | ) | (7,796,475 | ) | ||||||||
|
Impairment (loss)/reversal
|
(2,913,766 | ) | 1,744 | (178,131 | ) | (3,090,153 | ) | |||||||||
|
Depreciation and amortization
|
(13,244,965 | ) | (772,003 | ) | (245,936 | ) | (14,262,904 | ) | ||||||||
|
Net (loss)/gain on disposal of non-current assets
|
(427,286 | ) | 22,450 | (1 | ) | (404,837 | ) | |||||||||
|
Share of profits less losses of associates and joint ventures
|
1,421,072 | - | 24,915 | 1,445,987 | ||||||||||||
|
Income tax expense
|
(6,104,619 | ) | 254,772 | 14,397 | (5,835,450 | ) | ||||||||||
|
For the year ended 31 December 2014 (Restated*)
|
||||||||||||||||
|
Total revenue
|
125,271,587 | 14,370,406 | 537,452 | 140,179,445 | ||||||||||||
|
Inter-segment revenue
|
- | - | (152,755 | ) | (152,755 | ) | ||||||||||
|
Revenue from external customers
|
125,271,587 | 14,370,406 | 384,697 | 140,026,690 | ||||||||||||
|
Segment results
|
22,113,100 | 138,143 | (850,805 | ) | 21,400,438 | |||||||||||
|
Interest income
|
97,012 | 72,128 | 813 | 169,953 | ||||||||||||
|
Interest expense
|
(7,803,090 | ) | (426,019 | ) | (172,189 | ) | (8,401,298 | ) | ||||||||
|
Impairment (loss)/reversal
|
(1,488,619 | ) | 3,228 | (696,812 | ) | (2,182,203 | ) | |||||||||
|
Depreciation and amortization
|
(12,131,006 | ) | (821,574 | ) | (180,484 | ) | (13,133,064 | ) | ||||||||
|
Net loss on disposal of non-current assets
|
(469,819 | ) | (5 | ) | (8 | ) | (469,832 | ) | ||||||||
|
Share of profits less losses of associates and joint ventures
|
1,143,326 | - | 49,208 | 1,192,534 | ||||||||||||
|
Income tax expense
|
(6,204,709 | ) | (8,767 | ) | 1,590 | (6,211,886 | ) | |||||||||
|
For the year ended 31 December 2013 (Restated*)
|
||||||||||||||||
|
Total revenue
|
134,332,938 | 14,239,562 | 660,029 | 149,232,529 | ||||||||||||
|
Inter-segment revenue
|
- | - | (151,122 | ) | (151,122 | ) | ||||||||||
|
Revenue from external customers
|
134,332,938 | 14,239,562 | 508,907 | 149,081,407 | ||||||||||||
|
Segment results
|
19,983,931 | 157,079 | (108,246 | ) | 20,032,764 | |||||||||||
|
Interest income
|
107,500 | 70,445 | 1,541 | 179,486 | ||||||||||||
|
Interest expense
|
(7,895,903 | ) | (448,876 | ) | (138,139 | ) | (8,482,918 | ) | ||||||||
|
Impairment loss
|
(689,157 | ) | (431,985 | ) | (453,431 | ) | (1,574,573 | ) | ||||||||
|
Depreciation and amortization
|
(11,858,529 | ) | (686,619 | ) | (158,583 | ) | (12,703,731 | ) | ||||||||
|
Net (loss)/gain on disposal of non-current assets
|
(942,960 | ) | (987 | ) | 10,560 | (933,387 | ) | |||||||||
|
Share of profits less losses of associates and joint ventures
|
587,062 | - | (127,387 | ) | 459,675 | |||||||||||
|
Income tax expense
|
(4,907,082 | ) | (43,774 | ) | (14,591 | ) | (4,965,447 | ) | ||||||||
F-40
|
5
|
Revenue and segment information (Continued)
|
|
(Under PRC GAAP)
|
||||||||||||||||
|
PRC power
|
Singapore
|
All other
|
||||||||||||||
|
segment
|
segment
|
segments
|
Total
|
|||||||||||||
|
31 December 2015
|
||||||||||||||||
|
Segment assets
|
253,376,399 | 27,487,701 | 10,703,373 | 291,567,473 | ||||||||||||
|
Including:
|
||||||||||||||||
|
Additions to non-current assets (excluding financial assets and deferred income tax assets)
|
22,421,000 | 160,282 | 642,949 | 23,224,231 | ||||||||||||
|
Investments in associates
|
13,026,027 | - | 2,806,231 | 15,832,258 | ||||||||||||
|
Investments in joint ventures
|
1,569,614 | - | 785,004 | 2,354,618 | ||||||||||||
|
Segment liabilities
|
(176,406,566 | ) | (14,876,229 | ) | (5,097,402 | ) | (196,380,197 | ) | ||||||||
|
31 December 2014 (Restated*)
|
||||||||||||||||
|
Segment assets
|
254,113,135 | 28,899,723 | 10,622,010 | 293,634,868 | ||||||||||||
|
Including:
|
||||||||||||||||
|
Additions to non-current assets (excluding financial assets and deferred income tax assets)
|
30,325,524 | 444,658 | 872,615 | 31,642,797 | ||||||||||||
|
Investments in associates
|
11,638,863 | - | 2,400,808 | 14,039,671 | ||||||||||||
|
Investments in joint ventures
|
1,121,082 | - | 1,009,180 | 2,130,262 | ||||||||||||
|
Segment liabilities
|
(181,003,200 | ) | (15,865,147 | ) | (5,511,400 | ) | (202,379,747 | ) | ||||||||
A reconciliation of revenue from external customers to operating revenue is provided as follows:
|
For the year ended 31 December
|
||||||||||||
|
2015
|
2014
(Restated*)
|
2013
(Restated*)
|
||||||||||
|
Revenue from external customers (PRC GAAP)
|
128,904,873 | 140,026,690 | 149,081,407 | |||||||||
|
Reconciling item:
|
||||||||||||
|
Impact of restatement under PRC GAAP in relation to business combination under common control* (Note 39)
|
- | (14,619,835 | ) | (15,248,532 | ) | |||||||
|
Operating revenue per IFRS consolidated statement of comprehensive income
|
128,904,873 | 125,406,855 | 133,832,875 | |||||||||
A reconciliation of segment result to profit before income tax expense is provided as follows:
|
For the year ended 31 December
|
||||||||||||
|
2015
|
2014
(Restated*)
|
2013
(Restated*)
|
||||||||||
|
Segment results (PRC GAAP)
|
23,478,722 | 21,400,438 | 20,032,764 | |||||||||
|
Reconciling items:
|
||||||||||||
|
Loss related to the headquarter
|
(327,262 | ) | (87,313 | ) | (381,830 | ) | ||||||
|
Investment income from China Huaneng Finance Co., Ltd. (“Huaneng Finance”)
|
135,971 | 156,061 | 166,734 | |||||||||
|
Dividend income of available-for-sale financial assets
|
97,696 | 102,229 | 185,403 | |||||||||
|
Impact of restatement under PRC GAAP in relation to business combination under common control* (Note 39)
|
- | (2,696,622 | ) | (2,353,770 | ) | |||||||
|
Impact of other IFRS adjustments**
|
(427,077 | ) | 174,787 | (226,612 | ) | |||||||
|
Profit before income tax expense per IFRS consolidated statement of comprehensive income
|
22,958,050 | 19,049,580 | 17,422,689 | |||||||||
F-41
|
5
|
Revenue and segment information (Continued)
|
|
(Under PRC GAAP)
|
||||||||
|
Reportable segments’ assets are reconciled to total assets as follows:
|
||||||||
|
As at 31 December
|
||||||||
|
2015
|
2014
(Restated*)
|
|||||||
|
Total segment assets (PRC GAAP)
|
291,567,473 | 293,634,868 | ||||||
|
Reconciling items:
|
||||||||
|
Investment in Huaneng Finance
|
1,329,753 | 1,347,956 | ||||||
|
Deferred income tax assets
|
1,305,548 | 1,115,232 | ||||||
|
Prepaid income tax
|
2,393 | 19,899 | ||||||
|
Available-for-sale financial assets
|
5,127,863 | 4,383,515 | ||||||
|
Corporate assets
|
396,693 | 379,385 | ||||||
|
Impact of restatement under PRC GAAP in relation to business combination under common control* (Note 39)
|
- | (28,715,907 | ) | |||||
|
Impact of other IFRS adjustments**
|
9,136,631 | 3,006,820 | ||||||
|
Total assets per IFRS consolidated statement of financial position
|
308,866,354 | 275,171,768 | ||||||
|
Reportable segments’ liabilities are reconciled to total liabilities as follows:
|
||||||||
|
As at 31 December
|
||||||||
| 2015 |
2014
(Restated*)
|
|||||||
|
Total segment liabilities (PRC GAAP)
|
(196,380,197 | ) | (202,379,747 | ) | ||||
|
Reconciling items:
|
||||||||
|
Current income tax liabilities
|
(1,054,246 | ) | (881,687 | ) | ||||
|
Deferred income tax liabilities
|
(1,417,972 | ) | (1,595,025 | ) | ||||
|
Corporate liabilities
|
(4,937,450 | ) | (5,562,871 | ) | ||||
|
Impact of restatement under PRC GAAP in relation to business combination under common control* (Note 39)
|
- | 21,674,285 | ||||||
|
Impact of other IFRS adjustments**
|
(3,382,800 | ) | (1,644,017 | ) | ||||
|
Total liabilities per IFRS consolidated statement of financial position
|
(207,172,665 | ) | (190,389,062 | ) | ||||
Other material items:
|
Reportable segment total
|
Headquarters
|
Investment income from Huaneng Finance
|
Impact of restatement under PRC GAAP in relation to business combination under common control*
|
Impact of other IFRS adjustments**
|
Total
|
|||||||||||||||||||
|
For the year ended 31 December 2015
|
||||||||||||||||||||||||
|
Interest expense
|
(7,796,475 | ) | (149,259 | ) | - | - | - | (7,945,734 | ) | |||||||||||||||
|
Depreciation and amortization
|
(14,262,904 | ) | (60,236 | ) | - | - | (394,473 | ) | (14,717,613 | ) | ||||||||||||||
|
Impairment loss
|
(3,090,153 | ) | - | - | - | - | (3,090,153 | ) | ||||||||||||||||
|
Share of profits less losses of associates and joint ventures
|
1,445,987 | - | 135,971 | - | (55,983 | ) | 1,525,975 | |||||||||||||||||
|
Net loss on disposal of non-current assets
|
(404,837 | ) | (6 | ) | - | - | (33,478 | ) | (438,321 | ) | ||||||||||||||
|
Income tax expense
|
(5,835,450 | ) | - | - | - | 136,507 | (5,698,943 | ) | ||||||||||||||||
F-42
|
5
|
Revenue and segment information (Continued)
|
|
Reportable segment total
|
Headquarters
|
Investment income from Huaneng Finance
|
Impact of restatement under PRC GAAP in relation to business combination under common control*
|
Impact of other IFRS adjustments**
|
Total
|
|||||||||||||||||||
|
For the year ended 31 December 2014 (Restated*)
|
||||||||||||||||||||||||
|
Interest expense
|
(8,401,298 | ) | (180,305 | ) | - | 767,489 | - | (7,814,114 | ) | |||||||||||||||
|
Depreciation and amortization
|
(13,133,064 | ) | (54,896 | ) | - | 1,253,101 | 55,579 | (11,879,280 | ) | |||||||||||||||
|
Impairment (loss)/ reversal
|
(2,182,203 | ) | - | - | 60,640 | - | (2,121,563 | ) | ||||||||||||||||
|
Share of profits less losses of associates and joint ventures
|
1,192,534 | - | 156,061 | (5,553 | ) | (27,166 | ) | 1,315,876 | ||||||||||||||||
|
Net (loss)/gain on disposal of non-current assets
|
(469,832 | ) | 5 | - | 42,793 | - | (427,034 | ) | ||||||||||||||||
|
Income tax expense
|
(6,211,886 | ) | - | - | 701,307 | 23,371 | (5,487,208 | ) | ||||||||||||||||
|
For the year ended 31 December 2013 (Restated*)
|
||||||||||||||||||||||||
|
Interest expense
|
(8,482,918 | ) | (231,945 | ) | - | 927,391 | - | (7,787,472 | ) | |||||||||||||||
|
Depreciation and amortization
|
(12,703,731 | ) | (23,540 | ) | - | 1,225,130 | (43,374 | ) | (11,545,515 | ) | ||||||||||||||
|
Impairment loss
|
(1,574,573 | ) | - | - | 118,324 | (555 | ) | (1,456,804 | ) | |||||||||||||||
|
Share of profits less losses of associates and joint ventures
|
459,675 | - | 166,734 | (272 | ) | (11,054 | ) | 615,083 | ||||||||||||||||
|
Net (loss)/gain on disposal of non-current assets
|
(933,387 | ) | 108 | - | 43,557 | - | (889,722 | ) | ||||||||||||||||
|
Income tax expense
|
(4,965,447 | ) | - | - | 420,494 | 22,282 | (4,522,671 | ) | ||||||||||||||||
|
*
|
The Company completed the acquisition of equity interests of ten companies from Huaneng Group and HIPDC, see Note 39 for details. As the acquisition is a business combination under common control, the transaction is accounted for under merger accounting method under PRC GAAP. The assets and liabilities acquired in business combinations are measured at the carrying amounts of the acquirees in the consolidated financial statements of the ultimate controlling party on the acquisition date. The operating results for all periods presented are retrospectively restated as if the current structure and operations resulting from the acquisition had been in existence from the date when the acquirees first became under the control of the same ultimate controlling party. Therefore the relevant comparative figures in the segment information were restated under PRC GAAP while the acquisition is accounted for using acquisition method under IFRS. |
| ** |
Other GAAP adjustments above primarily represented the classification adjustments and other adjustments. Other than the classification adjustments, the differences will be gradually eliminated following subsequent depreciation and amortization of related assets or the extinguishment of liabilities.
|
Geographical information (Under IFRS):
|
|
(i)
|
External revenue generated from the following countries:
|
|
For the year ended 31 December
|
||||||||||||
|
2015
|
2014
|
2013
|
||||||||||
|
PRC
|
118,761,080 | 111,036,449 | 119,593,313 | |||||||||
|
Singapore
|
10,143,793 | 14,370,406 | 14,239,562 | |||||||||
|
Total
|
128,904,873 | 125,406,855 | 133,832,875 | |||||||||
|
|
(ii)
|
Non-current assets (excluding financial assets and deferred income tax assets) are located in the following countries:
|
|
As at 31 December
|
||||||||
|
2015
|
2014
|
|||||||
|
PRC
|
245,620,977 | 207,709,257 | ||||||
|
Singapore
|
22,874,396 | 23,808,140 | ||||||
|
Total
|
268,495,373 | 231,517,397 | ||||||
F-43
|
5
|
Revenue and segment information (Continued)
|
The information on sales to major customers of the Company and its subsidiaries at amount equal to or more than 10% of external revenue is as follows:
|
For the year ended 31 December
|
||||||||||||||||||||||||
|
2015
|
2014
|
2013
|
||||||||||||||||||||||
|
Amount
|
Proportion
|
Amount
|
Proportion
|
Amount
|
Proportion
|
|||||||||||||||||||
|
State Grid Shandong Electric Power Corporation
|
14,855,655 | 12 | % | 16,621,611 | 13 | % | 16,545,732 | 12 | % | |||||||||||||||
|
Jiangsu Electric Power Company
|
14,835,745 | 12 | % | 15,573,769 | 12 | % | 16,950,098 | 13 | % | |||||||||||||||
|
6
|
Profit before income tax expense
|
Profit before income tax expense was determined after charging/(crediting) the following:
|
For the year ended 31 December
|
||||||||||||
|
2015
|
2014
|
2013
|
||||||||||
|
Total interest expense on borrowing
|
8,716,074 | 8,371,506 | 8,285,936 | |||||||||
|
Less: amounts capitalized in property, plant and equipment
|
770,340 | 557,392 | 498,464 | |||||||||
|
Interest expenses charged in consolidated statement of comprehensive income
|
7,945,734 | 7,814,114 | 7,787,472 | |||||||||
|
Auditors’ remuneration
|
41,640 | 33,840 | 32,340 | |||||||||
|
Operating leases charge
|
526,929 | 422,749 | 331,559 | |||||||||
|
Fuel
|
59,242,367 | 64,762,908 | 73,807,817 | |||||||||
|
Depreciation of property, plant and equipment
|
14,411,632 | 11,646,683 | 11,293,522 | |||||||||
|
Amortization of other non-current assets
|
92,775 | 99,528 | 112,384 | |||||||||
|
Impairment loss of property, plant and equipment (Note 7)
|
1,047,641 | 1,358,522 | 472,921 | |||||||||
|
Impairment loss of investment in an associate (Note 8)
|
178,131 | 120,050 | - | |||||||||
|
Impairment loss of mining rights (Note 13)
|
760,296 | - | - | |||||||||
|
Impairment loss of goodwill (Note 15)
|
1,105,649 | 641,061 | 980,513 | |||||||||
|
(Reversal)/recognition of provision for doubtful accounts
|
(3,392 | ) | 4,577 | (2,610 | ) | |||||||
|
Recognition/(reversal) of provision for inventory obsolescence
|
1,828 | (2,647 | ) | (824 | ) | |||||||
|
Net loss on disposals of property, plant and equipment
|
438,321 | 427,034 | 897,222 | |||||||||
|
Government grants
|
(696,735 | ) | (787,988 | ) | (253,729 | ) | ||||||
Other operating expenses consist of impairment loss of property, plant and equipment, goodwill, mining rights and investment in an associate, environmental protection expenses, substituted power arrangement expenses, insurance, government grants and other miscellaneous expenses.
F-44
|
7
|
Property, plant and equipment
|
|
Dam
|
Port facilities
|
Buildings
|
Electric utility plant in service
|
Transportation facilities
|
Others
|
CIP
|
Total
|
|||||||||||||||||||||||||
|
As at 1 January 2014
|
||||||||||||||||||||||||||||||||
|
Cost
|
668,650 | 3,479,480 | 5,644,172 | 260,624,078 | 768,203 | 4,610,653 | 21,584,252 | 297,379,488 | ||||||||||||||||||||||||
|
Accumulated depreciation
|
(30,416 | ) | (433,993 | ) | (1,883,488 | ) | (105,512,124 | ) | (254,447 | ) | (2,647,293 | ) | - | (110,761,761 | ) | |||||||||||||||||
|
Accumulated impairment loss
|
- | - | (44,216 | ) | (5,059,682 | ) | - | (70,208 | ) | (28,440 | ) | (5,202,546 | ) | |||||||||||||||||||
|
Net book value
|
638,234 | 3,045,487 | 3,716,468 | 150,052,272 | 513,756 | 1,893,152 | 21,555,812 | 181,415,181 | ||||||||||||||||||||||||
|
Year ended 31 December 2014
|
||||||||||||||||||||||||||||||||
|
Beginning of the year
|
638,234 | 3,045,487 | 3,716,468 | 150,052,272 | 513,756 | 1,893,152 | 21,555,812 | 181,415,181 | ||||||||||||||||||||||||
|
Reclassification
|
- | - | 227,917 | (344,746 | ) | 31,812 | 85,017 | - | - | |||||||||||||||||||||||
|
Business combination (Note 39)
|
- | - | - | - | - | 156 | 10,594 | 10,750 | ||||||||||||||||||||||||
|
Additions
|
- | - | 68 | 331,026 | 85,465 | 134,743 | 20,150,978 | 20,702,280 | ||||||||||||||||||||||||
|
Transfer from CIP
|
167,544 | 1,648,442 | 806,588 | 18,474,896 | 2,082 | 659,735 | (21,759,287 | ) | - | |||||||||||||||||||||||
|
Disposals
|
- | - | (89 | ) | (457,662 | ) | - | (832 | ) | - | (458,583 | ) | ||||||||||||||||||||
|
Net effect of sales leaseback finance lease
|
- | - | - | 30,829 | - | - | - | 30,829 | ||||||||||||||||||||||||
|
Depreciation charge
|
(17,630 | ) | (115,444 | ) | (182,472 | ) | (10,946,184 | ) | (44,624 | ) | (364,520 | ) | - | (11,670,874 | ) | |||||||||||||||||
|
Impairment charge
|
(80,910 | ) | (568,637 | ) | (18,338 | ) | (336,328 | ) | - | (3,442 | ) | (350,867 | ) | (1,358,522 | ) | |||||||||||||||||
|
Currency translation differences
|
- | - | - | (305,025 | ) | - | (551 | ) | 13,572 | (292,004 | ) | |||||||||||||||||||||
|
End of the year
|
707,238 | 4,009,848 | 4,550,142 | 156,499,078 | 588,491 | 2,403,458 | 19,620,802 | 188,379,057 | ||||||||||||||||||||||||
|
As at 31 December 2014
|
||||||||||||||||||||||||||||||||
|
Cost
|
836,194 | 5,127,923 | 6,711,769 | 276,801,979 | 893,417 | 5,480,587 | 20,000,109 | 315,851,978 | ||||||||||||||||||||||||
|
Accumulated depreciation
|
(48,046 | ) | (549,438 | ) | (2,099,073 | ) | (115,023,072 | ) | (304,926 | ) | (3,003,834 | ) | - | (121,028,389 | ) | |||||||||||||||||
|
Accumulated impairment loss
|
(80,910 | ) | (568,637 | ) | (62,554 | ) | (5,279,829 | ) | - | (73,295 | ) | (379,307 | ) | (6,444,532 | ) | |||||||||||||||||
|
Net book value
|
707,238 | 4,009,848 | 4,550,142 | 156,499,078 | 588,491 | 2,403,458 | 19,620,802 | 188,379,057 | ||||||||||||||||||||||||
|
Year ended 31 December 2015
|
||||||||||||||||||||||||||||||||
|
Beginning of the year
|
707,238 | 4,009,848 | 4,550,142 | 156,499,078 | 588,491 | 2,403,458 | 19,620,802 | 188,379,057 | ||||||||||||||||||||||||
|
Reclassification
|
- | - | 94,127 | (23,353 | ) | 70,432 | (141,206 | ) | - | - | ||||||||||||||||||||||
|
Business combination (Note 39)
|
330,578 | - | 502,852 | 19,822,767 | 13 | 285,819 | 5,519,969 | 26,461,998 | ||||||||||||||||||||||||
|
Additions
|
- | - | 17 | 133,482 | - | 141,991 | 21,574,660 | 21,850,150 | ||||||||||||||||||||||||
|
Transfer from CIP
|
573,234 | 47,480 | 832,961 | 21,654,923 | - | 125,889 | (23,234,487 | ) | - | |||||||||||||||||||||||
|
Disposals/Write-off
|
- | - | (859 | ) | (802,652 | ) | 508 | 7,575 | - | (795,428 | ) | |||||||||||||||||||||
|
Transfer from a subsidiary to a joint venture*
|
- | (522,289 | ) | (16,097 | ) | - | - | (81,462 | ) | - | (619,848 | ) | ||||||||||||||||||||
|
Depreciation charge
|
(24,498 | ) | (111,245 | ) | (234,073 | ) | (13,618,136 | ) | (50,380 | ) | (403,120 | ) | - | (14,441,452 | ) | |||||||||||||||||
|
Impairment charge
|
(152,714 | ) | - | (302 | ) | (526,191 | ) | - | (557 | ) | (367,877 | ) | (1,047,641 | ) | ||||||||||||||||||
|
Currency translation differences
|
- | - | - | (133,733 | ) | - | 22,847 | (2,880 | ) | (113,766 | ) | |||||||||||||||||||||
|
End of the year
|
1,433,838 | 3,423,794 | 5,728,768 | 183,006,185 | 609,064 | 2,361,234 | 23,110,187 | 219,673,070 | ||||||||||||||||||||||||
|
As at 31 December 2015
|
||||||||||||||||||||||||||||||||
|
Cost
|
1,856,144 | 3,860,009 | 8,306,471 | 327,827,738 | 980,290 | 5,809,400 | 23,851,697 | 372,491,749 | ||||||||||||||||||||||||
|
Accumulated depreciation
|
(153,325 | ) | (436,215 | ) | (2,508,772 | ) | (138,852,591 | ) | (371,226 | ) | (3,366,838 | ) | - | (145,688,967 | ) | |||||||||||||||||
|
Accumulated impairment loss
|
(268,981 | ) | - | (68,931 | ) | (5,968,962 | ) | - | (81,328 | ) | (741,510 | ) | (7,129,712 | ) | ||||||||||||||||||
|
Net book value
|
1,433,838 | 3,423,794 | 5,728,768 | 183,006,185 | 609,064 | 2,361,234 | 23,110,187 | 219,673,070 | ||||||||||||||||||||||||
|
|
*
|
Huaneng Yingkou Port Limited Liability Company (“Yingkou Port”) was previously a subsidiary of the Company. Pursuant to the terms of the shareholder agreement signed in June, 2008, between the Company and the other 50% shareholder, the Company was given the rights and ability to solely direct the relevant activities, including all financial and operating decisions, whilst the Company holds 50% equity interest in Yingkou Port.
|
For the purpose of better utilization of the expertise of both shareholders in terms of port operation and management, the Company and the other shareholder agreed to optimize the business model of Yingkou Port and amended the articles of association and shareholder agreement of Yingkou Port on 1 January 2015. In accordance with the amended articles of association and shareholder agreement, the Company’s rights and ability to solely direct significant financial and operating decisions have been removed, and therefore, Yingkou Port became a joint venture and is jointly controlled by the Company and the other shareholder.
F-45
|
7
|
Property, plant and equipment (Continued)
|
Interest capitalization
Interest expense of approximately RMB770 million (2014 and 2013: RMB557 million and RMB498 million) arising on borrowings for the construction of property, plant and equipment was capitalized during the year and was included in ‘Additions’ in property, plant and equipment. The weighted average capitalization rate was approximately 5.31% (2014 and 2013: 5.98% and 5.74%) per annum.
Impairment
In 2015, impairment losses for certain property, plant and equipment of approximately RMB1,048 million have been recognized. Factors leading to the impairment of operating projects primarily included lower utilization hours and tariff of two coal-fired power plants as a result of over supply of electricity in two provinces, as well as low utilization hours of a hydropower plant as a result of low level of water inflow to the main dam. Discount rates of 7.86%, 8.81% and 7.60% were adopted in the value in use model in the determination of the recoverable amounts for the two coal-fired power plants and the hydropower plant respectively. Besides, as a result of the low demand of coal-fired power in local market, management estimated the possibility of further development of a coal-fired power project was remote, therefore the project under construction with a carrying value of RMB368 million was fully impaired in 2015.
In 2014, impairment losses for certain property, plant and equipment of approximately RMB1,359 million have been recognized. Factors leading to the impairment primarily included continuous losses and external environment deterioration in respect of port industry, continuous low level of water inflow to the main dam of a hydropower plant and shut-down of a coal-fired power plant. Discount rates of 9.54%, 7.24% and 8.68% were adopted in the value in use model in the determination of the recoverable amounts for the port plant, hydropower plant and coal-fired power plant respectively.
In 2013, impairment losses for certain property, plant and equipment of approximately RMB473 million have been recognized. Factors leading to the impairment primarily included shut-down of power plants and the continuous deterioration in utilization of certain non-power assets in a foreign subsidiary. Discount rates of 8.80% and 12.84% were adopted in the value in use model in the determination of the recoverable amounts for the coal-fired power plants and for the CGU of the foreign subsidiary respectively.
Property, plant and equipment held under finance leases
As at 31 December 2015, certain property, plant and equipment with original cost of RMB1,912 million (2014: RMB1,657 million) were held under finance leases, which mainly included power generation assets, ships and pipeline assets.
Security
As at 31 December 2015, certain property, plant and equipment were secured to a bank as collateral against a long-term loan (Note 23).
F-46
|
8
|
Investments in associates and joint ventures
|
|
2015
|
2014
|
|||||||
|
Beginning of the year
|
17,626,910 | 16,678,694 | ||||||
|
Additional capital injections in associates
|
300,280 | 266,877 | ||||||
|
Acquisition of associates
|
589,500 | - | ||||||
|
Business combination (Note 39)
|
136,244 | - | ||||||
|
Share of net profit less loss
|
1,525,975 | 1,315,876 | ||||||
|
Share of other comprehensive income
|
678,793 | 87,579 | ||||||
|
Dividends
|
(934,379 | ) | (602,066 | ) | ||||
|
Impairment charge
|
(178,131 | ) | (120,050 | ) | ||||
|
End of the year
|
19,745,192 | 17,626,910 | ||||||
As at 31 December 2015, investments in associates and joint ventures of the Company and its subsidiaries are unlisted except for Shenzhen Energy Corporation Limited (“SECL”) which is listed on the Shenzhen Stock Exchange. The following list contains only the particulars of material associates and joint ventures:
|
Percentage of equity interest held
|
||||||||||
|
Name
|
Country of incorporation
|
Registered capital
|
Business nature and scope of operation
|
Direct
|
Indirect1
|
|||||
|
Associates:
|
||||||||||
|
SECL*
|
PRC
|
RMB2,642,994,398
|
Energy and investment in related industries
|
25.02%
|
-
|
|||||
|
Hebei Hanfeng Power Generation Limited Liability Company (“Hanfeng Power”)
|
PRC
|
RMB1,975,000,000
|
Power generation
|
40%
|
-
|
|||||
|
Huaneng Finance
|
PRC
|
RMB5,000,000,000
|
Provision for financial service including fund deposit services, lending, finance lease arrangements, notes discounting and entrusted loans and investment arrangement within Huaneng Group
|
20%
|
-
|
|||||
|
Huaneng Sichuan Hydropower Co., Ltd. (“Sichuan Hydropower”)
|
PRC
|
RMB1,469,800,000
|
Development, investment, construction, operation and management of hydropower
|
49%
|
-
|
|||||
|
China Huaneng Group Fuel Co., Ltd.(“Huaneng Group Fuel Company”) **
|
PRC
|
RMB3,000,000,000
|
Wholesale of coal, import and export of coal
|
50%
|
-
|
|||||
|
Hainan Nuclear Power Limited Liability Company (“Hainan Nuclear”)
|
PRC
|
RMB2,059,334,000
|
Construction and operation of nuclear power plants; production and sales of electricity and related products
|
30%
|
-
|
|||||
|
Joint ventures:
|
||||||||||
|
Shanghai Time Shipping Co., Ltd. (“Shanghai Time Shipping”)
|
PRC
|
RMB1,200,000,000
|
International and domestic sea transportation
|
50%
|
-
|
|||||
|
Jiangsu Nantong Power Generation Co., Ltd. (“Jiangsu Nantong Power”)
|
PRC
|
RMB1,596,000,000
|
Operation and Management of power generation plants and transportation related projects
|
-
|
35%
|
|||||
|
|
1
|
The indirect percentage of equity interest held represents the effective ownership interest of the Company and its subsidiaries.
|
|
|
*
|
As at 31 December 2015, the fair value of the Company’s shares in SECL was RMB9,729 million (2014: RMB7,379 million).
|
F-47
|
8
|
Investments in associates and joint ventures (Continued)
|
|
|
**
|
In accordance with the articles of the association of the investee, the Company could only exercise significant influence on the investee and therefore accounts for the investment under the equity method.
|
In 2015, due to continuous loss as a result of deterioration of coal industry, impairment loss of RMB178 million (2014: RMB120 million) was provided for the investment in an associate engaged in coal production and sales.
All the above associates and joint ventures are accounted for under the equity method in the consolidated financial statements.
Summarized financial information of the material associates, adjusted for any differences in accounting policies and acquisition adjustments, and reconciliation to the carrying amounts in the consolidated financial statements, are disclosed below:
|
Sichuan Hydropower
|
SECL
|
Huaneng Finance
|
Hanfeng Power
|
Huaneng Group Fuel Company
|
Hainan Nuclear
|
|||||||||||||||||||||||||||||||||||||||||||
|
2015
|
2014
|
2015
|
2014
|
2015
|
2014
|
2015
|
2014
|
2015
|
2014
|
2015
|
2014
|
|||||||||||||||||||||||||||||||||||||
|
Gross amounts of the associates’
|
||||||||||||||||||||||||||||||||||||||||||||||||
|
Current assets
|
1,207,407 | 1,004,545 | 16,556,930 | 10,877,590 | 15,612,635 | 17,210,954 | 663,263 | 442,559 | 5,236,751 | 5,315,592 | 1,744,274 | 521,536 | ||||||||||||||||||||||||||||||||||||
|
Non-current assets
|
14,734,831 | 14,680,349 | 39,075,400 | 27,206,670 | 16,012,855 | 12,411,987 | 3,016,665 | 3,136,295 | 4,468,686 | 4,652,860 | 21,281,843 | 18,775,758 | ||||||||||||||||||||||||||||||||||||
|
Current liabilities
|
(2,894,554 | ) | (2,752,050 | ) | (15,009,530 | ) | (13,805,720 | ) | (24,881,159 | ) | (22,761,053 | ) | (1,158,424 | ) | (1,358,923 | ) | (2,594,360 | ) | (2,988,992 | ) | (907,693 | ) | (353,059 | ) | ||||||||||||||||||||||||
|
Non-current liabilities
|
(8,349,972 | ) | (8,228,061 | ) | (16,130,880 | ) | (4,152,700 | ) | (95,567 | ) | (122,110 | ) | (35,968 | ) | (10,911 | ) | (3,679,055 | ) | (3,627,542 | ) | (17,609,808 | ) | (15,119,935 | ) | ||||||||||||||||||||||||
|
Equity
|
4,697,712 | 4,704,783 | 24,491,920 | 20,125,840 | 6,648,764 | 6,739,778 | 2,485,536 | 2,209,020 | 3,432,022 | 3,351,918 | 4,508,616 | 3,824,300 | ||||||||||||||||||||||||||||||||||||
|
-Equity attributable to shareholders
|
3,573,323 | 3,617,367 | 21,679,710 | 17,563,160 | 6,648,764 | 6,739,778 | 2,485,536 | 2,209,020 | 3,287,867 | 3,215,675 | 4,508,616 | 3,824,300 | ||||||||||||||||||||||||||||||||||||
|
-Non-controlling interests
|
1,124,389 | 1,087,416 | 2,812,210 | 2,562,680 | - | - | - | - | 144,155 | 136,243 | - | - | ||||||||||||||||||||||||||||||||||||
|
Revenue
|
2,379,072 | 2,544,980 | 11,361,320 | 12,691,060 | 1,182,782 | 1,314,173 | 2,272,013 | 2,508,099 | 14,985,952 | 17,386,709 | 31,588 | - | ||||||||||||||||||||||||||||||||||||
|
Profit from continuing operations attributable to shareholders
|
308,603 | 367,955 | 1,865,095 | 1,985,921 | 679,857 | 780,304 | 431,337 | 267,851 | 65,887 | 154,577 | 11,696 | - | ||||||||||||||||||||||||||||||||||||
|
Other comprehensive (loss)/income attributable to shareholders
|
- | (588 | ) | 2,765,600 | 49,170 | (80,871 | ) | 379,393 | - | - | 6,306 | (622 | ) | - | - | |||||||||||||||||||||||||||||||||
|
Total comprehensive income attributable to shareholders
|
308,603 | 367,367 | 4,630,695 | 2,035,091 | 598,986 | 1,159,697 | 431,337 | 267,851 | 72,193 | 153,955 | 11,696 | - | ||||||||||||||||||||||||||||||||||||
|
Dividend received from the associate
|
189,499 | 172,894 | 132,232 | 165,290 | 138,000 | 154,000 | 115,954 | - | - | - | - | - | ||||||||||||||||||||||||||||||||||||
|
Reconciled to the interests in the associates
|
||||||||||||||||||||||||||||||||||||||||||||||||
|
Gross amounts of net assets of the associate
|
3,573,323 | 3,617,367 | 21,679,710 | 17,563,160 | 6,648,764 | 6,739,778 | 2,485,536 | 2,209,020 | 3,287,867 | 3,215,675 | 4,508,616 | 3,824,300 | ||||||||||||||||||||||||||||||||||||
|
The Company’s effective interest
|
49% | 49% | 25.02% | 25.02% | 20% | 20% | 40% | 40% | 50% | 50% | 30% | 30% | ||||||||||||||||||||||||||||||||||||
|
The Company’s share of net assets of the associate
|
1,750,928 | 1,772,510 | 5,423,179 | 4,393,424 | 1,329,753 | 1,347,956 | 994,214 | 883,608 | 1,643,934 | 1,607,838 | 1,352,585 | 1,147,290 | ||||||||||||||||||||||||||||||||||||
|
Impact of adjustments
|
207,586 | 224,288 | 1,161,810 | 1,165,428 | - | - | 293,082 | 347,108 | 16,521 | 16,521 | 14,076 | 14,076 | ||||||||||||||||||||||||||||||||||||
|
Carrying amount in the consolidated financial statements
|
1,958,514 | 1,996,798 | 6,584,989 | 5,558,852 | 1,329,753 | 1,347,956 | 1,287,296 | 1,230,716 | 1,660,455 | 1,624,359 | 1,366,661 | 1,161,366 | ||||||||||||||||||||||||||||||||||||
F-48
|
8
|
Investments in associates and joint ventures (Continued)
|
Summarized financial information of material joint ventures adjusted for any differences in accounting policies and acquisition adjustment, and reconciliation to the carrying amount in the consolidated financial statements, are disclosed below:
|
Shanghai Time
Shipping
|
Jiangsu Nantong Power
|
|||||||||||||||
|
2015
|
2014
|
2015
|
2014
|
|||||||||||||
|
Gross amounts of joint ventures’
|
||||||||||||||||
|
Current assets
|
889,689 | 764,956 | 629,933 | 639,132 | ||||||||||||
|
Non-current assets
|
5,675,480 | 6,010,052 | 6,587,197 | 6,706,755 | ||||||||||||
|
Current liabilities
|
(3,506,971 | ) | (2,853,997 | ) | (1,583,902 | ) | (1,688,700 | ) | ||||||||
|
Non-current liabilities
|
(1,524,838 | ) | (1,939,297 | ) | (2,494,000 | ) | (3,415,025 | ) | ||||||||
|
Equity
|
1,533,360 | 1,981,714 | 3,139,228 | 2,242,162 | ||||||||||||
|
Included in the above assets and liabilities:
|
||||||||||||||||
|
Cash and cash equivalents
|
197,894 | 236,737 | 144,001 | 72,549 | ||||||||||||
|
Current financial liabilities (excluding trade and other payables and provisions)
|
(3,027,511 | ) | (2,545,093 | ) | (954,448 | ) | (1,044,610 | ) | ||||||||
|
Non-current financial liabilities (excluding trade and other payables and provisions)
|
(1,524,837 | ) | (1,939,297 | ) | (2,494,000 | ) | (3,415,025 | ) | ||||||||
|
Revenue
|
3,071,262 | 4,270,631 | 3,583,167 | 3,429,254 | ||||||||||||
|
Profit from continuing operations
|
1,646 | 62,335 | 897,066 | 646,163 | ||||||||||||
|
Total comprehensive income
|
1,646 | 62,335 | 897,066 | 646,163 | ||||||||||||
|
Dividend received from the joint venture
|
225,000 | - | - | - | ||||||||||||
|
Included in the above profit:
|
||||||||||||||||
|
Depreciation and amortization
|
339,204 | 338,690 | 390,262 | 342,520 | ||||||||||||
|
Interest income
|
812 | 1,844 | 3,436 | 3,325 | ||||||||||||
|
Interest expense
|
172,382 | 210,461 | 199,769 | 260,486 | ||||||||||||
|
Income tax expense
|
561 | 7,797 | 261,023 | 262,335 | ||||||||||||
|
Reconciled to the interest in the joint venture:
|
||||||||||||||||
|
Gross amounts of net assets
|
1,533,360 | 1,981,714 | 3,139,228 | 2,242,162 | ||||||||||||
|
The Company’s effective interest
|
50% | 50% | 50% | 50% | ||||||||||||
|
The Company’s share of net assets
|
766,680 | 990,857 | 1,569,614 | 1,121,081 | ||||||||||||
|
Impact of adjustments
|
18,324 | 18,324 | - | - | ||||||||||||
|
Carrying amount in the consolidated financial statements
|
785,004 | 1,009,181 | 1,569,614 | 1,121,081 | ||||||||||||
Aggregate information of associates and a joint venture that are not individually material:
|
2015
|
2014
|
|||||||
|
Aggregate carrying amount of individually immaterial associates and joint venture in the consolidated financial statements
|
3,202,906 | 2,576,601 | ||||||
|
Aggregate amounts of the Company and its subsidiaries’ share of those associates and joint venture profit / (loss) from continuing operations
|
113,891 | (55,939 | ) | |||||
|
Total comprehensive income / (loss)
|
113,891 | (55,939 | ) | |||||
As at 31 December 2015, the Company’s share of losses of an associate and a joint venture exceeded its interest in the associate and the joint venture and the unrecognized further losses amounted to RMB76 million (2014: The unrecognized further loss of an associate amounted RMB35 million).
F-49
|
9
|
Investments in subsidiaries
|
As at 31 December 2015, the investments in subsidiaries of the Company and its subsidiaries, all of which are unlisted, are as follows:
|
|
(i)
|
Subsidiaries acquired through establishment or investment
|
|
Name of subsidiary
|
Country of incorporation
|
Type of interest held
|
Registered capital
|
Business nature and scope of operations
|
Percentage of equity interest held
|
|||||||
|
Interest
|
Voting
|
|||||||||||
|
Huaneng International Power Fuel Limited Liability Company
|
PRC
|
held directly
|
RMB
200,000,000
|
Wholesale of coal
|
100%
|
100%
|
||||||
|
Huaneng Shanghai Shidongkou Power Generation Limited Liability Company (“Shidongkou Power Company”)(i)
|
PRC
|
held directly
|
RMB
990,000,000
|
Power generation
|
50%
|
50%
|
||||||
|
Huaneng Nantong Power Generation Limited Liability Company
|
PRC
|
held directly
|
RMB
798,000,000
|
Power generation
|
70%
|
70%
|
||||||
|
Huaneng Yingkou Power Generation Limited Liability Company
|
PRC
|
held directly
|
RMB
844,030,000
|
Production and sales of electricity and heat sale of coal ash and lime
|
100%
|
100%
|
||||||
|
Huaneng Hunan Xiangqi Hydropower Co., Ltd.
|
PRC
|
held directly
|
RMB
328,000,000
|
Construction, operation and management of hydropower and related projects
|
100%
|
100%
|
||||||
|
Huaneng Zuoquan Coal-fired Power Generation Limited Liability Company
|
PRC
|
held directly
|
RMB
960,000,000
|
Construction, operation and management of power plants and related projects
|
80%
|
80%
|
||||||
|
Huaneng Kangbao Wind Power Utilization Limited Liability Company
|
PRC
|
held directly
|
RMB
370,000,000
|
Construction, operation and management of wind power and related projects; solar power generation
|
100%
|
100%
|
||||||
|
Huaneng Jiuquan Wind Power Generation Co., Ltd.
|
PRC
|
held directly
|
RMB
1,360,170,000
|
Construction, operation and management of wind power generation and related projects
|
100%
|
100%
|
||||||
|
Huaneng Jiuquan II Wind Power Generation Co., Ltd.
|
PRC
|
held directly
|
RMB
10,000,000
|
Construction, operation and management of wind power generation and related projects
|
100%
|
100%
|
||||||
|
Huaneng Wafangdian Wind Power Generation Co., Ltd.
|
PRC
|
held directly
|
RMB
50,000,000
|
Construction, operation and management of wind power generation and related projects
|
100%
|
100%
|
||||||
|
|
||||||||||||
|
Huaneng Changtu Wind Power Generation Co., Ltd.
|
PRC
|
held directly
|
RMB
50,000,000
|
Construction, operation and management of wind power generation and related projects
|
100%
|
100%
|
||||||
|
Huaneng Rudong Wind Power Generation Co., Ltd.
|
PRC
|
held directly
|
RMB
90,380,000
|
Construction and management of wind power generation projects
|
90%
|
90%
|
||||||
|
Huaneng Guangdong Haimen Port Limited Liability Company
|
PRC
|
held directly
|
RMB
197,400,000
|
Loading warehousing and conveying services, providing facilities services
|
100%
|
100%
|
||||||
|
Huaneng Taicang Port Limited Liability Company
|
PRC
|
held directly
|
RMB
510,800,000
|
Port development and construction, coal mixture, machinery leasing and repair
|
85%
|
85%
|
||||||
|
Huaneng Taicang Power Co., Ltd.
|
PRC
|
held directly
|
RMB
804,146,700
|
Power generation
|
75%
|
75%
|
||||||
F-50
|
9
|
Investments in subsidiaries (Continued)
|
|
|
(i)
|
Subsidiaries acquired through establishment or investment (Continued)
|
|
Name of subsidiary
|
Country of incorporation
|
Type of interest held
|
Registered capital
|
Business nature and scope of operations
|
Percentage of equity interest held
|
|||||||
|
Interest
|
Voting
|
|||||||||||
|
Huaneng Huaiyin II Power Limited Company
|
PRC
|
held directly
|
RMB
930,870,000
|
Power generation
|
63.64%
|
63.64%
|
||||||
|
Huaneng Xindian Power Co., Ltd.
|
PRC
|
held directly
|
RMB
465,600,000
|
Power generation
|
95%
|
95%
|
||||||
|
Huaneng Shanghai Combined Cycle Power Limited Liability Company
|
PRC
|
held directly
|
RMB
699,700,000
|
Power generation
|
70%
|
70%
|
||||||
|
Huaneng Yumen Wind Power Generation Co., Ltd.
|
PRC
|
held directly
|
RMB
719,170,000
|
Construction, operation and management of wind power generation and related projects
|
100%
|
100%
|
||||||
|
Huaneng Qingdao Co-generation Limited Liability Company
|
PRC
|
held directly
|
RMB
214,879,000
|
Construction, operation and management of cogeneration power plants and related projects, production and sales of electricity and heat
|
100%
|
100%
|
||||||
|
Huaneng Tongxiang Combined Cycle Cogeneration Co., Ltd.
|
PRC
|
held directly
|
RMB
300,000,000
|
Investment in related industries
|
95%
|
95%
|
||||||
|
Huaneng Eastern Yunnan Energy Mine Construction Co. Ltd.
|
PRC
|
held indirectly
|
RMB
10,000,000
|
Constructing and operating of mine and related construction projects
|
100%
|
100%
|
||||||
|
Huaneng Nanjing Combined Cycle Cogeneration Co., Ltd.
|
PRC
|
held directly
|
RMB
582,000,000
|
Power generation
|
60%
|
60%
|
||||||
|
Huaneng Shantou Haimen Power Limited Liability Company
|
PRC
|
held directly
|
RMB
1,508,000,000
|
Construction, operation and management of power plants and related projects
|
80%
|
80%
|
||||||
|
Huaneng Chongqing Liangjiang Power Generation Limited Liability Company
|
PRC
|
held directly
|
RMB
360,000,000
|
Construction, operation and management of natural gas power plants and related projects
|
100%
|
100%
|
||||||
|
Chongqing Huaqing Energy Co., Ltd.
|
PRC
|
held indirectly
|
RMB
44,420,000
|
Thermal energy, cold energy installation of instrumentation, promotion service for energy saving technology
|
60%
|
60%
|
||||||
|
Huaneng Fuyuan Wind Power Generation Co., Ltd.
|
PRC
|
held directly
|
RMB
54,000,000
|
Wind Power Project investment and management
|
100%
|
100%
|
||||||
|
Huaneng Panxian Wind Power Generation Co., Ltd.
|
PRC
|
held directly
|
RMB
10,000,000
|
Construction and management of wind power plants and related projects
|
100%
|
100%
|
||||||
|
Huaneng Jiangxi Clean Energy Limited Liability Company
|
PRC
|
held directly
|
RMB
5,000,000
|
Development, management and construction of clean energy project
|
100%
|
100%
|
||||||
|
Huaneng Suzhou Combined Cycle Co-generation Co., Ltd.
|
PRC
|
held directly
|
RMB
160,000,000
|
Construction and management of natural gas power plant and related projects
|
100%
|
100%
|
||||||
|
Huaneng Hunan Subaoding Wind Power Generation Co., Ltd.
|
PRC
|
held directly
|
RMB
6,000,000
|
Construction and operation of wind power plants and related projects
|
100%
|
100%
|
||||||
F-51
|
9
|
Investments in subsidiaries (Continued)
|
|
|
(i)
|
Subsidiaries acquired through establishment or investment (Continued)
|
|
Name of subsidiary
|
Country of incorporation
|
Type of interest held
|
Registered capital
|
Business nature and scope of operations
|
Percentage of equity interest held
|
|||||||
|
Interest
|
Voting
|
|||||||||||
|
Huaneng Suixian Jieshan Wind Power Generation Co., Ltd.
|
PRC
|
held directly
|
RMB
2,000,000
|
Construction and operation of wind power plants and related projects
|
100%
|
100%
|
||||||
|
Huaneng Taiyuan Dongshan Combined Cycle Co-generation Co., Ltd.
|
PRC
|
held directly
|
RMB
10,000,000
|
Construction and operation of power plants; thermal heating services
|
100%
|
100%
|
||||||
|
Jiangsu Huayi Energy Co., Ltd.
|
PRC
|
held directly
|
RMB
5,000,000
|
Development of new energy distribution of coal and coal products
|
100%
|
100%
|
||||||
|
Huaneng Xuzhou Tongshan Wind Power Co., Ltd.
|
PRC
|
held directly
|
RMB
169,000,000
|
Wind power generation
|
70%
|
70%
|
||||||
|
Huaneng Nanjing Co-generation Co., Ltd
|
PRC
|
held directly
|
RMB
300,000,000
|
Construction and operation of power plants; thermal heating services
|
70%
|
70%
|
||||||
|
Huaneng Hunan Guidong Wind Power Generation Co., Ltd.
|
PRC
|
held directly
|
RMB
2,000,000
|
Construction and operation of wind power plants and related projects
|
100%
|
100%
|
||||||
|
Huaneng Nanjing Luhe Wind Power Generation Co., Ltd.
|
PRC
|
held directly
|
RMB
5,000,000
|
Research and development of wind power technology, construction and operation of wind power plants
|
100%
|
100%
|
||||||
|
Huaneng Luoyuan Power Limited Liability Company
|
PRC
|
held directly
|
RMB
1,000,000,000
|
Construction and operation of power plants and related projects
|
100%
|
100%
|
||||||
|
Huaneng Lingang (Tianjin) Gas Co-generation Co., Ltd.
|
PRC
|
held directly
|
RMB
180,000,000
|
Power generation, installation and maintenance of power equipment
|
100%
|
100%
|
||||||
|
Huaneng Anhui Huaining Wind Power Generation Co., Ltd.
|
PRC
|
held directly
|
RMB
6,000,000
|
Construction and operation of wind power plants and related projects
|
100%
|
100%
|
||||||
|
Huaneng Mianchi Co-generation Limited Liability Company
|
PRC
|
held directly
|
RMB
570,000,000
|
Construction and operation of coal-fired plants and related projects
|
60%
|
60%
|
||||||
|
Huaneng Yingkou Xianrendao Co-generation Co., Ltd.
|
PRC
|
held directly
|
RMB
277,690,000
|
Construction and operation of cogeneration power plants and related projects
|
100%
|
100%
|
||||||
|
Huaneng Nanjing Xingang Heating Co., Ltd.
|
PRC
|
held directly
|
RMB
10,000,000
|
Construction and operation of heat supply network and related projects
|
65%
|
65%
|
||||||
|
Huaneng Changxing Photovoltaic Power Limited Liability Company
|
PRC
|
held directly
|
RMB
16,000,000
|
Construction and operation of distributed photovoltaic power generation and related projects
|
100%
|
100%
|
||||||
F-52
|
9
|
Investments in subsidiaries (Continued)
|
(i) Subsidiaries acquired through establishment or investment (Continued)
|
Name of subsidiary
|
Country of incorporation
|
Type of interest held
|
Registered capital
|
Business nature and scope of operations
|
Percentage of equity interest held
|
|||||||
|
Interest
|
Voting
|
|||||||||||
|
Huaneng Rudong Baxianjiao Offshore Wind Power Generation Co., Ltd.
|
PRC
|
held directly
|
RMB
610,000,000
|
Infrastructure construction of wind power plants
|
70%
|
70%
|
||||||
|
Huaneng Shanxi City of Science & Technology Project Management Co., Ltd.
|
PRC
|
held directly
|
RMB
10,000,000
|
Construction and operation of supporting power project
|
100%
|
100%
|
||||||
|
Huaneng Guilin Gas distributed energy Co., Ltd.
|
PRC
|
held directly
|
RMB
267,450,000
|
Construction and operation of power plants and related projects
|
80%
|
80%
|
||||||
|
Huaneng (Dalian) Co-generation Co., Ltd.
|
PRC
|
held directly
|
RMB
12,500,000
|
Construction and operation of cogeneration power plants and related projects
|
100%
|
100%
|
||||||
|
Huaneng Zhongxiang Wind Power Generation Co., Ltd.
|
PRC
|
held directly
|
RMB
10,000,000
|
Construction and operation of wind power plants and related projects
|
100%
|
100%
|
||||||
|
Huaneng Guanyun Co-generation Co., Ltd.
|
PRC
|
held directly
|
RMB
15,000,000
|
Construction and operation of cogeneration power plants and related projects
|
100%
|
100%
|
||||||
|
Huaneng International Power Hongkong Limited Company
|
Hong Kong
|
held directly
|
100,000
Shares
|
Construction and operation of power supply, coal project and related investment and financing businesses
|
100%
|
100%
|
||||||
|
TPG
|
Singapore
|
held indirectly
|
S$
1,183,000,001
|
Power generation and related by products, derivatives; developing power supply resources, operating electricity and power sales
|
100%
|
100%
|
||||||
|
TP Utilities Pte Ltd.
|
Singapore
|
held indirectly
|
S$
255,500,001
|
Provision of utility services
|
100%
|
100%
|
||||||
|
Huaneng Shanxi Taihang Power Generation Limited Liability Company*
|
PRC
|
held directly
|
RMB
1,086,440,000
|
Pre service related to power generation
|
60%
|
60%
|
||||||
|
Huaneng Mianchi Clean Energy Limited Liability Company*
|
PRC
|
held directly
|
RMB
10,000,000
|
Power generation, new energy development and utilization
|
100%
|
100%
|
||||||
|
Huaneng Zhuolu Clean Energy Limited Liability Company*
|
PRC
|
held directly
|
RMB
10,000,000
|
Construction, operation and management of power plants and related projects
|
100%
|
100%
|
||||||
|
Huaneng Tongwei Wind Power Limited Liability Company*
|
PRC
|
held directly
|
RMB
248,000,000
|
Construction, operation and management of power plants and related projects
|
100%
|
100%
|
||||||
|
Huaneng Yizheng Power Generation Limited Liability Company*
|
PRC
|
held directly
|
RMB
200,000,000
|
Wind power station design, construction, management and maintenance
|
100%
|
100%
|
||||||
F-53
|
9
|
Investments in subsidiaries (Continued)
|
|
|
(i)
|
Subsidiaries acquired through establishment or investment (Continued)
|
|
Name of subsidiary
|
Country of incorporation
|
Type of interest held
|
Registered capital
|
Business nature and scope of operations
|
Percentage of equity interest held
|
|||||||
|
Interest
|
Voting
|
|||||||||||
|
Huaneng Yancheng Dafeng New Energy Power Generation Limited Liability Company*
|
PRC
|
held directly
|
RMB
5,000,000
|
Construction, operation and management of wind power, photovoltaic power plant
|
100%
|
100%
|
||||||
|
Huaneng Shanyin Power Generation Limited Liability Company*
|
PRC
|
held directly
|
RMB
1,573,000,000
|
Construction, operation and management of power plants and related projects
|
51%
|
51%
|
||||||
|
Huaneng Jiangsu Energy Sales Limited Liability Company*
|
PRC
|
held directly
|
RMB
200,000,000
|
Electric energy, heat energy distribution network, and water supply services; heating pipe network construction and operation
|
100%
|
100%
|
||||||
|
Huaneng Liaoning Energy Sales Limited Liability Company*
|
PRC
|
held directly
|
RMB
200,000,000
|
Electric energy, thermal energy and circulating hot water sales
|
100%
|
100%
|
||||||
|
Huaneng Guangdong Energy Sales Limited Liability Company*
|
PRC
|
held directly
|
RMB
200,000,000
|
Power supply, energy transmission and substation project contracting
|
100%
|
100%
|
||||||
|
Huaneng Suizhou Power Generation Limited Liability Company*
|
PRC
|
held directly
|
RMB
50,000,000
|
Construction, operation and management of power plants production and sales of electricity and heat
|
100%
|
100%
|
||||||
|
Huaneng Changle Photovoltaic Power Limited Liability Company*
|
PRC
|
held directly
|
RMB
10,000,000
|
Construction, operation and management of photovoltaic power plants and related projects
|
100%
|
100%
|
||||||
|
Huaneng Longyan Wind Power Generation Limited Liability Company*
|
PRC
|
held directly
|
RMB
10,000,000
|
Construction, operation and management of wind power plants and related projects
|
100%
|
100%
|
||||||
|
Huaneng Yunnan Malong Wind Power Generation Limited Liability Company*
|
PRC
|
held directly
|
RMB
10,000,000
|
Construction, operation and management of wind power plants and related projects
|
100%
|
100%
|
||||||
|
Huaneng Dandong Photovoltaic Power Limited Liability Company*
|
PRC
|
held directly
|
RMB
15,000,000
|
Construction, operation and management of photovoltaic power plants and related projects
|
100%
|
100%
|
||||||
|
Huaneng Dongguan Combined Cycle Co-generation Limited Liability Company*
|
PRC
|
held directly
|
RMB
10,000,000
|
Construction, operation and management of photovoltaic power plants and related projects production of electricity heat production and sales
|
100%
|
100%
|
||||||
|
Huaneng Yangxi Photovoltaic Power Limited Liability Company*
|
PRC
|
held directly
|
RMB
62,500,000
|
Photovoltaic electric power production and sales
|
80%
|
80%
|
||||||
|
*
|
These companies were newly established in 2015.
|
F-54
|
9
|
Investments in subsidiaries (Continued)
|
|
|
(ii)
|
Subsidiaries acquired from business combinations under common control
|
|
Name of subsidiary
|
Country of incorporation
|
Type of interest held
|
Registered capital
|
Business nature and scope of operations
|
Percentage of equity interest held
|
|||||||
|
Interest
|
Voting
|
|||||||||||
|
Huaneng (Suzhou Industrial Park) Power Generation Co., Ltd.
|
PRC
|
held directly
|
RMB
632,840,000
|
Power generation
|
75%
|
75%
|
||||||
|
Huaneng Qinbei Power Co., Ltd.
|
PRC
|
held directly
|
RMB
1,540,000,000
|
Power generation
|
60%
|
60%
|
||||||
|
Huaneng Yushe Power Generation Co., Ltd.
|
PRC
|
held directly
|
RMB
615,760,000
|
Power generation
|
60%
|
60%
|
||||||
|
Huaneng Hunan Yueyang Power Generation Limited Liability Company
|
PRC
|
held directly
|
RMB
1,935,000,000
|
Power generation
|
55%
|
55%
|
||||||
|
Huaneng Chongqing Luohuang Power Generation Limited Liability Company (“Luohuang Power”)
|
PRC
|
held directly
|
RMB
1,658,310,000
|
Power generation
|
60%
|
60%
|
||||||
|
Huaneng Pingliang Power Generation Co., Ltd.
|
PRC
|
held directly
|
RMB
924,050,000
|
Power generation
|
65%
|
65%
|
||||||
|
Huaneng Nanjing Jinling Power Co., Ltd. (“Jinling Power”)
|
PRC
|
held directly
|
RMB
1,513,136,000
|
Power generation
|
60%
|
60%
|
||||||
|
Huaneng Qidong Wind Power Generation Co., Ltd.
|
PRC
|
held directly
|
RMB
391,738,500
|
Development of wind power project, production and sales of electricity
|
65%
|
65%
|
||||||
|
Tianjin Huaneng Yangliuqing Co-generation Limited Liability Company (“Yangliuqing Cogeneration”)
|
PRC
|
held directly
|
RMB
1,537,130,909
|
Power generation, heat supply, facilities installation, maintenance and related services
|
55%
|
55%
|
||||||
|
Huaneng Beijing Co-generation Limited Liability Company (“Beijing Cogeneration”) (ii)
|
PRC
|
held directly
|
RMB
2,665,000,000
|
Construction and operation of power plants and related construction projects
|
41%
|
66%
|
||||||
|
Huaneng Wuhan Power Generation Co., Ltd. (“Wuhan Power”)
|
PRC
|
held directly
|
RMB
1,445,754,800
|
Power generation comprehensive utilization of fly ash
|
75%
|
75%
|
||||||
|
Huaneng Anyuan Power Generation Co., Ltd. (“Anyuan Power”)
|
PRC
|
held directly
|
RMB
125,000,000
|
Construction and operation of power plants and related construction projects
|
100%
|
100%
|
||||||
|
Huaneng Hualiangting Hydropower Co., Ltd. (“Hualiangting Hydropower”)
|
PRC
|
held directly
|
RMB
50,000,000
|
Generation and transfer of power supply, water supply (irrigation)
|
100%
|
100%
|
||||||
|
Huaneng Chaohu Power Generation Co., Ltd. (“Chaohu Power”) (iii)
|
PRC
|
held directly
|
RMB
800,000,000
|
Construction and operation of power plants and related construction projects
|
60%
|
70%
|
||||||
|
Huaneng Jingmen Thermal Power Co., Ltd. (“Jingmen Thermal Power”)
|
PRC
|
held directly
|
RMB
780,000,000
|
General business projects: thermal power, power development, power services
|
100%
|
100%
|
||||||
F-55
|
9
|
Investments in subsidiaries (Continued)
|
|
|
(ii)
|
Subsidiaries acquired from business combinations under common control (Continued)
|
|
Name of subsidiary
|
Country of incorporation
|
Type of interest held
|
Registered capital
|
Business nature and scope of operations
|
Percentage of equity interest held
|
|||||||
|
Interest
|
Voting
|
|||||||||||
|
Enshi Qingjiang Dalongtan Hydropwer Development Co., Ltd. (“Dalongtan Hydropower”)
|
PRC
|
held directly
|
RMB
76,000,000
|
Hydropower development, production and management of electric power urban water supply
|
97%
|
97%
|
||||||
|
Huaneng Suzhou Thermal Power Co., Ltd. (“Suzhou Thermal Power”) (iv)
|
PRC
|
held directly
|
RMB
240,000,000
|
Power generation, steam production; mechanical and electrical equipment, pipeline installation, maintenance services; hot water, fly ash sales
|
53.45%
|
100%
|
||||||
|
Huaneng Hainan Power Inc. (“Hainan Power”)
|
PRC
|
held directly
|
RMB
1,326,419,587
|
Construction power plants, new energy development, power plant engineering and equipment maintenance services
|
91.80%
|
91.80%
|
||||||
|
Huaneng Ruijin Power Generation Co., Ltd. (“Ruijin Power Generation”)
|
PRC
|
held directly
|
RMB
536,923,299
|
Construction and operation of power plants and related construction projects
|
100%
|
100%
|
||||||
|
Huaneng Yingcheng Thermal Power Co., Ltd. (“Yingcheng Thermal Power”)
|
PRC
|
held directly
|
RMB
650,000,000
|
Construction and operation of power plants and related construction projects
|
100%
|
100%
|
||||||
|
Huaneng Wenchang Wind Power Generation Co., Ltd.
|
PRC
|
held indirectly
|
RMB
1,000,000
|
Development of wind power project, operation and management of wind power and related projects, production and sales of electricity
|
91.80%
|
100%
|
||||||
The subsidiaries above and the Company are all controlled by Huaneng Group before and after the acquisitions.
|
|
(iii)
|
Subsidiaries acquired from business combinations not under common control
|
|
Name of subsidiary
|
Country of incorporation
|
Type of interest held
|
Registered capital
|
Business nature and scope of operations
|
Percentage of equity interest held
|
|||||||
|
Interest
|
Voting
|
|||||||||||
|
Huaneng Weihai Power Limited Liability Company (“Weihai Power”)
|
PRC
|
held directly
|
RMB
1,822,176,621
|
Power generation
|
60%
|
60%
|
||||||
|
Huaneng Huaiyin Power Limited Company
|
PRC
|
held directly
|
RMB
265,000,000
|
Power generation
|
100%
|
100%
|
||||||
|
Huade County Daditaihong Wind Power Utilization Limited Liability Company
|
PRC
|
held directly
|
RMB
196,400,000
|
Wind power development and utilization
|
100%
|
100%
|
||||||
|
Huaneng Zhanhua Co-generation Limited Liability Company
|
PRC
|
held directly
|
RMB
190,000,000
|
Production and sales of electricity and steam
|
100%
|
100%
|
||||||
|
Shandong Hualu Sea Transportation Limited Company
|
PRC
|
held directly
|
RMB
100,000,000
|
Cargo transportation along domestic coastal areas
|
53%
|
53%
|
||||||
|
Huaneng Qingdao Port Limited Company
|
PRC
|
held directly
|
RMB
219,845,000
|
Loading and conveying warehousing (excluding dangerous goods), conveying, supply of water carriage materials
|
51%
|
51%
|
||||||
F-56
|
9
|
Investments in subsidiaries (Continued)
|
|
|
(iii)
|
Subsidiaries acquired from business combinations not under common control (Continued)
|
|
Name of subsidiary
|
Country of incorporation
|
Type of interest held
|
Registered capital
|
Business nature and scope of operations
|
Percentage of equity interest held
|
|||||||
|
Interest
|
Voting
|
|||||||||||
|
Huaneng (Fujian) Harbour Limited Company
|
PRC
|
held directly
|
RMB
652,200,000
|
Port management, cargo loading, water transport material supply
|
51%
|
51%
|
||||||
|
Fujian Yingda Property Development Limited Company
|
PRC
|
held indirectly
|
RMB
50,000,000
|
Real estate development leasing, real estate agency services, warehousing, loading and conveying
|
51%
|
100%
|
||||||
|
Fujian Xinhuanyuan Industrial Limited Company
|
PRC
|
held indirectly
|
RMB
93,200,000
|
Mineral water production and sale
|
51%
|
100%
|
||||||
|
Huaneng Yunnan Diandong Energy Limited Liability Company (“Diandong Energy”)
|
PRC
|
held directly
|
RMB
3,543,140,000
|
Power generation and coal exploitation
|
100%
|
100%
|
||||||
|
Yunnan Diandong Yuwang Energy Limited Company (“Diandong Yuwang”)
|
PRC
|
held directly
|
RMB
1,626,740,000
|
Power generation and coal exploitation
|
100%
|
100%
|
||||||
|
Huaneng Suzihe Hydropower Development Limited Company
|
PRC
|
held directly
|
RMB
50,000,000
|
Hydropower, aquaculture, agriculture irrigation
|
100%
|
100%
|
||||||
|
Enshi City Mawei Valley Hydropower Development Co., Ltd.
|
PRC
|
held directly
|
RMB
101,080,000
|
Hydro-resource development, hydropower, aquaculture
|
100%
|
100%
|
||||||
|
Kaifeng Xinli Power Generation Co., Ltd.
|
PRC
|
held indirectly
|
RMB
146,920,000
|
Power generation
|
60%
|
100%
|
||||||
|
Huaneng Luoyang Co-generation Limited Liability Company
|
PRC
|
held directly
|
RMB
600,000,000
|
Production and sales of electricity and heat to the electricity and heat networks sales of ancillary products of electricity and heat generation
|
80%
|
80%
|
||||||
|
Huaneng Jinling Combined Cycle Cogeneration Co., Ltd. (“Jinling CCGT”) (v)
|
PRC
|
held directly
|
RMB
356,350,000
|
Power generation
|
51%
|
72%
|
||||||
|
Huaneng Zhumadian Wind Power Generation Co., Ltd.
|
PRC
|
held directly
|
RMB
30,000,000
|
Wind power generation
|
90%
|
90%
|
||||||
|
SinoSing Power
|
Singapore
|
held directly
|
US$
1,476,420,585
|
Investment holding
|
100%
|
100%
|
||||||
|
Tuas Power
|
Singapore
|
held indirectly
|
S$
1,433,550,000
|
Electricity and gas supply and investment holding
|
100%
|
100%
|
||||||
|
Tuas Power Supply Pte Ltd.
|
Singapore
|
held indirectly
|
S$
500,000
|
Power sales
|
100%
|
100%
|
||||||
|
TP Asset Management Pte Ltd.
|
Singapore
|
held indirectly
|
S$2
|
Render of environment engineering services
|
100%
|
100%
|
||||||
|
TPGS Green Energy Pte Ltd.
|
Singapore
|
held indirectly
|
S$
1,000,000
|
Provision of utility services
|
75%
|
75%
|
||||||
|
New Earth Pte Ltd.
|
Singapore
|
held indirectly
|
S$
10,111,841
|
Consultancy in waste recycling
|
100%
|
100%
|
||||||
|
New Earth Singapore Pte Ltd.
|
Singapore
|
held indirectly
|
S$
17,816,050
|
Industrial waste management and recycling
|
100%
|
100%
|
||||||
F-57
|
9
|
Investments in subsidiaries (Continued)
|
Note:
|
|
(i)
|
According to its article of association, the other shareholder who holds the remaining equity interests of Shidongkou Power Company entrusts the Company to exercise all its voting rights in relation to the operation and financial policies of Shidongkou Power Company. Accordingly, the Company has control over Shidongkou Power Company.
|
|
|
(ii)
|
Pursuant to an agreement entered into between the Company and another shareholder, the Company is entrusted to vote the 25% voting rights held by the other shareholder as long as the Company remains as the largest shareholder of Beijing Cogeneration. Thus, the Company has majority voting rights required by the article of association to control the operation and financial policies of Beijing Cogeneration. Accordingly, the Company has control over Beijing Cogeneration.
|
|
|
(iii)
|
According to the voting in concert agreement entered into between the Company and one shareholder with 10% equity interests in Chaohu Power, the shareholder agreed to vote the same in respect of significant financial and operating decisions made by the Company. As a result, the Company has control over Chaohu Power.
|
|
|
(iv)
|
According to the voting in concert agreement entered into between the Company and the other two shareholders in Suzhou Thermal Power, the shareholders agreed to vote the same in respect of significant financial and operating decisions made by the Company. As a result, the Company has control over Suzhou Thermal Power.
|
|
|
(v)
|
According to the voting in concert agreement entered into between the Company and one shareholder with 21% equity interests in Jinling CCGT, the shareholder agreed to vote the same in respect of significant financial and operating decisions made by the Company under the circumstances that its legitimate entitlements are guaranteed. As a result, the Company has control over Jinling CCGT.
|
For the information of material non-controlling interest (“NCI”), please refer to Note 40.
Available-for-sale financial assets include the following:
|
As at 31 December
|
||||||||
|
2015
|
2014
|
|||||||
|
Listed security (Fair value measurement)
|
||||||||
|
257.56 million shares (representing 1.56% shareholding) of Yangtze Power
|
3,492,510 | 2,748,162 | ||||||
|
Unlisted securities (Cost measurement)
|
||||||||
|
10% of Shanxi Xishan Jinxing Energy Co., Ltd.
|
531,274 | 531,274 | ||||||
|
9.09% of Ganlong Double-track Railway Co., Ltd.
|
1,000,000 | 1,000,000 | ||||||
|
Others
|
54,079 | 53,941 | ||||||
|
Subtotal
|
1,585,353 | 1,585,215 | ||||||
|
Total
|
5,077,863 | 4,333,377 | ||||||
There were no impairment provisions on available-for-sale financial assets in 2015, 2014 and 2013.
F-58
|
11
|
Land use rights
|
The movements in the carrying amount of land use rights during the years are as follows:
|
2015
|
2014
|
|||||||
|
Beginning of the year
|
||||||||
|
Cost
|
6,482,189 | 5,900,546 | ||||||
|
Accumulated amortization
|
(1,309,076 | ) | (1,183,356 | ) | ||||
|
Accumulated impairment losses
|
(219,269 | ) | (225,905 | ) | ||||
|
Net book value
|
4,953,844 | 4,491,285 | ||||||
|
Movement:
|
||||||||
|
Business combination (Note 39)
|
2,996,440 | - | ||||||
|
Addition
|
600,693 | 613,225 | ||||||
|
Amortization charge for the year
|
(227,078 | ) | (139,088 | ) | ||||
|
Disposals and transfer out
|
(6,036 | ) | (1,735 | ) | ||||
|
Currency translation differences
|
(4,097 | ) | (9,843 | ) | ||||
|
End of the year
|
8,313,766 | 4,953,844 | ||||||
|
Cost
|
10,059,872 | 6,482,189 | ||||||
|
Accumulated amortization
|
(1,530,972 | ) | (1,309,076 | ) | ||||
|
Accumulated impairment losses
|
(215,134 | ) | (219,269 | ) | ||||
|
Net book value
|
8,313,766 | 4,953,844 | ||||||
All the lands located in the PRC and Singapore are leased from respective governments according to corresponding regulations applied across the countries. The Company and its subsidiaries will renew the leases according to the operation requirements of the Company and its subsidiaries and the related regulations of respective countries.
F-59
|
12
|
Power generation license
|
The movements in the carrying amount of power generation license during the years are as follows:
|
2015
|
2014
|
|||||||
|
Beginning of the year
|
3,720,959 | 3,837,169 | ||||||
|
Movement:
|
||||||||
|
Currency translation differences
|
(41,784 | ) | (116,210 | ) | ||||
|
End of the year
|
3,679,175 | 3,720,959 | ||||||
The Company and its subsidiaries acquired the power generation license in connection with the acquisition of Tuas Power. The power generation license was initially recognized at fair value at the acquisition date. Tuas Power operates power plants in Singapore pursuant to the license granted by the Energy Market Authority for a period of 30 years from 2003 until 2032. The license was extended to 2044 during 2011 with minimal costs and is subject to further renewal. The Company and its subsidiaries expect that the applicable rules and regulations surrounding the renewal can be complied with based on the current market framework. The Company and its subsidiaries assessed the useful life of the power generation license at 31 December 2015 as indefinite and therefore the license is not amortized.
Impairment test of power generation license
Power generation license belongs to and has been assigned to Tuas Power, a CGU. The recoverable amount of the CGU is determined based on value-in-use calculation. Management prepared the impairment model based on budget approved by the Board and various factors, such as inflation, power demand and other factors as well as the terminal value.
Key assumptions used for value-in-use calculation:
Management has assessed that, one of the most sensitive key assumptions is the discount rate which was arrived at based on weighted average cost of capital. The discount rate applied in determining the recoverable amounts of the CGU was 7.62% (31 December 2014: 7.29%). An absolute increase in the discount rate of 0.5% (31 December 2014: 0.5%) would result in approximately RMB1,704 million (31 December 2014: RMB1,540 million) decrease in the recoverable amount of the CGU.
Other key assumptions include projection of its business performance based on estimation of gross margin from electricity sold, volume of electricity sold and other operating expenses, which are largely based on a combination of past performance of the CGU, its expectation of market developments and consistency with forecasts included in industry reports. On average, the growth rates of 3.0% was used in consideration of future expansion plans and new development projects as part of the long-term strategy. Cash flows beyond the terminal year was extrapolated using a growth rate of 2%.
Based on the assessments, no impairment was provided for the power generation license.
F-60
|
13
|
Mining rights
|
The movements in the carrying amount of mining rights during the years are as follow:
|
2015
|
2014
|
|||||||
|
Beginning of the year
|
||||||||
|
Cost
|
1,922,655 | 1,922,655 | ||||||
|
Movement:
|
||||||||
|
Addition
|
483,912 | - | ||||||
|
Impairment charge for the year
|
(760,296 | ) | - | |||||
|
End of the year
|
1,646,271 | 1,922,655 | ||||||
|
Cost
|
2,406,567 | 1,922,655 | ||||||
|
Accumulated impairment losses
|
(760,296 | ) | - | |||||
|
Net book value
|
1,646,271 | 1,922,655 | ||||||
In 2015, due to the decrease of coal market price, impairment loss for mining rights of approximately RMB760 million have been recognized for two subsidiaries of the Company. The discount rate applied in determining the recoverable amounts of the mining rights in the value in use model were 10.46% and 10.62%.
|
14
|
Derivative financial instruments
|
Details of derivative financial instruments are as follows:
|
As at 31 December
|
||||||||
|
2015
|
2014
|
|||||||
|
Derivative financial assets
|
||||||||
|
-Hedging instruments for cash flow hedge (fuel swap contracts)
|
1 | 265 | ||||||
|
-Hedging instruments for cash flow hedge (exchange forward contracts)
|
140,977 | 116,712 | ||||||
|
-Hedging instruments for cash flow hedge (interest rate swap contracts)
|
2,691 | - | ||||||
|
-Financial instruments at fair value through profit or loss (fuel swap contracts)
|
39,894 | 184,756 | ||||||
|
-Financial instruments at fair value through profit or loss (exchange forward contracts)
|
949 | - | ||||||
|
Total
|
184,512 | 301,733 | ||||||
|
Less: non-current portion
|
||||||||
|
-Hedging instruments for cash flow hedge (fuel swap contracts)
|
- | 133 | ||||||
|
-Hedging instruments for cash flow hedge (exchange forward contracts)
|
42,353 | 40,465 | ||||||
|
-Hedging instruments for cash flow hedge (interest rate swap contracts)
|
2,691 | - | ||||||
|
Total non-current portion
|
45,044 | 40,598 | ||||||
|
Current portion
|
139,468 | 261,135 | ||||||
F-61
|
14
|
Derivative financial instruments (Continued)
|
|
As at 31 December
|
||||||||
|
2015
|
2014
|
|||||||
|
Derivative financial liabilities
|
||||||||
|
-Hedging instruments for cash flow hedge (fuel swap contracts)
|
1,157,677 | 1,009,369 | ||||||
|
-Hedging instruments for cash flow hedge (exchange forward contracts)
|
2,297 | 11 | ||||||
|
-Hedging instruments for cash flow hedge (interest rate swap contract)
|
121,576 | 322,871 | ||||||
|
-Financial instruments at fair value through profit or loss (fuel swap contracts)
|
23,047 | 149,989 | ||||||
|
-Financial instruments at fair value through profit or loss (exchange forward contracts)
|
344 | - | ||||||
|
Total
|
1,304,941 | 1,482,240 | ||||||
|
Less: non-current portion
|
||||||||
|
-Hedging instruments for cash flow hedge (fuel swap contracts)
|
307,573 | 326,634 | ||||||
|
-Hedging instruments for cash flow hedge (exchange forward contracts)
|
940 | 8 | ||||||
|
-Hedging instruments for cash flow hedge (interest rate swap contract)
|
121,576 | 322,871 | ||||||
|
Total non-current portion
|
430,089 | 649,513 | ||||||
|
Current portion
|
874,852 | 832,727 | ||||||
For the years ended 31 December 2015, 2014 and 2013, no material ineffective portion was recognized in the profit or loss arising from cash flow hedges.
The Company uses an interest rate swap contract to hedge its interest rate risk against one of its variable rate loans. The notional principal amount of the outstanding interest rate swap contract at 31 December 2015 was US$240 million (RMB equivalents of RMB1,558.46 million) (2014: US$278 million (RMB equivalents of RMB1,701.08 million)). Through this arrangement, the Company pays an annual fixed interest of 4.4% while the original annual floating interest expense (6-month LIBOR+1%) attached in the loan is offset by the receivable leg of the interest rate swap. Such a swap is settled on a quarterly basis from September 2009 to September 2019.
TPG uses exchange forward contracts to hedge its foreign exchange risk arising from highly probable forecast purchase transactions. It also uses fuel oil swap contracts to hedge its fuel price risk arising from highly probable forecast purchases of fuel purchases.
TPG also uses various interest rate swap contracts to hedge floating semi-annual interest payments on borrowings with maturity dates up to 2020. The notional principal amount of these outstanding interest rate swap contracts at 31 December 2015 was S$1,399.8 million (RMB equivalents of RMB6,421.8 million) (2014: S$1,440.9 million (RMB equivalents of RMB6,685.2 million)). Through these arrangements, TPG swaps original floating interest (6-month SOR) to annual fixed interest determined by individual swap contracts. Such swap contracts are settled semi-annually from September 2011 to March 2020. As at 31 December 2015, these interest rate swap contracts are carried on the consolidated statements of financial position as financial asset of RMB 2.69 million and financial liability of RMB41.12 million (2014: financial liability of RMB223.71 million).
F-62
|
14
|
Derivative financial instruments (Continued)
|
The analysis of contractual cash inflows/(outflows) of major derivative financial instruments are as follows:
|
Cash flows
|
||||||||||||||||||||
|
Carrying amounts
|
Contractual cash flows
|
Within 1 year
|
Between 1 and 5 years
|
After 5 years
|
||||||||||||||||
|
As at 31 December 2015
|
||||||||||||||||||||
|
Derivative financial assets
|
||||||||||||||||||||
|
Fuel derivatives used for hedging (net settlement)
|
1 | 1 | 1 | - | - | |||||||||||||||
|
Forward exchange contracts used for hedging
|
||||||||||||||||||||
|
- inflows
|
2,223,114 | 1,604,161 | 618,953 | - | ||||||||||||||||
|
- outflows
|
(2,093,389 | ) | (1,510,919 | ) | (582,470 | ) | - | |||||||||||||
| 140,977 | 129,725 | 93,242 | 36,483 | - | ||||||||||||||||
|
Net-settled interest rate swaps used for hedging - net cash inflows/(outflows)
|
2,691 | (16,121 | ) | (7,241 | ) | (8,880 | ) | - | ||||||||||||
|
Fuel derivatives that do not qualify as hedges (net settlement)
|
39,894 | 39,894 | 39,894 | - | - | |||||||||||||||
|
Foreign exchange contracts that do not qualify as hedges (net settlement)
|
949 | 691 | 691 | - | - | |||||||||||||||
|
Derivative financial liabilities
|
||||||||||||||||||||
|
Fuel derivatives used for hedging (net settlement)
|
1,157,677 | (1,157,677 | ) | (850,104 | ) | (307,573 | ) | - | ||||||||||||
|
Forward exchange contracts used for hedging
|
||||||||||||||||||||
|
- inflows
|
539,730 | 429,306 | 110,424 | - | ||||||||||||||||
|
- outflows
|
(544,985 | ) | (432,193 | ) | (112,792 | ) | - | |||||||||||||
| 2,297 | (5,255 | ) | (2,887 | ) | (2,368 | ) | - | |||||||||||||
|
Net-settled interest rate swaps used for hedging
|
||||||||||||||||||||
|
- net cash inflows/(outflows)
|
121,576 | (190,867 | ) | (84,753 | ) | (106,114 | ) | - | ||||||||||||
|
Fuel derivatives that do not qualify as hedges (net settlement)
|
23,047 | (23,047 | ) | (23,047 | ) | - | - | |||||||||||||
|
Foreign exchange contracts that do not qualify as hedges (net settlement)
|
344 | (413 | ) | (413 | ) | - | - | |||||||||||||
|
As at 31 December 2014
|
||||||||||||||||||||
|
Derivative financial assets
|
||||||||||||||||||||
|
Fuel derivatives used for hedging (net settlement)
|
265 | 265 | 133 | 132 | - | |||||||||||||||
|
Forward exchange contracts used for hedging
|
||||||||||||||||||||
|
- inflows
|
2,827,425 | 1,969,596 | 857,829 | - | ||||||||||||||||
|
- outflows
|
(2,714,818 | ) | (1,895,789 | ) | (819,029 | ) | - | |||||||||||||
| 116,712 | 112,607 | 73,807 | 38,800 | - | ||||||||||||||||
|
Fuel derivatives that do not qualify as hedges (net settlement)
|
184,756 | 184,756 | 184,756 | - | - | |||||||||||||||
F-63
|
14
|
Derivative financial instruments (Continued)
|
|
Cash flows
|
||||||||||||||||||||
|
Carrying amounts
|
Contractual cash flows
|
Within 1 year
|
Between 1 and 5 years
|
After 5 years
|
||||||||||||||||
|
Derivative financial liabilities
|
||||||||||||||||||||
|
Fuel derivatives used for hedging (net settlement)
|
1,009,369 | (1,009,369 | ) | (682,735 | ) | (326,634 | ) | - | ||||||||||||
|
Forward exchange contracts used for hedging
|
||||||||||||||||||||
|
- inflows
|
552,840 | 538,402 | 14,438 | - | ||||||||||||||||
|
- outflows
|
(553,505 | ) | (539,020 | ) | (14,485 | ) | - | |||||||||||||
| 11 | (665 | ) | (618 | ) | (47 | ) | - | |||||||||||||
|
Net-settled interest rate swaps used for hedging
|
||||||||||||||||||||
|
- net cash inflows/(outflows)
|
322,871 | (508,178 | ) | (175,843 | ) | (320,678 | ) | (11,657 | ) | |||||||||||
|
Fuel derivatives that do not qualify as hedges (net settlement)
|
149,989 | (149,989 | ) | (149,989 | ) | - | - | |||||||||||||
|
15
|
Goodwill
|
The movements of goodwill during the years are as follows:
|
2015
|
2014
|
|||||||
|
Beginning of the year
|
||||||||
|
Cost
|
13,865,890 | 14,273,513 | ||||||
|
Accumulated impairment losses
|
(2,140,335 | ) | (1,515,482 | ) | ||||
|
Net book value
|
11,725,555 | 12,758,031 | ||||||
|
Movement:
|
||||||||
|
Business combination (Note 39)
|
1,169,966 | - | ||||||
|
Impairment charge for the year
|
(1,105,649 | ) | (641,061 | ) | ||||
|
Disposals
|
- | (78,002 | ) | |||||
|
Currency translation differences
|
(112,690 | ) | (313,413 | ) | ||||
|
End of the year
|
11,677,182 | 11,725,555 | ||||||
|
Cost
|
14,919,930 | 13,865,890 | ||||||
|
Accumulated impairment losses
|
(3,242,748 | ) | (2,140,335 | ) | ||||
|
Net book value
|
11,677,182 | 11,725,555 | ||||||
F-64
|
15
|
Goodwill (Continued)
|
Impairment tests for goodwill
Goodwill is allocated to the CGUs of the Company and its subsidiaries.
The carrying amounts of major goodwill allocated to individual CGUs are as follows:
|
2015
|
2014
|
|||||||
|
PRC Power segment:
|
||||||||
|
Hainan Power
|
506,336 | - | ||||||
|
Wuhan Power
|
518,484 | - | ||||||
|
Yueyang Power Company
|
100,907 | 100,907 | ||||||
|
Beijing Cogeneration
|
95,088 | 95,088 | ||||||
|
Yangliuqing Cogeneration
|
151,459 | 151,459 | ||||||
|
Diandong Energy
|
- | 1,105,649 | ||||||
|
Singapore segment:
|
||||||||
|
Tuas Power
|
9,922,584 | 10,035,274 | ||||||
The recoverable amount of a CGU is determined based on value-in-use calculations. For domestic CGUs, these calculations use cash flow projections based on management’s financial budgets covering periods of no more than five years. The Company expects cash flows beyond such periods will be similar to that of the respective final forecast years on existing production capacity.
For the goodwill allocated to Tuas Power, management has based their assessment of recoverable amount on value-in-use calculations. Management prepared the impairment model based on budget approved and various factors, such as inflation, power demand and other factors as well as the terminal value. On average, the growth rates of 3.0% was used in consideration of future expansion plans and new development projects as part of the long-term strategy. Cash flows beyond the terminal year was extrapolated using a growth rate of 2.0%.
Discount rates used for value-in-use calculations:
|
PRC Power segment
|
8.31% ~ 9.02%
|
|
|
Singapore segment
|
7.62%
|
Key assumptions used for value-in-use calculations:
Key assumptions applied in the impairment tests include the expected tariff rates, demands of electricity in specific regions where these power plants are located, fuel cost and the expected output schedule of coal mine under construction and selling price of coal. Management determined these key assumptions based on past performance and its expectations on market development. The discount rates used reflect specific risks relating to individual CGUs. Management believes that any reasonably possible change in any of these key assumptions on which recoverable amounts of individual CGUs are based may cause carrying amounts of individual CGUs to exceed their recoverable amounts. Please refer to Note 4 and 12 for details of respective sensitivity analysis on domestic and oversea CGU impairment testing.
F-65
|
15
|
Goodwill (Continued)
|
In 2015, due to continuous operating loss of the power plant assets as a result of oversupply of local power market and intense competition which led to lower utilization hours and tariff, and the effect of deteriorating coal market price on the coal assets under construction, the goodwill arising from the acquisition of Diandong Energy was fully impaired based on the impairment testing result. The above mentioned goodwill impairment provided in 2015 amounted to approximately RMB1,106 million in total. For Singapore segment, the decrease of goodwill in respect of Tuas Power was due to currency translation differences.
In 2014, due to the delay in coal mine construction schedule and continuous lower utilization of the power plants in Yunnan province, the goodwill arising from the acquisition of Diandong Energy and Diandong Yuwang were impaired based on the impairment testing result. The above mentioned goodwill impairment provided in 2014 amounted to approximately RMB641 million in total. For Singapore segment, the decrease of goodwill in respect of Tuas Power was due to currency translation differences.
In 2013, due to the external environment deterioration in respect of shipping market, the utilization of port was below expectation and the price was at a lower level. Based on the impairment testing results, the goodwill arising from the acquisition of Luoyuanwan Harbor, Qingdao Port and Hualu Sea Transportation were fully impaired. Besides, the goodwill arising from the acquisition of Enshi Hydropower was assessed as fully impaired due to the fact that the capital expenditure of the power plant was higher than the original expectation. The above mentioned goodwill impairment provided in 2013 approximately amounted to RMB586 million. For Singapore segment, the goodwill in respect of Tuas Power was impaired RMB392 million in 2013 as a result of the power market change in Singapore.
|
16
|
Other non-current assets
|
Details of other non-current assets are as follows:
|
As at 31 December
|
||||||||
|
2015
|
2014
|
|||||||
|
Intangible assets*
|
451,176 | 452,109 | ||||||
|
Deferred employee housing subsidies
|
3,907 | 4,847 | ||||||
|
Prepayments for switchhouse and metering station
|
9,257 | 10,142 | ||||||
|
Prepaid connection fees
|
111,513 | 118,941 | ||||||
|
Prepaid territorial water use right**
|
763,905 | 775,493 | ||||||
|
Finance lease receivables
|
552,401 | 525,353 | ||||||
|
VAT recoverable
|
1,618,894 | 981,980 | ||||||
|
Others
|
867,944 | 850,390 | ||||||
|
Total
|
4,378,997 | 3,719,255 | ||||||
|
|
*
|
The intangible assets primarily consist of software, patented technologies and etc. In 2015, there is no impairment provided for the intangible assets (2014: RMB nil).
|
|
|
**
|
The prepaid territorial water use right is amortized over the contractual period of 50 years. As at 31 December 2015, territorial water use right with net book value amounting to RMB78.38 million (2014: RMB80.36 million) was secured to a bank as collateral against a long-term loan of RMB18 million (2014: RMB37 million) (Note 23).
|
F-66
|
17
|
Inventories
|
Inventories comprised:
|
As at 31 December
|
||||||||
|
2015
|
2014
|
|||||||
|
Fuel (coal and oil) for power generation
|
3,997,910 | 5,228,867 | ||||||
|
Material and supplies
|
1,587,211 | 1,636,865 | ||||||
| 5,585,121 | 6,865,732 | |||||||
|
Less: provision for inventory obsolescence
|
162,389 | 163,458 | ||||||
|
Total
|
5,422,732 | 6,702,274 | ||||||
Movements of provision for inventory obsolescence during the years are analyzed as follows:
|
2015
|
2014
|
2013
|
||||||||||
|
Beginning of the year
|
(163,458 | ) | (170,296 | ) | (182,352 | ) | ||||||
|
Provision
|
(2,867 | ) | (878 | ) | (2,336 | ) | ||||||
|
Reversal
|
1,039 | 3,525 | 3,160 | |||||||||
|
Write-offs
|
- | 632 | 3,551 | |||||||||
|
Currency translation differences
|
2,897 | 3,559 | 7,681 | |||||||||
|
End of the year
|
(162,389 | ) | (163,458 | ) | (170,296 | ) | ||||||
F-67
|
18
|
Other receivables and assets
|
Other receivables and assets comprised the following:
|
As at 31 December
|
||||||||
|
2015
|
2014
|
|||||||
|
Prepayments for inventories
|
143,446 | 279,128 | ||||||
|
Prepayments for pre-construction cost
|
735,975 | 577,644 | ||||||
|
Prepaid income tax
|
2,393 | 20,499 | ||||||
|
Prepayments for capacity quota
|
303,399 | 303,399 | ||||||
|
Others
|
102,854 | 144,040 | ||||||
|
Total prepayments
|
1,288,067 | 1,324,710 | ||||||
|
Staff advances
|
15,692 | 17,648 | ||||||
|
Dividends receivable
|
305,000 | 188,958 | ||||||
|
Financial lease receivables
|
19,419 | 14,767 | ||||||
|
Interest receivables
|
175 | 350 | ||||||
|
Others
|
728,781 | 622,310 | ||||||
|
Subtotal other receivables
|
1,069,067 | 844,033 | ||||||
|
Less: provision for doubtful accounts
|
27,957 | 29,644 | ||||||
|
Total other receivables, net
|
1,041,110 | 814,389 | ||||||
|
VAT recoverable
|
1,678,812 | 1,272,621 | ||||||
|
Designated loan to a joint venture
|
80,000 | - | ||||||
|
Gross total
|
4,115,946 | 3,441,364 | ||||||
|
Net total
|
4,087,989 | 3,411,720 | ||||||
Please refer to Note 35 for details of other receivables and assets due from the related parties.
The gross amounts of other receivables are denominated in the following currencies:
|
As at 31 December
|
||||||||
|
2015
|
2014
|
|||||||
|
RMB
|
1,005,399 | 781,426 | ||||||
|
S$ (RMB equivalent)
|
60,596 | 43,652 | ||||||
|
US$ (RMB equivalent)
|
3,072 | 18,955 | ||||||
|
Total
|
1,069,067 | 844,033 | ||||||
F-68
|
18
|
Other receivables and assets (Continued)
|
Movements of provision for doubtful accounts during the years are analyzed as follows:
|
2015
|
2014
|
2013
|
||||||||||
|
Beginning of the year
|
(29,644 | ) | (30,673 | ) | (28,641 | ) | ||||||
|
Reclassification to assets held for sale
|
- | - | 51 | |||||||||
|
Provision
|
(9 | ) | - | (2,096 | ) | |||||||
|
Reversal
|
1,696 | 1,029 | 13 | |||||||||
|
End of the year
|
(27,957 | ) | (29,644 | ) | (30,673 | ) | ||||||
As at 31 December 2015, there was no indication of impairment relating to other receivables which were not past due and no material provision was made (2014: nil).
As at 31 December 2015, other receivables of RMB168 million (2014: RMB101 million) were past due but not impaired. These amounts mainly represent funds deposited in a government agency and are fully recoverable. The ageing analysis of these other receivables was as follows:
|
As at 31 December
|
||||||||
|
2015
|
2014
|
|||||||
|
Within 1 year
|
98,649 | 32,330 | ||||||
|
Between 1 to 2 years
|
1,259 | 593 | ||||||
|
Between 2 to 3 years
|
780 | 236 | ||||||
|
Over 3 years
|
66,968 | 68,056 | ||||||
|
Total
|
167,656 | 101,215 | ||||||
As at 31 December 2015, other receivables of RMB35 million which were past due (2014: RMB35 million) were impaired and a provision of RMB28 million (2014: RMB30 million) has been provided against the receivables. The individually impaired receivables have been long outstanding without any repayment agreements in place or possibility of renegotiation. It was assessed that a substantial portion of the receivables is not expected to be recovered. The ageing of these other receivables was as follows:
|
As at 31 December
|
||||||||
|
2015
|
2014
|
|||||||
|
Within 1 year
|
1,566 | 542 | ||||||
|
Between 1 to 2 years
|
93 | - | ||||||
|
Between 2 to 3 years
|
3 | - | ||||||
|
Over 3 years
|
33,792 | 34,540 | ||||||
|
Total
|
35,454 | 35,082 | ||||||
F-69
|
19
|
Accounts receivable
|
Accounts receivable comprised the following:
|
As at 31 December
|
||||||||
|
2015
|
2014
|
|||||||
|
Accounts receivable
|
14,401,665 | 14,087,378 | ||||||
|
Notes receivable
|
1,977,790 | 806,394 | ||||||
| 16,379,455 | 14,893,772 | |||||||
|
Less: provision for doubtful accounts
|
2,054 | 11,809 | ||||||
|
Total
|
16,377,401 | 14,881,963 | ||||||
The gross amounts of account receivables are denominated in the following currencies:
|
As at 31 December
|
||||||||
|
2015
|
2014
|
|||||||
|
RMB
|
15,639,091 | 13,875,489 | ||||||
|
S$ (RMB equivalent)
|
735,300 | 1,014,881 | ||||||
|
US$ (RMB equivalent)
|
5,064 | 3,402 | ||||||
|
Total
|
16,379,455 | 14,893,772 | ||||||
The Company and its subsidiaries usually grant about one month’s credit period to local power grid customers from the end of the month in which the sales are made, except for SinoSing Power which provides credit period that ranges from 5 to 60 days from the dates of billings. Certain accounts receivables of Singapore subsidiaries are backed by bankers’ guarantees and/or deposits from customers. It is not practicable to determine the fair value of the collaterals that correspond to these accounts receivable.
As at 31 December 2015, no accounts receivable was secured to banks as collateral against loans (2014: accounts receivable approximately RMB3,592 million were secured to banks as collateral against short-term loans of RMB3,150 million ).
For the collateral of notes receivable, please refer to Note 26 for details.
Movements of provision for doubtful accounts during the years are analyzed as follows:
|
2015
|
2014
|
2013
|
||||||||||
|
Beginning of the year
|
(11,809 | ) | (6,123 | ) | (11,419 | ) | ||||||
|
Provision
|
(60 | ) | (8,413 | ) | (24 | ) | ||||||
|
Reversal
|
1,833 | 2,807 | 4,717 | |||||||||
|
Write-off
|
- | - | 50 | |||||||||
|
Transfer from a subsidiary to a joint venture
|
8,126 | - | - | |||||||||
|
Reclassification to assets held for sale
|
- | - | 298 | |||||||||
|
Currency translation differences
|
(144 | ) | (80 | ) | 255 | |||||||
|
End of the year
|
(2,054 | ) | (11,809 | ) | (6,123 | ) | ||||||
F-70
|
19
|
Accounts receivable (Continued)
|
Ageing analysis of accounts receivable was as follows:
|
As at 31 December
|
||||||||
|
2015
|
2014
|
|||||||
|
Within 1 year
|
16,129,748 | 14,693,174 | ||||||
|
Between 1 to 2 years
|
225,253 | 123,700 | ||||||
|
Between 2 to 3 years
|
1,915 | 48,021 | ||||||
|
Over 3 years
|
22,539 | 28,877 | ||||||
|
Total
|
16,379,455 | 14,893,772 | ||||||
As at 31 December 2015, the maturity period of the notes receivable ranged from 1 to 6 months (2014: from 1 to 6 months).
As at 31 December 2015, and 2014, there was no indication of impairment relating to accounts receivable which were not past due and no provision was made.
As at 31 December 2015, accounts receivable of RMB2.05 million (2014: RMB11.81 million) were impaired. The ageing of these accounts receivable was as follows:
|
As at 31 December
|
||||||||
|
2015
|
2014
|
|||||||
|
Less than 1 year
|
- | 274 | ||||||
|
Between 2 to 3 years
|
- | 8,126 | ||||||
|
Over 3 years
|
2,054 | 3,409 | ||||||
|
Total
|
2,054 | 11,809 | ||||||
Receivables that were past due but not impaired relate to a number of independent customers that have a good track record with the Company and its subsidiaries. Based on past experience, management believes that no impairment allowance is necessary in respect of these balances as there has not been a significant change in credit quality and the balances are still considered fully recoverable.
F-71
|
20
|
Share capital
|
|
2015
|
2014
|
|||||||||||||||
|
Number of Shares
|
Share capital
|
Number of Shares
|
Share capital
|
|||||||||||||
|
RMB ’000
|
RMB ’000
|
|||||||||||||||
|
As at 1 January
|
||||||||||||||||
|
A shares
|
10,500,000,000 | 10,500,000 | 10,500,000,000 | 10,500,000 | ||||||||||||
|
Overseas listed foreign shares
|
3,920,383,440 | 3,920,383 | 3,555,383,440 | 3,555,383 | ||||||||||||
|
Subtotal
|
14,420,383,440 | 14,420,383 | 14,055,383,440 | 14,055,383 | ||||||||||||
|
Issuance of new H shares
|
780,000,000 | 780,000 | 365,000,000 | 365,000 | ||||||||||||
|
As at 31 December
|
||||||||||||||||
|
A shares
|
10,500,000,000 | 10,500,000 | 10,500,000,000 | 10,500,000 | ||||||||||||
|
Overseas listed foreign shares
|
4,700,383,440 | 4,700,383 | 3,920,383,440 | 3,920,383 | ||||||||||||
|
Total
|
15,200,383,440 | 15,200,383 | 14,420,383,440 | 14,420,383 | ||||||||||||
In November 2015, the Company issued 780,000,000 H shares with a par value of RMB1.00, at a price of HK$7.32 per H share. Net proceeds from the issuance amounted to HK$5.69 billion after deducting issuance costs from gross proceeds of HK$5.71 billion. The difference between the net proceeds and the addition to share capital is recorded in capital surplus.
All shares issued by the Company were fully paid. The holders of domestic shares and overseas listed foreign shares, in all material aspects, are entitled to the same economic and voting rights. None of the issued A shares are within the lock-up period as at 31 December 2014 and 2015.
|
21
|
Surplus reserves
|
|
As at
1 January 2015
|
Transfer to surplus reserve
|
As at
31 December 2015
|
||||||||||
|
Surplus reserves
|
7,196,349 | 943,681 | 8,140,030 | |||||||||
According to the Company Law of the PRC, the Company’s articles of association and board resolutions, the Company appropriates 10% of each year’s net profit under PRC GAAP to the statutory surplus reserve. The Company has the option to cease provision for such reserve when it reaches 50% of the registered share capital. Upon the approval from relevant authorities, this reserve can be used to make up any losses incurred or to increase share capital. Except for offsetting against losses, this reserve cannot fall below 25% of the registered share capital after being used to increase share capital.
According to the Company’s articles of association and board resolutions on 24 March 2015, the Company intended to appropriate 10% of last year’s net profit attributable to the Company’s shareholders under PRC GAAP to the statutory surplus reserve, amounting to RMB1,055 million, in which RMB944 million being the excess of the consequent surplus reserve balance over 50% of the registered share capital was subject to the approval of the shareholders. Upon the approval of the shareholders at the annual general meeting on 25 June 2015 the excess amount was transferred to surplus reserve in 2015.
Appropriation of discretionary surplus reserve is proposed by the Board of Directors, and approved by the general meeting of shareholders. This reserve can be used to make up any losses incurred in prior years or to increase the share capital after obtaining relevant approvals. For the years ended 31 December 2014 and 2015, no provision was made to the discretionary surplus reserve.
F-72
|
21
|
Surplus reserves (Continued)
|
According to the articles of association, in distributing the Company’s profits after tax for the relevant accounting year, the lower of amounts determined in accordance with PRC GAAP and IFRS shall be adopted. As at 31 December 2015, in accordance with PRC GAAP and IFRS, the balance of retained earnings for the Company and its subsidiaries amounted to approximately RMB37.606 billion and RMB37.314 billion; respectively; and the balance of retained earnings for the Company amounted RMB30.156 billion and RMB27.249 billion, respectively.
|
22
|
Dividends
|
On 22 March 2016, the Board of Directors proposed a cash dividend of RMB0.47 per share, totaling approximately RMB7,144 million. This proposal is subject to the approval of the shareholders at the annual general meeting.
On 25 June 2015, upon the approval from the annual general meeting of the shareholders, the Company declared 2014 final dividend of RMB0.38 (2013: RMB0.38) per ordinary share, totaling approximately RMB5,480 million (2013: RMB5,341 million).
|
23
|
Long-term loans
|
Long-term loans comprised the following:
|
As at 31 December
|
||||||||
|
2015
|
2014
|
|||||||
|
Loans from Huaneng Group and its subsidiaries (a)
|
2,696,225 | 1,057,485 | ||||||
|
Bank loans and other loans (b)
|
75,683,003 | 63,973,406 | ||||||
| 78,379,228 | 65,030,891 | |||||||
|
Less: Current portion of long-term loans
|
12,351,205 | 7,392,433 | ||||||
|
Total
|
66,028,023 | 57,638,458 | ||||||
|
|
(a)
|
Loans from Huaneng Group and its subsidiaries
|
Details of loans from Huaneng Group and its subsidiaries are as follows:
|
As at 31 December 2015
|
||||||||||||||||||||
|
Original currency
|
RMB equivalent
|
Less: Current portion
|
Non-current portion
|
Annual interest rate
|
||||||||||||||||
| ’000 | ||||||||||||||||||||
|
Loans from Huaneng Group
|
||||||||||||||||||||
|
Unsecured
|
||||||||||||||||||||
|
RMB
|
||||||||||||||||||||
|
- Variable rate
|
665,015 | 665,015 | 665,015 | - | 4.28%-5.54 | % | ||||||||||||||
|
Loans from HIPDC
|
||||||||||||||||||||
|
Unsecured
|
||||||||||||||||||||
|
RMB
|
||||||||||||||||||||
|
- Fixed rate
|
400,000 | 400,000 | 400,000 | - | 5.30 | % | ||||||||||||||
|
- Variable rate
|
1,300,210 | 1,300,210 | 1,300,210 | - |
4.28%~5.30
|
% | ||||||||||||||
|
Loans from Huaneng Finance
|
||||||||||||||||||||
|
Unsecured
|
||||||||||||||||||||
|
RMB
|
||||||||||||||||||||
|
- Variable rate
|
331,000 | 331,000 | 72,000 | 259,000 |
4.41%~5.84
|
% | ||||||||||||||
|
Total
|
2,696,225 | 2,437,225 | 259,000 | |||||||||||||||||
F-73
|
23
|
Long-term loans (Continued)
|
|
|
(a)
|
Loans from Huaneng Group and its subsidiaries (Continued)
|
|
As at 31 December 2014
|
||||||||||||||||||||
|
Original currency
|
RMB equivalent
|
Less: Current portion
|
Non-current portion
|
Annual interest rate
|
||||||||||||||||
| ’000 | ||||||||||||||||||||
|
Loans from Huaneng Group
|
||||||||||||||||||||
|
Unsecured
|
||||||||||||||||||||
|
RMB
|
||||||||||||||||||||
|
- Variable rate
|
640,485 | 640,485 | - | 640,485 | 5.40 | % | ||||||||||||||
|
Loans from Huaneng Finance
|
||||||||||||||||||||
|
Unsecured
|
||||||||||||||||||||
|
RMB
|
||||||||||||||||||||
|
- Fixed rate
|
417,000 | 417,000 | 417,000 | - | 5.54 | % | ||||||||||||||
|
Total
|
1,057,485 | 417,000 | 640,485 | |||||||||||||||||
|
|
(b)
|
Bank loans and other loans
|
Details of bank loans and other loans are as follows:
|
As at 31 December 2015
|
||||||||||||||||||||
|
Original currency
|
RMB equivalent
|
Less: Current portion
|
Non-current portion
|
Annual interest rate
|
||||||||||||||||
| ’000 | ||||||||||||||||||||
|
Secured
|
||||||||||||||||||||
|
RMB
|
||||||||||||||||||||
|
- Fixed rate
|
9,389,630 | 9,389,630 | 1,103,320 | 8,286,310 | 4.41%-6.15 | % | ||||||||||||||
|
- Variable rate
|
253,000 | 253,000 | 25,300 | 227,700 | 4.90 | % | ||||||||||||||
|
Unsecured
|
||||||||||||||||||||
|
RMB
|
||||||||||||||||||||
|
- Fixed rate
|
18,727,985 | 18,727,985 | 2,201,076 | 16,526,909 | 2.90%-6.55 | % | ||||||||||||||
|
- Variable rate
|
31,374,161 | 31,374,161 | 5,774,825 | 25,599,336 | 3.95%-6.55 | % | ||||||||||||||
|
US$
|
||||||||||||||||||||
|
- Variable rate
|
472,800 | 3,070,174 | 388,925 | 2,681,249 | 1.38 | % | ||||||||||||||
|
S$
|
||||||||||||||||||||
|
- Variable rate
|
2,696,925 | 12,372,141 | 348,296 | 12,023,845 |
1.98%~4.25
|
% | ||||||||||||||
|
€
|
||||||||||||||||||||
|
- Fixed rate
|
48,530 | 344,331 | 66,294 | 278,037 | 2.00%-2.15 | % | ||||||||||||||
|
JPY
|
||||||||||||||||||||
|
-Fixed rate
|
2,812,263 | 151,581 | 5,944 | 145,637 | 0.75 | % | ||||||||||||||
|
Total
|
75,683,003 | 9,913,980 | 65,769,023 | |||||||||||||||||
|
As at 31 December 2014
|
||||||||||||||||||||
|
Original currency
|
RMB equivalent
|
Less: Current portion
|
Non-current portion
|
Annual interest rate
|
||||||||||||||||
| ’000 | ||||||||||||||||||||
|
Secured
|
||||||||||||||||||||
|
RMB
|
||||||||||||||||||||
|
- Fixed rate
|
10,504,895 | 10,504,895 | 1,059,994 | 9,444,901 | 5.54%-6.55 | % | ||||||||||||||
|
- Variable rate
|
100,000 | 100,000 | - | 100,000 | 6.15 | % | ||||||||||||||
|
Unsecured
|
||||||||||||||||||||
|
RMB
|
||||||||||||||||||||
|
- Fixed rate
|
26,194,209 | 26,194,209 | 4,985,946 | 21,208,263 | 4.20%-6.55 | % | ||||||||||||||
|
- Variable rate
|
10,556,570 | 10,556,570 | 82,980 | 10,473,590 | 5.35%-6.55 | % | ||||||||||||||
|
US$
|
||||||||||||||||||||
|
- Fixed rate
|
2,666 | 16,316 | 16,316 | - | 6.36 | % | ||||||||||||||
|
- Variable rate
|
539,004 | 3,298,164 | 408,284 | 2,889,880 | 0.81%-1.74 | % | ||||||||||||||
|
S$
|
||||||||||||||||||||
|
- Variable rate
|
2,774,327 | 12,871,770 | 352,252 | 12,519,518 | 1.98%-4.25 | % | ||||||||||||||
|
€
|
||||||||||||||||||||
|
- Fixed rate
|
57,874 | 431,482 | 69,661 | 361,821 | 2.00%-2.15 | % | ||||||||||||||
|
Total
|
63,973,406 | 6,975,433 | 56,997,973 | |||||||||||||||||
F-74
|
23
|
Long-term loans (Continued)
|
|
|
(b)
|
Bank loans and other loans (Continued)
|
As at 31 December 2015, a long-term loan of RMB18 million (31 December 2014: RMB37 million) is secured by territorial water use right with net book value amounting to RMB78.38 million (31 December 2014: RMB80.36 million).
As at 31 December 2015, a long-term loan of RMB67 million (31 December 2014: RMB95 million) is secured by certain property, plant and equipment with net book value amounting to approximately RMB150 million (31 December 2014: RMB194 million).
As at 31 December 2015, long-term loans of approximately RMB9,558 million were secured by future electricity revenue (31 December 2014: RMB10,404 million).
As at 31 December 2014, a long-term loan of RMB69 million was secured by a subsidiary’s port facility with net book value amounting to RMB522 million. The subsidiary was transferred to joint venture in 2015.
The maturity of long-term loans is as follows:
|
Loans from Huaneng Group and its subsidiaries
|
Bank loans and other loans
|
|||||||||||||||
|
As at 31 December
|
As at 31 December
|
|||||||||||||||
|
2015
|
2014
|
2015
|
2014
|
|||||||||||||
|
1 year or less
|
2,437,225 | 417,000 | 9,913,980 | 6,975,433 | ||||||||||||
|
More than 1 year but no more than 2 years
|
62,000 | 640,485 | 12,028,176 | 8,356,701 | ||||||||||||
|
More than 2 years but no more than 3 years
|
68,000 | - | 9,134,791 | 9,292,458 | ||||||||||||
|
More than 3 years but no more than 4 years
|
2,000 | - | 9,219,121 | 5,667,453 | ||||||||||||
|
More than 4 years but no more than 5 years
|
2,000 | - | 6,404,924 | 6,870,199 | ||||||||||||
|
More than 5 years
|
125,000 | - | 28,982,011 | 26,811,162 | ||||||||||||
| 2,696,225 | 1,057,485 | 75,683,003 | 63,973,406 | |||||||||||||
|
Less: amount due within 1 year included under current liabilities
|
2,437,225 | 417,000 | 9,913,980 | 6,975,433 | ||||||||||||
|
Total
|
259,000 | 640,485 | 65,769,023 | 56,997,973 | ||||||||||||
The interest payment schedule of long-term loans in the future years are summarized as follows:
|
As at 31 December
|
||||||||
|
2015
|
2014
|
|||||||
|
1 year or less
|
3,354,579 | 2,971,899 | ||||||
|
More than 1 year but not more than 2 years
|
2,784,037 | 2,628,832 | ||||||
|
More than 2 years but not more than 5 years
|
5,784,420 | 5,479,149 | ||||||
|
More than 5 years
|
4,325,853 | 4,441,296 | ||||||
|
Total
|
16,248,889 | 15,521,176 | ||||||
F-75
|
24
|
Long-term bonds
|
The Company issued bonds with maturity of 5 years, 7 years and 10 years in December 2007 with face values of RMB1 billion, RMB1.7 billion and RMB3.3 billion bearing annual interest rates of 5.67%, 5.75% and 5.90%, respectively. The total actual proceeds received by the Company were approximately RMB5.885 billion. These bonds are denominated in RMB and issued at par. Interest is payable annually while principal will be paid when the bonds fall due. The annual effective interest rates of those bonds are 6.13%, 6.10% and 6.17%, respectively. Interest paid per annum during the tenure of the bonds is RMB57 million, RMB98 million and RMB195 million, respectively. The bond with original maturity of 5 years had matured in December 2012 and the Company repaid the principal of RMB1 billion. The bond with original maturity of 7 years had matured in December 2014 and the Company repaid the principal of RMB1.7 billion. As at 31 December 2015, interest payables for the unmatured bonds amounted to approximately RMB3.72 million (31 December 2014: RMB3.73 million).
The Company also issued bonds with maturity of 10 years in May 2008 with a face value of RMB4 billion bearing an annual interest rate of 5.20%. The actual proceeds received by the Company were approximately RMB3.933 billion. These bonds are denominated in RMB and issued at par. Interest is payable annually while principal will be paid when the bonds fall due. The annual effective interest rate of bond is 5.42%. Interest paid per annum during the tenure of the bonds is RMB208 million. As at 31 December 2015, interest payable for these bonds amounted to approximately RMB134.69 million (31 December 2014: RMB135.06 million).
In November 2011 and January 2012, the Company issued non-public debt financing instrument with maturity of 5 years and 3 years with face values of RMB5 billion and RMB5 billion bearing annual interest rates of 5.74% and 5.24%, respectively. The actual proceeds received by the Company were approximately RMB4.985 billion and RMB4.985 billion. These bonds are denominated in RMB and issued at par. Interest is payable annually while principal will be paid when the bonds fall due. The annual effective interest rates of those bonds are 6.04% and 5.54%, respectively. Interest paid per annum during the tenure of the bonds is RMB287 million and RMB262 million. The bond with original maturity of 3 years had matured in January 2015 and the Company repaid the principal of RMB5 billion. As at 31 December 2015, interest payable for the unmatured bond amounted to approximately RMB45.48 million (31 December 2014: RMB45.61 million).
The Company issued overseas listed bonds with maturity of 3 years in February 2013 with a face value of RMB1.5 billion bearing an annual interest rate of 3.85%. The proceeds received by the Company were approximately RMB1.495 billion. These bonds are denominated in RMB and issued at par. Interest is payable semi-annually while principal will be paid when the bonds fall due. The annual effective interest rate of the bonds is 3.96%. Interest paid per annum during the tenure of the bonds is RMB58 million. As at 31 December 2015, interest payable for the bonds amounted to approximately RMB23.57 million (31 December 2014: RMB23.57 million).
The Company issued non-public debt financing instrument with maturity of 3 years in June 2013 with a face value of RMB5 billion bearing an annual interest rate of 4.82%. The proceeds received by the Company were approximately RMB4.985 billion. The bonds are denominated in RMB and issued at par. Interest is payable annually while principal will be paid when the bonds fall due. The annual effective interest rate of the bonds is 5.12%. Interest paid per annum during the tenure of the bonds is RMB241 million. As at 31 December 2015, interest payable for the bonds amounted to approximately RMB138.94 million (31 December 2014: RMB139.32 million).
F-76
|
24
|
Long-term bonds (Continued)
|
The Company issued medium-term notes with maturity of 5 years in July 2014 with a face value of RMB4 billion bearing an annual interest rate of 5.30%. The actual proceeds received by the Company were approximately RMB3.988 billion. These notes are denominated in RMB and issued at par. Interest is payable annually while principal will be paid when the notes fall due. The annual effective interest rate of these notes is 5.37%. Interest paid per annum during the tenure of the notes is RMB212 million. As at 31 December 2015, interest payable for the bonds amounted to approximately RMB99.05 million (31 December 2014: RMB99.32 million).
Please refer to Note 35(c) for details of long-term bonds of the Company guaranteed by HIPDC and government-related banks.
|
25
|
Other non-current liabilities
|
|
As at 31 December
|
||||||||
|
2015
|
2014
|
|||||||
|
Finance lease payables(a)
|
1,422,572 | 1,584,020 | ||||||
|
Government Grant
|
||||||||
|
-Environmental subsidies(b)
|
1,093,483 | 909,615 | ||||||
|
-Other government grant
|
164,394 | 113,010 | ||||||
|
Others
|
981,312 | 441,595 | ||||||
|
Subtotal
|
3,661,761 | 3,048,240 | ||||||
|
current portion of finance lease payables
|
(519,306 | ) | (329,560 | ) | ||||
|
current portion of other non-current liabilities
|
(20,000 | ) | - | |||||
|
Subtotal
|
(539,306 | ) | (329,560 | ) | ||||
|
Total
|
3,122,455 | 2,718,680 | ||||||
|
|
(a)
|
The Company and its subsidiaries had obligation under finance leases as follows:
|
|
As at 31 December
|
||||||||
|
2015
|
2014
|
|||||||
|
Within 1 year
|
574,415 | 414,143 | ||||||
|
After 1 year but within 2 years
|
596,160 | 541,831 | ||||||
|
After 2 years but within 3 years
|
240,793 | 535,492 | ||||||
|
After 3 years
|
136,386 | 284,234 | ||||||
| 1,547,754 | 1,775,700 | |||||||
|
Less: total future interest expense
|
125,182 | 191,680 | ||||||
|
Present value of finance lease obligations
|
1,422,572 | 1,584,020 | ||||||
|
|
(b)
|
This primarily represented subsidies for the construction of desulphurization equipment and other environmental protection projects.
|
|
|
(c)
|
In 2015, the asset-related government grants which were credited to the statement of comprehensive income amounted to RMB98.88 million (2014: RMB66.15 million).
|
F-77
|
26
|
Accounts payable and other liabilities
|
Accounts payable and other liabilities comprised:
|
As at 31 December
|
||||||||
|
2015
|
2014
|
|||||||
|
Accounts and notes payable
|
9,403,088 | 11,685,285 | ||||||
|
Amounts received in advance
|
472,886 | 649,431 | ||||||
|
Payables to contractors for construction
|
11,425,575 | 10,172,216 | ||||||
|
Retention payables to contractors
|
1,200,724 | 996,861 | ||||||
|
Consideration payables for acquisitions
|
- | 23,683 | ||||||
|
Accrued interests
|
874,333 | 1,056,249 | ||||||
|
Accrued pollutants discharge fees
|
94,691 | 75,648 | ||||||
|
Accrued water-resources fees
|
18,847 | 35,329 | ||||||
|
Accrued service fee of intermediaries
|
51,340 | 62,261 | ||||||
|
Security deposits
|
104,949 | 100,356 | ||||||
|
Provisions
|
15,001 | 28,647 | ||||||
|
Others
|
2,524,330 | 2,149,898 | ||||||
|
Total
|
26,185,764 | 27,035,864 | ||||||
Please refer to Note 35(a) for details of accounts payable and other liabilities due to the related parties.
As at 31 December 2015, notes payable of RMB14 million (2014: RMB13 million) were secured by notes receivable with net book value amounted to RMB14 million (2014: notes receivable amounted to RMB15 million).
The carrying amounts of financial liabilities (excluding amounts received in advance) included in accounts payable and other liabilities are denominated in the following currencies:
|
As at 31 December
|
||||||||
|
2015
|
2014
|
|||||||
|
RMB
|
24,773,457 | 25,106,220 | ||||||
|
S$ (RMB equivalent)
|
517,192 | 635,640 | ||||||
|
US$ (RMB equivalent)
|
392,953 | 626,242 | ||||||
|
JPY (RMB equivalent)
|
29,264 | 15,599 | ||||||
|
EUR (RMB equivalent)
|
12 | 2,677 | ||||||
|
GBP (RMB equivalent)
|
- | 55 | ||||||
|
Total
|
25,712,878 | 26,386,433 | ||||||
F-78
|
26
|
Accounts payable and other liabilities (Continued)
|
The ageing analysis of accounts and notes payable was as follows:
|
As at 31 December
|
||||||||
|
2015
|
2014
|
|||||||
|
Within 1 year
|
9,280,736 | 11,559,092 | ||||||
|
Between 1 to 2 years
|
78,682 | 88,408 | ||||||
|
Over 2 years
|
43,670 | 37,785 | ||||||
|
Total
|
9,403,088 | 11,685,285 | ||||||
|
27
|
Taxes payable
|
Taxes payable comprises:
|
As at 31 December
|
||||||||
|
2015
|
2014
|
|||||||
|
VAT payable
|
663,243 | 766,329 | ||||||
|
Income tax payable
|
1,054,246 | 751,349 | ||||||
|
Others
|
353,982 | 340,346 | ||||||
|
Total
|
2,071,471 | 1,858,024 | ||||||
|
28
|
Short-term bonds
|
The Company issued unsecured short-term bonds with face values of RMB5 billion and RMB5 billion bearing annual interest rates of 4.90% and 3.98% in April 2014 and November 2014, respectively. Such bonds are denominated in RMB, issued at par and mature in 365 days. The annual effective interest rates of these bonds are 5.30% and 4.40%, respectively. These bonds were fully repaid in April 2015 and November 2015 respectively.
The Company issued unsecured super short-term bonds with face values of RMB2 billion, RMB3 billion, and RMB3 billion bearing annual interest rates of 4.63%, 4.63% and 4.00%, in August 2014, September 2014, and November 2014, respectively. Such bonds are denominated in RMB, issued at face value and mature in 270 days from the issuance dates. The annual effective interest rates of these bonds are 4.94%, 4.94% and 4.31%, respectively. The bonds had matured and were fully repaid in May 2015, June 2015 and August 2015 respectively.
The Company issued unsecured short-term bonds with a face values of RMB5 billion and RMB 3 billion bearing annual interest rate of 4.44% and 3.17% in April 2015 and August 2015. Such bond is denominated in RMB, issued at par and mature in 366 days. The annual effective interest rates of these bonds is 4.86% and 3.58%. As at 31 December 2015, interest payables for the bonds amounted to approximately RMB159.52 million and RMB 34.82 million, respectively.
F-79
|
28
|
Short-term bonds (Continued)
|
The Company issued unsecured super short-term bonds with face values of RMB2 billion, RMB2 billion, RMB2 billion and RMB5 billion bearing annual interest rates of 3.11%, 3.10% , 3.38% and 3.05%, in June 2015, June 2015, June 2015 and July 2015, respectively. Such bonds are denominated in RMB, issued at face value and mature in 270 days from the issuance dates. The annual effective interest rates of these bonds are 3.42%, 3.41%, 3.69% and 3.36%. As at 31 December 2015, interest payables for the outstanding bonds amounted to approximately RMB34.67 million, RMB33.54 million, RMB34.91 million and RMB 73.75 million, respectively.
|
29
|
Short-term loans
|
Short-term loans are as follows:
|
As at 31 December 2015
|
As at 31 December 2014
|
|||||||||||||||||||||||
|
Original currency
|
RMB equivalent
|
Annual interest rate
|
Original currency
|
RMB equivalent
|
Annual interest rate
|
|||||||||||||||||||
| ’000 | ’000 | |||||||||||||||||||||||
|
Secured
|
||||||||||||||||||||||||
|
RMB
|
||||||||||||||||||||||||
|
- Fixed rate
|
- | - | - | 190,000 | 190,000 | 6.00 | % | |||||||||||||||||
|
- Fixed rate-discounted notes receivable
|
307,149 | 307,149 | 3.19%-4.30 | % | 114,901 | 114,901 | 4.50%-4.80 | % | ||||||||||||||||
|
- Variable rate
|
- | - | - | 3,000,000 | 3,000,000 | 5.04 | % | |||||||||||||||||
|
Subtotal
|
307,149 | 3,304,901 | ||||||||||||||||||||||
|
Unsecured
|
||||||||||||||||||||||||
|
RMB
|
||||||||||||||||||||||||
|
- Fixed rate
|
1,275,000 | 1,275,000 | 3.92%-5.60 | % | 9,532,000 | 9,532,000 | 4.00%-6.00 | % | ||||||||||||||||
|
- Variable rate
|
48,301,340 | 48,301,340 | 3.83%-5.32 | % | 30,692,103 | 30,692,103 | 5.00%-6.00 | % | ||||||||||||||||
|
Subtotal
|
49,576,340 | 40,224,103 | ||||||||||||||||||||||
|
Total
|
49,883,489 | 43,529,004 | ||||||||||||||||||||||
As at 31 December 2015, no short-term loan was secured by accounts receivable (31 December 2014: short-term loans of RMB3,150 million were secured by accounts receivable of the Company and its subsidiaries with net book value amounting to RMB3,592 million).
As at 31 December 2015, no short-term loan was secured by property, plant and equipment (31 December 2014: a short-term loan of RMB40 million is secured by a subsidiary’s port facility with net book value amounting to RMB56.47 million).
As at 31 December 2015, short-term loans of RMB307 million (31 December 2014: RMB115 million) represented the notes receivable that were discounted with recourse. As these notes receivable had not yet matured, the proceeds received were recorded as short-term loans.
As at 31 December 2015, a short-term loan from China Huaneng Group Clean Energy Technology Research Institute Co., Ltd. (“Huaneng Clean Energy”) has been repaid (31 December 2014: RMB150 million).
As at 31 December 2015, a short-term loan from Xi’an Thermal Power Research Institute Co., Ltd (“Xi’an Thermal”) has been repaid (31 December 2014: RMB200 million).
As at 31 December 2015, a short-term loan from Huaneng Group Hong Kong Limited Company (“Huaneng Hong Kong”) has been repaid (31 December 2014: RMB100 million).
F-80
|
30
|
Deferred income tax assets and liabilities
|
The offset amounts of deferred income tax assets and liabilities are as follows:
|
As at 31 December
|
||||||||
|
2015
|
2014
|
|||||||
|
Deferred income tax assets
|
1,064,391 | 884,274 | ||||||
|
Deferred income tax liabilities
|
(2,494,143 | ) | (1,810,755 | ) | ||||
|
Total
|
(1,429,752 | ) | (926,481 | ) | ||||
The gross movement on the deferred income tax accounts is as follows:
|
2015
|
2014
|
2013
|
||||||||||
|
Beginning of the year
|
(926,481 | ) | (1,380,059 | ) | (1,479,342 | ) | ||||||
|
Business combination (Note 39)
|
(1,007,147 | ) | - | - | ||||||||
|
Credited to profit or loss (Note 32)
|
687,206 | 541,582 | 57,230 | |||||||||
|
Charged to other comprehensive income
|
(198,525 | ) | (119,984 | ) | (59,197 | ) | ||||||
|
Currency translation differences
|
15,195 | 31,980 | 79,187 | |||||||||
|
Reclassification to liabilities held for sale
|
- | - | 22,063 | |||||||||
|
End of the year
|
(1,429,752 | ) | (926,481 | ) | (1,380,059 | ) | ||||||
F-81
|
30
|
Deferred income tax assets and liabilities (Continued)
|
The movements in deferred income tax assets and liabilities during the year, without taking into consideration the offsetting of balances within the same tax jurisdictions, are as follows:
Deferred income tax assets:
|
Hedging reserve
|
Amortization of land use rights
|
Provision for impairment loss
|
Depreciation
|
Accrued expenses
|
VAT refunds on purchases of domestically manufactured equipment
|
Unused tax losses
|
Others
|
Total
|
||||||||||||||||||||||||||||
|
As at 1 January 2014
|
62,874 | 14,711 | 261,673 | 97,007 | 33,604 | 281,346 | 159,890 | 403,956 | 1,315,061 | |||||||||||||||||||||||||||
|
(Charged)/credited to profit or loss
|
- | (368 | ) | (55,094 | ) | 541,903 | 42,107 | (25,260 | ) | (77,448 | ) | 51,200 | 477,040 | |||||||||||||||||||||||
|
Credited to other comprehensive income
|
160,112 | - | - | - | - | - | - | - | 160,112 | |||||||||||||||||||||||||||
|
Currency translation differences
|
(8,458 | ) | - | (147 | ) | (80 | ) | - | - | (123 | ) | (77 | ) | (8,885 | ) | |||||||||||||||||||||
|
As at 31 December 2014
|
214,528 | 14,343 | 206,432 | 638,830 | 75,711 | 256,086 | 82,319 | 455,079 | 1,943,328 | |||||||||||||||||||||||||||
|
Business combination (Note 39)
|
- | 452 | 98,498 | 918 | - | - | - | 25,507 | 125,375 | |||||||||||||||||||||||||||
|
(Charged)/credited to profit or loss
|
- | (378 | ) | 94,537 | (67,315 | ) | (34,773 | ) | (25,644 | ) | 153,954 | 213,629 | 334,010 | |||||||||||||||||||||||
|
Charged to other comprehensive loss
|
(12,438 | ) | - | - | - | - | - | - | - | (12,438 | ) | |||||||||||||||||||||||||
|
Currency translation differences
|
(2,214 | ) | - | (49 | ) | (54 | ) | - | - | (289 | ) | 2,188 | (418 | ) | ||||||||||||||||||||||
|
As at 31 December 2015
|
199,876 | 14,417 | 399,418 | 572,379 | 40,938 | 230,442 | 235,984 | 696,403 | 2,389,857 | |||||||||||||||||||||||||||
F-82
|
30
|
Deferred income tax assets and liabilities (Continued)
|
Deferred income tax liabilities:
|
Fair value gains
|
Amortization of land use rights
|
Depreciation
|
Power generation license
|
Mining rights
|
Territorial water use right
|
Others
|
Total
|
|||||||||||||||||||||||||
|
As at 1 January 2014
|
(179,059 | ) | (411,263 | ) | (988,792 | ) | (652,319 | ) | (270,667 | ) | (78,834 | ) | (114,186 | ) | (2,695,120 | ) | ||||||||||||||||
|
(Charged)/credited to profit or loss
|
- | (6,918 | ) | 76,723 | - | - | 2,864 | (8,127 | ) | 64,542 | ||||||||||||||||||||||
|
Charged to other comprehensive loss
|
(280,096 | ) | - | - | - | - | - | - | (280,096 | ) | ||||||||||||||||||||||
|
Currency translation differences
|
- | 17,658 | 2,960 | 19,756 | - | - | 491 | 40,865 | ||||||||||||||||||||||||
|
As at 31 December 2014
|
(459,155 | ) | (400,523 | ) | (909,109 | ) | (632,563 | ) | (270,667 | ) | (75,970 | ) | (121,822 | ) | (2,869,809 | ) | ||||||||||||||||
|
Business combination (Note 39)
|
- | (528,361 | ) | (603,508 | ) | - | - | - | (653 | ) | (1,132,522 | ) | ||||||||||||||||||||
|
Credited to profit or loss
|
- | 24,257 | 212,855 | - | 113,452 | 1,769 | 863 | 353,196 | ||||||||||||||||||||||||
|
Charged to other comprehensive loss
|
(186,087 | ) | - | - | - | - | - | - | (186,087 | ) | ||||||||||||||||||||||
|
Currency translation differences
|
- | 454 | 8,056 | 7,103 | - | - | - | 15,613 | ||||||||||||||||||||||||
|
As at 31 December 2015
|
(645,242 | ) | (904,173 | ) | (1,291,706 | ) | (625,460 | ) | (157,215 | ) | (74,201 | ) | (121,612 | ) | (3,819,609 | ) | ||||||||||||||||
F-83
|
30
|
Deferred income tax assets and liabilities (Continued)
|
As at 31 December 2015 and 2014, taxable temporary differences relating to interest in equity method investees amounted to RMB3.78 billion and RMB2.69 billion, respectively. No deferred tax liabilities were recognized as at 31 December 2015 and 2014 as dividends from investments in associates and joint ventures are exempted from the PRC income tax and the Company has no plan to dispose any of these investees in the foreseeable future.
As at 31 December 2015 and 2014, taxable temporary differences relating to the undistributed profit of a wholly-owned foreign subsidiary amounted to RMB3.78 billion and RMB3.84 billion, respectively. No deferred tax liabilities were recognized in respect of the tax that would be payable on the distribution of these retained profit as at 31 December 2015 and 2014 as the Company controls the dividend policy of the subsidiary, and it has been determined that it is probable that the profits will not be distributed in the foreseeable future.
In accordance with the accounting policy set out in Note 2(s), the Company and its subsidiaries did not recognize deferred income tax assets in respect of certain deductible temporary differences and accumulated tax losses that can be carried forward against future taxable income as follow:
|
As at 31 December
|
||||||||
|
2015
|
2014
|
|||||||
|
Deductible temporary differences
|
2,940,730 | 2,408,796 | ||||||
|
Tax losses
|
6,990,624 | 7,056,577 | ||||||
|
Total
|
9,931,354 | 9,465,373 | ||||||
The expiry dates of the tax losses of the Company and its subsidiaries for which no deferred income tax assets were recognized are summarized as follows:
|
As at 31 December
|
||||||||
|
2015
|
2014
|
|||||||
|
Year of expiry
|
||||||||
|
2015
|
- | 901,015 | ||||||
|
2016
|
1,504,577 | 1,589,376 | ||||||
|
2017
|
1,900,325 | 1,932,014 | ||||||
|
2018
|
1,181,030 | 1,256,982 | ||||||
|
2019
|
1,284,264 | 1,377,190 | ||||||
|
2020
|
1,120,428 | - | ||||||
|
Total
|
6,990,624 | 7,056,577 | ||||||
|
31
|
Additional financial information to the statements of financial position
|
As at 31 December 2015, the net current liabilities of the Company and its subsidiaries amounted to approximately RMB90,271 million (2014: RMB66,981 million). On the same date, total assets less current liabilities were approximately RMB185,030 million (2014: RMB170,326 million).
F-84
|
32
|
Income tax expense
|
|
For the year ended 31 December
|
||||||||||||
|
2015
|
2014
|
2013
|
||||||||||
|
Current income tax expense
|
6,386,149 | 6,028,790 | 4,579,901 | |||||||||
|
Deferred income tax (Note 30)
|
(687,206 | ) | (541,582 | ) | (57,230 | ) | ||||||
|
Total
|
5,698,943 | 5,487,208 | 4,522,671 | |||||||||
No Hong Kong profits tax has been provided as there were no estimated assessable profits in Hong Kong for the year (2014 and 2013: nil).
The reconciliation of the effective income tax rate from the notional income tax rate is as follows:
|
For the year ended 31 December
|
||||||||||||
|
2015
|
2014
|
2013
|
||||||||||
|
Notional tax on profit before incometax expense, calculated at the applicable income tax rates in the countries concerned
|
25.11 | % | 24.94 | % | 24.33 | % | ||||||
|
Effect of tax losses not recognized
|
(0.12 | %) | 0.96 | % | 0.48 | % | ||||||
|
Effect of deductible temporary differences not recognized
|
(0.16 | %) | 1.67 | % | 0.53 | % | ||||||
|
Effect of non-taxable income
|
(1.77 | %) | (1.86 | %) | (1.15 | %) | ||||||
|
Effect of non-deductible expenses
|
1.37 | % | 1.59 | % | 1.80 | % | ||||||
|
Others
|
0.39 | % | 1.50 | % | (0.03 | %) | ||||||
|
Effective tax rate
|
24.82 | % | 28.80 | % | 25.96 | % | ||||||
The Company and its PRC branches and subsidiaries are subject to income tax at 25%, except for certain PRC branches and subsidiaries that are tax exempted or taxed at preferential tax rates, as determined in accordance with the relevant PRC income tax rules and regulations for the years ended 31 December 2015, 2014 and 2013.
Pursuant to Guo Shui Han [2009] No. 33, starting from 1 January 2008, the Company and its PRC branches calculate and pay income tax on a consolidated basis according to relevant tax laws and regulations. The original regulation specifying locations for power plants and branches of the Company to make enterprise income tax payments was abolished. The income tax of subsidiaries remains to be calculated individually based on their individual operating results.
The income tax rate applicable to Singapore subsidiaries is 17% (2014 and 2013: 17%).
|
33
|
Earnings per share
|
The basic earnings per share is calculated by dividing the consolidated net profit attributable to the equity holders of the Company by the weighted average number of the Company’s outstanding ordinary shares during the year:
F-85
|
33
|
Earnings per share (Continued)
|
|
2015
|
2014
|
2013
|
||||||||||
|
Consolidated net profit attributable to equity holders of the Company
|
13,651,933 | 10,757,317 | 10,426,024 | |||||||||
|
Weighted average number of the Company’s outstanding ordinary shares (’000)*
|
14,485,383 | 14,085,800 | 14,055,383 | |||||||||
|
Basic and diluted earnings per share (RMB)
|
0.94 | 0.76 | 0.74 | |||||||||
*Weighted average number of ordinary shares:
|
2015
|
2014
|
2013
|
||||||||||
| ’000 | ’000 | ’000 | ||||||||||
|
Issued ordinary shares at 1 January
|
14,420,383 | 14,055,383 | 14,055,383 | |||||||||
|
Effect of share issue (Note 20)
|
65,000 | 30,417 | - | |||||||||
|
Weighted average number of ordinary shares at 31 December
|
14,485,383 | 14,085,800 | 14,055,383 | |||||||||
There was no dilutive effect on earnings per share since the Company had no dilutive potential ordinary shares for the years ended 31 December 2015, 2014 and 2013.
|
34
|
Notes to consolidated statement of cash flows
|
Bank balances and cash comprised the following:
|
As at 31 December
|
||||||||||||
|
2015
|
2014
|
2013
|
||||||||||
|
Total bank balances and cash
|
7,537,813 | 12,608,192 | 9,433,385 | |||||||||
|
Add: Cash and cash equivalents reclassified to assets held for sale
|
- | - | 34,488 | |||||||||
|
Less: Restricted cash
|
59,563 | 369,825 | 126,201 | |||||||||
|
Cash and cash equivalents as at year end
|
7,478,250 | 12,238,367 | 9,341,672 | |||||||||
The bank balances and cash of the Company and its subsidiaries are denominated in the following currencies:
|
As at 31 December
|
||||||||||||
|
2015
|
2014
|
2013
|
||||||||||
|
RMB
|
5,847,363 | 8,346,060 | 7,780,145 | |||||||||
|
S$ (RMB equivalent)
|
1,130,356 | 1,064,479 | 1,109,913 | |||||||||
|
US$ (RMB equivalent)
|
559,761 | 753,061 | 543,312 | |||||||||
|
JPY (RMB equivalent)
|
205 | 4 | 15 | |||||||||
|
HK$ (RMB equivalent)
|
128 | 2,444,588 | - | |||||||||
|
Total
|
7,537,813 | 12,608,192 | 9,433,385 | |||||||||
There is no material non-cash investing and financing transactions for the years ended 31 December 2015, 2014 and 2013.
F-86
|
35
|
Related party balances and transactions
|
The related parties of the Company and its subsidiaries that had transactions with the Company and its subsidiaries are as follows:
|
Names of related parties
|
Nature of relationship
|
|
|
Huaneng Group
|
Ultimate parent company
|
|
|
HIPDC
|
Parent company
|
|
|
Huaneng Energy & Communications Holdings Co., Ltd. and its subsidiaries
|
Subsidiaries of Huaneng Group
|
|
|
Huaneng Property Co., Ltd. and its subsidiaries
|
Subsidiaries of Huaneng Group
|
|
|
Xi’an Thermal and its subsidiaries
|
Subsidiaries of Huaneng Group
|
|
|
Huaneng Group Technology Innovation Center
|
A subsidiary of Huaneng Group
|
|
|
Huaneng Hulunbeier Energy Development Company Ltd.
|
A subsidiary of Huaneng Group
|
|
|
Gansu Huating Coal and Power Co., Ltd.
|
A subsidiary of Huaneng Group
|
|
|
Alltrust Insurance Co., Ltd.
|
A subsidiary of Huaneng Group
|
|
|
North United Power Co., Ltd. and its subsidiaries
|
Subsidiaries of Huaneng Group
|
|
|
Huaneng Clean Energy
|
A subsidiary of Huaneng Group
|
|
|
Huaneng Renewables Corporation Limited
|
A subsidiary of Huaneng Group
|
|
|
Huaneng Shandong Power Limited and its subsidiaries
|
Subsidiaries of Huaneng Group
|
|
|
Huaneng Carbon Assets Management Company Limited
|
A subsidiary of Huaneng Group
|
|
|
Huaneng Huajialing Wind Power Co., Ltd.
|
A subsidiary of Huaneng Group
|
|
|
Huaneng Hong Kong
|
A subsidiary of Huaneng Group
|
|
|
Huaneng Lancangjiang Hydropower Co., Ltd.
|
A subsidiary of Huaneng Group
|
|
|
Huaneng Henan Zhongyuan Gas Power Generation Co., Ltd.
|
A subsidiary of Huaneng Group
|
|
|
Rizhao Power Company
|
An associate of the Company and also a subsidiary of Huaneng Group
|
|
|
Huaneng Tiancheng Financial Leasing Co., Ltd.
|
An associate of the Company and also a subsidiary of Huaneng Group
|
|
|
Shidaowan Nuclear Power Co., Ltd.
|
An associate of the Company and also a subsidiary of Huaneng Group
|
|
|
Xiapu Nuclear Power Co., Ltd.
|
An associate of the Company and also a subsidiary of Huaneng Group
|
|
|
Huaneng Finance
|
An associate of the Company and also a subsidiary of Huaneng Group
|
|
|
Hainan Nuclear Power Co., Ltd.
|
An associate of the Company
|
|
|
Huaneng (Tianjing) Coal Gasification Power Generation Co., Ltd. (“Coal Gasification Co.”)
|
An associate of the Company and also a subsidiary of Huaneng Group
|
|
|
Lime Company
|
An associate of a subsidiary
|
|
|
Shanghai Time Shipping
|
A joint venture of the Company
|
|
|
Jiangsu Nantong Power
|
A joint venture of the Company
|
F-87
|
Names of related parties
|
Nature of relationship
|
|
|
Yinkou Port
|
A joint venture of the Company
|
|
|
Subsidiaries of Jiangsu Province Guoxin Asset Management Group Limited Company (“Jiangsu Guoxin”)**
|
Other related party
|
|
|
Other government-related enterprises***
|
Related parties of the Company
|
|
|
*
|
Transactions with subsidiaries of Huaneng Group which also are associates of the Company and its subsidiaries are presented as transactions with subsidiaries of Huaneng Group for note 35(a), 35(b) and 35(c).
|
|
|
**
|
Before 10 March 2015, the former director of the Company, Mr. Xu Zujian also serves as the Vice President of Jiangsu Guoxin. On 10 March 2015, Mr. Xu Zujian resigned from the position of the non-executive director. Meanwhile, Jiangsu Guoxin holds 30%, 30%, 26.36%, 30% and 21% equity interest of Huaneng Nanjing Combined Cycle Co-generation Co., Ltd., Huaneng Nantong Power Generation Limited Liability Company, Huaneng Huaiyin II Power Limited Company, Jinling Power and Jinling CCGT, respectively.
|
|
|
***
|
Huaneng Group is a state-owned enterprise. In accordance with the revised IAS 24, “Related Party Disclosures”, government-related enterprises, other than entities under Huaneng Group, which the PRC government has control, joint control or significant influence over are also considered as related parties of the Company and its subsidiaries (“other government-related enterprises”).
|
The majority of the business activities of the Company and its subsidiaries are conducted with other government-related enterprises. For the purpose of the related party balances and transactions disclosure, the Company and its subsidiaries have established procedures to determine, to the extent possible, the identification of the ownership structure of its customers and suppliers as to whether they are government-related enterprises. However, many government-related enterprises have a multi-layered corporate structure and the ownership structures change over time as a result of transfers and privatization programs. Nevertheless, management believes that all material related party balances and transactions have been adequately disclosed.
In addition to the related party information shown elsewhere in these financial statements, the following is a summary of significant related party transactions entered into in the ordinary course of business between the Company and its subsidiaries and their related parties during the year and significant balances arising from related party transactions as at year end.
F-88
|
35
|
Related party balances and transactions (Continued)
|
|
|
(a)
|
Related party balances
|
|
|
(i)
|
Cash deposits in a related party
|
|
As at 31 December
|
||||||||
|
2015
|
2014
|
|||||||
|
Deposits in Huaneng Finance - Savings deposit
|
4,599,922 | 5,048,722 | ||||||
For the year ended 31 December 2015, the annual interest rates for these savings deposits placed with Huaneng Finance ranged from 0.35% to 1.35% (2014: from 0.35% to 1.35%).
|
|
(ii)
|
As described in Note 23 and 29, certain loans of the Company and its subsidiaries were borrowed from Huaneng Group, HIPDC, Huaneng Finance, Xi’an Thermal, Huaneng Hong Kong and Huaneng Clean Energy.
|
|
|
(iii)
|
Except for those disclosed in Note 35(a)(ii), the balances with Huaneng Group, HIPDC, subsidiaries, associates, joint ventures and other related parties are unsecured, non-interest bearing and receivable/repayable within one year. As at and for the years ended 31 December 2015 and 2014, no provision is made on receivable balances from these parties.
|
Other receivables and assets comprised the following balances due from related parties:
|
As at 31 December
|
||||||||
|
2015
|
2014
|
|||||||
|
Due from Huaneng Group
|
1,700 | - | ||||||
|
Due from HIPDC
|
- | 99 | ||||||
|
Due from joint ventures
|
421,884 | 50,000 | ||||||
|
Due from subsidiaries of Huaneng Group
|
61,876 | 287,326 | ||||||
|
Due from other related parties
|
26,745 | - | ||||||
|
Total
|
512,205 | 337,425 | ||||||
|
|
(iv)
|
Accounts payable and other liabilities comprised the following balances due to related parties:
|
|
As at 31 December
|
||||||||
|
2015
|
2014
|
|||||||
|
Due to Huaneng Group
|
25,819 | 1,313 | ||||||
|
Due to HIPDC
|
89,589 | 14,417 | ||||||
|
Due to associates
|
9,652 | 12,718 | ||||||
|
Due to a joint venture
|
308,308 | 288,983 | ||||||
|
Due to subsidiaries of Huaneng Group
|
2,451,528 | 4,007,701 | ||||||
|
Due to other related parties
|
- | 126,102 | ||||||
|
Total
|
2,884,896 | 4,451,234 | ||||||
F-89
|
35
|
Related party balances and transactions (Continued)
|
|
|
(a)
|
Related party balances (Continued)
|
|
|
(v)
|
As at 31 December 2015, included in long-term loans (including current portion) and short-term loans are loans payable to other government-related enterprises amounting to RMB126 billion (2014: RMB106 billion).
|
The balances with government-related enterprises also included substantially all the accounts receivable due from domestic power plants of government-related power grid companies, the bank deposits placed with government-related financial institutions as well as accounts payables and other payables arising from the purchases of coal and property, plant and equipment construction and related labor service provided by other government-related enterprises. Except for bank deposits, these balances are unsecured, non-interest bearing and the majority of receivable/repayable is within one year.
|
|
(b)
|
Related party transactions
|
|
|
(i)
|
Procurement of goods and receiving services
|
|
For the year ended 31 December
|
||||||||||||
|
2015
|
2014
|
2013
|
||||||||||
|
Huaneng Group
|
||||||||||||
|
Technical services and engineering contracting services
|
50 | - | 10 | |||||||||
|
Purchase of capacity quota
|
- | - | 478,620 | |||||||||
|
Subsidiaries of Huaneng Group
|
||||||||||||
| 16,575,700 | 17,938,921 | 15,456,283 | ||||||||||
|
Purchase of equipment
|
230,638 | 347,946 | 366,990 | |||||||||
|
Purchase of materials
|
71,749 | 52,252 | 59,441 | |||||||||
|
Technical services and engineering contracting services
|
537,180 | 464,193 | 348,002 | |||||||||
|
Purchase of power generation quota
|
287,779 | 309,791 | 318,419 | |||||||||
|
Entrusting other parties for power generation
|
- | 38,855 | - | |||||||||
|
Premiums for property insurance
|
231,996 | 171,555 | 159,727 | |||||||||
|
Purchase of electricity
|
7,073 | 8,087 | 8,369 | |||||||||
|
Joint ventures of the Company
|
||||||||||||
|
Purchase of coal and transportation services
|
1,816,954 | 2,705,865 | 2,654,082 | |||||||||
|
Entrusting other parties for power generation
|
- | 27,985 | - | |||||||||
|
An associate of the Company
|
||||||||||||
|
Purchase of lime
|
44,591 | 69,911 | 113,697 | |||||||||
F-90
|
35
|
Related party balances and transactions (Continued)
|
|
|
(b)
|
Related party transactions (Continued)
|
|
|
(i)
|
Procurement of goods and receiving services (Continued)
|
|
For the year ended 31 December
|
||||||||||||
|
2015
|
2014
|
2013
|
||||||||||
|
Other Related Party
|
||||||||||||
|
Entrusting other parties for power generation
|
- | 967 | 7,977 | |||||||||
|
Purchase of power generation quota
|
- | - | 39,591 | |||||||||
|
|
(ii)
|
Sales of goods and providing services
|
|
For the year ended 31 December
|
||||||||||||
|
2015
|
2014
|
2013
|
||||||||||
|
Subsidiary of Huaneng Group
|
||||||||||||
|
Sales of power generation quota
|
135,085 | - | 7,704 | |||||||||
|
Sales of capacity quota
|
38,000 | 21,850 | - | |||||||||
|
Transportation service provided
|
14,522 | 19,743 | 37,094 | |||||||||
|
Provision of entrusted power generation
|
- | 241,868 | 295,020 | |||||||||
|
Sale of cable
|
- | 435 | - | |||||||||
|
Sales of electricity
|
1,304 | 1,042 | 2,779 | |||||||||
|
Handling service provided
|
36,028 | 28,589 | 33,316 | |||||||||
|
Labor service provided
|
77 | 10,464 | - | |||||||||
|
Sales of materials
|
1,476 | - | - | |||||||||
|
Sales of coal
|
- | - | 129,881 | |||||||||
|
Joint ventures of the Company
|
||||||||||||
|
Labor service provided
|
97,408 | - | - | |||||||||
|
Sales of capacity quota
|
7,650 | - | - | |||||||||
|
Sale of steam
|
15,353 | 24,551 | - | |||||||||
|
Maintain service provided
|
35,924 | - | - | |||||||||
|
Other Related Party
|
||||||||||||
|
Provision of entrusted power generation
|
33,129 | 29,232 | 75,736 | |||||||||
|
|
(iii)
|
Other related party transactions
|
|
For the year ended 31 December
|
||||||||
|
2015
|
2014
|
2013
|
||||||
|
(1)
|
Rental charge on leasehold
|
|||||||
|
HIPDC
|
161,941
|
148,603
|
142,428
|
|||||
|
Subsidiaries of Huaneng Group
|
130,591
|
125,807
|
111,630
|
|||||
|
|
||||||||
|
(2)
|
Rental income from leasehold
|
|||||||
|
A joint venture of the Company
|
10,759
|
3,440
|
-
|
|||||
|
A Subsidiary of Huaneng Group
|
9,115
|
9,342
|
982
|
|||||
F-91
|
35
|
Related party balances and transactions (Continued)
|
|
|
(b)
|
Related party transactions (Continued)
|
|
|
(iii)
|
Other related party transactions (Continued)
|
|
For the year ended 31 December
|
||||||||
|
2015
|
2014
|
2013
|
||||||
|
(3)
|
Drawdown of loans
|
|||||||
|
A subsidiary of Huaneng Group
|
2,660,500
|
2,340,000
|
1,540,000
|
|||||
|
Huaneng Group
|
-
|
- | 640,485 | |||||
|
(4)
|
Interest expense on loans
|
|||||||
|
Huaneng group
|
32,573
|
35,847
|
51,923
|
|||||
|
HIPDC
|
114,687
|
-
|
-
|
|||||
|
Subsidiaries of Huaneng Group
|
158,695
|
127,449
|
100,525
|
|||||
|
(5)
|
Interest income on loans
|
|||||||
|
A joint venture of the Company
|
4,572
|
-
|
-
|
|||||
|
(6)
|
Capital injection from a subsidiary of Huaneng Group
|
|||||||
|
A subsidiary of Huaneng Group
|
286,312
|
-
|
-
|
|||||
|
(7)
|
Capital injection to subsidiaries of Huaneng Group
|
|||||||
|
A subsidiary of Huaneng Group
|
683,550
|
-
|
-
|
|||||
|
A associate of the Company
|
206,230
|
266,877
|
-
|
|||||
|
(8)
|
Pre-construction cost paid by
|
|||||||
|
A subsidiary of Huaneng Group
|
12,254
|
-
|
-
|
|||||
|
(9)
|
Finance lease payments received from
|
|||||||
|
A subsidiary of Huaneng Group
|
100,000
|
-
|
-
|
|||||
|
(10)
|
Entrusted management fee
|
|||||||
|
Huaneng Group
|
24,950
|
-
|
-
|
|||||
|
(11)
|
Trusteeship management income
|
|||||||
|
Huaneng Group
|
1,700
|
-
|
-
|
|||||
|
|
(c)
|
Guarantees
|
|
As at 31 December
|
||||||
|
2015
|
2014
|
|||||
|
(i)
|
Long-term loans guaranteed by
|
|||||
|
- Huaneng Group
|
713,994
|
290,520
|
||||
|
- HIPDC
|
2,228,000
|
2,000,000
|
||||
|
(ii)
|
Long-term bonds guaranteed by
|
|||||
|
- HIPDC
|
4,000,000
|
4,000,000
|
||||
|
- Government-related banks
|
3,300,000
|
3,300,000
|
||||
F-92
|
35
|
Related party balances and transactions (Continued)
|
|
|
(c)
|
Guarantees (Continued)
|
Transactions with government-related enterprises
For the years ended 31 December 2015, 2014 and 2013 the Company and its domestic subsidiaries sold substantially all their products to local government-related power grid companies. Please refer to Note 5 for details of sales information to major power grid companies.
For the years ended 31 December 2015, 2014 and 2013 other collectively-significant transactions with government-related enterprises also include a large portion of fuel purchases, property, plant and equipment construction and related labor employed.
|
|
(d)
|
Pre-tax benefits and social insurance of key management personnel
|
|
For the year ended 31 December
|
||||||||||||
|
2015
|
2014
|
2013
|
||||||||||
|
Salaries
|
9,064 | 8,546 | 9,126 | |||||||||
|
Pension
|
1,470 | 1,350 | 1,324 | |||||||||
|
Total
|
10,534 | 9,896 | 10,450 | |||||||||
|
|
(e)
|
Related party commitments
|
Related party commitments which were contracted but not recognized in the consolidated statement of financial position as at the end of reporting period are as follows:
|
|
(i)
|
Capital commitments
|
|
As at 31 December
|
||||||||
|
2015
|
2014
|
|||||||
|
Subsidiaries of Huaneng Group
|
405,208 | 297,489 | ||||||
|
A joint venture of the Company
|
- | 7,220 | ||||||
|
Total
|
405,208 | 304,709 | ||||||
|
|
(ii)
|
Fuel purchase and transportation commitments
|
|
As at 31 December
|
||||||||
|
2015
|
2014
|
|||||||
|
Subsidiaries of Huaneng Group
|
1,343,875 | 2,732,549 | ||||||
|
An associate of the Company
|
200,440 | 223,534 | ||||||
|
Total
|
1,544,315 | 2,956,083 | ||||||
F-93
|
35
|
Related party balances and transactions (Continued)
|
|
|
(e)
|
Related party commitments (Continued)
|
|
|
(iii)
|
Operating lease commitments
|
|
As at 31 December
|
||||||||
|
2015
|
2014
|
|||||||
|
Subsidiaries of Huaneng Group
|
145,950 | 262,390 | ||||||
|
HIPDC
|
73,202 | 81,035 | ||||||
|
Total
|
219,152 | 343,425 | ||||||
|
36
|
Labor cost
|
Other than the salaries and staff welfare, the labor cost of the Company and its subsidiaries mainly comprises the following:
All PRC employees of the Company and its subsidiaries are entitled to a monthly pension upon their retirements. The PRC government is responsible for the pension liability to these employees on retirement. The Company and its subsidiaries are required to make contributions to the publicly administered retirement plan for their PRC employees at a specified rate, currently set at 14% to 22% (both 2014 and 2013: 14% to 22%) of the basic salary of the PRC employees. The retirement plan contributions paid by the Company and its subsidiaries for the year ended 31 December 2015 were approximately RMB789 million (2014 and 2013: RMB621 million and RMB565 million), including approximately RMB748 million (2014 and 2013: RMB593 million and RMB539 million) charged to profit or loss.
In addition, the Company and its subsidiaries have also implemented a supplementary defined contribution retirement scheme for PRC employees. Under this scheme, the employees are required to make a specified contribution based on the number of years of service with the Company and its subsidiaries, and the Company and its subsidiaries are required to make a contribution equal to two to four times the employees’ contributions. The employees will receive the total contributions upon their retirement. For the year ended 31 December 2015, the contributions to supplementary defined contribution retirement scheme paid by the Company and its subsidiaries amounted to approximately RMB223 million (2014 and 2013: RMB171 million and RMB154 million), including approximately RMB212 million (2014 and 2013: RMB164 million and RMB150 million) charged to profit or loss.
SinoSing Power and its subsidiaries in Singapore appropriate a specified rate, currently set at 6.5% to 16% (both 2014 and 2013: 6.5% to 16%) of the basic salary to central provident funds in accordance with the local government regulations. The contributions made by SinoSing Power and its subsidiaries for the year ended 31 December 2015 amounted to approximately RMB15.76 million (2014 and 2013: RMB14.70 million and RMB14.70 million), all of which were charged to profit or loss.
The Company and its subsidiaries have no further obligation for post-retirement benefits beyond the annual contributions made above.
F-94
|
36
|
Labor cost (Continued)
|
In addition, the Company and its subsidiaries also make contributions of housing funds and social insurance to the social security institutions at specified rates of the basic salary and no more than the upper limit. The housing funds and social insurance contributions paid by the Company and its subsidiaries amounted to approximately RMB579 million (2014 and 2013: RMB462 million and 433 million) and RMB658 million (2014 and 2013: RMB519 million and RMB458 million) for the year ended 31 December 2015, including approximately RMB546 million (2014 and 2013: RMB439 million and RMB414 million) and RMB619 million (2014 and 2013: RMB483 million and RMB428 million) were charged to profit or loss, respectively.
|
37
|
Directors’, supervisors’ and senior management’s emoluments
|
|
|
(a)
|
Pre-tax benefits and social insurance of directors and supervisors
|
The remuneration of every director and supervisor of the Company for the year ended 31 December 2015 is set out below:
|
Fees
|
Basic salaries
|
Performane salaries
|
Pension
|
Total
|
||||||||||||||||
|
Name of director
|
||||||||||||||||||||
|
Mr. Cao Peixi
|
- | - | - | - | - | |||||||||||||||
|
Mr. Guo Junming
|
- | - | - | - | - | |||||||||||||||
|
Mr. Liu Guoyue
|
- | 143 | 663 | 123 | 929 | |||||||||||||||
|
Mr. Li Shiqi
|
- | - | - | - | - | |||||||||||||||
|
Mr. Huang Jian
|
- | - | - | - | - | |||||||||||||||
|
Mr. Fan Xiaxia
|
- | 356 | 494 | 131 | 981 | |||||||||||||||
|
Mr. Mi Dabin
|
65 | - | - | - | 65 | |||||||||||||||
|
Mr. Guo Hongbo
|
12 | - | - | - | 12 | |||||||||||||||
|
Mr. Zhu Yousheng2
|
24 | - | - | - | 24 | |||||||||||||||
|
Mr. Xu Zujian1
|
24 | - | - | - | 24 | |||||||||||||||
|
Ms. Li Song
|
65 | - | - | - | 65 | |||||||||||||||
|
Mr. Li Zhensheng
|
74 | - | - | - | 74 | |||||||||||||||
|
Mr. Qi Yudong1
|
6 | - | - | - | 6 | |||||||||||||||
|
Mr. Zhang Shouwen
|
74 | - | - | - | 74 | |||||||||||||||
|
Mr. Yue Heng
|
100 | - | - | - | 100 | |||||||||||||||
|
Ms. Zhang Lizi1
|
30 | - | - | - | 30 | |||||||||||||||
|
Mr. Geng Jianxin2
|
37 | - | - | - | 37 | |||||||||||||||
|
Mr. Xia Qing2
|
37 | - | - | - | 37 | |||||||||||||||
|
Sub-total
|
548 | 499 | 1,157 | 254 | 2,458 | |||||||||||||||
|
Name of supervisor
|
||||||||||||||||||||
|
Mr. Ye Xiangdong
|
- | - | - | - | - | |||||||||||||||
|
Mr. Mu Xuan
|
65 | - | - | - | 65 | |||||||||||||||
|
Ms. Zhang Mengjiao
|
- | - | - | - | - | |||||||||||||||
|
Mr. Gu Jianguo
|
49 | - | - | - | 49 | |||||||||||||||
|
Mr. Wang Zhaobin
|
- | 298 | 385 | 103 | 786 | |||||||||||||||
|
Ms. Zhang Ling
|
- | 133 | 263 | 53 | 449 | |||||||||||||||
|
Sub-total
|
114 | 431 | 648 | 156 | 1,349 | |||||||||||||||
|
Total
|
662 | 930 | 1,805 | 410 | 3,807 | |||||||||||||||
F-95
|
37
|
Directors’, supervisors’ and senior management’s emoluments (Continued)
|
|
|
(a)
|
Pre-tax benefits and social insurance of directors and supervisors (Continued)
|
The remuneration of every director and supervisor of the Company for the year ended 31 December 2014 is set out below:
|
Fees
|
Basic salaries
|
Performance salaries
|
Pension
|
Total
|
||||||||||||||||
|
Name of director
|
||||||||||||||||||||
|
Mr. Cao Peixi
|
- | - | - | - | - | |||||||||||||||
|
Mr. Guo Junming
|
- | - | - | - | - | |||||||||||||||
|
Mr. Liu Guoyue
|
- | 278 | 258 | 117 | 653 | |||||||||||||||
|
Mr. Li Shiqi
|
- | - | - | - | - | |||||||||||||||
|
Mr. Huang Jian
|
- | - | - | - | - | |||||||||||||||
|
Mr. Fan Xiaxia
|
- | 358 | 494 | 122 | 974 | |||||||||||||||
|
Mr. Mi Dabin
|
- | - | - | - | - | |||||||||||||||
|
Mr. Guo Hongbo
|
48 | - | - | - | 48 | |||||||||||||||
|
Mr. Xu Zujian
|
48 | - | - | - | 48 | |||||||||||||||
|
Ms. Li Song
|
- | - | - | - | - | |||||||||||||||
|
Mr. Li Zhensheng
|
74 | - | - | - | 74 | |||||||||||||||
|
Mr. Qi Yudong
|
74 | - | - | - | 74 | |||||||||||||||
|
Mr. Zhang Shouwen
|
74 | - | - | - | 74 | |||||||||||||||
|
Mr. Yue Heng
|
- | - | - | - | - | |||||||||||||||
|
Ms. Zhang Lizi
|
- | - | - | - | - | |||||||||||||||
|
Mr. Huang Long
|
- | - | - | - | - | |||||||||||||||
|
Mr. Shan Qunying
|
48 | - | - | - | 48 | |||||||||||||||
|
Mr. Xie Rongxing
|
48 | - | - | - | 48 | |||||||||||||||
|
Mr. Shao Shiwei
|
74 | - | - | - | 74 | |||||||||||||||
|
Mr. Wu Liansheng
|
74 | - | - | - | 74 | |||||||||||||||
|
Sub-total
|
562 | 636 | 752 | 239 | 2,189 | |||||||||||||||
|
Name of supervisor
|
||||||||||||||||||||
|
Mr. Ye Xiangdong
|
- | - | - | - | - | |||||||||||||||
|
Mr. Mu Xuan
|
- | - | - | - | - | |||||||||||||||
|
Mr. Hao Tingwei
|
- | - | - | - | - | |||||||||||||||
|
Ms. Zhang Mengjiao
|
- | - | - | - | - | |||||||||||||||
|
Mr. Gu Jianguo
|
48 | - | - | - | 48 | |||||||||||||||
|
Mr. Wang Zhaobin
|
- | 305 | 420 | 111 | 836 | |||||||||||||||
|
Ms. Zhang Ling
|
- | 129 | 505 | 102 | 736 | |||||||||||||||
|
Sub-total
|
48 | 434 | 925 | 213 | 1,620 | |||||||||||||||
|
Total
|
610 | 1,070 | 1,677 | 452 | 3,809 | |||||||||||||||
F-96
|
37
|
Directors’, supervisors’ and senior management’s emoluments (Continued)
|
|
|
(a)
|
Pre-tax benefits and social insurance of directors and supervisors (Continued)
|
The remuneration of every director and supervisor of the Company for the year ended 31 December 2013 is set out below:
|
Fees
|
Basic salaries
|
Performance salaries
|
Pension
|
Total
|
||||||||||||||||
|
Name of director
|
||||||||||||||||||||
|
Mr. Cao Peixi
|
- | - | - | - | - | |||||||||||||||
|
Mr. Huang Long
|
- | - | - | - | - | |||||||||||||||
|
Mr. Li Shiqi
|
- | - | - | - | - | |||||||||||||||
|
Mr. Huang Jian
|
- | - | - | - | - | |||||||||||||||
|
Mr. Liu Guoyue
|
- | 318 | 353 | 113 | 784 | |||||||||||||||
|
Mr. Fan Xiaxia
|
- | 351 | 484 | 113 | 948 | |||||||||||||||
|
Mr. Shan Qunying
|
48 | - | - | - | 48 | |||||||||||||||
|
Mr. Guo Hongbo
|
48 | - | - | - | 48 | |||||||||||||||
|
Mr. Xu Zujian
|
48 | - | - | - | 48 | |||||||||||||||
|
Mr. Xie Rongxing
|
48 | - | - | - | 48 | |||||||||||||||
|
Mr. Shao Shiwei
|
74 | - | - | - | 74 | |||||||||||||||
|
Mr. Wu Liansheng
|
74 | - | - | - | 74 | |||||||||||||||
|
Mr. Li Zhensheng
|
74 | - | - | - | 74 | |||||||||||||||
|
Mr. Qi Yudong
|
74 | - | - | - | 74 | |||||||||||||||
|
Mr. Zhang Shouwen
|
74 | - | - | - | 74 | |||||||||||||||
|
Sub-total
|
562 | 669 | 837 | 226 | 2,294 | |||||||||||||||
|
Name of supervisor
|
||||||||||||||||||||
|
Mr. Guo Junming
|
- | - | - | - | - | |||||||||||||||
|
Mr. Hao Tingwei
|
48 | - | - | - | 48 | |||||||||||||||
|
Ms. Zhang Mengjiao
|
- | - | - | - | - | |||||||||||||||
|
Mr. Gu Jianguo
|
48 | - | - | - | 48 | |||||||||||||||
|
Mr. Wang Zhaobin
|
- | 299 | 412 | 99 | 810 | |||||||||||||||
|
Ms. Zhang Ling
|
- | 113 | 438 | 95 | 646 | |||||||||||||||
|
Sub-total
|
96 | 412 | 850 | 194 | 1,552 | |||||||||||||||
|
Total
|
658 | 1,081 | 1,687 | 420 | 3,846 | |||||||||||||||
|
|
1
|
Resigned on 25 June 2015.
|
|
|
2
|
Appointed on 25 June 2015.
|
During the year, no option was granted to the directors or the supervisors (2014 and 2013: nil).
During the year, no emolument was paid to the directors or the supervisors (including the five highest paid employees) as an inducement to join or upon joining the Company or as compensation for loss of office (2014 and 2013: nil).
No director or supervisor had waived or agreed to waive any emoluments during the years 2015, 2014 and 2013.
F-97
|
37
|
Directors’, supervisors’ and senior management’s emoluments (Continued)
|
|
|
(b)
|
Five highest paid individuals
|
The five individuals whose emoluments were the highest in the Company and its subsidiaries for the year include two directors (2014 and 2013: one director) whose emoluments are reflected in the analysis presented above. The emoluments payable to the remaining three (2014 and 2013: four) individuals during the year (within the range of nil to RMB0.85 million) are as follows:
|
For the year ended 31 December
|
||||||||||||
|
2015
|
2014
|
2013
|
||||||||||
|
Basic salaries
|
910 | 1,220 | 1,197 | |||||||||
|
Performance salaries
|
1,260 | 1,680 | 1,647 | |||||||||
|
Pension
|
365 | 454 | 418 | |||||||||
| 2,535 | 3,354 | 3,262 | ||||||||||
|
38
|
Commitments
|
|
|
(a)
|
Capital commitments
|
Capital commitments mainly relate to the construction of new power projects, certain ancillary facilities and renovation projects for existing power plants. Details of such commitments are as follows:
|
As at 31 December
|
||||||||
|
2015
|
2014
|
|||||||
|
Contracted but not provided
|
20,388,412 | 20,333,112 | ||||||
|
|
(b)
|
Operating lease commitments
|
The Company and its subsidiaries have various operating lease arrangements for land and buildings. Some of the leases contain renewal options and most of the leases contain escalation clauses. Lease terms do not contain restrictions on the Company and its subsidiaries’ activities concerning dividends, additional debts or further leasing.
Total future minimum lease payments under non-cancelable operating leases are as follows:
|
As at 31 December
|
||||||||
|
2015
|
2014
|
|||||||
|
Land and buildings
|
||||||||
|
- not later than 1 year
|
193,772 | 149,344 | ||||||
|
- later than 1 year and not later than 2 years
|
65,652 | 147,495 | ||||||
|
- later than 2 years and not later than 5 years
|
85,793 | 116,968 | ||||||
|
- later than 5 years
|
949,978 | 1,040,418 | ||||||
|
Total
|
1,295,195 | 1,454,225 | ||||||
F-98
|
38
|
Commitments (Continued)
|
|
|
(b)
|
Operating lease commitments (Continued)
|
In addition, in accordance with a 30-year operating lease agreement signed by Huaneng Dezhou Power Plant (“Dezhou Power Plant”) and Shandong Land Bureau for the land occupied by Dezhou Power Plant Phases I and II in June 1994, annual rental amounted to approximately RMB30 million effective from June 1994 and is subject to revision at the end of the fifth year from the contract date. Thereafter, the annual rental is subject to revision once every three years. The increment for each rental revision is restricted to no more than 30% of the previous annual rental amount. For the years ended 31 December 2015, 2014 and 2013, the annual rentals was approximately RMB34 million.
|
|
(c)
|
Fuel purchase commitments
|
The Company and its subsidiaries have entered into various long-term fuel supply agreements with various suppliers in securing fuel supply for various periods. All the agreements require minimum, maximum or forecasted volume purchases and are subject to certain termination provisions. Related purchase commitments are as follows:
|
As at 31 December 2015
|
||||||
|
Periods
|
Purchase quantities
|
Estimated unit costs (RMB)
|
||||
|
A government-related enterprise
|
2016-2039
|
2.8 million
m3/day*
|
2.13/ m3
|
|||
|
A government-related enterprise
|
2016-2023
|
541 million
m3/year*
|
1.91/ m3
|
|||
|
2016-2023
|
450 million
m3/year*
|
1.91/ m3
|
||||
|
Other suppliers
|
2016
|
244.5BBtu**/day
|
approximately
|
|||
|
40,000/BBtu
|
||||||
|
2017-2022
|
248BBtu/day
|
approximately
|
||||
|
40,000/BBtu
|
||||||
|
2023
|
247.5BBtu/day
|
approximately
|
||||
|
40,000/BBtu
|
||||||
|
2024-2028
|
49.9BBtu/day
|
approximately
|
||||
|
55,000/BBtu
|
||||||
|
As at 31 December 2014
|
||||||
|
Periods
|
Purchase quantities
|
Estimated unit costs (RMB)
|
||||
|
A government-related enterprise
|
2015
|
2.8 million
ton/year
|
not defined
|
|||
|
A government-related enterprise
|
2015-2039
|
2.8 million
m3/day*
|
2.92/ m3
|
|||
|
A government-related enterprise
|
2015–2023
|
541 million
m3/year*
|
2.33/ m3
|
|||
|
2015–2023
|
450 million
m3/year*
|
2.92/ m3
|
||||
|
Other suppliers
|
2015-2016
|
244.5BBtu/day
|
approximately
|
|||
|
70,000/BBtu
|
||||||
|
2017-2022
|
248BBtu/day
|
approximately
|
||||
|
70,000/BBtu
|
||||||
|
2023
|
247.5BBtu/day
|
approximately
|
||||
|
70,000/BBtu
|
||||||
|
2024-2028
|
49.9BBtu/day
|
approximately
|
||||
|
90,000/BBtu
|
||||||
F-99
|
38
|
Commitments (Continued)
|
|
|
(c)
|
Fuel purchase commitments (Continued)
|
|
|
*
|
The quantities represent maximum volume, others represent minimum or forecasted volume if not specified.
|
|
|
**
|
BBtu: Billion British Thermal Unit
|
|
39
|
Business combinations
|
|
|
2015 Business combinations
|
|
|
On 13 October 2014, the Company entered into equity transfer agreements with Huaneng Group and HIPDC respectively to acquire:
|
|
|
·
|
91.80% equity interests of Hainan Power from Huaneng Group
|
|
|
·
|
75% equity interests of Wuhan Power from Huaneng Group
|
|
|
·
|
53.45% equity interests of Suzhou Thermal Power from Huaneng Group
|
|
|
·
|
97% equity interests of Dalongtan Hydropower from Huaneng Group
|
|
|
·
|
100% equity interests of Hualiangting Hydropower from Huaneng Group
|
|
|
·
|
60% equity interests of Chaohu Power from HIPDC
|
|
|
·
|
100% equity interests of Ruijin Power, Anyuan Power, Jingmen Thermal Power and Yingcheng Thermal Power from HIPDC
|
These entities are all mainly engaged in power generation and sales business. In early January 2015 the acquisition was completed and since then the Company obtained the control over above mentioned entities. The acquired business contributed consolidated revenue of RMB15,477 million and consolidated net profit of RMB2,581 million to the Company and its subsidiaries for the period from the date of acquisition to 31 December 2015.
The total consideration is RMB9.647 billion after adjustment of the profits generated from the date of valuation to the acquisition date in accordance with the equity transfer agreements, which has been settled in cash in 2015.
|
Acquisition Date
|
||
|
Fair value of total identifiable net assets
|
10,412,147
|
|
|
Non-controlling interests
|
(1,934,865)
|
|
|
Goodwill
|
1,169,966
|
|
|
Cash consideration
|
9,647,248
|
|
|
Less: Bank balances and cash of acquirees
|
972,686
|
|
|
Less: Restricted cash
|
(189,637)
|
|
|
Cash and cash equivalents of acquirees
|
783,049
|
|
|
Add: Cash paid for payables in relation to business combination of prior period
|
23,683
|
|
|
Cash consideration paid for acquisition of subsidiaries, net of cash acquired
|
8,887,882
|
Goodwill arising from the acquisitions is attributable to the synergies expected to arise after the acquisitions of the equity interests in the subsidiaries stated above, which mainly included goodwill arising from the acquisition of Hainan Power and Wuhan Power amounting to RMB506 million and RMB518 million respectively.
F-100
|
39
|
Business combinations (Continued)
|
The assets and liabilities arising from the acquisitions of above entities are as follows:
|
Hainan Power
|
Wuhan Power
|
Suzhou Thermal Power
|
Dalongtan Hydropower
|
Hualiangting Hydropower
|
||||||||||||||||||||||||||||||||||||
|
Fair value
|
Acquiree’s carrying amount
|
Fair value
|
Acquiree’s carrying amount
|
Fair value
|
Acquiree’s carrying amount
|
Fair value
|
Acquiree’s carrying amount
|
Fair value
|
Acquiree’s carrying amount
|
|||||||||||||||||||||||||||||||
|
Bank balances and cash
|
269,420 | 269,420 | 241,796 | 241,796 | 25,718 | 25,718 | 3,709 | 3,709 | 11,470 | 11,470 | ||||||||||||||||||||||||||||||
|
Property, plant and equipment
|
8,198,754 | 7,347,394 | 4,723,925 | 3,929,268 | 626,551 | 552,971 | 303,255 | 303,255 | 4,224 | 4,224 | ||||||||||||||||||||||||||||||
|
Land use rights
|
1,328,452 | 412,525 | 1,312,397 | 186,236 | 81,075 | 20,104 | 12,420 | 12,420 | 32,707 | 32,707 | ||||||||||||||||||||||||||||||
|
Deferred income tax assets
|
- | 109,888 | - | 3,727 | - | 2,746 | - | - | - | - | ||||||||||||||||||||||||||||||
|
Investment in an associate
|
136,244 | 136,244 | - | - | - | - | - | - | - | - | ||||||||||||||||||||||||||||||
|
Available-for-sale financial assets
|
- | - | - | - | 33 | 33 | - | - | 105 | 105 | ||||||||||||||||||||||||||||||
|
Other non-current assets
|
26,823 | 25,180 | - | - | 373 | 373 | - | - | 207 | 207 | ||||||||||||||||||||||||||||||
|
Inventories
|
167,476 | 167,476 | 234,750 | 234,750 | 25,508 | 25,508 | 92 | 92 | 359 | 359 | ||||||||||||||||||||||||||||||
|
Receivables and other current assets
|
677,902 | 677,902 | 459,640 | 459,640 | 37,336 | 37,336 | 3,451 | 3,451 | 3,090 | 3,090 | ||||||||||||||||||||||||||||||
|
Payables and other current liabilities
|
(586,322 | ) | (586,322 | ) | (480,956 | ) | (480,956 | ) | (95,216 | ) | (95,216 | ) | (9,959 | ) | (9,959 | ) | (32,021 | ) | (32,021 | ) | ||||||||||||||||||||
|
Salary and welfare payables
|
(74,801 | ) | (74,801 | ) | (20,336 | ) | (20,336 | ) | (4,270 | ) | (4,270 | ) | - | - | (2,387 | ) | (2,387 | ) | ||||||||||||||||||||||
|
Borrowings
|
(5,380,813 | ) | (5,380,813 | ) | (2,844,530 | ) | (2,844,530 | ) | (230,000 | ) | (230,000 | ) | (199,187 | ) | (199,187 | ) | (10,000 | ) | (10,000 | ) | ||||||||||||||||||||
|
Deferred income tax liabilities
|
(332,344 | ) | - | (476,477 | ) | - | (30,892 | ) | - | - | - | - | - | |||||||||||||||||||||||||||
|
Other non-current liabilities
|
(2,700 | ) | (2,700 | ) | (40,037 | ) | (40,037 | ) | (7,176 | ) | (7,176 | ) | (760 | ) | (760 | ) | - | - | ||||||||||||||||||||||
|
Total identifiable net assets
|
4,428,091 | 3,101,393 | 3,110,172 | 1,669,558 | 429,040 | 328,127 | 113,021 | 113,021 | 7,754 | 7,754 | ||||||||||||||||||||||||||||||
|
Chaohu Power
|
Ruijin Power
|
Anyuan Power
|
Jingmen Thermal Power
|
Yingcheng Thermal Power
|
||||||||||||||||||||||||||||||||||||
|
Fair value
|
Acquiree’s carrying amount
|
Fair value
|
Acquiree’s carrying amount
|
Fair value
|
Acquiree’s carrying amount
|
Fair value
|
Acquiree’s carrying amount
|
Fair value
|
Acquiree’s carrying amount
|
|||||||||||||||||||||||||||||||
|
Bank balances and cash
|
30,210 | 30,210 | 53,381 | 53,381 | 188,402 | 188,402 | 61,508 | 61,508 | 87,072 | 87,072 | ||||||||||||||||||||||||||||||
|
Property, plant and equipment
|
3,170,347 | 2,598,201 | 2,028,220 | 1,942,631 | 3,330,391 | 3,323,710 | 2,467,152 | 2,465,509 | 1,609,179 | 1,609,642 | ||||||||||||||||||||||||||||||
|
Land use rights
|
4,603 | 3,344 | 52,269 | 53,909 | 89,264 | 89,264 | 6,615 | 6,784 | 76,638 | 71,950 | ||||||||||||||||||||||||||||||
|
Other non-current assets
|
230 | 230 | 294 | 294 | 83,030 | 83,030 | 88 | 88 | - | - | ||||||||||||||||||||||||||||||
|
Inventories
|
131,697 | 131,697 | 115,013 | 115,013 | 1,984 | 1,984 | 30,529 | 30,529 | - | - | ||||||||||||||||||||||||||||||
|
Receivables and other current assets
|
252,004 | 252,004 | 184,600 | 184,600 | 29,401 | 29,401 | 102,822 | 102,822 | 1,105 | 1,105 | ||||||||||||||||||||||||||||||
|
Payables and other current liabilities
|
(275,897 | ) | (275,897 | ) | (161,977 | ) | (161,977 | ) | (700,972 | ) | (700,972 | ) | (379,138 | ) | (379,138 | ) | (346,586 | ) | (346,586 | ) | ||||||||||||||||||||
|
Salary and welfare payables
|
(916 | ) | (916 | ) | (1,596 | ) | (1,596 | ) | (56,984 | ) | (56,984 | ) | (868 | ) | (868 | ) | - | - | ||||||||||||||||||||||
|
Borrowings
|
(1,690,220 | ) | (1,690,220 | ) | (1,868,750 | ) | (1,868,750 | ) | (3,082,500 | ) | (3,082,500 | ) | (1,886,834 | ) | (1,886,834 | ) | (1,162,000 | ) | (1,162,000 | ) | ||||||||||||||||||||
|
Deferred income tax liabilities
|
(143,351 | ) | - | (20,987 | ) | - | (1,670 | ) | - | (369 | ) | - | (1,057 | ) | - | |||||||||||||||||||||||||
|
Other non-current liabilities
|
(932 | ) | (932 | ) | (110 | ) | (110 | ) | (25,288 | ) | (25,288 | ) | - | - | (54,977 | ) | (54,977 | ) | ||||||||||||||||||||||
|
Total identifiable net assets/ (liabilities)
|
1,477,775 | 1,047,721 | 380,357 | 317,395 | (144,942 | ) | (149,953 | ) | 401,505 | 400,400 | 209,374 | 206,206 | ||||||||||||||||||||||||||||
F-101
|
39
|
Business combinations (Continued)
|
2014 Business combinations
Acquisition of Zhumadian Wind Power
In November 2014, the Company acquired 90% equity interests of Zhumadian Wind Power from Henan Lantian Group Co., Ltd. The aggregate cash consideration of the acquisition amounted to RMB23.68 million. The fair values of assets and liabilities arising from the acquisition of Zhumadian Wind Power and non-controlling interest’s proportionate share of acquiree’s net assets on the acquisition date are as follows:
|
Zhumadian Wind Power
|
||
|
Bank balances and cash
|
9
|
|
|
Other receivables
|
15,583
|
|
|
Inventories
|
20
|
|
|
Property, plant and equipment
|
10,750
|
|
|
Payables and other liabilities
|
(48)
|
|
|
Total identifiable net assets
|
26,314
|
|
|
Non-controlling interests
|
(2,631)
|
|
|
Goodwill
|
-
|
|
|
Consideration
|
23,683
|
As at 31 December 2014, Zhumadian Wind Power was still under construction.
2013 Business combinations
|
|
(a)
|
Acquisition of Luoyang Cogeneration
|
In April 2013, the Company acquired 60% equity interests of Luoyang Cogeneration from Luoyang Silicon Industry Group Co., Ltd. and Luoyang Hairun Power Project Management Ltd. The aggregate cash consideration of the acquisition amounted to RMB180 million. The fair values of assets and liabilities arising from the acquisition of Luoyang Cogeneration and proportionate share of acquiree’s net assets by non-controlling interests on the acquisition date are as follows:
|
Luoyang Cogeneration
|
||
|
Bank balances and cash
|
131,485
|
|
|
Other receivables
|
2,316
|
|
|
Property, plant and equipment
|
30,885
|
|
|
Land use rights
|
145,075
|
|
|
Payables and other liabilities
|
(9,761)
|
|
|
Total identifiable net assets
|
300,000
|
|
|
Non-controlling interests
|
(120,000)
|
|
|
Goodwill
|
-
|
|
|
Consideration
|
180,000
|
As at 31 December 2013, Luoyang Cogeneration was still under construction.
F-102
|
39
|
Business combinations (Continued)
|
2013 Business combinations (Continued)
|
|
(b)
|
Acquisition of control in Jinling CCGT
|
Jinling CCGT was previously an associate of the Company. In 2013, one of the non-controlling shareholders with 21% equity interests in Jinling CCGT entered into a voting in concert agreement with the Company whereby it agreed to vote the same in respect of significant financial and operating decisions made by the Company effective from 1 January 2013. As a result, the Company acquired control of Jinling CCGT since 1 January 2013.
Jinling CCGT is a limited liability company established on 6 December 2011 in Nanjing, Jiangsu Province. Jinling CCGT is primarily engaging in construction, management of cogeneration power plants and related projects. As at the acquisition date, Jinling CCGT was still under construction and its two power generation units went into operation in 2013 in succession. Financial information of Jinling CCGT is as follows:
|
From the acquisition date
|
||
|
Items
|
to 31 December 2013
|
|
|
Revenue
|
697,176
|
|
|
Net loss
|
(16,243)
|
|
|
Net cash outflow from operating activities
|
(37,163)
|
The identifiable assets and liabilities of Jinling CCGT as at the acquisition date are as follows:
|
Jinling CCGT
|
||
|
Bank balances and cash
|
78,249
|
|
|
Accounts receivable
|
9,621
|
|
|
Property, plant and equipment
|
733,602
|
|
|
Accounts payable
|
(56,472)
|
|
|
Long-term loans
|
(490,000)
|
|
|
Total identifiable net assets
|
275,000
|
|
|
Non-controlling interests
|
(134,750)
|
|
|
Net assets acquired
|
140,250
|
|
|
Fair value of the investment in associate before the acquisition date
|
140,250
|
F-103
|
40
|
Non-controlling interests
|
The following table summarizes the information relating to each of the Company and subsidiaries that have material non-controlling interests (“NCI”):
|
Qinbei Power Company
|
Beijing Cogeneration
|
Luohuang Power Company
|
Weihai Power Company
|
Jinling Power Company
|
Yueyang Power Company
|
Shidongkou Power Company
|
Yangliuqing Cogeneration
|
Other individually immaterial subsidiaries
|
Total
|
|||||||||||||||||||||||||||||||
|
NCI percentage
|
40 | % | 59 | % | 40 | % | 40 | % | 40 | % | 45 | % | 50 | % | 45 | % | ||||||||||||||||||||||||
|
31 December 2015
|
||||||||||||||||||||||||||||||||||||||||
|
Non-current assets
|
11,739,361 | 5,193,038 | 4,154,105 | 4,934,579 | 5,746,576 | 5,297,441 | 3,924,128 | 2,699,074 | ||||||||||||||||||||||||||||||||
|
Current assets
|
1,511,345 | 1,203,956 | 943,954 | 464,234 | 733,084 | 752,111 | 461,184 | 455,209 | ||||||||||||||||||||||||||||||||
|
Non-current liabilities
|
(3,313,836 | ) | (137,657 | ) | (300,428 | ) | (117,412 | ) | (2,310,221 | ) | (1,314,199 | ) | (1,379,640 | ) | (243,675 | ) | ||||||||||||||||||||||||
|
Current liabilities
|
(5,310,585 | ) | (1,090,231 | ) | (1,674,490 | ) | (1,984,600 | ) | (1,584,917 | ) | (2,173,454 | ) | (1,096,885 | ) | (800,584 | ) | ||||||||||||||||||||||||
|
Net assets
|
4,626,285 | 5,169,106 | 3,123,141 | 3,296,801 | 2,584,522 | 2,561,899 | 1,908,787 | 2,110,024 | ||||||||||||||||||||||||||||||||
|
Carrying amount of NCI
|
1,864,430 | 3,036,024 | 1,228,238 | 1,318,720 | 1,033,831 | 1,150,830 | 954,394 | 948,615 | 6,016,659 | 17,551,741 | ||||||||||||||||||||||||||||||
|
Revenue
|
6,078,743 | 5,675,930 | 3,313,706 | 3,941,344 | 3,785,240 | 3,045,746 | 2,115,996 | 1,999,749 | ||||||||||||||||||||||||||||||||
|
Net profit
|
1,196,791 | 1,308,936 | 486,578 | 1,019,397 | 857,881 | 452,894 | 459,330 | 319,976 | ||||||||||||||||||||||||||||||||
|
Total comprehensive income
|
1,196,791 | 1,308,936 | 486,578 | 1,019,397 | 857,881 | 452,894 | 459,330 | 319,976 | ||||||||||||||||||||||||||||||||
|
Profit allocated to NCI
|
478,716 | 772,272 | 194,631 | 407,759 | 343,153 | 203,802 | 229,665 | 143,989 | 833,187 | 3,607,174 | ||||||||||||||||||||||||||||||
|
Other comprehensive income allocated to NCI
|
- | - | - | - | - | - | - | - | (96 | ) | (96 | ) | ||||||||||||||||||||||||||||
|
Cash flow from operating activities
|
2,541,580 | 1,488,085 | 932,367 | 1,513,744 | 1,338,323 | 1,016,136 | 834,278 | 571,512 | ||||||||||||||||||||||||||||||||
|
Cash flow from investment activities
|
(33,499 | ) | (574,149 | ) | (151,647 | ) | (235,657 | ) | (103,779 | ) | 538,740 | (26,301 | ) | (14,100 | ) | |||||||||||||||||||||||||
|
Cash flow from financing activities
|
(2,328,362 | ) | (880,545 | ) | (758,054 | ) | (1,278,814 | ) | (1,287,469 | ) | (1,571,651 | ) | (853,459 | ) | (580,094 | ) | ||||||||||||||||||||||||
|
Net increase /(decrease) in cash and cash equivalents
|
179,719 | 36,511 | 22,666 | (727 | ) | (52,925 | ) | (16,775 | ) | (45,482 | ) | (22,599 | ) | |||||||||||||||||||||||||||
|
Dividends paid to NCI
|
697,436 | 362,958 | 220,000 | 83,320 | 373,143 | 135,000 | 270,000 | 183,055 | ||||||||||||||||||||||||||||||||
|
31 December 2014
|
||||||||||||||||||||||||||||||||||||||||
|
Non-current assets
|
12,468,950 | 4,861,762 | 4,491,788 | 5,016,286 | 6,053,110 | 5,481,010 | 4,184,272 | 2,753,641 | ||||||||||||||||||||||||||||||||
|
Current assets
|
1,671,490 | 1,348,041 | 967,057 | 643,829 | 681,848 | 1,675,476 | 479,770 | 635,546 | ||||||||||||||||||||||||||||||||
|
Non-current liabilities
|
(4,033,498 | ) | (505,544 | ) | (337,330 | ) | (291,886 | ) | (3,336,497 | ) | (1,512,909 | ) | (1,708,800 | ) | (290,710 | ) | ||||||||||||||||||||||||
|
Current liabilities
|
(4,832,978 | ) | (1,161,981 | ) | (2,184,952 | ) | (2,198,983 | ) | (1,054,216 | ) | (3,234,572 | ) | (1,154,784 | ) | (901,641 | ) | ||||||||||||||||||||||||
|
Net assets
|
5,273,964 | 4,542,278 | 2,936,563 | 3,169,246 | 2,344,245 | 2,409,005 | 1,800,458 | 2,196,836 | ||||||||||||||||||||||||||||||||
|
Carrying amount of NCI
|
2,088,919 | 2,570,827 | 1,153,607 | 1,267,699 | 937,720 | 1,082,027 | 900,229 | 987,681 | 3,664,506 | 14,653,215 | ||||||||||||||||||||||||||||||
|
Revenue
|
7,202,737 | 5,522,496 | 3,790,158 | 4,462,576 | 4,603,881 | 3,414,762 | 2,212,549 | 2,469,628 | ||||||||||||||||||||||||||||||||
|
Net profit
|
1,148,208 | 1,267,225 | 307,786 | 990,936 | 575,309 | 381,660 | 415,819 | 455,002 | ||||||||||||||||||||||||||||||||
|
Total comprehensive income
|
1,148,208 | 1,267,225 | 307,786 | 990,936 | 575,309 | 381,660 | 415,819 | 455,002 | ||||||||||||||||||||||||||||||||
|
Profit allocated to NCI
|
459,283 | 747,663 | 123,114 | 396,374 | 230,124 | 171,747 | 207,909 | 204,751 | 264,090 | 2,805,055 | ||||||||||||||||||||||||||||||
|
Other comprehensive income allocated to NCI
|
- | - | - | - | - | - | - | - | (313 | ) | (313 | ) | ||||||||||||||||||||||||||||
|
Cash flow from operating activities
|
2,086,088 | 1,544,626 | 838,484 | 1,522,446 | 1,278,901 | 939,572 | 740,734 | 667,560 | ||||||||||||||||||||||||||||||||
|
Cash flow from investment activities
|
(1,150,754 | ) | (680,480 | ) | (224,873 | ) | (254,105 | ) | (248,702 | ) | (845,313 | ) | (157,852 | ) | (170,819 | ) | ||||||||||||||||||||||||
|
Cash flow from financing activities
|
(931,763 | ) | (920,279 | ) | (602,121 | ) | (1,271,787 | ) | (1,108,039 | ) | (111,758 | ) | (508,833 | ) | (498,704 | ) | ||||||||||||||||||||||||
|
Net increase /(decrease) in cash and cash equivalents
|
3,571 | (56,133 | ) | 11,490 | (3,446 | ) | (77,840 | ) | (17,499 | ) | 74,049 | (1,963 | ) | |||||||||||||||||||||||||||
|
Dividends paid to NCI
|
- | 155,911 | 100,000 | 200,011 | 210,169 | 141,683 | 200,000 | 99,972 | ||||||||||||||||||||||||||||||||
F-104
|
40
|
Non-controlling interests (Continued)
|
|
Qinbei Power Company
|
Beijing Cogeneration
|
Luohuang Power Company
|
Weihai Power Company
|
Jinling Power Company
|
Yueyang Power Company
|
Shidongkou Power Company
|
Yangliuqing Cogeneration
|
Other individually immaterial subsidiaries
|
Total
|
|||||||||||||||||||||||||||||||
|
NCI percentage
|
40 | % | 59 | % | 40 | % | 40 | % | 40 | % | 45 | % | 50 | % | 45 | % | ||||||||||||||||||||||||
|
31 December 2013
|
||||||||||||||||||||||||||||||||||||||||
|
Non-current assets
|
12,846,706 | 4,993,083 | 4,697,318 | 5,210,683 | 7,614,270 | 5,730,660 | 4,353,809 | 2,805,530 | ||||||||||||||||||||||||||||||||
|
Current assets
|
1,739,894 | 945,067 | 980,195 | 693,725 | 1,031,919 | 1,071,740 | 443,995 | 606,043 | ||||||||||||||||||||||||||||||||
|
Non-current liabilities
|
(3,431,060 | ) | (654,821 | ) | (706,101 | ) | (42,560 | ) | (3,786,577 | ) | (1,931,979 | ) | (2,275,801 | ) | (697,662 | ) | ||||||||||||||||||||||||
|
Current liabilities
|
(7,065,834 | ) | (2,214,356 | ) | (1,842,635 | ) | (2,975,210 | ) | (2,249,999 | ) | (2,543,955 | ) | (737,365 | ) | (749,917 | ) | ||||||||||||||||||||||||
|
Net assets
|
4,089,706 | 3,068,973 | 3,128,777 | 2,886,638 | 2,609,613 | 2,326,466 | 1,784,638 | 1,963,994 | ||||||||||||||||||||||||||||||||
|
Carrying amount of NCI
|
1,635,882 | 1,810,694 | 1,251,511 | 1,154,655 | 1,043,845 | 1,046,910 | 892,319 | 883,797 | 3,022,696 | 12,742,309 | ||||||||||||||||||||||||||||||
|
Revenue
|
7,740,172 | 4,109,609 | 5,083,562 | 4,403,700 | 5,815,540 | 4,051,236 | 2,869,727 | 2,577,167 | ||||||||||||||||||||||||||||||||
|
Net profit
|
989,508 | 260,224 | 629,482 | 831,852 | 1,017,767 | 379,155 | 533,979 | 252,446 | ||||||||||||||||||||||||||||||||
|
Total comprehensive income
|
989,508 | 260,224 | 629,482 | 831,852 | 1,017,767 | 379,155 | 533,979 | 252,446 | ||||||||||||||||||||||||||||||||
|
Profit allocated to NCI
|
395,803 | 153,532 | 251,793 | 332,741 | 407,107 | 170,620 | 266,990 | 113,601 | 381,807 | 2,473,994 | ||||||||||||||||||||||||||||||
|
Other comprehensive loss allocated to NCI
|
- | - | - | - | - | - | - | - | (757 | ) | (757 | ) | ||||||||||||||||||||||||||||
|
Cash flow from operating activities
|
2,379,982 | 943,889 | 1,330,704 | 1,473,143 | 1,741,649 | 926,746 | 685,572 | 627,390 | ||||||||||||||||||||||||||||||||
|
Cash flow from investment activities
|
(792,933 | ) | (352,980 | ) | (260,088 | ) | (313,930 | ) | (304,778 | ) | (320,987 | ) | (127,757 | ) | (116,495 | ) | ||||||||||||||||||||||||
|
Cash flow from financing activities
|
(1,960,638 | ) | (564,632 | ) | (1,079,801 | ) | (1,256,761 | ) | (1,480,323 | ) | (648,793 | ) | (643,589 | ) | (504,954 | ) | ||||||||||||||||||||||||
|
Net (decrease)/increase in cash and cash equivalents
|
(373,589 | ) | 26,277 | (9,185 | ) | (97,548 | ) | (43,452 | ) | (43,044 | ) | (85,774 | ) | 5,957 | ||||||||||||||||||||||||||
|
Dividends paid to NCI
|
- | 132,865 | 69,595 | 33,358 | 158,649 | - | 75,000 | - | ||||||||||||||||||||||||||||||||
F-105
|
41
|
Pending Arbitration
|
In April 2015, a subsidiary’s construction contractor filed for an arbitration, demanding a compensation of RMB 83.46 million, inclusive of interests from the subsidiary. As the arbitration is ongoing, the amount of settlement cannot be estimated reliably. No provision has been recognized as at 31 December 2015.
|
42
|
Subsequent events
|
|
|
(a)
|
After the end of the reporting period, the directors proposed a final dividend. Further details are disclosed in Note 22.
|
|
|
(b)
|
The Company issued super short-term bonds with a face value of RMB2 billion bearing annual interest rate of 2.59% in March 2016, such bonds are denominated in RMB and mature in 270 days.
|
The Company issued super short-term bonds with a face value of RMB2 billion bearing annual interest rate of 2.48% in March 2016, such bonds are denominated in RMB and mature in 270 days.
F-106