UNITED STATES
SECURITIES AND EXCHANGE COMMISSION
Washington, D.C. 20549
FORM
|
|
ANNUAL REPORT PURSUANT TO SECTION 13 OR 15(d) OF THE SECURITIES EXCHANGE ACT OF 1934 |
For the Fiscal Year Ended
|
|
TRANSITION REPORT PURSUANT TO SECTION 13 OR 15(d) OF THE SECURITIES EXCHANGE ACT OF 1934 |
For the Transition Period from to
Commission file number
(Exact name of registrant as specified in its charter)
|
|
|
|
|
(State of Incorporation) |
|
(I.R.S. Employer Identification Number) |
|
|
|
|
|
|
|
|
|
|
|
( |
|
(Address of principal executive offices, including zip code) |
|
(Registrant's telephone number, including area code) |
Securities registered pursuant to Section 12(b) of the Act:
|
Title of each class |
|
Trading Symbol(s) |
|
Name of each exchange on which registered |
|
|
|
|
|
|
Securities registered pursuant to Section 12(g) of the Act: None
Indicate by check mark if the registrant is a well-known seasoned issuer, as defined in Rule 405 of the Securities Act.
Indicate by check mark if the registrant is not required to file reports pursuant to Section 13 or Section 15(d) of the Act. Yes ☐
Indicate by check mark whether the registrant (1) has filed all reports required to be filed by Section 13 or 15(d) of the Securities Exchange Act of 1934 during the preceding 12 months (or for such shorter period that the registrant was required to file such reports), and (2) has been subject to such filing requirements for the past 90 days.
Indicate by check mark whether the Registrant has submitted electronically every Interactive Data File required to be submitted pursuant to Rule 405 of Regulations S-T (§ 232.405 of this chapter) during the preceding 12 months (or for such shorter period that the Registrant was required to submit such files).
Indicate by check mark whether the registrant is a large accelerated filer, an accelerated filer, a non-accelerated filer, a smaller reporting company, or an emerging growth company. See the definitions of “large accelerated filer,” “accelerated filer,” “smaller reporting company,” and “emerging growth company” in Rule 12b-2 of the Exchange Act.
|
Large Accelerated Filer |
|
☐ |
|
|
|
☒ |
|
|
|
|
|
|
|
|
|
Non-accelerated Filer |
|
☐ |
|
Smaller Reporting Company |
|
|
|
Emerging growth company |
|
|
|
|
|
|
If an emerging growth company, indicate by check mark if the registrant has elected not to use the extended transition period for complying with any new or revised financial accounting standards provided pursuant to Section 13(a) of the Exchange Act. ☐
Indicate by check mark whether the registrant has filed a report on and attestation to its management’s assessment of the effectiveness of its internal control over financial reporting under Section 404(b) of the Sarbanes-Oxley Act (15 U.S.C. 7262(b)) by the registered public accounting firm that prepared or issued its audit report.
Indicate by check mark whether the registrant is a shell company (as defined in Rule 12b-2 of the Act). Yes
The aggregate market value of the registrant's outstanding common stock held by non-affiliates of the registrant on June 30, 2020 was $
DOCUMENTS INCORPORATED BY REFERENCE
Portions of the Proxy Statement for the Annual Meeting of Stockholders to be held on May 12, 2021 are incorporated herein by reference in Part III.
ADTRAN, Inc.
Annual Report on Form 10-K
For the Fiscal Year Ended December 31, 2020
Table of Contents
|
|
|
|
|
Page Number |
|
|
|
|
|
|
|
|
|
|
2 |
|
|
|
|
|
3 |
|
|
|
|
|
|
|
|
|
|
|
|
|
|
|
|
|
|
|
|
Item 1. |
|
|
7 |
|
|
|
|
|
|
|
|
Item 1A. |
|
|
17 |
|
|
|
|
|
|
|
|
Item 1B. |
|
|
31 |
|
|
|
|
|
|
|
|
Item 2. |
|
|
31 |
|
|
|
|
|
|
|
|
Item 3. |
|
|
31 |
|
|
|
|
|
|
|
|
Item 4. |
|
|
32 |
|
|
|
|
|
|
|
|
|
|
|
|
|
|
|
|
|
|
|
|
Item 5. |
|
|
33 |
|
|
|
|
|
|
|
|
Item 6. |
|
|
34 |
|
|
|
|
|
|
|
|
Item 7. |
|
Management’s Discussion and Analysis of Financial Condition and Results of Operations |
|
35 |
|
|
|
|
|
|
|
Item 7A. |
|
|
49 |
|
|
|
|
|
|
|
|
Item 8. |
|
|
50 |
|
|
|
|
|
|
|
|
Item 9. |
|
Changes in and Disagreements with Accountants on Accounting and Financial Disclosure |
|
98 |
|
|
|
|
|
|
|
Item 9A. |
|
|
98 |
|
|
|
|
|
|
|
|
Item 9B. |
|
|
99 |
|
|
|
|
|
|
|
|
|
|
|
|
|
|
|
|
|
|
|
|
Item 10. |
|
|
100 |
|
|
|
|
|
|
|
|
Item 11. |
|
|
100 |
|
|
|
|
|
|
|
|
Item 12. |
|
Security Ownership of Certain Beneficial Owners and Management and Related Stockholder Matters |
|
100 |
|
|
|
|
|
|
|
Item 13. |
|
Certain Relationships and Related Transactions and Director Independence |
|
101 |
|
|
|
|
|
|
|
Item 14. |
|
|
101 |
|
|
|
|
|
|
|
|
|
|
|
|
|
|
|
|
|
|
|
|
Item 15. |
|
|
102 |
|
|
|
|
|
|
|
|
Item 16. |
|
|
106 |
|
|
|
|
|
|
|
|
|
|
|
107 |
|
|
|
|
|
|
|
|
|
|
|
|
|
1
CAUTIONARY NOTE REGARDING FORWARD-LOOKING STATEMENTS
The Private Securities Litigation Reform Act of 1995 provides a safe harbor for forward-looking statements made by or on behalf of ADTRAN, Inc. (“ADTRAN”, the “Company”, “we”, “our” or “us”). ADTRAN and its representatives may from time to time make written or oral forward-looking statements, including statements contained in this report, our other filings with the Securities and Exchange Commission (the “SEC”) and other communications with our stockholders. Any statement that does not directly relate to a historical or current fact is a forward-looking statement. Generally, the words “believe”, “expect”, “intend”, “estimate”, “anticipate”, “will”, “may”, “could” and similar expressions identify forward-looking statements. We caution you that any forward-looking statements made by us or on our behalf are subject to uncertainties and other factors that could affect the accuracy of such statements. For a detailed description of the risk factors associated with our business, see Part I, Item 1A of this report. We caution investors that other factors may prove to be important in the future in affecting our operating results. New factors emerge from time to time, and it is not possible for us to predict all of these factors, nor can we assess the impact each factor, or a combination of factors, may have on our business. You are further cautioned not to place undue reliance on these forward-looking statements because they speak only of our views as of the date that the statements were made. We undertake no obligation to publicly update or revise any forward-looking statements, whether as a result of new information, future events or otherwise, except as required by law.
2
GLOSSARY OF SELECTED TERMS
Below are certain acronyms, concepts and defined terms commonly used in our industry and in this Annual Report on Form 10-K, along with their meanings:
|
Acronym/Concept/ Defined Term |
Meaning |
|
10G EPON |
10-Gigabit EPON (as defined below) |
|
10G PON |
10-Gigabit PON (as defined below) |
|
ABO |
Accumulated Benefit Obligation |
|
ADSL |
Asymmetric Digital Subscriber Line |
|
ADTN |
Ticker symbol for ADTRAN |
|
ADTRAN GmbH |
ADTRAN Gesellschaft mit beschränkter Haftung; Limited liability subsidiary of ADTRAN, Inc. in Germany |
|
APAC |
Asia Pacific |
|
ASU |
Accounting Standards Update |
|
ATIS |
Alliance for Telecommunications Industry Solutions; Standards organization that develops technical and operational standards and solutions for the information and technology industry |
|
ATM |
Asynchronous Transfer Mode |
|
BBF |
Broadband Forum |
|
CAD/CAM |
Computer-Aided Design/Computer-Aided Manufacturing |
|
CAF |
Connect America Fund |
|
CARES Act |
Coronavirus Aid, Relief, and Economic Security Act |
|
carrier |
Entity that provides voice, data or video services to consumers and businesses |
|
CLEC |
Competitive Local Exchange Carrier |
|
COSO |
Committee of Sponsoring Organizations |
|
CPE |
Customer-Premises Equipment |
|
CSP |
Communication Service Provider |
|
C-TPAT |
United States Customs Trade Partnership Against Terrorism |
|
DGCL |
Delaware General Corporation Law |
|
DOCSIS |
Data Over Cable Service Interface Specification |
|
DPU |
Distribution Point Unit |
|
DSL |
Digital Subscriber Line |
|
DSLAM |
Digital Subscriber Line Access Multiplexer |
|
DSO |
Days Sales Outstanding |
|
EBIT |
Earnings Before Interest and Taxes |
|
EMEA |
Europe, Middle East and Africa |
|
EMS |
Element Management System |
|
EPON |
Ethernet Passive Optical Network |
|
EPS |
Earnings Per Share |
|
ERP |
Enterprise Resource Planning |
|
Ethernet |
Means of connecting computers over a LAN (as defined below) |
|
ETSI |
European Telecommunications Standards Institute |
|
EU |
European Union |
|
FASB |
Financial Accounting Standards Board |
3
|
FCC |
Federal Communications Commission |
|
FCPA |
Foreign Corrupt Practices Act |
|
FOB |
Free on Board |
|
FSAN |
Full Service Access Network |
|
FTTN |
Fiber to the Node |
|
FTTP |
Fiber to the Premises |
|
FTTdp |
Fiber to the distribution point |
|
FTTx |
Fiber to the x; Any broadband network architecture using optical fiber to provide all or part of the local loop used for last mile telecommunications |
|
GAAP |
Generally Accepted Accounting Principles |
|
GDPR |
General Data Protection Regulation |
|
Gfast |
Digital subscriber line protocol standard for local loops (telephone lines) shorter than 500 meters with performance targets between 100 Mbps (as defined below) and 1 gigabit per second, depending on loop length |
|
GILTI |
Global Intangible Low-Taxed Income |
|
GPON |
Gigabit Passive Optical Network |
|
HDSL |
High-bit-rate Digital Subscriber Line |
|
hiX |
ADTRAN Multiservice Access Platform sold in the EU |
|
ICT |
Information and Communications Technology |
|
ILEC |
Incumbent Local Exchange Carrier |
|
IoT |
Internet of Things |
|
IP |
Internet Protocol |
|
ISO |
International Organization for Standardization |
|
ITU-T |
International Telecommunication Union – Telecommunication Standardization Sector |
|
LAN |
Local Area Network |
|
LATAM |
Latin America |
|
LIBOR |
London Inter-bank Offered Rate |
|
MBO |
Management by Objectives |
|
Mbps |
Megabits Per Second |
|
MEF |
Metro Ethernet Forum |
|
micro-node |
Small fixed access nodes that use VDSL2 and Gfast to deliver ultra-broadband services to a small number of end users |
|
MSAN |
Multi-Service Access Network |
|
MSO |
Multiple System Operator |
|
MSP |
Managed Service Provider |
|
NASDAQ |
National Association of Securities Dealers Automated Quotations, an American stock exchange based in New York City |
|
NFV |
Network Functions Virtualization |
|
NG-PON2 |
Next-Generation Passive Optical Network 2 |
|
NOC |
Network Operations Center |
|
OCP |
Open Compute Project |
|
ODM |
Original Design Manufacturer |
|
OEM |
Original Equipment Manufacturer |
|
OIS |
Overnight Index Swap |
|
OLT |
Optical Line Terminal |
4
|
ONE |
Optical Networking Edge |
|
ONT |
Optical Network Terminal |
|
ONU |
Optical Network Unit |
|
Operator |
Entity that provides voice, data or video services to consumers and businesses |
|
OS |
Operating System |
|
OSP |
Outside Plant |
|
OTT |
Over the Top |
|
PBO |
Projected Benefit Obligation |
|
PCAOB |
Public Company Accounting Oversight Board |
|
PON |
Passive Optical Network |
|
PSU |
Performance Stock Unit |
|
QSFP |
Quad Small Form-factor Pluggable |
|
RDOF |
Rural Digital Opportunity Fund |
|
REACH |
Registration, Evaluation, Authorization, and Restriction of Chemicals |
|
RFoG |
Radio Frequency over Glass |
|
RoHS |
Restriction of the Use of Certain Hazardous Substances in Electrical and Electronic Equipment |
|
RSP |
Regional Service Provider |
|
RSU |
Restricted Stock Unit |
|
SaaS |
Software-as-a-Service |
|
SAR |
Stock Appreciation Rights |
|
SD-Access |
Software Defined Access |
|
SDN |
Software Defined Networking |
|
SDX |
Software Defined Everything |
|
SDO |
Standards Developing Organizations |
|
SEC |
Securities and Exchange Commission |
|
Service Provider |
An entity that provides voice, data or video services to consumers and businesses |
|
SFP |
Small Form-factor Pluggable |
|
SFP+ |
Enhanced Small Form-factor Pluggable |
|
SI |
System Integrator – Person or company that specializes in bringing together component subsystems into a whole and ensuring that those subsystems function together |
|
SLA |
Service Level Agreement |
|
SmartOS |
Smart Operating System used on SmartRG, Inc. devices |
|
SMB |
Small- to Medium-sized Business |
|
SOFR |
Secured Overnight Financing Rate |
|
SP |
Service Provider |
|
TDM |
Time Division Multiplexed |
|
TIA |
Telecommunications Industry Association |
|
TIP |
Telecom Infra-Project |
|
TL 9000 |
Standard developed by and for the ICT industry to drive consistency in the quality of products and services down the supply chain through the implementation of a common body of QMS requirements and defined performance-based measurements |
|
U.K. |
United Kingdom |
|
U.S. |
United States |
5
|
VAR |
Value-Added Reseller |
|
VDSL2 |
Very high-speed Digital Subscriber Line 2 |
|
vWLAN |
virtual Wireless Local Area Network |
|
VoIP |
Voice over Internet Protocol |
|
WAN |
Wide Area Network |
|
WEEE |
Waste Electrical and Electronic Equipment; European Community Directive 2012/19/EU on waste electrical and electronic equipment |
|
WFA |
Wi-Fi Alliance |
|
Wi-Fi |
Family of wireless network protocols, based on the IEEE 802.11 family of standards, which are commonly used for local area networking of devices and Internet access |
|
xDSL |
All types of digital subscriber lines |
|
XFP |
10-Gigabit Small Form-factor Pluggable |
|
XGS-PON |
Updated standard for Passive Optical Networks that can support 10 Gbps symmetrical data transfer |
6
PART I
|
ITEM 1. |
BUSINESS |
Company Overview
ADTRAN, Inc. (“ADTRAN” or the “Company”) is a leading global provider of networking and communications platforms and services focused on the broadband access market. Our vision is to enable a fully connected world where the power to communicate is available to everyone, everywhere. Our unique approach, unmatched industry expertise and innovative solutions enable us to address almost any customer need. Our products and services are utilized by a diverse global customer base of network operators that range from those having regional or national reach and operating as telephone or cable television network operators to alternative network providers such as municipalities or utilities, as well as, managed service providers who serve small- and medium-sized businesses and distributed enterprises.
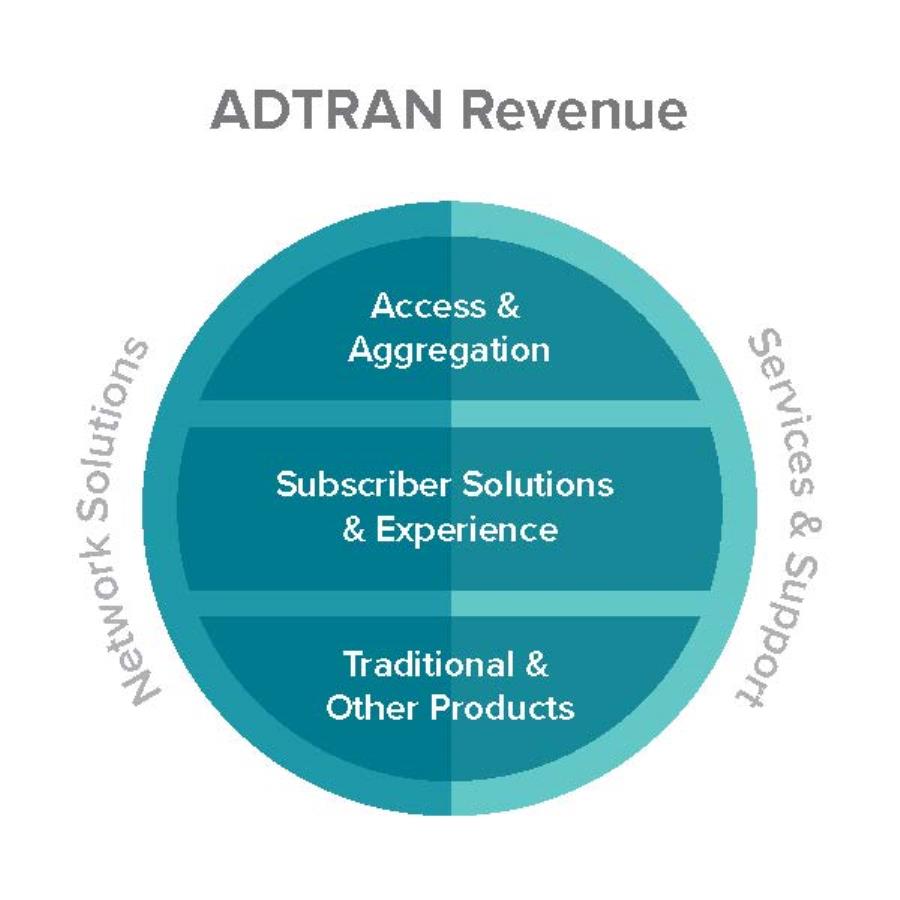
We operate under two reportable segments: (1) Network Solutions, which includes hardware and software products, and (2) Services & Support, which includes a portfolio of services that complement our product portfolio and can be utilized to support other platforms as well. These two segments span across our three revenue categories: (1) Access & Aggregation, (2) Subscriber Solutions & Experience and (3) Traditional & Other Products. These revenue categories are distinguished by the types of products and services offered. Access & Aggregation is focused on solutions that are used by service providers to connect their network infrastructure to subscribers; Subscriber Solutions & Experience is concentrated on subscriber solutions that terminate broadband access in the home and/or business; and Traditional & Other Products encompasses prior-generation technologies, products and services and certain other offerings. See below for a detailed discussion of these reportable segments and revenue categories.
Our innovative platforms and services enable voice, data and video communications across a variety of network infrastructures. They are currently in use by millions of end-users worldwide, making us a top supplier of broadband access solutions in the North American, EMEA and APAC regions.
We are focused on being a top supplier of communications infrastructure spanning from the cloud edge (data center) to the subscriber edge (customer premise) serving both the residential internet and enterprise cloud services markets. We offer a broad portfolio of flexible network infrastructure solutions, customer premises equipment, management and orchestration solutions and global services and support that enable service providers to meet their service demands now and in the future. These products and services enable service providers to transition to a common network supporting the simplified delivery of high-capacity services, regardless of subscriber density, network topology and infrastructure diversity.
ADTRAN began operations in January 1986. Headquartered in Huntsville, Alabama, ADTRAN is located in Cummings Research Park-the second largest high-tech center in the U.S. and fourth largest in the world. Our mailing address is 901 Explorer Boulevard, Huntsville, Alabama, 35806. Our telephone number at that location is (256) 963-8000. Our website is www.adtran.com. No information contained on our website is intended to be included as part of, or incorporated by reference into, this Annual Report on Form 10-K.
7
Reportable Segments
Our business operates under two reportable segments: (1) Network Solutions and (2) Services & Support. We review our financial performance, specifically revenue and gross profit, based on these two segments.
Network Solutions Segment
Our Network Solutions segment includes hardware and software products that support fiber, copper, coax and fixed wireless access infrastructures as well as residential and business connectivity solutions. In the fixed broadband access segment, we offer traditional chassis-based network solutions, such as the Total Access 5000 and hiX 5600, while also accelerating the industry’s transition to open, programmable and scalable fiber access solutions with our SDX Series. In our subscriber solutions portion of the Network Solution segments, ADTRAN offers cloud-managed Wi-Fi gateways and switches that provide a mix of wired and wireless connectivity at the customer premise. Our complete portfolio of broadband access and subscriber connectivity solutions are managed and orchestrated by our Mosaic software suite. The Mosaic software suite includes a mix of modern orchestration tools that simplify the deployment of open, disaggregated access networks along with cloud-based network and subscriber service optimization tools that make it easy for service providers to deploy high-speed fixed access and managed Wi-Fi networks.
Services & Support Segment
In addition to our network connectivity solutions, ADTRAN offers a comprehensive portfolio of network design, implementation and cloud management services to assist operators in the deployment of multi-vendor networks while reducing their cost to maintain these networks. These services are backed by a global support organization that offers on-site and off-site support services with varying SLAs. By pairing ADTRAN’s network solutions with our global services and support organization, customers can turn to ADTRAN as their single turnkey partner to assist in the deployment and maintenance of modern fiber access networks to connect homes and businesses.
Revenue Categories
In addition to classifying our operations into two reportable segments, we report revenue across three categories of products and services: (1) Access & Aggregation, (2) Subscriber Solutions & Experience and (3) Traditional & Other Products.
Our Access & Aggregation platforms are used by communications service providers to connect their network infrastructure to subscribers. This revenue category includes hardware- and software-based products and services that aggregate and/or originate access technologies. ADTRAN solutions within this category include a wide array of modular or fixed platforms designed to deliver the best technology and economy based on subscriber density and environmental conditions.
The Access & Aggregation category includes the following product, software and service families:
|
•Total Access 5000 Series FTTP and FTTN MSANs |
•SDX Series of SDN-controlled programmable network elements that form the hardware components within SD-Access architectures |
|
•hiX 5600 Series fiber aggregation and FTTN MSANs |
•ADTRAN ONE branded packet optical transport solutions used for broadband and Ethernet services aggregation and/or metro transport |
|
•FTTdp Gfast DPUs |
•IP-based DSLAMs (Total Access 1100 Series and the hiX 5600 Series) |
|
•Mosaic-branded network management and subscriber services control and orchestration software within SD-Access architectures |
•Cabinet and OSP enclosures and services |
|
•Planning, engineering, program management, maintenance, installation and commissioning services to implement customer network solutions |
•SFP, SFP+, XFP, QSFP transceivers, cables and other miscellaneous materials |
|
•All technology varieties of PON OLTs used in conjunction with the ADTRAN family of ONTs or select third-party ONTs |
•Other products and services that are generally applicable to Access & Aggregation |
8
Our Subscriber Solutions & Experience portfolio is used by service providers to terminate their access services infrastructure at the customer premises while providing an immersive and interactive experience for the subscriber. These solutions include copper and fiber WAN termination, LAN switching, Wi-Fi access and cloud software services for both residential and business markets.
The Subscriber Solutions & Experience category includes the following products, software and services:
|
•Broadband customer premises solutions, including GPON, XGS-PON, NG-PON2, EPON and 10G EPON and point-to-point Ethernet ONTs |
•Wi-Fi-enabled residential gateway products and accessories across xDSL, Ethernet, DOCSIS, and fiber technologies |
|
•NetVanta Ethernet switches for reliable multi-gigabit local area networking |
•Managed mesh Wi-Fi solutions for cloud-managed connectivity at the home or business |
|
•SmartOS-branded embedded software licensing for residential gateway and Wi-Fi devices |
•Bluesocket vWLAN for business-class Wi-Fi and management |
|
•Mosaic One cloud-based SaaS management platform for service providers to manage residential and enterprise networks |
•ProServices pre-sale and post-sale technical support |
|
•RFoG micro-nodes |
•Planning, engineering, program management, maintenance, installation and commissioning services to implement customer devices solutions into consumer, small business and enterprise locations
|
|
•Mosaic cloud-based SaaS management platform for subscriber and network analytics collection used to enhance network operations and customer experience |
•Other products, software and services applicable to Subscriber Solutions & Experience |
Our Traditional & Other Products category generally includes a mix of prior-generation technologies’ products and services, as well as other products and services that do not fit within the other revenue categories.
The Traditional & Other Products category includes products and services such as:
|
•TDM and ATM-based aggregation systems and customer devices |
|
•HDSL, ADSL and other mature technologies used to deliver business and residential services over service provider access and customer networks |
|
•Other products and services outside the Access & Aggregation and Subscriber Solutions & Experience categories |
Industry Overview
Communications solution providers are investing in their networks for growth in subscriber acquisition and retention, while streamlining their operations to reduce costs and complexity. Drivers for this network investment include the evolution of government funding programs, regulatory broadband policies, competition, increasing subscriber demand for broadband and merger obligations.
Subscriber demand for higher bandwidth continues to increase due to increasing numbers of connected devices, shifting working arrangements, OTT video, the prevalence of IoT and cloud services and the increasing use of internet applications. Performance is directly related to bandwidth availability. As the demand for high-definition video streaming services, symmetric bandwidth for video conferencing and collaboration tools, low-latency cloud gaming services and smart home video surveillance applications continues to increase, so too does the need for higher bandwidth to the home and business. ADTRAN serves as a trusted partner to our customers. Working side-by-side with our customers, we enable them to glean the maximum performance from their network, providing a flexible path for their networks to evolve cost effectively, and to further monetize their investments.
9
Our Strategy
Our strategy is to provide innovative and cost-effective solutions for SPs that enable them to address their increasing broadband demands. Our solutions focus on technology transformations that are happening in broadband network infrastructure, home and business CPE and software platforms, and services needed to help our customers address increasing complexity while scaling to meet increasing consumer demands. We aspire to be one of the top communication technology players in the world and plan to achieve this goal through innovation in network, home and business technology paired with a customer-focused organizational structure that tailors solutions to meet the needs of our target customers. ADTRAN has a unique approach to our portfolio in which we are focused in specific markets where we can offer competitive differentiation and scale while also having enough diversity and breadth in the portfolio to provide end-to-end connectivity solutions that offer value to our customers.
Customers
We have a diverse global customer base that includes Tier-1, -2 and -3 service providers, alternative service providers, such as utilities, municipalities and fiber overbuilders, cable/MSOs, SMBs and distributed enterprises. Many network operators require product approval before the purchase or installation of a product. The nature of our business involves a dynamic process of submitting new and succeeding generations of products for approval prior to orders being placed.
Three customers, CenturyLink, Inc., Deutsche Telekom AG and KGP Logistics, individually comprised more than 10% of our revenue in 2020. Additionally, our revenue in Germany comprised more than 10% of our revenue in 2020. The revenue from these customers and country is reported in both our Network Solutions and Services & Support segments.
For a discussion of risks associated with customers, service providers and approval processes, see “Risk Factors – The lengthy sales and approval process required by major and other service providers for new products could result in fluctuations in our revenue,” “Risk Factors – We depend heavily on sales to certain customers; the loss of any of these customers would significantly reduce our revenues and net income,” and “Risk Factors – Consolidation and deterioration in the CLEC market could result in a significant decrease in our revenue,” in Part I, Item 1A of this report.
Distribution, Sales and Marketing
We sell our products through our direct sales organization and our distribution network. Our direct sales organization supports major accounts and has offices in domestic and international locations. Sales to most smaller and independent telephone companies are fulfilled through a combination of direct sales and distributors. Our services offerings can be purchased directly from us, or through one of our service providers, channel partners or distribution partners.
Before placing an order, service providers typically require lengthy product qualification and standardization processes that can extend for several months or even years. Once approved, product orders are typically placed under single or multi-year supply agreements that are generally not subject to minimum volume commitments. Service providers generally prefer having two or more suppliers for most products. Therefore, individual orders are usually subject to competition based on some combination of total value, service, price, delivery and other terms.
Orders for end-user products are fulfilled through a combination of direct sales and distributors. This is supported by a direct sales organization for major accounts and a channel-based sales organization to facilitate sales to our partners. MSPs, VARs and SIs may be affiliated with the company as channel partners, or they may purchase from a distributor in an unaffiliated fashion. Affiliated partners participate with us at various program levels, based on sales volume and other factors, to receive benefits such as product discounts, market development funds, technical support and training.
Outside of the U.S., most service provider products are sold through our direct sales organization and end-user products are sold direct or through distribution arrangements customized for each region. Some regions are supported from a field office that offers sales and support functions, and in some cases, warehousing and manufacturing support. Our field sales organizations, distributors and service provider customers receive support from regional-based marketing, sales and customer support groups.
Our marketing organization promotes all brands associated with ADTRAN to key stakeholders, including customers, partners and prospects throughout the world. Marketing is complemented by product marketing and management teams that work with our engineering teams to develop and promote new products and services as well as product enhancements.
10
Research and Development
Rapidly changing technologies, evolving industry standards, changing customer requirements and continuing developments in communications service offerings characterize the markets for our products. Our on-going ability to adapt to these changes and to develop new and enhanced products that meet or anticipate market demand is a significant factor influencing our competitive position and our ability to grow.
Our product development activities are an important part of our strategy. We plan to maintain our emphasis on product development to enable us to respond to rapidly changing technology and evolving industry standards. Our research and development and engineering functions are global. We maintain research and development functions at our Huntsville, Alabama headquarters and in Germany and other locations worldwide. During the years ended December 31, 2020, 2019 and 2018, research and development expenditures totaled $113.3 million, $126.2 million and $124.5 million, respectively.
We develop our products either internally or by leveraging partners. Additionally, in some cases, we license intellectual property or acquire technologies. Internal development on advanced technology products gives us more control over design and manufacturing issues, while for traditional designs, ODM and/or licensed intellectual property provides us with the ability to leverage the economies of scale of our technology partners. This balanced approach ensures we provide best-in-class products for our customers.
As we continue to create more software-based intellectual property, such as our SDN/NFV portfolio, our use of lean agile practices in research and development ensures we remain responsive and customer-focused. This enables us to deliver products faster, at higher quality and more economically to our customers and the market on a continuous basis.
Our ability to continually reduce product costs, while focusing on delivery and quality, are important parts of our overall business strategy. Our product development efforts are often centered on entering a market with improved technology, allowing us to offer products at competitive prices. We then compete for market share. We continually re-engineer successive generations of existing products to improve our product performance, costs and value.
Development activities focus on solutions that support both existing and emerging communications industry technologies in segments that we consider viable revenue opportunities. We are actively engaged in developing and refining technologies to support data, voice and video transport primarily over IP/Ethernet network architectures. This includes Ethernet aggregation, fiber-optic transport and access, DSL, access routing, Ethernet switching, wireless LANs, integrated access, converged services, VoIP, network management and professional services.
Our research function supports product development efforts throughout the Company. This function guides our various product design and engineering teams in digital signal processing technologies, computer simulation and modeling, CAD/CAM toolsets, custom semiconductor design, optical transceiver design, industry standards, technological forecasting, product development methods and emerging networks standards.
Many communication requirements, processes and technologies are governed by SDOs. These SDOs consist of representatives from various manufacturers, service providers and testing laboratories who work to establish specifications and compliance guidelines for emerging communications technologies. We are an active participant in several SDOs and have assisted with the development of worldwide standards in many technologies.
Our SDO activities are primarily in the area of broadband access. This includes involvement with the ITU-T, ATIS, ETSI and the BBF. We are involved in the evolution of optical access technologies, participating in activities in the ITU-T, FSAN and BBF on next-generation PON. We are also involved in standards development efforts related to maximizing the bandwidth potential of the copper pair to enable new applications in the ITU-T. We continue to be involved with the industry-wide interoperability, performance-testing and system-level projects related to those standards in the BBF. We are also members of MEF, OCP, WFA, TIA, CableLabs and TIP.
For a discussion of risks associated with our research and development activities, see “Risk Factors – We must continue to update and improve our products and develop new products to compete and to keep pace with improvements in communications technology” and “Risk Factors – We engage in research and development activities to develop new, innovative solutions and to improve the application of developed technologies, and as a consequence may miss certain market opportunities enjoyed by larger companies with substantially greater research and development effort and which may focus on more leading edge development,” in Part I, Item 1A of this report.
11
Manufacturing and Operations
The principal steps in our manufacturing process include the purchase and management of materials, assembly, testing, final inspection, packing and shipping. We purchase parts and components for the assembly of some products from a large number of suppliers through a worldwide sourcing program. Additionally, we manage a process that identifies the components that are best purchased directly by contract manufacturers for use in the assembly of our products to achieve manufacturing efficiency, quality and cost objectives. Certain key components used in our products are currently available from a single source, and other key components are available from only a limited number of sources. In the past, we have experienced delays in the receipt of certain key components, which has resulted in delays in related product deliveries. We attempt to manage these risks through developing alternative sources, by staging inventories at strategic locations, through engineering efforts designed to prevent the necessity of certain components and by maintaining close contact and building long-term relationships with our suppliers.
We rely on subcontractors for assembly and testing of certain printed circuit board assemblies, sub-assemblies, chassis, enclosures and equipment shelves, and to purchase some of the raw materials used in such assemblies. We typically manufacture our lower-volume, higher-mix products and build and test product prototypes and many of our initial production units at our manufacturing site in Huntsville, Alabama. We later transfer the production of higher-volume, lower-mix assemblies to our subcontractors. Subcontract assembly operations can lengthen fulfillment cycle times, but we believe we can respond more rapidly to uncertainties in incoming order rates by selecting assembly subcontractors that have significant reserve capacity and flexibility. Our subcontractors have proven to be flexible and able to meet our quality requirements.
We ship the majority of products to our U.S. customers from our facilities in Huntsville, Alabama, although we also fulfill customer orders from other locations near our customers' sites, when possible. The majority of our products shipped to EMEA customers come from locations in that region. We also ship directly from subcontractors to a number of customers in the U.S. and international locations. Most of our facilities are certified pursuant to the most current releases of ISO 9001, TL 9000, ISO 14001 and ISO 27001. Our Huntsville, Alabama facilities and many of our key suppliers are C-TPAT certified. Our products are also certified to certain other customer, industry and privacy standards, including those relating to emission of electromagnetic energy and safety specifications.
For a discussion of risks associated with manufacturing activities, see “Risk Factors – Our strategy of outsourcing a portion of our manufacturing requirements to subcontractors located in various international regions may result in us not meeting our cost, quality or performance standards” and “Risk Factors – Our dependence on a limited number of suppliers for certain raw materials, key components and ODM products may prevent us from delivering our products on a timely basis, which could have a material adverse effect on customer relations and operating results,” in Part I, Item 1A of this report.
Competition
We compete in markets for networking and communications services and solutions for service providers, businesses, government agencies and other organizations worldwide. Our products and services provide solutions supporting voice, data and video communications across fiber-, copper-, coaxial- and wireless-based infrastructure, as well as across wide area networks, local area networks and the internet.
We compete with a number of companies in the markets we serve. In our Access & Aggregation category, key competitors include Calix, Casa Systems, Ciena, CommScope, DZS, Huawei, Nokia, Vecima Networks and ZTE. In the Subscriber Solutions & Experience category, our primary competitors include Calix, Cisco, CommScope, Hewlett Packard Enterprise, Juniper Networks, Ribbon Communications, Ubiquiti Networks and Zyxel. In addition to these OEM vendors, we face increasing competition from various ODM vendors who are being engaged directly by some of our service provider customers. Some of these companies compete in a single product segment, while others compete across multiple product lines. Competitors of our Services & Support business include Calix, Fujitsu Network Communications and Nokia.
For further discussion of risks associated with our competition, see “Risk Factors – We must continue to update and improve our products and develop new products to compete and to keep pace with improvements in communications technology” and “Risk Factors – We compete in markets that have become increasingly competitive, which may result in reduced gross profit margins and market share,” in Part I, Item 1A of this report.
Seasonality
We have experienced quarterly fluctuations in customer activity due to seasonal considerations. These seasonal effects may continue to vary and do not always correlate to our operating results. Accordingly, they should not be considered a reliable indicator of our future revenue or operating results.
12
Foreign Currency
Transactions with customers that are denominated in foreign currencies are recorded using the appropriate exchange rates from throughout the year. Assets and liabilities denominated in foreign currencies are remeasured at the balance sheet dates using the closing rates of exchange between those foreign currencies and the functional currency with any transaction gains or losses reported in other income (expense). Our primary exposures to foreign currency exchange rate movements are with our German subsidiary, whose functional currency is the Euro, our Australian subsidiary, whose functional currency is the Australian dollar, and our British subsidiary, whose functional currency is the Great British pound. Adjustments resulting from translating financial statements of international subsidiaries are recorded as a component of accumulated other comprehensive income (loss).
Backlog and Inventory
A substantial portion of our shipments in any fiscal period relates to orders received and shipped within that fiscal period for customers under agreements containing nonbinding purchase commitments. Further, a significant percentage of orders require delivery within a few days. These factors normally result in very little order backlog or order flow visibility. Additionally, backlog levels may vary because of seasonal trends, the timing of customer projects and other factors that affect customer order lead times. We believe that because we fill a substantial portion of customer orders within the fiscal quarter of receipt, backlog is not a meaningful indicator of actual revenue for any succeeding period.
To meet this type of demand, we have implemented supply chain management systems to manage the production process. We maintain substantial inventories of raw materials for long lead time components to support this demand and avoid expedite fees. We also maintain substantial finished goods inventories. Our practice of maintaining sufficient inventory levels to assure prompt delivery of our products and services increases the amount of inventory that may be considered excess and/or obsolete. This excess and obsolete inventory may require us to write down the value of the inventory, which may have an adverse effect on our operating results.
For further discussion of risks associated with managing our inventory, see “Risk Factors – Managing our inventory is complex and may include write-downs of excess or obsolete inventory,” in Part I, Item 1A of this report.
Government Regulation
Our products must comply with various regulations and standards established by communications authorities in various countries, as well as those of certain international bodies. Environmental legislation within the EU may increase our cost of doing business as we amend our products to comply with these requirements. For example, the EU issued the RoHS directive, the WEEE directive and the REACH regulation. We continue to implement measures to comply with these directives and other similar directives and regulations from additional countries.
We strive to deliver innovative network access solutions that lower the total cost and reduce the time of deploying services, increase the level of performance achievable with established infrastructures, reduce operating and capital expenses for our customers, increase network bandwidth and functionality, and extend network reach. Our development process is conducted in accordance with ISO 9001, TL 9000, ISO 14001, and ISO 27001, all of which are international standards for quality and environmental management systems. Our corporate practices also conform to GDPR requirements, which protect digital data for all EU citizens, and to other applicable data protection laws, including the California Consumer Privacy Act. To date, our compliance actions and costs relating to these laws, rules and regulations have not resulted in a material cost or effect on our capital expenditures, earnings or competitive position.
For further discussion of risks associated with government regulation, see “Risk Factors – We are subject to complex and evolving U.S. and foreign laws, regulations and standards governing the conduct of our business. Violations of these laws and regulations may harm our business, subject us to penalties and to other adverse consequences.”
13
Human Capital
We believe that our most valuable asset is our people. To ensure our Company continues to succeed, our objective is to be able to recruit, hire and retain top talent. Our ability to attract and retain a high-quality workforce is dependent on our ability to maintain a diverse, equitable and inclusive workplace that provides opportunities for our employees to learn and grow in their careers. This is supported by strong compensation, benefits, community service and other programs that enable employees to build connections within the community.
As of December 31, 2020, we had 1,405 full-time employees, with 1,080 in the U.S. and 325 in our international subsidiaries located in North America, Latin America, EMEA and APAC regions. We also utilized 250 contractors and temporary employees domestically and internationally in various manufacturing, engineering, sales and general and administrative capacities, as needed. We believe that our relationship with our employees is good. ADTRAN has a diverse employee base located in 17 countries. We pride ourselves on a highly educated workforce, and the majority of our employees serve in engineering, information technology and technical roles within the organization.
Until December 31, 2020, approximately 260 employees of ADTRAN GmbH were subject to collective bargaining agreements of either the Association of Metal and Electrical Industry in Berlin and Brandenburg e.V. or NORDMETALL Association of Metal and Electrical Industry e.V. Although these collective bargaining agreements expired on December 31, 2020, negotiations with the employees of ADTRAN GmbH for a new collective bargaining agreement are ongoing and we have not experienced any work stoppage. None of our other employees are subject to collective bargaining agreements.
Additionally, we continually work to recruit technical talent in diverse communities through our cooperative education program. This program seeks to identify college students that major in relevant technology areas and expose them to the work environment at ADTRAN on an alternating semester basis. Our goal is to retain as many of these students as possible for full-time employment after graduation, as they are our Company's future.
Diversity and Inclusion
We believe that maintaining a diverse and inclusive workforce is critical to the success of our business. The Company encourages an environment where individuality is embraced regardless of age, gender, identity, race, sexual orientation, physical or mental ability, ethnicity and perspective and where each employee is accepted and respected and can, therefore, bring their most authentic self to work. To this end, we have established an employee-driven Diversity, Equity & Inclusion (“DE&I”) Task Force to spearhead our efforts. The DE&I Task Force is comprised of our Chief Financial Officer and employee volunteers who are passionate about DE&I and how it affects our workforce.
In addition to diversity in our workforce, we seek to ensure diversity in our Board of Directors with respect to skills, experience, gender, race and ethnicity. Our Board of Directors is comprised of six members, two of which are females and three of which are ethnically diverse. Additionally, the Board of Directors has a diversity of skills and experience with respect to accounting and finance, management and leadership, vision and strategy, business operations, business judgment, crisis management, risk assessment, industry knowledge, corporate governance and global markets.
Health, Safety and Wellness
The well-being of our employees is paramount to the continued success of our business. To this end, we are committed to each of our employees' health, safety and wellness. We provide our employees with access to various health and wellness benefits designed to enable them and their family members to have affordable access to health, dental and vision insurance. Additionally, we offer access to many programs that provide additional monetary support in the event of a qualifying incident, including accident insurance, life insurance and hospital indemnity insurance, among others. We understand that mental health is an essential aspect of our employees’ wellbeing. As a result, we offer an employee assistance program at no charge to employees and their family members. This program provides access to qualified personnel to address various issues such as grief, financial stress, family and emotional issues.
In response to the COVID-19 pandemic, we implemented significant changes that were determined to be in the best interest of our employees and the communities in which we operate. We introduced enhanced health and safety standards that are in compliance with, or exceed, local, state and federal recommendations and regulations in the U.S. and at our international locations. This includes having the vast majority of our global employees work from home when possible. In areas where it is necessary to have critical, on-site personnel, such as at our manufacturing facilities, additional health and safety measures have been implemented to provide the safest environment possible for these workers.
14
Compensation and Benefits
We continually work to provide a competitive compensation and benefits program as this plays a key role in our ability to attract and retain a highly skilled workforce. In addition to salaries, these programs, which vary by country/region, include long-term equity incentive awards with certain vesting requirements, deferred compensation plans, which are offered to certain of executive management, a 401(k) plan, healthcare and insurance benefits, health savings and flexible spending accounts, paid time off, paid volunteer time off, employee assistance program and tuition assistance. Additionally, at our headquarters in Alabama, we offer our employees certain on-site services, including nurse practitioner care and a fitness center, among others.
Talent Development
We invest significant resources to develop the talent needed to remain a market-leading global supplier of broadband infrastructure. We offer numerous training opportunities on both technical and professional development topics. We recently enhanced tools and processes for providing performance feedback and developing high potential employees to become our future leaders.
The ADTRAN Career Development Program provides an opportunity for employees to shape their career journey. The program provides opportunities for employees to develop competencies in areas including technology, business acumen, emotional intelligence, design and systems thinking. As employees increase their competencies in these areas and master skills within their individual roles, this program offers a variety of career advancement paths. Employees also have access to the ADTRAN Learning Network. This platform houses all required training as well as optional training in a variety of areas.
Intellectual Property
ADTRAN develops and owns a significant amount of intellectual property. We hold over 600 patents worldwide related to our products and over 60 additional pending patent applications. Our patents expire at various dates between 2021 and 2038. We continue occasionally to seek additional patents related to our research and development activities. We do not derive any material amount of revenue from the licensing of our patents.
The ADTRAN corporate logo is a registered trademark of ADTRAN, as is the name “ADTRAN”, “SmartRG” and a number of our product identifiers and names. We also claim rights to a number of unregistered trademarks.
We protect our intellectual property and proprietary rights in accordance with good legal and business practices. We believe, however, that our competitive success will not fully depend on the ownership of intellectual property, but instead will depend primarily on the innovative skills, technical competence and marketing abilities of our personnel.
The communications industry is characterized by the existence of an ever-increasing volume of patent litigation and licensing activities. We have received, and may continue to receive, notices of claims alleging that we are infringing upon patents or other intellectual property. We cannot predict whether we will prevail in any claims or litigation over alleged infringements, or whether we will be able to license any valid and infringed patents, or other intellectual property, on commercially reasonable terms. It is possible that such litigation may result in significant legal costs and judgments and that intellectual property infringement claims, or related litigation against or by us could have a material adverse effect on our business and operating results.
For a discussion of risks associated with our intellectual property and proprietary rights, see “Risk Factors – Our failure to maintain rights to intellectual property used in our business could adversely affect the development, functionality, and commercial value of our products” in Part I, Item 1A of this report.
15
Information about our Executive Officers
Set forth below is certain information regarding the executive officers of ADTRAN. Unless otherwise indicated, the information set forth is as of December 31, 2020.
|
Thomas R. Stanton |
|
Age 56 |
|
2007 to present |
|
Chief Executive Officer and Chairman of the Board |
|
Michael K. Foliano |
|
Age 60 |
|
2019 to present |
|
Senior Vice President of Finance and Chief Financial Officer |
|
2006 to 2019 |
|
Senior Vice President of Operations |
|
Ronald D. Centis |
|
Age 58 |
|
2019 to present |
|
Senior Vice President of Operations |
|
2018 – 2019 |
|
President and Chief Operating Officer – Fastback Networks |
|
2015 – 2017 |
|
Executive Vice President and General Manager CenturyLink – Ericsson |
|
Raymond Harris |
|
Age 57 |
|
2018 to present |
|
Chief Information Officer |
|
2017 – 2018 |
|
Director High-Performance Computing – Johns Hopkins University Applied Physics Lab |
|
2010 – 2017 |
|
Vice President and Chief Information Officer – Iron Bow Technologies LLC |
|
2008 – 2010 |
|
Chief Information Security Engineer – Johns Hopkins University Applied Physics Lab |
|
Marc Kimpe |
|
Age 51 |
|
2019 to present |
|
Senior Vice President of Research and Development |
|
2014 – 2019 |
|
Vice President of Research and Development |
|
Eduard Scheiterer |
|
Age 67 |
|
2015 to present |
|
Senior Vice President of Research and Development |
|
2014 – 2015 |
|
Senior Vice President and Managing Director of International Markets |
|
2012 – 2014 |
|
Managing Director – ADTRAN GmbH, a German wholly owned subsidiary of ADTRAN, Inc. |
|
2009 – 2012 |
|
Head of Broadband Access – Nokia (formerly Nokia Siemens Networks), Germany |
|
James D. Wilson, Jr. |
|
Age 50 |
|
2019 to present |
|
Chief Revenue Officer |
|
2015 – 2019 |
|
Senior Vice President of Technology and Strategy |
|
2006 – 2015 |
|
Senior Vice President and General Manager of Carrier Networks |
There are no family relationships among our directors or executive officers.
Availability of Information
We file annual reports on Form 10-K, quarterly reports on Form 10-Q, current reports on Form 8-K, proxy statements and other information as required with the SEC. The SEC maintains an Internet website, www.sec.gov, that contains reports, proxy and information statements, and other information regarding issuers, including ADTRAN, that file electronically with them. Additionally, our annual reports on Form 10-K, quarterly reports on Form 10-Q, current reports on Form 8-K and amendments to those reports, if applicable, filed or furnished pursuant to Section 13(a) or 15(d) of the Securities and Exchange Act of 1934, as amended, are available free of charge under the Investor Relations section of our website, www.adtran.com, as soon as reasonably practicable after we electronically file them with, or furnish them to, the SEC. The reference to our website address does not constitute incorporation by reference of the information contained on the website, which information should not be considered part of this report.
16
|
ITEM 1A. |
RISK FACTORS |
Our business involves substantial risks. Any of the risk factors described below or elsewhere in this report could significantly and adversely affect our business prospects, financial condition and results of operations. The risks described below are not the only ones facing us. Additional risks and uncertainties not presently known to us or that we currently deem to be immaterial may also adversely affect us.
Risks related to our financial results and Company success
Our revenue for a particular period can be difficult to predict, and a shortfall in revenue may harm our operating results.
As a result of the many factors discussed in this report, our revenue for a particular quarter is difficult to predict and will fluctuate from quarter to quarter. Typically, our customers request product delivery within a short period following receipt of an order. Consequently, we do not typically carry a significant order backlog and are dependent upon obtaining orders and completing delivery in accordance with shipping terms that are predominantly within each quarter to achieve our targeted revenues. Our net revenue may grow at a slower rate than in previous quarters or may decline. Our deployment/installation cycle can vary depending on the customer’s schedule, site readiness, network size and complexity and other factors, which can cause our revenue to fluctuate from period to period. Our ability to meet financial expectations could also be affected if the variable revenue patterns seen in prior quarters recur in future quarters. We have experienced periods of time during which manufacturing issues have delayed shipments, leading to variable shipping patterns. In addition, to the extent that manufacturing issues and any related component shortages result in delayed shipments in the future, and particularly in quarters in which we and our subcontractors are operating at higher levels of capacity, it is possible that revenue for a quarter could be adversely affected, and we may not be able to remediate the conditions within the same quarter.
In the past, under certain market conditions, long manufacturing lead times have caused our customers to place the same order multiple times. When multiple ordering occurs, along with other factors, it may cause difficulty in predicting our sales and, as a result, could impair our ability to manage inventory effectively.
We plan our operating expense levels based primarily on forecasted revenue levels. These expenses and the impact of long-term commitments are relatively fixed in the short term. A shortfall in revenue could lead to operating results being below expectations because we may not be able to quickly reduce these fixed expenses in response to short-term business changes.
The lengthy sales and approval process required by major and other service providers for new products could result in fluctuations in our revenue.
In the industry in which we compete, sales and approval cycles are often lengthy. Selling efforts often involve a significant commitment of time and resources by us and our customers that may include extensive product testing, laboratory or network certification, or region-specific product certification and homologation requirements for deployment in networks. Additionally, a supplier must first obtain product approval from a major or other service provider to sell its products to these service providers. This process can last from six to eighteen months, or longer, depending on the technology, the service provider and the demand for the product from the service provider’s subscribers. Consequently, we are involved in a constant process of submitting for approval succeeding generations of products, as well as products that deploy new technology or respond to new technology demands from a major or other service provider. We have been successful in the past in obtaining these approvals; however, we cannot be certain that we will obtain these approvals in the future or that sales of these products will continue to occur. Any attempt by a major or other service provider to seek out additional or alternative suppliers, or to undertake, as permitted under applicable regulations, the production of these products internally, could have a material adverse effect on our operating results. Furthermore, the delay in sales until the completion of the approval process, the length of which is difficult to predict, could result in fluctuations of revenue and uneven operating results from quarter to quarter or year to year. Further, once customer approval or certifications are met, our supply chain customers typically do not guarantee us a minimum, or any, volume of sales. We are dependent on individual purchase orders as discussed elsewhere in this report.
We depend heavily on sales to certain customers; the loss of any of these customers would significantly reduce our revenues and net income.
Historically, a large percentage of our sales have been made to major service providers and larger independent communications companies. In 2020, these customers continued to comprise over half of our revenue. As long as the major and larger independent communications companies represent such a substantial percentage of our total revenue, our future success will significantly depend upon certain factors which are not within our control, including:
•the timing and size of future purchase orders, if any, from these customers;
•changes in strategic plans and capital budgets of these customers;
•the product requirements of these customers;
17
•the subscriber take rate, including subscriber loss or churn, of our customers;
•the financial and operational success of these customers;
•the impact of legislative and regulatory changes on these customers;
•consolidation, acquisition of, or corporate reorganization among these customers;
•the success of these customers' services deployed using our products; and
•the impact of work stoppages at these customers.
In the past, sales to our large customers have fluctuated, and may fluctuate in the future, significantly from quarter to quarter and year to year. The loss of, or a significant reduction or delay in, sales to any such customer or the occurrence of sales fluctuations could have a material adverse effect on our business and results of operations. Further, any attempt by a major or other service provider to seek out additional or alternative suppliers or to undertake, as permitted under applicable regulations, the production of these products internally, could have a material adverse effect on our operating results.
There has been a trend toward industry consolidation in our markets for several years. We expect this trend to continue as companies attempt to strengthen or hold their market positions or are unable to continue operations. This could lead to variability in our operating results and could have a material adverse effect on our business, operating results, financial condition and cash flow. In addition, particularly in the service provider market, rapid consolidation will lead to fewer customers, with the effect that a loss of a major customer could have a material impact on our results that we would not have anticipated in a marketplace composed of more numerous participants.
Our exposure to the credit risks of our customers and distributors may make it difficult to collect accounts receivable and could adversely affect our operating results, financial condition and cash flows.
Most of our revenue is made on an open credit basis, generally with payment terms of 30 days in the U.S. and typically longer in many geographic markets outside the U.S. As our international revenue grows, our total accounts receivable balance will likely increase. Our DSO could also increase as a result of a greater mix of international revenue. Additionally, international laws may not provide the same degree of protection against defaults on accounts receivable as provided under U.S. laws governing domestic transactions; therefore, as our international business grows, we may be subject to higher bad debt expense compared to historical trends. Overall, we monitor individual customer and distributor payment capability in granting such open credit arrangements, seek to limit such open credit to amounts that we believe customers and distributors can pay and maintain reserves we believe are adequate to cover exposure for doubtful accounts and other macroeconomic indicators. In the course of our sales to customers and distributors, we may encounter difficulty collecting accounts receivable and could be exposed to risks associated with uncollectible accounts receivable due to various reasons, including potential declining operating cash flows or bankruptcy filings. While we attempt to monitor these situations carefully and attempt to take appropriate measures to collect accounts receivable balances, there are no assurances we can avoid write-downs and/or write-offs of accounts receivable as a result of declining financial conditions for our customers, including bankruptcy. Such write-downs or write-offs could negatively affect our operating results for the period in which they occur and could potentially have a material adverse effect on our results of operations, financial condition and cash flows.
We expect gross margins to vary over time, and our levels of product and services gross margins may not be sustainable.
Our level of gross margins may not be sustainable and may be adversely affected by numerous factors, including:
|
|
• |
changes in customer, geographic or product or services mix, including software and the mix of configurations and professional services revenue within each product segment; |
|
|
• |
mix of domestic versus international revenue; |
|
|
• |
introduction of new products by competitors, including products with price-performance advantages; |
|
|
• |
our ability to reduce product cost; |
|
|
• |
increases in labor or material cost, including increases in material costs resulting from tariffs; |
|
|
• |
foreign currency exchange rate movements; |
|
|
• |
expediting costs incurred to meet customer delivery requirements; |
|
|
• |
excess inventory and inventory holding charges; |
|
|
• |
excess and obsolescence charges; |
|
|
• |
changes in shipment volume; |
|
|
• |
our ability to absorb fixed manufacturing costs during short-term fluctuations in customer demand; |
18
|
|
• |
loss of cost savings due to changes in component pricing or charges incurred due to inventory holding periods if parts ordering does not correctly anticipate product demand; |
|
|
• |
lower than expected benefits from value engineering; |
|
|
• |
increased price competition, including competitors from Asia, specifically China; |
|
|
• |
changes in distribution channels; |
|
|
• |
increased warranty cost; |
|
|
• |
liquidated damages costs relating to customer contractual terms; and |
|
|
• |
our ability to manage the impact of foreign currency exchange rate fluctuations relating to our revenue or cost of goods sold. |
Our dependence on a limited number of suppliers for certain raw materials, key components and ODM products may prevent us from delivering our products on a timely basis, which could have a material adverse effect on customer relations and operating results.
Certain raw materials and key components used in our products are currently available from only one source, and others are available from only a limited number of sources. The availability of these raw materials and supplies may be subject to market forces beyond our control, such as merger and acquisition activity of our suppliers and consolidation in some segments of our supplier base. From time to time, there may not be sufficient quantities of raw materials and supplies in the marketplace to meet customer demand. Many companies utilize the same raw materials and supplies that we do in the production of their products. Companies with more resources than our own may have a competitive advantage in obtaining raw materials and supplies due to greater buying power. These factors can result in reduced supply, higher prices of raw materials and delays in the receipt of certain of our key components, which in turn may generate increased costs, lower margins and delays in product delivery, with a corresponding adverse effect on revenues and customer relationships. We attempt to manage these risks through developing alternative sources, by staging inventories at strategic locations, through engineering efforts designed to obviate the necessity of certain components and by building long-term relationships and close contact with each of our key suppliers; however, we cannot assure that delays in or failures of deliveries of key components, either to us or to our contract manufacturers, and consequent delays in product deliveries, will not occur in the future. For a discussion of the impact of the COVID-19 pandemic on our supply chain see “- The ongoing COVID-19 pandemic could adversely affect our business, results of operations and financial condition.”
We compete in markets that have become increasingly competitive, which may result in reduced gross profit margins and market share.
The markets for our products are intensely competitive. Additional manufacturers have entered the markets in recent years to offer products in competition with us. Additionally, certain companies have, in recent years, developed the ability to deliver competing products using coaxial cable and cellular transmission, especially in high-density metropolitan areas. Competition will further increase if new companies enter the market or existing competitors expand their product lines. Some of these potential competitors may have greater financial, technological, manufacturing, sales and marketing, and personnel resources than we have. As a result, these competitors may be able to respond more rapidly or effectively to new or emerging technologies and changes in customer requirements, withstand significant price decreases, or devote greater resources to the development, promotion and sale of their products than we can.
In addition, our present and future competitors may be able to enter our existing or future markets with products or technologies comparable or superior to those that we offer. An increase in competition could cause us to reduce prices, decrease our market share, require increased spending by us on product development and sales and marketing, or cause delays or cancellations in customer orders, any one of which could reduce our gross profit margins and adversely affect our business and results of operations.
19
Our estimates regarding future warranty obligations may change due to product failure rates, installation and shipment volumes, field service repair obligations and other rework costs incurred in correcting product failures. If our estimates change, our liability for warranty obligations may increase or decrease, impacting future cost of goods sold.
Our products are highly complex, and we cannot ensure that our extensive product development, manufacturing and integration testing will be adequate to detect all defects, errors, failures and quality issues. Quality or performance problems for products covered under warranty could adversely impact our reputation and negatively affect our operating results, financial position and cash flows. The development and production of new products with high complexity often involves problems with software, components and manufacturing methods. If significant warranty obligations arise due to reliability or quality issues arising from defects in software, faulty components or manufacturing methods, our operating results, financial position and cash flows could be negatively impacted by:
|
|
• |
costs associated with fixing software or hardware defects; |
|
|
• |
costs associated with internal or third-party installation errors; |
|
|
• |
high service and warranty expenses; |
|
|
• |
costs associated with recalling and replacing products with software or hardware defects, including costs from writing-off defective products recalled; |
|
|
• |
high inventory obsolescence expense; |
|
|
• |
delays in collecting accounts receivable; |
|
|
• |
payment of liquidated damages for performance failures; |
|
|
• |
extended performance bond expenses; and |
|
|
• |
a decline in sales to existing customers. |
Managing our inventory is complex and may include write-downs of excess or obsolete inventory.
Managing our inventory of components and finished products is complicated by a number of factors, including the need to maintain a significant inventory of certain components that are in short supply, that have been discontinued by the component manufacturer, that must be purchased in bulk to obtain favorable pricing or that require long lead times. These issues may result in our purchasing and maintaining significant amounts of inventory, which if not used or expected to be used based on anticipated production requirements, may become excess or obsolete. Any excess or obsolete inventory could also result in sales price reductions and/or inventory write- downs, which could adversely affect our business and results of operations.
20
The continuing growth of our international operations could expose us to additional risks, increase our costs and adversely affect our operating results, financial condition and cash flows.
We are expanding our presence in international markets, which represented 30.5% of our net revenue for 2020, and as a result, we anticipate increased sales and operating costs in these markets. This international expansion may increase our operational risks and impact our results of operations, including: exposure to unfavorable commercial terms in certain countries; the time and cost to staff and manage foreign operations, including the time and cost to maintain good relationships with employee associations and works councils;
|
|
• |
exposure to unfavorable commercial terms in certain countries; |
|
|
• |
the time and cost to staff and manage foreign operations, including the time and cost to maintain good relationships with employee associations and works councils; |
|
|
• |
the time and cost to ensure adequate business interruption controls, processes and facilities; |
|
|
• |
the time and cost to manage and evolve financial reporting systems, maintain effective financial disclosure controls and procedures, and comply with corporate governance requirements in multiple jurisdictions; |
|
|
• |
the cost to collect accounts receivable and extension of collection periods; |
|
|
• |
the cost and potential disruption of facilities transitions required in some business acquisitions; |
|
|
• |
risks as a result of less regulation of patents or other safeguards of intellectual property in certain countries; |
|
|
• |
the potential impact of adverse tax, customs regulations and transfer-pricing issues; |
|
|
• |
exposure to increased price competition from additional competitors in some countries; |
|
|
• |
exposure to global social, political and economic instability, changes in economic conditions and foreign currency exchange rate movements; |
|
|
• |
potential exposure to liability or damage of reputation resulting from a higher incidence of corruption or unethical business practices in some countries; |
|
|
• |
potential regulations on data protection, regarding the collection, use, disclosure and security of data; |
|
|
• |
potential trade protection measures, export compliance issues, domestic preference procurement requirements, qualification to transact business and additional regulatory requirements; and |
|
|
• |
potential exposure to natural disasters, epidemics and pandemics (and government regulations in response thereto) and acts of war or terrorism. |
If we are unable to successfully address the potential risks associated with our overall international expansion, our operating results, financial condition and cash flows may be negatively impacted.
If we are unable to integrate future acquisitions successfully, it could adversely affect our operating results, financial condition and cash flows.
We may make acquisitions to improve or expand our product offerings, customer base, talent or intellectual property. Our current and future acquisition strategy will depend on our ability to identify, negotiate, complete and integrate acquisitions. Acquisitions involve numerous risks, including, but not limited to:
|
|
• |
difficulties integrating and managing the operations, technologies and products of the companies we acquire; |
|
|
• |
our inability to maintain the key business relationships and the brand equity of businesses we acquire; |
|
|
• |
our inability to retain key personnel of the acquired business; and |
|
|
• |
our responsibility for the liabilities of the businesses we acquire, some of which we may not anticipate, including costs of third-party advisors to resolve disputes. |
21
Our success depends on attracting and retaining key personnel.
Our business has grown significantly since its inception. Our success is dependent in large part on the continued employment of our executive officers, including Thomas R. Stanton, our Chief Executive Officer, and other key management personnel. The unplanned departure of one or more of these individuals could adversely affect our business. In addition, for ADTRAN to continue as a successful entity we must also be able to attract and retain key engineers and software developers and architects whose expertise helps us maintain competitive advantages. We believe that our future success will depend, in large part, upon our ability to continue to attract, retain, train and motivate highly-skilled employees who are in great demand. Stock awards are designed to reward employees for their long-term contributions and to provide incentives for them to remain with us. Changes to our overall compensation program, including our stock incentive program, may adversely affect our ability to retain key employees. Properly managing our continued growth, avoiding the problems often resulting from such growth and expansion and continuing to operate in the manner which has proven successful to us to date will be critical to the future success of our business.
If we fail to manage our exposure to worldwide financial and securities markets successfully, our operating results and financial statements could be materially impacted.
We are exposed to financial market risks, including changes in interest rates and prices of marketable equity and fixed-income securities. The global macroeconomic environment has been challenging and inconsistent due to uncertainty in the global central bank monetary policy and uncertainty in global credit markets and the geopolitical environment in many areas of the world. The primary objective of the majority of our investment activities is to preserve principal while at the same time achieving appropriate yields without significantly increasing risk. To achieve this objective, a majority of our marketable securities are investment grade corporate and municipal fixed-rate bonds, U.S. government bonds and municipal money market instruments denominated in U.S. dollars. While we do invest a portion of our investment portfolio in equities, which are subject to market risks, including the loss of principal, our equity investments are generally invested in professionally-managed portfolios with the objective of exceeding the performance of their underlying benchmarks.
We have significant investments in corporate bonds, municipal fixed-rate bonds, asset-backed bonds, mortgage/agency-backed bonds, U.S. government bonds and foreign government bonds. Through December 31, 2020, we have not been required to impair any of these investments; however, we may experience a reduction in value or loss of liquidity in these investments, which may have an adverse effect on our results of operations, liquidity and financial condition. Fixed-rate interest securities may have their fair value adversely impacted due to a rise in interest rates, while variable-rate securities may produce less income than expected if interest rates fall. Our investments are subject to general credit, liquidity, market and interest rate risks, which may increase because of conditions in the financial markets and related credit liquidity issues. Consequently, our future investment income may fall short of expectations due to changes in interest rates, or we may suffer losses in principal if we are forced to sell securities that decline in fair value due to changes in interest rates.
See “Management’s Discussion and Analysis of Financial Condition and Results of Operations – Liquidity and Capital Resources” in Part II, Item 7 of this report, “Quantitative and Qualitative Disclosures about Market Risk” in Part II, Item 7A of this report and Note 6 of Notes to the Consolidated Financial Statements in Part II, Item 8 of this report for more information about our investments
Risks related to COVID-19
The ongoing COVID-19 pandemic could adversely affect our business, results of operations and financial condition.
In March 2020, the World Health Organization declared the outbreak of COVID-19, a pandemic. COVID-19 continues to spread and has resulted in authorities implementing numerous measures to contain the virus, including travel bans and restrictions, quarantines, shelter-in-place orders, and business limitations and shutdowns. While we are unable to accurately predict the full impact that COVID-19 will have on our results of operations, financial condition, liquidity and cash flows due to numerous uncertainties, including the duration and severity of the pandemic and containment measures, our compliance with these measures has impacted, and may continue to impact, our day-to-day operations and could continue to disrupt our business and operations, as well as that of our customers, suppliers (including contract manufacturers) and other counterparties, for an indefinite period of time. We have experienced, and may continue to experience, disruptions in our supply chain, including a slow-down in supply chain deliveries and some raw material and freight-related cost increases as a result of the pandemic.
To support the health and well-being of our employees, customers, partners and communities, a majority of our employees are working remotely as of February 26, 2021. However, there is risk that a number of our employees could be infected with COVID-19, including our key personnel. In addition, many of our customers, suppliers and other counterparties are working remotely, which may delay the timing of some orders and expected deliveries. The disruptions to our operations caused by COVID-19 may result in inefficiencies, delays and additional costs in our product development, sales, marketing and customer service efforts that we cannot fully mitigate through remote or other alternative work arrangements. These additional costs may be partially offset by reduced travel expenses as a result of travel restrictions that we have in place, as well as lower marketing-related costs.
22
More generally, the global pandemic has caused a significant economic downturn and volatility in financial markets, which could affect demand for our products and services and impact our results and financial condition even after the pandemic is contained and the shelter-in-place orders are lifted. For example, we may be unable to collect receivables from those customers significantly impacted by COVID-19. Also, a decrease in orders could negatively affect our revenues in future periods, particularly if experienced on a sustained basis.
Although we expect that current cash and cash equivalent balances and cash flows that are generated from operations will be sufficient to meet our domestic and international working capital needs and other capital and liquidity requirements for at least the next 12 months, if our access to capital is restricted or our borrowing costs increase as a result of the COVID-19 pandemic, our operations and financial condition could be adversely impacted.
Moreover, the impacts of the COVID-19 pandemic may exacerbate other pre-existing risks, such as political, regulatory, social, financial, operational and cybersecurity risks, and those associated with global economic conditions, any of which could have a material adverse effect on our business.
We will continue to evaluate the nature and extent of the impact of COVID-19 on our business.
Risks related to our control environment
We are currently in the process of implementing a new enterprise resource planning (“ERP”) software solution. If we do not effectively implement this project, or any future associated updates, our operations could be significantly disrupted.
We are currently in the process of implementing of a new ERP software solution. This project requires us to migrate and reconfigure all of our current system processes, transactions, data and controls to a new cloud-based platform and is expected to have a significant impact on our business processes, financial reporting, information systems and internal controls. This has required, and will continue to require, significant change management, meaningful investment in capital and personnel resources and coordination of numerous software and system providers and internal business teams. We may experience difficulties, including delays and higher than anticipated costs related to personnel and capital resources, as we manage these changes and transition to this new ERP solution, including loss or corruption of data, delayed shipments, delayed financial reporting, decreases in productivity as our personnel implement and become familiar with the new systems and processes, unanticipated expenses (including increased costs of implementation, costs of conducting business or the potential impairment of previously capitalized ERP implementation costs) and lost revenue. Once implemented, we will have cloud driven quarterly updates. Although we will conduct design validations and user testing, these may cause delays in transacting our business due to system challenges, limitations in functionality, inadequate change management or process deficiencies in the production and use of the system. Difficulties in implementing this new ERP solution or the related quarterly updates could disrupt our operations, divert management’s attention from key strategic initiatives and have an adverse effect on our results of operations, financial condition and cash flows.
Breaches of our information systems and cyber-attacks could compromise our intellectual property and cause significant damage to our business and reputation.
We maintain sensitive data on our information systems and the networks of third-party providers, including intellectual property, financial data and proprietary or confidential business information relating to our business, customers, suppliers and business partners. We also produce networking equipment solutions and software used by network operators to ensure security and reliability in their management and transmission of data. Our customers, particularly those in regulated industries, are increasingly focused on the security features of our technology solutions. Maintaining the security of information sensitive to us and our business partners is critical to our business and reputation. We rely upon a number of internal business processes and information systems to support key operations and financial functions, and the efficient operation of these processes and systems is critical. Companies are increasingly subjected to cyber-attacks and other attempts to gain unauthorized access. We have a comprehensive approach to cybersecurity, which includes prevention, detection, containment and response. Our layered defense approach encompasses proactive security monitoring of our global infrastructure by both internal solutions and multiple third-party Security Operation Centers. Additionally, we routinely perform patch management, vulnerability scans and continuous monitoring across our entire enterprise. Our security policy framework includes meaningful and enforceable Information Security policies and procedures. The cybersecurity program is aligned with our mission and business objectives, reviewed periodically for improvements and is supported by experienced and certified security professionals. This is supplemented by an information security awareness program spanning our global workforce. Despite this, our network and storage applications and those systems and storage applications maintained by our third-party providers may be subject to unauthorized access by cyber-attack or breached due to operator error, fraudulent activity or other system disruptions. For example, although no indicators of compromise were identified by the Company in response to the SolarWinds Orion cybersecurity breach, we cannot absolutely assure that a future malware attack will not be successful in breaching our system and in turn, have a material impact to the Company. Additionally, in some cases, it is difficult to anticipate or immediately detect damage caused by such incidents. Unauthorized access or disclosure of our information could compromise our intellectual property and expose sensitive business information. Our information systems are designed to appropriate industry standards to reduce downtime in the event of
23
power outages, weather or climate events and cybersecurity issues. The Company carries two cybersecurity insurance policies meant to limit its risk and exposure should one of these cybersecurity issues occur. However, a significant failure of our systems due to these issues could result in significant remediation costs, disrupt business operations and divert management attention, which could result in harm to our business reputation, operating results, financial condition and cash flow.
While we have remediated the previously identified material weakness in our internal control over financial reporting, any future material weakness, if not remediated, materially adversely affect us.
Section 404 of the Sarbanes-Oxley Act of 2002 (“Section 404”) requires us to include in our Annual Reports on Form 10-K an assessment by the Company’s management of the effectiveness of our internal control over financial reporting, as well as a report from our independent registered public accounting firm on the effectiveness of our internal control over financial reporting. We must perform system and process evaluation and testing of our internal control over financial reporting to allow management and our independent registered public accounting firm to report on the effectiveness of our internal control over financial reporting, as required by Section 404. Our compliance with Section 404 may require that we incur substantial accounting expense and expend significant management efforts. In addition, if management or our independent registered public accounting firm is unable to conclude that our internal control over financial reporting is effective, we could lose investor confidence in the accuracy and completeness of our financial statements, which could have an adverse effect on our stock price or lead to litigation claims.
Our initiatives to remediate a material weakness in our internal control over financial reporting identified in the future may not prove successful, and management may not be able to conclude that our internal control over financial reporting is effective. Furthermore, even if management were to reach a conclusion that our internal control over financial reporting is effective, if our independent registered public accounting firm or the PCAOB is not satisfied with the adequacy of our controls, or if the independent registered public accounting firm interprets the requirements, rules or regulations differently than we do, then they in the future may decline to issue a report on our internal control over financial reporting or may issue a report that is qualified. Any of these events could result in a loss of investor confidence in the reliability of our financial statements, which in turn could negatively affect the price of our common stock.
Risks related to the telecommunications industry
We must continue to update and improve our products and develop new products to compete and to keep pace with improvements in communications technology.
The markets for our products are characterized by rapidly changing technology, evolving industry standards and continuing improvements in the communications service offerings of service providers. If technologies or standards applicable to our products, or service provider offerings based on our products, become obsolete or fail to gain widespread commercial acceptance, our existing products or products under development may become obsolete or unmarketable. Moreover, the introduction of products embodying new technologies, the emergence of new industry standards, or changes in service provider offerings could adversely affect our ability to sell our products. For instance, we offer a large number of products that apply primarily to the delivery of high-speed digital communications over the local loop utilizing copper wire. We compete favorably with our competitors by developing a high-performance line of these products. We market products that apply to fiber optic transport in the local loop. We expect, however, that use of coaxial cable and fixed and mobile wireless access in place of local loop access will increase. Also, MSOs are increasing their presence in the local loop. To meet the requirements of these new delivery systems and to maintain our market position, we expect to continue to develop new products and/or modify existing products. We expect that the addition of fiber-based products focused on the cable MSO operators, using EPON and RFoG technologies, and fixed wireless access solutions will better position us to benefit from spending in these adjacent markets.
Our revenue and profitability in the past have, to a significant extent, resulted from our ability to anticipate changes in technology, industry standards and service provider offerings, and to develop and introduce new and enhanced products. Our continued ability to adapt will be a significant factor in maintaining or improving our competitive position and our prospects for growth. We cannot assure that we will be able to respond effectively to changes in technology, industry standards, service provider offerings or new product announcements by our competitors. We also cannot assure that we will be able to successfully develop and market new products or product enhancements, or that these products or enhancements will achieve market acceptance. Any failure by us to continue to anticipate or respond in a cost-effective and timely manner to changes in technology, industry standards, service provider offerings or new product announcements by our competitors, or any significant delays in product development or introduction, could have a material adverse effect on our ability to competitively market our products and on our revenues, results of operations, financial condition and cash flows.
24
Our failure or the failure of our contract manufacturers to comply with applicable environmental regulations could adversely impact our results of operations.
The manufacture, assembly and testing of our products may require the use of hazardous materials that are subject to environmental, health and safety regulations. Our failure or the failure of our contract manufacturers to comply with any of these applicable requirements could result in regulatory penalties, legal claims or disruption of production. In addition, our failure or the failure of our contract manufacturers to properly manage the use, transportation, emission, discharge, storage, recycling or disposal of hazardous materials could subject us to increased costs or liabilities. Existing and future environmental regulations may restrict our use of certain materials to manufacture, assemble and test products. Any of these consequences could adversely impact our results of operations by increasing our expenses and/or requiring us to alter our manufacturing processes.
If our products do not interoperate with our customers’ networks, installations may be delayed or canceled, which could harm our business.
Our products must interface with existing networks, each of which may have different specifications, utilize multiple protocol standards and incorporate products from other vendors. Many of our customers’ networks contain multiple generations of products that have been added over time as these networks have grown and evolved. Our products may be required to interoperate with many or all of the products within these networks, as well as future products to meet our customers’ requirements. If we find errors in the existing software or defects in the hardware used in our customers’ networks, we may have to modify our software or hardware to fix or overcome these errors so that our products will interoperate with the existing software and hardware. Implementation of product corrections involving interoperability issues could increase our costs and adversely affect our results of operations. Such issues may affect our ability to obtain product acceptance from other customers.
We engage in research and development activities to develop new, innovative solutions and to improve the application of developed technologies, and as a consequence may miss certain market opportunities enjoyed by larger companies with substantially greater research and development efforts and which may focus on more leading edge development.
We engage in research and development activities to develop new, innovative solutions and to improve the application of developed technologies, and as a consequence may miss certain market opportunities enjoyed by larger companies with substantially greater research and development efforts. A portion of our research and development activities are focused on the continued innovation of currently accepted access technologies in order to deliver faster internet speeds, more capacity, better quality of service and operational efficiency. These research and development efforts result in improved applications of technologies for which demand already exists or is latent. We also focus our research and development efforts on developing software, solutions and platforms that enable service providers to increase revenue-generating service velocity, reducing operational costs, increasing scale and providing service agility. We rarely engage in research projects that represent a vast departure from the current business practices of our key customers. While we believe our strategy provides a higher likelihood of producing nearer term or more sustainable revenue streams, this strategy could result in lost revenue opportunities and higher operating expenses should a new technology achieve rapid and widespread market acceptance. When we do engage in research and development activities for new, leading-edge technologies and market approaches, there is no guarantee that those technologies or market approaches will be successful or that they will be adopted and purchased by our customers.
Our strategy of outsourcing a portion of our manufacturing requirements to subcontractors located in various international regions may result in us not meeting our cost, quality or performance standards.
We are heavily dependent on subcontractors for the assembly and testing of certain printed circuit board assemblies, subassemblies, chassis, enclosures and equipment shelves, and the purchase of some raw materials used in such assemblies. This reliance involves several risks, including the unavailability of, or interruptions in, access to certain process technologies and reduced control over product quality, delivery schedules, transportation, manufacturing yields and costs. We may not be able to provide product order volumes to our subcontractors that are high enough to achieve sufficient cost savings. If shipments fall below forecasted levels, we may incur increased costs or be required to take ownership of excess inventory. Changes in international tariff structures could adversely impact our product costs. In addition, a significant component of maintaining cost competitiveness is the ability of our subcontractors to adjust their costs to compensate for possible adverse exchange rate movements. To the extent that the subcontractors are unable to do so, and we are unable to procure alternative product supplies, then our competitiveness and results of operations could be adversely impaired. These risks may be exacerbated by economic, regulatory or political changes or uncertainties, terrorist actions, the effects of climate change, natural disasters or pandemics in the foreign countries in which our subcontractors are located. We do not utilize contract manufacturing for our products in China, though we do source some ODM products from China which are, or may become, subject to import tariffs. Additionally, concerns and additional costs associated with import tariffs imposed on certain products from China has resulted in manufacturers seeking to secure production capabilities outside of China, including in countries where we currently utilize contract manufacturing.
25
To date, we believe that we have successfully managed the risks of our dependence on these subcontractors through a variety of efforts, which include seeking and developing alternative subcontractors while maintaining existing relationships; however, we cannot be assured that delays in product deliveries will not occur in the future because of shortages resulting from this limited number of subcontractors or from the financial or other difficulties of these parties. Our inability to develop alternative subcontractors if and as required in the future, or the need to undertake required retraining and other activities related to establishing and developing a new subcontractor relationship, could result in delays or reductions in product shipments which, in turn, could have a negative effect on our customer relationships and operating results.
Our failure to maintain rights to intellectual property used in our business could adversely affect the development, functionality and commercial value of our products.
Our future success depends in part upon our proprietary technology. Although we attempt to protect our proprietary technology by contract, trademark, copyright and patent registration and internal security, including trade secret protection, these protections may not be adequate. Furthermore, our competitors can develop similar technology independently without violating our proprietary rights. From time to time, we receive and may continue to receive notices of claims alleging that we are infringing upon patents or other intellectual property. Any of these claims, whether with or without merit, could result in significant legal fees, divert our management’s time, attention and resources, delay our product shipments or require us to enter into royalty or licensing agreements. We cannot predict whether we will prevail in any claims or litigation over alleged infringements, or whether we will be able to license any valid and infringed patents, or other intellectual property, on commercially reasonable terms. If a claim of intellectual property infringement against us is successful and we fail to obtain a license or develop or license non-infringing technology, our business, operating results, financial condition and cash flows could be affected adversely.
Software under license from third parties for use in certain of our products may not continue to be available to us on commercially reasonable terms.
We integrate third-party software into certain of our products. Licenses for this technology may not be available or continue to be available to us on commercially reasonable terms. Difficulties with third-party technology licensors could result in the termination of such licenses, which may result in increased costs or require us to purchase or develop a substitute technology. Difficulty obtaining and maintaining third-party technology licenses may disrupt the development of our products and increase our costs, which could harm our business.
Our use of open source software could impose limitations on our ability to commercialize our products.
Several of our solutions utilize elements of open source or publicly available software. Although we closely monitor our use of open source software, the terms of many open source software licenses have not been interpreted by the courts, and there is a risk that such licenses could be construed in a manner that could impose unanticipated conditions or restrictions on our ability to sell our products. In such event, we could be required to make our proprietary software generally available to third parties, including competitors, at no cost, to seek licenses from third parties in order to continue offering our products, to re-engineer our products or to discontinue the sale of our products in the event re-engineering cannot be accomplished on a timely basis or at all, any of which could adversely affect our revenues and operating expenses.
We may incur liabilities or become subject to litigation that would have a material effect on our business.
In the ordinary course of business, we accept purchase orders, and enter into sales and other related contracts, for the marketing, sale, manufacture, distribution or use of our products and services. We may incur liabilities relating to our performance under such agreements, or which result from damage claims arising from certain events as outlined within the particular contract. While we attempt to include reasonable limitations of liability and other protective measures to all agreements, such agreements may not always contain, or be subject to, maximum loss clauses and liabilities arising from them may result in significant adverse changes to our results of operations, financial condition and cash flows.
In the ordinary course of business, we may be subject to various legal proceedings and claims, including employment disputes, patent claims, disputes over contract agreements and other commercial disputes. In some cases, claimants seek monetary recovery, or other relief, including damages such as royalty payments related to patents, lost profits or injunctive relief, which, if granted, could require significant expenditures. Any such disputes may be resolved before trial, or if tried, may be resolved in our favor; however, the cost of claims sustained in litigation, and costs associated with the litigation process, may not be covered by our insurance. Such costs, and the demands on management time during such an event, could harm our business, reputation and have a material adverse effect on our liquidity, results of operations, financial condition and cash flows.
26
Consolidation and deterioration in the CLEC market could result in a significant decrease in our revenue.
We sell a moderate volume of products directly or indirectly to CLECs who compete with the established ILEC. The CLEC market is experiencing a process of consolidation. Many of our CLEC customers do not have a strong financial position and have limited ability to access the public financial markets for additional funding for growth and operations. If one or more of these CLECs fail, we could face a loss in revenue and an increased bad debt expense, due to their inability to pay outstanding invoices, as well as the corresponding decrease in customer base and future revenue. Furthermore, significant portions of our sales to CLECs are made through independent distributors. The failure of one or more CLECs could also negatively affect the financial position of a distributor to the point that the distributor could also experience business failure and/or default on payments to us.
If we are unable to successfully develop and maintain relationships with SIs, service providers and enterprise VARs, our sales may be negatively affected.
As part of our sales strategy, we are targeting SIs, service providers and enterprise VARs. In addition to specialized technical expertise, SIs, service providers and VARs typically offer sophisticated service capabilities that are frequently desired by enterprise customers. To expand our distribution channel to include resellers with such capabilities, we must be able to provide effective support to these resellers. If our sales, marketing or service capabilities are not sufficient to provide effective support to such SIs, service providers and VARs, our sales may be negatively affected, and current SI, service provider and VAR partners may terminate their relationships with us, which would adversely impact our sales and overall results of operations.
General Risk Factors
Risks related to the Company’s stock price
Our operating results may fluctuate in future periods, which may adversely affect our stock price.
Our operating results have been, and will continue to be, subject to quarterly and annual fluctuations as a result of numerous factors. These factors include, but are not limited to:
|
|
• |
fluctuations in demand for our products and services, especially with respect to significant network expansion projects undertaken by service providers; |
|
|
• |
continued growth of communications network traffic and the adoption of communication services and applications by enterprise and consumer end users; |
|
|
• |
changes in sales and implementation cycles for our products and reduced visibility into our customers’ spending plans and associated revenue, especially should a slowdown in communications industry spending occur due to economic downturns, tight capital markets, or declining liquidity trends; |
|
|
• |
reductions in demand for our traditional products as new technologies gain acceptance; |
|
|
• |
our ability, and that of our distributors, to maintain appropriate inventory levels and related purchase commitments; |
|
|
• |
price and product competition in the communications and networking industries, which can change rapidly due to technological innovation; |
|
|
• |
the overall movement toward industry consolidation among both our competitors and our customers; |
|
|
• |
our dependence on sales of our products by channel partners, the timing of their replenishment orders, the potential for conflicts and competition involving our channel partners and large end-user customers and the potential for consolidation among our channel partners; |
|
|
• |
variations in sales channels, product cost or mix of products and services sold; |
|
|
• |
delays in receiving acceptance, as defined under contract, from certain customers for shipments or services performed near the end of a reporting period; |
|
|
• |
our ability to maintain high levels of product support and professional services; |
|
|
• |
manufacturing and customer order lead times, and potential restrictions in the supply of key components; |
|
|
• |
fluctuations in our gross margin and the factors that contribute to this (as described above); |
|
|
• |
our ability to achieve cost reductions; |
|
|
• |
the ability of our customers, channel partners and suppliers to obtain financing or to fund capital expenditures; |
|
|
• |
our ability to execute on our strategy and operating plans; |
27
|
|
• |
benefits anticipated from our investments in engineering, sales and marketing activities; |
|
|
• |
the effects of climate change and other natural events; |
|
|
• |
the effect of political or economic conditions, including the effect of tariffs or so-called “trade wars” on us and our supply chain, acts of war, terrorist attacks or other unrest in certain international markets; and |
|
|
• |
changes in tax laws and regulations or accounting pronouncements. |
As a result, operating results for a particular future period are difficult to predict, and prior results are not necessarily indicative of results to be expected in future periods. Any of the above-mentioned factors, or other factors discussed elsewhere in this report, could have a material adverse effect on our business, results of operations, financial condition and cash flows that could adversely affect our stock price.
The price of our common stock has been volatile and may continue to fluctuate significantly.
Our common stock is traded on the NASDAQ Global Select Market under the symbol ADTN. Since our initial public offering in August 1994, there has been, and may continue to be, significant volatility in the market for our common stock, based on a variety of factors, including factors listed in this section, some of which are beyond our control.
Risks related to the regulatory environments in which we do business
We are subject to complex and evolving U.S. and foreign laws, regulations and standards governing the conduct of our business. Violations of these laws and regulations may harm our business, subject us to penalties and to other adverse consequences.
We are subject to laws and regulations that govern conduct by our Company, our employees and agents and the manufacture, sale and use of our products. Our inability to comply with current and evolving laws and regulations governing our business domestically and internationally may adversely affect our revenues, results of operations, financial conditions and cash flows. New and changing laws, regulations and industry practices could require us to modify our business, products or services offered, potentially in a material manner, and may limit our ability to develop new products, services and features. If we violate these laws and regulations, governmental authorities in the U.S. and in foreign jurisdictions could seek to impose civil and/or criminal fines and penalties which could have an adverse effect on our reputation, as well as our results of operations, financial condition and cash flows.
These laws and regulations include, but are not limited to:
|
|
• |
Various regulations and regional standards established by communications authorities and import/export control authorities that govern the manufacture, sale and use of our products. Changes in domestic or international communications regulations, tariffs, potential changes in trade policies by the U.S. and other nations, application requirements, import/export controls or expansion of regulation to new areas, including access, communications or commerce over the Internet, may affect customer demand for our products or slow the adoption of new technologies which may affect our sales. Further, the cost of complying with the evolving standards and regulations, including the cost of product re-design if necessary, or the failure to obtain timely domestic or foreign regulatory approvals or certification such that we may not be able to sell our products where these standards or regulations apply, may adversely affect our revenues, results of operations, financial condition and cash flows. |
|
|
• |
Compliance with a wide variety of provincial, state, national and international laws and regulations applicable to the collection, use, retention, protection, disclosure, transfer and other processing of data, including personal data. Foreign data protection, privacy and other laws and regulations, including GDPR, are often more restrictive than those in the U.S. These data protection and privacy-related laws and regulations are varied, evolving, can be subject to significant change, may be augmented or replaced by new or additional laws and regulations and may result in ever-increasing regulatory and public scrutiny and escalating levels of enforcement and sanctions. For example, California’s Consumer Privacy Act became effective in January 2020, providing new data privacy rights for consumers and new operational requirements for companies, and, on July 16, 2020, the Court of Justice of the European Union issued a decision that invalidated the EU-U.S. Privacy Shield framework as a basis for transfers of personal data from the EU to the U.S., resulting in uncertainty and potential additional compliance obligations to ensure that a valid basis under the GDPR exists for these data transfers. There is also a risk that we, directly or as the result of a third-party service provider we use, could be found to have failed to comply with the laws and regulations applicable in a jurisdiction regarding the collection, consent, handling, transfer or disposal of personal data. |
28
|
|
• |
The FCPA, which prohibits U.S. companies and their intermediaries from making corrupt payments to foreign officials for the purpose of directing, obtaining or keeping business, and requires companies to maintain reasonable books and records and a system of internal accounting controls. The FCPA applies to companies, individual directors, officers, employees and agents. Under the FCPA, U.S. companies may be held liable for the corrupt actions taken by employees, strategic or local partners or other representatives. Because a significant portion of our total revenues is generated from sales outside of the U.S., we have proactively implemented internally and externally focused measures and controls to address this risk. We help ensure that our employees understand the key requirements of FCPA compliance and the consequences of non-compliance through training courses and detective controls. ADTRAN senior management and employees whose responsibilities include international activities are required to complete an online training program and pass an exam every two years. We have put processes in place to help detect non-compliance through providing our employees access to a worldwide reporting “hotline,” available by phone and online, that is maintained by a third-party provider. Finally, we perform annual reviews of our employees’ expense reports and corporate credit card activity to identify possible corruption concerns. We have also implemented controls to help ensure our third-party partners and customers observe FCPA requirements. Prior to selling to new international distributors, resellers or agents, we review third-party data and check them against over 200 denied party lists from government institutions worldwide for potential FCPA concerns. We also require international distributors, resellers and agents to complete an Anti-Corruption Due Diligence Questionnaire, which is reviewed and assessed by a cross-functional compliance committee and our export-compliance function. |
|
|
• |
Environmental, health and safety regulation governing the manufacture, assembly and testing of our products, including without limitation regulations governing the use of hazardous materials. Our failure or the failure of our contract manufacturers to properly manage the use, transportation, emission, discharge, storage, recycling or disposal of hazardous materials could subject us to increased costs or liabilities. Existing and future environmental regulations may restrict our use of certain materials to manufacture, assemble and test products. |
|
|
• |
Requirements by the SEC governing the disclosure of the use of “conflict minerals” mined from the Democratic Republic of Congo and adjoining countries and procedures to identify the source of such minerals included in manufactured products. The disclosures will require us to incur additional costs to verify the origins of the identified minerals used and comply with disclosure requirements. These requirements could affect the availability of minerals used in the manufacture of a limited number of parts contained in our products. This may reduce the number of suppliers who provide conflict-free minerals and may affect our ability to obtain products in sufficient quantities or at competitive prices. Our material sourcing is broad-based and multi-tiered. While we are taking steps to identify sourcing based on recommended standards for our industry, we may not be able to conclusively verify the origins for all minerals used in our products. An inability to make a sourcing determination of minerals in our products could impact our revenues and harm our financial condition should our customers require that we certify that all components used in our products are free of minerals from this region. |
29
Changes in trade policy in the U.S. and other countries, specifically the U.K. and China, including the imposition of additional tariffs and the resulting consequences, may adversely impact our gross profits, gross margins, results of operations and financial condition.
The U.S. government has imposed tariffs on a wide range of products and goods manufactured in China and imported into the U.S. These tariffs are intended to address trade imbalances, which include decreasing imports from China and encouraging increased production of these products in the U.S. These proposals have, and could continue to, result in increased customs duties and tariffs. We import an increasing percentage of our products into the U.S. from China and an increase in customs duties and tariffs with respect to these imports could negatively impact our gross profit, gross margins and results of operations. These customs duties and tariffs may also cause other U.S. trading partners to take certain actions with respect to U.S. imports in their respective countries. Any potential changes in trade policies in the U.S. and the potential actions by other countries in which we do business could adversely impact our financial performance.
In June 2016, the UK held a referendum, commonly referred to as “Brexit,” in which the majority of voters elected to withdraw from the EU. The UK formally departed from the EU on Friday, January 31, 2020. Negotiations between the UK and the EU are ongoing regarding the customs and trading relationship between the UK and the EU. Although the terms of withdrawal remain in negotiation, the referendum has created global economic uncertainty, including anticipation of a possible slowdown in the global economy. Brexit has resulted in, and likely will continue to result in, significant volatility in the value of the British Pound Sterling and Euro currencies. The past year has been challenging for the credit markets due to a shift from a time of quantitative easing to a time of quantitative tightening by central banks around the world. If global economic and market conditions, or economic conditions in key markets, remain uncertain or further deteriorate, we may experience material impacts on our business and operating results. We may also be adversely affected in ways that we do not currently anticipate.
New or revised tax regulations, changes in our effective tax rate, recognition of a valuation allowance or assessments arising from tax audits may have an adverse impact on our results.
We are subject to taxation in various jurisdictions, both domestically and internationally, in which we conduct business. Significant judgment is required in the determination of our provision for income taxes, and this determination requires the interpretation and application of complex and sometimes uncertain tax laws and regulations. Our effective tax rate may be adversely impacted by changes in the mix of earnings between jurisdictions with different statutory tax rates, in the valuation of our deferred tax assets, and by changes in tax rules and regulations. We continually monitor our deferred tax assets and when it becomes more likely than not that a tax benefit will not be recognized, a valuation allowance is recorded against those assets. In addition, we are subject to examination of our income tax returns by the Internal Revenue Service and various other jurisdictions in which we conduct business. We regularly assess the likelihood of adverse outcomes resulting from these examinations to determine the adequacy of our provision for income taxes. There can be no assurance that the outcomes from these continuous examinations will not have an adverse effect on our results of operations, financial condition and cash flow. Additionally, we continually review the adequacy of the valuation allowance and recognize the benefits of deferred tax assets only as the reassessment indicates that it is more likely than not that the deferred tax assets will be recognized. As such, we may release a portion of the valuation allowance or establish a new valuation allowance based on operations in the jurisdictions in which these assets arose. Management continues to evaluate all evidence including historical operating results, the existence of losses in the most recent year, forecasted earnings, future taxable income and tax planning strategies. Should management determine that a valuation allowance is needed in the future due to not being able to absorb deferred tax assets, it would have a material impact on our consolidated financial statements.
30
|
ITEM 1B. |
UNRESOLVED STAFF COMMENTS |
None.
|
ITEM 2. |
PROPERTIES |
Our headquarters and principal administrative, engineering and manufacturing facilities are located on an 82-acre campus in Cummings Research Park in Huntsville, Alabama. Two office buildings serve both our Network Solutions and our Services & Support segments. We lease engineering facilities in the U.S. and Europe that are used to develop products sold by our Network Solutions segment. In addition, we lease office space in North America, LATAM, EMEA and APAC, providing sales and service support for both of our segments. These cancelable and non-cancelable leases expire at various times through 2025. For more information, see Note 9 of Notes to Consolidated Financial Statements included in Part II, Item 8 of this report.
We also have numerous sales and support staff operating from home-based offices serving both our Network Solutions and our Services & Support segments, which are located within the U.S. and abroad.
|
ITEM 3. |
LEGAL PROCEEDINGS |
Securities Class Action Lawsuit
On October 17, 2019, a purported stockholder class action lawsuit, captioned Burbridge v. ADTRAN, Inc. et al., Docket No. 19-cv-09619, was filed in the United States District Court for the Southern District of New York against the Company, two of its current executive officers and one of its former executive officers. The complaint alleges violations of federal securities laws and seeks unspecified compensatory damages on behalf of purported purchasers of ADTRAN securities between February 28, 2019 and October 9, 2019. The lawsuit claims that the defendants made materially false and misleading statements regarding, and/or failed to disclose material adverse facts about, the Company’s business, operations and prospects, specifically relating to the Company’s internal control over financial reporting, excess and obsolete inventory reserves, financial results and demand from certain customers. The lawsuit was transferred to the U.S. District Court for the Northern District of Alabama on January 7, 2020, and co-lead plaintiffs have been appointed to represent the putative class. The plaintiffs filed an amended complaint on April 30, 2020. The defendants filed a motion to dismiss the amended complaint on June 17, 2020. The plaintiffs filed an opposition brief to the defendants’ motion to dismiss on July 17, 2020. The defendants filed a reply to the plaintiffs’ brief on August 17, 2020. The motion to dismiss remains under review by the Court. We deny the allegations in the complaint, as amended, and intend to vigorously defend against this lawsuit. At this time, we are unable to predict the outcome of or estimate the possible loss or range of loss, if any, associated with this lawsuit.
Shareholder Derivative Lawsuit
On March 31, 2020, a shareholder derivative suit, captioned Johnson (Derivatively on behalf of ADTRAN) v. T. Stanton, M. Foliano, R. Shannon, and Board of Directors, case no. 5:20-cv-00447, was filed in the U.S. District Court of Northern Alabama against two of the Company’s current executive officers, one of its former executive officers and its Board of Directors. The derivative suit, which is purportedly brought on behalf of ADTRAN, makes similar allegations as the stockholder class action lawsuit and accuses the directors and officers of breaches of fiduciary duty in connection with those allegations. On June 7, 2020, the Court entered an order staying the derivative litigation pending resolution of the motion to dismiss in the securities class action. The Company and its defendants disagree with the claims made in the complaint, and the defendants intend to vigorously defend against this lawsuit. At this time, we are unable to predict the outcome of or estimate the possible loss or range of loss, if any, associated with this lawsuit.
Other Legal Matters
In addition to the litigation described above, from time to time we are subject to or otherwise involved in various lawsuits, claims, investigations and legal proceedings that arise out of or are incidental to the conduct of our business (collectively, “Legal Matters”), including those relating to employment matters, patent rights, regulatory compliance matters, stockholder claims, and contractual and other commercial disputes. Such Legal Matters, even if not meritorious, could result in the expenditure of significant financial and managerial resources. Additionally, an unfavorable outcome in a legal matter, including in a patent dispute, could require the Company to pay damages, entitle claimants to other relief, such as royalties, or could prevent the Company from selling some of its products in certain jurisdictions. While the Company cannot predict with certainty the results of the Legal Matters in which it is currently involved, the Company does not expect that the ultimate outcome of such Legal Matters will individually or in the aggregate have a material adverse effect on its business, results of operations, financial condition or cash flows.
31
|
ITEM 4. |
MINE SAFETY DISCLOSURES |
Not applicable.
32
PART II
|
ITEM 5. |
MARKET FOR REGISTRANT'S COMMON EQUITY, RELATED STOCKHOLDER MATTERS AND ISSUER PURCHASES OF EQUITY SECURITIES |
ADTRAN's common stock is traded on the NASDAQ Global Select Market under the symbol ADTN. As of February 19, 2021, ADTRAN had 154 stockholders of record and approximately 12,705 beneficial owners of shares held in street name.
Stock Repurchases
The following table sets forth repurchases of our common stock for the months indicated.
|
Period |
|
Total Number of Shares Purchased |
|
|
Average Price Paid per Share |
|
|
Total Number of Shares Purchased as Part of Publicly Announced Plans or Programs (1) |
|
|
Maximum Number of Shares that May Yet Be Purchased Under the Plans or Programs |
|
||||
|
October 1, 2020 – October 31, 2020 |
|
|
— |
|
|
$ |
— |
|
|
|
— |
|
|
|
2,545,430 |
|
|
November 1, 2020 – November 30, 2020 |
|
|
— |
|
|
$ |
— |
|
|
|
— |
|
|
|
2,545,430 |
|
|
December 1, 2020 – December 31, 2020 |
|
|
— |
|
|
$ |
— |
|
|
|
— |
|
|
|
2,545,430 |
|
|
Total |
|
|
— |
|
|
|
|
|
|
|
— |
|
|
|
|
|
|
(1) |
In July 2015, our Board of Directors approved a share repurchase program that authorized open market repurchase transactions of our common stock, which are implemented through open market or private purchases from time to time as conditions warrant. We currently have authorization to repurchase an additional 2.5 million shares of our common stock under the current authorization of up to 5.0 million shares. |
33
|
ITEM 6. |
SELECTED FINANCIAL DATA |
The Company has applied the amendment to Regulation S-K Item 301 which became effective on February 10, 2021.
34
|
ITEM 7. |
MANAGEMENT'S DISCUSSION AND ANALYSIS OF FINANCIAL CONDITION AND RESULTS OF OPERATIONS |
The following discussion should be read in conjunction with our audited consolidated financial statements and the related notes included in Part II, Item 8 of this Annual Report on Form 10-K. We have omitted discussion of the earliest of the three years of financial condition and results of operations and this information can be found in Part I, Item 7, “Management's Discussion and Analysis of Financial Condition and Results of Operations” of our Annual Report on Form 10-K for the fiscal year ended December 31, 2019, filed with the SEC on February 25, 2020, which is available free of charge on the SEC's website at sec.gov and on our website at www.adtran.com.
This discussion is designed to provide the reader with information that will assist in understanding our consolidated financial statements, the changes in certain key items in those financial statements from period to period, and the primary factors that accounted for those changes, as well as how certain accounting principles affect our consolidated financial statements. See “Cautionary Note Regarding Forward-Looking Statements” on page 2 of this report for a description of important factors that could cause actual results to differ from expected results. See also Part I, Item 1A, Risk Factors, of this Form 10-K.
Overview
ADTRAN is a leading global provider of networking and communications platforms and services focused on the broadband access market, serving a diverse domestic and international customer base in multiple countries that includes Tier-1, -2 and -3 service providers, alternative service providers, such as utilities, municipalities and fiber overbuilders, cable/MSOs, SMBs and distributed enterprises. Our innovative solutions and services enable voice, data, video and internet communications across a variety of network infrastructures and are currently in use by millions worldwide. We support our customers through our direct global sales organization and our distribution networks. Our success depends upon our ability to increase unit volume and market share through the introduction of new products and succeeding generations of products having lower selling prices and increased functionality as compared to both the prior generation of a product and to the products of competitors. In order to service our customers and grow revenue, we are continually conducting research and development of new products addressing customer needs and testing those products for the specific requirements of the particular customers. We are focused on being a top global supplier of access infrastructure and related value-added solutions from the cloud edge to the subscriber edge. We offer a broad portfolio of flexible software and hardware network solutions and services that enable service providers to meet today’s service demands, while enabling them to transition to the fully-converged, scalable, highly-automated, cloud-controlled voice, data, internet and video network of the future. In addition to our corporate headquarters in Huntsville, Alabama, we have research and development facilities in strategic global locations.
An important part of our strategy is to reduce the cost of each succeeding product generation and then lower the product’s selling price based on the cost savings achieved in order to gain market share and/or improve gross margins. As a part of this strategy, we seek to be a high-quality and low-cost provider of products in our markets. Our success to date is attributable in large measure to our ability to design our products initially with a view to their subsequent redesign, allowing both increased functionality and reduced manufacturing costs in each succeeding product generation. This strategy enables us to sell succeeding generations of products to existing customers, while increasing our market share by selling these enhanced products to new customers.
We ended 2020 with a year-over-year revenue decline of 4.4%, driven by the decrease in shipments to an international Tier-1 operator partially offset by an increase in shipments to regional service providers in the U.S., alternative network operators in Europe and initial sales to a European Tier-1 operator. During 2020, we had three 10% revenue customers. Our year-over-year domestic revenue growth of 17.0% was driven by growth in both Tier-2 and Tier-3 carrier categories due to additional fiber access deployments in both access equipment and CPE. Internationally, our revenue decreased by 32.6% compared to the prior year, primarily driven by a slowdown in shipments to an international Tier-1 operator. In the Asia Pacific region, we experienced growth driven by the acceleration of access network builds. Additionally, fiber access continued to experience revenue growth, and, during 2020, we announced multiple long-term Tier-1 next-generation fiber access deals in Europe and the U.S., positioning us well for the next access network upgrade investment cycle.
35
In March 2020, the World Health Organization declared the outbreak of COVID-19 a pandemic. During the twelve months ended December 31, 2020, there was a downturn in the global financial markets followed by a gradual rebound and a slowdown in the global economy due to the COVID-19 pandemic. COVID-19 continues to spread throughout the U.S. and the world and has resulted in authorities implementing numerous measures to contain the virus, including travel bans and restrictions, quarantines, shelter-in-place orders, and business limitations and shutdowns. While we are unable to accurately predict the full impact that COVID-19 will have on our results of operations, financial condition, liquidity and cash flows due to numerous uncertainties, including the duration and severity of the pandemic and containment measures, our compliance with these measures has impacted our day-to-day operations and could disrupt our business and operations, as well as that of our key customers, suppliers and other counterparties, for an indefinite period of time. We have experienced some impact to our supply chain, including a slowdown in supply chain deliveries, extended lead times on some key components and some raw material cost increases. We have also had to increase our volume of inventory to ensure supply continuity during the pandemic. In addition, we have experienced significant increases in freight-related costs. While throughout the pandemic, we have seen increased demand in networking requirements and utilization due to social distancing guidelines issued by governments, as well as COVID-19 related reductions in travel and infrastructure expenses, it is possible that we could experience some slowdown in demand and further supply chain issues as the pandemic continues. Even after the COVID-19 pandemic has subsided, we may continue to experience adverse impacts to our business as a result of any economic recession that has occurred or may occur in the future.
Among our customers, we made progress with our fiber and fiber-extension solutions, including PON and Gfast, while also continuing to engage various Services & Support opportunities that we expect will contribute to sales in 2021 and beyond. In addition, we believe that we are at the beginning of a significant investment cycle for fiber deployment driven by technology advancements and regulatory influences. The transition to next-generation network architectures is beginning, and we are seeing demand for our next-generation SD-Access solutions. In 2021, we anticipate that payments to service providers under government funding programs such as the FCC RDOF will begin.
In addition to classifying our operations into two reportable segments, we report revenue across three categories of products and services – (1) Access & Aggregation, (2) Subscriber Solutions & Experience and (3) Traditional & Other Products.
Our Access & Aggregation platforms are used by CSPs to connect their network infrastructure to subscribers. This revenue category includes hardware- and software-based products and services that aggregate and/or originate access technologies. ADTRAN solutions within this category include a wide array of modular or fixed platforms designed to deliver the best technology and economy based on subscriber density and environmental conditions.
Our Subscriber Solutions & Experience portfolio is used by service providers to terminate their infrastructure at the customer’s premises while providing an immersive and interactive experience for the subscriber. These solutions include copper and fiber WAN termination, LAN switching, Wi-Fi access, and cloud software services, for both residential and business markets.
Our Traditional & Other Products category generally includes a mix of prior-generation technologies’ products and services, as well as other products and services that do not fit within the other revenue categories.
Our operating results have fluctuated, and may continue to fluctuate, on a quarterly basis due to a number of factors, including customer order activity and backlog. A substantial portion of our shipments in any fiscal period relates to orders received and shipped within that fiscal period for customers under agreements containing non-binding purchase commitments. Further, a significant percentage of orders require delivery within a few days. These factors normally result in a varying order backlog and limited order flow visibility. Additionally, backlog levels may vary because of seasonal trends, the timing of customer projects and other factors that affect customer order lead times. Because many of our customers require prompt delivery of products, we are required to maintain sufficient inventory levels to satisfy anticipated customer demand. If near-term demand for our products declines, or if potential sales in any quarter do not occur as anticipated, our financial results could be adversely affected. Operating expenses are relatively fixed in the short term; therefore, a shortfall in quarterly revenues could significantly impact our financial results in a given quarter.
36
Our operating results may also fluctuate as a result of a number of other factors, including a decline in general economic and market conditions, specifically the decline that has resulted from the COVID-19 pandemic, foreign currency exchange rate movements, increased competition, customer order patterns, changes in product and services mix, timing differences between price decreases and product cost reductions, product warranty returns, expediting costs, tariffs and announcements of new products by us or our competitors. Additionally, maintaining sufficient inventory levels to assure prompt delivery of our products increases the amount of inventory that may become obsolete and increases the risk that the obsolescence of this inventory may have an adverse effect on our business and operating results. Also, not maintaining sufficient inventory levels to assure prompt delivery of our products may cause us to incur expediting costs to meet customer delivery requirements, which may negatively impact our operating results in a given quarter. During 2019 and continuing into 2020, the Company initiated restructuring plans to realign its expense structure with the reduction in revenue experienced in recent years and with overall Company objectives. Management assessed the efficiency of our operations and consolidated locations and personnel, among other things, and implemented certain cost savings initiatives, where possible. We expect to continue to see a reduction in our operating expenses and cost of sales, both in the U.S. and internationally, as a result of our implementation of these restructuring plans.
Our historical financial performance is not necessarily a meaningful indicator of future results, and, in general, management expects that our financial results may vary from period to period. See Note 21 of Notes to Consolidated Financial Statements, included in Part II, Item 8 of this report, for additional information on quarterly results for 2020 and 2019. For a discussion of risks associated with our operating results, see Part I, Item 1A, Risk Factors of this Annual Report on Form 10-K.
Results of Operations
The following table presents selected financial information derived from our Consolidated Statements of Income (Loss) expressed as a percentage of revenue for the years indicated. Amounts may not foot due to rounding.
|
|
|
Year Ended December 31, |
|
|||||||||
|
|
|
2020 |
|
|
2019 |
|
|
2018 |
|
|||
|
Sales |
|
|
|
|
|
|
|
|
|
|
|
|
|
Network Solutions |
|
|
86.5 |
% |
|
|
85.9 |
% |
|
|
86.6 |
% |
|
Services & Support |
|
|
13.5 |
|
|
|
14.1 |
|
|
|
13.4 |
|
|
Total Sales |
|
|
100.0 |
|
|
|
100.0 |
|
|
|
100.0 |
|
|
Cost of Sales |
|
|
|
|
|
|
|
|
|
|
|
|
|
Network Solutions |
|
|
48.2 |
|
|
|
49.7 |
|
|
|
52.7 |
|
|
Services & Support |
|
|
8.8 |
|
|
|
8.9 |
|
|
|
8.8 |
|
|
Total Cost of Sales |
|
|
57.0 |
|
|
|
58.7 |
|
|
|
61.5 |
|
|
Gross Profit |
|
|
43.0 |
|
|
|
41.3 |
|
|
|
38.5 |
|
|
Selling, general and administrative expenses |
|
|
22.5 |
|
|
|
24.6 |
|
|
|
23.5 |
|
|
Research and development expenses |
|
|
22.4 |
|
|
|
23.8 |
|
|
|
23.5 |
|
|
Asset impairments |
|
|
— |
|
|
|
0.7 |
|
|
|
— |
|
|
Gain on contingency |
|
|
— |
|
|
|
(0.2 |
) |
|
|
— |
|
|
Operating Loss |
|
|
(1.9 |
) |
|
|
(7.5 |
) |
|
|
(8.6 |
) |
|
Interest and dividend income |
|
|
0.4 |
|
|
|
0.5 |
|
|
|
0.8 |
|
|
Interest expense |
|
|
— |
|
|
|
(0.1 |
) |
|
|
(0.1 |
) |
|
Net investment gain (loss) |
|
|
1.0 |
|
|
|
2.2 |
|
|
|
(0.8 |
) |
|
Other income (expense), net |
|
|
(0.6 |
) |
|
|
0.3 |
|
|
|
0.2 |
|
|
Gain on bargain purchase of a business |
|
|
— |
|
|
|
— |
|
|
|
2.1 |
|
|
Loss Before Income Taxes |
|
|
(1.2 |
) |
|
|
(4.7 |
) |
|
|
(6.3 |
) |
|
Income tax (expense) benefit |
|
|
1.7 |
|
|
|
(5.3 |
) |
|
|
2.7 |
|
|
Net Income (Loss) |
|
|
0.5 |
% |
|
|
(10.0 |
)% |
|
|
(3.7 |
)% |
The following discussion and financial information are presented to aid in an understanding of our current consolidated financial position, changes in financial position, results of operations and cash flows and should be read in conjunction with the audited consolidated financial statements and notes thereto included herein. The emphasis of the discussion is a comparison of the years ended December 31, 2020 and December 31, 2019. For a discussion of a comparison of the years ended December 31, 2019 and December 31, 2018, please refer to Management’s Discussion and Analysis of Financial Condition and Results of Operations included in our Annual Report on Form 10-K for the year ended December 31, 2019, filed with the SEC on February 25, 2020.
37
Comparison of Years Ended December 31, 2020 and December 31, 2019
Revenue
Our revenue decreased 4.4% from $530.1 million for the year ended December 31, 2019 to $506.5 million for the year ended December 31, 2020. Our Services & Support revenue decreased $6.3 million compared to 2019 and our Network Solutions revenue decreased $17.2 million versus the prior year. The decrease in our 2020 revenue was primarily attributable to a decrease in Access & Aggregation revenue of $35.7 million and Traditional & Other Products revenue of $6.0 million, partially offset by increases in Subscriber Solutions & Experience revenue of $18.2 million.
Network Solutions revenue decreased by 3.8% from $455.2 million in 2019 to $438.0 million in 2020, due primarily to a decrease in sales of our Access & Aggregation products and Traditional & Other Products, partially offset by increases in Subscriber Solutions & Experience revenue. The decrease in revenue of 9.4% of our Access & Aggregation products for 2020 was primarily attributable to decreased volume in sales of FTTN products. The increase of 11.9% in 2020 for sales of our Subscriber Solutions & Experience products was primarily attributable to an increased volume of network termination and Fiber CPE. While we expect that revenue from Traditional & Other Products will continue to decline over time, this revenue may fluctuate, and continue to fluctuate, for years because of the time required for our customers to transition to newer technologies.
Services & Support revenue decreased by 8.5% from $74.8 million in 2019 to $68.5 million in 2020. The decrease in revenue for 2020 was primarily attributable to decreased sales volume of FTTN products for Access & Aggregation.
Domestic revenue increased 17.0% from $300.9 million in 2019 to $352.1 million in 2020. Our domestic growth was driven by an increase in revenue to the RSP market segment and additional fiber deployments across all customers. In addition, such growth was driven by an increase in sales to Tier-2 and Tier-3 customers with diversified business among our fiber access and CPE, service provider CPE and services.
International revenue, which is included in the amounts for the Network Solutions and Services & Support segments amounts discussed above, decreased 32.6% from $229.2 million for the year ended December 31, 2019 to $154.4 for the year ended December 31, 2020. International revenue, as a percentage of total revenue, decreased from 43.2% for the year ended December 31, 2019 to 30.5% for the year ended December 31, 2020. The decrease in international revenue for 2020 was primarily attributable to the slowdown in shipments to an international Tier-1 customer.
Our international revenue is largely focused on broadband infrastructure and is affected by the decisions of our customers as to timing for installation of new technologies, expansion of their networks and/or network upgrades. Our international customers must make these decisions in the regulatory and political environment in which they operate – both nationally and in some instances, regionally – whether of a multi-country region or a more local region within a country. The competitive landscape in certain international markets is also affected by the increased presence of Asian manufacturers that seek to compete aggressively on price. Our revenue and operating income in some international markets can be negatively impacted by a strengthening U.S. dollar. Consequently, while we expect the global trend towards deployment of more robust broadband speeds and access to continue creating additional market opportunities for us, the factors described above may result in negative pressure on revenue and operating income.
Cost of Sales
As a percentage of revenue, cost of sales decreased from 58.7% for the year ended December 31, 2019 to 57.0% for the year ended December 31, 2020. The decrease was primarily attributable to regional revenue shifts, changes in customer and product mix and a decrease in fixed personnel costs as a result of our restructuring program initiated in 2019.
Network Solutions cost of sales, as a percentage of that segment’s revenue, decreased from 57.9% of revenue in 2019 to 55.8% of revenue in 2020. The decrease in Network Solutions cost of sales as a percentage of that segment’s revenue was primarily attributable to changes in customer and product mix, a regional revenue shift and a decrease in fixed personnel costs as a result of our restructuring program initiated in 2019.
An important part of our strategy is to reduce the cost of each succeeding generation of product and then lower the product’s selling price based on the cost savings achieved in order to gain market share and/or improve gross margins. This may cause variations in our gross profit percentage due to timing differences between the recognition of cost reductions and the lowering of product selling prices.
Services & Support cost of sales, as a percentage of that segment’s revenue, increased from 63.1% of revenue in 2019 to 65.3% of revenue in 2020. The increase in Services & Support cost of sales as a percentage of that segment’s revenue in 2020 was primarily attributable to changes in services and support mix and volume.
38
Services & Support revenue is comprised of network planning and implementation, maintenance, support and cloud-based management services, with network planning and implementation being the largest and fastest growing component in the long-term. Compared to our other services, such as maintenance, support and cloud-based management services, our network planning and implementation services typically utilize a higher percentage of internal and subcontracted engineers, professionals and contractors to perform the work for customers. The additional costs incurred to perform these infrastructure and labor-intensive services inherently result in lower average gross margins as compared to maintenance and support services.
As our network planning and implementation revenue grew to become the largest component of our Services & Support segment business, our Services & Support segment gross margins decreased versus those reported when maintenance and support comprised the majority of the business. Further, because the growth in our network planning and implementation services has resulted in our Services & Support segment revenue comprising a larger percentage of our overall revenue, and because our Services & Support segment gross margins are generally below those of the Network Solutions segment, our overall corporate gross margins may decline as that business continues to grow. Within the Services & Support segment, we do expect variability in gross margins from quarter-to-quarter based on the mix of the services recognized.
Selling, General and Administrative Expenses
Selling, general and administrative expenses as a percentage of revenue decreased from 24.6% for the year ended December 31, 2019 to 22.5% for the year ended December 31, 2020. Selling, general and administrative expenses as a percentage of revenue will generally fluctuate whenever there is a significant fluctuation in revenues for the periods being compared as these costs are relatively fixed in the short term.
Selling, general and administrative expenses decreased by 12.5% from $130.3 million for the year ended December 31, 2019 to $114.0 million for the year ended December 31, 2020. Selling, general and administrative expenses include personnel costs for management, accounting, information technology, human resources, sales and marketing, as well as accounting, tax and other professional fees, contract services and legal and litigation related costs. The decrease in selling, general and administrative expenses was primarily attributable to lower travel related expenses, personnel costs due to our restructuring program initiated in 2019 and the capitalization of certain costs related to our ongoing enterprise resource planning implementation project as well as marketing related costs, such as trade show expenses, offset by increased contract and professional services mainly related to our enterprise resource planning implementation project.
Research and Development Expenses
Research and development expenses as a percentage of revenue decreased from 23.8% for the year ended December 31, 2019 to 22.4% for the year ended December 31, 2020. Research and development expenses as a percentage of revenue will fluctuate whenever there are incremental product development activities or significant fluctuations in revenue for the periods being compared as these costs are relatively fixed in the short term.
Research and development expenses decreased by 10.2% from $126.2 million for the year ended December 31, 2019 to $113.3 million for the year ended December 31, 2020. The decrease in research and development expenses was primarily attributable to lower personnel costs and other expenses, such as operating expenses, which were mainly the result of our restructuring program initiated in 2019 as well as lower travel related costs, partially offset by increased contract services and restructuring related costs.
We expect to continue to incur research and development expenses in connection with our new and existing products and our expansion into international markets. We continually evaluate new product and market opportunities and engage in significant research and development efforts which provide for new product development, enhancement of existing products and product cost reductions. We may incur significant research and development expenses prior to the receipt of revenue from a major new product group.
Asset Impairments
Asset impairments, which were $3.9 million and less than $0.1 million for the years ended December 31, 2019 and 2020, respectively, relate to the abandonment of certain information technology implementation projects in which we had previously capitalized costs. See Note 1 and Note 8 of Notes to Consolidated Financial Statements included in Part II, Item 8 of this report for additional information.
39
Gain on Contingency
Gain on contingency, which was $1.2 million for the year ended December 31, 2019, relates to the reversal of unearned contingent liabilities which were initially recognized upon the acquisition of SmartRG in the fourth quarter of 2018. There was no gain on contingency recognized during the year ended December 31, 2020. See Note 3 of the Notes to Consolidated Financial Statements included in Part II, Item 8 of this report for additional information.
Interest and Dividend Income
Interest and dividend income decreased by 30.0% from $2.8 million for the year ended December 31, 2019 to $1.9 million for the year ended December 31, 2020. The decrease in interest and dividend income was primarily attributable to a decrease in interest income as a result of a decline in our investment balances. Our investment balances decreased due to the maturity of our certificate of deposit which served as collateral for our taxable revenue bonds and the sale of certain equity investments for working capital and other purposes. Our investments decreased from $127.7 million as of December 31, 2019 to $83.3 million as of December 31, 2020.
Interest Expense
Interest expense, which is related to our taxable revenue bonds, decreased by $0.5 million for the year ended December 31, 2020 compared to the year ended December 31, 2019. The decrease was due to the outstanding principal balance of the taxable revenue bonds being paid off upon maturity in January 2020. See “Financing Activities” in “Liquidity and Capital Resources” below for additional information on our taxable revenue bond.
Net Investment Gain
We recognized a net investment gain of $11.4 million and $4.9 million for the years ended December 31, 2019 and 2020, respectively. The decrease in our net investment gain was primarily attributable to changes in fair value of equity securities recognized during the period and impairment charges related to an equity investment. During the year ended December 31, 2020, our investments were impacted by varying market conditions, including the COVID-19 pandemic, which resulted in a sharp downturn in the markets during the first quarter of 2020 followed by market improvements and more positive results from a favorable portfolio mix during the remainder of 2020. We expect that any future equity market volatility, whether from COVID-19 or other factors, will result in continued volatility in our investment portfolios. See “Investing Activities” in “Liquidity and Capital Resources” and Note 1 and Note 6 of Notes to Consolidated Financial Statements included in Part II, Item 8 of this report for additional information.
Other Income (Expense), net
Other income (expense), net, decreased from income of $1.5 million for the year ended December 31, 2019 to expense of $3.3 million for the year ended December 31, 2020. For the year ended December 31, 2020, other income (expense), net, is comprised primarily of gains and losses on foreign currency transactions. For the year ended December 31, 2019, other income (expense), net, consisted mainly of the receipt of a one-time insurance proceeds from a life insurance policy.
Income Tax (Expense) Benefit
Our effective tax rate decreased from an expense of 113.8%, for the year ended December 31, 2019 to a benefit of 138.1% for the year ended December 31, 2020. The change in the effective tax rate between the two periods was primarily driven by the establishment of a valuation allowance against our domestic deferred tax assets in the amount of $42.8 million during the year ended December 31, 2019, and tax benefits generated from loss carrybacks as a result of the passage of the Coronavirus Aid, Relief, and Economic Security Act (the “CARES Act”) partially offset by tax expense in foreign jurisdictions during the year ended December 31, 2020. See Note 14 of the Notes to Consolidated Financial Statements included in Part II, Item 8 of this report for additional information.
Net Income (Loss)
As a result of the above factors, our net income increased from a net loss of $53.0 million for the year ended December 31, 2019 to net income of $2.4 million for the year ended December 31, 2020. As a percentage of revenue, net loss was 10.0% for the year ended December 31, 2019. As a percentage of revenue, net income was 0.5% for the year ended December 31, 2020.
40
Liquidity and Capital Resources
Liquidity
We have historically financed, and currently expect to continue to finance, our ongoing business with existing cash, investments and cash flow from operations. We have used, and expect to continue to use, existing cash, investments and cash generated from operations for working capital, business acquisitions, purchases of treasury stock, shareholder dividends and other general corporate purposes, including product development activities to enhance our existing products and develop new products, expand our sales and marketing activities and fund capital expenditures. We believe that our cash and cash equivalents, investments and cash generated from operations will be adequate to meet our operating and capital needs for at least the next 12 months.
As of December 31, 2020, cash on hand was $60.2 million and short-term investments were $3.1 million, which resulted in available short-term liquidity of $63.3 million, of which $49.7 million was held by our foreign subsidiaries. As of December 31, 2019, cash on hand was $73.8 million and short-term investments were $33.2 million, which resulted in available short-term liquidity of $107.0 million, of which $52.3 million was held by our foreign subsidiaries. The decrease in short-term liquidity from December 31, 2019 to December 31, 2020 was primarily attributable to the maturity of a certificate of deposit of $25.6 million that served as collateral for our revenue bond, which matured in January 2020, and the sale of certain equity investments for working capital and other purposes.
On November 4, 2020, the Company entered into a Revolving Credit and Security Agreement and related Promissory Note (together, the “Revolving Credit Agreement”) with Cadence Bank, N.A., as lender (the “Lender”). The Revolving Credit Agreement provides the Company with a new $10.0 million secured revolving credit facility. Loans under the Revolving Credit Agreement will bear interest at a rate equal to 1.50% over the screen rate as obtained by Reuter’s, Bloomberg or another commercially available source as may be designated by the Lender from time to time; provided, however, that in no event shall the applicable rate of interest under the Revolving Credit Agreement be less than 1.50% per annum. Such loans are secured by all of the cash, securities, securities entitlements and investment property in a certain bank account, as outlined in the Revolving Credit Agreement, at a maximum loan-to-value ratio of 75% determined by dividing the full commitment amount under the Revolving Credit Agreement on the date of testing, determined by the Lender each fiscal quarter, by the market value of the collateral. The Revolving Credit Agreement matures on November 4, 2021, subject to earlier termination upon the occurrence of certain events of default. The Company entered into the Revolving Credit Agreement in order to increase the flexibility and management of its short-term liquidity. To date, the Company has not made any draws under the Revolving Credit Agreement. The Company agreed to certain negative covenants that are customary for credit arrangements of this type, including, among other things, restrictions on the Company’s ability to enter into mergers, acquisitions or other business combination transactions, grant liens or suffer a material adverse change in the condition or affairs (financial or otherwise) of the Company, which negative covenants are subject to certain exceptions. The Company must be in compliance with all covenants to be able to draw on the line of credit. As of December 31, 2020, the Company was in compliance with all covenants.
Operating Activities
Our working capital, which consists of current assets less current liabilities, increased 7.5% from $207.6 million as of December 31, 2019 to $223.2 million as of December 31, 2020. The current ratio, defined as current assets divided by current liabilities, increased from 2.84 as of December 31, 2019 to 3.37 as of December 31, 2020. The increase in our working capital and current ratio was primarily attributable to an increase in inventory, accounts receivable and other receivables, partially offset by a decrease in cash and short-term investments, which consisted of a certificate of deposit related to our taxable revenue bond as of December 31, 2019 and the related bonds payable. The quick ratio, defined as cash and cash equivalents, short-term investments, and net accounts receivable, divided by current liabilities, decreased from 1.75 as of December 31, 2019 to 1.72 as of December 31, 2020. The decrease in the quick ratio was primarily attributable to the decrease in cash and cash equivalents as well as a decrease in short-term investments, offset by a decrease in current liabilities due to the repayment of our revenue bond payable.
Net accounts receivable increased 9.2% from $90.5 million as of December 31, 2019 to $98.8 million as of December 31, 2020. Our allowance for doubtful accounts was less than $0.1 million as of December 31, 2020 and 2019. Quarterly accounts receivable DSO decreased from 72 days as of December 31, 2019 to 70 days as of December 31, 2020. The decrease in DSO was due to the timing of product shipments and customer mix.
Other receivables increased 30.0% from $16.6 million as of December 31, 2019 to $21.5 million as of December 31, 2020. The increase in other receivables was primarily attributable to increases in income tax receivables related to the CARES Act partially offset by a decrease in contract assets and purchasing shipments.
41
Annual inventory turnover decreased from 3.14 turns as of December 31, 2019 to 2.58 turns as of December 31, 2020. Inventory increased 27.6% from $98.3 million as of December 31, 2019 to $125.5 million as of December 31, 2020. The increase in inventory was due to increased purchases in preparation for new product ramp ups as well as strategic inventory buffer purchases to ensure supply continuity during the COVID-19 pandemic. We expect inventory levels to fluctuate as we attempt to maintain sufficient inventory in response to COVID-19 uncertainties related to supply chain and supply, seasonal cycles of our business and ensuring competitive lead times while managing the risk of inventory.
Accounts payable increased 11.3% from $44.9 million as of December 31, 2019 to $49.9 million as of December 31, 2020. Accounts payable will fluctuate due to variations in the timing of the receipt of supplies, inventory and services and our subsequent payments for these purchases.
Investing Activities
Capital expenditures totaled approximately $6.4 million, $9.5 million and $8.1 million for the years ended December 31, 2020, 2019 and 2018, respectively. These expenditures were primarily used to purchase manufacturing and test equipment, software, computer hardware and building improvements.
Our combined short-term and long-term investments decreased $44.5 million from $127.7 million as of December 31, 2019 to $83.3 million as of December 31, 2020. This decrease reflects the maturity of a certificate of deposit which served as collateral for our revenue bond and the sale of certain equity investments for working capital and other purposes.
We typically invest all available cash not required for immediate use in operations, primarily in securities that we believe bear minimal risk of loss. See Note 6 of Notes to Consolidated Financial Statements included in Part II, Item 8 of this report for additional information. As of December 31, 2020, our corporate bonds, municipal fixed-rate bonds, asset-backed bonds, mortgage/agency-backed bonds, U.S. government bonds, and foreign government bonds were classified as available-for-sale and had a combined duration of 1.74 years with an average Standard & Poor’s credit rating of AA-. Because our investment portfolio has a high-quality rating and contractual maturities of short duration, we are able to obtain prices for these bonds derived from observable market inputs, or for similar securities traded in an active market, on a daily basis.
Our long-term investments decreased 15.2% from $94.5 million as of December 31, 2019 to $80.1 million as of December 31, 2020. Our investments include various marketable equity securities classified as long-term investments with a fair market value of $11.0 million and $35.8 million, as of December 31, 2020 and December 31, 2019, respectively. Long-term investments as of December 31, 2020 and 2019 also included $23.9 million and $21.7 million, respectively, related to our deferred compensation plan, and $0.2 million and $0.3 million, respectively, of other investments, consisting of interests in a private equity fund.
Financing Activities
In conjunction with the 1995 expansion of our Huntsville, Alabama, facility, we were approved for participation in an incentive program offered by the State of Alabama Industrial Development Authority (“the Authority”). Pursuant to the program, in January 1995, the Authority issued $20.0 million of its taxable revenue bonds (the “Taxable Revenue Bonds”) and loaned the proceeds from the sale of the Taxable Revenue Bonds to ADTRAN. Further advances on the Taxable Revenue Bonds were made by the Authority, bringing the total amount outstanding to $50.0 million. The bonds matured on January 1, 2020, and the current outstanding balance of $24.6 million was repaid in full on January 2, 2020. We were required to make payments to the Authority in amounts necessary to pay the interest on the Taxable Revenue Bonds which totaled $1.0 million and $1.1 million for the years ended December 31, 2019 and 2018, respectively. The Company had no outstanding debt as of December 31, 2020. See Note 13 of Notes to Consolidated Financial Statements included in Part II, Item 8 of this report for additional information.
Dividends
During 2020, 2019 and 2018, we paid shareholder dividends totaling $17.3 million, $17.2 million and $17.3 million, respectively. The Board of Directors presently anticipates that it will declare a regular quarterly dividend so long as the present tax treatment of dividends exists and adequate levels of liquidity are maintained. The following table shows dividends per common share paid to our shareholders in each quarter of 2020, 2019 and 2018:
|
Dividends per Common Share |
|
|||||||||||
|
|
|
2020 |
|
|
2019 |
|
|
2018 |
|
|||
|
First Quarter |
|
$ |
0.09 |
|
|
$ |
0.09 |
|
|
$ |
0.09 |
|
|
Second Quarter |
|
$ |
0.09 |
|
|
$ |
0.09 |
|
|
$ |
0.09 |
|
|
Third Quarter |
|
$ |
0.09 |
|
|
$ |
0.09 |
|
|
$ |
0.09 |
|
|
Fourth Quarter |
|
$ |
0.09 |
|
|
$ |
0.09 |
|
|
$ |
0.09 |
|
42
Stock Repurchase Program
Since 1997, our Board of Directors has approved multiple share repurchase programs that have authorized open market repurchase transactions of our common stock, which are implemented through open market or private purchases from time to time as conditions warrant. There were no stock repurchases during the year ended December 31, 2020. For the years ended December 31, 2019 and 2018, we repurchased less than 0.1 million shares and 1.0 million shares, respectively, for $0.2 million and $15.5 million, respectively, at an average price of $14.06 and $15.52 per share, respectively. We currently have authorization to repurchase an additional 2.5 million shares of our common stock under the current authorization of up to 5.0 million shares.
Stock Option Exercises
To accommodate employee stock option exercises, we issued less than 0.1 million shares of treasury stock for $0.5 million during the year ended December 31, 2019 and 0.1 million shares of treasury stock for $1.5 million during the year ended December 31, 2018. There were no stock option exercises during the year ended December 31, 2020.
Employee Pension Plan
We maintain a defined benefit pension plan covering employees in certain foreign countries. Pension benefit plan obligations are based on various assumptions used by our actuaries in calculating these amounts. These assumptions include discount rates, compensation rate increases, expected return on plan assets, retirement rates and mortality rates. Actual results that differ from the assumptions and changes in assumptions could affect future expenses and obligations.
Our defined benefit plan assets consist of a balanced portfolio of equity funds, bond funds, real estate funds and managed futures. Our investment policy includes various guidelines and procedures designed to ensure assets are invested in a manner necessary to meet expected future benefits earned by participants and consider a broad range of economic conditions. Central to the policy are target allocation ranges by asset class, which is currently 50% for bond funds, 40% for equity funds and 10% cash, real estate and managed futures. The objectives of the target allocations are to maintain investment portfolios that diversify risk through prudent asset allocation parameters, achieve asset returns that meet or exceed the plans’ actuarial assumptions and achieve asset returns that are competitive with like institutions employing similar investment strategies. The investment policy is periodically reviewed by us and a designated third-party fiduciary for investment matters. The policy is established and administered in a manner that is compliant at all times with applicable government regulations. At December 31, 2020, the estimated fair market value of our defined benefit pension plans assets increased to $32.3 million from $28.0 million at December 31, 2019.
The defined benefit pension plan is accounted for on an actuarial basis, which requires the use of various assumptions, including an expected rate of return on plan assets and a discount rate. The expected return on our German plan assets that is utilized in determining the benefit obligation and net periodic benefit cost is derived from periodic studies, which include a review of asset allocation strategies, anticipated future long-term performance of individual asset classes, risks using standard deviations and correlations of returns among the asset classes that comprise the plans' asset mix. While the studies give appropriate consideration to recent plan performance and historical returns, the assumptions are primarily long-term, prospective rates of return. The discount rate has been derived from the returns of high-quality, corporate bonds denominated in Euro currency with durations close to the duration of our pension obligations. The projected benefit obligation for our defined benefit pension plans was $50.9 million and $43.9 million as of December 31, 2020 and 2019, respectively.
The components of net periodic pension cost, other than the service cost component, are included in other income (expense), net in the Consolidated Statements of Income (Loss). The components of net periodic pension cost and amounts recognized in other comprehensive income (loss) for the years ended December 31, 2020, 2019 and 2018 were $1.6 million, $3.2 million and $6.1 million, respectively.
Actuarial gains and losses are recorded in accumulated other comprehensive income (loss). To the extent unamortized gains and losses exceed 10% of the higher of the market-related value of assets or the projected benefit obligation, the excess is amortized as a component of net periodic pension cost over the remaining service period of active participants. We estimate that $0.9 million will be amortized from accumulated other comprehensive income (loss) into net periodic pension cost in 2021 for the net actuarial loss. The net actuarial loss recognized in accumulated other comprehensive income (loss) as of December 31, 2020 and 2019 was $13.5 million and $13.0 million, respectively.
See Note 15 of Notes to Consolidated Financial Statements included in Part II, Item 8 of this report for additional information.
Off-Balance Sheet Arrangements and Contractual Obligations
We do not have off-balance sheet financing arrangements and have not engaged in any related party transactions or arrangements with unconsolidated entities or other persons that are reasonably likely to materially affect our financial condition, revenue or expenses, results of operations, liquidity, capital expenditures, or the availability of, or requirements for, capital resources.
43
Contractual Obligations
We have various contractual obligations and commercial commitments. The following table sets forth the annual payments we are required to make under contractual cash obligations and other commercial commitments as of December 31, 2020:
|
(In thousands) |
|
Total |
|
|
2021 |
|
|
2022 |
|
|
2023 |
|
|
2024 |
|
|
2025 |
|
|
After 2025 |
|
|||||||
|
Pledged collateral(1) |
|
$ |
6,000 |
|
|
$ |
6,000 |
|
|
$ |
— |
|
|
$ |
— |
|
|
$ |
— |
|
|
$ |
— |
|
|
$ |
— |
|
|
Purchase obligations(2) |
|
|
143,944 |
|
|
|
136,924 |
|
|
|
2,839 |
|
|
|
2,123 |
|
|
|
2,056 |
|
|
|
2 |
|
|
|
— |
|
|
Operating lease obligations(3) |
|
|
5,554 |
|
|
|
1,895 |
|
|
|
1,600 |
|
|
|
1,251 |
|
|
|
521 |
|
|
|
287 |
|
|
|
— |
|
|
Totals |
|
$ |
155,498 |
|
|
$ |
144,819 |
|
|
$ |
4,439 |
|
|
$ |
3,374 |
|
|
$ |
2,577 |
|
|
$ |
289 |
|
|
$ |
— |
|
(1) We are required to maintain a pledged collateral amount related to a letter of credit agreement entered into with a bank to guarantee performance obligations under a contract with a certain customer. The obligations under this customer contract will be performed over multiple years. As of December 31, 2020, the Company was required to maintain a minimum collateral value of $9.0 million. The letter of credit was secured by a pledge of a portion of the Company’s fixed-income securities, which totaled $11.2 million as of December 31, 2020. The Company increased its pledged collateral to the maximum value of our minimum collateral requirement of $15.0 million in February 2021 as the Company reached certain milestones as outlined in the customer contract. Any shortfalls in the minimum collateral value are required to be restored by the Company from available cash and cash equivalents, short-term investments and/or long-term investments. The collateral under the letter of credit will be released when all obligations under the customer contract have been met.
(2) Primarily relates to open purchase orders to our contract manufacturers, component suppliers, service partners and other vendors, including those assisting with the implementation of our new ERP system.
(3) Primarily relates to future minimum rental payments under non-cancelable operating leases, including renewals determined to be reasonably assured, with original maturities of greater than 12 months.
We have committed to invest up to an aggregate of $5.0 million in a private equity fund, of which $4.9 million has been applied to these commitments. The additional $0.1 million commitment has been excluded from the table above due to the uncertainty of when it will be applied.
Certain contracts, customers and/or jurisdictions in which we do business require us to provide various guarantees of performance such as bid bonds, performance bonds and customs bonds. As of December 31, 2020, we had commitments related to these bonds totaling $15.2 million, which expire at various dates through August 2024. Although the triggering events vary from contract to contract, in general we would only be liable for the amount of these guarantees in the event of default in our performance under each contract, the probability of which we believe is remote.
We also have obligations related to uncertain income tax positions that have been excluded from the table above due to the uncertainty of when the related expense will be recognized. See Note 14 of Notes to Consolidated Financial Statements included in Part II, Item 8 of this report for additional information.
On November 4, 2020, the Company, as borrower, entered into a Revolving Credit and Security Agreement and related Promissory Note (together, the “Revolving Credit Agreement”) with Cadence Bank, N.A., as lender (the “Lender”). See Liquidity and Capital Resources – Liquidity for further information.
44
Critical Accounting Policies and Estimates
An accounting policy is deemed to be critical if it requires an accounting estimate to be made based on assumptions about matters that are highly uncertain at the time the estimate is made, if different estimates reasonably could have been used or if changes in the accounting estimate that are reasonably likely to occur could materially impact the results of financial operations. Several accounting policies, as described in Note 1 of Notes to the Consolidated Financial Statements included in Part II, Item 8 of this report, require material subjective or complex judgment and have a significant impact on our financial condition and results of operations, as applicable. We believe the following critical accounting policies affect our more significant judgments and estimates used in the preparation of our Consolidated Financial Statements:
Revenue
Revenue is measured based on the consideration expected to be received in exchange for transferring goods or providing services to a customer and as performance obligations under the terms of the contract are satisfied. Generally, this occurs with the transfer of control of a product to the customer. Review of contracts with customers, for both direct customers and distributors, are performed and assessed for principal versus agent considerations to determine primary responsibility for delivery of performance obligation, presumed inventory risk, and discretion in establishing pricing, when applicable. For transactions where there are multiple performance obligations, individual products and services are accounted for separately if they are distinct (if a product or service is separately identifiable from other items and if a customer can benefit from it on its own or with other resources that are readily available to the customer). The consideration, including any discounts, is allocated between separate products and services based on their stand-alone selling prices. Stand-alone selling prices are determined based on the prices at which the separate products and services are sold and are allocated based on each item’s relative value to the total value of the products and services in the arrangement. For items that are not sold separately, we estimate stand-alone selling prices primarily using the “expected cost plus a margin” approach. Payment terms are generally 30 days in the U.S. and typically longer in many geographic markets outside the U.S. Shipping fees are recorded as revenue and the related cost is included in cost of sales. Sales, value-added and other taxes collected concurrently with revenue-producing activities are excluded from revenue. Costs of obtaining a contract, if material, are capitalized and amortized over the period that the related revenue is recognized if greater than one year. We have elected to account for shipping fees as a cost of fulfilling the related contract. We have also elected to apply the practical expedient related to the incremental costs of obtaining contracts and recognize those costs as an expense when incurred if the amortization period of the assets is one year or less. These costs are included in selling, general and administrative expenses. Capitalized costs with an amortization period greater than one year were immaterial.
Revenue is generated by two reportable segments: Network Solutions and Services & Support.
Network Solutions Segment - Includes hardware products and software defined next-generation virtualized solutions used in service provider or business networks, as well as prior generation products. The majority of the revenue from this segment is from hardware sales.
Hardware and Software Revenue
Revenue from hardware sales is recognized when control is transferred to the customer, which is generally when the products are shipped. Shipping terms are generally FOB shipping point. Revenues from software license sales are recognized at delivery and transfer of control to the customer. Revenue is recorded net of estimated discounts and rebates using historical trends. Customers are typically invoiced when control is transferred and revenue is recognized. Our products generally include assurance-based warranties of 90 days to five years for product defects.
In certain transactions, we are also the lessor in sales-type lease arrangements for network equipment that have terms of 18 months to five years. These arrangements typically include network equipment, network implementation services and maintenance services.
Services & Support Segment – A complete portfolio of maintenance, network implementation and solutions integration and managed services, which include hosted cloud services and subscription services to complement our Network Solutions segment.
Maintenance Revenue
Our maintenance service periods range from one month to five years. Customers are typically invoiced and pay for maintenance services at the beginning of the maintenance period. We recognize revenue for maintenance services on a straight-line basis over the maintenance period as our customers benefit evenly throughout the contract term and deferred revenues, when applicable, are recorded in unearned revenue and non-current unearned revenue.
Network Implementation Revenue
45
We recognize revenue for network implementation, which primarily consists of engineering, execution and enablement services at a point in time when each performance obligation is complete. If we have recognized revenue but have not billed the customer, the right to consideration is recognized as a contract asset that is included in other receivables on the Consolidated Balance Sheet. The contract asset is transferred to accounts receivable when the completed performance obligation is invoiced to the customer.
Inventory
We carry our inventory at the lower of cost and net realizable value, with cost being determined using the first-in, first-out method. Standard costs for material, labor, and manufacturing overhead are used to value inventory and are updated at least quarterly. Most variances are expensed in the current period; therefore, our inventory costs approximate actual costs at the end of each reporting period. We establish reserves for estimated excess and obsolete inventory equal to the difference between the cost of the inventory and the estimated net realizable value of the inventory based on estimated reserve percentages, which consider historical usage, known trends, inventory age and marketing conditions. If actual trends and market conditions are less favorable than those projected by management, we may be required to make additional inventory write-downs. Our reserve for excess and obsolete inventory was $39.6 million and $34.1 million at December 31, 2020 and 2019, respectively. Inventory disposals charged against the reserve were $6.0 million and $1.8 million for the years ended December 31, 2020 and 2019, respectively.
Stock-Based Compensation
For purposes of determining the estimated fair value of market-based performance stock unit (PSU) awards on the date of grant, the Monte Carlo Simulation valuation method is used. These PSUs are subject to a market condition based on the relative total shareholder return of ADTRAN against all of the companies in the NASDAQ Telecommunications Index and vest at the end of a three-year performance period. The fair value of performance-based PSUs, restricted stock units (RSUs) and restricted stock is equal to the closing price of our stock on the business day immediately preceding the grant date. Compensation expense related to unvested performance-based PSUs is recognized over the requisite service period of three years as the achievement of the performance obligation becomes probable. For purposes of determining the estimated fair value of our stock option awards on the date of grant, we use the Black-Scholes Model. This model requires the input of certain assumptions that require subjective judgment. These assumptions include, but are not limited to, expected stock price volatility over the term of the awards and actual and projected employee stock option exercise behaviors. Because our stock option awards have characteristics significantly different from those of traded options, and because changes in the input assumptions can materially affect the fair value estimate, the existing model may not provide a reliable, single measure of the fair value of our stock option awards. Management will continue to assess the assumptions and methodologies used to calculate the estimated fair value of stock-based compensation. Circumstances may change and additional data may become available over time, which could result in changes to these assumptions and methodologies and thereby materially impact our fair value determination. If factors change in future periods, the compensation expense that we record may differ significantly from what we have recorded in the current period.
Goodwill
Goodwill represents the excess purchase price over the fair value of net assets acquired. We evaluate the carrying value of goodwill during the fourth quarter of each year and between annual evaluations if events occur or circumstances change that would more likely than not reduce the fair value of the reporting unit below its carrying amount. We have elected to by-pass a qualitative assessment to determine whether it is more likely than not that the fair value of the reporting unit to which the goodwill is assigned is less than its carrying amount and, in turn, performed a step-1 analysis of goodwill. No impairment charges on goodwill were recognized during the years ended December 31, 2020, 2019 and 2018.
46
Income Taxes
We estimate our income tax provision or benefit in each of the jurisdictions in which we operate, including estimating exposures related to examinations by taxing authorities. We also make judgments regarding the realization of deferred tax assets and establish valuation allowances where we believe it is more likely than not that future taxable income in certain jurisdictions will be insufficient to realize these deferred tax assets. Our estimates regarding future taxable income and income tax provision or benefit may vary due to changes in market conditions, changes in tax laws, or other factors. If our assumptions, and consequently our estimates, change in the future, the valuation allowances we have established may be increased or decreased, impacting future income tax expense. We continually review the adequacy of our valuation allowance and recognize the benefits of deferred tax assets only as the reassessment indicates that it is more likely than not that the deferred tax assets will be realized in accordance with ASC 740, Income Taxes. Due to a decrease in revenue and profitability for 2019, and all other positive and negative objective evidence considered as part of our analysis, our ability to consider other subjective evidence such as projections for future growth is limited when evaluating whether our deferred tax assets will be realized. As such, the Company is no longer able to conclude that it is more likely than not that our domestic deferred tax assets will be realized and a valuation allowance against our domestic deferred tax assets was established in the third quarter of 2019. The amount of the deferred tax assets considered realizable, however, could be adjusted in future periods in the event sufficient evidence is present to support a conclusion that it is more likely than not that all or a portion of our domestic deferred tax assets will be realized.
We establish reserves to remove some or all of the tax benefit of any of our tax positions at the time we determine that the positions become uncertain. We adjust these reserves, including any impact on the related interest and penalties, as facts and circumstances change.
Liability for Warranty
Our products generally include warranties of 90 days to five years for product defects. We accrue for warranty returns at the time of product shipment based on our historical return rate and an estimate of the cost to repair or replace the defective products. We engage in extensive product quality programs and processes, including actively monitoring and evaluating the quality of our component suppliers. Our products continue to become more complex in both size and functionality as many of our product offerings migrate from line card applications to total systems. The increasing complexity of our products will cause warranty incidences, when they arise, to be more costly. Our estimates regarding future warranty obligations may change due to product failure rates, material usage, and other rework costs incurred in correcting a product failure. In addition, from time to time, specific warranty accruals may be recorded if unforeseen problems arise. Should our actual experience relative to these factors be worse than our estimates, we will be required to record additional warranty expense. The liability for warranty obligations totaled $7.1 million and $8.4 million at December 31, 2020 and 2019, respectively. These liabilities are included in accrued expenses and other liabilities in the accompanying Consolidated Balance Sheets.
Pension Benefit Plan Obligations
Pension benefit plan obligations are based on various assumptions used by our actuaries in calculating these amounts. These assumptions include discount rates, compensation rate increases, expected return on plan assets, retirement rates and mortality rates. Actual results that differ from the assumptions and changes in assumptions could affect future expenses and obligations. Our net pension liability totaled $18.7 million and $15.9 million at December 31, 2020 and 2019, respectively. This liability is included in pension liability in the accompanying Consolidated Balance Sheets.
Recently Issued Accounting Pronouncements
For a discussion of recently issued accounting pronouncements, see Note 1 of Notes to Consolidated Financial Statements included in Part II, Item 8 of this report for additional information.
47
Subsequent Events
On February 3, 2021, the Company announced that its Board of Directors declared a quarterly cash dividend of $0.09 per common share to be paid to the Company’s stockholders of record at the close of business on February 18, 2021. The dividends will be paid on March 4, 2021 in the aggregate amount of approximately $4.4 million.
As part of our required pledged collateral related to a letter for credit agreement entered into with a bank to guarantee performance obligations under a contract with a certain customer, the Company increased its pledged collateral to $15.0 million as of February 2021. We do not anticipate any additional increases in the collateral value at this time as we have reached the maximum amount of the letter of credit required under our contract with the customer. The collateral under the letter of credit will be released when all obligations under the customer contract have been met.
48
|
ITEM 7A. |
QUANTITATIVE AND QUALITATIVE DISCLOSURES ABOUT MARKET RISK |
We are exposed to financial market risks, including changes in foreign currency rates and prices of marketable equity and fixed-income securities. In addition, the ongoing COVID-19 pandemic has caused an economic downturn and volatility in financial markets. The primary objective of the large majority of our investment activities is to preserve principal while at the same time achieving appropriate yields without significantly increasing risk. To achieve this objective, a majority of our marketable securities are investment grade, fixed-rate bonds and municipal money market instruments denominated in U.S. dollars. Our investment policy provides limitations for issuer concentration, which limits, at the time of purchase, the concentration in any one issuer to 5% of the market value of our total investment portfolio.
We maintain depository investments with certain financial institutions. As of December 31, 2020, $56.3 million of our cash and cash equivalents, primarily certain domestic money market funds and foreign depository accounts, were in excess of government provided insured depository limits. Although these depository investments exceed government insured depository limits, we have evaluated the credit-worthiness of these financial institutions and determined the risk of material financial loss due to exposure of such credit risk to be minimal.
As of December 31, 2020, approximately $46.0 million of our cash and investments may be directly affected by changes in interest rates. As of December 31, 2020, we held $4.4 million of cash and variable-rate investments where a change in interest rates would impact our interest income. A hypothetical 50 basis point decline in interest rates as of December 31, 2020, assuming all other variables remain constant, would reduce annualized interest income on our cash and investments by less than $0.1 million. In addition, we held $41.6 million of fixed-rate bonds whose fair values may be directly affected by a change in interest rates. A hypothetical 50 basis point increase in interest rates as of December 31, 2020, assuming all other variables remain constant, would reduce the fair value of our fixed-rate bonds by approximately $0.4 million.
We are exposed to changes in foreign currency exchange rates to the extent that such changes affect our revenue and gross margin on revenue derived from some international customers, expenses, and assets and liabilities held in non-functional currencies related to our foreign subsidiaries. Our primary exposures to foreign currency exchange rate movements are with our German subsidiary, whose functional currency is the Euro, and our Australian subsidiary, whose functional currency is the Australian dollar. Our revenue is primarily denominated in the respective functional currency of the subsidiary and paid in that subsidiary’s functional currency or certain other local currency. Our global supply chain predominately invoices us in the respective functional currency of the subsidiary and is paid in U.S. dollars, and some of our operating expenses are invoiced and paid in certain local currencies (approximately 13% of total operating expense for the year ended December 31, 2020, respectively). Therefore, our revenues, gross margins, operating expenses and operating income are all subject to foreign currency fluctuations. As a result, changes in currency exchange rates could cause variations in our operating income.
We have certain customers and suppliers who are invoiced or pay in a non-functional currency. Changes in the monetary exchange rates used to invoice such customers versus the functional currency of the entity billing such customers may adversely affect our results of operations and financial condition. To manage the volatility relating to these typical business exposures, we may enter into various derivative transactions, when appropriate. We do not hold or issue derivative instruments for trading or other speculative purposes. All non-functional currencies billed would result in a combined hypothetical gain or loss of $2.3 million if the U.S. dollar weakened or strengthened 10% against the billing currencies. This change represents an increase in the amount of hypothetical gain or loss compared to prior periods and is mainly due to an increase in U.S. dollar denominated billings in a non-U.S. dollar denominated subsidiary. Although we do not currently hold any derivative instruments, any gain or loss would be partially mitigated by any derivative instruments held.
As of December 31, 2020, we had certain material contracts subject to currency revaluation, including accounts receivable, accounts payable and lease liabilities denominated in foreign currencies. As of December 31, 2020, we did not have any forward contracts outstanding.
For further information about the fair value of our investments as of December 31, 2020, see Note 6 of Notes to Consolidated Financial Statements included in Part II, Item 8 of this report.
49
|
ITEM 8. |
FINANCIAL STATEMENTS AND SUPPLEMENTARY DATA |
The following consolidated financial statements are contained in this report.
|
|
|
|
|
Page |
|
|
|
|
|
|
|
|
51 |
|||
|
|
|
|
|
|
|
|
53 |
|||
|
|
|
|
53 |
|
|
|
|
|
|
|
|
|
|
|
54 |
|
|
|
|
|
|
|
|
|
|
|
55 |
|
|
|
|
|
|
|
|
|
|
|
56 |
|
|
|
|
|
|
|
|
|
|
|
57 |
|
|
|
|
|
|
|
|
|
108 |
|||
50
Report of Independent Registered Public Accounting Firm
To the Board of Directors and Stockholders of ADTRAN, Inc.
Opinions on the Financial Statements and Internal Control over Financial Reporting
We have audited the accompanying consolidated balance sheets of ADTRAN, Inc. and its subsidiaries (the “Company”) as of December 31, 2020 and 2019, and the related consolidated statements of income (loss), of comprehensive income (loss), of changes in stockholders’ equity and of cash flows for each of the three years in the period ended December 31, 2020, including the related notes and financial statement schedule listed in the accompanying index (collectively referred to as the “consolidated financial statements”). We also have audited the Company's internal control over financial reporting as of December 31, 2020, based on criteria established in Internal Control - Integrated Framework (2013) issued by the Committee of Sponsoring Organizations of the Treadway Commission (COSO).
In our opinion, the consolidated financial statements referred to above present fairly, in all material respects, the financial position of the Company as of December 31, 2020 and 2019, and the results of its operations and its cash flows for each of the three years in the period ended December 31, 2020 in conformity with accounting principles generally accepted in the United States of America. Also in our opinion, the Company maintained, in all material respects, effective internal control over financial reporting as of December 31, 2020, based on criteria established in Internal Control - Integrated Framework (2013) issued by the COSO.
Basis for Opinions
The Company's management is responsible for these consolidated financial statements, for maintaining effective internal control over financial reporting, and for its assessment of the effectiveness of internal control over financial reporting, included in Management’s Report on Internal Control over Financial Reporting appearing under Item 9A. Our responsibility is to express opinions on the Company’s consolidated financial statements and on the Company's internal control over financial reporting based on our audits. We are a public accounting firm registered with the Public Company Accounting Oversight Board (United States) (PCAOB) and are required to be independent with respect to the Company in accordance with the U.S. federal securities laws and the applicable rules and regulations of the Securities and Exchange Commission and the PCAOB.
We conducted our audits in accordance with the standards of the PCAOB. Those standards require that we plan and perform the audits to obtain reasonable assurance about whether the consolidated financial statements are free of material misstatement, whether due to error or fraud, and whether effective internal control over financial reporting was maintained in all material respects.
Our audits of the consolidated financial statements included performing procedures to assess the risks of material misstatement of the consolidated financial statements, whether due to error or fraud, and performing procedures that respond to those risks. Such procedures included examining, on a test basis, evidence regarding the amounts and disclosures in the consolidated financial statements. Our audits also included evaluating the accounting principles used and significant estimates made by management, as well as evaluating the overall presentation of the consolidated financial statements. Our audit of internal control over financial reporting included obtaining an understanding of internal control over financial reporting, assessing the risk that a material weakness exists, and testing and evaluating the design and operating effectiveness of internal control based on the assessed risk. Our audits also included performing such other procedures as we considered necessary in the circumstances. We believe that our audits provide a reasonable basis for our opinions.
Definition and Limitations of Internal Control over Financial Reporting
A company’s internal control over financial reporting is a process designed to provide reasonable assurance regarding the reliability of financial reporting and the preparation of financial statements for external purposes in accordance with generally accepted accounting principles. A company’s internal control over financial reporting includes those policies and procedures that (i) pertain to the maintenance of records that, in reasonable detail, accurately and fairly reflect the transactions and dispositions of the assets of the company; (ii) provide reasonable assurance that transactions are recorded as necessary to permit preparation of financial statements in accordance with generally accepted accounting principles, and that receipts and expenditures of the company are being made only in accordance with authorizations of management and directors of the company; and (iii) provide reasonable assurance regarding prevention or timely detection of unauthorized acquisition, use, or disposition of the company’s assets that could have a material effect on the financial statements.
51
Because of its inherent limitations, internal control over financial reporting may not prevent or detect misstatements. Also, projections of any evaluation of effectiveness to future periods are subject to the risk that controls may become inadequate because of changes in conditions, or that the degree of compliance with the policies or procedures may deteriorate.
Critical Audit Matters
The critical audit matter communicated below is a matter arising from the current period audit of the consolidated financial statements that was communicated or required to be communicated to the audit committee and that (i) relates to accounts or disclosures that are material to the consolidated financial statements and (ii) involved our especially challenging, subjective, or complex judgments. The communication of critical audit matters does not alter in any way our opinion on the consolidated financial statements, taken as a whole, and we are not, by communicating the critical audit matter below, providing a separate opinion on the critical audit matter or on the accounts or disclosures to which it relates.
Excess and Obsolete Inventory Reserve
As described in Note 7 to the consolidated financial statements, the Company’s consolidated net inventory and inventory reserve as of December 31, 2020 were $125.5 million and $39.6 million, respectively. Management establishes reserves for estimated excess and obsolete inventory equal to the difference between the cost of the inventory and the estimated net realizable value of the inventory based on estimated reserve percentages, which consider historical usage, known trends, inventory age, and market conditions.
The principal considerations for our determination that performing procedures relating to the excess and obsolete inventory reserve is a critical audit matter are (i) the significant judgment by management in estimating the excess and obsolete inventory reserve, which in turn led to (ii) a high degree of auditor judgment, subjectivity and effort in performing procedures and evaluating management’s significant assumptions related to the estimated reserve percentages.
Addressing the matter involved performing procedures and evaluating audit evidence in connection with forming our overall opinion on the consolidated financial statements. These procedures included testing the effectiveness of controls relating to the excess and obsolete inventory reserve. These procedures also included, among others, testing management’s process for developing the excess and obsolete inventory reserve; evaluating the appropriateness of the approach; testing the completeness and accuracy of underlying data used in the approach, including historical usage and inventory age; and evaluating the reasonableness of the estimated reserve percentages used by management to determine the excess and obsolete inventory reserve. Evaluating the reasonableness of the estimated reserve percentages involved assessing whether they were consistent with the historical data and evidence obtained in other areas of the audit.
/s/ PricewaterhouseCoopers LLP
Birmingham, Alabama
February 26, 2021
We have served as the Company’s auditor since 1986.
52
Financial Statements
ADTRAN, INC.
Consolidated Balance Sheets
(In thousands, except per share amount)
December 31, 2020 and 2019
|
ASSETS |
|
2020 |
|
|
2019 |
|
||
|
Current Assets |
|
|
|
|
|
|
|
|
|
Cash and cash equivalents |
|
$ |
|
|
|
$ |
|
|
|
Restricted cash |
|
|
|
|
|
|
— |
|
|
Short-term investments (includes $ |
|
|
|
|
|
|
|
|
|
Accounts receivable, less allowance for doubtful accounts of $ |
|
|
|
|
|
|
|
|
|
Other receivables |
|
|
|
|
|
|
|
|
|
Inventory, net |
|
|
|
|
|
|
|
|
|
Prepaid expenses and other current assets |
|
|
|
|
|
|
|
|
|
Total Current Assets |
|
|
|
|
|
|
|
|
|
Property, plant and equipment, net |
|
|
|
|
|
|
|
|
|
Deferred tax assets, net |
|
|
|
|
|
|
|
|
|
Goodwill |
|
|
|
|
|
|
|
|
|
Intangibles, net |
|
|
|
|
|
|
|
|
|
Other non-current assets |
|
|
|
|
|
|
|
|
|
Long-term investments (includes $ |
|
|
|
|
|
|
|
|
|
Total Assets |
|
$ |
|
|
|
$ |
|
|
|
LIABILITIES AND STOCKHOLDERS' EQUITY |
|
|
|
|
|
|
|
|
|
Current Liabilities |
|
|
|
|
|
|
|
|
|
Accounts payable |
|
$ |
|
|
|
$ |
|
|
|
Bonds payable |
|
|
— |
|
|
|
|
|
|
Unearned revenue |
|
|
|
|
|
|
|
|
|
Accrued expenses and other liabilities |
|
|
|
|
|
|
|
|
|
Accrued wages and benefits |
|
|
|
|
|
|
|
|
|
Income tax payable, net |
|
|
|
|
|
|
|
|
|
Total Current Liabilities |
|
|
|
|
|
|
|
|
|
Non-current unearned revenue |
|
|
|
|
|
|
|
|
|
Pension liability |
|
|
|
|
|
|
|
|
|
Deferred compensation liability |
|
|
|
|
|
|
|
|
|
Other non-current liabilities |
|
|
|
|
|
|
|
|
|
Total Liabilities |
|
|
|
|
|
|
|
|
|
Commitments and contingencies (see Note 17) |
|
|
|
|
|
|
|
|
|
Stockholders' Equity |
|
|
|
|
|
|
|
|
|
Common stock, par value $ |
|
|
|
|
|
|
|
|
|
Additional paid-in capital |
|
|
|
|
|
|
|
|
|
Accumulated other comprehensive loss |
|
|
( |
) |
|
|
( |
) |
|
Retained earnings |
|
|
|
|
|
|
|
|
|
Less treasury stock at cost: |
|
|
( |
) |
|
|
( |
) |
|
Total Stockholders' Equity |
|
|
|
|
|
|
|
|
|
Total Liabilities and Stockholders' Equity |
|
$ |
|
|
|
$ |
|
|
See accompanying notes to consolidated financial statements.
53
ADTRAN, INC.
Consolidated Statements of Income (Loss)
(In thousands, except per share amounts)
Years ended December 31, 2020, 2019 and 2018
|
|
|
2020 |
|
|
2019 |
|
|
2018 |
|
|||
|
Sales |
|
|
|
|
|
|
|
|
|
|
|
|
|
Network Solutions |
|
$ |
|
|
|
$ |
|
|
|
$ |
|
|
|
Services & Support |
|
|
|
|
|
|
|
|
|
|
|
|
|
Total Sales |
|
|
|
|
|
|
|
|
|
|
|
|
|
Cost of Sales |
|
|
|
|
|
|
|
|
|
|
|
|
|
Network Solutions |
|
|
|
|
|
|
|
|
|
|
|
|
|
Services & Support |
|
|
|
|
|
|
|
|
|
|
|
|
|
Total Cost of Sales |
|
|
|
|
|
|
|
|
|
|
|
|
|
Gross Profit |
|
|
|
|
|
|
|
|
|
|
|
|
|
Selling, general and administrative expenses |
|
|
|
|
|
|
|
|
|
|
|
|
|
Research and development expenses |
|
|
|
|
|
|
|
|
|
|
|
|
|
Asset impairments |
|
|
|
|
|
|
|
|
|
|
— |
|
|
Gain on contingency |
|
|
— |
|
|
|
( |
) |
|
|
— |
|
|
Operating Loss |
|
|
( |
) |
|
|
( |
) |
|
|
( |
) |
|
Interest and dividend income |
|
|
|
|
|
|
|
|
|
|
|
|
|
Interest expense |
|
|
( |
) |
|
|
( |
) |
|
|
( |
) |
|
Net investment gain (loss) |
|
|
|
|
|
|
|
|
|
|
( |
) |
|
Other income (expense), net |
|
|
( |
) |
|
|
|
|
|
|
|
|
|
Gain on bargain purchase of a business |
|
|
— |
|
|
|
— |
|
|
|
|
|
|
Loss Before Income Taxes |
|
|
( |
) |
|
|
( |
) |
|
|
( |
) |
|
Income tax (expense) benefit |
|
|
|
|
|
|
( |
) |
|
|
|
|
|
Net Income (Loss) |
|
$ |
|
|
|
$ |
( |
) |
|
$ |
( |
) |
|
Weighted average shares outstanding – basic |
|
|
|
|
|
|
|
|
|
|
|
|
|
Weighted average shares outstanding – diluted |
|
|
|
|
|
|
|
|
|
|
|
|
|
Earnings (loss) per common share – basic |
|
$ |
|
|
|
$ |
( |
) |
|
$ |
( |
) |
|
Earnings (loss) per common share – diluted |
|
$ |
|
|
|
$ |
( |
) |
|
$ |
( |
) |
See accompanying notes to consolidated financial statements.
54
ADTRAN, INC.
Consolidated Statements of Comprehensive Income (Loss)
(In thousands)
Years ended December 31, 2020, 2019 and 2018
|
|
|
2020 |
|
|
2019 |
|
|
2018 |
|
|||
|
Net Income (Loss) |
|
$ |
|
|
|
$ |
( |
) |
|
$ |
( |
) |
|
Other Comprehensive Income (Loss), net of tax |
|
|
|
|
|
|
|
|
|
|
|
|
|
Net unrealized gains (losses) on available-for-sale securities |
|
|
|
|
|
|
|
|
|
|
( |
) |
|
Defined benefit plan adjustments |
|
|
( |
) |
|
|
( |
) |
|
|
( |
) |
|
Foreign currency translation |
|
|
|
|
|
|
( |
) |
|
|
( |
) |
|
Other Comprehensive Income (Loss), net of tax |
|
|
|
|
|
|
( |
) |
|
|
( |
) |
|
Comprehensive Income (Loss), net of tax |
|
$ |
|
|
|
$ |
( |
) |
|
$ |
( |
) |
See accompanying notes to consolidated financial statements.
55
ADTRAN, INC.
Consolidated Statements of Changes in Stockholders' Equity
(In thousands, except per share amounts)
Years ended December 31, 2020, 2019 and 2018
|
|
|
Common Shares |
|
|
Common Stock |
|
|
Additional Paid-In Capital |
|
|
Retained Earnings |
|
|
Treasury Stock |
|
|
Accumulated Other Comprehensive Income (Loss) |
|
|
Total Stockholders' Equity |
|
|||||||
|
Balance as of December 31, 2017 |
|
|
|
|
|
$ |
|
|
|
$ |
|
|
|
$ |
|
|
|
$ |
( |
) |
|
$ |
( |
) |
|
$ |
|
|
|
Net loss |
|
|
— |
|
|
|
— |
|
|
|
— |
|
|
|
( |
) |
|
|
— |
|
|
|
— |
|
|
|
( |
) |
|
ASU 2014-09 adoption |
|
|
— |
|
|
|
— |
|
|
|
— |
|
|
|
|
|
|
|
— |
|
|
|
— |
|
|
|
|
|
|
ASU 2016-01 adoption |
|
|
— |
|
|
|
— |
|
|
|
— |
|
|
|
|
|
|
|
— |
|
|
|
— |
|
|
|
|
|
|
Other comprehensive loss, net of tax |
|
|
— |
|
|
|
— |
|
|
|
— |
|
|
|
— |
|
|
|
— |
|
|
|
( |
) |
|
|
( |
) |
|
Dividend payments ($ |
|
|
— |
|
|
|
— |
|
|
|
— |
|
|
|
( |
) |
|
|
— |
|
|
|
— |
|
|
|
( |
) |
|
Dividends accrued on unvested restricted stock units |
|
|
— |
|
|
|
— |
|
|
|
— |
|
|
|
( |
) |
|
|
— |
|
|
|
— |
|
|
|
( |
) |
|
Stock options exercised |
|
|
— |
|
|
|
— |
|
|
|
— |
|
|
|
( |
) |
|
|
|
|
|
|
— |
|
|
|
|
|
|
PSUs, RSUs and restricted stock vested |
|
|
— |
|
|
|
— |
|
|
|
— |
|
|
|
( |
) |
|
|
|
|
|
|
— |
|
|
|
( |
) |
|
Purchase of treasury stock |
|
|
— |
|
|
|
— |
|
|
|
— |
|
|
|
— |
|
|
|
( |
) |
|
|
— |
|
|
|
( |
) |
|
Stock-based compensation expense |
|
|
— |
|
|
|
— |
|
|
|
|
|
|
|
— |
|
|
|
— |
|
|
|
— |
|
|
|
|
|
|
Balance as of December 31, 2018 |
|
|
|
|
|
|
|
|
|
|
|
|
|
|
|
|
|
|
( |
) |
|
|
( |
) |
|
|
|
|
|
Net loss |
|
|
— |
|
|
|
— |
|
|
|
— |
|
|
|
( |
) |
|
|
— |
|
|
|
— |
|
|
|
( |
) |
|
ASU 2016-02 adoption |
|
|
— |
|
|
|
— |
|
|
|
— |
|
|
|
|
|
|
|
— |
|
|
|
— |
|
|
|
|
|
|
ASU 2018-02 adoption |
|
|
— |
|
|
|
— |
|
|
|
— |
|
|
|
( |
) |
|
|
— |
|
|
|
|
|
|
|
— |
|
|
Other comprehensive loss, net of tax |
|
|
— |
|
|
|
— |
|
|
|
— |
|
|
|
— |
|
|
|
— |
|
|
|
( |
) |
|
|
( |
) |
|
Dividend payments ($ |
|
|
— |
|
|
|
— |
|
|
|
— |
|
|
|
( |
) |
|
|
— |
|
|
|
— |
|
|
|
( |
) |
|
Dividends accrued on unvested restricted stock units |
|
|
— |
|
|
|
— |
|
|
|
— |
|
|
|
( |
) |
|
|
— |
|
|
|
— |
|
|
|
( |
) |
|
Stock options exercised |
|
|
— |
|
|
|
— |
|
|
|
— |
|
|
|
( |
) |
|
|
|
|
|
|
— |
|
|
|
|
|
|
PSUs, RSUs and restricted stock vested |
|
|
— |
|
|
|
— |
|
|
|
— |
|
|
|
( |
) |
|
|
|
|
|
|
— |
|
|
|
( |
) |
|
Purchase of treasury stock |
|
|
— |
|
|
|
— |
|
|
|
— |
|
|
|
— |
|
|
|
( |
) |
|
|
— |
|
|
|
( |
) |
|
Stock-based compensation expense |
|
|
— |
|
|
|
— |
|
|
|
|
|
|
|
— |
|
|
|
— |
|
|
|
— |
|
|
|
|
|
|
Balance as of December 31, 2019 |
|
|
|
|
|
|
|
|
|
|
|
|
|
|
|
|
|
|
( |
) |
|
|
( |
) |
|
|
|
|
|
Net income |
|
|
— |
|
|
|
— |
|
|
|
— |
|
|
|
|
|
|
|
— |
|
|
|
— |
|
|
|
|
|
|
Other comprehensive income, net of tax |
|
|
— |
|
|
|
— |
|
|
|
— |
|
|
|
— |
|
|
|
— |
|
|
|
|
|
|
|
|
|
|
Dividend payments ($ |
|
|
— |
|
|
|
— |
|
|
|
— |
|
|
|
( |
) |
|
|
— |
|
|
|
— |
|
|
|
( |
) |
|
Dividends accrued on unvested restricted stock units |
|
|
— |
|
|
|
— |
|
|
|
— |
|
|
|
( |
) |
|
|
— |
|
|
|
— |
|
|
|
( |
) |
|
Deferred compensation adjustments, net of tax |
|
|
— |
|
|
|
— |
|
|
|
— |
|
|
|
— |
|
|
|
( |
) |
|
|
— |
|
|
|
( |
) |
|
PSUs, RSUs and restricted stock vested |
|
|
— |
|
|
|
— |
|
|
|
— |
|
|
|
( |
) |
|
|
|
|
|
|
— |
|
|
|
( |
) |
|
Stock-based compensation expense |
|
|
— |
|
|
|
— |
|
|
|
|
|
|
|
— |
|
|
|
— |
|
|
|
— |
|
|
|
|
|
|
Balance as of December 31, 2020 |
|
|
|
|
|
$ |
|
|
|
$ |
|
|
|
$ |
|
|
|
$ |
( |
) |
|
$ |
( |
) |
|
$ |
|
|
See accompanying notes to consolidated financial statements.
56
ADTRAN, INC.
Consolidated Statements of Cash Flows
(In thousands)
Years ended December 31, 2020, 2019 and 2018
|
|
|
2020 |
|
|
2019 |
|
|
2018 |
|
|||
|
Cash flows from operating activities: |
|
|
|
|
|
|
|
|
|
|
|
|
|
Net Income (Loss) |
|
$ |
|
|
|
$ |
( |
) |
|
$ |
( |
) |
|
Adjustments to reconcile net income (loss) to net cash (used in) provided by operating activities: |
|
|
|
|
|
|
|
|
|
|
|
|
|
Depreciation and amortization |
|
|
|
|
|
|
|
|
|
|
|
|
|
Asset impairments |
|
|
|
|
|
|
|
|
|
|
— |
|
|
(Gain) loss on investments |
|
|
( |
) |
|
|
( |
) |
|
|
|
|
|
Stock-based compensation expense |
|
|
|
|
|
|
|
|
|
|
|
|
|
Deferred income taxes |
|
|
( |
) |
|
|
|
|
|
|
( |
) |
|
Gain on contingency payment |
|
|
— |
|
|
|
( |
) |
|
|
— |
|
|
Gain on life insurance proceeds |
|
|
— |
|
|
|
( |
) |
|
|
— |
|
|
Gain on bargain purchase of a business |
|
|
— |
|
|
|
— |
|
|
|
( |
) |
|
Other |
|
|
|
|
|
|
( |
) |
|
|
|
|
|
Change in operating assets and liabilities: |
|
|
|
|
|
|
|
|
|
|
|
|
|
Accounts receivable, net |
|
|
( |
) |
|
|
|
|
|
|
|
|
|
Other receivables |
|
|
( |
) |
|
|
|
|
|
|
( |
) |
|
Inventory, net |
|
|
( |
) |
|
|
|
|
|
|
|
|
|
Prepaid expenses and other assets |
|
|
( |
) |
|
|
|
|
|
|
|
|
|
Accounts payable, net |
|
|
|
|
|
|
( |
) |
|
|
( |
) |
|
Accrued expenses and other liabilities |
|
|
|
|
|
|
( |
) |
|
|
( |
) |
|
Income taxes payable |
|
|
( |
) |
|
|
( |
) |
|
|
|
|
|
Net cash provided by (used in) operating activities |
|
|
( |
) |
|
|
( |
) |
|
|
|
|
|
Cash flows from investing activities: |
|
|
|
|
|
|
|
|
|
|
|
|
|
Purchases of property, plant and equipment |
|
|
( |
) |
|
|
( |
) |
|
|
( |
) |
|
Proceeds from disposals of property, plant and equipment |
|
|
|
|
|
|
— |
|
|
|
— |
|
|
Proceeds from sales and maturities of available-for-sale investments |
|
|
|
|
|
|
|
|
|
|
|
|
|
Purchases of available-for-sale investments |
|
|
( |
) |
|
|
( |
) |
|
|
( |
) |
|
Acquisition of note receivable |
|
|
( |
) |
|
|
— |
|
|
|
— |
|
|
Life insurance proceeds received |
|
|
— |
|
|
|
|
|
|
|
— |
|
|
Acquisition of business |
|
|
— |
|
|
|
|
|
|
|
( |
) |
|
Net cash provided by (used in) investing activities |
|
|
|
|
|
|
( |
) |
|
|
|
|
|
Cash flows from financing activities: |
|
|
|
|
|
|
|
|
|
|
|
|
|
Dividend payments |
|
|
( |
) |
|
|
( |
) |
|
|
( |
) |
|
Repayment of bonds payable |
|
|
( |
) |
|
|
— |
|
|
|
— |
|
|
Tax withholdings related to stock-based compensation settlements |
|
|
( |
) |
|
|
— |
|
|
|
— |
|
|
Proceeds from stock option exercises |
|
|
— |
|
|
|
|
|
|
|
|
|
|
Purchases of treasury stock |
|
|
— |
|
|
|
( |
) |
|
|
( |
) |
|
Payments on long-term debt |
|
|
— |
|
|
|
( |
) |
|
|
( |
) |
|
Net cash used in financing activities |
|
|
( |
) |
|
|
( |
) |
|
|
( |
) |
|
Net increase (decrease) in cash and cash equivalents |
|
|
( |
) |
|
|
( |
) |
|
|
|
|
|
Effect of exchange rate changes |
|
|
|
|
|
|
( |
) |
|
|
( |
) |
|
Cash, cash equivalents and restricted cash, beginning of year |
|
|
|
|
|
|
|
|
|
|
|
|
|
Cash, cash equivalents and restricted cash, end of year |
|
$ |
|
|
|
$ |
|
|
|
$ |
|
|
|
Supplemental disclosure of cash flow information |
|
|
|
|
|
|
|
|
|
|
|
|
|
Cash paid during the year for interest |
|
$ |
|
|
|
$ |
|
|
|
$ |
|
|
|
Cash paid during the year for income taxes |
|
$ |
|
|
|
$ |
|
|
|
$ |
|
|
|
Supplemental disclosure of non-cash investing activities |
|
|
|
|
|
|
|
|
|
|
|
|
|
Purchases of property, plant and equipment included in accounts payable |
|
$ |
|
|
|
$ |
|
|
|
$ |
|
|
|
Contingent payment |
|
$ |
— |
|
|
$ |
— |
|
|
$ |
|
|
See accompanying notes to consolidated financial statements.
57
Notes to Consolidated Financial Statements
Note 1 – Nature of Business
ADTRAN, Inc. (“ADTRAN” or the “Company”) is a leading global provider of networking and communications platforms and services focused on the broadband access market. Our vision is to enable a fully connected world where the power to communicate is available to everyone, everywhere. Our unique approach, unmatched industry expertise and innovative solutions enable us to address almost any customer need. Our products and services are utilized by a diverse global customer base of network operators that range from those having regional or national reach and operating as telephone or cable television network operators to alternative network providers such as municipalities or utilities, as well as, managed service providers who serve small- and medium-sized businesses and distributed enterprises.
Principles of Consolidation
The accompanying Consolidated Financial Statements have been prepared in accordance with accounting principles generally accepted in the U.S. (“U.S. GAAP”) and include the financial position, results of operations, comprehensive income (loss), changes in equity and cash flows of ADTRAN and its wholly-owned subsidiaries. All intercompany accounts and transactions have been eliminated in consolidation.
Use of Estimates
The preparation of financial statements in conformity with U.S. GAAP requires management to make estimates and assumptions that affect the reported amounts of assets and liabilities, the disclosure of contingent assets and liabilities at the date of the financial statements, and the reported amounts of revenue and expenses during the reporting period. Our more significant estimates include excess and obsolete inventory reserves, warranty reserves, customer rebates, determination and accrual of the deferred revenue components of multiple element sales agreements, estimated costs to complete obligations associated with deferred revenues and network installations, estimated income tax provision and income tax contingencies, fair value of stock-based compensation, assessment of goodwill and other intangibles for impairment, estimated lives of intangible assets, estimated pension liability, fair value of investments, evaluation of other-than-temporary declines in the value of investments and our allowance for current expected credit losses. Actual amounts could differ significantly from these estimates.
We assessed certain accounting matters that generally require consideration of forecasted financial information in context with the information reasonably available to us and the unknown future impacts of the novel coronavirus (“COVID-19”) as of December 31, 2020 and through the date of this report. The accounting matters assessed included, but were not limited to, the allowance for doubtful accounts, current estimated credit losses, stock-based compensation, excess and obsolete inventory reserves, carrying value of goodwill, intangibles and other long-lived assets, financial assets, valuation allowances for tax assets and revenue recognition. While there was not a material impact to our consolidated financial statements as of and for the year ended December 31, 2020 resulting from these assessments, future conditions related to the magnitude and duration of the COVID-19 pandemic, as well as other factors, could result in material impacts to our consolidated financial statements in future reporting periods.
Correction of Immaterial Misstatement
During the three months ended June 30, 2019, the Company determined that there was an immaterial misstatement of its excess and obsolete inventory reserves in its previously issued annual and interim financial statements. The Company corrected this misstatement by recognizing a $
58
During the first quarter of 2020, it was determined that certain investments held in the Company’s stock for a deferred compensation plan accounted for as a Rabbi trust were incorrectly classified as long-term investments with the fair value of such investments incorrectly marked to market at each period end rather than classified as treasury stock held at historical cost. This plan has been in existence since 2011. The Company corrected this misstatement as an out-of-period adjustment in the three months ended March 31, 2020 and the twelve months ended December 31, 2020, by remeasuring the investment assets to their historical cost basis through the recording of a net investment gain of $
Summary of Significant Accounting Policies
Cash and Cash Equivalents
Cash and cash equivalents represent demand deposits, money market funds and short-term investments classified as available-for-sale with original maturities of three months or less. We maintain depository investments with certain financial institutions. As of December 31, 2020, $
Restricted Cash
Restricted cash consists of certain collateral which secures the Company’s performance obligation under a contract with a certain customer.
Financial Instruments
The carrying amounts reported in the Consolidated Balance Sheets for cash and cash equivalents, accounts receivable, and accounts payable approximate fair value due to the immediate or short-term maturity of these financial instruments. The carrying amount reported for bonds payable was $
Investments with contractual maturities beyond one year may be classified as short-term based on their highly liquid nature and because such marketable securities represent the investment of cash that is available for current operations. Despite the long-term nature of their stated contractual maturities, we routinely buy and sell these securities and we believe we have the ability to quickly sell them to the remarketing agent, tender agent or issuer at par value plus accrued interest in the event we decide to liquidate our investment in a particular variable rate demand note. All income generated from these investments is recorded as interest income. We have not recorded any losses relating to variable rate demand notes.
Long-term investments is comprised of deferred compensation plan assets, corporate bonds, municipal fixed-rate bonds, asset-backed bonds, mortgage/agency-backed bonds, U.S. and foreign government bonds, marketable equity securities and other equity investments. Marketable equity securities are reported at fair value as determined by the most recently traded price of the securities at the balance sheet date, although the securities may not be readily marketable due to the size of the available market. Any changes in fair value are recognized in net investment gain (loss). Realized gains and losses on sales of debt securities are computed under the specific identification method and are included in other income (expense). See Note 6 for additional information.
Accounts Receivable
We record accounts receivable at net realizable value. Prior to establishing payment terms for a new customer, we evaluate the credit risk of the customer. Credit limits and payment terms established for new customers are re-evaluated periodically based on customer collection experience and other financial factors. As of December 31, 2020, single customers comprising more than 10% of our total accounts receivable balance included
On January 1, 2020, we adopted ASU 2016-13, Financial Instruments – Credit Losses (Topic 326): Measurement of Credit Losses on Financial Instruments.
59
Accounting Policy Under Topic 326
We regularly review the need for an allowance for credit losses related to our outstanding accounts receivable balances using the historical loss-rate method as well as assessing asset-specific risks. The assessment of asset-specific risks included the evaluation of relevant available information, from internal and external sources, relating to current conditions that may affect a customer’s ability to pay, such as the customer’s current financial condition or credit rating by geographic location, as provided by a third party and/or by customer, if needed, and overall macro-economic conditions in which the customer operates. Based on this assessment, an allowance for credit loss would be recorded if the Company determined that, based on our historical write-offs, which have been immaterial, and such asset specific risks, there was risk in collectability of the full amount of any accounts receivable.
Accounting Policy Prior to Adoption of Topic 326
Prior to adoption of Topic 326 on January 1, 2020, we regularly reviewed the need to maintain an allowance for doubtful accounts and considered factors such as the age of accounts receivable balances, the current economic conditions that may affect a customer’s ability to pay, significant one-time events impacting these customers and our historical experience. If the financial condition of a customer deteriorated, resulting in an impairment of their ability to make payments, we may have been required to record an allowance for doubtful accounts.
Inventory
Inventory is carried at the lower of cost and estimated net realizable value, with cost being determined using the first-in, first-out method. Standard costs for material, labor and manufacturing overhead are used to value inventory and are updated at least quarterly. We establish reserves for estimated excess and obsolete inventory equal to the difference between the cost of the inventory and the estimated net realizable value of the inventory based on estimated reserve percentages, which consider historical usage, known trends, inventory age and market conditions. When we dispose of excess and obsolete inventories, the related disposals are charged against the inventory reserve. See Note 7 for additional information.
Property, Plant and Equipment
Property, plant and equipment, which is stated at cost, is depreciated using the straight-line method over the estimated useful lives of the assets. We depreciate building and land improvements from
Intangible Assets
Purchased intangible assets with finite lives are carried at cost less accumulated amortization. Amortization is recorded over the estimated useful lives of the respective assets, which is
Impairment of Long-Lived Assets and Intangibles
Long-lived assets used in operations and intangible assets are reviewed for impairment whenever events or changes in circumstances indicate that the carrying amount of an asset may not be recoverable and the undiscounted cash flows estimated to be generated by the asset are less than the asset’s carrying value. An impairment loss would be recognized in the amount by which the recorded value of the asset exceeds the fair value of the asset, measured by the quoted market price of an asset or an estimate based on the best information available in the circumstances. During the years ended December 31, 2020 and December 31, 2019, we recognized an impairment loss of less than $
60
Goodwill
Goodwill represents the excess purchase price over the fair value of net assets acquired. We evaluate the carrying value of goodwill during the fourth quarter of each year and between annual evaluations if events occur or circumstances change that would more likely than not reduce the fair value of the reporting unit below its carrying amount. We have elected to by-pass a qualitative assessment to determine whether it is more likely than not that the fair value of the reporting unit to which the goodwill is assigned is less than its carrying amount and, in turn, performed a step-1 analysis of goodwill.
Liability for Warranty
Our products generally include warranties of
A summary of warranty expense and write-off activity for the years ended December 31, 2020, 2019 and 2018 is as follows:
|
|
|
Year Ended December 31, |
|
|||||||||
|
(In thousands) |
|
2020 |
|
|
2019 |
|
|
2018 |
|
|||
|
Balance at beginning of period |
|
$ |
|
|
|
$ |
|
|
|
$ |
|
|
|
Plus: Amounts charged to cost and expenses |
|
|
|
|
|
|
|
|
|
|
|
|
|
Less: Deductions |
|
|
( |
) |
|
|
( |
) |
|
|
( |
) |
|
Balance at end of period |
|
$ |
|
|
|
$ |
|
|
|
$ |
|
|
Pension Benefit Plan Obligations
We maintain a defined benefit pension plan covering employees in certain foreign countries. Pension benefit plan obligations are based on various assumptions used by our actuaries in calculating these amounts. These assumptions include discount rates, compensation rate increases, expected return on plan assets, retirement rates and mortality rates. Actual results that differ from the assumptions and changes in assumptions could affect future expenses and obligations. Our net pension liability totaled $
Stock-Based Compensation
We have
Stock-based compensation expense recognized for the years ended December 31, 2020, 2019 and 2018 was approximately $
Research and Development Costs
Research and development costs include compensation for engineers and support personnel, contracted services, depreciation and material costs associated with new product development, enhancement of current products and product cost reductions. We continually evaluate new product opportunities and engage in intensive research and product development efforts. Research and development costs totaled $
61
Other Comprehensive Income (Loss)
The following table presents changes in accumulated other comprehensive income (loss), net of tax, by components of accumulated other comprehensive income (loss) for the years ended December 31, 2020 2019 and 2018:
|
(In thousands) |
|
Unrealized Gains (Losses) on Available- for-Sale Securities |
|
|
Defined Benefit Plan Adjustments |
|
|
Foreign Currency Adjustments |
|
|
ASU 2018-02 Adoption (2) |
|
|
Total |
|
|||||
|
Balance as of December 31, 2017 |
|
$ |
|
|
|
$ |
( |
) |
|
$ |
( |
) |
|
$ |
— |
|
|
$ |
( |
) |
|
Other comprehensive loss before reclassifications |
|
|
|
|
|
|
( |
) |
|
|
( |
) |
|
|
— |
|
|
|
( |
) |
|
Amounts reclassified to retained earnings (1) |
|
|
( |
) |
|
|
— |
|
|
|
— |
|
|
|
— |
|
|
|
( |
) |
|
Amounts reclassified from accumulated other comprehensive loss |
|
|
( |
) |
|
|
|
|
|
|
— |
|
|
|
— |
|
|
|
( |
) |
|
Balance as of December 31, 2018 |
|
|
( |
) |
|
|
( |
) |
|
|
( |
) |
|
|
— |
|
|
|
( |
) |
|
Other comprehensive loss before reclassifications |
|
|
|
|
|
|
( |
) |
|
|
( |
) |
|
|
— |
|
|
|
( |
) |
|
Amounts reclassified to retained earnings (1) |
|
|
— |
|
|
|
— |
|
|
|
— |
|
|
|
|
|
|
|
|
|
|
Amounts reclassified from accumulated other comprehensive loss |
|
|
( |
) |
|
|
|
|
|
|
— |
|
|
|
— |
|
|
|
|
|
|
Balance as of December 31, 2019 |
|
|
( |
) |
|
|
( |
) |
|
|
( |
) |
|
|
|
|
|
|
( |
) |
|
Other comprehensive loss before reclassifications |
|
|
|
|
|
|
( |
) |
|
|
|
|
|
|
— |
|
|
|
|
|
|
Amounts reclassified from accumulated other comprehensive loss |
|
|
( |
) |
|
|
|
|
|
|
— |
|
|
|
— |
|
|
|
|
|
|
Balance as of December 31, 2020 |
|
$ |
|
|
|
$ |
( |
) |
|
$ |
( |
) |
|
$ |
|
|
|
$ |
( |
) |
|
|
(1) |
With the adoption of ASU 2016-01, the unrealized gains on our equity investments were reclassified to retained earnings. |
|
|
(2) |
With the adoption of ASU 2018-02 on January 1, 2019, stranded tax effects related to the Tax Cuts and Jobs Act of 2017 were reclassified to retained earnings. See Note 14 for additional information. |
The following tables present the details of reclassifications out of accumulated other comprehensive income (loss) for the years ended December 31, 2020, 2019 and 2018:
|
(In thousands) |
|
For the year ended December 31, |
|
|
|
|||||||||
|
Details about Accumulated Other Comprehensive Income Components |
|
2020 |
|
|
2019 |
|
|
2018 |
|
|
Affected Line Item in the Statement Where Net Income Is Presented |
|||
|
Unrealized gains on available-for-sale securities: |
|
|
|
|
|
|
|
|
|
|
|
|
|
|
|
Net realized gain on sales of securities |
|
$ |
|
|
|
$ |
|
|
|
$ |
|
|
|
Net investment gain (loss) |
|
Defined benefit plan adjustments – actuarial losses |
|
|
( |
) |
|
|
( |
) |
|
|
( |
) |
|
(1) |
|
Total reclassifications for the period, before tax |
|
|
( |
) |
|
|
( |
) |
|
|
|
|
|
|
|
Tax benefit |
|
|
|
|
|
|
|
|
|
|
( |
) |
|
|
|
Total reclassifications for the period, net of tax |
|
$ |
( |
) |
|
$ |
( |
) |
|
$ |
|
|
|
|
|
|
(1) |
Included in the computation of net periodic pension cost. See Note 15 for additional information. |
62
The following tables present the tax effects related to the change in each component of other comprehensive income (loss) for the years ended December 31, 2020, 2019 and 2018:
|
|
|
2020 |
|
|||||||||
|
(In thousands) |
|
Before-Tax Amount |
|
|
Tax (Expense) Benefit |
|
|
Net-of-Tax Amount |
|
|||
|
Unrealized gains (losses) on available-for-sale securities |
|
$ |
|
|
|
$ |
( |
) |
|
$ |
|
|
|
Reclassification adjustment for amounts related to available-for-sale investments included in net income |
|
|
( |
) |
|
|
|
|
|
|
( |
) |
|
Defined benefit plan adjustments |
|
|
( |
) |
|
|
|
|
|
|
( |
) |
|
Reclassification adjustment for amounts related to defined benefit plan adjustments included in net income |
|
|
|
|
|
|
( |
) |
|
|
|
|
|
Foreign currency translation adjustment |
|
|
|
|
|
|
— |
|
|
|
|
|
|
Total Other Comprehensive Income (Loss) |
|
$ |
|
|
|
$ |
|
|
|
$ |
|
|
|
|
|
2019 |
|
|||||||||
|
(In thousands) |
|
Before-Tax Amount |
|
|
Tax (Expense) Benefit |
|
|
Net-of-Tax Amount |
|
|||
|
Unrealized gains (losses) on available-for-sale securities |
|
$ |
|
|
|
$ |
( |
) |
|
$ |
|
|
|
Reclassification adjustment for amounts related to available-for-sale investments included in net loss |
|
|
( |
) |
|
|
|
|
|
|
( |
) |
|
Defined benefit plan adjustments |
|
|
( |
) |
|
|
|
|
|
|
( |
) |
|
Reclassification adjustment for amounts related to defined benefit plan adjustments included in net loss |
|
|
|
|
|
|
( |
) |
|
|
|
|
|
Foreign currency translation adjustment |
|
|
( |
) |
|
|
— |
|
|
|
( |
) |
|
Total Other Comprehensive Income (Loss) |
|
$ |
( |
) |
|
$ |
|
|
|
$ |
( |
) |
|
|
|
2018 |
|
|||||||||
|
(In thousands) |
|
Before-Tax Amount |
|
|
Tax (Expense) Benefit |
|
|
Net-of-Tax Amount |
|
|||
|
Unrealized gains (losses) on available-for-sale securities |
|
$ |
|
|
|
$ |
( |
) |
|
$ |
|
|
|
Reclassification adjustment for amounts related to available-for-sale investments included in net loss |
|
|
( |
) |
|
|
|
|
|
|
( |
) |
|
Reclassification adjustment for amounts reclassed to retained earnings related to the adoption of ASU 2016-01 |
|
|
( |
) |
|
|
|
|
|
|
( |
) |
|
Defined benefit plan adjustments |
|
|
( |
) |
|
|
|
|
|
|
( |
) |
|
Reclassification adjustment for amounts related to defined benefit plan adjustments included in net loss |
|
|
|
|
|
|
( |
) |
|
|
|
|
|
Foreign currency translation adjustment |
|
|
( |
) |
|
|
— |
|
|
|
( |
) |
|
Total Other Comprehensive Income (Loss) |
|
$ |
( |
) |
|
$ |
|
|
|
$ |
( |
) |
Income Taxes
The provision for income taxes has been determined using the asset and liability approach of accounting for income taxes. Under this approach, deferred taxes represent the future tax consequences expected to occur when the reported amounts of assets and liabilities are recovered or paid. The provision for income taxes represents income taxes paid or payable for the current year plus the change in deferred taxes during the year. Deferred taxes result from the difference between financial and tax bases of our assets and liabilities and are adjusted for changes in tax rates and tax laws when such changes are enacted. Valuation allowances are recorded to reduce deferred tax assets when it is more likely than not that a tax benefit will not be realized.
We establish reserves to remove some or all of the tax benefit of any of our tax positions at the time we determine that the positions become uncertain. We adjust these reserves, including any impact on the related interest and penalties, as facts and circumstances change.
63
Foreign Currency
Transactions with customers that are denominated in foreign currencies are recorded using the appropriate exchange rates from throughout the year. Assets and liabilities denominated in foreign currencies are remeasured at the balance sheet dates using the closing rates of exchange between those foreign currencies and the functional currency with any transaction gains or losses reported in other income (expense). Our primary exposures to foreign currency exchange rate movements are with our German subsidiary, whose functional currency is the Euro, our Australian subsidiary, whose functional currency is the Australian dollar and our British subsidiary, whose functional currency is the Great British pound. Adjustments resulting from translating financial statements of international subsidiaries are recorded as a component of accumulated other comprehensive income (loss).
Revenue
On January 1, 2018, we adopted ASU 2014-09, Revenue from Contracts with Customers (Topic 606), which supersedes the revenue recognition requirements in Topic 605, Revenue Recognition.
Accounting Policy under Topic 606
Revenue is measured based on the consideration expected to be received in exchange for transferring goods or providing services to a customer and as performance obligations under the terms of the contract are satisfied. Generally, this occurs with the transfer of control of a product to the customer. Review of contracts with customers, for both direct customers and distributors, are performed and assessment made regarding principal versus agent considerations to determine primary responsibility for delivery of performance obligation, presumed inventory risk, and discretion in establishing pricing, when applicable. For transactions where there are multiple performance obligations, individual products and services are accounted for separately if they are distinct (if a product or service is separately identifiable from other items and if a customer can benefit from it on its own or with other resources that are readily available to the customer). The consideration, including any discounts, is allocated between separate products and services based on their stand-alone selling prices. Stand-alone selling prices are determined based on the prices at which the separate products and services are sold and are allocated based on each item’s relative value to the total value of the products and services in the arrangement. For items that are not sold separately, we estimate stand-alone selling prices primarily using the “expected cost plus a margin” approach. Payment terms are generally 30 days in the U.S. and typically longer in many geographic markets outside the U.S. Shipping fees are recorded as revenue and the related cost is included in cost of sales. Sales, value-added and other taxes collected concurrently with revenue-producing activities are excluded from revenue. Costs of obtaining a contract, if material, are capitalized and amortized over the period that the related revenue is recognized if greater than one year. We have elected to account for shipping fees as a cost of fulfilling the related contract. We have also elected to apply the practical expedient related to the incremental costs of obtaining contracts and recognize those costs as an expense when incurred if the amortization period of the assets is one year or less. These costs are included in selling, general and administrative expenses. Capitalized costs with an amortization period greater than one year were immaterial.
Revenue is generated by two reportable segments: Network Solutions and Services & Support.
Network Solutions Segment - Includes hardware products and software defined next-generation virtualized solutions used in service provider or business networks, as well as prior generation products. The majority of the revenue from this segment is from hardware revenue.
Hardware and Software Revenue
Revenue from hardware sales is recognized when control is transferred to the customer, which is generally when the products are shipped. Shipping terms are generally FOB shipping point. Revenue from software license sales are recognized at delivery and transfer of control to the customer. Revenue is recorded net of estimated discounts and rebates using historical trends. Customers are typically invoiced when control is transferred and revenue is recognized. Our products generally include assurance-based warranties of
64
Services & Support Segment - A complete portfolio of maintenance, network implementation and solutions integration and managed services, which include hosted cloud services and subscription services to complement our Network Solutions segment.
Maintenance Revenue
Our maintenance service periods range from
Network Implementation Revenue
We recognize revenue for network implementation, which primarily consists of engineering, execution and enablement services at a point in time when each performance obligation is complete. If we have recognized revenue but have not billed the customer, the right to consideration is recognized as a contract asset that is included in other receivables on the Consolidated Balance Sheet. The contract asset is transferred to accounts receivable when the completed performance obligation is invoiced to the customer.
See Notes 4 and 16 for additional information on reportable segments.
Unearned Revenue
Unearned revenue primarily represents customer billings on maintenance service programs and unearned revenues related to multiple element contracts where we still have contractual obligations to our customers. We currently offer maintenance contracts ranging from
Earnings (Loss) per Share
Earnings (loss) per common share and earnings (loss) per common share assuming dilution, are based on the weighted average number of common shares and, when dilutive, common equivalent shares outstanding during the year. See Note 19 for additional information.
Business Combinations
The Company records assets acquired, liabilities assumed, contractual contingencies, when applicable, and intangible assets recognized as part of business combinations based on their fair values on the date of acquisition. The excess of the purchase price over the estimated fair values of the net tangible and intangible assets and liabilities assumed or acquired is recorded as goodwill. If the estimated fair values of net tangible and intangible assets acquired and liabilities assumed exceed the purchase price, a bargain purchase gain is recorded. The Company’s estimates of fair value are based on historical experience, industry knowledge, certain information obtained from the management of the acquired company and, in some cases, valuations performed by independent third-party firms. The results of operations of acquired companies are included in the accompanying Consolidated Statements of Income (Loss) since their dates of acquisition. Costs incurred to complete the business combination, such as legal, accounting or other professional fees are charged to selling, general and administrative expenses as incurred.
65
Recently Adopted Accounting Pronouncements
In August 2018, the Financial Accounting Standards Board (“FASB”) issued Accounting Standards Update (“ASU”) 2018-14, Compensation – Retirement Benefits – Defined Benefit Plans – General (Subtopic 715-20): Disclosure Framework – Changes to the Disclosure Requirements for Defined Benefit Plans, which makes changes to and clarifies the disclosure requirements related to defined benefit pension and other postretirement plans. ASU 2018-14 requires additional disclosures related to the reasons for significant gains and losses affecting the benefit obligation and an explanation of any other significant changes in the benefit obligation or plan assets that are not otherwise apparent in other disclosures required by ASC 715. ASU 2018-14 also clarifies the guidance in ASC 715 to require disclosure of the projected benefit obligation (“PBO”) and fair value of plan assets for pension plans with PBOs in excess of plan assets and the accumulated benefit obligation (“ABO”) and fair value of plan assets for pension plans with ABOs in excess of plan assets. ASU 2018-14 was effective for public business entities for fiscal years ending after December 15, 2020. The adoption of this standard did not have a material effect on the disclosures in the consolidation financial statements. See Note 15 for additional information.
In August 2018, the FASB issued ASU 2018-13, Fair Value Measurement (Topic 820): Disclosure Framework – Changes to the Disclosure Requirements for Fair Value Measurement, which changes the fair value measurement disclosure requirements of ASC 820, Fair Value Measurement. The amendments in this ASU are the result of a broader disclosure project, Concepts Statement No. 8 — Conceptual Framework for Financial Reporting — Chapter 8 — Notes to Financial Statements, which the FASB finalized on August 28, 2018. The FASB used the guidance in the Concepts Statement to improve the effectiveness of ASC 820’s disclosure requirements. ASU 2018-13 provides users of financial statements with information about assets and liabilities measured at fair value in the statement of financial position or disclosed in the notes to the financial statements. More specifically, ASU 2018-13 requires disclosures about the valuation techniques and inputs that are used to arrive at measures of fair value, including judgments and assumptions that are made in determining fair value. In addition, ASU 2018-13 requires disclosures regarding the uncertainty in the fair value measurements as of the reporting date and how changes in fair value measurements affect performance and cash flows. The Company adopted ASU 2018-13 on
In August 2018, the FASB issued ASU 2018-15, Intangibles – Goodwill and Other – Internal-Use Software (Subtopic 350-40): Customer’s Accounting for Implementation Costs Incurred in a Cloud Computing Arrangement That Is a Service Contract. ASU 2018-15 clarifies certain aspects of ASU 2015-05, Customer’s Accounting for Fees Paid in a Cloud Computing Arrangement. Specifically, ASU 2018-15 aligns the requirements for capitalizing implementation costs incurred in a hosting arrangement that is a service contract with the requirements for capitalizing implementations costs incurred to develop or obtain internal use software. The Company adopted ASU 2018-15 on
The following table illustrates the impact of adoption of ASU 2018-15 on the Consolidated Balance Sheet as of December 31, 2019:
|
|
|
As of December 31, 2019 |
|
|||||||||
|
(In thousands) |
|
Pre-Adoption |
|
|
Effect of Adoption |
|
|
As Presented Now |
|
|||
|
Consolidated Balance Sheet |
|
|
|
|
|
|
|
|
|
|
|
|
|
Property, plant and equipment, net |
|
$ |
|
|
|
$ |
( |
) |
|
$ |
|
|
|
Other non-current assets |
|
$ |
|
|
|
$ |
|
|
|
$ |
|
|
There was no impact upon adoption of ASU 2018-15 on the Consolidated Statement of Income (Loss) for the year ended December 31, 2019 and the Consolidated Statement of Cash Flows for the year ended December 31, 2019 as outlined in the following tables:
|
|
|
For the year ended December 31, 2019 |
|
|||||||||
|
(In thousands) |
|
Pre-Adoption |
|
|
Effect of Adoption |
|
|
As Presented Now |
|
|||
|
Consolidated Statement of Income (Loss) |
|
|
|
|
|
|
|
|
|
|
|
|
|
Net income (loss) |
|
$ |
( |
) |
|
$ |
— |
|
|
$ |
( |
) |
|
Consolidated Statement of Cash Flows |
|
|
|
|
|
|
|
|
|
|
|
|
|
Net cash provided by (used in) operating activities |
|
$ |
( |
) |
|
$ |
— |
|
|
$ |
( |
) |
66
The following table presents the capitalized implementation costs incurred with hosting arrangements, included in other non-current assets on the Consolidated Balance Sheet, as of December 31, 2020:
|
(In thousands) |
|
December 31, 2020 |
|
|
|
Implementation costs - hosting arrangements |
|
$ |
|
|
|
Less: accumulated amortization |
|
|
— |
|
|
Implementation costs - hosting arrangements, net |
|
$ |
|
|
In December 2019, the FASB issued ASU 2019-12, Income Taxes (Topic 740): Simplifying the Accounting for Income Taxes, which simplifies the accounting for income taxes by removing various exceptions, such as the exception to the incremental approach for intra-period tax allocation when there is a loss from continuing operations and income or a gain from other items. The amendments in this update also simplify the accounting for income taxes related to income-based franchise taxes and require that an entity reflect enacted tax laws or rates in the annual effective tax rate computation in the interim period that includes the enactment date. The Company early adopted ASU 2019-12 on
In June 2016, the FASB issued ASU 2016-13, Financial Instruments – Credit Losses (Topic 326): Measurement of Credit Losses on Financial Instruments. ASU 2016-13 requires the measurement and recognition of expected credit losses for financial instruments held at amortized cost. In November 2018, the FASB issued ASU 2018-19, Codification Improvements to Topic 326 Financial Instruments – Credit Losses, which clarifies that receivables arising from operating leases are not within the scope of the credit losses standard, but rather should be accounted for in accordance with the standard for leases. In April 2019, the FASB issued ASU 2019-04, Codification Improvements to Topic 326, Financial Instruments–Credit Losses, Topic 815, Derivatives and Hedging, and Topic 825, Financial Instruments, which clarifies the accounting for transfers between classifications of debt securities and clarifies that entities should include expected recoveries on financial assets in the calculation of the current expected credit loss allowance. In addition, renewal options that are not unconditionally cancelable should be considered in the determination of expected credit losses. In May 2019, the FASB issued ASU 2019-05, Financial Instruments – Credit Losses (Topic 326): Targeted Transition Relief, which amends ASU 2016-13 to allow companies, upon adoption, to elect the fair value option on financial instruments that were previously recorded at amortized cost if they meet certain criteria. In November 2019, the FASB issued ASU 2019-11, Codification Improvements to Topic 326, Financial Instruments – Credit Losses, which makes various narrow-scope amendments to the new credit losses standard, such as providing disclosure relief for accrued interest receivables. In March 2020, the FASB issued ASU 2020-03, Codification Improvements to financial instruments, which clarifies various issues related to the new credit losses standard, such as the contractual term used to measure expected credit losses for leases and when to record an allowance for credit losses for financial assets that fall under the scope of ASC 860-20, Transfers and Servicing – Sales of Financial Assets. All of these ASUs were codified as part of Accounting Standards Codifications (“ASC”) Topic 326 and were effective for fiscal years, and interim periods within those fiscal years, beginning after December 15, 2019. The Company adopted this standard on
In January 2017, the FASB issued ASU 2017-04, Intangibles – Goodwill and Other (Topic 350): Simplifying the Test for Goodwill Impairment. ASU 2017-04 simplifies the measurement of goodwill by eliminating step 2 of the goodwill impairment test. Under ASU 2017-04, entities are required to compare the fair value of a reporting unit to its carrying amount and recognize an impairment charge for the amount by which the carrying amount exceeds the reporting unit’s fair value. ASU 2017-04 was effective for annual or interim impairment tests performed in fiscal years beginning after December 15, 2019.
67
The Company adopted ASU 2017-04 on
Note 2 – Cash, Cash Equivalents and Restricted Cash
The following table provides a reconciliation of cash, cash equivalents and restricted cash reported within the Consolidated Balance Sheet that sum to the total of the same such amounts shown in the Consolidated Statement of Cash Flows:
|
(In thousands) |
|
December 31, 2020 |
|
|
|
Cash and cash equivalents |
|
$ |
|
|
|
Restricted cash |
|
|
|
|
|
Cash, cash equivalents and restricted cash |
|
$ |
|
|
The Company did
Note 3 – Business Combinations
In
Contingent liabilities with a fair value totaling $
An escrow in the amount of $
The Consolidated Statement of Income for the year ended December 31, 2018 includes the following revenue and net loss attributable to SmartRG and Sumitomo since the date of acquisition:
|
(In thousands) |
|
March 19, 2018 to December 31, 2018 |
|
|
|
Revenue |
|
$ |
|
|
|
Net loss |
|
$ |
( |
) |
The following unaudited supplemental pro forma information presents the financial results as if the acquisition of SmartRG and Sumitomo had occurred on January 1, 2017. This unaudited supplemental pro forma information does not purport to be indicative of what would have occurred had the acquisition been completed on January 1, 2018, nor is it indicative of any future results. There were no material, non-recurring adjustments to this unaudited pro forma information.
|
(In thousands) |
|
2018 |
|
|
|
Pro forma revenue |
|
$ |
|
|
|
Pro forma net loss |
|
$ |
( |
) |
For the years ended December 31, 2020, 2019 and 2018, we incurred acquisition and integration related expenses and amortization of acquired intangibles of $
68
Note 4 - Revenue
The following is a description of the principal activities from which revenue is generated by reportable segment:
Network Solutions - Includes hardware products and software-defined next-generation virtualized solutions used in service provider or business networks, as well as prior generation products.
Services & Support - Includes maintenance, network implementation, solutions integration and managed services, which include hosted cloud services and subscription services.
Revenue by Category
In addition to reportable segments, revenue is also reported for the following
The following table disaggregates revenue by reportable segment and revenue category for the year ended December 31, 2020:
|
(In thousands) |
|
Network Solutions |
|
|
Services & Support |
|
|
Total |
|
|||
|
Access & Aggregation |
|
$ |
|
|
|
$ |
|
|
|
$ |
|
|
|
Subscriber Solutions & Experience |
|
|
|
|
|
|
|
|
|
|
|
|
|
Traditional & Other Products |
|
|
|
|
|
|
|
|
|
|
|
|
|
Total |
|
$ |
|
|
|
$ |
|
|
|
$ |
|
|
The following table disaggregates revenue by reportable segment and revenue category for the year ended December 31, 2019:
|
(In thousands) |
|
Network Solutions |
|
|
Services & Support |
|
|
Total |
|
|||
|
Access & Aggregation |
|
$ |
|
|
|
$ |
|
|
|
$ |
|
|
|
Subscriber Solutions & Experience |
|
|
|
|
|
|
|
|
|
|
|
|
|
Traditional & Other Products |
|
|
|
|
|
|
|
|
|
|
|
|
|
Total |
|
$ |
|
|
|
$ |
|
|
|
$ |
|
|
The following table disaggregates revenue by reportable segment and revenue category for the year ended December 31, 2018:
|
(In thousands) |
|
Network Solutions |
|
|
Services & Support |
|
|
Total |
|
|||
|
Access & Aggregation |
|
$ |
|
|
|
$ |
|
|
|
$ |
|
|
|
Subscriber Solutions & Experience |
|
|
|
|
|
|
|
|
|
|
|
|
|
Traditional & Other Products |
|
|
|
|
|
|
|
|
|
|
|
|
|
Total |
|
$ |
|
|
|
$ |
|
|
|
$ |
|
|
Revenue allocated to remaining performance obligations represents contract revenues that have not yet been recognized for contracts with a duration greater than one year. As of December 31, 2020, we did
69
The following table provides information about accounts receivable, contract assets and unearned revenue from contracts with customers:
|
(In thousands) |
|
December 31, 2020 |
|
|
December 31, 2019 |
|
||
|
Accounts receivable |
|
$ |
|
|
|
$ |
|
|
|
Contract assets(1) |
|
$ |
|
|
|
$ |
|
|
|
Unearned revenue |
|
$ |
|
|
|
$ |
|
|
|
Non-current unearned revenue |
|
$ |
|
|
|
$ |
|
|
(1) Included in other receivables on the Consolidated Balance Sheets.
Of the outstanding unearned revenue balance as of December 31, 2019 and December 31, 2018, $
Note 5 – Stock-Based Compensation
The following table summarizes stock-based compensation expense related to stock options, PSUs, RSUs and restricted stock for the years ended December 31, 2020, 2019 and 2018:
|
(In thousands) |
|
2020 |
|
|
2019 |
|
|
2018 |
|
|||
|
Stock-based compensation expense included in cost of sales |
|
$ |
|
|
|
$ |
|
|
|
$ |
|
|
|
Selling, general and administrative expenses |
|
|
|
|
|
|
|
|
|
|
|
|
|
Research and development expenses |
|
|
|
|
|
|
|
|
|
|
|
|
|
Stock-based compensation expense included in operating expenses |
|
|
|
|
|
|
|
|
|
|
|
|
|
Total stock-based compensation expense |
|
|
|
|
|
|
|
|
|
|
|
|
|
Tax benefit for expense associated with non-qualified stock options, PSUs, RSUs and restricted stock |
|
|
( |
) |
|
|
( |
) |
|
|
( |
) |
|
Total stock-based compensation expense, net of tax |
|
$ |
|
|
|
$ |
|
|
|
$ |
|
|
Stock Incentive Program Descriptions
2020 Stock Incentive Plans
At the annual meeting of stockholders held on May 13, 2020, the Company’s stockholders approved, upon recommendation of the Board of Directors, the adoption of the ADTRAN, Inc. 2020 Employee Stock Incentive Plan (the “2020 Employee Plan”) as well as the ADTRAN, Inc. 2020 Directors Stock Plan (the “2020 Directors Plan”).
Under the 2020 Employee Plan, the Company is authorized to issue
70
Under the 2020 Directors Plan, the Company is authorized to issue
Previous Stock Incentive Plans
In January 2015, the Board of Directors adopted the 2015 Employee Plan, which authorized
In January 2006, the Board of Directors adopted the ADTRAN, Inc. 2006 Employee Stock Incentive Plan (the “2006 Plan”), which authorized
In May 2010, the Company’s stockholders approved the 2010 Directors Plan, under which
PSUs, RSUs and restricted stock
The following table is a summary of our PSUs, RSUs and restricted stock outstanding as of December 31, 2019 and 2020 and the changes that occurred during 2020:
|
|
|
Number of shares (In thousands) |
|
|
Weighted Average Grant Date Fair Value |
|
||
|
Unvested PSUs, RSUs and restricted stock outstanding, December 31, 2019 |
|
|
|
|
|
$ |
|
|
|
PSUs, RSUs and restricted stock granted |
|
|
|
|
|
$ |
|
|
|
PSUs, RSUs and restricted stock vested |
|
|
( |
) |
|
$ |
|
|
|
PSUs, RSUs and restricted stock forfeited |
|
|
( |
) |
|
$ |
|
|
|
Unvested PSUs, RSUs and restricted stock outstanding, December 31, 2020 |
|
|
|
|
|
$ |
|
|
The following table details the significant assumptions that impact the fair value estimate of the market-based PSUs:
|
|
|
2020 |
|
|
2019 |
|
2018 |
|
||
|
Estimated fair value per share |
|
|
$ |
|
|
$9.53 to $18.05 |
|
|
$ |
|
|
Expected volatility |
|
|
|
|
|
32.7% to 38.9% |
|
27.98% to 31.58% |
|
|
|
Risk-free interest rate |
|
|
|
|
|
1.6% to 2.46% |
|
2.11% to 2.99% |
|
|
|
Expected dividend yield |
|
|
|
|
|
2.3% to 4.09% |
|
1.83% to 2.49% |
|
|
71
For market-based PSUs, the number of shares of common stock earned by a recipient is subject to a market condition based on ADTRAN’s relative total shareholder return against all companies in the NASDAQ Telecommunications Index at the end of a performance period. Depending on the relative total shareholder return over the performance period, the recipient may earn from
During the first quarter of 2020, the Company issued
The fair value of RSUs and restricted stock is equal to the closing price of our stock on the grant date. RSUs and restricted stock vest ratably over and periods, respectively.
We will continue to assess the assumptions and methodologies used to calculate the estimated fair value of stock-based compensation. If circumstances change, and additional data becomes available over time, we may change our assumptions and methodologies, which may materially impact our fair value determination.
As of December 31, 2020, total unrecognized compensation expense related to the non-vested portion of market-based PSUs, RSUs and restricted stock was approximately $
As of December 31, 2020,
Stock Options
The following table is a summary of stock options outstanding as of December 31, 2020 and 2019 and the changes that occurred during 2020:
|
|
|
Number of Options (In thousands) |
|
|
Weighted Average Exercise Price (Per share) |
|
|
Weighted Avg. Remaining Contractual Life in Years |
|
|
Aggregate Intrinsic Value (In thousands) |
|
||||
|
Stock options outstanding, December 31, 2019 |
|
|
|
|
|
$ |
|
|
|
|
|
|
|
$ |
— |
|
|
Stock options granted |
|
|
— |
|
|
$ |
— |
|
|
|
|
|
|
|
|
|
|
Stock options exercised |
|
|
— |
|
|
$ |
— |
|
|
|
|
|
|
|
|
|
|
Stock options forfeited |
|
|
— |
|
|
$ |
— |
|
|
|
|
|
|
|
|
|
|
Stock options expired |
|
|
( |
) |
|
$ |
|
|
|
|
|
|
|
|
|
|
|
Stock options outstanding, December 31, 2020 |
|
|
|
|
|
$ |
|
|
|
|
|
|
|
$ |
— |
|
|
Stock options exercisable, December 31, 2020 |
|
|
|
|
|
$ |
|
|
|
|
|
|
|
$ |
— |
|
All of these stock options were issued at exercise prices that approximated fair market value at the date of grant. As of December 31, 2020, there was
The aggregate intrinsic values represent the total pre-tax intrinsic value (the difference between ADTRAN’s closing stock price on the last trading day of 2020 and the exercise price, multiplied by the number of in-the-money options) that would have been received by the option holders had all option holders exercised their options on December 31, 2020. The amount of aggregate intrinsic value will change based on the fair market value of ADTRAN’s stock and was $
72
The total pre-tax intrinsic value of options exercised during 2020, 2019 and 2018 was $
The following table further describes our stock options outstanding as of December 31, 2020:
|
|
|
Options Outstanding |
|
|
Options Exercisable |
|
||||||||||||||
|
Range of Exercise Prices |
|
Options Outstanding at December 31, 2020 (In thousands) |
|
|
Weighted Avg. Remaining Contractual Life in Years |
|
|
Weighted Average Exercise Price |
|
|
Options Exercisable at December 31, 2020 (In thousands) |
|
|
Weighted Average Exercise Price |
|
|||||
|
|
|
|
|
|
|
|
|
|
|
$ |
|
|
|
|
|
|
|
$ |
|
|
|
|
|
|
|
|
|
|
|
|
|
$ |
|
|
|
|
|
|
|
$ |
|
|
|
|
|
|
|
|
|
|
|
|
|
$ |
|
|
|
|
|
|
|
$ |
|
|
|
|
|
|
|
|
|
|
|
|
|
$ |
|
|
|
|
|
|
|
$ |
|
|
|
|
|
|
|
|
|
|
|
|
|
|
|
|
|
|
|
|
|
|
|
|
The Black-Scholes option pricing model (the “Black-Scholes Model”) is used to determine the estimated fair value of stock option awards on the date of grant. The Black-Scholes Model requires the input of certain assumptions that involve judgment. Because our stock options have characteristics significantly different from those of traded options, and because changes in the input assumptions can materially affect the fair value estimate, existing models may not provide reliable measures of fair value of our stock options. The stock option pricing model requires the use of several assumptions that impact the fair value estimate. These variables include, but are not limited to, the volatility of our stock price and employee exercise behaviors.
There were
Note 6 – Investments
Debt Securities and Other Investments
As of December 31, 2020, the following debt securities and other investments were included in short-term investments and long-term investments on the Consolidated Balance Sheet and recorded at fair value:
|
|
|
Amortized |
|
|
Gross Unrealized |
|
|
Fair |
|
|||||||
|
(In thousands) |
|
Cost |
|
|
Gains |
|
|
Losses |
|
|
Value |
|
||||
|
Corporate bonds |
|
$ |
|
|
|
$ |
|
|
|
$ |
— |
|
|
$ |
|
|
|
Municipal fixed-rate bonds |
|
|
|
|
|
|
|
|
|
|
— |
|
|
|
|
|
|
Asset-backed bonds |
|
|
|
|
|
|
|
|
|
|
— |
|
|
|
|
|
|
Mortgage/Agency-backed bonds |
|
|
|
|
|
|
|
|
|
|
( |
) |
|
|
|
|
|
U.S. government bonds |
|
|
|
|
|
|
|
|
|
|
— |
|
|
|
|
|
|
Foreign government bonds |
|
|
|
|
|
|
|
|
|
|
( |
) |
|
|
|
|
|
Commercial Paper |
|
|
|
|
|
|
— |
|
|
|
— |
|
|
|
|
|
|
Other |
|
|
|
|
|
|
— |
|
|
|
— |
|
|
|
|
|
|
Available-for-sale debt securities held at fair value |
|
$ |
|
|
|
$ |
|
|
|
$ |
( |
) |
|
$ |
|
|
As of December 31, 2019, the following debt securities and other investments were included in short-term investments and long-term investments on the Consolidated Balance Sheet and recorded at fair value:
|
|
|
Amortized |
|
|
Gross Unrealized |
|
|
Fair |
|
|||||||
|
(In thousands) |
|
Cost |
|
|
Gains |
|
|
Losses |
|
|
Value |
|
||||
|
Corporate bonds |
|
$ |
|
|
|
$ |
|
|
|
$ |
— |
|
|
$ |
|
|
|
Municipal fixed-rate bonds |
|
|
|
|
|
|
— |
|
|
|
— |
|
|
|
|
|
|
Asset-backed bonds |
|
|
|
|
|
|
|
|
|
|
( |
) |
|
|
|
|
|
Mortgage/Agency-backed bonds |
|
|
|
|
|
|
|
|
|
|
( |
) |
|
|
|
|
|
U.S. government bonds |
|
|
|
|
|
|
|
|
|
|
( |
) |
|
|
|
|
|
Foreign government bonds |
|
|
|
|
|
|
— |
|
|
|
( |
) |
|
|
|
|
|
Variable rate demand notes |
|
|
|
|
|
|
— |
|
|
|
— |
|
|
|
|
|
|
Available-for-sale debt securities held at fair value |
|
$ |
|
|
|
$ |
|
|
|
$ |
( |
) |
|
$ |
|
|
73
As of December 31, 2020, our debt securities had the following contractual maturities:
|
(In thousands) |
|
Corporate bonds |
|
|
Municipal fixed-rate bonds |
|
|
Asset-backed bonds |
|
|
Mortgage / Agency-backed bonds |
|
|
U.S. government bonds |
|
|
Foreign government bonds |
|
|
Commercial paper |
|
|
Other |
|
||||||||
|
Less than one year |
|
$ |
|
|
|
$ |
|
|
|
$ |
|
|
|
$ |
|
|
|
$ |
— |
|
|
$ |
|
|
|
$ |
|
|
|
$ |
|
|
|
One to two years |
|
|
|
|
|
|
|
|
|
|
|
|
|
|
|
|
|
|
|
|
|
|
|
|
|
|
— |
|
|
|
— |
|
|
Two to three years |
|
|
|
|
|
|
|
|
|
|
|
|
|
|
|
|
|
|
|
|
|
|
|
|
|
|
— |
|
|
|
— |
|
|
Three to five years |
|
|
|
|
|
|
|
|
|
|
|
|
|
|
|
|
|
|
|
|
|
|
|
|
|
|
— |
|
|
|
— |
|
|
Five to ten years |
|
|
— |
|
|
|
— |
|
|
|
|
|
|
|
|
|
|
|
— |
|
|
|
— |
|
|
|
— |
|
|
|
— |
|
|
More than ten years |
|
|
— |
|
|
|
— |
|
|
|
|
|
|
|
|
|
|
|
— |
|
|
|
— |
|
|
|
— |
|
|
|
— |
|
|
Total |
|
$ |
|
|
|
$ |
|
|
|
$ |
|
|
|
$ |
|
|
|
$ |
|
|
|
$ |
|
|
|
$ |
|
|
|
$ |
|
|
Actual maturities may differ from contractual maturities as some borrowers have the right to call or prepay obligations with or without call or prepayment penalties.
Realized gains and losses on sales of securities are computed under the specific identification method.
|
|
|
For the year ended December 31, |
|
|||||||||
|
(In thousands) |
|
2020 |
|
|
2019 |
|
|
2018 |
|
|||
|
Gross realized gains on debt securities |
|
$ |
|
|
|
$ |
|
|
|
$ |
|
|
|
Gross realized losses on debt securities |
|
|
( |
) |
|
|
( |
) |
|
|
( |
) |
|
Total gain (loss) recognized, net |
|
$ |
|
|
|
$ |
|
|
|
$ |
( |
) |
The Company’s investment policy provides limitations for issuer concentration, which limits, at the time of purchase, the concentration in any one issuer to
The following table presents the breakdown of debt securities and other investments with unrealized losses as of December 31, 2020:
|
|
|
Continuous Unrealized Loss Position for Less than 12 Months |
|
|
Continuous Unrealized Loss Position for 12 Months or Greater |
|
|
Total |
|
|||||||||||||||
|
(In thousands) |
|
Fair Value |
|
|
Unrealized Losses |
|
|
Fair Value |
|
|
Unrealized Losses |
|
|
Fair Value |
|
|
Unrealized Losses |
|
||||||
|
Corporate bonds |
|
$ |
|
|
|
$ |
— |
|
|
$ |
— |
|
|
$ |
— |
|
|
$ |
|
|
|
$ |
— |
|
|
Municipal fixed-rate bonds |
|
|
|
|
|
|
— |
|
|
|
— |
|
|
|
— |
|
|
|
|
|
|
|
— |
|
|
Asset-backed bonds |
|
|
|
|
|
|
— |
|
|
|
— |
|
|
|
— |
|
|
|
|
|
|
|
— |
|
|
Mortgage/Agency-backed bonds |
|
|
|
|
|
|
( |
) |
|
|
— |
|
|
|
— |
|
|
|
|
|
|
|
( |
) |
|
U.S. government bonds |
|
|
|
|
|
|
— |
|
|
|
— |
|
|
|
— |
|
|
|
|
|
|
|
— |
|
|
Foreign government bonds |
|
|
|
|
|
|
( |
) |
|
|
— |
|
|
|
— |
|
|
|
|
|
|
|
( |
) |
|
Total |
|
$ |
|
|
|
$ |
( |
) |
|
$ |
— |
|
|
$ |
— |
|
|
$ |
|
|
|
$ |
( |
) |
74
The following table presents the breakdown of debt securities and other investments with unrealized losses as of December 31, 2019:
|
|
|
Continuous Unrealized Loss Position for Less than 12 Months |
|
|
Continuous Unrealized Loss Position for 12 Months or Greater |
|
|
Total |
|
|||||||||||||||
|
(In thousands) |
|
Fair Value |
|
|
Unrealized Losses |
|
|
Fair Value |
|
|
Unrealized Losses |
|
|
Fair Value |
|
|
Unrealized Losses |
|
||||||
|
Corporate bonds |
|
$ |
|
|
|
$ |
— |
|
|
$ |
— |
|
|
$ |
— |
|
|
$ |
|
|
|
$ |
— |
|
|
Municipal fixed-rate bonds |
|
|
|
|
|
|
— |
|
|
|
— |
|
|
|
— |
|
|
|
|
|
|
|
— |
|
|
Asset-backed bonds |
|
|
|
|
|
|
( |
) |
|
|
— |
|
|
|
— |
|
|
|
|
|
|
|
( |
) |
|
Mortgage/Agency-backed bonds |
|
|
|
|
|
|
( |
) |
|
|
|
|
|
|
( |
) |
|
|
|
|
|
|
( |
) |
|
U.S. government bonds |
|
|
|
|
|
|
( |
) |
|
|
— |
|
|
|
— |
|
|
|
|
|
|
|
( |
) |
|
Foreign government bonds |
|
|
|
|
|
|
( |
) |
|
|
— |
|
|
|
— |
|
|
|
|
|
|
|
( |
) |
|
Total |
|
$ |
|
|
|
$ |
( |
) |
|
$ |
|
|
|
$ |
( |
) |
|
$ |
|
|
|
$ |
( |
) |
The decrease in unrealized losses during 2020 resulted from changes in market positions associated with our fixed income portfolio.
Marketable Equity Securities
Marketable equity securities consist of publicly traded stock, funds and certain other investments measured at fair value or cost, where appropriate.
During the three months ended March 31, 2019, an outstanding note receivable of $
Realized and unrealized gains and losses for our marketable equity securities for the year ended December 31, 2020, 2019 and 2018 were as follows:
|
|
|
For the year ended December 31, |
|
|||||||||
|
(In thousands) |
|
2020 |
|
|
2019 |
|
|
2018 |
|
|||
|
Realized losses on equity securities sold |
|
$ |
( |
) |
|
$ |
( |
) |
|
$ |
|
|
|
Unrealized gains on equity securities held |
|
|
|
|
|
|
|
|
|
|
( |
) |
|
Total gain (loss) recognized, net |
|
$ |
|
|
|
$ |
|
|
|
$ |
( |
) |
As of December 31, 2020 and 2019, gross unrealized losses related to individual investments in a continuous loss position for twelve months or longer were not material.
U.S. GAAP establishes a three-level valuation hierarchy based upon observable and unobservable inputs for fair value measurement of financial instruments:
• Level 1 – Observable outputs; values based on unadjusted quoted prices for identical assets or liabilities in an active market;
• Level 2 – Significant inputs that are observable; values based on quoted prices in markets that are not active or model inputs that are observable either directly or indirectly;
• Level 3 – Significant unobservable inputs; values based on prices or valuation techniques that require inputs that are both unobservable and significant to the overall fair value measurement; inputs could include information supplied by investees.
75
The Company’s cash equivalents and investments held at fair value are categorized into this hierarchy as follows:
|
|
|
Fair Value Measurements as of December 31, 2020 Using |
|
|||||||||||||
|
(In thousands) |
|
Fair Value |
|
|
Quoted Prices in Active Market for Identical Assets (Level 1) |
|
|
Significant Other Observable Inputs (Level 2) |
|
|
Significant Unobservable Inputs (Level 3) |
|
||||
|
Cash equivalents |
|
|
|
|
|
|
|
|
|
|
|
|
|
|
|
|
|
Money market funds |
|
$ |
|
|
|
$ |
|
|
|
$ |
— |
|
|
$ |
— |
|
|
U.S. government bonds |
|
|
|
|
|
|
|
|
|
|
— |
|
|
|
— |
|
|
Available-for-sale debt securities |
|
|
|
|
|
|
|
|
|
|
|
|
|
|
|
|
|
Corporate bonds |
|
|
|
|
|
|
— |
|
|
|
|
|
|
|
— |
|
|
Municipal fixed-rate bonds |
|
|
|
|
|
|
— |
|
|
|
|
|
|
|
— |
|
|
Asset-backed bonds |
|
|
|
|
|
|
— |
|
|
|
|
|
|
|
— |
|
|
Mortgage/Agency-backed bonds |
|
|
|
|
|
|
— |
|
|
|
|
|
|
|
— |
|
|
U.S. government bonds |
|
|
|
|
|
|
|
|
|
|
— |
|
|
|
— |
|
|
Foreign government bonds |
|
|
|
|
|
|
— |
|
|
|
|
|
|
|
— |
|
|
Commercial paper |
|
|
|
|
|
|
— |
|
|
|
|
|
|
|
— |
|
|
Other investments |
|
|
|
|
|
|
— |
|
|
|
— |
|
|
|
|
|
|
Marketable equity securities |
|
|
|
|
|
|
|
|
|
|
|
|
|
|
|
|
|
Marketable equity securities – various industries |
|
|
|
|
|
|
|
|
|
|
— |
|
|
|
— |
|
|
Deferred compensation plan assets |
|
|
|
|
|
|
|
|
|
|
— |
|
|
|
— |
|
|
Other investments |
|
|
|
|
|
|
|
|
|
|
— |
|
|
|
— |
|
|
Total |
|
$ |
|
|
|
$ |
|
|
|
$ |
|
|
|
$ |
|
|
|
|
|
Fair Value Measurements as of December 31, 2019 Using |
|
|||||||||||||
|
(In thousands) |
|
Fair Value |
|
|
Quoted Prices in Active Market for Identical Assets (Level 1) |
|
|
Significant Other Observable Inputs (Level 2) |
|
|
Significant Unobservable Inputs (Level 3) |
|
||||
|
Cash equivalents |
|
|
|
|
|
|
|
|
|
|
|
|
|
|
|
|
|
Money market funds |
|
$ |
|
|
|
$ |
|
|
|
$ |
— |
|
|
$ |
— |
|
|
Available-for-sale debt securities |
|
|
|
|
|
|
|
|
|
|
|
|
|
|
|
|
|
Corporate bonds |
|
|
|
|
|
|
— |
|
|
|
|
|
|
|
— |
|
|
Municipal fixed-rate bonds |
|
|
|
|
|
|
— |
|
|
|
|
|
|
|
— |
|
|
Asset-backed bonds |
|
|
|
|
|
|
— |
|
|
|
|
|
|
|
— |
|
|
Mortgage/Agency-backed bonds |
|
|
|
|
|
|
— |
|
|
|
|
|
|
|
— |
|
|
U.S. government bonds |
|
|
|
|
|
|
|
|
|
|
— |
|
|
|
— |
|
|
Foreign government bonds |
|
|
|
|
|
|
— |
|
|
|
|
|
|
|
— |
|
|
Variable rate demand notes |
|
|
|
|
|
|
— |
|
|
|
|
|
|
|
— |
|
|
Marketable equity securities |
|
|
|
|
|
|
|
|
|
|
|
|
|
|
|
|
|
Marketable equity securities – various industries |
|
|
|
|
|
|
|
|
|
|
— |
|
|
|
— |
|
|
Equity in escrow |
|
|
|
|
|
|
|
|
|
|
— |
|
|
|
— |
|
|
Deferred compensation plan assets |
|
|
|
|
|
|
|
|
|
|
— |
|
|
|
— |
|
|
Other investments |
|
|
|
|
|
|
|
|
|
|
— |
|
|
|
— |
|
|
Total |
|
$ |
|
|
|
$ |
|
|
|
$ |
|
|
|
$ |
— |
|
76
The fair value of our Level 2 securities is calculated using a weighted average market price for each security. Market prices are obtained from a variety of industry standard data providers, large financial institutions and other third-party sources. These multiple market prices are used as inputs into a distribution-curve-based algorithm to determine the daily market value of each security.
The fair value of Level 3 securities is calculated based on unobservable inputs. Quantitative information with respect to unobservable inputs consisted of third-party valuations performed in accordance with ASC 820 – Fair Value Measurement. Inputs used in preparing the third-party valuation included the following assumptions, among others: estimated discount rates and fair market yields.
Our variable rate demand notes have a structure that implies a standard expected market price. The frequent interest rate resets make it reasonable to expect the price to stay at par. These securities are priced at the expected market price.
Note 7 – Inventory
As of December 31, 2020 and 2019, inventory, net was comprised of the following:
|
(In thousands) |
|
2020 |
|
|
2019 |
|
||
|
Raw materials |
|
$ |
|
|
|
$ |
|
|
|
Work in process |
|
|
|
|
|
|
|
|
|
Finished goods |
|
|
|
|
|
|
|
|
|
Total Inventory, net |
|
$ |
|
|
|
$ |
|
|
Inventory reserves are established for estimated excess and obsolete inventory equal to the difference between the cost of the inventory and the estimated net realizable value of the inventory based on estimated reserve percentages, which consider historical usage, known trends, inventory age and market conditions. As of December 31, 2020 and 2019, our inventory reserve was $
Note 8 – Property, Plant and Equipment
As of December 31, 2020 and 2019, property, plant and equipment, net was comprised of the following:
|
(In thousands) |
|
2020 |
|
|
2019 |
|
||
|
Land |
|
$ |
|
|
|
$ |
|
|
|
Building and land improvements |
|
|
|
|
|
|
|
|
|
Building |
|
|
|
|
|
|
|
|
|
Furniture and fixtures |
|
|
|
|
|
|
|
|
|
Computer hardware and software |
|
|
|
|
|
|
|
|
|
Engineering and other equipment |
|
|
|
|
|
|
|
|
|
Total Property, Plant and Equipment |
|
|
|
|
|
|
|
|
|
Less: accumulated depreciation |
|
|
( |
) |
|
|
( |
) |
|
Total Property, Plant and Equipment, net |
|
$ |
|
|
|
$ |
|
|
Long-lived assets used in operations are reviewed for impairment whenever events or changes in circumstances indicate that the carrying amount of an asset may not be recoverable and the undiscounted cash flows estimated to be generated by the asset are less than the asset’s carrying value. During the years ended December 31, 2020 and December 31, 2019, the Company recognized impairment charges of $
Depreciation expense was $
77
Note 9 – Leases
We have operating leases for office space, automobiles and various other equipment in the U.S. and in certain international locations. Other contracts, such as manufacturing agreements and service agreements, are reviewed to determine if they contain potential embedded leases. These other contracts are specifically reviewed to determine whether we have the right to substantially all of the economic benefit from the use of any specified assets or the right to direct the use of any specified assets, either of which would indicate the existence of a lease.
As of December 31, 2020, our operating leases had remaining lease terms of
|
|
|
|
|
December 31, |
|
|
December 31, |
|
||
|
(In thousands) |
|
Classification |
|
2020 |
|
|
2019 |
|
||
|
Assets |
|
|
|
|
|
|
|
|
|
|
|
Operating lease assets |
|
Other non-current assets |
|
$ |
|
|
|
$ |
|
|
|
Total lease asset |
|
|
|
$ |
|
|
|
$ |
|
|
|
|
|
|
|
|
|
|
|
|
|
|
|
Liabilities |
|
|
|
|
|
|
|
|
|
|
|
Current operating lease liability |
|
Accrued expenses and other liabilities |
|
$ |
|
|
|
$ |
|
|
|
Non-current operating lease liability |
|
Other non-current liabilities |
|
|
|
|
|
|
|
|
|
Total lease liability |
|
|
|
$ |
|
|
|
$ |
|
|
Leases with an initial term of 12 months or less are not recorded on the balance sheet and lease expense for these leases is recognized on a straight-line basis over the lease term. Lease expense related to these short-term leases was less than $
The components of lease expense included in the Consolidated Statements of Income (Loss) were as follows:
|
|
|
For the year ended December 31, |
|
|||||
|
(In thousands) |
|
2020 |
|
|
2019 |
|
||
|
Cost of sales |
|
$ |
|
|
|
$ |
|
|
|
Selling, general and administrative expenses |
|
|
|
|
|
|
|
|
|
Research and development expenses |
|
|
|
|
|
|
|
|
|
Total operating lease expense |
|
$ |
|
|
|
$ |
|
|
As of December 31, 2020, operating lease liabilities included on the Consolidated Balance Sheet by future maturity were as follows:
|
(In thousands) |
|
Amount |
|
|
|
2021 |
|
$ |
|
|
|
2022 |
|
|
|
|
|
2023 |
|
|
|
|
|
2024 |
|
|
|
|
|
2025 |
|
|
|
|
|
Thereafter |
|
|
— |
|
|
Total lease payments |
|
|
|
|
|
Less: Interest |
|
|
( |
) |
|
Present value of lease liabilities |
|
$ |
|
|
78
Future operating lease payments include $
An incremental borrowing rate is used based on information available at the commencement date in determining the present value of lease payments. The incremental borrowing rate is determined on a portfolio basis by grouping leases with similar terms as well as grouping leases based on a U.S. dollar or Euro functional currency. The actual rate is then determined based on a credit spread over LIBOR as well as the Bloomberg Curve Matrix for the U.S. Communications section.
|
|
|
As of December 31, |
|
|||||
|
Weighted average remaining lease term (years) |
|
2020 |
|
|
2019 |
|
||
|
Operating leases with USD functional currency |
|
|
|
|
|
|
|
|
|
Operating leases with Euro functional currency |
|
|
|
|
|
|
|
|
|
Weighted average discount rate |
|
|
|
|
|
|
|
|
|
Operating leases with USD functional currency |
|
|
|
% |
|
|
|
% |
|
Operating leases with Euro functional currency |
|
|
|
% |
|
|
|
% |
Supplemental cash flow information related to operating leases is as follows:
|
|
|
As of December 31, |
|
|||||
|
(In thousands) |
|
2020 |
|
|
2019 |
|
||
|
Cash paid for amounts included in the measurement of operating lease assets/liabilities |
|
|
|
|
|
|
|
|
|
Cash used in operating activities related to operating leases |
|
$ |
|
|
|
$ |
|
|
|
Right-of-use assets obtained in exchange for operating lease obligations |
|
$ |
|
|
|
$ |
|
|
Sales-Type Leases
We are the lessor in sales-type lease arrangements for network equipment, which have initial terms of up to
|
|
|
As of December 31, |
|
|||||
|
(In thousands) |
|
2020 |
|
|
2019 |
|
||
|
Current minimum lease payments receivable(1) |
|
$ |
|
|
|
$ |
|
|
|
Non-current minimum lease payments receivable(2) |
|
|
|
|
|
|
|
|
|
Total minimum lease payments receivable |
|
|
|
|
|
|
|
|
|
Less: Current unearned revenue(1) |
|
|
|
|
|
|
|
|
|
Less: Non-current unearned revenue(2) |
|
|
|
|
|
|
|
|
|
Net investment in sales-type leases |
|
$ |
|
|
|
$ |
|
|
|
|
(1) |
Included in other receivables on the Consolidated Balance Sheets. |
|
|
(2) |
Included in other non-current assets on the Consolidated Balance Sheets. |
79
Components of gross profit related to sales-type lease recognized at the lease commencement date and interest and dividend income, included in the Consolidated Statements of Income (Loss) for the year ended December 31, 2020 and 2019 were as follows:
|
|
|
For the year ended December 31, |
|
|||||
|
(In thousands) |
|
2020 |
|
|
2019 |
|
||
|
Revenue - Network Solutions |
|
$ |
|
|
|
$ |
|
|
|
Cost of sales - Network Solutions |
|
|
|
|
|
|
|
|
|
Gross profit |
|
$ |
|
|
|
$ |
|
|
|
|
|
|
|
|
|
|
|
|
|
Interest and dividend income |
|
$ |
|
|
|
$ |
|
|
As of December 31, 2020 future minimum lease payments to be received from sales-type leases were as follows:
|
(In thousands) |
|
Amount |
|
|
|
2021 |
|
$ |
|
|
|
2022 |
|
|
|
|
|
2023 |
|
|
|
|
|
2024 |
|
|
|
|
|
2025 |
|
|
|
|
|
Total |
|
$ |
|
|
Note 10 – Goodwill
Goodwill, all of which relates to our acquisitions of Bluesocket, Inc. in 2011 and SmartRG in 2018, was $
The Company evaluates the carrying value of goodwill during the fourth quarter of each year and between annual evaluations if events occur or circumstances change that could more likely than not reduce the fair value of the reporting unit below its carrying amount. We have elected to by-pass a qualitative assessment to determine whether it is more likely than not that the fair value of the reporting unit to which the goodwill is assigned is less than its carrying amount.
Note 11 – Intangible Assets
Intangible assets as of December 31, 2020 and 2019, consisted of the following:
|
|
|
2020 |
|
|
2019 |
|
||||||||||||||||||
|
(In thousands) |
|
Gross Value |
|
|
Accumulated Amortization |
|
|
Net Value |
|
|
Gross Value |
|
|
Accumulated Amortization |
|
|
Net Value |
|
||||||
|
Customer relationships |
|
$ |
|
|
|
$ |
( |
) |
|
$ |
|
|
|
$ |
|
|
|
$ |
( |
) |
|
$ |
|
|
|
Developed technology |
|
|
|
|
|
|
( |
) |
|
|
|
|
|
|
|
|
|
|
( |
) |
|
|
|
|
|
Licensed technology |
|
|
|
|
|
|
( |
) |
|
|
|
|
|
|
|
|
|
|
( |
) |
|
|
|
|
|
Supplier relationships |
|
|
|
|
|
|
( |
) |
|
|
— |
|
|
|
|
|
|
|
( |
) |
|
|
|
|
|
Licensing agreements |
|
|
|
|
|
|
( |
) |
|
|
|
|
|
|
|
|
|
|
( |
) |
|
|
|
|
|
Patents |
|
|
|
|
|
|
( |
) |
|
|
|
|
|
|
|
|
|
|
( |
) |
|
|
|
|
|
Trade names |
|
|
|
|
|
|
( |
) |
|
|
|
|
|
|
|
|
|
|
( |
) |
|
|
|
|
|
Total |
|
$ |
|
|
|
$ |
( |
) |
|
$ |
|
|
|
$ |
|
|
|
$ |
( |
) |
|
$ |
|
|
The Company evaluates the carrying value of intangible assets whenever events or changes in circumstances indicate that the carrying amount of an asset may not be recoverable and the undiscounted cash flows estimated to be generated by the asset are less than the asset’s carrying value.
80
Amortization expense was $
As of December 31, 2020, estimated future amortization expense of intangible assets was as follows:
|
(In thousands) |
|
Amount |
|
|
|
2021 |
|
$ |
|
|
|
2022 |
|
|
|
|
|
2023 |
|
|
|
|
|
2024 |
|
|
|
|
|
2025 |
|
|
|
|
|
Thereafter |
|
|
|
|
|
Total |
|
$ |
|
|
Note 12 – Revolving Credit Agreement
On November 4, 2020, the Company, as borrower, entered into a Revolving Credit and Security Agreement and related Promissory Note (together, the “Revolving Credit Agreement”) with Cadence Bank, N.A., as lender (the “Lender”). The Revolving Credit Agreement provides the Company with a new $
Note 13 – Alabama State Industrial Development Authority Financing and Economic Incentives
In conjunction with the 1995 expansion of our Huntsville, Alabama facility, we were approved for participation in an incentive program offered by the State of Alabama Industrial Development Authority (the “Authority”). Pursuant to the program, in January 1995, the Authority issued $
In conjunction with this program, we were eligible to receive certain economic incentives from the state of Alabama that reduce the amount of payroll withholdings that we were required to remit to the state for those employment positions that qualify under the program. Economic incentives realized related to payroll withholdings totaled $
81
Note 14 – Income Taxes
The components of income tax expense (benefit) for the years ended December 31, 2020, 2019 and 2018 are as follows:
|
(In thousands) |
|
2020 |
|
|
2019 |
|
|
2018 |
|
|||
|
Current |
|
|
|
|
|
|
|
|
|
|
|
|
|
Federal |
|
$ |
( |
) |
|
$ |
( |
) |
|
$ |
( |
) |
|
State |
|
|
( |
) |
|
|
( |
) |
|
|
( |
) |
|
International |
|
|
|
|
|
|
( |
) |
|
|
|
|
|
Total Current |
|
|
( |
) |
|
|
( |
) |
|
|
|
|
|
|
|
|
|
|
|
|
|
|
|
|
|
|
|
Deferred |
|
|
|
|
|
|
|
|
|
|
|
|
|
Federal |
|
|
— |
|
|
|
|
|
|
|
( |
) |
|
State |
|
|
— |
|
|
|
|
|
|
|
( |
) |
|
International |
|
|
( |
) |
|
|
( |
) |
|
|
|
|
|
Total Deferred |
|
|
( |
) |
|
|
|
|
|
|
( |
) |
|
Total Income Tax Expense (Benefit) |
|
$ |
( |
) |
|
$ |
|
|
|
$ |
( |
) |
The effective income tax rate differs from the federal statutory rate due to the following:
|
|
|
2020 |
|
|
2019 |
|
|
2018 |
|
|||
|
Tax provision computed at the federal statutory rate |
|
|
|
% |
|
|
|
% |
|
|
|
% |
|
State income tax provision, net of federal benefit |
|
|
|
|
|
|
|
|
|
|
|
|
|
Federal research credits |
|
|
|
|
|
|
|
|
|
|
|
|
|
Foreign taxes |
|
|
( |
) |
|
|
|
|
|
|
( |
) |
|
Tax-exempt income |
|
|
|
|
|
|
|
|
|
|
|
|
|
State tax incentives |
|
|
— |
|
|
|
|
|
|
|
|
|
|
Change in valuation allowance |
|
|
|
|
|
|
( |
) |
|
|
— |
|
|
Foreign tax credits |
|
|
|
|
|
|
|
|
|
|
— |
|
|
Stock-based compensation |
|
|
( |
) |
|
|
( |
) |
|
|
( |
) |
|
Withholding taxes |
|
|
( |
) |
|
|
— |
|
|
|
— |
|
|
Bargain purchase |
|
|
— |
|
|
|
— |
|
|
|
|
|
|
Impact of CARES Act |
|
|
|
|
|
|
— |
|
|
|
— |
|
|
Impact of U.S. tax reform |
|
|
— |
|
|
|
— |
|
|
|
|
|
|
Global intangible low-taxed income ("GILTI") |
|
|
( |
) |
|
|
( |
) |
|
|
( |
) |
|
Other, net |
|
|
|
|
|
|
( |
) |
|
|
( |
) |
|
Effective Tax Rate |
|
|
|
% |
|
|
( |
)% |
|
|
|
% |
Income (loss) before expense (benefit) for income taxes for the years ended December 31, 2020, 2019 and 2018 is as follows:
|
(In thousands) |
|
2020 |
|
|
2019 |
|
|
2018 |
|
|||
|
U.S. entities |
|
$ |
( |
) |
|
$ |
( |
) |
|
$ |
( |
) |
|
International entities |
|
|
|
|
|
|
|
|
|
|
|
|
|
Total |
|
$ |
( |
) |
|
$ |
( |
) |
|
$ |
( |
) |
Income (loss) before expense (benefit) for income taxes for international entities reflects income (loss) based on statutory transfer pricing agreements. This amount does not correlate to consolidated international revenue, which occurs from our U.S. entity.
82
Deferred income taxes on the Consolidated Balance Sheets result from temporary differences between the amount of assets and liabilities recognized for financial reporting and tax purposes. The significant components of current and non-current deferred taxes as of December 31, 2020 and 2019 consist of the following:
|
(In thousands) |
|
2020 |
|
|
2019 |
|
||
|
Deferred tax assets: |
|
|
|
|
|
|
|
|
|
Inventory |
|
$ |
|
|
|
$ |
|
|
|
Accrued expenses |
|
|
|
|
|
|
|
|
|
Deferred compensation |
|
|
|
|
|
|
|
|
|
Stock-based compensation |
|
|
|
|
|
|
|
|
|
Uncertain tax positions related to state taxes and related interest |
|
|
|
|
|
|
|
|
|
Pensions |
|
|
|
|
|
|
|
|
|
Foreign losses |
|
|
|
|
|
|
|
|
|
State losses and credit carry-forwards |
|
|
|
|
|
|
|
|
|
Federal loss and research carry-forwards |
|
|
|
|
|
|
|
|
|
Lease liabilities |
|
|
|
|
|
|
|
|
|
Capitalized research and development expenditures |
|
|
|
|
|
|
|
|
|
Valuation allowance |
|
|
( |
) |
|
|
( |
) |
|
Total Deferred Tax Assets |
|
|
|
|
|
|
|
|
|
|
|
|
|
|
|
|
|
|
|
Deferred tax liabilities: |
|
|
|
|
|
|
|
|
|
Property, plant and equipment |
|
|
( |
) |
|
|
( |
) |
|
Intellectual property |
|
|
( |
) |
|
|
( |
) |
|
Right of use lease assets |
|
|
( |
) |
|
|
( |
) |
|
Investments |
|
|
( |
) |
|
|
( |
) |
|
Total Deferred Tax Liabilities |
|
|
( |
) |
|
|
( |
) |
|
Net Deferred Tax Assets |
|
$ |
|
|
|
$ |
|
|
On March 27, 2020, the Coronavirus Aid, Relief, and Economic Security Act (the “CARES Act”) was signed into law. Subsequently, the Internal Revenue Service (“IRS”) released its final Global Intangible Low Tax Income (“GILTI”) regulations on July 9, 2020. The passage of the CARES Act and subsequent issuance of the GILTI final regulations together resulted in the Company’s recognition of a tax benefit in the amount of $
As of December 31, 2020 and 2019, non-current deferred taxes reflect deferred taxes on net unrealized gains and losses on available-for-sale investments and deferred taxes on unrealized losses in our pension plan. The net change in non-current deferred taxes associated with these items, which resulted in a deferred tax benefit of $
83
The Company continually reviews the adequacy of its valuation allowance and recognizes the benefits of deferred tax assets only as the reassessment indicates that it is more likely than not that the deferred tax assets will be recognized in accordance with ASC 740, Income Taxes. Our assessment of the realizability of our deferred tax assets includes the evaluation of evidence, some of which requires significant judgement, including historical operating results, the evaluation of a three-year cumulative income position, future taxable income projections and tax planning strategies. Should management’s conclusion change in the future and additional valuation allowance or a partial or full release of the valuation allowance is necessary, it could have a material effect on our consolidated financial statements.
As of December 31, 2020 and 2019, the Company had gross deferred tax assets totaling $
Supplemental balance sheet information related to deferred tax assets as of December 31, 2020 and 2019 is as follows:
|
|
|
December 31, 2020 |
|
|||||||||
|
(In thousands) |
|
Deferred Tax Assets |
|
|
Valuation Allowance |
|
|
Deferred Tax Assets, net |
|
|||
|
Domestic |
|
$ |
|
|
|
$ |
( |
) |
|
$ |
— |
|
|
International |
|
|
|
|
|
|
( |
) |
|
|
|
|
|
Total |
|
$ |
|
|
|
$ |
( |
) |
|
$ |
|
|
|
|
|
December 31, 2019 |
|
|||||||||
|
(In thousands) |
|
Deferred Tax Assets |
|
|
Valuation Allowance |
|
|
Deferred Tax Assets, net |
|
|||
|
Domestic |
|
$ |
|
|
|
$ |
( |
) |
|
$ |
— |
|
|
International |
|
|
|
|
|
|
( |
) |
|
|
|
|
|
Total |
|
$ |
|
|
|
$ |
( |
) |
|
$ |
|
|
As of December 31, 2020 and 2019, the deferred tax assets for foreign and domestic loss carry-forwards, research and development tax credits, unamortized research and development costs and state credit carry-forwards totaled $
As of December 31, 2020 and 2019, respectively, our cash and cash equivalents were $
During 2020, 2019 and 2018,
84
The change in the unrecognized income tax benefits for the years ended December 31, 2020, 2019 and 2018 is reconciled below:
|
(In thousands) |
|
2020 |
|
|
2019 |
|
|
2018 |
|
|||
|
Balance at beginning of period |
|
$ |
|
|
|
$ |
|
|
|
$ |
|
|
|
Increases for tax position related to: |
|
|
|
|
|
|
|
|
|
|
|
|
|
Prior years |
|
|
|
|
|
|
— |
|
|
|
|
|
|
Current year |
|
|
|
|
|
|
|
|
|
|
|
|
|
Decreases for tax positions related to: |
|
|
|
|
|
|
|
|
|
|
|
|
|
Prior years |
|
|
— |
|
|
|
( |
) |
|
|
— |
|
|
Expiration of applicable statute of limitations |
|
|
( |
) |
|
|
( |
) |
|
|
( |
) |
|
Balance at end of period |
|
$ |
|
|
|
$ |
|
|
|
$ |
|
|
As of December 31, 2020, 2019 and 2018, our total liability for unrecognized tax benefits was $
We do not anticipate a single tax position generating a significant increase or decrease in our liability for unrecognized tax benefits within 12 months of this reporting date. We file income tax returns in the U.S. for federal and various state jurisdictions and several foreign jurisdictions. We are not currently under audit by the Internal Revenue Service. Generally, we are not subject to changes in income taxes by any taxing jurisdiction for the years prior to 2017.
Note 15 – Employee Benefit Plans
Pension Benefit Plan
We maintain a defined benefit pension plan covering employees in certain foreign countries.
The pension benefit plan obligations and funded status as of December 31, 2020 and 2019, were as follows:
|
(In thousands) |
|
2020 |
|
|
2019 |
|
||
|
Change in projected benefit obligation: |
|
|
|
|
|
|
|
|
|
Projected benefit obligation at beginning of period |
|
$ |
|
|
|
$ |
|
|
|
Service cost |
|
|
|
|
|
|
|
|
|
Interest cost |
|
|
|
|
|
|
|
|
|
Actuarial (gain) loss - experience |
|
|
( |
) |
|
|
|
|
|
Actuarial loss - assumptions |
|
|
|
|
|
|
|
|
|
Benefit payments |
|
|
( |
) |
|
|
( |
) |
|
Effects of foreign currency exchange rate changes |
|
|
|
|
|
|
( |
) |
|
Projected benefit obligation at end of period |
|
|
|
|
|
|
|
|
|
Change in plan assets: |
|
|
|
|
|
|
|
|
|
Fair value of plan assets at beginning of period |
|
|
|
|
|
|
|
|
|
Actual gain on plan assets |
|
|
|
|
|
|
|
|
|
Contributions |
|
|
|
|
|
|
— |
|
|
Effects of foreign currency exchange rate changes |
|
|
|
|
|
|
( |
) |
|
Fair value of plan assets at end of period |
|
|
|
|
|
|
|
|
|
Unfunded status at end of period |
|
$ |
( |
) |
|
$ |
( |
) |
The accumulated benefit obligation was $
85
The net amounts recognized in the Consolidated Balance Sheets for the unfunded pension liability as of December 31, 2020 and 2019 were as follows:
|
(In thousands) |
|
2020 |
|
|
2019 |
|
||
|
Current liability |
|
$ |
|
|
|
$ |
|
|
|
Pension liability |
|
|
|
|
|
|
|
|
|
Total |
|
$ |
|
|
|
$ |
|
|
The components of net periodic pension cost, other than the service cost component, are included in other income (expense), net in the Consolidated Statements of Income (Loss). The components of net periodic pension cost and amounts recognized in other comprehensive income (loss) for the years ended December 31, 2020, 2019 and 2018 were as follows:
|
(In thousands) |
|
2020 |
|
|
2019 |
|
|
2018 |
|
|||
|
Net periodic benefit cost: |
|
|
|
|
|
|
|
|
|
|
|
|
|
Service cost |
|
$ |
|
|
|
$ |
|
|
|
$ |
|
|
|
Interest cost |
|
|
|
|
|
|
|
|
|
|
|
|
|
Expected return on plan assets |
|
|
( |
) |
|
|
( |
) |
|
|
( |
) |
|
Amortization of actuarial losses |
|
|
|
|
|
|
|
|
|
|
|
|
|
Net periodic benefit cost |
|
|
|
|
|
|
|
|
|
|
|
|
|
Other changes in plan assets and benefit obligations recognized in other comprehensive income (loss): |
|
|
|
|
|
|
|
|
|
|
|
|
|
Net actuarial (gain) loss |
|
|
|
|
|
|
|
|
|
|
|
|
|
Amortization of actuarial losses |
|
|
( |
) |
|
|
( |
) |
|
|
( |
) |
|
Amount recognized in other comprehensive income (loss) |
|
|
|
|
|
|
|
|
|
|
|
|
|
Total recognized in net periodic benefit cost and other comprehensive income (loss) |
|
$ |
|
|
|
$ |
|
|
|
$ |
|
|
The amounts recognized in accumulated other comprehensive income (loss) as of December 31, 2020 and 2019 were as follows:
|
(In thousands) |
|
2020 |
|
|
2019 |
|
||
|
Net actuarial loss |
|
$ |
( |
) |
|
$ |
( |
) |
The defined benefit pension plan is accounted for on an actuarial basis, which requires the use of various assumptions, including an expected rate of return on plan assets and a discount rate. The expected return on our German plan assets that is utilized in determining the benefit obligation and net periodic benefit cost is derived from periodic studies, which include a review of asset allocation strategies, anticipated future long-term performance of individual asset classes, risks using standard deviations and correlations of returns among the asset classes that comprise the plans' asset mix. While the studies give appropriate consideration to recent plan performance and historical returns, the assumptions are primarily long-term, prospective rates of return. The discount rate has been derived from the returns of high-quality, corporate bonds denominated in Euro currency with durations close to the duration of our pension obligations.
The weighted-average assumptions that were used to determine the net periodic benefit cost for the years ended December 31, 2020, 2019 and 2018 were as follows:
|
|
|
2020 |
|
|
2019 |
|
|
2018 |
|
|||
|
Discount rate |
|
|
|
% |
|
|
|
% |
|
|
|
% |
|
Rate of compensation increase |
|
|
|
% |
|
|
|
% |
|
|
|
% |
|
Expected long-term rates of return |
|
|
|
% |
|
|
|
% |
|
|
|
% |
The weighted-average assumptions that were used to determine the benefit obligation as of December 31, 2020 and 2019:
|
|
|
2020 |
|
|
2019 |
|
||
|
Discount rate |
|
|
|
% |
|
|
|
% |
|
Rate of compensation increase |
|
|
|
% |
|
|
|
% |
86
Actuarial gains and losses are recorded in accumulated other comprehensive income (loss). To the extent unamortized gains and losses exceed
We do not anticipate making any contributions to the pension plan in 2021.
|
(In thousands) |
|
|
|
|
|
2021 |
|
$ |
|
|
|
2022 |
|
|
|
|
|
2023 |
|
|
|
|
|
2024 |
|
|
|
|
|
2025 |
|
|
|
|
|
2026 - 2030 |
|
|
|
|
|
Total |
|
$ |
|
|
U.S. GAAP establishes a three-level valuation hierarchy based upon observable and unobservable inputs for fair value measurement of financial instruments:
|
|
• |
Level 1 – Observable outputs; values based on unadjusted quoted prices for identical assets or liabilities in an active market; |
|
|
• |
Level 2 – Significant inputs that are observable; values based on quoted prices in markets that are not active or model inputs that are observable either directly or indirectly; |
|
|
• |
Level 3 – Significant unobservable inputs; values based on prices or valuation techniques that require inputs that are both unobservable and significant to the overall fair value measurement. These inputs could include information supplied by investees. |
We have categorized our cash equivalents and our investments held at fair value into this hierarchy as follows:
|
|
|
Fair Value Measurements at December 31, 2020 Using |
|
|||||||||||||
|
(In thousands) |
|
Fair Value |
|
|
Quoted Prices in Active Markets for Identical Assets (Level 1) |
|
|
Significant Other Observable Inputs (Level 2) |
|
|
Significant Unobservable Inputs (Level 3) |
|
||||
|
Cash and cash equivalents |
|
$ |
|
|
|
$ |
|
|
|
$ |
— |
|
|
$ |
— |
|
|
Available-for-sale securities |
|
|
|
|
|
|
|
|
|
|
|
|
|
|
|
|
|
Bond funds: |
|
|
|
|
|
|
|
|
|
|
|
|
|
|
|
|
|
Corporate bonds |
|
|
|
|
|
|
|
|
|
|
— |
|
|
|
— |
|
|
Government bonds |
|
|
|
|
|
|
|
|
|
|
— |
|
|
|
— |
|
|
Emerging markets bonds |
|
|
|
|
|
|
|
|
|
|
— |
|
|
|
— |
|
|
Equity funds: |
|
|
|
|
|
|
|
|
|
|
|
|
|
|
|
|
|
Global equity |
|
|
|
|
|
|
|
|
|
|
— |
|
|
|
— |
|
|
Balanced fund |
|
|
|
|
|
|
|
|
|
|
— |
|
|
|
— |
|
|
Emerging markets |
|
|
|
|
|
|
|
|
|
|
— |
|
|
|
— |
|
|
Large cap value |
|
|
|
|
|
|
|
|
|
|
— |
|
|
|
— |
|
|
Global real estate fund |
|
|
|
|
|
|
|
|
|
|
— |
|
|
|
— |
|
|
Managed futures fund |
|
|
|
|
|
|
|
|
|
|
— |
|
|
|
— |
|
|
Available-for-sale securities |
|
|
|
|
|
|
|
|
|
|
— |
|
|
|
— |
|
|
Total |
|
$ |
|
|
|
$ |
|
|
|
$ |
— |
|
|
$ |
— |
|
87
|
|
|
Fair Value Measurements at December 31, 2019 Using |
|
|||||||||||||
|
(In thousands) |
|
Fair Value |
|
|
Quoted Prices in Active Markets for Identical Assets (Level 1) |
|
|
Significant Other Observable Inputs (Level 2) |
|
|
Significant Unobservable Inputs (Level 3) |
|
||||
|
Cash and cash equivalents |
|
$ |
|
|
|
$ |
|
|
|
$ |
— |
|
|
$ |
— |
|
|
Available-for-sale securities |
|
|
|
|
|
|
|
|
|
|
|
|
|
|
|
|
|
Bond funds: |
|
|
|
|
|
|
|
|
|
|
|
|
|
|
|
|
|
Government bonds |
|
|
|
|
|
|
|
|
|
|
— |
|
|
|
— |
|
|
Corporate bonds |
|
|
|
|
|
|
|
|
|
|
— |
|
|
|
— |
|
|
Emerging markets bonds |
|
|
|
|
|
|
|
|
|
|
— |
|
|
|
— |
|
|
Equity funds: |
|
|
|
|
|
|
|
|
|
|
|
|
|
|
|
|
|
Global equity |
|
|
|
|
|
|
|
|
|
|
— |
|
|
|
— |
|
|
Emerging markets |
|
|
|
|
|
|
|
|
|
|
— |
|
|
|
— |
|
|
Balanced fund |
|
|
|
|
|
|
|
|
|
|
— |
|
|
|
— |
|
|
Large cap value |
|
|
|
|
|
|
|
|
|
|
— |
|
|
|
— |
|
|
Global real estate fund |
|
|
|
|
|
|
|
|
|
|
— |
|
|
|
— |
|
|
Managed futures fund |
|
|
|
|
|
|
|
|
|
|
— |
|
|
|
— |
|
|
Available-for-sale securities |
|
|
|
|
|
|
|
|
|
|
— |
|
|
|
— |
|
|
Total |
|
$ |
|
|
|
$ |
|
|
|
$ |
— |
|
|
$ |
— |
|
Our investment policy includes various guidelines and procedures designed to ensure assets are invested in a manner necessary to meet expected future benefits earned by participants and consider a broad range of economic conditions. Central to the policy are target allocation ranges by asset class, which is currently
The investment policy is periodically reviewed by us and a designated third-party fiduciary for investment matters. The policy is established and administered in a manner that is compliant at all times with applicable government regulations.
401(k) Savings Plan
We maintain the ADTRAN, Inc. 401(k) Retirement Plan (the “Savings Plan”) for the benefit of eligible employees. The Savings Plan is intended to qualify under Sections 401(a) and 401(k) of the Internal Revenue Code of 1986, as amended (the “Code”), and is intended to be a “safe harbor” 401(k) plan under Code Section 401(k)(12). The Savings Plan allows employees to save for retirement by contributing part of their compensation to the plan on a tax-deferred basis. The Savings Plan also requires us to contribute a “safe harbor” amount each year. We match up to
Deferred Compensation Plans
We maintain
The ADTRAN, Inc. Deferred Compensation Program for Employees is offered as a supplement to our tax-qualified 401(k) plan and is available to certain executive management employees who have been designated by our Board of Directors. This deferred compensation plan allows participants to defer all or a portion of certain specified bonuses and up to
88
For our Board of Directors, we maintain the ADTRAN, Inc. Deferred Compensation Program for Directors. This program allows our Board of Directors to defer all or a portion of monetary remuneration paid to the Director, including, but not limited to, meeting fees and annual retainers. We also maintain the ADTRAN, Inc. Equity Deferral Program for Directors. Under this plan, participants may elect to defer all or a portion of their vested restricted stock awards. Such deferrals shall continue to be held and deemed to be invested in shares of ADTRAN stock unless and until the amounts are distributed or such deferrals are moved to another deemed investment pursuant to an election made by the director.
We have set aside the plan assets for all plans in a rabbi trust (the “Trust”) and all contributions are credited to bookkeeping accounts for the participants. The Trust assets are subject to the claims of our creditors in the event of bankruptcy or insolvency. The assets of the Trust are deemed to be invested in pre-approved mutual funds as directed by each participant and the participant’s bookkeeping account is credited with the earnings and losses attributable to those investments. Benefits are scheduled to be distributed
Assets of the Trust are deemed invested in mutual funds that cover an investment spectrum ranging from equities to money market instruments. These mutual funds are publicly quoted and reported at fair value.
|
(In thousands) |
|
2020 |
|
|
2019 |
|
||
|
Fair Value of Plan Assets |
|
|
|
|
|
|
|
|
|
Long-term investments |
|
$ |
|
|
|
$ |
|
|
|
Total Fair Value of Plan Assets |
|
$ |
|
|
|
$ |
|
|
|
Amounts Payable to Plan Participants |
|
|
|
|
|
|
|
|
|
Deferred compensation liability |
|
$ |
|
|
|
$ |
|
|
|
Total Amounts Payable to Plan Participants |
|
$ |
|
|
|
$ |
|
|
The Trust held $
Interest and dividend income of the Trust are included in interest and dividend income in the accompanying 2020, 2019 and 2018 Consolidated Statements of Income (Loss). Changes in the fair value of the plan assets held by the Trust have been included in other income (expense) in the accompanying 2020, 2019 and 2018 Consolidated Statements of Income (Loss). Changes in the fair value of the deferred compensation liability are included as selling, general and administrative expense in the accompanying 2020, 2019 and 2018 Consolidated Statements of Income (Loss). Based on the changes in the total fair value of the Trust’s assets, we recorded deferred compensation income (expense) in 2020, 2019 and 2018 of $
Retiree Medical Coverage
Medical, dental and prescription drug coverage is provided to certain spouses and former spouses of current and former officers on the same terms as provided to our active officers for up to
89
Note 16 – Segment Information and Major Customers
The chief operating decision maker regularly reviews the Company’s financial performance based on
The performance of each segment is evaluated based on gross profit; therefore, selling, general and administrative expenses, research and development expenses, interest and dividend income, interest expense, net investment gain (loss), other income (expense) and income tax (expense) benefit are reported on a Company-wide basis only. There is no inter-segment revenue. Asset information by reportable segment is not produced and, therefore, is not reported.
The following table presents information about revenue and gross profit of our reportable segments for each of the years ended December 31, 2020, 2019 and 2018:
|
|
|
2020 |
|
|
2019 |
|
|
2018 |
|
|||||||||||||||
|
(In thousands) |
|
Revenue |
|
|
Gross Profit |
|
|
Revenue |
|
|
Gross Profit |
|
|
Revenue |
|
|
Gross Profit |
|
||||||
|
Network Solutions |
|
$ |
|
|
|
$ |
|
|
|
$ |
|
|
|
$ |
|
|
|
$ |
|
|
|
$ |
|
|
|
Services & Support |
|
|
|
|
|
|
|
|
|
|
|
|
|
|
|
|
|
|
|
|
|
|
|
|
|
Total |
|
$ |
|
|
|
$ |
|
|
|
$ |
|
|
|
$ |
|
|
|
$ |
|
|
|
$ |
|
|
Revenue by Category
In addition to our reportable segments, revenue is also reported for the following
The following tables disaggregate our revenue by category for the years ended December 31, 2020, 2019 and 2018:
|
|
|
2020 |
|
|||||||||
|
(In thousands) |
|
Network Solutions |
|
|
Services & Support |
|
|
Total |
|
|||
|
Access & Aggregation |
|
$ |
|
|
|
$ |
|
|
|
$ |
|
|
|
Subscriber Solutions & Experience |
|
|
|
|
|
|
|
|
|
|
|
|
|
Traditional & Other Products |
|
|
|
|
|
|
|
|
|
|
|
|
|
Total |
|
$ |
|
|
|
$ |
|
|
|
$ |
|
|
|
|
|
2019 |
|
|||||||||
|
(In thousands) |
|
Network Solutions |
|
|
Services & Support |
|
|
Total |
|
|||
|
Access & Aggregation |
|
$ |
|
|
|
$ |
|
|
|
$ |
|
|
|
Subscriber Solutions & Experience |
|
|
|
|
|
|
|
|
|
|
|
|
|
Traditional & Other Products |
|
|
|
|
|
|
|
|
|
|
|
|
|
Total |
|
$ |
|
|
|
$ |
|
|
|
$ |
|
|
|
|
|
2018 |
|
|||||||||
|
(In thousands) |
|
Network Solutions |
|
|
Services & Support |
|
|
Total |
|
|||
|
Access & Aggregation |
|
$ |
|
|
|
$ |
|
|
|
$ |
|
|
|
Subscriber Solutions & Experience |
|
|
|
|
|
|
|
|
|
|
|
|
|
Traditional & Other Products |
|
|
|
|
|
|
|
|
|
|
|
|
|
Total |
|
$ |
|
|
|
$ |
|
|
|
$ |
|
|
90
Additional Information
The following table presents revenue information by geographic area for the years ended December 31, 2020, 2019 and 2018:
|
(In thousands) |
|
2020 |
|
|
2019 |
|
|
2018 |
|
|||
|
United States |
|
$ |
|
|
|
$ |
|
|
|
$ |
|
|
|
Germany |
|
|
|
|
|
|
|
|
|
|
|
|
|
Mexico |
|
|
|
|
|
|
|
|
|
|
|
|
|
Other international |
|
|
|
|
|
|
|
|
|
|
|
|
|
Total |
|
$ |
|
|
|
$ |
|
|
|
$ |
|
|
Customers comprising more than 10% of revenue can change from year to year. Single customers comprising more than 10% of revenue in 2020 included
As of December 31, 2020, property, plant and equipment, net totaled $
Note 17 – Commitments and Contingencies
Securities Class Action Lawsuit
On October 17, 2019, a purported stockholder class action lawsuit, captioned Burbridge v. ADTRAN, Inc. et al., Docket No. 19-cv-09619, was filed in the United States District Court for the Southern District of New York against the Company,
Shareholder Derivative Lawsuit
On March 31, 2020, a shareholder derivative suit, captioned Johnson (Derivatively on behalf of ADTRAN) v. T. Stanton, M. Foliano, R. Shannon, and Board of Directors, case no. 5:20-cv-00447, was filed in the U.S. District Court of Northern Alabama against
91
Other Legal Matters
In addition to the litigation described above, from time to time we are subject to or otherwise involved in various lawsuits, claims, investigations and legal proceedings that arise out of or are incidental to the conduct of our business (collectively, “Legal Matters”), including those relating to employment matters, patent rights, regulatory compliance matters, stockholder claims, and contractual and other commercial disputes. Such Legal Matters, even if not meritorious, could result in the expenditure of significant financial and managerial resources. Additionally, an unfavorable outcome in any legal matter, including in a patent dispute, could require the Company to pay damages, entitle claimants to other relief, such as royalties, or could prevent the Company from selling some of its products in certain jurisdictions. While the Company cannot predict with certainty the results of the Legal Matters in which it is currently involved, the Company does not expect that the ultimate outcome of such Legal Matters will individually or in the aggregate have a material adverse effect on its business, results of operations, financial condition or cash flows.
Performance Bonds
Certain contracts, customers and/or jurisdictions in which we do business require us to provide various guarantees of performance such as bid bonds, performance bonds and customs bonds. As of December 31, 2020, we had commitments related to these bonds totaling $
In June 2020, the Company entered into a letter of credit with a bank to guarantee performance obligations under a contract with a certain customer. The obligations under this customer contract will be performed over multiple years. As of December 31, 2020, the Company was required to maintain a minimum collateral value of $
Investment Commitment
We have committed to invest up to an aggregate of $
Note 18 – Current Expected Credit Losses
Under ASC 326 – Financial Instruments – Credit Losses, the Company estimates credit losses for the contractual life of assets that are measured at amortized cost and are within the scope of this guidance, which includes accounts receivable, net investment in sales-type leases, contract assets under the revenue recognition model and outstanding notes receivable. Where appropriate, the Company pools assets if similar risk characteristics exist. Additionally, the Company analyzes its available-for-sale debt securities for impairment and records a credit loss allowance as needed.
Assets Measured at Amortized Cost
Accounts Receivable
The Company records accounts receivable in the normal course of business as products are shipped or services are performed and invoiced, but payment has not yet been remitted by the customer. Accounts receivable balances are considered past due when payment has not been received by the date indicated on the relevant invoice or based on agreed upon terms between the customer and the Company.
92
As of December 31, 2020 and January 1, 2020 (the “implementation date”), the Company’s net outstanding accounts receivable balance was $
Contract Assets
The Company records contract assets when it has recognized revenue but has not yet billed the customer. As of December 31, 2020 and January 1, 2020, the Company’s outstanding contract asset balance was $
Net Investment in Sales-Type Leases
The Company is the lessor in sales-type lease arrangements for network equipment. As of December 31, 2020 and January 1, 2020, the Company’s outstanding net investment in sales-type leases was $
93
The following table presents amortized cost basis in sales-type leases based on payment activity:
|
|
|
Sales-Type Leases Amortized Cost Basis by Origination Year |
|
|||||||||||||||||||||||||
|
(In thousands) |
|
2020 |
|
|
2019 |
|
|
2018 |
|
|
2017 |
|
|
2016 |
|
|
Prior |
|
|
Total |
|
|||||||
|
|
|
|
|
|
|
|
|
|
|
|
|
|
|
|
|
|
|
|
|
|
|
|
|
|
|
|
|
|
|
Payment performance |
|
|
|
|
|
|
|
|
|
|
|
|
|
|
|
|
|
|
|
|
|
|
|
|
|
|
|
|
|
Performing |
|
$ |
|
|
|
$ |
|
|
|
$ |
|
|
|
$ |
|
|
|
$ |
|
|
|
$ |
— |
|
|
$ |
|
|
|
Non-performing |
|
|
— |
|
|
|
— |
|
|
|
— |
|
|
|
— |
|
|
|
— |
|
|
|
— |
|
|
|
— |
|
|
Total |
|
$ |
|
|
|
$ |
|
|
|
$ |
|
|
|
$ |
|
|
|
$ |
|
|
|
$ |
— |
|
|
$ |
|
|
Sales-type lease receivables are considered past due when payment has not been received based on agreed upon terms between the customer and the Company.
Secured Loan Receivable
The Company has a secured loan receivable totaling $
Off-Balance Sheet Arrangements
The Company did not have any off-balance sheet arrangements as of December 31, 2020 or January 1, 2020.
Available-for-Sale Debt Securities
As of December 31, 2020 and January 1, 2020, the Company’s available-for-sale debt securities totaled $
The Company had
94
For those available-for-sale debt securities whose fair value was less than its amortized cost basis, the Company analyzed additional criteria such as adverse conditions specifically related to the security, an industry or geographic area, failure of the issuer of the security to make scheduled interest or principal payments, if applicable, and any changes to the rating of the security by a rating agency to determine if a credit loss existed. The Company used information provided by its investment manager to determine if any scheduled interest or principal payments had not been received and used a third party to determine if any changes to credit ratings had occurred. The Company noted that all principal and interest payments had been received as scheduled and that there had been no changes in credit ratings year-over-year or period-over-period that warranted further review.
Note 19 – Earnings (Loss) per Share
The calculations of basic and diluted earnings (loss) per share for the years ended December 31, 2020, 2019 and 2018 are as follows:
|
(In thousands, except for per share amounts) |
|
2020 |
|
|
2019 |
|
|
2018 |
|
|||
|
Numerator |
|
|
|
|
|
|
|
|
|
|
|
|
|
Net Income (Loss) |
|
$ |
|
|
|
$ |
( |
) |
|
$ |
( |
) |
|
Denominator |
|
|
|
|
|
|
|
|
|
|
|
|
|
Weighted average number of shares – basic |
|
|
|
|
|
|
|
|
|
|
|
|
|
Effect of dilutive securities: |
|
|
|
|
|
|
|
|
|
|
|
|
|
Stock options |
|
|
— |
|
|
|
— |
|
|
|
— |
|
|
PSUs, RSUs and restricted stock |
|
|
|
|
|
|
— |
|
|
|
— |
|
|
Weighted average number of shares – diluted |
|
|
|
|
|
|
|
|
|
|
|
|
|
Earnings (loss) per share – basic |
|
$ |
|
|
|
$ |
( |
) |
|
$ |
( |
) |
|
Earnings (loss) per share – diluted |
|
$ |
|
|
|
$ |
( |
) |
|
$ |
( |
) |
For the years ended December 31, 2020 and 2019,
For the year ended December 31, 2020 and 2019,
Note 20 – Restructuring
During the second half of 2019, the Company initiated a restructuring plan to realign its expense structure with the reduction in revenue experienced in recent years and overall Company objectives. As part of this restructuring plan, the Company announced plans to reduce its overall operating expenses, both in the U.S. and internationally. Management continued to assess the efficiency of operations during 2020 and, in turn, consolidated locations and personnel, among other things, where possible.
In February 2019, the Company announced the restructuring of a certain portion of its workforce predominantly in Germany, which included the closure of the Company’s office location in Munich, Germany accompanied by relocation or severance benefits for the affected employees. Voluntary early retirement was offered to certain other employees and was announced in March 2019 and again in August 2020.
The cumulative amount of restructuring expenses incurred as of December 31, 2020 for the restructuring plans announced in the second half of 2019 and continuing in 2020 was $
In January 2018, the Company announced an early retirement incentive program for employees that met certain defined requirements. The cumulative amount incurred during the year ended December 31, 2018 related to this restructuring program was $
95
A reconciliation of the beginning and ending restructuring liability, which is included in accrued wages and benefits in the Consolidated Balance Sheets as of December 31, 2020 and 2019, is as follows:
|
(In thousands) |
|
2020 |
|
|
2019 |
|
||
|
Balance at beginning of period |
|
$ |
|
|
|
$ |
|
|
|
Plus: Amounts charged to cost and expense |
|
|
|
|
|
|
|
|
|
Less: Amounts paid |
|
|
( |
) |
|
|
( |
) |
|
Balance at end of period |
|
$ |
|
|
|
$ |
|
|
Restructuring expenses included in the Consolidated Statements of Income (Loss) are for the years ended December 31, 2020, 2019 and 2018:
|
(In thousands) |
|
2020 |
|
|
2019 |
|
|
2018 |
|
|||
|
Cost of sales |
|
$ |
|
|
|
$ |
|
|
|
$ |
|
|
|
Selling, general and administrative expenses |
|
|
|
|
|
|
|
|
|
|
|
|
|
Research and development expenses |
|
|
|
|
|
|
|
|
|
|
|
|
|
Total restructuring expenses |
|
$ |
|
|
|
$ |
|
|
|
$ |
|
|
The following table represents the components of restructuring expense by geographic area for the years ended December 31, 2020, 2019 and 2018:
|
(In thousands) |
|
2020 |
|
|
2019 |
|
|
2018 |
|
|||
|
United States |
|
$ |
|
|
|
$ |
|
|
|
$ |
|
|
|
International |
|
|
|
|
|
|
|
|
|
|
|
|
|
Total restructuring expenses |
|
$ |
|
|
|
$ |
|
|
|
$ |
|
|
Note 21 – Summarized Quarterly Financial Data (Unaudited)
The following table presents unaudited quarterly operating results for each of the last eight fiscal quarters. This information has been prepared on a basis consistent with the audited financial statements and includes all adjustments, consisting only of normal recurring adjustments, considered necessary for a fair presentation of the data.
Unaudited Quarterly Operating Results
|
|
|
Three Months Ended |
|
|
|||||||||||||
|
(In thousands, except for per share amounts) |
|
March 31, 2020(2) |
|
|
June 30, 2020 |
|
|
September 30, 2020 |
|
|
December 31, 2020 |
|
|
||||
|
Total Sales |
|
$ |
|
|
|
$ |
|
|
|
$ |
|
|
|
$ |
|
|
|
|
Gross Profit |
|
$ |
|
|
|
$ |
|
|
|
$ |
|
|
|
$ |
|
|
|
|
Operating Income (Loss) |
|
$ |
( |
) |
|
$ |
( |
) |
|
$ |
|
|
|
$ |
( |
) |
|
|
Net Income (Loss) |
|
$ |
( |
) |
|
$ |
|
|
|
$ |
|
|
|
$ |
|
|
|
|
Earnings (loss) per common share - basic |
|
$ |
( |
) |
|
$ |
|
|
|
$ |
|
|
|
$ |
|
|
|
|
Earnings (loss) per common share - diluted |
|
$ |
( |
) |
|
$ |
|
|
(1) |
$ |
|
|
(1) |
$ |
|
|
(1) |
|
|
|
Three Months Ended |
|
|
|||||||||||||
|
(In thousands, except for per share amounts) |
|
March 31, 2019 |
|
|
June 30, 2019(2) |
|
|
September 30, 2019 |
|
|
December 31, 2019 |
|
|
||||
|
Total Sales |
|
$ |
|
|
|
$ |
|
|
|
$ |
|
|
|
$ |
|
|
|
|
Gross Profit |
|
$ |
|
|
|
$ |
|
|
|
$ |
|
|
|
$ |
|
|
|
|
Operating Income (Loss) |
|
$ |
( |
) |
|
$ |
|
|
|
$ |
( |
) |
|
$ |
( |
) |
|
|
Net Income (Loss) |
|
$ |
|
|
|
$ |
|
|
|
$ |
( |
) |
|
$ |
( |
) |
|
|
Earnings (loss) per common share - basic |
|
$ |
|
|
|
$ |
|
|
|
$ |
( |
) |
|
$ |
( |
) |
|
|
Earnings (loss) per common share - diluted |
|
$ |
|
|
(1) |
$ |
|
|
(1) |
$ |
( |
) |
|
$ |
( |
) |
|
|
|
(1) |
Assumes exercise of dilutive securities calculated under the treasury stock method. |
|
|
(2) |
See footnote 1 for discussion on out of period disclosures impacting these quarterly operating results. |
96
Note 22 – Subsequent Events
On
As part of our required pledged collateral related to a letter for credit agreement entered into with a bank to guarantee performance obligations under a contract with a certain customer, the Company increased its pledged collateral to $
97
|
ITEM 9. |
CHANGES IN AND DISAGREEMENTS WITH ACCOUNTANTS ON ACCOUNTING AND FINANCIAL DISCLOSURE |
None.
|
ITEM 9A. |
CONTROLS AND PROCEDURES |
Evaluation of Disclosure Controls and Procedures
We maintain disclosure controls and procedures that are designed to provide reasonable assurance that the information required to be disclosed by us in reports that we file or submit under the Securities Exchange Act of 1934, as amended (the “Exchange Act”), is recorded, processed, summarized and reported within the time periods specified in the rules and forms promulgated by the SEC, and that such information is accumulated and communicated to our management, including our Chief Executive Officer and our Chief Financial Officer, as appropriate, to allow timely decisions regarding required disclosure. Because of the inherent limitations to the effectiveness of any system of disclosure controls and procedures, no evaluation of disclosure controls and procedures can provide absolute assurance that all control issues, if any, with a company have been prevented or detected on a timely basis. Even disclosure controls and procedures determined to be effective can only provide reasonable assurance that their objectives are achieved.
As of the end of the period covered by this report, an evaluation was carried out by management, including our Chief Executive Officer and our Chief Financial Officer, of the effectiveness of our disclosure controls and procedures, as such term is defined under Rule 13a-15(e) promulgated under the Exchange Act. Based on that evaluation, our Chief Executive Officer and our Chief Financial Officer concluded that our disclosure controls and procedures were effective at the reasonable assurance level.
Internal Control over Financial Reporting.
Section 404 of the Sarbanes-Oxley Act of 2002 requires management to include in our Annual Report on Form 10-K a report on management’s assessment of the effectiveness of our internal control over financial reporting, as well as a report from our independent registered public accounting firm on the effectiveness of our internal control over financial reporting. Management’s report on internal control over financial reporting is included below, and the related report from our independent registered public accounting firm is located in Part II, Item 8, “Financial Statements and Supplementary Data,” of this Annual Report on Form 10-K.
Changes in Internal Control over Financial Reporting.
During the fourth quarter of 2020, ADTRAN, Inc. began implementing a new enterprise resource planning (“ERP”) software solution. As of December 31, 2020, the Company was still reliant on its existing procedures and controls. The Company continues to work toward implementation of the new ERP system and expects to complete that process during 2021. There were no other changes in the Company’s internal control over financial reporting that occurred during the most recent fiscal quarter covered by this report that have materially affected, or are reasonably likely to materially affect, its internal control over financial reporting.
Management’s Report on Internal Control over Financial Reporting
Management of ADTRAN, Inc. is responsible for establishing and maintaining adequate internal control over financial reporting as defined in Rules 13a-15(f) and 15d-15(f) under the Securities Exchange Act of 1934, as amended. ADTRAN’s internal control over financial reporting is designed to provide reasonable assurance regarding the reliability of financial reporting and the preparation of financial statements for external purposes in accordance with generally accepted accounting principles. ADTRAN’s internal control over financial reporting includes those policies and procedures that:
|
|
• |
pertain to the maintenance of records that, in reasonable detail, accurately and fairly reflect the transactions and dispositions of the assets of ADTRAN; |
|
|
• |
provide reasonable assurance that transactions are recorded as necessary to permit preparation of financial statements in accordance with generally accepted accounting principles, and that receipts and expenditures of ADTRAN are being made only in accordance with authorizations of management and directors of ADTRAN; and |
|
|
• |
provide reasonable assurance regarding prevention or timely detection of unauthorized acquisition, use or disposition of ADTRAN’s assets that could have a material effect on the financial statements. |
98
Because of its inherent limitations, internal control over financial reporting may not prevent or detect misstatements. Also, projections of any evaluation of effectiveness to future periods are subject to the risk that controls may become inadequate because of changes in conditions, or that the degree of compliance with the policies or procedures may deteriorate.
Management assessed the effectiveness of ADTRAN’s internal control over financial reporting as of December 31, 2020. In making this assessment, management used the criteria set forth by the Committee of Sponsoring Organizations of the Treadway Commission (COSO) in Internal Control-Integrated Framework (2013).
Based on our assessment and those criteria, management has concluded that ADTRAN maintained effective internal control over financial reporting as of December 31, 2020.
The effectiveness of the Company’s internal control over financial reporting as of December 31, 2020 has been audited by PricewaterhouseCoopers LLP, an independent registered public accounting firm, as stated in their report which appears in Item 8.
|
ITEM 9B. |
OTHER INFORMATION |
None.
99
PART III
|
ITEM 10. |
DIRECTORS, EXECUTIVE OFFICERS AND CORPORATE GOVERNANCE |
Code of Ethics
We have adopted the ADTRAN, Inc. Code of Business Conduct and Ethics, which applies to all employees, officers and directors of ADTRAN. The Code of Business Conduct and Ethics meets the requirements of a "code of ethics" as defined by Item 406 of Regulation S-K, and applies to our Chief Executive Officer, Chief Financial Officer (who is both our principal financial and principal accounting officer), as well as all other employees, as indicated above. The Code of Business Conduct and Ethics also meets the requirements of a code of conduct under NASDAQ listing standards. The Code of Business Conduct and Ethics is posted on our website at www.adtran.com under the links "About – Investor Relations – Corporate Governance – Charters and Documents – Code of Business Conduct and Ethics." We intend to disclose any amendments to the Code of Business Conduct and Ethics, as well as any waivers for executive officers or directors, on our website at www.adtran.com.
Certain information required by this Item regarding ADTRAN’s executive officers is included in Part I of this Annual Report on Form 10-K under the caption “Information about our Executive Officers” in accordance with the Instructions to Item 401 of Regulation S-K.
Other information required by this Item is incorporated by reference pursuant to General Instruction G(3) of Form 10-K from ADTRAN’s definitive Proxy Statement for the 2021 Annual Meeting of Stockholders (the “2021 Proxy Statement”) to be filed with the SEC pursuant to Regulation 14A.
|
ITEM 11. |
EXECUTIVE COMPENSATION |
The information required by this Item is incorporated by reference pursuant to General Instruction G(3) of Form 10-K from the 2021 Proxy Statement to be filed with the SEC pursuant to Regulation 14A.
|
ITEM 12. |
SECURITY OWNERSHIP OF CERTAIN BENEFICIAL OWNERS AND MANAGEMENT AND RELATED STOCKHOLDER MATTERS |
Securities Authorized for Issuance Under Equity Compensation Plans
The following table provides information about our common stock that may be issued under all of our existing equity compensation plans as of December 31, 2020, which includes the 2020 Employee Stock Plan and the 2020 Directors Stock Plan (the “Plans”). Each of the Plans has been approved by our stockholders.
|
Plan Category |
|
Number of securities to be issued upon exercise of outstanding options, warrants and rights |
|
|
Weighted average exercise price of outstanding options, warrants and rights |
|
|
Number of securities remaining available for future issuance under equity compensation plans |
|
|
|||
|
Equity compensation plans approved by stockholders |
|
|
3,950,646 |
|
(1) |
$ |
18.30 |
|
|
|
3,602,976 |
|
(2) |
|
Equity compensation plans not approved by stockholders |
|
|
— |
|
|
$ |
— |
|
|
|
— |
|
|
|
TOTAL |
|
|
3,950,646 |
|
(1) |
$ |
18.30 |
|
|
|
3,602,976 |
|
(2) |
|
(1) |
Does not include 613,438 target performance share awards outstanding under the Plans as of December 31, 2020. |
|
(2) |
Represents 3,220,820 shares of common stock available for future issuance pursuant to the 2020 Employee Stock Plan (assuming target payout of outstanding performance share awards) and 382,156 shares of common stock available for future issuance pursuant to the 2020 Directors Stock Plan. Certain shares underlying awards that are forfeited, cancelled or terminated under the Plans will again be available for issuance under the 2020 Employee Stock Plan or the 2020 Directors Stock Plan, as applicable and as described in Note 5 of Notes to Consolidated Financial Statements included in Part II, Item 8 of this report. |
The other information required by this Item is incorporated by reference pursuant to General Instruction G(3) of Form 10-K from the 2021 Proxy Statement to be filed with the Securities and Exchange Commission pursuant to Regulation 14A.
100
|
ITEM 13. |
CERTAIN RELATIONSHIPS AND RELATED TRANSACTIONS AND DIRECTOR INDEPENDENCE |
The information required by this Item is incorporated by reference pursuant to General Instruction G(3) of Form 10-K from the 2021 Proxy Statement to be filed with the SEC pursuant to Regulation 14A.
|
ITEM 14. |
PRINCIPAL ACCOUNTANT FEES AND SERVICES |
The information required by this Item is incorporated by reference pursuant to General Instruction G(3) of Form 10-K from the 2021 Proxy Statement to be filed with the SEC pursuant to Regulation 14A.
101
PART IV
|
ITEM 15. |
EXHIBITS AND FINANCIAL STATEMENT SCHEDULES |
Documents Filed as Part of This Report.
1. Consolidated Financial Statements
The consolidated financial statements of ADTRAN and the report of independent registered public accounting firm thereon are set forth under Part II, Item 8 of this report.
Consolidated Balance Sheets as of December 31, 2020 and 2019
Consolidated Statements of Income (Loss) for the years ended December 31, 2020, 2019 and 2018
Consolidated Statements of Comprehensive Income for the years ended December 31, 2020, 2019 and 2018
Consolidated Statements of Changes in Stockholders' Equity for the years ended December 31, 2020, 2019 and 2018
Consolidated Statements of Cash Flows for the years ended December 31, 2020, 2019 and 2018
Notes to Consolidated Financial Statements
2. Consolidated Financial Statement Schedule
Schedule II - Valuation and Qualifying Accounts
3. Exhibits
The following exhibits are filed with or incorporated by reference in this report. Where such filing is made by incorporation by reference to a previously filed registration statement or report, such registration statement or report is identified in parentheses. We will furnish any exhibit upon request to: ADTRAN, Inc., Attn: Investor Relations, 901 Explorer Boulevard, Huntsville, Alabama 35806. There is a charge of $0.50 per page to cover expenses for copying and mailing.
|
Exhibit Number |
|
Description |
|||
|
|
|
|
|
|
|
|
2.1† |
|
||||
|
|
|
|
|
|
|
|
3.1 |
|
Certificate of Incorporation, as amended (Exhibit 3.1 to ADTRAN's Registration Statement on Form S-1, No. 33-81062). (P) |
|||
|
|
|
|
|
|
|
|
3.2 |
|
Bylaws, as amended (Exhibit 3.1 to ADTRAN's Form 8-K filed July 23, 2020). |
|||
|
|
|
|
|||
|
4.1 |
|
Description of Securities (Exhibit 4.1 to ADTRAN’s Form 10-K filed February 25, 2020). |
|||
|
|
|
|
|
|
|
|
10.1 |
|
Documents relative to the $50,000,000 Taxable Revenue Bond, Series 1995 (ADTRAN, Inc. Project) issued by the Alabama State Industrial Development Authority, consisting of the following: |
|||
|
|
|
|
|
|
|
|
|
|
(a) |
|
||
|
|
|
|
|
|
|
|
|
|
(b) |
|
||
|
|
|
|
|
|
|
|
|
|
(c) |
|
||
|
|
|
|
|
|
|
|
|
|
(d) |
|
||
|
|
|
|
|
|
|
|
|
|
(e) |
|
||
102
|
Exhibit Number |
|
Description |
|||
|
|
|
|
|
|
|
|
|
|
(f) |
|
||
|
|
|
|
|
|
|
|
|
|
(g) |
|
||
|
|
|
|
|
|
|
|
|
|
(h) |
|
||
|
|
|
|
|
|
|
|
10.2 |
|
Tax Indemnification Agreement dated July 1, 1994 by and among ADTRAN and the stockholders of ADTRAN prior to ADTRAN's initial public offering of Common Stock (Exhibit 10.5 to the 1994 Form 10-K). (P) |
|||
|
|
|
|
|
|
|
|
10.3 |
|
Management Contracts and Compensatory Plans: |
|||
|
|
|
|
|
|
|
|
|
|
(a) |
|
||
|
|
|
|
|
|
|
|
|
|
(b) |
|
Form of Notice Letter under the ADTRAN, Inc. Variable Incentive Compensation Plan. (Exhibit 10.3(b) to ADTRAN’s Form 10-K filed February 25, 2020). |
|
|
|
|
|
|
|
|
|
|
|
(c) |
|
||
|
|
|
|
|
|
|
|
|
|
(d) |
|
||
|
|
|
|
|
|
|
|
|
|
(e) |
|
||
|
|
|
|
|
|
|
|
|
|
(f) |
|
||
|
|
|
|
|
|
|
|
|
|
(g) |
|
||
|
|
|
|
|
|
|
|
|
|
(h) |
|
ADTRAN, Inc. 2010 Directors Stock Plan (Exhibit 4.3 to ADTRAN’s Form S-8 filed July 30, 2010). |
|
|
|
|
|
|
|
|
|
|
|
(i) |
|
||
|
|
|
|
|
|
|
|
|
|
(j) |
|
||
|
|
|
|
|
|
|
|
|
|
(k) |
|
||
|
|
|
|
|
|
|
|
|
|
(l) |
|
||
|
|
|
|
|
|
|
|
|
|
(m) |
|
||
|
|
|
|
|
|
|
|
|
|
(n) |
|
||
|
|
|
|
|
|
|
|
|
|
(o) |
|
||
|
|
|
|
|
|
|
|
|
|
(p) |
|
||
|
|
|
|
|
|
|
103
|
Exhibit Number |
|
Description |
|||
|
|
|
(q) |
|
||
|
|
|
|
|
|
|
|
|
|
(r) |
|
||
|
|
|
|
|
|
|
|
|
|
(s) |
|
||
|
|
|
|
|
|
|
|
|
|
(t) |
|
||
|
|
|
|
|
|
|
|
|
|
(u) |
|
Service Agreement, entered into effective June 25, 2019, between Eduard Scheiterer and ADTRAN GmbH. (Exhibit 10.3(w) to ADTRAN’s Form 10-K filed February 25, 2020). |
|
|
|
|
|
|
|
|
|
|
|
(v) |
|
Form of Clawback Agreement, entered into between ADTRAN, Inc. and each executive officer of ADTRAN, Inc. (Exhibit 10.3(x) to ADTRAN’s Form 10-K filed February 25, 2020). |
|
|
|
|
|
|
|
|
|
|
|
(w) |
|
Employment Offer Letter, dated September 25, 2018, between Raymond Harris and ADTRAN, Inc. (Exhibit 10.3(y) to ADTRAN’s Form 10-K filed February 25, 2020). |
|
|
|
|
|
|
|
|
|
|
|
(x) |
|
Employment Offer Letter, dated November 29, 2018, between Jeffery F. McInnis and ADTRAN, Inc. (Exhibit 10.3(z) to ADTRAN’s Form 10-K filed February 25, 2020). |
|
|
|
|
|
|
|
|
|
|
|
(y) |
|
||
|
|
|
|
|
|
|
|
|
|
(z) |
|
||
104
|
Exhibit Number |
|
Description |
|||
|
|
|
|
|
|
|
|
|
|
(aa) |
|
||
|
|
|
|
|
|
|
|
|
|
(ab) |
|
ADTRAN, Inc. 2020 Directors Stock Plan (Exhibit 10.2 to ADTRAN’s Form 10-Q filed August 7, 2020). |
|
|
|
|
|
|
|
|
|
|
|
(ac) |
|
||
|
|
|
|
|
|
|
|
|
|
(ad)* |
|
||
|
|
|
|
|
|
|
|
|
|
(ae)* |
|
Form of Notice Letter under the ADTRAN, Inc. 2020 Employee Stock Incentive Plan. |
|
|
|
|
|
|
|
|
|
|
|
(af)* |
|
Form of Notice Letter under the ADTRAN, Inc. 2020 Directors Stock Incentive Plan. |
|
|
|
|
|
|
|
|
|
10.4+ |
|
|
|
||
|
10.5 |
|
||||
|
|
|
|
|||
|
10.6+ |
|
||||
|
|
|
|
|||
|
10.7 |
|
||||
|
|
|
|
|||
|
21* |
|
||||
|
|
|
|
|||
|
23* |
|
||||
|
|
|
|
|
|
|
|
24* |
|
||||
|
|
|
|
|
|
|
|
31* |
|
||||
|
|
|
|
|
|
|
|
32* |
|
||||
|
|
|
|
|
|
|
|
101 |
|
The following financial statements from the Company's Annual Report on Form 10-K for the year ended December 31, 2020, formatted in inline eXtensible Business Reporting Language (iXBRL): (i) Consolidated Balance Sheets, (ii) Consolidated Statements of Income (Loss), (iii) Consolidated Statements of Comprehensive Income, (iv) Consolidated Statements of Changes in Stockholders' Equity, (v) Consolidated Statements of Cash Flows, (vi) Notes to Consolidated Financial Statements, and (vii) Schedule II – Valuation and Qualifying Accounts. |
|||
|
|
|
|
|
|
|
|
104 |
|
Cover Page Interactive Data File (formatted in iXBRL and contained in Exhibit 101) |
|||
|
|
|
|
|
|
|
|
|
|
|
|||
|
* |
Filed herewith |
(P) Indicates a paper filing with the SEC.
|
+ |
Schedules and exhibits omitted pursuant to Item 601(a)(5) of Regulation S-K. The Company agrees to furnish a copy of any omitted schedule or exhibit to the SEC upon request. |
|
† |
Confidential treatment has been requested as to certain portions of this document. Each such portion, which has been omitted therein and replaced with an asterisk (*), has been filed separately with the Securities and Exchange Commission. |
105
|
ITEM 16. |
FORM 10-K SUMMARY |
ADTRAN has elected not to provide a summary of the information contained in this report at this time.
106
SIGNATURES
Pursuant to the requirements of Section 13 or 15(d) of the Securities Exchange Act of 1934, the Registrant has duly caused this report to be signed on its behalf by the undersigned, thereunto duly authorized on February 26, 2021.
|
ADTRAN, Inc. (Registrant) |
||
|
|
|
|
|
By: |
|
/s/ Michael Foliano |
|
|
|
Michael Foliano |
|
|
|
Senior Vice President of Finance and |
|
|
|
Chief Financial Officer |
|
|
|
(Principal Accounting Officer) |
Pursuant to the requirements of the Securities Exchange Act of 1934, this report has been signed below by the following persons on behalf of the Registrant and in the capacities indicated on February 26, 2021.
|
Signature |
|
Title |
|
|
|
|
|
/s/ Thomas R. Stanton |
|
Chief Executive Officer and Chairman of the Board (Principal Executive Officer) |
|
Thomas R. Stanton |
|
|
|
|
|
|
|
/s/ Michael Foliano |
|
Senior Vice President of Finance and Chief Financial Officer (Principal Financial Officer and Principal Accounting Officer) |
|
Michael Foliano |
|
|
|
|
|
|
|
/s/ H. Fenwick Huss* |
|
Director |
|
H. Fenwick Huss |
|
|
|
|
|
|
|
/s/ Gregory McCray* |
|
Director |
|
Gregory McCray |
|
|
|
|
|
|
|
/s/ Balan Nair* |
|
Director |
|
Balan Nair |
|
|
|
|
|
|
|
/s/ Jacqueline H. Rice* |
|
Director |
|
Jacqueline H. Rice |
|
|
|
|
|
|
|
/s/ Kathryn A. Walker* |
|
Director |
|
Kathryn A. Walker |
|
|
|
|
|
|
|
|
|
|
|
|
|
|
|
*By: |
|
/s/ Michael Foliano |
|
|
|
Michael Foliano as Attorney in Fact |
107
ADTRAN, INC.
SCHEDULE II
VALUATION AND QUALIFYING ACCOUNTS
|
(In thousands) |
|
Balance at Beginning of Period |
|
|
Charged to Costs & Expenses |
|
|
Deductions |
|
|
Balance at End of Period |
|
||||
|
Year ended December 31, 2020 |
|
|
|
|
|
|
|
|
|
|
|
|
|
|
|
|
|
Allowance for Doubtful Accounts |
|
$ |
|
|
|
|
— |
|
|
|
— |
|
|
$ |
|
|
|
Inventory Reserve |
|
$ |
|
|
|
|
|
|
|
|
|
|
|
$ |
|
|
|
Warranty Liability |
|
$ |
|
|
|
|
|
|
|
|
|
|
|
$ |
|
|
|
Deferred Tax Asset Valuation Allowance |
|
$ |
|
|
|
|
|
|
|
|
|
|
|
$ |
|
|
|
Year ended December 31, 2019 |
|
|
|
|
|
|
|
|
|
|
|
|
|
|
|
|
|
Allowance for Doubtful Accounts |
|
$ |
|
|
|
|
|
|
|
|
|
|
|
$ |
|
|
|
Inventory Reserve |
|
$ |
|
|
|
|
|
|
|
|
|
|
|
$ |
|
|
|
Warranty Liability |
|
$ |
|
|
|
|
|
|
|
|
|
|
|
$ |
|
|
|
Deferred Tax Asset Valuation Allowance |
|
$ |
|
|
|
|
|
|
|
|
|
|
|
$ |
|
|
|
Year ended December 31, 2018 |
|
|
|
|
|
|
|
|
|
|
|
|
|
|
|
|
|
Allowance for Doubtful Accounts |
|
$ |
— |
|
|
|
|
|
|
|
— |
|
|
$ |
|
|
|
Inventory Reserve |
|
$ |
|
|
|
|
|
|
|
|
|
|
|
$ |
|
|
|
Warranty Liability |
|
$ |
|
|
|
|
|
|
|
|
|
|
|
$ |
|
|
|
Deferred Tax Asset Valuation Allowance |
|
$ |
|
|
|
|
— |
|
|
|
|
|
|
$ |
|
|
108