0000921638FALSE2021FY0.66670.0541082http://fasb.org/us-gaap/2021-01-31#PropertyPlantAndEquipmentAndFinanceLeaseRightOfUseAssetAfterAccumulatedDepreciationAndAmortizationhttp://fasb.org/us-gaap/2021-01-31#PropertyPlantAndEquipmentAndFinanceLeaseRightOfUseAssetAfterAccumulatedDepreciationAndAmortizationhttp://fasb.org/us-gaap/2021-01-31#OtherAssetsNoncurrenthttp://fasb.org/us-gaap/2021-01-31#OtherAssetsNoncurrenthttp://www.ssrmining.com/20211231#AccruedLiabilitiesAndOtherLiabilitiesCurrenthttp://www.ssrmining.com/20211231#AccruedLiabilitiesAndOtherLiabilitiesCurrenthttp://fasb.org/us-gaap/2021-01-31#OtherLiabilitiesNoncurrenthttp://fasb.org/us-gaap/2021-01-31#OtherLiabilitiesNoncurrent00009216382021-01-012021-12-3100009216382021-06-30iso4217:USD00009216382022-01-31xbrli:shares00009216382020-01-012020-12-3100009216382019-01-012019-12-31iso4217:USDxbrli:shares00009216382020-12-3100009216382019-12-3100009216382018-12-3100009216382021-12-310000921638us-gaap:CommonStockMember2018-12-310000921638us-gaap:RetainedEarningsMember2018-12-310000921638us-gaap:ParentMember2018-12-310000921638us-gaap:NoncontrollingInterestMember2018-12-310000921638us-gaap:CommonStockMember2019-01-012019-12-310000921638us-gaap:ParentMember2019-01-012019-12-310000921638us-gaap:NoncontrollingInterestMember2019-01-012019-12-310000921638us-gaap:RetainedEarningsMember2019-01-012019-12-310000921638us-gaap:CommonStockMember2019-12-310000921638us-gaap:RetainedEarningsMember2019-12-310000921638us-gaap:ParentMember2019-12-310000921638us-gaap:NoncontrollingInterestMember2019-12-310000921638us-gaap:CommonStockMember2020-01-012020-12-310000921638us-gaap:ParentMember2020-01-012020-12-310000921638us-gaap:NoncontrollingInterestMember2020-01-012020-12-310000921638us-gaap:RetainedEarningsMember2020-01-012020-12-310000921638us-gaap:CommonStockMember2020-12-310000921638us-gaap:RetainedEarningsMember2020-12-310000921638us-gaap:ParentMember2020-12-310000921638us-gaap:NoncontrollingInterestMember2020-12-310000921638us-gaap:CommonStockMember2021-01-012021-12-310000921638us-gaap:RetainedEarningsMember2021-01-012021-12-310000921638us-gaap:ParentMember2021-01-012021-12-310000921638us-gaap:NoncontrollingInterestMember2021-01-012021-12-310000921638us-gaap:CommonStockMember2021-12-310000921638us-gaap:RetainedEarningsMember2021-12-310000921638us-gaap:ParentMember2021-12-310000921638us-gaap:NoncontrollingInterestMember2021-12-31ssrm:minessrm:segment0000921638us-gaap:VehiclesMembersrt:MinimumMember2021-01-012021-12-310000921638srt:MaximumMemberus-gaap:VehiclesMember2021-01-012021-12-310000921638srt:MinimumMemberssrm:MiningEquipmentMember2021-01-012021-12-310000921638srt:MaximumMemberssrm:MiningEquipmentMember2021-01-012021-12-310000921638srt:MinimumMemberssrm:MobileEquipmentComponentsMember2021-01-012021-12-310000921638srt:MaximumMemberssrm:MobileEquipmentComponentsMember2021-01-012021-12-310000921638us-gaap:BuildingMembersrt:MinimumMember2021-01-012021-12-310000921638srt:MaximumMemberus-gaap:BuildingMember2021-01-012021-12-310000921638ssrm:MinePlantEquipmentMembersrt:MinimumMember2021-01-012021-12-310000921638srt:MaximumMemberssrm:MinePlantEquipmentMember2021-01-012021-12-310000921638ssrm:UndergroundInfrastructureMembersrt:MinimumMember2021-01-012021-12-310000921638srt:MaximumMemberssrm:UndergroundInfrastructureMember2021-01-012021-12-310000921638srt:MinimumMemberssrm:RightOutUseAssetPlantAndEquipmentMember2021-01-012021-12-310000921638srt:MaximumMemberssrm:RightOutUseAssetPlantAndEquipmentMember2021-01-012021-12-310000921638ssrm:TaigaGoldCorporationMember2021-12-02iso4217:CADxbrli:shares00009216382021-12-02ssrm:property0000921638ssrm:AmiskAlbertaCanadaMemberssrm:TaigaGoldCorporationMember2021-12-02xbrli:pure0000921638ssrm:FisherPropertyMemberssrm:TaigaGoldCorporationMember2021-12-020000921638ssrm:FisherPropertyMemberssrm:TaigaGoldCorporationMemberssrm:TaigaGoldCorporationMember2021-12-020000921638ssrm:AlacerGoldCorporationMemberus-gaap:CommonStockMember2020-09-162020-09-160000921638ssrm:AlacerGoldCorporationMember2020-09-160000921638ssrm:AnagoldMadencilikSanayiVeTicaretAnonimIrketiMemberssrm:AlacerGoldCorporationMember2020-09-160000921638ssrm:LidyaMadencilikSanayiVeTicaretAnonimIrketiMemberssrm:AlacerGoldCorporationMember2020-09-160000921638ssrm:AlacerGoldCorporationMember2020-09-152020-09-150000921638ssrm:AlacerGoldCorporationMember2021-01-012021-12-310000921638ssrm:AlacerGoldCorporationMember2020-01-012020-12-310000921638ssrm:RestrictedStockUnitsPerformanceSharesAndDeferredShareUnitsMemberssrm:AlacerGoldCorporationMember2020-09-162020-09-160000921638ssrm:AlacerGoldCorporationMember2020-09-162020-09-160000921638ssrm:AlacerGoldCorporationMemberus-gaap:CommonStockMember2020-09-152020-09-150000921638ssrm:AlacerGoldCorporationMemberus-gaap:CommonStockMember2020-09-150000921638ssrm:AlacerGoldCorporationMemberus-gaap:RestrictedStockUnitsRSUMember2020-09-152020-09-150000921638us-gaap:PerformanceSharesMemberssrm:AlacerGoldCorporationMember2020-09-152020-09-150000921638ssrm:DeferredShareUnitsMemberssrm:AlacerGoldCorporationMember2020-09-152020-09-150000921638ssrm:AlacerGoldCorporationMemberssrm:AlacerGoldCorporationMember2020-09-150000921638ssrm:PunaMember2019-09-180000921638ssrm:PunaMember2019-09-182019-09-180000921638ssrm:PunaMember2019-09-170000921638ssrm:RoyaltyPortfolioMemberus-gaap:DisposalGroupDisposedOfBySaleNotDiscontinuedOperationsMember2021-10-210000921638ssrm:RoyaltyPortfolioMemberus-gaap:MeasurementInputDiscountRateMemberus-gaap:DisposalGroupDisposedOfBySaleNotDiscontinuedOperationsMember2021-10-210000921638ssrm:RoyaltyPortfolioMemberus-gaap:DisposalGroupDisposedOfBySaleNotDiscontinuedOperationsMember2021-01-012021-06-300000921638ssrm:RoyaltyPortfolioMemberus-gaap:DisposalGroupDisposedOfBySaleNotDiscontinuedOperationsMember2021-10-212021-10-210000921638us-gaap:OperatingSegmentsMemberssrm:PlerMember2021-01-012021-12-310000921638us-gaap:OperatingSegmentsMemberssrm:MarigoldMember2021-01-012021-12-310000921638us-gaap:OperatingSegmentsMemberssrm:SeabeeMember2021-01-012021-12-310000921638us-gaap:OperatingSegmentsMemberssrm:PunaMember2021-01-012021-12-310000921638us-gaap:OperatingSegmentsMemberssrm:ExplorationEvaluationAndDevelopmentPropertiesMember2021-01-012021-12-310000921638us-gaap:CorporateNonSegmentMember2021-01-012021-12-310000921638us-gaap:OperatingSegmentsMemberssrm:PlerMember2021-12-310000921638us-gaap:OperatingSegmentsMemberssrm:MarigoldMember2021-12-310000921638us-gaap:OperatingSegmentsMemberssrm:SeabeeMember2021-12-310000921638us-gaap:OperatingSegmentsMemberssrm:PunaMember2021-12-310000921638us-gaap:OperatingSegmentsMemberssrm:ExplorationEvaluationAndDevelopmentPropertiesMember2021-12-310000921638us-gaap:CorporateNonSegmentMember2021-12-310000921638us-gaap:OperatingSegmentsMemberssrm:PlerMember2020-01-012020-12-310000921638us-gaap:OperatingSegmentsMemberssrm:MarigoldMember2020-01-012020-12-310000921638us-gaap:OperatingSegmentsMemberssrm:SeabeeMember2020-01-012020-12-310000921638us-gaap:OperatingSegmentsMemberssrm:PunaMember2020-01-012020-12-310000921638us-gaap:OperatingSegmentsMemberssrm:ExplorationEvaluationAndDevelopmentPropertiesMember2020-01-012020-12-310000921638us-gaap:CorporateNonSegmentMember2020-01-012020-12-310000921638us-gaap:OperatingSegmentsMemberssrm:PlerMember2020-12-310000921638us-gaap:OperatingSegmentsMemberssrm:MarigoldMember2020-12-310000921638us-gaap:OperatingSegmentsMemberssrm:SeabeeMember2020-12-310000921638us-gaap:OperatingSegmentsMemberssrm:PunaMember2020-12-310000921638us-gaap:OperatingSegmentsMemberssrm:ExplorationEvaluationAndDevelopmentPropertiesMember2020-12-310000921638us-gaap:CorporateNonSegmentMember2020-12-310000921638us-gaap:OperatingSegmentsMemberssrm:MarigoldMember2019-01-012019-12-310000921638us-gaap:OperatingSegmentsMemberssrm:SeabeeMember2019-01-012019-12-310000921638us-gaap:OperatingSegmentsMemberssrm:PunaMember2019-01-012019-12-310000921638us-gaap:OperatingSegmentsMemberssrm:ExplorationEvaluationAndDevelopmentPropertiesMember2019-01-012019-12-310000921638us-gaap:CorporateNonSegmentMember2019-01-012019-12-310000921638us-gaap:OperatingSegmentsMemberssrm:MarigoldMember2019-12-310000921638us-gaap:OperatingSegmentsMemberssrm:SeabeeMember2019-12-310000921638us-gaap:OperatingSegmentsMemberssrm:PunaMember2019-12-310000921638us-gaap:OperatingSegmentsMemberssrm:ExplorationEvaluationAndDevelopmentPropertiesMember2019-12-310000921638us-gaap:CorporateNonSegmentMember2019-12-310000921638us-gaap:OperatingSegmentsMembercountry:TR2021-12-310000921638us-gaap:OperatingSegmentsMembercountry:TR2020-12-310000921638us-gaap:OperatingSegmentsMembercountry:CA2021-12-310000921638us-gaap:OperatingSegmentsMembercountry:CA2020-12-310000921638us-gaap:OperatingSegmentsMembercountry:US2021-12-310000921638us-gaap:OperatingSegmentsMembercountry:US2020-12-310000921638us-gaap:OperatingSegmentsMembercountry:AR2021-12-310000921638us-gaap:OperatingSegmentsMembercountry:AR2020-12-310000921638us-gaap:OperatingSegmentsMembercountry:MX2021-12-310000921638us-gaap:OperatingSegmentsMembercountry:MX2020-12-310000921638us-gaap:OperatingSegmentsMembercountry:PE2021-12-310000921638us-gaap:OperatingSegmentsMembercountry:PE2020-12-310000921638us-gaap:OperatingSegmentsMember2021-12-310000921638us-gaap:OperatingSegmentsMember2020-12-310000921638country:TR2021-01-012021-12-310000921638country:TR2020-01-012020-12-310000921638country:TR2019-01-012019-12-310000921638country:CA2021-01-012021-12-310000921638country:CA2020-01-012020-12-310000921638country:CA2019-01-012019-12-310000921638country:US2021-01-012021-12-310000921638country:US2020-01-012020-12-310000921638country:US2019-01-012019-12-310000921638country:AR2021-01-012021-12-310000921638country:AR2020-01-012020-12-310000921638country:AR2019-01-012019-12-310000921638ssrm:PlerMemberssrm:GoldDoreSalesMember2021-01-012021-12-310000921638ssrm:PlerMemberssrm:GoldDoreSalesMember2020-01-012020-12-310000921638ssrm:PlerMemberssrm:GoldDoreSalesMember2019-01-012019-12-310000921638ssrm:MarigoldMemberssrm:GoldDoreSalesMember2021-01-012021-12-310000921638ssrm:MarigoldMemberssrm:GoldDoreSalesMember2020-01-012020-12-310000921638ssrm:MarigoldMemberssrm:GoldDoreSalesMember2019-01-012019-12-310000921638ssrm:SeabeeMemberssrm:GoldDoreSalesMember2021-01-012021-12-310000921638ssrm:SeabeeMemberssrm:GoldDoreSalesMember2020-01-012020-12-310000921638ssrm:SeabeeMemberssrm:GoldDoreSalesMember2019-01-012019-12-310000921638ssrm:ConcentrateSalesMemberssrm:PunaMember2021-01-012021-12-310000921638ssrm:ConcentrateSalesMemberssrm:PunaMember2020-01-012020-12-310000921638ssrm:ConcentrateSalesMemberssrm:PunaMember2019-01-012019-12-310000921638ssrm:OtherProductsMemberssrm:PlerMember2021-01-012021-12-310000921638ssrm:OtherProductsMemberssrm:PlerMember2020-01-012020-12-310000921638ssrm:OtherProductsMemberssrm:PlerMember2019-01-012019-12-310000921638ssrm:OtherProductsMemberssrm:MarigoldMember2021-01-012021-12-310000921638ssrm:OtherProductsMemberssrm:MarigoldMember2020-01-012020-12-310000921638ssrm:OtherProductsMemberssrm:MarigoldMember2019-01-012019-12-310000921638ssrm:OtherProductsMemberssrm:SeabeeMember2021-01-012021-12-310000921638ssrm:OtherProductsMemberssrm:SeabeeMember2020-01-012020-12-310000921638ssrm:OtherProductsMemberssrm:SeabeeMember2019-01-012019-12-310000921638ssrm:OtherProductsMemberssrm:PunaMember2021-01-012021-12-310000921638ssrm:OtherProductsMemberssrm:PunaMember2020-01-012020-12-310000921638ssrm:OtherProductsMemberssrm:PunaMember2019-01-012019-12-310000921638us-gaap:GoldMember2021-01-012021-12-310000921638us-gaap:GoldMember2020-01-012020-12-310000921638us-gaap:GoldMember2019-01-012019-12-310000921638ssrm:SilverMember2021-01-012021-12-310000921638ssrm:SilverMember2020-01-012020-12-310000921638ssrm:SilverMember2019-01-012019-12-310000921638ssrm:LeadMember2021-01-012021-12-310000921638ssrm:LeadMember2020-01-012020-12-310000921638ssrm:LeadMember2019-01-012019-12-310000921638ssrm:ZincMember2021-01-012021-12-310000921638ssrm:ZincMember2020-01-012020-12-310000921638ssrm:ZincMember2019-01-012019-12-310000921638ssrm:OtherMetalsMember2021-01-012021-12-310000921638ssrm:OtherMetalsMember2020-01-012020-12-310000921638ssrm:OtherMetalsMember2019-01-012019-12-310000921638ssrm:IstanbulGoldRefineryMemberssrm:GoldDoreMemberus-gaap:CustomerConcentrationRiskMemberus-gaap:SalesRevenueNetMember2021-01-012021-12-310000921638ssrm:CanadianImperialBankOfCommerceMemberssrm:GoldDoreMemberus-gaap:CustomerConcentrationRiskMemberus-gaap:SalesRevenueNetMember2021-01-012021-12-310000921638ssrm:CanadianImperialBankOfCommerceMemberssrm:GoldDoreMemberus-gaap:CustomerConcentrationRiskMemberus-gaap:SalesRevenueNetMember2020-01-012020-12-310000921638ssrm:IstanbulGoldRefineryMemberssrm:GoldDoreMemberus-gaap:CustomerConcentrationRiskMemberus-gaap:SalesRevenueNetMember2020-01-012020-12-310000921638ssrm:BankOfMontrealMemberssrm:GoldDoreMemberus-gaap:CustomerConcentrationRiskMemberus-gaap:SalesRevenueNetMember2020-01-012020-12-310000921638ssrm:CanadianImperialBankOfCommerceMemberssrm:GoldDoreMemberus-gaap:CustomerConcentrationRiskMemberus-gaap:SalesRevenueNetMember2019-01-012019-12-310000921638ssrm:GoldDoreMemberus-gaap:CustomerConcentrationRiskMemberssrm:BankOfNovaScotiaMemberus-gaap:SalesRevenueNetMember2019-01-012019-12-310000921638ssrm:BankOfMontrealMemberssrm:GoldDoreMemberus-gaap:CustomerConcentrationRiskMemberus-gaap:SalesRevenueNetMember2019-01-012019-12-310000921638ssrm:ConcentrateMetalSalesAgreementMember2021-12-310000921638ssrm:ConcentrateMetalSalesAgreementMember2020-12-310000921638ssrm:ConcentrateMetalSalesAgreementMemberssrm:SilverMember2021-01-012021-12-31utr:oz0000921638ssrm:ConcentrateMetalSalesAgreementMemberssrm:SilverMember2021-12-31iso4217:USDssrm:ounce0000921638ssrm:ConcentrateMetalSalesAgreementMemberssrm:ZincMember2021-01-012021-12-31utr:lb0000921638ssrm:ConcentrateMetalSalesAgreementMemberssrm:ZincMember2021-12-31iso4217:USDssrm:pound0000921638ssrm:ConcentrateMetalSalesAgreementMemberssrm:LeadMember2021-01-012021-12-310000921638ssrm:ConcentrateMetalSalesAgreementMemberssrm:LeadMember2021-12-310000921638us-gaap:CostOfSalesMember2021-01-012021-12-310000921638us-gaap:CostOfSalesMember2020-01-012020-12-310000921638us-gaap:CostOfSalesMember2019-01-012019-12-310000921638us-gaap:GeneralAndAdministrativeExpenseMember2021-01-012021-12-310000921638us-gaap:GeneralAndAdministrativeExpenseMember2020-01-012020-12-310000921638us-gaap:GeneralAndAdministrativeExpenseMember2019-01-012019-12-310000921638ssrm:ExplorationEvaluationAndReclamationExpenseMember2021-01-012021-12-310000921638ssrm:ExplorationEvaluationAndReclamationExpenseMember2020-01-012020-12-310000921638ssrm:ExplorationEvaluationAndReclamationExpenseMember2019-01-012019-12-310000921638ssrm:TransactionAndIntegrationExpenseMember2021-01-012021-12-310000921638ssrm:TransactionAndIntegrationExpenseMember2020-01-012020-12-310000921638ssrm:TransactionAndIntegrationExpenseMember2019-01-012019-12-310000921638us-gaap:EmployeeStockOptionMember2021-01-012021-12-310000921638us-gaap:EmployeeStockOptionMember2020-01-012020-12-310000921638us-gaap:EmployeeStockOptionMember2019-01-012019-12-310000921638ssrm:DeferredShareUnitsMember2021-12-310000921638ssrm:DeferredShareUnitsMember2021-01-012021-12-310000921638ssrm:DeferredShareUnitsMember2020-01-012020-12-310000921638ssrm:DeferredShareUnitsMember2019-01-012019-12-310000921638ssrm:DeferredShareUnitsMember2020-12-310000921638ssrm:DeferredShareUnitsMember2019-12-310000921638us-gaap:RestrictedStockUnitsRSUMember2021-01-012021-12-310000921638ssrm:AlacerGoldCorporationMemberus-gaap:RestrictedStockUnitsRSUMember2021-01-012021-12-310000921638us-gaap:RestrictedStockUnitsRSUMember2020-01-012020-12-310000921638us-gaap:RestrictedStockUnitsRSUMember2019-01-012019-12-310000921638us-gaap:RestrictedStockUnitsRSUMember2021-12-310000921638us-gaap:RestrictedStockUnitsRSUMember2020-12-310000921638us-gaap:PerformanceSharesMembersrt:MinimumMember2021-01-012021-12-310000921638us-gaap:PerformanceSharesMembersrt:MaximumMember2021-01-012021-12-310000921638us-gaap:PerformanceSharesMemberssrm:AlacerGoldCorporationMembersrt:MinimumMember2021-01-012021-12-310000921638us-gaap:PerformanceSharesMembersrt:MaximumMemberssrm:AlacerGoldCorporationMember2021-01-012021-12-310000921638us-gaap:PerformanceSharesMember2021-01-012021-12-310000921638us-gaap:PerformanceSharesMember2020-01-012020-12-310000921638us-gaap:PerformanceSharesMember2019-01-012019-12-310000921638us-gaap:PerformanceSharesMember2021-12-310000921638us-gaap:PerformanceSharesMember2020-12-310000921638ssrm:OtherForeignMember2021-01-012021-12-310000921638ssrm:OtherForeignMember2020-01-012020-12-310000921638ssrm:OtherForeignMember2019-01-012019-12-310000921638country:TR2021-12-310000921638country:MX2021-12-310000921638country:CA2021-12-310000921638country:US2021-12-310000921638country:AR2021-12-310000921638us-gaap:FairValueInputsLevel1Member2021-12-310000921638us-gaap:FairValueInputsLevel2Member2021-12-310000921638us-gaap:FairValueInputsLevel3Member2021-12-310000921638us-gaap:FairValueInputsLevel1Member2020-12-310000921638us-gaap:FairValueInputsLevel2Member2020-12-310000921638us-gaap:FairValueInputsLevel3Member2020-12-310000921638us-gaap:MeasurementInputDiscountRateMemberus-gaap:ValuationTechniqueDiscountedCashFlowMembersrt:MinimumMember2021-12-310000921638srt:MaximumMemberus-gaap:MeasurementInputDiscountRateMemberus-gaap:ValuationTechniqueDiscountedCashFlowMember2021-12-310000921638us-gaap:MeasurementInputDiscountRateMemberus-gaap:ValuationTechniqueDiscountedCashFlowMembersrt:MinimumMember2020-12-310000921638srt:MaximumMemberus-gaap:MeasurementInputDiscountRateMemberus-gaap:ValuationTechniqueDiscountedCashFlowMember2020-12-310000921638ssrm:A2019NotesMemberus-gaap:SeniorNotesMemberus-gaap:FairValueInputsLevel1Memberus-gaap:CarryingReportedAmountFairValueDisclosureMember2021-12-310000921638ssrm:A2019NotesMemberus-gaap:SeniorNotesMemberus-gaap:EstimateOfFairValueFairValueDisclosureMemberus-gaap:FairValueInputsLevel1Member2021-12-310000921638ssrm:A2019NotesMemberus-gaap:SeniorNotesMemberus-gaap:FairValueInputsLevel1Memberus-gaap:CarryingReportedAmountFairValueDisclosureMember2020-12-310000921638ssrm:A2019NotesMemberus-gaap:SeniorNotesMemberus-gaap:EstimateOfFairValueFairValueDisclosureMemberus-gaap:FairValueInputsLevel1Member2020-12-310000921638us-gaap:FairValueInputsLevel2Memberssrm:TermLoanMemberus-gaap:CarryingReportedAmountFairValueDisclosureMember2021-12-310000921638us-gaap:FairValueInputsLevel2Memberus-gaap:EstimateOfFairValueFairValueDisclosureMemberssrm:TermLoanMember2021-12-310000921638us-gaap:FairValueInputsLevel2Memberssrm:TermLoanMemberus-gaap:CarryingReportedAmountFairValueDisclosureMember2020-12-310000921638us-gaap:FairValueInputsLevel2Memberus-gaap:EstimateOfFairValueFairValueDisclosureMemberssrm:TermLoanMember2020-12-310000921638us-gaap:CarryingReportedAmountFairValueDisclosureMember2021-12-310000921638us-gaap:EstimateOfFairValueFairValueDisclosureMember2021-12-310000921638us-gaap:CarryingReportedAmountFairValueDisclosureMember2020-12-310000921638us-gaap:EstimateOfFairValueFairValueDisclosureMember2020-12-310000921638ssrm:MaterialsAndSuppliesMember2021-12-310000921638ssrm:MaterialsAndSuppliesMember2020-12-310000921638ssrm:StockpiledOreMember2021-12-310000921638ssrm:StockpiledOreMember2020-12-310000921638ssrm:LeachPadInventoryMember2021-12-310000921638ssrm:LeachPadInventoryMember2020-12-310000921638ssrm:PlantAndEquipmentMember2021-12-310000921638ssrm:PlantAndEquipmentMember2020-12-310000921638us-gaap:ConstructionInProgressMember2021-12-310000921638us-gaap:ConstructionInProgressMember2020-12-310000921638ssrm:MineralPropertiesSubjectToDepletionMember2021-12-310000921638ssrm:MineralPropertiesSubjectToDepletionMember2020-12-310000921638ssrm:MineralPropertiesNotYetSubjectToDepletionMember2021-12-310000921638ssrm:MineralPropertiesNotYetSubjectToDepletionMember2020-12-310000921638ssrm:ExplorationAndEvaluationAssetsMember2021-12-310000921638ssrm:ExplorationAndEvaluationAssetsMember2020-12-310000921638ssrm:A2019NotesMemberus-gaap:SeniorNotesMember2021-12-310000921638ssrm:A2019NotesMemberus-gaap:SeniorNotesMember2020-12-310000921638ssrm:TermLoanMember2021-12-310000921638ssrm:TermLoanMember2020-12-310000921638ssrm:OtherDebtMember2021-12-310000921638ssrm:OtherDebtMember2020-12-310000921638ssrm:A2019NotesMember2021-12-310000921638ssrm:A2019NotesMember2020-12-310000921638us-gaap:SeniorNotesMemberssrm:A2013NotesMember2013-01-160000921638us-gaap:SeniorNotesMemberssrm:A2013NotesMember2019-03-190000921638us-gaap:SeniorNotesMemberssrm:A2013NotesMember2019-03-192019-03-190000921638us-gaap:MeasurementInputDiscountRateMemberus-gaap:SeniorNotesMemberus-gaap:ValuationTechniqueDiscountedCashFlowMemberssrm:A2013NotesMember2019-03-190000921638us-gaap:SeniorNotesMemberssrm:A2013NotesMember2020-01-312020-01-310000921638us-gaap:SeniorNotesMemberssrm:A2013NotesMember2020-01-012020-03-310000921638us-gaap:SeniorNotesMemberssrm:A2013NotesMember2020-03-312020-03-310000921638ssrm:A2019NotesMemberus-gaap:SeniorNotesMember2019-03-190000921638ssrm:A2019NotesMemberus-gaap:SeniorNotesMember2019-03-192019-03-19ssrm:day0000921638ssrm:TermLoanMemberssrm:AlacerGoldCorporationMember2020-09-160000921638ssrm:TermLoanMemberus-gaap:LondonInterbankOfferedRateLIBORMembersrt:MinimumMember2020-09-162020-09-160000921638ssrm:TermLoanMemberus-gaap:LondonInterbankOfferedRateLIBORMembersrt:MaximumMember2020-09-162020-09-160000921638ssrm:TermLoanMemberssrm:AlacerGoldCorporationMember2020-12-310000921638ssrm:TermLoanMemberssrm:AlacerGoldCorporationMember2021-12-310000921638us-gaap:LineOfCreditMemberus-gaap:RevolvingCreditFacilityMember2015-08-040000921638us-gaap:LineOfCreditMemberus-gaap:RevolvingCreditFacilityMember2017-12-310000921638us-gaap:LineOfCreditMemberus-gaap:RevolvingCreditFacilityMember2021-06-070000921638us-gaap:LineOfCreditMemberus-gaap:LondonInterbankOfferedRateLIBORMemberus-gaap:RevolvingCreditFacilityMembersrt:MinimumMember2021-06-072021-06-070000921638us-gaap:LineOfCreditMemberus-gaap:LondonInterbankOfferedRateLIBORMembersrt:MaximumMemberus-gaap:RevolvingCreditFacilityMember2021-06-072021-06-070000921638us-gaap:LineOfCreditMemberus-gaap:RevolvingCreditFacilityMembersrt:MinimumMember2021-06-072021-06-070000921638us-gaap:LineOfCreditMembersrt:MaximumMemberus-gaap:RevolvingCreditFacilityMember2021-06-072021-06-070000921638us-gaap:LineOfCreditMemberus-gaap:LetterOfCreditMember2021-06-072021-06-070000921638us-gaap:LineOfCreditMemberus-gaap:LetterOfCreditMembersrt:MinimumMember2021-06-072021-06-070000921638us-gaap:LineOfCreditMembersrt:MaximumMemberus-gaap:LetterOfCreditMember2021-06-072021-06-070000921638srt:MinimumMember2021-12-310000921638srt:MaximumMember2021-12-310000921638ssrm:AirLiquideGazSanayiVeTicaretASMember2021-12-310000921638ssrm:AirLiquideGazSanayiVeTicaretASMember2021-01-012021-12-31ssrm:renewalOption0000921638us-gaap:SuretyBondMember2021-12-310000921638us-gaap:SuretyBondMember2020-12-310000921638us-gaap:SubsequentEventMemberus-gaap:DisposalGroupDisposedOfBySaleNotDiscontinuedOperationsMemberssrm:PitarrillaProjectMember2022-01-120000921638us-gaap:SubsequentEventMember2022-02-222022-02-22
UNITED STATES
SECURITIES AND EXCHANGE COMMISSION
Washington, D.C. 20549
Form 10-K
(Mark One)
☒ ANNUAL REPORT PURSUANT TO SECTION 13 OR 15(d) OF THE SECURITIES EXCHANGE ACT OF 1934
For the Fiscal Year Ended December 31, 2021
or
☐ TRANSITION REPORT PURSUANT TO SECTION 13 OR 15(d) OF THE SECURITIES EXCHANGE ACT OF 1934
For the transition period from __________to__________
Commission File Number: 001-35455
SSR MINING INC.
(Exact name of registrant as specified in its charter)
| | | | | | | | |
British Columbia (State or Other Jurisdiction of Incorporation or Organization) | | 98-0211014
(I.R.S. Employer Identification No.) |
Suite 800 - 7001 E. Belleview Avenue, Denver, Colorado 80237 |
(Address of Principal Executive Offices)
Registrant’s telephone number, including area code (303) 292-1299
Securities registered pursuant to Section 12(b) of the Act.
| | | | | | | | |
| Title of each class | Trading symbol | Name of each exchange on which registered |
| Common shares without par value | SSRM | The Nasdaq Stock Market LLC |
Securities registered pursuant to Section 12(g) of the Act. None
Indicate by check mark if the registrant is a well-known seasoned issuer, as defined in Rule 405 of the Securities Act. ☒ Yes ☐ No
Indicate by check mark if the registrant is not required to file reports pursuant to Section 13 or Section 15(d) of the Act. ☐ Yes ☒ No
Indicate by check mark whether the registrant (1) has filed all reports required to be filed by Section 13 or 15(d) of the Securities Exchange Act of 1934 during the preceding 12 months (or for such shorter period that the registrant was required to file such reports), and (2) has been subject to such filing requirements for the past 90 days. ☒ Yes ☐ No
Indicate by check mark whether the registrant has submitted electronically every Interactive Data File required to be submitted pursuant to Rule 405 of Regulation S-T during the preceding 12 months (or for such shorter period that the registrant was required to submit such files). ☒ Yes ☐ No
Indicate by check mark whether the registrant is a large accelerated filer, an accelerated filer, a non-accelerated filer, a smaller reporting company, or an emerging growth company. See definitions of “large accelerated filer,” “accelerated filer,” “smaller reporting company,” and “emerging growth company” in Rule 12-b2 of the Exchange Act.
| | | | | | | | | | | | | | |
| Large accelerated filer | ☒ | | Accelerated filer | ☐ |
| Non-accelerated filer | ☐ | | Smaller reporting company | ☐ |
| | | Emerging growth company | ☐ |
If an emerging growth company, indicate by check mark if the registrant has elected not to use the extended transition period for complying with any new or revised financial accounting standards provided pursuant to Section 13(a) of the Exchange Act. ☐
Indicate by check mark whether the registrant has filed a report on and attestation to its management’s assessment of the effectiveness of its internal control over financial reporting under Section 404(b) of the Sarbanes-Oxley Act (15 U.S.C. 7262(b)) by the registered public accounting firm that prepared or issued its audit report. ☒
Indicate by check mark whether the registrant is a shell company (as defined in Rule 12-b2 of the Exchange Act). ☐ Yes ☒ No
At June 30, 2021, the aggregate market value of the registrant’s voting and non-voting common equity held by non-affiliates of the registrant was $3,351,155,606 based on the closing sale price as reported on Nasdaq Global Market on that date. There were 212,380,004 common shares outstanding on January 31, 2022.
DOCUMENTS INCORPORATED BY REFERENCE
Designated portions of the registrant’s definitive Proxy Statement for its 2022 Annual Meeting of Shareholders, which is to be filed subsequent to the date hereof, are incorporated by reference into Part III of this Annual Report on Form 10-K.
EXPLANATORY NOTE
As of June 30, 2021, we determined that we no longer qualified as a "foreign private issuer," as such term is defined in Rule 405 under the Securities Act of 1933, as amended. Consequently, we were required to comply with U.S. domestic issuer requirements beginning January 1, 2022. As a U.S. domestic issuer, we have adopted U.S. generally accepted accounting principles for the first time with the preparation of our consolidated financial statements for the years ended December 31, 2021, 2020 and 2019. As a foreign private issuer, we previously prepared our consolidated financial statements in accordance with International Financial Reporting Standards, as issued by the International Accounting Standards Board.
TABLE OF CONTENTS
| | | | | |
| Page |
| PART I |
| |
| |
| |
| |
| |
| |
| |
| |
| |
| |
| |
| |
| |
| |
| PART II |
| |
| |
| |
| |
| |
| |
| |
| |
| |
| |
| |
| |
| |
| |
| |
| |
| PART III |
| |
| |
| |
| |
| |
| PART IV |
| |
| |
| |
PART I
Full Year 2021 Highlights:
•Strong full year operating cost performance: The Company reported full year 2021 production of 794,456 gold equivalent ounces at all-in sustaining costs (“AISC”) of $955 per gold equivalent ounce. See "Non-GAAP Measure – Cash Costs and AISC" for an explanation of AISC and a reconciliation of this financial measure to net income and production costs, which are the comparable GAAP financial measures.
•Generated peer leading free cash flow: Full year free cash flow of $444.2 million resulted in a sector-leading free cash flow yield of 12%. Attributable net income in 2021 was $368.1 million, or $1.70 in net income per share. See "Non-GAAP Measure – Free Cash Flow" and "Non-GAAP Measure – Adjusted Attributable Net Income" for explanations of these measures and reconciliations to cash provided by operating activities and net income attributable to equity holders of SSR Mining (GAAP), respectively, which is the comparable GAAP financial measures.
•Delivered strong capital returns through initial dividends and inaugural share buy-back program: During 2021, the Company returned $191.3 million in capital to shareholders through dividend payments and the repurchase of 8,800,700 shares under the Normal Course Issuer Bid (“NCIB”) program announced on April 19, 2021. The inaugural dividend program was announced in February 2021, with a $0.05 quarterly per share dividend declared at the discretion of the Board of Directors. Subsequently, the Board has approved a 40% increase in the quarterly base dividend to $0.07 per share.
•Balance Sheet Remained a Key Strength: Closed 2021 with a cash and cash equivalent balance of $1,017.6 million despite the aforementioned $191.3M in capital returns to shareholders and $70.0 million in scheduled debt repayments.
•Increased gold mineral reserves by 14%: Mineral resource to reserve conversion at Ҫӧpler’s Çakmaktepe Extension (Ardich) and Seabee’s Gap Hanging Wall drove an increase to mineral reserves and offset depletion at Marigold and Puna, increasing gold mineral reserves by 14%. Total gold equivalent mineral reserves increased by 13%, or 1.2 million ounces, to 10.2 million total ounces.
•Delivered strong near-mine and greenfield exploration results across the portfolio: Delivered positive exploration updates from the Çakmaktepe Extension (Ardich), Seabee, Marigold, Copper Hill, and Amisk properties in 2021, showcasing SSR Mining's robust global exploration platform. See Item 2. Properties for further information.
•Expanded development portfolio in core jurisdictions and continued asset rationalizations: On December 2, 2021, the Company announced the proposed acquisition of Taiga Gold Corp. for $21.0 million. The transaction will consolidate a 100% interest in the Fisher properties contiguous to the Seabee mine, eliminated an existing 2.5% net smelter return (“NSR”) royalty on the majority of the Fisher properties, and added five new properties covering 30,480 hectares to complement the Company’s existing exploration platform. Earlier in the fourth quarter of 2021, the Company announced an agreement to increase its ownership in the joint venture covering the Copper Hill exploration target in Turkey to 70%. Additionally, the Company progressed its portfolio rationalization process with the announcement of the sale of its non-core royalty portfolio to EMX Royalty Corporation ("EMX") on July 29, 2021, for total consideration of $100.0 million.
•Updated Technical Report Summaries at all producing assets reiterate quality of longer-term platform: The Company has completed Technical Report Summaries for each of its operating assets in compliance with Subpart 1300 of Regulation S-K. These reports include refreshed operating and economic assumptions for each asset and provide a base case for further growth and optimization to support the Company's long-term production base.
ITEM 1. BUSINESS
Introduction
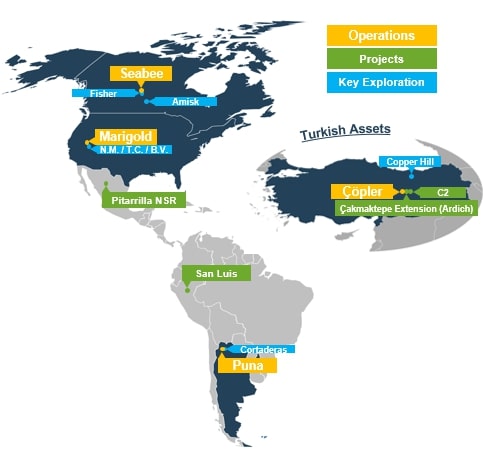
SSR Mining is a precious metals mining company with four producing assets located in the United States, Turkey, Canada and Argentina. The Company is primarily engaged in the operation, acquisition, exploration and development of precious metal resource properties located in Turkey and the Americas. The Company produces gold doré as well as copper, silver, lead and zinc concentrates. SSR Mining's diversified asset portfolio is comprised of high-margin, long-life assets located in some of the world's most prolific metal districts. In 2021, the Company's four operating assets produced over 794 thousand gold equivalent ounces and generated over $440.0 million dollars of free cash flow. See "Non-GAAP Measure – Free Cash Flow" for an explanation of this measure and a reconciliation to cash provided by operating activities, which is the comparable GAAP financial measure.
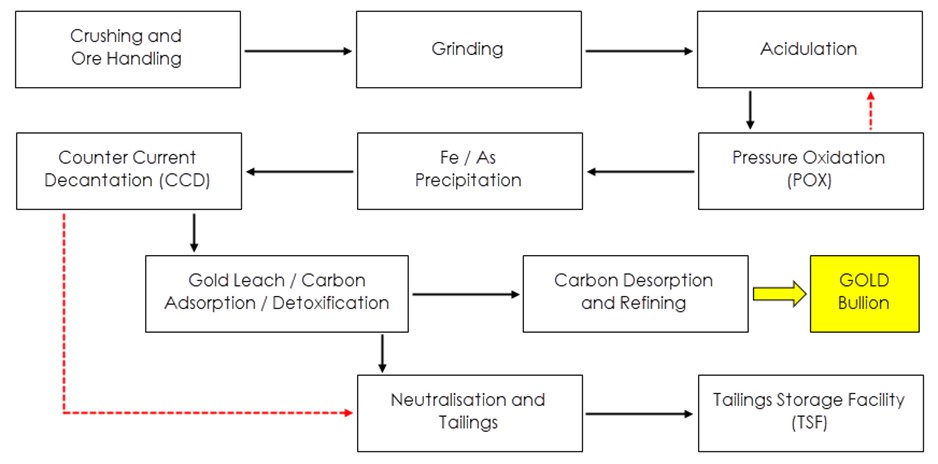
The Company has an experienced leadership team with a proven track record of delivery and value creation. Across the organization, the Company has expertise in project construction, mining (open pit and underground), and processing (pressure oxidation, heap leach and flotation), with a robust commitment to health, safety, community engagement and environmental management.
The Company has a strong balance sheet, with over $1 billion in cash and cash equivalents as of December 31, 2021, to support its growth pipeline. The Company intends to leverage its balance sheet strength and proven track record of free cash flow generation to fund growth across its portfolio to facilitate superior returns to shareholders.
In this report, "SSR Mining," the "Company," "our" and "we" refer to SSR Mining Inc. together with its affiliates and subsidiaries, unless the context otherwise requires. All currency references herein are in United States dollars ("USD") unless otherwise indicated. References to "CAD" or the use of the symbol “C$” refers to Canadian dollars. References to “TL” are to the lawful currency of Turkey, the Turkish Lira. References to “ARS” are to the lawful currency of Argentina, the Argentine peso.
All share data in this report refers to consolidated shares/data, unless otherwise indicated.
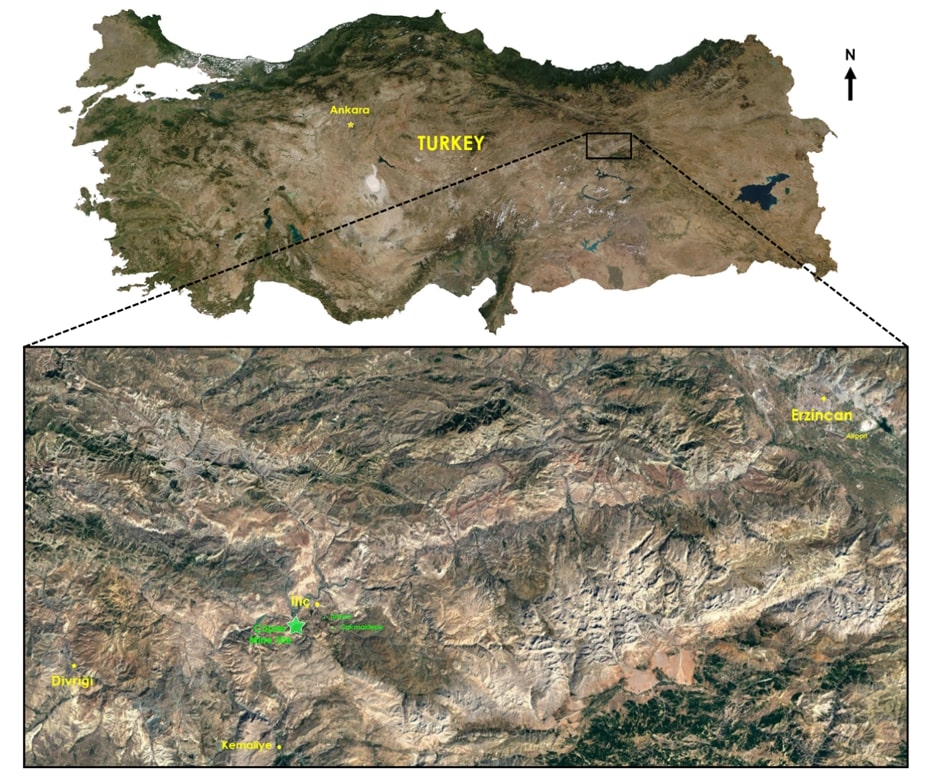
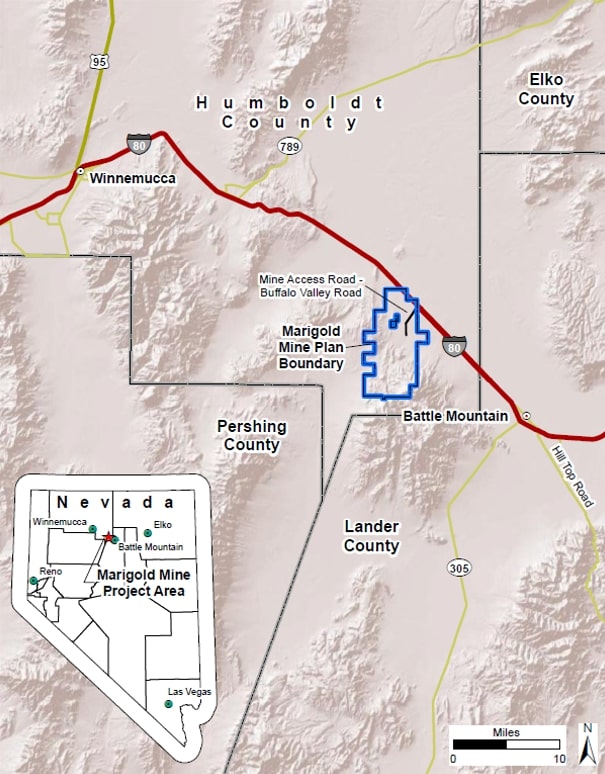
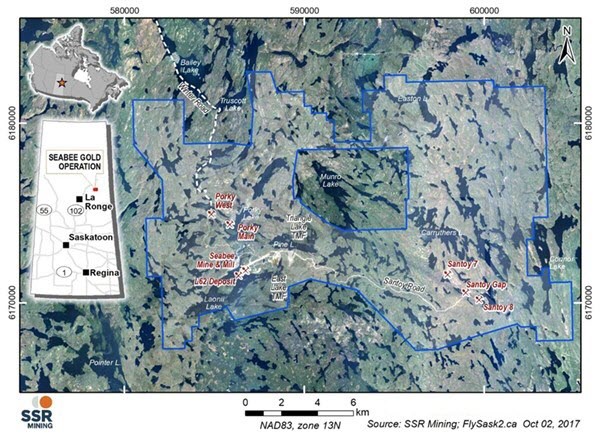
Segment Information
The Company's operations consist of four operating mine sites - Çöpler Gold Mine, located in Erzincan Province, Turkey ("Çöpler"), Marigold Mine, located in Nevada, United States ("Marigold"), Seabee Gold Operations, located in Saskatchewan, Canada ("Seabee" or "SGO"), and Puna Operations, located in Jujuy Province, Argentina ("Puna") - each of which is a reportable operating segment and which are also referred to as producing assets. The contributions to our revenue by reportable operating segment for the year ended December 31, 2021 were 41% from Çöpler (2020 – 24%; 2019 – nil), 29% from Marigold (2020 – 48%; 2019 – 52%), 15% from Seabee (2020 – 16%; 2019 – 24%) and 15% from Puna (2020 – 12%; 2019 – 24%). See Note 4 to the Consolidated Financial Statements for further information relating to our reportable operating segments.
In addition to current mine production, the Company also operates exploration and development activities at properties located in Canada, Turkey, Peru and Mexico. See Item 2, Properties, for further information about the Company's production and exploration properties.
Principal Products
Çöpler, Marigold and Seabee produce gold doré. Doré is unrefined gold bullion bars usually consisting of in excess of 90% gold, which is subsequently refined by a third party to gold bullion. The Company sells gold doré primarily to bullion banks, however all of the gold doré produced at Çöpler is delivered to the Istanbul Gold Refinery. Puna produces silver, lead and zinc concentrates, which are sold to smelters or traders for further refining.
During 2021, sales of gold doré accounted for 84% of revenue, with 41% sold to Istanbul Gold Refinery, 30% to CIBC. During 2020, sales of gold doré to CIBC, Istanbul Gold Refinery, and Bank of Montreal accounted for 45%, 24%, and 14% of the Company's total revenues, respectively. During 2019, sales of gold doré to CIBC, Bank of Nova Scotia, and Bank of Montreal accounted for 37%, 22%, and 17% of the Company's total revenues, respectively.
The Company sells lead and zinc concentrate with high silver content, through contractual arrangements with smelters and traders located in Asia and Europe. The concentrates are sold under supply contracts updated annually or as needed through spot sales, with processing fees based on the demand for the concentrates in the global marketplace.
The Company’s revenue by product category for the years ended December 31 was as follows:
| | | | | | | | | | | | | | | | | |
| Years Ended December 31, |
Product Revenue (1) | 2021 | | 2020 | | 2019 |
| Gold | 84 | % | | 88 | % | | 76 | % |
| Silver | 12 | % | | 11 | % | | 19 | % |
| Lead | 2 | % | | 1 | % | | 2 | % |
| Zinc | 1 | % | | 1 | % | | 3 | % |
(1) The Company also realizes de minimus revenue from copper.
As of December 31, 2021, the Company had attributable proven and probable gold reserves of 9,154 koz. For information on the mineral resources and mineral reserves for each operating asset, see Item 2, “Proven and Probable Reserve Estimates" and "Resource Estimates”.
The market prices of gold and silver are key drivers of the Company’s profitability. The prices of gold and silver can fluctuate widely and are affected by a number of macroeconomic factors, including global or regional consumption patterns, the supply of, and demand for gold and silver, interest rates, exchange rates, inflation or deflation, global economic conditions resulting from the COVID-19 pandemic, and the political and economic conditions of major gold- and silver-producing and gold- and silver-consuming countries throughout the world. Importantly, the price of gold and silver can be impacted by their role as safe havens during periods of market turmoil and as defense against the perceived inflationary impacts and currency depreciation caused by the responses of governments and central banking authorities to various economic threats. See Item 1A. Risk Factors, for further information.
During 2021, the gold price, based on the London Bullion Market Association (“LBMA”) averaged $1,799 per ounce, which was $29 per ounce, or 2%, higher than the 2020 annual average of $1,770 per ounce and $409 per ounce, or 29%, higher than the 2019 annual average of $1,393 per ounce. During 2021, the price of silver, based on the LBMA silver price, averaged $25.14 per ounce, which was $4.59 per ounce, or 22%, higher than the 2020 annual average of $20.55 per ounce and $8.93 per ounce, or 55%, higher than the 2019 annual average of $16.21 per ounce. See Item 7. Management’s Discussion and Analysis of Financial Condition and Results of Operations, below, for further information relating to metal prices. For further details, see "Consolidated Results" and "Results of Operations" in Item 7, Management's Discussion and Analysis.
Competition
The precious and base metals mineral exploration and mining business is competitive. Competition is primarily for: mineral properties that can be developed and produced economically; technical experts that can find, develop and mine such mineral properties; labor to operate the mineral properties; and capital to finance exploration, development and operations.
The Company competes with other mining and exploration companies in the acquisition of mineral properties and in connection with the recruitment and retention of qualified employees. There is significant competition for mineral properties. Many larger competitors have greater financial and technical resources available to them. If the Company is unsuccessful in acquiring additional mineral properties or qualified personnel, the Company may not be able to replace mineral reserves, maintain production or grow.
Licenses and Concessions
Other than operating licenses for our mining and processing facilities, there are no third party patents, licenses or franchises material to our business. In many countries, however, we conduct our mining and exploration activities pursuant to concessions granted by, or under contracts with, the host government, including the United States, Canada, Mexico, Peru, Argentina, and Turkey. The concessions and contracts are subject to the political risks associated with the host country. See Item 1A. Risk Factors for further information.
Condition of Physical Assets and Insurance
Our business is capital intensive and requires ongoing capital investment for the replacement, modernization or expansion of equipment and facilities. See Results of Consolidated Operations and Liquidity and Capital Resources within Item 7. Management’s Discussion and Analysis of Consolidated Financial Condition and Results of Operations, for further information.
We maintain insurance policies against property loss and business interruption and insure against risks that are typical in the operation of our business, in amounts that we believe to be reasonable. Such insurance, however, contains exclusions and limitations on coverage, particularly with respect to environmental liability and political risk. There can be no assurance that claims would be paid under such insurance policies in connection with a particular event. See Item 1A. Risk Factors, below for further information.
Environmental, Social and Governance ("ESG")
The Company’s approach to environmental and social development is underpinned by the goal of minimizing the impact of our operations to the environment and leaving a positive legacy in the communities where the Company operates. For the Company, being a responsible corporate citizen means protecting the natural environment associated with its business activities, providing a safe workplace and work processes for its employees and contractors, and investing in the communities where the Company operates in an effort to enhance the lives of those who live and work in these communities beyond the life of its operations. The Company takes a long-term view of its corporate responsibility, which is reflected in the policies that guide the Company’s business decisions, and in its corporate culture that fosters safe and ethical behavior across all levels of SSR Mining.
Environment Stewardship
The Company is committed to executing its business with strong environmental and community stewardship through the ongoing development of a sustainable approach to operating its business. The Company’s Environmental & Sustainability Policy defines the organization’s commitments to responsible environmental stewardship and to health and welfare of the people and communities in which the Company operates. The policy is designed to guide the Company in advancing each of those commitments. The Company annually publishes an ESG and Sustainability Report, which is developed using the Global Reporting Initiative framework and outlines the Company’s approach to sustainability across a range of areas and summarizes the Company’s sustainability performance. The Company's Environmental & Sustainability Policy and its ESG and Sustainability Report are available on the Company’s website.
The Company’s Board of Directors has also established an Environmental, Health, Safety and Sustainability Committee of the Board (the “EHS&S Committee”) that, as part of its mandate, is responsible for reviewing the Company’s safety, health, security, risk, environment, community relations and sustainability policies and practices, and monitoring the Company’s performance in these areas. The Company’s EHS&S Committee charter is available on the Company’s website.
In 2007, Marigold became the first operating gold mine in the world certified as fully compliant with the International Cyanide Management Code (the “Cyanide Code”), a voluntary industry program for companies involved in the production of gold by the cyanidation process. The Cyanide Code addresses the production of cyanide, its transport from the producer to the mine, its on-site storage and use, decommissioning and financial assurance, worker safety, emergency response, training, stakeholder involvement and verification of implementation of the Cyanide Code. Marigold has been recertified in compliance with the Cyanide Code each time it has been audited by the International Cyanide Management Institute, with the most recent successful recertification occurring in 2021.
Producing precious metals is an energy-intensive business, resulting in carbon emissions. The Company's principal energy sources are purchased electricity, diesel fuel, natural gas and propane. The Company's operations are subject to a range of risks related to transitioning the business to meet regulatory, societal and investor expectations for operating in a low-carbon economy. Transitioning to a lower-carbon economy may entail extensive policy, legal, technology, and market changes to address mitigation and adaptation requirements related to climate change. SSR Mining plans to establish an action plan to achieve net zero emissions by 2050. Consistent with this commitment, actions taken to achieve transition to a low-carbon economy may result in increased costs for the Company's operations, partners and suppliers, including increased energy, capital equipment, environmental monitoring and reporting and other costs to achieve the Company's carbon neutrality goal and to comply with ongoing regulations and legislation to address carbon emissions.
Community Engagement
The Company’s community relations program is based on open and continuous communication with the members of communities located in its areas of operation. The Company takes a shared-value approach to local development activities to promote sustainable long-term economic and social benefits. In addition, the Company strives to ensure that local stakeholders have an opportunity for input and dialogue. Projects aimed at assisting and advancing the Company’s communities include training and employment, development of infrastructure and support for education and medical services, among others. At all times, the Company works to be a partner in the long-term sustainability of the communities in which it operates. In addition to direct investments made by SSR Mining, the Company also invests in the local communities surrounding its operations by supporting education, social programs and infrastructure projects.
Environmental Regulations
The Company’s activities are subject to extensive laws and regulations governing the protection of the environment and natural resources in all jurisdictions where the Company operates throughout the exploration, development and operating stages of a mining property. These laws address, among other things, emissions into the air and air quality, discharges into water and water quality, management of waste, management and disposal of solid and hazardous substances, protection of natural resources, fisheries and wildlife protection, antiquities, endangered species, noise and use and reclamation of lands disturbed by mining operations.
The Company is required to obtain governmental permits and, in some instances, provide bonding requirements under federal, state, or provincial air, water quality, and mine reclamation rules and permits. Violations of environmental laws are subject to civil sanctions and, in some cases, criminal sanctions, including the suspension or revocation of permits. Additionally, environmental laws in the countries in which the Company operates require that the Company periodically perform environmental impact studies and updates at its mines.
Reclamation
The Company’s mining, exploration and development activities are subject to various federal, provincial, state and municipal laws and regulations relating to the protection of the environment, including requirements for closure and reclamation of mining properties. The Company believes that how it closes a mine is just as important as how it opens and operates a mine.
The Company has certain reclamation obligations at its mineral properties, including Çöpler, Marigold, Seabee and Puna Operations. At Marigold, the Company engages in concurrent reclamation practices and provides bonds for all permitted features, as part of the State of Nevada permitting process. Current bonding amounts are based on third party cost estimates to reclaim all permitted features at Marigold, with the exception of a few features permitted as permanent, post-mining features. The U.S. Bureau of Land Management (“BLM”) and the State of Nevada both review and approve the bond estimate, and the BLM holds the financial instruments providing the bond backing. At Seabee, the Company also has an approved closure plan and financial assurance held by the Province of Saskatchewan. The closure plan addresses all final reclamation requirements as well as the longer-term post-reclamation monitoring and maintenance phase. As required by the Company’s environmental permits, the closure plan is periodically updated.
The financial and operational effect of environmental protection requirements on the capital expenditures and earnings of each mineral property are not significantly different than that of similar sized mines in the same jurisdiction, and therefore should not have a negative effect on the Company’s competitive position in the future. See Item 7. Management’s Discussion and Analysis of Consolidated Financial Condition and Results of Operations, for further information regarding closure and reclamation cost estimates.
Human Capital Management
Employees and Contractors
As of December 31, 2021, the Company employed approximately 2,429 full-time employees and 1,608 contract employees throughout the United States, Canada, Mexico, Peru, Argentina and Turkey.
As of December 31, 2021, of the 649 full-time employees in Turkey, approximately 61% were represented by a union, and of the 839 full-time employees in Argentina, approximately 63% were represented by a union.
Diversity and Inclusion
The Company recognizes that a workforce composed of many individuals with a mix of skills, experience, perspectives, backgrounds and characteristics leads to a more robust understanding of opportunities, issues and risks, and to stronger decision-making. Given the broad geographic footprint of the Company’s operations, we benefit from a meaningfully diverse workforce. The Company’s Board of Directors also recognizes that a diverse board of directors makes prudent business sense and makes for better oversight and corporate governance and is committed to a merit-based process, which is based on objective criteria, solicits multiple perspectives and is free of conscious or unconscious bias and discrimination, for the identification and selection of nominees to the Board. In March 2019, the Company became a member of each of the Catalyst Accord 2022 and the 30% Club Canada. These initiatives are aimed at accelerating the advancement of women in the workplace with a target goal of at least 30% representation of women on public-company boards. The Board remains committed to these initiatives and is currently going through its annual Board renewal process with a focus on increasing diversity on the Board, including female Board members. The Board has engaged a third-party search firm to assist the Board in recruiting additional directors to ensure that the slate of nominees presented in the Company’s proxy will reflect its commitment to Board diversity.
The Company has adopted a Diversity Policy which requires the Company to establish specific diversity initiatives, programs and targets. The Company’s Corporate Governance and Nominating Committee oversees the diversity initiatives at the Board level and the Company’s Compensation and Leadership Development Committees oversee such initiatives across the Company. The Company’s Corporate Governance and Nominating Committee reviews the Diversity Policy available on our website annually and assesses its effectiveness. The Company and the Board of Directors are committed to establishing measurable diversity objectives and assessing on an annual basis the achievement against these objectives, including the representation of women at all levels of the organization.
In addition, the Company’s Code of Business Conduct and Ethics (the “Code of Conduct”), available on our website, promotes and supports diversity and inclusion.
Health and Safety
The Company is committed to the health and safety of its employees and does so by creating and maintaining a safe working environment, equipment, work processes, effective safety and health management systems, and by complying with all applicable health and safety laws and regulations. The Company acknowledges that there are inherent risks associated with the Company’s business and, through proactive risk management, continuously strives to maximize the safety of its operations and minimize and control health and safety risks.
The Company’s safety framework emphasizes effective risk-centered management systems, positive and effective work cultures and proactive leadership to drive culture enhancement. The Company focuses on balancing the human and technical aspects of safety: blending leadership behaviors with traditional management activities to create a safe, productive culture. The Company ensures that its workers understand their individual roles and contributions to safe production and a safe workplace. In this way, the Company’s employees maintain safety awareness, recognize hazards and analyze risk in their daily activities. The technical aspects of safety are addressed through established systems, policies and procedures that enable the Company's employees to identify and assess job-related risks, and that support our efforts to provide appropriate training and verify training competencies. Performance measurement and accountability provides feedback and maintains focus on continuous improvement.
Human Rights
As part of the Company’s commitment to being a responsible corporate citizen, the Company recognizes the important role and responsibility it has in respecting the human rights of its stakeholders. The Company has adopted a Human Rights Policy, available on the Company’s website, which is aligned with the United Nations Guiding Principles on Business and Human Rights, the United Nations Global Compact, and the Organization for Economic Cooperation and Development Guidelines for Multinational Enterprises. This includes support and respect for the human rights expressed in the International Bill of Human Rights and the principles concerning fundamental rights set out in the International Labour Organization’s Declaration on Fundamental Principles and Rights at Work.
COVID-19 Impact
During the year ended December 31, 2021, the COVID-19 pandemic negatively impacted global economic and certain financial markets. Many industries have been impacted by the COVID-19 pandemic and are facing operating challenges associated with the regulations and guidelines resulting from efforts to contain it.
Seabee and Puna were placed into care and maintenance near the end of the first quarter of 2020 and subsequently restarted through the second and third quarters of 2020, with no operational shutdowns in 2021. At Çöpler and Marigold, where no operational shutdowns have taken place, the sites continued to operate with limited impact from COVID-19 and have implemented numerous measures intended to protect employees, including quarantining, testing, ensuring physical distancing and providing additional protective equipment. Currently, Çöpler, Marigold, Seabee and Puna are all operating as expected, with limited impacts resulting from ongoing COVID-19 restrictions and related impacts. Each of the sites continue to work with national and local authorities in accordance with applicable regulations and remain vigilant with respect to on-site specific protocols to protect the health and safety of employees and stakeholders; however, all sites remain vulnerable to potential COVID-19 restrictions and impacts, including those resulting from existing or new variants and new governmental restrictions, which could suspend or limit the Company's operations or result in temporary loss of employees due to COVID-19 infections. COVID-19 is slowing government processes, including permitting, which has impacted the Company's operations as the Company is seeking additional permits and land access for possible growth and operations.
The Company continues to restrict non-essential travel and manage the contact of its employees and contractors in order to reduce the risk of COVID-19 impacting its operations and the communities surrounding our mine sites. The Company has reopened its corporate offices to the extent permitted by local health ordinances, with employees still working remotely, as necessary or required, to mitigate the spread of COVID-19.
Forward-Looking Statements
Certain statements contained in this report (including information incorporated by reference herein) are "forward-looking statements" within the meaning of Section 27A of the Securities Act of 1933, as amended (the “Securities Act”), and Section 21E of the Securities Exchange Act of 1934, as amended (the “Exchange Act”), and are intended to be covered by the safe harbor provided for under these sections. Forward looking statements can be identified with words such as “may,” “will,” “could,” “should,” “expect,” “plan,” “anticipate,” “believe,” “intend,” “estimate,” “projects,” “predict,” “potential,” “continue” and similar expressions, as well as statements written in the future tense. When made, forward-looking statements are based on information known to management at such time and/or management’s good faith belief with respect to future events. Such statements are subject to risks and uncertainties that could cause actual performance or results to differ materially from those expressed in the Company's forward-looking statements. Many of these factors are beyond the Company's ability to control or predict. Given these uncertainties, readers are cautioned not to place undue reliance on forward-looking statements. Forward-looking statements include, without limitation:
•forecasts and outlook;
•timing, production, cost, operating and capital expenditure guidance;
•the Company’s intention to return excess attributable free cash flow to shareholders;
•the timing and implementation of the Company’s dividend policy;
•the implementation of any share buyback program;
•statements regarding plans or expectations for the declaration of future dividends and the amount thereof;
•future cash costs and all-in sustaining costs (“AISC”) per ounce of gold, silver and other metals sold;
•the prices of gold, silver, copper, lead, zinc and other metals;
•mineral resources, mineral reserves, realization of mineral reserves, and the existence or realization of mineral resource estimates;
•the Company’s ability to discover new areas of mineralization;
•the timing and extent of capital investment at the Company’s operations;
•the timing of production and production levels and the results of the Company’s exploration and development programs;
•current financial resources being sufficient to carry out plans, commitments and business requirements for the next twelve months;
•movements in commodity prices not impacting the value of any financial instruments;
•estimated production rates for gold, silver and other metals produced by the Company;
•the estimated cost of sustaining capital;
•availability of sufficient financing;
•receipt of regulatory approvals;
•the timing of studies, announcements, and analysis;
•the timing of construction and development of proposed mines and process facilities;
•ongoing or future development plans and capital replacement;
•estimates of expected or anticipated economic returns from the Company’s mining projects, including future sales of metals, concentrate or other products produced by the Company and the timing thereof;
•the impact of COVID-19, including any existing and new variants, on the Company's operations;
•the Company’s plans and expectations for its properties and operations; and
•all other timing, exploration, development, operational, financial, budgetary, economic, legal, social, environmental, regulatory, and political matters that may influence or be influenced by future events or conditions.
Such forward-looking information and statements are based on a number of material factors and assumptions, including, but not limited to:
•the inherent speculative nature of exploration results;
•the ability to explore;
•communications with local stakeholders;
•maintaining community and governmental relations;
•status of negotiations of joint ventures;
•weather conditions at the Company’s operations;
•commodity prices;
•the ultimate determination of and realization of mineral reserves;
•existence or realization of mineral resources;
•the development approach;
•availability and receipt of required approvals, titles, licenses and permits;
•sufficient working capital to develop and operate the mines and implement development plans;
•access to adequate services and supplies;
•foreign currency exchange rates;
•interest rates;
•inflation;
•access to capital markets and associated cost of funds;
•availability of a qualified workforce;
•ability to negotiate, finalize, and execute relevant agreements;
•lack of social opposition to the Company’s mines or facilities;
•lack of legal challenges with respect to the Company’s properties;
•the timing and amount of future production;
•the ability to meet production, cost, and capital expenditure targets;
•timing and ability to produce studies and analyses;
•capital and operating expenditures;
•economic conditions;
•availability of sufficient financing;
•the ultimate ability to mine, process, and sell mineral products on economically favorable terms; and
•any and all other timing, exploration, development, operational, financial, budgetary, economic, legal, social, geopolitical, regulatory and political factors that may influence future events or conditions.
The above list is not exhaustive of the factors that may affect any of the Company’s forward-looking statements and information, and such statements and information will not be updated to reflect events or circumstances arising after the date of such statements or to reflect the occurrence of anticipated or unanticipated events.
Available Information
SSR Mining Inc. was incorporated in British Columbia, Canada in 2005 and its predecessor companies date back to 1946. The corporate office is located at Suite 800 - 7001 E. Belleview Avenue, Denver, Colorado 80237. SSR Mining’s common shares are listed on the Nasdaq Global Market and the Toronto Stock Exchange under the trading symbol “SSRM.” The Company’s CHESS depositary interests (“CDIs”) are listed under the ticker symbol “SSR” on Australian Securities Exchange (ASX).
General information about the Company is available through the Company’s website at http://www.ssrmining.com. The Company’s press releases and filings with the SEC in the United States and on SEDAR in Canada are available free of charge within the Investors section of the Company’s website at http://ir.ssrmining.com/investors. In addition, the SEC maintains an internet site that contains reports, proxy and information statements and other information regarding issuers, such as the Company, that are filed electronically with the SEC. The address of that website is http://www.sec.gov. The documents that the Company files under Canadian securities law requirements are available on SEDAR at the following address http://sedar.com. The information on or linked to the Company’s website is neither a part of nor incorporated by reference in this Annual Report or any of the Company’s other SEC filings or filings made on SEDAR. All references to www.ssrmining.com in this Annual Report are inactive textual references only and information contained at that website is not incorporated herein and does not constitute a part of this Annual Report.
As of June 30, 2021, we determined that we no longer qualified as a “foreign private issuer,” as such term is defined in Rule 405 under the Securities Act of 1933, as amended. Consequently, we were required to comply with U.S. domestic issuer requirements beginning January 1, 2022. As a U.S. domestic issuer, we have adopted U.S. generally accepted accounting principles for the first time with the preparation of our consolidated financial statements for the years ended December 31, 2021, 2020 and 2019. As a foreign private issuer, we previously prepared our consolidated financial statements in accordance with International Financial Reporting Standards.
ITEM 1A. RISK FACTORS
The Company's business activities are subject to significant risks, including those described below. You should carefully consider these risks. If any of the described risks actually occurs, the Company's business, financial position and results of operations could be materially adversely affected. Such risks are not the only ones faced by the Company and additional risks and uncertainties not presently known to us or that we currently deem immaterial may also affect the Company's business. This Annual Report contains forward-looking statements that involve risks and uncertainties. The Company's actual results could differ materially from those anticipated in the forward-looking statements as a result of a number of factors, including the risks described below. See “Cautionary Note Concerning Forward-Looking Statements.”
Risk Factor Summary
The Company is subject to a variety of risks and uncertainties, including risks related to the Company's operations and business, financial risks and risks related to the Company's indebtedness, risks related to the Company's industry and the jurisdictions in which we operate, risks related to our personnel, risks related to governmental regulation and legal proceedings and risks related to ownership of Company equity, which could have a material adverse effect on the Company's business, financial condition, results of operations and cash flow. The following is a summary of the principal risks faced by the Company, including, but not limited to:
•The Company's production, development plans and cost estimates may vary and/or not be achieved.
•Changes in the market prices of gold, silver and other metals, which in the past have fluctuated widely, will affect the Company’s operations.
•Epidemics, pandemics or other public health crises, including COVID-19, could adversely affect the Company’s business.
•The Company’s estimates of mineral reserves and mineral resources are based on interpretation and assumptions and may yield less mineral production under actual conditions than is currently estimated.
•The Company may be unable to replace its mineral reserves or acquire additional commercially mineable mineral rights.
•Increased operating and capital costs could affect the Company's profitability.
•The Company's operations may be adversely affected by rising energy prices or energy shortages.
•Supply chain and other disruptions could adversely affect the Company's business.
•Continuation of the Company's mining production is dependent on the availability of sufficient water supplies to support our mining operations.
•The Company may be exposed to future development risks.
•Land reclamation, mine closure and remediation requirements and costs may be burdensome and actual environmental and asset retirement obligations may exceed estimates and reserves.
•The Company is subject to certain transportation risks that could have a negative impact on the Company’s ability to operate.
•The Company may be subject to information systems security threats.
•The Company’s joint venture interests are subject to risks.
•Reputation loss may result in decreased investor confidence, increased challenges in developing and maintaining community relations and an impediment to the Company’s overall ability to advance its projects, thereby having a material adverse impact on the Company’s financial performance, financial condition, cash flows and growth prospects.
•The Company is subject to risks associated with its financial instruments.
•The Company may be adversely affected by fluctuations in foreign exchange rates.
•Inflation may have a material adverse effect on results of operations.
•Future funding requirements may affect the Company's business or its ability to develop mineral properties, complete exploration and development programs, pay cash dividends or engage in share repurchase transactions.
•The Company may be unable to generate sufficient cash to service its debt and other actions to satisfy such obligations may be unsuccessful.
•The Company may fail to fulfill its obligations under existing and future indebtedness, and such indebtedness may impair the financial health of the Company.
•Political or economic instability or unexpected regulatory change in the countries where the Company’s mineral properties are located could adversely affect its business.
•Suitable infrastructure may not be available or damage to existing infrastructure may occur.
•Mining is inherently risky and subject to conditions and events beyond the Company’s control.
•Mining companies are increasingly required to consider and provide benefits to the communities and countries in which they operate in order to maintain operations.
•Indigenous peoples’ title claims and rights to consultation and accommodation may affect the Company’s existing operations as well as development projects and future acquisitions.
•Civil disobedience in certain of the countries where the Company’s mineral properties are located could adversely affect its business.
•The Company and the mining industry face geotechnical challenges, which could adversely impact our production and profitability.
•Certain of the Company’s directors and/or officers also serve, or may serve, as directors of other companies involved in natural resource exploration and development, and consequently there exists the possibility for these directors and/or officers to be in a position of conflict.
•The Company could be subject to potential labor unrest or other labor disturbances.
•The Company is dependent on its ability to recruit and retain qualified personnel.
•The Company relies on contractors to conduct a significant portion of its operations and construction projects.
•The Company is subject to significant governmental regulations.
•The Company requires permits to conduct its operations, and delays in obtaining or failing to obtain such permits, or a failure to comply with the terms of any such permits that the Company has obtained, would adversely affect the Company’s business.
•The Company’s activities are subject to environmental laws and regulations that may increase the Company’s costs and restrict its operations.
•Compliance with emerging climate change regulations could result in significant costs and climate change may present physical risks to a mining company’s operations.
•The Company may be required by human rights laws to take actions that delay the Company’s operations or the advancement of its projects.
•The Company’s mineral properties may be subject to uncertain title.
•The Company is subject to claims and legal proceedings that arise in the ordinary course of business.
•The Company is subject to assessment by taxation authorities in multiple jurisdictions that arise in the ordinary course of business.
•The Company’s common shares are publicly traded and are subject to various factors that have historically made the Company’s common share price volatile.
•Holders of our common shares may not receive dividends.
•Future sales or issuances of equity securities could decrease the value of the Company’s common shares, dilute investors’ voting power and reduce the Company’s earnings per share.
Risks Related to the Company's Operations and Business
The Company’s production, development plans and cost estimates may vary and/or not be achieved.
The Company has prepared estimates of future production, operating costs and capital costs for Çöpler, Marigold, Seabee and Puna, and the Company’s technical studies and reports for the Company’s projects, including the Çöpler District Master Plan 2021 Technical Report Summary, the Marigold 2021 Technical Report Summary, the Seabee 2021 Technical Report Summary and the Puna 2021 Technical Report Summary, contain estimates of future production, development plans, operating and capital costs and other economic and technical estimates relating to these projects. These estimates are based on a variety of factors and assumptions and there is no assurance that such production, plans, costs or other estimates will be achieved. Actual production, costs and financial returns may vary significantly from the estimates depending on a variety of factors many of which are not within the Company’s control. These factors include, but are not limited to: actual ore mined varying from estimates of grade, tonnage, dilution, metallurgical and other characteristics; short-term operating factors such as the need for sequential development of ore bodies and the processing of new or different ore grades from those planned; mine failures, slope failures or equipment failures; industrial accidents; natural phenomena such as inclement weather conditions, inadequate ice thickness for an ice road at Seabee, floods, droughts, wildfires, rock slides and earthquakes; encountering unusual or unexpected geological conditions; changes in power costs and potential power shortages; exchange rate and commodity price fluctuations; shortages of principal supplies needed for operations, including explosives, fuels, chemical reagents, water, equipment parts and lubricants; labor shortages or strikes; epidemics, pandemics and public health emergencies, including those related to the recent outbreak of COVID-19; high rates of inflation; civil disobedience and protests; and restrictions (including changes to the taxation regime) or regulations imposed by governmental or regulatory authorities, including permitting and environmental regulations, or other changes in the regulatory environments. Failure to achieve estimates or material increases in costs could have a material adverse impact on the Company’s future cash flows, profitability, results of operations and financial condition.
Changes in the market prices of gold, silver and other metals, which in the past have fluctuated widely, will affect the Company’s operations.
The Company’s profitability and long-term viability and the economic feasibility of its mineral properties depend, in large part, on the market price of gold, silver, copper, lead and zinc. The market prices for these metals are volatile and are affected by numerous factors beyond the Company’s control, including:
•global or regional consumption patterns;
•the supply of, and demand for, these metals;
•gold sales, purchases or leasing by governments and central banks;
•the monetary policies employed by the world’s major central banks;
•the fiscal policies employed by the world’s major industrialized economies;
•recession or reduced economic activity in the United States and other industrialized or developing countries;
•speculative short positions taken by significant investors or traders in gold, silver, lead, zinc or other metals;
•forward sales by producers in hedging or similar transactions;
•the availability and costs of metal substitutes;
•decreased industrial, jewelry, base metal or investment demand;
•increased import and export taxes;
•inflation and/or expectations for inflation;
•other political and economic conditions, including interest rates and currency values; and
•changing investor or consumer sentiment, including in connection with transition to a low-carbon economy, investor interest in crypto currencies and other investment alternatives and other factors
The Company cannot predict the effect of these factors on metal prices. For example, average gold prices for 2021 were $1,799 per ounce (2020: $1,770; 2019: $1,393), average silver prices for 2021 were $25.14 per ounce (2020: $20.55; 2019: $16.21), average lead prices for 2021 were $1.00 per pound (2020: $0.89; 2019: $0.99) and average zinc prices for 2021 were $1.36 per pound (2020: $1.03; 2019: $1.24). Any decline in our realized prices adversely impacts our revenues, net income and operating cash flows.
In addition, a decrease in the market price of gold, silver and other metals would affect the profitability of Çöpler, Marigold, Seabee and Puna Operations and could affect the Company’s ability to finance the exploration and development of any of the Company’s other mineral properties. The market price of gold, silver and other metals may not remain at current levels. In particular, an increase in worldwide supply, and consequential downward pressure on prices, may result over the longer term from increased gold or silver production from mines developed or expanded as a result of current metal price levels.
Furthermore, sustained lower gold, silver, copper, zinc, lead or other metal prices may:
•reduce revenues further through production declines due to cessation of the mining of deposits, or portions of deposits, that have become uneconomic at sustained lower metal prices;
•reduce or eliminate the profit that we currently expect from ore stockpiles and ore on leach pads and increase the likelihood and amount that the Company might be required to record as an impairment charge related to the carrying value of its stockpiles and ore on leach pads;
•halt or delay the development of new projects;
•reduce funds available for exploration and advanced projects with the result that depleted reserves may not be replaced; and
•reduce existing reserves by removing ores from reserves that can no longer be economically processed at prevailing prices.
Epidemics, pandemics or other public health crises, including COVID-19, could adversely affect the Company’s business.
The COVID-19 pandemic has adversely impacted the Company’s operations since 2020, including production and operating income, as well as temporary suspension of operations at Seabee and Puna. While all the Company’s mines are currently operating at expected levels, the health and safety protocols that the Company has implemented for the protection of its employees and other stakeholders are adding costs and impacting the efficiency of the Company's operations. There is no assurance that the operations at any or all of the Company's mines will not be the subject of new or additional restrictions, protocols, suspensions or closures, in whole or in part, in the future, which could have a material adverse effect on the Company's business.
The global responses to the COVID-19 pandemic have led to significant restrictions on travel, temporary business closures, quarantines, stock market volatility, supplier and vendor uncertainty and a general reduction in global consumer activity. The effects of the COVID-19 pandemic continue to evolve, and governments may introduce new, or modify existing, laws, regulations, decrees or other orders that could impact the Company’s operations or affect its employees, suppliers, local communities, customers, and other stakeholders. In addition, there is the risk that the responses of the relevant governments, including the effectiveness of vaccination programs implemented in the markets in which we operate, may be insufficient to contain the impact of the COVID-19 pandemic, which could further impact the Company’s ability to operate. Further, there is the risk that one or more of the Company’s employees, contractors or community members could contract COVID-19 or be directly affected by someone who contracts COVID-19 and is required to self-isolate. This could impact the Company’s workforce, its ability to operate at that location and the health of the surrounding community. The Company has implemented what it believes to be the necessary protocols in each of the jurisdictions in which it operates in order to adequately respond to developments relating to the COVID-19 pandemic, including to further protect the health and safety of its workforce, their families and neighboring communities. However, with the uncertainties surrounding the continued development of the COVID-19 pandemic, including in connection with existing or new variants of COVID-19, and the resulting implications globally, there is no assurance that any protocols that have been or that may be put in place will mitigate the risks or that they will not cause the Company to experience less favorable economic and/or health and safety outcomes.
Finally, while the COVID-19 pandemic has adversely impacted the Company’s operations in the short term, it is difficult to predict the long-term impact on the global economy, which could in turn materially adversely affect our operations, financial results and/or liquidity position. The prolonged exposure of the Company's business and the economy to the impacts of COVID-19 may exacerbate many of the risks that the Company is subject to, including the risks described in this report, and expose the Company to the following: operational and supply chain delays and disruptions, labor shortages, social unrest, breach of material contracts and customer agreements, increased insurance premiums and/or taxes, increased supplier and contractor expenses, decreased demand or the inability to sell and deliver precious metals, declines in the price of precious metals, delays in permitting or approvals, governmental disruptions, international economic and political conditions, international or regional consumptive patterns, expectations on inflation or deflation, interest rates, capital markets volatility, or other unknown but potentially significant impacts, including the possibility of a significant protracted economic downturn, including a global recession. These factors may impact, among other things, the Company’s operating plans, production, liquidity and cash flows, valuation of its long-lived assets, the broader market and the trading price of SSR Mining’s common shares.
Given the uncertainty of the duration and magnitude of the impact of the COVID-19 pandemic, the Company’s future operations, including production and cash cost estimates, are subject to a higher than normal degree of risk and uncertainty. It is unknown whether and how the Company’s operations may be affected if the COVID-19 pandemic persists for an extended period of time. Should the duration, spread or intensity of the COVID-19 pandemic further develop in 2022, SSR Mining’s business, financial condition and results of operations could be more significantly impacted.
Further, to the extent that the COVID-19 pandemic adversely affects our business and financial results, it may also have the effect of heightening many of the other risk factors described herein, including, but not limited to, risks related to commodity prices and commodity markets, commodity price fluctuations, our indebtedness, information systems and cyber security and risks relating to our mining operations such as risks related to mineral reserve and mineral resource estimates, production forecasts, impacts of governmental regulations, international operations, availability of infrastructure and employees and challenging global financial conditions.
The Company may be unable to replace its mineral reserves or acquire additional commercially mineable mineral rights.
The Company must continually replace its depleted mineral reserves to maintain production levels over the long term. Mineral reserves can be replaced by expanding known ore bodies, locating new deposits or making acquisitions. There is a risk that depletion of the Company’s mineral reserves will not be offset by discoveries or acquisitions. The Company’s mineral base may decline if mineral reserves are mined without adequate replacement and the Company may not be able to sustain production beyond the current mine lives, based on current production rates. If the Company’s mineral reserves are not replaced either by the development of additional mineral reserves and/or additions to mineral reserves, there may be an adverse impact on the Company’s future cash flows, earnings, results of operations and financial condition, and this may be compounded by requirements to expend funds for reclamation and decommissioning.
The Company’s future growth and productivity will depend, in part, on its ability to identify and acquire additional commercially mineable mineral rights, and on the costs and results of continued exploration and potential development programs. Mineral exploration is highly speculative in nature and is frequently non-productive. Most exploration projects do not result in the discovery of commercially mineable ore deposits, and there is no assurance that any anticipated or estimated level of recovery of mineral reserves will be realized or that any identified mineral deposit will ever qualify as a commercially mineable (or viable) orebody that can be legally and economically exploited. Once a site with mineralization is discovered, it may take several years from the initial phases of drilling until production is possible, during which time the economic feasibility of production may change. Substantial expenditures are also required to establish proven and/or probable mineral reserves and to construct mining and processing facilities. Material changes in mineral reserves, grades, stripping ratios or recovery rates may affect the economic viability of any project. As a result, there is no assurance that current or future exploration programs will be successful.
The Company may consider, from time to time, the acquisition of ore reserves from third parties. Such acquisitions are typically based on an analysis of a variety of factors including, but not limited to, historical operating results, estimates of and assumptions regarding the extent of ore reserves, the timing of production from such reserves, cash and other operating costs and the Company's assumptions for future gold, silver, copper, zinc or lead prices or other mineral prices. In connection with any acquisitions, the Company may rely on data and reports prepared by third parties, which may contain information or data that the Company is unable to independently verify or confirm. Other than historical operating results, all of these factors are uncertain and may have an impact on the Company's revenue, cash flow and other operating issues, as well as contributing to the uncertainties related to the process used to estimate ore reserves. In addition, there may be intense competition for the acquisition of ore reserves and/or attractive mining properties. There can be no assurance that the Company will be able to successfully acquire any desired ore reserves or mining properties.
The Company’s estimates of mineral reserves and mineral resources are based on interpretation and assumptions and may yield less mineral production under actual conditions than is currently estimated.
There are numerous uncertainties inherent in estimating quantities of mineral reserves and grades of mineralization, including many factors beyond the Company’s control. In making determinations about whether to advance any of the Company’s projects to development or to mine existing mineral reserves, the Company must rely upon estimated calculations as to the mineral reserves and grades of mineralization on its properties. Until ore is actually mined and processed, mineral reserves and grades of mineralization must be considered as estimates only. These estimates are imprecise and depend upon geological interpretation and statistical inferences drawn from drilling and sampling, which may prove to be unreliable. The Company cannot assure that mineral reserves, mineral resources or other mineralization estimates will be accurate, or that mineralization can be mined or processed profitably. Actual operating and capital cost and economic returns on projects may differ significantly from original estimates. Further, it may take many years from the initial phases of exploration until commencement of production, during which time, the economic feasibility of production may change.
Additionally, the Company is required to comply with the disclosure standards under new Regulation S-K Subpart 1300 for the year ended December 31, 2021. The provisions of the new disclosure standards are intended to align with those used in the major mining regulatory jurisdictions, however certain provisions of the new disclosure standards may be more restrictive and/or prescriptive than those used in other regulatory jurisdictions. Such variation may result in declarations and disclosures of the Company differing, potentially materially, from those of our non-US joint-venture partners and competitors.
Any material changes in mineral reserves estimates and grades of mineralization will affect the economic viability of placing a property into production and a property’s return on capital. The Company’s estimates of mineral reserves and mineral resources have been determined and valued based on assumed future prices, cut-off grades and operating costs that may prove to be inaccurate. Extended declines in market prices for gold, silver and other precious metals may render portions of the Company’s mineralization uneconomic and result in reduced reported mineral reserves or mineral resources.
Any material reductions in estimates of mineralization, or of the Company’s ability to extract this mineralization, including estimates made in Çöpler District Master Plan 2021 Technical Report Summary, the Marigold 2021 Technical Report Summary, the Seabee 2021 Technical Report Summary and the Puna 2021 Technical Report Summary and the technical reports for the Company’s additional projects, could have a material adverse effect on the Company’s results of operations or financial condition. There is no assurance that mineral recovery rates achieved in small scale tests will be duplicated in large scale tests under on-site conditions or in production scale. If our reserve estimations are required to be revised using significantly lower gold, silver, zinc, lead and other metal prices as a result of a decrease in commodity prices, increases in operating costs, reductions in metallurgical recovery or other modifying factors, this could result in material write-downs of our investment in mining properties or increased amortization, reclamation and closure charges.
Increased operating and capital costs could affect the Company's profitability.
Costs at any particular mining location are subject to variation due to a number of factors, such as variable ore grade, changing metallurgy and revisions to mine plans in response to the physical shape and location of the ore body, as well as the age and utilization rates for the mining and processing related facilities and equipment. In addition, costs are affected by the price and availability of input commodities, such as fuel, electricity, labor, chemical reagents, explosives, steel, concrete and mining and processing related equipment and facilities. Commodity costs are, at times, subject to volatile price movements, including increases that could make production at certain operations less profitable. Further, changes in laws and regulations can affect commodity prices, uses and transport. Reported costs may also be affected by changes in accounting standards. A material increase in costs at any significant location could have a significant effect on our profitability and operating cash flow.
We could have significant increases in capital and operating costs over the next several years in connection with the development of new projects and in the sustaining and/or expansion of existing mining and processing operations. Costs associated with capital expenditures may increase in the future as a result of factors beyond our control. Increased capital expenditures may have an adverse effect on the profitability of and cash flow generated from existing operations, as well as the economic returns anticipated from new projects.
The Company's operations may be adversely affected by rising energy prices or energy shortages.
Our mining operations and development projects require significant amounts of energy. Increasing global demand for energy, concerns about nuclear power and the limited growth of new energy sources are affecting the price and supply of energy. A variety of factors, including higher energy usage in emerging market economies, actual and proposed taxation of carbon emissions as well as concerns surrounding unrest and potential conflict in the Middle East, could result in increased demand or limited supply of energy and/or sharply escalating diesel fuel, gasoline, natural gas and other energy prices. Additionally, changes in energy laws and regulations in various jurisdictions may impact energy dispatch rules and the ability to access energy and sell excess energy. Limitations on energy supply and increased energy prices could negatively impact our operating costs and cash flow.
Our principal energy sources are electricity, purchased petroleum products, natural gas and coal. Some of our operations are in remote locations requiring long distance transmission of power, and in some locations we compete with other companies for access to third party power generators or electrical supply networks. As our operations move towards lower greenhouse gas (“GHG”) emissions targets, power sources and technology at our operations will continue to be evaluated. Certain of our operations may become more dependent upon access to electrical power supply as certain mines move towards electrification. A disruption in the transmission of energy, inadequate energy transmission infrastructure or the termination of any of our energy supply contracts could interrupt our energy supply and adversely affect our operations.
Supply chain and other disruptions could adversely affect the Company's business.
The Company’s ability to mine, process and sell products is critical to our operations. The Company’s operations depend on the continued availability of energy, water, equipment and labor, the costs of which are subject to worldwide supply and demand as well as other factors beyond the Company’s control. Supply chain disruptions, power outages, labor disputes and/or strikes, geopolitical activity, weather events and natural disasters and global health risks or pandemics could seriously harm the Company’s operations as well as the operations of the Company’s customers and suppliers. Likewise, disruptions in the transportation and delivery of products may impact our ability to sell our products and deliver them to our customers on time. In addition, the costs of transporting materials and products through our chain of sourcing and production may increase, and such increases could be significant. Further, the Company’s suppliers may experience capacity limitations in their own operations or may elect to reduce or eliminate certain product lines. To address this risk, generally, the Company seeks to have many sources of supply for key materials in order to avoid significant dependence on any one or a few suppliers, however, prices charged for such key materials by suppliers may differ substantially and obtaining key materials from different suppliers may impact the Company's costs. Although there can be no assurance that such mitigation efforts will prevent future difficulty in obtaining sufficient and timely delivery of certain materials, the Company believes it has adequate programs to ensure a reliable supply of key materials.
Failure to take adequate steps to mitigate the likelihood or potential impact of such disruptions, or to effectively manage such disruptions if they occur, could adversely affect our business and results of operations, as well as require additional resources to restore our global supply chain. Any of these factors could have a material adverse impact on our results of operations and financial condition.
Continuation of the Company's mining production is dependent on the availability of sufficient water supplies to support our mining operations.
The Company recognizes the right to clean, safe water and that reliable water supplies are vital for hygiene, sanitation, livelihoods and the health of the environment. Across the globe, water is a shared and regulated resource. Water is also critical to the Company's business, and the increasing pressure on water resources requires us to consider both current and future conditions in our water management approach. SSR Mining operates in areas where watersheds are under stress with limited supply, increasing population and water demand that impact water in various forms. The Company's management of water-related risks targets the specific areas of operation, as well as considering the physical environment and social and regulatory context. Although each of the Company's operations currently has sufficient water rights, claims and contracts to cover its operational demands, the potential outcome of pending or future legal proceedings or community negotiations relating to water rights, claims, contracts and uses is unknown and unpredictable. Further, laws and regulations may be introduced in certain operational jurisdictions, which could limit the Company's access to sufficient water resources. Water shortages may also result from weather or environmental changes and climate impacts out of the Company’s control. While the Company has considered and incorporated systems to address the impact of the dry season as part of its operating plans, there is no assurance that those systems will be sufficient to address all shortages in water supply. Any interruption or shortage of water supplies could require the Company to curtail or shut down mining production and could prevent the Company from pursuing expansion opportunities, resulting in production and processing delays or stoppages.
The Company may be exposed to future development risks.
Any adverse condition affecting mining or processing conditions at a Company property could have a material adverse effect on the Company’s financial performance and results of operations. The future development of any other properties found to be economically feasible and approved by the Company’s Board of Directors will require the construction and operation of mines, processing plants and related infrastructure. As a result, the Company is and will continue to be subject to all of the risks associated with establishing new mining operations, including:
•the availability and cost of skilled labor, and mining and processing equipment;
•the availability and cost of appropriate smelting and refining arrangements;
•securing long-term access agreements required to develop and operate a mine;
•the need to obtain and retain necessary environmental and other governmental approvals and permits and the timing of the receipt of those approvals and permits;
•potential opposition from governmental or non-governmental organizations, environmental groups or local community groups which may delay or prevent development activities;
•potential for labor unrest or other labor disturbances;
•potential increases in cost structures due to changes in input costs including the cost of fuel, power, materials and supplies and fluctuations in currency exchange rates;
•the timing and cost, which may be considerable, of the construction and expansion of mining, processing and tailings management facilities;
•changes in tonnage, grades and metallurgical characteristics of ore to be mined and processed;
•the quality of the data on which engineering assumptions were made;
•adverse geotechnical conditions;
•changes in tax laws, the laws and/or regulations around royalties and other taxes due to the regional and national governments and royalty agreements;
•weather or severe climate impacts, including, without limitation, prolonged or unexpected precipitation, drought and/or sub-zero temperatures; and
•potential delays and restrictions in connection with health and safety issues, including pandemics (such as COVID-19) and other infectious diseases.
The costs, timing and complexities of operating the Company's existing operations and constructing and developing the Company’s other projects may be greater than the Company anticipates. The majority of the Company's established and development property interests are not located in developed areas and, as a result, the Company’s property interests may not be served by appropriate road access, water and power supply and other support infrastructure. Cost estimates may also increase as more detailed engineering work is completed on a project.
Properties not yet in production or slated for expansion are subject to higher risks, as new mining operations often experience unexpected problems during the construction and start-up phase, and production delays and cost adjustments can often occur. Further, feasibility studies, pre-feasibility studies and preliminary economic assessments contain project-specific estimates of future production, which are based on a variety of factors and assumptions. There is no assurance that such estimates will be achieved and the failure to achieve production or cost estimates or material increases in costs could have a material adverse effect on the Company’s future cash flows, profitability, results of operations and financial condition and the Company’s share price.
In addition, developments are prone to material cost overruns versus budget. The capital expenditures and time required to develop new mines, including building mining and processing facilities for new properties, are considerable, and changes in cost or construction schedules can significantly increase both the time and capital required to build the mine. The project development schedules are also dependent on obtaining the governmental approvals and permits necessary for the operation of a mine, which is often beyond the Company’s control. It is not unusual in the mining industry for new mining operations to experience unexpected problems during the start-up phase, resulting in delays and requiring more capital than anticipated. There is no assurance that there will be sufficient availability of funds to finance construction and development activities, particularly if unexpected problems arise.
The Company’s production forecasts are based on full production rates being achieved at all of the Company’s mines. The Company’s ability to achieve and maintain full production rates at these mines is subject to a number of risks and uncertainties. Future development activities may not result in the expansion or replacement of current production forecasts with new production forecasts. One or more new projects may be less profitable than anticipated or may not be profitable at all. Any reduction in production forecasts could have a material adverse effect on the Company’s results of operations and financial position.
Land reclamation, mine closure and remediation requirements and costs may be burdensome and actual environmental and asset retirement obligations may exceed estimates and reserves.
Although variable depending on location and the governing authority, land reclamation, mine closure and remediation requirements are generally imposed on mining companies in order to minimize long-term effects of land disturbance. Such requirements may include requirements to control dispersion of potentially deleterious effluents, and reasonably re-establish pre-disturbance landforms and vegetation.
The laws and regulations governing mine closure and reclamation in a particular jurisdiction are subject to review at any time and may be amended to impose additional requirements and conditions. Any additional obligations may cause our provisions for environmental liabilities to be underestimated and could materially affect our financial position or results of operations. In addition, regulators are increasingly requesting security in the form of cash collateral, credit, trust arrangements or guarantees to secure the performance of environmental obligations, which could have an adverse effect on our financial position. For a more detailed description of potential environmental liabilities, see the discussion in Environmental Matters in Notes 6 and 19 to the consolidated financial statements.
Under the U.S. Comprehensive Environmental Response, Compensation, and Liability Act of 1980 (“CERCLA”) and its state law equivalents, current or former owners of properties may be held jointly and severally liable for the costs of site cleanup or required to undertake remedial actions in response to unpermitted releases of hazardous substances at such property, in addition to, among other potential consequences, liability to governmental entities for the cost of damages to natural resources, which may be significant. These subject properties are referred to as “superfund” sites. While no operations are currently so designated, it is possible that certain of our other current or former operations in the U.S. could be designated as a superfund site in the future, exposing us to potential liability under CERCLA.
In order to carry out reclamation, mine closure and remediation obligations imposed on the Company in connection with its exploration, potential development and production activities, the Company must allocate financial resources that might otherwise be spent on further exploration and development programs, including providing the appropriate regulatory authorities with reclamation financial assurance. The amount and nature of the financial assurance are dependent upon a number of factors, including the Company’s financial condition and reclamation cost estimates, and can be difficult to predict, particularly water remediation requirements which may be ongoing and long lasting. Changes to these amounts, as well as the nature of the collateral to be provided, could significantly increase the Company’s costs, making the maintenance and development of existing and new mines less economically feasible. To the extent that the value of the collateral provided to the regulatory authorities is or becomes insufficient to cover the amount of financial assurance the Company is required to post, the Company would be required to replace or supplement the existing security with more expensive forms of security, which might include cash deposits, which would reduce the Company’s cash available for operations and financing activities. There can be no assurance that the Company will be able to maintain or add to the Company’s current level of financial assurance. The Company may not have sufficient capital resources to further supplement the Company’s existing security.
Certain of the Company’s mineral properties have been subject to historic mining operations and certain of the mineral properties that were historically mined by the Company are subject to remediation obligations. In addition, the actual costs of reclamation, mine closure and remediation are uncertain and planned expenditures may differ from the actual expenditures required. Therefore, the amount that the Company is required to spend could be materially higher than current estimates. Any additional amounts required to be spent on reclamation and mine closure may have an adverse effect on the Company’s financial position and results of operations and may cause the Company to alter the Company’s operations.
The Company is subject to certain transportation risks that could have a negative impact on the Company’s ability to operate.
The Company’s facilities depend on supplies of consumables (including diesel, tires, sodium cyanide and reagents) and capital items delivery to operate efficiently. At Seabee, supplies are delivered to site across a seasonal ice road. If the Company experiences prolonged disruption to the delivery of such consumables, the Company’s production efficiency and ability to effectively complete capital projects requiring such deliveries may be reduced. Separately, if the seasonal ice road becomes unusable or unavailable for any reason, the Company may incur significant costs to arrange alternative transportation, if such alternative transportation is even available or possible. There can be no assurance that these transportation risks will not have an adverse effect on any site, particularly Seabee, and therefore on the Company’s profitability.
In addition, ore mined at the Chinchillas property is loaded onto road trucks and transported approximately 45 kilometers to the Pirquitas processing facilities. Transportation of such ore is subject to numerous risks including, but not limited to, roadblocks, terrorism, interruption by domesticated and non-domesticated herding animals, theft, weather conditions, environmental liabilities in the event of an accident or spill, inability to transport ore in oversized loads, personal injury and loss of life. The Company is also subject to the risk of a potential interruption of business from a third party beyond the Company’s control, which could have a material adverse effect on the Company’s operations and revenues.
The Company may be subject to information systems security threats.
The Company has entered into agreements with third parties for hardware, software, telecommunications and other information technology (“IT”) services in connection with its operations. The Company’s operations depend, in part, on how well the Company and its suppliers protect networks, equipment, IT systems and software against damage from a number of threats, including, but not limited to, cable cuts, damage to physical plants, natural disasters, terrorism, fire, power loss, hacking, computer viruses, vandalism and theft. Cybersecurity risk is increasingly difficult to identify and quantify and cannot be fully mitigated because of the rapidly evolving nature of the threats, targets and consequences. Additionally, unauthorized parties may attempt to gain access to these systems or our information through fraud or other means of deceiving our third-party service providers, employees or vendors.
Given the unpredictability of the timing, nature and scope of information technology disruptions, we could potentially be subject to production downtimes, operational delays, the compromising of confidential or otherwise protected information, destruction or corruption of data, security breaches, other manipulation or improper use of our systems and networks or financial losses from remedial actions. Outages in our operational technology may affect operations related to health and safety and could result in putting lives at risk of harm or death. In addition, as technologies evolve and cybersecurity attacks become more sophisticated, we may incur significant costs to upgrade or enhance our security measures to protect against such attacks and we may face difficulties in fully anticipating or implementing adequate preventive measures or mitigating potential harm, which could have a material adverse effect on our cash flows, competitive position, financial condition or results of operations. For instance, we review our cybersecurity controls against current industry threats and partner with security vendors to assist with protecting our network and data resources through activities such as penetration and vulnerability testing, assessments against current cybersecurity standards, and leveraging industry recommendations from both independent vendors as well as industry partners. These efforts are designed to address any remediation actions through our ongoing cyber security program. Such efforts may incur significant costs and yet prove insufficient to deter future cybersecurity attacks or prevent all security breaches.
The Company’s operations also depend on the timely maintenance, upgrade and replacement of networks, equipment, IT systems and software, as well as pre-emptive expenses to mitigate the risks of failures. Any of these and other events could result in information system failures, delays and/or increase in capital and operating expenses. The failure of information systems or a component of information systems could, depending on the nature of any such failure, adversely impact the Company’s reputation and results of operations.
Although to date the Company has not experienced any material losses relating to information systems security threats or other information security breaches, there can be no assurance that the Company will not incur such losses in the future. The Company’s risk and exposure to these matters cannot be fully mitigated because of, among other things, the evolving nature of these threats. As cyber threats continue to evolve, the Company may be required to expend additional resources to continue to modify or enhance protective measures or to investigate and remediate any security vulnerabilities.
General economic conditions may adversely affect the Company’s growth and profitability.
Market events and conditions, including the disruptions in the international credit markets and other financial systems, along with political instability and fluctuation of currency prices expressed in USD, CAD, TL, ARS, or the currency of any other location in which the Company operates may result in commodity price volatility. These conditions have, at times, caused a loss of confidence in global credit markets, resulting in the collapse of, and/or government intervention in, major banks, financial institutions and insurers, and creating a climate of greater volatility, tighter regulations, less liquidity, widening credit spreads, less price transparency, increased credit losses and tighter credit conditions. Notwithstanding various actions by governments, concerns about the general condition of the capital markets, financial instruments, banks and investment banks, insurers and other financial institutions may cause the broader credit markets to be volatile and interest rates to remain low. In addition, an increase in price levels generally, or in price levels in a particular sector such as the energy sector (such as current inflation related to domestic and global supply chain issues, which has led to both overall price increases and pronounced price increases in certain sectors) could result in a shift in demand for metals, which could adversely affect our revenues and, at the same time, increase our costs. These events are illustrative of the effect that events beyond the Company’s control may have on commodity prices, demand for metals, including gold, silver, zinc and lead, availability of credit, investor confidence, and general financial market liquidity, all of which may adversely affect the Company’s business.
The Company faces intense competition in the mining industry.
The mining industry is intensely competitive in all phases and the Company competes with many companies, several of which possess greater financial and technical resources than itself. Competition in the base and precious metals mining industry is primarily for mineral rich properties which can be developed and produced economically; the human resources and technical expertise to find, develop, and operate such properties; the labor to operate the properties; and the capital for the purpose of funding such properties. Many competitors not only explore for and mine precious metals, but also conduct refining and marketing operations on a world-wide basis. Such competition may result in the Company being unable to acquire desired properties, recruit or retain qualified employees or acquire the capital necessary to fund its operations and develop its properties. Existing or future competition in the mining industry could materially adversely affect the Company’s prospects for mineral exploration and success in the future.
The Company may be subject to risks associated with future acquisitions.
As part of the Company’s business strategy, it has sought and will continue to seek new operating, development and exploration opportunities in the mining industry. In pursuit of such opportunities, the Company may fail to select appropriate acquisition candidates or negotiate acceptable arrangements, including arrangements to finance acquisitions or integrate the acquired opportunities into the Company's existing business. The Company cannot provide assurance that it can complete any acquisition or business arrangement that it pursues, or is pursuing, on favorable terms, if at all, or that any acquisitions or business arrangements completed will ultimately benefit its business. Further, any acquisition the Company makes will require a significant amount of time and attention of the Company's management, as well as resources that otherwise could be spent on the operation and development of its existing business.
Any future acquisitions would be accompanied by risks, such as a significant decline in the relevant metal price after the Company commits to complete an acquisition on certain terms; the quality of the mineral deposit acquired proving to be lower than expected; the difficulty of assimilating the operations and personnel of any acquired companies; the potential disruption of its ongoing business; the inability of management to realize anticipated synergies and maximize its financial and strategic position; the failure to maintain uniform standards, controls, procedures and policies; and the potential for unknown or unanticipated liabilities associated with acquired assets and businesses, including tax, environmental or other liabilities. There can be no assurance that any business or assets acquired in the future will prove to be profitable, that the Company will be able to integrate the acquired businesses or assets successfully or that the Company will identify all potential liabilities during due diligence. Any of these factors could have a material adverse effect on its business, expansion, results of operations and financial condition.
The Company’s joint venture interests are subject to risks.
The Company has joint venture arrangements in respect of certain of its properties, including its properties in Turkey. Although the Company expects relations with its joint venture and strategic partners to remain positive, contractual or other disputes may arise that may have a material adverse effect on the Company’s financial condition or its ability to develop and operate its assets. Furthermore, the Company has inherently less control when it is not the operator of a project subject to a joint venture agreement, even if the Company has a controlling interest under a joint venture agreement. In such instances, the contractual terms of the agreement may limit the Company’s ability to influence the operation of the project.
The Company’s interest in deferred consideration received from divestitures may not be fully realizable.
From time to time, as partial or full consideration for the Company’s disposition of assets, the Company may receive certain deferred cash or enter into long-term royalty arrangements, including net smelter royalties. The Company cannot provide any assurances that the Company will be able to realize the full value of any deferred cash or royalty interests.
Reputation loss may result in decreased investor confidence, increased challenges in developing and maintaining community relations and an impediment to the Company’s overall ability to advance its projects, thereby having a material adverse impact on the Company’s financial performance, financial condition, cash flows and growth prospects.
Damage to the Company’s reputation can be the result of the actual or perceived occurrence of any number of events, and could include negative publicity, whether true or not. The increased use of social media and other web-based tools to generate, publish and discuss user-generated content and to connect with other users has made it increasingly easier for individuals and groups to communicate and share opinions and views regarding the Company and its activities, whether true or not. The Company does not ultimately have direct control over how it is perceived by others and reputational damage could have a material adverse impact on the Company’s financial performance, financial condition, cash flows and growth prospects.
The Company’s insurance coverage does not cover all of the Company’s potential losses, liabilities and damages related to its business and certain risks are uninsured and uninsurable.
The Company’s business is subject to a number of risks and hazards generally, including adverse environmental conditions, industrial accidents, labor disputes, unusual or unexpected geological conditions, ground or slope failures, cave-ins, mechanical failures, changes in the regulatory environment and natural phenomena such as inclement weather conditions, fires, floods, hurricanes and earthquakes. Such occurrences could result in damage to mineral properties or production facilities, personal injury or death, environmental damage to the Company’s properties or the properties of others, delays in mining, monetary losses and possible legal liability.
Although the Company maintains insurance to protect against certain risks in such amounts as it considers reasonable, the Company’s insurance will not cover all of the potential risks associated with a mining company’s operations. The Company may also be unable to maintain insurance to cover these risks at economically feasible premiums. Insurance coverage may not continue to be available or may not be adequate to cover any resulting liability. Moreover, insurance against risks such as loss of title to mineral property, environmental pollution, or other hazards as a result of exploration and production is not generally available to the Company or to other companies in the mining industry on acceptable terms. The Company might also become subject to liability for pollution or other hazards which may not be insured against or which it may elect not to insure against because of premium costs or other reasons. Losses from these events may cause the Company to incur significant costs that could have a material adverse effect upon its financial performance and results of operations.
The Company is exposed to market and/or counterparty risks related to the sale of its concentrates and metals.
There is no assurance that the Company will, in the future and where necessary, be successful in entering into arrangements to sell the Company’s doré or concentrates on acceptable terms, or at all. If the Company is not successful in entering into such arrangements, the Company may be forced to sell some or all of the Company’s products, or greater volumes of them than the Company may from time to time intend, in the spot market, or the Company may not have a market for its products and the Company’s future operating results may be materially adversely impacted as a result.
In addition, the Company may become subject to such market limitations and/or complications should any counterparty to any of the Company’s arrangements not honor such arrangement or should any of such counterparties become insolvent. Moreover, there is no assurance that the Company will be able to renew any agreements the Company has in place to sell doré or concentrates when such agreements expire, that the Company will be able to enter into any new or additional sale agreements, or that the Company’s doré or concentrates will meet the qualitative and/or quantitative requirements under supply agreements or of existing or future buyers.
Financial Risks and Risks Related to Our Indebtedness
The Company is subject to risks associated with its financial instruments.
The Company maintains financial instruments consisting of cash and cash equivalents, receivables, short-term investments, investments in publicly traded securities, trade and other payables and borrowings, including the Term Loan entered into with a syndicate of lenders (BNP Paribas (Suisse) SA, ING Bank NV, Societe Generale Corporate & Investment Banking and UniCredit S.P.A.) (the “Term Loan”), a Credit Agreement, as amended, with The Canadian Imperial Bank of Commerce, the Bank of Montreal and The Bank of Nova Scotia (the "Amended Credit Facility"), and the indenture governing the notes, dated as of March 19, 2019 entered into with The Bank of New York Mellon (the “2019 Notes”). The Company’s financial instruments are denominated in various foreign currency denominations and are held in various financial institutions. These financial instruments, and others which the Company may acquire, involve substantial risks including, but not limited to, credit risk, liquidity risk, interest rate risk and foreign currency risk. Volatility of external factors beyond the Company’s control may result in substantial and permanent losses. Furthermore, to adequately reduce these risks to acceptable levels, available investment alternatives may result in limited or no return on these assets and any derivative which may be acquired in attempt to mitigate these risks may be ineffective.
The Company's Term Loan and Amended Credit Facility use the London Inter-bank Offered Rate ("LIBOR") as the screen rate and benchmark rate, respectively, and contain LIBOR alternative provisions applicable when LIBOR ceases to exist. LIBOR has recently been the subject of international reform proposals and certain LIBOR settings were discontinued at the end of 2021, with the remaining settings expected to be discontinued by mid-2023. In the United States, the Alternative Reference Rates Committee has proposed the Secured Overnight Financing Rate ("SOFR") as an alternative to LIBOR for use in contracts that are currently indexed to USD LIBOR and has proposed a phased market transition plan to SOFR. There are significant differences between LIBOR and SOFR, such as LIBOR being an unsecured lending rate while SOFR is a secured lending rate, and SOFR is an overnight rate while LIBOR reflects term rates at different maturities. If our LIBOR-based borrowings are converted to SOFR or other alternative rates, the differences between LIBOR and such rates, plus the recommended spread adjustment, could result in interest costs that are higher than if LIBOR remained available, which could have a material adverse effect on our operating results. At this time, it is not possible to predict the effect that these developments, any discontinuance, modification or other reforms to LIBOR, or the establishment of alternative reference rates, such as SOFR, may have on LIBOR, other benchmark rates or floating rate debt instruments, or whether SOFR or any other alternative reference rates that have been proposed will attain market acceptance as replacements of LIBOR. While the Term Loan and Amended Credit Facility contain LIBOR alternative provisions, the use of alternative reference rates or other reforms could cause the interest rate on the Company's borrowings to be materially different than expected. These developments may cause the Company to renegotiate some of these agreements. The Company will continue to monitor market developments related to LIBOR's modification or discontinuance.
The Company may be adversely affected by fluctuations in foreign exchange rates.
The Company maintains its cash and cash equivalents primarily in USD. The Company’s revenues are in USD, while certain of the Company’s costs will be incurred in other currencies. Any appreciation in the currencies of Turkey, Canada, Argentina, or any other country in which the Company carries out exploration or development activities against the USD will increase the Company’s costs of carrying on operations in such countries. In addition, any decrease in the TL, CAD, ARS, or the currency of any other country in which the Company operates, against the USD will result in a loss on the Company’s books to the extent the Company holds funds or net monetary or non-monetary assets denominated in those currencies.
From time to time, countries in which the Company operates may adopt measures to restrict the availability of the local currency or the repatriation of capital across borders or enact tax rate changes designed to restrict fund movement across borders. These measures are imposed by governments or central banks, in some cases during times of economic instability, to prevent the removal of capital or the sudden devaluation of local currencies or to maintain in-country foreign currency reserves. In addition, many emerging markets countries require consents or reporting processes before local currency earnings can be converted into USD or other currencies and/or such earnings can be repatriated or otherwise transferred outside of the operating jurisdiction. These measures may have a number of negative effects on SSR Mining, reducing the immediately available capital that we could otherwise deploy for investment opportunities or the payment of expenses. In addition, measures that restrict the availability of the local currency or impose a requirement to operate in the local currency may create other practical difficulties for SSR Mining. As a result, the Company’s financial performance and forecasts may be significantly impacted by changes in foreign exchange rates.
Inflation may have a material adverse effect on results of operations.
Certain of the Company's operations are located in countries that have in the past experienced high rates of inflation. It is possible that in the future, high inflation in the countries in which we operate may result in an increase in operational costs in local currencies (without a concurrent devaluation of the local currency of operations against the dollar or an increase in the dollar price of gold, silver, copper, zinc or lead). Maintaining operating costs in currencies subject to significant inflation could expose us to risks relating to devaluation and high domestic inflation. Country-specific inflation rates are often volatile and unpredictable, and global inflation rates rose consistently at the end of 2021 as a result of numerous global economic factors and the continuing impact of the COVID-19 pandemic. For instance, in Argentina, the level of inflation during 2019 reached 53.8%, and the level of inflation in Turkey has fluctuated drastically over the end of 2021 and beginning of 2022, significantly impacting the value of the Turkish lira and precipitating Turkish governmental efforts to offset inflation impacts and restore the value of the lira, including lowering central bank interest rates. Significantly higher and sustained rates of inflation, with subsequent increases in operational costs, could result in the deferral or closure of projects and mines in the event that operating costs become prohibitive. This could have a material adverse effect on our business, financial position and results of operations.
The Company may be subject to risks associated with hedging activities.
Precious metals prices, foreign currency rates, and costs of materials and consumables associated with exploration, development and mining activities are subject to frequent, unpredictable and substantial volatility which is beyond the Company’s control. The Company currently has an interest rate hedge in place in relation to its Term Loan and the Company may engage in further hedging activities in the future. Hedging activities are intended to mitigate exposure to fluctuations in the price of precious metals, foreign currencies, materials and consumables. Certain precious metals hedging strategies may protect a company against lower prices, but they may also limit the price that can be realized on precious metal that is subject to forward sales and call options where the market price of gold exceeds the gold price in a forward sale or call option contract. Similarly, hedges of foreign currencies, materials and consumables may protect a company against adverse currency variances and rising costs but may result in losses if currency rates and costs move counter to a company’s hedge position. Hedging activities may be uneconomic due to numerous factors and no assurances can be made that hedging will effectively mitigate risks as intended.
Future funding requirements may affect the Company's business or its ability to develop mineral properties, complete exploration and development programs, pay cash dividends or engage in share repurchase transactions.
Potential future investments, including projects in the Company’s project pipeline, acquisitions and other investments, will require significant funds for capital expenditures. The continuation of production, development and exploration activities, if any, will depend on the Company’s ability to generate sufficient operating cash flows from its mining operations and to obtain additional external financing where necessary. Depending on gold, silver, copper, zinc and lead prices, the Company's operating cash flow may not be sufficient to meet all of these expenditures, depending on the timing of development and other projects. As a result, new sources of capital may be needed to fund investments, ongoing business activities, construction and operation of potential future projects and exploration projects, in addition to funding possible share repurchase transactions and paying dividends. The Company's ability to raise and service significant new sources of capital will be a function of macroeconomic conditions, future gold, silver, copper, zinc and lead prices as well as the Company's operational performance, current cash flow and debt position, among other factors. Failure to obtain sufficient financing could result in the delay or indefinite postponement of exploration, development or production on any or all of its projects. There can be no assurance that additional capital or other types of financing will be available if needed or that, if available, the terms of such financing will be favorable. Alternatively, the Company may determine that it may be necessary or preferable to issue additional equity or other securities, defer projects or sell assets in the future to meet the Company's capital needs.
U.S. and global markets have, from time to time, experienced significant dislocations and liquidity disruptions, and the COVID-19 pandemic has increased, and may continue to increase, volatility and pricing in the capital markets. Additional financing may not be commercially available when needed or, if available, the terms of such financing may not be favorable to us and, if raised by offering equity securities, any additional financing may involve substantial dilution to existing shareholders. In the event of lower gold, silver, copper, zinc or lead prices, unanticipated operating or financial challenges, or new funding limitations, the Company's ability to pursue new business opportunities, invest in existing and new projects, fund our ongoing business activities, retire or service all outstanding debt, repurchase shares and pay dividends could be significantly constrained. If the Company is unable to obtain financing or service existing or future debt we could be required to reduce, suspend or eliminate any dividend payments to shareholders or any planned share repurchase transactions. In addition, the Company's joint venture partners may not have sufficient funds or borrowing ability to make their expected capital commitments to such joint ventures. In the case that such joint venture partners do not make their economic commitments, the Company may be prevented from pursuing certain development opportunities or may assume additional financial obligations, which may require new sources of capital.
The Company may be unable to generate sufficient cash to service its debt and other actions to satisfy such obligations may be unsuccessful.
The Company's ability to make scheduled payments or to refinance our debt obligations and to fund our planned capital expenditures and other ongoing liquidity needs depends on our financial and operating performance, which is subject to prevailing economic and competitive conditions and to certain financial, business and other factors beyond our control. There can be no assurance that the Company's business will generate sufficient cash flow from operations or that borrowings will be available to us to pay the principal, premium, if any, and interest on our debt or to fund our other liquidity needs. The Company may need to refinance all or a portion of its debt on or before maturity, but there is no assurance that the Company will be able to refinance any debt on commercially reasonable terms, or at all.
If cash flows and capital resources are insufficient to fund the Company's debt service obligations, it may be forced to reduce or delay investments and capital expenditures or to sell assets, seek additional capital or restructure or refinance our debt. The Company's ability to restructure or refinance its debt will depend on the condition of the capital markets and our financial condition at such time. Any refinancing of the Company's debt could be at higher interest rates and may require the Company to comply with more onerous covenants, which could further restrict business operations. The terms of existing or future debt instruments, including the indenture governing the 2019 Notes, the Amended Credit Facility and the Term Loan, may restrict us from adopting some of these alternatives. In addition, any failure to make payments of interest and principal on outstanding debt on a timely basis would likely result in a reduction of the Company's credit rating, which could harm our ability to incur additional debt.
The Company may fail to fulfill its obligations under existing and future indebtedness, and such indebtedness may impair the financial health of the Company.
As of December 31, 2021, the Company had total indebtedness of approximately $367.0 million, primarily in the form of the 2019 Notes and the Term Loan. The Company's level of debt and associated debt service obligations may have adverse effects on our business, financial condition, cash flows or results of operations, including:
•making it more difficult for us to satisfy our obligations with respect our outstanding indebtedness;
•reducing the amount of funds available to finance our operations, capital expenditures and other activities;
•increasing our vulnerability to economic downturns and industry conditions;
•limiting our flexibility in responding to changing business and economic conditions;
•jeopardizing our ability to execute our business plans;
•placing us at a disadvantage when compared to our competitors that have less debt;
•increasing our cost of borrowing; and
•limiting our ability to borrow additional funds.
The Company and its subsidiaries may incur substantial additional indebtedness in the future. If new debt is added to the Company and/or its subsidiaries’ existing debt levels, the existing risks associated with the Company’s aggregate debt would necessarily increase.
The Company’s subsidiary, Anagold Madencilik Sanayi ve Ticaret Anonim Şirketi, is party to the Term Loan assumed through the Company’s 2020 merger with Alacer Gold Corp. In addition, the Company is party to the Amended Credit Facility. The Company's ability to make scheduled payments on or refinance its debt obligations under the Term Loan and Amended Credit Facility depends on its financial condition and operating performance, which are subject to prevailing economic and competitive conditions and to certain financial, business, legislative, regulatory and other factors beyond its control. The Company may be unable to maintain a level of cash flows from operating activities sufficient to permit the Company to pay the principal, premium (if any) and interest on its indebtedness. If the Company’s cash flows and capital resources are insufficient to fund its debt service obligations, it could face substantial liquidity problems and could be forced to reduce or delay investments and capital expenditures or to dispose of material assets or operations, seek additional debt or equity capital or restructure or refinance its indebtedness. The Company may not be able to affect any such alternative measures on commercially reasonable terms or at all and, even if successful, those alternatives may not allow it to meet its scheduled debt service obligations. The Term Loan and the Amended Credit Facility will restrict the Company's ability to dispose of assets and use the proceeds from those dispositions and may also restrict its ability to raise debt or equity capital to be used to repay other indebtedness when it becomes due. The Company may not be able to consummate those dispositions or to obtain proceeds in an amount sufficient to meet any debt service obligations then due.
Under the 2019 Notes, the Company has made various covenants to the trustees on behalf of the holders of such notes, including to make payments of interest and principal when due and, upon undergoing a fundamental change, to offer to purchase all of the outstanding 2019 Notes, plus accrued and unpaid interest, if any. Furthermore, if an event of default were to occur under the Term Loan, Amended Credit Facility or 2019 Notes, this would place additional strain on the Company’s cash resources, which could inhibit its ability to further the Company’s exploration and development activities.
The Company may fail to meet financial covenants related to its indebtedness.
The terms of the Company’s debt, including the Term Loan and the Amended Credit Facility, require the Company to satisfy various affirmative and negative covenants and to meet certain financial ratios and tests. These covenants limit, among other things, the Company’s ability to incur further indebtedness if doing so would cause it to fail to meet certain financial covenants, create certain liens on assets or engage in certain types of transactions. Although these covenants do not currently restrict the Company’s ability to conduct its business, there can be no assurances that the Company will continue to satisfy these covenants, that such covenants will not limit in its ability to respond to changes in its business or competitive activities in the future, or the Company will not be restricted from engaging in future mergers, acquisitions or dispositions of assets which may be beneficial to the Company. Furthermore, a breach of these covenants, including a failure to meet the financial tests or ratios, would likely result in an event of default under the associated debt instrument unless the Company can obtain a waiver or consent in respect of any such breach. There can be no assurance that such waiver or consent would be granted. In the event of any default, the applicable lenders could elect to declare all outstanding borrowings, together with accrued and unpaid interest, fees and other amounts due, to be immediately due and payable, which may have a material adverse impact on the Company’s business, profitability or financial condition.
Risks Related to Our Industry and the Jurisdictions in Which We Operate
Political or economic instability or unexpected regulatory change in the countries where the Company’s mineral properties are located could adversely affect its business.
The Company currently conducts operations in the United States, Turkey, Canada and Argentina, and has development and exploration assets in the United States, Turkey, Canada, Mexico and Peru; as such, the Company is exposed to various levels of economic, political and other risks and uncertainties. These risks and uncertainties vary from country to country and include, but are not limited to: royalties and tax increases or claims by governmental bodies; expropriation or nationalization; employee profit-sharing requirements; foreign exchange controls; restrictions on repatriation of profits; import and export regulations; cancellation or renegotiation of contracts; changing fiscal regimes and uncertain regulatory environments; fluctuations in currency exchange rates; high rates of inflation; changes in royalty and tax regimes, including the elimination of tax exemptions; underdeveloped industrial and economic infrastructure; unenforceability of contractual rights and judgments; loss of social license to operate resulting from a decline in societal support for the industry; loss of critical services such as power and water; and environmental permitting regulations. The occurrence of these various factors and uncertainties cannot be accurately predicted and could adversely affect the Company’s business.
Furthermore, the introduction of new tax laws, regulations or rules, or changes to, or differing interpretation of, or application of, existing tax laws, regulations or rules in any of the countries in which the Company’s operations or business is located, could result in an increase in its taxes, or other governmental charges, duties or impositions. No assurance can be given that new tax laws, rules or regulations will not be enacted or that existing tax laws will not be changed, interpreted or applied in a manner that could result in the Company’s profits being subject to additional taxation or that could otherwise have a material adverse effect on the Company.
Additionally, the taking of property by nationalization or expropriation without adequate compensation is a risk in certain jurisdictions in which the Company has operations. Expropriation, or the threat of expropriation, is often the result of poor economic conditions within a country or has underlying political rationales. Although the Company does not presently anticipate that any of its properties will be the subject of expropriation, there can be no assurance that this will not occur. Such governmental actions may have an adverse impact on the Company’s operations and profitability.
Suitable infrastructure may not be available or damage to existing infrastructure may occur.
Mining, processing, development and exploration activities depend on adequate infrastructure. Reliable roads, ice roads, bridges, port and/or rail transportation, power sources, water supply and access to key consumables are important determinants for capital and operating costs. The lack of availability on acceptable terms or the delay in the availability of any one or more of these items could prevent or delay exploration, development or exploitation of the Company’s projects. If adequate infrastructure is not available in a timely manner, the Company cannot assure you that the exploitation or development of its projects will be commenced or completed on a timely basis, or at all, or that the resulting operations will achieve the anticipated production volume, or that the construction costs and operating costs associated with the exploitation and/or development of the Company’s projects will not be higher than anticipated. In addition, extreme weather phenomena, sabotage, vandalism, government, non-governmental organization and community or other interference in the maintenance or provision of such infrastructure could adversely affect the Company’s operations and profitability.
Mining is inherently risky and subject to conditions and events beyond the Company’s control.
The development and operation of a mine or mine property is inherently risky and involves many risks that even a combination of experience, knowledge and careful evaluation may not be able to overcome, including:
•unusual or unexpected geological formations;
•metallurgical and other processing problems;
•shortages in materials or equipment and energy and electrical power supply interruptions or rationing;
•failure of engineered structures;
•inaccurate mineral modeling;
•unanticipated changes in inventory levels at heap-leach operations;
•metal losses;
•environmental hazards, including discharge of metals, concentrates, pollutants or hazardous chemicals;
•ground and water conditions;
•power outages;
•remote locations and inadequate infrastructure;
•community relations problems;
•labor disruptions;
•the availability and retention of skilled personnel;
•non-governmental organization or community activities;
•industrial accidents, including in connection with the operation of mining equipment, milling equipment and/or conveyor systems and accidents associated with the preparation and ignition of large-scale blasting operations, milling and processing;
•transportation incidents, including transportation of chemicals, explosions or other materials, transportation of large mining equipment and transportation of employees and business partners to and from sites;
•fall-of-ground accidents in underground operations;
•failure of mining pit slopes and tailings dam walls;
•periodic interruptions due to inclement or hazardous weather conditions;
•flooding, explosions, fire, rockbursts, cave-ins and landslides;
•seismic activity;
•changes to legal and regulatory requirements;
•security incidents, including activities of illegal or artisanal miners, gold bullion or concentrate theft, including in transport, and corruption and fraud;
•mechanical equipment and facility performance problems;
•failure of unproven or evolving technologies or loss of information integrity or data; and
•the availability of materials and equipment.
These risks could result in damage to, or destruction of, mineral properties, production facilities or other properties, environmental damage, delays in mining, increased production costs, asset write downs, monetary losses and possible legal liability or penalties, occupational illness or health issues, personal injury, and loss of life, and/or facility and workforce evacuation. The Company may not be able to obtain insurance to cover these risks at economically feasible premiums, or at all. The Company may suffer a material adverse effect on its business if it incurs losses related to any significant events that are not covered by the Company’s insurance policies.
Additionally, the Company’s operations, particularly those operations located outside of North America, are exposed to various levels of safety and security risks which could result in injury or death, damage to property, work stoppages, product theft, or blockades of the Company’s mining operations and projects. Risks and uncertainties vary from region to region and include, but are not limited to, terrorism, hostage taking, local drug gang and/or other gang activities, military and/or governmental repression, labor unrest and war or civil unrest. Local opposition to mine development projects could arise and such opposition may be violent. If the Company were to experience resistance or unrest in connection with its mines or projects, it could have a material adverse effect on the Company’s operations and profitability. Additionally, to the extent that such risks and uncertainties are directed towards local populations, the Company may not be able to retain sufficient labor forces to maintain the Company’s operations.
Mining companies are increasingly required to consider and provide benefits to the communities and countries in which they operate in order to maintain operations.
Greater scrutiny on multi-national companies to contribute to sustainable outcomes in the places where they operate, has led to a proliferation of standards, reporting initiatives and expectations focused on environmental stewardship, social performance, community engagement and transparency. Extractive industries, and mining in particular, have seen significant increases in stakeholder expectations and attention. These businesses are increasingly required to meaningfully engage with impacted stakeholders; to understand, avoid or mitigate negative impacts while optimizing economic development and employment opportunities associated with their operations. The expectation is for companies to recognize the impact their operations can have on the communities in which they operate and develop strategies and identify targets to address the actual or perceived impact to create shared value for shareholders, employees, governments, local communities and host countries. Such expectations tend to be particularly focused on companies whose activities are perceived to have high environmental impacts, like mining companies. In response, the Company has developed and continues to evolve a robust system of ESG management that includes standards, guidance, assurance, and participation in international organizations focused on sustainability and improved performance and outcomes for host communities and the environment. Despite the Company’s commitment to on-going engagement with communities and stakeholders, no assurances can be provided that increased stakeholder expectations will not result in interest from activists who seek a more rapid or more significant response to the environmental risks and opportunities faced by the Company or adverse financial and operational impacts to the business, including, without limitation, operational disruption, increased costs, increased investment obligations and increased taxes and royalties payable to governments.
Indigenous peoples’ title claims and rights to consultation and accommodation may affect the Company’s existing operations as well as development projects and future acquisitions.
Some of the Company’s properties may be subject to the rights or the asserted rights of various community stakeholders, including indigenous peoples. The presence of community stakeholders may impact the Company’s ability to develop or operate its mining properties and projects or to conduct exploration activities. Accordingly, the Company is subject to the risk that one or more groups may oppose the continued operation, further development, or new development or exploration of the Company’s current or future mining properties and projects. Such opposition may be directed through legal or administrative proceedings, or through protests or other campaigns against the Company’s activities. In addition, if historical artifacts or archaeological sites are discovered on or near the Company’s properties, the Company may be prohibited or restricted from developing or mining its mineral properties or be required to relocate or preserve such findings.
Governments in many jurisdictions, including in some parts of Turkey, Canada, the United States, Argentina, Mexico and Peru, must consult with, or may require the Company to consult with, indigenous peoples with respect to grants of mineral rights and the issuance or amendment of project authorizations and permits, pursuant to various international and national laws, codes, resolutions, conventions and guidelines, such as the International Labour Organization Convention 169. Consultation and other rights of indigenous peoples may require accommodation including undertakings regarding employment, royalty payments and other matters. This may affect the Company’s ability to acquire effective mineral titles, permits or licenses in these jurisdictions within a reasonable time, and may affect the timetable and costs of development and operation of the Company’s mineral properties in these jurisdictions. In addition, the risk of unforeseen title claims by indigenous peoples could affect existing operations and development projects. These legal requirements may also affect the Company’s ability to expand or transfer existing operations or to develop new projects.
Civil disobedience in certain of the countries where the Company’s mineral properties are located could adversely affect its business.
Acts of civil disobedience are common in certain of the countries where the Company’s properties are located. In recent years, many mining companies have been the targets of actions to restrict their legally granted access to mining concessions or property. The evolving expectations related to human rights, indigenous rights, and environmental protections may result in opposition to our current and future operations, the development of new projects and mines, and exploration activities. Such opposition may take the form of legal or administrative proceedings or manifestations such as protests, roadblocks or other forms of public expression against our activities, any of which may have a negative impact on our local or global reputation and operations. Such acts of civil disobedience often occur with no warning and can result in significant direct and indirect costs and delays in operations. Opposition by community and activist groups to our operations may require modification of, or preclude the operation or development of, our projects and mines or may require us to enter into agreements with such groups or local governments, which may cause increased costs and significant delays to the advancement of our projects. While the Company has not faced such acts of civil disobedience to date, there can be no assurance that the Company will not face such disruptions to site access in the future.
The Company and the mining industry face geotechnical challenges, which could adversely impact our production and profitability.
As certain of our mines age, the Company may face geotechnical challenges faced by the mining industry as a whole, including mining deeper pits and more complex deposits, which generally leads to higher pit walls, more complex underground environments and increased exposure to geotechnical instability and hydrological impacts. As our operations mature, the open pits at our sites will necessarily become deeper and we may face certain geotechnical failures at some of our mines. Unanticipated adverse geotechnical and hydrological conditions may occur. Such conditions are often affected by risks and hazards outside of our control, such as severe weather and considerable rainfall, which may lead to periodic floods, mudslides, wall instability and seismic activity, which may result in slippage of material. Such events may not be detected in advance.
In addition, SSR Mining has operational and closed tailings impoundments in a variety of climatic and topographic settings. The failure of tailings dam and storage facilities and other impoundments at our mining sites could cause severe, and in some cases catastrophic, property and environmental damage and loss of life. Geotechnical or tailings storage facility failures could result in limited or restricted access to mine sites, suspension of operations, government investigations, increased monitoring costs, remediation costs and other impacts, which could result in a material adverse effect on our results of operations and financial position. Recognizing this risk, while SSR Mining continues to review its existing practices, there can be no assurance that these events will not occur in the future.
Risks Related to Our Personnel
Certain of the Company’s directors and/or officers also serve, or may serve, as directors of other companies involved in natural resource exploration and development, and consequently there exists the possibility for these directors and/or officers to be in a position of conflict.
Certain of the Company’s directors and/or officers may have fiduciary and/or contractual obligations to other companies, including companies that are engaged in business activities similar to those intended to be conducted by the Company. Accordingly, such companies may participate in transactions and have obligations that may be in conflict or competition with the Company’s business or acquisition strategy. As a result of such conflict, the Company may not be able to participate in certain transactions, which may have a material adverse effect on the Company’s financial position. Any decision made by any of these directors and/or officers involving SSR Mining is required to be made in accordance with their duties and obligations to deal fairly and in good faith with a view to the best interests of SSR Mining and its shareholders.
The Company could be subject to potential labor unrest or other labor disturbances.
Production at Çöpler, Marigold, Seabee and Puna is dependent upon the efforts of the Company’s employees and the Company’s relations with them. Relations with the Company’s employees may be affected by changes in the scheme of labor relations that may be introduced by the relevant governmental authorities in those jurisdictions in which the Company carries on business. Changes in such legislation or in the relationship with the Company’s employees may have a material adverse effect on the Company’s business, financial condition and results of operations. Additionally, we could experience labor disputes, work stops or other disruptions in production due to union activities or other employee actions. A failure to successfully enter into new contracts or resolve any complaints could result in future labor disputes, work stoppages or other disruptions in production. Any labor unrest or other labor disturbances could have a material adverse effect on the Company’s business.
The Company is dependent on its ability to recruit and retain qualified personnel.
The Company competes with other mining companies to attract and retain key executives and skilled and experienced employees. The Company is dependent on the services of its key executives and other skilled and experienced personnel to focus on advancing its corporate objectives as well as the identification of new opportunities for growth and funding. Due to the size of the Company’s organization, the loss of any of these persons, or the Company’s inability to attract and retain suitable replacements for them or additional highly skilled employees and contractors required for the operation of the Company’s corporate offices, Çöpler, Marigold, Seabee and Puna and the Company’s other activities may have a material adverse effect on its business and financial condition.
The Company relies on contractors to conduct a significant portion of its operations and construction projects.
A significant portion of the Company's operations and construction projects in Turkey and Argentina are currently conducted in part by contractors. As a result, these operations are subject to a number of risks, some of which are outside of the Company's control, including:
•Negotiating agreements with contractors on acceptable terms;
•New legislation limiting or altering the ability to utilize contractors or outsourced resources;
•The inability to replace a contractor and its operating equipment in the event that either party terminates the agreement;
•Reduced control over those aspects of operations which are the responsibility of the contractor;
•Failure of a contractor to perform under its agreement;
•Interruption of operations or increased costs in the event that a contractor ceases its business due to insolvency or other unforeseen events;
•Failure of a contractor to comply with applicable legal and regulatory requirements, to the extent it is responsible for such compliance;
•Problems of a contractor with managing its workforce, labor unrest or other employment issues; and
•Liability to third parties as a result of the actions of our contractors.
In addition, law and regulations relating to the use of contractors may vary in the jurisdictions in which we operate, and changes in legal and regulatory restrictions may also impact our ability to utilize contractors and outsourcing services. The occurrence of one or more of these risks could adversely affect our results of operations and financial position.
Risks Related to Governmental Regulation and Legal Proceedings
The Company is subject to significant governmental regulations.
The Company's operations are subject to extensive and complex laws and regulations governing worker health and safety across our operating regions and failure to comply with applicable legal requirements can result in substantial penalties, civil sanctions and, in some cases, criminal sanctions, including the suspension or revocation of permits. Future changes in applicable laws, regulations, permits and approvals or changes in their enforcement or regulatory interpretation could substantially increase costs to achieve compliance, lead to the revocation of existing or future exploration or mining rights or otherwise have an adverse impact on the Company's results of operations and financial position. Matters which may be regulated by federal, state, provincial, territorial and local laws and regulations include:
•environmental protection;
•the management and use of toxic substances and explosives;
•the management of natural resources;
•the exploration of mineral properties;
•exports;
•insurance restrictions;
•import restrictions;
•exchange controls;
•capital controls;
•price controls;
•taxation and mining royalties;
•labor standards and occupational health and safety, including mine safety;
•employee profit-sharing arrangements;
•anti-corruption and anti-bribery statutes; and
•historical, archaeological and cultural preservation.
U.S. surface and underground mines are continuously inspected by the U.S. Department of Labor Mine Safety and Health Administration (“MSHA”), which inspections often lead to notices of violation under the Federal Mine Safety and Health Act of 1977. Our U.S. mine could be subject to a temporary or extended shutdown as a result of a violation alleged by MSHA. The Company’s mining operations outside of the U.S. are similarly subject to inspection and regulation under applicable jurisdictional laws and regulations. If inspections result in an alleged violation, the Company may be subject to fines, penalties or sanctions and its mining operations could be subject to temporary or extended closures. In addition to potential government restrictions and regulatory fines, penalties or sanctions, the Company's ability to operate and thus, its results of operations and financial position, could be adversely affected by accidents, injuries, fatalities or events detrimental (or perceived to be detrimental) to the health and safety of our employees, the environment or the communities in which the Company operates.
In addition to existing regulatory requirements, legislation and regulations may be adopted, regulatory procedures modified, or permit limits reduced at any time, any of which could result in additional exposure to liability, operating expense, capital expenditures or restrictions and delays in the mining, production or development of our properties. Mining accidents and fatalities or toxic waste releases, whether or not at our mines or related to metals mining, may increase the likelihood of additional regulation or changes in law or enhanced regulatory scrutiny. In addition, enforcement or regulatory tools and methods available to regulatory bodies such as MSHA, the U.S. Environmental Protection Agency (“EPA”), and their equivalent agencies in other jurisdictions in which the Company has operations, which have not been or have infrequently been used against us or the mining industry to date, may in the future be used more extensively or more consistently.
Failure to comply with applicable laws and regulations may result in civil or criminal fines or penalties or enforcement actions, including orders issued by regulatory or judicial authorities enjoining or curtailing operations or requiring corrective measures, installation of additional equipment or remedial actions, or the imposition of additional local or foreign parties as joint venture partners, any of which could result in significant expenditures. The Company may also be required to compensate private parties suffering loss or damage by reason of a breach of such laws, regulations or permitting requirements. Future laws and regulations, or more stringent enforcement of current laws and regulations by governmental authorities, cannot be accurately predicted and it is possible that these could cause the Company to incur additional expense, divert management time and attention from revenue generating activities or restrict or delay the exploration and development of the Company’s properties.
The Company requires permits to conduct its operations, and delays in obtaining or failing to obtain such permits, or a failure to comply with the terms of any such permits that the Company has obtained, would adversely affect the Company’s business.
The Company’s operations, including continued production at Çöpler, Marigold, Seabee and Puna, and further exploration, development and commencement of production on the Company’s other mineral properties, require licenses, permits and other approvals from various governmental authorities, including land and water usage permits. Obtaining or renewing governmental permits is a complex and time-consuming process. The duration and success of efforts to obtain and renew permits are contingent upon many variables not within the Company’s control.
The Company's ability to obtain the required permits and approvals to explore for, develop and operate mines and to successfully operate near communities in the jurisdictions in which we operate depends in part on our ability to develop, operate and close mines in a manner that is consistent with the creation of social and economic benefits in the surrounding communities, which may or may not be required by law. Our ability to obtain permits and approvals and to operate near certain communities may be adversely impacted by real or perceived detrimental events associated with our activities or those of other mining companies affecting the environment, health and safety of communities in which we operate. Further, certain communities may challenge, or seek to challenge, permits and approvals granted to the Company, which may result in temporary or permanent suspension of such permits and approvals or the cessation of Company operations. Any delay or suspension of the Company's operations as a result of such challenges, whether such challenges have merit, may adversely affect the Company's business, results of operations or financial condition.
Previously obtained permits and approvals may be suspended or revoked for many reasons, including through government or court action, or may be adjusted in a manner that adversely affects our operations, including our ability to explore or develop properties, commence production or continue operations. There can be no assurance that all permits, licenses and approvals that are required for the operations of the Company, including any for construction of mining facilities or conduct of mining, will be obtainable or renewable on reasonable terms, or at all. Delays or a failure to obtain such required permits, or the expiry, revocation or failure by the Company to comply with the terms of any such permits that it has obtained, would adversely affect the Company’s business.
The Company’s activities are subject to environmental laws and regulations that may increase the Company’s costs and restrict its operations.
The Company’s activities are subject to extensive laws and regulations governing the protection of the environment, natural resources and human health. These laws address, among other things, emissions into the air and air quality, discharges into water and water quality, management of waste, management and disposal of solid and hazardous substances, protection of natural resources, fisheries and wildlife protection, antiquities, endangered species, noise and use and reclamation of lands disturbed by mining operations. The Company is required to obtain governmental permits and, in some instances, provide bonding requirements under federal, state or provincial air quality, water quality, and mine reclamation rules and permits. Although the Company makes provisions for reclamation costs, it cannot be assured that these provisions will be adequate to discharge the Company’s future obligations for these costs. Violations of environmental laws may be subject to civil sanctions and, in some cases, criminal sanctions, including the suspension or revocation of permits. While responsible environmental, health and safety stewardship is one of the Company’s core values, there can be no assurance that the Company has been or will be at all times in complete compliance with such laws, regulations and permits, or that the costs of complying with current and future environmental laws and permits will not materially and adversely affect the Company’s business, results of operations or financial condition.
Our U.S. operations are subject to the Clean Water Act (the "CWA"), which requires permits for certain discharges into waters of the United States. Such permitting has been a frequent subject of litigation and enforcement activity by environmental advocacy groups and the EPA, respectively, which has resulted in declines in such permits or extensive delays in receiving them, as well as the imposition of penalties for permit violations. In 2015, the regulatory definition of “waters of the United States” that are protected by the CWA was expanded by the EPA, thereby imposing significant additional restrictions on waterway discharges and land uses. However, in 2018, implementation of the relevant rule was suspended for two years, and in December 2019 a revised definition that narrows the 2015 version was implemented. Even with the narrowed rule, it is possible that in the future the definition could again be expanded, or states could take action to address a perceived fall-off in protection under the CWA, either of which could increase litigation involving water discharge permits, which may result in delays in, or in some instances preclude, the commencement or continuation of development or production operations. Enforcement actions by the EPA or other federal or state agencies could also result. Adverse outcomes in lawsuits challenging permits or failure to comply with applicable regulations or permits could result in the suspension, denial, or revocation of required permits, or the imposition of penalties, any of which could have a material adverse impact on our cash flows, results of operations, or financial condition.
Some of the mining wastes from our U.S. operations currently are exempt to a limited extent from the extensive set of EPA regulations governing hazardous waste under the Resource Conservation and Recovery Act (“RCRA”). If the EPA were to repeal this exemption, and designate these mining wastes as hazardous under RCRA, we would be required to expend additional amounts on the handling of such wastes and to make significant expenditures to construct hazardous waste storage or disposal facilities. In addition, if any of these wastes or other substances we release or cause to be released into the environment cause or has caused contamination in or damage to the environment at a U.S. mining facility, that facility could be designated as a “Superfund” site under the Comprehensive Environmental Response, Compensation and Liability Act of 1980 (“CERCLA”). Under CERCLA, any present owner or operator of a Superfund site or the owner or operator at the time of contamination may be held jointly and severally liable regardless of fault and may be forced to undertake extensive remedial cleanup action or to pay for the cleanup efforts. The owner or operator also may be liable to federal, state and tribal governmental entities for the cost of damages to natural resources, which could be substantial.
Under certain environmental laws, the Company could be held jointly and severally liable for removal or remediation of any hazardous substance contamination at its current, former and future properties, at nearby properties, or at other third-party sites where the Company’s wastes may have migrated or been disposed. The Company could also be held liable for damages to natural resources resulting from hazardous substance contamination. Additionally, environmental laws in some of the countries in which the Company operates require that the Company periodically perform environmental impact studies at the Company’s mines. The Company cannot provide assurance that these studies will not reveal environmental impacts that would require the Company to make significant capital outlays or cause material changes or delays in its intended activities, any of which could adversely affect the Company’s business.
The failure to comply with environmental laws and regulations or liabilities related to hazardous substance contamination could result in project development delays, material financial impacts or other material impacts to the Company’s projects and activities, fines, penalties, lawsuits by the government or private parties, or material capital expenditures. Environmental legislation in many countries is evolving and the trend has been towards stricter standards and enforcement, increased fines and penalties for non-compliance, more stringent environmental assessments of proposed projects, and increasing responsibility for companies and their officers, directors and employees. Future changes in these laws or regulations could have a significant adverse impact on some portion of the Company’s business, causing the Company to re- evaluate those activities at that time.
In addition to evolving and expanding environmental regulations providing governmental authorities with the means to make claims against us, private parties have in the past and may in the future bring claims against us based upon damage to property and injury to persons resulting from the environmental, health and safety impacts of prior and current operations (including for exposure to or contamination by lead). Laws in the United States such as CERCLA and similar state laws may expose us to joint and several liability or claims for contribution made by the government (state or federal) or private parties. Moreover, exposure to these liabilities arises not only from our existing but also from closed operations, operations sold to third parties, or operations in which we had a leasehold, joint venture, or other interest. Because liability under CERCLA is often alleged on a joint and several basis against any property owner or operator or arranger for the transport of hazardous waste, our exposure to environmental claims may be greater because of the bankruptcy or dissolution of other mining companies which may have engaged in more significant activities at a mining site than we but which are no longer available for governmental agencies or other claimants to make claims against or obtain judgments from. Similarly, there is also the potential for claims against us based on agreements entered into by certain affiliates and predecessor companies relating to the transfer of businesses or properties, which contained indemnification provisions relating to environmental matters.
Compliance with emerging climate change regulations could result in significant costs and climate change may present physical risks to a mining company’s operations.
GHGs are emitted directly by the Company’s operations, as well as by external utilities from which it purchases power. Currently, a number of international and national measures to address or limit GHG emissions, including the Kyoto Protocol, the Copenhagen Accord, Durban Platform and the Paris Agreement, are in various phases of discussion or implementation in the countries in which the Company operates. These, or future, measures could require the Company to reduce its direct GHG emissions or energy use or to incur significant costs for GHG emissions permits or taxes or have these costs or taxes passed on by electricity utilities which supply the Company’s operations. The Company could also incur significant costs associated with capital equipment, GHG monitoring and reporting and other obligations to comply with applicable requirements. Additionally, concerns about potential GHG emissions impacts could manifest themselves in shareholder proposals, preferred purchasing, delays or failures in obtaining or retaining regulatory approvals, lack of market acceptance, continued pressure for and adoption of more stringent regulatory intervention and litigation, including governmental entities and other plaintiffs bringing claims against us for purported damages caused by the alleged effects of climate change. These risks could result in unexpected costs, increase our operating expenses, reduce the demand for our products and result in reputational harm to the Company, which in turn could have an adverse effect on the Company’s business, results of operations and financial condition.
The Company’s operations could be exposed to a number of physical risks from climate change, such as changes in rainfall rates, rising sea levels, reduced water availability, higher temperatures, increased snowpack and extreme weather events. Events or conditions such as flooding or inadequate water supplies could disrupt mining and transport operations, mineral processing and rehabilitation efforts, could create resource shortages and could damage the Company’s property or equipment and increase health and safety risks on site. Such events or conditions could have other adverse effects on the Company’s workforce and on the communities around the Company’s mines, such as an increased risk of food insecurity, water scarcity and prevalence of disease. In addition, if the effects of extreme weather events cause prolonged disruption to the delivery, or increased prices, of essential commodities or capital items, particularly over the seasonal ice road at Seabee, the Company’s production efficiency may be reduced. Although the Company makes efforts to mitigate these risks by ensuring that extreme weather conditions are included in emergency response plans at mine sites as required, there can be no assurance that these efforts will be effective and that these risks will not have an adverse effect on the Company’s operations.
Further, climate change litigation has grown in frequency, as scientists, agencies, and the general public increasingly associate catastrophic environmental events with changing climate. In recent years, litigants have utilized common law theories and existing environmental statutes to try to hold companies liable for the effects of climate change. While much of the climate change litigation to date has focused on allegations that companies have or are contributing to GHG emissions, businesses have also been targeted based on a theory of failing to prepare for the effects of climate change. Additionally, increasing scrutiny of public climate change disclosures made by companies has prompted recent government investigations and enforcement actions. The Company may become subject to climate change-related lawsuits in the future. Regardless of whether future litigants are successful in such claims, such lawsuits may require significant time and attention by the Company’s management, result in significant defense costs and expense or possible penalties and may materially adversely affect the Company’s business and/or its ability to continue all or certain of its mining, exploration and development activities.
The Company may be required by human rights laws to take actions that delay the Company’s operations or the advancement of its projects.
Various international and national laws, codes, resolutions, conventions, guidelines and other materials relate to human rights (including rights with respect to health and safety and the environment surrounding the Company’s operations). Many of these materials impose obligations on government and companies to respect human rights. Some mandate that governments consult with communities surrounding the Company’s projects regarding government actions that may affect local stakeholders, including actions to approve or grant mining rights or permits. The obligations of government and private parties under the various international and national materials pertaining to human rights continue to evolve and be defined. One or more groups of people may oppose the Company’s current and future operations or further development or new development of its projects or operations. Such opposition may be directed through legal or administrative proceedings or expressed in manifestations such as protests, roadblocks or other forms of public expression against the Company’s activities, and may have a negative impact on its reputation. Opposition by such groups to the Company’s operations may require modification of, or preclude the operation or development of, the Company’s projects or may require it to enter into agreements with such groups or local governments with respect to its projects, in some cases causing considerable delays to the advancement of its projects.
The Company’s mineral properties may be subject to uncertain title.
There can be no assurance that title to the Company's mineral properties will not be challenged. The Company owns, leases or has under option, unpatented and patented mining claims, mineral claims or concessions which constitute its property holdings. The ownership and validity, or title, of unpatented mining claims and concessions are often uncertain and may be contested. Further, the Company may not have, or may not be able to obtain or economically obtain, all necessary surface rights to develop a property. Title insurance is generally not available for mineral properties and the Company’s ability to ensure that it has obtained a secure claim to individual mining properties or mining concessions may be severely constrained. The Company has not conducted surveys of all of the claims in which it holds direct or indirect interests. A successful claim contesting the Company’s title to a property will cause the Company to lose the Company’s rights to explore and, if warranted, develop that property or undertake or continue production thereon. This could result in the Company not being compensated for its prior expenditures relating to the property.
The Company is subject to claims and legal proceedings that arise in the ordinary course of business.
The Company is subject to various claims and legal proceedings, including adverse rulings in current or future litigation against the Company and/or its directors or officers, covering a wide range of matters that arise in the ordinary course of business activities. Each of these matters is subject to various uncertainties and it is possible that some of these matters may be resolved unfavorably to the Company. The Company carries liability insurance coverage and establishes reserves for matters that are probable and can be reasonably estimated. In addition, the Company may be involved in disputes with other parties in the future that may result in litigation, which may have a material adverse impact on the Company’s future cash flows, profitability, results of operations and financial condition. Additionally, the Company may be subject to frivolous and/or nuisance claims. While such claims are often dismissed, there can be no assurance that all such claims will be dismissed entirely, or that the Company will not be required to incur significant expenses defending such claims.
The Company is subject to assessment by taxation authorities in multiple jurisdictions that arise in the ordinary course of business.
In the normal course of business, the Company is subject to assessment by taxation authorities in various jurisdictions. Income tax provisions and income tax filing positions require estimates and interpretations of income tax rules and regulations of the various jurisdictions in which the Company operates and judgments as to their interpretation and application to the Company’s specific situation. Tax rates and the calculations of taxes and the associated deferred tax assets and liabilities can change significantly and are influenced by changes in political administrations, foreign currency fluctuations and other factors. The Company’s business and operations, and that of its subsidiaries, is complex, and the Company has, historically, undertaken several significant financings, acquisitions and other material transactions. The computation of income taxes payable as a result of these transactions involves many complex factors as well as the Company’s interpretation of, and compliance with, relevant tax legislation and regulations. While the Company’s management believes that the provision for income tax is appropriate and in accordance with U.S. GAAP and applicable legislation and regulations, tax filing positions are subject to review and adjustment by taxation authorities, which may challenge the Company’s interpretation of the applicable tax legislation and regulations.
The Company is subject to anti-corruption laws.
The Company is subject to anti-corruption laws under the Canadian Corruption of Foreign Public Officials Act and the U.S. Foreign Corrupt Practices Act, which generally prohibit companies from engaging in bribery or other prohibited payments to foreign officials for the purpose of obtaining or retaining business. In addition, the Company may also be subject to the extra-territorial provisions of the Bribery Act 2010 (United Kingdom) which, in certain circumstances, can apply to offenses committed outside of the United Kingdom by foreign companies, as well as other anti-corruption laws applicable in the jurisdictions in which we operate. Corruption, extortion, bribery, pay-offs, theft and other fraudulent practices may occur from time-to-time in Turkey, Argentina, Peru, Mexico or any other jurisdiction in which the Company may conduct business, and the Company cannot provide assurance that its employees or other agents will not engage in such prohibited conduct for which the Company might be held responsible. If the Company’s employees or other agents, including past employees or agents of companies the Company has acquired, are found to have engaged in such practices, the Company could suffer severe penalties and other consequences that may have a material adverse effect on its business, financial condition and results of operations. The Company has an Anti-Corruption Policy and internal controls and procedures intended to address compliance and business integrity issues, and the Company trains its employees on anti-bribery compliance on a global basis. However, despite careful establishment and implementation, the Company cannot assure you that these or other anti-bribery, anti-fraud or anti-corruption policies and procedures are or will be sufficient to protect against fraudulent and/or corrupt activity. In particular, the Company, in spite of its best efforts, may not always be able to prevent or detect corrupt or unethical practices by current or former employees or third parties, such as subcontractors or joint venture partners, which may result in reputational damage, civil and/or criminal liability (under the Canadian Corruption of Foreign Public Officials Act, the U.S. Foreign Corrupt Practices Act or any other relevant compliance, anti-bribery, anti-fraud or anti-corruption laws) being imposed on the Company.
Risks Related to Ownership of Company Equity
The Company’s common shares are publicly traded and are subject to various factors that have historically made the Company’s common share price volatile.
The market price of the Company’s common shares has experienced, and may continue to experience, significant volatility, which may result in losses to investors. The market price of the Company’s common shares may increase or decrease in response to a number of events and factors, including: the Company’s operating performance and the performance of competitors and other similar companies; volatility in metal prices; the public’s reaction to the Company’s press releases on developments at the Company’s properties, material change reports, other public announcements and the Company’s filings with the various securities regulatory authorities; changes in earnings estimates or recommendations by research analysts who track the Company’s common shares or the shares of other companies in the resource sector; changes in general economic and/or political conditions; the number of common shares to be publicly traded after an offering of the Company’s common shares; the arrival or departure of key personnel; and acquisitions, strategic alliances or joint ventures involving the Company or the Company’s competitors.
In addition, the global stock markets and prices for mining company shares have experienced volatility that often has been unrelated to the operating performance of such companies. These market and industry fluctuations may adversely affect the market price of the Company’s common shares, regardless of the Company’s operating performance. The variables which are not directly related to the Company’s success and are, therefore, not within the Company’s control, include other developments that affect the market for mining company shares, the breadth of the public market for the Company’s common shares and the attractiveness of alternative investments. The effect of these and other factors on the market price of the Company’s common shares on the exchanges on which they trade has historically made the Company’s common share price volatile and suggests that the Company’s common share price will continue to be volatile in the future.
Holders of our common shares may not receive dividends.
Holders of our common shares are entitled to receive only such dividends as the Company's Board of Directors may declare out of funds legally available for such payments. On February 17, 2021, the Company’s Board of Directors approved its inaugural quarterly dividend payment of $0.05 per common share that was paid on March 31, 2021 to shareholders of record at the close of business on March 5, 2021. During the year ended December 31, 2021, the Company declared and paid cash dividends of $0.20 per common share in the aggregate amount of $43.2 million. The declaration and payment of future dividends is at the discretion of the Board of Directors and will be made based on the Company’s financial position and other factors relevant at the time. The Company's ability to pay dividends will be subject to future earnings, capital requirements, financial condition, compliance with covenants and financial ratios related to existing or future indebtedness and other factors deemed relevant by the Board of Directors. An annualized dividend payout level has not been declared by the Board of Directors, and the declaration and payment of future dividends, including future quarterly dividends, remains at the discretion of the Board of Directors. The Company's dividend framework is non-binding, and the Board of Directors may modify the dividend framework or reduce, defer or eliminate the common stock dividend in the future.
Future sales or issuances of equity securities could decrease the value of the Company’s common shares, dilute investors’ voting power and reduce the Company’s earnings per share.
The Company may sell additional equity securities in subsequent offerings (including through the sale of securities convertible into equity securities) and may issue equity securities in acquisitions. The Company cannot predict the size of future issuances of equity securities or the size and terms of future issuances of debt instruments or other securities convertible into equity securities or the effect, if any, that future issuances and sales of the Company’s securities will have on the market price of the Company’s common shares.
Additional issuances of the Company’s securities may involve the issuance of a significant number of common shares at prices less than the current market price for the common shares. Issuances of substantial numbers of common shares, or the perception that such issuances could occur, may adversely affect prevailing market prices of the Company’s common shares. Any transaction involving the issuance of previously authorized but unissued common shares, or securities convertible into common shares, would result in dilution, possibly substantial, to security holders. The Company is not able at this time to predict the future amount of such issuances or dilution.
Furthermore, sales of substantial amounts of the Company’s securities by the Company or the Company’s existing shareholders, or the availability of such securities for sale, could adversely affect the prevailing market prices for the Company’s securities and dilute investors’ earnings per share.
Risks Related to Being a Public Company
The Company may fail to maintain adequate internal control over financial reporting pursuant to the requirements of applicable regulations.
No evaluation can provide complete assurance that the Company’s internal control over financial reporting will prevent, detect or uncover all failures of persons within the Company to disclose material information required to be reported. The effectiveness of the Company’s controls and procedures could also be limited by simple errors or faulty judgments. In addition, as the Company continues to expand, the challenges involved in implementing appropriate internal control over financial reporting will increase and will require that the Company continue to improve its internal control over financial reporting. Although the Company intends to devote substantial time and incur substantial costs, as necessary, to ensure ongoing compliance, the Company cannot be certain that it will be successful in complying with internal control regulations.
Due to the loss of the Company's foreign private issuer status, the Company is now required to comply with the Exchange Act’s domestic reporting regime.
As of June 30, 2021, we determined that we no longer qualified as a "foreign private issuer," as such term is defined in Rule 405 under the Securities Act, which means that as of January 1, 2022 we are required to comply with all the periodic disclosure and current reporting requirements of the Exchange Act applicable to U.S. domestic issuers. The transition from foreign private issuer status is expected to result in incremental increase in costs as the requirements applicable to U.S. domestic issuers are more detailed and extensive than the requirements for foreign private issuers.
The Company's accounting and other estimates may be imprecise.
Preparing consolidated financial statements requires management to make estimates and assumptions that affect the reported amounts and related disclosure of assets, liabilities, revenue and expenses at the date of the consolidated financial statements and reporting periods. The more significant areas requiring the use of management assumptions and estimates relate to:
•Mineral reserves, mineral resources, and other resources that are the basis for future income and cash flow estimates and units-of-production depreciation, depletion and amortization calculations;
•future ore grades, throughput and recoveries;
•future metals prices;
•future capital and operating costs;
•environmental, reclamation and closure obligations;
•permitting and other regulatory considerations;
•asset impairments;
•valuation of business combinations;
•future foreign exchange rates, inflation rates and applicable tax rates;
•reserves for contingencies and litigation; and
•deferred tax asset valuation allowance.
Future estimates and actual results may differ materially from these estimates as a result of using different assumptions or conditions. For additional information, see Critical Accounting Policies and Estimates in Item 7. Management’s Discussion and Analysis of Consolidated Financial Condition and Results of Operations, Note 2 of the Notes to the Consolidated Financial Statements, and the risk factors set forth in this section.
It may be difficult to obtain and enforce judgments against the Company because of its Canadian incorporation and foreign assets.
The Company is a corporation existing under the laws of the Province of British Columbia. Some of the Company's officers, directors, and experts are Canadian or non-U.S. residents, and many of its assets are located outside the United States. Investors should not assume that Canadian or other foreign courts would enforce judgments of United States courts, or liabilities, obtained in actions against the Company or its directors, officers or experts predicated upon the civil liability provisions of the United States federal securities laws or the securities or “blue sky” laws of any state or jurisdiction of the United States. In addition, while statutory provisions exist in British Columbia for derivative actions to be brought in certain circumstances, the circumstances in which a derivative action may be brought, and the procedures and defenses that may be available in respect of any such action, may be different than those of shareholders of a company incorporated in the United States.
ITEM 1B. UNRESOLVED STAFF COMMENTS.
None.
ITEM 2. PROPERTIES
The following descriptions summarize selected information about the Company’s four producing assets: Çöpler Gold Mine, Marigold Mine, Seabee Gold Operation and Puna Operations, each of which is an operating segment. All of the Company’s properties are wholly owned except for Çöpler.
The disclosure in this Annual Report of a scientific or technical nature for each asset is based on the Çöpler District Master Plan 2021 Technical Report Summary, the Marigold 2021 Technical Report Summary, the Seabee 2021 Technical Report Summary and the Puna 2021 Technical Report Summary (collectively, the “Technical Report Summaries”). Each Technical Report Summary is filed with the SEC as an exhibit to this Annual Report and incorporated by reference herein and is being filed concurrently with the applicable securities regulatory authorities in Canada as a technical report in compliance with National Instrument 43-101 – Standards of Disclosure for Mineral Projects (“NI 43-101”), and are available for review on EDGAR at www.sec.gov and on SEDAR at www.sedar.com. You should read each such Technical Report Summary as part of your review of the information in this Item 2. Properties.
Additional Mining Company Financial Information
The Company is listed on Nasdaq and the TSX and is subject to the ongoing disclosure and reporting requirements, including those required of a mineral resource company, in both the United States and Canada. The mineral resource company disclosure requirements in each country are different. As a result, certain additional disclosures have been included in this “Item 2. Properties” to comply with requirements under Canada’s National Instrument 51-102 – Continuous Disclosure Obligations ("NI 52-101") and 43-101. Certain of these additional disclosures include financial measures that are customary in the mining industry, including capital costs and operating costs, which have been calculated in a manner that is not in accordance with U.S. GAAP. There are no standardized definitions or comparable financial measures under U.S. GAAP for these mining industry non-GAAP financial measures. As a result, we have not identified a comparable financial measure calculated under U.S. GAAP and we have also not provided a reconciliation of these mining industry non-GAAP financial measures to a U.S. GAAP financial measure. We believe investors rely on these mining industry non-GAAP financial measures to assist in an evaluation and comparison of the operating performance of mining companies. These disclosures are intended to provide additional information and should not be considered in isolation or as a substitute for measures of performance prepared in accordance with U.S. GAAP. These mining industry non-GAAP financial measures should be read in conjunction
with “Item 7. Management’s Discussion and Analysis of Financial Condition and Results of Operation” and our consolidated financial statements included elsewhere in this Annual Report on Form 10-K.
Properties Overview
Çöpler is an open pit gold mine located along the Tethyan belt in east-central Turkey’s Erzincan Province. Çöpler contains oxide and sulfide ores which are mined concurrently and processed through its two separate processing circuits. Gold contained in oxide ore is recovered through heap leach processing producing gold doré with a minor by-product of copper concentrate, while gold sulfide mineralization is subjected to pressure oxidation and carbon-in-leach processing, to produce gold doré.
Marigold is an open pit gold mine located along the northern margin of the Battle Mountain-Eureka Trend in Nevada, USA. Marigold is a run-of-mine heap leach operation producing gold doré bars.
Seabee is an underground gold mine located along the Trans-Hudson Corridor in east-central Saskatchewan, Canada. Seabee processes ore through its processing plant using gravity concentration, cyanide leaching and carbon-in-pulp to produce gold doré.
Puna is an open pit silver-lead-zinc mine located along the silver belt in northern Argentina in the Province of Jujuy. Puna processes ore mined from the Chinchillas mine through its Pirquitas flotation processing mill to produce a silver/lead and a zinc concentrate.
Çöpler Gold Mine, Erzincan Province, Turkey
The Çöpler project consists of a number of mining licenses covering mineral resources on the Çöpler, Çakmaktepe, Çakmaktepe Expansion (Ardich), and Bayramdere deposits, mineral reserves on the Çöpler and Çakmaktepe open pit mines, oxide and sulfide processing facilities, and supporting infrastructure.
The Çöpler deposit, including the mineral resources and mineral reserves, is wholly owned by Anagold Madencilik Sanayi ve Ticaret Anonim Şirketi (“Anagold”). SSR Mining controls 80% of the shares of Anagold, Lidya Madencilik Sanayi ve Ticaret A.Ş. (“Lidya”) controls 18.5%, and a bank wholly‑owned by Çalık Holdings A.Ş. holds the remaining 1.5%. Çakmaktepe is wholly owned by Kartaltepe and Çakmaktepe Expansion (Ardich) spans both Kartaltepe and Anagold ground (predominantly Anagold). SSR Mining controls 50% of the shares of Kartaltepe Madencilik Sanayi ve Ticaret Anonim Şirketi (“Kartaltepe”). Çakmaktepe Expansion (Ardich) and Bayramdere deposits and the Mavialtın Porphyry Belt (including the Aslantepe, Sarıdere, Fındıklıdere and Mavidere porphyries) have areas owned by both Anagold and Kartaltepe. SSR Mining is the Operator of both Anagold and Kartaltepe. All of the processing facilities and operating assets are located on land owned by Anagold. In total 77% of the exclusive Mineral Resources and 79% of the Mineral Reserve at Çöpler are owned by SSR Mining.
Also, in Turkey, SSR Mining owns 30% of Tunçpınar Madencilik Sanayi ve Ticaret Anonim Şirketi (“Tunçpınar”), operated by Lidya, and 70% of Bakırtepe Madencilik Sanayi ve Ticaret Anonim Şirketi (“Bakırtepe”), which is operated by SSR Mining. Bakırtepe includes the Copper Hill exploration target.
Property Description and Location
The Çöpler project is located in east central Turkey, 120 kilometers west of the city of Erzincan, in Erzincan Province, 40 kilometers east of the iron-mining city of Divriği, and 550 kilometers east of Turkey’s capital city, Ankara. The nearest urban center, İliç, is located approximately 6 kilometers northeast of the Çöpler mine.
The Çöpler project is serviced by road and rail networks. The mine is accessed from the main paved highway between Erzincan and Kemaliye. The project area is located in the Eastern Anatolia geographical district of Turkey. Mining operations are conducted year-round. The climate is typically continental with cold, wet winters and hot, dry summers.
The Çöpler mining operations fall within the license areas numbered 847, 49729, and 20067313, which have been granted by the General Directorate of Mining and Petroleum Affairs. The Çakmaktepe satellite mining operation is located 6 km east of the current Çöpler pit. The Çakmaktepe pits are located within Kartaltepe License 1054. Ore mined at Çakmaktepe is hauled and treated at the Anagold Çöpler facilities.
Anagold holds the exclusive right to engage in mining activities within the Çöpler project area. Anagold holds six granted licenses covering a combined area of approximately 16,600 hectares. Kartaltepe holds eight licenses covering approximately 9,200 hectares. The total near-mine tenement package is approximately 25,800 hectares.
Kartaltepe sells Anagold ore from Çakmaktepe at an agreed rate. SSR Mining holds a 2% net smelter return (“NSR”) on the Kartaltepe licenses, receivable after repayment of a historical royalty pre-payment.
Under Turkish Mining Law, the royalty rate for precious metals is variable and tied to metal prices. The Çöpler project is subject to a mineral production royalty that is based on a sliding scale to gold price and is payable to the Turkish government. In September 2020 a presidential decree was issued, increasing the prescribed royalty rates by 25%. Royalty rates are reduced by 40% for ore processed in country, as an incentive to process ore locally. As the Çöpler project produces its gold doré on-site, the Çöpler project is eligible for a 40% reduction to the royalty rate.
History
The Çöpler region has been subject to gold and silver mining dating back at least to Roman times. The Turkish Geological Survey carried out regional exploration work in the early-1960s that was predominately confined to geological mapping. In 1964, a local Turkish company started mining for manganese until 1973; the property was sold in January 1979 and manganese production restarted, continuing until 1992.
In 1998, Anatolia Minerals Development Ltd (“Anatolia”) identified several porphyry-style gold–copper prospects in east central Turkey and applied for exploration licenses for these prospects, including in the Çöpler basin. In August 2009, a joint venture agreement between Anatolia and Lidya was executed.
In February 2011, Anatolia merged with Avoca Resources Limited, an Australian company, to become Alacer Gold Corp., which further merged with SSR Mining in September 2020.
Geological Setting, Mineralization, and Deposit Types
The Çöpler project is located near the northern margin of a complex collision zone that lies between the Pontide Belt / North Anatolian Fault, the Arabian Plate, and the East Anatolian Fault, which bounds several major plates. The region underwent crustal thickening related to the closure of a single ocean, or possibly several oceanic and micro-continental realms, in the late Cretaceous to early Tertiary period.
The gold, silver, and copper mineralization of economic interest at Çöpler occurs in a porphyry-related epithermal environment, with most of the gold mineralization concentrated in three zones: Main Zone, Manganese Zone, and Marble Zone, with mineralization present in five different forms:
•Stockwork and veins with disseminated marcasite, pyrite, and arsenopyrite
•Clay-altered brecciated and carbonatized diorite with rhodochrosite veinlets, and disseminated marcasite, pyrite, realgar, orpiment, sphalerite, and galena
•Massive marcasite and pyrite replacement bodies
•Massive jarositic gossan
•Massive manganese oxide
Oxidation of this mineralization has resulted in the formation of gossans, massive manganese oxide, and goethitic / jarositic assemblages hosting fine-grained free gold. The oxidized cap is underlain by primary and secondary sulfide mineralization. In addition to the gold–silver–copper mineralization of economic interest some arsenic, lead, magnesium, manganese, mercury, and zinc are also present.
The Manganese Zone (pit) is about 650 m wide in the north-south direction and about 650 m in the east-west direction. The surface was predominantly covered with marble. A major component of the mineralization is associated with the contact between the diorite and the marble. Disseminated mineralization also occurs outside the contact zones. Mineralization ranges from the surface to 400m deep.
The Marble Zone (pit) is in the southeastern portion of the system and associated with a northeast striking fault contact between marble on the east and hornfels (metasediments) and intrusives on the west. The width is almost 350 m and the strike length is about 300 m east-north-east. Depth of the mineralization ranges from the surface to about 160 m.
The Main Zone (pit) drilling identified a mineralization extending about 750 m north-south and 1,000 m east west. Oxide zone is confined to near surface to depths of about 40 m. Main Pit is the largest area of exposure in the west and south of the Çöpler mine and exposes dominantly diorite-granodiorite porphyry in the southern wall in contact with Hornfels Block. High grade gold is controlled by both faults and contacts. Supergene enrichment enhanced along syn- and post-mineral structures plays an important role in localizing high-grade gold mineralization at lithological contacts, late-stage faults and shear zones, and fault/contact intersections.
The West Pit exposes a high-grade gossan/fanglomerates at the basal contact of Munzur Limestone with hornfels. The contact is locally well preserved and shows a ~10 m thick zone of broken rock cataclastites at the base of limestone on a wide zone of highly sheared hornfelds with folded foliations. Some Gossans would be supergene of polymetallic replacement deposits. Gossans are confined to limestone and hornfels and enriched/formed as a result of karstic process in the area.
Mining Operations
Open pit mining at the Çöpler project is carried out by a mining contractor and managed by Anagold. The mining method is a conventional open pit method with drill and blast and utilizing excavators and trucks operating on bench heights of 5 meters. The mining contractor provides operators, line supervisors, equipment, and ancillary facilities required for the mining operation. SSR Mining provides management, technical, mine planning, engineering, and grade control functions for the operation.
The facility infrastructure supports the mine, and the oxide heap leach and sulfide plant processing facilities. The current leach pad consists of four phases designed to accommodate approximately 58 million tonnes of oxide ore heap with a nominal maximum heap height of 100 meters above the pad liner, with additional phases in development.
The tailings storage facility is developed and constructed in stages. Ongoing work in ensuring sufficient long-term capacity for storage of tailings is undertaken. Studies by Anagold have determined that the effect of the addition of the flotation plant to the sulfide plant circuit would result in an increase in the solids content and improvement in the final settled density based on an increase in the rate of tailings consolidation.
Infrastructure, Permitting and Compliance Activities
The power supply for the Çöpler mine and processing facilities is provided via a 154 kV transmission line to site. Existing mine site facilities are located primarily within the Çöpler and Sabırlı Creek watersheds immediately upstream of their confluence with the Karasu River. The only perennial surface water in the vicinity of the Çöpler project is the Karasu River flowing in the northern and western part of the area. All other valleys are either ephemeral streams or dry valleys.
The Çöpler mining and processing operations involve open pit mining from multiple pits, construction of multiple waste rock dumps to accommodate mined materials, processing of oxide ores and placement on heap leach pads, and processing of sulfide ores with placement of tailings in a tailings storage facility. Operation of the Çöpler mining and processing facilities, and mining at Çakmaktepe, have been investigated and authorized by means of a series of Environmental Impact Assessments ("EIAs"). Anagold has remained in compliance with all aspects of the EIAs and operating permits throughout the history of the project.
The currently permitted EIA boundary incorporates 1,747 hectares, whereas the footprint of the mine units covers a combined 1,089 hectares. The currently permitted Çakmaktepe EIA boundary incorporates 290 hectares, but pending approval, it is anticipated that the Çakmaktepe EIA boundary will increase to 360 hectares.
Mineral Processing and Metallurgical Testing
Oxide Testwork
The heap leaching facilities were commissioned at the Çöpler mine site in late-2010 and have operated continuously since that time. Oxide heap leach operations were ongoing at the Cöpler District Master Plan 2021 Technical Report Summary (“CDMP21TRS”) effective date.
Metallurgical testwork on Çakmaktepe oxide material for heap leaching has been undertaken at the on-site metallurgical laboratory, initially under the supervision of Kappes, Cassiday & Associates. The initial testwork in 2015 undertook bottle roll and column leach tests. The results are comparable with the Çöpler oxide ore, with similar behavior and leach kinetics. Subsequently, Çakmaktepe oxide ore has been heap leached along with Çöpler oxide ore. Oxide column testwork on oxide ore continues at the on-site laboratory.
Metallurgical testwork on Ardich oxide material for heap leaching has been undertaken at McClelland laboratories and supervised by Metallurgium. An initial testwork program, including bottle roll and column leach, was carried out in 2019. This initial program identified two distinct domains with respect to gold recovery based on sulfur content: <1% and 1%–2%. The column testwork results indicated that the listwanite, dolomite, and jasperoid lithologies have physical properties amenable to heap leaching. This initial test program was followed up with further testwork in 2020.
Analysis of the results of the metallurgical testwork and a review of the existing recovery models for use in economic analysis were undertaken in 2020. This was done for the oxide and sulfide processing, including the flotation circuit. The resulting recoveries have been used in the economic analysis for the CDMP21TRS.
Oxide gold recoveries vary by lithology for Çöpler in the range 62.3%–78.4%, at Çakmaktepe the range is 61%–80%. At Ardich the testwork suggest recoveries will vary in the range 40%–73%. The average oxide recovery in the Reserve Case is 61%.
Sulfide Testwork
The sulfide process plant commenced commissioning in Q4’18. The plant consists principally of a pressure oxidation (POX) leach followed by a cyanide leach to recover gold.
Significant testwork had been conducted on sulfide ores prior to commissioning of the sulfide plant, with pilot plant testwork campaigns and a significant number of batch variability tests on POX / cyanide leach completed.
Whilst a POX / cyanide leach circuit was implemented, significant work had also been undertaken on flotation of the gold-bearing sulfides as a process route, although ultimately this option was not selected for development. Flotation of a partial stream of the plant feed was considered to maximize the available capacity of the plant, including the POX autoclave and available oxygen supply. Further flotation testwork demonstrated that the addition of a small flotation plant into the existing sulfide process route would allow optimization and maximization of already installed capacities.
The testwork indicates that sulfur recovery through flotation is estimated to be 75% to concentrate with a corresponding 55% gold recovery. Flotation tails gold recovery is estimated at 43%. A side stream flotation plant capable of treating 50 to 150 tonnes per hour commenced commissioning on December 24, 2021. Once fully commissioned the actual plant performance will be reconciled with expected performance.
The current determination of POX gold recovery is based on assessment of results for the pilot testwork programs undertaken prior to commencement of operations and benchmarked with the existing operating data. An equation has been derived to calculate gold recovery by material type for all ore that is subject to POX; this includes direct POX feed and flotation concentrate. The Reserve Case average sulfide gold recovery is 91%.
Processing and Recovery Operations
The Company currently operates a sulfide process plant and an oxide heap leach facility.
The oxide heap leaching facilities were commissioned at the Çöpler mine site in the second half of 2010 with initial gold production achieved in the fourth quarter of 2010. The process was originally designed to treat approximately 6.0 million tonnes per annum of ore by three-stage crushing (primary, secondary, and tertiary) to 80% passing 12.5 millimeters, agglomeration, and heap leaching on lined heap leach pads with dilute alkaline sodium cyanide solution. Gold is recovered through a carbon in-column system, followed by stripping of metal values from carbon, electrowinning and smelting to yield a doré (containing gold and silver) suitable for sale. Control of copper in leach solutions is undertaken in a sulfidization, acidification, recovery, and thickening ("SART") plant, which also regenerates cyanide.
The sulfide plant commenced commissioning in the fourth quarter of 2018. The basic flow of processing through the sulfide plant is as follows:
The incorporation of a flotation circuit into the existing sulfide plant to upgrade sulfide sulfur to fully utilize grinding and pressure oxidation (“POX”) autoclave capacity was constructed and commenced ore production at the end of December 2021. This addition to the sulfide plant is incorporated between grinding and acidulation by taking a bleed / slip stream from the grinding thickener feed, floating sulfides, and returning the sulfide concentrate to the grinding thickener to be combined with direct autoclave feed. Gold in the flotation tails (not recovered to the flotation concentrate) is combined with the material that was processed through the POX autoclave circuit, this combined stream then goes to the gold leaching and recovery circuits to recover gold.
Since completing ramp-up of the sulfide plant in June 2020, POX throughput has progressively improved to exceed design up to a monthly average peak of 330 tonnes per hour and at the maximum sulfide sulfur of 13.7 tonnes per hour. The gold recovery has remained at around 91%, with the tailings grade ranging between about 0.25–0.30 grams of gold per tonne.
See “Proven and Probable Reserve Estimates” and "Resource Estimates" in this Item 2 for further information on the mineral resources and mineral reserves for Çöpler, and see "Operating Statistics" in this Item 2 for further information on production of the Çöpler operations for the years ended December 31, 2021 and December 31, 2020.
Exploration
The principal exploration technique at the Çöpler project has been reverse circulation and diamond core drilling, conducted in several campaigns starting in 2000. Initially, exploration was directed at evaluating the economic potential of the near-surface oxide mineralization for the recovery of gold by either heap leaching or conventional milling techniques.
Exploration in Çöpler after the discovery of several porphyry centers identified the ore body in four adjacent zones (and subsequent open pits) from east to west: Manganese Pit, Marble Pit, Main Pit and West Pit.
Since 2000, the Company’s exploration program within the Çöpler district has identified several new gold-dominant and copper–gold prospects. The gold-dominant regional prospects include the Çöpler Saddle and Elmadere. Copper–gold prospects include Aslantepe, Sarıdere, Fındıklıdere and Mavidere porphyries located within the Mavialtın Porphyry Belt and the early exploration stage Meşeburnu porphyry located west of the Çöpler deposit.
Drilling
Drilling at the Çöpler deposit commenced in 2000, and since that time a total of 2,635 holes have been drilled for 373,562 meters. A total of 68 diamond core holes have been completed in 2021 (18,492 meters). Step-out drilling at the Çöpler deposit has defined most of the lateral boundaries of the mineralization. There has been additional development drilling, as well as condemnation drilling of areas planned for infrastructure during the last few years.
Drilling at Çakmaktepe commenced in 2012 and has resulted in the definition of three distinct mineralized zones: East, Central, and North. As production proceeded within the Çakmaktepe Central and East pits, additional targets were generated to provide push-back options around the pit design. A total of 136 diamond core holes have been completed since 2019 to test for continuation of the Çakmaktepe mineralization to the north and the east.
Since the initial discovery of mineralization at Çakmaktepe Expansion (Ardich), SSR Mining has undertaken several drilling programs to better-define the geological model and to attempt to increase resource inventories. Anagold has completed 531 diamond core holes for 111,004 meters at Çakmaktepe Expansion (Ardich) from late-2017 to December 31, 2021, including holes for metallurgical testing and hydrogeological studies.
Drilling at Bayramdere commenced in 2007 as part of the near-mine exploration strategy. Since that time 120 holes have been drilled at Bayramdere for a total of 10,734 meters.
Sampling, Analysis and Data Verification
Exploration samples are submitted to ALS Global laboratories in Izmir, Turkey for sample preparation and analysis which is an ISO/IEC 17025:2005 certified and accredited laboratory. Bureau Veritas (Acme) laboratory, Ankara is used for umpire check sample analysis. Gold is analyzed by fire assay with an AAS finish, and the multi-element analyses are determined by four acid digestion and ICP-AES and MS finish. For gold assays greater than or equal to 10 g/t, the fire assay process is repeated with a gravimetric finish for coarse gold. The drill and geochemical samples were collected in accordance with accepted industry standards. SSR Mining conducts routine QA/QC analysis on all assay results, including the systematic utilization of certified reference materials, blanks, field duplicates, and umpire laboratory check assays.
SSR Mining operates an onsite laboratory at Çöpler for assay of production samples. The onsite laboratory is certified to 17025:2017 but is not independent. It is primarily used in grade control.
Data verification procedures are well established at Çöpler. Routine ongoing checking of all data is undertaken prior to being uploaded to the database. This is followed by campaign-based independent data verification audits at milestone stages throughout data collection programs. For drillhole data, verification includes the checking of Topcon differential global positioning system ("DGPS") collar coordinates relative to topographic surveys, checking of down hole surveys relative to adjacent readings and planned dip and azimuth of the hole, checking logged data entries to ensure they are consistent with log key sheets, cross-checking a subset of assay data with the original laboratory reports, and submission of and review of QA/QC data.
The QA/QC program has historically consisted of a combination of QA/QC sample types that are designed to monitor different aspects of the sample preparation and assaying process. None of the verification programs have identified material issues with the supporting data.
Capital and Operating Costs.
The capital and operating cost estimates derived for Çöpler are based on a combination of the data set forth in the Çöpler District Master Plan 2021 Technical Report Summary and budgetary estimates and reflect SSR Mining’s current estimates as of December 31, 2021.
Capital costs are estimated to be $474 million for the life of Çöpler and are primarily composed of mine and plant equipment, tailings storage expansions and asset componentization. Estimated operating costs for mine operations include both cash and non-cash costs.
| | | | | | | | | | | | | | | | | | | | | | | | | | | | | |
Cost | | Total LOM ($M) | | 5-Year Average per year ($/t) | | LOM Average per year ($/t) |
Mining | | $ | 766 | | $ | 14.98 | | $ | 10.15 |
Process | | | 2,225 | | | 27.79 | | | 29.49 |
Site Support and G&A | | | 473 | | | 7.14 | | | 6.27 |
Operating Costs | | $ | 3,464 | | | $ | 49.91 | | $ | 45.91 |
Capital costs and operating costs are provided for mineral property disclosure purposes in accordance with NI 51-102 and are, generally, non-GAAP mining company financial measures. See “Additional Mining Company Financial Information” in this Item 2 for more information.
Costs in individual years may vary significantly as a result of, among other things, current or future nonrecurring expenditures, and changes to input costs and exchange rates. Please refer to the Çöpler District Master Plan 2021 Technical Report Summary for other key metrics including detailed cash flows by year and net present value computations.
Çöpler Copper, Initial Assessment Case
The Çöpler Copper project (C2) has been developed to leverage off the copper mineralization within and adjacent to existing resource pits. Supporting the 2021 Çöpler Mineral Resource estimate an Initial Assessment has been prepared to analyse the impact of changes in processing method for the Çöpler Mineral Resource. The current project has two processing methods: a sulfide process plant and a heap leach oxide processing facility.
The sulfide plant includes the crushing, grinding, flotation and pressure oxidation to produce gold and small amounts of silver. The heap leach facility produces gold and small amounts of silver and copper.
The scenario for the Initial Assessment Case analysis includes additional processing units to recover copper from the sulfide Mineral Resource. The two processing units are:
•A Copper Concentrator producing a copper concentrate for sale and a pyrite concentrate to feed to the sulfide plant
•A Sodium Hydrosulfide (NaSH) copper recovery circuit to be installed in the current sulfide plant which will produce a copper concentrate for sale.
The copper concentrator with a capacity of 1.8 Mtpa and would make a copper concentrate for sale to smelters and a pyrite concentrate to be fed into the autoclaves in the sulfide plant. The pyrite concentrate would have a high gold content and also provide sulfur as a source of fuel for the autoclaves.
The Çöpler Mineral Resource has been selected for the Initial Assessment analysis, as the other Mineral Resources at the project do not have significant amounts of copper.
Implementation of the copper recovery options will require capital expenditures and will also provide opportunities for operational cost and productivity improvements. The Çöpler Copper Case shows the results of a shorter term analysis using the Reserve Case metal prices and the impact of the estimated capital and potential cost savings from economies of scale and reallocation of shared and fixed costs.
For both the Initial Assessment economic analysis, the Ardich and Cakmaktepe Mineral Reserve has been included in the cash flow analysis without change from the Reserve Case. This is to allow the analysis to quantify the impact of the copper concentrator and NaSH circuit and demonstrate the potential of the additional Mineral Resources.
A separate analysis of the Initial Assessment Case was prepared using only Measured and Indicated Mineral Resources (MI Case). Comparison of the initial years of the Initial Assessment and the MI Case showed only 1.4% of the material processed in the first nine years of the Initial Assessment is Inferred Mineral Resource. The majority of the Inferred material is processed in years 10 to 20 and does not exceed 50% of the total processing in any one year.
The Initial Assessment Case production is oxide of 41.8 Mt 1.26 g/t Au, 59.7 Mt at 2.45 g/t Au and 24.9 Mt at 0.50g/t Au and 0.2% Cu for a total of 126.4 Mt at 1.67 g/t Au. The gold production in the Initial Assessment Case is 5.4 Moz and 164 Mlb of copper. Copper is produced from all three processing streams. The impact of including the copper concentrator as a processing facility is to expand the Çöpler pit which ceases mining in 2043. Additional production in the Initial Assessment Case comes from feed of 1.8 Mtpa to the copper concentrator and also from additional sulfide and oxide processing feed that is exposed when the pit gets deeper. Total capital including contingency of 25% for the copper concentrator and the copper recovery circuit in the sulfide plant is $218M. The capital costs have an accuracy of +/- 50%.
The Initial Assessment Case shows an after-tax NPV at a 5% discount rate of $2.00 billion and the average AISC is $924/oz gold.
The Initial Assessment has been prepared to demonstrate economic potential of the Mineral Resources at the Çöpler Deposit. The Initial Assessment is preliminary in nature, it includes Inferred Mineral Resources that are considered too speculative geologically to have modifying factors applied to them that would enable them to be categorised as Mineral Reserves, and there is no certainty that this economic assessment will be realized.
Marigold Mine, Nevada, United States
Marigold Mine is an open pit mining and processing operation located in Nevada, United States. SSR Mining holds a 100% interest in Marigold through its wholly owned subsidiary, Marigold Mining Company.
Property Description and Location
Marigold is located in southeastern Humboldt County, in the northern foothills of the Battle Mountain Range, Nevada, U.S. The mine is situated approximately 5 kilometers south–southwest of the town of Valmy, Nevada. Other nearby municipalities include Winnemucca and Battle Mountain, Nevada, which lie approximately 58 kilometers to the northwest and 24 kilometers to the southeast of the property, respectively.
The surface and mineral rights held by the Company at Marigold are comprised of fee owned real property, unpatented mining claims, and leasehold rights held with respect to unpatented mining claims, mill site claims and certain surface lands. Certain of the leases require the Company to make NSR royalty payments to the lessors and comply with other obligations, including completing work commitments or paying taxes levied on the underlying properties. The NSR royalty payments are based on the specific gold-extraction areas and are payable when the corresponding gold ounces are extracted, produced, and sold. The NSR royalty payments vary between 0% and 10.0% of the value of gold production, net of off‑site refining costs, which equates to an annual average ranging from 3.7% to 10.0% and a weighted average of 7.8% over the life‑of‑mine. Mineral claims in Nevada are managed federally by the U.S. Bureau of Land Management.
The authorized Plan of Operations (“PoO”) area for Marigold currently encompasses approximately 10,703 hectares, with approximately 3,296 hectares within the PoO permitted for mining‑related disturbance. Land and mineral ownership within the PoO are within the corridor initially governed by the Pacific Railroad Act of 1862, and, as such, these areas generally have a “checkerboard” ownership pattern.
New Millennium, enabled by land acquisitions completed in 2016, 2018 and 2019, represents a low cost, high probability development opportunity. The New Millennium target area is comprised of six distinct zones which include East Basalt, Battle Cry, Antler, Section 6, L’il Gun and North Antler. In addition, exploration on the 100% controlled 8,900-hectare land package to the south of Marigold continues at the past producing Buffalo Valley, North Peak, and Trenton Canyon mines.
History
The first recorded gold production from the property occurred in 1938 when the Marigold Mining Company developed and operated an underground mine which came to be known as Marigold. Approximately 9,000 tonnes of ore, averaging about 6.85 grams of gold per tonne, was processed before World War II halted production. Several unsuccessful attempts were made to open and operate the mine before exploration activities began again in 1968. The property was further explored and developed by various companies and operations from 1968, with two million ounces of gold recovered from Marigold by mid-2009.
The Company acquired Marigold in April 2014 for total cash consideration of $268 million. In August 2015, Marigold mine acquired 2,844 hectares of adjacent land from Newmont Corporation. This land included previously mined areas known as the Mud pit, NW pit, and the Valmy pits. Marigold has now been in continuous operation for more than 30 years and poured the four millionth ounce in 2020.
Geological Setting, Mineralization, and Deposit Types
Marigold is located in north‑central Nevada within the Basin and Range physiographic province bounded by Sierra Nevada to the west and the Colorado Plateau to the east. The western part of the North American continent has undergone a complex history of extensional and compressional tectonics from the Proterozoic through to the Quaternary. Predominantly Paleozoic rifting and basin subsidence led to the formation of thick (hundreds of meters) passive margin sedimentary sequences and repeated inter plate collisions caused accretion of arc related volcanics and ocean floor rocks, which were pushed together with the basin sediments to form fold and thrust belts. Subsequent extension related to subduction and back arc basin rifting resulted in the development of Basin and Range topography. Crustal thinning caused by the extension allowed the rise of magma close to the surface, which produced extensive and voluminous magmatism from the middle Eocene to late Miocene. Crustal extension with bimodal (mafic and felsic) volcanism occurred in the region from the late Miocene to the present day.
The property is in the Battle Mountain mining district on the northern end of the Battle Mountain-Eureka trend, a conspicuous lineament of sedimentary-hosted gold deposits. The Battle Mountain district hosts numerous mineral occurrences, including porphyry copper–gold, porphyry copper–molybdenum, skarn, placer gold, distal disseminated silver-gold, and Carlin-type gold systems. Gold at Marigold is currently mined from multiple deposits located on a >10-kilometer by 1.5-kilometer area. Depth of the mineralization ranges from the surface to about 250m for the oxide ore. The majority of individual mineralization zones at Marigold have coalesced into the Mackay pit.
The gold deposits at Marigold cumulatively define a north trending alignment of gold mineralized rock more than 8 kilometers long. A silver and base metal mineralizing event at Marigold includes a mineral association of chalcopyrite, argentiferous tennantite, galena, and sphalerite. Gold mineralizing fluids were primarily controlled by fault structure and lithology, with tertiary influence by fold geometry. The deposition of gold was restricted to fault zones and quartzite chert dominant horizons within the Valmy Formation and high permeability units within the Antler sequence. Gold mineralization was also influenced by fold geometry in the Valmy Formation.
Rocks within the Marigold mine area are oxidized to a maximum depth of approximately 450 meters. The redox boundary is not consistent throughout the Property and is substantially influenced by lithology. Shale, argillite, and siltstone units are frequently oxidized adjacent to pervasively oxidized quartzite horizons. Gold occurs natively in fractures in association with iron oxide.
Mining Operations
Marigold uses open pit mining methods at a life‑of‑mine sustained mining rate of approximately 250,000 tonnes per day. The mine conducts conventional drilling and blasting activities with a free face trim row blast to ensure stable wall rock conditions. Mining occurs on 15.2-meter benches. Loading operations are currently performed using one electric shovel and three hydraulic shovels. Waste and ore haulage is performed with a fleet of 300 tonne class haul trucks.
The Marigold geotechnical management plan includes highwall monitoring using three radar systems which provide full coverage for the Mackay pit, the mine’s largest, and which can be deployed in smaller pits, if required. Routine monitoring of waste dumps, leach pads and inactive pits using INSAR data is performed by a third party monthly.
Infrastructure, Permitting and Compliance Activities
The infrastructure facilities at Marigold include ancillary buildings, offices and support buildings, access roads into the plant site, power distribution, source of fresh water and water distribution, fuel supply, storage and distribution, waste management and communications. Equipment maintenance is performed on site for all equipment. There are no contract mining operations on site.
The power supply for Marigold is provided by NV Energy Inc. via a 120 kV transmission line to site. Water for Marigold is supplied from three existing groundwater wells located near the access road to the Property. Marigold owns groundwater rights and collectively allows up to 3.134 million m3 liters of water consumption annually. Water is primarily consumed by retention in the heap leach pad, evaporation, processing operations and dust suppression.
Marigold holds valid permits for all facets of the current mining operation as required by county, state, and federal regulations. The Company performs duties on leased lands pursuant to all federal and state requirements to maintain leases in good standing. The Company engages in concurrent reclamation practices and is bonded for all permitted features, as part of the Nevada permitting process.
Mineral Processing and Metallurgical Testing
Marigold uses an assay method that measures cyanide-soluble gold. This technique generates a value that represents the head grade of the ore in terms of the amount of gold in a finely ground sample that can be dissolved by a strong sodium cyanide solution. The gold content of the final solution is measured using atomic absorption ("AA").
All Marigold blasthole samples are assayed for cyanide-soluble gold. Samples from each ore polygon delineated by ore control are selected for fire assay based on the grade distribution for the polygon tonnage and targeting one sample per every 2,000 short tons of ore. Therefore, some samples have two assay values: an AuCN (cyanide soluble) value; and an AuFA (fire assayed) value. The ratio of AuCN:AuFA provides the theoretical maximum gold recovery that can be achieved.
Testwork has demonstrated that, generally, all ore at Marigold behaves similarly. The ratio of AuCN / AuFA is an important characteristic. A best‑fit linear regression from approximately 155,000 pairs of fire assays (field AUFA in the database) and cyanide soluble assays (field AUAA in the database shows the AuCN / AuFA ratio is 0.8037:1 (~80% cyanide soluble gold), based on the most recent assessment in 2017.
Processing and Recovery Operations
Marigold processing plant and processing facilities combine run-of-mine (“ROM”) heap leaching, carbon adsorption, carbon desorption and electro-winning circuits to produce a final precious metal (doré) product. All processing of ore, which is oxide in nature, is completed via ROM heap leaching. ROM ore is delivered to the leach pad by haulage truck and stacked in 6.1-meter to 12.2-meter lifts. At any given time, approximately 0.5 million square meters of pad area is being leached.
Barren leach solution (cyanide-bearing solution, very low in gold grade) is applied selectively to different areas of the heap leach pad. The barren leach solution is pumped to the leach pad and the pregnant solution (gold-bearing) from the leach pad is then recovered through a carbon in-column system, followed by stripping of metal values from carbon, electrowinning and smelting to yield a doré (containing gold and silver) suitable for sale.
From March 1990 through December 2021, gold recovery from the heap leach pad was 71.1%. The LOM actual leach pad recovery is 74.2% (including in‑process gold inventory through December 2021).
See “Proven and Probable Reserve Estimates” and "Resource Estimates" in this Item 2 for further information on the mineral resources and mineral reserves for Marigold for the years ended December 31, 2021 and December 31, 2020, and see "Operating Statistics" in this Item 2 for further information on production of the Marigold operations for the years ended December 31, 2021, December 31, 2020 and December 31, 2019.
Exploration
After the purchase of Marigold was completed in 2014, SSR Mining completed a gravity survey in areas that had not been previously covered, with a main objective to delineate possible fluid conduits or feeder structures for the Marigold mineralization. After finalizing the purchase of the Valmy property in 2015, the Company expanded the geophysical gravity survey to include this new ground.
Drilling
The Company has conducted drilling and sampling throughout the Marigold property. As of December 31, 2021, a total of 9,323 drillholes for 1,940,438 meters of drilling had been completed on the property. SSR Mining also has undertaken a deep drilling program at Marigold that, to date, includes nine diamond drillholes to test for sulfide mineralization at depth. This drilling has been completed across the property to help understand the overall geology of the property and to target higher gold grade sulfide ores beyond the oxidation boundary.
Sampling, Analysis and Data Verification
Since 2014, all exploration samples from Marigold and the Valmy property are analysed at American Assay Laboratories (“AAL”), an ISO 17025 certified facility in Sparks, Nevada. AAL is independent from SSR Mining. All samples are subjected to first‑pass fire assay (“FA”) determination with an atomic absorption (“AA”) finish and FA with gravimetric finish for over‑limits. This is followed by a gold cyanide solution assay with an AA finish on samples that have FA values greater than or equal to 0.03 grams of gold per tonne.
Following the acquisition of Marigold and the adjacent Valmy property, the Company’s exploration personnel manually checked the entire drillhole database against the original documents for data entry errors. Less than 1% of the drillholes had any issues, and these were subsequently corrected. As an additional check, SSR Mining acquired the chip trays for 687 drillholes, pulps from 57 drillholes, and sample rejects from 66 drillholes, of which 5% were reviewed for lithology and alteration. The original logging was deemed accurate and was used to construct the lithological models.
The collar positions of 43 Valmy drillholes were verified using differentially corrected GPS methods. The results showed a maximum variance of 4 m in the X/Y planes (easting and northing) and < 1 m in the Z dimension (elevation). This error‑shift is less than half the size of a resource model cell and is not material to any resulting estimate. The Valmy data was deemed accurate and precise, and appropriate for resource estimation purposes.
For data collected after April 2014, verification was completed as part of the generation of the mineral resources estimate for Marigold. Three technical issues were identified in the Marigold mineral resources database which have been resolved: (i) drillholes were missing downhole surveys; (ii) some samples were only assayed by cyanide soluble analysis and not by FA; and (iii) assay results for a high percentage of lower grade samples were recorded as 0.0 grams of gold per tonne.
Capital and Operating Costs.
The capital and operating cost estimates derived for Marigold are based on a combination of the data set forth in the Marigold 2021 Technical Report Summary and budgetary estimates and reflect the Company’s current estimates as of December 31, 2021.
Capital costs, exclusive of discretionary exploration, are estimated to be $359 million for the life of Marigold and are primarily composed of mine and plant equipment and the associated asset componentization. Estimated operating costs for mine operations include both cash and non-cash costs.
| | | | | | | | | | | | | | | | | | | | | | | | | | | | | |
| | Total LOM ($M) | | 5-Year Average per year ($/t) | | LOM Average per year ($/t) |
| Mining | | $ | 1,469 | | | $ | 7.53 | | $ | 7.18 |
| Processing | | | 373 | | | 1.57 | | | 1.82 |
| Site Support | | | 214 | | | 0.92 | | | 1.05 |
Operating Costs | | $ | 2,056 | | | $ | 10.01 | | $ | 10.05 |
Capital costs and operating costs are provided for mineral property disclosure purposes in accordance with NI 51-102 and, generally, are non-GAAP mining company financial measures. See “Additional Mining Company Financial Information” in this Item 2 for more information.
Costs in individual years may vary significantly as a result of, among other things, current or future nonrecurring expenditures, and changes to input costs and exchange rates. Please refer to the Marigold 2021 Technical Report Summary for other key metrics including detailed cash flows by year and net present value computations.
Trenton Canyon and Buffalo Valley
The Trenton Canyon project is located approximately 4 km south of New Millennium at Marigold and is one of three historically producing mines on a 100% controlled 8,900-hectare parcel acquired from Newmont Corporation in 2019. The Buffalo Valley project is located approximately 10 km south‑west of New Millennium.
Exploration work on the Trenton Canyon and Buffalo Valley properties consists of drilling, geophysical surveying, remote sensing, geochemical surveying, and mapping.
Gold mineralization at Trenton Canyon is structurally controlled with significantly less dissemination than at Marigold. The net result of this change in mineralization style is higher gold grades in a smaller volume of mineralized rock at Trenton Canyon.
SSR Mining has completed 13 deep exploration diamond core holes on Trenton Canyon totaling 10,131 meters, and 249 reverse circulation drillholes for 73,165 meters. As of December 2021, one diamond core hole has been completed at Buffalo Valley to a depth of 598 meters.
Seabee Gold Operation, Saskatchewan, Canada
The Seabee Gold Operation (“SGO”) is an underground gold mining and milling operation, located in Saskatchewan, Canada. SSR Mining holds a 100% interest in the property through its wholly‑owned subsidiary, SGO Mining Inc.
Property Description and Location
SGO is located at the north end of Laonil Lake, approximately 125 kilometers north-east of the town of La Ronge, Saskatchewan, Canada. Ore is currently produced from the Santoy underground mine from a ramp access/surface portal and is hauled 14 kilometers to the mill located at the Seabee site. A second underground mine, also having ramp access, was operated from 1991–2018 at Seabee. All ore is processed at the Seabee mill facility, which is located close to the now-closed Seabee mine and has been in operation since 1991. The Seabee mill facility produces gold doré bars that are shipped to a third-party refinery.
The mine is a remote operation. SGO is accessible by fixed-wing aircraft from the town of LaRonge and during the winter months, typically January through the end of March, a 60 kilometers winter road is also built between the mine site and Brabant Lake, approximately 120 kilometers north of La Ronge.
SGO is comprised of seven mineral leases and 102 mineral claims that cover an area of approximately 62,158 hectares, including the Fisher Property rights. SGO is subject to production and NSR royalties payable to third parties, including certain royalty payments to the Province of Saskatchewan, which are calculated on 10% of net operating profits and are payable once capital and exploration costs are recovered. The other NSR royalty payments are based on specific gold production and/or sales and vary between 1.0% and 3.0% of the value of gold production and/or sales, as applicable.
SGO currently has a valid surface lease with the Province of Saskatchewan, which was amended in March 2010. This surface lease provides land surface rights necessary to carry out the mining, milling and associated operations at the SGO. The existing surface lease is in effect from March 2010 to its expiry date of May 31, 2040.
History
The Laonil Lake region has been intermittently explored since the 1940s, with the first gold discovery made by prospectors in 1947, with detailed drilling and exploration of the property constituting the SGO conducted from 1947 until construction of the Seabee mill was initiated in the summer of 1990. Mill construction was completed in late 1991, and mining commenced in December 1991. Exploration and production expanded into the Santoy segment of the property through the early 2000s.
The Company acquired the SGO on May 31, 2016. SGO has produced over 1.6 million ounces of gold since production began in 1991. Production has steadily increased to achieving 84 koz, 96 koz and 112 koz of gold during 2017, 2018 and 2019, respectively. A drop in gold production was experienced in 2020 due to impacts from the COVID-19 pandemic. In 2021 Seabee mined and processed record tonnes delivering record production of 119 koz.
Geological Setting, Mineralization, and Deposit Types
Northern Saskatchewan forms part of the Churchill Province of the Canadian Shield and has been subdivided into a series of litho-structural crustal units, of which the SGO is located within the Glennie domain of the Proterozoic Trans-Hudson Orogen. The Glennie domain is wedge shaped and characterized by arcuate belts of Lower Proterozoic supracrustal rocks separated by granitoid gneisses and granitoid intrusions. It is bounded on the west by the north–north-east trending Stanley shear zone and bounded on the east by the north–south trending Tabbernor fault zone. To the south, Phanerozoic sedimentary rocks cover the Glennie domain.
Gold mineralization at the Santoy mine occurs in gold-sulfide-chlorite-quartz veins in the shear zones, near or in the granodiorite and granite sills. The gold mineralization throughout the SGO exhibits complex geometrical patterns attributed to a combination of structural and/or lithological controls.
Mining Operations
There is currently one operating mine as part of the SGO, that being the underground Santoy mine, with ore hauled to the surface and then 14 kilometers to the mill located near the old Seabee mine.
Access underground at the Santoy mine is provided from the surface via a main ramp with sublevels spaced between 17–20 meters vertically. Mining is carried out using sublevel open stoping mining methods with backfill, with stopes filled with a combination of rock fill and cemented rock fill, mined in a bottom-up mining sequence. Sill pillars are mined on retreat once the stopes below and above have been mined.
Infrastructure, Permitting and Compliance Activities
The major infrastructure at the SGO site includes roads, an airstrip, powerhouse and electrical distribution system, mill buildings and related services facilities, portal and ventilation raises, fuel storage, explosive storage, water supply and distribution, water management ponds and water treatment plant, tailings management facilities, administrative buildings and camp accommodation.
There are currently two tailings management facilities (“TMF”) that are being used by the mill; the East Lake TMF and the Triangle Lake TMF. Tailings deposition alternates between the two TMFs where winter deposition occurs in the Triangle Lake TMF and summer deposition is in the East Lake TMF. The remaining storage capacities of both facilities, based on the planned production rates, will potentially reach maximum capacity towards the end of 2030. To ensure that water treatment volumes are attained, a water treatment plant was constructed at East Lake TMF.
SGO holds an Approval to Operate Pollutant Control Facilities issued by the Province of Saskatchewan’s Ministry of Environment. This approval, which is a multi-year approval issued in October 2019, is valid until September 2022. Renewal of this approval is triggered through an application submitted to the Ministry of Environment at least 90 days prior to its expiry date. Subject to the terms and conditions of this approval, SSR Mining is authorized to operate all pollutant control facilities associated with the operation’s mine and mill.
Mineral Processing and Metallurgical Testing
SGO was originally developed based on bench-scale metallurgical testwork that characterized the Seabee deposit as a lode gold style of mineralisation that was free milling and that would respond to a standard flow sheet employing gravity recovery and cyanidation.
Historical recovery at the Seabee mill was in the 94%–96% range, with routine low levels of losses both in the tailings solids and solution. Future recovery estimates are 98%, based on the recent mill performance with recoveries of more than 98%. These improvements are attributed to the better condition of the leach equipment as well as the restored leach capacity.
Processing and Recovery Operations
Material has been processed for 30 years in the mill constructed immediately adjacent to the old Seabee mine. The operation was initially developed and operated on diesel power and later connected to the Saskatchewan grid power in 1992. The initial capacity of the mill was 500 tonnes per day, which was later expanded to a nameplate capacity of 1,000 tonnes per day, with the addition of a third grinding mill in 2005. The mill flow sheet is a conventional crushing and grinding circuit employing gravity concentration and cyanide leaching and carbon-in-pulp for recovery and production of doré gold on site.
Capital projects have included the addition of the primary ball mill, addition of a second Knelson concentrator and Acadia gravity gold recovery. The current Seabee process plant capacity is nominally 1,320 tonnes per day, or 1,240 tonnes per day annual average. The Seabee operation is characterized by coarse gold making the gravity recovery circuit critical to the overall gold recovery of the process plant. In recent years, with incorporation of gravity circuit improvements including the Acacia circuit, gold recovery has improved and is typically 98%.
See “Proven and Probable Reserve Estimates” and "Resource Estimates" in this Item 2 for further information on the mineral resources and mineral reserves for the SGO for the years ended December 31, 2021 and December 31, 2020, and see "Operating Statistics" in this Item 2 for further information on production of the SGO operations for the years ended December 31, 2021, December 31, 2020 and December 31, 2019.
Exploration
Historically, several rock and soil sampling programs have been executed on the SGO property. Over 1,200 surface rock samples and nearly 7,000 soil samples were collected between 1985 and 1988, with a further nearly 2,000 surface rock samples and over 7,000 soil samples collected between 1990 and 2013. Early samples were largely collected around the Laonil Lake, Porky Lake and Pine Lake areas, but the focus of exploration later shifted to the Santoy area.
Upon its acquisition of the SGO, SSR Mining performed a review of all exploration activities conducted on the property by previous operators. In addition to the data review, the Company executed an exploration program that included detailed mapping of the Herb West and Santoy Lake areas, as well as the collection of accompanying soil samples to be submitted for gold assay. Limited anomalous occurrences were identified from grab and soil sample results, and no new showings or gold in soil trends were recognized. The Company plans to map additional regions to the north and east within the Herb Lake area as additional shear zones are targeted. The Company has also planned further exploration in prospective areas east and west of the Santoy Lake area.
The objective of ongoing exploration conducted by SSR is to delineate, increase, and upgrade Mineral Resources. Underground drilling since 2016 focused on the Santoy 8 and 9 veins and the Gap Hangingwall and Santoy Hangingwall veins.
At the SGO, the three-year budget calls for an average of 80 km of combined surface and underground drilling per year between 2022 and 2024. This drilling is for testing of targets to maximize Mineral Resource potential at the mine as SSR develops its long-term strategy for continuing to replenish its 3–5 year reserve inventory in the same way it has for more than 20 years, with particular focus on bringing higher grade zones on stream to displace lower tenor inventory that currently occurs in the schedule from 2024 onwards.
Drilling
In total exploration at the SGO has comprised of surficial geochemical sampling, airborne and ground geophysical surveys and extensive drilling. To date, drilling completed on the SGO property (by SSR and previous operators) includes 2,324 surface drillholes totaling 496,197 meters and 6,139 underground drillholes totaling 1,161,184 meters.
Sampling, Analysis and Data Verification
All drill samples in respect of the Seabee Gold Operation underground drilling program and some samples from the surface program were assayed by our onsite non-accredited assay laboratory, which is not independent from SSR Mining. Surface drilling samples not analyzed by our onsite assay laboratory were analyzed at TSL Laboratories Inc. (“TSL”) in Saskatoon, Saskatchewan, which also serves as the QAQC laboratory for our onsite lab. Duplicate check assays were conducted at site as well as at TSL, which is independent from SSR Mining. Mean results of the spot checks were consistent with those reported. Sampling interval was established by minimum or maximum sampling lengths and geological and/or structural criteria.
SGO site lab typically prepares two hundred-gram samples that were pulverized until greater than 80 percent passed through a 200-mesh screen. Thirty-gram pulp samples were then analyzed for gold by fire assay with gravimetric finish (0.01 g/t gold detection limit). TSL prepares a minus-200 mesh pulp (95% passing) weighing 250 grams from a minus 10 mesh coarse crush reject. Fire assay with Atomic Absorption finish was completed on a 30-gram aliquot to produce gold analytical results with a 0.003 g/t gold detection limit. Fire assay with gravimetric finish was prepared on those samples with greater than 3 g/t gold.
All regional exploration’s drill and surface samples are analyzed at TSL Laboratories Inc. in Saskatoon, Saskatchewan. Duplicate check assays are conducted at TSL and the Saskatchewan Research Council, which are independent from SSR Mining. Mean results of the spot checks were consistent with those reported. Sampling interval was established by minimum or maximum sampling lengths and geological or structural criteria.
Capital and Operating Costs.
Capital costs are estimated to be $162 million and are primarily composed of mine and plant equipment and the associated asset componentization. Estimated operating costs for mine operations include both cash and non-cash costs.
| | | | | | | | |
Cost Component | US$/t milled |
Mining | $ | 46 |
Surface Haulage | | 6 |
Milling (& Fixed Plant) | | 35 |
General & Admin | | 68 |
Total Operating Expense | $ | 155 |
Capital costs and operating costs are provided for mineral property disclosure purposes in accordance with NI 51-102 and are mining company financial measures. See “Additional Mining Company Financial Information” in this Item 2 for more information.
Costs in individual years may vary significantly as a result of, among other things, current or future nonrecurring expenditures, and changes to input costs and exchange rates. Please refer to the Seabee 2021 Technical Report Summary for other key metrics including detailed cash flows by year and net present value computations.
Fisher Property
SSR Mining announced the proposed acquisition of Taiga Gold Corp. in December 2021. Upon closing, expected in the first half of 2022, SSR Mining will own 100% of the Fisher project. The Fisher property is contiguous to the SGO leases southeast of the Santoy mine.
Gold mineralization on the Fisher property is found in four major areas, and within 16 kilometers of the Santoy mine. Mineralization observed on the Fisher property to date is similar to that of Santoy, where disseminated to coarse gold-bearing sheeted quartz veins occur along major ductile shear zones. Like the SGO, the Fisher property is hosted within the Pine Lake greenstone belt, which is dominated by supracrustal rocks, including mafic volcanics, sediments, mafic intrusions and a range of felsic intrusions, of which some are directly associated with gold-bearing quartz veins. The southern extension of the Santoy shear zone onto the Fisher property is an underexplored gold
target that occurs across a 10-kilometer-wide stratigraphic package and is considered as part of future exploration on the property.
Puna Operations, Jujuy Province, Argentina
The Puna property (“Puna”) comprises the Chinchillas property and the Pirquitas property, both of which are located the Jujuy Province in far north Argentina. Puna is 100% owned by SSR Mining through its subsidiary Puna Operations Inc.
Property Description and Location
The Chinchillas property is located in the Puna region of northwestern Argentina, in the province of Jujuy, department of Rinconada, approximately 290 kilometers northwest of San Salvador de Jujuy, the capital of Jujuy Province. The property is centered at elevations ranging from 4,000–4,200 meters above sea level. The Pirquitas Property is also located in the Rinconada Department in the Province of Jujuy, approximately 45 kilometers southwest of the Chinchillas Property and approximately 335 kilometers northwest of San Salvador de Jujuy. Activities at the Property are centered at elevations of between 4,000–4,450 meters above sea level.
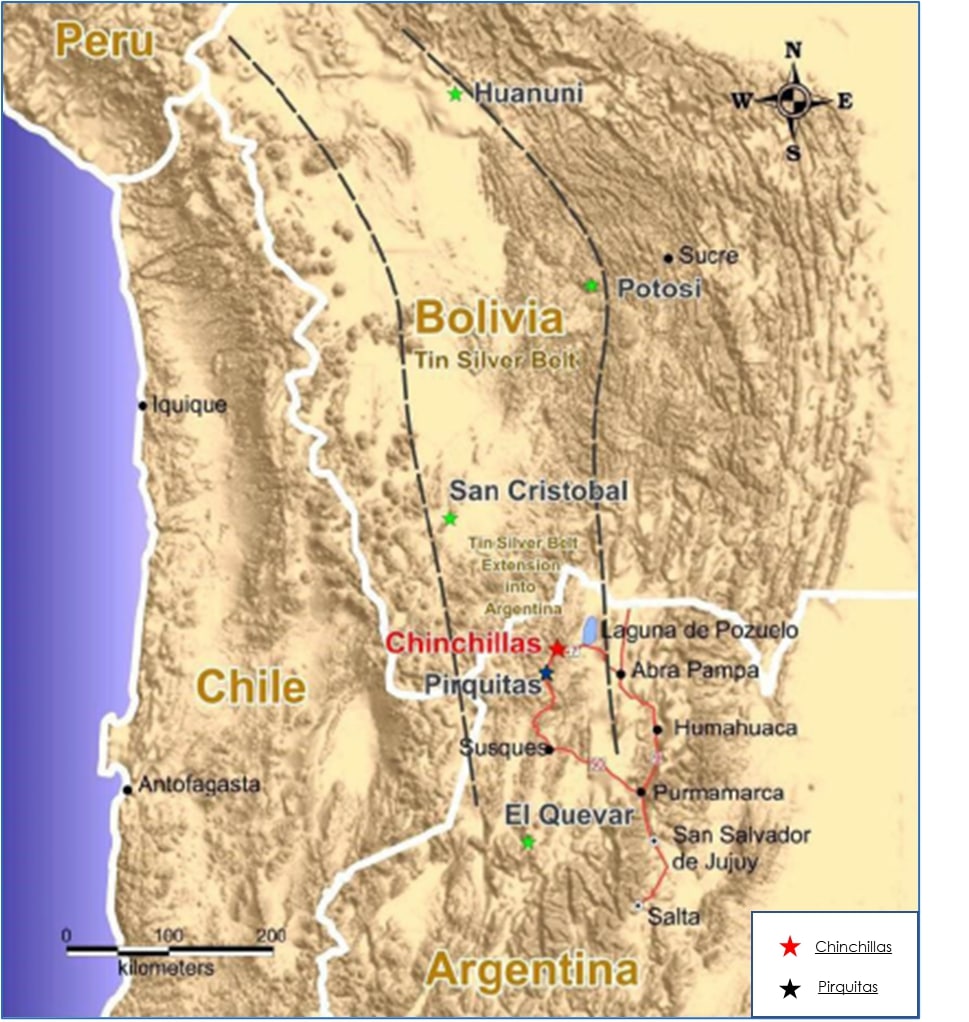
The Chinchillas property is composed of three contiguous claims, totaling 2,043 hectares, and the Pirquitas operation includes surface rights covering an area of approximately 7,500 hectares, which is used for purposes such as housing, infrastructure facilities, processing facilities, proposed tailings facility and other facilities to support mining operations for Puna. Ore from the Chinchillas mine is transported to the Pirquitas plant for processing. The Chinchillas mine is located approximately 45 kilometers from the Pirquitas plant.
Concentrates produced at Puna are subject to a maximum 3% ‘mouth of mine value’ royalty that is payable to the Province of Jujuy. This royalty payment is based on the net recoverable value of the contained metals less certain operating costs.
History
Chinchillas was first prospected and mined in small scale in the eighteenth century by Jesuit missionaries. An initial mining concession was granted in 1956, with small scale production beginning after 1968 through 1982. Exploration and sampling were conducted on and off at Chinchillas between 1982 and the mid-2010s. Between the 1930s and 1995, the area of the Pirquitas mine had multiple small mining operations to recover silver and tin from placer and vein deposits, with comprehensive mineral exploration conducted on the property between 1995 and 2000. The Pirquitas mine was formally inaugurated in April 2009 and commercial production started in December of that year until open pit ore mining was completed in mid‑January 2017. The Pirquitas processing plant has been in continuous operation since 2009.
The Company entered into a joint venture in October 2015 comprising the Chinchillas property, the Pirquitas pit and the Pirquitas operations. The agreement included an 18‑month pre-development period to advance Chinchillas, including the infill drilling, engineering and environmental studies, and permitting, with an option for the Company to assume full ownership, which the Company exercised on March 31, 2017.
Geological Setting, Mineralization, and Deposit Types
The Chinchillas and Pirquitas properties are considered part of the Bolivian tin‑silver–zinc belt that extends from the San Rafael tin‑copper deposit in southern Peru into the Puna region of Jujuy and are located in the Puna geological belt. Deposits with similar environments and styles of mineralization include San Cristóbal, Potosí, and Pulacayo. These deposits are generally characterized by intrusion of dacite dome complexes with mineralization hosted in shears and breccias within the dacite domes and / or within shears and breccias within the host rocks. More rarely, as in the case of the Chinchillas Property and San Cristóbal, the deposits also contain disseminated flat lying manto bodies within sedimentary and pyroclastic rocks that are cut by the ‘feeder’ shears. All the deposits are known to have large vertical extents.
Significant silver-lead-zinc mineralization occurs in four main areas at the Chinchillas Property deposit: the Silver Mantos and Mantos Basement zones in the west part of the Project, and the Socavon del Diablo and Socavon Basement zones in the east part.
Mining Operations
The Chinchillas deposit is mined as a conventional open pit operation. Most of the in-pit haulage for both ore and waste is carried out using 100 tonne haul trucks. Ore is mined in five-meter benches and stockpiled in a staging area close to the pit. In the staging area, ore is loaded onto 35 tonne road trucks to be transported to the crusher at the Pirquitas operation. Throughout the mining operation, low grade ore is stockpiled near the pit rim to be processed at the end of mine life. Waste rock will be mined and hauled to two major on-site rock storage facilities based on their geochemical characteristics.
The nearest community to Chinchillas is the village of Santo Domingo, and nearest to Pirquitas is the village of Nuevo Pirquitas. Basic amenities are supplied from Susques and Abra Pampa, while supplies for mining are obtained through the provincial capital of San Salvador de Jujuy, which has an airport with daily commercial air service to Buenos Aires.
Infrastructure, Permitting and Compliance Activities
Infrastructure at Chinchillas is limited. Electricity onsite at Chinchillas is supplied along existing power lines from the generators at Pirquitas. Water supply for human consumption comes from bottled water, and water for mining operations is drawn from wells.
Pirquitas has been a permitted commercial mine and processing facility, operated by SSR Mining since December 2009, with existing infrastructure that includes a processing plant, a permitted tailings facility, a fully serviced workers camp sufficient for approximately 670 personnel, a communications system including cellular and intranet access, fully serviced office buildings, and wastewater treatment facilities, organic waste landfill and a recycling center. Electricity is produced from natural gas at the Pirquitas site. Water supply is from a site known as San Marcos, which is located within the property a short distance downstream from where the Pirquitas River drains into the Collahuaima River. Domestic water is pumped from a diversion upstream of the open pit for use at the camp.
Government permits required to conduct exploration, drilling and processing at Puna have been obtained.
Mineral Processing and Metallurgical Testing
The metallurgical testing of Chinchillas ore types commenced in 2013 and continued until 2016. The first testwork was focused on silver recovery by both leaching and flotation methods with flotation proving to be superior at this early stage. The second program continued process development of flotation into separate lead/silver and zinc concentrates. The third testwork campaign was designed to advance the flotation process and test specifically these ore types to the Pirquitas mill flow sheet.
The Pirquitas process plant operating performance since commencement on Chinchillas ores is used to provide the concentrate grade recovery and mass pull relationships.
Processing and Recovery Operations
The Pirquitas processing plant consists of crushing grinding and froth flotation to produce 2 products, a silver/lead and a zinc concentrate. These 2 product concentrates are bagged separately in one tonne bags and transported to Buenos Aires by truck for export to smelters. The Pirquitas process plant has continued to improve performance from the expected 4,000 tonnes per day feed capacity to 4,500 tonnes per day achieved in 2021.
See “Proven and Probable Reserve Estimates” and "Resource Estimates" in this Item 2 for further information on the mineral resources and mineral reserves for Puna for the years ended December 31, 2021 and December 31, 2020, and see "Operating Statistics" in this Item 2 for further information on production of the Puna operations for the years ended December 31, 2021, December 31, 2020 and December 31, 2019.
Exploration
At Chinchillas, surface exploration programs included detailed mapping with a special emphasis on structures, rock chip sampling, trenching, soil sampling and talus sampling. These programs identified the major structural zones, the strong east–west control on basin formation, and new mineralized target areas. Work has included geophysical surveys IP ("Induced Polarization")/Resistivity, Controlled-Source Audio-Magnetotelluric Technique ("CSAMT"), Magnetics). Five drilling programs constituting approximately 50,000 meters of drilling were conducted at the Chinchillas property.
At Pirquitas, comprehensive mineral exploration was conducted on the property, including geological mapping, geophysical surveying (44 line-kilometers of ground magnetics and 19.2 line- kilometers of induced polarization surveying), underground rock sampling and multiple programs of RC and diamond drilling.
The Granada target area is at the intersection of the Potosi vein and Cortaderas vein-breccia in San Miguel Pit. The Potosí Vein is a west-northwest oriented steeply dipping vein. The Cortaderas Vein gives outcrops at the south slope of the Cortaderas Valley around 500 m north of the San Miguel Open Pit and oriented east-west with a dip direction around 60° to the southwest. Colquechaca and Blanca Veins are located slightly north of Potosi, strike both northwest and southeast and variably dip steeply to the north and south.
In 2019–2020, the objective of the deep Granada drill program was to test the theorized intersection between the south west dipping Cortaderas vein breccia and the steeply north-dipping Potosi vein, located at depth beneath the San Miguel pit. Three HQ drill holes were completed between October 6, 2019 and January 31, 2020 and the total length drilled was 3,430 m. Results from the Granada drilling program intersected the two different mineral compositions that correspond with historically described veins. Mineralization is commonly filling open spaces as fracturing, brecciation, and faulting, usually as massive or semi-massive veins or veinlets, they have widths ranging commonly from 5–30 cm, and range up to 3.5 m. The Granada target was not encountered at the anticipated depth but the program did identify significant intersections of gold values below the elevation of previous mining within the San Miguel open pit (~4,000 m). The gold values are commonly associated with elevated concentrations of Ag, As, Bi, Cu, and Sn.
Drilling
An early drilling program (before SSR, 2008), was effectively conducted in two phases, with the transition being marked by a change in analytical laboratories from American Assay Laboratories ("AAL") to the SGS Chile laboratory partway through its drilling program. RC drillholes AR 001-AR 092 and diamond core drillholes DDH 001-DDH 042 were analyzed by AAL, RC drillholes AR 093-AR 164 and diamond core drillholes DDH 043-DDH 069 were analyzed by SGS Chile. Both analytical labs took possession of the samples at Pirquitas and were in custody of them throughout the sample preparation and analysis steps (including sample transportation from site to the respective analytical laboratory). AAL set up sample preparation facilities on-site at Pirquitas whilst SGS Chile transported the samples to their analytical laboratory in Salta, Argentina. Each laboratory implemented QC programs that were reviewed and monitored by Sunshine Argentina and an independent consultant.
Alex Stewart is the primary laboratory and ALS in Peru ("ALS") is used as the secondary laboratory for check samples. All samples are tested for a suite of 39 elements including silver, lead and zinc by a four-acid digestion method and analysis by Inductively Coupled Plasma atomic emission spectroscopy ("ICP") (method ICP-MA-39). Silver greater than 200 parts per million (ppm) is assayed by fire assay using a 50 g sample with gravimetric finish (method Ag4A-50). Lead and zinc greater than 10,000 ppm are re-assayed by an oxidizing acid digestion for ore grade material and reading by ICP (method ICP-ORE).
ALS is used as secondary laboratory by method ME-ICP61 based on a four-acid digestion and reading by ICP. Samples greater than one percent lead or zinc are re-tested using ore grade method Pb-OG62 and Zn-OG62. Samples greater than 100 ppm silver are re-assayed by fire assay with gravimetric finish (method Ag-GRA22).
Sampling, Analysis and Data Verification
No material sample bias was identified by the qualified persons during the review of the drill data and assays. Observation of the drill core during the site visits and inspection and validation of the data collected convinced the qualified persons that the drill data are adequate for the estimation of measured, indicated and inferred mineral resources.
Capital and Operating Costs.
Total capital expenditure, exclusive of discretionary exploration, is estimated to be $47 million which is primarily composed of mine and plant equipment, tailings storage facility expansions and asset componentization. Estimated operating costs for mine operations include both cash and non-cash costs.
| | | | | | | | | | | | | | | | | |
Description | Total ($M) | | LOM Average ($/t milled) |
Mining Costs | $ | 110 | | $ | 15.01 |
Processing Costs | | 183 | | | 24.95 |
G&A Costs | | 93 | | | 12.71 |
Total | $ | 387 | | $ | 52.67 |
Capital costs and operating costs are provided for mineral property disclosure purposes in accordance with NI 51-102 and are mining company financial measures. See “Additional Mining Company Financial Information” in this Item 2 for more information.
Costs in individual years may vary significantly as a result of, among other things, current or future nonrecurring expenditures, and changes to input costs and exchange rates. Please refer to the Puna 2021 Technical Report Summary for other key metrics including detailed cash flows by year and net present value computations.
Exploration and Development
Turkey Exploration
SSR Mining owns 30% of Tunçpınar Madencilik Sanayi ve Ticaret Anonim Şirketi (“Tunçpınar”) operated by Lidya and 70% of Bakırtepe Madencilik Sanayi ve Ticaret Anonim Şirketi (“Bakırtepe”) which is operated by SSR Mining. Bakırtepe includes the Copper Hill exploration target.
Copper hill is in the Black Sea region of Turkey and is a priority target of the Company’s exploration program.
Drilling at Copper Hill (Bakırtepe) commenced in April 2020, with eight diamond drill holes totaling 3,181 meters. Seven of the eight holes intersected sulfide (chalcopyrite) copper mineralization. To-date, 35 diamond drill holes, totaling 10,829 meters have been completed. The northwest-southeast trending mineralized zone has been identified over a strike length of at least 450 meters with a width of 180 meters and a depth extent of at least 200 meters. Copper Hill sits within the package of exploration leases known as Kazıkbeli. The Lidya Mining Exploration team discovered Bakırtepe and undertook the preliminary exploration activities on behalf of the joint venture with the Company. Site activities are now being transitioned to the SSR Mining Exploration and Project Development teams.
Amisk, Canada Exploration
The Amisk property is 39,880 hectares (and 126 claims) with extensive Proterozoic-volcano-sedimentary rock assemblages that are prospective for gold-silver epithermal, gold-rich volcanogenic massive sulfide and orogenic gold deposits.
In the Amisk property the West Channel and Black Diamond trends occur along regional-scale ductile shear zones that range from 5 to 50 meters in orthogonal width. Intermediate volcanic and volcaniclastic rocks core much of these trends with lesser meta-volcanic, meta-sedimentary and gabbro packages occurring in proximity to the high-strain corridors. Alteration assemblages of sericite, iron-carbonate and silicification dominate the regional shear zones. Localized chlorite and diaspore occurrences are diagnostic and associated with auriferous quartz veins at the Monarch target area. Arsenopyrite is the most common sulfide mineral associated with this vein-hosted gold mineralization. Pyrite, chalcopyrite and pyrrhotite are also present, but generally to a lesser degree. Based on visual observations, Sulfide content related to gold mineralization can range from 1%-15%, with most zones hosting 3-5% total sulfide. Coarse visible gold is relatively uncommon on the property and is presently identified at the Raine-Walker, TCA and Black Diamond targets to-date.
Pitarrilla, Mexico Exploration
The Pitarrilla project is a wholly owned silver project located within the Municipality of Santa María del Oro and Indé, on the eastern flank of the Sierra Madre Occidental mountain range in the central part of Durango State, Mexico. The project is held by the Company’s wholly owned subsidiary, SSR Durango, S.A. de C.V.
On January 12, 2022, the Company entered into an agreement with Endeavor Silver Corp. ("Endeavor Silver") to sell the Pitarrilla project. The transaction is expected to close in the first half of 2022. Until closing, Pitarrilla will be maintained in good standing by the Company.
San Luis, Peru Exploration
The San Luis project is a wholly owned high-grade gold-silver project located in the Ancash Department of central Peru. The project is held by the Company’s wholly owned subsidiary, Reliant Ventures S.A.C.
In September 2012, Peru’s Ministry of Mines and Energy approved the EIA for the mining operation of the Ayelén deposit, completing a significant milestone for the San Luis project. Based on the preliminary and early works the Company conducted in respect of the project in 2017, the EIA now has no expiry date.
The San Luis project includes several vein systems across an area of land whose surface rights are held by two local communities: Ecash and Cochabamba. The execution of the San Luis project requires land access and use negotiations to be completed with both communities. Exploration activities were successfully undertaken on land belonging to the Ecash community in 2021 and the company plans to extend exploration activities onto Cochabamba lands in 2022.
Qualified Persons
The Technical Report Summaries were prepared by OreWin, an independent mining consultancy based in Australia, and the following contributors, each of whom is an independent Qualified Person for purposes of Subpart 1300 of Regulation S-K and NI 43-101:
•In respect of the Çöpler District Master Plan 2021 Technical Report Summary, Bernard Peters, BEng (Mining), FAusIMM (201743), employed by OreWin as Technical Director - Mining, was responsible for the overall preparation, the Mineral Reserve estimates, Sections 1 to 5, Sections 10, Section 12 to 25; and Sharron Sylvester, BSc (Geol), RPGeo AIG (10125), employed by OreWin as Technical Director - Geology, was responsible for the preparation of the Mineral Resources, Sections 1 to 3, Section 6 to 9, Section 11, Sections 22 to 25.
•In respect of the Marigold 2021 Technical Report Summary, Bernard Peters, BEng (Mining), FAusIMM (201743), employed by OreWin as Technical Director - Mining, was responsible for the overall preparation, the Mineral Reserve estimates, Sections 1 to 5, Sections 10, Section 12 to 25; and Sharron Sylvester, BSc (Geol), RPGeo AIG (10125), employed by OreWin as Technical Director - Geology, was responsible for the preparation of the Mineral Resources, Sections 1 to 3, Section 6 to 9, Section 11, Sections 22 to 25; OreWin Pty Ltd was responsible for the preparation of Sections 1 to 25.
•In respect of the Seabee 2021 Technical Report Summary, Bernard Peters, BEng (Mining), FAusIMM (201743), employed by OreWin as Technical Director - Mining, was responsible for the overall preparation, the Mineral Reserve estimates, Sections 1 to 5, Sections 10, Section 12 to 25; and Sharron Sylvester, BSc (Geol), RPGeo AIG (10125), employed by OreWin as Technical Director - Geology, was responsible for the preparation of the Mineral Resources, Sections 1 to 3, Section 6 to 9, Section 11, Sections 22 to 25; OreWin Pty Ltd was responsible for the preparation of Sections 1 to 25.
•In respect of the Puna 2021 Technical Report Summary, Gregory Gibson, BSc (Mining), SME(4134135), employed by SSR Mining as Vice President Americas Operations, was responsible for the preparation of Sections 1 to 25; Bernard Peters, BEng (Mining), FAusIMM (201743), employed by OreWin as Technical Director - Mining, was responsible for the overall preparation and the Mineral Reserve estimates, Sections 1 to 5, Sections 10, Section 12 to 25; Sharron Sylvester, BSc (Geol), RPGeo AIG (10125), employed by OreWin as Technical Director - Geology, was responsible for the preparation of the Mineral Resources, Sections 1 to 3, Section 6 to 9, Section 11, Sections 22 to 25; OreWin Pty Ltd was responsible for the preparation of Sections 1 to 25.
Bernard Peters, an independent Qualified Person, has approved the 2021 mineral reserves, and Sharron Sylvester, an independent Qualified Person, has approved the 2021 mineral resources included in this Annual Report related to the Technical Report Summaries.
Additionally, Karthik Rathnam, a Qualified Person employed by SSR Mining as Manager Resource Geology, has approved the mineral resources and reserves included in this Annual Report in respect of the Pitarrilla, Mexico and San Luis, Peru exploration projects, and Cengiz Demirci, a Qualified Person employed by SSR Mining as Vice President, Exploration, has approved the mineral resources and reserves included in this Annual Report in respect of the Amisk, Canada exploration project.
OreWin is not affiliated with SSR Mining and, other than Gregory Gibson, Karthik Rathnam and Cengiz Demirci, none of the Qualified Persons identified above are employees of, or otherwise affiliated with, SSR Mining or any of its subsidiaries.
Internal Controls over the Mineral Reserves and Mineral Resources Estimation Process
The Company has internal controls over the mineral reserves and mineral resources estimation processes that result in reasonable and reliable estimates aligned with industry practice and reporting regulations. Annually, qualified persons and other employees review the estimates of mineral reserves and mineral resources, the supporting documentation, and compliance to the internal controls, and, based on their review of such information, recommend approval to use the mineral reserve and mineral resource estimates to our senior management. The Company’s controls utilize management systems including but not limited to, formal quality assurance and quality control protocols, standardized procedures, workflow processes, supervision and management approval, internal and external reviews and audits, reconciliations, and data security covering record keeping, chain of custody and data storage.
The Company's systems also cover exploration activities, sample preparation and analysis, data verification, mineral processing, metallurgical testing, recovery estimation, mine design and sequencing, and mineral reserve and resource evaluations, with environmental, social and regulatory considerations. The Company’s quality assurance and control protocols over sampling and assaying of drill hole samples include insertion of blind samples consisting of standards, blanks, and duplicates in the primary sample streams, as well as selective sample validation at secondary laboratories.
These controls and other methods help to validate the reasonableness of the estimates. The effectiveness of the controls are reviewed periodically to address changes in conditions and the degree of compliance with policies and procedures. Refer to Item 1A. “Risk Factors” for discussion of risks associated with our estimates of mineral reserves and mineral resources.
Proven and Probable Reserve Estimates
Proven and probable Mineral Reserves are based on extensive drilling, sampling, geological modeling, and metallurgical testing from which economic feasibility has been determined. The price sensitivity of Mineral Reserves depends upon several factors including grade, metallurgical recovery, operating cost, waste-to-ore ratio and ore type. Metallurgical recovery rates vary depending on the metallurgical properties of each deposit and the production process used. The Mineral Reserve tables below list the average metallurgical recovery rate for each deposit, which takes into account the several different processing methods to be used. The cut-off grade, or lowest grade of mineralized material considered economic to process, varies with material type, metallurgical recoveries and operating costs.
The proven and probable Mineral Reserves presented herein are estimates based on information available at the time of calculation. No assurance can be given that the indicated levels of recovery of gold, silver, lead, zinc, and copper will be realized. Ounces of gold or silver, or pounds of copper, lead or zinc in the proven and probable Mineral Reserves are calculated without regard to any losses during metallurgical treatment. Mineral Reserves estimates may require revision based on actual production experience. Market price fluctuations of gold, silver, lead, zinc, and copper as well as increased production costs or reduced metallurgical recovery rates, could render proven and probable Mineral Reserves containing relatively lower grades of mineralization uneconomic to exploit and might result in a decrease in actual recovery as compared to the Mineral Reserves reported herein.
The Mineral Reserves presented below as of December 31, 2021 have been prepared in accordance with the U.S. Securities and Exchange Commission (SEC) Regulation S-K subpart 1300 rules for Property Disclosures for Mining Registrants (S-K 1300). Mineral Reserves metal prices used for preparation of the 2021 report, which were selected, in each case, by the Qualified Persons that prepared the 2021 Technical Report Summary for each property, are: $1,350 per gold ounce, $18.50 per silver ounce, $0.90 per lead pound, $1.05 per zinc pound, and $3.30 per copper pound unless otherwise stated.
The Mineral Reserves presented below as of December 31, 2020 have been prepared in accordance with National Instrument 43-101 – Standards of Disclosure for Mineral Projects (“NI 43-101”). The Mineral Reserves metal price assumptions for 2020 report are: $1,350 per gold ounce, $18.50 per silver ounce, $0.90 per lead pound, $1.05 per zinc pound, and $3.00 per copper pound unless otherwise stated.
Technical Report Summaries for Çöpler, Marigold, Seabee and Chinchillas (Puna) operations are available under the Company's profile on the SEDAR website at www.sedar.com and as part of the Company’s Annual Report on Form 10-K filed on the SEC’s EDGAR website at sec.gov. For additional information about the projects, readers are encouraged to review the Company’s Annual Report on Form 10-K, which includes the Technical Report Summaries for each property.
The point of reference for Mineral Reserves is the point of feed into the processing facility for all projects except for Marigold, which is entry into the carbon columns in the processing facility.
Metals shown in the table are contained metals in ore mined and processed.
Tonnage is metric tonnes, ounces represent troy ounces, and g/t represents grams per metric tonne.
Figures may vary due to rounding.
The following tables summarize the Company's estimated gold reserves as of December 31, 2021 and December 31, 2020 for each of its production and exploration assets:
| | | | | | | | | | | | | | | | | | | | | | | | | | | | | | | | | | | | | | | | | | | | | | | | | | | | | | | | | | | | | | | | | | | | | | | | | | |
| Gold Reserves as of December 31, 2021 |
| | | | | | Proven | | Probable | | Proven and Probable | | |
| | | | SSR | | Tonnes | | Grade | | Gold | | Tonnes | | Grade | | Gold | | Tonnes | | Grade | | Gold | | Metallurgical |
| Deposit | | Country | | Share | | (kt) | | (g/t) | | (koz) | | (kt) | | (g/t) | | (koz) | | (kt) | | (g/t) | | (koz) | | Recovery |
Çöpler (OP)(1)(2)(3) (4) | | Turkey | | 78% | | 9,024 | | | 2.55 | | | 741 | | | 53,863 | | | 2.03 | | | 3,522 | | | 62,887 | | | 2.11 | | | 4,263 | | | 84 | % |
| Çöpler Stockpile | | Turkey | | 80% | | — | | | — | | | — | | | 12,479 | | | 2.25 | | | 901 | | | 12,479 | | | 2.25 | | | 901 | | | 91 | % |
Marigold (OP)(5) | | United States | | 100% | | — | | | — | | | — | | | 203,768 | | | 0.48 | | | 3,173 | | | 203,768 | | | 0.48 | | | 3,173 | | | 75 | % |
| Marigold (leach pad inventory) | | United States | | 100% | | — | | | — | | | — | | | — | | | — | | | 237 | | | — | | | — | | | 237 | | | 71 | % |
Seabee (UG)(6)(7) | | Canada | | 100% | | 304 | | | 9.16 | | | 90 | | | 2,379 | | | 6.40 | | | 490 | | | 2,684 | | | 6.72 | | | 580 | | | 98 | % |
| | | | | | 9,328 | | | 2.77 | | | 831 | | | 272,489 | | | 0.92 | | | 8,323 | | | 281,818 | | | 0.98 | | | 9,154 | | | 78 | % |
(1)Çöpler Mineral Reserves includes reserves from Çöpler Mine, Cakmaktepe and Ardich.
(2)Mineral Reserves are shown on a 100% basis. SSR Ownership is an average based on location of Mineral Reserves (gold) relative to licenses: Çöpler and part of Ardich are on Anagold 80:20 ground of which SSR holds 80% rights, and Çakmaktepe, Bayramdere and the remainder of Ardich are on Kartaltepe 50:50 ground of which SSR holds 50% rights. Total ownership percentages are weighted averages.
(3)Mineral Reserve cut-offs are based on $1,350/oz gold price. The average oxide recoveries are 73% and average sulfide recoveries are 91%. All cut-off values include allowance for royalty payable. There are no credits for silver or copper in the cut-off calculations. Oxide cutoff grades vary between 0.44-0.80g/t gold and sulphide cutoff grades vary between 1.05-1.11g/t gold.
(4)There are no sulfide Mineral Reserves at Çakmaktepe and Bayramdere.
(5)Marigold Mineral Reserves are reported at a cut-off grade of 0.065 g/t payable gold (gold assay factored for metallurgical recovery, royalty, and net proceeds). No mining dilution is applied to the grade of the Mineral Reserves. Dilution intrinsic to the Mineral Reserves estimate is considered sufficient to represent the mining selectivity considered.
(6)Seabee Mineral Reserves are reported using $1,600/oz gold and a cut-off grade of 2.52 g/t gold. Processing recoveries vary based on the feed grade. The average recovery is estimated to be 98%.
(7)Seabee Mineral Reserves includes Santoy 8, Santoy 9, and Gap Hangingwall ("GHW") lodes.
| | | | | | | | | | | | | | | | | | | | | | | | | | | | | | | | | | | | | | | | | | | | | | | | | | | | | | | | | | | | | | | | | | | | | | | | | | |
| Gold Reserves as of December 31, 2020 |
| | | | | | Proven | | Probable | | Proven and Probable | | |
| | | | SSR | | Tonnes | | Grade | | Gold | | Tonnes | | Grade | | Gold | | Tonnes | | Grade | | Gold | | Metallurgical |
| Deposit | | Country | | Share | | (kt) | | (g/t) | | (koz) | | (kt) | | (g/t) | | (koz) | | (kt) | | (g/t) | | (koz) | | Recovery |
Çöpler (OP)(1)(2)(3) (4) | | Turkey | | 78% | | 2,196 | | | 2.31 | | | 163 | | | 47,617 | | | 2.03 | | | 3,109 | | | 49,814 | | | 2.04 | | | 3,273 | | | 84 | % |
| Çöpler Stockpile | | Turkey | | 80% | | — | | | — | | | — | | | 6,993 | | | 2.54 | | | 571 | | | 6,993 | | | 2.54 | | | 571 | | | 91 | % |
Marigold (OP)(5) | | United States | | 100% | | — | | | — | | | — | | | 219,398 | | | 0.49 | | | 3,425 | | | 219,398 | | | 0.47 | | | 3,425 | | | 75 | % |
| Marigold (leach pad inventory) | | United States | | 100% | | — | | | — | | | — | | | — | | | — | | | 270 | | | — | | | — | | | 270 | | | 73 | % |
Seabee (UG)(6) | | Canada | | 100% | | 529 | | | 8.79 | | | 150 | | | 1,031 | | | 10.37 | | | 344 | | | 1,560 | | | 9.83 | | | 493 | | | 98 | % |
| | | | | | 2,725 | | | 3.57 | | | 313 | | | 275,039 | | | 0.84 | | | 7,719 | | | 277,765 | | | 0.87 | | | 8,032 | | | 77 | % |
(1)Çöpler Mineral Reserves includes reserves from Çöpler Mine and Cakmaktepe.
(2)Çöpler Mineral Reserves are reported at the following cut-off grades: oxide cut-off grades are 0.47-0.71 g/t gold and Çöpler sulfide cut-off grade is 1.05 g/t gold. All cut-off grades include allowance for royalty payable.
(3)Metallurgical recoveries vary with grade and average recoveries for oxide is 61% and for sulphides is 91%. The overall average recovery is 84%.
(4)Copler Reserves are located on ground held 80% by SSR and Çakmaktepe reserves (<1%) of the total reserves on ground 50% by SSR.
(5)Marigold Mineral Reserves are reported using $1,350/oz gold and at a gold cut-off grade of 0.065 g/t which incorporates royalty and metallurgical recovery.
(6)Seabee Mineral Reserves are reported using $1,350/oz gold and a cut-off grade of 3.99 g/t gold.
The following tables summarize the Company's estimated silver reserves as of December 31, 2021 and December 31, 2020 for each of its production and exploration assets:
| | | | | | | | | | | | | | | | | | | | | | | | | | | | | | | | | | | | | | | | | | | | | | | | | | | | | | | | | | | | | | | | | | | | | | | | | | |
| Silver Reserves as of December 31, 2021 |
| | | | | | Proven | | Probable | | Proven and Probable | | |
| | | | SSR | | Tonnes | | Grade | | Silver | | Tonnes | | Grade | | Silver | | Tonnes | | Grade | | Silver | | Metallurgical |
| Deposit | | Country | | Share | | (kt) | | (g/t) | | (koz) | | (kt) | | (g/t) | | (koz) | | (kt) | | (g/t) | | (koz) | | Recovery |
Çöpler (OP)(1)(2)(3)(4) | | Turkey | | 78% | | 9,024 | | | 4.15 | | | 1,203 | | | 53,863 | | | 4.48 | | | 7,765 | | | 62,887 | | | 4.44 | | | 8,968 | | | 9 | % |
Chinchillas (OP)(5)(6) | | Argentina | | 100% | | 2,379 | | | 168.91 | | | 12,918 | | | 5,041 | | | 155.30 | | | 25,174 | | | 7,420 | | | 159.68 | | | 38,092 | | | 98 | % |
| Chinchillas (Stockpile) | | Argentina | | 100% | | — | | | — | | | — | | | 187 | | | 141.00 | | | 846 | | | 187 | | | 141.00 | | | 846 | | | 98 | % |
| | | | | | 11,403 | | | 38.52 | | | 14,121 | | | 59,091 | | | 17.78 | | | 33,785 | | | 70,494 | | | 21.14 | | | 47,906 | | | 19 | % |
(1)Çöpler Mineral Reserves includes reserves from Çöpler Mine, Cakmaktepe and Ardich.
(2)Mineral Reserves are shown on a 100% basis. SSR Ownership is an average based on location of Mineral Reserves (gold) relative to licenses: Çöpler and part of Ardich are on Anagold 80:20 ground of which SSR holds 80% rights, and Çakmaktepe, Bayramdere and the remainder of Ardich are on Kartaltepe 50:50 ground of which SSR holds 50% rights. Total ownership percentages are weighted averages.
(3)Mineral Reserve cut-offs are based on $1,350/oz gold price. The average oxide recoveries are 73% and average sulfide recoveries are 91%. The weighted average gold recovery is 84%. All cut-off values include allowance for royalty payable. There are no credits for silver or copper in the cut-off calculations. Oxide cutoff grades vary between 0.44-0.80g/t gold and sulphide cutoff grades vary between 1.05-1.11g/t gold.
(4)There are no sulfide Mineral Reserves at Çakmaktepe and Bayramdere.
(5)Chinchillas Mineral Reserves are reported at NSR cut off value of $44.11 per tonne which incorporates appropriate metallurgical recoveries and includes lead and zinc attributable metals.
(6)Chinchillas processing recoveries vary based on the feed grade. The average recovery is estimated to be 98% for silver, 93% for lead and 63% for zinc.
| | | | | | | | | | | | | | | | | | | | | | | | | | | | | | | | | | | | | | | | | | | | | | | | | | | | | | | | | | | | | | | | | | | | | | | | | | |
| Silver Reserves as of December 31, 2020 |
| | | | | | Proven | | Probable | | Proven and Probable | | |
| | | | SSR | | Tonnes | | Grade | | Silver | | Tonnes | | Grade | | Silver | | Tonnes | | Grade | | Silver | | Metallurgical |
| Deposit | | Country | | Share | | (kt) | | (g/t) | | (koz) | | (kt) | | (g/t) | | (koz) | | (kt) | | (g/t) | | (koz) | | Recovery |
Çöpler (OP)(1)(2)(3)(4) | | Turkey | | 78% | | 2,196 | | | 7.70 | | | 544 | | | 47,617 | | | 5.03 | | | 8,836 | | | 49,814 | | | 5.85 | | | 9,379 | | | 9 | % |
Chinchillas (OP)(5) | | Argentina | | 100% | | 420 | | | 142.58 | | | 1,926 | | | 7,614 | | | 162.17 | | | 39,696 | | | 8,034 | | | 161.14 | | | 41,622 | | | 96 | % |
| Chinchillas (Stockpile) | | Argentina | | 100% | | — | | | — | | | — | | | 339 | | | 126.74 | | | 1,382 | | | 339 | | | 126.74 | | | 1,382 | | | 94 | % |
| | | | | | 2,616 | | | 29.35 | | | 2,470 | | | 55,570 | | | 27.94 | | | 49,914 | | | 58,187 | | | 28.00 | | | 52,383 | | | 21 | % |
(1)Çöpler Mineral Reserves includes reserves from Çöpler Mine and Cakmaktepe.
(2)Çöpler Mineral Reserves are reported at the following cut-off grades: oxide cut-off grades are 0.47-0.71 g/t gold and Çöpler sulfide cut-off grade is 1.05 g/t gold. All cut-off grades include allowance for royalty payable.
(3)Metallurgical recoveries vary with gold grade and the average silver recovery is 9%.
(4)Çöpler mine Mineral Reserves are located on ground held 80% by SSR and Çakmaktepe Mineral Reserves (<1%) are located on ground held 50% by SSR
(5)Chinchillas Mineral Reserves are reported at NSR cut off value of $44.11 per tonne which incorporates appropriate metallurgical recoveries and includes lead and zinc attributable metals. Metal price assumptions for reserves are $18.00/oz silver, $0.90/lb lead, and $1.00/lb zinc.
The following tables summarize the Company's estimated lead reserves as of December 31, 2021 and December 31, 2020 for each of its production and exploration assets:
| | | | | | | | | | | | | | | | | | | | | | | | | | | | | | | | | | | | | | | | | | | | | | | | | | | | | | | | | | | | | | | | | | | | | | | | | | |
| Lead Reserves as of December 31, 2021 |
| | | | | | Proven | | Probable | | Proven and Probable | | |
| | | | SSR | | Tonnes | | Grade | | Lead | | Tonnes | | Grade | | Lead | | Tonnes | | Grade | | Lead | | Metallurgical |
| Deposit | | Country | | Share | | (kt) | | (%) | | (Mlbs) | | (kt) | | (%) | | (Mlbs) | | (kt) | | (%) | | (Mlbs) | | Recovery |
Chinchillas (OP)(1)(2) | | Argentina | | 100% | | 2,379 | | | 1.33 | | | 69.7 | | | 5,041 | | | 1.29 | | | 143.4 | | | 7,420 | | | 1.30 | | | 213.1 | | | 95 | % |
| Chinchillas Stockpile | | Argentina | | 100% | | — | | | — | | | — | | | 187 | | | 1.33 | | | 5.5 | | | 187 | | | 1.33 | | | 5.5 | | | 95 | % |
| | | | | | 2,379 | | | 1.33 | | | 69.7 | | | 5,228 | | | 1.29 | | | 148.9 | | | 7,607 | | | 1.30 | | | 218.6 | | | 95 | % |
(1)Chinchillas Mineral Reserves are reported at NSR cut off value of $44.11 per tonne which incorporates appropriate metallurgical recoveries and includes silver and zinc attributable metals.
(2)Chinchillas processing recoveries vary based on the feed grade. The average recovery is estimated to be 98% for silver, 93% for lead, and 63% for zinc.
| | | | | | | | | | | | | | | | | | | | | | | | | | | | | | | | | | | | | | | | | | | | | | | | | | | | | | | | | | | | | | | | | | | | | | | | | | |
| Lead Reserves as of December 31, 2020 |
| | | | | | Proven | | Probable | | Proven and Probable | | |
| | | | SSR | | Tonnes | | Grade | | Lead | | Tonnes | | Grade | | Lead | | Tonnes | | Grade | | Lead | | Metallurgical |
| Deposit | | Country | | Share | | (kt) | | (%) | | (Mlbs) | | (kt) | | (%) | | (Mlbs) | | (kt) | | (%) | | (Mlbs) | | Recovery |
Chinchillas (OP)(1) | | Argentina | | 100% | | 420 | | | 0.73 | | | 6.8 | | | 7,614 | | | 1.39 | | | 232.6 | | | 8,034 | | | 1.35 | | | 239.4 | | | 96 | % |
| Chinchillas Stockpile | | Argentina | | 100% | | — | | | — | | | — | | | 339 | | | 0.84 | | | 6.3 | | | 339 | | | 0.84 | | | 6.3 | | | 94 | % |
| | | | | | 420 | | | 0.73 | | | 6.8 | | | 7,953 | | | 1.36 | | | 238.9 | | | 8,373 | | | 1.33 | | | 245.7 | | | 96 | % |
(1)Mineral Reserves are reported at NSR cut off value of $44.11 per tonne which incorporates appropriate metallurgical recoveries and includes silver and zinc attributable metals. Metal price assumption for reserves are $0.90/lb lead.
The following tables summarize the Company's estimated zinc reserves as of December 31, 2021 and December 31, 2020 for each of its production and exploration assets:
| | | | | | | | | | | | | | | | | | | | | | | | | | | | | | | | | | | | | | | | | | | | | | | | | | | | | | | | | | | | | | | | | | | | | | | | | | |
| Zinc Reserves as of December 31, 2021 |
| | | | | | Proven | | Probable | | Proven and Probable | | |
| | | | SSR | | Tonnes | | Grade | | Zinc | | Tonnes | | Grade | | Zinc | | Tonnes | | Grade | | Zinc | | Metallurgical |
| Deposit | | Country | | Share | | (kt) | | (%) | | (Mlbs) | | (kt) | | (%) | | (Mlbs) | | (kt) | | (%) | | (Mlbs) | | Recovery |
Chinchillas (OP)(1)(2) | | Argentina | | 100% | | 2,379 | | | 0.34 | | | 17.8 | | | 5,041 | | | 0.25 | | | 27.8 | | | 7,420 | | | 0.28 | | | 45.6 | | | 63 | % |
| Chinchillas Stockpile | | Argentina | | 100% | | — | | | — | | | — | | | 187 | | | 0.50 | | | 2.1 | | | 187 | | | 0.50 | | | 2.1 | | | 63 | % |
| | | | | | 2,379 | | | 0.34 | | | 17.8 | | | 5,228 | | | 0.26 | | | 29.9 | | | 7,607 | | | 0.28 | | | 47.7 | | | 63 | % |
(1)Chinchillas Mineral Reserves are reported at NSR cut off value of $44.11 per tonne which incorporates appropriate metallurgical recoveries and includes silver and lead attributable metals.
(2)Chinchillas processing recoveries vary based on the feed grade. The average recovery is estimated to be 98% for silver, 95% for lead and 63% for zinc.
| | | | | | | | | | | | | | | | | | | | | | | | | | | | | | | | | | | | | | | | | | | | | | | | | | | | | | | | | | | | | | | | | | | | | | | | | | |
| Zinc Reserves as of December 31, 2020 |
| | | | | | Proven | | Probable | | Proven and Probable | | |
| | | | SSR | | Tonnes | | Grade | | Zinc | | Tonnes | | Grade | | Zinc | | Tonnes | | Grade | | Zinc | | Metallurgical |
| Deposit | | Country | | Share | | (kt) | | (%) | | (Mlbs) | | (kt) | | (%) | | (Mlbs) | | (kt) | | (%) | | (Mlbs) | | Recovery |
Chinchillas (OP)(1) | | Argentina | | 100% | | 420 | | | 0.37 | | | 3.4 | | | 7,614 | | | 0.36 | | | 60.4 | | | 8,034 | | | 0.36 | | | 63.8 | | | 15 | % |
| Chinchillas Stockpile | | Argentina | | 100% | | — | | | — | | | — | | | 339 | | | 0.45 | | | 3.4 | | | 339 | | | 0.45 | | | 3.4 | | | 68 | % |
| | | | | | 420 | | | 0.37 | | | 3.4 | | | 7,953 | | | 0.36 | | | 63.8 | | | 8,373 | | | 0.36 | | | 67.2 | | | 17 | % |
(1)Chinchillas Mineral Reserves are reported at NSR cut off value of $44.11 per tonne which incorporates appropriate metallurgical recoveries and includes silver and lead attributable metals. The metal price assumption for reserves is $1.00/lb zinc.
The following tables summarize the Company's estimated copper reserves as of December 31, 2021 and December 31, 2020 for each of its production and exploration assets:
| | | | | | | | | | | | | | | | | | | | | | | | | | | | | | | | | | | | | | | | | | | | | | | | | | | | | | | | | | | | | | | | | | | | | | | | | | |
| Copper Reserves as of December 31, 2021 |
| | | | | | Proven | | Probable | | Proven and Probable | | |
| | | | SSR | | Tonnes | | Grade | | Copper | | Tonnes | | Grade | | Copper | | Tonnes | | Grade | | Copper | | Metallurgical |
| Deposit | | Country | | Share | | (kt) | | (%) | | (Mlbs) | | (kt) | | (%) | | (Mlbs) | | (kt) | | (%) | | (Mlbs) | | Recovery |
Çöpler (OP)(1)(2)(3)(4)(5)(6) | | Turkey | | 78% | | 9,024 | | | — | | | 0.2 | | | 53,863 | | | 0.01 | | | 9.2 | | | 62,887 | | | 0.01 | | | 9.4 | | | 2 | % |
| | | | | | 9,024 | | | — | | | 0.2 | | | 53,863 | | | 0.01 | | | 9.2 | | | 62,887 | | | 0.01 | | | 9.4 | | | 2 | % |
(1)Çöpler Mineral Reserves includes reserves from Çöpler Mine, Cakmaktepe and Ardich.
(2)Mineral Reserves are shown on a 100% basis. SSR Ownership is an average based on location of Mineral Reserves relative to licenses: Çöpler and part of Ardich are on Anagold 80:20 ground of which SSR holds 80% rights, and Çakmaktepe, Bayramdere and the remainder of Ardich are on Kartaltepe 50:50 ground of which SSR holds 50% rights. Total ownership percentages are weighted averages.
(3)Mineral Reserve cut-offs are based on $1,350/oz gold price. The average oxide recoveries are 73% and average sulfide recoveries are 91%. All cut-off values include allowance for royalty payable. There are no credits for silver or copper in the cut-off calculations. Oxide cutoff grades vary between 0.44-0.80g/t gold and sulphide cutoff grades vary between 1.05-1.11g/t gold.
(4)There are no sulfide Mineral Reserves at Çakmaktepe and Bayramdere.
(5) There is no copper recovery in sulphide material.
(6) Copper oxide recoveries are 2%.
| | | | | | | | | | | | | | | | | | | | | | | | | | | | | | | | | | | | | | | | | | | | | | | | | | | | | | | | | | | | | | | | | | | | | | | | | | |
| Copper Reserves as of December 31, 2020 |
| | | | | | Proven | | Probable | | Proven and Probable | | |
| | | | SSR | | Tonnes | | Grade | | Copper | | Tonnes | | Grade | | Copper | | Tonnes | | Grade | | Copper | | Metallurgical |
| Deposit | | Country | | Share | | (kt) | | (%) | | (Mlbs) | | (kt) | | (%) | | (Mlbs) | | (kt) | | (%) | | (Mlbs) | | Recovery |
Çöpler (OP)(1)(2)(3)(4)(5) | | Turkey | | 78% | | 2,196 | | | 0.01 | | | 0.3 | | | 47,344 | | | 0.02 | | | 18.1 | | | 49,540 | | | 0.02 | | | 18.4 | | | 2 | % |
| | | | | | 2,196 | | | 0.01 | | | 0.3 | | | 47,344 | | | 0.02 | | | 18.1 | | | 49,540 | | | 0.02 | | | 18.4 | | | 2 | % |
isis(1)Çöpler Mineral Reserves includes reserves from Çöpler Mine and Cakmaktepe.
(2)Çöpler Mineral Reserves are reported at the following cut-off grades: oxide cut-off grades are 0.47-0.71 g/t gold and Çöpler sulfide cut-off grade is 1.05 g/t gold. All cut-off grades include allowance for royalty payable.
(3)Çöpler mine Mineral Reserves are located on ground held 80% by SSR and Çakmaktepe Mineral Reserves (<1%) are located on ground held 50% by SSR.
(4)Metallurgical recoveries vary with grade and average recoveries for oxide is 2%.
(5)There is no copper recovery in sulphides.
Resource Estimates
Mineral Resources are presented exclusive of Mineral Reserves. Due to the uncertainty that may be attached to Inferred Mineral Resources, it cannot be assumed that all or any part of an Inferred Mineral Resource will be upgraded to an Indicated or Measured Mineral Resource as a result of continued exploration.
The Mineral Resources presented below as of December 31, 2021 have been prepared in accordance with the U.S. Securities and Exchange Commission (SEC) Regulation S-K subpart 1300 rules for Property Disclosures for Mining Registrants (S-K 1300). Mineral Resources metal prices used for preparation of the 2021 report, which were selected, in each case, by the applicable Qualified Persons for each property, are: $1,750 per gold ounce, $22.00 per silver ounce, $0.95 per lead pound, $1.15 per zinc pound, and $3.95 per copper pound unless otherwise stated.
The Mineral Resources presented below as of December 31, 2020 have been prepared in accordance with National Instrument 43-101 – Standards of Disclosure for Mineral Projects (“NI 43-101”). Resources metal prices used for preparation of the 2020 report are: $1,750 per gold ounce, $22.00 per silver ounce, $1.00 per lead pound, $1.15 per zinc pound, and $3.25 per copper pound unless otherwise stated in the footnotes.
The point of reference for Mineral Resources is the point of feed into the processing facility for all projects except for Marigold, which is entry into the carbon columns in the processing facility.
Metals shown in the tables below are contained metals in ore mined and processed.
Tonnage is metric tonnes, ounces represent troy ounces, and g/t represents grams per metric tonne.
Figures may vary due to rounding.
The following tables summarize the Company's estimated gold resources as of December 31, 2021 and 2020 for each of its production and exploration assets:
| | | | | | | | | | | | | | | | | | | | | | | | | | | | | | | | | | | | | | | | | | | | | | | | | | | | | | | | | | | | | | | | | | | | | | | | | | | | | | | | | | | | | | |
| Gold Resources as of December 31, 2021 |
| | | | | | Measured | | Indicated | | Measured and Indicated | | Inferred |
| | | | SSR | | Tonnes | | Grade | | Gold | | Tonnes | | Grade | | Gold | | Tonnes | | Grade | | Gold | | Tonnes | | Grade | | Gold |
| Deposit | | Country | | Share | | (kt) | | (g/t) | | (koz) | | (kt) | | (g/t) | | (koz) | | (kt) | | (g/t) | | (koz) | | (kt) | | (g/t) | | (koz) |
Çöpler (OP) (1)(2)(3)(4)(5)(6)(7) | | Turkey | | 77% | | 3,306 | | | 1.92 | | | 204 | | | 88,948 | | | 1.03 | | | 2,933 | | | 92,254 | | | 1.06 | | | 3,137 | | | 103,154 | | | 1.17 | | | 3,875 | |
Marigold (OP)(8)((9) | | United States | | 100% | | — | | | — | | | — | | | 115,294 | | | 0.43 | | | 1,611 | | | 115,294 | | | 0.43 | | | 1,611 | | | 21,795 | | | 0.36 | | | 250 | |
Seabee (UG)(10) | | Canada | | 100% | | 71 | | | 19.75 | | | 45 | | | 797 | | | 12.23 | | | 313 | | | 869 | | | 12.83 | | | 358 | | | 2,754 | | | 6.05 | | | 536 | |
Amisk (OP)(11) | | Canada | | 100% | | — | | | — | | | — | | | 43,976 | | | 0.73 | | | 1,028 | | | 43,976 | | | 0.73 | | | 1,028 | | | 49,985 | | | 0.52 | | | 830 | |
San Luis (UG)(12) | | Peru | | 100% | | — | | | — | | | — | | | 484 | | | 22.40 | | | 349 | | | 484 | | | 22.43 | | | 349 | | | 20 | | | 5.60 | | | 4 | |
| | | | | | 3,377 | | | 2.30 | | | 249 | | | 249,499 | | | 0.78 | | | 6,234 | | | 252,877 | | | 0.80 | | | 6,483 | | | 177,708 | | | 0.96 | | | 5,495 | |
(1)Çöpler Mineral Resources include resources from Çöpler Mine, Cakmaktepe, Ardich and Bayramdere.
(2)Mineral Resources are shown on a 100% basis. SSR Ownership is an average based on location of Mineral Resources (gold) relative to licenses: Çöpler and part of Ardich are on Anagold 80:20 ground of which SSR holds 80% rights, and Çakmaktepe, Bayramdere and the remainder of Ardich are on Kartaltepe 50:50 ground of which SSR holds 50% rights. Total ownership percentages are weighted averages.
(3)All Mineral Resources for Çöpler were assessed for reasonable prospects for eventual economic extraction by reporting only material that fell within conceptual pit shells ($1,400/oz gold and $19.00/oz silver for Bayramdere).
(4)Oxide definitions: At Çöpler: oxide is defined as material <2% total sulfur and sulfide material is ≥2% total sulfur. At Ardich and Çakmaktepe, oxide is comprised of low-sulfur (LS) oxide (<1% total sulfur) and high-sulfur oxide (≥1% and <2% total sulfur). At Bayramdere, oxide is defined as material <2% total sulfur.
(5)Sulfide definitions: At Ardich, sulfide is comprised of standard sulfide material (≥2% total sulfur) and sulfide-with-Cu material (sulfide with Cu>0.10%). There is no sulfide material at Çakmaktepe or Bayramdere.
(6)Mineral Resources are reported at the variable gold cut-off grades based on different metallurgical parameters: oxide cut-off grades are 0.19-0.76 g/t gold, sulfide cut-off uses an NSR value in $/t based on gold price of $1,750/oz, silver price of $22.00/oz, and copper price of $3.95/lb with allowances for payability, deductions, transport, and royalties.
(7)Çöpler oxide recoveries vary between 38.0-78.4% and sulphide recoveries vary between 55-98%.
(8)Marigold Mineral Resource estimate is based on an optimised pit shell at a cut off grade of 0.065 g/t payable gold (gold assay factored for recovery, royalty, and net proceeds).
(9)Marigold metallurgical recoveries varies with gold grade and on average recoveries are 67%
(10)Seabee Mineral Resources are reported using a cut-off grade of 2.07 g/t and were assessed for reasonable prospects for eventual economic extraction by reporting only material that fell within conceptual underground shapes. Mineral resources includes Santoy 8, Santoy 9, and GHW lodes.
(11)Amisk Mineral Resources are reported using a gold equivalent cut-off grade of 0.30 g/t and include silver attributable ounces. Average gold recovery is 90%.
(12)San Luis Mineral Resources are reported at gold price assumptions of $600/oz using a gold equivalent cut-off grade of 6.0 g/t and include silver attributable ounces. Average gold recovery is 94%.
| | | | | | | | | | | | | | | | | | | | | | | | | | | | | | | | | | | | | | | | | | | | | | | | | | | | | | | | | | | | | | | | | | | | | | | | | | | | | | | | | | | | | | |
| Gold Resources as of December 31, 2020 |
| | | | | | Measured | | Indicated | | Measured and Indicated | | Inferred |
| | | | SSR | | Tonnes | | Grade | | Gold | | Tonnes | | Grade | | Gold | | Tonnes | | Grade | | Gold | | Tonnes | | Grade | | Gold |
| Deposit | | Country | | Share | | (kt) | | (g/t) | | (koz) | | (kt) | | (g/t) | | (koz) | | (kt) | | (g/t) | | (koz) | | (kt) | | (g/t) | | (koz) |
Çöpler (OP) (1)(2)(3)(4)(5)(6)(7) | | Turkey | | 76% | | 5,707 | | | 1.70 | | | 312 | | | 70,619 | | | 1.34 | | | 3,049 | | | 76,326 | | | 1.37 | | | 3,362 | | | 73,741 | | | 1.30 | | | 3,089 | |
Marigold (OP)(8) | | United States | | 100% | | — | | | — | | | — | | | 121,332 | | | 0.43 | | | 1,680 | | | 121,332 | | | 0.43 | | | 1,680 | | | 28,597 | | | 0.36 | | | 334 | |
Seabee (UG)(9) | | Canada | | 100% | | 24 | | | 103.17 | | | 80 | | | 1,421 | | | 9.40 | | | 429 | | | 1,445 | | | 10.97 | | | 510 | | | 2,030 | | | 7.77 | | | 507 | |
Amisk (OP)(10) | | Canada | | 100% | | — | | | — | | | — | | | 43,976 | | | 0.73 | | | 1,028 | | | 43,976 | | | 0.73 | | | 1,028 | | | 49,985 | | | 0.52 | | | 830 | |
San Luis (UG)(11) | | Peru | | 100% | | — | | | — | | | — | | | 484 | | | 22.40 | | | 349 | | | 484 | | | 22.40 | | | 349 | | | 20 | | | 5.60 | | | 4 | |
| | | | | | 5,731 | | | 2.13 | | | 392 | | | 237,832 | | | 0.85 | | | 6,535 | | | 243,563 | | | 0.88 | | | 6,929 | | | 154,373 | | | 0.96 | | | 4,765 | |
(1)Çöpler Mineral Resources include resources from Çöpler Mine, Cakmaktepe, Ardich and Bayramdere.
(2)All Mineral Resources for Çöpler were assessed for reasonable prospects for eventual economic extraction by reporting only material that fell within conceptual pit shells based on metal prices of $1,750/oz for gold ($1,400 for gold and $19/oz for silver for Bayramdere). The following parameters were used: gold metallurgical recoveries in oxide: Çöpler mine 62.3–78.4%, Çakmaktepe 38.0–80.0%, Ardich 40.0–73.0%, and Bayramdere 75.0%, and in sulfide: Çöpler 85.0%, and Ardich 82.9%; gold cut-off grades in oxide: Çöpler 0.32–0.41 g/t gold, Çakmaktepe 0.36–0.76 g/t gold, Ardich 0.30–0.55 g/t gold, and Bayramdere 0.35–0.50 g/t gold, and in sulfide: Çöpler 0.73 g/t gold and Ardich 0.77 g/t gold (there are no credits for silver or copper in the cut-off grade calculations); allowances have been made for royalty payable.
(3)At Çöpler, oxide is defined as material <2% total sulfur and sulfide material is ≥2% total sulfur.
(4)At Ardich and Çakmaktepe, low-sulfur (LS) oxide is defined as material with <1% total sulfur, high-sulfur (HS) oxide is material with ≥1% and <2% total sulfur, and sulfide material is ≥2% total sulfur.
(5)At Bayramdere. oxide is defined as material <2% total sulfur. There is no sulfide material at Bayramdere.
(6)Mineral Resources are reported at the following cut-off grades: oxide cut-off grades 0.32-0.76 g/t gold and Çöpler sulfide cut-off grades 0.73-0.77 g/t gold. All cut-off grades include allowance for royalty payable.
(7)Mineral Resources are shown on a 100% basis. Çöpler Mineral Resources are located on ground held 80% by SSR, Çakmaktepe and Bayramdere Mineral Resources are located on ground held 50% by SSR, and approximately 96% of Ardich Mineral Resources are located on ground held 80% by SSR, with the remainder located on ground 50% held by SSR.
(8)Marigold Mineral Resources are reported using a cut-of grade of 0.065 g/t within a conceptual open pit shell with a average process recovery of 75%.
(9)Seabee Mineral Resources are reported using a cut-off grade of 3.11 g/t with an average recovery of 98%.
(10)Amisk Mineral Resources are reported using a gold equivalent cut-off grade of 0.30 g/t and include silver attributable ounces. Gold process recovery is 90%.
(11)San Luis Mineral Resources are reported at gold price assumptions of $600/oz using a gold equivalent cut-off grade of 6.0 g/t and include silver attributable ounces. Gold process recovery is 94%.
The following tables summarize the Company's estimated silver resources as of December 31, 2021 and 2020 for each of its production and exploration assets:
| | | | | | | | | | | | | | | | | | | | | | | | | | | | | | | | | | | | | | | | | | | | | | | | | | | | | | | | | | | | | | | | | | | | | | | | | | | | | | | | | | | | | | |
| Silver Resources as of December 31, 2021 |
| | | | | | Measured | | Indicated | | Measured and Indicated | | Inferred |
| | | | SSR | | Tonnes | | Grade | | Silver | | Tonnes | | Grade | | Silver | | Tonnes | | Grade | | Silver | | Tonnes | | Grade | | Silver |
| Deposit | | Country | | Share | | (kt) | | (g/t) | | (koz) | | (kt) | | (g/t) | | (koz) | | (kt) | | (g/t) | | (koz) | | (kt) | | (g/t) | | (koz) |
Çöpler (OP) (1)(2)(3)(4)(5)(6)(7) | | Turkey | | 77% | | 3,306 | | | 4.30 | | | 457 | | | 88,948 | | | 3.35 | | | 9,572 | | | 92,254 | | | 3.38 | | | 10,029 | | | 103,154 | | | 9.56 | | | 31,695 | |
Chinchillas (OP)(8) | | Argentina | | 100% | | 1,110 | | | 99.20 | | | 3,540 | | | 4,904 | | | 101.13 | | | 15,943 | | | 6,014 | | | 100.76 | | | 19,483 | | | 165 | | | 101.86 | | | 540 | |
Pirquitas (UG)(9) | | Argentina | | 100% | | 79 | | | 444.50 | | | 1,129 | | | 2,555 | | | 287.67 | | | 23,627 | | | 2,634 | | | 292.33 | | | 24,756 | | | 1,080 | | | 206.86 | | | 7,185 | |
San Luis (UG)(10) | | Peru | | 100% | | — | | | — | | | — | | | 484 | | | 578.10 | | | 9,003 | | | 484 | | | 578.56 | | | 9,003 | | | 20 | | | 272.00 | | | 175 | |
Pitarilla (OP)(11) | | Mexico | | 100% | | 12,345 | | | 90.10 | | | 35,746 | | | 147,016 | | | 97.50 | | | 460,728 | | | 159,361 | | | 96.90 | | | 496,474 | | | 8,524 | | | 77.40 | | | 21,213 | |
Pitarilla (UG)(12) | | Mexico | | 100% | | — | | | — | | | — | | | 5,430 | | | 164.90 | | | 28,793 | | | 5,430 | | | 164.93 | | | 28,793 | | | 1,230 | | | 138.10 | | | 5,461 | |
Amisk(13) | | Canada | | 100% | | — | | | — | | | — | | | 43,976 | | | 5.30 | | | 7,531 | | | 43,976 | | | 5.33 | | | 7,531 | | | 49,985 | | | 3.50 | | | 5,550 | |
| | | | | | 16,840 | | | 75.52 | | | 40,872 | | | 293,313 | | | 58.88 | | | 555,197 | | | 310,153 | | | 59.78 | | | 596,069 | | | 164,158 | | | 13.62 | | | 71,819 | |
(1)Çöpler Mineral Resources include resources from Çöpler Mine, Cakmaktepe, Ardich and Bayramdere.
(2)Mineral Resources are shown on a 100% basis. SSR Ownership is an average based on location of Mineral Resources (gold) relative to licenses: Çöpler and part of Ardich are on Anagold 80:20 ground of which SSR holds 80% rights, and Çakmaktepe, Bayramdere and the remainder of Ardich are on Kartaltepe 50:50 ground of which SSR holds 50% rights. Total ownership percentages are weighted averages.
(3)All Mineral Resources for Çöpler were assessed for reasonable prospects for eventual economic extraction by reporting only material that fell within conceptual pit shells ($1,400/oz for gold and $19.00/oz for silver for Bayramdere).
(4)Oxide definitions: At Çöpler: oxide is defined as material <2% total sulfur and sulfide material is ≥2% total sulfur. At Ardich and Çakmaktepe, oxide is comprised of low-sulfur (LS) oxide (<1% total sulfur) and high-sulfur oxide (≥1% and <2% total sulfur). At Bayramdere: oxide is defined as material <2% total sulfur.
(5)Sulfide definitions: At Ardich, sulfide is comprised of standard sulfide material (≥2% total sulfur) and sulfide-with-Cu material (sulfide with Cu>0.10%). There is no sulfide material at Çakmaktepe or Bayramdere.
(6)Mineral Resources are reported at the variable gold cut-off grades based on different metallurgical parameters: oxide cut-off grades 0.19-0.76 g/t gold, sulfide cut-off uses an NSR value in $/t based on gold price of $1,750/oz, silver price of $22.00/oz, and copper price of $3.95/lb with allowances for payability, deductions, transport, and royalties.
(7)Average silver recoveries are 16%.
(8)Chinchillas Mineral Resource are contained within a pit shell generated using an NSR cut-off of $33.20. Metallurgical recoveries vary based on the grade and on average are 98% for silver, 95% for lead, and 63% for zinc.
(9)Piriquitas UG Mineral Resources are reported using a silver metal price of $20.00/oz, $1.10/lb lead, and $1.30/lb zinc. The cut-off grade includes lead and zinc attributable metal and is calculated at $100/t. Metallurgical recoveries vary with grade and on average are 87% for silver, 50% for lead, and 85% for zinc.
(10)San Luis Mineral Resources are reported at silver price assumptions of $9.25/oz. The cut-off grade includes gold ounces and is 6.0 g/t gold equivalent. Gold process recovery is 90%.
(11)Pitarilla Open Pit Mineral Resources are reported at silver price assumptions of $20.00/oz, $1.10/lb for lead, and $1.30/lb for zinc. The cut-off grade includes attributable lead and zinc metal and the NSR cut-off values is $16.38 per tonnes (leach) or $16.40 per tonne flotation. Silver process recovery is 71.8%.
(12)Pitarilla UG Mineral Resources are reported at silver price of $20.00/oz,$1.10/lb for lead, and $1.30/lb for zinc. The cut-off grade includes attributable lead and zinc metal and the NSR cut-off values is $80 per tonne. Silver process recovery is 72%.
(13)Amisk Mineral Resources are reported at a cut-off grade that includes gold ounces and is 0.30 g/t gold equivalent. Silver process recovery is 80%.
| | | | | | | | | | | | | | | | | | | | | | | | | | | | | | | | | | | | | | | | | | | | | | | | | | | | | | | | | | | | | | | | | | | | | | | | | | | | | | | | | | | | | | |
| Silver Resources as of December 31, 2020 |
| | | | | | Measured | | Indicated | | Measured and Indicated | | Inferred |
| | | | SSR | | Tonnes | | Grade | | Silver | | Tonnes | | Grade | | Silver | | Tonnes | | Grade | | Silver | | Tonnes | | Grade | | Silver |
| Deposit | | Country | | Share | | (kt) | | (g/t) | | (koz) | | (kt) | | (g/t) | | (koz) | | (kt) | | (g/t) | | (koz) | | (kt) | | (g/t) | | (koz) |
Çöpler (OP) (1)(2)(3)(4)(5)(6)(7) | | Turkey | | 78% | | 5,707 | | | 0.20 | | | 36 | | | 70,619 | | | 3.10 | | | 7,039 | | | 76,326 | | | 2.88 | | | 7,076 | | | 73,741 | | | 9.16 | | | 21,708 | |
Chinchillas (OP)(8) | | Argentina | | 100% | | 378 | | | 85.89 | | | 1,043 | | | 14,077 | | | 69.52 | | | 31,463 | | | 14,455 | | | 69.95 | | | 32,507 | | | 21,836 | | | 49.82 | | | 34,974 | |
Pirquitas (UG)(9) | | Argentina | | 100% | | 79 | | | 444.50 | | | 1,129 | | | 2,555 | | | 287.70 | | | 23,627 | | | 2,634 | | | 292.37 | | | 24,756 | | | 1,080 | | | 206.86 | | | 7,185 | |
San Luis (UG)(10) | | Peru | | 100% | | — | | | — | | | — | | | 484 | | | 578.10 | | | 9,003 | | | 484 | | | 578.10 | | | 9,003 | | | 20 | | | 272.00 | | | 175 | |
Pitarilla (OP)(11) | | Mexico | | 100% | | 12,345 | | | 90.06 | | | 35,746 | | | 147,016 | | | 97.50 | | | 460,728 | | | 159,361 | | | 96.90 | | | 496,474 | | | 8,524 | | | 77.41 | | | 21,213 | |
Pitarilla (UG)(12) | | Mexico | | 100% | | — | | | — | | | — | | | 5,430 | | | 164.90 | | | 28,793 | | | 5,430 | | | 164.93 | | | 28,793 | | | 1,230 | | | 138.10 | | | 5,461 | |
Amisk(13) | | Canada | | 100% | | — | | | — | | | — | | | 43,976 | | | 5.30 | | | 7,531 | | | 43,976 | | | 5.30 | | | 7,531 | | | 49,985 | | | 3.45 | | | 5,550 | |
| | | | | | 18,509 | | | 63.78 | | | 37,954 | | | 284,157 | | | 62.19 | | | 568,184 | | | 302,666 | | | 62.29 | | | 606,140 | | | 156,416 | | | 19.14 | | | 96,266 | |
(1)Çöpler Mineral Resources include resources from Çöpler Mine, Cakmaktepe, Ardich and Bayramdere.
(2)All Mineral Resources for Çöpler were assessed for reasonable prospects for eventual economic extraction by reporting only material that fell within conceptual pit shells based on metal prices of $1,750/oz for gold ($1,400/oz for gold and $19.00/oz for silver for Bayramdere). The following parameters were used: gold metallurgical recoveries in oxide: Çöpler mine 62.3–78.4%, Çakmaktepe 38.0–80.0%, Ardich 40.0–73.0%, and Bayramdere 75.0%, and in sulfide: Çöpler 85.0%, and Ardich 82.9%; g cut-off grades in oxide: Çöpler 0.32–0.41 g/t gold, Çakmaktepe 0.36–0.76 g/t gold, Ardich 0.30–0.55 g/t gold, and Bayramdere 0.35–0.50 g/t gold, and in sulfide: Çöpler 0.73 g/t gold and Ardich 0.77 g/t gold, (there are no credits for silver or copper in the cut-off grade calculations); allowances have been made for royalty payable.
(3)At Çöpler, oxide is defined as material <2% total sulfur and sulfide material is ≥2% total sulfur.
(4)At Ardich and Çakmaktepe, low-sulfur (LS) oxide is defined as material with <1% total sulfur, high-sulfur (HS) oxide is material with ≥1% and <2% total sulfur, and sulfide material is ≥2% total sulfur.
(5)At Bayramdere, oxide is defined as material <2% total sulfur. There is no sulfide material at Bayramdere.
(6)Silver average recoveries are 9%.
(7)Mineral Resources are shown on a 100% basis. Çöpler Mineral Resources are located on ground held 80% by SSR, Çakmaktepe and Bayramdere Mineral Resources are located on ground held 50% by SSR, and approximately 96% of Ardich Mineral Resources are located on ground held 80% by SSR, with the remainder located on ground 50% held by SSR.
(8)Chinchillas Mineral Resources are calculated using a silver equivalent cut off value of 60.0g/t. The cut-off value includes lead and zinc attributable metal. Silver process recovery is 89%. Metal price assumption for resources are $20.00/oz silver.
(9)Piriquitas UG Mineral Resources are reported using a silver price of $20.00/oz. The cut-off grade includes lead and zinc attributable metal and is calculated at NSR $90-$100/t. Silver process recovery is 87%.
(10)San Luis Mineral Resources are reported using a silver price of $9.25/oz. The cut-off grade includes gold ounces and is 6.0 g/t gold equivalent. Gold process recovery is 90%
(11)Pitarilla Open Pit Mineral Resources are reported using a silver price of $20.00/oz. The cut-off grade includes attributable lead and zinc metal and the NSR cut-off values is $16.38 per tonnes (leach) or $16.40 per tonne flotation. Silver process recovery is 71.8%.
(12)Pitarilla UG Mineral Resources are reported using a silver price of $20.00/oz. The cut-off grade includes attributable lead and zinc metal and the NSR cut-off values is $80 per tonne. Silver process recovery is 72%.
(13)Amisk Mineral Resources are reported at a cut-off grade that includes gold ounces and is 0.30 g/t gold equivalent. Silver process recovery is 80%.
The following tables summarize the Company's estimated lead resources as of December 31, 2021 and 2020 for each of its production and exploration assets:
| | | | | | | | | | | | | | | | | | | | | | | | | | | | | | | | | | | | | | | | | | | | | | | | | | | | | | | | | | | | | | | | | | | | | | | | | | | | | | | | | | | | | | |
| Lead Resources December 31, 2021 |
| | | | | | Measured | | Indicated | | Measured and Indicated | | Inferred |
| | | | SSR | | Tonnes | | Grade | | Lead | | Tonnes | | Grade | | Lead | | Tonnes | | Grade | | Lead | | Tonnes | | Grade | | Lead |
| Deposit | | Country | | Share | | (kt) | | (%) | | (Mlbs) | | (kt) | | (%) | | (Mlbs) | | (kt) | | (%) | | (Mlbs) | | (kt) | | (%) | | (Mlbs) |
Chinchillas (OP)(1) | | Argentina | | 100% | | 1,110 | | | 0.86 | | | 21.0 | | | 4,904 | | | 0.88 | | | 95.6 | | | 6,013 | | | 0.88 | | | 116.6 | | | 165 | | | 0.48 | | | 1.8 | |
Pirquitas (UG)(2) | | Argentina | | 100% | | 79 | | | 0.20 | | | 0.3 | | | 2,555 | | | 0.02 | | | 1.1 | | | 2,634 | | | 0.03 | | | 1.4 | | | 1,080 | | | — | | | 0.1 | |
Pitarilla (OP)(3) | | Mexico | | 100% | | 12,345 | | | 0.70 | | | 190.0 | | | 147,016 | | | 0.32 | | | 1,040.4 | | | 159,361 | | | 0.35 | | | 1,230.4 | | | 8,524 | | | 0.18 | | | 32.9 | |
Pitarilla (UG)(4) | | Mexico | | 100% | | — | | | — | | | — | | | 5,430 | | | 0.68 | | | 81.4 | | | 5,430 | | | 0.68 | | | 81.4 | | | 1,230 | | | 0.89 | | | 24.1 | |
| | | | | | 13,534 | | | 0.71 | | | 211.3 | | | 159,905 | | | 0.34 | | | 1,218.5 | | | 173,438 | | | 0.37 | | | 1,429.8 | | | 10,999 | | | 0.25 | | | 58.9 | |
(1)Chinchillas Mineral Resource are contained within a pit shell generated using an NSR cut-off of $33.20. Metallurgical recoveries vary based on the grade and on average are 98% for silver, 95% for lead and 63% for zinc.
(2)Piriquitas UG Mineral Resources are contained within underground mining shapes based on an NSR cut-off on $90-$100/t are reported using a silver metal price of $20.00/oz, $1.10/lb for lead and $1.30/lb for zinc. Metallurgical recoveries vary with grade and on average are 87% for silver, 50% for lead, and 85% for zinc.
(3)Pitarilla Open Pit Mineral Resources are reported using a silver price of $20.00/oz, $1.10/lb for lead, and $1.30/lb for zinc. The cut-off grade includes silver and zinc metal and the NSR cut-off values is $16.38 per tonnes (leach) or $16.40 per tonne flotation. Lead process recovery is 68%.
(4)Pitarilla UG Mineral Resources are reported using a silver price of $20.00/oz, $1.10/lb for lead, and $1.30/lb for zinc. The cut-off grade includes silver and zinc metal and the NSR cut-off values is $80 per tonne. Lead process recovery is 68%.
| | | | | | | | | | | | | | | | | | | | | | | | | | | | | | | | | | | | | | | | | | | | | | | | | | | | | | | | | | | | | | | | | | | | | | | | | | | | | | | | | | | | | | |
| Lead Resources December 31, 2020 |
| | | | | | Measured | | Indicated | | Measured and Indicated | | Inferred |
| | | | SSR | | Tonnes | | Grade | | Lead | | Tonnes | | Grade | | Lead | | Tonnes | | Grade | | Lead | | Tonnes | | Grade | | Lead |
| Deposit | | Country | | Share | | (kt) | | (%) | | (Mlbs) | | (kt) | | (%) | | (Mlbs) | | (kt) | | (%) | | (Mlbs) | | (kt) | | (%) | | (Mlbs) |
Chinchillas (OP)(1) | | Argentina | | 100% | | 378 | | | 0.62 | | | 5.1 | | | 14,077 | | | 0.79 | | | 243.9 | | | 14,455 | | | 0.78 | | | 249.0 | | | 21,836 | | | 0.55 | | | 263.4 | |
Pirquitas (UG)(2) | | Argentina | | 100% | | 79 | | | 0.20 | | | 0.3 | | | 2,555 | | | 0.02 | | | 1.1 | | | 2,634 | | | 0.03 | | | 1.4 | | | 1,080 | | | — | | | 0.1 | |
Pitarilla (OP)(3) | | Mexico | | 100% | | 12,345 | | | 0.70 | | | 190.0 | | | 147,016 | | | 0.32 | | | 1,040.4 | | | 159,361 | | | 0.35 | | | 1,230.4 | | | 8,524 | | | 0.18 | | | 32.9 | |
Pitarilla (UG)(4) | | Mexico | | 100% | | — | | | — | | | — | | | 5,430 | | | 0.68 | | | 81.4 | | | 5,430 | | | 0.68 | | | 81.4 | | | 1,230 | | | 0.89 | | | 24.1 | |
| | | | | | 12,802 | | | 0.69 | | | 195.4 | | | 169,078 | | | 0.37 | | | 1,366.8 | | | 181,880 | | | 0.39 | | | 1,562.2 | | | 32,670 | | | 0.45 | | | 320.5 | |
(1)Chinchillas Mineral Resources are calculated using a silver equivalent cut off value of 60.0 g/t that includes silver and zinc attributable metal. Lead process recovery is 93%. Metal price assumption for resources is $1.10/lb lead.
(2)Piriquitas UG Mineral Resources are reported using a lead price of $1.10/lb. The cut-off grade includes silver and zinc attributable metal and is calculated at NSR $90-$100/t. Lead process recovery is 50%.
(3)Pitarilla Open Pit Mineral Resources are reported using a lead price of $1.10/lb. The cut-off grade includes silver and zinc metal and the NSR cut-off values is $16.38 per tonnes (leach) or $16.40 per tonne flotation. Lead process recovery is 68%.
(4)Mineral Resources are reported using a lead price of $1.10/lb. The cut-off grade includes silver and zinc metal and the NSR cut-off values is $80 per tonne. Lead process recovery is 68%.
The following tables summarize the Company's estimated zinc resources as of December 31, 2021 and 2020 for each of its production and exploration assets:
| | | | | | | | | | | | | | | | | | | | | | | | | | | | | | | | | | | | | | | | | | | | | | | | | | | | | | | | | | | | | | | | | | | | | | | | | | | | | | | | | | | | | | |
| Zinc Resources as of December 31, 2021 |
| | | | | | Measured | | Indicated | | Measured and Indicated | | Inferred |
| | | | SSR | | Tonnes | | Grade | | Zinc | | Tonnes | | Grade | | Zinc | | Tonnes | | Grade | | Zinc | | Tonnes | | Grade | | Zinc |
| Deposit | | Country | | Share | | (kt) | | (%) | | (Mlbs) | | (kt) | | (%) | | (Mlbs) | | (kt) | | (%) | | (Mlbs) | | (kt) | | (%) | | (Mlbs) |
Chinchillas (OP)(1) | | Argentina | | 100% | | 1,110 | | | 0.31 | | | 7.6 | | | 4,904 | | | 0.19 | | | 20.5 | | | 6,013 | | | 0.21 | | | 28.0 | | | 165 | | | 0.16 | | | 0.6 | |
Pirquitas (UG)(2) | | Argentina | | 100% | | 79 | | | 1.17 | | | 2.0 | | | 2,555 | | | 4.56 | | | 256.8 | | | 2,634 | | | 4.46 | | | 258.9 | | | 1,080 | | | 7.45 | | | 177.4 | |
Pitarilla (OP)(3) | | Mexico | | 100% | | 12,345 | | | 1.22 | | | 333.1 | | | 147,016 | | | 0.87 | | | 2,803.6 | | | 159,361 | | | 0.89 | | | 3,136.7 | | | 8,524 | | | 0.58 | | | 108.2 | |
Pitarilla (UG)(4) | | Mexico | | 100% | | — | | | — | | | — | | | 5,430 | | | 1.34 | | | 160.4 | | | 5,430 | | | 1.34 | | | 160.4 | | | 1,230 | | | 1.25 | | | 33.9 | |
| | | | | | 13,534 | | | 1.15 | | | 342.7 | | | 159,904 | | | 0.92 | | | 3,241.3 | | | 173,438 | | | 0.94 | | | 3,584.0 | | | 10,999 | | | 1.32 | | | 320.1 | |
(1)Chinchillas Mineral Resources are calculated using a NSR cut off value of $33.20 that includes silver and lead attributable metal. The average recovery is estimated to be 98% for silver, 93% for lead and 63% for zinc.
(2)Piriquitas UG Mineral Resources are contained within underground mining shapes based on an NSR cut-off on $90-$100/t are reported using a silver metal price of $20.00/oz, $1.10/lb for lead, and $1.30/lb for zinc. Metallurgical recoveries vary with grade and on average are 87% silver, 50% for lead, and 85% for zinc.
(3)Pitarilla Open Pit Mineral Resources are reported using a silver price of $20.00/oz, $1.10/lb for lead, and $1.30/lb for zinc. The cut-off grade includes silver and lead metal and the NSR cut-off values is $16.38 per tonnes (leach) or $16.40 per tonne flotation. Zinc process recovery is 72%.
(4)Pitarilla UG Mineral Resources are reported using a silver price of $20.00/oz, $1.10/lb for lead, and $1.30/lb for zinc. The cut-off grade includes silver and lead metal and the NSR cut-off values is $80 per tonne. Zinc process recovery is 72%.
| | | | | | | | | | | | | | | | | | | | | | | | | | | | | | | | | | | | | | | | | | | | | | | | | | | | | | | | | | | | | | | | | | | | | | | | | | | | | | | | | | | | | | |
| Zinc Resources as of December 31, 2020 |
| | | | | | Measured | | Indicated | | Measured and Indicated | | Inferred |
| | | | SSR | | Tonnes | | Grade | | Zinc | | Tonnes | | Grade | | Zinc | | Tonnes | | Grade | | Zinc | | Tonnes | | Grade | | Zinc |
| Deposit | | Country | | Share | | (kt) | | (%) | | (Mlbs) | | (kt) | | (%) | | (Mlbs) | | (kt) | | (%) | | (Mlbs) | | (kt) | | (%) | | (Mlbs) |
Chinchillas (OP)(1) | | Argentina | | 100% | | 378 | | | 0.66 | | | 5.5 | | | 14,077 | | | 0.77 | | | 238.5 | | | 14,455 | | | 0.77 | | | 244.0 | | | 21,836 | | | 0.83 | | | 400.0 | |
Pirquitas (UG)(2) | | Argentina | | 100% | | 79 | | | 1.17 | | | 2.0 | | | 2,555 | | | 4.56 | | | 256.8 | | | 2,634 | | | 4.46 | | | 258.8 | | | 1,080 | | | 7.45 | | | 177.4 | |
Pitarilla (OP)(3) | | Mexico | | 100% | | 12,345 | | | 1.22 | | | 333.1 | | | 147,016 | | | 0.87 | | | 2,803.6 | | | 159,361 | | | 0.89 | | | 3,136.7 | | | 8,524 | | | 0.58 | | | 108.2 | |
Pitarilla (UG)(4) | | Mexico | | 100% | | — | | | — | | | — | | | 5,430 | | | 1.34 | | | 160.4 | | | 5,430 | | | 1.34 | | | 160.4 | | | 1,230 | | | 1.25 | | | 33.9 | |
| | | | | | 12,802 | | | 1.21 | | | 340.6 | | | 169,078 | | | 0.93 | | | 3,459.3 | | | 181,880 | | | 0.95 | | | 3,799.9 | | | 32,670 | | | 1.00 | | | 719.5 | |
(1)Chinchillas Mineral Resources are calculated using a silver equivalent cut off value of 60.0 g/t that includes silver and lead attributable metal. Zinc process recovery is 81%. Metal price assumption for resources is $1.30/lb zinc.
(2)Piriquitas UG Mineral Resources are reported using a zinc price of $1.30/lb. The cut-off grade includes silver and lead attributable metal and is calculated at NSR $90-$100/t. Zinc process recovery is 85%. The project is currently undeveloped.
(3)Pitarilla Open Pit Mineral Resources are reported using a zinc price of $1.30/lb. The cut-off grade includes silver and lead metal and the NSR cut-off value is $16.38 per tonnes (leach) or $16.40 per tonne flotation. Zinc process recovery is 72%.
(4)Pitarilla UG Mineral Resources are reported using a zinc price of $1.30/lb. The cut-off grade includes silver and lead metal and the NSR cut-off value is $80 per tonne. Zinc process recovery is 72%.
The following tables summarize the Company's estimated copper resources as of December 31, 2021 and 2020 for each of its production and exploration assets:
| | | | | | | | | | | | | | | | | | | | | | | | | | | | | | | | | | | | | | | | | | | | | | | | | | | | | | | | | | | | | | | | | | | | | | | | | | | | | | | | | | | | | | |
| Copper Resources as of December 31, 2021 |
| | | | | | Measured | | Indicated | | Measured and Indicated | | Inferred |
| | | | SSR | | Tonnes | | Grade | | Copper | | Tonnes | | Grade | | Copper | | Tonnes | | Grade | | Copper | | Tonnes | | Grade | | Copper |
| Deposit | | Country | | Share | | (kt) | | (%) | | (Mlbs) | | (kt) | | (%) | | (Mlbs) | | (kt) | | (%) | | (Mlbs) | | (kt) | | (%) | | (Mlbs) |
Çöpler (OP) (1)(2)(3)(4)(5)(6)(7) | | Turkey | | 77% | | 3,306 | | | 0.03 | | | 2.1 | | | 88,948 | | | 0.15 | | | 296.7 | | | 92,254 | | | 0.15 | | | 298.8 | | | 103,154 | | | 0.13 | | | 285.6 | |
| | | | | | 3,306 | | | 0.03 | | | 2.1 | | | 88,948 | | | 0.15 | | | 296.7 | | | 92,254 | | | 0.15 | | | 298.8 | | | 103,154 | | | 0.13 | | | 285.6 | |
(1)Çöpler Mineral Resources include resources from Çöpler Mine, Cakmaktepe, Ardich and Bayramdere.
(2)Mineral Resources are shown on a 100% basis. SSR Ownership is an average based on location of Mineral Resources (gold) relative to licenses: Çöpler and part of Ardich are on Anagold 80:20 ground of which SSR holds 80% rights, and Çakmaktepe, Bayramdere and the remainder of Ardich are on Kartaltepe 50:50 ground of which SSR holds 50% rights. Total ownership percentages are weighted averages.
(3)All Mineral Resources for Çöpler were assessed for reasonable prospects for eventual economic extraction by reporting only material that fell within conceptual pit shells ($1,400/oz for gold and $19.00/oz for silver for Bayramdere).
(4)Oxide definitions: At Çöpler, oxide is defined as material <2% total sulfur and sulfide material is ≥2% total sulfur. At Ardich and Çakmaktepe, oxide is comprised of low-sulfur (LS) oxide (<1% total sulfur) and high-sulfur oxide (≥1% and <2% total sulfur). At Bayramdere, oxide is defined as material <2% total sulfur.
(5)Sulfide definitions: At Ardich, sulfide is comprised of standard sulfide material (≥2% total sulfur) and sulfide-with-Cu material (sulfide with Cu>0.10%). There is no sulfide material at Çakmaktepe or Bayramdere.
(6)Mineral Resources are reported at the variable gold cut-off grades based on different metallurgical parameters: oxide cut-off grades 0.19-0.76 g/t gold, sulfide cut-off uses an NSR value in $/t based on a gold price of $1,750/oz, silver price of $22.00/oz, and copper price of $3.95/lb with allowances for payability, deductions, transport, and royalties.
(7)Copper oxide recoveries are 2% and sulphide recoveries are 65%.
| | | | | | | | | | | | | | | | | | | | | | | | | | | | | | | | | | | | | | | | | | | | | | | | | | | | | | | | | | | | | | | | | | | | | | | | | | | | | | | | | | | | | | |
| Copper Resources as of December 31, 2020 |
| | | | | | Measured | | Indicated | | Measured and Indicated | | Inferred |
| | | | SSR | | Tonnes | | Grade | | Copper | | Tonnes | | Grade | | Copper | | Tonnes | | Grade | | Copper | | Tonnes | | Grade | | Copper |
| Deposit | | Country | | Share | | (kt) | | (%) | | (Mlbs) | | (kt) | | (%) | | (Mlbs) | | (kt) | | (%) | | (Mlbs) | | (kt) | | (%) | | (Mlbs) |
Çöpler (OP) (1)(2)(3)(4)(5)(6) | | Turkey | | 77% | | 5,707 | | | — | | | 0.2 | | | 70,619 | | | 0.04 | | | 59.9 | | | 76,326 | | | 0.04 | | | 60.1 | | | 73,741 | | | 0.06 | | | 94.9 | |
| | | | | | 5,707 | | | — | | | 0.2 | | | 70,619 | | | — | | | 59.9 | | | 76,326 | | | 0.04 | | | 60.1 | | | 73,741 | | | 0.06 | | | 94.9 | |
(1)Çöpler Mineral Resources include resources from Çöpler Mine, Cakmaktepe, Ardich and Bayramdere.
(2)All Mineral Resources for Çöpler were assessed for reasonable prospects for eventual economic extraction by reporting only material that fell within conceptual pit shells based on metal prices of $1,750/oz for gold ($1,400/oz for gold and $19.00/oz for silver for Bayramdere). The following parameters were used: gold metallurgical recoveries in oxide: Çöpler mine 62.3–78.4%, Çakmaktepe 38.0–80.0%, Ardich 40.0–73.0%, and Bayramdere 75.0%, and in sulfide: Çöpler 85.0%, and Ardich 82.9%; gold cut-off grades in oxide: Çöpler 0.32–0.41 g/t gold, Çakmaktepe 0.36–0.76 g/t gold, Ardich 0.30–0.55 g/t gold, and Bayramdere 0.35–0.50 g/t gold, and in sulfide: Çöpler 0.73 g/t gold and Ardich 0.77 g/t gold, (there are no credits for silver or copper in the cut-off grade calculations); allowances have been made for royalty payable.
(3)Mineral Resources are shown on a 100% basis. Çöpler Mineral Resources are located on ground held 80% by SSR, Çakmaktepe and Bayramdere Mineral Resources are located on ground held 50% by SSR, and approximately 96% of Ardich Mineral Resources are located on ground held 80% by SSR, with the remainder located on ground 50% held by SSR.
(4)At Ardich and Çakmaktepe, low-sulfur (LS) oxide is defined as material with <1% total sulfur, high-sulfur (HS) oxide is material with ≥1% and <2% total sulfur, and sulfide material is ≥2% total sulfur.
(5)At Bayramdere, oxide is defined as material <2% total sulfur. There is no sulfide material at Bayramdere.
(6)Copper oxide recoveries are 2% and sulphide recoveries are 65%.
Operating Statistics
The following tables summarize operating statistics related to production of our operations for the years ended December 31, 2021 and December 31, 2020:
| | | | | | | | | | | | | | | | | | | | | | | |
| Year Ended December 31, 2021 |
| Çöpler | | Marigold | | Seabee | | Puna |
| Gold produced (oz) | 329,276 | | | 235,282 | | | 118,888 | | | — | |
| Gold sold (oz) | 333,761 | | | 236,847 | | | 118,746 | | | — | |
| Silver produced ('000 oz) | — | | | — | | | — | | | 8,010 | |
| Silver sold ('000 oz) | — | | | — | | | — | | | 7,810 | |
| Lead produced ('000 lb) | — | | | — | | | — | | | 37,695 | |
| Lead sold ('000 lb) | — | | | — | | | — | | | 33,378 | |
| Zinc produced ('000 lb) | — | | | — | | | — | | | 13,642 | |
| Zinc sold ('000 lb) | — | | | — | | | — | | | 10,751 | |
| | | | | | | |
| Ore mined (kt) | 9,750 | | | 19,999 | | | 384 | | | 1,449 | |
| Waste removed (kt) | 15,015 | | | 79,885 | | | 272 | | | 9,594 | |
| Total material mined (kt) | 24,765 | | | 99,884 | | | 656 | | | 11,043 | |
| | | | | | | |
| Ore stacked - oxide (kt) | 1,786 | | | 19,999 | | | — | | | — | |
| Gold grade stacked - oxide (g/t) | 1.24 | | 0.41 | | — | | | — | |
| | | | | | | |
| Ore milled (kt) | 2,325 | | | — | | | 382 | | | 1,643 | |
| Gold mill feed grade (g/t) | 3.71 | | — | | | 9.92 | | — | |
| Gold recovery (%) | 91.0 | | — | | | 98.4 | | — | |
| Silver mill feed grade (g/t) | — | | | — | | | — | | | 158.00 | |
| Lead mill feed grade (%) | — | | | — | | | — | | | 1.12 | |
| Zinc mill feed grade (%) | — | | | — | | | — | | | 0.57 | |
| Silver recovery (%) | — | | | — | | | — | | | 95.8 | |
| Lead recovery (%) | — | | | — | | | — | | | 93.0 | |
| Zinc recovery (%) | — | | | — | | | — | | | 65.6 | |
| | | | | | | | | | | | | | | | | | | | | | | |
| Year Ended December 31, 2020 |
| Çöpler (1) | | Marigold | | Seabee | | Puna |
| Gold produced (oz) | 102,616 | | | 234,443 | | | 81,686 | | | — | |
| Gold sold (oz) | 108,283 | | | 229,892 | | | 75,600 | | | — | |
| Silver produced ('000 oz) | — | | | — | | | — | | | 5,581 | |
| Silver sold ('000 oz) | — | | | — | | | — | | | 4,411 | |
| Lead produced ('000 lb) | — | | | — | | | — | | | 17,193 | |
| Lead sold ('000 lb) | — | | | — | | | — | | | 14,179 | |
| Zinc produced ('000 lb) | — | | | — | | | — | | | 6,988 | |
| Zinc sold ('000 lb) | — | | | — | | | — | | | 5,111 | |
| | | | | | | |
| Ore mined (kt) | 2,535 | | | 23,556 | | | 256 | | | 817 | |
| Waste removed (kt) | 5,573 | | | 62,038 | | | 219 | | | 4,879 | |
| Total material mined (kt) | 8,108 | | | 85,594 | | | 475 | | | 5,696 | |
| | | | | | | |
| Ore stacked - oxide (kt) | 1,413 | | | 23,556 | | | — | | | — | |
| Gold grade stacked - oxide (g/t) | 1.20 | | 0.39 | | — | | | — | |
| | | | | | | |
| Ore milled (kt) | 669 | | | — | | | 255 | | | 1,118 | |
| Gold mill feed grade (g/t) | 3.62 | | — | | | 10.10 | | — | |
| Gold recovery (%) | 91.0 | | — | | | 98.4 | | — | |
| Silver mill feed grade (g/t) | — | | | — | | | — | | | 164.00 | |
| Lead mill feed grade (%) | — | | | — | | | — | | | 0.77 | |
| Zinc mill feed grade (%) | — | | | — | | | — | | | 0.51 | |
| Silver recovery (%) | — | | | — | | | — | | | 94.6 | |
| Lead recovery (%) | — | | | — | | | — | | | 90.2 | |
| Zinc recovery (%) | — | | | — | | | — | | | 55.5 | |
(1)The operating data presented in this column represents the period from September 16, 2020 to December 31, 2020, the period for which the Company was entitled to the economic benefits of Çöpler following the Company's acquisition of Alacer.
| | | | | | | | | | | | | | | | | |
| Year Ended December 31, 2019 |
| Marigold | | Seabee | | Puna |
| Gold produced (oz) | 220,227 | | | 112,137 | | | — | |
| Gold sold (oz) | 226,823 | | | 104,527 | | | — | |
| Silver produced ('000 oz) | — | | | — | | | 7,674 | |
| Silver sold ('000 oz) | — | | | — | | | 7,204 | |
| Lead produced ('000 lb) | — | | | — | | | 23,957 | |
| Lead sold ('000 lb) | — | | | — | | | 22,886 | |
| Zinc produced ('000 lb) | — | | | — | | | 8,392 | |
| Zinc sold ('000 lb) | — | | | — | | | 11,794 | |
| | | | | |
| Ore mined (kt) | 25,676 | | | 345 | | | 1,443 | |
| Waste removed (kt) | 48,364 | | | 260 | | | 10,839 | |
| Total material mined (kt) | 74,040 | | | 605 | | | 12,282 | |
| | | | | |
| Total ore stacked (kt) | 25,676 | | | — | | | — | |
| Gold stacked grade (g/t) | 0.40 | | — | | | — | |
| | | | | |
| Ore milled (kt) | — | | | 334 | | | 1,394 | |
| Gold mill feed grade (g/t) | — | | | 9.56 | | — | |
| Gold mill recovery (%) | — | | | 98.2 | | — | |
| Silver mill feed grade (g/t) | — | | | — | | | 184.00 | |
| Lead mill feed grade (%) | — | | | — | | | 0.89 | |
| Zinc mill feed grade (%) | — | | | — | | | 0.54 | |
| Silver mill recovery (%) | — | | | — | | | 93.2 | |
| Lead mill recovery (%) | — | | | — | | | 85.8 | |
| Zinc mill recovery (%) | — | | | — | | | 49.2 | |
ITEM 3. LEGAL PROCEEDINGS
From time to time, the Company and its subsidiaries have become involved in litigation relating to claims arising out of operations in the normal course of business. Information regarding legal proceedings is contained in Note 20 to the Consolidated Financial Statements contained in this Annual Report and is incorporated herein by reference.
ITEM 4. MINE SAFETY DISCLOSURES
The Company is required to report certain mine safety violations or other regulatory matters required by Section 1503(a) of the Dodd-Frank Wall Street Reform and Consumer Protection Act and Item 104 of Regulation S-K, and that required information is included in Exhibit 95 to this Annual Report, which is incorporated herein by reference.
PART II
ITEM 5. MARKET FOR REGISTRANT’S COMMON EQUITY, RELATED SHAREHOLDER MATTERS AND ISSUER PURCHASE OF EQUITY SECURITIES
The Company’s common shares are listed under the ticker symbol “SSRM” on the Toronto Stock Exchange and Nasdaq Global Select Market. The Company’s CDIs are listed under the ticker symbol “SSR” on ASX. As of January 31, 2022, there were approximately 1,243 holders of record of the Company's common shares without par value, and approximately 3,528 holders of record of the Company's CDIs.
On April 19, 2021, the Company announced that it received acceptance from the Toronto Stock Exchange to initiate a Normal Course Issuer Bid (the "NCIB") permitting the Company to purchase for cancellation up to 10,000,000 common shares of the Company, representing 4.5% of the total issued and outstanding common shares, during the twelve-month period beginning April 21, 2021 and ending April 20, 2022. In connection with the NCIB, the Company has entered into an automatic share purchase plan with a designated broker (the “ASPP”). The ASPP is intended to allow for the purchase of Common Shares under the NCIB at times when it would ordinarily not be permitted to purchase shares due to regulatory restrictions and customary self-imposed blackout periods. Through the end of September 2021, 8,800,700 common shares were purchased under the NCIB through the ASPP. No shares were purchased in the fourth quarter of 2021.
The following table summarizes purchases by the Company or an affiliated purchaser of the Company’s equity securities registered pursuant to Section 12 of the Exchange Act during the three months ended December 31, 2021:
| | | | | | | | | | | | | | |
| Period | Total Number of Shares Purchased (1) | Average Price Paid Per Share (1) | Total Number of Shares Purchased as Part of Publicly Announced Plans or Programs (2) | Maximum Number of Shares that May Yet Be Purchased Under the Plans or Programs (2) |
| April 1 - April 30 | - | - | - | 10,000,000 |
| May 1 - May 31 | 2,000,000 | $17.84 | 2,000,000 | 8,000,000 |
| June 1 - June 30 | 2,000,000 | $17.27 | 4,000,000 | 6,000,000 |
| July 1 - July 31 | 2,000,000 | $16.07 | 6,000,000 | 4,000,000 |
| August 1 - August 31 | 2,000,000 | $16.27 | 8,000,000 | 2,000,000 |
| September 1 - September 30 | 800,700 | $16.50 | 8,800,700 | 1,199,300 |
(1) The total number of shares purchase (and the average price paid per share) reflects shares purchase pursuant to the repurchase program described in (2) below.
(2) The Company's Board of Directors authorized a share repurchase program, under which the Company was authorized to repurchase up to 10,000,000 common shares. Such program was announced April 19, 2021 and will expire April 20, 2022. The Company repurchased 8,800,700 common shares during 2021 under such program. The extent to which the Company repurchases its shares, and the timing of such repurchases, will depend upon a variety of factors, including trading volume, market conditions, legal requirements, business conditions and other factors. The repurchase program may be discontinued at any time, and the program does not obligate the Company to acquire any specific number of shares of its common stock.
Dividend Policy
On February 17, 2021, the Company’s Board of Directors approved its inaugural quarterly dividend payment of $0.05 per common share that was paid on March 31, 2021 to shareholders of record at the close of business on March 5, 2021. During the year ended December 31, 2021, the Company declared and paid cash dividends of $0.20 per common share in the aggregate amount of $43.2 million. The declaration and payment of future dividends is at the discretion of the Board of Directors and will be made based on the Company’s financial position and other factors relevant at the time. The Company expects to declare comparable cash dividends in the future, with increases to the amount of cash dividends declared as possible based on the Company's financial position going forward.
Performance Graph
The following performance graph compares the performance of our common shares during the period beginning December 31, 2016 and ending December 31, 2021 to the S&P 500 and the S&P 500 Gold Index. The graph assumes a $100 investment in our common shares and in each of the indexes since the beginning of the period, and a reinvestment of dividends paid on such investments on a quarterly basis throughout the period.
| | | | | | | | | | | | | | | | | | | | |
| 12/31/2016 | 12/31/2017 | 12/31/2018 | 12/31/2019 | 12/31/2020 | 12/31/2021 |
| SSR Mining Inc. | $100.00 | $98.54 | $135.54 | $215.92 | $225.45 | $201.02 |
| S&P/TSX Global Gold Index | $100.00 | $100.62 | $96.16 | $134.52 | $162.38 | $150.31 |
| S&P 500 Gold (Sub Ind) | $100.00 | $110.13 | $101.70 | $130.71 | $180.17 | $186.58 |
The share performance information above is “furnished” and shall not be deemed to be “soliciting material” or subject to Rule 14A of the Exchange Act, shall not be deemed “filed” for purposes of Section 18 of the Exchange Act or otherwise subject to the liabilities of that section, and shall not be deemed incorporated by reference in any filing under the Securities Act or the Exchange Act, whether made before or after the date of this Annual Report and irrespective of any general incorporation by reference language in any such filing, except to the extent that it specifically incorporates the information by reference.
Exchange Controls
Canada has no system of exchange controls. There are no Canadian restrictions on the repatriation of capital or earnings of a Canadian public company to non-resident investors. There are no laws in Canada or exchange restrictions affecting the remittance of dividends, profits, interest, royalties and other payments to non-resident holders of the Company’s securities, except as discussed in “Canadian Federal Income Tax Considerations” below.
There are no limitations under the laws of Canada or in the organizing documents of the Company on the right of foreigners to hold or vote securities of the Company, except that the Investment Canada Act may require review and approval by the Minister of Industry (Canada) of certain acquisitions of “control” of the Company by a “non-Canadian.” “Non-Canadian” generally means an individual who is not a Canadian citizen, or a corporation, partnership, trust or joint venture that is ultimately controlled by non-Canadians.
Certain United States Federal Income Tax Considerations for U.S. Holders
There may be material U.S. federal income tax consequences to U.S. holders in relation to an acquisition or disposition of common shares or other securities of the Company. U.S. holders should consult their own legal, accounting and tax advisors regarding such tax consequences under United States, state, local or foreign tax law regarding the acquisition or disposition of our common shares or other securities, in particular the tax consequences if the Company becomes a “passive foreign investment company” (commonly known as a “PFIC”) within the meaning of Section 1297 of the United States Internal Revenue Code.
U.S. Resident Holders whose shares are taxable Canadian property should consult their own tax advisors.
Canadian Federal Income Tax Considerations
This summary is applicable to a holder or prospective purchaser of common shares who, for the purposes of the Income Tax Act (Canada) and any applicable treaty and at all relevant times, is not (and is not deemed to be) resident in Canada, does not (and is not deemed to) use or hold the common shares in, or in the course of, carrying on a business in Canada, and is not an insurer that carries on an insurance business in Canada and elsewhere.
This summary is based on the current provisions of the Income Tax Act (Canada), the regulations thereunder, all specific proposals to amend such Act and regulations publicly announced by or on behalf of the Minister of Finance (Canada) prior to the date hereof and the Company’s understanding of the administrative policies and assessing practices published in writing by the Canada Revenue Agency prior to the date hereof. This summary does not otherwise take into account any change in law or administrative policy or assessing practice, whether by judicial, governmental, legislative or administrative decision or action, nor does it take into account other federal or provincial, territorial or foreign tax consequences, which may vary from the Canadian federal income tax considerations described herein.
Currency Conversion
For the purposes of the Income Tax Act (Canada), all amounts relating to the acquisition, holding or disposition of common shares, including dividends and proceeds of disposition must be determined in CAD based on the daily exchange rate of the Bank of Canada on the particular day, or such other rate of exchange as acceptable to the CRA.
Dividends on Common Shares
Canadian withholding tax at a rate of 25.0% (subject to reduction under the provisions of any applicable tax treaty) will be payable on dividends (or amounts paid or credited on account or in lieu of payment of, or in satisfaction of, dividends) paid or credited to a holder of common shares. Under the Canada - U.S. Income Tax Convention (1980), as amended (the “Canada - U.S. Income Tax Treaty”), the withholding tax rate is reduced to 15.0% for a holder who is entitled to the benefits of the Canada - U.S. Income Tax Treaty and who is the beneficial owner of the dividends (or to 5.0% if the holder is a company that owns at least 10.0% of the common shares).
Capital Gains and Losses
Subject to the provisions of any relevant tax treaty, capital gains realized by a holder on the disposition or deemed disposition of common shares held as capital property will not be subject to Canadian tax unless the common shares are taxable Canadian property (as defined in the Income Tax Act (Canada)), in which case the capital gains will be subject to Canadian tax at rates which will approximate those payable by a Canadian resident. Common shares generally will not be taxable Canadian property to a holder provided that, at the time of the disposition or deemed disposition, the common shares are listed on a designated stock exchange (which currently includes the NYSE) unless at any time within the 60 month period immediately preceding such time (a) any combination of (i) such holder, (ii) persons with whom such holder did not deal at arm’s length or (iii) a partnership in which such holder or any such persons holds a membership interest either directly or indirectly through one or more partnerships, owned 25.0% or more of the issued shares of any class or series of shares of the Company and (b) more than 50% of the fair market value of the common shares was derived directly or indirectly from one or any combination of (i) real or immovable property situated in Canada, (ii) Canadian resource properties, (iii) timber resource properties, and (iv) options in respect of, or interests in, or for civil law rights in, property described in any of paragraphs (i) to (iii), whether or not the property exists. In certain circumstances set out in the Income Tax Act (Canada), the common shares may be deemed to be taxable Canadian property. Under the Canada - U.S. Income Tax Treaty, a holder who is entitled to the benefits of the Canada - U.S. Income Tax Treaty and to whom the common shares are taxable, Canadian property will not be subject to Canadian tax on the disposition or deemed disposition of the common shares unless at the time of disposition or deemed disposition, the value of the common shares is derived principally from real property situated in Canada.
ITEM 6. [RESERVE]
ITEM 7. MANAGEMENT’S DISCUSSION AND ANALYSIS OF FINANCIAL CONDITION AND RESULTS OF OPERATIONS
The following Management’s Discussion and Analysis (“MD&A”) provides information that management believes is relevant to an assessment and understanding of the consolidated financial condition and results of operations of SSR Mining Inc. and its subsidiaries (collectively, the “Company”). The Company uses certain non-GAAP financial measures in this MD&A; for a description of each of these measures, please see the discussion under "Non-GAAP Financial Measures" in Part II, Item 7, Management’s Discussion and Analysis herein. This item should be read in conjunction with the Consolidated Financial Statements and the notes thereto included in this annual report.
Overview
SSR Mining is a precious metals mining company with four producing assets located in the United States, Turkey, Canada and Argentina. The Company is primarily engaged in the operation, acquisition, exploration and development of precious metal resource properties located in Turkey and the Americas. The Company produces gold doré as well as copper, silver, lead and zinc concentrates. SSR Mining's diversified asset portfolio is comprised of high-margin, long-life assets located in some of the world's most prolific metal districts.
During the years ended December 31, 2021 and 2020, the COVID-19 pandemic negatively impacted the global economy and certain financial markets. Seabee and Puna were placed into care and maintenance near the end of the first quarter of 2020 and restarted operations during the second and third quarters of 2020, respectively. Çöpler and Marigold's operations were uninterrupted during 2020. While the length and duration of the COVID-19 pandemic, and the impact of any existing variant, continues to remain unknown, all sites have remained operational throughout 2021. The Company continues to restrict non-essential travel, protect the health and safety of its employees and contractors and take necessary steps to reduce the risk of COVID-19 impacting its operations.
On September 16, 2020, the Company completed the business acquisition of Alacer Gold Corp. ("Alacer"). The Company acquired all of the issued and outstanding common shares of Alacer for total consideration of $2,180 million. The financial information included in the following discussion and analysis of financial condition and results of operations for the year ended December 31, 2020, compared to the same periods in 2019, includes the results of the Çöpler operation since September 16, 2020. For further information, see Note 3 to the Consolidated Financial Statements.
On October 21, 2021, the Company completed the sale of a portfolio of 16 royalties and various deferred consideration interests in Turkey and the Americas (the "Royalty Portfolio") to EMX Royalty Corporation (“EMX”). The Company received total consideration of $33.0 million in cash and $34.5 million in equity (12.3 million common shares at $2.80 per share). In addition, the Company will receive up to $34.0 million in contingent cash payments payable upon completion of certain milestones related to the Yenipazar project. For further information, see Note 3 to the Consolidated Financial Statements.
On December 2, 2021, the Company announced an agreement to acquire all the issued and outstanding common shares of Taiga Gold Corporation (“Taiga Gold”) at a price of CAD $0.265 per Taiga Gold share which implies an equity value of approximately $21.0 million. Taiga Gold has announced that it intends to call a meeting of shareholders to be held on or before March 15, 2022 to seek shareholder approval for the transaction. The transaction will require approval of (i) at least 66⅔% of the votes cast by Taiga Gold shareholders and (ii) a simple majority of the votes cast by certain Taiga Gold shareholders, which excludes votes from certain shareholders, as required under Canadian Multilateral Instrument 61-601 - Protection of Minority Securityholders in Special Transactions. The completion of the transaction is also subject to receipt of court, stock exchange and any other regulatory approvals, and is subject to customary closing conditions for transactions of this nature. The agreement provides for non-solicitation covenants with "fiduciary out" provisions that allow Taiga Gold to consider and accept a superior proposal, subject to a "right to match period" in favor of the Company. The agreement also provides for (i) a termination fee of $1.2 million to be paid by Taiga Gold to the Company if the agreement is terminated in certain specified circumstances; and (ii) and expense reimbursement fee of $0.3 million to be paid by the Company to Taiga Gold if the transaction fails to close as a result of specified breaches of the agreement by the Company. The transaction is expected to close in the first half of 2022. For further information, see Note 3 to the Consolidated Financial Statements.
On January 12, 2022, the Company entered into an agreement with Endeavour Silver Corp. ("Endeavour Silver") to sell its Pitarrilla project in Durango, Mexico for consideration consisting of $35.0 million in common shares of Endeavor Silver, $35.0 million in cash, and a 1.25% net smelter returns royalty on the Pitarilla property. The transaction is expected to close in the first half of 2022. Until closing, Pitarrilla will be included in the Company's Exploration, evaluation and development properties segment.
Consolidated Results of Operations
A summary of the Company's consolidated financial and operating results for the years ended December 31, are presented below (in thousands):
| | | | | | | | | | | | | | | | | | | | | | | | | | | | | | | | | | | | | | | | | |
| | Years Ended December 31, | | Change |
| | 2021 | | 2020 | | 2019 | | 2021 (%) | | 2020 (%) |
| Financial Results | | | | | | | | | | | | | |
| Revenue | | $ | 1,474,199 | | | $ | 853,089 | | | $ | 606,850 | | | 72.8 | % | | 40.6 | % |
| Operating income | | $ | 444,375 | | | $ | 188,275 | | | $ | 118,395 | | | 136.0 | % | | 59.0 | % |
Production costs | | $ | 671,374 | | | $ | 444,538 | | | $ | 349,619 | | | 51.0 | % | | 27.1 | % |
| Net income | | $ | 425,922 | | | $ | 157,162 | | | $ | 101,218 | | | 171.0 | % | | 55.3 | % |
| Net income attributable to equity holders of SSR Mining | | $ | 368,076 | | | $ | 151,535 | | | $ | 102,776 | | | 142.9 | % | | 47.4 | % |
| Basic net income per share attributable to equity holders of SSR Mining | | $ | 1.70 | | | $ | 1.00 | | | $ | 0.84 | | | 70.0 | % | | 19.0 | % |
Adjusted attributable net income(1) | | $ | 401,757 | | | $ | 193,401 | | | $ | 82,019 | | | 107.7 | % | | 135.8 | % |
Adjusted basic attributable net income per share (1) | | $ | 1.86 | | | $ | 1.28 | | | $ | 0.67 | | | 45.3 | % | | 91.0 | % |
Adjusted diluted attributable net income per share (1) | | $ | 1.78 | | | $ | 1.21 | | | $ | 0.63 | | | 47.1 | % | | 92.1 | % |
| | | | | | | | | | | | | |
| Operating Results | | | | | | | | | | | | | |
| Gold produced (oz) | | | 683,446 | | | | 418,745 | | | | 331,120 | | | 63.2 | % | | 26.5 | % |
| Gold sold (oz) | | | 689,354 | | | | 413,775 | | | | 331,350 | | | 66.6 | % | | 24.9 | % |
| Silver produced ('000 oz) | | | 8,010 | | | | 5,581 | | | | 7,674 | | | 43.5 | % | | (27.3) | % |
| Silver sold ('000 oz) | | | 7,810 | | | | 4,411 | | | | 7,204 | | | 77.1 | % | | (38.8) | % |
Lead produced ('000 lb) (2) | | | 37,695 | | | | 17,193 | | | | 23,958 | | | 119.2 | % | | (28.2) | % |
Lead sold ('000 lb) (2) | | | 33,378 | | | | 14,179 | | | | 22,886 | | | 135.4 | % | | (38.0) | % |
Zinc produced ('000 lb) (2) | | | 13,642 | | | | 6,988 | | | | 8,392 | | | 95.2 | % | | (16.7) | % |
Zinc sold ('000 lb) (2) | | | 10,751 | | | | 5,111 | | | | 11,794 | | | 110.4 | % | | (56.7) | % |
| | | | | | | | | | | | | |
Gold equivalent produced (oz) (3) | | | 794,456 | | | | 484,153 | | | | 421,828 | | | 64.1 | % | | 14.8 | % |
Gold equivalent sold (oz) (3) | | | 797,602 | | | | 465,471 | | | | 415,383 | | | 71.4 | % | | 12.1 | % |
| | | | | | | | | | | | | |
| Average realized gold price ($/oz sold) | | $ | 1,802 | | | $ | 1,812 | | | $ | 1,394 | | | (0.6) | % | | 30.0 | % |
| Average realized silver price ($/oz sold) | | $ | 24.98 | | | $ | 21.23 | | | $ | 16.26 | | | 17.7 | % | | 30.6 | % |
| | | | | | | | | | | | | |
Production cost per gold equivalent ounce sold | | $ | 842 | | | $ | 955 | | | $ | 842 | | | (11.8) | % | | 13.4 | % |
Cash cost per gold equivalent ounce sold (1, 3) | | $ | 698 | | | $ | 814 | | | $ | 787 | | | (14.3) | % | | 3.4 | % |
AISC per gold equivalent ounce sold (1, 3) | | $ | 955 | | | $ | 1,193 | | $ | 1,078 | | | (19.9) | % | | 10.7 | % |
(1)The Company reports non-GAAP financial measures including adjusted attributable net income, adjusted basic attributable net income per share, cash costs and AISC per ounce sold to manage and evaluate its operating performance at its mines. See "Non-GAAP Financial Measures" for an explanation of these financial measures and a reconciliation of these financial measures to net income and production costs, which are the comparable GAAP financial measures.
(2)Data for lead production and sales relate only to lead in lead concentrate. Data for zinc production and sales relate only to zinc in zinc concentrate.
(3)Gold equivalent ounces have been established using the average realized metal prices per ounce of precious metals sold in the period and applied to the recovered silver metal content produced by the mines. Zinc and lead production are not included in gold equivalent ounces produced.
Revenue
For the year ended December 31, 2021, revenue increased by $621.1 million, or 72.8%, to $1,474.2 million as compared to $853.1 million the year ended December 31, 2020. The increase was mainly due to an increase in gold equivalent ounces sold by 71.4%, partially offset by a 0.6% decrease in average realized gold prices. Changes in sales across the Company's operations were as follows: (i) gold sales at Çöpler increased $402.4 million, (ii) metal sales at Puna increased $123.5 million, (iii) gold sales at Seabee increased $78.6 million and (iv) gold sales at Marigold increased $16.6 million. At Çöpler, gold sales were 195.8% higher in 2021 due to a full year of operations and the results for the year ended December 31, 2020 represent only the results from September 16, 2020 to December 31, 2020, the period for which the Company was entitled to the economic benefits of Çöpler following the Company's acquisition of Alacer. At Seabee and Puna, the increase in revenues in 2021 was due to the impact of the temporary suspensions of operations related to COVID-19 during the year ended December 31, 2020. At Marigold, revenues remained relatively consistent for the year ended December 31, 2021 as compared to the year ended December 31, 2020.
Revenue increased by $246.2 million, or 40.6%, to $853.1 million for the year ended December 31, 2020, as compared to $606.9 million for the year ended December 31, 2019. The increase was mainly due to an increase in gold equivalent ounces sold of 12.1% coupled with a 30.0% increase in average realized gold prices. Changes in sales across the Company's operations were as follows: (i) $205.5 million in gold sales at Çöpler, which was acquired in September 16, 2020, (ii) a $94.4 million increase in gold sales at Marigold, (iii) a decrease of $42.9 million in silver sales at Puna and (iv) a decrease of $10.8 million in gold sales at Seabee. At Çöpler, revenue reflects the first period reporting results from Çöpler following the acquisition of Alacer on September 16, 2020. At Marigold, gold sales revenue was 29.9% higher primarily due to a 28.2% increase in the average realized gold price. At Puna, sales revenue was 29.5% lower primarily due to a 38.8% decrease in the volume of silver ounces sold, partially offset by a 30.6% increase in the average realized silver price. At Seabee, sales revenue was 7.4% lower due to a 27.7% decrease in the volume of gold ounces sold, offset partially by a 28.0% increase in the average realized gold price. The lower sales volumes at Seabee and Puna were due to the impact of the temporary suspensions of operations related to COVID-19.
Production costs
Production costs increased by $226.8 million, or 51.0%, to $671.4 million for the year ended December 31, 2021, as compared to $444.5 million for the year ended December 31. 2020. The increase was primarily due to an additional $143.3 million in production costs at Çöpler during 2021, a 117.8% increase, reflecting a full year of operations during the year ended December 31, 2021 as compared to partial year costs recorded in 2020 from September 16, 2020 through December 31, 2020, following the acquisition of Alacer. The remaining increase is due to higher production costs of $25.8 million at Seabee, $55.1 million at Puna and $2.7 million at Marigold. At Seabee and Puna, production costs increased in 2021 as the sites did not shut down or temporarily suspend operations as the result of COVID-19 as had happened in the year ended December 31, 2020. At Marigold, production costs remained relatively consistent for the year ended December 31, 2021 as compared to the year ended December 31, 2020.
Production costs increased by $94.9 million, or 27.1%, to $444.5 million for the year ended December 31, 2020, as compared to $349.6 million for the year ended December 31, 2019. The increase in production costs was due to the inclusion of $121.6 million in new production costs from Çöpler and an increase of $24.3 million at Marigold, partially offset by a decrease of $45.0 million at Puna and a decrease of $6.1 million at Seabee. At Çöpler, the production costs were new resulting from the acquisition of Alacer on September 16, 2020. At Marigold, production costs increased primarily due to a higher royalty as a result of more ounces produced at a higher average realized gold price. At Seabee and Puna, production costs decreased primarily due to the impact of the temporary suspensions of operations related to COVID-19 during the year ended December 31, 2020.
Depreciation, depletion and amortization
| | | | | | | | | | | | | | | | | | | | | | | | | | | | | | | | | | | | | | |
| Years Ended December 31, | | Change |
| 2021 | | 2020 | | 2019 | | 2021 (%) | | 2020 (%) |
Depreciation, depletion, and amortization ($000s) | $ | 227,959 | | | $ | 109,258 | | | $ | 85,644 | | 108.6 | % | | 27.6 | % |
| Gold equivalent ounces sold | | 797,602 | | | | 465,471 | | | | 415,383 | | 71.4 | % | | 12.1 | % |
Depreciation, depletion, and amortization per gold equivalent ounce sold | $ | 286 | | | $ | 235 | | | $ | 206 | | 21.7 | % | | 14.1 | % |
Depreciation, depletion, and amortization expense increased by $118.7 million, or 108.6%, to $228.0 million for the year ended December 31, 2021 as compared to $109.3 million for the year ended December 31, 2020. At Çöpler, the increase of $91.4 million reflected a full year of operations being included in the results for the year ended December 31, 2021 as compared to the period from September 16, 2020 to December 31, 2020, following the acquisition from Alacer. At Seabee and Puna, depreciation, depletion, and amortization increased primarily due to the impact of the temporary suspensions of operations related to COVID-19 during the year ended December 31, 2020.
Depreciation, depletion, and amortization expense increased by $23.6 million, or 27.6%, to $109.3 million for the year ended December 31, 2020 as compared to $85.6 million for the year ended December 31, 2019. The increase is mainly due to the inclusion of $33.8 million of depreciation, depletion, and amortization from Çöpler, an increase of $0.2 million at Marigold, partially offset by decreases at Puna and Seabee of $2.4 million and $8.0 million, respectively. At Çöpler, the depreciation, depletion, and amortization expense reflects the addition of Çöpler following the acquisition of Alacer on September 16, 2020, adding additional depreciation, depletion and amortization to 2020. At Seabee and Puna, depreciation, depletion, and amortization decreased primarily due to the impact of the temporary suspensions of operations related to COVID-19 during the year ended December 31, 2020.
General and administrative expense
General and administrative expense for the year ended December 31, 2021 was $56.6 million as compared to $33.6 million for the year ended December 31, 2020. General and administrative expenses increased primarily due to a larger combined organization following the acquisition of Alacer that covers more locations and jurisdictions, partially offset by the decrease in stock-based compensation expense primarily related to mark-to-market adjustments for cash-settled units due to changes in the Company's common share price. Further, the insurance market has hardened in 2021 across almost all insurance policy types and the Company is experiencing increased rates as a result of the pricing change in the market.
General and administrative expense for the year ended December 31, 2020 was $33.6 million as compared to $31.1 million for the year ended December 31, 2019. General and administrative expenses increased mainly due to the acquisition of Alacer, partially offset by a decrease in cash-settled stock-based compensation expense as a result of a smaller increase in the Company's common share price during the year ended December 31, 2020 as compared to the year ended December 31, 2019.
Exploration, evaluation and reclamation costs
Exploration, evaluation, and reclamation costs for the year ended December 31, 2021 were $42.4 million as compared to $27.0 million for the year ended December 31, 2020. Exploration and evaluation activity in the year ended December 31, 2020 was restricted by COVID-19. The expenditures incurred during the year ended December 31, 2021 mainly relate to brownfield exploration work at Çöpler, particularly around the Saddle target and Ardich, in addition to work at the Trenton Canyon property of Marigold and work at Seabee. The expenditures incurred during the year ended December 31, 2020 mainly related to greenfield exploration work performed at the Trenton Canyon property of Marigold and Seabee.
Exploration, evaluation, and reclamation costs for the year ended December 31, 2020 were $27.0 million as compared to $22.1 million for the year ended December 31, 2019. The expenditures incurred during the year ended December 31, 2020 mainly related to greenfield exploration work performed at Trenton Canyon property of Marigold, as well as at Çöpler and Seabee. The expenditures incurred during the year ended December 31, 2019 mainly related to greenfield exploration work performed at Trenton Canyon and Seabee.
Care and maintenance expense
Care and maintenance expense for the year ended December 31, 2020 was $29.6 million and no expenses were recognized for the years ended December 31, 2021 and 2019. Care and maintenance expenses of $13.6 million and $16.0 million were recognized at Seabee and Puna, respectively. These costs related to expenses incurred with the temporary suspension of the operations in response to COVID-19 during 2020. During the temporary suspensions, certain costs were incurred at each of the sites to provide care and maintenance activities. These costs were identified and recognized as care and maintenance expenses in the consolidated statements of income.
Impairment of long-lived and other assets
Impairment loss for the year ended December 31, 2021 was $20.3 million and no loss was recognized for the year ended December 31, 2020. The Company recognized an impairment loss related to the Royalty Portfolio sold on October 21, 2021, based on the difference between the carrying amount of the assets within the Royalty Portfolio, and the estimated net transaction price.
Transaction, integration and SEC conversion expense
Transaction, integration and SEC conversion expense for the year ended December 31, 2021 was $11.2 million as compared to $20.8 million for the year ended December 31, 2020. During the year ended December 31, 2021, the Company incurred expenses of $6.9 million associated with the integration activities related to the merger with Alacer and $4.3 million related to the transitional requirements in connection with converting from a foreign private issuer to a domestic filer under SEC reporting requirements. Expenses for the year ended December 31, 2020 of $20.8 million were associated with the acquisition of Alacer. No such expenses were incurred during the year ended December 31, 2019.
Interest expense
Interest expense for the year ended December 31, 2021 was $19.1 million as compared to $13.9 million for the year ended December 2020. The increase is mainly due to the addition of a full year of interest expense incurred in 2021 associated with the Term Loan and the Air Liquide oxygen plant at Çöpler which were assumed as part of the acquisition of Alacer.
Interest expense for the year ended December 31, 2020 was $13.9 million as compared to $12.8 million for the year ended December 31, 2019. The increase is mainly due to the interest expense for the partial year on the Term Loan assumed in the acquisition of Alacer.
Other income (expense)
Other expense for the year ended December 31, 2021 was $14.1 million as compared to income of $31.1 million for the year ended December 31, 2020. The change is mainly due to the fluctuation in fair value of marketable securities. For the years ended December 31, 2021 and 2020, the Company recognized a loss of $10.7 million and a gain of $21.4 million, respectively.
Other income for the year ended December 31, 2020 was $31.1 million as compared to $39.2 million for the year ended December 31, 2019. The decrease is mainly due to the change in fair value of marketable securities. For the years ended December 31, 2020 and 2019, the Company recognized a gain of $21.4 million and a gain of $34.6 million, respectively.
Foreign exchange gain (loss)
Foreign exchange gain for the year ended December 31, 2021 was $3.6 million compared to a loss of $3.7 million for the year ended December 31, 2020. The Company's main foreign exchange exposures are related to net monetary assets and liabilities denominated in TRY, ARS and CAD. During the year ended December 31, 2021, the foreign exchange gain was mainly due to a weakening of the TRY against the USD and its impact on TRY-denominated liabilities at Çöpler, partially offset by a weakening of the ARS against the USD and its impact on ARS-denominated assets at Puna.
Foreign exchange loss for the year ended December 31, 2020 was $3.7 million as compared to $5.1 million for the year ended December 31, 2019. During the year ended December 31, 2020, the foreign exchange loss was mainly due to a weakening of the ARS and its impact on the ARS-denominated assets at Puna, offset partially by a foreign exchange gain on CAD-denominated liabilities during the first quarter of 2020, as the CAD weakened, in addition to a foreign exchange gain on cash and cash equivalents balance during the second and third quarters of 2020 as the CAD strengthened. During the year ended December 31, 2019, the foreign exchange loss was due mainly to a weakening of the ARS and its impact on ARS denominated assets at Puna, as well as a strengthening of the CAD and its impact on CAD denominated assets.
Income and mining tax benefit (expense)
Income and mining tax benefit for the year ended December 31, 2021 was $14.1 million as compared to expense of $43.2 million for the year ended December 31, 2020. The decrease in tax expense in the year ended December 31, 2021 was primarily a result of a remeasurement gain on non-monetary assets denominated in non-functional currencies, primarily resulting from Turkey. In particular there was a significant devaluation of the Lira relative to the U.S. dollar amounting to $116.8 million.
Income and mining tax expense for the year ended December 31, 2020 was $43.2 million as compared to $35.4 million for the year ended December 31, 2019. The increase in tax expense for the year ended December 31, 2020 is primarily a result of increased income from operations.
Results of Operations
Çöpler, Turkey
| | | | | | | | | | | | | | | | | | | | | | | |
| Years Ended December 31, | | |
| Operating Data | 2021 | | 2020 (1) | | Change (%) |
Gold produced (oz) | | 329,276 | | | | 102,616 | | | 220.9 | % |
| Gold sold (oz) | | 333,761 | | | | 108,283 | | | 208.2 | % |
| Average realized gold price ($/oz sold) | $ | 1,800 | | | $ | 1,887 | | | (4.6) | % |
| | | | | | | |
Production costs | $ | 264,889 | | | $ | 121,614 | | | 117.8 | % |
Production costs ($/oz gold sold) | $ | 794 | | | $ | 1,123 | | | (29.3) | % |
| | | | | | | |
Cash costs ($/oz gold sold) (2) | $ | 578 | | | $ | 623 | | | (7.2) | % |
AISC ($/oz gold sold) (2) | $ | 713 | | | $ | 749 | | | (4.8) | % |
(1)The operating data presented in this column represents the period from September 16, 2020 to December 31, 2020, the period for which the Company was entitled to the economic benefits of Çöpler following the Company's acquisition of Alacer.
(2)The Company reports the non-GAAP financial measures of cash costs and AISC per ounce of gold sold to manage and evaluate operating performance at Çöpler. See "Non-GAAP Financial Measures" for an explanation of these financial measures and a reconciliation to production costs, which are the comparable GAAP financial measure. Cash costs and AISC per ounce of gold sold exclude the impact of any fair value adjustment on acquired inventories as of the date of the Company's acquisition of Alacer.
Production and Production Costs
For the year ended December 31, 2021 and the period from September 16, 2020 to December 31, 2020, Çöpler produced 329,276 and 102,616 ounces of gold, respectively. Higher production for the year ended December 31, 2021 reflects a full year of production following the acquisition of Alacer on September 16, 2020. The Çöpler flotation plant construction was completed during the third quarter of 2021 on budget and schedule. The environmental impact assessment was approved in October 2021. Subsequent provincial permitting for the operation of the new facility was completed and the flotation plant was brought online in late December 2021 after the final permit was received.
Production costs for the year ended December 31, 2021 were $264.9 million, a 117.8% increase as compared to the year ended December 31, 2020. The production costs were higher due to the acquisition of Alacer on September 16, 2020.
Cash Costs
For the years ended December 31, 2021 and 2020, cash costs per ounce of gold sold were $578 and $623, respectively. The decrease is mainly due to the increase in ounces sold during the year ended December 31, 2021.
AISC
For the years ended December 31, 2021 and 2020, AISC per ounce of gold sold were $713 and $749, respectively. The decrease is mainly due to the increase in ounces sold during the year ended December 31, 2021.
Marigold, USA
| | | | | | | | | | | | | | | | | | | | | | | | | | | | | | | | | | | | | | |
| Years Ended December 31, | | Change |
| Operating Data | 2021 | | 2020 | | 2019 | | 2021 (%) | | 2020 (%) |
| Gold produced (oz) | | 235,282 | | | | 234,443 | | | | 220,227 | | | 0.4 | % | | 6.5 | % |
| Gold sold (oz) | | 236,847 | | | | 229,892 | | | | 226,823 | | | 3.0 | % | | 1.4 | % |
| Average realized gold price ($/oz sold) | $ | 1,804 | | $ | 1,783 | | | $ | 1,391 | | | 1.2 | % | | 28.2 | % |
| | | | | | | | | | | | |
Production costs | $ | 219,035 | | $ | 216,358 | | | $ | 192,032 | | | 1.2 | % | | 12.7 | % |
Production costs ($/oz gold sold) | $ | 925 | | | $ | 941 | | | $ | 847 | | | (1.7) | % | | 11.1 | % |
| | | | | | | | | | | | |
Cash costs ($/oz gold sold) (1) | $ | 926 | | $ | 938 | | $ | 847 | | (1.3) | % | | 10.7 | % |
AISC ($/oz gold sold) (1) | $ | 1,187 | | $ | 1,205 | | $ | 1,044 | | (1.5) | % | | 15.4 | % |
(1)AISC per ounce of gold sold to manage and evaluate operating performance at Marigold. See "Non-GAAP Financial Measures" for an explanation of these financial measures and a reconciliation to production costs, which are the comparable GAAP financial measure.
Production and Production Costs
Production ounces remained consistent during the year ended December 31, 2021, compared to the same period in 2020. For the year ended December 31, 2020, Marigold produced 234,443 ounces of gold, an increase of 6.5% compared to 220,227 ounces for the year ended December 31, 2019. The increase was due to low stacking elevations throughout 2020 which contributed to faster leach times and a decrease in electrowinning cell inventory during 2020.
Production costs for the year ended December 31, 2021 were $219.0 million, a 1.2% increase as compared to the year ended December 31, 2020. The production costs remained consistent with prior periods. Production costs for the year ended December 31, 2020 were $216.4 million, a 12.7% increase compared to the year ended December 31, 2019. The increase is primarily due to 35.0% higher royalty as a result of 6.5% more ounces produced at a 28.2% higher gold price compared to the prior year.
Cash Costs
Cash costs per ounce of gold sold for the year ended December 31, 2021 were $926, a 1.3% decrease compared to the year ended December 31, 2020. The cash cost per ounce remained consistent with the prior period.
Cash costs per ounce of gold sold for the year ended December 31, 2020 were $938, a 10.7% increase compared to the year ended December 31, 2019, primarily due to an increase in per unit royalty costs due to higher realized gold prices in 2020.
AISC
AISC remained consistent during the year ended December 31, 2021, compared to the same period in 2020.
For the year ended December 31, 2020, AISC per ounce of gold sold was $1,205, a 15.4% increase compared to the year ended December 31, 2019. The increase is primarily due to higher cash costs and an increase in capital expenditures per gold ounce sold. Capital expenditures were higher during the year ended December 31, 2020 compared to the prior period in 2019 due to mobile mine equipment replacements, increased leach pad construction, and dewatering construction costs.
Seabee, Canada
| | | | | | | | | | | | | | | | | | | | | | | | | | | | | | | | | | | | | | |
| Years Ended December 31, | | Change |
| Operating Data | 2021 | | 2020 | | 2019 | | 2021 (%) | | 2020 (%) |
| Gold produced (oz) | | 118,888 | | | 81,686 | | | 110,893 | | 45.5 | % | | (26.3) | % |
| Gold sold (oz) | | 118,746 | | | 75,600 | | | 104,527 | | 57.1 | % | | (27.7) | % |
| Average realized gold price ($/oz sold) | $ | 1,804 | | $ | 1,790 | | $ | 1,398 | | 0.8 | % | | 28.0 | % |
| | | | | | | | | | | | |
Production costs | $ | 66,354 | | | $ | 40,575 | | | $ | 46,627 | | | 63.5 | % | | (13.0) | % |
Production costs ($/oz gold sold) | $ | 559 | | $ | 537 | | $ | 446 | | 4.1 | % | | 20.4 | % |
| | | | | | | | | | | | |
Cash costs ($/oz sold) (1) | $ | 521 | | $ | 522 | | $ | 447 | | (0.2) | % | | 16.8 | % |
AISC ($/oz sold) (1) | $ | 804 | | $ | 1,110 | | $ | 798 | | (27.6) | % | | 39.1 | % |
(1)The Company reports the non-GAAP financial measures of cash costs and AISC per ounce of gold sold to manage and evaluate operating performance at Seabee. See "Non-GAAP Financial Measures" for an explanation of these financial measures and a reconciliation to production costs, which are the comparable GAAP financial measure.
Production and Production Costs
For the year ended December 31, 2021, Seabee produced 118,888 ounces of gold, a 45.5% increase compared to the year ended December 31, 2020. The increase was primarily due to a full year of mill operations in 2021 compared to the mill shut down from March 2020 through August 2020 due to the temporary suspension of operations as a result of COVID-19. For the year ended December 31, 2020, Seabee produced 81,686 ounces of gold, a 26.3% decrease compared to the year ended December 31, 2019. The decrease was primarily due to the mill shut down from March 2020 through August 2020 due to COVID-19 while the mill was fully operational in 2019. In response to the COVID-19 pandemic, Seabee was voluntarily placed into temporary care and maintenance on March 25, 2020 as a precautionary measure to protect the Company's employees, their families, and communities. Through this period, the mine was maintained in a state of operational readiness. The Company commenced a phased restart in June 2020 and the mine was operating at full capacity starting in August 2020.
Production costs for the year ended December 31, 2021 were $66.4 million, a 63.5% increase compared to the year ended December 31, 2020. The increase was primarily due to the temporary suspension of operations in 2020. Production costs for the year ended December 31, 2020 were $40.6 million, a 13.0% decrease as compared to the year ended December 31, 2019. The decrease was primarily due to the temporary suspension of operations in 2020.
Cash Costs
Cash costs per ounce of gold sold remained consistent during the year ended December 31, 2021, compared to the same period in 2020.
Cash costs per ounce of gold sold for the year ended December 31, 2020 were $522 as compared to $447 for the year ended December 31, 2019. The increase in cash costs was primarily due to a 27.7% decrease in gold ounces sold, partially offset by a 13.0% decrease in production costs.
AISC
For the year ended December 31, 2021, AISC per ounce was $804, a 27.6% decrease compared to the year ended December 31, 2020. The decrease is primarily due to a 57.1% increase in gold ounces sold.
For the year ended December 31, 2020, AISC per ounce of gold sold was $1,110, a 39.1% increase compared to the year ended December 31, 2019. The increase is primarily due to a 27.7% decrease in gold equivalent ounces sold while the AISC costs remained consistent with the prior period.
Puna, Argentina
| | | | | | | | | | | | | | | | | | | | | | | | | | | | | | | | | | | | | | |
| Years Ended December 31, | | Change |
| Operating Data | 2021 | | 2020 | | 2019 | | 2021 (%) | | 2020 (%) |
| Silver produced ('000 oz) | | 8,010 | | | | 5,581 | | | | 7,674 | | | 43.5 | % | | (27.3) | % |
| Silver sold ('000 oz) | | 7,810 | | | | 4,411 | | | | 7,204 | | | 77.1 | % | | (38.8) | % |
| Lead produced ('000 lb) | | 37,695 | | | | 17,193 | | | | 23,958 | | | 119.2 | % | | (28.2) | % |
| Lead sold ('000 lb) | | 33,378 | | | | 14,179 | | | | 22,886 | | | 135.4 | % | | (38.0) | % |
| Zinc produced ('000 lb) | | 13,642 | | | | 6,988 | | | | 8,392 | | | 95.2 | % | | (16.7) | % |
| Zinc sold ('000 lb) | | 10,751 | | | | 5,111 | | | | 11,794 | | | 110.4 | % | | (56.7) | % |
Gold equivalent sold ('000 oz) (2) | | 108,248 | | | | 51,696 | | | | 84,033 | | | 109.4 | % | | (38.5) | % |
| Average realized silver price ($/oz) | $ | 25.12 | | | $ | 21.23 | | | $ | 16.26 | | | 18.3 | % | | 30.6 | % |
| | | | | | | | | | | | |
Production costs | $ | 121,096 | | | $ | 65,991 | | | $ | 110,960 | | | 83.5 | % | | (40.5) | % |
| Production costs ($/oz gold equivalent sold) | $ | 1,119 | | | $ | 1,277 | | | $ | 1,320 | | | (12.4) | % | | (3.3) | % |
| | | | | | | | | | | | |
Cash costs ($/oz silver sold) (1) | $ | 10.56 | | | $ | 12.72 | | | $ | 12.24 | | | (17.0) | % | | 3.9 | % |
Cash costs ($/oz gold equivalent sold) | $ | 762 | | | $ | 1,085 | | | $ | 1,049 | | | (29.8) | % | | 3.4 | % |
AISC ($/oz silver sold) (1) | $ | 12.40 | | | $ | 18.56 | | | $ | 13.81 | | | (33.2) | % | | 34.4 | % |
AISC ($/oz gold equivalent sold) | $ | 897 | | | $ | 1,584 | | | $ | 1,184 | | | (43.4) | % | | 33.8 | % |
(1)The Company reports the non-GAAP financial measures of cash costs and AISC per ounce of silver sold to manage and evaluate operating performance at Puna. See "Non-GAAP Financial Measures" for an explanation of these financial measures and a reconciliation to production costs, which are the comparable GAAP financial measure.
(2)Gold equivalent ounces have been established using realized metal prices per ounce of precious metal sold in the period and applied to the recovered metal content of the silver sold by Puna. The Company has not included lead and zinc as they are considered a by-product.
Production
For the year ended December 31, 2021, Puna produced 8.0 million ounces of silver, a 43.5% increase compared to the year ended December 31, 2020. The increase is primarily due to a full year of production in 2021 as compared to the temporary suspension of operations in response to COVID-19 during the second and third quarters of 2020. Lead and zinc production were significantly higher for the same reason. For the year ended December 31, 2020, Puna produced 5,581.2 million ounces of silver, a 27.3% decrease compared to the year ended December 31, 2019. The decrease is primarily due to the temporary suspension of operations in response to COVID-19 during the second and third quarters of 2020 and a full year of operations in 2019.
Production costs for the year ended December 31, 2021 were $121.1 million a 83.5% increase compared to the year ended December 31, 2020. The increase was primarily due to the temporary suspension of operations in 2020. Production costs for the year ended December 31, 2020 were $66.0 million, a 40.5% decrease as compared to the year ended December 31, 2019. The decrease was primarily due to the temporary suspension of operations in 2020.
Cash Costs
Cash costs per ounce of silver sold for the year ended December 31, 2021 were $10.56, a 17.0% decrease as compared to the year ended December 31, 2020. The decrease is primarily due to the increased silver ounces produced partially offset by increases in operating costs due to increased productivity of mining equipment and higher average daily plant throughput.
Cash costs per ounce of silver sold for the year ended December 31,2020 were $12.72, a 3.9% increase as compared to the year ended December 31, 2019. The increase was primarily due to higher mining unit costs, offset by lower processing and overhead unit costs. Mining costs were higher due to operating inefficiencies through shutdown and start-up phases and an increase in maintenance work performed during the temporary suspensions. The lower processing and overhead unit costs are a result of higher average daily plant throughput and the positive impact of the renegotiation of the natural gas contract.
AISC
For the year ended December 31, 2021, AISC per ounce of silver sold was $12.40, a 33.2% decrease compared to the year ended December 31, 2020. The decrease in per ounce cost is primarily due to a significant increase in volumes produced and sold during 2021. Volumes increased in 2021 primarily due to the temporary suspension of operations in response to COVID-19 during the second and third quarters of 2020.
For the year ended December 31, 2020, AISC per ounce of silver sold was $18.56, a 34.4% increase as compared to the year ended December 31, 2019. The increase is primarily due to higher cash costs per ounce sold, offset partially by lower sustaining capital expenditures. The lower sustaining capital expenditures were mainly due to the deferral of capital projects due to impacts of COVID-19.
Liquidity and Capital Resources
The Company manages its liquidity risk through a rigorous planning, budgeting and forecasting process, which is reviewed and updated on a regular basis, to help determine the funding requirements to support its current operations, expansion and development plans, and by managing its capital structure.
The Company's objectives when managing capital are to:
▪safeguard its ability to continue as a going concern in order to develop and operate its current projects and pursue strategic growth initiatives; and
▪maintain a flexible capital structure which lowers its cost of capital.
In assessing capital structure, the Company includes the components of shareholders’ equity, the 2019 Notes, the Term Loan and the Amended Credit Facility. In order to facilitate the management of capital requirements, the Company prepares annual budgets and continuously monitors and reviews actual and forecasted cash flows. The annual budget is monitored and approved by the Company's Board of Directors. To maintain or adjust the capital structure, the Company may, from time to time, issue new shares or debt, repay debt, dispose of non-core assets, or buy back shares. The Company expects its current capital resources will be sufficient to meet its business requirements for a minimum of twelve months.
Cash Dividends
During the year ended December 31, 2021, we declared and paid cash dividends of $0.20 per common share in the aggregate amount of $43.2 million.
Share Repurchase Plan/ NCIB
On April 19, 2021, the Board authorized a share repurchase plan, pursuant to which the Company may purchase in open market transactions, from time to time over the 12-month period commencing April 21, 2021, up to an aggregate of 10,000,000 of our common shares on the Nasdaq Global Select Market, the TSX and/or other exchanges and alternative trading systems in Canada and/or the United States, if eligible, subject to applicable law and stock exchange rules. The price that the Company will pay for common shares in open market transactions will be the market price at the time of purchase or such other price as may be permitted by applicable law or stock exchange rules. During the year ended December 31, 2021, the Company repurchased and cancelled 8,800,700 common shares for $148.1 million under the 2021 Repurchase Plan.
The TSX approved the Company’s notice of intention to commence the NCIB pursuant to which the Company may purchase common shares over the TSX and Nasdaq for the period commencing April 21, 2021 until April 20, 2022 in accordance with the TSX's normal course issuer bid rules, including that such purchases are to be made at prevailing market prices or as otherwise permitted. Under the rules of the TSX, the maximum number of common shares that may be purchased in this period is 10,000,000 (representing 4.5% of the Company’s issued and outstanding common shares as of April 9, 2021), and the maximum number of common shares that may be purchased on a single day on the TSX is 144,221 common shares, which is 25.0% of 576,887 (the average daily trading volume for the common shares on the TSX for the six months ended prior to the TSX's acceptance of the notice of the NCIB), subject to certain exceptions for block purchases, subject in any case to the volume and other limitations under Rule 10b-18. Under the rules of the NASDAQ, the maximum number of common shares that can be purchased on a single day on the Nasdaq is 25.0% of the rolling 4-week average.
Cash and Cash Equivalents
At December 31, 2021, the Company had $1,017.6 million of cash and cash equivalents, an increase of $156.9 million from December 31, 2020, mainly due to positive cash flows generated at each of the Company's operations. The Company held $975.0 million of its cash and cash equivalents balance in USD. Additionally, the Company held cash and cash equivalents of $24.5 million, $12.8 million and $3.0 million in ARS, CAD and TRY, respectively. All cash is invested in short-term investments or high interest savings accounts in accordance with the Company's investment policy with maturities of 90 days or less, providing the Company with sufficient liquidity to meet its foreseeable corporate needs.
Debt
On June 7, 2021, the Company amended its previous Credit Facility which expired on June 8, 2021, increasing the facility size from $75.0 million to $200.0 million and extending the maturity by four years to June 8, 2025. The Amended Credit Facility also includes an accordion feature that increased from $25.0 million to $100.0 million. The Amended Credit Facility may be used by the Company for working capital, reclamation bonding and other general corporate purposes. Amounts drawn under the Amended Credit Facility are subject to variable interest rates at LIBOR plus an applicable margin ranging from 2.00% to 3.00%, based on the Company's net leverage ratio. The Amended Credit Facility contains fallback language that replaces LIBOR with an alternative benchmark rate based on either SOFR or another alternative benchmark rate when LIBOR ceases to exist. Undrawn amounts are subject to a standby fee ranging from 0.40% to 0.60%, based on the Company's net leverage ratio. The Amended Credit Facility is undrawn at December 31, 2021.
The Company's working capital at December 31, 2021, together with future cash flows from operations, are expected to be sufficient to fund planned activities and commitments.
Cash Flows
The following table summarizes the Company's cash flow activity for year ended December 31:
| | | | | | | | | | | | | | | | | | | | | | | | | | |
| Year Ended December 31, |
| 2021 | | | 2020 | | | 2019 |
| Net cash provided by operating activities | $ | 608,986 | | $ | 307,098 | | $ | 118,139 |
| Cash (used in) provided by investing activities | | (129,137) | | | | 240,423 | | | | (114,881) | |
| Cash (used in) provided by financing activities | | (319,769) | | | | (158,374) | | | | 81,469 | |
| Effect of foreign exchange rate changes on cash and cash equivalents | | (3,136) | | | | 789 | | | | 12 | |
| Increase in cash, cash equivalents and restricted cash | | 156,944 | | | | 389,936 | | | | 84,739 | |
| Cash, cash equivalents, and restricted cash, beginning of period | | 895,921 | | | | 505,985 | | | | 421,246 | |
| Cash, cash equivalents, and restricted cash, end of period | $ | 1,052,865 | | $ | 895,921 | | $ | 505,985 |
Cash provided by operating activities
For the year ended December 31, 2021, cash provided by operating activities was $609.0 million compared to $307.1 million for the year ended December 31, 2020. The increase in cash provided by operating activities is mainly due to the impact of higher gold sales across all mine sites including a full year of operations at Çöpler during the year ended December 31, 2021.
For the year ended December 31, 2020, cash provided by operating activities was $307.1 million compared to $118.1 million for the year ended December 31, 2019. The increase in cash provided by operating activities during 2020 was mainly due to the impact of increased gold production due to the acquisition of Alacer, as well as higher average realized gold prices.
Cash (used in) provided by investing activities
For the year ended December 31, 2021, cash used in investing activities was $129.1 million compared to cash provided by investing activities of $240.4 million for the year ended December 31, 2020. The increase in cash used in investing activities is mainly due to increased capital expenditures of $25.8 million and a $85.7 million reduction in proceeds from sales of marketable securities, partially offset from the proceeds of $32.6 million from the royalty portfolio sale in 2021. Furthermore, the Company acquired cash, cash equivalents, and restricted cash of $303.4 million in connection with the acquisition of Alacer during 2020.
For the year ended December 31, 2020, cash provided by investing activities was $240.4 million compared to cash used in investing activities of $114.9 million for the year ended December 31, 2019. The increase in cash provided is mainly due to the acquisition of cash, cash equivalents, and restricted cash on the acquisition of Alacer on September 16, 2021 and higher proceeds from marketable securities, partially offset by increased capital expenditures in 2020.
Cash (used in) provided by financing activities
For the year ended December 31, 2021, cash used in financing activities was $319.8 million compared to $158.4 million for the years ended December 31, 2020. The increase in cash used in financing activities is mainly due to the repurchase and cancellation of shares under the 2021 Repurchase Plan and dividends paid in 2021 compared to the redemption of the 2013 Notes and higher debt payments in 2020.
For the year ended December 31, 2020, cash used in financing activities was $158.4 million compared to cash provided by financing activities of $81.5 million for the year ended December 31, 2019. The increase in cash used in financing activities is mainly due to the proceeds from the issuance of the 2019 Notes in 2019 and higher debt payments in 2020.
Contractual Obligations
The Company enters into contracts in the normal course of business that give rise to commitments for future minimum payments. The following table summarizes the contractual obligations of the Company's financial liabilities, operating and capital commitments:
| | | | | | | | | | | | | | | | | | | | | | | | | | |
| | December 31, 2021 |
| (in thousands) | Current | | Non-current | | Total |
| Accounts payable and accrued liabilities | $ | 179,506 | | | $ | — | | $ | 179,506 | |
| Convertible notes (principal portion) | | — | | | 230,000 | | | 230,000 |
| Term Loan and other debt (principal portion) | | 70,000 | | | 70,000 | | | 140,000 |
| Interest payments on debt | | 1,093 | | | 918 | | | 2,011 |
| Lease liabilities | | 14,677 | | | 111,490 | | | 126,167 |
| Reclamation liabilities | | 2,384 | | | 122,660 | | | 125,044 |
| Operating expenditure commitments | | 3,456 | | | 752 | | | 4,208 |
| Capital expenditure commitments | | 12,368 | | | 2,137 | | | 14,505 |
| Other | | — | | | — | | | — |
Total contractual obligations | $ | 283,484 | | $ | 537,957 | | $ | 821,441 |
The Company believes working capital as of December 31, 2021, together with future cash flows from operations, are sufficient to support its commitments through 2022.
Non-GAAP Financial Measures
The Company has included certain non-GAAP financial measures to assist in understanding the Company's financial results. The non-GAAP financial measures are employed by the Company to measure its operating and economic performance and to assist in decision-making, as well as to provide key performance information to senior management. The Company believes that, in addition to conventional measures prepared in accordance with GAAP, certain investors and other stakeholders will find this information useful to evaluate the Company's operating and financial performance; however, these non-GAAP performance measures do not have any standardized meaning. These performance measures are intended to provide additional information and should not be considered in isolation or as a substitute for measures of performance prepared in accordance with GAAP. These non-GAAP measures should be read in conjunction with the Company's consolidated financial statements.
Non-GAAP Measure - Cash Costs and AISC
The Company uses cash costs per ounce of precious metals sold to monitor its operating performance internally. The most directly comparable measure prepared in accordance with GAAP is production costs. The Company believes this measure provides investors and analysts with useful information about its underlying cash costs of operations and the impact of by-product credits on its cost structure. The Company also believes it is a relevant metric used to understand its operating profitability and ability to generate cash flow. When deriving the production costs associated with an ounce of precious metal, the Company includes by-product credits. Thereby allowing management and other stakeholders to assess the net costs of gold and silver production. In calculating cash costs per ounce, the Company also excludes the impact of specific items that are significant, but not reflective of its underlying operations, including the impact of measuring inventories at fair value in connection with business combinations.
AISC includes total production costs incurred at the Company's mining operations, which forms the basis of cash costs. Additionally, the Company includes sustaining capital expenditures, sustaining mine-site exploration and evaluation costs, reclamation cost accretion and amortization, and general and administrative expenses. This measure seeks to reflect the ongoing cost of gold and silver production from current operations; therefore, expansionary capital and non-sustaining expenditures are excluded. Certain other cash expenditures, including tax payments and financing costs are also excluded.
The Company believes that AISC represents the total costs of producing gold and silver from current operations and provides the Company and other stakeholders with additional information about its operating performance and ability to generate cash flows. It allows the Company to assess its ability to support capital expenditures and to sustain future production from the generation of operating cash flows.
When deriving the number of ounces of precious metal sold, the Company considers the physical ounces available for sale after the treatment and refining process, commonly referred to as payable metal, as this is what is sold to third parties.
AISC includes total production costs incurred at the Company's mining operations, which forms the basis of its cash costs and which are reconciled to reported production costs.
The following tables provide a reconciliation of production costs to cash costs and AISC: | | | | | | | | | | | | | | | | | | | | | | | | | | | | | | | | | | | | | | |
| | Year Ended December 31, 2021 |
(in thousands, unless otherwise noted) | | Çöpler | | Marigold | | Seabee | | Puna | | Corporate | | Total |
| Production costs (GAAP) | | $ | 264,889 | | $ | 219,035 | | $ | 66,354 | | $ | 121,096 | | $ | — | | $ | 671,374 |
| By-product credits | | $ | (5,989) | | $ | (103) | | $ | (94) | | $ | (50,192) | | $ | — | | $ | (56,378) |
| Treatment and refining charges | | $ | — | | $ | 956 | | $ | 394 | | $ | 15,724 | | $ | — | | $ | 17,074 |
Incremental COVID-19 related costs(1) | | $ | — | | $ | (649) | | $ | (4,786) | | $ | (4,151) | | $ | — | | $ | (9,586) |
| Fair value adjustment on acquired inventories | | $ | (65,939) | | $ | — | | $ | — | | $ | — | | $ | — | | $ | (65,939) |
| Cash costs (non-GAAP) | | $ | 192,961 | | $ | 219,239 | | $ | 61,868 | | $ | 82,477 | | $ | — | | $ | 556,545 |
| Sustaining capital expenditures | | $ | 35,015 | | | $ | 57,722 | | | $ | 33,010 | | | $ | 10,458 | | | $ | — | | $ | 136,205 | |
| Sustaining exploration and evaluation expense | | $ | 992 | | $ | 1,572 | | $ | — | | $ | 140 | | $ | — | | $ | 2,704 |
| Reclamation cost accretion and amortization | | $ | 2,395 | | $ | 2,738 | | $ | 642 | | $ | 1,624 | | $ | — | | $ | 7,399 |
| General and administrative expense and stock-based compensation expense | | $ | 6,664 | | $ | (103) | | $ | (28) | | $ | 2,165 | | $ | 50,072 | | $ | 58,770 |
| Total AISC (non-GAAP) | | $ | 238,027 | | $ | 281,168 | | $ | 95,492 | | $ | 96,864 | | $ | 50,072 | | $ | 761,623 |
| | | | | | | | | | | | |
| Gold sold (oz) | | 333,761 | | | 236,847 | | | 118,746 | | | — | | | — | | | 689,354 | |
| Silver sold (oz) | | — | | | — | | | — | | | 7,810,282 | | | — | | | 7,810,282 | |
Gold equivalent sold (oz) (2)(3) | | 333,761 | | | 236,847 | | | 118,746 | | | 108,248 | | — | | | 797,602 | |
| | | | | | | | | | | | |
Production cost per gold equivalent ounce sold | | $ | 794 | | | $ | 925 | | | $ | 559 | | | $ | 1,119 | | | N/A | | $ | 842 | |
| Cash cost per gold ounce sold | | $ | 578 | | | $ | 926 | | | $ | 521 | | | N/A | | N/A | | N/A |
| Cash cost per silver ounce sold | | N/A | | N/A | | N/A | | $ | 10.56 | | | N/A | | N/A |
| Cash cost per gold equivalent ounce sold | | $ | 578 | | | $ | 926 | | | $ | 521 | | | $ | 762 | | | N/A | | $ | 698 | |
| AISC per gold ounce sold | | $ | 713 | | | $ | 1,187 | | | $ | 804 | | | N/A | | N/A | | N/A |
| AISC per silver ounce sold | | N/A | | N/A | | N/A | | $ | 12.40 | | | N/A | | N/A |
| AISC per gold equivalent ounce sold | | $ | 713 | | $ | 1,187 | | $ | 804 | | $ | 895 | | N/A | | $ | 955 |
(1)COVID-19 related costs include direct, incremental costs associated with COVID-19.
(2)Gold equivalent ounces have been established using realized metal prices per ounce of precious metal sold in the period and applied to the recovered metal content of the gold and silver sold by Çöpler, Marigold, Seabee and Puna. The Company has not included lead and zinc as they are considered a by-product.
(3)Gold equivalent ounces sold may not re-calculate based on amounts presented in this table due to rounding.
| | | | | | | | | | | | | | | | | | | | | | | | | | | | | | | | | | | | | | |
| | Year Ended December 31, 2020 |
(in thousands, unless otherwise noted) | | Çöpler | | Marigold | | Seabee | | Puna | | Corporate | | Total |
| Production costs (GAAP) | | $ | 121,614 | | $ | 216,358 | | $ | 40,575 | | $ | 65,991 | | $ | — | | $ | 444,538 |
| By-product credits | | $ | (1,158) | | $ | (53) | | $ | (53) | | $ | (16,018) | | $ | — | | $ | (17,282) |
| Treatment and refining charges | | $ | — | | $ | 214 | | $ | 153 | | $ | 6,601 | | $ | — | | $ | 6,968 |
Incremental COVID-19 related costs (1) | | $ | (1,014) | | $ | (769) | | $ | (1,189) | | $ | (475) | | $ | — | | $ | (3,447) |
| Fair value adjustment on acquired inventories | | $ | (51,931) | | $ | — | | $ | — | | $ | — | | $ | — | | $ | (51,931) |
| Cash costs (non-GAAP) | | $ | 67,511 | | $ | 215,750 | | $ | 39,486 | | $ | 56,099 | | $ | — | | $ | 378,846 |
| Sustaining capital expenditures | | $ | 12,893 | | $ | 55,563 | | $ | 30,325 | | $ | 6,323 | | $ | — | | $ | 105,104 |
| Sustaining exploration and evaluation expense | | $ | 162 | | $ | 2,463 | | $ | — | | $ | 204 | | $ | — | | $ | 2,829 |
Care and maintenance | | $ | — | | | $ | — | | $ | 13,644 | | $ | 15,949 | | $ | — | | $ | 29,593 |
| Reclamation cost accretion and amortization | | $ | 306 | | $ | 2,756 | | $ | 344 | | $ | 1,771 | | $ | — | | $ | 5,177 |
| General and administrative expense and stock-based compensation expense | | $ | 251 | | $ | 435 | | $ | 127 | | $ | 1,520 | | $ | 31,236 | | $ | 33,569 |
| Total AISC (non-GAAP) | | $ | 81,123 | | $ | 276,967 | | $ | 83,926 | | $ | 81,866 | | $ | 31,236 | | $ | 555,118 |
| | | | | | | | | | | | |
| Gold sold (oz) | | 108,283 | | | 229,892 | | | 75,600 | | | — | | | — | | | 413,775 | |
| Silver sold (oz) | | — | | | — | | | — | | | 4,411,087 | | | — | | | 4,411,087 | |
Gold equivalent sold (oz) (2)( 3) | | 108,283 | | | 229,892 | | | 75,600 | | | 51,696 | | | — | | | 465,471 | |
| | | | | | | | | | | | |
Production cost per gold equivalent ounce sold | | $ | 1,123 | | | $ | 941 | | | $ | 537 | | | $ | 1,277 | | | N/A | | $ | 955 | |
| Cash cost per gold ounce sold | | $ | 623 | | | $ | 938 | | | $ | 522 | | | N/A | | N/A | | N/A |
| Cash cost per silver ounce sold | | N/A | | N/A | | N/A | | $ | 12.72 | | | N/A | | N/A |
| Cash cost per gold equivalent ounce sold | | $ | 623 | | | $ | 938 | | | $ | 522 | | | $ | 1,085 | | | N/A | | $ | 814 |
| AISC per gold ounce sold | | $ | 749 | | | $ | 1,205 | | | $ | 1,110 | | | N/A | | N/A | | N/A |
| AISC per silver ounce sold | | N/A | | N/A | | N/A | | $ | 18.56 | | | N/A | | N/A |
| AISC per gold equivalent ounce sold | | $ | 749 | | $ | 1,205 | | $ | 1,110 | | $ | 1,584 | | N/A | | $ | 1,193 |
(1)COVID-19 related costs include direct, incremental costs associated with COVID-19.
(2)Gold equivalent ounces have been established using realized metal prices per ounce of precious metal sold in the period and applied to the recovered metal content of the gold and silver sold by Çöpler, Marigold, Seabee and Puna. The Company has not included lead and zinc as they are considered a by-product.
(3)Gold equivalent ounces sold may not re-calculate based on amounts presented in this table due to rounding.
| | | | | | | | | | | | | | | | | | | | | | | | | | | | | | | | |
| | Year Ended December 31, 2019(1) |
(in thousands, unless otherwise noted) | | Marigold | | Seabee | | Puna | | Corporate | | Total |
| Production costs (GAAP) | | $ | 192,032 | | | $ | 46,627 | | | $ | 110,960 | | | $ | — | | | $ | 349,619 | |
| By-product credits | | $ | (70) | | | $ | (50) | | | $ | (32,988) | | | $ | — | | | $ | (33,108) | |
| Treatment and refining charges | | $ | 259 | | | $ | 127 | | | $ | 10,199 | | | $ | — | | | $ | 10,585 | |
| Cash costs (non-GAAP) | | $ | 192,221 | | | $ | 46,704 | | | $ | 88,171 | | | $ | — | | | $ | 327,096 | |
| Sustaining capital expenditures | | $ | 40,363 | | $ | 33,558 | | $ | 6,672 | | $ | — | | | $ | 80,593 |
| Sustaining exploration and evaluation expense | | $ | 1,250 | | $ | 2,622 | | $ | 786 | | $ | — | | | $ | 4,658 |
| Reclamation cost accretion and amortization | | $ | 2,163 | | $ | 252 | | $ | 2,054 | | $ | — | | | $ | 4,469 |
| General and administrative expense and stock-based compensation expense | | $ | 819 | | $ | 248 | | $ | 1,775 | | $ | 28,266 | | $ | 31,108 |
| Total AISC (non-GAAP) | | $ | 236,816 | | $ | 83,384 | | $ | 99,458 | | $ | 28,266 | | $ | 447,924 |
| | | | | | | | | | |
| Gold sold (oz) | | 226,823 | | | 104,527 | | | — | | | — | | | 331,350 | |
| Silver sold (oz) | | — | | | — | | | 7,204,312 | | | — | | | 7,204,312 | |
Gold equivalent sold (oz) (1)(2) | | 226,823 | | | 104,527 | | | 84,033 | | | — | | | 415,383 | |
| | | | | | | | | | |
| Production cost per gold equivalent ounce sold | | $ | 847 | | | $ | 446 | | | $ | 1,320 | | | N/A | | $ | 842 | |
| Cash cost per gold ounce sold | | $ | 847 | | | $ | 447 | | | N/A | | N/A | | N/A |
| Cash cost per silver ounce sold | | N/A | | N/A | | $ | 12.24 | | | N/A | | N/A |
| Cash cost per gold equivalent ounce sold | | $ | 847 | | | $ | 447 | | | $ | 1,049 | | | N/A | | $ | 787 | |
| AISC per gold ounce sold | | $ | 1,044 | | $ | 798 | | N/A | | N/A | | N/A |
| AISC per silver ounce sold | | N/A | | N/A | | $ | 13.81 | | | N/A | | N/A |
| AISC per gold equivalent ounce sold | | $ | 1,044 | | $ | 798 | | $ | 1,184 | | N/A | | $ | 1,078 |
(1)The operating data presented in this table present results for the entire year ended December 31, 2019. As the Company was not entitled to the economic benefits of Çöpler prior to the acquisition, financial data for the periods prior to September 16, 2020 are not provided.
(2)Gold equivalent ounces have been established using realized metal prices per ounce of precious metal sold in the period and applied to the recovered metal content of the gold and silver sold by Çöpler, Marigold, Seabee and Puna. The Company has not included lead and zinc as they are considered a by-product.
(3)Gold equivalent ounces sold may not re-calculate based on amounts presented in this table due to rounding.
Non-GAAP Measure - Adjusted Attributable Net Income
Adjusted attributable net income and adjusted attributable net income per share are used by management and investors to measure the Company's underlying operating performance. The most directly comparable financial measures prepared in accordance with GAAP are net income attributable to equity holders of SSR Mining and net income per share attributable to equity holders of SSR Mining. Adjusted attributable net income is defined as net income adjusted to exclude the after-tax impact of specific items that are significant, but not reflective of the Company's underlying operations, including the impact of measuring inventories and mineral properties at fair value in connection with business combinations; impairment adjustments and reversals; foreign exchange (gains) losses and inflationary impacts on tax balances; transaction, integration and SEC conversion expenses; changes in tax rate for fair value adjustments and other non-recurring items.
The following table provides a reconciliation of net income attributable to equity holders of SSR Mining to adjusted net income attributable to equity holders of SSR Mining: | | | | | | | | | | | | | | | | | | | | | | | | | | |
| Years Ended December 31, |
(in thousands, except per share) | 2021 | | 2020 | | 2019 |
| Net income attributable to equity holders of SSR Mining (GAAP) | $ | 368,076 | | | $ | 151,535 | | | $ | 102,776 | |
| Interest saving on convertible notes, net of tax | | 4,889 | | | | 4,883 | | | | 3,392 | |
| Net income used in the calculation of diluted net income per share | $ | 372,965 | | | $ | 156,418 | | | $ | 106,168 | |
| | | | | | | | |
| Weighted-average shares used in the calculation of net income and adjusted net income per share | | | | | | | | |
| Basic | | 215,993 | | | | 151,144 | | | | 121,769 | |
| Diluted | | 228,241 | | | | 163,699 | | | | 135,443 | |
| | | | | | | | |
| Net income per share attributable to common stockholders (GAAP) | | | | | | | | |
| Basic | $ | 1.70 | | | $ | 1.00 | | | $ | 0.84 | |
| Diluted | $ | 1.63 | | | $ | 0.96 | | | $ | 0.78 | |
| | | | | | | | |
| Adjustments: | | | | | | | | |
Fair value adjustment on acquired assets(1) | $ | 104,714 | | | $ | 48,893 | | | $ | — | |
COVID-19 related costs (2) | | 9,586 | | | | 3,447 | | | | — | |
| Foreign exchange loss (gain) | | (3,629) | | | | 3,732 | | | | 5,119 | |
| Transaction, integration, and SEC conversion expense | | 11,240 | | | | 20,813 | | | | — | |
| Impairment of long-lived and other assets | | 20,275 | | | | — | | | | — | |
| Changes in fair value of investments | | 10,741 | | | | (21,368) | | | | (34,630) | |
| Loss (gain) on sale of mineral properties, plant and equipment | | (412) | | | | 2,804 | | | | 863 | |
| Loss on redemption of convertible debt | | — | | | | — | | | | 3,044 | |
| Income tax impact related to above adjustments | | (34,120) | | | | (15,144) | | | | 3,197 | |
| Foreign exchange (gain) loss and inflationary impacts on tax balances | | (97,288) | | | | (1,311) | | | | 1,650 | |
| Impact of tax rate change on fair value adjustments | | 12,574 | | | | — | | | | — | |
| Adjusted net income attributable to equity holders of SSR Mining (Non-GAAP) | $ | 401,757 | | $ | 193,401 | | $ | 82,019 |
| | | | | | | | |
| Adjusted net income per share attributable to SSR Mining shareholders (Non-GAAP) | | | | | | | | |
| Basic | $ | 1.86 | | $ | 1.28 | | $ | 0.67 |
| Diluted | $ | 1.78 | | $ | 1.21 | | $ | 0.63 |
(1)Fair value adjustments on acquired assets relate to the acquisition of Alacer's inventories and mineral properties.
(2)COVID-19 related costs include direct, incremental costs associated with COVID-19 at all operations.
Non-GAAP Measure - Earnings Before Interest, Taxes, Depreciation and Amortization ("EBITDA") and Adjusted EBITDA
EBITDA represents net income before interest, taxes, depreciation, and amortization. EBITDA is an indicator of the Company's ability to generate liquidity by producing operating cash flow to fund working capital needs, service debt obligations, and fund capital expenditures.
Adjusted EBITDA represents net income before interest, taxes, depreciation, and amortization, adjusted to exclude the impact of specific items that are significant, but not reflective of the Company's underlying operations, including the impact of measuring inventories at fair value in connection with business combinations; impairment adjustments and reversals; foreign exchange gains (losses); transaction and integration expenses; unrealized gains (losses) on derivatives; and other non-recurring items.
The most directly comparable financial measure prepared in accordance with GAAP to EBITDA and Adjusted EBITDA is net income attributable to equity holders of SSR Mining.
The following is a reconciliation of net income attributable to equity holders of SSR Mining to EBITDA and adjusted EBITDA:
| | | | | | | | | | | | | | | | | | | | | | | | | | |
| Years Ended December 31, |
(in thousands) | 2021 | | 2020 | | 2019 |
| Net income attributable to equity holders of SSR Mining (GAAP) | $ | 368,076 | | | $ | 151,535 | | | $ | 102,776 | |
| Net income (loss) attributable to non-controlling interests | | 57,846 | | | | 5,627 | | | | (1,558) | |
| Depletion, depreciation and amortization | | 227,959 | | | | 109,258 | | | | 85,644 | |
| Interest expense | | 19,097 | | | | 13,876 | | | | 12,771 | |
| Income and mining tax expense (benefit) | | (14,116) | | | | 43,203 | | | | 35,439 | |
| EBITDA (non-GAAP) | | 658,862 | | | | 323,499 | | | | 235,072 | |
Fair value adjustment on acquired inventories (1) | | 65,939 | | | | 51,931 | | | | — | |
COVID-19 related costs (2) | | 9,586 | | | | 3,447 | | | | — | |
| Foreign exchange loss (gain) | | (3,629) | | | | 3,732 | | | | 5,119 | |
| Transaction, integration, and SEC conversion expense | | 11,240 | | | | 20,813 | | | | — | |
| Impairment of long-lived and other assets | | 20,275 | | | | — | | | | — | |
| Changes in fair value of investments | | 10,741 | | | | (21,368) | | | | (34,630) | |
| Loss (gain) on sale of mineral properties, plant and equipment | | (412) | | | | 2,804 | | | | 863 | |
| Loss on redemption of convertible debt | | — | | | | — | | | | 3,044 | |
| Adjusted EBITDA (non-GAAP) | $ | 772,602 | | | $ | 384,858 | | | $ | 209,468 | |
(1)Fair value adjustments on acquired inventories relate to the acquisition of Alacer.
(2)COVID-19 related costs include direct, incremental costs associated with COVID-19 at all operations.
Non-GAAP Measure - Free Cash Flow
The Company uses free cash flow to supplement information in its consolidated financial statements. The most directly comparable financial measures prepared in accordance with GAAP is cash provided by operating activities. The Company believes that in addition to conventional measures prepared in accordance with US GAAP, certain investors and analysts use this information to evaluate the ability of the Company to generate cash flow after capital investments and build the Company's cash resources. The Company calculates free cash flow by deducting cash capital spending from cash generated by operating activities.
The following table provides a reconciliation of cash provided by operating activities to free cash flow:
| | | | | | | | | | | | | | | | | | | | | | | | | | |
| Year Ended December 31, |
(in thousands) | 2021 | | 2020 | | 2019 |
| Cash provided by operating activities (GAAP) | $ | 608,986 | | $ | 307,098 | | $ | 118,139 |
| Expenditures on mineral properties, plant and equipment | | (164,810) | | | | (138,990) | | | | (110,624) | |
| Free cash flow (non-GAAP) | $ | 444,176 | | $ | 168,108 | | $ | 7,515 |
Critical Accounting Estimates
MD&A is based on our consolidated financial statements, which have been prepared in conformity with US GAAP. The preparation of these statements requires that the Company makes estimates and assumptions that affect the reported amounts of assets, liabilities, revenues and expenses. The Company bases these estimates on historical experience and on assumptions that the Company considers reasonable under the circumstances; however, reported results could differ from those based on the current estimates under different assumptions or conditions. The areas requiring the use of management’s estimates are also discussed in Note 2 – Summary of Significant Accounting Policies. The policies identified as being critical to the understanding of our business and results of operations and that require the application of significant management judgment are outlined below.
Recoverable metal in stockpiles and leach pads
The Company estimates the quantity of recoverable metal in stockpiled ore and on leach pads using surveyed volumes of material, ore grades determined through sampling and assaying of blastholes, and estimated recovery rates based on ore type. The quantity of recoverable metal and recovery rates varies based on ore mineralogy, ore grade, ore particle sizes and the percentage of cyanide soluble gold. The estimated recoverable gold ounces placed on the leach pads are periodically reconciled by comparing the related ore to the actual gold ounces recovered (metallurgical balancing). The ultimate recoverable metal or life-of-mine recovery rate is unknown until mining operations cease. Accounting for recoverable metal in stockpiled ore and on leach pads represents a critical accounting estimate because (i) it is impracticable to determine metal contained in stockpiles and leach pads by physical count, thus requiring management to employ reasonable estimation methods and (ii) recovery rates from leach stockpiles can vary significantly. A change in the recovery rate or the quantity of recoverable gold ounces in our stockpiles or ore on leach pads could materially impact our financial statements.
Mineral reserves
Recoverable proven and probable reserves are the part of a mineral deposit that can be economically and legally extracted or produced at the time of the reserve determination. The determination of reserves involves numerous uncertainties with respect to the geology of the ore bodies, including quantities, grades and recovery rates. Estimating the quantity and grade of mineral reserves requires us to determine the size, shape and depth of our ore bodies by analyzing geological data, such as samplings of drill holes, tunnels and other underground workings. In addition to the geology of our mines, assumptions are required to determine the economic feasibility of mining these reserves, including estimates of future commodity prices and demand, the mining methods we use and the related costs incurred to develop and mine our reserves. The Company's estimates of recoverable proven and probable mineral reserves are prepared by and are the responsibility of its employees. These estimates are reviewed and verified regularly by independent experts in mining, geology and reserve determination.
As discussed in Note 2 – Summary of Significant Accounting Policies, the Company depreciates its mineral properties and mine development costs using the units-of-production method based on the estimated recoverable ounces in proven and probable reserves. Because the economic assumptions used to estimate mineral reserves may change from period to period and additional geological data is generated during the course of operations, estimates of reserves may change, which could have a significant impact on our results of operations, including changes to prospective depreciation rates and impairments of long-lived asset carrying values.
Impairment of long-lived assets
The Company assesses the carrying value of its long-lived assets for impairment when events or changes in circumstances indicate that the related carrying amounts of such assets may not be recoverable. Events or circumstances that could indicate that the carrying value of an asset or asset group may not be recoverable include, but are not limited to, significant adverse changes in the business climate including changes in future metal prices, significant changes to the extent or manner in which the asset is being used or its physical condition including significant decreases in production or mineral reserves, and significant decreases in the market price of the assets. In evaluating long-lived assets for recoverability, estimates of undiscounted future cash flows of the Company's mines are used. Estimates of future cash flows are derived from current business plans which are developed using short and long-term metal price assumptions; estimates of costs; resource, reserve and exploration potential estimates, including timing and costs to develop and produce the material; and the use of discount rates in the measurement of fair value. The Company believes its estimates and models used to determine fair value are similar to what a market participant would use.
Goodwill
Goodwill is allocated to reporting units and is tested for impairment annually as of December 31 and when events or circumstances indicate that the carrying value of a reporting unit exceeds its fair value. In testing for goodwill impairment, the Company first evaluates qualitative factors to determine whether the existence of events or circumstances indicate that it is more likely than not that the fair value of a reporting unit is less than its carrying value. If it is determined that it is more likely than not that the carrying value exceeds the fair value, then a quantitative goodwill impairment test is performed by determining the fair value of the reporting unit. The fair value of a reporting unit is determined using either the income approach by utilizing estimates of discounted future cash flows or the market approach utilizing recent transaction activity for comparable properties. Estimates of future cash flows are derived from current business plans which are developed using short and long-term metal price assumptions; estimates of costs; resource, reserve and exploration potential estimates, including timing and costs to develop and produce the material; and the use of discount rates in the measurement of fair value.
Income taxes
Deferred income taxes are accounted for using the asset and liability method. Under this method, deferred tax assets and liabilities are determined by applying the enacted statutory tax rates in effect at the end of a reporting period to the cumulative temporary differences between the tax basis of assets and liabilities and their reported amounts in the Company’s consolidated financial statements. The effect on deferred taxes for a change in tax rates is recognized in income in the period that includes the enactment date.
The Company's operations are in multiple jurisdictions where uncertainties arise in the application of complex tax regulations. Some of these tax regimes are defined by contractual agreements with the local government, while others are defined by general tax laws and regulations. The Company is subject to reviews of its income tax filings and other tax payments, and disputes can arise with the taxing authorities over the interpretation of its contracts or laws.
The Company recognizes potential liabilities and records tax liabilities for anticipated tax audit issues based on our estimate of whether, and the extent to which, additional taxes will be due. These reserves are adjusted in light of changing facts and circumstances; however, due to the complexity of some of these uncertainties, the final resolution may result in a payment that is materially different from the current estimate of the tax liabilities. If the estimated tax liabilities prove to be less than the final assessment, an additional charge to expense would result. If the estimated tax liabilities prove to be greater than the final assessment, a tax benefit would result. In certain jurisdictions, the Company must pay a portion of the disputed amount to the local government in order to formally appeal the assessment. Such payment is recorded as a receivable if the Company believes the amount is ultimately collectible.
A valuation allowance for deferred tax assets is established when it is more likely than not that some portion of the benefit from deferred tax assets will not be realized. In determining the amount of the valuation allowance, the Company considers estimated future taxable income or loss as well as feasible tax planning strategies in each jurisdiction. If the Company determines all or a portion of our deferred income tax assets will not be realized, the valuation allowance will be increased. Conversely, if the Company determines all or a portion of the related benefits for which a valuation allowance has been provided will ultimately be realized, all or a portion of the related valuation allowance will be reduced.
Reclamation liabilities
The Company recognizes a liability for the fair value of estimated future reclamation costs when incurred. Reclamation liabilities are periodically adjusted to reflect changes in the estimated present value resulting from the passage of time and revisions to the estimates of either the timing or amount of reclamation costs. The estimated reclamation liability is based on when spending for an existing disturbance is expected to occur. The Company reviews, on an annual basis, unless otherwise deemed necessary, the reclamation obligation at each mine site.
Remediation costs are accrued based on the Company’s best estimate at the end of each period of the costs expected to be incurred at a site. Accounting for reclamation liabilities requires the Company to make estimates unique to each mining operation of the future costs we will incur to complete the reclamation work required to comply with existing laws and regulations. Any such changes in future costs, the timing of reclamation activities, scope, or the exclusion of certain costs not considered reclamation costs, could materially impact the amounts charged to earnings for reclamation. Additionally, future changes to environmental laws and regulations could increase the extent of reclamation work required.
New Accounting Pronouncements
As of December 31, 2021, the Company has adopted all accounting pronouncements affecting the Company.
Risks and Uncertainties
The mining industry involves many risks including global pandemics which are inherent to the nature of the business, global economic trends and economic, environmental and social conditions in the geographical areas of operation. As a result, the Company is subject to a number of risks and uncertainties, each of which could have an adverse effect on its operating results, business prospects or financial position. The Company continuously assesses and evaluates these risks, seeking to minimize them by implementing high operating standards and processes to identify, assess, report and monitor risk across the organization.
For a comprehensive list of other known risks and uncertainties affecting the business, please refer to the section entitled “Risk Factors” in Part 1, Item 1A.
ITEM 7A. QUANTITATIVE AND QUALITATIVE DISCLOSURES ABOUT MARKET RISK
The Company is exposed to a variety of financial risks as a result of its operations, including market risk (which includes price risk, currency risk and interest rate risk), credit risk, liquidity risk and capital risk. The Company's overall risk management strategy seeks to reduce potential adverse effects on its financial performance. Risk management is carried out under policies approved by the Board of Directors. The Company may, from time to time, use foreign exchange contracts, commodity price contracts, equity hedges and interest rate swaps to manage its exposure to fluctuations in foreign currency, energy or diesel prices, marketable securities values and interest rates.
The risks associated with the Company's financial instruments, and the policies on how the Company mitigates those risks are set out below. This is not intended to be a comprehensive discussion of all risks. There were no significant changes to the Company's exposures to these risks or the management of its exposures during the year ended December 31, 2021.
Market Risk
This is the risk that the fair values of financial instruments will fluctuate due to changes in market prices. The significant market risks to which the Company is exposed are price risk, currency risk and interest rate risk.
Price Risk
The Company sells concentrates produced from its Puna operation on a provisional basis. Provisional concentrate sales contain an embedded derivative that is required to be separated from the host contract for accounting purposes. The embedded derivative is marked to market through earnings each period prior to final settlement. The Company's concentrate metal sales agreements are subject to pricing terms that settle within one to four months after delivery of concentrate. This adjustment period represents the Company's exposure to commodity price risk on its trade receivables. A 10% increase or decrease in the silver price as of December 31, 2021, with all other variables held constant, would have resulted in a $6.7 million increase or decrease to the Company's after-tax net income, respectively.
Currency Risk
Currency risk is the risk that the fair values or future cash flows of the Company's financial instruments will fluctuate because of changes in foreign exchange rates. Exchange rate fluctuations affect the costs the Company incurs at its operations. Gold, silver, lead and zinc are sold in USD and the Company's costs are principally in USD, TRY, CAD and ARS. The appreciation or depreciation of foreign currencies against the USD can increase or decrease the cost of metal production and capital expenditures in USD terms. The Company is also exposed to currency risk arising from cash, cash equivalents and restricted cash held in foreign currencies, marketable securities, accounts receivable and other financial assets, trade and other payables, lease liabilities, other financial liabilities, and current and deferred income and other taxes denominated in foreign currencies. Further, the Company is exposed to currency risk through non-monetary assets and liabilities and tax bases of assets, liabilities and losses of entities whose taxable profit or tax loss are denominated in foreign currencies.
Effective September 2, 2019, Argentina introduced new Central Bank regulations which require export proceeds to be converted into ARS within five business days of such proceeds entering the country. These provisions were intended to be temporary until December 31, 2019; however, the provisions remained in effect as of December 31, 2021. While these provisions remain in effect, the Company is unable to hold funds in Argentina in USD, which has increased its exposure to the ARS.
At December 31, 2021, the Company was primarily exposed to currency risk through the following financial assets and liabilities denominated in foreign currencies:
| | | | | | | | | | | | | | | | | | | | | | | | | | |
| December 31, 2021 |
(in thousands) | TRY | | CAD | | ARS |
| Financial assets | | | | | | | | |
Cash and cash equivalents | $ | 2,968 | | | $ | 12,763 | | | $ | 24,450 | |
Marketable securities | | — | | | | 7,820 | | | | 3,489 | |
Accounts receivable and other financial assets (1) | | 20,004 | | | | 39 | | | | 4,716 | |
| Financial liabilities | | | | | | | | |
Trade and other payables | | (26,782) | | | | (24,954) | | | | (14,374) | |
Lease liabilities (1) | | (4,456) | | | | (278) | | | | — | |
Other financial liabilities | | (4,354) | | | | (236) | | | | — | |
| | $ | (12,620) | | | $ | (4,846) | | | $ | 18,281 | |
| | | | | | | | | | | | | | | | | | | | | | | | | | |
| December 31, 2020 |
(in thousands) | TRY | | CAD | | ARS |
| Financial assets | | | | | | | | |
Cash and cash equivalents | $ | 1,435 | | | $ | 4,556 | | | $ | 3,325 | |
Marketable securities | | — | | | | 25,235 | | | | — | |
Accounts receivable and other financial assets (1) | | 11,435 | | | | 362 | | | | 2,670 | |
| Financial liabilities | | | | | | | | |
Trade and other payables | | (33,263) | | | | (38,569) | | | | (9,289) | |
Lease liabilities (1) | | (6,389) | | | | (293) | | | | — | |
Other financial liabilities | | (3,195) | | | | (13,933) | | | | — | |
| | $ | (29,977) | | | $ | (22,642) | | | $ | (3,294) | |
(1)Includes current and non-current portion.
The Company assessed the impact of a 10% change in the USD exchange rate relative to the ARS and CAD and a 25% change in the USD exchange rate relative to the TRY as of December 31, 2021, on the Company's net income based on the above net financial assets and liabilities. As of December 31, 2021, depreciation of the TRY, CAD, and ARS against the USD would have resulted in an increase to the Company's total net income as follows:
| | | | | | | | |
| (in thousands) | Year Ended December 31, 2021 |
| TRY | $ | 2,524 |
| CAD | $ | 441 |
| ARS | $ | (1,662) | |
Interest Rate Risk
Interest rate risk is the risk that the fair values or future cash flows of the Company's financial instruments will fluctuate because of changes in market interest rates. The Company manages interest rate risk by maintaining an investment policy for short-term investments and cash held in banks, which focuses on preservation of capital and liquidity. As of December 31, 2021, the Company is exposed to interest rate cash flow risk arising from its cash and restricted cash in bank accounts that earn variable interest rates, and interest expense on variable rate borrowings. The Company's variable rate borrowings are comprised of the Term Loan, which is subject to a variable interest rate of LIBOR plus 3.50% to 3.70%, and the Amended Credit Facility, which is subject to a variable interest rate of LIBOR plus 2% to 3%. The Term Loan and Amended Credit Facility contain fallback language that replaces LIBOR with an alternative benchmark rate based on either SOFR or another alternative benchmark rate when LIBOR ceases to exist. The Amended Credit Facility is undrawn at December 31, 2021.
Future net cash flows from interest income on cash, restricted cash, and interest expense on variable rate borrowings will be affected by interest rate fluctuations. To mitigate exposures to interest rate risk, the Company may purchase short-term investments at market interest rates that result in fixed yields to maturity.
As of December 31, 2021, a 1.0% increase or decrease in the LIBOR interest rate, assuming all other variables remained constant, would decrease or increase the Company's after-tax net income for the year ended December 31, 2021 by $1.3 million.
As of December 31, 2021 and 2020, the weighted average interest rate earned on the Company's cash and cash equivalents was 0.14% and 0.16%, respectively. With other variables unchanged, a 1.0% change in the annualized interest rate would impact the Company's after-tax net income by $6.4 million and $4.0 million for the years ended December 31, 2021 and December 31, 2020, respectively.
Credit risk
Credit risk is the risk that the counterparty to a financial instrument will cause a financial loss for the Company by failing to discharge its obligations under the terms of the financial contract. The Company's maximum exposure to credit risk as of December 31, 2021 and December 31, 2020 was as follows (in thousands):
| | | | | | | | | | | | | | | | | |
| December 31, |
| | 2021 | | 2020 |
| Cash and cash equivalents | $ | 1,017,562 | | | $ | 860,633 | |
| Trade receivables | | 73,656 | | | | 38,456 | |
| Value added tax receivable | | 22,456 | | | | 29,899 | |
| Restricted cash | | 35,303 | | | | 35,288 | |
| Other current and non-current financial assets | | 39,335 | | | | 24,898 | |
| | $ | 1,188,312 | | | $ | 989,174 | |
As of December 31, 2021, no amounts were held as collateral except those discussed above related to other financial assets.
In addition, the Company uses surety bonds to support certain environmental bonding obligations. As of December 31, 2021 and 2020, the Company had surety bonds totaling $117.0 million and $117.5 million, respectively, outstanding.
ITEM 8. FINANCIAL STATEMENTS AND SUPPLEMENTARY DATA
Report of Independent Registered Public Accounting Firm
To the Shareholders and Board of Directors of SSR Mining Inc.
Opinions on the Financial Statements and Internal Control over Financial Reporting
We have audited the accompanying consolidated balance sheets of SSR Mining Inc. and its subsidiaries (together, the Company) as of December 31, 2021 and 2020, and the related consolidated statements of operations, cash flows, and statement of changes in equity for each of the three years in the period ended December 31, 2021, including the related notes (collectively referred to as the consolidated financial statements). We also have audited the Company's internal control over financial reporting as of December 31, 2021, based on criteria established in Internal Control – Integrated Framework (2013) issued by the Committee of Sponsoring Organizations of the Treadway Commission (COSO).
In our opinion, the consolidated financial statements referred to above present fairly, in all material respects, the financial position of the Company as of December 31, 2021 and 2020, and the results of its operations and its cash flows for each of the three years in the period ended December 31, 2021 in conformity with accounting principles generally accepted in the United States of America. Also in our opinion, the Company maintained, in all material respects, effective internal control over financial reporting as of December 31, 2021, based on criteria established in Internal Control – Integrated Framework (2013) issued by the COSO.
Basis for Opinions
The Company's management is responsible for these consolidated financial statements, for maintaining effective internal control over financial reporting, and for its assessment of the effectiveness of internal control over financial reporting, included in Management's Report on Internal Control Over Financial Reporting under item 9a. Our responsibility is to express opinions on the Company’s consolidated financial statements and on the Company's internal control over financial reporting based on our audits. We are a public accounting firm registered with the Public Company Accounting Oversight Board (United States) ("PCAOB") and are required to be independent with respect to the Company in accordance with the U.S. federal securities laws and the applicable rules and regulations of the Securities and Exchange Commission and the PCAOB.
We conducted our audits in accordance with the standards of the PCAOB. Those standards require that we plan and perform the audits to obtain reasonable assurance about whether the consolidated financial statements are free of material misstatement, whether due to error or fraud, and whether effective internal control over financial reporting was maintained in all material respects.
Our audits of the consolidated financial statements included performing procedures to assess the risks of material misstatement of the consolidated financial statements, whether due to error or fraud, and performing procedures that respond to those risks. Such procedures included examining, on a test basis, evidence regarding the amounts and disclosures in the consolidated financial statements. Our audits also included evaluating the accounting principles used and significant estimates made by management, as well as evaluating the overall presentation of the consolidated financial statements. Our audit of internal control over financial reporting included obtaining an understanding of internal control over financial reporting, assessing the risk that a material weakness exists, and testing and evaluating the design and operating effectiveness of internal control based on the assessed risk. Our audits also included performing such other procedures as we considered necessary in the circumstances. We believe that our audits provide a reasonable basis for our opinions.
Definition and Limitations of Internal Control over Financial Reporting
A company’s internal control over financial reporting is a process designed to provide reasonable assurance regarding the reliability of financial reporting and the preparation of financial statements for external purposes in accordance with generally accepted accounting principles. A company’s internal control over financial reporting includes those policies and procedures that (i) pertain to the maintenance of records that, in reasonable detail, accurately and fairly reflect the transactions and dispositions of the assets of the company; (ii) provide reasonable assurance that transactions are recorded as necessary to permit preparation of financial statements in accordance with generally accepted accounting principles, and that receipts and expenditures of the company are being made only in accordance with authorizations of management and directors of the company; and (iii) provide reasonable assurance regarding prevention or timely detection of unauthorized acquisition, use, or disposition of the company’s assets that could have a material effect on the financial statements.
Because of its inherent limitations, internal control over financial reporting may not prevent or detect misstatements. Also, projections of any evaluation of effectiveness to future periods are subject to the risk that controls may become inadequate because of changes in conditions, or that the degree of compliance with the policies or procedures may deteriorate.
Critical Audit Matters
The critical audit matter communicated below is a matter arising from the current period audit of the consolidated financial statements that was communicated or required to be communicated to the audit committee and that (i) relates to accounts or disclosures that are material to the consolidated financial statements and (ii) involved our especially challenging, subjective, or complex judgments. The communication of critical audit matters does not alter in any way our opinion on the consolidated financial statements, taken as a whole, and we are not, by communicating the critical audit matter below, providing a separate opinion on the critical audit matter or on the accounts or disclosures to which it relates.
Assessment of impairment indicators of mineral properties, plant and equipment
As described in Note 2 to the consolidated financial statements, the carrying value of mineral properties, plant and equipment is reviewed for impairment whenever events or changes in circumstances indicate that the carrying amounts of the assets or asset groups may not be recoverable (impairment indicators). The carrying amount of the Company’s mineral properties, plant and equipment was $3.2 billion as of December 31, 2021. Management applies judgment to assess whether there are impairment indicators present that give rise to the requirement to conduct an impairment test. Events or changes in circumstances that could trigger an impairment test include (i) significant adverse changes in the business climate including changes in future metal prices; (ii) significant changes in the extent or manner in which the asset is being used or its physical condition including significant decreases in production or mineral reserves; and (iii) significant decreases in the market price of the assets.
The principal considerations for our determination that performing procedures relating to the assessment of impairment indicators of mineral properties, plant and equipment is a critical audit matter are that there was significant judgment by management when assessing whether there were indicators of impairment related to the Company’s mineral properties, plant and equipment, specifically related to assessing whether there were (i) significant adverse changes in the business climate including changes in future metal prices; (ii) significant changes in the extent or manner in which the asset is being used or its physical condition including significant decreases in production or mineral reserves; and (iii) significant decreases in the market price of the assets. This in turn led to a high degree of auditor judgment, subjectivity and effort in performing procedures and evaluating audit evidence related to the judgments made by management in their assessment of impairment indicators that could give rise to the requirement to conduct an impairment test.
Addressing the matter involved performing procedures and evaluating audit evidence in connection with forming our overall opinion on the consolidated financial statements. These procedures included testing the effectiveness of controls relating to management’s assessment of impairment indicators of mineral properties, plant and equipment. These procedures also included, among others, (i) evaluating whether there were significant adverse changes in the business climate including changes in future metal prices by considering external market and industry data; (ii) evaluating whether there were any significant changes in the extent or manner in which the asset is being used or its physical condition including by assessing any significant decreases in production or mineral reserves by considering mineral reserve and resource technical reports and production results compared to historical actuals; and (iii) assessing whether there were significant decreases in the market price of the assets by considering any significant or prolonged declines in the Company’s share price, and evidence obtained in other areas of the audit.
/s/ PricewaterhouseCoopers LLP
Chartered Professional Accountants
Vancouver, Canada
February 23, 2022
We have served as the Company's auditor since 1989.
SSR Mining Inc.
Consolidated Statements of Operations
(in thousands)
| | | | | | | | | | | | | | | | | | | | | | | | | | | | | |
| | Years Ended December 31, |
| | | 2021 | | 2020 | | 2019 |
| Revenue | | $ | 1,474,199 | | | $ | 853,089 | | | $ | 606,850 | |
| Operating Costs and Expenses: | | | | | | | | | |
| Production costs | | | 671,374 | | | | 444,538 | | | | 349,619 | |
| Depreciation, depletion, and amortization | | | 227,959 | | | | 109,258 | | | | 85,644 | |
| General and administrative expense | | | 56,594 | | | | 33,569 | | | | 31,108 | |
| Exploration. evaluation, and reclamation costs | | | 42,382 | | | | 27,043 | | | | 22,084 | |
| Care and maintenance expense | | | — | | | | 29,593 | | | | — | |
| Impairment of long-lived and other assets | | | 20,275 | | | | — | | | | — | |
| Transaction, integration and SEC conversion expense | | | 11,240 | | | | 20,813 | | | | — | |
| Operating income | | | 444,375 | | | | 188,275 | | | | 118,395 | |
| Other income (expense): | | | | | | | | | |
| Interest expense | | | (19,097) | | | | (13,876) | | | | (12,771) | |
| Loss on redemption of convertible debt | | | — | | | | — | | | | (3,044) | |
| Other income (expense) | | | (14,149) | | | | 31,124 | | | | 39,196 | |
| Foreign exchange gain (loss) | | | 3,629 | | | | (3,732) | | | | (5,119) | |
| Total other income (expense) | | | (29,617) | | | | 13,516 | | | | 18,262 | |
| Income before income and mining taxes | | | 414,758 | | | | 201,791 | | | | 136,657 | |
| Income and mining tax benefit (expense) | | | 14,116 | | | | (43,203) | | | | (35,439) | |
| Equity income (loss) of affiliates | | | (2,952) | | | | (1,426) | | | | — | |
| Net income | | | 425,922 | | | | 157,162 | | | | 101,218 | |
| Net loss (income) attributable to non-controlling interest | | | (57,846) | | | | (5,627) | | | | 1,558 | |
| Net income attributable to SSR Mining shareholders | | $ | 368,076 | | | $ | 151,535 | | | $ | 102,776 | |
| | | | | | | | | |
| Net income per share attributable to SSR Mining shareholders | | | | | | | | | |
| Basic | | $ | 1.70 | | | $ | 1.00 | | | $ | 0.84 | |
| Diluted | | $ | 1.63 | | | $ | 0.96 | | | $ | 0.78 | |
The accompanying notes are an integral part of the Consolidated Financial Statements.
SSR Mining Inc.
Consolidated Statements of Cash Flows
(in thousands)
| | | | | | | | | | | | | | | | | | | | | | | | | | |
| | Years Ended December 31, |
| 2021 | | 2020 | | 2019 |
| Operating activities | | | | | | | | |
| Net income | $ | 425,922 | | | $ | 157,162 | | | $ | 101,218 | |
| Adjustments for: | | | | | | | | |
| Depletion, depreciation, and amortization | | 227,959 | | | | 109,258 | | | | 85,644 | |
| Amortization of debt discount | | 948 | | | | 938 | | | | 1,611 | |
| Reclamation costs | | 4,821 | | | | 3,815 | | | | 3,729 | |
| Deferred income taxes | | (130,570) | | | | 20,659 | | | | 10,643 | |
| Loss on redemption of convertible debt | | — | | | | — | | | | 3,044 | |
| Stock-based compensation | | 14,799 | | | | 15,851 | | | | 14,424 | |
| Equity pickup on investments in joint ventures | | 2,952 | | | | 1,426 | | | | — | |
| Unrealized loss (gain) on derivative instruments | | (5,093) | | | | 5,215 | | | | (2,238) | |
| Change in fair value of marketable securities | | 10,741 | | | | (21,368) | | | | (34,630) | |
Non-cash fair value adjustment on acquired inventories | | 65,939 | | | | 51,930 | | | | — | |
| Loss (gain) on sale of mineral properties, plant and equipment | | (412) | | | | 2,804 | | | | 863 | |
| Impairment of long-lived and other assets | | 20,275 | | | | — | | | | — | |
| Net change in operating assets and liabilities | | (29,295) | | | | (40,592) | | | | (66,169) | |
| Net cash provided by (used in) operating activities | | 608,986 | | | | 307,098 | | | | 118,139 | |
| Investing activities | | | | | | | | |
| Additions to mineral properties, plant and equipment | | (164,810) | | | | (138,990) | | | | (110,624) | |
| Purchases of marketable securities | | (10,086) | | | | (29,550) | | | | (3,435) | |
| Proceeds on Royalty Portfolio sale | | 32,600 | | | | — | | | | — | |
| Net proceeds from sales of marketable securities | | 11,396 | | | | 97,098 | | | | 3,308 | |
| Proceeds from sale of mineral properties, plant and equipment | | 2,505 | | | | 8,537 | | | | 1,214 | |
| Acquisition of non-controlling interest | | — | | | | — | | | | (2,415) | |
| Acquisition of Alacer, cash, cash equivalents and restricted cash | | — | | | | 303,388 | | | | — | |
| Other investing activities | | (742) | | | | (60) | | | | (2,929) | |
| Net cash provided by (used in) investing activities | | (129,137) | | | | 240,423 | | | | (114,881) | |
SSR Mining Inc.
Consolidated Statements of Cash Flows
(in thousands)
| | | | | | | | | | | | | | | | | | | | | | | | | | |
| Years Ended December 31, |
| 2021 | | 2020 | | 2019 |
| Financing activities | | | | | | | | |
| Repayment of debt, principal | $ | (70,000) | | | $ | (35,000) | | | $ | — | |
| Redemption of convertible notes | | — | | | | (114,994) | | | | (152,250) | |
| Proceeds from issuance of convertible notes, net of transaction costs | | — | | | | — | | | | 222,932 | |
| Proceeds from issuance of debt | | — | | | | 3,087 | | | | — | |
| Proceeds from exercise of stock options | | 8,778 | | | | 6,545 | | | | 7,875 | |
| Purchase and cancellation of common shares | | (148,075) | | | | — | | | | — | |
| Dividends paid | | (43,233) | | | | — | | | | — | |
| Settlement of restricted and performance share units | | 408 | | | | (14,389) | | | | 60 | |
| Funding from non-controlling interest | | — | | | | — | | | | 3,710 | |
| Non-controlling interest dividend | | (55,464) | | | | — | | | | — | |
| Principal payments on finance leases | | (10,441) | | | | (3,623) | | | | (554) | |
| Other financing activities | | (1,742) | | | | — | | | | (304) | |
| Net cash provided by (used in) financing activities | | (319,769) | | | | (158,374) | | | | 81,469 | |
| Effect of foreign exchange rate changes on cash, cash equivalents and restricted cash | | (3,136) | | | | 789 | | | | 12 | |
| Net increase (decrease) in cash, cash equivalents, and restricted cash | | 156,944 | | | | 389,936 | | | | 84,739 | |
| Cash, cash equivalents, and restricted cash beginning of year | | 895,921 | | | | 505,985 | | | | 421,246 | |
| Cash, cash equivalents, and restricted cash end of year | $ | 1,052,865 | | $ | 895,921 | | | $ | 505,985 | |
| | | | | | | | |
| Reconciliation of cash, cash equivalents, and restricted cash: | | | | | | | | |
| Cash and cash equivalents | $ | 1,017,562 | | $ | 860,633 | | | $ | 503,647 | |
| Restricted cash | | 35,303 | | | 35,288 | | | | 2,338 | |
| Total cash, cash equivalents, and restricted cash | $ | 1,052,865 | | $ | 895,921 | | | $ | 505,985 | |
The accompanying notes are an integral part of the Consolidated Financial Statements.
SSR Mining Inc.
Consolidated Balance Sheets
(in thousands)
| | | | | | | | | | | | | | | | | |
| | December 31, |
| 2021 | | 2020 |
| ASSETS | | | | | |
| Cash and cash equivalents | $ | 1,017,562 | | | $ | 860,633 | |
| Marketable securities | | 40,431 | | | | 26,748 | |
| Trade and other receivables | | 121,356 | | | | 83,218 | |
| Inventories | | 389,416 | | | | 437,034 | |
| Prepaids and other current assets | | 31,549 | | | | 16,162 | |
| Total current assets | | 1,600,314 | | | | 1,423,795 | |
| | | | | |
| Mineral properties, plant and equipment, net | | 3,249,764 | | | | 3,469,739 | |
| Inventories | | 221,617 | | | | 135,200 | |
| Restricted cash | | 35,303 | | | | 35,288 | |
| Equity method investments | | 4,918 | | | | 7,782 | |
| Goodwill | | 49,786 | | | | 49,786 | |
| Deferred income tax assets | | 8,501 | | | | 15,072 | |
| Other non-current assets | | 41,235 | | | | 40,682 | |
| Total assets | $ | 5,211,438 | | | $ | 5,177,344 | |
| | | | | |
| LIABILITIES | | | | | |
Accounts payable | $ | 34,844 | | | $ | 42,923 | |
Accrued liabilities and other | | 165,108 | | | | 131,781 | |
| Finance lease liabilities | | 12,439 | | | | 3,568 | |
Current portion of debt | | 71,491 | | | | 71,025 | |
| Total current liabilities | | 283,882 | | | | 249,297 | |
| | | | | |
| Debt | | 295,493 | | | | 366,612 | |
| Finance lease liabilities | | 105,965 | | | | 109,544 | |
| Reclamation liabilities | | 122,660 | | | | 102,721 | |
| Deferred income tax liabilities | | 338,788 | | | | 473,027 | |
| Other non-current liabilities | | 12,133 | | | | 25,655 | |
| Total liabilities | | 1,158,921 | | | | 1,326,856 | |
| | | | | |
| Contingently redeemable shares | | — | | | | 3,311 | |
| | | | | |
| EQUITY | | | | | |
Common shares – unlimited authorized common shares with no par value; 211,879 and 219,607 shares issued and outstanding as of December 31, 2021 and December 31, 2020, respectively | | 3,140,189 | | | | 3,242,821 | |
| Retained earnings | | 397,667 | | | | 92,077 | |
| SSR Mining’s shareholders’ equity | | 3,537,856 | | | | 3,334,898 | |
| Non-controlling interest | | 514,661 | | | | 512,279 | |
| Total equity | | 4,052,517 | | | | 3,847,177 | |
| Total liabilities and equity | $ | 5,211,438 | | | $ | 5,177,344 | |
The accompanying notes are an integral part of the Consolidated Financial Statements.
SSR Mining Inc.
Consolidated Statement of Changes of Equity
(in thousands)
| | | | | | | | | | | | | | | | | | | | | | | | | | | | | | | | | | | | | | | | | | | | | | | | | | | | | | | | | | | | | | |
| | Common shares | | | |
| | Number of shares | | Amount | | Retained earnings (Accumulated Deficit) | | Total equity attributable to equity holders of SSR Mining | | Non-controlling interest | | Total equity | | | Contingently redeemable shares |
| Balance January 1, 2019 | 120,740 | | | $ | 1,074,821 | | | $ | (163,191) | | | $ | 911,630 | | | $ | 31,829 | | | $ | 943,459 | | | | $ | — | |
| Exercise of stock options | 1,094 | | | | 7,875 | | | | — | | | | 7,875 | | | | — | | | | 7,875 | | | | | — | |
| Settlement of RSUs | 4 | | | | 60 | | | | — | | | | 60 | | | | — | | | | 60 | | | | | — | |
| Acquisition of non-controlling interest | 1,246 | | | | 19,681 | | | | — | | | | 19,681 | | | | (33,981) | | | | (14,300) | | | | | — | |
| Equity-settled stock-based compensation | — | | | | 3,397 | | | | — | | | | 3,397 | | | | — | | | | 3,397 | | | | | — | |
| Transfer of equity-settled PSUs | — | | | | 1,356 | | | | — | | | | 1,356 | | | | — | | | | 1,356 | | | | | — | |
| Reclassification of contingently redeemable shares | — | | | | (3,599) | | | | — | | | | (3,599) | | | | — | | | | (3,599) | | | | | 3,599 | |
| Funding from non-controlling interest | — | | | | — | | | | — | | | | — | | | | 3,710 | | | | 3,710 | | | | | — | |
| Net income (loss) | — | | | | — | | | | 102,776 | | | | 102,776 | | | | (1,558) | | | | 101,218 | | | | | — | |
| Balance December 31, 2019 | 123,084 | | $ | 1,103,591 | | $ | (60,415) | | $ | 1,043,176 | | $ | — | | $ | 1,043,176 | | | $ | 3,599 |
| Acquisition of Alacer | 95,700 | | | | 2,142,703 | | | | — | | | | 2,142,703 | | | | 506,652 | | | | 2,649,355 | | | | | |
| Exercise of stock options | 825 | | | | 6,545 | | | | — | | | | 6,545 | | | | — | | | | 6,545 | | | | | — | |
| Settlement of RSUs and PSUs | — | | | | (15,557) | | | | 1,168 | | | | (14,389) | | | | — | | | | (14,389) | | | | | — | |
| Transfer of cash-settled RSUs and PSUs | — | | | | (4,138) | | | | 900 | | | | (3,238) | | | | — | | | | (3,238) | | | | | — | |
| Equity-settled stock-based compensation | — | | | | 8,677 | | | | — | | | | 8,677 | | | | — | | | | 8,677 | | | | | — | |
| Reclassification of contingently redeemable shares | — | | | | 288 | | | | — | | | | 288 | | | | — | | | | 288 | | | | | (288) | |
| Other | (2) | | | | 712 | | | | (1,111) | | | | (399) | | | | — | | | | (399) | | | | | — | |
| Net income (loss) | — | | | | — | | | | 151,535 | | | | 151,535 | | | | 5,627 | | | | 157,162 | | | | | — | |
| Balance December 31, 2020 | 219,607 | | | $ | 3,242,821 | | | $ | 92,077 | | $ | 3,334,898 | | $ | 512,279 | | $ | 3,847,177 | | | $ | 3,311 |
| Repurchase of common shares | (8,801) | | | | (129,052) | | | | (19,023) | | | | (148,075) | | | | — | | | | (148,075) | | | | | — | |
| Exercise of stock options | 818 | | | | 8,778 | | | | — | | | | 8,778 | | | | — | | | | 8,778 | | | | | — | |
| Settlement of RSUs and PSUs | 255 | | | | 408 | | | | — | | | | 408 | | | | — | | | | 408 | | | | | — | |
| Transfer of equity settled RSUs | — | | | | 8,802 | | | | — | | | | 8,802 | | | | — | | | | 8,802 | | | | | — | |
| Equity-settled stock-based compensation | — | | | | 5,121 | | | | — | | | | 5,121 | | | | — | | | | 5,121 | | | | | — | |
| Reclassification of contingently redeemable shares | — | | | | 3,311 | | | | — | | | | 3,311 | | | | — | | | | 3,311 | | | | | (3,311) | |
| Dividends paid to equity holders of SSR Mining | — | | | | — | | | | (43,233) | | | | (43,233) | | | | — | | | | (43,233) | | | | | — | |
| Dividends paid to non-controlling interest | — | | | | — | | | | — | | | | — | | | | (55,464) | | | | (55,464) | | | | | — | |
| Other | — | | | | — | | | | (230) | | | | (230) | | | | — | | | | (230) | | | | | — | |
| Net income (loss) | — | | | | — | | | | 368,076 | | | | 368,076 | | | | 57,846 | | | | 425,922 | | | | | — | |
| Balance December 31, 2021 | 211,879 | | | $ | 3,140,189 | | | $ | 397,667 | | $ | 3,537,856 | | $ | 514,661 | | $ | 4,052,517 | | | $ | — |
The accompanying notes are an integral part of the Consolidated Financial Statements.
SSR Mining Inc.
Notes to Consolidated Financial Statements
1.THE COMPANY
SSR Mining Inc. and its subsidiaries (collectively, "SSR Mining," or the "Company”) is incorporated under the laws of the Province of British Columbia, Canada. The Company's common shares are listed on the Toronto Stock Exchange ("TSX") in Canada and the Nasdaq Global Select Market ("NASDAQ") in the United States under the symbol "SSRM" and the Australian Securities Exchange (ASX) in Australia under the symbol "SSR."
The Company is principally engaged in the operation, acquisition, exploration and development of precious metal resource properties located in Turkey and the Americas. The Company has four producing mines in Turkey, the United States, Canada, and Argentina. The Company's focus is on safe, profitable gold and silver production from its Çöpler Gold Mine ("Çöpler") in Erzincan, Turkey, Marigold mine ("Marigold") in Nevada, USA, Seabee Gold Operation ("Seabee") in Saskatchewan, Canada and Puna Operations ("Puna") in Jujuy, Argentina, and to advance, as market and project conditions permit, its principal development projects towards development and commercial production.
2.SUMMARY OF SIGNIFICANT ACCOUNTING POLICIES
The significant accounting policies used in the preparation of these consolidated financial statements are as follows:
Risks and uncertainties
As a mining company, the revenue, profitability and future rate of growth of the Company are substantially dependent on the prevailing prices for gold, silver, zinc and lead. The prices of these metals are volatile and affected by many factors beyond the Company’s control, and there can be no assurance that commodity prices will not be subject to wide fluctuations in the future. A substantial or extended decline in commodity prices could have a material adverse effect on the Company’s financial position, results of operations, cash flows, access to capital and the quantities of reserves that the Company can economically produce. The carrying value of the Company’s Mineral properties, plant and equipment; Inventories; Deferred income tax assets; and Goodwill are particularly sensitive to the outlook for commodity prices. A decline in the Company’s price outlook could result in material impairment charges related to these assets.
COVID-19
During the year ended December 31, 2021, the COVID-19 pandemic continued to impact global economic and financial markets, disrupting global supply chains and workforce participation. Many industries and businesses, including the Company, continue to be impacted by the COVID-19 pandemic and face operating challenges associated with the regulations and guidelines resulting from efforts to contain COVID-19.
The Company continues to restrict all non-essential travel and manage the contacts of its employees and contractors in order to reduce the risk of COVID-19 impacting its operations. The Company is operating its corporate offices at reduced capacity, with most employees working remotely.
The Company's mine sites remain operational with carefully managed COVID-19 based restrictions designed to protect communities and employees, including quarantining, testing, ensuring physical distancing and providing additional protective equipment.
SSR Mining Inc.
Notes to Consolidated Financial Statements
Basis of preparation
These consolidated financial statements have been prepared in accordance with accounting principles generally accepted in the United States of America (“U.S. GAAP”). Previously, the Company prepared its consolidated financial statements under International Financial Reporting Standards ("IFRS") as permitted by securities regulators in Canada, as well as in the United States under the status of a Foreign Private Issuer as defined by the United States Securities and Exchange Commission ("SEC"). As of June 30, 2021, the Company determined that it no longer qualified as a Foreign Private Issuer under the SEC rules. As a result, beginning January 1, 2022 the Company is required to report with the SEC on domestic forms and comply with domestic company rules in the United States. The transition to U.S. GAAP was made retrospectively for all periods from the Company’s inception. New accounting standards implemented subsequent to January 1, 2019 were adopted on their required adoption date.
Use of estimates
Preparing financial statements in accordance with U.S. GAAP requires management to make estimates and assumptions that affect the reported amounts of assets and liabilities and disclosure of contingent assets and liabilities at the date of the financial statements and the reported amounts of revenues and expenses during the reporting period. The more significant areas requiring the use of management’s estimates and assumptions relate to mineral reserves that are the basis for future cash flow estimates utilized in impairment calculations and units-of-production depreciation; reclamation liabilities; valuation of assets acquired and liabilities assumed in business combinations; estimates of fair value for certain reporting units and asset impairments (including impairments of long-lived assets and goodwill); estimates of recoverable metal in stockpile and leach pad inventories; estimates of the net realizable value of inventory, stockpiles and ore on leach pads; and estimates of deferred tax assets and liabilities. The Company has based its estimates on historical experience and various other assumptions that it believes to be reasonable. Accordingly, actual results may differ materially from these estimates under different assumptions or conditions. Changes in facts and circumstances may alter such estimates and affect the results of operations and financial position in future periods.
Principles of consolidation
These consolidated financial statements include the accounts of SSR Mining Inc., its wholly owned subsidiaries, and variable interest entities (“VIEs”) in which it is the primary beneficiary. Intercompany assets, liabilities, equity, income, expenses, and cash flows between SSR Mining Inc. and its subsidiaries have been eliminated on consolidation. Investments in joint ventures in which the Company has significant influence and VIEs where the Company is not the primary beneficiary are accounted for under the equity method of accounting.
Operating segments
The Company has five reportable segments for financial reporting purposes: Çöpler, Marigold, Seabee, Puna and the exploration, evaluation and development properties. Çöpler, Marigold, Seabee and Puna segments represent the Company's four operating mine sites. The exploration, evaluation and development properties segment represents a portfolio of prospective exploration tenures, both near or adjacent to the existing operations (near-mine) and greenfield standalone prospects, across Turkey, the U.S., Canada, Mexico and Peru. For further information refer to Note 4.
Business combinations
The Company recognizes and measures the assets acquired and liabilities assumed in a business combination based on their estimated fair values at the acquisition date, while transaction and integration costs are expensed as incurred. Any excess of the purchase consideration when compared to the fair value of the net tangible and intangible assets acquired, if any, is recorded as goodwill. For material acquisitions, the Company engages independent valuation specialists to assist with the determination of the fair value of assets acquired, liabilities assumed, non-controlling interest, if any, and goodwill, based on recognized business valuation methodologies. An income, market or cost valuation method may be utilized to estimate the fair value of the assets acquired, liabilities assumed, and non-controlling interest, if any, in a business combination. If the initial accounting for the business combination is incomplete by the end of the reporting period in which the acquisition occurs, an estimate will be recorded.
SSR Mining Inc.
Notes to Consolidated Financial Statements
Subsequent to the acquisition date, and not later than one year from the acquisition date, the Company will record any material adjustments to the initial estimate based on new information obtained that would have existed as of the date of the acquisition. Any adjustment that arises from information obtained that did not exist as of the date of the acquisition will be recorded in the period the adjustment arises.
Foreign currency transactions
The functional and reporting currency of SSR Mining and each of its subsidiaries is the USD. Accordingly, foreign currency transactions and balances of the Company’s subsidiaries are remeasured as follows: (i) monetary assets and liabilities denominated in currencies other than the USD (“foreign currencies”) are remeasured into USD at the exchange rates prevailing at the balance sheet date; and (ii) non-monetary assets denominated in foreign currencies and measured at other than fair value are remeasured using the rates of exchange at the transaction date. Foreign exchange gains and losses are recognized in Foreign exchange gain (loss) in the Consolidated Statements of Operations. Unrealized foreign exchange gains and losses on cash and cash equivalent balances denominated in foreign currencies are disclosed separately in the Consolidated Statements of Cash Flows.
Cash and cash equivalents
Cash and cash equivalents include cash on hand and held at banks and short-term investments with an original maturity of three months or less, which are readily convertible into a known amount of cash. Restricted cash is presented separately in Restricted cash in the Consolidated Balance Sheets. Restricted cash is deposited at banks and financial institutions and represents both a debt service reserve account and reclamation reserve account.
Inventories
Stockpiled ore, leach pad inventory, work-in-process inventory, and finished goods are valued at the lower of average cost or net realizable value (“NRV”). NRV is calculated using the estimated price at the time of sale based on prevailing and forecasted metal prices, less estimated future production costs to convert the inventory into saleable form, depreciation, and all associated selling costs. Costs include all direct costs incurred in production, including direct labor and materials, freight, depletion and depreciation, and directly attributable overhead costs. Any write-downs of inventory to NRV are recognized within Production costs and Depreciation, depletion, and amortization in the Consolidated Statements of Operations.
Stockpiled ore represents ore that has been extracted from the mine and is available for further processing. The cost of stockpiled ore is derived from the current mining costs incurred up to the point of stockpiling the ore and is removed at the weighted average cost as ore is processed. Quantities of stockpiled ore are verified by periodic surveys. Stockpiled ore that is not expected to be processed within the next twelve months is classified as non-current.
Leach pad inventory represents ore that has been mined and placed on leach pads where a solution is applied to the surface of the heap to dissolve the gold and by-products. The resulting solution is further processed in a plant to recover the gold. The cost of leach pad inventory is derived from current mining and leaching costs and is removed as ounces of gold are recovered at the weighted average cost per recoverable ounce of gold on the leach pads. Estimates of recoverable gold in the leach pads are calculated based on the quantities of ore placed on the leach pads (measured tonnes added to the leach pads), the grade of ore placed on the leach pads (based on assay data), and an estimated recovery percentage (based on estimated recovery assumptions from the block model). The nature of the leaching process inherently limits the ability to precisely monitor inventory levels. As a result, estimates are refined based on actual results and engineering studies over time. The final recovery of gold from leach pads will not be known until the leaching process is concluded at the end of the mine life. Ore on leach pads that is not expected to be recovered within the next twelve months is classified as non-current.
SSR Mining Inc.
Notes to Consolidated Financial Statements
Work-in-process inventory represents material that is currently in the process of being converted to a saleable product, whether being processed in a mill or following recovery from a leach pad. Work-in-process inventory is determined based on assays of the material fed into the process and the projected recoveries of the respective processing plants. Work-in-process inventory is valued at the lower of average cost of the material fed into the process plus the in-process conversion costs, including applicable depreciation relating to the process facilities, or NRV.
Finished goods inventory includes metal concentrates at site and in transit, doré at a site or a refinery, or gold bullion and are valued at the lower of the average cost of the respective in-process inventories incurred prior to the refining process, plus applicable refining costs, or NRV. Costs are transferred from finished goods inventory and recorded as Production costs and Depreciation, depletion and amortization in the Consolidated Statements of Operations upon sale.
Materials and supplies inventories are measured at the lower of average cost or NRV. A regular review is undertaken to determine the extent of any reserve for obsolescence.
Mineral properties, plant and equipment
Mineral properties
Mineral properties are capitalized at fair value at the acquisition date. Mineral properties may include mineral reserves, mineral resources and exploration potential. Mineral reserves represent the estimate of ore that can be economically and legally extracted from the Company's mining properties. Production stage mineral properties are operating properties that contain proven and probable reserves and are amortized using the units-of-production method based on the estimated recoverable ounces or pounds in proven and probable reserves. Development stage mineral properties are those under development that contain proven and probable reserves. Exploration stage mineral properties are those that potentially contain mineralized material, consisting of (i) areas adjacent to existing mineral resources and mineralization located within the immediate mine area; (ii) areas outside of immediate mine areas that are not part of mineral resources; and (iii) greenfield exploration potential that is not associated with any other production, development, or exploration stage property. Mineral properties in the development and exploration stage are not amortized until the property is converted to the production stage. Mineral exploration costs, including costs associated with prospecting, sampling, mapping, diamond drilling and other work involved in searching for mineral resources are charged to Exploration, evaluation and reclamation costs as incurred.
Mine development
Mine development costs include engineering and metallurgical studies, drilling and other related costs to delineate an ore body, the removal of overburden to initially expose an ore body at open pit surface mines and the building of access ways, shafts, lateral access, drifts, ramps and other infrastructure at underground mines. Capitalization of mine development project costs that meet the definition of an asset begins once mineralization is classified as proven and probable reserves.
Drilling and related costs are capitalized for an ore body where proven and probable reserves exist, and the activities are directed at obtaining additional information about the ore body or converting mineralized material to proven and probable reserves. All other drilling and related costs are expensed as incurred. Drilling costs incurred during the production phase for operational ore control are allocated to inventory costs and then included as a component of Production costs.
The cost of removing overburden and waste materials to access the ore body at an open pit mine prior to the production phase are referred to as “pre-stripping costs.” Pre-stripping costs are capitalized during the development of an open pit mine. Where multiple open pits exist at a mining complex utilizing common processing facilities, pre-stripping costs are capitalized for each pit. The removal, production, and sale of de minimis saleable materials may occur during the development phase of an open pit mine and are assigned incremental mining costs related to the removal of that material.
SSR Mining Inc.
Notes to Consolidated Financial Statements
The production phase of an open pit mine commences when saleable minerals, beyond a de minimis amount, are produced. Stripping costs incurred during the production phase of a mine are variable production costs that are included as a component of inventory to be recognized in Production costs in the same period as the revenue from the sale of inventory.
Mine development costs are amortized using the units-of-production method based on estimated recoverable ounces or pounds in proven and probable reserves. To the extent that these costs benefit an entire ore body, they are amortized over the estimated life of the ore body. Costs incurred to access specific ore blocks or areas that only provide benefit over the life of that area are amortized over the estimated life of that specific ore block or area.
Plant and equipment
Expenditures for new facilities or equipment and expenditures that extend the useful lives of existing facilities or equipment are capitalized and recorded at cost. Facilities and equipment acquired as part of a finance lease are capitalized and recorded as right-of-use ("ROU") assets based on the contractual lease terms. The carrying amounts of plant and equipment are depreciated to their estimated residual value over the estimated useful lives of the specific assets or the estimated life-of-mine ("LOM"), if shorter. Depreciation starts on the date when the asset is available for its intended use. Construction in process assets are not depreciated until available for their intended use. The major categories of plant and equipment are depreciated on a straight-line basis using the estimated lives indicated below:
| | | | | |
| Vehicles | 5 years - 7 years |
| Mining equipment | 3 years - 21 years |
| Mobile equipment components | 2 years - 7 years |
| Buildings | 5 years - 21 years |
| Mine plant equipment | 3 years - 21 years |
| Underground infrastructure | 5 years - 21 years |
ROU assets - plant and equipment (1) | 10 years - 21 years |
(1)For ROU assets, the depreciation period indicated above represents the period from lease commencement date to the earlier of the end of the useful life of the underlying asset or the end of the lease term.
Impairment of long-lived assets
The Company assesses the carrying value of its long-lived assets for impairment when events or changes in circumstances indicate that the related carrying amounts of such assets may not be recoverable. Events or circumstances that could indicate that the carrying value of an asset or asset group may not be recoverable include, but are not limited to, significant adverse changes in the business climate including changes in future metal prices, significant changes to the extent or manner in which the asset is being used or its physical condition including significant decreases in production or mineral reserves, and significant decreases in the market price of the assets. In evaluating long-lived assets for recoverability, estimates of undiscounted future cash flows of the Company's mines are used. An impairment is considered to exist if total estimated undiscounted future cash flows are less than the carrying amount of the asset. Once it is determined that an impairment exists, and impairment loss is recognized based on the difference between the estimated fair value of the long-lived assets and their carrying amounts. Fair value is typically determined through the use of an income approach utilizing estimates of discounted future cash flows. Future cash flows are derived from current business plans which are developed using short and long-term metal price assumptions; estimates of costs; and resource, reserve and exploration potential estimates, including timing and costs to develop and produce the material and are considered Level 3 fair value measurements. The Company believes its estimates and models used to determine fair value are similar to what a market participant would use.
SSR Mining Inc.
Notes to Consolidated Financial Statements
Goodwill
Under the acquisition method of accounting for business combinations, the identifiable assets acquired and liabilities assumed are recognized at their estimated fair value as of the date of acquisition. The excess of the fair value of consideration paid over the fair value of the identifiable net assets acquired is recognized as Goodwill and allocated to the reporting units.
Goodwill is allocated to reporting units and assessed for impairment annually as of December 31 and when events or circumstances indicate that the carrying value of a reporting unit exceeds its fair value. In testing for goodwill impairment, the Company first evaluates qualitative factors to determine whether the existence of events or circumstances indicate that it is more likely than not that the fair value of a reporting unit is less than its carrying value. If it is determined that it is more likely than not that the fair value is less than the carrying value, then a quantitative goodwill impairment test is performed by determining the fair value of the reporting unit. The fair value of a reporting unit is determined using either the income approach by utilizing estimates of discounted future cash flows or the market approach utilizing recent transaction activity for comparable properties. These approaches are considered Level 3 fair value measurements. If the carrying amount of a reporting unit exceeds the fair value, an impairment loss is recognized in the current period in an amount equal to the excess.
Stock-based compensation
The Company determines the fair value on the grant date for stock-based compensation awards and expenses the awards in the Consolidated Statements of Operations over the vesting period on a straight-line basis. Based on the terms of the award, and the Company’s intent and past practice for settlement in cash or shares, the awards are classified as liabilities or equity. The Company recognizes forfeitures as they occur.
Cash-settled stock-based compensation arrangements; including Deferred Share Units (“DSUs”), DSU Replacement Units, Performance Stock Units (“PSUs”), and PSU Replacement Units are remeasured at fair value at the end of each reporting period and at the date of settlement, with any changes in fair value recognized in profit or loss for the period.
For equity-settled stock options, the fair value at the grant date is estimated using the Black-Scholes option pricing model. For Restricted Share Units (“RSUs”) and RSU Replacement Units, the fair value at the grant date is estimated based on the quoted market price of the Company’s common stock.
Income taxes
The income tax and mining expense for the period is comprised of current tax expense and deferred tax expense, and is recognized in the Consolidated Statements of Operations.
Current income tax
Current tax for each of the Company's taxable entities is based on the local taxable profit for the period at the local statutory tax rates enacted at the date of the Consolidated Balance Sheets as well as the available double tax treaty rates as ratified. Management periodically evaluates positions taken in tax returns in situations in which applicable tax regulation is subject to interpretation. The Company establishes provisions where appropriate on the basis of amounts expected to be paid to tax authorities. Any uncertain tax positions must meet a more-likely-than-not realization threshold to be recognized and any potential accrued interest and penalties related to unrecognized tax benefits are recognized within Income tax benefit (expense).
SSR Mining Inc.
Notes to Consolidated Financial Statements
Deferred tax
Deferred income taxes are accounted for using the asset and liability method. Under this method, deferred tax assets and liabilities are determined by applying the enacted statutory tax rates in effect at the end of a reporting period to the cumulative temporary differences between the tax bases of assets and liabilities and their reported amounts in the Company’s consolidated financial statements. Deferred income tax assets are recognized for all deductible temporary differences to the extent that it is more likely than not that taxable profits will be available to be utilized against those deductible temporary differences. A valuation allowance for deferred tax assets is established when it is more likely than not that some portion of the benefit from deferred tax assets will not be realized. The extent to which deductible temporary differences, unused tax losses and other income tax deductions are expected to be realized are reassessed at the end of each reporting period. The effect on deferred taxes for a change in tax rates is recognized in income during the period that the enactment date is effective.
Deferred tax assets are recognized for investment incentive tax credits in Turkey in the period earned as expenditures that are more likely than not to be accepted as eligible spend occur and it is more likely than not that taxable profits will be available to be utilized against those credits, which can be applied to current and future year income tax payments. The Company accounts for the investment incentive tax credit in Turkey using the flow-through method. Under this method, the investment incentive tax credit is treated as a reduction of income taxes in the year in which the credit arises. Deferred income tax liabilities are not recognized for taxable temporary differences associated with investments in subsidiaries and associates, and interests in joint ventures, unless it becomes apparent that the excess book over tax basis difference is expected to reverse in the foreseeable future. Accordingly, deferred income tax assets and liabilities are recognized for future withholding taxes payable where it has been determined that the amount would reasonably be payable in the foreseeable future.
Deferred tax assets and liabilities are offset when there is a legally enforceable right to offset the current tax assets against the current tax liabilities, when they relate to income taxes levied by the same taxation authority, and the Company intends to settle its current tax assets and liabilities on a net basis.
Mining taxes and other tax arrangements
Mining taxes or royalties and other arrangements are treated as taxation arrangements when they have the characteristics of an income tax. This is the case when they are imposed under government authority and the amount payable is calculated by reference to an income measure. Obligations arising from royalty arrangements that do not satisfy these criteria are recognized as current liabilities and included within Production costs.
Investments
The Company has investments in debt securities and marketable equity securities. The Company determines the appropriate classification of debt securities at the time of purchase and re-evaluates such determinations at each reporting date. Current investments include marketable equity securities and held to maturity and available for sale debt securities. Marketable equity securities are carried at fair value. Held to maturity securities, classified based on the intent and ability to hold the securities to maturity, are carried at amortized cost. Marketable debt securities are categorized as available for sale and carried at fair value.
Gains and losses on the sale of securities are recognized on a specific identification basis. Unrealized gains and losses are included in Other income (expense) on the Consolidated Statements of Operations.
SSR Mining Inc.
Notes to Consolidated Financial Statements
Derivative financial instruments
The Company is exposed to various market risks, including the effect of changes in metal prices and foreign exchange rates, and from time to time uses derivatives to manage financial exposures that occur in the normal course of business. The Company recognizes derivatives as either assets, presented in the Consolidated Balance Sheets in Prepaid and other current assets or Other non-current assets, or liabilities, presented in the Consolidated Balance Sheets in Accrued liabilities and other or Other non-current liabilities, and measures those instruments at fair value. These are considered Level 2 fair value measurements. Changes in the value of derivative instruments are recorded each period in Production Costs or Other income (expense) on the Consolidated Statements of Operations. Management applies judgment in estimating the fair value of instruments that are highly sensitive to assumptions regarding commodity prices, market volatilities, and foreign currency exchange rates. The Company currently does not apply hedge accounting.
Reclamation liabilities
The Company recognizes a liability for the fair value of estimated future reclamation costs when incurred. The liability is accreted over time through periodic charges to Exploration, evaluation and reclamation costs in the Consolidated Statements of Operations. In addition, the asset retirement cost is capitalized as part of the asset's carrying value and amortized over the life of the related asset. Reclamation liabilities are periodically adjusted to reflect changes in the estimated present value resulting from the passage of time and revisions to the estimates of either the timing or amount of reclamation costs. Changes in the estimate of reclamation costs may result from changes in legal or regulatory requirements, increased obligations arising from additional mining and exploration activities, and changes to cost estimates. Changes in reclamation estimates at mines that are not currently operating, as the mine or portion of the mine site has entered the closure phase and has no substantive future economic value, are reflected in Exploration, evaluation and reclamation costs in the Consolidated Statements of Operations. The estimated reclamation obligation is based on when spending for an existing disturbance is expected to occur. The Company reviews, on an annual basis, unless otherwise deemed necessary, the reclamation obligation at each mine site.
Leases
The Company has entered into lease contracts under which it is the lessee. The Company determines whether an arrangement is, or contains, a lease based on the substance of the arrangement at its inception. If the contract is determined to be a lease, the Company classifies the lease as either an operating or financing lease. Operating lease right of use ("ROU") assets are included in Other non-current assets and lease obligations are included in Accrued liabilities and other and Other non-current liabilities in the Consolidated Balance Sheets. Finance lease ROU assets are included in Mineral properties, plant and equipment and lease obligations are included in Finance lease liabilities in the Consolidated Balance Sheets.
ROU assets represent the Company’s right to use the underlying assets for the lease term and the corresponding lease liabilities represent its obligations to make lease payments arising from the leases. Operating and finance lease ROU assets and liabilities are recognized at the commencement date based on the present value of the expected lease payments over the lease term. When the rate of interest implicit in the lease cannot be readily determined, the Company uses its incremental borrowing rate in determining the present value of future lease payments.
Operating lease costs are recognized on a straight-line basis over the lease term. Finance lease costs are recognized based on the effective interest method for the lease liability and straight-line amortization of the ROU asset, resulting in more cost being recognized in earlier periods. Variable lease payments are recognized in the period in which they are incurred.
The Company has elected certain practical expedients including the short-term lease recognition exemption for all classes of underlying assets. Accordingly, leases with a term of one year or less have not and will not be recognized on the Consolidated Balance Sheets. The Company has also elected the practical expedient to not separate lease and non-lease components such as taxes and common area maintenance charges, in certain classes of assets such as its office facilities.
SSR Mining Inc.
Notes to Consolidated Financial Statements
Most of the Company’s leasing arrangements include extension and termination options, all of which provide the Company flexibility in retaining the underlying facilities and equipment, as well as some protection from future price variability. The Company has applied judgment to determine the lease term, which is the non-cancelable period in the contract, plus the period beyond that cancellation period that the Company believes it is reasonably certain it will need the equipment for operational purposes.
Revenue recognition
The Company generates revenue by selling gold, copper, silver, lead and zinc produced from its mining operations. The majority of the Company’s sales come from the sale of refined gold bullion; however, the end product at the Company’s gold operations is generally doré bars. The Company also sells silver-lead and zinc concentrate to smelters for further treatment and refining.
Gold sales
Doré is sent to refiners to produce bullion that meets the required market standard of 99.95% gold. Under the terms of the Company’s refining agreements, the doré bars are refined for a fee, and the Company’s share of the refined gold and separately recovered silver is credited to its bullion account. Doré produced at Marigold and Seabee is sold primarily to bullion banks in the London spot market. Doré produced at Çöpler is sold primarily on the Istanbul Gold Exchange. Under legislation commenced in Turkey in 2018, the Central Bank of the Republic of Turkey has the first right of refusal for all gold produced by mining operations in Turkey.
The Company generally recognizes revenue for gold from doré production when it satisfies the performance obligation of transferring gold bullion credits to the customer, as this is the point at which the customer obtains the ability to direct the use of and hold the remaining benefits of ownership of the asset. The transaction price is fixed on the date of sale based on the London Bullion Market Association's (“LBMA”) gold fix price or spot price and number of ounces delivered. Payment is due upon delivery of gold bullion credits to the customer’s account.
Concentrate sales
Metals produced at Puna are sold in concentrate form to smelters and traders. The Company recognizes revenue for silver-lead and zinc concentrate, net of treatment and refining costs, when it satisfies the performance obligation of transferring control of the concentrate to the customer. This generally occurs as material passes over the vessel’s rail at the port of loading or unloading, as the customer has the risk of loss and ability to direct the use of and obtain substantially all of the remaining benefits of the material. The Company has elected to account for shipping and handling costs for concentrate contracts as fulfillment activities and not as promised goods or services; therefore, these activities are not considered separate performance obligations.
The initial sales price of concentrate metal sales is determined on a provisional basis at the date of sale as the final selling price is subject to movements in the monthly average London Metal Exchange (“LME”) or LBMA prices up to the date of final pricing. The period between provisional invoicing and final pricing, or settlement period, is typically between 30 and 120 days.
The Company’s accounts receivable from provisionally priced sales contain an embedded derivative that is required to be separated from the host contract for accounting purposes. The host contract is the receivable from the sale of concentrates measured at the forward price at the time of sale. The embedded derivative is adjusted to fair value through Revenue each period until the date of final metal settlement.
Income per share
Basic net income per share is calculated by dividing the net income or loss attributable to common stockholders of the Company by the weighted average number of common shares outstanding during the period. Diluted net income per share is determined by including the basic weighted average number of common shares outstanding adjusted for the effects of all potential dilutive shares of common stock, unless their effect would be anti-dilutive.
SSR Mining Inc.
Notes to Consolidated Financial Statements
3.ACQUISITIONS AND DIVESTITURES
Acquisition of Taiga Gold Corporation
On December 2, 2021, the Company announced an agreement to acquire all the issued and outstanding common shares of Taiga Gold Corporation (“Taiga Gold”) at a price of CAD $0.265 per Taiga Gold share which implies an equity value of approximately $21.0 million. Taiga Gold has announced that it intends to call a meeting of shareholders to be held on or before March 15, 2022 to seek shareholder approval for the Transaction. The transaction will require approval of (i) at least 66⅔% of the votes cast by Taiga Gold shareholders and (ii) a simple majority of the votes cast by certain Taiga Gold shareholders, which excludes votes from certain shareholders, as required under Canadian Multilateral Instrument 61-601 - Protection of Minority Securityholders in Special Transactions. The completion of the transaction is also subject to receipt of court, stock exchange and any other regulatory approvals, and is subject to customary closing conditions for transactions of this nature. The agreement provides for non-solicitation covenants with "fiduciary out" provisions that allow Taiga Gold to consider and accept a superior proposal, subject to a "right to match period" in favor of the Company. The agreement also provides for (i) a termination fee of $1.2 million to be paid by Taiga Gold to the Company if the agreement is terminated in certain specified circumstances; and (ii) and expense reimbursement fee of $0.3 million to be paid by the Company to Taiga Gold if the transaction fails to close as a result of specified breaches of the agreement by the Company. The transaction is expected to close in the first half of 2022.
The transaction materially expands the Company’s presence in Saskatchewan, Canada, a core jurisdiction, by adding five new properties, which provide new exploration targets stretching south from the Seabee mine to the Company’s 100%-owned Amisk property. Further, the acquisition consolidates a 100% interest in the Fisher property contiguous to the Seabee mine, currently operated under joint venture comprised of the Company's 80% and Taiga Gold's 20%. The Company will leverage its existing teams and infrastructure to advance the development of these assets.
Acquisition of Alacer Gold Corporation
On September 16, 2020 (“Acquisition Date”), the Company acquired all of the issued and outstanding common shares of Alacer Gold Corp. ("Alacer"). The acquisition of Alacer created a diversified portfolio of high quality, long-life mines across four mining-friendly jurisdictions.
The Company acquired all of the issued and outstanding common shares of Alacer, with Alacer shareholders receiving 0.3246 of the Company’s common stock for every one Alacer share (the "Exchange Ratio"). The transaction resulted in the issuance of 95,699,911 of the Company’s common stock to the former shareholders of Alacer. All outstanding RSUs, PSUs and DSUs of Alacer that were not exercised prior to the Acquisition Date were replaced with the Company units (the RSU Replacement Units, the PSU Replacement Units, and the DSU Replacement Units, respectively), with the number of such securities issued adjusted by the Exchange Ratio.
Upon closing of the transaction, the Company and former Alacer shareholders owned 57% and 43%, respectively, of the shares of the combined entity. Upon the completion of the transaction, Alacer became a wholly-owned subsidiary of the Company. Alacer holds an 80% interest in Anagold Madencilik Sanayi ve Ticaret Anonim Şirketi ("Anagold"), the owner and operator of Çöpler, a large-scale open pit gold mine in east-central Turkey. The 20% non-controlling interest in Anagold is held by Lidya Madencilik Sanayi ve Ticaret Anonim Şirketi ("Lidya Mining").
Based upon the September 15, 2020 closing stock price of the Company's common stock, the total purchase price consideration of the acquisition was $2.2 billion. The Company incurred transaction and integration costs of $6.9 million and $20.8 million, which included $11.0 million for severance and termination payments to executives, for the years ended December 31, 2021 and 2020, respectively. These costs were recognized in Transaction, integration and SEC conversion expense in the Consolidated Statements of Operations.
SSR Mining Inc.
Notes to Consolidated Financial Statements
The acquisition of Alacer was accounted for as a business combination which requires the measurement of acquired assets and liabilities assumed at their respective fair values at the date of acquisition. The Acquisition Date fair value of the consideration transferred consists of the following (in thousands):
| | | | | | | | | | | |
Share consideration (1) | | $ | 2,127,284 | |
RSU, PSU and DSU consideration (2) | | | 52,363 | |
| Total consideration | | $ | 2,179,647 | |
(1)The fair value of 95,699,911 common shares issued to Alacer shareholders was determined using the Company's common share price of $22.22 per share on September 15, 2020.
(2)The fair value of 3,570,261 RSU, 3,463,023 PSU and 1,158,071 DSU consideration units issued was determined using the Alacer share price of $7.21 on September 15, 2020, adjusted for the Exchange Ratio. Of the amount relating to the RSU, PSU and DSU consideration, $15.4 million was recognized in equity and $23.8 million and $13.2 million were recognized in Accrued liabilities and other and Other non-current liabilities, respectively.
The table below presents the fair values of the assets acquired and liabilities assumed at the Acquisition Date (in thousands):
| | | | | | | | |
ASSETS | | |
| Cash and cash equivalents | $ | 270,445 | |
| Trade and other receivables | | 17,218 | |
| Inventories | | 224,992 | |
Prepaids and other current assets | | 6,039 | |
| Mineral properties, plant and equipment | | 2,789,832 | |
| Inventories | | 124,775 | |
| Restricted cash | | 32,943 | |
| Equity method investments | | 9,148 | |
| Other non-current assets | | 9,575 | |
| Total assets | $ | 3,484,967 | |
| | |
LIABILITIES | | |
| Accounts payable and accrued liabilities | $ | 71,861 |
| Current portion of debt | | 70,000 | |
| Debt | | 175,000 | |
Reclamation liabilities(1) | | 26,154 | |
| Lease liabilities - non-current | | 114,820 | |
Deferred income tax liabilities (2) | | 337,752 | |
| Other non-current liabilities | | 3,081 | |
Non-controlling interest (3) | | 506,652 | |
| Total liabilities | | 1,305,320 | |
| Total net assets | $ | 2,179,647 | |
(1)The fair value of reclamation costs is based on the expected amounts and timing of cash flows for closure activities and discounted to present value using a credit-adjusted risk-free rate as of the Acquisition Date. Key assumptions include the costs and timing of key closure activities based on the life of mine plans.
(2)Deferred income tax liabilities are net of a deferred income tax asset of $182.9 million relating to investment incentive tax credits at Çöpler and includes a deferred income tax liability of $29.2 million for withholding tax on distributable earnings of the Turkish entities.
(3)The fair value of non-controlling interest is measured based on a discounted cash flow model.
SSR Mining Inc.
Notes to Consolidated Financial Statements
The fair values of inventories were determined based on an NRV approach, whereby the future estimated cash flows from sales of payable metal produced are adjusted for costs to complete. The fair values of mineral properties have been estimated using discounted cash flow models and the fair values of plant and equipment have been estimated using a depreciated replacement cost approach. A market approach was used to estimate the fair values of certain exploration assets with reference to a public company comparable analysis. Expected future cash flows are based on estimates of future metal prices, production based on current estimates of mineral reserves and recoverable mineral resources, future operating costs and capital expenditures, and discount rates. The valuation of net deferred tax liabilities includes an amount recognized for deferred tax assets relating to investment incentive tax credits for which the Company has determined it is more likely than not to be accepted as eligible spend occurs and it is more likely than not that taxable profits will be available to utilize against those credits.
Consolidated revenue for the year ended December 31, 2020 includes revenue from the assets acquired in the acquisition of Alacer of $205.5 million. Consolidated net income for the year ended December 31, 2020 includes net income attributable to SSR Mining shareholders from Alacer of $24.1 million.
Pro forma financial information
The following table provides unaudited pro forma financial information for the years ended December 31, 2020 and 2019, as if Alacer had been acquired as of January 1, 2019 (in thousands):
| | | | | | | | | | | | | | | | | |
| | Years Ended December 31, |
| | 2020 | | 2019 |
| Revenue | $ | 1,215,145 | | | $ | 1,077,093 | |
| Net income attributable to SSR Mining shareholders | $ | 264,390 | | | $ | 219,068 | |
Acquisition of non-controlling interest in Puna
On September 18, 2019, the Company acquired a 25% interest in Puna from Golden Arrow Resources Corporation ("Golden Arrow") for aggregate consideration of $32.4 million, consisting of $2.3 million of cash, the extinguishment of the loan to Golden Arrow and related interest of $11.4 million, the issuance of $18.2 million of the Company's common shares, and the transfer of shares in Golden Arrow held by the Company, with a fair value of $0.5 million, for cancellation.
As the acquisition did not result in a change of control, the acquisition was accounted for as an equity transaction whereby the carrying amount of the non-controlling interest of $33.9 million in Puna prior to the acquisition was adjusted to zero in the Consolidated Balance Sheets. Further, the difference of $1.5 million between the carrying amount of the non-controlling interest in Puna at the time of acquisition and the fair value of the consideration paid to Golden Arrow of $32.4 million was recognized in equity. Transaction costs incurred in connection with the transaction of $0.2 million were recognized as a reduction of equity.
Divestiture of royalty assets
On October 21, 2021, the Company completed the sale of a portfolio of royalty interests and deferred consideration (the "Royalty Portfolio") to EMX Royalty Corporation ("EMX") with a carrying value of $83.9 million. The total consideration received included cash, EMX common shares, and deferred consideration in the form of contingent payments of cash payable upon completion of certain project milestones related to one of the royalties totaling approximately $87.9 million. The fair value of the deferred consideration was estimated based on the present value of the projected future cash inflows using a discount rate of 12.5%. The projected future cash inflows are affected by assumptions related to the achievement of the development milestones. At June 30, 2021, following the negotiation of the Royalty Portfolio sale, the Company recorded an impairment loss of $22.3 million on the Royalty Portfolio, calculated based on the difference between the estimated fair value of the Royalty Portfolio and its carrying amount prior to the impairment. The impairment loss was recognized in the Company's Exploration, evaluation and development properties segment. The Company recognized a gain on closing of the Royalty Portfolio sale to EMX of $2.1 million, net of $0.3 million of transaction costs, which has been recorded against the impairment loss.
SSR Mining Inc.
Notes to Consolidated Financial Statements
4.OPERATING SEGMENTS
The Company currently has four producing mines and a portfolio of precious metal dominant projects. Each individual operating mine site along with the Company's exploration, evaluation and development properties are considered reportable segments. Operating results of operating segments are reviewed by the Company's chief operating decision maker ("CODM") to make decisions about resources to be allocated to the segments and to assess their performance. The Company's business activities that not included within the reportable segments are included in Corporate and other. Although they are not required to be included in this footnote, they are provided for reconciliation purposes.
In connection with the acquisition of Alacer, the Company added Çöpler as a new operating mine site for the year ended December 31, 2020. Çöpler is an operating mine site, therefore it is considered a reportable segment.
The following tables provide a summary of financial information related to the Company's segments (in thousands):
| | | | | | | | | | | | | | | | | | | | | | | | | | | | | | | | | | | | | | | | | |
| Year Ended December 31, 2021 |
| Çöpler | | Marigold | | Seabee | | Puna | | Exploration, evaluation
and development properties | | Corporate and other (1) | | Total |
| Revenue | $ | 607,887 | | | $ | 426,391 | | | $ | 213,860 | | | $ | 226,061 | | | $ | — | | | $ | — | | | $ | 1,474,199 | |
| Production costs | $ | 264,889 | | | $ | 219,035 | | | $ | 66,354 | | | $ | 121,096 | | | $ | — | | | $ | — | | | $ | 671,374 | |
| Depletion, depreciation and amortization | $ | 125,220 | | | $ | 35,410 | | | $ | 45,334 | | | $ | 21,995 | | | $ | — | | | $ | — | | | $ | 227,959 | |
| Exploration, evaluation and reclamation costs | $ | 10,868 | | | $ | 2,979 | | | $ | 11,867 | | | $ | 1,764 | | | $ | 13,027 | | | $ | 1,877 | | | $ | 42,382 | |
Care and maintenance expense (1) | $ | — | | | $ | — | | | $ | — | | | $ | — | | | $ | — | | | $ | — | | | $ | — | |
| Transaction, integration and SEC conversion expense | $ | — | | | $ | — | | | $ | — | | | $ | — | | | $ | — | | | $ | 11,240 | | | $ | 11,240 | |
| Impairment of long-lived and other assets | $ | — | | | $ | — | | | $ | — | | | $ | — | | | $ | 20,275 | | | $ | — | | | $ | 20,275 | |
| Operating income | $ | 201,302 | | | $ | 169,070 | | | $ | 90,332 | | | $ | 79,043 | | | $ | (33,302) | | | $ | (62,070) | | | $ | 444,375 | |
| Capital expenditures | $ | 34,699 | | | $ | 55,861 | | | $ | 40,553 | | | $ | 10,458 | | | $ | — | | | $ | — | | | $ | 141,571 | |
| Total assets as of December 31, 2021 | $ | 2,290,367 | | | $ | 566,015 | | | $ | 479,370 | | | $ | 293,470 | | | $ | 923,204 | | | $ | 659,012 | | | $ | 5,211,438 | |
(1)Care and maintenance expense consists of operating costs and depreciation incurred while a site is placed into care and maintenance or operating at reduced levels in response to the COVID-19 pandemic.
SSR Mining Inc.
Notes to Consolidated Financial Statements
| | | | | | | | | | | | | | | | | | | | | | | | | | | | | | | | | | | | | | | | | |
| Year Ended December 31, 2020 |
| Çöpler | | Marigold | | Seabee | | Puna | | Exploration, evaluation
and development properties | | Corporate and other (1) | | Total |
| Revenue | $ | 205,535 | | | $ | 409,799 | | | $ | 135,230 | | | $ | 102,525 | | | $ | — | | | $ | — | | | $ | 853,089 | |
| Production costs | $ | 121,614 | | | $ | 216,358 | | | $ | 40,575 | | | $ | 65,991 | | | $ | — | | | $ | — | | | $ | 444,538 | |
| Depletion, depreciation and amortization | $ | 33,793 | | | $ | 34,619 | | | $ | 28,341 | | | $ | 12,505 | | | $ | — | | | $ | — | | | $ | 109,258 | |
| Exploration. evaluation, and reclamation costs | $ | 3,560 | | | $ | 3,742 | | | $ | 6,390 | | | $ | (373) | | | $ | 13,186 | | | $ | 538 | | | $ | 27,043 | |
Care and maintenance expense (1) | $ | — | | | $ | — | | | $ | 13,644 | | | $ | 15,949 | | | $ | — | | | $ | — | | | $ | 29,593 | |
| Transaction, integration and SEC conversion expense | $ | — | | | $ | — | | | $ | — | | | $ | — | | | $ | — | | | $ | 20,813 | | | $ | 20,813 | |
| Impairment of long-lived and other assets | $ | — | | | $ | — | | | $ | — | | | $ | — | | | $ | — | | | $ | — | | | $ | — | |
| Operating income | $ | 46,546 | | | $ | 154,645 | | | $ | 46,152 | | | $ | 6,937 | | | $ | (13,186) | | | $ | (52,819) | | | $ | 188,275 | |
| Capital expenditures | $ | 22,883 | | | $ | 55,567 | | | $ | 32,782 | | | $ | 10,962 | | | $ | — | | | $ | — | | | $ | 122,194 | |
| Total assets as of December 31, 2020 | $ | 2,254,320 | | | $ | 601,804 | | | $ | 454,484 | | | $ | 225,033 | | | $ | 1,018,801 | | | $ | 622,902 | | | $ | 5,177,344 | |
(1)Care and maintenance expense consists of operating costs and depreciation incurred while a site is placed into care and maintenance or operating at reduced levels in response to the COVID-19 pandemic.
SSR Mining Inc.
Notes to Consolidated Financial Statements
| | | | | | | | | | | | | | | | | | | | | | | | | | | | | | | | | | | | |
| | Year Ended December 31, 2019 (1) |
| | Marigold | | Seabee | | Puna | | Exploration, evaluation
and development properties | | Corporate and other (1) | | Total |
| Revenue | | $ | 315,413 | | | $ | 146,059 | | | $ | 145,378 | | | $ | — | | | $ | — | | | $ | 606,850 | |
| Production costs | | $ | 192,032 | | | $ | 46,627 | | | $ | 110,960 | | | $ | — | | | $ | — | | | $ | 349,619 | |
| Depletion, depreciation and amortization | | $ | 34,372 | | | $ | 36,345 | | | $ | 14,927 | | | $ | — | | | $ | — | | | $ | 85,644 | |
| Exploration, evaluation and reclamation costs | | $ | 2,672 | | | $ | 8,763 | | | $ | 2,840 | | | $ | 7,130 | | | $ | 679 | | | $ | 22,084 | |
Care and maintenance expense (2) | | $ | — | | | $ | — | | | $ | — | | | $ | — | | | $ | — | | | $ | — | |
| Transaction, integration and SEC conversion expense | | $ | — | | | $ | — | | | $ | — | | | $ | — | | | $ | — | | | $ | — | |
| Impairment of long-lived and other assets | | $ | — | | | $ | — | | | $ | — | | | $ | — | | | $ | — | | | $ | — | |
| Operating income | | $ | 85,519 | | | $ | 54,077 | | | $ | 15,457 | | | $ | (7,130) | | | $ | (29,528) | | | $ | 118,395 | |
| Capital expenditures | | $ | 46,390 | | | $ | 34,010 | | | $ | 16,721 | | | $ | — | | | $ | — | | | $ | 97,121 | |
| Total assets as of December 31, 2019 | | $ | 487,958 | | | $ | 482,085 | | | $ | 253,835 | | | $ | 111,227 | | | $ | 356,413 | | | $ | 1,691,518 | |
(1)The operating data presented in this table present results for the year ended December 31, 2019. As the Company was not entitled to the economic benefits of Çöpler prior to the acquisition, financial data for the periods prior to September 16, 2020 are not provided.
(2)Care and maintenance expense consists of operating costs and depreciation incurred while a site is placed into care and maintenance or operating at reduced levels in response to the COVID-19 pandemic.
Geographic area
The following are non-current assets, excluding Goodwill, Restricted cash and Deferred income taxes, by location as of December 31 (in thousands):
| | | | | | | | | | | | | | | | | |
| December 31, |
| 2021 | | 2020 |
| Turkey | $ | 2,744,707 | | | $ | 2,899,724 | |
| Canada | | 292,264 | | | | 306,253 | |
| United States | | 307,857 | | | | 271,894 | |
| Argentina | | 123,834 | | | | 126,386 | |
| Mexico | | 48,345 | | | | 48,619 | |
| Peru | | 527 | | | | 527 | |
| Total | $ | 3,517,534 | | | $ | 3,653,403 | |
SSR Mining Inc.
Notes to Consolidated Financial Statements
The following is revenue information by geographic area based on the location of production as of December 31 (in thousands):
| | | | | | | | | | | | | | | | | | | | | | | | | | |
| Years Ended December 31 |
| 2021 | | 2020 | | 2019 |
| Turkey | $ | 607,887 | | | $ | 205,535 | | | $ | — | |
| Canada | | 213,860 | | | | 135,230 | | | | 146,059 | |
| United States | | 426,391 | | | | 409,799 | | | | 315,413 | |
| Argentina | | 226,061 | | | | 102,525 | | | | 145,378 | |
| Total | $ | 1,474,199 | | | $ | 853,089 | | | $ | 606,850 | |
5.REVENUE
The following table represents revenues by product (in thousands):
| | | | | | | | | | | | | | | | | | | | | | | | | | |
| Years Ended December 31, |
| | 2021 | | 2020 | | 2019 |
| Gold doré sales | | | | | | | | |
Copler | $ | 600,790 | | | $ | 205,535 | | | $ | — | |
Marigold | | 426,288 | | | | 409,746 | | | | 315,350 | |
Seabee | | 213,766 | | | | 135,177 | | | | 146,016 | |
| Concentrate sales | | | | | | | | |
Puna | | 229,959 | | | | 105,350 | | | | 144,839 | |
Other (1) | | | | | | | | |
Copler | | 7,097 | | | | — | | | | — | |
Marigold | | 103 | | | | 53 | | | | 69 | |
Seabee | | 94 | | | | 53 | | | | 49 | |
Puna | | (3,898) | | | | (2,825) | | | | 527 | |
Total | $ | 1,474,199 | | | $ | 853,089 | | | $ | 606,850 | |
(1)Other revenue includes: changes in the fair value of concentrate trade receivables due to changes in silver and base metal prices; and silver and copper by-product revenue arising from the production and sale of gold doré.
Revenue by metal
Revenue by metal type for the years ended December 31, 2021, 2020 and 2019 are as follows (in thousands):
| | | | | | | | | | | | | | | | | | | | | | | | | | |
| Years Ended December 31, |
| 2021 | | 2020 | | 2019 |
| Gold | $ | 1,240,844 | | | $ | 750,458 | | | $ | 461,366 | |
| Silver | | 183,378 | | | | 92,260 | | | | 115,640 | |
| Lead | | 33,070 | | | | 8,815 | | | | 19,541 | |
| Zinc | | 13,511 | | | | 4,275 | | | | 9,658 | |
Other | | 3,396 | | | | (2,719) | | | | 645 | |
| Total | $ | 1,474,199 | | | $ | 853,089 | | | $ | 606,850 | |
Çöpler, Marigold and Seabee produce gold doré. During 2021, sales to Istanbul Gold Refinery and CIBC accounted for 41% and 30% of the Company's total revenues, respectively. During 2020, sales to CIBC, Istanbul Gold Refinery, and Bank of Montreal accounted for 45%, 24%, and 14%, of the Company's total revenues, respectively. During 2019, sales to CIBC, Bank of Nova Scotia, and Bank of Montreal accounted for 37%, 22%, and 17% of the Company's total revenues, respectively.
SSR Mining Inc.
Notes to Consolidated Financial Statements
Puna sells lead and zinc concentrate with high silver content to smelters and traders located in Asia and Europe. The concentrates are sold under supply contracts updated annually or as needed through spot sales, with processing fees based on the demand for these concentrates in the global marketplace.
Provisional metal sales
For the years ending December 31, 2021 and 2020, changes in the fair value of the Company's embedded derivatives relating to provisional concentrate metal sales was an increase (decrease) of $(1.0) million $(1.5) million, respectively, which has been recorded in Revenue.
At December 31, 2021, the Company had silver sales of 3.90 million ounces at an average price of $23.49 per ounces, zinc sales of 6.33 million pounds at an average price of $1.46 per pound, and lead sales of 19.23 million pounds at an average price of $1.02 per pound, subject to final pricing over the next several months.
6.RECLAMATION LIABILITIES
The Company is subject to various domestic and international laws and regulations governing the protection of the environment. These laws and regulations are continually changing and are generally becoming more restrictive. Estimated future reclamation costs are based principally on current legal and regulatory requirements.
Changes in Reclamation liabilities during the years ended December 31 were as follows (in thousands):
| | | | | | | | | | | | | | | | | |
| 2021 | | 2020 |
| Balance, beginning of year | $ | 104,744 | | | $ | 80,838 | |
Liabilities assumed on the acquisition of Alacer (1) | | — | | | | 26,154 | |
Reclamation expenditures | | (243) | | | | (2,447) | |
Accretion expense | | 4,821 | | | | 3,815 | |
Additions, changes in estimate and other | | 15,722 | | | | (3,616) | |
| Balance, end of year | $ | 125,044 | | | $ | 104,744 | |
| Less: current portion | | (2,384) | | | | (2,023) | |
| Non-current reclamation liabilities | $ | 122,660 | | | $ | 102,721 | |
(1)On September 16, 2020, the Company acquired Alacer, including Çöpler. Please refer to Note 3 for further details. The consideration included the assumption of reclamation liabilities of $26.2 million.
SSR Mining Inc.
Notes to Consolidated Financial Statements
7. STOCK-BASED COMPENSATION
The Company has awards outstanding under its 2017, 2020 and 2021 Share Compensation Plans which include stock options, DSUs, RSUs and PSUs up to an aggregate total of 4.5% of the Company’s issued and outstanding common stock. There are 8,137,941 shares available for issuance under the Share Compensation Plans.
Stock-based compensation expense
Stock-based compensation expense has been recognized as follows (in thousands):
| | | | | | | | | | | | | | | | | | | | | | | | | | | | | |
| | Years Ended December 31, |
| | 2021 | | 2020 | | 2019 |
Production costs | | $ | 1,105 | | | $ | 2,164 | | | $ | 1,451 | |
General and administrative expense | | | 11,867 | | | | 8,500 | | | | 12,814 | |
Exploration, evaluation and reclamation expense | | | 105 | | | | 169 | | | | 159 | |
Transaction and integration expense | | | 1,722 | | | | 5,018 | | | | — | |
Income tax benefits recognized | | | — | | | | — | | | | — | |
| | $ | 14,799 | | | $ | 15,851 | | | $ | 14,424 | |
Stock options
The Company grants stock options to executives and eligible employees. Stock options issued under the Company’s incentive plans vest over three years and are exercisable over a period of time not to exceed the earlier of seven years after the grant date and the latest date permitted under the rules of the regulatory authorities. The exercise price of each option is set at the date of grant and shall not be less than the closing market price of the Company's common stock at the date of grant. New shares from treasury are issued on the exercise of stock options.
The following table summarizes the changes in stock options outstanding during the year ended December 31, 2021 (in thousands except per share amounts):
| | | | | | | | | | | | | | | | | | | | | | | | | | | | | | | | |
| | Number of Options | | Weighted Average Exercise Price Per Share | | Weighted Average Remaining Contractual Term (years) | | Aggregate Intrinsic Value |
Balance at January 1, 2021 | | 1,405 | | | $ | 13.54 | | | | | |
Granted | | — | | | | — | | | | | | |
Exercised | | (818) | | | | 10.14 | | | | | |
Forfeited | | (318) | | | | 20.12 | | | | | |
Expired | | (8) | | | | 8.57 | | | | | |
| Balance at December 31, 2021 | | 261 | | | | 16.32 | | 4.1 | | $ | 774 |
| Vested and exercisable at December 31, 2021 | | 200 | | | | 15.59 | | 3.9 | | $ | 677 |
SSR Mining Inc.
Notes to Consolidated Financial Statements
There were no stock options granted in 2021. The fair value of stock options granted during the years ended December 31. 2020 and 2019 were determined using the Black-Scholes option pricing model. The following table includes the assumptions used and other information related to stock options during the years ended December 31:
| | | | | | | | | | | | | | | | | | | | | | | | | | |
| | | | | | | | |
| 2021 | | 2020 | | 2019 |
| Expected dividend yield (%) | | N/A | | | — | | | | — | |
| Risk-free interest rate (%) | | N/A | | | 1.31 | | | | 1.78 | |
| Expected life (years) | | N/A | | | 4.20 | | | 4.20 |
| Expected volatility (%) | | N/A | | | 45.80 | | | | 45.80 | |
| Weighted-average grant-date fair value (per option) | | N/A | | $ | 17.76 | | | $ | 11.75 | |
Intrinsic value of options exercised (in thousands) | $ | 4,814 | | | $ | 9,780 | | | $ | 8,382 | |
Fair value of options vested (in thousands) | $ | 1,430 | | | $ | 5,006 | | | $ | 1,828 | |
As of December 31, 2021, there was $0.1 million of unrecognized compensation cost related to unvested stock options expected to be recognized over a weighted average period of approximately 0.9 years. During the year ended December 31, 2021, the amount of cash received from stock option exercises was $8.8 million and the tax benefit from stock options exercised was $1.3 million.
Deferred Share Units
Non-executive directors may elect to receive all or a portion of their annual compensation in the form of DSUs which are linked to the value of the Company's common stock. DSUs are issued on a quarterly basis at the market value of the Company's common stock at the date of grant. DSUs vest immediately and are redeemable in cash. 50% of a director's DSUs will be automatically redeemed on each of the following dates: (i) three months following the date the eligible director ceases to be a director of the Company and (ii) the earlier of fifteen months following, or December 31 of the calendar year following the date the eligible director ceases to be a director of the Company. In connection with the acquisition of Alacer, the Company issued DSU Replacement Units to replace the outstanding DSUs of Alacer. Each DSU Replacement Unit entitles the director to receive a payment in cash for the equivalent value of one common share on the date the director ceases to be a director.
The fair value of the outstanding DSUs and DSU Replacement Units at the end of each reporting period was recognized as a liability and included in Accrued liabilities and other.
During the years ended December 31, 2021, 2020, and 2019 total cash paid to settle DSUs and DSU Replacement Units was $2.7 million, $3.1 million, and $— million, respectively. As of December 31, 2021, 2020, and 2019, the fair value of DSUs and DSU Replacement Units granted and vested was $1.4 million, $10.7 million and $1.9 million, respectively.
The following table summarizes the changes in DSUs and DSU Replacement Units outstanding during the year ended December 31, 2021 (in thousands except per share amounts):
| | | | | | | | | | | | | | | | | | | | | | | | | | |
| | Number of Shares | | Weighted Grant Date Fair Value Per Share | | Aggregate Intrinsic Value |
Balance at January 1, 2021 | | 748 | | | $ | 21.76 | | | |
| Granted | | 89 | | | | 15.75 | | | |
| Exercised/Released | | (165) | | | | 9.07 | | | |
| Canceled/Forfeited | | — | | | | — | | | | |
| Reinvested | | 10 | | | | 14.51 | | | |
Balance at December 31, 2021 | | 682 | | | | 23.95 | | $ | 12,072 | |
SSR Mining Inc.
Notes to Consolidated Financial Statements
Restricted Share Units
The Company grants RSUs to executives and eligible employees which vest over a period of three years. In connection with the acquisition of Alacer, the Company issued RSU Replacement Units, with terms similar to RSUs, to replace the outstanding unexcercised RSUs of Alacer which vest over a period of three years.
As of December 31, 2020, RSUs and RSU Replacement Units vesting in 2022 and 2023 were classified as liabilities and included in Accrued liabilities and other and Other non-current liabilities. RSU Replacement Units vesting in 2021 were classified as equity and presented in Contingently Redeemable Shares due to certain provisions included in the 2017 and 2020 Share Compensation plans that specifies the termination of an employee within 12 months after a change of control event would result in all RSU Replacement Units issued under the plans to immediately vest and become redeemable in either cash or shares at the option of the award holder.
On February 10, 2021, the Company’s Board of Directors indicated its intention to settle all RSUs and RSU Replacement Units in common shares when vested. As of December 31, 2021, RSUs and RSU Replacement Units are classified as equity and presented in Common shares.
During the years ended December 31, 2021, 2020 and 2019, total cash paid to settle RSUs and RSU Replacement Units was $— million, $4.6 million and $0.9 million, respectively. The fair value of RSUs and RSU Replacement Units granted was $7.2 million, $25.4 million and $2.7 million for the years ended December 31, 2021, 2020 and 2019, respectively. The fair value of RSUs and RSU Replacement Units vested was $3.3 million, $14.1 million, and $1.6 million during the years ended December 31, 2021, 2020, and 2019, respectively. As of December 31, 2021, there was $2.9 million of total unrecognized compensation cost related to unvested RSUs and RSU Replacement Units expected to be recognized over approximately 2.9 years.
The following table summarizes the changes in RSUs and RSU Replacement Units outstanding during the year ended December 31, 2021 (in thousands except per share amounts):
| | | | | | | | | | | | | | | | | | | | | | | | | | |
| | Number of Shares | | Weighted Average Grant Date Fair Value | | Aggregate intrinsic value |
Balance at January 1, 2021 | | 749 | | | $ | 23.42 | | | |
Granted | | 388 | | | | 18.63 | | | |
Exercised/Released | | (197) | | | | 16.81 | | | |
Canceled/Forfeited | | (82) | | | | 19.82 | | | |
Reinvested | | 11 | | | | 21.34 | | | |
Balance at December 31, 2021 |
| 869 | | | | 23.10 | | | $ | 15,370 | |
SSR Mining Inc.
Notes to Consolidated Financial Statements
Performance Share Units
PSUs are granted to senior executives and vest after a performance period of three years. The vesting of these awards is based on the Company's total shareholder return in comparison to its peer group and awards vested range from 0% to 200% of initial PSUs granted. In connection with the acquisition of Alacer, the Company issued PSU Replacement Units to replace the outstanding unexcercised PSUs of Alacer. Each PSU Replacement Unit entitles the participant, at the end of the applicable performance period, to receive a payment in cash for the equivalent value of common shares earned, provided: (i) the participant continues to be employed or engaged by the Company or any of its affiliates; and (ii) all other terms and conditions of the grant have been satisfied, including the performance metrics associated with each PSU Replacement Unit. The vesting of these awards is based on actual production and costs against budget, and the performance of the Company's share price relative to its peer group. Awards vested range from 0% to 200% of initial PSU Replacement Units granted.
As of December 31, 2020, PSUs vesting in 2021 were classified as equity and presented in Contingently Redeemable Shares due to certain provisions included in the 2017 and 2020 Share Compensation Plans. PSUs and PSU Replacement Units vesting in 2022 and 2023 were classified as liabilities and included in Other non-current liabilities.
As of December 31, 2021, PSUs and PSU Replacement Units were classified as liabilities. On February 10, 2021, the Company's Board of Directors indicated its intention to settle all PSUs and PSU Replacement Units issued under the Company's plans in cash when vested.
During the years ended December 31, 2021, 2020 and 2019, total cash paid to settle PSUs and PSU Replacement Units was $14.3 million, $12.0 million, and $4.1 million, respectively. The fair value of PSUs and PSU Replacement Units granted was $11.5 million, $24.8 million and $2.4 million for the years ended December 31, 2021, 2020, and 2019, respectively. The fair value of PSUs and PSU Replacement Units vested was $17.4 million, $4.4 million, and $2.0 million during the years ended December 31, 2021, 2020, and 2019, respectively. As of December 31, 2021, there was $4.9 million of total unrecognized compensation cost related to unvested PSUs and PSU Replacement Units expected to be recognized over approximately 2.3 years.
The following table summarizes the changes in PSUs and PSU Replacement Units outstanding during the year ended December 31, 2021:
| | | | | | | | | | | | | | | | | | | | | | | | | | |
| | Number of Shares | | Weighted Average Grant Date Fair Value | | Aggregate Intrinsic Value |
Balance at January 1, 2021 | | 1,114 | | | $ | 24.69 | | | |
Granted | | 560 | | | | 20.52 | | | |
Exercised/Released | | (813) | | | | 21.34 | | | |
Canceled/Forfeited | | (71) | | | | 22.35 | | | |
Reinvested | | 10 | | | | 21.70 | | | | |
Balance at December 31, 2021 |
| 800 | | | | 25.34 | | | $ | 14,169 | |
SSR Mining Inc.
Notes to Consolidated Financial Statements
8.INCOME AND MINING TAXES
The following tables represent the major components of Income before taxes and Income and mining tax benefit (expense) recognized in the Consolidated Statements of Operations (in thousands):
| | | | | | | | | | | | | | | | | | | | | | | | | | | | | |
| | Years ended December 31, |
| | 2021 | | 2020 | | 2019 |
Income before income and mining taxes components: | | | | | | | | | |
| United States | | $ | 138,230 | | | $ | 119,654 | | | $ | 61,198 | |
| Canada | | | 26,752 | | | | 26,207 | | | | 71,537 | |
| Turkey | | | 186,971 | | | | 41,385 | | | | — | |
| Other Foreign | | | 62,805 | | | | 14,545 | | | | 3,922 | |
Total income before incomes taxes | | $ | 414,758 | | | $ | 201,791 | | | $ | 136,657 | |
| | | | | | | | | | | | | | | | | | | | | | | | | | |
| Years Ended December 31, |
| 2021 | | 2020 | | 2019 |
Current income tax provision: | | | | | | | | |
| United States | $ | 15,603 | | | $ | 13,945 | | | $ | 6,003 | |
| Canada | | 27,672 | | | | 5,720 | | | | 18,367 | |
| Turkey | | 49,851 | | | | 1,805 | | | | — | |
| Other Foreign | | 23,328 | | | | 1,074 | | | | 426 | |
| Total current income tax provision | | 116,454 | | | | 22,544 | | | | 24,796 | |
Deferred income tax provision (benefit): | | | | | | | | |
United States | | 13,288 | | | | 8,265 | | | | 7,145 | |
| Canada | | (230) | | | | 765 | | | | 520 | |
| Turkey | | (131,456) | | | | 19,205 | | | | — | |
| Other foreign | | (12,172) | | | | (7,576) | | | | 2,978 | |
Total deferred income tax provision (benefit) | | (130,570) | | | | 20,659 | | | | 10,643 | |
Total income tax provision (benefit) | $ | (14,116) | | | $ | 43,203 | | | $ | 35,439 | |
SSR Mining Inc.
Notes to Consolidated Financial Statements
Income and mining tax expense differs from the amount that would be computed by applying the Canadian statutory rate of 27%, 27%, and 27% for the years ended December 31, 2021, 2020 and 2019, respectively, to income before income and mining taxes. The reasons for the differences are as follows (in thousands):
| | | | | | | | | | | | | | | | | | | | | | | | | | | | | |
| | Years Ended December 31, |
| | 2021 | | 2020 | | 2019 |
Income before income and mining taxes | | $ | 414,758 | | $ | 201,791 | | $ | 136,657 |
| Statutory tax rate | | | 27 | % | | | 27 | % | | | 27 | % |
Expected income and mining tax expense | | | 111,985 | | | 54,484 | | | 36,897 |
| | | | | | | | | |
| Increase (decrease) attributable to: | | | | | | | | | |
| Non-taxable items | | | (4,379) | | | (22,236) | | | (7,518) |
Foreign exchange and inflation | | | (124,946) | | | (676) | | | 1,650 |
| Differences in foreign and future tax rates | | | 738 | | | (10,641) | | | (8,699) |
| Investment incentive tax credits | | | (14,082) | | | 1,983 | | | — |
Mining taxes and overseas withholding tax | | | 17,528 | | | 17,006 | | | 10,207 |
| Expired losses | | | 1,455 | | | 1,129 | | | 738 |
| Change in estimates in respect of prior years | | | (2,046) | | | (1,616) | | | (2,316) |
| Changes in recognition of deferred tax assets | | | 1,086 | | | 3,550 | | | 4,074 |
| Other | | | (1,455) | | | 220 | | | 406 |
Total income and mining tax expense | | $ | (14,116) | | $ | 43,203 | | $ | 35,439 |
SSR Mining Inc.
Notes to Consolidated Financial Statements
The significant components of Deferred income tax assets and Deferred income tax liabilities were (in thousands):
| | | | | | | | | | | | | | | | | |
| December 31, |
| 2021 | | 2020 |
| Deferred income tax assets | | | | | |
| Deductible temporary differences relating to: | | | | | |
Marketable securities | $ | 634 | | | $ | — | |
Inventories | | — | | | | 3,245 |
Reclamation liabilities | | 27,608 | | | 20,117 |
Lease liabilities | | 23,895 | | | 24,307 |
Deductibility of other taxes | | 9,299 | | | 10,770 |
Stock-based compensation | | 7,247 | | | 11,410 |
Other items | | 16,595 | | | 7,873 |
| | | 85,278 | | | 77,722 |
Investment incentive tax credits (1) | | 46,354 | | | | 168,447 | |
Tax loss carryforwards | | 25,395 | | | | 22,597 | |
Less: Valuation allowance | | (38,496) | | | | (37,410) | |
Total deferred income tax assets | $ | 118,531 | | | $ | 231,356 | |
| | | | | | |
| Deferred income tax liabilities | | | | | |
Taxable temporary differences relating to: | | | | | |
Marketable securities | $ | (270) | | | $ | (2,041) | |
Inventories | | (17,768) | | | | (47,484) | |
Mineral properties, plant and equipment | | (365,793) | | | | (566,922) | |
Convertible notes | | (359) | | | | (414) | |
Mineral tax | | (38,452) | | | | (39,575) | |
Foreign withholding tax | | (17,080) | | | | (32,875) | |
Other items | | (9,096) | | | | — | |
Total deferred income tax liabilities | $ | (448,818) | | | $ | (689,311) | |
| | | | | | |
| Balance sheet presentation | | | | | |
Deferred income tax assets | $ | 8,501 | | | $ | 15,072 | |
Deferred income tax liabilities | | (338,788) | | | | (473,027) | |
Deferred income tax liabilities, net | $ | (330,287) | | | $ | (457,955) | |
(1)The Company receives investment incentive tax credits for qualifying capital expenditures at Çöpler. The application of these tax credits, which are denominated in Turkish Lira, reduced income and mining tax expense and cash tax payments for the year ended December 31, 2021 and are expected to offset future cash tax payments. Reviews of eligible expenditures for tax credits by local tax authorities occur periodically and can result in adjustments to the recognition of investment incentive tax credits.
As of December 31, 2021 and 2020, an aggregate deferred tax liability of $10.7 million and $14.1 million, respectively, for temporary differences of $35.6 million and $47.0 million, respectively, related to investments in subsidiaries was not recognized as the Company controls the dividend policy of its subsidiaries (i.e., the Company controls the timing of reversal of the related taxable temporary differences and is satisfied that they will not reverse in the foreseeable future).
SSR Mining Inc.
Notes to Consolidated Financial Statements
Valuation of deferred tax assets
The Company recognizes tax benefits on losses or other deductible amounts generated in countries where it determines that it is more likely than not that taxable profits will be available to be utilized against those temporary differences. The Company's deferred tax valuation allowance related primarily to tax losses in foreign jurisdictions which do not meet the “more-likely-than-not” standard under current accounting guidance due to insufficient positive taxable income to utilize available tax losses.
When there is a change in judgment concerning the recovery of deferred tax assets in future periods, a valuation allowance is recorded into earnings during the quarter in which the change in judgment occurs. During 2021, the Company made adjustments to its deferred tax assets and corresponding valuation allowances. The net change to the valuation allowance consisted of a $1.1 million increase related to reclamation liabilities with no future tax benefit and the generation of losses.
Tax loss carryforwards
As of December 31, 2021, the Company had the following estimated tax operating losses available to reduce future taxable income, including both losses for which deferred tax assets are utilized to offset applicable deferred tax liabilities and losses for which deferred tax assets are not recognized as listed in the table above. Losses expire at various dates and amounts between 2022 and 2041. There were no operating losses generated in Turkey.
| | | | | | | | | | | | | | |
| December 31, 2021 | | Expiration Year |
| Mexico | $ | 34,695 | | | 2022 - 2031 |
| Canada | $ | 42,632 | | | 2040 - 2041 |
| U.S.A. | $ | 7,797 | | | Indefinite |
Argentina | $ | 5,146 | | | 2026 |
Unrecognized tax benefits
The Company records uncertain tax positions on the basis on a two-step process in which (1) the Company determines whether it is more likely than not that the tax positions will be sustained on the basis of the technical merits of the position and (2) for those tax positions meeting the “more-likely-than-not” recognition threshold, the Company recognizes the largest amount of tax benefit that is more than 50% likely to be realized upon ultimate settlement with the related tax authority.
The Company determined that no liability for unrecognized tax benefits for uncertain tax positions was required as of December 31, 2021. In addition, the Company does not believe that it has any tax positions for which it is reasonably possible that it will be required to record a significant liability for previously recognized tax benefits within the next twelve months. If the Company were to record an unrecognized tax benefit, the Company will recognize applicable interest and penalties related to income tax matters in income and mining tax expense.
The Company files income tax returns in the U.S. federal jurisdiction, Canada, Turkey, Argentina and various state, provincial and foreign jurisdictions. With few exceptions, the Company is no longer subject to U.S. Federal, state and local, and non-US income tax examinations for years before 2016. The Company is currently litigating with Turkey for the years 2016 through 2020 related to withholding tax on distributions from its Turkish operation.
SSR Mining Inc.
Notes to Consolidated Financial Statements
9.OTHER INCOME (EXPENSE)
The following table includes the components of Other income (expense):
| | | | | | | | | | | | | | | | | | | | | | | | | | |
| Years Ended December 31, |
| 2021 | | 2020 | | 2019 |
Interest income | $ | 1,939 | | | $ | 6,545 | | | $ | 11,882 | |
Gain (loss) on marketable securities | | (10,741) | | | | 21,368 | | | | 34,630 | |
Gain (loss) on derivative instruments | | (12) | | | | 383 | | | | 1,486 | |
Gain (loss) on sale of mineral properties, plant, and equipment | | 412 | | | | (2,804) | | | | (863) | |
Other | | (5,747) | | | | 5,632 | | | | (7,939) | |
Total | $ | (14,149) | | | $ | 31,124 | | | $ | 39,196 | |
10.INCOME PER SHARE
The Company calculates basic net income per share using, as the denominator, the weighted average number of common shares outstanding during the period. Diluted net income per share uses, as its denominator, the weighted average number of common shares outstanding during the period plus the effect of potential dilutive shares during the period.
Potential dilutive common shares include stock options, PSUs and PSU Replacement Units, RSUs and RSU Replacement Units, and convertible notes for periods in which the Company has reported net income.
The calculations of basic and diluted net income per share attributable to stockholders of SSR Mining for the years ended December 31 were based on the following (in thousands):
| | | | | | | | | | | | | | | | | | | | | | | | | | |
| Years Ended December 31, |
| 2021 | | 2020 | | 2019 |
| Net Income | $ | 425,922 | | | $ | 157,162 | | | $ | 101,218 | |
Net (income) loss attributable to non-controlling interest | | (57,846) | | | | (5,627) | | | | 1,558 | |
Net income attributable to stockholders of SSR Mining | | 368,076 | | | | 151,535 | | | | 102,776 | |
Interest saving on convertible notes, net of tax | | 4,889 | | | | 4,883 | | | | 3,392 | |
Net income used in the calculation of diluted net income per share | $ | 372,965 | | | $ | 156,418 | | | $ | 106,168 | |
| | | | | | | | | |
| Weighted average number of common shares issued | | 215,993 | | | | 151,144 | | | | 121,769 | |
Adjustments for dilutive instruments: | | | | | | | | |
Stock options | | 38 | | | | 453 | | | | 1,224 | |
PSUs and PSU Replacement Units | | — | | | | — | | | | 5 | |
RSUs and RSU Replacement Units | | 58 | | | | 1 | | | | — | |
Convertible notes | | 12,152 | | | | 12,101 | | | | 12,445 | |
Diluted weighted average number of shares outstanding | | 228,241 | | | | 163,699 | | | | 135,443 | |
| | | | | | | | | |
| Net income per share attributable to common stockholders | | | | | | | | |
Basic | $ | 1.70 | | | $ | 1.00 | | | $ | 0.84 | |
Diluted | $ | 1.63 | | | $ | 0.96 | | | $ | 0.78 | |
SSR Mining Inc.
Notes to Consolidated Financial Statements
11.FAIR VALUE MEASUREMENTS AND FINANCIAL INSTRUMENTS
Fair value accounting establishes a fair value hierarchy that prioritizes the inputs to valuation techniques used to measure fair value. The hierarchy gives the highest priority to unadjusted quoted prices in active markets for identical assets or liabilities (Level 1 measurements) and the lowest priority to unobservable inputs (Level 3 measurements). The three levels of the fair value hierarchy are described below:
Level 1 - Unadjusted quoted prices in active markets that are accessible at the measurement date for identical, unrestricted assets or liabilities;
Level 2 - Quoted prices in markets that are not active, quoted prices for similar assets or liabilities in active markets, quoted prices or inputs that are observable, either directly or indirectly, for substantially the full term of the asset or liability and model-based valuation techniques (e.g. the Black-Scholes model) for which all significant inputs are observable in the market or can be corroborated by observable market data for substantially the full term of the assets or liabilities; and
Level 3 - Prices or valuation techniques that require inputs that are both significant to the fair value measurement and unobservable (supported by little or no market activity).
As required by accounting guidance, assets and liabilities are classified in their entirety based on the lowest level of input that is significant to the fair value measurement. The following tables set forth the Company’s assets and liabilities measured at fair value on a recurring (at least annually) and nonrecurring basis by level within the fair value hierarchy (in thousands).
| | | | | | | | | | | | | | | | | | | | | | | | | | | | | | | | | | | |
| | Fair value at December 31, 2021 |
| | Level 1 (1) | | Level 2 (2) | | Level 3 (3) | | Total |
| Assets: | | | | | | | | | | | |
Cash | $ | 1,017,562 | | | $ | — | | | $ | — | | | $ | 1,017,562 | |
Restricted cash | | 35,303 | | | | — | | | | — | | | | 35,303 | |
Marketable securities | | 46,923 | | | | — | | | | — | | | | 46,923 | |
| Trade receivables | | — | | | | 72,634 | | | — | | | | 72,634 | |
Derivative asset | | — | | | | 987 | | | — | | | | 987 |
Deferred consideration | | — | | | | — | | | | 22,610 | | | | 22,610 | |
| | $ | 1,099,788 | | | $ | 73,621 | | | $ | 22,610 | | | $ | 1,196,019 | |
| | | | | | | | | | | | | | | | | | | | | | | | | | | | | | | | | | | |
| | Fair value at December 31, 2020 |
| | Level 1 (1) | | Level 2 (2) | | Level 3 (3) | | Total |
| Assets: | | | | | | | | | | | |
Cash | $ | 860,633 | | | $ | — | | | $ | — | | | $ | 860,633 | |
Restricted cash | | 35,288 | | | | — | | | | — | | | | 35,288 | |
Marketable securities | | 26,748 | | | | — | | | | — | | | | 26,748 | |
| Trade receivables | | — | | | | 36,856 | | | | — | | | | 36,856 | |
Derivative asset | | — | | | | 1,243 | | | | — | | | | 1,243 | |
Deferred consideration | | — | | | | — | | | | 21,460 | | | 21,460 |
| $ | 922,669 | | | $ | 38,099 | | | $ | 21,460 | | | $ | 982,228 | |
| Liabilities: | | | | | | | | | | | |
Derivative liabilities | $ | — | | | $ | (3,881) | | | $ | — | | | $ | (3,881) | |
| $ | — | | | $ | (3,881) | | | $ | — | | | $ | (3,881) | |
1)Marketable securities of publicly quoted companies, consisting of investments, are valued using a market approach based upon unadjusted quoted prices in an active market obtained from securities exchanges.
SSR Mining Inc.
Notes to Consolidated Financial Statements
2)The Company manages its exposure to fluctuation in diesel prices and foreign currency exchange rates through hedges. The Company’s derivative asset and liabilities are valued using pricing models with inputs derived from observable market data, including quoted prices in active markets. The Company’s provisional metal sales contracts, included in Trade and other receivables in the Consolidated Balance Sheets, are valued using inputs derived from observable market data, including quoted commodity forward prices. The inputs do not involve significant management judgment. Such instruments are classified within Level 2 of the fair value hierarchy.
3)Certain items of deferred consideration related to the sale of of exploration and evaluation assets and the EMX divestiture are included in Level 3, as certain assumptions used in the calculation of the fair value are not based on observable market data. Deferred consideration is included in Other non-current assets in the Consolidated Balance Sheets.
The following table reconciles the beginning and ending balances for financial instruments that are recognized at fair value using significant unobservable inputs (Level 3) in the consolidated financial statements (in thousands):
| | | | | | | | | | | | | | | | | |
| | 2021 | | 2020 |
| Beginning Balance as of January 1 | $ | 21,460 | | | $ | 13,984 | |
| Revaluations | | 930 | | | | (1,059) | |
| Receipt of deferred consideration | | 20,911 | | | | 8,535 | |
| Disposition of deferred consideration | | (20,691) | | | | — | |
Ending balance as of December 31 | $ | 22,610 | | | $ | 21,460 | |
The fair value of the deferred consideration was estimated using the discounted cash flow method. The discount rate used to calculate the Company's deferred consideration assets was between 8.0% and 12.5% at December 31, 2021 and between 8.0% and 20.0% at December 31, 2020. Increases to the discount rate will cause a decrease in the the estimated value of the deferred consideration. The timing of achievement of development milestones were considered in determining the fair value of the deferred consideration.
Fair values of financial assets and liabilities not already measured at fair value
The fair value of the 2019 Notes and Term Loan as compared to the carrying amounts were as follows:
| | | | | | | | | | | | | | | | | | | | | | | | | | | | | | | | | | | | | | | | | |
| | | December 31, |
| | | 2021 | | 2020 |
| Level | | Carrying amount | | Fair value | | | Carrying amount | | | Fair value |
2019 Notes (1) | 1 | | $ | 225,534 | | | $ | 286,207 | | | $ | 224,586 | | | $ | 317,538 | |
Term Loan (2) | 2 | | | 140,000 | | | | 144,871 | | | | 210,000 | | | | 221,943 | |
| Total borrowings | | | $ | 365,534 | | | $ | 431,078 | | | $ | 434,586 | | | $ | 539,481 | |
(1)The fair value disclosed for the Company's 2019 Notes is included in Level 1 as the basis of valuation uses a quoted price in an active market.
(2)The fair value disclosed for the Company's Term Loan is included in Level 2 as the fair value is determined by an independent third-party pricing source.
SSR Mining Inc.
Notes to Consolidated Financial Statements
12.TRADE AND OTHER RECEIVABLES
Trade and other receivables was composed of the following (in thousands):
| | | | | | | | | | | | | | | | | | | | |
| | December 31, |
| | 2021 | | 2020 |
| Trade receivables | | $ | 86,124 | | | $ | 38,456 | |
| Value added tax receivables | | | 20,723 | | | | 24,189 | |
| Income tax receivable | | | 9,374 | | | | 14,130 | |
| Other taxes receivable | | | 1,866 | | | | 4,249 | |
| Other | | | 3,269 | | | | 2,194 | |
Total | | $ | 121,356 | | | $ | 83,218 | |
No provision for credit loss was recognized as of December 31, 2021 or 2020. All trade receivables are expected to be settled within twelve months.
13.INVENTORIES
The components of Inventories were as follows (in thousands):
| | | | | | | | | | | | | | | | | | | | |
| | December 31, |
| | 2021 | | 2020 |
| Materials and supplies | | $ | 79,372 | | | $ | 85,766 | |
| Stockpiled ore | | | 27,589 | | | | 25,582 | |
| Leach pad inventory | | | 243,627 | | | | 282,793 | |
| Work-in-process | | | 4,951 | | | | 4,368 | |
| Finished goods | | | 33,877 | | | | 38,525 | |
Total current inventories | | $ | 389,416 | | | $ | 437,034 | |
| | | | | | |
| Stockpiled ore | | | 220,324 | | | | 133,500 | |
| Materials and supplies | | | 1,293 | | | | 1,700 | |
Total non-current inventories | | $ | 221,617 | | | $ | 135,200 | |
As of December 31, 2021 and 2020, the Company has recognized a reserve of $8.1 million and $7.2 million for obsolete materials and supplies inventory, respectively.
During the year ended December 31, 2021, 2020 and 2019, the Company recognized write-downs of stockpiled ore inventories of $— million, $12.1 million, and $11.8 million respectively, classified as components of Production Costs and Depreciation, depletion and amortization.
SSR Mining Inc.
Notes to Consolidated Financial Statements
14.MINERAL PROPERTIES, PLANT AND EQUIPMENT, NET
The components of Mineral properties, plant and equipment, net were as follows (in thousands):
| | | | | | | | | | | | | | | | | | | | |
| | December 31, |
| | 2021 | | 2020 |
Plant and equipment (1) | | $ | 1,762,833 | | | $ | 1,640,705 | |
Construction in process | | | 36,841 | | | | 40,290 | |
Mineral properties subject to depletion | |
| 1,331,615 | | | | 1,282,208 | |
Mineral properties not yet subject to depletion | | | 141,629 | | | | 222,938 | |
Exploration and evaluation assets | |
| 927,176 | | | | 930,606 | |
| Total mineral properties, plant, and equipment | | | 4,200,094 | | | | 4,116,747 | |
Accumulated depreciation, plant and equipment | |
| (529,635) | | | | (423,326) | |
| Accumulated depreciation, mineral properties | | | (420,695) | | | | (223,682) | |
| Mineral properties, plant, and equipment, net | | $ | 3,249,764 | | | $ | 3,469,739 | |
(1)As of December 31, 2021 and 2020, plant and equipment includes finance lease right-of-use assets with a carrying amount of $114.9 million and $112.8 million, respectively.
15.GOODWILL
The excess of the fair value of consideration paid over the fair value of the identifiable net assets acquired is recognized as goodwill and allocated to the reporting units. The Company has goodwill which arose from the acquisition of Seabee in 2016.
Balance of Goodwill recorded at Seabee (in thousands):
| | | | | | | | | | | | | | | | | | | | |
| | December 31, |
| | 2021 | | 2020 |
| Goodwill | | $ | 49,786 | | $ | 49,786 |
16.ACCRUED LIABILITIES AND OTHER
Accrued liabilities and other are comprised of the following items (in thousands):
| | | | | | | | | | | | | | | | | | | | |
| | December 31, |
| | | 2021 | | 2020 |
| Accrued liabilities | | $ | 51,544 | | | $ | 44,503 | |
| Royalties payable | | | 32,383 | | | | 36,019 | |
Stock-based compensation liabilities | | | 22,652 | | | | 30,050 | |
| Derivative liabilities | | | — | | | | 3,764 | |
| Income taxes payable | | | 52,206 | | | | 9,194 | |
| Lease liabilities | | | 2,238 | | | | 1,954 | |
| Other | | | 4,085 | | | | 6,297 | |
Total accrued liabilities and other | | $ | 165,108 | | | $ | 131,781 | |
SSR Mining Inc.
Notes to Consolidated Financial Statements
17.DEBT
The following tables summarize the Company’s debt balances (in thousands):
| | | | | | | | | | | | | | | | | | | | |
| | December 31, |
| | 2021 | | 2020 |
2019 Notes (1) | | $ | 225,534 | | | $ | 224,586 | |
| Term Loan | | | 140,000 | | | | 210,000 | |
| Other | | | 1,450 | | | | 3,051 | |
Total carrying amount | | $ | 366,984 | | | $ | 437,637 | |
| | | | | | |
Current portion | | $ | 71,491 | | | $ | 71,025 | |
Non-current portion | | $ | 295,493 | | | $ | 366,612 | |
(1)Amount is net of discount and debt issuance costs of $4.5 million and $5.4 million, respectively.
Convertible debt
2013 Notes
On January 16, 2013 the Company issued $265.0 million of its 2.875% senior convertible notes due 2033 (the "2013 Notes").
On March 19, 2019, the Company repurchased $150.0 million of its 2.875% senior convertible notes due in 2033 for a cash payment of $152.2 million. The redemption amount was based on the fair value of the debt of $148.0 million, estimated using a discounted cash flow model and a discount rate of 4.95%. The difference of $3.0 million between the $149.2 million amortized value and the cash paid was recognized in Loss on redemption of convertible debt in the Consolidated Statements of Operations along with the related tax recovery of $0.4 million.
On January 31, 2020, pursuant to the put option under the terms of the 2013 Notes, $49.0 thousand aggregate principal amount of the 2013 Notes was redeemed at the option of the holders and $4.0 thousand of debt was converted to equity.
On March 30, 2020, pursuant to the call option under the terms of the 2013 Notes, the Company redeemed all of its remaining outstanding 2013 Notes consisting of an aggregate principal amount plus accrued interest in exchange for a cash payment of $115.5 million and equity of $2.0 thousand.
2019 Notes
On March 19, 2019, the Company issued $230.0 million of 2.50% convertible senior notes due in 2039 (the “2019 Notes”) for net proceeds of $222.9 million after payment of commissions and expenses related to the offering of $7.1 million. The 2019 Notes mature on April 1, 2039 and bear an interest rate of 2.50% per annum, payable semi-annually in arrears on April 1 and October 1 of each year. The 2019 Notes are convertible into the Company's common shares at a fixed conversion rate, subject to certain anti-dilution adjustments. In addition, if certain fundamental changes occur, holders of the 2019 Notes may be entitled to an increased conversion rate. The 2019 Notes are convertible into the Company's common shares at an initial conversion rate of 54.1082 common shares per $1,000 principal amount of 2019 Notes converted, representing an initial conversion price of $18.48 per common share.
Prior to April 1, 2023, the Company may not redeem the 2019 Notes, except in the event of certain changes in Canadian tax law. On or after April 1, 2023 and prior to April 1, 2026, the Company may redeem all or part of the 2019 Notes for cash, but only if the last reported sales price of its common stock for 20 or more trading days in a period of 30 consecutive trading days exceeds 130% of the conversion price in effect on each such trading day. On or after April 1, 2026, the Company may redeem the 2019 Notes in full or in part, for cash.
SSR Mining Inc.
Notes to Consolidated Financial Statements
Holders of the 2019 Notes have the right to require the Company to repurchase all or part of their 2019 Notes on April 1 of each of 2026, 2029 and 2034, or upon certain fundamental corporate changes. The repurchase price will be equal to par plus accrued and unpaid interest.
Term Loan
In connection with the acquisition of Alacer (see Note 3), the Company assumed a term loan (the "Term Loan"), with a fair value of $245.0 million at the date of acquisition, with a syndicate of lenders (BNP Paribas (Suisse) SA, ING Bank NV, Societe Generale Corporate & Investment Banking and UniCredit S.P.A.). The Term Loan bears interest at the London Inter-bank Offered Rate ("LIBOR") plus a fixed interest rate margin in the range of 3.50% to 3.70% depending on the tranche. On October 12, 2021, the Company amended its existing agreement and agreed to replacement of the LIBOR screen rate with an alternative screen rate when LIBOR ceases to exist. The Term Loan has no mandatory hedging or cash sweep requirements, no prepayment penalties, and final repayment is scheduled in the fourth quarter of 2023.
In addition to the Term Loan, the Company assumed LIBOR interest rate swap contracts with underlying notional amounts of approximately 37% of the outstanding Term Loan balance as of December 31, 2020 through the duration of the interest rate management program, which ended in 2021.
Restricted cash accounts must be maintained while the Term Loan is outstanding. As of December 31, 2021 and 2020, $32.9 million and $32.9 million of restricted cash relates to the Term Loan, respectively. Restricted cash is not available for use within one year and is classified as Restricted cash in the Consolidated Balance Sheets.
Under the terms of the Term Loan, the Company is required to comply with the following financial covenants:
▪historic and forecast debt service cover ratio greater than or equal to 1.20:1;
▪loan life cover ratio greater than or equal to 1.30:1; and
▪minimum tail reserves as a percentage of total reserves greater than or equal to 30%.
As of December 31, 2021, the Company was in compliance with its externally imposed financial covenants in relation to the Term Loan and Credit Facility. The Company does not have any financial covenants in relation to the 2019 Notes.
Credit Facility
On August 4, 2015, the Company entered into a $75.0 million senior secured revolving credit facility (the "Credit Facility") with a syndicate of banks. The Credit Facility may be used for reclamation bonding, working capital and other general corporate purposes but can only be used to fund activities of entities that were in the SSR Mining group prior to the acquisition of Alacer (see Note 3). During 2017, the Company extended the maturity of the Credit Facility to June 8, 2020, and concurrently reduced applicable margins, increased covenant flexibility and added a $25.0 million accordion feature.
On June 7, 2021, the Company amended its existing Credit Facility to extend its maturity to June 8, 2025 and increase the Credit Facility to $200.0 million with a $100.0 million accordion feature (the "Amended Credit Facility"). Amounts drawn under the Amended Credit Facility are subject to variable interest rates at LIBOR plus an applicable margin ranging from 2.0% to 3.0%, based on the Company's net leverage ratio. The Amended Credit Facility contains fallback language that replaces LIBOR with an alternative benchmark rate based on either SOFR or another alternative benchmark rate when LIBOR ceases to exist. Undrawn amounts are subject to a standby fee ranging from 0.4% to 0.6%, based on the Company's net leverage ratio.
The Amended Credit Facility also provides for financial letters of credit at 66.0% of the applicable margin, undrawn fees are subject to a utilization fee of 0.25%, and standby fees are calculated as 25% of the drawn applicable margin plus a utilization fee ranging from 0.25% to 0.75%.
SSR Mining Inc.
Notes to Consolidated Financial Statements
All debts, liabilities and obligations under the Credit Facility are guaranteed by the Company's material subsidiaries and secured by certain of the Company's assets and material subsidiaries, and pledges of the securities of the Company's material subsidiaries, excluding Alacer entities. In connection with the Credit Facility, the Company must also maintain certain net tangible worth and ratios for interest coverage and net leverage. As of December 31, 2021, the Company was in compliance with these covenants.
As of December 31, 2021 and 2020, the amount outstanding on the Credit Facility, included in Accrued liabilities and other, was $0.9 million and $0.7 million, respectively.
Scheduled minimum debt repayments are as follows (in thousands):
| | | | | | | | |
| 2022 | $ | 71,093 | |
| 2023 | $ | 70,918 | |
| 2024 | $ | — | |
| 2025 | $ | — | |
| 2026 | $ | — | |
| Thereafter | $ | 230,000 | |
18.LEASES
The Company’s operating leases consist primarily of leases for office space, vehicles, and plant and mining equipment. These leases have a range of terms between three months to twenty years with renewal terms included in the contracts. Some are automatic renewals, and some are at the option of the Company. There are no restrictions placed upon the lessee by entering into these leases. The Company’s finance leases consist primarily of equipment.
The Company's principal lease relates to its right to use the oxygen plant supplied by Air Liquide Gaz Sanayi ve Ticaret A.S. (the "Air Liquide Plant") at Çöpler which was assumed on the acquisition of Alacer (see Note 3). The Air Liquide Plant is used for the production, transportation and delivery of oxygen and liquid oxygen to support mining operations at Çöpler. Under the terms of the Air Liquide Plant lease, the Company pays variable monthly lease payments that depend on an index. In addition, the Company is subject to variable payments based on consumption and use which have been accounted for as non-lease components and included in Production costs. The Air Liquide Plant lease contains a non-cancellable period of 15 years ending in 2033 with options to extend for consecutive 2-year periods. The lease term used in the measurement of the Company's lease liability and right-of-use asset includes four consecutive 2-year extension periods ending in 2041 for which the Company is reasonably certain to exercise its option in line with the Çöpler LOM.
The Company uses its incremental borrowing rate as the discount rate to determine the present value of the lease payments, as the leases do not have readily determinable implicit discount rates. The Company’s incremental borrowing rate is the rate of interest that it would have to borrow on a collateralized basis over a similar term and amount in a similar economic environment to pay its lease obligations. The Company determines the incremental borrowing rates for its leases by adjusting the local risk-free interest rate with a credit risk premium corresponding to its credit rating. From time to time, the Company may enter into arrangements for the construction or purchase of an asset and then enter into a financing arrangement to lease the asset. The Company recognizes leased assets and liabilities under these arrangements when it obtain control of the asset.
SSR Mining Inc.
Notes to Consolidated Financial Statements
The components of the Company’s leases presented in the Consolidated Balance Sheets were as follows (in thousands):
| | | | | | | | | | | | | | | | | | | | |
| | December 31, |
| | 2021 | | 2020 |
Finance lease right-of-use assets, net (included in Mineral properties, plant and equipment, net) | | $ | 114,882 | | | $ | 112,808 | |
Operating lease right-of-use assets (included in Other non-current assets) | | | 7,530 | | | | 9,362 | |
Total lease right-of-use-assets | | $ | 122,412 | | | $ | 122,170 | |
| | | | | | |
Short-term finance lease liabilities (included in Finance lease liabilities) | | $ | 12,439 | | | $ | 3,568 | |
Short-term operating lease liabilities (included in Accrued liabilities and other) | | | 2,238 | | | | 1,954 | |
Long-term finance lease liabilities (included in Finance Lease liabilities) | | | 105,965 | | | | 109,544 | |
Long-term operating lease liabilities (included in Other non-current liabilities) | | | 5,525 | | | | 7,530 | |
Total lease liabilities | | $ | 126,167 | | | $ | 122,596 | |
The components of the Company’s leases presented in the Consolidated Statements of Operations for the years ended December 31 were as follows (in thousands):
| | | | | | | | | | | | | | | | | | | | | | | | | | | | | |
| | Years Ended December 31, |
| | 2021 | | 2020 | | 2019 |
| Operating leases | | $ | 2,986 | | | $ | 1,260 | | | $ | 521 | |
| | | | | | | | | | |
| Finance leases: | | | | | | | | | |
Amortization of lease cost | | | 2,517 | | | | 92 | | | | 70 | |
Interest expense on lease liabilities | | | 274 | | | | 12 | | | | 14 | |
| Variable and short-term leases | | | 10,661 | | | | 3,615 | | | | — | |
| Total | | $ | 16,438 | | | $ | 4,979 | | | $ | 605 | |
For finance leases, amortization and interest expense is included in Interest expense. For operating leases, lease expense is included in Production costs for entities with production and General and administrative expense for entities without production.
The components of the Company’s leases presented in the statements of cash flows for the years ended December 31 were as follows (in thousands):
| | | | | | | | | | | | | | | | | | | | | | | | | | | | | |
| | Years Ended December 31, |
| | 2021 | | 2020 | | 2019 |
| Operating leases within cash flows from operating activities | | $ | 2,986 | | | $ | 1,260 | | | $ | 521 | |
| Finance leases within cash flows from financing activities | | $ | 10,441 | | | $ | 3,623 | | | $ | 554 | |
SSR Mining Inc.
Notes to Consolidated Financial Statements
The following is a schedule of weighted-average discount rates used to determine lease liabilities and remaining lease terms for the years ended December 31:
| | | | | | | | | | | | | | |
| | Years Ended December 31, |
| | 2021 | | 2020 |
| Weighted-average remaining lease term - operating leases (in years) | | 5.5 | | 5.9 |
| Weighted-average remaining lease term - finance leases (in years) | | 19.1 | | 20.7 |
| Weighted-average discount rate - operating leases | | 8.6 | % | | 9.4 | % |
| Weighted-average discount rate - finance leases | | 4.5 | % | | 4.6 | % |
The following is a schedule of future minimum lease payments under noncancellable finance and operating leases as of December 31, 2021 (in thousands):
| | | | | | | | | | | | | | | | | | | | |
| | Operating Leases | | Finance Leases |
2022 | | $ | 2,950 | | | $ | 16,907 | |
2023 | | | 1,520 | | | | 8,532 | |
2024 | | | 1,374 | | | | 8,532 | |
2025 | | | 1,218 | | | | 8,532 | |
2026 | | | 1,234 | | | | 8,532 | |
| Thereafter | | | 1,548 | | | | 122,023 | |
Total minimum lease payments | | $ | 9,844 | | | $ | 173,058 | |
Less: amounts representing interest | | | 2,081 | | | | 54,654 | |
Present value of net minimum lease payments | | | 7,763 | | | | 118,404 | |
Less: current portion of lease liabilities | | | 2,238 | | | | 12,439 | |
Long-term lease liabilities | | $ | 5,525 | | | $ | 105,965 | |
19.SUPPLEMENTAL CASH FLOW INFORMATION
Net change in operating assets and liabilities during the years ended December 31 were as follows (in thousands):
| | | | | | | | | | | | | | | | | | | | | | | | | | |
| Years Ended December 31, |
| | 2021 | | 2020 | | 2019 |
Decrease (increase) in operating assets: | | | | | | | | |
Trade and other receivables | $ | (38,138) | | | $ | 5,132 | | | $ | (44,465) | |
Inventories | | (20,848) | | | | (21,660) | | | | (11,368) | |
Other operating assets | | (1,516) | | | | 17,781 | | | | 1,375 | |
Increase (decrease) in operating liabilities: | | | | | | | | |
Accounts payable | | (6,882) | | | | 7,761 | | | | 16,732 | |
Accrued liabilities | | 38,761 | | | | (1,574) | | | | (401) | |
Reclamation liabilities | | (243) | | | | (2,447) | | | | (3,568) | |
Other operating liabilities | | (429) | | | | (45,585) | | | | (24,474) | |
| | $ | (29,295) | | | $ | (40,592) | | | $ | (66,169) | |
SSR Mining Inc.
Notes to Consolidated Financial Statements
Other cash information during the years ended December 31 were as follows (in thousands):
| | | | | | | | | | | | | | | | | | | | | | | | | | |
| Years Ended December 31, |
| | 2021 | | 2020 | | 2019 |
| Interest paid | $ | (12,512) | | | $ | (13,638) | | | $ | (11,646) | |
Interest received | $ | 5,315 | | | $ | 3,665 | | | $ | 9,697 | |
| Income taxes paid | $ | (58,000) | | | $ | (43,744) | | | $ | (20,850) | |
20.COMMITMENTS AND CONTINGENCIES
General
Estimated losses from loss contingencies are accrued by a charge to income when information is available prior to the issuance of the financial statements that indicates it is probable that a liability could be incurred, and the amount of the loss can be reasonably estimated. Legal expenses associated with the loss contingency are expensed as incurred. If a loss contingency is not probable or reasonably estimable, disclosure of the loss contingency is made in the financial statements when it is at least reasonably possible that a material loss could be incurred.
Environmental matters
The Company uses surety bonds to support certain environmental bonding obligations. As of December 31, 2021 and 2020, the Company had surety bonds totaling $117.0 million and $117.5 million outstanding, respectively.
Other commitments and contingencies
The Company is involved in legal proceedings related to its course of business. Management does not believe that these legal cases will have a material effect on the Company’s financial condition or results of the operation.
21.SUBSEQUENT EVENTS
Disposal
On January 12, 2022, the Company entered into an agreement with Endeavour Silver Corp. ("Endeavour Silver") to sell its Pitarrilla project in Durango, Mexico, included in the Company's Exploration, evaluation and development properties segment, in exchange for consideration including $35.0 million in common shares of Endeavour Silver, $35.0 million in cash, and a 1.25% net smelter returns royalty on the Pitarrilla property. The transaction is expected to close in the first half of 2022.
Dividend
On February 22, 2022, the Company declared a quarterly cash dividend of $0.07 per common share, payable on April 4, 2022 to holders of record at the close of business on March 7, 2022.
SSR Mining Inc.
Notes to Consolidated Financial Statements
ITEM 9. CHANGES IN AND DISAGREEMENTS WITH ACCOUNTANTS ON ACCOUNTING AND FINANCIAL DISCLOSURE
None.
ITEM 9A. CONTROLS AND PROCEDURES
Evaluation of Disclosure Controls and Procedures
The Management of the Company is responsible for establishing and maintaining adequate internal controls over financial reporting. Internal controls over financial reporting is defined in Rule 13a-15(f) or 15d-15(f) under the Securities Exchange Act of 1934 as a process designed by, or under the supervision of, the Company’s principal executive and principal financial officers and effected by the Company’s Board of Directors, Management and other personnel, to provide reasonable assurance regarding the reliability of financial reporting and the preparation of financial statements for external purposes in accordance with generally accepted accounting principles (GAAP) and includes those policies and procedures that:
•Pertain to the maintenance of records that in reasonable detail accurately and fairly reflect the transactions and dispositions of the Company’s assets;
•Provide reasonable assurance that transactions are recorded as necessary to permit preparation of financial statements in accordance with generally accepted accounting principles, and that receipts and expenditures of the Company are being made only in accordance with authorizations of Management and directors of the Company; and
•Provide reasonable assurance regarding prevention or timely detection of unauthorized acquisition, use or disposition of the Company’s assets that could have a material effect on the financial statements.
Definition and Limitations of Internal Control Over Financial Reporting
Because of its inherent limitations, internal controls over financial reporting may not prevent or detect misstatements. Projections of any evaluation of effectiveness to future periods are subject to risk that controls may become inadequate because of changes in conditions, or that the degree of compliance with the policies or procedures may deteriorate.
Management's Report on Internal Control Over Financial Reporting
The Company’s Management assessed the effectiveness of the Company’s internal controls over financial reporting as of December 31, 2021. In making this assessment, the Company’s Management used the criteria set forth by the Committee of Sponsoring Organizations of the Treadway Commission ("COSO") in Internal Control-Integrated Framework 2013. Based upon its assessment, Management concluded that, at December 31, 2021, the Company’s internal controls over financial reporting were effective.
PricewaterhouseCoopers LLP, an independent registered public accounting firm, has audited our financial statements included in this Annual Report and issued its attestation report on the effectiveness of our internal control over financial reporting as of December 31, 2021, which is included herein.
Changes in Internal Control Over Financial Reporting
There were no changes in our internal control over financial reporting (as such term is defined in Rules 13a–15(f) and 15d–15(f) under the Exchange Act) that occurred during our most recent quarter, that has materially affected, or is reasonably likely to materially affect, our internal control over financial reporting.
ITEM 9B. OTHER INFORMATION
None.
ITEM 9C. DISCLOSURE REGARDING FOREIGN JURISDICTIONS THAT PREVENT INSPECTIONS
Not applicable.
PART III
ITEM 10. DIRECTORS, EXECUTIVE OFFICERS AND CORPORATE GOVERNANCE
Information concerning this item is contained in the Company's definitive Proxy Statement for its Annual Meeting of Shareholders to be filed with the Securities and Exchange Commission pursuant to Regulation 14A or, if such definitive Proxy Statement is not filed with the Securities and Exchange Commission within 120 days after the close of the Company’s fiscal year, an amendment to this Annual Report filed under cover of Form 10-K/A.
ITEM 11. EXECUTIVE COMPENSATION
Information concerning this item is contained in the Company's definitive Proxy Statement for its Annual Meeting of Shareholders to be filed with the Securities and Exchange Commission pursuant to Regulation 14A or, if such definitive Proxy Statement is not filed with the Securities and Exchange Commission within 120 days after the close of the Company’s fiscal year, an amendment to this Annual Report filed under cover of Form 10-K/A.
ITEM 12. SECURITY OWNERSHIP OF CERTAIN BENEFICIAL OWNERS AND MANAGEMENT AND RELATED STOCKHOLDER MATTERS
Information concerning this item is contained in the Company's definitive Proxy Statement for its Annual Meeting of Shareholders to be filed with the Securities and Exchange Commission pursuant to Regulation 14A or, if such definitive Proxy Statement is not filed with the Securities and Exchange Commission within 120 days after the close of the Company’s fiscal year, an amendment to this Annual Report filed under cover of Form 10-K/A.
ITEM 13. CERTAIN RELATIONSHIPS AND RELATED TRANSACTIONS, AND DIRECTOR INDEPENDENCE
Information concerning this item is contained in the Company's definitive Proxy Statement for its Annual Meeting of Shareholders to be filed with the Securities and Exchange Commission pursuant to Regulation 14A or, if such definitive Proxy Statement is not filed with the Securities and Exchange Commission within 120 days after the close of the Company’s fiscal year, an amendment to this Annual Report filed under cover of Form 10-K/A.
ITEM 14. PRINCIPAL ACCOUNTING FEES AND SERVICES
Information concerning this item is contained in the Company's definitive Proxy Statement for its Annual Meeting of Shareholders to be filed with the Securities and Exchange Commission pursuant to Regulation 14A or, if such definitive Proxy Statement is not filed with the Securities and Exchange Commission within 120 days after the close of the Company’s fiscal year, an amendment to this Annual Report filed under cover of Form 10-K/A.
PART IV
ITEM 15. EXHIBITS, FINANCIAL STATEMENT SCHEDULES
(a) The following documents are filed as a part of this Annual Report:
1. Consolidated financial statements: the consolidated financial statements and the Report of Independent Registered Public Accounting Firm (PCAOB ID 271) are included in Item 8. Financial Statements and Supplementary Data, of this Annual Report on Form 10-K.
2. Financial statement schedules: All schedules have been omitted because they are inapplicable, not required, or the information is included in the above referenced consolidated financial statements or the notes thereto.
3. Exhibits furnished pursuant to the requirements of Form 10-K:
| | | | | |
| Exhibit Number |
| 2.1 | |
| 3.1 | Memorandum, Articles and Certificate of Incorporation (incorporated by reference to Exhibit 1.1 to the Registrant’s Registration Statement on Form 20-F (File No. 0-26424), filed on July 13, 1995). |
| 3.2 | |
| 4.1 | |
| 4.2 | |
4.3 + | |
| 4.4 | |
10.1 + | |
| 10.2 + | Amending Agreement No. 1 to Credit Agreement, dated May 31, 2016, among SSR Mining, as the Borrower, and The Canadian Imperial Bank of Commerce, as the Sole Lead Arranger, Sole Bookrunner and Administrative Agent, Bank of Montreal and The Bank of Nova Scotia, as Co-Syndication Agents, and Royal Bank of Canada and ING Capital LLC, as Lenders. |
| 10.3 + | Amending Agreement No. 2 to Credit Agreement, dated June 8, 2017, among SSR Mining, as the Borrower, and The Canadian Imperial Bank of Commerce, as the Sole Lead Arranger, Sole Bookrunner and Administrative Agent, Bank of Montreal and The Bank of Nova Scotia, as Co-Syndication Agents, and Royal Bank of Canada and ING Capital LLC, as Lenders. |
| | | | | |
| 10.4 + | Amending Agreement No. 3 to Credit Agreement, dated January 21, 2020, among SSR Mining, as the Borrower, and The Canadian Imperial Bank of Commerce, as the Sole Lead Arranger, Sole Bookrunner and Administrative Agent, Bank of Montreal and The Bank of Nova Scotia, as Co-Syndication Agents, and Royal Bank of Canada and ING Capital LLC, as Lenders. |
| 10.5 + | Amending Agreement No. 4 to Credit Agreement, dated June 3, 2020, among SSR Mining, as the Borrower, and The Canadian Imperial Bank of Commerce, as the Sole Lead Arranger, Sole Bookrunner and Administrative Agent, Bank of Montreal and The Bank of Nova Scotia, as Co-Syndication Agents, and Royal Bank of Canada and ING Capital LLC, as Lenders. |
| 10.6 + | Amended and Restated Facility Agreement, dated Jun 16, 2016, among Anagold Madencilik Sanayi ve Ticaret A.S., as the Borrower, Alacer Gold Corp., Lidya Madencilik Sanayi ve Ticaret A.S., Alacer Gold Madencilik A.S., Banka Kombetare Tregtare SHA, Societe Generale, London Branch, BNP Paribas (Suisse) SA, ING Bank N.V. and Unicredit Bank Austria AG, each as a Mandated Lead Arranger, ING Bank N.V., as the Facility Agent and Security Holder, BNP Paribas (Suisse) SA, as Technical Agent, Societe Generale, London Branch, as Documentation Agent, the Financial Institutions party thereto as Hedge Providers, and the Financial Institutions party thereto as Financial Institutions. |
| 10.7 | |
| 10.8 * | |
| 10.9 * | |
| 10.10 * | |
| 10.11 * | |
| 10.12 * | |
| 10.13 + | |
| 10.14 + | |
| 10.15 + | |
| 10.16 + | |
| 10.17 + | |
| 10.18 + | |
| 10.19 + | |
| 10.20 * | |
| 10.21 * | |
| 10.22 * | |
| 10.23 * | |
| | | | | |
| 21 + | |
| 23.1 + | |
| 23.2 + | |
| 23.3 + | |
| 23.4 + | |
| 23.5 + | |
| 23.6 + | |
| 23.7 + | |
| 31.1 + | |
| 31.2 + | |
| 32.1++ | |
| 32.2++ | |
| 95 + | |
| 96.1 + | |
| 96.2 + | |
| 96.3 + | |
| 96.4 + | |
| 101 + | The following materials from the Registrant’s Annual Report on Form 10-K for the fiscal year ended December 31, 2021 formatted in Inline XBRL: (i) the Consolidated Balance Sheets; (ii) the Consolidated Statements of Operations; (iii) the Consolidated Statements of Comprehensive Income; (iv) the Consolidated Statements of Shareholders’ Equity; (v) the Consolidated Statements of Cash Flows; and (vi) the Notes to the Consolidated Financial Statements. |
| 104 + | Cover Page Interactive Data File (embedded within the Inline XBRL document). |
| + | Filed herewith |
| ++ | Furnished herewith |
| * | Indicates a management contract or compensatory plan or arrangement. |
ITEM 16. FORM 10-K SUMMARY.
None.
SIGNATURES
Pursuant to the requirements of Section 13 or 15(d) of the Securities Exchange Act of 1934, the registrant has duly caused this report to be signed on its behalf by the undersigned, thereunto duly authorized.
| | | | | |
| SSR MINING INC.
Registrant |
| Date: February 23, 2022 | /s/ Rodney P. Antal |
| Name: Rodney P. Antal
Title: President and Chief Executive Officer |
Pursuant to the requirements of the Securities Exchange Act of 1934, this report has been signed below by the following persons on behalf of the registrant and in the capacities and on the dates indicated.
| | | | | | | | |
| Name | Position | Date |
| | | |
| /s/ Rodney P. Antal | President, Chief Executive Officer and Director | February 23, 2022 |
| Rodney P. Antal | (Principal Executive Officer) | |
| | | |
| /s/ Alison White | Executive Vice President, Chief Financial Officer | February 23, 2022 |
| Alison White | (Principal Financial Officer) | |
| | |
| /s/ Russell Farnsworth | Vice President, Controller | February 23, 2022 |
| Russell Farnsworth | (Principal Accounting Officer) | |
| | |
| /s/ A.E. Michael Anglin | Chairman of the Board of Directors | February 23, 2022 |
| A.E. Michael Anglin | | |
| | | |
| /s/ Thomas Bates, Jr. | Director | February 23, 2022 |
| Thomas Bates, Jr. | | |
| | |
| /s/ Brian R. Booth | Director | February 23, 2022 |
| Brian R. Booth | | |
| | | |
| /s/ Edward Dowling Jr. | Director | February 23, 2022 |
| Edward Dowling Jr. | | |
| | | |
| /s/ Simon A. Fish | Director | February 23, 2022 |
| Simon A. Fish | | |
| | |
| /s/ Alan P. Krusi | Director | February 23, 2022 |
| Alan P. Krusi | | |
| | |
| /s/ Kay Priestly | Director | February 23, 2022 |
| Kay Priestly | | |