Exhibit 99.1


Essex Announces First Quarter 2020 Results and Withdraws Full-Year Guidance
San Mateo, California—May 6, 2020—Essex Property Trust, Inc. (NYSE: ESS) (the
“Company”) announced today its first quarter 2020 earnings results and related business activities.
Net Income, Funds from Operations (“FFO”), and Core FFO per diluted share for the quarter ended March 31, 2020 are detailed below.
|
Three Months Ended
March 31,
|
%
|
|||||||||||||
|
2020
|
2019
|
Change
|
||||||||||||
|
Per Diluted Share
|
||||||||||||||
|
Net Income
|
|
$4.76
|
|
$1.81
|
163.0%
|
|
||||||||
|
Total FFO
|
|
$3.44
|
|
$3.34
|
3.0%
|
|
||||||||
|
Core FFO
|
|
$3.48
|
|
$3.23
|
7.7%
|
|
||||||||
|
|
||||||||||||||
First Quarter 2020 Highlights:
| • |
Reported Net Income per diluted share for the first quarter of 2020 of $4.76, compared to $1.81 in the first quarter of 2019. The increase is largely attributable to a gain on
remeasurement of co-investments in the first quarter of 2020.
|
| • |
Grew Core FFO per diluted share by 7.7% compared to the first quarter of 2019, exceeding the midpoint of the first quarter guidance range by $0.07 per share.
|
| • |
Achieved same-property gross revenue and net operating income (“NOI”) growth of 3.2% and 3.9%, respectively, compared to the first quarter of 2019.
|
| • |
Increased the dividend by 6.5% to an annual distribution of $8.31 per common share, our 26th consecutive annual increase.
|
| • |
Committed $106.4 million in two preferred equity investments and an investment in subordinated loans at a weighted average return of 11.2%.
|
| • |
Issued $500.0 million of 12-year senior unsecured notes due in 2032 at an interest rate per annum of 2.65% and an effective yield of 2.69%.
|
| • |
Repurchased $176.3 million in common stock at an average price per share of $227.13 under the stock buyback program.
|
| • |
As of May 4, 2020, the Company’s immediately available liquidity exceeded $1.0 billion.
|
1100 Park Place Suite 200 San Mateo California 94403 telephone 650 655 7800 facsimile 650 655 7810
www.essex.com
| • |
Acquired its joint venture partner’s 45.0% interest in a land parcel and six communities representing 2,020 apartment homes, together valued at approximately $1.0 billion on a gross
basis. The Company recognized $6.5 million of promote income related to this transaction in the first quarter.
|
“We are pleased with the thoughtful and caring response by the Essex team with respect to the unprecedented challenges from the COVID-19 pandemic. Early in the crisis, we
acted decisively to implement protocols to protect Essex team-members, financially assist impacted residents, and maintain essential housing services. The solid start to 2020, as reflected in our first quarter financial results, is not expected to
continue given the extraordinary effects of the pandemic and ongoing economic fallout. Given that it’s impossible to reasonably predict the future course of the COVID-19 virus, and thus its economic consequences such as job loss and reduced rental
demand across the country, we have withdrawn our previously-provided guidance ranges for 2020. While we cannot predict the depth or the duration of the pandemic, we remain committed to our mission and believe that the defensive characteristics of
apartments, the durability of the technology industries, and the Company’s strong financial condition will allow us to seek opportunity while managing through broad market disruption,” commented Michael Schall, President and CEO of the Company.
Same-Property Operations
Same-property operating results exclude any properties that are not comparable for the periods presented. The table below illustrates the percentage change in same-property
gross revenues for the quarter ended March 31, 2020 compared to the quarter ended March 31, 2019, and the sequential percentage change for the quarter ended March 31, 2020 compared to the quarter ended December 31, 2019, by submarket for the Company:
|
Q1 2020 vs.
Q1 2019
|
Q1 2020 vs.
Q4 2019
|
% of Total
|
||||||||||
|
Gross
Revenues
|
Gross
Revenues
|
Q1 2020
Revenues
|
||||||||||
|
Southern California
|
||||||||||||
|
Los Angeles County
|
2.2%
|
|
-0.3%
|
|
19.0%
|
|
||||||
|
Orange County
|
3.1%
|
|
-0.2%
|
|
11.0%
|
|
||||||
|
San Diego County
|
3.7%
|
|
0.7%
|
|
8.2%
|
|
||||||
|
Ventura County
|
2.5%
|
|
0.6%
|
|
4.4%
|
|
||||||
|
Total Southern California
|
2.7%
|
|
0.0%
|
|
42.6%
|
|
||||||
|
Northern California
|
||||||||||||
|
Santa Clara County
|
3.4%
|
|
0.2%
|
|
19.0%
|
|
||||||
|
Alameda County
|
2.3%
|
|
-0.9%
|
|
6.9%
|
|
||||||
|
San Mateo County
|
3.3%
|
|
0.1%
|
|
5.1%
|
|
||||||
|
Contra Costa County
|
2.1%
|
|
-0.5%
|
|
4.8%
|
|
||||||
|
San Francisco
|
4.1%
|
|
-0.3%
|
|
3.3%
|
|||||||
|
Total Northern California
|
3.1%
|
|
-0.1%
|
|
39.1%
|
|
||||||
|
Seattle Metro
|
4.7%
|
|
0.6%
|
|
18.3%
|
|
||||||
|
Same-Property Portfolio
|
3.2%
|
|
0.1%
|
|
100.0%
|
|
||||||
- 2 -
|
Year-Over-Year Growth
|
||||||||||||
|
Q1 2020 compared to Q1 2019
|
||||||||||||
|
Gross
Revenues
|
Operating
Expenses
|
NOI
|
||||||||||
|
Southern California
|
2.7%
|
|
2.4%
|
|
2.9%
|
|
||||||
|
Northern California
|
3.1%
|
|
1.8%
|
|
3.5%
|
|
||||||
|
Seattle Metro
|
4.7%
|
|
-1.8%
|
|
7.6%
|
|
||||||
|
Same-Property Portfolio
|
3.2%
|
|
1.3%
|
|
3.9%
|
|
||||||
|
Sequential Growth
|
||||||||||||
|
Q1 2020 compared to Q4 2019
|
||||||||||||
|
Gross
Revenues
|
Operating
Expenses
|
NOI
|
||||||||||
|
Southern California
|
0.0%
|
|
2.4%
|
|
-0.9%
|
|
||||||
|
Northern California
|
-0.1%
|
|
-0.8%
|
|
0.1%
|
|
||||||
|
Seattle Metro
|
0.6%
|
|
3.3%
|
|
-0.4%
|
|
||||||
|
Same-Property Portfolio
|
0.1%
|
|
1.4%
|
|
-0.4%
|
|
||||||
|
Financial Occupancies
|
||||||||||||
|
Quarter Ended
|
||||||||||||
|
3/31/2020
|
12/31/2019
|
3/31/2019
|
||||||||||
|
Southern California
|
96.6%
|
|
97.0%
|
|
96.8%
|
|
||||||
|
Northern California
|
96.9%
|
|
97.2%
|
|
97.1%
|
|
||||||
|
Seattle Metro
|
96.9%
|
|
97.1%
|
|
96.9%
|
|
||||||
|
Same-Property Portfolio
|
96.8%
|
|
97.1%
|
|
96.9%
|
|
||||||
Investment Activity
Real Estate
In January 2020, the Company purchased Canada Pension Plan Investment Board’s (“CPP Investments”) 45.0% interest in a land parcel and six communities valued at
approximately $1.0 billion on a gross basis. The six communities totaling 2,020 apartment homes were consolidated on the Company’s financials in mid-January. As a result of the acquisition, the Company reported a remeasurement gain of $234.7 million
in the first quarter of 2020, which is excluded from Total and Core FFO. The Company recognized approximately $6.5 million of promote income in the first quarter of 2020 associated with this transaction, which is excluded from Core FFO.
Other Investments
In the first quarter of 2020, the Company originated two preferred equity investments totaling $91.4 million and comprised of two multifamily communities located in
California. The investments have a weighted average return of 11.3% with most of the proceeds expected to fund in late 2020 and early 2021.
In March 2020, the Company committed to fund an investment in subordinated loans totaling $15.0 million as part of the development of a multifamily community located in Los
Angeles, CA. The investment has an
- 3 -
initial preferred return of 10.5% and matures in 2023. The initial funding for this investment is expected to occur by the third quarter of 2020.
In the first quarter of 2020, the Company received cash proceeds of $28.2 million from the full or partial redemption of a preferred equity investment and a subordinated
loan investment. The Company recorded $0.2 million of income from prepayment penalties as a result of the early redemptions, which has been excluded from Core FFO.
Development Activity
The table below represents the development communities in lease-up and the current leasing
status as of May 4, 2020. The Company has minimal development funding requirements and currently has no new development starts planned in 2020.
|
Project Name
|
Location
|
Total
Apartment
Homes
|
ESS
Ownership
|
% Leased
as of
05/04/20
|
Status
|
||||||||||
|
500 Folsom
|
San Francisco, CA
|
537
|
50%
|
|
53.3%
|
|
In Lease-Up
|
||||||||
|
Mylo
|
Santa Clara, CA
|
476
|
100%
|
|
34.7%
|
|
In Lease-Up
|
||||||||
|
Station Park Green – Phase III
|
San Mateo, CA
|
172
|
100%
|
|
36.6%
|
|
In Lease-Up
|
||||||||
|
Patina at Midtown
|
San Jose, CA
|
269
|
50%
|
|
0.4%
|
|
Pre-leasing
|
||||||||
|
Total/Average % Leased
|
1,454
|
35.4%
|
|
||||||||||||
Liquidity and Balance Sheet
Common Stock
In the first quarter of 2020, the Company repurchased 776,261 shares of its common stock totaling $176.3 million, including commissions, at an average price
of $227.13 per share. As of May 6, 2020, the Company had $73.7 million of purchase authority remaining under the stock repurchase plan.
The Company did not issue any shares of common stock through its equity distribution program in the first quarter of 2020.
Balance Sheet
In January 2020, the Company extended the maturity date of its $1.2 billion unsecured line of credit facility to mature in December 2023 with one 18-month extension,
exercisable at the Company’s option. Pricing on the line of credit remained unchanged at LIBOR + 0.825%.
In February 2020, the Company issued $500.0 million of 12-year senior unsecured notes due in 2032 at an interest rate per annum of 2.65% and an effective yield of 2.69%.
The proceeds paid down the Company’s line of credit, which had been used to fund the buyout of CPP’s 45.0% interest in a land parcel and six communities, as well as to repay $100.3 million of secured debt during the quarter with a cash rate of 5.3%
and an effective rate of 4.1%.
- 4 -
Subsequent to quarter end, the Company obtained a $200.0 million unsecured term loan, priced at LIBOR + 1.20% with a one-year maturity and two 12-month extension options,
exercisable at the Company’s option. The proceeds will be used to repay all remaining consolidated debt maturing in 2020, of which $169.6 million was prepaid on April 30, 2020, with an effective rate of 7.1% and a cash rate of 4.3%.
As of May 4, 2020, the Company had $885 million in undrawn capacity on its unsecured credit facilities and over $1.0 billion in available liquidity.
Guidance
For the first quarter of 2020, the Company exceeded the midpoint of the guidance
range provided in its fourth quarter 2019 earnings release for Core FFO by $0.07 per share.
The following table provides a reconciliation of first quarter 2020 Core FFO per share to the midpoint of the guidance provided in the fourth quarter 2019 earnings release,
which was dated January 29, 2020.
|
Per Diluted
Share
|
||||
|
Projected midpoint of Core FFO per share for Q1 2020
|
$
|
3.41
|
||
|
NOI from consolidated communities
|
0.04
|
|||
|
FFO from Co-Investments
|
0.01
|
|||
|
G&A and other
|
0.02
|
|||
|
Core FFO per share for Q1 2020 reported
|
$ |
3.48
|
Due to the economic disruption and inherent uncertainty of the COVID-19 pandemic, the Company is withdrawing its full-year guidance. As a result of
COVID-19, the Company has provided additional disclosures on its operations for April 2020 on page S-15 along with updated 2020 supply, job, and rent growth projections in its core markets and other economic data starting on page S-16 of the
supplemental financial information.
COVID-19 Response
Essex’s top priorities remain the health and safety of the Company’s residents and employees as well as providing the necessary
resources and flexibility to assist those who need it most during this unprecedented time. Early in the crisis, the Company announced that it was halting evictions and creating payment plans for those who have been financially impacted by the
pandemic, including our commercial tenants. The Company also began offering lease renewals with no rent increases to all residents. For employees, the Company has provided additional paid leave and instituted numerous policies to maintain a safe work
environment. Despite the ongoing challenges of the pandemic, the Essex team is working hard to ensure that all of our stakeholders are safe and supported.
Conference Call with Management
The Company will host an earnings conference call with management to discuss its quarterly results on Thursday, May 7, 2020 at 10 a.m. PT (1 p.m. ET), which will be
broadcast live via the Internet at
- 5 -
www.essex.com, and accessible via phone by dialing toll-free, (877) 407-0784, or toll/international, (201) 689-8560. No passcode is necessary.
A rebroadcast of the live call will be available online for 30 days and digitally for 7 days.
To access the replay online, go to www.essex.com and select the first quarter 2020 earnings
link. To access the replay, dial (844) 512-2921 using the replay pin number 13700927. If you are unable to access the information via the Company’s website, please contact the Investor Relations Department at investors@essex.com or by calling (650) 655-7800.
Corporate Profile
Essex Property Trust, Inc., an S&P 500 company, is a fully integrated real estate investment trust (REIT) that acquires, develops,
redevelops, and manages multifamily residential properties in selected West Coast markets. Essex currently has ownership interests in 250 apartment communities comprising approximately 60,000 apartment homes with an additional 6 properties in various stages of active development.
Additional information about the Company can be found on the Company’s website at www.essex.com.
This press release and accompanying supplemental financial information has been furnished to the Securities and Exchange Commission electronically on Form 8-K and can be
accessed from the Company’s website at www.essex.com.
If you are unable to obtain the information via the Web, please contact the Investor Relations Department at (650) 655-7800.
FFO RECONCILIATION
FFO, as defined by the National Association of Real Estate Investment Trusts (“NAREIT”), is generally considered by industry analysts as an
appropriate measure of performance of an equity REIT. Generally, FFO adjusts the net income of equity REITs for non-cash charges such as depreciation and amortization of rental properties, impairment charges, gains on sales of real estate and
extraordinary items. Management considers FFO and FFO which excludes non-core items, which is referred to as “Core FFO,” to be useful supplemental operating performance measures of an equity REIT because, together with net income and cash flows, FFO
and Core FFO provide investors with additional bases to evaluate the operating performance and ability of a REIT to incur and service debt and to fund acquisitions and other capital expenditures and to pay dividends. By excluding gains or losses
related to sales of depreciated operating properties and excluding real estate depreciation (which can vary among owners of identical assets in similar condition based on historical cost accounting and useful life estimates), FFO can help investors
compare the operating performance of a real estate company between periods or as compared to different companies. By further adjusting for items that are not considered part of the Company’s core business operations, Core FFO allows investors to
compare the core operating performance of the Company to its performance in prior reporting periods and to the operating performance of other real estate companies without the effect of items that by their nature are not comparable from period to
period and tend to obscure the Company’s actual operating results. FFO and Core FFO do not represent net income or cash flows from operations as defined by U.S. generally accepted accounting principles (“GAAP”) and are not intended to indicate
whether cash flows will be sufficient to fund cash needs. These measures should not be considered as alternatives to net income as an indicator of the REIT's operating performance or to cash flows as a measure of liquidity. FFO and Core FFO do not
measure whether cash flow is sufficient to fund all cash needs including principal amortization, capital improvements and distributions to stockholders. FFO and Core FFO also do not represent cash flows generated from operating, investing or
financing activities as defined under GAAP. Management has consistently applied the NAREIT definition of FFO to all periods presented. However, there is judgment involved and other REITs’ calculation of FFO may vary from the NAREIT definition for
this measure, and thus their disclosures of FFO may not be comparable to the Company’s calculation.
- 6 -
The following table sets forth the Company’s calculation of diluted FFO and Core FFO for the three months ended March 31, 2020 and 2019 (in thousands, except for share and
per share amounts):
|
Three Months Ended
March 31,
|
||||||||
|
Funds from Operations attributable to common stockholders and unitholders
|
2020
|
2019
|
||||||
|
Net income available to common stockholders
|
$
|
315,006
|
$
|
118,858
|
||||
|
Adjustments:
|
||||||||
|
Depreciation and amortization
|
131,559
|
120,568
|
||||||
|
Gains not included in FFO
|
(234,694
|
)
|
(31,535
|
)
|
||||
|
Depreciation and amortization from unconsolidated co-investments
|
12,544
|
15,190
|
||||||
|
Noncontrolling interest related to Operating Partnership units
|
10,986
|
4,171
|
||||||
|
Depreciation attributable to third party ownership and other
|
(134
|
)
|
(230
|
)
|
||||
|
Funds from Operations attributable to common stockholders and unitholders
|
$
|
235,267
|
$
|
227,022
|
||||
|
FFO per share – diluted
|
$
|
3.44
|
$
|
3.34
|
||||
|
Expensed acquisition and investment related costs
|
$
|
87
|
$
|
32
|
||||
|
Loss on sale of marketable securities
|
13
|
58
|
||||||
|
Unrealized (gains) losses on marketable securities
|
8,696
|
(4,510
|
)
|
|||||
|
Provision for credit losses
|
(50
|
)
|
-
|
|||||
|
Equity (income) loss from non-core co-investment(1)
|
110
|
(314
|
)
|
|||||
|
Interest rate hedge ineffectiveness (2)
|
-
|
181
|
||||||
|
Gain on early retirement of debt, net
|
(321
|
)
|
(1,336
|
)
|
||||
|
Co-investment promote income
|
(6,455
|
)
|
(809
|
)
|
||||
|
Income from early redemption of preferred equity investments
|
(210
|
)
|
(100
|
)
|
||||
|
General and administrative and other, net
|
820
|
-
|
||||||
|
Insurance reimbursements, legal settlements, and other, net
|
43
|
(210
|
)
|
|||||
|
Core Funds from Operations attributable to common stockholders and unitholders
|
$
|
238,000
|
$
|
220,014
|
||||
|
Core FFO per share – diluted
|
$
|
3.48
|
$
|
3.23
|
||||
|
Weighted average number of shares outstanding diluted (3)
|
68,359,698
|
68,048,908
|
||||||
| (1) |
Represents the Company’s share of co-investment income from Real Estate Technology Ventures, L.P.
|
| (3) |
Assumes conversion of all outstanding limited partnership units in Essex Portfolio, L.P. (the “Operating Partnership”) into shares of the Company’s common stock and
excludes all DownREIT limited partnership units for which the Operating Partnership has the ability and intention to redeem the units for cash and does not consider them to be common stock equivalents.
|
- 7 -
Net Operating Income (“NOI”) and Same-Property NOI Reconciliations
NOI and Same-Property NOI are considered by management to be important supplemental performance measures to earnings from operations included in the Company’s consolidated
statements of income. The presentation of same-property NOI assists with the presentation of the Company’s operations prior to the allocation of depreciation and any corporate-level or financing-related costs. NOI reflects the operating performance
of a community and allows for an easy comparison of the operating performance of individual communities or groups of communities. In addition, because prospective buyers of real estate have different financing and overhead structures, with varying
marginal impacts to overhead by acquiring real estate, NOI is considered by many in the real estate industry to be a useful measure for determining the value of a real estate asset or group of assets. The Company defines same-property NOI as
same-property revenues less same-property operating expenses, including property taxes. Please see the reconciliation of earnings from operations to NOI and same-property NOI, which in the table below is the NOI for stabilized properties consolidated
by the Company for the periods presented (dollars in thousands):
|
Three Months Ended
March 31,
|
||||||||
|
2020
|
2019
|
|||||||
|
Earnings from operations
|
$
|
130,837
|
$ |
115,695
|
||||
|
Adjustments:
|
||||||||
|
Corporate-level property management expenses
|
8,759
|
8,429
|
||||||
|
Depreciation and amortization
|
131,559
|
120,568
|
||||||
|
Management and other fees from affiliates
|
(2,617
|
)
|
(2,335
|
)
|
||||
|
General and administrative
|
13,982
|
13,459
|
||||||
|
Expensed acquisition and investment related costs
|
87
|
32
|
||||||
|
NOI
|
282,607
|
255,848
|
||||||
|
Less: Non-same property NOI
|
(30,842
|
)
|
(13,638
|
)
|
||||
|
Same-Property NOI
|
$
|
251,765
|
$ |
242,210
|
||||
Safe Harbor Statement Under The Private Litigation Reform Act of 1995:
This press release includes “forward-looking statements” within the meaning of Section 27A of the Securities Act of 1933,
as amended, and Section 21E of the Securities Exchange Act of 1934, as amended. Forward-looking statements are statements which are not historical facts, including statements regarding the Company's expectations, estimates, assumptions, hopes,
intentions, beliefs and strategies regarding the future. Words such as “expects,” “assumes,” “anticipates,” “may,” “will,” “intends,” “plans,” “projects,” “believes,” “seeks,” “future,” “estimates,” and variations of such words and similar
expressions are intended to identify such forward-looking statements. Such forward-looking statements include, among other things, statements regarding the Company’s expectations related to the impact of the COVID-19 pandemic on the Company’s
business, financial condition and results of operations and the impact of any measures taken to mitigate the impact of the pandemic, the Company’s intent, beliefs or expectations with respect to the timing of completion of current development and
redevelopment projects and the stabilization of such projects, the timing of lease-up and occupancy of its apartment communities, the anticipated operating performance of its apartment communities, the total projected costs of development and
redevelopment projects, co-investment activities, qualification as a REIT under the Internal Revenue Code of 1986, as amended, the real estate markets in the geographies in which the Company’s properties are located and in the United States in
general, the adequacy of future cash flows to meet anticipated cash needs, its financing activities and the use of proceeds from such activities, the availability of debt and equity financing, general economic conditions including the potential
impacts from such economic conditions, including as a result of the COVID-19 pandemic, trends affecting the Company’s financial condition or results of operations, changes to U.S. tax laws and regulations in general or specifically related to REITs
or real estate, changes to laws and regulations
- 8 -
in jurisdictions in which communities the Company owns are located, and other information that is not historical information.
While the Company's management believes the assumptions underlying its forward-looking statements are reasonable, such forward-looking statements involve known and unknown
risks, uncertainties and other factors, many of which are beyond the Company’s control, which could cause the actual results, performance or achievements of the Company to be materially different from any future results, performance or achievements
expressed or implied by such forward-looking statements. The Company cannot assure the future results or outcome of the matters described in these statements; rather, these statements merely reflect the Company’s current expectations of the
approximate outcomes of the matters discussed. Factors that might cause the Company’s actual results, performance or achievements to differ materially from those expressed or implied by these forward-looking statements include, but are not limited
to, the following: the impact of the COVID-19 pandemic, which remains inherently uncertain as the situation is unprecedented and continuously evolving, and other potential future outbreaks of infectious diseases or other health concerns, and measures
taken to limit their impact, could adversely affect the Company’s business and its tenants, and cause a significant downturn in general economic conditions, the real estate industry, and the markets in which the Company's communities are located; the
Company may fail to achieve its business objectives; the actual completion of development and redevelopment projects may be subject to delays; the stabilization dates of such projects may be delayed; the Company may abandon or defer development or
redevelopment projects for a number of reasons, including changes in local market conditions which make development less desirable, increases in costs of development, increases in the cost of capital or lack of capital availability, resulting in
losses; the total projected costs of current development and redevelopment projects may exceed expectations; such development and redevelopment projects may not be completed; development and redevelopment projects and acquisitions may fail to meet
expectations; estimates of future income from an acquired property may prove to be inaccurate; occupancy rates and rental demand may be adversely affected by competition and local economic and market conditions; there may be increased interest rates
and operating costs; the Company may be unsuccessful in the management of its relationships with its co-investment partners; future cash flows may be inadequate to meet operating requirements and/or may be insufficient to provide for dividend
payments in accordance with REIT requirements; changes in laws or regulations; the terms of any refinancing may not be as favorable as the terms of existing indebtedness; unexpected difficulties in leasing of development projects; volatility in
financial and securities market; Company’s failure to successfully operate acquired properties; unforeseen consequences from cyber-intrusion; the Company’s inability to maintain our investment grade credit rating with the rating agencies; government
approvals, actions and initiatives, including the need for compliance with environmental requirements; and those further risks, special considerations, and other factors referred to in the Company’s annual report on Form 10-K, quarterly reports on
Form 10-Q, and other reports that the Company files with the SEC from time to time. Additionally, the risks, uncertainties and other factors set forth above or otherwise referred to in the reports that the Company has filed with the SEC may be
further amplified by the global impact of the COVID-19 pandemic. All forward-looking statements are made as of the date hereof, the Company assumes no obligation to update or supplement this information for any reason, and therefore, they may not
represent the Company’s estimates and assumptions after the date of this press release.
- 9 -
Definitions and Reconciliations
Non-GAAP financial measures
and certain other capitalized terms, as used in this earnings release, are defined and further explained on pages S-17.1 through S-17.4, "Reconciliations of Non-GAAP Financial Measures and Other Terms," of the accompanying supplemental financial
information. The supplemental financial information is available on the Company's website at www.essex.com.
Contact Information
Rylan Burns
Vice President of Finance & Investor Relations
(650) 655-7800
rburns@essex.com
- 10 -
Q1 2020 Supplemental
Table of Contents
|
Page(s)
|
|
|
Consolidated Operating Results
|
S-1 – S-2
|
|
Consolidated Funds From Operations
|
S-3
|
|
Consolidated Balance Sheets
|
S-4
|
|
Debt Summary – March 31, 2020
|
S-5
|
|
Capitalization Data, Public Bond Covenants, Credit Ratings, and Selected Credit Ratios – March 31, 2020
|
S-6
|
|
Portfolio Summary by County – March 31, 2020
|
S-7
|
|
Operating Income by Quarter – March 31, 2020
|
S-8
|
|
Same-Property Revenue Results by County – Quarters ended March 31, 2020 and 2019, and December 31, 2019
|
S-9
|
|
Same-Property Operating Expenses – Quarter ended as of March 31, 2020 and 2019
|
S-10
|
|
Development Pipeline – March 31, 2020
|
S-11
|
|
Redevelopment Pipeline – March 31, 2020
|
S-12
|
|
Capital Expenditures – March 31, 2020
|
S-12.1
|
|
Co-investments and Preferred Equity Investments – March 31, 2020
|
S-13
|
|
Summary of Apartment Community Acquisitions and Dispositions Activity
|
S-14
|
| April 2020 Collections, Operating Statistics, Liquidity, and Near-Term Funding Obligations |
S-15
|
|
2020 MSA Level Forecast: Supply, Jobs, and Apartment Market Conditions
|
S-16
|
|
Federal Stimulus is Mitigating the Income Impact of Unemployment in Essex Markets
|
S-16.1
|
|
Reconciliations of Non-GAAP Financial Measures and Other Terms
|
S-17.1 – S-17.4
|
E S S E X P R O P E R T Y T R U S T, I N C.
|
Consolidated Operating Results
(Dollars in thousands, except share and per share amounts)
|
Three Months Ended
March 31,
|
|||||||
|
2020
|
2019
|
|||||||
|
Revenues:
|
||||||||
|
Rental and other property
|
$
|
389,750
|
$
|
353,888
|
||||
|
Management and other fees from affiliates
|
2,617
|
2,335
|
||||||
|
392,367
|
356,223
|
|||||||
|
Expenses:
|
||||||||
|
Property operating
|
107,143
|
98,040
|
||||||
|
Corporate-level property management expenses
|
8,759
|
8,429
|
||||||
|
Depreciation and amortization
|
131,559
|
120,568
|
||||||
|
General and administrative
|
13,982
|
13,459
|
||||||
|
Expensed acquisition and investment related costs
|
87
|
32
|
||||||
|
261,530
|
240,528
|
|||||||
|
Earnings from operations
|
130,837
|
115,695
|
||||||
|
Interest expense, net (1)
|
(53,163
|
)
|
(51,598
|
)
|
||||
|
Interest and other income (loss)
|
(5,221
|
)
|
12,261
|
|||||
|
Equity income from co-investments
|
21,297
|
16,276
|
||||||
|
Gain on early retirement of debt, net
|
321
|
1,336
|
||||||
|
Gain on remeasurement of co-investment
|
234,694
|
31,535
|
||||||
|
Net income
|
328,765
|
125,505
|
||||||
|
Net income attributable to noncontrolling interest
|
(13,759
|
)
|
(6,647
|
)
|
||||
|
Net income available to common stockholders
|
$
|
315,006
|
$
|
118,858
|
||||
|
Net income per share - basic
|
$
|
4.77
|
$
|
1.81
|
||||
|
Shares used in income per share - basic
|
66,043,831
|
65,702,788
|
||||||
|
Net income per share - diluted
|
$
|
4.76
|
$
|
1.81
|
||||
|
Shares used in income per share - diluted
|
66,195,415
|
65,783,869
|
||||||
|
(1)
|
Refer to page S-17.2, the section titled “Interest Expense, Net” for additional information.
|
See Company’s Form 10-K and Form 10-Qs filed with the SEC for additional information
S-1
E S S E X P R O P E R T Y T R U S T, I N C.
|
Consolidated Operating Results
Selected Line Item Detail
|
Three Months Ended
March 31,
|
|||||||
|
(Dollars in thousands)
|
2020
|
2019
|
||||||
|
Rental and other property
|
||||||||
|
Rental income
|
$
|
383,498
|
$
|
347,805
|
||||
|
Other property
|
6,252
|
6,083
|
||||||
|
Rental and other property
|
$
|
389,750
|
$
|
353,888
|
||||
|
Property operating expenses
|
||||||||
|
Real estate taxes
|
$
|
43,012
|
$
|
39,418
|
||||
|
Administrative
|
22,757
|
21,110
|
||||||
|
Maintenance and repairs
|
21,871
|
19,666
|
||||||
|
Utilities
|
19,503
|
17,846
|
||||||
|
Property operating expenses
|
$
|
107,143
|
$
|
98,040
|
||||
|
Interest and other income
|
||||||||
|
Marketable securities and other income
|
$
|
3,481
|
$
|
7,599
|
||||
|
Loss on sale of marketable securities
|
(13
|
)
|
(58
|
)
|
||||
|
Provision for credit losses
|
50
|
-
|
||||||
|
Unrealized gains (losses) on marketable securities
|
(8,696
|
)
|
4,510
|
|||||
|
Insurance reimbursements, legal settlements, and other, net
|
(43
|
)
|
210
|
|||||
|
Interest and other income (loss)
|
$
|
(5,221
|
)
|
$
|
12,261
|
|||
|
Equity income from co-investments
|
||||||||
|
Equity income from co-investments
|
$
|
3,063
|
$
|
4,985
|
||||
|
Income from preferred equity investments
|
11,679
|
10,068
|
||||||
|
Equity income (loss) from non-core co-investment
|
(110
|
)
|
314
|
|||||
|
Co-investment promote income
|
6,455
|
809
|
||||||
|
Income from early redemption of preferred equity investments
|
210
|
100
|
||||||
|
Equity income from co-investments
|
$
|
21,297
|
$
|
16,276
|
||||
|
Noncontrolling interest
|
||||||||
|
Limited partners of Essex Portfolio, L.P.
|
$
|
10,986
|
$
|
4,171
|
||||
|
DownREIT limited partners’ distributions
|
2,136
|
1,564
|
||||||
|
Third-party ownership interest
|
637
|
912
|
||||||
|
Noncontrolling interest
|
$
|
13,759
|
$
|
6,647
|
||||
See Company’s Form 10-K and Form 10-Qs filed with the SEC for additional information
S-2
E S S E X P R O P E R T Y T R U S T, I N C.
|
Consolidated Funds From Operations (1)
(Dollars in thousands, except share and per share amounts and in footnotes)
|
Three Months Ended
March 31,
|
|||||||||||
|
2020
|
2019
|
% Change
|
||||||||||
|
Funds from operations attributable to common stockholders and unitholders (FFO)
|
||||||||||||
|
Net income available to common stockholders
|
$
|
315,006
|
$
|
118,858
|
||||||||
|
Adjustments:
|
||||||||||||
|
Depreciation and amortization
|
131,559
|
120,568
|
||||||||||
|
Gains not included in FFO
|
(234,694
|
)
|
(31,535
|
)
|
||||||||
|
Depreciation and amortization from unconsolidated co-investments
|
12,544
|
15,190
|
||||||||||
|
Noncontrolling interest related to Operating Partnership units
|
10,986
|
4,171
|
||||||||||
|
Depreciation attributable to third party ownership and other (2)
|
(134
|
)
|
(230
|
)
|
||||||||
|
Funds from operations attributable to common stockholders and unitholders
|
$
|
235,267
|
$
|
227,022
|
||||||||
|
FFO per share-diluted
|
$
|
3.44
|
$
|
3.34
|
3.0
|
%
|
||||||
|
Components of the change in FFO
|
||||||||||||
|
Non-core items:
|
||||||||||||
|
Expensed acquisition and investment related costs
|
$
|
87
|
$
|
32
|
||||||||
|
Loss on sale of marketable securities
|
13
|
58
|
||||||||||
|
Unrealized (gains) losses on marketable securities
|
8,696
|
(4,510
|
)
|
|||||||||
|
Provision for credit losses
|
(50
|
)
|
-
|
|||||||||
|
Equity (income) loss from non-core co-investment
(3)
|
110
|
(314
|
)
|
|||||||||
|
Interest rate hedge ineffectiveness (4)
|
-
|
181
|
||||||||||
|
Gain on early retirement of debt, net
|
(321
|
)
|
(1,336
|
)
|
||||||||
|
Co-investment promote income
|
(6,455
|
)
|
(809
|
)
|
||||||||
|
Income from early redemption of preferred equity investments
|
(210
|
)
|
(100
|
)
|
||||||||
|
General and administrative and other, net
|
820
|
-
|
||||||||||
|
Insurance reimbursements, legal settlements, and other, net
|
43
|
(210
|
)
|
|||||||||
|
Core funds from operations attributable to common stockholders and unitholders
|
$
|
238,000
|
$
|
220,014
|
||||||||
|
Core FFO per share-diluted
|
$
|
3.48
|
$
|
3.23
|
7.7
|
%
|
||||||
|
Changes in core items:
|
||||||||||||
|
Same-property NOI
|
$
|
9,555
|
||||||||||
|
Non-same property NOI
|
17,204
|
|||||||||||
|
Management and other fees, net
|
282
|
|||||||||||
|
FFO from co-investments
|
(2,957
|
)
|
||||||||||
|
Interest and other income
|
(4,118
|
)
|
||||||||||
|
Interest expense
|
(1,746
|
)
|
||||||||||
|
General and administrative
|
297
|
|||||||||||
|
Corporate-level property management expenses
|
(330
|
)
|
||||||||||
|
Other items, net
|
(201
|
)
|
||||||||||
|
$
|
17,986
|
|||||||||||
|
Weighted average number of shares outstanding diluted (5)
|
68,359,698
|
68,048,908
|
||||||||||
| (1) |
Refer to page S-17.2, the section titled “Funds from Operations (“FFO”) and Core FFO” for additional information on the Company’s definition and use of FFO and Core FFO.
|
| (2) |
The Company consolidates certain co-investments. The noncontrolling interest’s share of net operating income in these investments for the three months ended March 31, 2020 was $1.4
million.
|
| (3) |
Represents the Company’s share of co-investment income from Real Estate Technology Ventures, L.P.
|
| (4) |
On January 1, 2019, the Company adopted ASU No. 2017-12 “Derivatives and Hedging - Targeted Improvements to Accounting for Hedging Activities,” which resulted in a cumulative
effect adjustment of approximately $181,000 from interest expense to accumulated other comprehensive income. As a result of the adoption of this standard, the Company recognizes qualifying hedge ineffectiveness through accumulated other
comprehensive income as opposed to current earnings.
|
| (5) |
Assumes conversion of all outstanding limited partnership units in the Operating Partnership into shares of the Company’s common stock and excludes all DownREIT limited partnership
units for which the Operating Partnership has the ability and intention to redeem the units for cash and does not consider them to be common stock equivalents.
|
See Company’s Form 10-K and Form 10-Qs filed with the SEC for additional information
S-3
E S S E X P R O P E R T Y T R U S T, I N C.
|
Consolidated Balance Sheets
(Dollars in thousands)
|
||||||||
|
March 31, 2020
|
December 31, 2019
|
|||||||
|
Real Estate:
|
||||||||
|
Land and land improvements
|
$
|
2,983,314
|
$
|
2,773,805
|
||||
|
Buildings and improvements
|
12,263,293
|
11,264,337
|
||||||
|
|
15,246,607
|
14,038,142
|
||||||
|
Less: accumulated depreciation
|
(3,818,489
|
)
|
(3,689,482
|
)
|
||||
|
11,428,118
|
10,348,660
|
|||||||
|
Real estate under development
|
435,865
|
546,075
|
||||||
|
Co-investments
|
997,137
|
1,335,339
|
||||||
|
12,861,120
|
12,230,074
|
|||||||
|
Cash and cash equivalents, including restricted cash
|
282,347
|
81,094
|
||||||
|
Marketable securities
|
148,139
|
144,193
|
||||||
|
Notes and other receivables
|
34,867
|
134,365
|
||||||
|
Operating lease right-of-use assets
|
74,428
|
74,744
|
||||||
|
Prepaid expenses and other assets
|
49,940
|
40,935
|
||||||
|
Total assets
|
$
|
13,450,841
|
$
|
12,705,405
|
||||
|
Unsecured debt, net
|
$
|
5,258,263
|
$
|
4,763,206
|
||||
|
Mortgage notes payable, net
|
887,389
|
990,667
|
||||||
|
Lines of credit
|
350,000
|
55,000
|
||||||
|
Operating lease liabilities
|
76,405
|
76,740
|
||||||
|
Other liabilities
|
428,192
|
378,878
|
||||||
|
Total liabilities
|
7,000,249
|
6,264,491
|
||||||
|
Redeemable noncontrolling interest
|
32,643
|
37,410
|
||||||
|
Equity:
|
||||||||
|
Common stock
|
7
|
7
|
||||||
|
Additional paid-in capital
|
6,959,523
|
7,121,927
|
||||||
|
Distributions in excess of accumulated earnings
|
(708,697
|
)
|
(887,619
|
)
|
||||
|
Accumulated other comprehensive loss, net
|
(22,668
|
)
|
(13,888
|
)
|
||||
|
Total stockholders’ equity
|
6,228,165
|
6,220,427
|
||||||
|
Noncontrolling interest
|
189,784
|
183,077
|
||||||
|
Total equity
|
6,417,949
|
6,403,504
|
||||||
|
Total liabilities and equity
|
$
|
13,450,841
|
$
|
12,705,405
|
||||
See Company’s Form 10-K and Form 10-Qs filed with the SEC for additional information
S-4
E S S E X P R O P E R T Y T R U S T, I N C.
|
Debt Summary - March 31, 2020
|
|||||||||||||||||||||||||||||||||||
|
(Dollars in thousands, except in footnotes)
|
|||||||||||||||||||||||||||||||||||
|
Scheduled principal payments, unamortized premiums (discounts) and (debt issuance costs) are as follows - excludes lines of credit:
|
|||||||||||||||||||||||||||||||||||
|
Weighted
Average
Interest Rate
|
Percentage
of Total Debt
|
||||||||||||||||||||||||||||||||||
|
Weighted Average
|
|||||||||||||||||||||||||||||||||||
|
Balance
Outstanding
|
Interest
Rate
|
Maturity
in Years
|
Unsecured
|
Secured
|
Total
|
||||||||||||||||||||||||||||||
|
Unsecured Debt, net
|
|||||||||||||||||||||||||||||||||||
|
Bonds private - fixed rate
|
$
|
200,000
|
4.4
|
%
|
1.2
|
2020
|
$
|
-
|
$
|
185,493
|
$
|
185,493
|
6.8
|
%
|
3.0
|
%
|
|||||||||||||||||||
|
Bonds public - fixed rate
|
4,750,000
|
3.7
|
%
|
7.7
|
2021
|
500,000
|
31,653
|
531,653
|
4.3
|
%
|
8.6
|
%
|
|||||||||||||||||||||||
|
Term loan (1)
|
350,000
|
2.7
|
%
|
1.9
|
2022
|
650,000
|
43,188
|
693,188
|
3.1
|
%
|
11.2
|
%
|
|||||||||||||||||||||||
|
Unamortized net discounts and debt issuance costs
|
(41,737
|
)
|
-
|
-
|
2023
|
600,000
|
2,945
|
602,945
|
3.7
|
%
|
9.8
|
%
|
|||||||||||||||||||||||
|
5,258,263
|
3.6
|
%
|
7.1
|
2024
|
400,000
|
3,109
|
403,109
|
4.0
|
%
|
6.5
|
%
|
||||||||||||||||||||||||
|
Mortgage Notes Payable, net
|
2025
|
500,000
|
133,054
|
633,054
|
3.5
|
%
|
10.2
|
%
|
|||||||||||||||||||||||||||
|
Fixed rate - secured
|
629,501
|
4.7
|
%
|
4.3
|
2026
|
450,000
|
99,405
|
549,405
|
3.5
|
%
|
8.9
|
%
|
|||||||||||||||||||||||
|
Variable rate - secured (2)
|
255,270
|
2.6
|
%
|
17.0
|
2027
|
350,000
|
153,955
|
503,955
|
3.6
|
%
|
8.1
|
%
|
|||||||||||||||||||||||
|
Unamortized premiums and debt issuance costs, net
|
2,618
|
-
|
-
|
2028
|
-
|
68,332
|
68,332
|
4.1
|
%
|
1.1
|
%
|
||||||||||||||||||||||||
|
Total mortgage notes payable
|
887,389
|
4.1
|
%
|
7.9
|
2029
|
500,000
|
31,156
|
531,156
|
4.0
|
%
|
8.6
|
%
|
|||||||||||||||||||||||
|
2030
|
550,000
|
1,592
|
551,592
|
3.1
|
%
|
8.9
|
%
|
||||||||||||||||||||||||||||
|
Unsecured Lines of Credit
|
Thereafter
|
800,000
|
130,889
|
930,889
|
3.3
|
%
|
15.1
|
%
|
|||||||||||||||||||||||||||
|
Line of credit (3)
|
350,000
|
2.4
|
%
|
Subtotal
|
5,300,000
|
884,771
|
6,184,771
|
3.6
|
%
|
100.0
|
%
|
||||||||||||||||||||||||
|
Line of credit (4)
|
-
|
2.4
|
%
|
Debt Issuance Costs
|
(27,589
|
)
|
(2,425
|
)
|
(30,014
|
)
|
NA
|
NA
|
|||||||||||||||||||||||
|
Total lines of credit
|
350,000
|
2.4
|
%
|
(Discounts)/Premiums
|
(14,148
|
)
|
5,043
|
(9,105
|
)
|
NA
|
NA
|
||||||||||||||||||||||||
|
Total
|
$
|
5,258,263
|
$
|
887,389
|
$
|
6,145,652
|
3.6
|
%
|
100.0
|
%
|
|||||||||||||||||||||||||
|
Total debt, net
|
$
|
6,495,652
|
3.6
|
% | |||||||||||||||||||||||||||||||
Capitalized interest for the three months ended March 31, 2020 was approximately $4.8 million.
|
(1)
|
The unsecured term loan has a variable interest rate of LIBOR plus 0.95%. The Company has interest rate swap contracts with an aggregate notional amount of $175 million, which
effectively converts the interest rate on $175 million of the term loan to a fixed rate of 2.3%.
|
| (2) |
$255.3 million of variable rate debt is tax exempt to the note holders.
|
| (3) |
This unsecured line of credit facility has a capacity of $1.2 billion, with a scheduled maturity date in December 2023 with one 18-month extension, exercisable at the Company’s
option. The underlying interest rate on this line is based on a tiered rate structure tied to the Company’s corporate ratings and is currently at LIBOR plus 0.825%.
|
| (4) |
This unsecured line of credit facility has a capacity $35.0 million, with a scheduled maturity date in February 2021. The underlying interest rate on this line is based on a tiered
rate structure tied to the Company’s corporate ratings and is currently at LIBOR plus 0.825%.
|
See Company’s Form 10-K and Form 10-Qs filed with the SEC for additional information
S-5
E S S E X P R O P E R T Y T R U S T, I N C.
Capitalization Data, Public Bond Covenants, Credit Ratings and Selected Credit Ratios - March 31, 2020
(Dollars and shares in thousands, except per share amounts)
|
|
|
|
|
|
|
|
|
|
|
|
|
|
|||
|
|
|
|
|
|
|
|
|
|
|
|
|
|
|||
|
Capitalization Data
|
|
|
|
|
|
Public Bond Covenants (1)
|
|
Actual
|
|
Requirement
|
|||||
|
Total debt, net
|
|
|
$
|
6,495,652
|
|
|
|
|
|||||||
|
|
|
|
|
|
|
|
Debt to Total Assets:
|
|
38%
|
< 65%
|
|||||
|
Common stock and potentially dilutive securities
|
|
|
|
|
|
||||||||||
|
Common stock outstanding
|
|
65,412
|
|
|
|
|
|||||||||
|
Limited partnership units (1)
|
|
2,254
|
|
|
|
|
|||||||||
|
Options-treasury method
|
|
12
|
|
|
Secured Debt to Total Assets:
|
|
5%
|
< 40%
|
|||||||
|
Total shares of common stock and potentially dilutive securities
|
|
67,678
|
|
|
|
|
|||||||||
|
|
|
|
|
|
|
|
|
|
|
||||||
|
Common stock price per share as of March 31, 2020
|
$
|
220.24
|
|
|
|
|
|||||||||
|
|
|
|
|
|
|
|
|
Interest Coverage:
|
|
484%
|
> 150%
|
||||
|
Total equity capitalization
|
$
|
14,905,403
|
|
|
|
|
|||||||||
|
|
|
|
|
|
|
|
|
|
|||||||
|
Total market capitalization
|
$
|
21,401,055
|
|
|
Unsecured Debt Ratio (2):
|
|
264%
|
> 150%
|
|||||||
|
|
|
|
|
|
|
|
|
|
|
||||||
|
Ratio of debt to total market capitalization
|
|
|
30.4%
|
|
|
|
|
||||||||
|
|
|
|
|
|
|
|
Selected Credit Ratios (3)
|
|
Actual
|
||||||
|
Credit Ratings
|
|
|
|
|
|
|
|
||||||||
|
Rating Agency
|
|
Rating
|
Outlook
|
|
|
|
|
Net Indebtedness Divided by Adjusted EBITDAre, normalized and annualized:
|
|
5.9
|
|||||
|
Fitch
|
BBB+
|
Stable
|
|
|
|
|
|
|
|||||||
|
Moody’s
|
Baa1
|
Stable
|
|
|
|
|
Unencumbered NOI to Adjusted Total NOI:
|
|
90%
|
||||||
|
Standard & Poor’s
|
BBB+
|
Stable
|
|
|
|
|
|
|
|
|
|
||||
|
|
|
|
|
|
|
(1) Refer to page S-17.4 for
additional information on the Company’s Public Bond Covenants.
|
|||||||||
|
(1) Assumes conversion of all
outstanding limited partnership units in the OperatingPartnership into shares of the Company’s common stock.
|
(2) Unsecured Debt Ratio is
unsecured assets (excluding investments in co-investments) divided by unsecured indebtedness.
|
||||||||||||||
|
(3) Refer to pages S-17.1 to
S-17.4, the section titled “Reconciliations of Non-GAAP Financial Measures and Other Terms” for additional information on the Company’s Selected Credit Ratios.
|
|||||||||||||||
See Company’s Form 10-K and Form 10-Qs filed with the SEC for additional information
S-6
E S S E X P R O P E R T Y T R U S T, I N C.
Portfolio Summary by County as of March 31, 2020
|
Apartment Homes
|
Average Monthly Rental Rate (1)
|
Percent of NOI (2)
|
||||||||||||||||||||||||||||||||||||||
|
Region - County
|
Consolidated (3)
|
Unconsolidated
Co-investments (4)
|
Apartment
Homes in
Development (5)
|
Total
|
Consolidated
|
Unconsolidated
Co-investments (6)
|
Total (7)
|
Consolidated
|
Unconsolidated
Co-investments (6)
|
Total (7)
|
||||||||||||||||||||||||||||||
|
Southern California
|
||||||||||||||||||||||||||||||||||||||||
|
Los Angeles County
|
9,097
|
1,563
|
200
|
10,860
|
$
|
2,484
|
$
|
2,190
|
$
|
2,460
|
17.6
|
%
|
15.7
|
%
|
17.4
|
%
|
||||||||||||||||||||||||
|
Orange County
|
5,554
|
1,149
|
-
|
6,703
|
2,248
|
1,972
|
2,222
|
9.8
|
%
|
10.8
|
%
|
9.9
|
%
|
|||||||||||||||||||||||||||
|
San Diego County
|
4,824
|
616
|
-
|
5,440
|
1,995
|
1,879
|
1,988
|
7.8
|
%
|
5.6
|
%
|
7.6
|
%
|
|||||||||||||||||||||||||||
|
Ventura County and Other
|
3,200
|
693
|
-
|
3,893
|
1,845
|
2,222
|
1,885
|
4.9
|
%
|
8.1
|
%
|
5.2
|
%
|
|||||||||||||||||||||||||||
|
Total Southern California
|
22,675
|
4,021
|
200
|
26,896
|
2,232
|
2,088
|
2,220
|
40.1
|
%
|
40.2
|
%
|
40.1
|
%
|
|||||||||||||||||||||||||||
|
Northern California
|
||||||||||||||||||||||||||||||||||||||||
|
Santa Clara County (8)
|
9,176
|
1,237
|
269
|
10,682
|
2,898
|
2,965
|
2,902
|
20.9
|
%
|
16.4
|
%
|
20.6
|
%
|
|||||||||||||||||||||||||||
|
Alameda County
|
3,959
|
1,309
|
-
|
5,268
|
2,577
|
2,497
|
2,566
|
7.9
|
%
|
16.4
|
%
|
8.5
|
%
|
|||||||||||||||||||||||||||
|
San Mateo County
|
2,651
|
195
|
107
|
2,953
|
3,195
|
3,881
|
3,220
|
6.2
|
%
|
3.7
|
%
|
6.0
|
%
|
|||||||||||||||||||||||||||
|
Contra Costa County
|
2,619
|
-
|
-
|
2,619
|
2,493
|
-
|
2,493
|
5.3
|
%
|
0.0
|
%
|
4.9
|
%
|
|||||||||||||||||||||||||||
|
San Francisco
|
1,343
|
537
|
-
|
1,880
|
3,274
|
4,008
|
3,397
|
3.4
|
%
|
4.1
|
%
|
3.4
|
%
|
|||||||||||||||||||||||||||
|
Total Northern California
|
19,748
|
3,278
|
376
|
23,402
|
2,845
|
2,996
|
2,857
|
43.7
|
%
|
40.6
|
%
|
43.4
|
%
|
|||||||||||||||||||||||||||
|
Seattle Metro
|
10,343
|
1,890
|
-
|
12,233
|
1,933
|
1,931
|
1,933
|
16.2
|
%
|
19.2
|
%
|
16.5
|
%
|
|||||||||||||||||||||||||||
|
Total
|
52,766
|
9,189
|
576
|
62,531
|
$
|
2,403
|
$
|
2,375
|
$
|
2,401
|
100.0
|
%
|
100.0
|
%
|
100.0
|
%
|
||||||||||||||||||||||||
| (1) |
Average monthly rental rate is defined as the total scheduled monthly rental income (actual rent for occupied apartment homes plus market rent for vacant apartment homes) divided
by the number of apartment homes.
|
| (2) |
Represents the percentage of actual NOI for the quarter ended March 31, 2020. See the section titled “Net Operating Income (“NOI”) and Same-Property NOI Reconciliations” on page
S-17.3.
|
| (3) |
Includes two communities consisting of 648 apartment homes that are producing partial income due to lease-up.
|
| (4) |
Includes one community consisting of 537 apartment homes that is producing partial income due to lease-up.
|
| (5) |
Includes development communities with no rental income.
|
| (6) |
Co-investment amounts weighted for Company’s pro rata share.
|
| (7) |
At Company’s pro rata share.
|
| (8) |
Includes all communities in Santa Clara County and one community in Santa Cruz County.
|
See Company’s Form 10-K and Form 10-Qs filed with the SEC for additional information
S-7
E S S E X P R O P E R T Y T R U S T, I N C.
Operating Income by Quarter (1)
(Dollars in thousands, except in footnotes)
|
Apartment
Homes
|
Q1 ‘20
|
Q4 ‘19
|
Q3 ‘19
|
Q2 ‘19
|
Q1 ‘19
|
|||||||||||||||||||
|
Rental and other property revenues:
|
||||||||||||||||||||||||
|
Same-property
|
47,347
|
$
|
346,456
|
$
|
346,224
|
$
|
340,383
|
$
|
338,275
|
$
|
335,658
|
|||||||||||||
|
Acquisitions (2)
|
2,869
|
21,924
|
7,201
|
6,019
|
3,538
|
987
|
||||||||||||||||||
|
Development (3)
|
968
|
4,075
|
3,417
|
1,883
|
1,217
|
1,158
|
||||||||||||||||||
|
Redevelopment
|
621
|
5,401
|
5,317
|
5,272
|
5,240
|
5,229
|
||||||||||||||||||
|
Non-residential/other, net (4)
|
961
|
11,894
|
10,702
|
10,947
|
11,105
|
10,856
|
||||||||||||||||||
|
Total rental and other property revenues
|
52,766
|
389,750
|
372,861
|
364,504
|
359,375
|
353,888
|
||||||||||||||||||
|
Property operating expenses:
|
||||||||||||||||||||||||
|
Same-property
|
94,691
|
93,412
|
95,421
|
91,043
|
93,448
|
|||||||||||||||||||
|
Acquisitions (2)
|
6,830
|
2,181
|
2,020
|
945
|
332
|
|||||||||||||||||||
|
Development (3)
|
1,447
|
1,208
|
706
|
506
|
524
|
|||||||||||||||||||
|
Redevelopment
|
1,663
|
1,725
|
1,734
|
1,586
|
1,650
|
|||||||||||||||||||
|
Non-residential/other, net (4) (5)
|
2,512
|
2,598
|
2,292
|
1,110
|
2,086
|
|||||||||||||||||||
|
Total property operating expenses
|
107,143
|
101,124
|
102,173
|
95,190
|
98,040
|
|||||||||||||||||||
|
Net operating income (NOI):
|
||||||||||||||||||||||||
|
Same-property
|
251,765
|
252,812
|
244,962
|
247,232
|
242,210
|
|||||||||||||||||||
|
Acquisitions (2)
|
15,094
|
5,020
|
3,999
|
2,593
|
655
|
|||||||||||||||||||
|
Development (3)
|
2,628
|
2,209
|
1,177
|
711
|
634
|
|||||||||||||||||||
|
Redevelopment
|
3,738
|
3,592
|
3,538
|
3,654
|
3,579
|
|||||||||||||||||||
|
Non-residential/other, net (4)
|
9,382
|
8,104
|
8,655
|
9,995
|
8,770
|
|||||||||||||||||||
|
Total NOI
|
$
|
282,607
|
$
|
271,737
|
$
|
262,331
|
$
|
264,185
|
$
|
255,848
|
||||||||||||||
|
Same-property metrics
|
||||||||||||||||||||||||
|
Operating margin
|
73
|
%
|
73
|
%
|
72
|
%
|
73
|
%
|
72
|
%
|
||||||||||||||
|
Annualized turnover (6)
|
39
|
%
|
41
|
%
|
56
|
%
|
48
|
%
|
40
|
%
|
||||||||||||||
|
Financial occupancy (7)
|
96.8
|
%
|
97.1
|
%
|
96.0
|
%
|
96.6
|
%
|
96.9
|
%
|
||||||||||||||
| (1) |
Includes consolidated communities only.
|
| (2) |
Acquisitions include properties acquired which did not have comparable stabilized results as of January 1, 2019.
|
| (3) |
Development includes properties developed which did not have comparable stabilized results as of January 1, 2019.
|
| (4) |
Non-residential/other, net consists of revenues generated from retail space, commercial properties, held for sale properties, disposition properties, student housing, properties
undergoing significant construction activities that do not meet our redevelopment criteria, and three communities located in the California counties of Riverside, Santa Barbara, and Santa Cruz, which the Company does not consider its core
markets.
|
| (5) |
Includes other expenses and intercompany eliminations pertaining to self-insurance.
|
| (6) |
Annualized turnover is defined as the number of apartment homes turned over during the quarter, annualized, divided by the total number of apartment homes.
|
| (7) |
Financial occupancy is defined as the percentage resulting from dividing actual rental income by total scheduled rental income (actual rent for occupied apartment homes plus market
rent for vacant apartment homes).
|
See Company’s Form 10-K and Form 10-Qs filed with the SEC for additional information
S-8
E S S E X P R O P E R T Y T R U S T, I N C.
Same-Property Revenue Results by County - First Quarter 2020 vs. First Quarter 2019 and Fourth Quarter 2019
(Dollars in thousands, except average monthly rental rates)
|
Average Monthly Rental Rate
|
Financial Occupancy
|
Gross Revenues
|
Sequential Gross
Revenues
|
|||||||||||||||||||||||||||||||||||||||||||||||||
|
Region - County
|
Apartment
Homes
|
Q1 ‘20 %
of Actual
NOI
|
Q1 ‘20
|
Q1 ‘19
|
% Change
|
Q1 ‘20
|
Q1 ‘19
|
% Change
|
Q1 ‘20
|
Q1 ‘19
|
% Change
|
Q4 ‘19
|
% Change
|
|||||||||||||||||||||||||||||||||||||||
|
Southern California
|
||||||||||||||||||||||||||||||||||||||||||||||||||||
|
Los Angeles County
|
8,641
|
18.4
|
%
|
$
|
2,492
|
$
|
2,433
|
2.4
|
%
|
96.4
|
%
|
96.7
|
%
|
-0.3
|
%
|
$
|
65,959
|
$
|
64,563
|
2.2
|
%
|
$
|
66,134
|
-0.3
|
%
|
|||||||||||||||||||||||||||
|
Orange County
|
5,554
|
10.8
|
%
|
2,248
|
2,189
|
2.7
|
%
|
96.4
|
%
|
96.7
|
%
|
-0.3
|
%
|
38,050
|
36,904
|
3.1
|
%
|
38,110
|
-0.2
|
%
|
||||||||||||||||||||||||||||||||
|
San Diego County
|
4,582
|
8.3
|
%
|
1,988
|
1,933
|
2.8
|
%
|
97.2
|
%
|
96.6
|
%
|
0.6
|
%
|
28,381
|
27,359
|
3.7
|
%
|
28,197
|
0.7
|
%
|
||||||||||||||||||||||||||||||||
|
Ventura County
|
2,577
|
4.5
|
%
|
1,873
|
1,827
|
2.5
|
%
|
97.2
|
%
|
97.2
|
%
|
0.0
|
%
|
15,131
|
14,758
|
2.5
|
%
|
15,046
|
0.6
|
%
|
||||||||||||||||||||||||||||||||
|
Total Southern California
|
21,354
|
42.0
|
%
|
2,246
|
2,189
|
2.6
|
%
|
96.6
|
%
|
96.8
|
%
|
-0.2
|
%
|
147,521
|
143,584
|
2.7
|
%
|
147,487
|
0.0
|
%
|
||||||||||||||||||||||||||||||||
|
Northern California
|
||||||||||||||||||||||||||||||||||||||||||||||||||||
|
Santa Clara County
|
7,523
|
20.0
|
%
|
2,858
|
2,768
|
3.3
|
%
|
97.2
|
%
|
97.3
|
%
|
-0.1
|
%
|
66,164
|
64,009
|
3.4
|
%
|
66,043
|
0.2
|
%
|
||||||||||||||||||||||||||||||||
|
Alameda County
|
2,954
|
6.9
|
%
|
2,612
|
2,558
|
2.1
|
%
|
96.3
|
%
|
96.7
|
%
|
-0.4
|
%
|
23,818
|
23,293
|
2.3
|
%
|
24,045
|
-0.9
|
%
|
||||||||||||||||||||||||||||||||
|
San Mateo County
|
1,830
|
5.3
|
%
|
3,088
|
2,967
|
4.1
|
%
|
96.8
|
%
|
97.6
|
%
|
-0.8
|
%
|
17,525
|
16,960
|
3.3
|
%
|
17,511
|
0.1
|
%
|
||||||||||||||||||||||||||||||||
|
Contra Costa County
|
2,270
|
4.9
|
%
|
2,385
|
2,327
|
2.5
|
%
|
97.0
|
%
|
97.3
|
%
|
-0.3
|
%
|
16,730
|
16,384
|
2.1
|
%
|
16,812
|
-0.5
|
%
|
||||||||||||||||||||||||||||||||
|
San Francisco
|
1,178
|
3.1
|
%
|
3,159
|
3,048
|
3.6
|
%
|
96.4
|
%
|
96.1
|
%
|
0.3
|
%
|
11,467
|
11,015
|
4.1
|
%
|
11,496
|
-0.3
|
%
|
||||||||||||||||||||||||||||||||
|
Total Northern California
|
15,755
|
40.2
|
%
|
2,793
|
2,709
|
3.1
|
%
|
96.9
|
%
|
97.1
|
%
|
-0.2
|
%
|
135,704
|
131,661
|
3.1
|
%
|
135,907
|
-0.1
|
%
|
||||||||||||||||||||||||||||||||
|
Seattle Metro
|
10,238
|
17.8
|
%
|
1,933
|
1,847
|
4.7
|
%
|
96.9
|
%
|
96.9
|
%
|
0.0
|
%
|
63,231
|
60,413
|
4.7
|
%
|
62,830
|
0.6
|
%
|
||||||||||||||||||||||||||||||||
|
Total Same-Property
|
47,347
|
100.0
|
%
|
$
|
2,360
|
$
|
2,288
|
3.1
|
%
|
96.8
|
%
|
96.9
|
%
|
-0.1
|
%
|
$
|
346,456
|
$
|
335,658
|
3.2
|
%
|
$
|
346,224
|
0.1
|
%
|
|||||||||||||||||||||||||||
See Company’s Form 10-K and Form 10-Qs filed with the SEC for additional information
S-9
E S S E X P R O P E R T Y T R U S T, I N C.
|
Same-Property Operating Expenses - Quarter to Date as of March 31, 2020 and 2019
|
||||||||||||||||
|
(Dollars in thousands)
|
||||||||||||||||
|
|
||||||||||||||||
|
|
||||||||||||||||
|
Based on 47,347 apartment homes
|
||||||||||||||||
|
Q1 ‘20
|
Q1 ‘19
|
% Change
|
% of Op. Ex.
|
|||||||||||||
|
Same-property operating expenses:
|
||||||||||||||||
|
Real estate taxes
|
$
|
36,957
|
$
|
37,065
|
-0.3
|
%
|
39.0
|
%
|
||||||||
|
Maintenance and repairs
|
19,313
|
18,581
|
3.9
|
%
|
20.4
|
%
|
||||||||||
|
Administrative
|
16,630
|
16,496
|
0.8
|
%
|
17.6
|
%
|
||||||||||
|
Utilities
|
17,163
|
16,895
|
1.6
|
%
|
18.1
|
%
|
||||||||||
|
Insurance and other
|
4,628
|
4,411
|
4.9
|
%
|
4.9
|
%
|
||||||||||
|
Total same-property operating expenses
|
$
|
94,691
|
$
|
93,448
|
1.3
|
%
|
100.0
|
%
|
||||||||
See Company’s Form 10-K and Form 10-Qs filed with the SEC for additional information
S-10
E S S E X P R O P E R T Y T R U S T, I N C.
|
Development Pipeline - March 31, 2020
|
||||||||||||||||||||||||||||||||||||||||||||||||||||||
|
(Dollars in millions, except per apartment home amounts in thousands and except in footnotes)
|
||||||||||||||||||||||||||||||||||||||||||||||||||||||
|
|
|
|||||||||||||||||||||||||||||||||||||||||||||||||||||
|
Project Name
|
Location
|
Ownership
%
|
Estimated
Apartment
Homes
|
Estimated
Commercial
sq. feet
|
Incurred to
Date
|
Remaining
Costs
|
Estimated
Total Cost |
Essex Est.
Total Cost (1)
|
Cost per
Apartment
Home (2)
|
Average
%
Occupied
|
%
Leased
(3)
|
Construction
Start
|
Initial
Occupancy
|
Stabilized
Operations
|
||||||||||||||||||||||||||||||||||||||||
|
Development Projects - Consolidated (4)
|
||||||||||||||||||||||||||||||||||||||||||||||||||||||
|
Station Park Green - Phase III
|
San Mateo, CA
|
100
|
%
|
172
|
-
|
124
|
10
|
134
|
134
|
779
|
25
|
%
|
30
|
%
|
Q3 2017
|
Q1 2020
|
Q3 2020
|
|||||||||||||||||||||||||||||||||||||
|
Station Park Green - Phase IV
|
San Mateo, CA
|
100
|
%
|
107
|
-
|
21
|
73
|
94
|
94
|
879
|
0
|
%
|
0
|
%
|
Q3 2019
|
Q4 2021
|
Q2 2022
|
|||||||||||||||||||||||||||||||||||||
|
Mylo (5)
|
Santa Clara, CA
|
100
|
%
|
476
|
-
|
203
|
23
|
226
|
226
|
475
|
23
|
%
|
35
|
%
|
Q3 2016
|
Q3 2019
|
Q2 2021
|
|||||||||||||||||||||||||||||||||||||
|
Wallace on Sunset (6)
|
Hollywood, CA
|
100
|
%
|
200
|
4,700
|
78
|
27
|
105
|
105
|
500
|
0
|
%
|
0
|
%
|
Q4 2017
|
Q3 2020
|
Q2 2021
|
|||||||||||||||||||||||||||||||||||||
|
Total Development Projects - Consolidated
|
|
955 |
|
4,700
|
|
426
|
|
133
|
|
559
|
|
559
|
|
580
|
||||||||||||||||||||||||||||||||||||||||
|
Land Held for Future Development - Consolidated
|
||||||||||||||||||||||||||||||||||||||||||||||||||||||
|
Other Projects
|
Various
|
100
|
%
|
21
|
-
|
21
|
21
|
|||||||||||||||||||||||||||||||||||||||||||||||
|
Total Development Pipeline - Consolidated
|
|
955
|
|
4,700
|
|
447
|
|
133
|
|
580
|
|
580 | ||||||||||||||||||||||||||||||||||||||||||
|
Development Projects - Joint Venture (4)
|
||||||||||||||||||||||||||||||||||||||||||||||||||||||
|
Patina at Midtown
|
San Jose, CA
|
50
|
%
|
269
|
-
|
126
|
10
|
136
|
68
|
506
|
0
|
%
|
0
|
%
|
Q3 2017
|
Q2 2020
|
Q2 2021
|
|||||||||||||||||||||||||||||||||||||
|
500 Folsom (7)
|
San Francisco, CA
|
50
|
%
|
537
|
6,000
|
390
|
25
|
415
|
208
|
763
|
43
|
%
|
47
|
%
|
Q4 2015
|
Q3 2019
|
Q4 2020
|
|||||||||||||||||||||||||||||||||||||
|
Total Development Projects - Joint Venture
|
|
806 |
|
6,000
|
|
516 |
|
35
|
|
551
|
|
276
|
$
|
677
|
||||||||||||||||||||||||||||||||||||||||
|
Grand Total - Development Pipeline
|
1,761
|
10,700
|
$
|
963
|
$
|
168
|
$
|
1,131
|
856
|
|||||||||||||||||||||||||||||||||||||||||||||
|
Essex Cost Incurred to Date - Pro Rata
|
(705
|
)
|
||||||||||||||||||||||||||||||||||||||||||||||||||||
|
Essex Remaining Commitment
|
$
|
151
|
||||||||||||||||||||||||||||||||||||||||||||||||||||
| (1) |
The Company’s share of the estimated total cost of the project.
|
| (2) |
Net of the estimated allocation to the retail component of the project.
|
| (3) |
Calculations are based on multifamily operations only and are as of March 31, 2020.
|
| (4) |
For the first quarter of 2020, the Company’s cost includes $4.7 million of capitalized interest, $1.6 million of capitalized overhead and $0.3 million of development fees (such development fees
reduced G&A expenses).
|
| (5) |
Cost incurred to date does not include a deduction of $4.7 million for accumulated depreciation recorded during the period when the property was held as a retail operating asset.
|
| (6) |
Cost incurred to date does not include a deduction of $6.3 million for accumulated depreciation recorded during the period when the property was held as a retail operating asset.
|
| (7) |
Estimated cost incurred to date and total cost are net of a projected value for low income housing tax credit proceeds and the value of the tax exempt bond structure.
|
See Company’s Form 10-K and Form 10-Qs filed with the SEC for additional information
S-11
E S S E X P R O P E R T Y T R U S T, I N C.
|
Redevelopment Pipeline - March 31, 2020
|
|||||||||||||||||||||||||||||
|
(Dollars in thousands)
|
|||||||||||||||||||||||||||||
|
Total
|
Estimated
|
Estimated
|
NOI
|
||||||||||||||||||||||||||
|
Apartment
|
Incurred
|
Remaining
|
Total
|
Project
|
Three Months Ended
|
||||||||||||||||||||||||
|
Region/Project Name
|
Homes
|
To Date
|
Cost
|
Cost
|
Start Date
|
2020
|
2019
|
||||||||||||||||||||||
|
Consolidated - Redevelopment Projects
|
|||||||||||||||||||||||||||||
|
Same-Property (1)
|
|||||||||||||||||||||||||||||
|
Southern California
|
|||||||||||||||||||||||||||||
|
The Henley
|
215
|
$
|
21,000
|
$
|
2,600
|
$
|
23,600
|
Q1 2014
|
|||||||||||||||||||||
|
The Blake LA
|
196
|
10,400
|
1,800
|
12,200
|
Q4 2016
|
||||||||||||||||||||||||
|
The Palms at Laguna Niguel
|
460
|
6,400
|
3,100
|
9,500
|
Q4 2016
|
||||||||||||||||||||||||
|
Total Same-Property - Redevelopment Projects
|
871
|
$
|
37,800
|
$
|
7,500
|
$
|
45,300
|
$
|
4,281
|
$
|
4,219
|
||||||||||||||||||
|
Non-Same Property
|
|||||||||||||||||||||||||||||
|
Southern California
|
|||||||||||||||||||||||||||||
|
Bunker Hill Towers
|
456
|
$
|
83,100
|
$
|
4,300
|
$
|
87,400
|
Q3 2013
|
|||||||||||||||||||||
|
Total Non-Same Property - Redevelopment Projects
|
456
|
$
|
83,100
|
$
|
4,300
|
$
|
87,400
|
$
|
2,250
|
$
|
2,129
|
||||||||||||||||||
| (1) |
Redevelopment activities are ongoing at these communities, but the communities have stabilized operations, therefore results are classified in same-property results.
|
See Company’s Form 10-K and Form 10-Qs filed with the SEC for additional information
S-12
E S S E X P R O P E R T Y T R U S T, I N C.
|
Capital Expenditures - March 31, 2020 (1)
|
||||||||||||||||||||
|
(Dollars in thousands, except in footnotes and per apartment home amounts)
|
||||||||||||||||||||
|
|
||||||||||||||||||||
|
Revenue Generating Capital Expenditures (2)
|
Q1 ‘20
|
Q4 ‘19
|
Q3 ‘19
|
Q2 ‘19
|
Trailing 4
Quarters
|
|||||||||||||||
|
Same-property portfolio
|
$
|
18,046
|
$
|
15,128
|
$
|
21,032
|
$
|
14,799
|
$
|
69,005
|
||||||||||
|
Non-same property portfolio
|
3,599
|
1,147
|
3,158
|
2,104
|
10,008
|
|||||||||||||||
|
Total revenue generating capital expenditures
|
$
|
21,645
|
$
|
16,275
|
$
|
24,190
|
$
|
16,903
|
$
|
79,013
|
||||||||||
|
Number of same-property interior renovations
|
777
|
993
|
1,302
|
1,079
|
4,151
|
|||||||||||||||
|
Number of total consolidated interior renovations
|
917
|
1,154
|
1,396
|
1,093
|
4,560
|
|||||||||||||||
|
Non-Revenue Generating Capital Expenditures (3)
|
Q1 ‘20
|
Q4 ‘19
|
Q3 ‘19
|
Q2 ‘19
|
Trailing 4
Quarters
|
|||||||||||||||
|
Non-revenue generating capital expenditures (4)
|
$
|
15,315
|
$
|
26,282
|
$
|
25,273
|
$
|
22,763
|
$
|
89,633
|
||||||||||
|
Average apartment homes in quarter
|
51,670
|
50,521
|
50,065
|
49,511
|
50,442
|
|||||||||||||||
|
Capital expenditures per apartment homes in the quarter
|
$
|
296
|
$
|
520
|
$
|
505
|
$
|
460
|
$
|
1,777
|
||||||||||
| (1) |
The Company incurred $0.1 million of capitalized interest, $3.3 million of capitalized overhead and $0.1 million of co-investment fees related to redevelopment in Q1 2020.
|
| (2) |
Represents revenue generating or expense saving expenditures, such as full-scale redevelopments shown on page S-12, interior unit turn renovations, enhanced amenities and certain resource
management initiatives.
|
| (3) |
Represents roof replacements, paving, building and mechanical systems, exterior painting, siding, etc.
|
| (4) |
Non-revenue generating capital expenditures does not include expenditures incurred due to changes in governmental regulations that the Company would not have incurred otherwise and retail,
furniture and fixtures, and expenditures in which the Company expects to be reimbursed.
|
See Company’s Form 10-K and Form 10-Qs filed with the SEC for additional information
S-12.1
E S S E X P R O P E R T Y T R U S T, I N C.
|
Co-investments and Preferred Equity Investments - March 31, 2020
|
||||||||||||||||||||||||||||||||
|
(Dollars in thousands)
|
||||||||||||||||||||||||||||||||
|
|
Weighted
Average Essex
Ownership
Percentage
|
Apartment
Homes
|
Total
Undepreciated
Book Value
|
Debt
Amount
|
Essex
Book
Value
|
Weighted
Average
Borrowing Rate
|
Remaining
Term of
Debt (in Years)
|
Three Months Ended
March 31, 2020 |
||||||||||||||||||||||||
|
Operating and Other Non-Consolidated Joint Ventures
|
NOI
|
|||||||||||||||||||||||||||||||
|
Wesco I, III, IV, and V
|
51
|
%
|
5,310
|
$
|
1,721,632
|
$
|
1,033,444
|
$
|
209,742
|
3.7
|
%
|
4.0
|
$
|
25,847
|
||||||||||||||||||
|
BEXAEW, BEX II, BEX III, and BEX IV
|
50
|
%
|
2,691
|
824,450
|
423,397
|
156,869
|
3.6
|
%
|
3.7
|
12,191
|
||||||||||||||||||||||
|
CPPIB (1)
|
-
|
-
|
-
|
-
|
-
|
-
|
-
|
2,008
|
||||||||||||||||||||||||
|
Other
|
48
|
%
|
651
|
214,337
|
167,078
|
21,023
|
3.5
|
%
|
3.7
|
3,595
|
||||||||||||||||||||||
|
Total Operating and Other Non-Consolidated Joint Ventures
|
8,652
|
$
|
2,760,419
|
$
|
1,623,919
|
$
|
387,634
|
3.6
|
%
|
3.9
|
$
|
43,641
|
||||||||||||||||||||
|
Pre-Development and Development Non-Consolidated Joint Ventures (2)
|
50
|
%
|
806
|
517,367
|
178,235
|
158,145
|
2.7
|
%
|
23.7
|
(3)
|
1,865
|
|||||||||||||||||||||
|
Total Non-Consolidated Joint Ventures
|
9,458
|
$
|
3,277,786
|
$
|
1,802,154
|
$
|
545,779
|
3.6
|
%
|
5.8
|
$
|
45,506
|
||||||||||||||||||||
|
Essex Portion of
NOI and Expenses
|
||||||||||||||||||||||||||||||||
|
NOI
|
$
|
23,685
|
||||||||||||||||||||||||||||||
|
Depreciation
|
(12,544
|
)
|
||||||||||||||||||||||||||||||
|
Interest expense and other
|
(8,078
|
)
|
||||||||||||||||||||||||||||||
|
Equity income (loss) from non-core co-investment
|
(110
|
)
|
||||||||||||||||||||||||||||||
|
Co-investment promote income
|
6,455
|
|||||||||||||||||||||||||||||||
|
Net income from operating and other co-investments
|
$
|
9,408
|
||||||||||||||||||||||||||||||
|
Weighted
Average
Preferred
Return
|
Weighted
Average
Expected
Term
|
Income from
Preferred Equity
Investments
|
||||||||||||||||||||||||||||||
|
Income from preferred equity investments
|
$
|
11,679
|
||||||||||||||||||||||||||||||
|
Income from early redemption of preferred equity investments
|
210
|
|||||||||||||||||||||||||||||||
|
Preferred Equity Investments (4)
|
$
|
451,358
|
10.6
|
%
|
2.0
|
$
|
11,889
|
|||||||||||||||||||||||||
|
Total Co-investments
|
$
|
997,137
|
$
|
21,297
|
||||||||||||||||||||||||||||
| (1) |
In January 2020, the Company purchased CPPIB’s 45% interest in each of a land parcel and six communities totaling 2,020 apartment homes. The NOI included in the three months ended March 31,
2020 represents the Company’s pro-rata share prior to the acquisition.
|
| (2) |
The Company has ownership interests in development co-investments, which are detailed on page S-11.
|
| (3) |
$132.0 million of the debt related to 500 Folsom, one of the Company’s development co-investments, is financed by tax exempt bonds with a maturity date of January 2052.
|
| (4) |
As of March 31, 2020, the Company has invested in 17 preferred equity investments.
|
See Company’s Form 10-K and Form 10-Qs filed with the SEC for additional information
S-13
E S S E X P R O P E R T Y T R U S T, I N C.
|
Summary of Apartment Community Acquisitions and Dispositions Activity
|
||||||||||||||||||||||||||
|
Year to date as of March 31, 2020
|
||||||||||||||||||||||||||
|
(Dollars in thousands)
|
||||||||||||||||||||||||||
|
|
|
|
||||||||||||||||||||||||
|
Acquisitions
|
Essex
|
Total
|
||||||||||||||||||||||||
|
Property Name
|
Location
|
Apartment
Homes
|
Ownership
Percentage
|
Entity
|
Date
|
Contract
Price
|
Price per
Apartment Home (2)
|
Average
Rent
|
||||||||||||||||||
|
CPPIB Portfolio (1)
|
Various
|
2,020
|
100
|
%
|
EPLP
|
Jan-20
|
$
|
463,400
|
$
|
497
|
$
|
2,732
|
||||||||||||||
|
Q1 2020
|
2,020
|
$
|
463,400
|
$
|
497
|
|||||||||||||||||||||
|
|
|
|
||||||||||||||||||||||||
|
Dispositions
|
Essex
|
Total
|
||||||||||||||||||||||||
|
Property Name
|
Location
|
Apartment
Homes
|
Ownership
Percentage |
Entity
|
Date
|
Sales
Price |
Price per
Apartment Home |
|||||||||||||||||||
Neither Essex nor its unconsolidated joint ventures sold any apartment communities during the first quarter of 2020.
|
(1)
|
In January 2020, the Company purchased the joint venture partner’s 45% membership interest in a land parcel and six communities representing 2,020 apartments homes based on a total
valuation of approximately $1.0 billion.
|
|
(2)
|
Price per apartment home excludes value allocated to retail space.
|
See Company’s Form 10-K and Form 10-Qs filed with the SEC for additional information
S-14
E S S E X P R O P E R T Y T R U S T, I N C.
April 2020 Collections, Operating Statistics, Liquidity, and Near-Term Funding Obligations
(Dollars in millions, except in footnotes)
|
Collections
|
Liquidity and Near-Term Funding Obligations
|
||||||||||||||
|
Total Residential Portfolio (61,955 units)
|
April 2020
|
1Q 2020
|
Liquidity Profile
|
April 30, 2020
|
|||||||||||
|
Cash delinquencies as % of scheduled rent
|
5.0
|
%
|
0.3
|
%
|
Unsecured credit facility - committed
|
$
|
1,235
|
||||||||
|
|
Balance outstanding
|
350
|
|||||||||||||
|
% of units requesting assistance
|
7.4
|
%
|
N/A
|
Undrawn portion of line of credit
|
$
|
885
|
|||||||||
|
Cash, cash equivalents & marketable securities (1)
|
129
|
||||||||||||||
|
Breakdown of units requesting assistance
|
Total liquidity
|
$
|
1,014
|
||||||||||||
|
% of units paid full April rent
|
36
|
%
|
N/A
|
||||||||||||
|
% of units paid partial April rent
|
36
|
%
|
N/A
|
||||||||||||
|
% of units paid no April rent
|
28
|
%
|
N/A
|
||||||||||||
|
Near-Term Funding Obligations
|
|||||||||||||||
|
% of units delinquent in April not requesting assistance (1)
|
2.2
|
%
|
N/A
|
Unfunded development commitments - 2020 & 2021
|
$
|
151
|
|||||||||
|
2020 Debt maturities (2)
|
-
|
||||||||||||||
|
2021 Debt maturities
|
532
|
||||||||||||||
|
Total
|
$ |
683 |
|||||||||||||
|
Operating Statistics
|
|||||||||||||||
|
Same-Property Portfolio (47,347 units)
|
April 2020
|
April 2019
|
|||||||||||||
|
Cash delinquencies as % of scheduled rent
|
5.0
|
%
|
0.4
|
%
|
|||||||||||
|
|
Ratio of liquidity to near-term funding obligations
|
1.5
|
|||||||||||||
|
New lease rates
|
1.5
|
%
|
2.5
|
%
|
|||||||||||
|
Renewal rates
|
2.4
|
%
|
4.8
|
%
|
|||||||||||
|
|
|||||||||||||||
|
Financial occupancy
|
95.4
|
%
|
96.7
|
%
|
|||||||||||
|
Physical occupancy (April 30, 2020)
|
94.4
|
%
|
96.5
|
%
|
|||||||||||
|
(1) Represents units that had greater than $250 in delinquency balance in April 2020.
|
(1) Excludes an investment in a mortgage backed security.
|
||||||||||||||
|
(2) The Company entered into a $200.0 million unsecured term loan in April 2020, the proceeds of which were used
to repay all remaining 2020 consolidated debt maturities.
|
|||||||||||||||
See Company’s Form 10-K and Form 10-Qs filed with the SEC for additional information
S-15
E S S E X P R O P E R T Y T R U S T, I N C.
|
2020 MSA Level Forecast: Supply, Jobs, and Apartment Market Conditions
|
||
|
Forecast Summary:
|
Forecast Assumptions:
|
|
|
2020 GDP Growth = -5.0% (-25% in 2Q20)
|
Current stay-at-home orders are partially relaxed no later than June 1st
|
|
|
2020 U.S. Job Growth = -7.0%
|
No extended “2nd wave” stay-at-home orders in California or Washington
|
|
|
2020 Multifamily supply in ESS markets down 15% vs. prior expectation
|
Many social distancing measures persist through 2020
|
|
|
2020 Unemployment rate peaks at 14-16%, falling to 6-8% by year-end
|
Federal $600/week UI supplement ends on July 31st (no extension)
|
|
|
Residential Supply (1)
|
Job Forecast (2)
|
Rent Forecast (3)
|
||||||||||||||||||||||||||||||
|
Market
|
New MF
Supply
|
New SF
Supply
|
Total
Supply
|
% of MF
Supply to
MF Stock
|
% of Total
Supply to
Total Stock
|
Est. New
Jobs
|
% Growth
|
Economic Rent
Growth
|
||||||||||||||||||||||||
|
So. Cal.
|
14,700
|
13,500
|
28,200
|
0.6
|
%
|
0.5
|
%
|
-565,000
|
-6.9
|
%
|
-3.2
|
%
|
||||||||||||||||||||
|
No. Cal.
|
9,300
|
5,900
|
15,200
|
1.2
|
%
|
0.7
|
%
|
-235,000
|
-6.6
|
%
|
-3.0
|
%
|
||||||||||||||||||||
|
Seattle
|
5,500
|
5,000
|
10,500
|
1.1
|
%
|
0.8
|
%
|
-100,000
|
-5.6
|
%
|
-1.5
|
%
|
||||||||||||||||||||
|
|
||||||||||||||||||||||||||||||||
|
Total/Weighted Avg. (4)
|
29,500
|
24,400
|
53,900
|
0.9
|
%
|
0.6
|
%
|
-900,000
|
-6.6
|
%
|
-2.8
|
%
|
||||||||||||||||||||
All data are based on Essex Property Trust, Inc. forecasts.
| (1) |
Residential Supply: Total supply
includes the Company’s estimate of multifamily deliveries of properties with 50+ units and excludes student, senior and 100% affordable housing communities. Single-family estimates are based on trailing single-family permits.
Multifamily estimates incorporate a methodological enhancement (“delay-adjusted supply”) to reflect the anticipated impact of continued construction delays in Essex markets.
|
| (2) |
Job Forecast: Refers to the difference between total non-farm industry employment (not seasonally adjusted) projected 4Q over 4Q, expressed as total new jobs and growth rates.
|
| (3) |
Rent Forecast: The estimated rent growth
represents the forecasted change in effective market rents for full year 2020 vs 2019 (excludes submarkets not targeted by Essex).
|
| (4) |
Weighted Average: Growth rates are
weighted by scheduled rent in the Company’s Portfolio.
|
See Company’s Form 10-K and Form 10-Qs filed with the SEC for additional information
S-16
E S S E X P R O P E R T Y T R U S T, I N C. Federal stimulus is mitigating the income
impact of unemployment in Essex marketsThe Federal supplement of $600 per week to unemployment benefits provides a meaningful source of near-term income for households affected by layoffs or furloughs due to COVID-19.For dual-income
households, the new unemployment benefits and CARES Act payments cover the average Essex apartment rent of approximately $2,400 at a rent-to-income ratio of 24.7% in California and 22.2% in Seattle. Source: Employment Security
Department of Washington, Employment Development Department of California. See Company’s Form 10-K and Form 10-Qs filed with the SEC for additional informationS-16.1 Scenario: Two-income household with no
children Pre-COVID annual income per person: $ 60,000 Monthly Rent: $ 2,400 As Une
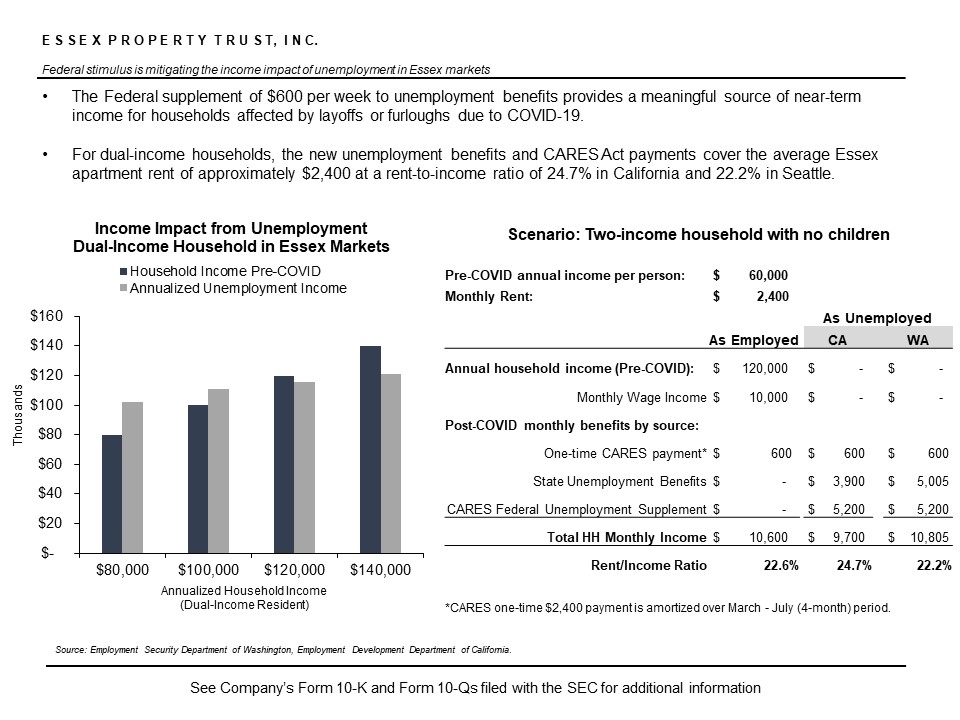
mployed As Employed CA WA Annual household income (Pre-COVID): $ 120,000 $ - $ - Monthly Wage Income $ 10,000
$ - $ - Post-COVID monthly benefits by source: One-time CARES payment* $ 600 $ 600 $ 600 State Unemployment Benefits $ - $ 3,900 $ 5,005 CARES Federal Unemployment Supplement $ -
$ 5,200 $ 5,200 Total HH Monthly Income $ 10,600 $ 9,700 $ 10,805 Rent/Income Ratio 22.6% 24.7% 22.2% *CARES one-time $2,400 payment is amortized over March - July (4-month)
period.
E S S E X P R O P E R T Y T R U S T, I N C. Federal stimulus is mitigating the
income impact of unemployment in Essex marketsThe Federal supplement of $600 per week to unemployment benefits provides a meaningful source of near-term income for households affected by layoffs or furloughs due to
COVID-19.For dual-income households, the new unemployment benefits and CARES Act payments cover the average Essex apartment rent of approximately $2,400 at a rent-to-income ratio of 24.7% in California and 22.2% in
Seattle. Source: Employment Security Department of Washington, Employment Development Department of California. See Company’s Form 10-K and Form 10-Qs filed with the SEC for additional informationThe number of shares of
common stock beneficially owned by each person is determined under the rules of the SEC. Under these rules, beneficial ownership includes any shares as to which the individual has sole or shared voting power or investment
power and also any shares that the individual has the right to acquire by June 28, 2020 (sixty days after April 29, 2020) through the exercise or conversion of a security or other right. Unless otherwise indicated, each
person has sole investment and voting power, or shares such power with a family member, with respect to the shares set forth in the following table. The inclusion in this table of any shares deemed beneficially owned does
not constitute an admission of beneficial ownership of those shares for any other purpose. As of April 29, 2020, there were 17,548,910 shares of common stock outstanding. Shares not outstanding, but deemed beneficially
owned by virtue of the right of a person to acquire those shares, are treated as outstanding only for purposes of determining the number and percent of shares co common stock owned by such person or group. Scenario:
Two-income household with no children Pre-COVID annual income per person: $ 60,000 Monthly Rent: $ 2,400 As Unemployed As Employed CA WA Annual
household income (Pre-COVID): $ 120,000 $ - $ - Monthly Wage Income $ 10,000 $ - $ - Post-COVID monthly benefits by source: One-time CARES payment* $ 600 $ 600 $ 600
State Unemployment Benefits $ - $ 3,900 $ 5,005 CARES Federal Unemployment Supplement $ - $ 5,200 $ 5,200 Total HH Monthly Income $ 10,600 $ 9,700 $ 10,805 Rent/Income
Ratio 22.6% 24.7% 22.2% *CARES one-time $2,400 payment is amortized over March - July (4-month) period.
S-16.1
E S S E X P R O P E R T Y T R U S T, I N C.
Reconciliations of Non-GAAP Financial Measures and Other Terms
Adjusted EBITDAre Reconciliation
The National Association of Real Estate Investment Trusts (“NAREIT”) defines earnings before interest, taxes, depreciation and amortization for real
estate (“EBITDAre”) (September 2017 White Paper) as net income (computed in accordance with U.S. generally accepted accounting principles (“U.S. GAAP”)) before interest expense, income taxes, depreciation and amortization expense, and further
adjusted for gains and losses from sales of depreciated operating properties, impairment write-downs of depreciated operating properties, impairment write-downs of investments in unconsolidated entities caused by a decrease in value of
depreciated operating properties within the joint venture and adjustments to reflect the Company’s share of EBITDAre of investments in unconsolidated entities.
The Company believes that EBITDAre is useful to investors, creditors and rating agencies as a supplemental measure of the Company’s ability to incur and service debt because it is a recognized measure of performance by the real estate industry, and by excluding gains or losses related to sales or impairment of depreciated operating properties, EBITDAre can help compare the Company’s credit strength between periods or as compared to different companies.
Adjusted EBITDAre represents EBITDAre further adjusted for non-comparable items and is a component of the credit ratio, “Net Indebtedness Divided by Adjusted EBITDAre, normalized and annualized,” presented on page S-6, in the section titled “Selected Credit Ratios,” and it is not intended to be a measure of free cash flow for management’s discretionary use, as it does not consider certain cash requirements such as income tax payments, debt service requirements, capital expenditures and other fixed charges.
Adjusted EBITDAre is an important metric in evaluating the credit strength of the Company and its ability to service its debt obligations. The Company believes that Adjusted EBITDAre is useful to investors, creditors and rating agencies because it allows investors to compare the Company’s credit strength to prior reporting periods and to other companies without the effect of items that by their nature are not comparable from period to period and tend to obscure the Company’s actual credit quality.
EBITDAre and Adjusted EBITDAre are not recognized measurements under U.S. GAAP. Because not all companies use identical calculations, the Company’s presentation of EBITDAre and Adjusted EBITDAre may not be comparable to similarly titled measures of other companies.
The reconciliations of Net Income available to common stockholders to EBITDAre and Adjusted EBITDAre are presented in the table below (Dollars in
thousands):
|
Three Months Ended
March 31,
2020
|
||||
|
Net income available to common stockholders
|
$
|
315,006
|
||
|
Adjustments:
|
||||
|
Net income attributable to noncontrolling interest
|
13,759
|
|||
|
Interest expense, net (1)
|
53,163
|
|||
|
Depreciation and amortization
|
131,559
|
|||
|
Income tax provision
|
65
|
|||
|
Gain on remeasurement of co-investment communities
|
(234,694
|
)
|
||
|
Co-investment EBITDAre adjustments
|
20,382
|
|||
|
EBITDAre
|
299,240
|
|||
|
Gain on sale of marketable securities
|
13
|
|||
|
Unrealized gains on marketable securities
|
8,696
|
|||
|
Provision for credit losses
|
(50
|
)
|
||
|
Equity loss from non-core co-investment
|
110
|
|||
|
General and administrative and other, net
|
820
|
|||
|
Insurance reimbursements and legal settlements, net
|
43
|
|||
|
Co-investment promote income
|
(6,455
|
)
|
||
|
Income from early redemption of preferred equity investments
|
(210
|
)
|
||
|
Expensed acquisition and investment related costs
|
87
|
|||
|
Gain on early retirement of debt, net
|
(321
|
)
|
||
|
Adjusted EBITDAre
|
$
|
301,973
|
||
| (1) |
Interest expense, net includes items such as gains on derivatives and the amortization of deferred charges.
|
See Company’s Form 10-K and Form 10-Qs filed with the SEC for additional information
S-17.1
E S S E X P R O P E R T Y T R U S T, I N C.
Reconciliations of Non-GAAP Financial Measures and Other Terms
Encumbered
Encumbered means any mortgage, deed of trust, lien, charge, pledge, security interest, security agreement or other encumbrance of any kind.
Funds From Operations (“FFO”) and Core FFO
FFO, as defined by NAREIT, is generally considered by industry analysts as an appropriate measure of performance of an equity REIT. Generally, FFO
adjusts the net income of equity REITs for non-cash charges such as depreciation and amortization of rental properties, impairment charges, gains on sales of real estate and extraordinary items. Management considers FFO and FFO which excludes
non-core items, which is referred to as “Core FFO,” to be useful supplemental operating performance measures of an equity REIT because, together with net income and cash flows, FFO and Core FFO provide investors with additional bases to
evaluate the operating performance and ability of a REIT to incur and service debt and to fund acquisitions and other capital expenditures and to pay dividends. By excluding gains or losses related to sales of depreciated operating properties
and excluding real estate depreciation (which can vary among owners of identical assets in similar condition based on historical cost accounting and useful life estimates), FFO can help investors compare the operating performance of a real
estate company between periods or as compared to different companies. By further adjusting for items that are not considered part of the Company’s core business operations, Core FFO allows investors to compare the core operating performance of
the Company to its performance in prior reporting periods and to the operating performance of other real estate companies without the effect of items that by their nature are not comparable from period to period and tend to obscure the
Company’s actual operating results.
FFO and Core FFO do not represent net income or cash flows from operations as defined by U.S. GAAP and are not intended to indicate whether cash flows will be sufficient to fund cash needs. These measures should not be considered as alternatives to net income as an indicator of the REIT’s operating performance or to cash flows as a measure of liquidity. FFO and Core FFO do not measure whether cash flow is sufficient to fund all cash needs including principal amortization, capital improvements and distributions to stockholders. FFO and Core FFO also do not represent cash flows generated from operating, investing or financing activities as defined under GAAP. Management has consistently applied the NAREIT definition of FFO to all periods presented. However, there is judgment involved and other REITs’ calculation of FFO may vary from the NAREIT definition for this measure, and thus their disclosures of FFO may not be comparable to the Company’s calculation.
The reconciliations of diluted FFO and Core FFO are detailed on page S-3 in the section titled “Consolidated Funds From Operations”.
Interest Expense, Net
Interest expense, net is presented on page S-1 in the section titled “Consolidated Operating Results”. Interest expense, net includes items such as
gains on derivatives and the amortization of deferred charges and is presented in the table below (Dollars in thousands):
|
Three Months Ended
March 31,
2020
|
||||
|
Interest expense
|
$
|
55,147
|
||
|
Adjustments:
|
||||
|
Total return swap income
|
(1,984
|
)
|
||
|
Interest expense, net
|
$
|
53,163
|
||
See Company’s Form 10-K and Form 10-Qs filed with the SEC for additional information
S-17.2
E S S E X P R O P E R T Y T R U S T, I N C.
Reconciliations of Non-GAAP Financial Measures and Other Terms
Net Indebtedness Divided by Adjusted EBITDAre
This credit ratio is presented on page S-6 in the section titled “Selected Credit Ratios.” This credit ratio is calculated by dividing net
indebtedness by Adjusted EBITDAre, as annualized based on the most recent quarter, and adjusted for estimated net operating income from properties acquired or disposed of during the quarter. This ratio is presented by the Company because it
provides rating agencies and investors an additional means of comparing the Company’s ability to service debt obligations to that of other companies. Net indebtedness is total debt, net less unamortized premiums, discounts, debt issuance costs,
unrestricted cash and cash equivalents, and marketable securities. The reconciliation of Adjusted EBITDAre is set forth in “Adjusted EBITDAre Reconciliation” on page S-17.1 The calculation of this credit ratio and a reconciliation of net
indebtedness to total debt at pro rata share for co-investments, net is presented in the table below (Dollars in thousands):
|
Total consolidated debt, net
|
$
|
6,495,652
|
||
|
Total debt from co-investments at pro rata share
|
919,971
|
|||
|
Adjustments:
|
||||
|
Consolidated unamortized premiums, discounts, and debt issuance costs
|
39,119
|
|||
|
Pro rata co-investments unamortized premiums, discounts, and debt issuance costs
|
4,210
|
|||
|
Consolidated cash and cash equivalents-unrestricted
|
(271,877
|
)
|
||
|
Pro rata co-investment cash and cash equivalents-unrestricted
|
(29,322
|
)
|
||
|
Marketable securities (1)
|
(73,094
|
)
|
||
|
Net Indebtedness
|
$
|
7,084,659
|
||
|
Adjusted EBITDAre, annualized (2)
|
$
|
1,207,892
|
||
|
Other EBITDAre normalization adjustments, net, annualized (3)
|
2,601
|
|||
|
Adjusted EBITDAre, normalized and annualized
|
$
|
1,210,493
|
||
|
Net Indebtedness Divided by Adjusted EBITDAre, normalized and annualized
|
5.9
|
| (1) |
Excludes investment in mortgage backed security
|
| (2) |
Based on the amount for the most recent quarter, multiplied by four.
|
| (3) |
Adjustments made for properties in lease-up, acquired, or disposed of during the most recent quarter and other partial quarter activity, multiplied by four.
|
Net Operating Income (“NOI”) and Same-Property NOI Reconciliations
NOI and same-property NOI are considered by management to be important supplemental performance measures to earnings from operations included in the
Company’s consolidated statements of income. The presentation of same-property NOI assists with the presentation of the Company’s operations prior to the allocation of depreciation and any corporate-level or financing-related costs. NOI
reflects the operating performance of a community and allows for an easy comparison of the operating performance of individual communities or groups of communities.
In addition, because prospective buyers of real estate have different financing and overhead structures, with varying marginal impacts to overhead by acquiring real estate, NOI is considered by many in the real estate industry to be a useful measure for determining the value of a real estate asset or group of assets. The Company defines same-property NOI as same-property revenues less same-property operating expenses, including property taxes. Please see the reconciliation of earnings from operations to NOI and same-property NOI, which in the table below is the NOI for stabilized properties consolidated by the Company for the periods presented (Dollars in thousands):
In addition, because prospective buyers of real estate have different financing and overhead structures, with varying marginal impacts to overhead by acquiring real estate, NOI is considered by many in the real estate industry to be a useful measure for determining the value of a real estate asset or group of assets. The Company defines same-property NOI as same-property revenues less same-property operating expenses, including property taxes. Please see the reconciliation of earnings from operations to NOI and same-property NOI, which in the table below is the NOI for stabilized properties consolidated by the Company for the periods presented (Dollars in thousands):
|
Three Months Ended
March 31,
2020
|
Three Months Ended
March 31,
2019
|
|||||||
|
Earnings from operations
|
$
|
130,837
|
$
|
115,695
|
||||
|
Adjustments:
|
||||||||
|
Corporate-level property management expenses
|
8,759
|
8,429
|
||||||
|
Depreciation and amortization
|
131,559
|
120,568
|
||||||
|
Management and other fees from affiliates
|
(2,617
|
)
|
(2,335
|
)
|
||||
|
General and administrative
|
13,982
|
13,459
|
||||||
|
Expensed acquisition and investment related costs
|
87
|
32
|
||||||
|
NOI
|
282,607
|
255,848
|
||||||
|
Less: Non-same property NOI
|
(30,842
|
)
|
(13,638
|
)
|
||||
|
Same-Property NOI
|
$
|
251,765
|
$
|
242,210
|
||||
See Company’s Form 10-K and Form 10-Qs filed with the SEC for additional information
S-17.3
Public Bond Covenants
Public Bond Covenants refer to certain covenants set forth in instruments governing the Company’s unsecured indebtedness. These instruments require
the Company to meet specified financial covenants, including covenants relating to net worth, fixed charge coverage, debt service coverage, the amounts of total indebtedness and secured indebtedness, leverage and certain investment limitations.
These covenants may restrict the Company’s ability to expand or fully pursue its business strategies. The Company’s ability to comply with these covenants may be affected by changes in the Company’s operating and financial performance, changes
in general business and economic conditions, adverse regulatory developments or other events adversely impacting it. The breach of any of these covenants could result in a default under the Company’s indebtedness, which could cause those and
other obligations to become due and payable. If any of the Company’s indebtedness is accelerated, the Company may not be able to repay it. For risks related to failure to comply with these covenants, see “Item 1A: Risk Factors - Risks Related
to Our Indebtedness and Financings” in the Company’s annual report on Form 10-K and other reports filed by the Company with the Securities and Exchange Commission (“SEC”).
The ratios set forth on page S-6 in the section titled “Public Bond Covenants” are provided only to show the Company’s compliance with certain
specified covenants that are contained in indentures related to the Company’s issuance of Senior Notes, which indentures are filed by the Company with the SEC. See, for example, the Indenture dated February 11, 2020, filed by the Company as
Exhibit 4.1 to the Company’s Form 8-K, filed on February 11, 2020. These ratios should not be used for any other purpose, including without limitation to evaluate the Company’s financial condition or results of operations, nor do they indicate
the Company’s covenant compliance as of any other date or for any other period. The capitalized terms in the disclosure are defined in the indentures filed by the Company with the SEC and may differ materially from similar terms used by other
companies that present information about their covenant compliance.
Secured Debt
Secured Debt means debt of the Company or any of its subsidiaries which is secured by an encumbrance on any property or assets of the Company or any
of its subsidiaries. The Company’s total amount of Secured Debt is set forth on page S-5.
Unencumbered NOI to Adjusted Total NOI
This ratio is presented on page S-6 in the section titled “Selected Credit Ratios”. Unencumbered NOI means the sum of NOI for those real estate
assets which are not subject to an encumbrance securing debt. The ratio of Unencumbered NOI to Adjusted Total NOI for the three months ended March 31, 2020, annualized, is calculated by dividing Unencumbered NOI, annualized for the three months
ended March 31, 2020 and as further adjusted for pro forma NOI for properties acquired or sold during the recent quarter, by Adjusted Total NOI as annualized. The calculation and reconciliation of NOI is set forth in “Net Operating Income
(“NOI”) and Same-Property NOI Reconciliations” above. This ratio is presented by the Company because it provides rating agencies and investors an additional means of comparing the Company’s ability to service debt obligations to that of other
companies. The calculation of this ratio is presented in the table below (Dollars in thousands):
|
Annualized
Q1‘20 (1)
|
||||
|
NOI
|
$
|
1,130,428
|
||
|
Adjustments:
|
||||
|
Other, net (2)
|
(3,033
|
)
|
||
|
Adjusted Total NOI
|
1,127,395
|
|||
|
Less: Encumbered NOI
|
(107,901
|
)
|
||
|
Unencumbered NOI
|
$
|
1,019,494
|
||
|
Encumbered NOI
|
$
|
107,901
|
||
|
Unencumbered NOI
|
1,019,494
|
|||
|
Adjusted Total NOI
|
$
|
1,127,395
|
||
|
Unencumbered NOI to Adjusted Total NOI
|
90
|
%
|
||
| (1) |
This table is based on the amounts for the most recent quarter, multiplied by four.
|
| (2) |
Includes intercompany eliminations pertaining to self-insurance and other expenses.
|
See Company’s Form 10-K and Form 10-Qs filed with the SEC for additional information
S-17.4