0000920371false--12-312022FY—0.01—5,000————0.010.01160,000160,00043,21743,32643,21743,3261.030.980.92—93.4588.31P3YP3YP3YP3YP3Yhttp://fasb.org/us-gaap/2021-01-31#AccruedLiabilitiesCurrenthttp://fasb.org/us-gaap/2021-01-31#AccruedLiabilitiesCurrenthttp://fasb.org/us-gaap/2021-01-31#PropertyPlantAndEquipmentNethttp://fasb.org/us-gaap/2021-01-31#PropertyPlantAndEquipmentNet00009203712022-01-012022-12-3100009203712021-06-30iso4217:USD00009203712023-02-24xbrli:shares00009203712022-12-3100009203712021-12-31iso4217:USDxbrli:shares00009203712021-01-012021-12-3100009203712020-01-012020-12-310000920371ssd:ETANCOMember2022-01-012022-12-310000920371ssd:ETANCOMember2021-01-012021-12-310000920371ssd:ETANCOMember2020-01-012020-12-310000920371us-gaap:CommonStockMember2019-12-310000920371us-gaap:AdditionalPaidInCapitalMember2019-12-310000920371us-gaap:RetainedEarningsMember2019-12-310000920371us-gaap:AociIncludingPortionAttributableToNoncontrollingInterestMember2019-12-310000920371us-gaap:TreasuryStockMember2019-12-3100009203712019-12-310000920371us-gaap:RetainedEarningsMember2020-01-012020-12-310000920371us-gaap:AociIncludingPortionAttributableToNoncontrollingInterestMember2020-01-012020-12-310000920371us-gaap:AccountingStandardsUpdate201409Memberus-gaap:AociIncludingPortionAttributableToNoncontrollingInterestMember2019-12-310000920371us-gaap:AccountingStandardsUpdate201409Member2019-12-310000920371us-gaap:AdditionalPaidInCapitalMember2020-01-012020-12-310000920371us-gaap:CommonStockMember2020-01-012020-12-310000920371us-gaap:TreasuryStockMember2020-01-012020-12-310000920371us-gaap:CommonStockMember2020-12-310000920371us-gaap:AdditionalPaidInCapitalMember2020-12-310000920371us-gaap:RetainedEarningsMember2020-12-310000920371us-gaap:AociIncludingPortionAttributableToNoncontrollingInterestMember2020-12-310000920371us-gaap:TreasuryStockMember2020-12-3100009203712020-12-310000920371us-gaap:RetainedEarningsMember2021-01-012021-12-310000920371us-gaap:AociIncludingPortionAttributableToNoncontrollingInterestMember2021-01-012021-12-310000920371us-gaap:AdditionalPaidInCapitalMember2021-01-012021-12-310000920371us-gaap:CommonStockMember2021-01-012021-12-310000920371us-gaap:TreasuryStockMember2021-01-012021-12-310000920371us-gaap:CommonStockMember2021-12-310000920371us-gaap:AdditionalPaidInCapitalMember2021-12-310000920371us-gaap:RetainedEarningsMember2021-12-310000920371us-gaap:AociIncludingPortionAttributableToNoncontrollingInterestMember2021-12-310000920371us-gaap:TreasuryStockMember2021-12-310000920371us-gaap:RetainedEarningsMember2022-01-012022-12-310000920371us-gaap:AociIncludingPortionAttributableToNoncontrollingInterestMember2022-01-012022-12-310000920371us-gaap:AdditionalPaidInCapitalMember2022-01-012022-12-310000920371us-gaap:CommonStockMember2022-01-012022-12-310000920371us-gaap:TreasuryStockMember2022-01-012022-12-310000920371us-gaap:CommonStockMember2022-12-310000920371us-gaap:AdditionalPaidInCapitalMember2022-12-310000920371us-gaap:RetainedEarningsMember2022-12-310000920371us-gaap:AociIncludingPortionAttributableToNoncontrollingInterestMember2022-12-310000920371us-gaap:TreasuryStockMember2022-12-31xbrli:pure0000920371us-gaap:FairValueInputsLevel1Member2022-12-310000920371us-gaap:FairValueInputsLevel1Member2021-12-31ssd:bank0000920371us-gaap:FairValueInputsLevel2Member2022-12-310000920371us-gaap:FairValueInputsLevel3Member2022-12-310000920371us-gaap:FairValueInputsLevel1Memberus-gaap:RevolvingCreditFacilityMember2022-12-310000920371us-gaap:FairValueInputsLevel2Memberus-gaap:RevolvingCreditFacilityMember2022-12-310000920371us-gaap:FairValueInputsLevel3Memberus-gaap:RevolvingCreditFacilityMember2022-12-310000920371us-gaap:FairValueInputsLevel1Memberus-gaap:RevolvingCreditFacilityMember2021-12-310000920371us-gaap:FairValueInputsLevel1Memberssd:DerivativeContractsMember2022-12-310000920371us-gaap:FairValueInputsLevel2Memberssd:DerivativeContractsMember2022-12-310000920371us-gaap:FairValueInputsLevel3Memberssd:DerivativeContractsMember2022-12-310000920371us-gaap:FairValueInputsLevel1Memberssd:DerivativeContractsMember2021-12-310000920371us-gaap:ForeignExchangeContractMemberus-gaap:FairValueInputsLevel1Member2022-12-310000920371us-gaap:ForeignExchangeContractMemberus-gaap:FairValueInputsLevel3Member2022-12-310000920371us-gaap:ForeignExchangeContractMemberus-gaap:FairValueInputsLevel1Member2021-12-310000920371us-gaap:SoftwareAndSoftwareDevelopmentCostsMembersrt:MinimumMember2022-01-012022-12-310000920371us-gaap:SoftwareAndSoftwareDevelopmentCostsMembersrt:MaximumMember2022-01-012022-12-310000920371us-gaap:MachineryAndEquipmentMembersrt:MinimumMember2022-01-012022-12-310000920371us-gaap:MachineryAndEquipmentMembersrt:MaximumMember2022-01-012022-12-310000920371us-gaap:BuildingAndBuildingImprovementsMembersrt:MinimumMember2022-01-012022-12-310000920371us-gaap:BuildingAndBuildingImprovementsMembersrt:MaximumMember2022-01-012022-12-310000920371ssd:WoodConstructionMemberus-gaap:AccountingStandardsUpdate201409Member2022-01-012022-12-310000920371ssd:WoodConstructionMemberus-gaap:AccountingStandardsUpdate201409Member2021-01-012021-12-310000920371ssd:WoodConstructionMemberus-gaap:AccountingStandardsUpdate201409Member2020-01-012020-12-310000920371ssd:ConcreteConstructionMemberus-gaap:AccountingStandardsUpdate201409Member2022-01-012022-12-310000920371ssd:ConcreteConstructionMemberus-gaap:AccountingStandardsUpdate201409Member2021-01-012021-12-310000920371ssd:ConcreteConstructionMemberus-gaap:AccountingStandardsUpdate201409Member2020-01-012020-12-310000920371us-gaap:AccountingStandardsUpdate201409Memberssd:OtherProductsMember2022-01-012022-12-310000920371ssd:ETANCOMember2022-04-010000920371ssd:ETANCOMemberus-gaap:RevolvingCreditFacilityMember2022-01-012022-12-310000920371ssd:ETANCOMemberus-gaap:RevolvingCreditFacilityMember2022-12-310000920371ssd:ETANCOMemberssd:ETANCOMember2022-01-012022-12-310000920371ssd:ETANCOMember2022-12-310000920371ssd:ETANCOMemberssd:ETANCOMember2022-12-310000920371ssd:ETANCOMemberus-gaap:LandMember2022-01-012022-12-310000920371ssd:ETANCOMemberus-gaap:BuildingAndBuildingImprovementsMember2022-01-012022-12-310000920371ssd:ETANCOMemberssd:MachineryEquipmentAndSoftwareDevelopmentMember2022-01-012022-12-310000920371us-gaap:BuildingAndBuildingImprovementsMember2022-01-012022-12-310000920371ssd:MachineryEquipmentAndSoftwareDevelopmentMembersrt:MinimumMember2022-01-012022-12-310000920371srt:MaximumMemberssd:MachineryEquipmentAndSoftwareDevelopmentMember2022-01-012022-12-310000920371ssd:ETANCOMemberus-gaap:CustomerRelationshipsMember2022-01-012022-12-310000920371ssd:ETANCOMemberus-gaap:CustomerRelationshipsMember2022-12-310000920371ssd:ETANCOMemberus-gaap:TradeNamesMember2022-12-310000920371ssd:ETANCOMemberus-gaap:DevelopedTechnologyRightsMember2022-01-012022-12-310000920371ssd:ETANCOMemberus-gaap:DevelopedTechnologyRightsMember2022-12-310000920371us-gaap:PatentsMemberssd:ETANCOMember2022-01-012022-12-310000920371us-gaap:PatentsMemberssd:ETANCOMember2022-12-310000920371us-gaap:AcquisitionRelatedCostsMember2022-01-012022-12-310000920371ssd:AmortizationProFormaMember2022-01-012022-12-310000920371ssd:NetIncomeProFormaWithAdjustmentMember2022-01-012022-12-310000920371ssd:NetIncomeProFormaWithAdjustmentMember2021-01-012021-12-310000920371ssd:A2018StockRepurchaseProgramMemberMember2018-12-010000920371ssd:A2019StockRepurchaseProgramMember2019-12-090000920371us-gaap:AccumulatedTranslationAdjustmentMember2019-12-310000920371us-gaap:AccumulatedDefinedBenefitPlansAdjustmentMember2019-12-310000920371us-gaap:AccumulatedGainLossNetCashFlowHedgeParentMember2019-12-310000920371ssd:ForwardForeignCurrencyMember2019-12-310000920371us-gaap:AccumulatedTranslationAdjustmentMember2020-01-012020-12-310000920371us-gaap:AccumulatedDefinedBenefitPlansAdjustmentMember2020-01-012020-12-310000920371us-gaap:AccumulatedGainLossNetCashFlowHedgeParentMember2020-01-012020-12-310000920371ssd:ForwardForeignCurrencyMember2020-01-012020-12-310000920371us-gaap:AccumulatedTranslationAdjustmentMember2020-12-310000920371us-gaap:AccumulatedDefinedBenefitPlansAdjustmentMember2020-12-310000920371us-gaap:AccumulatedGainLossNetCashFlowHedgeParentMember2020-12-310000920371ssd:ForwardForeignCurrencyMember2020-12-310000920371us-gaap:AccumulatedTranslationAdjustmentMember2021-01-012021-12-310000920371us-gaap:AccumulatedDefinedBenefitPlansAdjustmentMember2021-01-012021-12-310000920371us-gaap:AccumulatedGainLossNetCashFlowHedgeParentMember2021-01-012021-12-310000920371ssd:ForwardForeignCurrencyMember2021-01-012021-12-310000920371us-gaap:AccumulatedTranslationAdjustmentMember2021-12-310000920371us-gaap:AccumulatedDefinedBenefitPlansAdjustmentMember2021-12-310000920371us-gaap:AccumulatedGainLossNetCashFlowHedgeParentMember2021-12-310000920371ssd:ForwardForeignCurrencyMember2021-12-310000920371us-gaap:AccumulatedTranslationAdjustmentMember2022-01-012022-12-310000920371us-gaap:AccumulatedDefinedBenefitPlansAdjustmentMember2022-01-012022-12-310000920371us-gaap:AccumulatedGainLossNetCashFlowHedgeParentMember2022-01-012022-12-310000920371ssd:ForwardForeignCurrencyMember2022-01-012022-12-310000920371us-gaap:AccumulatedTranslationAdjustmentMember2022-12-310000920371us-gaap:AccumulatedDefinedBenefitPlansAdjustmentMember2022-12-310000920371us-gaap:AccumulatedGainLossNetCashFlowHedgeParentMember2022-12-310000920371ssd:ForwardForeignCurrencyMember2022-12-310000920371us-gaap:EmployeeStockOptionMemberssd:StockOptionAndRestrictedStockUnitPlan2011Member2022-12-310000920371us-gaap:RestrictedStockUnitsRSUMember2021-12-310000920371us-gaap:RestrictedStockUnitsRSUMember2022-01-012022-12-310000920371us-gaap:RestrictedStockUnitsRSUMember2022-12-310000920371us-gaap:RestrictedStockUnitsRSUMemberssd:EmployeesMember2022-01-012022-12-310000920371us-gaap:PhantomShareUnitsPSUsMember2022-01-012022-12-310000920371us-gaap:RestrictedStockUnitsRSUMembersrt:DirectorMember2022-01-012022-12-31ssd:director0000920371us-gaap:RestrictedStockUnitsRSUMember2021-01-012021-12-310000920371us-gaap:RestrictedStockUnitsRSUMember2020-01-012020-12-310000920371us-gaap:RestrictedStockUnitsRSUMemberssd:StockBonusPlanMember2022-01-012022-12-310000920371us-gaap:RestrictedStockUnitsRSUMemberssd:StockBonusPlanMember2021-01-012021-12-310000920371us-gaap:RestrictedStockUnitsRSUMemberssd:StockBonusPlanMember2020-01-012020-12-310000920371ssd:CNYForwardContractsMember2022-11-012022-11-3000009203712022-03-310000920371ssd:ForwardPointsMember2022-03-310000920371ssd:ForwardPointsMember2022-01-012022-12-310000920371ssd:CrossCurrencySwapIndexedToEquitySettlementCashAmountMember2022-03-310000920371us-gaap:SwapMember2022-03-012022-03-3100009203712022-03-012022-03-310000920371ssd:HedgeAccountingReserveBalanceMember2022-03-012022-03-310000920371us-gaap:InterestRateContractMember2022-12-310000920371us-gaap:CrossCurrencyInterestRateContractMember2022-12-310000920371ssd:EURForwardContractMember2022-12-310000920371ssd:CNYForwardContractsMember2022-12-310000920371us-gaap:InterestExpenseMemberus-gaap:CashFlowHedgingMember2022-01-012022-12-310000920371us-gaap:InterestExpenseMemberus-gaap:CashFlowHedgingMemberus-gaap:InterestRateContractMember2022-01-012022-12-310000920371us-gaap:InterestExpenseMemberus-gaap:CrossCurrencyInterestRateContractMemberus-gaap:CashFlowHedgingMember2022-01-012022-12-310000920371us-gaap:ForeignCurrencyGainLossMemberus-gaap:CrossCurrencyInterestRateContractMemberus-gaap:CashFlowHedgingMember2022-01-012022-12-310000920371us-gaap:CashFlowHedgingMemberus-gaap:InterestRateContractMember2022-01-012022-12-310000920371us-gaap:CashFlowHedgingMemberus-gaap:InterestRateContractMember2021-01-012021-12-310000920371us-gaap:InterestExpenseMemberus-gaap:CashFlowHedgingMemberus-gaap:InterestRateContractMember2021-01-012021-12-310000920371us-gaap:CrossCurrencyInterestRateContractMemberus-gaap:CashFlowHedgingMember2022-01-012022-12-310000920371us-gaap:CrossCurrencyInterestRateContractMemberus-gaap:CashFlowHedgingMember2021-01-012021-12-310000920371us-gaap:InterestExpenseMemberus-gaap:CrossCurrencyInterestRateContractMemberus-gaap:CashFlowHedgingMember2021-01-012021-12-310000920371us-gaap:ForeignExchangeContractMemberus-gaap:ForeignCurrencyGainLossMemberus-gaap:CashFlowHedgingMember2022-01-012022-12-310000920371us-gaap:ForeignExchangeContractMemberus-gaap:ForeignCurrencyGainLossMemberus-gaap:CashFlowHedgingMember2021-01-012021-12-310000920371us-gaap:ForwardContractsMemberus-gaap:CashFlowHedgingMember2022-01-012022-12-310000920371us-gaap:ForwardContractsMemberus-gaap:CashFlowHedgingMember2021-01-012021-12-310000920371us-gaap:CostOfSalesMemberus-gaap:ForwardContractsMemberus-gaap:CashFlowHedgingMember2022-01-012022-12-310000920371us-gaap:CostOfSalesMemberus-gaap:ForwardContractsMemberus-gaap:CashFlowHedgingMember2021-01-012021-12-310000920371us-gaap:CashFlowHedgingMember2022-01-012022-12-310000920371us-gaap:CashFlowHedgingMember2021-01-012021-12-310000920371us-gaap:NetInvestmentHedgingMember2022-01-012022-12-310000920371us-gaap:LandMember2022-12-310000920371us-gaap:LandMember2021-12-310000920371us-gaap:BuildingAndBuildingImprovementsMember2022-12-310000920371us-gaap:BuildingAndBuildingImprovementsMember2021-12-310000920371us-gaap:LeaseholdImprovementsMember2022-12-310000920371us-gaap:LeaseholdImprovementsMember2021-12-310000920371us-gaap:MachineryAndEquipmentMember2022-12-310000920371us-gaap:MachineryAndEquipmentMember2021-12-310000920371us-gaap:SoftwareDevelopmentMember2022-12-310000920371us-gaap:SoftwareDevelopmentMember2021-12-310000920371ssd:NorthAmericaSegmentMember2020-12-310000920371ssd:EuropeSegmentMember2020-12-310000920371ssd:AsiaPacificSegmentMember2020-12-310000920371ssd:NorthAmericaSegmentMember2021-01-012021-12-310000920371ssd:EuropeSegmentMember2021-01-012021-12-310000920371ssd:AsiaPacificSegmentMember2021-01-012021-12-310000920371ssd:NorthAmericaSegmentMember2021-12-310000920371ssd:EuropeSegmentMember2021-12-310000920371ssd:AsiaPacificSegmentMember2021-12-310000920371ssd:NorthAmericaSegmentMember2022-01-012022-12-310000920371ssd:EuropeSegmentMember2022-01-012022-12-310000920371ssd:AsiaPacificSegmentMember2022-01-012022-12-310000920371ssd:NorthAmericaSegmentMember2022-12-310000920371ssd:EuropeSegmentMember2022-12-310000920371ssd:AsiaPacificSegmentMember2022-12-310000920371srt:MinimumMember2022-01-012022-12-310000920371srt:MaximumMember2022-01-012022-12-310000920371us-gaap:PatentsMember2020-12-310000920371us-gaap:PatentsMember2021-01-012021-12-310000920371us-gaap:PatentsMember2021-12-310000920371us-gaap:PatentsMember2022-01-012022-12-310000920371us-gaap:PatentsMember2022-12-310000920371us-gaap:UnpatentedTechnologyMember2020-12-310000920371us-gaap:UnpatentedTechnologyMember2021-01-012021-12-310000920371us-gaap:UnpatentedTechnologyMember2021-12-310000920371us-gaap:UnpatentedTechnologyMember2022-01-012022-12-310000920371us-gaap:UnpatentedTechnologyMember2022-12-310000920371ssd:NoncompeteAgreementsTrademarksAndOtherMember2020-12-310000920371ssd:NoncompeteAgreementsTrademarksAndOtherMember2021-01-012021-12-310000920371ssd:NoncompeteAgreementsTrademarksAndOtherMember2021-12-310000920371ssd:NoncompeteAgreementsTrademarksAndOtherMember2022-01-012022-12-310000920371ssd:NoncompeteAgreementsTrademarksAndOtherMember2022-12-310000920371us-gaap:CustomerRelationshipsMember2020-12-310000920371us-gaap:CustomerRelationshipsMember2021-01-012021-12-310000920371us-gaap:CustomerRelationshipsMember2021-12-310000920371us-gaap:CustomerRelationshipsMember2022-01-012022-12-310000920371us-gaap:CustomerRelationshipsMember2022-12-310000920371us-gaap:TradeNamesMember2022-12-310000920371us-gaap:TradeNamesMember2022-01-012022-12-310000920371us-gaap:RevolvingCreditFacilityMemberus-gaap:LineOfCreditMember2022-01-012022-12-310000920371us-gaap:RevolvingCreditFacilityMember2022-12-310000920371us-gaap:RevolvingCreditFacilityMember2022-01-012022-12-310000920371us-gaap:SecuredDebtMemberus-gaap:RevolvingCreditFacilityMember2022-01-012022-12-310000920371us-gaap:RevolvingCreditFacilityMemberssd:WellsFargoBankMember2022-12-310000920371us-gaap:LineOfCreditMember2022-01-012022-12-310000920371us-gaap:RevolvingCreditFacilityMemberus-gaap:LineOfCreditMembersrt:MinimumMember2022-01-012022-12-310000920371us-gaap:RevolvingCreditFacilityMembersrt:MaximumMemberus-gaap:LineOfCreditMember2022-01-012022-12-310000920371us-gaap:SecuredDebtMemberssd:AdjustedBaseRateMembersrt:MinimumMember2022-01-012022-12-310000920371us-gaap:SecuredDebtMemberssd:AdjustedBaseRateMembersrt:MaximumMember2022-01-012022-12-310000920371us-gaap:SecuredDebtMemberssd:EurodollarApplicableMarginRateMembersrt:MinimumMember2022-01-012022-12-310000920371us-gaap:SecuredDebtMembersrt:MaximumMemberssd:EurodollarApplicableMarginRateMember2022-01-012022-12-310000920371us-gaap:RevolvingCreditFacilityMemberus-gaap:LineOfCreditMemberssd:EurodollarApplicableMarginRateMembersrt:MinimumMember2022-01-012022-12-310000920371us-gaap:RevolvingCreditFacilityMembersrt:MaximumMemberus-gaap:LineOfCreditMemberssd:EurodollarApplicableMarginRateMember2022-01-012022-12-310000920371us-gaap:RevolvingCreditFacilityMembercountry:GBus-gaap:LineOfCreditMemberssd:DailySimpleRFRMembersrt:MinimumMember2022-01-012022-12-310000920371us-gaap:RevolvingCreditFacilityMembersrt:MaximumMembercountry:GBus-gaap:LineOfCreditMemberssd:DailySimpleRFRMember2022-01-012022-12-310000920371us-gaap:RevolvingCreditFacilityMemberus-gaap:LineOfCreditMemberssd:DailySimpleRFRMembersrt:MinimumMember2022-01-012022-12-310000920371us-gaap:RevolvingCreditFacilityMembersrt:MaximumMemberus-gaap:LineOfCreditMemberssd:DailySimpleRFRMember2022-01-012022-12-310000920371us-gaap:RevolvingCreditFacilityMemberssd:DebtInstrumentRateOverLifeOfDebtMemberus-gaap:LineOfCreditMember2022-01-012022-12-310000920371country:US2022-01-012022-12-310000920371country:CA2022-01-012022-12-31ssd:plan0000920371srt:MinimumMembercountry:CA2022-01-012022-12-310000920371srt:MaximumMembercountry:CA2022-01-012022-12-310000920371country:US2021-01-012021-12-310000920371country:US2020-01-012020-12-31ssd:segment0000920371us-gaap:CorporateNonSegmentMember2022-01-012022-12-310000920371us-gaap:IntersegmentEliminationMemberssd:NorthAmericaSegmentMember2022-01-012022-12-310000920371ssd:EuropeSegmentMemberus-gaap:IntersegmentEliminationMember2022-01-012022-12-310000920371us-gaap:IntersegmentEliminationMemberssd:AsiaPacificSegmentMember2022-01-012022-12-310000920371us-gaap:IntersegmentEliminationMember2022-01-012022-12-310000920371us-gaap:CorporateNonSegmentMember2022-12-310000920371us-gaap:CorporateNonSegmentMember2021-01-012021-12-310000920371us-gaap:IntersegmentEliminationMemberssd:NorthAmericaSegmentMember2021-01-012021-12-310000920371ssd:EuropeSegmentMemberus-gaap:IntersegmentEliminationMember2021-01-012021-12-310000920371us-gaap:IntersegmentEliminationMemberssd:AsiaPacificSegmentMember2021-01-012021-12-310000920371us-gaap:IntersegmentEliminationMember2021-01-012021-12-310000920371us-gaap:CorporateNonSegmentMember2021-12-310000920371ssd:NorthAmericaSegmentMember2020-01-012020-12-310000920371ssd:EuropeSegmentMember2020-01-012020-12-310000920371ssd:AsiaPacificSegmentMember2020-01-012020-12-310000920371us-gaap:CorporateNonSegmentMember2020-01-012020-12-310000920371us-gaap:IntersegmentEliminationMemberssd:NorthAmericaSegmentMember2020-01-012020-12-310000920371ssd:EuropeSegmentMemberus-gaap:IntersegmentEliminationMember2020-01-012020-12-310000920371us-gaap:IntersegmentEliminationMemberssd:AsiaPacificSegmentMember2020-01-012020-12-310000920371us-gaap:IntersegmentEliminationMember2020-01-012020-12-310000920371us-gaap:CorporateNonSegmentMember2020-12-310000920371ssd:ForeignOperatingEntitiesMember2022-12-310000920371country:US2022-01-012022-12-310000920371country:US2022-12-310000920371country:US2021-01-012021-12-310000920371country:US2021-12-310000920371country:US2020-01-012020-12-310000920371country:US2020-12-310000920371country:FR2022-01-012022-12-310000920371country:FR2022-12-310000920371country:FR2021-01-012021-12-310000920371country:FR2021-12-310000920371country:FR2020-01-012020-12-310000920371country:FR2020-12-310000920371country:CA2022-01-012022-12-310000920371country:CA2022-12-310000920371country:CA2021-01-012021-12-310000920371country:CA2021-12-310000920371country:CA2020-01-012020-12-310000920371country:CA2020-12-310000920371country:GB2022-01-012022-12-310000920371country:GB2022-12-310000920371country:GB2021-01-012021-12-310000920371country:GB2021-12-310000920371country:GB2020-01-012020-12-310000920371country:GB2020-12-310000920371country:DE2022-01-012022-12-310000920371country:DE2022-12-310000920371country:DE2021-01-012021-12-310000920371country:DE2021-12-310000920371country:DE2020-01-012020-12-310000920371country:DE2020-12-310000920371country:IT2022-01-012022-12-310000920371country:IT2022-12-310000920371country:IT2021-01-012021-12-310000920371country:IT2021-12-310000920371country:IT2020-01-012020-12-310000920371country:IT2020-12-310000920371country:PL2022-01-012022-12-310000920371country:PL2022-12-310000920371country:PL2021-01-012021-12-310000920371country:PL2021-12-310000920371country:PL2020-01-012020-12-310000920371country:PL2020-12-310000920371country:SE2022-01-012022-12-310000920371country:SE2022-12-310000920371country:SE2021-01-012021-12-310000920371country:SE2021-12-310000920371country:SE2020-01-012020-12-310000920371country:SE2020-12-310000920371country:DK2022-01-012022-12-310000920371country:DK2022-12-310000920371country:DK2021-01-012021-12-310000920371country:DK2021-12-310000920371country:DK2020-01-012020-12-310000920371country:DK2020-12-310000920371country:NO2022-01-012022-12-310000920371country:NO2022-12-310000920371country:NO2021-01-012021-12-310000920371country:NO2021-12-310000920371country:NO2020-01-012020-12-310000920371country:NO2020-12-310000920371country:AU2022-01-012022-12-310000920371country:AU2022-12-310000920371country:AU2021-01-012021-12-310000920371country:AU2021-12-310000920371country:AU2020-01-012020-12-310000920371country:AU2020-12-310000920371country:BE2022-01-012022-12-310000920371country:BE2022-12-310000920371country:BE2021-01-012021-12-310000920371country:BE2021-12-310000920371country:BE2020-01-012020-12-310000920371country:BE2020-12-310000920371ssd:OtherCountriesMember2022-01-012022-12-310000920371ssd:OtherCountriesMember2022-12-310000920371ssd:OtherCountriesMember2021-01-012021-12-310000920371ssd:OtherCountriesMember2021-12-310000920371ssd:OtherCountriesMember2020-01-012020-12-310000920371ssd:OtherCountriesMember2020-12-310000920371ssd:WoodConstructionMember2022-01-012022-12-310000920371ssd:WoodConstructionMember2021-01-012021-12-310000920371ssd:WoodConstructionMember2020-01-012020-12-310000920371ssd:ConcreteConstructionMember2022-01-012022-12-310000920371ssd:ConcreteConstructionMember2021-01-012021-12-310000920371ssd:ConcreteConstructionMember2020-01-012020-12-310000920371ssd:OtherProductsMember2022-01-012022-12-310000920371ssd:OtherProductsMember2021-01-012021-12-310000920371ssd:OtherProductsMember2020-01-012020-12-310000920371us-gaap:SubsequentEventMember2023-01-242023-01-240000920371us-gaap:AllowanceForCreditLossMember2021-12-310000920371us-gaap:AllowanceForCreditLossMember2022-01-012022-12-310000920371us-gaap:AllowanceForCreditLossMember2022-12-310000920371us-gaap:SalesReturnsAndAllowancesMember2021-12-310000920371us-gaap:SalesReturnsAndAllowancesMember2022-01-012022-12-310000920371us-gaap:SalesReturnsAndAllowancesMember2022-12-310000920371us-gaap:ValuationAllowanceOfDeferredTaxAssetsMember2021-12-310000920371us-gaap:ValuationAllowanceOfDeferredTaxAssetsMember2022-01-012022-12-310000920371us-gaap:ValuationAllowanceOfDeferredTaxAssetsMember2022-12-310000920371us-gaap:AllowanceForCreditLossMember2020-12-310000920371us-gaap:AllowanceForCreditLossMember2021-01-012021-12-310000920371us-gaap:SalesReturnsAndAllowancesMember2020-12-310000920371us-gaap:SalesReturnsAndAllowancesMember2021-01-012021-12-310000920371us-gaap:ValuationAllowanceOfDeferredTaxAssetsMember2020-12-310000920371us-gaap:ValuationAllowanceOfDeferredTaxAssetsMember2021-01-012021-12-310000920371us-gaap:AllowanceForCreditLossMember2019-12-310000920371us-gaap:AllowanceForCreditLossMember2020-01-012020-12-310000920371us-gaap:SalesReturnsAndAllowancesMember2019-12-310000920371us-gaap:SalesReturnsAndAllowancesMember2020-01-012020-12-310000920371us-gaap:ValuationAllowanceOfDeferredTaxAssetsMember2019-12-310000920371us-gaap:ValuationAllowanceOfDeferredTaxAssetsMember2020-01-012020-12-31
UNITED STATES
SECURITIES AND EXCHANGE COMMISSION
Washington, D.C. 20549
FORM 10-K
(Mark One)
☒ Annual Report Pursuant to Section 13 or 15(d) of the Securities Exchange Act of 1934
For the fiscal year ended December 31, 2022
OR
☐ Transition Report Pursuant to Section 13 or 15(d) of the Securities Exchange Act of 1934
for the transition period from to .
Commission file number: 1-13429
Simpson Manufacturing Co., Inc.
(Exact name of registrant as specified in its charter)
| | | | | | | | |
| Delaware | | 94-3196943 |
| (State or other jurisdiction of | | (I.R.S. Employer |
| incorporation or organization) | | Identification No.) |
5956 W. Las Positas Blvd., Pleasanton, CA 94588
(Address of principal executive offices) (Zip Code)
Registrant’s telephone number, including area code: (925) 560-9000
Securities registered pursuant to Section 12(b) of the Act:
| | | | | | | | |
| Title of Each Class | Trading Symbol | Name of Each Exchange on Which Registered |
| Common Stock, par value $0.01 | SSD | New York Stock Exchange |
Securities registered pursuant to Section 12(g) of the Act:
None
(Title of class)
Indicate by check mark if the registrant is a well-known seasoned issuer, as defined in Rule 405 of the Securities Act. Yes ý No o
Indicate by check mark if the registrant is not required to file reports pursuant to Section 13 or 15(d) of the Act.
Yes o No ý
Indicate by check mark whether the registrant (1) has filed all reports required to be filed by Section 13 or 15(d) of the Securities Exchange Act of 1934 during the preceding 12 months (or for such shorter period that the registrant was required to file such reports), and (2) has been subject to such filing requirements for the past 90 days. Yes ý No o
Indicate by check mark whether the registrant has submitted electronically every Interactive Data File required to be submitted pursuant to Rule 405 of Regulation S-T (§232.405 of this chapter) during the preceding 12 months (or for such shorter period that the registrant was required to submit such files). Yes ý No o
Indicate by check mark whether the registrant has filed a report on and attestation to its management’s assessment of
the effectiveness of its internal control over financial reporting under Section 404(b) of the Sarbanes-Oxley Act (15 U.S.C.
7262(b)) by the registered public accounting firm that prepared or issued its audit report. ☒
Indicate by check mark whether the registrant is a large accelerated filer, an accelerated filer, a non-accelerated filer, a smaller reporting company, or an emerging growth company. See the definitions of “large accelerated filer,” “accelerated filer,” “smaller reporting company,” and "emerging growth company" in Rule 12b-2 of the Exchange Act.
| | | | | | | | | | | |
| Large accelerated filer | x | Accelerated filer | ☐ |
| Non-accelerated filer | ☐ | Smaller reporting company | ☐ |
| | Emerging growth company | ☐ |
If an emerging growth company, indicate by check mark if the registrant has elected has elected not to use the extended transition period for complying with the new or revised financial accounting standards provided pursuant to Section 13 (a) of the Exchange Act o
If securities are registered pursuant to Section 12(b) of the Act, indicate by check mark whether the financial statements of the registrant included in the filing reflect the correction of an error to previously issued financial statements. o
Indicate by check mark whether any of those error corrections are restatements that required a recovery analysis of incentive-based compensation received by any of the registrant’s executive officers during the relevant recovery period pursuant to §240.10D-1(b).
Indicate by check mark whether the registrant is a shell company (as defined in Rule 12b-2 of the Exchange Act). Yes ☐ No ý
The aggregate market value of the shares of common stock, par value $0.01 per share, which is the only outstanding class of voting and non-voting equity, held by non-affiliates of the registrant (based on the closing price for the common stock on the New York Stock Exchange on June 30, 2022) was approximately $4,342,946,050.
As of February 24, 2023, 42,662,967 shares of the registrant’s common stock were outstanding.
Documents Incorporated by Reference
Portions of the registrant's definitive Proxy Statement for its 2023 annual meeting of stockholders (the "2023 Annual Meeting") are incorporated herein by reference in Part III of this Annual Report on Form 10-K to the extent stated herein. Such Proxy Statement will be filed with the Securities and Exchange Commission (the "SEC") within 120 days of the registrant's fiscal year ended December 31, 2022.
SIMPSON MANUFACTURING CO., INC.
TABLE OF CONTENTS
| | | | | | | | |
| | Page |
| PART I | |
| Item 1. | | |
| Item 1A. | | |
| Item 1B. | | |
| Item 2. | | |
| Item 3. | | |
| Item 4. | | |
| PART II | |
| Item 5. | | |
| Item 6. | | |
| Item 7. | | |
| Item 7A. | | |
| Item 8. | | |
| Item 9. | | |
| Item 9A. | | |
| Item 9B. | | |
| PART III | |
| Item 10. | | |
| Item 11. | | |
| Item 12. | | |
| Item 13. | | |
| Item 14. | | |
| PART 1V | |
| Item 15. | | |
| Item 16. | | |
NOTE ABOUT FORWARD-LOOKING STATEMENTS
In this filing we make statements concerning our expectations, beliefs, plans, objectives, goals, strategies, and future events or performance. Such statements are forward-looking statements within the meaning of the Private Securities Litigation Reform Act of 1995, Section 27A of the Securities Act of 1933, as amended, and Section 21E of the Securities Exchange Act of 1934, as amended. Forward-looking statements generally can be identified by words such as “anticipate,” “believe,” “estimate,” “expect,” “intend,” “plan,” “target,” “continue,” “predict,” “project,” “change,” “result,” “future,” “will,” “could,” “can,” “may,” “likely,” “potentially,” or similar expressions that concern our strategy, plans, expectations or intentions. Forward-looking statements include, but are not limited to, statements about future financial and operating results, our plans, objectives, business outlook, priorities, expectations and intentions, expectations for sales and market growth, comparable sales, earnings and performance, stockholder value, capital expenditures, cash flows, the housing market, the home improvement industry, demand for services, share repurchases, the integration of the acquisition of FIXCO Invest S.A.S ("ETANCO"), our strategic initiatives, including the impact of these initiatives, on our strategic and operational plans and financial results, and any statement of an assumption underlying any of the foregoing and other statements that are not historical facts. Although we believe that the expectations, opinions, projections and comments reflected in these forward-looking statements are reasonable, such statements involve risks and uncertainties and we can give no assurance that such statements will prove to be correct. Actual results may differ materially from those expressed or implied in such statements.
Forward-looking statements are subject to inherent uncertainties, risks and other factors that are difficult to predict and could cause our actual results to vary in material respects from what we have expressed or implied by these forward-looking statements. Important factors that could cause our actual results and financial condition to differ materially from those expressed in our forward looking statements include, among others, the prolonged impact of the COVID-19 pandemic on our operations and supply chain, the operations of our customers, suppliers and business partners, and the successful integration of ETANCO and those discussed under Item 1A. Risk Factors and Item 7. Management’s Discussion and Analysis of Financial Condition and Results of Operations in our Annual Report on Form 10-K for the fiscal year ended December 31, 2022. Additional risks include: the cyclicality and impact of general economic conditions; changing conditions in global markets including the impact of sanctions and tariffs, quotas and other trade actions and import restrictions; the impact of pandemics, epidemics or other public health emergencies; volatile supply and demand conditions affecting prices and volumes in the markets for both our products and raw materials we purchase; the impact of foreign currency fluctuations; potential limitations on our ability to access capital resources and borrowings under our existing credit agreement; restrictions on our business and financial covenants under our credit agreement; reliance on employees subject to collective bargaining agreements; and or ability to repurchase shares of our common stock and the amounts and timing of repurchases, if any.
We undertake no obligation to publicly update any forward-looking statement, whether as a result of new information, future developments or otherwise. Readers are urged to carefully review and consider the various disclosures made by us in this report and in our other reports filed with the SEC that advise of the risks and factors that may affect our business.
PART I
Item 1. Business.
Company Background
Simpson Manufacturing Co., Inc. ("Simpson," the "Company," "we," "us," or "our,") through its subsidiaries, including, Simpson Strong-Tie Company Inc. ("SST"), designs, engineers and is a leading manufacturer of high quality wood and concrete construction products designed to make structures safer and more secure. Our products are designed to perform at high levels and be easy to use and cost-effective for customers. Our wood construction products are used in light-frame construction and include connectors, truss plates, fastening systems, fasteners and pre-fabricated lateral resistive systems. Our concrete construction products are used in concrete, masonry and steel construction and include adhesives, chemicals, mechanical anchors, carbide drill bits, powder actuated tools, fiber reinforced materials and other repair products used for protection and strengthening. We market our products to the residential construction, light industrial and commercial construction, remodeling and do-it-yourself (“DIY”) markets domestically in North America, primarily in the United States, and Europe internationally. We also provide engineering services in support of some of our products and increasingly offer design and other software that facilitates the specification, selection and use of our products. The Company has continuously manufactured structural connectors since 1956 and believes that the Simpson Strong-Tie® brand benefits from strong brand name recognition in residential, light industrial and commercial applications among architects and engineers who frequently request the use of our products.
Recent Acquisition
As previously disclosed, on April 1, 2022, the Company successfully completed the acquisition of ETANCO. ETANCO is a leading designer, manufacturer and distributor of fixing and fastening solutions for the European building and construction market. ETANCO's primary product applications directly align with the addressable markets in which the Company operates, expands our portfolio of solutions, including mechanical anchors, fasteners and commercial building envelope solutions, and significantly increase our market presence across Europe. We continue to believe that the acquisition of ETANCO will support continued growth in our European business, including expansion into new geographies, sales channels and commercial building offerings. For more information, see “Item 7 — Management’s Discussion and Analysis of Financial Condition and Results of Operations.”
Sales
The Company attracts and retains customers by designing, manufacturing and selling high quality products that perform well, are easy to use and cost-effective for customers. The Company manufactures and warehouses its products in geographic proximity to its markets to help ensure availability and facilitate timely delivery to customers, which enables us to promptly respond to customer requests for specially designed products and services. The Company maintains levels of inventory intended to operate with minimum backlog and fill most customer orders within a few days. High levels of manufacturing automation and flexibility allow the Company to maintain its high quality standards while continuing to provide prompt delivery to meet our customers' needs.
The Company intends to continue efforts to increase market share in both the wood construction and concrete construction product groups by:
•maintaining frequent customer contacts and service levels;
•continuing to sponsor seminars to inform architects, engineers, contractors and building officials on appropriate use, proper installation and identification of the Company’s products;
•continuing to invest in mobile, web and software applications for customers to both help them do their jobs more efficiently and allow us to connect with them utilizing social media, blog posts and videos;
•continuing to invest in Building Information Modeling ("BIM") software services and solutions for home builders and lumber-building material suppliers; and
•continuing to innovate, advance and diversify our product offerings.
Products and Services
Historically, the Company’s product lines have encompassed connectors, anchors, fasteners, lateral resistive systems, and truss plates, as well as repair and strengthening product lines for the industrial and transportation markets. See “Item 7 — Management’s Discussion and Analysis of Financial Condition and Results of Operations,” and “Note 19 — Segment Information” to the Company’s consolidated financial statements for financial information regarding revenues by product
category. Through, the acquisition of ETANCO, the Company expanded its product portfolio to include commercial building envelope solutions and significantly increased its market presence across Europe.
Many of the Company’s products are approved by building code evaluation agencies. To achieve these approvals, the Company conducts extensive product testing, which is witnessed and certified by independent testing laboratories. These tests also provide the basis of load ratings for the Company’s structural products. This test and load information is used by architects, engineers, contractors, building officials, and homeowners in selecting our products and comparing them to those of competitors, and is useful across all applications of the Company’s products, ranging from the deck constructed by a homeowner to a multi-story structure designed by an architect or engineer.
Wood Construction Products. The Company produces and markets over 15,000 standard and custom wood construction products. These products are used primarily to strengthen, support and connect wood applications in residential and commercial construction and DIY projects. The Company’s wood construction products contribute to structural integrity and resistance to seismic, wind and gravitational forces. As described below, the Company’s wood construction products include:
•Connectors - Connectors are prefabricated metal products that attach wood, concrete, masonry or steel together and are essential for tying wood construction elements together and create safer and stronger buildings. Included in this category are connectors, holddowns, and truss connector plates.
•Fasteners - The fastening line includes various nails, screws and staples, which are complemented by the Company's Quik Drive auto-feed screw driving system, which is used in numerous applications such as building envelope applications, decking, subfloors, drywall and roofing; and
•Lateral Resistive Systems - Lateral resistive systems are assemblies used to resist earthquake or wind forces and include steel and wood shearwalls, Anchor Tiedown Systems (ATS), and steel moment frames.
Concrete Construction Products. The Company produces and markets over 3,000 standard and custom concrete construction products. The Company’s concrete construction products are composed of various materials including steel, chemicals and carbon fiber. They are used primarily to anchor, protect and strengthen concrete, brick and masonry applications in industrial, infrastructure, residential, commercial and DIY projects. The Company’s concrete construction products contribute to structural integrity and resistance to seismic, wind and gravitational forces. These products are sold in all segments of the Company. As described below, the Company’s concrete construction products include:
•Anchor Products - Anchor products include adhesives, mechanical anchors, carbide drill bits and powder-actuated pins and tools used for numerous applications of anchoring or attaching elements onto concrete, brick, masonry and steel; and
•Construction, Repair, Protection and Strengthening Products - Concrete construction repair, protection and strengthening products include grouts, coatings, sealers, mortars, fiberglass and fiber-reinforced polymer systems and asphalt products.
Engineering and Design Services. The Company’s engineers not only design and test products, but also provide engineering support for customers in connection with a number of products that the Company manufactures and sells. This support might range from the discussion of a load value in a catalog to testing the suitability of an existing product in a unique application. For the truss product line, the Company’s engineers review the output of the Company’s software to assist customers in ensuring that trusses are properly designed and specified, and in some instances seal design diagrams. Generally, in connection with any engineering services the Company provides, the Company’s engineers serve as a point of reference and support for the customer’s engineers and other service professionals, who ultimately determine and are responsible for the engineering approach and design loads for any project.
Distribution Channels and Markets
The Company seeks to expand its product and distribution coverage through several channels:
•Distributors. The Company regularly evaluates its distribution coverage and the service levels provided by its distributors, and from time to time implements changes. The Company evaluates distributor product mix and conducts promotions to encourage distributors to add the Company’s products that complement the mix of product offerings in their markets.
•Home Centers. The Company intends to increase penetration of the DIY markets by continuing to expand its product offerings through home centers. The Company’s sales force maintains ongoing contact with home centers to work with them in a broad range of areas, including inventory levels, retail display maintenance and product knowledge training. The Company’s strategy is to ensure that the home center retail stores are fully stocked with adequate supplies of the
Company’s products carried by those stores. The Company has further developed extensive bar coding and merchandising aids and has devoted a portion of its research and development efforts to DIY products. The Company’s sales to home centers increased year-over-year in 2022, 2021 and 2020. The Company brought back Lowe's as a home center customer in the second quarter of 2020.
•Dealers. In some markets, the Company sells its products directly to lumber dealers and cooperatives.
•Contractors. In some markets, the Company sells to a wide-range of end-customers mainly through direct sales.
•Wood Component Manufacturers. The company works directly with wood component manufacturer customers. We continue to develop our software solutions and provide better technology solutions increasing our truss connector plate sales as well as other Simpson Strong-Tie core products sales within the component industry.
•OEM Relationships. The Company works closely with manufacturers of engineered wood, composite laminated timber and original equipment manufacturers ("OEMs") for off-site construction to develop and expand the application and sales of its engineered wood connector, fastener, anchor, and truss products. The Company has relationships with many of the leaders in these industries.
•International Sales. The Company has established a presence in Europe through acquisition of companies with existing customer bases and through servicing U.S.-based customers operating in Europe. The Company also distributes connector, anchor and epoxy products in Canada, Mexico, Chile, Australia and New Zealand.
The Company seeks to expand existing and identify new distributions channels in the markets we serve, and expand into new markets. Presently, we primarily serve three markets, which are also our operating segments, consisting of the North America, Europe and Asia/Pacific segments. The North America segment includes operations primarily in the U.S. and Canada. The Europe segment includes operations primarily in France, the United Kingdom, Germany, Denmark, Switzerland, Portugal, Poland, The Netherlands, Belgium, Spain, Sweden, Norway, Italy and Romania. The Asia/Pacific segment includes operations primarily in Australia, New Zealand, China, Taiwan, and Vietnam. These segments are similar in several ways, including similarities in the products manufactured and distributed, the types of materials used, the production processes, the distribution channels and the product applications.
New Products
In order to innovate, advance and diversify our product offerings, the Company commits substantial resources to new product development. The majority of SST’s products have been developed through its internal research and development program. The Company believes it is the only U.S. manufacturer with the capability to internally test multi-story wall systems, thus enabling full scale testing rather than analysis alone to prove system performance. The Company’s engineering, sales, product management, and marketing teams work together with architects, engineers, building inspectors, code officials, builders and customers in the new product development process.
The Company’s product research and development is based largely on products or solutions that are identified within the Company, feedback or requests from customers for new or specialty products and in connection with the Company’s strategic initiatives to expand into new markets and/or develop new product lines. The Company’s strategy is to develop new products on a proprietary basis, to seek patents when appropriate and to rely on trade secret protection for others or depending on availability and circumstances, the Company will acquire products or solutions meeting our strategic initiatives.
Since at least 2006, the Company generally develops 15 to 35 new products each year. In 2022, through our research and development efforts, the Company, including ETANCO, developed over 40 new products expanding its product offerings by adding:
•new connectors and lateral products for wood framing applications;
•new connectors and fasteners for mass timber & offsite constructions;
•connections for structural steel construction;
•new connectors for cold formed steel applications;
•new fastener products and tools for wood construction;
•new mechanical and adhesive anchors for concrete and masonry construction; and
•new repair and strengthening systems for concrete, masonry and wood pile applications.
By executing on its research and development strategy, the Company intends to continue to expand its product offerings.
The Company provides expertise and resources to offer software solutions and services to builders and lumber building material dealers, and supports efforts to further develop integrated software component solutions for the building industry. The
Company also has ongoing development of truss software for the design, modeling and truss plate selection for its integrated component manufacturing customers.
Competition
Simpson is a category creator in the building products space. Our mission is to provide solutions that help people design and build safer, stronger structures. Our products improve the performance and integrity of the structures they are installed in, helping to make those structures more sustainable, and often helping to save lives in times of natural disasters and catastrophe.
We sell our products through multiple channels including contractor distributors, home centers and co-ops, lumber dealers and OEMs. Currently, 26 of the top 30 U.S. builders (based on number of housing starts per year) are engaged in our builder program. In terms of home centers, we were pleased to welcome back Lowe’s as a home center customer in 2020, where we had successfully completed the rollout of our product sets in over 1,700 Lowe’s stores.
We encounter a variety of competitors that vary by product line, end market and geographic area. The Company's competitors include many regional or specialized companies, as well as large U.S. and non-U.S. companies or divisions of large companies. While we do not believe that any single company competes with us across all of our product lines and distribution channels, certain companies compete in one or more product categories and/or distribution channels.
For over 65 years, through SST, we have led the industry with a majority market share in the wood connectors products space and a growing presence in both the concrete and fastener markets in the U.S. and Europe. We’ve successfully increased our market share over the years through:
•designing and marketing end-to-end construction product systems;
•product availability with delivery in typically 24 hours to 48 hours;
•strong customer support and education for engineers, builders, contractors and building officials;
•extensive product testing capabilities at our state-of-the-art test lab;
•strong relationships with engineers that get our products specified on the blueprint and pulled through to the job site; and
•active involvement with code officials to improve building codes and construction practices.
We believe these value-added services are competitive differentiators for us and provide us with a competitive advantage, helping us to achieve industry-leading margins, strong brand recognition and a trusted reputation. We also provide engineering services in support of some of our products and increasingly offer design and other software that facilitates the specification, selection and use of our products. We are also investing in software technology, such as 3D visualization software tools, truss design and specification software and BIM software, in order to drive increased specification and use of our building material products with homeowners, truss component manufacturers, builders and distributors as well as to support our customers with additional solutions and services.
In an effort to help mitigate our exposure to the cyclicality of the U.S. housing market, as well as to respond to the needs of our customers, we’ve made investments over the years in adjacent products such as anchors, fasteners and software solutions and expanded operations into Europe through acquisitions. As a result, the Company is less dependent on U.S. housing starts, though they are still a leading indicator for a portion of our business.
Resources
Raw Materials
The principal raw material used by the Company is steel, including stainless steel. The Company also uses materials such as carbon fiber, fiberglass, mortars, grouts, epoxies and acrylics in the manufacture of its chemical anchoring and reinforcing products. The Company purchases raw materials from a variety of commercial sources. The Company’s practice is to seek cost savings and enhanced quality by developing business relationships with and purchasing from a limited number of suppliers.
We purchase steel at market prices, which fluctuate as a result of supply and demand driven by economic conditions in the marketplace. The steel industry is highly cyclical and prices for the Company’s raw materials are influenced by numerous factors beyond the Company’s control including geopolitical and macroeconomic factors, supply constraints and supply chain disruptions, foreign currency fluctuations, import tariffs and duties, and unsettled international trade disputes. The steel market continues to be dynamic, with a high degree of uncertainty about future pricing trends. Given current conditions, the Company currently expects that raw material costs may continue to increase. Numerous factors may cause steel prices to remain high in the future. In addition to increases in steel prices, steel mills may add surcharges for zinc, energy and freight in response to increases in their costs. See “Item 1A — Risk Factors” and “Item 7 — Management’s Discussion and Analysis of Financial
Condition and Results of Operations.” The Company historically has not attempted to hedge against changes in prices of steel or other raw materials. However, the Company may purchase and carry more steel or other raw materials in inventory to meet projected sales demand in a tight raw materials market.
Patents, Trademarks and Intellectual Property
Generally, the Company seeks statutory protection for strategic or financially important intellectual property developed in connection with its business. Certain intellectual property, where appropriate, is protected by contracts, licenses, confidentiality or other agreements. From time to time, the Company takes action to protect its businesses by asserting its intellectual property rights against third-party infringers.
The Company’s trademarks are registered or otherwise legally protected in the U.S. and many non-U.S. countries where products and services of the Company are sold. The Company may, from time to time, becomes involved in trademark licensing transactions. Most works of authorship produced for the Company, such as computer programs, catalogs and sales literature, carry appropriate notices indicating the Company's claim to copyright protection under U.S. law and appropriate international treaties.
The Company has U.S. and foreign patents, the majority of which cover products that the Company currently manufactures and markets. These patents, and applications for new patents, cover various design aspects of the Company’s products, as well as processes used in their manufacture. The Company continues to develop new potentially patentable products, product enhancements and product designs as well as acquire patented product. Although the Company does not intend to apply for additional foreign patents covering existing products, the Company has developed an international patent program to protect new products that it may develop. In addition to seeking patent protection, the Company relies on unpatented proprietary technology to maintain its competitive position. See “Item 1A — Risk Factors.”
While the Company believes its intellectual property portfolio is important to its business operations and in the aggregate constitutes a valuable asset, no single patent, trademark, license or other intellectual property, or group of such intellectual property, is critical to the success of the business or any segment.
Seasonality and Cyclicality
The Company’s sales have been seasonal and cyclical, with operating results varying from quarter to quarter. With some exceptions, our sales and income have historically been lower in the first and fourth quarters than in the second and third quarters of a fiscal year, as the Company's customers tend to purchase construction materials in the late spring and summer months for the construction season. Weather conditions, such as extended cold or wet weather, which affected and sometimes delayed installation of some of our products, would negatively affect our results of operations. Operating results vary from quarter to quarter and with economic cycles. The Company’s sales are also dependent, to a degree, on the North American residential home construction industry. As noted above, the same efforts to mitigate the Company's reliance on housing starts have also softened the effects of seasons and adverse weather on the Company's quarterly results. See “Item 1A — Risk Factors” and “Item 7 — Management’s Discussion and Analysis of Financial Condition and Results of Operations.”
Human Capital Resources
Successful execution of our strategy is largely dependent on attracting, developing and retaining key employees and leaders. The skills, experience, industry knowledge, and contributions of our employees significantly benefit our operations and performance. We continuously evaluate, modify, and enhance our internal programs, processes and technologies to increase employee engagement, productivity, and efficiency and provide the opportunities, skills, and resources they need to be successful.
As of December 31, 2022, our employees, including those employed by consolidated subsidiaries, by region were approximately:
| | | | | |
Asia Pacific | 544 | |
Europe | 1,579 | |
North America | 3,035 | |
| |
| 5,158 | |
Inclusion & Diversity
Our commitment to diversity and inclusion starts at the top with a highly skilled and diverse board. We strive to have a diverse culture of employees representing different genders, ages, ethnicities and abilities by implementing thoughtful, customized solutions and programs.
As of December 31, 2022, we had the following global gender demographics:
| | | | | | | | | | | |
| Women | Men | Not Disclosed |
All employees | 19% | 64% | 17% |
Individual Contributors | 19% | 63% | 18% |
Middle Management | 17% | 68% | 15% |
Senior Leadership | 27% | 73% | —% |
As of December 31, 2022, our U.S. employees had the following race and ethnicity demographics:
| | | | | | | | | | | | | | |
| All U.S. Employees | Individual Contributors | Middle Management | Senior Leadership |
American Indian or Alaska Native | 1 | % | 1 | % | — | % | — | % |
Asian | 10 | % | 10 | % | 8 | % | 8 | % |
Black or African American | 10 | % | 12 | % | 3 | % | 4 | % |
Hispanic or Latino | 18 | % | 19 | % | 9 | % | — | % |
Native Hawaiian or Other Pacific Islander | — | % | — | % | — | % | — | % |
Two or More Races | 2 | % | 2 | % | 2 | % | — | % |
White | 54 | % | 51 | % | 77 | % | 88 | % |
| Not disclosed | 5 | % | 5 | % | 2 | % | — | % |
Talent Development
Talent development underpins our efforts to execute our strategy and continue to develop, manufacture and market innovative products and services. The opportunity to grow and develop skills and abilities, regardless of job role, division, or geographical location is critical to the success of the Company as a global organization and we continually invest in our employees’ career growth and provide employees access to a wide variety of learning and development resources, including a suite of online courses for developing both soft and technical skills. Our extraordinary leadership development programs provide employees with training, tools and experiences that are targeted to develop their full leadership potential.
Pay Equity
The Company’s compensation philosophy is to attract, retain, motivate, and differentiate employees through its rewards programs. We believe people should be paid for what they do and how they do it, regardless of their gender, race, or other personal characteristics and are committed to internal pay equity. Our Board of Directors, through its Compensation and Leadership Development Committee, monitors the relationship between the pay received by our executive officers, and Human Resources monitors the relationship of pay received by all other employees. We believe our compensation philosophy and strategy are strongly aligned with our corporate strategic priorities and our vision for stockholder value creation.
In addition to financial compensation we offer a health and wellness package to our employees, which is designed to provide a range of options that are customizable to suit their individual and/or family needs. In addition, in an effort to continue to attract, retain, and motivate our workforce, in the U.S., we offer remote and flexible work packages for positions which allow for remote work. We continue to engage our partners and benefits consultants to ensure our health and wellness package continues to meet the needs of our diverse workforce today and into the future.
Workplace Safety and Health
A vital part of our business is providing our workforce with a safe, healthy and sustainable working environment. Our Environmental, Health and Safety program focuses on implementing change through employee observation feedback channels to recognize risk and continuously improve our processes, as well as conducting regular risk reviews and self-audits at our
manufacturing facilities around the world to explore new opportunities to reduce potential employee exposure to occupational injuries.
Our continuous focus on workplace safety has enabled us to preserve business continuity without sacrificing our commitment to keeping our colleagues and workplace visitors safe since the COVID-19 outbreak.
Labor Relations
As of December 31, 2022, approximately 9% of the Company’s employees are represented by labor unions and are covered by collective bargaining agreements. We have two facility locations with collective bargaining agreements covering tool and die craftsmen, maintenance workers, and sheet-metal workers. In Stockton, California, two union contracts will expire in June 2023 and September 2023, respectively. Also, we have two union contracts in San Bernardino County, California that will expire in February 2025 and in June 2026. Based on current information and subject to future events and circumstances, we believe that, even if new agreements are not reached before the existing labor union contracts expire, it is not expected to have a material adverse effect on the Company’s ability to provide products to customers or on the Company’s profitability. See “Item 1A — Risk Factors.”
Available Information
The Company's website address is www.simpsonmfg.com. We file or furnish annual, quarterly and current reports, proxy statements and other information with the SEC. You may obtain a copy of any of these reports, free of charge, on the "Financials - SEC Filling" page of our website, as soon as reasonably practicable after we file such material with, or furnish it to the SEC. Printed copies of any of these materials will also be provided free of charge on request.
Through the "Governance" page of our website, it is also possible to access copies of the charters for our Audit and Finance Committee, Compensation and Leadership Development Committee, Corporate Strategy and Acquisitions Committee and Nominating and ESG Committee, Sustainability Reports, as well as our Corporate Governance Guidelines and Code of Business Conduct and Ethics. Each of these documents is made available free of charge. We intend to disclose on our website any amendment to, or waiver of, any provisions of our Code of Business Conduct and Ethics that apply to any of our directors, executive officers or senior financial officers that would otherwise be required to be disclosed under the rules of the SEC or the NYSE. The foregoing information regarding our website and its content is for your convenience only. The information contained in or connected to our website is not deemed to be incorporated by reference in this Annual Report or filed with the SEC.
In addition, the SEC maintains a website that contains reports, proxy and information statements, and other information regarding issuers, where you may obtain a copy of all information we file publicly with the SEC. The SEC website address is www.sec.gov.
Item 1A. Risk Factors.
Investing in our common stock involves a high degree of risk. You should carefully review the following discussion of the risks that may affect our business, results of operations and financial condition, as well as our consolidated financial statements and notes thereto and the other information appearing in this report, for important information regarding risks that affect us. Current global economic events and conditions may amplify many of these risks. These risks are not the only risks that may affect us. Additional risks that we are not aware of or do not believe are material at the time of this filing, may also become important factors that adversely affect our business.
Global and Economic Risks
Global economic conditions, including inflation and supply chain disruptions, could continue to adversely affect our operations
General global economic downturns and macroeconomic trends, including heightened inflation, capital market volatility, interest rate and currency rate fluctuations, and economic slowdown or recession, may result in unfavorable conditions that could negatively affect demand for our products due to customers decreasing their inventories in the near-term or long-term, reduction in sales due to raw material shortages, reduction in research and development efforts, our inability to sufficiently hedge our currency and raw material costs, insolvency of suppliers and customers and exacerbate some of the other risks that affect our business, financial condition and results of operations. Both domestic and international markets experienced significant inflationary pressures in fiscal year 2022 and inflation rates in the U.S., as well as in other countries in which we
operate, are currently expected to continue at elevated levels for the near-term. We may be adversely affected during periods of high inflation, mainly from raw material and labor costs. Inflation could increase our cost of financing, raw materials and labor and could cause our financial results and profitability to decline. In addition, the Federal Reserve in the U.S. and other central banks in various countries have raised, and may again raise, interest rates in response to concerns about inflation, which, coupled with reduced government spending and volatility in financial markets, may have the effect of further increasing economic uncertainty and heightening these risks. Interest rate increases or other government actions taken to reduce inflation could also result in recessionary pressures in many parts of the world.
The impact of public health crises, could have a significant effect on supply and/or demand for our products and services and have a negative impact on our business, financial condition and results of operations.
COVID-19 was identified in late 2019 and spread globally. Our operations expose us to risks associated with a pandemic, or outbreak of contagious diseases in the human population, including the COVID‑19 pandemic. The COVID-19 pandemic has negatively impacted the global economy, disrupted consumer spending and global supply chains, disrupted the labor market, created significant volatility and disruption of financial markets and has resulted in governments around the world implementing stringent measures to help control the spread of the virus. These economic uncertainties could adversely affect our business, financial condition, demand for our products, services, and contribute to volatile supply and demand conditions affecting prices and volumes in the markets for our products, services and raw materials.
Changes in government and industry regulatory standards pertaining to health and safety could have a material adverse effect on our business, financial condition or results of operations.
We are subject to risks associated with public health crises, such as pandemics and epidemics, including the COVID-19 pandemic. The nature and extent of future impacts are highly uncertain and unpredictable. While many countries around the world have removed or reduced the restrictions taken in response to the COVID-19 pandemic, the emergence of new variants of the SARS-CoV-2 virus may result in new governmental lockdowns, quarantine requirements or other restrictions to slow the spread of the virus. Any such measures could also impact the global economy more broadly, for example by leading to further economic slowdowns. The global outlook remains uncertain as case counts fluctuate and vaccination and booster rates remain relatively low in many parts of the world.
The scope and duration of any future public health crisis, including the potential emergence of new variants of the SARS-CoV-2 virus, the pace at which government restrictions, including, but not limited to, quarantines, “shelter in place” and “stay at home” order, travel restrictions and other similar measures, are imposed and lifted, the scope of additional actions taken to mitigate the spread of disease, global vaccination and booster rates, may significantly impact our production throughout the supply chain and constrict distribution channels. We are unable to predict the potential future impact that these factors will have on our business, financial condition or results of operations.
Risks Related to Our Business and Our Industry
Business cycles and uncertainty regarding the housing market, economic conditions, political climate and other factors beyond our control could adversely affect demand for our products and services, and our costs of doing business, any of which may harm our business, financial condition and results of operations.
Our North America Segment accounted for approximately 80% of our net sales for the fiscal year ended December 31, 2022. The primary drivers of our North America segment are residential remodeling, replacement activities and housing starts. Accordingly, our business, financial condition and results of operations depend significantly on the stability of the housing and residential construction and home improvement markets, which are affected by conditions and other factors that are beyond our control. These conditions include, but are not limited to:
•uncertainty about the housing and residential construction and home improvement markets;
•consumer confidence and spending;
•unemployment levels;
•foreclosure rates;
•interest rates;
•raw material, logistics and energy costs;
•labor and healthcare costs;
•capital availability, or lack thereof, to builders, developers and consumers;
•unfavorable weather conditions and natural disasters; and
•political or social instability, such as war, or acts of terrorism or other international incidents.
These factors could adversely affect demand for our products and services, and our costs of doing business, and our business, financial condition and results of operations may be harmed. Further, many of our customers in the construction industry are small and medium-sized businesses that are more likely to be adversely affected by economic downturns than larger, more established businesses. Uncertainty about current global economic conditions may cause these consumers to postpone or refrain from spending or may cause them to switch to lower-cost alternative products, which could reduce demand for our products and materially and adversely affect our financial condition and results of operations.
We have a few large customers, the loss of any one of which could negatively affect our sales and profits.
Our largest customers accounted for a significant portion of net sales for the years ended December 31, 2022, 2021, and 2020. A reduction in, or elimination of, our sales to any of these customers would at least temporarily, and possibly on a longer term basis, cause a material reduction in our net sales, income from operations and net income. Such a reduction in or elimination of our sales to any of our largest customers would also increase our relative dependence on our remaining large customers.
In addition, our distributor customers and builders have increasingly consolidated over time, which has increased the material adverse effect risk of losing any one of them and may increase their bargaining power in negotiations with us. These trends could negatively affect our sales and profitability.
Our growth may depend on our ability to develop new products and services and penetrate new markets, which could reduce our profitability.
Our continued growth depends upon our ability to develop additional products, services and technologies that meet our customers’ expectations of our brand and quality and that allow us to enter into new markets. Expansion into new markets and the development of new products and services may involve considerable costs and may not generate sufficient revenue to be profitable or cover the costs of development. We might not be able to penetrate these product markets and any market penetration that occurs might not be timely or profitable. We may be unable to recoup part or all of the investments we make in attempting to develop new products and technologies and penetrate new markets. Any of these events could reduce our profitability.
We face significant competition in the markets we serve and we may not be able to compete successfully.
In order to compete effectively we must continue to develop enhancements to our existing products, new products and services on a timely basis that meet changing consumer preferences and successfully develop, manufacture and market these new products, product enhancements and services. There can be no assurance that we will be successful in developing and marketing new products, product enhancements, additional technologies and services. Many of our competitors are dedicating increasing resources to competing with us, especially as our products and services become more affected by technological advances and software innovations. Our inability to effectively compete could reduce the sales of our products and services, which could have a material adverse impact on our business, financial condition and results of operations.
Additionally, our ability to compete effectively depends, to a significant extent, on the specification or approval of our products by architects, engineers, building inspectors, building code officials and customers and their acceptance of our premium brand. If a significant portion of those communities were to decide that the design, materials, manufacturing, testing or quality control of our products is inferior to that of any of our competitors or the cost differences between our products and any competitors are not justifiable, our sales and profits could be materially reduced.
Increases in prices of raw materials and energy could negatively affect our sales and profits.
Steel is the principal raw material used in the manufacture of many of our products. The price of steel has historically fluctuated on a cyclical basis and has often depended on a variety of factors over which we have no control including general economic conditions and currency exchange rates. Import tariffs and/or other mandates also could significantly increase the prices on raw materials that are critical to our business, such as steel. The cost of producing our products is also sensitive to the price of energy.
The selling prices of our products have not always increased in response to raw material, energy or other cost increases, and we are unable to determine to what extent, if any, we will be able to pass future cost increases through to our customers. Increases in prices of raw materials and energy, our inability or unwillingness to pass increased costs through to our customers could materially and adversely affect our financial condition or results of operations.
We depend on third parties for transportation services and the lack of availability of transportation and/or increases in cost could materially and adversely affect our business and operations.
Our business depends on the transportation of both our products to our customers and distributors and the transportation of raw materials to us. We rely on third parties for transportation services of these items, which services are occasionally in high demand (especially at the end of calendar quarters) and/or subject to price fluctuations. Damage or disruption to our supply chain, including transportation and distribution capabilities, could impair our ability to manufacture or sell our products. Failure to take adequate steps to mitigate the likelihood or potential impact of disruptions, or to effectively manage such events if they occur could adversely affect our business or financial results.
If the required supply of transportation services is unavailable when needed, our manufacturing processes may be interrupted if we are not able to receive raw materials or we may be unable to sell our products at full value, or at all. This could harm our reputation, negatively impact our customer relationships and have a material adverse effect on our financial condition and results of operations. In addition, a material increase in transportation rates or fuel surcharges could have a material adverse effect on our profitability.
Expectations relating to environmental, social and governance considerations expose the Company to potential liabilities, increased costs, reputational harm and other adverse effects on the Company’s business.
Many governments, regulators, investors, employees, customers and other stakeholders are increasingly focused on environmental, social and governance considerations relating to businesses, including climate change and greenhouse gas emissions, human capital and diversity, equity and inclusion. We make statements about our environmental, social and governance goals and initiatives through information provided on our website, press statements and other communications, including through our Environmental, Social and Governance Report. Responding to these environmental, social and governance considerations and implementation of these goals and initiatives involves risks and uncertainties, including those described under “Forward-Looking Statements,” requires investments and are impacted by factors that may be outside our control. In addition, some stakeholders may disagree with our goals and initiatives and the focus of stakeholders may change and evolve over time. Stakeholders also may have very different views on where environmental, social and governance focus should be placed, including differing views of regulators in various jurisdictions in which we operate. Any failure, or perceived failure, by us to achieve our goals, further our initiatives, adhere to our public statements, comply with federal, state or international environmental, social and governance laws and regulations, or meet evolving and varied stakeholder expectations and standards could result in legal and regulatory proceedings against us and materially adversely affect our business, reputation, results of operations, financial condition and stock price.
Risks Related to Seasonality and Weather Conditions
Seasonality and weather-related conditions may have a significant impact on our financial condition from period to period.
The demand for our products and services is heavily correlated to both seasonal changes, with operating results varying from quarter to quarter, and unpredictable weather patterns. Our sales and income have historically been lower in the first and fourth quarters than in the second and third quarters, as customers tend to purchase construction materials in the late spring and summer months for the construction season. In addition, weather conditions, such as unseasonably warm, cold or wet weather, which affect, and sometimes delay or accelerate installation of some of our products, may significantly affect our results of operations. Sales that we anticipate in one quarter may occur in another quarter, affecting both quarters’ results and potentially our stock price.
In addition, we typically ship orders as we receive them and maintain inventory levels to allow us to operate with minimum backlog. The efficiency of our inventory system, and our ability to avoid backlogs and potential loss of customers, is closely tied to our ability to accurately predict seasonal and quarterly variances. Further, our planned expenditures are also based primarily on sales forecasts. When sales do not meet our expectations, our operating results will be reduced for the relevant quarters, as we will have already incurred expenses based on those expectations. This could result in a material decline in our stock price.
Climate change, drought, weather conditions and storm activity could have a material adverse impact on our results of operations.
In North America, weather conditions and the level of severe storms can have a significant impact on the markets for residential construction and home improvement. As a result, climate change that results in altered weather conditions or storm activity could have a significant impact on our business by:
•depressing or reversing economic development;
•reducing the demand for construction;
•increasing the cost and reducing the availability of wood products used in construction;
•increasing the cost and reducing the availability of raw materials and energy;
•increasing the cost and reducing the availability of insurance covering damage from natural disasters; and
•lead to new laws and regulations that increase our expenses and reduce our sales.
Generally, any weather conditions that slow or limit residential or construction activity can adversely impact demand for our products and services.
Lower demand for our products or services as a result of this scenario could adversely impact our business, financial condition and results of operations. Additionally, severely low temperatures may lead to significant and immediate spikes in costs of natural gas, electricity and other commodities that could negatively affect our results of operation.
Natural disasters or other catastrophes could decrease our manufacturing capacity or harm our business and financial condition.
Some of our manufacturing facilities are located in geographic regions that have experienced, or may experience in the future, major natural disasters and other catastrophes, such as fires, earthquakes, floods and hurricanes. Our disaster recovery plan may not be adequate or effective to respond in such events. Further, although we maintain various form and levels of insurance to protect us against potential loss exposures, the scope of our available insurance coverage may not be adequate to protect us against all potential risks. For example, we do not carry earthquake insurance and other insurance that we carry is limited in the risks covered and the amount of coverage. Our insurance may not be adequate to cover all of our resulting costs, business interruption and lost profits when a major natural disaster or catastrophe occurs. A natural disaster rendering one or more of our manufacturing facilities totally or partially inoperable, whether or not covered by insurance, would materially and adversely affect our business and financial condition.
Product, Services and Sales Risks
Product liability claims and litigation could affect our business, reputation, financial condition, results of operations and cash flows.
In the ordinary course of business, the products that we design and/or manufacture, and/or the services we provide, have led to product liability claims or other legal claims being filed against us. To the extent that plaintiffs are successful in showing that a defect in a product’s design, manufacture or warnings led to personal injury or property damage, or that our provision of services resulted in similar injury or damage, we may be subject to claims for damages. Although we are insured for damages above a certain amount, we bear the costs and expenses associated with defending claims, including frivolous lawsuits, and are responsible for damages up to the insurance retention amount. The insurance that we carry is limited in the amount of coverage and may not be adequate to cover all of our resulting costs, business interruption and lost profits if we are subject to product liability claims. We might also face increases in premiums and reductions in the availability of insurance covering product liability, which could have a significant impact on our business. In addition to claims concerning individual products, as a manufacturer, we can be subject to costs, potential negative publicity and lawsuits related to product recalls, which could adversely impact our results of operations and damage our reputation.
Design defects, labeling defects, product formula defects, inaccurate chemical mixes, product recalls and/or product liability claims could harm our business, reputation, financial condition and results of operations.
Many of our products are integral to the structural soundness or safety of the structures in which they are used and we have on occasion found flaws and deficiencies in the design, manufacturing, assembling, labeling, product formulations, chemical mixes or testing of our products. We also have on occasion found flaws and deficiencies in raw materials and finished goods produced by others and used with or incorporated into our products. Some flaws and deficiencies have not been apparent until after the products were installed or used by customers.
If any flaws or deficiencies exist in our products and if such flaws or deficiencies are not discovered and corrected before our products are incorporated into structures, the structures could be unsafe or could suffer severe damage, such as collapse or fire, and personal injury or death could result. To the extent that such damage or injury is not covered by our product liability
insurance and we are held to be liable, we could be required to correct such damage and to compensate persons who might have suffered injury or death, and our business, reputation, financial condition, results of operations and cash flows could be materially and adversely affected.
As a result of the nature of many of our products and their use in construction projects, claims (including product warranty claims and claims resulting from a natural disaster) may be made against us with regard to damage or destruction of structures incorporating our products whether or not our products failed. Any such claims, if asserted, could require us to expend material time and efforts defending the claim and may materially and adversely affect our business, reputation, financial condition and results of operations. Costs associated with resolving such claims (such as repair or replacement of the affected parts) could be material and may exceed any amounts reserved in our consolidated financial statements.
While we generally attempt to limit our contractual liability and our exposure to price or expense increases, we may have uncapped liabilities or significant exposure under some contracts, and could suffer material losses under such contracts.
We enter into many types of contracts with our customers, suppliers and other third parties, including in connection with our expansion into new markets and new product lines. Under some of these contracts, our overall liability may not be limited to a specified maximum amount or we may have significant potential exposure to price or expense increases. If we receive claims under these contracts or experience significant price increases or comparable expense increases, we may incur liabilities significantly in excess of the revenues associated with such contracts, which could have a material adverse effect on our results of operations.
Some of our technology offerings provide planning and design functions to customers, and we are involved both in product sales and engineering services. Any software errors or deficiencies or failures in our engineering services could have material adverse effects on our business, reputation, financial condition, results of operations and cash flows.
Our planning/design software applications facilitate the creation by customers of complex construction and building designs and is extremely complex. If our software applications contain defects or errors, our engineers prepare, approve or seal drawings that contain defects or we are otherwise involved in any design or construction that contains flaws, regardless of whether we caused such flaws, we may be required to correct deficiencies and may become involved in litigation. Further, if any damage or injury is not covered by our insurance and we are held to be liable, we could be required to correct such damage and to compensate persons who might have suffered injury, and our business, reputation, financial condition, results of operations and cash flows could be materially and adversely affected.
Risks Related to Our Intellectual Property and Information Technology
Our recent efforts to increase our technology offerings and integrate new software and application offerings may prove unsuccessful and may affect our future prospects.
In North America the residential construction industry has experienced increased complexity in some home design and builders are more aggressively trying to reduce their costs. One of our responses has been to develop and market sophisticated software and applications to facilitate the specification, selection and use of our product systems. We have continued to commit substantial resources to our software development endeavors in recent years and expect that trend to continue.
We may not be able to create and further develop commercially successful software and applications. Even if we are able to create and develop initially successful ideas, the technology industry is subject to rapid changes. We may not be able to adapt quickly enough to keep up with changing demands, and our software may become obsolete.
While we see having a software interface with the construction industry as a potential growth area, we also face competition from other companies that are focused solely or primarily on the development of software and applications. These companies may have significantly greater expertise and resources to devote to software development, and we may be unable to compete with them in that space.
If we cannot protect our intellectual property, we will not be able to compete effectively.
We monitor and protect against activities that might infringe, dilute, or otherwise harm our patents, trademarks and other intellectual property and rely on the patent, trademark and other laws of the U.S. and other countries. However, we may be unable to prevent third parties from using our intellectual property without our authorization. To the extent we cannot protect our intellectual property, unauthorized use and misuse of our intellectual property could harm our competitive position and have a material adverse impact on our business, financial condition and results of operations. In addition, the laws of some non-U.S.
jurisdictions provide less protection for our proprietary rights than the laws of the U.S. and we therefore may not be able to effectively enforce our intellectual property rights in these jurisdictions. If we are unable to maintain certain exclusive licenses, our brand recognition and sales could be adversely impacted. Current employees, contractors and suppliers have, and former employees, contractors and suppliers may have, access to trade secrets and confidential information regarding our operations which could be disclosed improperly and in breach of contract to our competitors or otherwise used to harm us.
Third parties may also claim that we are infringing upon their intellectual property rights. If we are unable to successfully defend or license such alleged infringing intellectual property or if we are required to substitute similar technology from another source, our operations could be adversely affected. Even if we believe that such intellectual property claims are without merit, defending such claims can be costly, time consuming and require significant resources. Claims of intellectual property infringement also might require us to redesign affected products, pay costly damage awards, or face injunctions prohibiting us from manufacturing, importing, marketing or selling certain of our products. Even if we have agreements to indemnify us, indemnifying parties may be unable or unwilling to do so.
We are subject to cyber security risks and may incur increasing costs in efforts to minimize those risks and to comply with regulatory standards.
We employ information technology systems and operate websites which allow for the secure storage and transmission of proprietary or confidential information regarding our customers, employees and others. We make significant efforts to secure our computer network to mitigate the risk of possible cyber-attacks, including, but not limited to, data breaches, and are continuously working to upgrade our existing information technology systems to ensure that we are protected, to the greatest extent possible, against cyber risks and security breaches. Despite these efforts security of our computer networks could be compromised which could impact operations and confidential information could be misappropriated, which could lead to negative publicity, loss of sales and profits or cause us to incur significant costs to reimburse third- parties for damages, which could adversely impact profits.
We strive to comply with all applicable laws, policies, legal obligations and industry codes of conduct relating to privacy and data protection, to the extent possible. However, we continue to see increasingly complex, rigorous and more stringent state and national regulatory standards enacted to protect businesses and personal data, including the General Data Protection Regulation (“GDPR”) and the California Consumer Privacy Act of 2018 ("CCPA"). GDPR is a comprehensive European Union privacy and data protection reform, effective in 2018, which applies to companies that are organized in the European Union or otherwise provide services to consumers who reside in the European Union, and imposes strict standards regarding the sharing, storage, use, disclosure and protection of end user data and significant penalties (monetary and otherwise) for non-compliance. The CCPA, which became effective in 2022 established a new privacy framework for covered businesses by, among other things, creating an expanded definition of personal information, establishing new data privacy rights for consumers in the State of California and creating a new and potentially severe statutory damages framework for violations of the CCPA and for businesses that fail to implement reasonable security procedures and practices to prevent data breaches. More recently, on November 3, 2020, California enacted the California Privacy Rights Act (the “CPRA”). The CPRA, which went into effect on January 1, 2023, expands upon the protections provided by the CCPA, including new limitations on the sale or sharing of consumers' personal information, and the creation of a new state agency to enforce the CPRA’s protections. Any failure to comply with GDPR, the CCPA, the CPRA, or other state or regulatory standards, could subject the Company to legal and reputational risks. Misuse of or failure to secure personal information could also result in violation of data privacy laws and regulations, proceedings against us by governmental entities or others, damage to our reputation and credibility, and could have a material adverse effect on our business and results of operations.
We publicly post our privacy policies and practices concerning our processing, use, and disclosure of personally identifiable information on our websites. If we fail to adhere to our privacy policy and other published statements or applicable laws concerning our processing, use, transmission and disclosure of protected information, or if our statements or practices are found to be deceptive or misrepresentative, we could face regulatory actions, fines and other liability.
We rely on complex software systems and hosted applications to operate our business, and our business may be disrupted if we are unable to successfully and efficiently update these systems or convert to new systems.
We are increasingly dependent on technology systems to operate our business, reduce costs, and enhance customer service. These systems include complex software systems and hosted applications that are provided by third parties such as financial management and human capital management platforms from SAP America, Inc. and Workday, Inc. Software systems need to be updated on a regular basis with patches, bug fixes and other modifications. Hosted applications are subject to service availability and reliability of hosting environments. We also migrate from legacy systems to new systems from time to time.
Maintaining existing software systems, implementing upgrades and converting to new systems are costly and require a significant allocation of personnel and other resources. The implementation of these systems upgrades and conversions is a complex and time-consuming project involving substantial expenditures for implementation activities, consultants, system hardware and software, often requires transforming our current business and financial processes to conform to new systems, and therefore, may take longer, be more disruptive, and cost more than forecast and may not be successful. If the implementation is delayed or otherwise is not successful, it may hinder our business operations and negatively affect our financial condition and results of operations. There are many factors that may materially and adversely affect the schedule, cost, and execution of the implementation process, including, without limitation, problems during the design and testing phases of new systems; system delays and malfunctions; the deviation by suppliers and contractors from the required performance under their contracts with us; the diversion of management attention from our daily operations to the implementation project; reworks due to unanticipated changes in business processes; difficulty in training employees in the operation of new systems and maintaining internal control while converting from legacy systems to new systems; and integration with our existing systems. Some of such factors may not be reasonably anticipated or may be beyond our control.
We have experienced and may in the future experience delays, outages, cyber-based attacks or security breaches in relation to our information systems and computer networks, which have disrupted and may in the future disrupt our operations and may result in data corruption. As a result, our profitability, financial condition and reputation could be negatively affected. In addition, data privacy statements and laws could subject us to liability.
We depend on information technology networks and systems, including the Internet, to process, transmit and store electronic information. We depend on our information technology infrastructure for electronic communications among our locations around the world and between our personnel and our subsidiaries, customers and suppliers. We collect and retain large volumes of internal and customer, vendor and supplier data, including some personally identifiable information, for business purposes. We also maintain personally identifiable information about our employees. The integrity and protection of our customer, vendor, supplier, employee and other Company data is critical to our business. The regulatory environment governing information, security and privacy laws is increasingly demanding and continues to evolve. Maintaining compliance with applicable security and privacy regulations may increase our operating costs or adversely affect our business operations.
Despite the security and maintenance measures we have in place, our facilities and systems, and those of the retailers, dealers, licensees and other third-parties with which we do business, we remain vulnerable to security breaches, cyber-attacks, acts of vandalism, computer viruses, malware, data corruption, delays, disruptions, programming and/or human errors or other similar events, such as those accomplished through fraud, trickery or other forms of deceiving our employees, contractors or other agents or representatives and those due to system updates, natural disasters, malicious attacks, accidents, power disruptions, telecommunications failures, acts of terrorism or war, computer viruses, physical or electronic break-ins or similar events. Such incidents have occurred, continue to occur, and may occur in the future.
Security breaches of our infrastructure could create system disruptions, shutdowns or unauthorized disclosures of confidential information. Despite the security measures we have in place, our facilities and systems, and those of the retailers, dealers, licensees and other third parties with which we do business, we may be vulnerable to security breaches, cyber-attacks, acts of vandalism, computer viruses, misplaced or lost data, programming and/or human errors or other similar events. Such incidents may involve misappropriation, loss or other unauthorized disclosure of confidential data, materials or information, including those concerning our customers, employees or suppliers, whether by us or by the retailers, dealers, licensees and other third-party distributors with which we do business, disrupt our operations, result in losses, damage our reputation, and expose us to the risks of litigation and liability (including regulatory liability); and may have a material adverse effect on our business, results of operations and financial condition.
Some of our agreements for software and software-as-services products have limited terms, and we may be unable to renew such agreements and may lose access to such products.
We have various agreements with a number of third parties that provide software and software-as-a-service products to us. These agreements often require reoccurring payments for online access to the products and have limited terms. In the future, we will be required to renegotiate the terms of these agreements, and may be unable to renew such agreements on favorable terms. If any such agreement cannot be renewed or can only be renewed on terms that are materially worse for us, we may be unable to access the applicable software, and our business and operating results may be adversely affected.
Regulatory Risks
Failure to comply with industry regulations could result in reduced sales and increased costs.
We are subject to environmental laws and regulations governing emissions into the air, discharges into water, and generation, handling, storage, transportation, treatment and disposal of waste materials. We are also subject to other federal and state laws and regulations regarding health and safety matters.
Our manufacturing operations involve the use of solvents, chemicals, oils and other materials that are regarded as hazardous or toxic. We also use complex and heavy machinery and equipment that can pose severe safety hazards, especially if not properly and carefully used. Some of our products also incorporate materials that are hazardous or toxic in some forms, such as:
•zinc and lead used in some steel galvanizing processes;
•chemicals used in our acrylic and epoxy anchoring products, our concrete repair, strengthening and protecting products; and
•gun powder used in our powder-actuated tools, which is explosive.
We have in the past, and may in the future, need to take steps to remedy our failure to properly label, store, transport, use and manufacture such toxic and hazardous materials.
If we do not obtain all material licenses and permits required by environmental, health and safety laws and regulations, or otherwise fail to comply with applicable laws and regulations, we may be subject to regulatory action by governmental authorities. If our policies and procedures are flawed, or our employees fail or neglect to follow our policies and procedures in all respects, we might incur liability. Relevant laws and regulations could change or new ones could be adopted that require us to incur substantial expense to comply.
Complying or failing to comply with conflict minerals regulations could materially and adversely affect our supply chain, our relationships with customers and suppliers and our financial results.
We are currently subject to conflict mineral disclosure regulations in the U.S. and may be affected by new regulations concerning conflict and similar minerals adopted by other jurisdictions where we operate. While we have been successful to date in adapting to such regulations, we have and will continue to incur added costs to comply with the disclosure requirements, including costs related to determining the source of such minerals used in our products. We may not be able to ascertain the origins of such minerals that we use and may not be able to satisfy requests from customers to certify that our products are free of conflict minerals. These requirements also could constrain the pool of suppliers from which we source such minerals. We may be unable to obtain conflict-free minerals at competitive prices. Such consequences will increase costs and may materially and adversely affect our manufacturing operations and profitability.
When we provide engineering services we are subject to various local, state and federal rules and regulations which can increase our potential liability.
As part of our product offerings, we may provide engineering and design-related services to our clients. Some of these services require us to stamp drawings or otherwise be involved in the engineering process. While we generally attempt to limit our liability through our internal processes and through our legal agreements with third parties to which we provide such services, under various local, state and federal rules and regulations these limitations may not be effective and we may be held liable for engineering failures. Any such liability could materially and adversely affect our profitability.
Capital Expenditures, Expansions, Acquisitions and Divestitures Risks
The integration of ETANCO may not result in anticipated improvements in market position or the realization of anticipated operating synergies or may take longer to realize than expected.
Although we believe that our acquisition of ETANCO will improve our market position and realize positive operating results, including operating synergies, we cannot be assured that these improvements will be obtained or the timing of such improvements. The management and acquisition of businesses involves substantial risks, any of which may result in a material adverse effect on our business and results of operations, including:
•the uncertainty that an acquired business will achieve anticipated operating results;
•significant expenses to integrate;
•diversion of management’s attention from business operations to integration matters;
•departure of key personnel from the acquired business;
•effectively managing entrepreneurial spirit and decision-making;
•integration of different information systems;
•unanticipated costs and exposure to unforeseen liabilities; and
•impairment of assets.
Our acquisition activities from time to time present unique risks for our business, and any acquisition could materially and adversely affect our business and operating results.
We may consider and evaluate acquisitions and compete for acquisitions with other potential acquirers, some of which may have greater financial or operational resources than we do. Any acquisitions we undertake involve numerous risks, including:
•unforeseen difficulties in integrating operations, products, technologies, services, accounting and employees;
•diversion of financial and management resources attention from existing operations;
•unforeseen difficulties integrating geographic regions where we do not have prior experience;
•the potential loss of key employees of acquired businesses;
•unforeseen liabilities associated with businesses acquired; and
•inability to generate sufficient revenue or realize sufficient cost savings to offset acquisition or investment costs.
As a result, if we fail to evaluate and execute acquisitions properly, we might not achieve the anticipated benefits of such acquisitions and we may incur costs in excess of what we anticipate. These risks would likely be greater in the case of larger acquisitions.
In addition, future acquisitions may involve issuance of additional equity securities that dilute the value of our existing equity securities, increase our debt, cause impairment related to goodwill and cause impairment of, and amortization expenses related to, other intangible assets, which could materially and adversely affect our profitability.
Our capital expenditures may not be adequate to maintain our competitive position and may not be implemented in a timely or cost-effective manner.
Our capital expenditures are limited by our liquidity and capital resources and the amount we have available for capital spending is limited by the need to pay our other expenses and to maintain adequate cash reserves and borrowing capacity to meet unexpected demands that may arise. Productivity improvements through process re-engineering, design efficiency and manufacturing cost improvements may be required to offset potential increases in labor and raw material costs and competitive price pressures. If we are unable to make sufficient capital expenditures, or to maximize the efficiency of the capital expenditures we do make, our competitive position may be harmed and we may be unable to manufacture the products necessary to compete successfully in our targeted market segments.
Additional financing, if needed, to fund our working capital, growth or other business requirements may not be available on reasonable terms, or at all.
If the cash needed for working capital or to fund our growth or other business requirements increases to a level that exceeds the amount of cash that we generate from operations and have available through our current credit arrangements, we will need to seek additional financing. Additional or new borrowings may not be available on reasonable terms, or at all. Our ability to raise money by issuing and selling shares of our common or preferred stock depends on general market conditions and the demand for our stock. If we sell stock, our existing stockholders could experience substantial dilution. Our inability to secure additional financing could prevent the expansion of our business, internally and through acquisitions.
Risks Related to Human Capital
We depend on executives and other key employees, the loss of whom could harm our business.
We depend, in part, on the efforts and skills of our executives and other key employees, including members of our sales force. Our executives and key employees are experienced and highly qualified. The loss of any of our executive officers or other key employees could harm the business and the Company’s ability to timely achieve its strategic initiatives. Our success also depends on our ability to identify, attract, hire and retain our key personnel. We face strong competition for such personnel and may not be able to attract or retain such personnel. In addition, when we experience periods with little or no profits, a decrease in compensation based on our profits may make it difficult to attract and retain highly qualified personnel. We may not be able to attract and retain key personnel or may incur significant costs to do so.
Our work force could become increasingly unionized in the future and our unionized or union-free work force could strike, which could adversely affect the stability of our production and reduce our profitability.
A significant number of our employees are represented by labor unions and covered by collective bargaining agreements that will expire between 2023 and 2026. Generally, collective bargaining agreements that expire may be terminated after notice by the union. After termination, the union may authorize a strike similar to the strike which was initiated at our Stockton facility in the third quarter of 2019. Although we believe that our relations with our employees are generally good, no assurance can be given that we will be able to successfully extend or renegotiate our collective bargaining agreements as they expire. If we fail to extend or renegotiate our collective bargaining agreements, if disputes with our unions arise, or if the workers covered by one or more of the collective bargaining agreements engage in a strike, lockout, or other work stoppage, we could have a material adverse effect on production at one or more of our facilities, incur higher labor costs, and, depending upon the length of such dispute or work stoppage, on our business, results of operations, financial position and liquidity.
Risks Related to Our International Operations
International operations and our financial results in those markets may be affected by legal, regulatory, political, currency exchange and other economic risks.
During 2022, revenue from sales outside of the U.S. was $500.4 million, representing approximately 23.6% of consolidated sales. In addition, a significant amount of our manufacturing and production operations are located outside the U.S. As a result, our business is subject to risks and uncertainties associated with international operations, including:
•difficulties and costs associated with complying with a wide variety of complex and changing laws, including securities laws, tax laws, employment and pension-related laws, competition laws, U.S. and foreign export and trading laws, and laws governing improper business practices, treaties and regulations;
•limitations on our ability to enforce legal rights and remedies;
•adverse domestic or international economic and political conditions, business interruption, war and civil disturbance;
•changes to tax, currency, or other laws or policies that may adversely impact our ability to repatriate cash from non-U.S. subsidiaries, make cross-border investments, or engage in other intercompany transactions;
•future regulatory guidance and interpretations of the tax legislation commonly known as the U.S. Tax Cuts and Jobs Act of 2017 (the "Tax Act"), as well as assumptions that the Company makes related to the Tax Act;
•changes to tariffs or other import or export restrictions, penalties or sanctions, including modification or elimination of international agreements covering trade or investment;
•costs and availability of shipping and transportation;
•nationalization or forced relocation of properties by foreign governments;
•currency exchange rate fluctuations between the U.S. dollar and foreign currencies; and
•uncertainty with respect to any potential changes to laws, regulations and policies that could exacerbate the risks described above.
All of these factors could result in increased costs or decreased revenues and could materially and adversely affect our sales, financial condition and results of operations. Additionally, international construction standards, techniques and methods differ from those in the U.S. and as a result, we may need to redesign our products, or design new products, to compete effectively and profitably in international markets.
In addition, we operate in many parts of the world that have experienced governmental corruption and we could be adversely affected by violations of the Foreign Corrupt Practices Act ("FCPA") and similar worldwide anti-corruption laws. The FCPA and similar anti-corruption laws in other jurisdictions generally prohibit companies and their intermediaries from making improper payments to officials for the purpose of obtaining or retaining business. Although we mandate compliance with these anti-corruption laws, we cannot provide assurance that these measures will necessarily prevent violations of these laws by our employees or agents. If we were found to be liable for violations of anti-corruption laws, we could be liable for criminal or civil penalties or other sanctions, which could have a material adverse impact on our business, financial condition and results of operations.
Failure to comply with export, import, and sanctions laws and regulations could materially and adversely affect us.
We are subject to a number of export, import and economic sanction regulations, including the International Traffic in Arms Regulations (“ITAR”), the Export Administration Regulations (“EAR”) and U.S. sanction regulations administered by the U.S. Department of Treasury, Office of Foreign Assets (“OFAC”). Foreign governments where we have operations also implement export, import and sanction laws and regulations, some of which may be inconsistent or conflict with ITAR and EAR. Where we face such inconsistencies, it may be impossible for us to comply with all applicable regulations.
If we do not obtain all necessary import and export licenses required by applicable export and import regulations, including ITAR and EAR, or do business with sanctioned countries or individuals, we may be subject to fines, penalties and other regulatory action by governmental authorities, including, among other things, having our export or import privileges suspended. Even if our policies and procedures for exports, imports and sanction regulations comply, but our employees fail or neglect to follow them in all respects, we might incur similar liability.
Any changes in applicable export, import or sanction laws or regulations or any legal or regulatory violations could materially and adversely affect our business and financial condition.
Our manufacturing facilities in China complicate our supply and inventory management.
We maintain manufacturing capability in various parts of the world, including Jiangsu, China, in part to allow us to serve our customers with prompt delivery of needed products. In recent years, we have significantly expanded our manufacturing capabilities in China. Substantially all of our manufacturing output in China was and is currently intended for export to other parts of the world. Any halting or disruption to our operations at or near our Jiangsu, China manufacturing facility could substantially interfere with our general commercial activity related to our supply chain and customer base, which could have a material adverse effect on our financial condition, results of operations, business or prospects. In such event, we may need to seek alternative sources of supply for products for our customers, which may increase the costs to manufacture and deliver our products.
If significant tariffs or other restrictions are placed on our imports or any related counter-measures are taken by other countries, our costs of doing business, revenue and results of operations may be negatively impacted.
If significant tariffs or other restrictions are placed on Chinese or other imports or any related countermeasures are taken by China or other countries, our costs of doing business, revenue and results of operations may be materially harmed. If duties are imposed on our imports, we may be required to raise our prices, which may result in the loss of customers and harm our operating performance. Alternatively, we may seek to shift production outside of China, resulting in diversion of management's attention, significant costs and disruption to our operations as we would need to pursue the time-consuming processes of establishing a new supply chain, identifying substitute components and establishing new manufacturing locations.
We are subject to U.S. and international tax laws that could affect our financial results.
We generally conduct international operations through our wholly-owned subsidiaries. Our income tax liabilities in the different countries where we operate depend in part on internal settlement prices and administrative charges among us and our subsidiaries. These arrangements require us to make judgments with which tax authorities may disagree. Tax authorities may impose additional tariffs, duties, taxes, penalties and interest on us. Transactions that we have arranged in light of current tax rules could have material and adverse consequences if tax rules change, and changes in tax rules or imposition of any new or increased tariffs, duties and taxes could materially and adversely affect our sales, profits and financial condition.
Tax laws are dynamic and subject to change as new laws are passed and new interpretations are issued or applied. If the U.S. or other foreign tax authorities change applicable tax laws, our overall taxes could increase, and our business, financial condition or results of operations may be adversely impacted.
Significant judgment and certain estimates are required in determining our worldwide provision for income taxes. Future tax law changes may materially increase the Company’s prospective income tax expense.
We are subject to income taxation in the U.S. as well as numerous foreign jurisdictions. Significant judgment is required in determining our worldwide income tax provision and, there are many transactions and calculations where the ultimate tax determination is uncertain. Although we believe our estimates are reasonable, the ultimate tax outcome may differ from the amounts recorded in our financial statements and may materially affect our financial results in the period or periods for which such determination is made.
We are a global company with significant revenues and earnings generated internationally, which exposes us to the impact of foreign currency fluctuations, as well as political and economic risks.
A significant portion of our net sales and earnings are generated internationally. Sales outside of the U.S. accounted for 23.6% of our consolidated net sales in 2022 and we anticipate that sales from international operations will continue to represent a significant portion of our net sales in the future. In addition, many of our manufacturing facilities and suppliers are located outside of the U.S. Our foreign operations subject us to certain commercial, political and financial risks. Our business in these
foreign markets is subject to general political conditions, including any political instability (such as those resulting from war, terrorism and insurrections) and general economic conditions in these markets, such as inflation, deflation, interest rate volatility and credit availability. Additionally, a number of factors, including U.S. relations with the governments of the foreign countries in which we operate, changes to international trade agreements and treaties, increases in trade protectionism, or the weakening or loss of certain intellectual property protection rights in some countries, may affect our business, financial condition and results of operations. Foreign regulatory requirements, including those related to the testing, authorization, and labeling of products and import or export licensing requirements, could affect the availability of our products in these markets.
In addition to risks associated with general political conditions, our international operations are subject to fluctuations in foreign currency exchange rates The functional currency for most of our foreign operations is the applicable local currency. As a result, fluctuations in foreign currency exchange rates affect the results of our operations and the value of our foreign assets and liabilities, which in turn may adversely affect results of operations and cash flows and the comparability of period-to-period results of operations. Foreign governmental policies and actions regarding currency valuation could result in actions by the United States and other countries to offset the effects of such fluctuations. Given the unpredictability and volatility of foreign currency exchange rates, ongoing or unusual volatility may adversely impact our business and financial conditions.
General Risk Factors
Any issuance of preferred stock may dilute your investment and reduce funds available for dividends.
Our Board of Directors is authorized by our certificate of incorporation to determine the terms of one or more series of preferred stock and to authorize the issuance of shares of any such series on such terms as our Board of Directors may approve. Any such issuance could be used to impede an acquisition of our business that our Board of Directors does not approve, further dilute the equity investments of holders of our common stock and reduce funds available for the payment of dividends to holders of our common stock.
Provisions in our amended and restated certificate of incorporation and bylaws or Delaware law might discourage, delay or prevent a change in control of our company or changes in our management.
Our amended and restated certificate of incorporation and bylaws contain provisions that may discourage, delay or prevent a change in control of our Company or changes in our management that our stockholders may deem advantageous. For example, under our charter documents, our stockholders cannot call special meetings and cannot take action by written consent.
Additionally, we are subject to Section 203 of the Delaware General Corporation Law, which generally prohibits a Delaware corporation from engaging in any of a broad range of business combinations with any “interested” stockholder for a period of three years following the date on which the stockholder became an “interested” stockholder and which may discourage, delay or prevent a change in control of our company. Delaware law and our corporate governance documents could deter takeover attempts that might otherwise be beneficial to our stockholders.
If we were required to write down all or part of our goodwill or other indefinite-lived intangible assets, our results of operations or financial condition could be materially adversely affected in a particular period.
Declines in the Company’s business may result in an impairment of the Company’s tangible and intangible assets which could result in a material non-cash charge. At least annually, or at other times when events occur that could affect the value of such assets, we perform impairment tests on our goodwill, indefinite-lived intangible assets and definite-lived intangible assets. To determine whether an impairment has occurred, we compare fair value of each of our reporting units with its carrying value. In the past, these tests have led us to incur significant impairment charges. Significant and unanticipated changes in circumstances, such as significant adverse changes in business climate, adverse actions by regulatory authorities, unanticipated competition, loss of key customers or changes in technology or markets, can require a charge for impairment that can negatively impact our results of operations.
Item 1B. Unresolved Staff Comments.
None.
Item 2. Properties.
Our headquarters and principal executive offices in Pleasanton, California, and our principal U.S. manufacturing facilities in Stockton and San Bernardino County, California, McKinney, Texas, West Chicago, Illinois, Columbus, Ohio, and Gallatin,
Tennessee are located in owned premises. The principal manufacturing facilities located outside the U.S., the majority of which we own, are in France, Italy, Romania, Denmark, Germany, Poland, Switzerland, Sweden, Portugal and China. We also own and lease smaller manufacturing facilities, warehouses, research and development facilities and sales offices in the U.S., Canada, the United Kingdom, Europe, Asia, Australia, New Zealand, and Chile. As of February 28, 2023, the Company’s owned and leased facilities were as follows:
| | | | | | | | | | | | | | | | | | | | | | | | | | |
| | | Number | | | | | | |
| | | Of | | Approximate Square Footage |
| | | Properties | | Owned | | Leased | | Total |
| | | | | (in thousands of square feet) |
| North America | | 28 | | | 2,235 | | | 1,031 | | | 3,266 | |
| Europe | | 36 | | | 1,749 | | | 725 | | | 2,474 | |
| Asia/Pacific | | 9 | | | 175 | | | 40 | | | 215 | |
| Administrative and all other | | 1 | | | 89 | | | — | | | 89 | |
| Total | | 74 | | | 4,248 | | | 1,796 | | | 6,044 | |
We believe that our properties are maintained in good operating condition. Our manufacturing facilities are equipped with specialized equipment and use extensive automation. Our leased facilities typically have renewal options and have expiration dates through 2032. We believe we will be able to extend leases on our various facilities as necessary, or as they expire. Currently, our manufacturing facilities are being operated with at least one full-time shift. Based on current information and subject to future events and circumstances, we anticipate that we may require additional facilities to accommodate possible future growth.
Item 3. Legal Proceedings.
From time to time, the Company is involved in various legal proceedings and other matters arising in the normal course of business. Corrosion, hydrogen embrittlement, cracking, material hardness, wood pressure-treating chemicals, misinstallations, misuse, design and assembly flaws, manufacturing defects, labeling defects, product formula defects, inaccurate chemical mixes, adulteration, environmental conditions, or other factors can contribute to failure of fasteners, connectors, anchors, adhesives, specialty chemicals, such as fiber reinforced polymers, and tool products. In addition, inaccuracies may occur in product information, descriptions and instructions found in catalogs, packaging, data sheets, and the Company’s website.
The Company currently is not a party to any legal proceedings which the Company expects individually or in the aggregate to have a material adverse effect on the Company’s financial condition, cash flows or results of operations. Nonetheless, the resolution of any claim or litigation is subject to inherent uncertainty and we could in the future incur judgments, enter into settlements of claims or revise our expectations regarding the outcome of the various legal proceedings and other matters we are currently involved in, which could materially impact our financial condition, cash flows or results of operations. Refer to Note 14, “Commitments and Contingencies,” to the Company’s consolidated financial statements included in this Annual Report on Form 10-K for a discussion of recent developments related to certain of the legal proceedings in which we are involved.
Item 4. Mine Safety Disclosures.
Not applicable.
PART II
Item 5. Market for Registrant’s Common Equity, Related Stockholder Matters and Issuer Purchases of Equity Securities.
Market Information for Common Stock
The Company’s common stock is listed on the New York Stock Exchange (the “NYSE”) under the symbol “SSD.”
As of February 23, 2023 there were 46,260 holders of record of the Company’s common stock, although we believe that there are a significantly larger number of beneficial owners of our common stock.
Dividends
During 2022, the Company paid a total of $43.9 million in cash dividends. On January 24, 2023, we declared a quarterly cash dividend of $0.26 per share of common stock to be paid on April 27, 2023 to stockholders of record as of April 6, 2023. See "Note 19 — Subsequent Events" to the Company's consolidated financial statements. Future dividends, if any, will be determined by the Company’s Board of Directors, based on the Company’s future earnings, cash flows, financial condition and other factors deemed relevant by the Board of Directors. See “Item 7 — Management’s Discussion and Analysis of Financial Condition and Results of Operations.”
Stock Performance Graph
The following graph compares the cumulative total stockholder return on the Company’s common stock from December 31, 2017, through December 31, 2022, with the cumulative total return on the S&P 500 Index (a broad equity market index), the Dow Jones U.S. Building Materials & Fixtures Index (a published industry or line-of-business index) and a Peer Group Index over the same period (assuming the investment of $100 in the Company’s common stock and in each of the indices on December 31, 2017, and reinvestment of all dividends into additional shares of the same class of equity securities at the frequency with which dividends are paid on such securities during the applicable fiscal year). To provide an additional comparison to our performance, we included an index consisting of companies in the building products or construction materials industries that are most comparable to us in terms of size and nature of operations, which group has also been referenced by us in connection with setting our executive compensation. The Peer Group Index below consisted of AAON, Inc., Advance Drainage Systems, Inc., Allegion Plc, American Woodmark Corp, Apogee Enterprises, Inc., Armstrong World Industries, Inc., Atkore Inc., Axek Company Inc., Eagle Materials, Inc., Gibraltar Industries, Inc., Masonite International Corp., Patrick Industries, Inc., PGT Innovations, Inc., Quanex Building Products Corp., Summit Materials, Inc., and Trex Company, Inc.
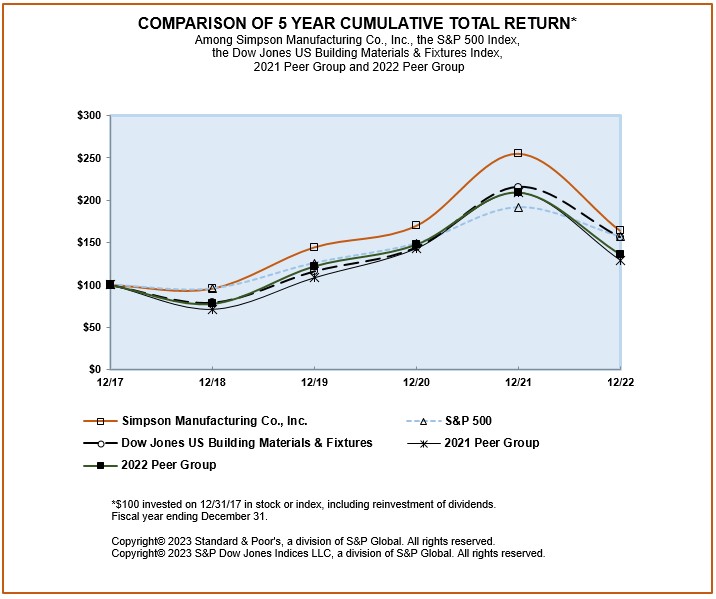
Purchases of Equity Securities by the Issuer and Affiliated Purchasers
The table below shows the monthly repurchases of shares of the Company's common stock in the fourth quarter of 2022.
| | | | | | | | | | | | | | | | | | | | | | | |
| (a) | | (b) | | (c) | | (d) |
| Period | Total Number of Shares Purchased | | Average Price Paid per Share | | Total Number of Shares Purchased as Part of Publicly Announced Plans or Programs | | Approximate Value of Shares that May Yet Be Purchased Under the Plans or Programs (1) (in millions) |
| October 1 - October 31, 2022 | 45 | | | $ | 78.40 | | | — | | | $25,438,087 |
| November 1 - November 30, 2022 | 47,828 | | | $ | 84.95 | | | 47,800 | | | $21,377,692 |
| December 1 - December 31, 2022 | 69 | | | $ | 94.24 | | | — | | | $21,377,692 |
| Total | 47,942 | | | | | | | |
(1)Pursuant to the $100.0 million repurchase authorization from the Board of Directors on November 18, 2021, and expired on December 31,
2022. See “Note 5 — Stockholder's Equity.
81,543 shares of the Company's common stock were repurchased in 2022, in connection with the withholding of shares to cover payroll taxes on vesting of stock-based compensation awards vested and for retirement eligible employees who retired during 2022.
811,330 of the Company's common stock shares for $78.6 million were repurchased in 2022, pursuant to the Board’s $100.0 million repurchase authorization that was publicly announced on November 18, 2021, which authorization expired on December 31, 2022.
On December 15, 2022, the Board of Directors authorized the repurchase up to $100.0 million of the Company’s common stock from January 1, 2023 through December 31, 2023.
Item 6. [Reserved]
Item 7. Management’s Discussion and Analysis of Financial Condition and Results of Operations.
The following discussion and analysis of our financial condition and results of operations should be read in conjunction with our consolidated financial statements and related notes that appear in this Annual Report. In addition to historical consolidated financial information, the following discussion contains forward-looking statements that reflect our plans, estimates and beliefs. Our actual results could differ materially from those discussed in the forward-looking statements. Factors that could cause or contribute to these differences include those discussed below and in this Annual Report, particularly in "Part I - Item 1A. Risk Factors."
Overview
We design, manufacture and sell building construction products that are of high quality and performance, easy to use and cost-effective for customers. We operate in three business segments determined by geographic region: North America, Europe and Asia/Pacific.
In 2021, we unveiled several key growth initiatives that we believe will help us continue our track record of achieving above market revenue growth through a combination of organic and inorganic opportunities. Our organic opportunities are focused on expansion into new markets within our core competencies of wood and concrete products. These key growth initiatives will focus on the OEM, repair and remodel or do-it-yourself, mass timber, concrete and structural steel markets.
In order to grow in these markets, we aspire to be among the leaders in engineered load-rated construction building products and systems and building technology while leveraging our engineering expertise, deep-rooted relationships with top builders, engineers, contractors, code officials and distributors, along with our ongoing commitment to testing, research and innovation. Importantly, we currently have existing products, testing results, distribution and manufacturing capabilities for our key growth
initiatives. Although these initiatives are all currently in different stages of development, our successful growth in these areas will ultimately be a function of expanding our sales and/or marketing functions to promote our products to different end users and distribution channels, expanding our customer base, and potentially introducing new products in the future.
We also highlighted our five-year ambitions in 2021, which are as follows:
•Strengthen our values-based culture;
•Be the business partner of choice;
•Strive to be an innovative leader in the markets we operate;
•Continue above market growth relative to the United States housing starts;
•Remain within the top quartile of our proxy peers for operating income margin; and
•Remain in the top quartile of our proxy peers for return on invested capital.
We have made progress towards our key growth initiatives since they were first announced in 2021. A few examples from 2022 were:
•Acquired ETANCO which has resulted in additional scale for our legacy European operations, as well as the opportunity to realize synergies in those operations;
•Realigned our sales teams to more specifically focus on five end use markets – Residential, Commercial, OEM, National Retail and Building Technology, which has led to new customer and project wins within five of our key growth initiatives;
•We were awarded a structural steel opportunity In the Commercial market for a healthcare center in which our products will provide a means for bolted attachment of glass façades and temporary guard railings;
•We were awarded a project in the mass timber OEM market for a four-story mixed use building for apartments and retail space;
•Made strategic investments in building technology focused on creating solutions to help our customers be more efficient;
•Achieved product fulfillment rate of 97% in North America;
•Our North America sales volumes grew above housing starts;
•Rolled out over 40 new products during 2022; and
•Invested in venture capital funds and other companies focused on the home building industry and related new technologies.
As we make progress on our key growth initiatives, we believe we can continue our above market growth relative to U.S. housing starts in fiscal 2023 and beyond. These examples further emulate our Founder, Barclay Simpson’s, nine principles of doing business, and more specifically the focus and obsession on customers and users.
Acquisition of ETANCO
On April 1, 2022, the Company successfully completed the acquisition of ETANCO, a manufacturer of fixing and fastener products headquartered in France, for $805.4 million (730 million euros(1)) net of cash.
ETANCO's primary product applications directly align with the addressable markets in which the Company operates. Leveraging ETANCO's leading market position in Europe, following the acquisition, the Company would expand its portfolio of solutions, including mechanical anchors, fasteners and commercial building envelope solutions, as well as significantly increase its market presence across Europe. The acquisition of ETANCO has provided the Company access into new commercial building markets such as façades, waterproofing, safety and solar, as well as grow its share of direct business sales in Europe.
Upon announcing the acquisition, the Company expected to realize operating income synergies of approximately $30.0 million, on an annual run rate basis following integration efforts. We continue to expect that these synergies will be achieved through expanding the Company's market share by selling its products into new markets and channels, incorporating ETANCO's products into the Company's existing channels, as well as procurement optimization, manufacturing and operating expense efficiencies. Some of these synergies are expected to be delayed due to the current environment in Europe.
Since we announced the transaction back in late December 2021, planning for and initiating the integration of ETANCO has been our primary focus and we believe it has been progressing according to plan. We assembled a project management office that includes a leading globally recognized external advisory consulting group together with a multi-disciplinary team of key management from both Simpson and ETANCO. Because of our complementary cultures and values, our combined team has
been working extremely well together as we develop detailed plans for each of our specific integration tracks. We believe our approach has contributed to a high employee retention rate throughout the transition. With the groundwork we have laid so far, we believe we are still well positioned to capture meaningful benefits from those synergies in the coming years.
We incurred $17.3 million in acquisition and integration related costs, and realized $9.8 million in net interest expense on the financing for the acquisition during 2022.
Corporate Developments
Effective January 1, 2023, Mike Olosky, the Company’s President and Chief Operating Officer ("COO") was promoted to be the Company’s Chief Executive Officer ("CEO") and also appointed to the Company's board of directors. The Company's former CEO, Karen Colonias, will remain employed as an Executive Advisor to assist with a smooth and orderly transition until her retirement on June 30, 2023. Ms. Colonias will continue to serve as a member of Simpson's board of directors until she steps down at the 2023 annual meeting of stockholders.
Factors Affecting Our Results of Operations
The Company’s business, financial condition and results of operations depends in large part on the level of United States housing starts and residential construction activity. Though single-family housing starts increased the prior two years, we have seen demand decline recently due to supply-chain factors, inflation and interest rate increases affecting new home starts and completions. However, the Company also supplies product used in multifamily housing construction, which increased compared to last year. Decreases in product prices are expected to be partially offset by lower raw material costs for inventory on hand, while a tight labor market could further negatively affect operating margins for 2023.
Unlike lumber or other products that have a more direct correlation to United States housing starts, our products are used to a greater extent in areas that are subject to natural forces, such as seismic or wind events. Our products are generally used in a sequential progression that follows the construction process. Residential and commercial construction begins with the foundation, followed by the wall and the roof systems, and then the installation of our products, which flow into a project or a house according to these schedules.
In prior years, our sales were heavily seasonal with operating results varying from quarter to quarter depending on weather conditions that could delay construction starts. Our sales and income have historically been lower in the first and fourth quarters than in the second and third quarters of a fiscal year. Due to efforts in diversifying our global footprint, most notably with our acquisition of ETANCO, sales from our product line, customer base and customer purchases are becoming less seasonal. Political and economic events such as rising energy costs, volatility in the steel market, stressed product transportation systems and increasing interest rates can also have an effect on our gross and operating profits as well. Changes in raw material cost could impact the amount of inventory on-hand, and negatively affect our gross profit and operating margins depending on the timing of raw material purchases or how much sales prices can be increased to offset higher raw material costs.
Our operations also expose us to risks associated with pandemics, epidemics or other public health, such as the
COVID-19 pandemic.
Business Segment Information
Historically our North America segment has generated more revenues from wood construction products compared to concrete construction products. North America sales increased 24.8% for the year ended December 31, 2022 compared to December 31, 2021. Our wood construction product sales increased 34.6% for the year ended December 31, 2022 compared to December 31, 2021 and our concrete construction product sales increased 33.9% over the same periods, for both, primarily due to product price increases throughout 2021 in an effort to offset rising raw material costs and partly due to increased volumes. These product price increases were also the primary contributor to gross profits and operating profits increasing over the same comparable periods. Recently announced decreases for pricing on certain of our wood products for 2023 will likely negatively affect 2023 net sales compared to 2022. We currently anticipate compression of our operating margin for fiscal 2023 compared to 2022 due to the effects of these price decreases, higher average priced steel in cost of sales relative to much of the prior year, and increases in operating expenses.
During 2022, we reviewed the footprint for our U.S. operations with assistance from a third party. As a result, we identified facility expansion in the U.S. that we expect will improve our overall service, production efficiencies and safety in the workplace, as well as reduce our reliance on certain outsourced finished goods and component products and continue to ensure we have ample capacity to meet our customer needs. These investments reinforce our core business model differentiators to
remain the partner of choice as we continue to produce products locally and ensure superior levels of customer service. Facility investments have already started in 2022 with the announced expansion of the Columbus facility, expected to be completed in 2024 while additional facility expansions are being considered.
Europe sales increased 103.2% for the year ended December 31, 2022 compared to December 31, 2021, primarily due to the acquisition of ETANCO, which contributed $212.6 million in net sales, along with product price increases. If the Company had not acquired ETANCO, Europe net sales would have declined by $23.5 million as a result of foreign currency translation due to a strengthened United States dollar, and lower sales volumes. Wood construction product sales increased 101.1% for the year ended December 31, 2022 compared to December 31, 2021 with ETANCO contributing $170.3 million. Concrete construction product sales increased 112.5% for the year ended December 31, 2022 compared to December 31, 2021 with ETANCO contributing $42.3 million. Gross profit increased $56.5 million due to the acquisition of ETANCO while gross margins decreased mostly due to ETANCO having a lower gross margin profile, and $13.6 million in non-recurring fair-value adjustments to increase the fair value of acquired inventory as a result of purchase accounting related to the acquisition of ETANCO. Operating income was negatively impacted by higher operating expenses with $48.7 million attributable to ETANCO including $12.9 million in amortization costs for acquired intangibles, the $13.6 million in non-recurring fair-value adjustments noted above and acquisition and integration costs of $17.3 million. Fiscal 2023 will include a full year of ETANCO net sales and operating results compared to nine months for 2022. Operating margins will benefit from the absence of the 2022 non-recurring fair-value adjustments of acquired inventory noted above, as well as less integration costs estimated to be between $6 million to $8 million.
Our Asia/Pacific segment has generated revenues from both wood and concrete construction products. We believe that the Asia/Pacific segment is not significant to our overall performance.
Business Outlook
Based on business trends and conditions, the Company's outlook for the full fiscal year ending December 31, 2023 is as follows:
•Operating margin is estimated to be in the range of 18% to 20%.
•Interest expense on the outstanding Revolving Credit Facility and Term Loans, which have borrowings of $150.0 million and $433.1 million as of December 31, 2022, respectively, is expected to be approximately $9.7 million, including the benefit from interest rate and cross currency swaps mitigating substantially all of the volatility from changes in interest rates.
•The effective tax rate is estimated to be in the range of 25% to 26%, including both federal and state income tax rates and assuming no tax law changes are enacted.
•Capital expenditures are estimated to be in the range of $90.0 million to $95.0 million including the expected spend of $22.0 million to $25.0 million on its previously announced Columbus, Ohio facility expansion, with the balance of that project to be spent in 2024.
•The Company continues to work on integrating ETANCO into its operations. Plans were developed to realize the Company’s previously identified synergies in the years ahead which resulted in additional costs in 2022 that are expected to continue in 2023. We believe the Company remains well positioned to capture meaningful benefits from the synergies, subject to changing macroeconomic circumstances, which are expected to delay realization of some of the synergy opportunities.
Footnotes
(1) Reflects EUR to USD exchange rate as of April 1, 2022.
Results of Operations
Our discussion of our results focuses on 2022 and 2021 and year-to-year comparisons between those periods. Discussions of 2020 results and year-to-ear comparison between 2021 and 2020 results are not included in this Form 10K and can be found in "Management's Discussion and Analysis of Financial Condition and Results of Operations" in Part II, Item 7 of our Annual Report on Form 10K for the fiscal year ended December 31, 2021. The following table sets forth, for the years indicated, the Company’s operating results as a percentage of net sales for the years ended December 31, 2022, 2021 and 2020, respectively:
| | | | | | | | | | | | | | | | | |
| | Years Ended December 31, |
| | 2022 | | 2021 | | 2020 |
| Net sales | 100.0 | % | | 100.0 | % | | 100.0 | % |
| Cost of sales | 55.5 | % | | 52.0 | % | | 54.5 | % |
| Gross profit | 44.5 | % | | 48.0 | % | | 45.5 | % |
| Research and development and other engineering | 3.2 | % | | 3.8 | % | | 4.0 | % |
| Selling expense | 8.0 | % | | 8.6 | % | | 8.9 | % |
| General and administrative expense | 10.8 | % | | 12.3 | % | | 12.7 | % |
| Total operating expense | 22.0 | % | | 24.7 | % | | 25.6 | % |
| Acquisition and integration related costs | 0.8 | % | | — | % | | — | % |
| Net gain on disposal of assets | (0.1) | % | | — | % | | — | % |
| Income from operations | 21.8 | % | | 23.3 | % | | 19.9 | % |
| Interest expense, net and other | (0.4) | % | | (0.2) | % | | (0.2) | % |
| Other and foreign exchange loss, net | (0.2) | % | | (0.4) | % | | (0.1) | % |
| | | | | |
| | | | | |
| Income before taxes | 21.2 | % | | 22.8 | % | | 19.7 | % |
| Provision for income taxes | 5.4 | % | | 5.9 | % | | 4.9 | % |
| Net income | 15.8 | % | | 16.9 | % | | 14.8 | % |
Comparison of the Years Ended December 31, 2022 and 2021
Unless otherwise stated, the results announced below results, when providing comparisons (which are generally indicated by words such as “increased,” “decreased,” “unchanged” or “compared to”), compare the results of operations for the year ended December 31, 2022, against the results of operations for the year ended December 31, 2021. Unless otherwise stated, the results announced below, when referencing “both years,” refer to the year ended December 31, 2021 and the year ended December 31, 2022.
Beginning in 2022, the Company changed its presentation for both the North America and the Administrative and all other segment's statement of operations to display allocated expenses and management fees as a separate item below income from operations. During 2021 and 2020, allocated expenses and management fees between the two segments were previously included in gross profit, operating expenses and in income from operations and have been adjusted herein to conform to the 2022 presentation. consolidated income from operations, income before tax and net income for all periods presented below are not affected by the change in presentation
The following table shows the change in the Company’s operations from 2021 to 2022, and the increases or decreases from the prior year, for each category by segment:
| | | | | | | | | | | | | | | | | | | | | | | | | | | | | | | | | | | |
| | | | Increase (Decrease) in Operating Segment | | |
| | | | North America | | | | Asia/
Pacific | | Admin &
All Other | | |
(in thousands) | 2021 | | | Europe | | | | 2022 |
| Net sales | $ | 1,573,217 | | | $ | 338,100 | | | $ | 203,307 | | | $ | 1,463 | | | $ | — | | | $ | 2,116,087 | |
| Cost of sales | 818,187 | | | 208,507 | | | 146,855 | | | 1,455 | | | (210) | | | 1,174,794 | |
| Gross profit | 755,030 | | | $ | 129,593 | | | $ | 56,452 | | | $ | 8 | | | $ | 210 | | | 941,293 | |
| Operating expenses: | | | | | | | | | | | |
| Research and development and other engineering expense | 59,381 | | | 8,113 | | | 953 | | | (92) | | | (1) | | | 68,354 | |
| Selling expense | 135,004 | | | 16,418 | | | 17,647 | | | 296 | | | 13 | | | 169,378 | |
| General and administrative expense | 193,176 | | | (3,865) | | | 24,682 | | | 230 | | | 14,245 | | | 228,468 | |
| Operating expenses | 387,561 | | | 20,666 | | | 43,282 | | | 434 | | | 14,257 | | | 466,200 | |
| Net gain (loss) on disposal of assets | (324) | | | 97 | | | (1,134) | | | 44 | | | — | | | (1,317) | |
| Acquisition and integration related costs | — | | | — | | | 17,343 | | | — | | | — | | | 17,343 | |
| Income from operations | 367,793 | | | 108,830 | | | (3,039) | | | (470) | | | (14,047) | | | 459,067 | |
| Interest expense, net and other | (1,386) | | | 1,784 | | | (7,722) | | | (172) | | | (98) | | | (7,594) | |
| Foreign exchange gain (loss) | (7,858) | | | (17,652) | | | 1,050 | | | 841 | | | 20,211 | | | (3,408) | |
| Income before income taxes | 358,549 | | | 92,962 | | | (9,711) | | | 199 | | | 6,066 | | | 448,065 | |
| Provision for income taxes | 92,102 | | | 24,575 | | | (2,634) | | | 850 | | | (823) | | | 114,070 | |
| Net income | $ | 266,447 | | | $ | 68,387 | | | $ | (7,077) | | | $ | (651) | | | $ | 6,889 | | | $ | 333,995 | |
Net Sales increased 34.5% to $2,116.1 million from $1,573.2 million primarily due to product price increases and the acquisition of ETANCO, which contributed $212.6 million in net sales, partly offset by the negative effect of $27.8 million in foreign currency translation related mostly to Europe's currencies weakening against the United States dollar. Wood construction product net sales, including sales of connectors, truss plates, fastening systems, fasteners and shearwalls, represented 87% of the Company’s total net sales for both years ended December 31, 2022 and 2021. Concrete construction product net sales, including sales of adhesives, chemicals, mechanical anchors, powder actuated tools and reinforcing fiber materials, represented 13% of the Company’s total net sales for both years ended December 31, 2022 and 2021.
Gross profit increased to $941.3 million from $755.0 million. Gross margins decreased to 44.5% from 48.0%, primarily due to higher material costs realized through cost of sales, and $13.6 million in non-recurring fair-value adjustments for inventory related to the acquisition of ETANCO. Gross margins, including some inter-segment expenses, which were eliminated in consolidation, and excluding certain expenses that are allocated according to product group, decreased to 44.4% from 47.9% for wood construction products and decreased to 43.9% from 44.4% for concrete construction products.
Research and development and other engineering expense increased 15.1% to $68.4 million from $59.4 million, primarily due to increases of $7.4 million in personnel costs, $1.1 million in professional fees, and $0.9 million in travel costs, partially offset by a decrease of $0.8 million in cash profit sharing expense.
Selling expense increased 25.5% to $169.4 million from $135.0 million, primarily due to increases of $20.3 million in personnel costs, $7.6 million in travel-related expenses, $6.1 million in advertising and promotional expense, $1.4 million in professional fees, and $0.9 million in leasing related costs, partially offset by decreases of $4.9 in commission expense and $0.3 million in stock based compensation expense.
General and administrative expense increased 18.3% to $228.5 million from $193.2 million, primarily due to increases of $12.7 million in depreciation and amortization, $9.5 million in personnel costs, $4.5 million in professional fees, $3.5 million of computer and software related costs, and $1.7 million in travel costs, partially offset by decreases of $2.6 million in stock-based compensation, and $1.9 million in cash profit sharing expense.
Our effective income tax rate decreased to 25.5% from 25.7%.
Net income was $334.0 million compared to $266.4 million. Diluted net income per share of common stock was $7.76 compared to $6.12.
Net Sales
The following table shows net sales by segment for the years ended December 31, 2021 and 2022, respectively:
| | | | | | | | | | | | | | | | | | | | | | | |
| (in thousands) | North
America | | Europe | | Asia/
Pacific | | Total |
| December 31, 2021 | $ | 1,362,941 | | | $ | 196,996 | | | $ | 13,280 | | | $ | 1,573,217 | |
| December 31, 2022 | 1,701,041 | | 400,303 | | | 14,743 | | | 2,116,087 |
| Increase | $ | 338,100 | | $ | 203,307 | | | $ | 1,463 | | | $ | 542,870 |
| Percentage increase | 24.8 | % | | 103.2 | % | | 11.0 | % | | 34.5 | % |
The following table shows segment net sales as percentages of total net sales for the years ended December 31, 2021 and 2022, respectively:
| | | | | | | | | | | | | | | | | | | | | | | |
| North
America | | Europe | | Asia/
Pacific | | Total |
| Percentage of total 2021 net sales | 87 | % | | 13 | % | | — | % | | 100 | % |
| Percentage of total 2022 net sales | 80 | % | | 19 | % | | 1 | % | | 100 | % |
Gross Profit
The following table shows gross profit by segment for the years ended December 31, 2021 and 2022, respectively:
| | | | | | | | | | | | | | | | | | | | | | | | | | | | | |
| (in thousands) | North
America | | Europe | | Asia/
Pacific | | Admin &
All Other | | Total |
| December 31, 2021 | $ | 681,137 | | | $ | 69,164 | | | $ | 4,902 | | | $ | (173) | | | $ | 755,030 | |
| December 31, 2022 | 810,730 | | | 125,616 | | | 4,910 | | | 37 | | | 941,293 | |
| Increase | $ | 129,593 | | | $ | 56,452 | | | $ | 8 | | | $ | 210 | | | $ | 186,263 | |
| Percentage increase | 19.0 | % | | 81.6 | % | | * | | * | | 24.7 | % |
* The statistic is not meaningful or material.
The following table shows gross margins by segment for the years ended December 31, 2021 and 2022, respectively:
| | | | | | | | | | | | | | | | | | | | | | | | | | | | | |
| North
America | | Europe | | Asia/
Pacific | | Admin &
All Other | | Total |
| 2021 gross margin | 50.0 | % | | 35.1 | % | | 36.9 | % | | * | | 48.0 | % |
| 2022 gross margin | 47.7 | % | | 31.4 | % | | 33.3 | % | | * | | 44.5 | % |
* The statistic is not meaningful or material.
North America
•Net sales increased 24.8% primarily due to product price increases that took effect throughout 2021 in an effort to offset rising material costs as well as higher sales volumes. Canada's sales increased primarily due to increases in sales volume and were negatively affected by $2.9 million foreign currency translation in local currency.
•Gross margin decreased to 47.7% from 50.0%, primarily due to higher material and factory & tooling costs, each as a percentage of net sales, and were partly offset by decreases in labor, warehouse and freight costs, each as a percentage of net sales.
•Research and development and engineering expense increased $8.1 million, primarily due to increases of $4.5 million in professional fees, $4.1 million in personnel costs, $0.8 million in travel related costs, and $0.2 million in stock-based
compensation, offset by $1.9 million higher software development expenses capitalized and a decrease of $0.8 million cash profit sharing expense.
•Selling expense increased $16.4 million, primarily due to increases of $7.1 million in personnel costs, $5.9 million in advertising and trade show events, $5.5 million in travel related costs, and $1.7 million in professional fees, partly offset by decreases of $4.4 million in sales commission and $0.3 million of stock-based compensation.
•General and administrative expense decreased $3.9 million, primarily due to decreases of $8.3 million in professional fees, including legal fees, $1.6 million in cash profit sharing expense, $1.4 million in depreciation and amortization. and $0.8 million in stock-based compensation, partially offset by increases of $4.3 million of personal costs, and $2.8 million in computer software and hardware costs.
•Income from operations increased $108.8 million, mostly due to increases in sales and gross profit, partly offset by higher operating expenses.
Europe
•Net sales increased 103.2%, primarily due to the acquisition of ETANCO, which contributed $212.6 million in net sales, along with product price increases, partially offset by the negative effect of approximately $23.5 million in foreign currency translation.
•Gross margin decreased to 31.4% from 35.1%, while gross profit increased $56.5 million. Europe gross profit included $59.5 million from the acquisition of ETANCO, which includes $13.6 million non-recurring fair-value adjustment for inventory costs as a result of purchase accounting.
•Income from operations decreased $3.0 million, primarily due to $7.0 million in professional fees incurred prior to the acquisition of ETANCO. ETANCO contributed $0.5 million to income from operations, which included charges for $13.6 million in inventory adjustments, $12.4 million of amortization on acquired intangible assets, and $10.3 million of integration costs for a total of $36.9 million.
Asia/Pacific
•For information about the Company’s Asia/Pacific segment, please refer to the table above setting forth changes in our operating results for the years ended December 31, 2022 and 2021.
Administrative and All Other
•General and administrative expense increased $14.2 million, primarily due to increases of $15.8 million in professional and legal fees and $0.6 million insurance related costs offset by decreases of $1.7 million in stock-based compensation expenses, $0.6 million in cash profit sharing expenses.
Critical Accounting Policies and Estimates
The critical accounting policies described below affect the Company’s more significant judgments and estimates used in the preparation of the Company’s consolidated financial statements. If the Company’s business conditions change or if it uses different assumptions or estimates in the application of these and other accounting policies, the Company’s future results of operations could be adversely affected.
Inventory Valuation
Inventories are stated at the lower of cost or net realizable value (market). Cost includes all costs incurred in bringing each product to its present location and condition, as follows:
•Raw materials and purchased finished goods — principally valued at cost determined on a weighted average basis; and
•In-process products and finished goods — cost of direct materials and labor plus attributable overhead based on a normal level of activity.
The Company applies net realizable value and makes estimates for obsolescence to the gross value of inventory. The Company estimates net realizable value based on estimated selling price less further costs through completion and disposal. The Company impairs slow-moving products by comparing inventories on hand to projected demand. If on-hand supply of a product exceeds projected demand or if the Company believes the product is no longer marketable, the product is considered obsolete inventory. The Company revalues obsolete inventory to its net realizable value and has consistently applied this methodology. The Company believes that this approach is suitable for impairments of slow-moving and obsolete inventory. When impairments are established, a new cost basis of the inventory is created. Unexpected changes in market demand, building codes or buyer preferences could reduce the rate of inventory turnover and require the Company to recognize more obsolete inventory.
Business Combinations.
Accounting for business combinations requires us to make significant estimates and assumptions. We use our best estimates and assumptions to accurately assign fair value to the tangible and intangible assets acquired and liabilities assumed at the acquisition date as well as the useful lives of those acquired intangible assets.
Critical estimates in valuing certain of the intangible assets and goodwill we have acquired are:
•future expected cash flows from operations;
•historical and expected customer attrition rates and anticipated growth in revenue from acquired customers;
•assumptions about the period of time the acquired trade name will continue to be used in our offerings; and
•discount rates.
Unanticipated events and circumstances may occur that may affect the accuracy or validity of such assumptions, estimates or actual results.
Goodwill and Other Intangible Assets
Our goodwill balance is not amortized to expense, and we may assess quantitative or qualitative factors to determine whether it is more likely than not that the fair value of each reporting unit is less than its carrying amount as a basis for determining whether it is necessary to complete quantitative impairment assessments. The Company evaluates the recoverability of goodwill in accordance with Accounting Standard Codification (“ASC”) Topic 350, “Intangibles - Goodwill and Other,” annually, or more frequently if an event occurs or circumstances change in the interim that would more likely than not reduce the fair value of the asset below its carrying amount.
Intangible assets acquired are recognized at their fair value at the date of acquisition. Finite-lived intangibles are amortized over their applicable useful lives. We monitor conditions related to these assets to determine whether events and circumstances warrant a revision to the remaining amortization or depreciation period. We test these assets for potential impairment annually and whenever management concludes events or changes in circumstances indicate that the carrying amount may not be recoverable.
The Company tests goodwill for impairment at the reporting unit level on an annual basis (in the fourth quarter for the Company). The Company also reviews goodwill for impairment whenever events or changes in circumstances indicate the carrying value of an asset may not be recoverable. These events or circumstances could include a significant change in the business climate, legal factors, operating performance indicators, competition, or disposition or relocation of a significant portion of a reporting unit.
During fiscal year 2022, we revised our European reporting units due to the acquisition of ETANCO and changes to the management, product distribution and operations structure of our legacy European operations. Subsequent to this change, all European reporting units, including the S&P Clever reporting unit, but excluding ETANCO, were consolidated for reporting purposes into one overall Europe reporting unit. ETANCO will remain its own reporting unit until its integrated into our other European operations, and there are sufficient economic similarities between the ETANCO and the European reporting units. A qualitative assessment was performed immediately preceding the reporting unit change and determined that it was not more likely than not that any impairment existed prior to the reporting unit change. For the Company’s remaining reporting units, the reporting unit level is generally one level below the operating segment, which is at the country level, except for the United States and Australia.
During the annual impairment assessment performed in fourth quarter of 2021, we performed a quantitative impairment test over all reporting units. During the fourth quarter of 2022, we completed our annual impairment assessment by performing a qualitative assessment. For this qualitative assessment, we assessed various assumptions, events and circumstances that would have affected the estimated fair value of the reporting units as compared to their quantitative fair value measurement determined in the fourth quarter of 2021. Based on the qualitative assessment performed, the Company concluded that there was no evidence of events or circumstances that would indicate a material change from the Company’s prior year quantitative assessment by reporting unit and therefore, it was more likely than not that the estimated fair value of reporting units exceeded their respective carrying values.
The 2022 and 2021 annual testing of goodwill and intangible assets for impairment did not result in impairment charges.
Revenue from Contracts with Customers
The Company recognizes revenue when it satisfies a performance obligation by transferring control over a product to a customer at a point in time. The Company's general shipping terms are Incoterm C.P.T. (F.O.B. shipping point), where the title, and risk and rewards of ownership transfer at the point when the products are no longer on the Company's premises. Other Incoterms are allowed as exceptions depending on the product or service being sold and the nature of the sale. The Company recognizes revenue based on the consideration specified in the invoice with a customer, excluding any sales incentives, discounts, and amounts collected on behalf of third parties (i.e., governmental tax authorities).
Volume rebates, discounts and rights of return are accounted for as variable considerations because the transaction price is either uncertain until the customer completes or fails the specified volumes or returned product are not returned by the return period. The Company estimates allowances based on historical experience from prior periods and the customer’s historical purchasing pattern. These estimates are deducted from revenues and are reevaluated periodically during the reporting period.
Effect of New Accounting Standards
See "Note 1 — Recently Adopted Accounting Standards" and "Note 1 — Recently Issued Accounting Standards Not Yet Adopted" to the Company’s consolidated financial statements.
Liquidity and Capital Resources
On March 30, 2022, the Company entered into an Amended and Restated Credit Agreement. The Amended and Restated Credit Agreement provides for a 5-year revolving credit facility of $450.0 million, which includes a letter of credit-sub-facility up to $50.0 million, and for a 5-year term loan facility of $450.0 million. The Company borrowed $250.0 million, under the revolving credit facility and $450.0 million under the term loan facility to finance a portion of the purchase price of the Company’s acquisition of ETANCO. The outstanding balances as of December 31, 2022, were $150.0 million and $433.2 million on the Revolving Credit Facility and Term Loans, respectively.
Our principal uses of capital include the costs and expenses associated with our operations, including financing working capital requirements and continuing our capital allocation strategy, which includes supporting capital expenditures, paying cash dividends, repurchasing the Company's common stock, and financing other investment opportunities over the next twelve months. We believe that our cash position, cash flows from operating activities and our expectation of continuing availability to draw upon our credit facilities are sufficient to meet our cash flow needs for the foreseeable future.
The Company has certain contractual obligations, primarily debt interest, operating leases and purchase obligations, which include annual facility fees. Refer to "Note 11 - Leases" (Part II, Item 8), "Note 14 - Debt" and "Note 15 - Commitment and Contingencies" for details related to the Company's obligations and debt annual facility fees. The Company did not have any significant off-balance sheet commitments as of December 31, 2022.
As of December 31, 2022, our cash and cash equivalents consisted of deposits and money market funds held with established national financial institutions, and includes $77.9 million held in the local currencies of our foreign operations and could be subject to additional taxation if repatriated to the U.S. The Company is maintaining a permanent reinvestment assertion on its foreign earnings relative to remaining cash held outside the United States.
The following table presents selected financial information as of December 31, 2022, 2021 and 2020, respectively:
| | | | | | | | | | | | | | | | | | | | |
| | As of December 31, |
| (in thousands) | | 2022 | | 2021 | | 2020 |
| | | | | | |
| Cash and cash equivalents | | $ | 300,742 | | | $ | 301,155 | | | $ | 274,639 | |
| Property, plant and equipment, net | | 361,555 | | | 259,869 | | | 255,184 | |
| Equity investment, goodwill and intangible assets | | 863,841 | | | 170,309 | | | 162,644 | |
| Working capital | | 529,945 | | | 453,078 | | | 559,078 | |
The following table presents the significant categories of cash flows for the twelve months ended December 31, 2022, 2021 and 2020, respectively:
| | | | | | | | | | | | | | | | | | | | |
| | Years Ended December 31, |
| (in thousands) | | 2022 | | 2021 | | 2020 |
| Net cash provided by (used in): | | | | | | |
| Operating activities | | $ | 399,821 | | | $ | 151,295 | | | $ | 207,572 | |
| Investing activities | | (870,244) | | | (58,805) | | | (39,853) | |
| Financing activities | | 465,526 | | | (71,616) | | | (126,777) | |
Cash flows from operating activities result primarily from our earnings, and are also affected by changes in operating assets and liabilities which consist primarily of working capital balances. Our revenues are derived from manufacturing and sales of building construction materials. Our operating cash flows are subject to seasonality and are cyclically associated with the volume and timing of construction project starts. For example, trade accounts receivable is generally at its lowest at the end of the fourth quarter and increases during the first, second and third quarters.
In 2022, operating activities provided $399.8 million in cash and cash equivalents as a result of $334.0 million from net income and $83.8 million from non-cash adjustments to net income which includes depreciation and amortization, stock-based compensation and non-recurring inventory fair-value adjustments from the acquisition of ETANCO, partially offset by a decrease of $18.0 million for the net change in operating assets and liabilities.
Cash used in investing activities of $870.2 million during the year ended December 31, 2022, was mostly for the $805.4 million acquisition of ETANCO net of cash acquired, coupled with capital spending of $62.4 million, which was primarily used for machinery and equipment purchases and facility expansion projects. Based on current information and subject to future events and circumstances, capital expenditures are estimated to be in the range of $90.0 million to $95.0 million for 2023 including the expected spend of $22.0 million to $25.0 million on our previously announced Columbus, Ohio facility expansion, with the balance of that project to be spent in 2024. Our growth investments will be primarily focused on purchases of new equipment to support increased productivity and efficiencies, enhancements to our existing facilities to expand our manufacturing footprint in-line with increasing customer needs, as well as investments for adjacencies and key growth initiatives.
Cash provided by financing activities of $465.5 million during the year ended December 31, 2022, consisted primarily of $583.2 million in loan proceeds (net of principal payments) used for the acquisition of ETANCO, offset by $78.6 million for the repurchase of the Company’s common stock and $43.9 million used to pay cash dividends. During 2022, we purchased, received and retired 811,330 shares of the Company’s common stock on the open market at an average price of $96.91 per share, for a total of $78.6 million under a previously announced $100.0 million share repurchase authorization (which expired at the end of 2022).
On December 15, 2022, the Board authorized the Company to repurchase up to $100.0 million of the Company's common stock, effective January 1, 2023 through December 31, 2023. Further, on January 24, 2023, the Company's Board of Directors (the "Board") declared a quarterly cash dividend of $0.26 per share payable on April 27, 2023 to stockholders of record on April 6, 2023, and estimated to be $11.1 million in total.
For the fiscal year ended December 31, 2022, the Company returned $122.5 million to the Company's stockholders, which represents 36.2% of our free cash flow from operations during the same period. Since the beginning of 2019 to the fiscal year ended December 31, 2022, we have returned $405.9 million to stockholders, which represents 51.9% of our free cash flow and
over the same period the Company has repurchased over 3.1 million shares of the Company's common stock, which represents approximately 6.8% of the outstanding shares of the Company's common stock.
Cash flows from operating activities years ended December 31, 2021 and 2020 are incorporated by reference to Form 10-K 2021 filing.
Contingencies
From time to time, we are subject to various claims, lawsuits, legal proceedings (including litigation, arbitration or regulatory actions) and other matters arising in the ordinary course of business. Periodically, we evaluate the status of each matter and assess our potential financial exposure.
The Company records a liability when we believe that it is both probable that a loss has been incurred, and the amount is reasonably estimable. Significant judgment is required to determine both probability of a loss and the estimated amount. The outcomes of claims, lawsuits, legal proceedings and other matters brought against the Company are subject to significant uncertainty, some of which are inherently unpredictable and/or beyond our control. Therefore, although management considers the likelihood of such an outcome to be remote, if one or more of these matters were resolved against the Company for amounts in excess of management’s expectations, they could have a material adverse impact on our business, results of operations, financial position and liquidity.
See “Item 3 — Legal Proceedings” above and “Note 15 — Commitments and Contingencies” to the Company’s consolidated financial statements.
Inflation and Raw Materials
Inflation rates increased significantly during fiscal year 2022, which have negatively affected material costs as well as labor costs and other costs of doing business, and as such may adversely affect our operating profits if we cannot recover the higher costs through price increases. Our main raw material is steel, and as such, increases in steel prices may adversely affect our gross margin if we cannot recover the higher costs through price increases. See “Item 1 — Raw Materials” and “Item 1A — Risk Factors.”
Indemnification
In the normal course of business, to facilitate transactions of services and products, we have agreed to indemnify certain parties with respect to certain matters. These agreements may limit the time within which an indemnification claim can be made and the amount of the claim. In addition, we have entered into indemnification agreements with our officers and directors, and the Company’s bylaws as permitted by the Company’s certificate of incorporation require the Company to indemnify corporate servants, including our officers and directors, to the fullest extent permitted by law. The Company maintains directors and officers liability insurance coverage to reduce its exposure to such obligations. The Company has not incurred significant obligations under indemnification provisions historically, and does not expect to incur significant obligations in the future. It is not possible to determine the maximum potential amount under these indemnities due to the limited history of prior indemnification claims and the unique facts and circumstances involved in each particular agreement. Accordingly, the Company has not recorded any liability for costs related to these indemnities through December 31, 2022.
Item 7A. Quantitative and Qualitative Disclosures About Market Risk
We have operations both within the U.S. and internationally, and we are exposed to market risks in the ordinary course of our business, including changes to foreign currency exchange rates and interest rates and fluctuations in commodity prices.
Foreign Exchange Risk
We have foreign exchange rate risk in our international operations, and through purchases from foreign vendors. Changes in the values of currencies of foreign countries affect our financial position, income statement and cash flows when translated into U.S. Dollars. We estimate that if the exchange rate were to change by 10% in any one country where we have our operations, the change in net income would not be material to our operations taken as a whole.
We may manage our exposure to transactional exposures by entering into foreign currency forward contracts for forecasted transactions and projected cash flows for foreign currencies in future periods. In 2021 and 2022, we entered into financial
contracts at various times to hedge the risk of fluctuations associated with the Euro and the Chinese Yuan. Refer to “Note 9 — Derivative Instruments” to the Company’s consolidated financial statements.
Foreign currency translation adjustments on our underlying assets and liabilities resulted in an accumulated other comprehensive loss of $20.7 million for the year ended December 31, 2022, due to the effects of the strengthening United States Dollar in relation to almost all other countries, The loss was offset by $32.3 million in accumulated other comprehensive gains from foreign currency forward contracts. Refer to “Note 5 — Stockholders Equity” to the Company’s consolidated financial statements.
Interest Rate Risk
Our primary exposure to interest rate risk results from outstanding borrowings under the Amended and Restated Credit Agreement, which bears interest at variable rates. As of December 31, 2022, the outstanding debt under the Amended and Restated Credit Agreement subject to interest rate fluctuations was $583.2 million. The variable interest rates on the Credit Agreement fluctuate and expose us to short-term changes in market interest rates as our interest obligation on this instrument is based on prevailing market interest rates. Interest rates fluctuate as a result of many factors, including governmental monetary and tax policies, domestic and international economic and political considerations and other factors that are beyond our control.
We have entered into an interest rate swap agreement to convert the variable interest rate on our revolver and term loan to fixed interest rates. The objective of the interest rate swap agreement is to eliminate the variability of the interest payment cash flows associated with the variable interest rate outstanding under the borrowings. We designated the interest rate swaps as cash flow hedges. Refer to Note 9, "Derivatives Instruments" to the Company’s consolidated financial statements, for further information on our interest rate swap contracts in effect as of December 31, 2022.
Commodity Price Risk
In the normal course of business, we are exposed to market risk related to our purchase of steel, a significant raw material upon which our manufacturing depends. Steel cost started decreasing at the end of 2022 relative to the significant increases experienced in 2021 and 2020 due to the worldwide raw material shortage stemming from the COVID-19 pandemic. While steel is typically available from numerous suppliers, the price of steel is a commodity subject to fluctuations that apply across broad spectrums of the steel market. We do not use any derivative or hedging instruments to manage steel price risk. If the price of steel increases, our variable costs would also increase. While historically we have successfully mitigated these increased costs through the implementation of price increases, in the future we may not be able to successfully mitigate these costs, which could cause our operating margins to decline.
Item 8. Consolidated Financial Statements and Supplementary Data.
SIMPSON MANUFACTURING CO., INC.
INDEX TO CONSOLIDATED FINANCIAL STATEMENTS
| | | | | |
| Consolidated financial statements | |
| |
| |
| |
| |
| |
| |
| |
| Financial Statement Schedule | |
| |
REPORT OF INDEPENDENT REGISTERED PUBLIC ACCOUNTING FIRM
Board of Directors and Shareholders
Simpson Manufacturing Co., Inc.
Opinion on the financial statements
We have audited the accompanying consolidated balance sheets of Simpson Manufacturing Co., Inc., (a Delaware corporation) and subsidiaries (the “Company”) as of December 31, 2022 and 2021, the related consolidated statements of operations, stockholders’ equity, and cash flows for each of the three years in the period ended December 31, 2022, and the related notes and financial statement schedule (collectively referred to as the “financial statements”). In our opinion, the financial statements present fairly, in all material respects, the financial position of the Company as of December 31, 2022 and 2021, and the results of its operations and its cash flows for each of the three years in the period ended December 31, 2022, in conformity with accounting principles generally accepted in the United States of America.
We also have audited, in accordance with the standards of the Public Company Accounting Oversight Board (United States) (“PCAOB”), the Company’s internal control over financial reporting as of December 31, 2022, based on criteria established in the 2013 Internal Control—Integrated Framework issued by the Committee of Sponsoring Organizations of the Treadway Commission (“COSO”), and our report dated February 28, 2023 expressed an unqualified opinion.
Basis for opinion
These financial statements are the responsibility of the Company’s management. Our responsibility is to express an opinion on the Company’s financial statements based on our audits. We are a public accounting firm registered with the PCAOB and are required to be independent with respect to the Company in accordance with the U.S. federal securities laws and the applicable rules and regulations of the Securities and Exchange Commission and the PCAOB.
We conducted our audits in accordance with the standards of the PCAOB. Those standards require that we plan and perform the audit to obtain reasonable assurance about whether the financial statements are free of material misstatement, whether due to error or fraud. Our audits included performing procedures to assess the risks of material misstatement of the financial statements, whether due to error or fraud, and performing procedures that respond to those risks. Such procedures included examining, on a test basis, evidence regarding the amounts and disclosures in the financial statements. Our audits also included evaluating the accounting principles used and significant estimates made by management, as well as evaluating the overall presentation of the financial statements. We believe that our audits provide a reasonable basis for our opinion.
Critical audit matter
The critical audit matter communicated below is a matter arising from the current period audit of the financial statements that was communicated or required to be communicated to the audit committee and that: (1) relates to accounts or disclosures that are material to the financial statements and (2) involved our especially challenging, subjective, or complex judgments. The communication of critical audit matters does not alter in any way our opinion on the financial statements, taken as a whole, and we are not, by communicating the critical audit matter below, providing a separate opinion on the critical audit matter or on the accounts or disclosures to which it relates.
Valuation of acquired customer relationships intangible asset – ETANCO acquisition
As described further in Note 3 to the financial statements, the Company completed the acquisition of Fixco Invest S.A.S (“ETANCO”) for $805.4 million in cash consideration, which resulted in $225.0 million of customer relationships being recorded. The transaction was accounted for as a business combination using the acquisition method of accounting. We identified the valuation of the acquired customer relationships intangible asset as a critical audit matter.
The principal considerations for our determination that the Company’s assessment of the fair value of the customer relationships intangible asset represents a critical audit matter are that the judgments and key assumptions made in assessing the fair value of customer relationships are complex and subjective, resulting in estimation uncertainty. The significant assumptions utilized to determine the fair value included prospective financial information, long-term growth, discount and customer attrition rates. Auditor subjectivity and effort was required to evaluate management’s judgments and assumptions.
Our audit procedures related to the valuation of the customer relationships intangible asset included the following, among others.
•We inspected the purchase agreement and evaluated management’s process for identifying and estimating the fair value of the customer relationships intangible asset.
•We obtained an understanding, evaluated the design and tested the operating effectiveness of the Company's controls over its valuation of the customer relationships intangible asset and the determination of the significant assumptions.
•We evaluated the Company's selection of the valuation methodology and the significant assumptions for reasonableness. Evaluating the reasonableness of the significant assumptions involved consideration of industry data, historical results and evidence obtained in other areas of the audit.
•We evaluated the qualifications of the external third-party valuation specialist engaged by management in the fair value determination.
/s/ Grant Thornton LLP
We have served as the Company’s auditor since 2015.
San Francisco, California
February 28, 2023
REPORT OF INDEPENDENT REGISTERED PUBLIC ACCOUNTING FIRM
Board of Directors and Stockholders
Simpson Manufacturing Co., Inc.
Opinion on internal control over financial reporting
We have audited the internal control over financial reporting of Simpson Manufacturing Co., Inc. (a Delaware corporation) and subsidiaries (the “Company”) as of December 31, 2022, based on criteria established in the 2013 Internal Control—Integrated Framework issued by the Committee of Sponsoring Organizations of the Treadway Commission (“COSO”). In our opinion, the Company maintained, in all material respects, effective internal control over financial reporting as of December 31, 2022, based on criteria established in the 2013 Internal Control—Integrated Framework issued by COSO.
We also have audited, in accordance with the standards of the Public Company Accounting Oversight Board (United States) (“PCAOB”), the consolidated financial statements of the Company as of and for the year ended December 31, 2022, and our report dated February 28, 2023 expressed an unqualified opinion on those financial statements.
Basis for opinion
The Company’s management is responsible for maintaining effective internal control over financial reporting and for its assessment of the effectiveness of internal control over financial reporting, included in the accompanying Management’s Report on Internal Control over Financial Reporting (“Management’s Report”). Our responsibility is to express an opinion on the Company’s internal control over financial reporting based on our audit. We are a public accounting firm registered with the PCAOB and are required to be independent with respect to the Company in accordance with the U.S. federal securities laws and the applicable rules and regulations of the Securities and Exchange Commission and the PCAOB.
We conducted our audit in accordance with the standards of the PCAOB. Those standards require that we plan and perform the audit to obtain reasonable assurance about whether effective internal control over financial reporting was maintained in all material respects. Our audit included obtaining an understanding of internal control over financial reporting, assessing the risk that a material weakness exists, testing and evaluating the design and operating effectiveness of internal control based on the assessed risk, and performing such other procedures as we considered necessary in the circumstances. We believe that our audit provides a reasonable basis for our opinion.
Our audit of, and opinion on, the Company’s internal control over financial reporting does not include the internal control over financial reporting of FIXCO Invest S.A.S. (“ETANCO”), a wholly owned subsidiary, whose financial statements reflect total assets and revenues constituting 26 percent and 10 percent, respectively, of the related consolidated financial statement amounts as of and for the year ended December 31, 2022. As indicated in Management’s Report, ETANCO was acquired during 2022. Management’s assertion on the effectiveness of the Company’s internal control over financial reporting excluded internal control over financial reporting of ETANCO.
Definition and limitations of internal control over financial reporting
A company’s internal control over financial reporting is a process designed to provide reasonable assurance regarding the reliability of financial reporting and the preparation of financial statements for external purposes in accordance with generally accepted accounting principles. A company’s internal control over financial reporting includes those policies and procedures that (1) pertain to the maintenance of records that, in reasonable detail, accurately and fairly reflect the transactions and dispositions of the assets of the company; (2) provide reasonable assurance that transactions are recorded as necessary to permit preparation of financial statements in accordance with generally accepted accounting principles, and that receipts and expenditures of the company are being made only in accordance with authorizations of management and directors of the company; and (3) provide reasonable assurance regarding prevention or timely detection of unauthorized acquisition, use, or disposition of the company’s assets that could have a material effect on the financial statements.
Because of its inherent limitations, internal control over financial reporting may not prevent or detect misstatements. Also, projections of any evaluation of effectiveness to future periods are subject to the risk that controls may become inadequate because of changes in conditions, or that the degree of compliance with the policies or procedures may deteriorate.
/s/ Grant Thornton LLP
San Francisco, California
February 28, 2023
Simpson Manufacturing Co., Inc. and Subsidiaries
Consolidated Balance Sheets
(In thousands, except per share data)
| | | | | | | | | | | |
| | December 31, |
| | 2022 | | 2021 |
| ASSETS | | | |
| Current assets | | | |
| Cash and cash equivalents | $ | 300,742 | | | $ | 301,155 | |
| Trade accounts receivable, net | 269,124 | | | 231,021 | |
| Inventories | 556,801 | | | 443,756 | |
| Other current assets | 52,583 | | | 22,903 | |
| Total current assets | 1,179,250 | | | 998,835 | |
| Property, plant and equipment, net | 361,555 | | | 259,869 | |
| Operating lease right-of-use assets | 57,652 | | | 45,438 | |
| Goodwill | 495,672 | | | 134,022 | |
| | | |
| Intangible assets, net | 362,917 | | | 26,269 | |
| Other noncurrent assets | 46,925 | | | 19,692 | |
| Total assets | $ | 2,503,971 | | | $ | 1,484,125 | |
| LIABILITIES AND STOCKHOLDERS’ EQUITY | | | |
| Current liabilities | | | |
| | | |
| Trade accounts payable | $ | 97,841 | | | $ | 57,215 | |
| Accrued liabilities and other current liabilities | 228,222 | | | 187,387 | |
| Long-term debt, current portion | 22,500 | | | — | |
| Total current liabilities | 348,563 | | | 244,602 | |
| Long-term debt, net of current portion and issuance costs | 554,539 | | | — | |
| Operating lease liabilities | 46,882 | | | 37,091 | |
| | | |
| Deferred income tax and other long-term liabilities | 140,608 | | | 18,434 | |
| Total liabilities | 1,090,592 | | | 300,127 | |
| Commitments and contingencies (see Note 15) | | | |
| Stockholders’ equity | | | |
| | | |
| Common stock, par value $0.01; authorized shares, 160,000; issued and outstanding shares, 42,560 and 43,217 at December 31, 2022 and 2021, respectively | 425 | | | 432 | |
| Additional paid-in capital | 298,983 | | | 294,330 | |
| Retained earnings | 1,118,030 | | | 906,841 | |
| | | |
| Accumulated other comprehensive loss | (4,059) | | | (17,605) | |
| Total stockholders’ equity | 1,413,379 | | | 1,183,998 | |
| Total liabilities and stockholders’ equity | $ | 2,503,971 | | | $ | 1,484,125 | |
The accompanying notes are an integral part of these consolidated financial statements
44
Simpson Manufacturing Co., Inc. and Subsidiaries
Consolidated Statements of Operations
(In thousands, except per share data)
| | | | | | | | | | | | | | | | | |
| | Years Ended December 31, |
| | 2022 | | 2021 | | 2020 |
| Net sales | $ | 2,116,087 | | | $ | 1,573,217 | | | $ | 1,267,945 | |
| Cost of sales | 1,174,794 | | | 818,187 | | | 691,561 | |
| Gross profit | 941,293 | | | 755,030 | | | 576,384 | |
| Operating expenses: | | | | | |
| Research and development and other engineering | 68,354 | | | 59,381 | | | 50,807 | |
| Selling | 169,378 | | | 135,004 | | | 112,517 | |
| General and administrative | 228,468 | | | 193,176 | | | 161,029 | |
| Total operating expenses | 466,200 | | | 387,561 | | | 324,353 | |
| Acquisition and integration related costs | 17,343 | | | — | | | — | |
Net gain on disposal of assets | (1,317) | | | (324) | | | (332) | |
| Income from operations | $ | 459,067 | | | $ | 367,793 | | | $ | 252,363 | |
| Interest expense, net and other | (7,594) | | | (1,386) | | | (2,012) | |
| Other & foreign exchange loss, net | (3,408) | | | (7,858) | | | (787) | |
| Income before taxes | 448,065 | | | 358,549 | | | 249,564 | |
| Provision for income taxes | 114,070 | | | 92,102 | | | 62,564 | |
| Net income | $ | 333,995 | | | $ | 266,447 | | | $ | 187,000 | |
| Other comprehensive income | | | | | |
| Translation adjustment | (20,733) | | | (7,313) | | | 14,172 | |
| Unamortized pension adjustments, net of tax | 2,065 | | | 404 | | | (161) | |
Cash flow hedge adjustment, net of tax | 32,214 | | | (268) | | | 390 | |
| Comprehensive income | $ | 347,541 | | | $ | 259,270 | | | $ | 201,401 | |
| Net income per common share: | | | | | |
| Basic | $ | 7.78 | | | $ | 6.15 | | | $ | 4.28 | |
| Diluted | $ | 7.76 | | | $ | 6.12 | | | $ | 4.27 | |
| Weighted average number of shares of common stock outstanding | | | | | |
| Basic | 42,925 | | | 43,325 | | | 43,709 | |
| Diluted | 43,047 | | | 43,532 | | | 43,841 | |
| | | | | |
The accompanying notes are an integral part of these consolidated financial statements
45
Simpson Manufacturing Co., Inc. and Subsidiaries
Consolidated Statements of Stockholders’ Equity
For the years ended December 31, 2020, 2021 and 2022
(In thousands, except per share data) | | | | | | | | | | | | | | | | | | | | | | | |
| | | Additional
Paid-in
Capital | | Accumulated
Other
Comprehensive
Income (Loss) | | |
| | Common Stock | Retained
Earnings | Treasury
Stock | |
| | Shares | Par Value | Total |
| Balance as of January 1, 2020 | 44,209 | | $ | 442 | | $ | 280,216 | | $ | 645,507 | | $ | (24,829) | | $ | (9,379) | | $ | 891,957 | |
| Net income | — | — | — | 187,000 | | — | — | 187,000 | |
| Translation adjustment, net of tax | — | — | — | — | 14,172 | | — | 14,172 | |
| Pension adjustment, net of tax | — | — | — | — | (161) | | — | (161) | |
| Adoption of new accounting standards | — | — | — | — | 390 | | — | 390 | |
| Stock-based compensation expense | — | — | 11,410 | | — | — | — | 11,410 | |
| Repurchase of common stock | (1,053) | | — | — | | — | — | (76,189) | | (76,189) | |
| Retirement of common stock | — | (10) | | — | (72,048) | | — | 72,058 | | — | |
| Cash dividends declared on common stock, $0.92 per share | — | — | — | (40,018) | | — | — | (40,018) | |
| Shares issued from release of restricted stock units | 166 | | 1 | | (7,960) | | — | — | — | (7,959) | |
| Common stock issued at $88.31 per share | 4 | | — | 341 | | — | — | — | 341 | |
| Balance as of December 31, 2020 | 43,326 | | 433 | | 284,007 | | 720,441 | | (10,428) | | (13,510) | | 980,943 | |
| Net income | — | | — | | — | | 266,447 | | — | | — | 266,447 | |
| Translation adjustment, net of tax | — | | — | | — | | — | | (7,313) | | — | (7,313) | |
| Pension adjustment, net of tax | — | | — | | — | | — | | 404 | | — | 404 | |
| Derivative instrument adjustment, net of tax | — | | — | | — | | — | | (268) | | — | (268) | |
| Stock-based compensation expense | — | | — | | 15,029 | | — | | — | | — | 15,029 | |
| Repurchase of common stock | (222) | | — | | — | | — | | — | | (24,125) | | (24,125) | |
| Retirement of common stock | — | | (3) | | — | | (37,632) | | — | | 37,635 | | — | |
| Cash dividends declared on common stock, $0.98 per share | — | | — | | — | | (42,415) | | — | | — | (42,415) | |
| Shares issued from release of restricted stock units | 106 | | 2 | | (5,397) | | — | | — | | — | (5,395) | |
| Common stock issued at $93.45 per share | 7 | | — | | 691 | | — | | — | | — | 691 | |
| Balance as of December 31, 2021 | 43,217 | | 432 | | 294,330 | | 906,841 | | (17,605) | | — | | 1,183,998 | |
| Net income | — | | — | | — | | 333,995 | | — | | | 333,995 | |
| Translation adjustment, net of tax | — | | — | | — | | — | | (20,733) | | — | | (20,733) | |
| Pension adjustment, net of tax | — | | — | | — | | — | | 2,065 | | — | | 2,065 | |
| Derivative instrument adjustments, net of tax | — | | — | | — | | — | | 32,214 | | — | | 32,214 | |
| Stock-based compensation expense | — | | — | | 12,422 | | — | | — | | — | | 12,422 | |
| Repurchase of common stock | (811) | | — | | — | | — | | — | | (78,622) | | (78,622) | |
| Retirement of common stock | — | | (8) | | — | | (78,614) | | — | | 78,622 | | — | |
| Cash dividends declared on common stock, $1.03 per share | — | | — | | — | | (44,192) | | — | | — | | (44,192) | |
| Shares issued from release of restricted stock units | 138 | | 1 | | (9,553) | | — | | — | | — | | (9,552) | |
| Common stock issued at $110.13 per share | 16 | | — | | 1,784 | | — | | — | | — | | 1,784 | |
| Balance at December 31, 2022 | 42,560 | | $ | 425 | | $ | 298,983 | | $ | 1,118,030 | | $ | (4,059) | | $ | — | | $ | 1,413,379 | |
— The accompanying notes are an integral part of these consolidated financial statements
46
Simpson Manufacturing Co., Inc. and Subsidiaries
Consolidated Statements of Cash Flows
(In thousands) | | | | | | | | | | | | | | | | | |
| | Years Ended December 31, |
| | 2022 | | 2021 | | 2020 |
| Cash flows from operating activities | | | | | |
| Net income | $ | 333,995 | | | $ | 266,447 | | | $ | 187,000 | |
| Adjustments to reconcile net income to net cash provided by operating activities: | | | | | |
| Gain on sale of assets and other | (1,317) | | | (160) | | | (332) | |
| Depreciation and amortization | 60,890 | | | 42,477 | | | 38,767 | |
| Noncash lease expense | 11,327 | | | 9,562 | | | 6,984 | |
| | | | | |
| | | | | |
| | | | | |
| Inventory step-up expense | 13,572 | | | — | | | — | |
| Loss (income) in equity method investment, before tax | (914) | | | 2,276 | | | 14 | |
| Deferred income taxes | (13,156) | | | (915) | | | 3,179 | |
| Noncash compensation related to stock plans | 14,980 | | | 17,715 | | | 13,507 | |
| Provision for (benefit from ) doubtful accounts | 1,146 | | | 393 | | | (98) | |
| Deferred hedge gain | (2,690) | | | — | | | — | |
| Changes in operating assets and liabilities, (net of amounts acquired from ETANCO see Note 3) | | | | | |
| Trade accounts receivable | 19,763 | | | (67,993) | | | (22,107) | |
| Inventories | (28,421) | | | (164,202) | | | (27,219) | |
| Other current assets | (6,107) | | | (1,951) | | | (845) | |
| | | | | |
| Trade accounts payable | (4,016) | | | 10,235 | | | 11,360 | |
| Accrued liabilities and other current liabilities | 20,394 | | | 50,548 | | | 7,754 | |
| Other noncurrent assets and liabilities | (19,625) | | | (13,137) | | | (10,392) | |
| | | | | |
| | | | | |
| | | | | |
| | | | | |
| | | | | |
| Net cash provided by operating activities | 399,821 | | | 151,295 | | | 207,572 | |
| Cash flows from investing activities | | | | | |
| Capital expenditures | (62,362) | | | (43,738) | | | (32,579) | |
| Acquisitions, net of cash acquired (See Note 3) | (805,904) | | | (218) | | | (2,797) | |
| Purchases of intangible assets | (4,861) | | | (5,856) | | | (5,330) | |
| Purchases of Equity investments | (3,178) | | | (9,829) | | | — | |
| | | | | |
| Termination forward contracts | 3,535 | | | — | | | — | |
| Proceeds from sale of property and equipment | 2,526 | | | 836 | | | 853 | |
| | | | | |
| Net cash used in investing activities | (870,244) | | | (58,805) | | | (39,853) | |
| Cash flows from financing activities | | | | | |
| Proceeds from lines of credit | 717,268 | | | 16,752 | | | 169,164 | |
| Repayments of line of credit and capital leases | (134,120) | | | (16,408) | | | (170,680) | |
| Termination of cash flow hedge | 21,252 | | | — | | | — | |
| Debt issuance costs | (6,804) | | | (819) | | | (712) | |
| | | | | |
| Repurchase of common stock | (78,622) | | | (24,125) | | | (76,189) | |
| | | | | |
| Dividends paid | (43,895) | | | (41,619) | | | (40,400) | |
| Cash paid on behalf of employees for shares withheld | (9,553) | | | (5,397) | | | (7,960) | |
| Net cash provided by (used in) financing activities | 465,526 | | | (71,616) | | | (126,777) | |
| Effect of exchange rate changes on cash | 4,484 | | | 5,642 | | | 3,487 | |
| Net increase (decrease) in cash and cash equivalents | (413) | | | 26,516 | | | 44,429 | |
| Cash and cash equivalents at beginning of year | 301,155 | | | 274,639 | | | 230,210 | |
| Cash and cash equivalents at end of year | $ | 300,742 | | | $ | 301,155 | | | $ | 274,639 | |
| | | | | |
| Supplemental Disclosure of Cash Flow Information |
| Cash paid during the year for | | | | | |
| Interest | $ | 17,028 | | | $ | 1,597 | | | $ | 1,598 | |
| Income taxes | 113,208 | | | 83,662 | | | 63,035 | |
| Noncash activity during the year for | | | | | |
| Noncash capital expenditures | $ | 1,671 | | | $ | 99 | | | $ | 3,719 | |
| | | | | |
| | | | | |
| Contingent consideration for intangible acquisition | 6,500 | | | — | | | 547 | |
| Issuance of Company’s common stock for compensation | 960 | | | 691 | | | 341 | |
| Dividends declared but not paid | 11,223 | | | 10,806 | | | 9,999 | |
The accompanying notes are an integral part of these consolidated financial statements
47
Simpson Manufacturing Co., Inc. and Subsidiaries
Notes to Consolidated Financial Statements
1.Operations and Summary of Significant Accounting Policies
Nature of Operations
Simpson Manufacturing Co., Inc., through Simpson Strong-Tie Company Inc. and its other subsidiaries (collectively, the “Company”), focuses on designing, manufacturing, and marketing systems and products to make buildings and structures safe and secure. The Company designs, engineers and is a leading manufacturer of wood construction products, including connectors, truss plates, fastening systems, fasteners and shearwalls, and concrete construction products, including adhesives, specialty chemicals, mechanical anchors, powder actuated tools and fiber reinforcing materials. The Company markets its products to the residential construction, industrial, commercial and infrastructure construction, remodeling and do-it-yourself markets.
The Company operates exclusively in the building products industry. The Company’s products are sold primarily in the U.S., Canada, Europe and Pacific Rim. A significant portion of the Company’s business is dependent on economic activity within the North America segment. The Company's business is also dependent on the availability of steel, its primary raw material.
Principles of Consolidation
The accompanying consolidated financial statements include the accounts of Simpson Manufacturing Co., Inc. and its subsidiaries. Investments in 50% or less owned entities are accounted for using either cost or the equity method. All significant intercompany transactions have been eliminated.
Use of Estimates
The preparation of the consolidated financial statements in conformity with accounting principles generally accepted in the United States of America ("GAAP") requires management to make estimates and assumptions that affect the reported amounts of assets and liabilities and disclosure of contingent assets and liabilities at the date of the consolidated financial statements and the reported amounts of revenues and expenses during the reporting period. Management believes that these consolidated financial statements include all normal and recurring adjustments necessary for a fair presentation under GAAP.
Cash Equivalents
The Company classifies investments that are highly liquid and have maturities of three months or less at the date of purchase as cash equivalents. As of December 31, 2022, and 2021, the value of these investments was $125.1 million and $26.4 million, respectively, consisting of U.S. Treasury securities and money market funds. The value of the investments is based on cost, which approximates fair value based on Level 1 inputs.
Current Estimated Credit Loss - Allowance for doubtful accounts
The Company maintains an allowance for doubtful accounts receivable for estimated future expected credit losses resulting from customers' failure to make payments on its accounts receivable. The Company determines the estimate of the allowance for doubtful accounts receivable by considering several factors, including (1) specific information on the financial condition and the current creditworthiness of customers, (2) credit rating, (3) payment history and historical experience, (4) aging of the accounts receivable, and (5) reasonable and supportable forecasts about collectability. The Company also reserves 100% of the amounts deemed uncollectible due to a customer's deteriorating financial condition or bankruptcy.
Every quarter, the Company evaluates the customer group using the accounts receivable aging report and its best judgment when considering changes in customers' credit ratings, level of delinquency, customers' historical payments and loss experience, current market and economic conditions, and expectations of future market and economic conditions.
The changes in the allowance for doubtful accounts receivable for the year ended December 31, 2022 are outlined in the table below:
| | | | | | | | | | | | | | |
| Balance
as of | | | Balance
as of |
| (in thousands) | December 31, 2021 | Expense (Deductions), net | Write-Offs1 | December 31, 2022 |
| | | | |
| Allowance for Doubtful Accounts | $ | 1,933 | | $ | 1,663 | | $ | 356 | | $ | 3,240 | |
1Amount is net of recoveries and the effect of foreign currency fluctuations for the year ended December 31, 2022
Concentration of Credit Risk
Financial instruments that potentially subject the Company to concentrations of credit risk consist of cash in banks, short-term investments in money market funds and trade accounts receivable. The Company maintains its cash on demand deposit and in money market accounts held in 31 banks, and at times these cash and investments may be in excess of amounts insured by the Federal Deposit Insurance Corporation (FDIC). However, we have not experienced any losses on these accounts.
Inventory Valuation
Inventories are stated at the lower of cost or net realizable value. Cost includes all costs incurred in bringing each product to its present location and condition, as follows:
•Raw materials and purchased finished goods for resale — principally valued at a cost determined on a weighted average basis; and
•In-process products and finished goods — the cost of direct materials and labor plus attributable overhead based on a normal level of activity.
The Company applies net realizable value and makes estimates for obsolescence to the gross value of the inventory. Estimated net realizable value is based on estimated selling price less further costs to completion and disposal. The Company impairs slow-moving products by comparing inventories on hand to projected demand. If the on-hand supply of a product exceeds projected demand or if the Company believes the product is no longer marketable, the product is considered obsolete inventory. The Company revalues obsolete inventory to its net realizable value and has consistently applied this methodology. When impairments are established, a new cost basis for the inventory is created. An unexpected change in market demand, building codes or buyer preferences could reduce the rate of inventory turnover and require the recognition of more obsolete inventory.
Other Current Assets
Other current assets, which are less than 5% of current assets, consist primarily of prepaid expenses, derivative assets-current, and other miscellaneous assets.
Warranties and recalls
The Company provides product warranties for specific product lines and records estimated expenses in the period in which the recall occurs, none of which has been material to the consolidated financial statements. In a limited number of circumstances, the Company may also agree to indemnify customers against legal claims made against those customers by the end users of the Company’s products. Historically, payments made by the Company, if any, under such agreements have not had a material effect on its consolidated statement of operations, cash flows or financial position.
Equity Investments
The Company accounts for investments and ownership interests under equity method accounting when it has the ability to exercise significant influence but does not have a controlling financial interest. The Company records its interest in the net earnings of its equity method investees, along with adjustments for unrealized profits or losses within earnings or loss from equity interests in the consolidated statement of operations. The investment is reviewed for impairment whenever factors indicate the carrying amount might not be recoverable and the decrease in value, if any, is recognized in the period the impairment occurs in the consolidated statement of operations.
Fair Value of Financial Instruments
Fair value is an exit price, representing the amount that would be received to sell an asset or paid to transfer a liability in an orderly transaction between market participants. As such, fair value is a market-based measurement that is determined based on assumptions that market participants would use in pricing an asset or a liability. Assets and liabilities recorded at fair value are measured and classified under a three-tier fair valuation hierarchy based on the observability of the inputs available in the market: Level 1 inputs are quoted prices (unadjusted) in active markets for identical assets or liabilities; Level 2 inputs are quoted prices for similar assets and liabilities in active markets or inputs that are observable for the asset or liability, either directly or indirectly through market corroboration, for substantially the full term of the financial instrument; and Level 3 inputs are unobservable inputs based on the Company’s assumptions used to measure assets and liabilities at fair value. The fair value hierarchy requires an entity to maximize the use of observable inputs and minimize the use of unobservable inputs when measuring fair value. The carrying amounts of trade accounts receivable, accounts payable, accrued liabilities and other current liabilities approximate fair value due to the short-term nature of these instruments. The fair values of the interest rate and foreign currency contracts are classified as Level 2 within the fair value hierarchy. The fair values of the Company’s contingent consideration related to acquisitions and equity investments are classified as Level 3 within the fair value hierarchy, as these amounts are based on unobserved inputs such as management estimates and entity-specific assumptions and are evaluated on an
ongoing basis.
The following tables summarize the financial assets and financial liabilities measured at fair value for the Company as of December 31, 2022 and 2021:
| | | | | | | | | | | | | | | | | |
| | 2022 | | 2021 |
(in millions) | Level 1 | Level 2 | Level 3 | | Level 1 |
Cash equivalents (1) | $ | 125.1 | | $ | — | | $ | — | | | $ | 26.4 | |
Term loan due 2027 (2) | — | | 433.1 | | — | | | — | |
Revolver due 2027 (2) | — | | 150.0 | | — | | | — | |
Derivative instruments - assets (3) | — | | 43.9 | | — | | | — | |
Derivative instruments - liabilities (3) | — | | 8.0 | | — | | | — | |
| Contingent considerations | — | | — | | 6.5 | | | — | |
(1) The carrying amounts of cash equivalents, representing government and other money market funds traded in an active market with relatively short maturities, are reported on the consolidated balance sheet as of December 31, 2022 and 2021 as a component of "Cash and cash equivalents".
(2) The carrying amounts of our term loan and revolver approximate fair value as of December 31, 2022 based upon their terms and conditions as disclosed in Note 14 in comparison to debt instruments with similar terms and conditions available on the same date.
(3) Derivatives for interest rate, foreign exchange and forward swap contracts are discussed in Note 9.
Derivative Instruments
The Company uses derivative instruments as a risk management tool to mitigate the potential impact of certain market risks. Foreign currency and interest rate risk are the primary market risks the Company manages through the use of derivative instruments, which are accounted for as cash flow hedges or net investment hedges under the accounting standards and carried at fair value as other current or noncurrent assets or as other current or other long-term liabilities in the consolidated balance sheets. Assets and liabilities with the legal right of offset are not offset in the consolidated balance sheets. Net deferred gains and losses related to changes in fair value of cash flow hedges are included in accumulated other comprehensive income/loss ("OCI"), a component of stockholders' equity in the consolidated balance sheets; and are reclassified into the line item in the consolidated statement of operations in which the hedged items are recorded in the same period the hedged item affects earnings. The effective portion of gains and losses attributable to net investment hedges is recorded net of tax to OCI to offset the change in the carrying value of the net investment being hedged. Recognition in earnings of amounts previously recorded to OCI are limited to circumstances such as complete or substantially complete liquidation of the net investment in the hedged
foreign operation. Changes in fair value of any derivatives that are determined to be ineffective are immediately reclassified from OCI into earnings.
Business Combinations and Asset Acquisitions
Business combinations are accounted for under the acquisition method in accordance with ASC 805, Business Combinations. The acquisition method requires identifiable assets acquired and liabilities assumed and any noncontrolling interest in the business acquired be recognized and measured at fair value on the acquisition date, which is the date that the acquirer obtains control of the acquired business. The amount by which the fair value of consideration transferred as the purchase price exceeds the net fair value of assets acquired and liabilities assumed is recorded as goodwill.
Acquisitions that do not meet the definition of a business under the ASC are accounted for as an acquisition of assets, whereby all of the cost of the individual assets acquired and liabilities assumed, including certain transactions costs, are allocated on a relative fair value basis. Accordingly, goodwill is never recognized in an asset acquisition.
Property, Plant and Equipment
Property, plant and equipment are carried at cost. Major renewals and betterments are capitalized while maintenance and repairs are expensed as incurred. When assets are sold or retired, their costs and accumulated depreciation are removed from the accounts, and the resulting gains or losses are reflected in the consolidated statements of operations.
The “Intangibles—Goodwill and Other” topic of the FASB ASC provides guidance on capitalization of the costs incurred for computer software developed or obtained for internal use. The Company capitalizes qualified external costs and internal costs related to the purchase and implementation of software projects used for business operations and engineering design activities. Capitalized software costs primarily include purchased software, internal costs and external consulting fees. Capitalized software projects are amortized over the estimated useful lives of the software.
Depreciation and Amortization
Software, including amounts capitalized for internally developed software is amortized on a straight-line basis over an estimated useful life of three to five years. Machinery and equipment is depreciated using accelerated methods over an estimated useful life of three to ten years. Buildings and site improvements are depreciated using the straight-line method over their estimated useful lives, which range from 15 to 45 years. Leasehold improvements are amortized using the straight-line method over the shorter of the expected life or the remaining term of the lease. Purchased intangible assets with finite useful lives are amortized using the straight-line method over the estimated useful lives of the assets. The weighted-average amortization period for all amortizable intangibles on a combined basis is 9.1 years.
Preferred Stock
The Company’s Board of Directors has the authority to issue authorized and unissued preferred stock in one or more series with such designations, rights and preferences as may be determined from time to time by the Board of Directors. Accordingly, the Board of Directors is empowered, without stockholder approval, to issue preferred stock with dividend, redemption, liquidation, conversion, voting or other rights that could adversely affect the voting power or other rights of the holders of the Company’s common stock.
Common Stock
Subject to the rights of holders of any preferred stock that may be issued in the future, holders of common stock are entitled to receive dividends, if any, as may be declared from time to time by the Board of Directors out of legally available funds, and in the event of liquidation, dissolution or winding-up of the Company, to share ratably in all assets available for distribution. The holders of common stock have no preemptive or conversion rights. Subject to the rights of any preferred stock that may be issued in the future, the holders of common stock are entitled to one vote per share on any matter submitted to a vote of the stockholders. A director in an uncontested election is elected if the votes cast “for” such director’s election exceed the votes cast “against” such director’s election, except that, if a stockholder properly nominates a candidate for election to the Board of Directors, the candidates with the highest number of affirmative votes (up to the number of directors to be elected) are elected. There are no redemption or sinking fund provisions applicable to common stock.
Comprehensive Income or Loss
Comprehensive income is defined as net income plus other comprehensive income or loss. Other comprehensive income or loss consists of changes in cumulative translation adjustments, changes in unamortized pension adjustments and changes in the fair value of derivative instruments classified as cash flow hedge instruments, all of which are recorded directly in accumulated other comprehensive income within stockholders’ equity.
Foreign Currency Translation
The local currency is the functional currency for all of the Company’s operations in Europe, Canada, Asia, Australia and New Zealand. Assets and liabilities denominated in foreign currencies are translated using the exchange rate on the balance sheet date. Revenues and expenses are translated using average exchange rates prevailing during the year. The translation adjustment resulting from this process is shown separately as a component of stockholders’ equity. Foreign currency transaction gains or losses are presented below operating income.
Revenue Recognition
Generally, the Company's revenue contract with a customer exists when (1) the goods are shipped, services are rendered, and the related invoice is generated, (2) the duration of the contract does not extend beyond the promised goods or services already transferred and (3) the transaction price of each distinct promised product or service specified in the invoice is based on its relative stated standalone selling price. The Company recognizes revenue when it satisfies a performance obligation by transferring control of a product to a customer at a point in time. Our shipping terms provide the primary indicator of the transfer of control. The Company's general shipping terms are Incoterm C.P.T. (F.O.B. shipping point), where the title, and risk and rewards of ownership transfer at the point when the products are no longer on the Company's premises. Other Incoterms are allowed as exceptions depending on the product or service being sold and the nature of the sale. The Company recognizes revenue based on the consideration specified in the invoice with a customer, excluding any sales incentives, discounts, and amounts collected on behalf of third parties (i.e., governmental tax authorities). Based on historical experience with the customer, the customer's purchasing pattern, and its significant experience selling products, the Company concluded that a significant reversal in the cumulative amount of revenue recognized would not occur when the uncertainty (if any) is resolved (that is, when the total amount of purchases is known). Refer to Note 2 for additional information.
The Company presents taxes collected and remitted to governmental authorities on a net basis in the consolidated statements of operations.
Cost of Sales
Cost of sales includes material, labor, factory and tooling overhead, shipping, and freight costs. Major components of these expenses are steel and other materials, packaging and cartons, personnel costs, and facility costs, such as rent, depreciation and utilities, related to the production and distribution of the Company’s products. Inbound freight charges, purchasing and receiving costs, inspection costs, warehousing costs, internal transfer costs, and other costs of the Company’s distribution network are also included in cost of sales.
Tool and Die Costs
Tool and die costs are included in product costs in the year incurred.
Product and Software Research and Development Costs
Product research and development costs, which are included in operating expenses and are charged against income as incurred, were $15.7 million, $12.3 million and $10.1 million in 2022, 2021 and 2020, respectively. Product research and development expenses include all related personnel costs including salary, benefits, retirement, stock-based compensation costs, as well as computer and software costs, professional fees, supplies, tools and maintenance costs. In 2022, 2021 and 2020, the Company incurred software development expenses related to its ongoing expansion into the plated truss market and some of the software development costs were capitalized. See "Note 8 — Property, Plant and Equipment." The Company amortizes acquired patents over their remaining lives and performs periodic reviews for impairment. The cost of internally developed patents is expensed as incurred.
Selling Costs
Selling costs include expenses associated with selling, merchandising and marketing the Company’s products. Major components of these expenses are personnel, sales commissions, facility costs such as rent, depreciation and utilities, professional services, information technology costs, sales promotion, advertising, literature and trade shows.
Advertising Costs
Advertising costs are included in selling expenses and were $12.6 million, $8.4 million and $8.2 million in 2022, 2021, and 2020, respectively.
General and Administrative Costs
General and administrative costs include personnel, information technology related costs, facility costs such as rent, depreciation and utilities, professional services, amortization of intangibles and bad debt charges.
Accounting for Leases
The Company has operating and finance leases for certain facilities, equipment, autos and data centers. As an accounting policy for short-term leases, the Company elected to not recognize a right-of-use asset ("ROU asset") and liability if, at the commencement date, the lease (1) has a term of 12 months or less and (2) does not include renewal and purchase options that the Company is reasonably certain to exercise. Monthly payments on short-term leases are recognized on a straight-line basis over the full lease term.
Accounting for Stock-Based Compensation
The Company recognizes stock-based compensation expense related to the estimated fair value of restricted stock awards on a straight-line basis, net of estimated forfeitures, over the requisite service period of the awards, which is generally the vesting term of three or four years. Stock-based compensation related to performance share grants are measured based on grant date fair value and expensed on a graded basis over the service period of the awards, which is generally a performance period of three years. The performance conditions are based on the Company's achievement of revenue growth and return on invested capital over the performance period and are evaluated for the probability of vesting at the end of each reporting period with changes in expected results recognized as an adjustment to expense. The assumptions used to calculate the fair value of restricted stock grants are evaluated and revised, as necessary, to reflect market conditions and the Company’s experience.
Income Taxes
Income taxes are calculated using an asset and liability approach. The provision for income taxes includes federal, state and foreign taxes currently payable, and deferred taxes due to temporary differences between the financial statement and tax bases of assets and liabilities. In addition, future tax benefits are recognized to the extent that realization of such benefits is more likely than not. This method gives consideration to the future tax consequences of the deferred income tax items and immediately recognizes changes in income tax laws in the year of enactment.
Net Income per Share
Basic net income per common share is computed based on the weighted average number of common shares outstanding. Potentially dilutive shares are included in the diluted per-share calculations using the treasury stock method for all periods when the effect of their inclusion is dilutive.
Accounting Standards Not Yet Adopted
Newly issued and effective accounting standards during 2022 were determined to be not relevant or material to the Company.
2.Revenue from Contracts with Customers
Disaggregated revenue
The Company disaggregates net sales into the following major product groups as described in its segment information included in these financial statements under Note 19.
Wood Construction Products Revenue. Wood construction products represented approximately 87%, 87%, and 85% of total net sales in the years ended December 31, 2022, 2021, and 2020 respectively.
Concrete Construction Products Revenue. Concrete construction products represented approximately 13%, 13%, and 15% of total net sales in the years ended December 31, 2022, 2021 and 2020, respectively.
Customer acceptance criteria. Generally, there are no customer acceptance criteria included in the Company’s standard sales agreement with customers. When an arrangement with the customer does not meet the criteria to be accounted for as a revenue contract under the standard, the Company recognizes revenue in the amount of nonrefundable consideration received when the Company has transferred control of the goods or services and has stopped transferring (and has no obligation to transfer) additional goods or services. The Company offers certain customers discounts for paying invoices ahead of the due date, which are generally 30 to 60 days after the issue date.
Other revenue. Service sales, representing after-market repair and maintenance, engineering activities and software license sales and services were less than 0.1% of net sales for 2022, 2021 and 2020 and recognized as the services are completed or by transferring control over a product to a customer at a point in time. Services may be sold separately or in bundled packages. The typical contract length for services is generally less than one year. For bundled packages, the Company accounts for individual services separately when they are distinct within the context of the contract. A distinct service is separately identifiable from other items in the bundled package if a customer can benefit from it on its own or with other resources that are readily available to the customer. The consideration (including any discounts) is allocated between separate services in a bundle based on their stand-alone selling prices. The stand-alone selling prices are determined based on the prices at which the Company separately sells the services.
Reconciliation of contract balances
Contract assets are the right to receive consideration in exchange for goods or services that the Company has transferred to a customer when that right is conditional on something other than the passage of time. Contract liabilities are recorded for any services billed to customers and not yet recognizable if the contract period has commenced or for the amount collected from customers in advance of the contract period commencing. As of December 31, 2022 and 2021, the Company had no material contract assets or contract liabilities from contracts with customers.
Other accounting considerations
Volume discounts. Volume discounts are accounted for as variable consideration because the transaction price is uncertain until the customer completes or fails to purchase the specified volume of purchases (consideration is contingent on a future outcome - occurrence or nonoccurrence). In addition, the Company applies the volume rebate or discount retrospectively, because the final price of each product or services sold depends on the customer's total purchases subject to the rebate program. Estimated rebates are deducted from revenues based on the gross transaction price and historical experience with the customer.
Rights of return and other allowances. Rights of return create variability in the transaction price. The Company accounts for returned product during the return period as a refund to customer and not a performance obligation. The estimated allowance for returns is based on historical percentage of returns and allowance from prior periods and the customer's historical purchasing pattern. This estimate is deducted from revenues based on the gross transaction price.
Principal versus Agent. The Company considered the principal versus agent guidance of the new revenue recognition standard and concluded that the Company is the principal in a third-party transaction. The Company manufactures its products and has control over the transfer of its products to Dealer Distributors, Contract Distributors, and end customers.
Costs to obtain or fulfill a contract. Costs incurred to obtain a contract are immaterial. Commission cost is not an incremental cost directly related to obtaining a contract.
Shipping costs. The Company recognizes shipping and handling activities that occur after the customer has obtained control of goods as a fulfillment cost rather than as an additional promised service. Therefore, the Company recognizes revenue and accrues shipping and handling costs when the control of goods transfers to the customer upon shipment.
Advertising costs. Cooperative advertising and partnership discounts are consideration payable to a customer and not payment in exchange for a distinct product or service at fair value. Estimated cooperative advertising and partnership discounts are reductions of the transaction price.
3. Acquisition
On April 1, 2022, the Company completed its acquisition of 100% of the outstanding equity interest of FIXCO Invest S.A.S. (together with its subsidiaries, "ETANCO") for total purchase consideration of $805.4 million, net of cash acquired (the "Acquisition"). The Acquisition was completed pursuant to the securities purchase agreement dated January 26, 2022, as amended (the “SPA”), by and among the Company, Fastco Investment, Fastco Financing, LRLUX and certain other security holders. The purchase price for the Acquisition was paid using cash on hand and borrowings in the amount of $250.0 million under the revolving credit facility and $450.0 million under the term loan facility. See Note 14 for further information on the Amended and Restated Credit Facility.
ETANCO is a manufacturer and distributor of fastener and fixing products headquartered in France and its primary product applications directly align with the addressable markets in which the Company operates. The Acquisition will allow the Company to enter into new commercial building markets such as façades, waterproofing, safety and solar, as well as grow its share of direct business sales in Europe.
ETANCO’s results of operations were included in the Company's consolidated financial statements from the April 1, 2022 acquisition date, and as such, only includes ETANCO's results of operations for the nine months ending December 31, 2022. ETANCO had net sales of $212.6 million and a net loss of $5.9 million for the nine months ended December 31, 2022, which includes costs related to fair-value adjustments for acquired inventory, amortization of acquired intangible assets, and expenses incurred for integration.
Purchase price allocation
The Acquisition was accounted for using the acquisition method of accounting in accordance with Accounting Standards Codification 805, Business Combinations (“ASC 805”) which requires, among other things, assets acquired and liabilities assumed in a business combination be recorded at fair value as of the acquisition date with limited exceptions.
The allocation of the $824.4 million purchase price, including cash, to the estimated fair values of the tangible and intangible assets acquired and liabilities assumed is as follows:
| | | | | | | | | | |
| (in thousands) | | | Amount | |
| Cash and cash equivalents | | | $ | 19,010 | | |
| Trade accounts receivable, net | | | 63,607 | | |
| Inventory | | | 107,185 | | |
| Other current assets | | | 4,491 | | |
| Property and equipment, net | | | 89,695 | | |
| Operating lease right-of-use assets | | | 5,361 | | |
| Goodwill | | | 365,591 | | |
| Intangible assets, net | | | 357,327 | | |
| Other noncurrent assets | | | 2,881 | | |
| Total assets | | | 1,015,148 | | |
| Trade accounts payable | | | 46,457 | | |
| Accrued liabilities and other current liabilities | | | 22,079 | | |
| Operating lease liabilities | | | 5,176 | | |
| Deferred income tax and other long-term liabilities | | | 117,031 | | |
| Total purchase price | | | $ | 824,405 | | |
Trade accounts receivable, net
The gross amount of trade receivables acquired was approximately $67.4 million, of which $63.6 million is estimated to be recoverable based on ETANCO's historical trend for collections.
Inventory
Acquired inventory primarily consists of raw materials and finished goods consisting of building and construction materials products. The Company adjusted acquired finished goods higher by $14.3 million to estimated fair value based on expected selling prices less a reasonable amount for selling efforts. The fair value adjustment was fully recognized as a component of cost of sales over the inventory’s estimated turnover period during the nine months ended December 31, 2022.
Property and equipment, net
Acquired property and equipment includes land of $16.1 million, buildings and site improvements of $32.5 million, and machinery, equipment, and software of $41.1 million. The estimated fair value of property and equipment was determined primarily using market and/or or cost approach methodologies. The acquired fair value for buildings and site improvements will depreciate on a straight-line basis over the estimated useful lives of the assets for a period of up to sixteen years, and machinery, equipment and software will depreciate on an accelerated basis over an estimated useful life of three to ten years. Depreciation expense associated with the acquired property and equipment amounted to $5.4 million for the nine months ended December 31, 2022.
Goodwill
The excess of purchase price over the net assets acquired is recognized as goodwill and relates to the value that is expected from the acquired assembled workforce as well as the increased scale and synergies resulting from the integration of both businesses. The goodwill recognized from the Acquisition is not deductible for local income tax purposes. Goodwill has been allocated to components within the ETANCO reporting unit.
Intangible assets, net
The estimated fair value of intangible assets acquired was determined primarily using income approach methodologies. The preliminary values allocated to intangible assets and the useful lives are as follows:
| | | | | | | | | | |
| (in thousands except useful lives) | | | Weighted-average useful life (in years) | Amount |
| Customer relationships | | | 15 | $ | 248,398 | |
| Trade names | | | Indefinite | 93,811 | |
| Developed technology | | | 10 | 11,256 | |
| Patents | | | 8 | 3,862 | |
| | | | $ | 357,327 | |
The acquired definite-lived intangible assets will be amortized on a straight-line basis over estimated useful lives, which approximates the pattern in which these assets are utilized. The Company recognized $13.0 million of amortization expense on these assets during the nine months ended December 31, 2022.
Deferred taxes
As a result of the increase in fair value of inventory, property and equipment, and intangible assets, deferred tax liabilities of $105.9 million were recognized, primarily due to intangible assets.
Acquisition and integration related costs
During the twelve months ended December 31, 2022, and December 31, 2021, the Company incurred acquisition and/or integration related expenses of $17.3 million, and $2.3 million, respectively. The fiscal 2022 amounts have been included in acquisition and integration related costs in the Company’s income from operations, while the 2021 amounts were included in
interest expense, net and other. These acquisition and integration related costs consisted of investment banking, legal, accounting, advisory, and consulting fees.
Unaudited pro forma results
The following unaudited pro forma combined financial information presents estimated results as if the Company acquired ETANCO on January 1, 2021. The unaudited pro forma financial information as presented below is for informational purposes only and does not purport to actually represent what the Company’s combined results of operations would have been had the Acquisition occurred on January 1, 2021, or what those results will be for any future periods.
The following unaudited pro forma consolidated financial information has been prepared using the acquisition method of accounting in accordance with U.S. GAAP:
| | | | | | | | |
| Years Ended December 31, |
| (in thousands) | 2022 | 2021 |
| | |
| Net sales | $ | 2,195,271 | | $ | 1,884,654 | |
| Net income | $ | 363,527 | | $ | 261,389 | |
| | |
| Pro forma earnings per common share: | | |
| Basic | $ | 8.47 | | $ | 6.03 | |
| Diluted | $ | 8.44 | | $ | 6.00 | |
| | |
| Weighted average shares outstanding: | | |
| Basic | 42,925 | | 43,325 | |
| Diluted | 43,047 | | 43,532 | |
| | |
The unaudited pro forma results above includes the following non-recurring charges to net income:
1) Acquisition and integration related costs of $17.3 million which were incurred during the twelve months ended December 31, 2022 were adjusted as if such costs were incurred during the twelve months ended December 31, 2021.
2) The $14.3 million amortization related to the fair value adjustment for inventory and recognized during the twelve months ended December 31, 2022, were adjusted as if incurred during the twelve months ended December 31, 2021.
3) Net income for ETANCO includes adjustments of $0.4 million and $3.2 million to conform ETANCO’s historical financial results prepared under French GAAP to U.S. GAAP for the twelve months ended December 31, 2022, and December 31, 2021, respectively. The U.S. GAAP adjustments are primarily related to share-based payments expense on awards that were settled prior to the Acquisition, and costs incurred and capitalized by ETANCO on its historical acquisitions.
4. Net Income per Share
The following shows a reconciliation of basic earnings per share (“EPS”) to diluted EPS:
| | | | | | | | | | | | | | | | | |
| | For the Year Ended December 31, |
(in thousands, except per-share amounts) | 2022 | | 2021 | | 2020 |
| Net income available to common stockholders | $ | 333,995 | | | $ | 266,447 | | | $ | 187,000 | |
| | | | | |
| Basic weighted average shares outstanding | 42,925 | | | 43,325 | | | 43,709 | |
| Dilutive effect of potential common stock equivalents | 122 | | | 207 | | | 132 | |
| Diluted weighted average shares outstanding | 43,047 | | | 43,532 | | | 43,841 | |
| Net earnings per share: | | | | | |
| Basic | $ | 7.78 | | | $ | 6.15 | | | $ | 4.28 | |
| Diluted | $ | 7.76 | | | $ | 6.12 | | | $ | 4.27 | |
5. Stockholders' Equity
Stock Repurchases
For the fiscal year ended December 31, 2022, the Company repurchased 811,330 shares of the Company’s common stock in the open market at an average price of $96.91 per share, for a total of $78.6 million under the previously announced $100.0 million share repurchase authorization (which expired at the end of 2022). On December 15, 2022, the Company’s Board of Directors authorized the Company to repurchase up to $100.0 million of the Company’s common stock from January 1, 2023 through December 31, 2023.
As of December 31, 2022, the Company retired a total of 811,330 of its common stock and therefore had zero shares of its common stock as treasury shares.
Comprehensive Income or Loss
The following shows the components of accumulated other comprehensive income or loss as of December 31, 2022, 2021, and 2020 respectively:
| | | | | | | | | | | | | | | | | | |
| Foreign Currency Translation | Pension Benefit | | Cash Flow Hedge | Forward Foreign Currency | Total |
| (in thousands) | |
| Balance as of January 1, 2020 | $ | (22,080) | | $ | (2,749) | | | $ | — | | $ | — | | $ | (24,829) | |
| Other comprehensive gain/(loss), net of tax effect | 14,172 | | (161) | | | — | | 390 | | 14,401 | |
| Balance as of December 31, 2020 | (7,908) | | (2,910) | | | — | | 390 | | (10,428) | |
| Other comprehensive gain/(loss), net of tax effect | (7,313) | | 404 | | | — | | 204 | | (6,705) | |
| Amounts reclassified from accumulative other comprehensive income, net of $0 tax | — | | — | | | — | | (472) | | (472) | |
| Balance at December 31, 2021 | (15,221) | | (2,506) | | | — | | 122 | | (17,605) | |
| Other comprehensive gain/(loss), net of tax effect | (20,942) | | 2,065 | | | 42,740 | | 11,898 | | 35,761 | |
| Amounts reclassified from accumulative other comprehensive income, net of $0 tax | 209 | | — | | | (18,987) | | (3,437) | | (22,215) | |
| Balance at December 31, 2022 | $ | (35,954) | | $ | (441) | | | $ | 23,753 | | $ | 8,583 | | $ | (4,059) | |
6. Stock-Based Compensation
The Company currently maintains the Simpson Manufacturing Co., Inc. Amended and Restated 2011 Incentive Plan (the “2011 Plan”) as its only equity incentive plan. Under the 2011 Plan, no more than 16.3 million shares of the Company’s common stock in aggregate may be issued, including shares already issued pursuant to prior awards granted under the 2011 Plan. Shares of common stock underlying awards to be issued pursuant to the 2011 Plan are registered under the Securities Act. Under the 2011 Plan, the Company may grant restricted stock and restricted stock units. The Company currently intends to award only performance-based stock units ("PSUs") and/or time-based restricted stock units ("RSUs").
The following table shows the Company’s stock-based compensation activity:
| | | | | | | | | | | | | | | | | |
| | Fiscal Years Ended December 31, |
(in thousands) | 2022 | | 2021 | | 2020 |
| Stock-based compensation expense recognized | $ | 12,503 | | | $ | 15,036 | | | $ | 11,384 | |
| Tax benefit of stock-based compensation expense in provision for income taxes | 3,133 | | | 3,787 | | | 2,859 | |
| Stock-based compensation expense, net of tax | $ | 9,370 | | | $ | 11,249 | | | $ | 8,525 | |
| Fair value of shares vested | $ | 25,565 | | | $ | 15,701 | | | $ | 21,921 | |
The Company allocates stock-based compensation expense amongst cost of sales, research and development and other engineering expense, selling expense, or general and administrative expense based on the job functions performed by the employees to whom the stock-based compensation is awarded. Stock-based compensation capitalized in inventory was immaterial for all periods presented.
The following table summarizes the Company’s unvested restricted stock unit activity for the year ended December 31, 2022:
| | | | | | | | | | | | | | | | | |
| Shares
(in thousands) | | Weighted-
Average
Price | | Aggregate
Intrinsic
Value *
(in thousands) |
| Unvested Restricted Stock Units (RSUs) | | |
| Outstanding as of January 1, 2022 | 344 | | | $ | 81.33 | | | $ | 47,721 | |
| Awarded | 186 | | | 119.60 | | | |
| Vested | (219) | | | 65.45 | | | |
| Forfeited | (9) | | | 99.29 | | | |
| Outstanding as of December 31, 2022 | 302 | | | $ | 102.10 | | | $ | 26,745 | |
| Outstanding and expected to vest at December 31, 2022 | 351 | | | $ | 97.86 | | | $ | 31,107 | |
* The intrinsic value for outstanding and expected to vest is calculated using the closing price per share of $88.66, as reported by the New York Stock Exchange on December 31, 2022.
During the year ended December 31, 2022, the Company granted 180 thousand RSUs and PSUs to the Company’s employees, including officers at an estimated weighted average fair value of $120.09 per share, based on the closing price (adjusted for certain market factors primarily the present value of dividends) of the Company’s common stock on the grant date. The RSUs and PSUs granted to the Company’s employees may be time-based, performance-based or time- and performance-based. Certain of the PSUs are granted to officers and key employees, where the number of performance-based awards to be issued is based on the achievement of certain Company performance criteria established in the award agreement over a cumulative three years period. These awards cliff vest after three years. In addition, these same officers and key employees also receive time-based RSUs, which vest pursuant to a three-year graded vesting schedule. Time- and performance based RSUs granted to the Company’s employees excluding officers and certain key employees, vest ratably over the four year life of the award and through 2019, required the underlying shares of the Company's common stock to be subject to a performance-based adjustment during the first year and starting in 2020, were time-based awards which vest ratable over the four-year life of the award.
The Company’s seven non-employee directors are entitled to receive approximately $704 thousand in equity compensation annually. The number of shares ultimately granted is based on the average closing share price for the Company over the 60 days period prior to approval of the award in the second quarter of each year. In May and June 2022, the Company granted 6 thousand shares of the Company's common stock to the non-employee directors, based on the average closing price of $105.50 per share and recognized total expense of $655 thousand.
The total intrinsic value of RSUs and PSUs vested during the years ended December 31, 2022, 2021 and 2020 was $25.6 million, $15.7 million and $21.9 million, respectively, based on the market value on the vest date.
As of December 31, 2022, the Company’s aggregate unamortized stock compensation expense was approximately $16.1 million, which is expected to be recognized over a weighted-average period of approximately 2.1 years.
Stock Bonus Plan
The Company also maintains the Simpson Manufacturing Co., Inc. 1994 Employee Stock Bonus Plan (the “Stock Bonus Plan”), whereby it awards shares of the Company’s common stock to employees, who do not otherwise participate in any of the Company’s equity-based incentive plans and meet minimum service requirements. Shares have generally been awarded under the Stock Bonus Plan following the year in which the respective employee reached his or her tenth, twentieth, thirtieth, fortieth or fiftieth anniversary of employment with the Company or any direct or indirect subsidiary thereof.
The Company awarded shares for service through 2022, 2021, and 2020 as shown below:
| | | | | | | | | | | |
| December 31, |
| 2022 | 2021 | 2020 |
| Shares issued | 9,300 | | 6,900 | | 7,400 | |
| Shares settled with cash (foreign employees) | 7,400 | | 6,500 | | 5,200 | |
| Total award | 16,700 | | 13,400 | | 12,600 | |
As a result, we recorded pre-tax compensation charges of $1.5 million, $1.7 million, and $1.2 million for years ended December 31, 2022, 2021, and 2020, respectively. These charges include cash bonuses to compensate employees for income taxes payable as a result of the stock bonuses.
7. Trade Accounts Receivable, net
Trade accounts receivable consisted of the following:
| | | | | | | | | | | |
| | As of December 31, |
(in thousands) | 2022 | | 2021 |
| Trade accounts receivable | $ | 276,229 | | | $ | 237,312 | |
| Allowance for doubtful accounts | (3,240) | | | (1,932) | |
| Allowance for sales discounts | (3,865) | | | (4,359) | |
| | $ | 269,124 | | | $ | 231,021 | |
8. Inventories
The components of inventories are as follows:
| | | | | | | | | | | |
| | As of December 31, |
(in thousands) | 2022 | | 2021 |
| Raw materials | $ | 187,149 | | | $ | 191,174 | |
| In-process products | 55,171 | | | 30,309 | |
| Finished products | 314,481 | | | 222,273 | |
| | $ | 556,801 | | | $ | 443,756 | |
9. Derivative Instruments
The Company enters into derivative instrument agreements, including forward foreign currency exchange contracts, interest rate swaps, and cross currency swaps to manage risk in connection with changes in foreign currency and interest rates. The Company hedges committed exposures and does not engage in speculative transactions. The Company only enters into derivative instrument agreements with counterparties who have highly rated credit.
The Company produces certain of its concrete products from a wholly owned subsidiary in China, and as a result is exposed to variability in cash outflows associated with changes in the foreign exchange rate between the U.S. Dollar and the Chinese Yuan (CNY). In November 2022, the Company entered into a series of foreign currency derivative contracts that mature monthly between January 2023 and, December 2023 to buy CNY 102.4 million in the aggregate by selling a total of $14.8 million.
These forward contracts are accounted for as cash flow hedges under the accounting standards, and fair value is included in other current assets or other current liabilities, as applicable, in the consolidated balance sheet. Net deferred gains and losses on these contracts relating to changes in fair value are included in accumulated other OCI and are reclassified into cost of sales in the consolidated statements of operations in the which the hedged items are recorded in the same period the hedged item affects earnings. There were no amounts recognized for gains or losses on these contracts during the year ended December 31, 2022. Changes in fair value of any forward contracts that are determined to be ineffective are immediately reclassified from OCI into earnings. The amounts deferred in OCI are expected to be recognized as a component of cost of sales in the consolidated statements of operations during 2023 and 2024.
Beginning in March 2022, the Company entered into a forward foreign currency contract expiring in March 2029 to hedge its exposure to adverse foreign currency exchange rate movements for its operations in Europe and elected the spot method for designating this contract as a net investment hedge with the excluded forward point amortized to interest expense. During May 2022, the Company settled the March 2022 forward foreign currency contract for $3.9 million in cash, which included $0.4 million in recognized forward points, terminated the hedge accounting treatment and simultaneously entered into a new forward foreign currency contract expiring in March 2029 with the same notional amount at a new forward rate. The Company also elected the spot method for designating the May 2022 contract as a net investment hedge. The $3.5 million gain recognized on the March 2022 contract excluding recognized forward points is deferred in OCI and will remain in OCI until either the sale or substantially complete liquidation of the hedged subsidiaries.
Beginning in March 2022, the Company also converted a Euro-denominated ("EUR"), fixed rate obligation into a U.S. Dollar fixed rate obligation using a receive fixed, pay fixed cross currency swap, which was designated as a cash flow hedge. During May 2022, the Company settled the March 2022 cross currency swap for $22.4 million in cash, which was comprised of $21.3 million gain on the swap excluding accrued interest and $1.1 million of net interest income accrued according to the terms of the swap. The Company terminated the hedge accounting treatment and simultaneously entered into a new cross currency swap expiring in March 2029 with a lower notional amount for the US dollar denominated leg at a new US dollar interest rate. An amount of $28.3 million was reclassified out of OCI into earnings to offset the currency loss on the underlying security being hedged resulting in a net $7.0 million hedge accounting reserve balance within OCI, which is being amortized to interest expense in the consolidated statements of operations through the termination of the underlying hedged intercompany debt in March 2029.
In addition, the Company converted its domestic U.S. variable rate debt to fixed rate debt using a receive variable, pay fixed interest rate swap expiring March 2027. The interest rate swap contract is also designated as a cash flow hedge.
As of December 31, 2022, the aggregate notional amount of the Company's outstanding interest rate contracts, cross currency swap contracts, EUR forward contract and CNY forward contracts were $583.2 million, $454.1 million, $321.7 million and $14.8 million, respectively. As of December 31, 2021, there were no outstanding forward contracts on its Chinese Yuan denominated purchases.
Changes in fair value of any forward contracts that are determined to be ineffective are immediately reclassified from OCI into earnings. There were no amounts recognized due to ineffectiveness during the twelve months ended December 31, 2022.
The effects of fair value and cash flow hedge accounting on the consolidated statements of operations for the periods ended December 31, were as follows:
| | | | | | | | | | | | | | | | | | | | | | | | | | |
| 2022 | | 2021 |
| (in thousands) | Cost of sales | Interest expense, net | Other & foreign exchange loss, net | | Cost of sales |
| Total amounts of income and expense line items presented in the Consolidated Statements of Operations in which the effects of fair value or cash flow hedges are recorded | $ | 1,174,794 | | $ | (7,594) | | $ | (3,408) | | | $ | 818,187 | |
| The effects of fair value and cash flow hedging | | | | | |
| Gain or (loss) on cash flow hedging relationships | | | | | |
| | Interest contracts: | | | | | |
| | | Amount of gain or (loss) reclassified from OCI to earnings | | (1,012) | | | | |
| | Cross currency swap contract | | | | | |
| | | Amount of gain or (loss) reclassified from OCI to earnings | | 5,650 | | 14,349 | | | |
| | Forward contract | | | | | |
| | | Amount of gain or (loss) reclassified from OCI to earnings | 122 | | | | | 472 | |
The effects of derivative instruments on the consolidated statements of operations for the twelve months ended December 31, 2022 and December 31, 2021 were as follows:
| | | | | | | | | | | | | | | | | | | | |
| Cash Flow Hedging Relationships | Gain (Loss) Recognized in OCI | | Location of Gain (Loss) Reclassified from OCI into Earnings | Gain (Loss) Reclassified from OCI into Earnings |
| 2022 | 2021 | | | 2022 | 2021 |
| Interest rate contracts | $ | 26,830 | | $ | — | | | Interest expense | $ | (1,012) | | $ | — | |
| Cross currency contracts | 26,174 | | — | | | Interest expense | 5,650 | | — | |
| | | | FX gain (loss) | 14,349 | | — | |
| Forward contracts | 231 | | 163 | | | Cost of goods sold | — | | 472 | |
| Total | $ | 53,235 | | $ | 163 | | | | $ | 18,987 | | $ | 472 | |
For the twelve months ended December 31, 2022, gains on the net investment hedge of $13.0 million were included in OCI. For the twelve months ended December 31, 2022, gains excluded of $3.3 million, were reclassified from OCI to interest expense.
As of December 31, 2022, the aggregate fair values of the Company’s derivative instruments were comprised of assets totaling $43.9 million, and liabilities of $8.0 million on the consolidated balance sheets.
As of December 31, 2022, the Company expects it will reclassify net gains of approximately $20.2 million, currently recorded in AOCI, into interest expense in earnings within the next twelve months. However, the actual amount reclassified could vary due to future changes in the fair value of these derivatives.
10. Property, Plant and Equipment, net
Property, plant and equipment consisted of the following:
| | | | | | | | | | | |
| | December 31, |
(in thousands) | 2022 | | 2021 |
| Land | $ | 50,025 | | | $ | 28,175 | |
| Buildings and site improvements | 233,123 | | | 202,393 | |
| Leasehold improvements | 6,367 | | | 5,995 | |
| Machinery and equipment | 472,907 | | | 399,079 | |
| | 762,422 | | | 635,642 | |
| Less accumulated depreciation and amortization | (432,392) | | | (402,246) | |
| | 330,030 | | | 233,396 | |
| Capital projects in progress | 31,525 | | | 26,473 | |
| | $ | 361,555 | | | $ | 259,869 | |
Property, plant and equipment as of December 31, 2022, and 2021, includes fully depreciated assets with an original cost of $253.5 million and $234.0 million, respectively, which are still in use. The Company capitalizes certain development costs associated with internal use software, including the direct costs of services provided by third-party consultants and payroll for internal employees, both of which are performing development and implementation activities on a software project. As of December 31, 2022, and 2021, the Company had capitalized software development costs net of accumulated amortization of $33.3 million and $30.2 million, respectively, included in machinery and equipment and as of December 31, 2022, and 2021, $7.0 million and $4.8 million, respectively, was included in capital projects in progress.
Depreciation expense, including depreciation of equipment and amortization of internally developed software and software acquired through capital lease arrangements, was $43.4 million, $36.1 million, and $32.1 million for the years ended December 31, 2022, 2021 and 2020, respectively.
11. Goodwill and Intangible Assets
Goodwill
The annual changes in the carrying amount of goodwill, by segment, as of December 31, 2021 and 2022, were as follows, respectively:
| | | | | | | | | | | | | | | | | | | | | | | |
| (in thousands) | North
America | | Europe | | Asia
Pacific | | Total |
| Balance as of January 1, 2021 | $ | 96,311 | | | $ | 38,059 | | | $ | 1,474 | | | $ | 135,844 | |
| Foreign exchange | (4) | | | (1,622) | | | (90) | | | (1,716) | |
| | | | | | | |
| Reclassifications | — | | | (106) | | | — | | (106) | |
| Balance as of December 31, 2021 | 96,307 | | | 36,331 | | | 1,384 | | | 134,022 | |
| Goodwill acquired | 7,444 | | | 365,591 | | | — | | | 373,035 | |
| Foreign exchange | (179) | | | (11,123) | | | (83) | | | (11,385) | |
| | | | | | | |
| Reclassifications | — | | | — | | | — | | | — | |
| Balance as of December 31, 2022 | $ | 103,572 | | | $ | 390,799 | | | $ | 1,301 | | | $ | 495,672 | |
Goodwill Impairment Testing
The Company tests goodwill for impairment at the reporting unit level on an annual basis (in the fourth quarter). Our goodwill balance is not amortized to expense, and we may assess qualitative factors and quantitative factors to determine whether it is more likely than not that the fair value of each reporting unit is less than its carrying amount as a basis for determining whether it is necessary to complete quantitative impairment assessments
We assessed the qualitative factors related to the goodwill of the reporting units to determine whether it is necessary to perform an impairment test.
During fiscal year 2022, we revised our European reporting units due to the acquisition of ETANCO and changes to the management, product distribution and operations structure of our legacy European operations. Subsequent to this change, all European reporting units, including the S&P Clever reporting unit, but excluding ETANCO, were consolidated for reporting purposes into one overall Europe reporting unit. ETANCO will remain as its own reporting unit until it is fully integrated into our other European operations, and there are sufficient economic similarities between the ETANCO and European reporting units. A qualitative assessment was performed immediately preceding the reporting unit change and determined that it was not more likely than not that any impairment existed prior to the reporting unit change. For the Company’s remaining reporting units, the reporting unit level is generally one level below the operating segment, which is at the country level, except for the United States and Australia.
The Company determined that the U.S. reporting unit includes four components: Northwest United States, Southwest United States, Northeast United States and Southeast United States. The Australia reporting unit includes two components: Australia and New Zealand. For each of these reporting units, the Company aggregated the components because management concluded that they are economically similar and that the goodwill is recoverable from these components working in concert.
In 2021, the Company applied the ("Step 1") approach where the Company compares the fair value of the reporting unit to its carrying value. The fair value calculation uses both the income approach (discounted cash flow method) and the market approach, equally weighted. If the Company determines that the carrying value of the net assets assigned to the reporting unit, including goodwill, exceeds the fair value of the reporting unit, no further action is taken. If the Company determines that the carrying value of a reporting unit’s goodwill exceeds its implied fair value, the Company will record an impairment charge equal to the difference between the implied fair value of the goodwill and the carrying value.
In 2022, we completed our annual impairment assessment by performing a qualitative assessment. For this qualitative assessment, we assessed various assumptions, events and circumstances that would have affected the estimated fair value of the reporting units as compared to the quantitative fair value measurement determined in the fourth quarter of 2021. Based on the qualitative assessment performed, the Company concluded that there was no evidence of events or circumstances that would indicate a material change from the Company’s prior year quantitative assessment by reporting unit and therefore, it was more likely than not that the estimated fair value of reporting units exceeded their respective carrying values.
The 2022 and 2021 annual testing of goodwill for impairment did not result in impairment charges. "See Item 7 - Critical Accounting Policies and Estimates -Goodwill and Other Intangible Assets".
Amortizable Intangible Assets
Intangible assets from acquired businesses or asset purchases are recognized at their estimated fair values on the date of acquisition and consist of patents, unpatented technology, non-compete agreements, trademarks, customer relationships and other intangible assets. Finite-lived intangibles are amortized to expense over the applicable useful lives, ranging from three to twenty-one years, based on the nature of the asset and the underlying pattern of economic benefit as reflected by future net cash inflows. The Company performs an impairment test of finite-lived intangibles whenever events or changes in circumstances indicate their carrying value may be impaired.
The total gross carrying amount and accumulated amortization of definite-lived intangible assets as of December 31, 2022, was $427.0 million and $64.1 million, respectively. The aggregate amount of amortization expense of intangible assets for the years ended December 31, 2022, 2021 and 2020 was $17.4 million, $6.4 million and $6.1 million, respectively. The weighted-average remaining amortization period for all amortizable intangibles on a combined basis is 9.1 years as of December 31, 2022.
The annual changes in the carrying amounts of patents, unpatented technologies, customer relationships and non-compete agreements and other intangible assets subject to amortization for the years ended December 31, 2022 and 2021 were as follows: | | | | | | | | | | | | | | | | | |
| (in thousands) | Gross
Carrying
Amount | | Accumulated
Amortization | | Net
Carrying
Amount |
| Patents | | |
| Balance as of January 1, 2021 | $ | 4,699 | | | $ | (934) | | | $ | 3,765 | |
| Purchases | 6,074 | | | — | | | 6,074 | |
| Amortization | — | | | (428) | | | (428) | |
| | | | | |
| | | | | |
| | | | | |
| Balance as of December 31, 2021 | 10,773 | | | (1,362) | | | 9,411 | |
| Purchases | 13,775 | | | (670) | | | 13,105 | |
| Amortization | — | | | (771) | | | (771) | |
| | | | | |
| | | | | |
| | | | | |
| Foreign exchange | (376) | | | — | | | (376) | |
| Balance as of December 31, 2022 | $ | 24,172 | | | $ | (2,803) | | | $ | 21,369 | |
| | | | | | | | | | | | | | | | | |
| (in thousands) | Gross
Carrying
Amount | | Accumulated
Amortization | | Net
Carrying
Amount |
| Unpatented Technology | | |
| Balance as of January 1, 2021 | $ | 22,104 | | | $ | (16,492) | | | $ | 5,612 | |
| Amortization | — | | | (2,174) | | | (2,174) | |
| | | | | |
Reclassifications | 348 | | | — | | | 348 | |
| Foreign exchange | (49) | | | — | | | (49) | |
| | | | | |
| Balance as of December 31, 2021 | 22,403 | | | (18,666) | | | 3,737 | |
| | | | | |
| Amortization | — | | | (793) | | | (793) | |
| Reclassifications | (49) | | | — | | | (49) | |
| Foreign exchange | 56 | | | — | | | 56 | |
| | | | | |
| Balance as of December 31, 2022 | $ | 22,410 | | | $ | (19,459) | | | $ | 2,951 | |
| | | | | | | | | | | | | | | | | |
| (in thousands) | Gross
Carrying
Amount | | Accumulated
Amortization | | Net
Carrying
Amount |
Non-Compete Agreements,
Trademarks and Other | | |
| |
| Balance as of January 1, 2021 | $ | 21,582 | | | $ | (7,724) | | | $ | 13,858 | |
| | | | | |
| | | | | |
| Amortization | — | | | (2,631) | | | (2,631) | |
| Foreign exchange | (148) | | | — | | | (148) | |
| | | | | |
| | | | | |
| Balance as of December 31, 2021 | 21,434 | | | (10,355) | | | 11,079 | |
| | | | | |
| | | | | |
| Purchases of intangible assets | 6,880 | | | (5) | | | 6,875 | |
| Amortization | — | | | (2,572) | | | (2,572) | |
| | | | | |
| Reclassifications | 149 | | | — | | | 149 | |
| Foreign exchange | (162) | | | — | | | (162) | |
| | | | | |
| Balance as of December 31, 2022 | $ | 28,301 | | | $ | (12,932) | | | $ | 15,369 | |
| | | | | | | | | | | | | | | | | |
| (in thousands) | Gross
Carrying
Amount | | Accumulated
Amortization | | Net
Carrying
Amount |
| Customer Relationships | | |
| Balance as of January 1, 2021 | $ | 18,123 | | | $ | (15,175) | | | $ | 2,948 | |
| | | | | |
| Disposal | (217) | | | — | | | (217) | |
| Amortization | — | | | (1,186) | | | (1,186) | |
| | | | | |
| Foreign exchange | (117) | | | — | | | (117) | |
| | | | | |
| Balance as of December 31, 2021 | 17,789 | | | (16,361) | | | 1,428 | |
| | | | | |
| Purchases of intangible assets | 249,767 | | | (12,223) | | | 237,544 | |
| | | | | |
| Amortization | — | | | (386) | | | (386) | |
| | | | | |
| Reclassifications | (151) | | | — | | | (151) | |
| Foreign exchange | (6,946) | | | — | | | (6,946) | |
| | | | | |
| Balance as of December 31, 2022 | $ | 260,459 | | | $ | (28,970) | | | $ | 231,489 | |
As of December 31, 2022, estimated future amortization of intangible assets was as follows:
(in thousands)
| | | | | |
| 2023 | $ | 20,957 | |
| 2024 | 20,012 | |
| 2025 | 19,782 | |
| 2026 | 19,259 | |
| 2027 | 18,953 | |
| Thereafter | 172,215 | |
| $ | 271,178 | |
Indefinite-Lived Intangible Assets
Indefinite-lived intangible assets totaled $91.7 million as of December 31, 2022, including $91.1 million, net of an unfavorable foreign exchange impact of $2.7 million, attributable to trade names acquired in the ETANCO acquisition.
Definite-lived and indefinite-lived assets, net, by segment as of December 31, 2022, and 2021 were as follows:
| | | | | | | | | | | | | | | | | |
| | As of December 31, 2021 |
| | Gross
Carrying
Amount | | Accumulated
Amortization | | Net
Carrying
Amount |
| (in thousands) | | |
| Total Intangible Assets | | |
| North America | $ | 46,643 | | | $ | (26,346) | | | $ | 20,297 | |
| Europe | 26,371 | | | (20,399) | | | 5,972 | |
| Total | $ | 73,014 | | | $ | (46,745) | | | $ | 26,269 | |
| | | | | | | | | | | | | | | | | |
| | As of December 31, 2022 |
| | Gross
Carrying
Amount | | Accumulated
Amortization | | Net
Carrying
Amount |
| (in thousands) | | |
| Total Intangible Assets | | |
| North America | $ | 53,498 | | | $ | (29,782) | | | $ | 23,716 | |
| Europe | 373,538 | | | (34,337) | | | 339,201 | |
| Total | $ | 427,036 | | | $ | (64,119) | | | $ | 362,917 | |
12. Leases
The Company has operating leases for certain facilities, equipment and automobiles. The existing operating leases expire at various dates through 2027, some of which include options to extend the leases for up to five years. The Company measured the lease liability at the present value of the lease payments to be made over the lease term. The lease payments are discounted using the Company's incremental borrowing rate. The Company measured the right-of-use ("ROU") assets at the amount at which the lease liability is recognized plus initial direct costs incurred or prepayment amounts. The ROU assets are amortized on a straight-line basis over the lease term.
The following table provides a summary of leases included on the consolidated balance sheets as of December 31, 2022, and 2021, and consolidated statements of operations, and consolidated statements of cash flows for the year ended December 31, 2022 and 2021:
| | | | | | | | | | | |
| Consolidated Balance Sheets Line Item | As of December 31, |
| | 2022 | 2021 |
| (in thousands) | | | |
| Operating leases | | | |
| Assets | | | |
| Operating leases | Operating lease right-of-use assets | $ | 57,652 | | $ | 45,438 | |
| Liabilities | | | |
| Operating-current | Accrued expenses and other current liabilities | $ | 11,544 | | $ | 8,769 | |
| Operating-noncurrent | Operating lease liabilities | 46,882 | | 37,091 | |
| Total operating lease liabilities | | $ | 58,426 | | $ | 45,860 | |
| Finance leases | | | |
| Assets | | | |
| Property and equipment, gross | Property, plant and equipment, net | $ | 3,569 | | $ | 3,569 | |
| Accumulated amortization | Property, plant and equipment, net | (3,569) | | (3,416) | |
| Property and equipment, net | Property, plant and equipment, net | $ | — | | $ | 153 | |
| | | |
| | | |
| | | |
| | | |
The components of lease expense were as follows:
| | | | | | | | | | | | |
| Consolidated Statements of Operations Line Item | Years Ended
December 31, | |
| (in thousands) | | 2022 | 2021 | |
| Operating lease cost | General administrative expenses and
cost of sales | $ | 13,794 | | $ | 11,704 | | |
| Finance lease cost: | | | | |
| Amortization of right-of-use assets | General administrative expenses | $ | — | | $ | 324 | | |
| Interest on lease liabilities | Interest expense, net | — | | 2 | | |
| Total finance lease cost | | $ | — | | $ | 326 | | |
Other information
Supplemental cash flow information related to leases is as follows:
| | | | | | | | | |
| Years Ended
December 31, | |
| (in thousands) | 2022 | 2021 | |
| Cash paid for amounts included in the measurement of lease liabilities: | | | |
| Operating cash flows for operating leases | $ | 13,355 | | $ | 11,443 | | |
| Finance cash flows for finance leases | $ | — | | $ | 437 | | |
| Operating right-of-use assets obtained in exchange for new lease liabilities | | | |
| | | |
| Operating leases | $ | 19,587 | | $ | 11,530 | | |
The following is a schedule, by years, of maturities for lease liabilities as of December 31, 2022:
| | | | | |
| (in thousands) | Operating Leases |
| 2023 | $ | 14,157 | |
| 2024 | 12,291 | |
| 2025 | 10,292 | |
| 2026 | 8,192 | |
| 2027 | 6,518 | |
| Thereafter | 16,680 | |
| Total lease payments | 68,129 | |
| Less: Present value discount | (9,703) | |
| Total lease liabilities | $ | 58,426 | |
The following table summarizes the Company’s lease terms and discount rates as of December 31, 2022:
| | | | | | | | | | |
| Years Ended
December 31, | | |
| 2022 | 2021 | | |
| Weighted-average remaining lease terms (in years): | | | | |
| Operating leases | 6.10 | 6.88 | | |
| | | | |
| Weighted-average discount rate: | | | | |
| Operating leases | 4.68 | % | 5.22 | % | | |
| | | | |
13. Accrued Liabilities and Other Current Liabilities
Accrued liabilities and other current liabilities consisted of the following: | | | | | | | | | | | |
| | As of December 31, |
| (in thousands) | 2022 | | 2021 |
| Labor related liabilities | $ | 63,451 | | | $ | 46,821 | |
| Sales incentives & advertising allowances | 69,029 | | | 63,702 | |
| Accrued cash profit sharing and commissions | 22,816 | | | 24,178 | |
| Sales tax payable and other | 35,564 | | | 20,822 | |
| Dividends payable | 11,170 | | | 10,806 | |
| Accrued profit sharing trust contributions | 14,648 | | | 12,289 | |
| Operating lease - current portion | 11,544 | | | 8,769 | |
| | | |
| $ | 228,222 | | | $ | 187,387 | |
14. Debt
On March 30, 2022, the Company entered into the Amended and Restated Credit Facility, which amends and restates the Company's previous Credit Agreement, dated July 27, 2012. The Amended and Restated Credit Facility provides for a 5-year $450.0 million revolving line of credit, which includes a letter of credit-sub-facility up to $50.0 million, and a 5-year term loan facility of $450.0 million. The Company borrowed $250.0 million, under the revolving credit facility and $450.0 million under the term loan facility to finance a portion of the purchase price for the acquisition of ETANCO. In addition, the Company incurred $6.8 million of debt issuance costs, which are classified in long-term debt on the consolidating balance sheet, that have been deferred and will amortize over the 5-year terms of the Amended and Restated Credit Facility. During 2022, the Company made principal payments of $100.0 million and $16.9 million of the Company's outstanding Revolving and Term Credit Facility, respectively.
The Company is required to pay an annual revolving credit facility fee of 0.10% to 0.25% per annum on the available commitments under the terms of the Amended and Restated Revolving Credit Facility, regardless of usage, with the applicable fee determined on a quarterly basis based on the Company’s net leverage ratio. The fee is included within Interest expense, net and other in the Company's consolidated statements of operations.
Amounts borrowed under the Amended and Restated Credit Facility will bear interest from time to time at either the Base Rate, Spread Adjusted Daily Simple SOFR, Spread Adjusted Term SOFR, Adjusted Eurocurrency Rate or Daily Simple RFR, in each case, as calculated under and as in effect from time to time under the Amended and Restated Credit Facility, plus the Applicable Margin, as defined in the Amended and Restated Credit Facility. The Applicable Margin is determined based on the Company’s net leverage ratio, and ranges (i) from 0.00% to 0.75% per annum for amounts borrowed under the term loan facility that bear interest at Base Rate, (ii) from 0.75% to 1.75% per annum for amounts borrowed under the term loan facility that bear interest at Adjusted Eurocurrency Rate, Spread Adjusted Daily Simple SOFR or Spread Adjusted Term SOFR, (iii) from 0.00% to 0.50% per annum for amounts borrowed under the revolving credit facility that bear interest at Base Rate, (iv) from 0.68% to 1.53% per annum for amounts borrowed under the revolving credit facility that bear interest at Daily Simple RFR (solely to the extent denominated in pound sterling) and (v) from 0.65% to 1.50% per annum for amounts borrowed under the revolving credit facility that bear interest at Daily Simple RFR (other than loans denominated in pound sterling) or Adjusted Eurocurrency Rate. Loans outstanding under the Amended and Restated Credit Facility may be prepaid at any time without penalty except for customary breakage costs and expenses. Based on current principal payment expectations, the annual interest rate on the outstanding debt will be approximately 2.00% over the life of the debt including the effects of the interest rate swap and other derivatives noted above.
As of December 31, 2022, in addition to the Amended and Restated Credit Facility, certain of the Company’s domestic subsidiaries are guarantors for a credit agreement between certain of its foreign subsidiaries and institutional lenders. Together, all credit facilities provide the Company with a total of $304.4 million in available revolving credit lines and an irrevocable standby letter of credit in support of various insurance deductibles.
The Company has $583.2 million, excluding deferred financing costs, outstanding under the Amended and Restated Credit Facility, which is the estimated fair value as of December 31, 2022. There were no outstanding balances under the Amended and Restated Credit Facility as of December 31, 2021.
The following is a schedule, by years, of maturities for the remaining term loan facility as of December 31, 2022:
| | | | | | | |
| (in thousands) | | | 5-Year Term Loan |
| 2023 | | | 22,500 | |
| 2024 | | | 22,500 | |
| 2025 | | | 22,500 | |
| 2026 | | | 22,500 | |
| 2027 | | | 343,125 | |
| Total loan outstanding | | | $ | 433,125 | |
| | | |
The $150.0 million borrowed under the revolving credit facility is due on March 31, 2027.
The Company complied with its financial covenants under the Amended and Related Credit Facility as of December 31, 2022.
The Company incurs interest costs, which include interest net of the effect of cash flow hedges, maintenance fees and bank charges. The amount of costs incurred, capitalized, and expensed for the years ended December 31, 2022, 2021 and 2020, consisted of the following:
| | | | | | | | | | | | | | | | | |
| | Years Ended December 31, |
| (in thousands) | 2022 | | 2021 | | 2020 |
| Interest costs, including benefits from cash flow and net investment hedges | $ | 9,685 | | | $ | 1,424 | | | $ | 2,796 | |
| Less: Interest capitalized | (1,658) | | | (574) | | | (512) | |
| Interest expense, including benefits from cash flow and net investment hedges | $ | 8,027 | | | $ | 850 | | | $ | 2,284 | |
15. Commitments and Contingencies
Purchase Obligations
In addition to the debt and lease obligations described elsewhere in the footnotes, the Company has certain purchase obligations in the ordinary course of business. These purchase obligations are primarily related to the acquisition, construction or expansion of facilities and equipment, and minimum purchase quantities of certain raw materials. The Company is not a party to any long-term supply contracts with respect to the purchase of raw materials or finished goods. As of December 31, 2022, these purchase obligations were $148.2 million, of which $73.9 million is payable in 2023 and the remainder over the following three years. Debt interest obligations include annual facility fees on the Company’s primary line-of-credit facility in the amount of $42.2 million at December 31, 2022.
Employee Relations
As of December 31, 2022, approximately 9% of our employees are represented by labor unions and are covered by collective bargaining agreements in the U.S. The Company has two-facility locations with collective bargaining agreements covering tool and die craftsmen, maintenance workers, and sheet-metal workers. In Stockton, California, two union contracts will expire in September 2023 and June 2023, respectively. Also, the Company has two contracts in San Bernardino County, California that will expire in February 2025 and in June 2026, respectively. Based on current information and subject to future events and circumstances, the Company believes that, even if new agreements are not reached before the existing labor union contracts expire, it is not expected to have a material adverse effect on the Company’s ability to provide products to customers or on the Company’s profitability.
Environmental
The Company’s policy with regard to environmental liabilities is to accrue for future environmental assessments and remediation costs when information becomes available that indicates that it is probable that the Company is liable for any related claims and assessments and the amount of the liability is reasonably estimable. The Company does not believe that any such matters will have a material adverse effect on the Company’s financial condition, cash flows or results of operations.
Litigation and Potential Claims
From time to time, the Company is involved in various legal proceedings and other matters arising in the normal course of business. Corrosion, hydrogen embrittlement, cracking, material hardness, wood pressure-treating chemicals, misinstallations, misuse, design and assembly flaws, manufacturing defects, labeling defects, product formula defects, inaccurate chemical mixes, adulteration, environmental conditions, or other factors can contribute to failure of fasteners, connectors, anchors, adhesives, specialty chemicals, such as fiber reinforced polymers, and tool products. In addition, inaccuracies may occur in product information, descriptions and instructions found in catalogs, packaging, data sheets, and the Company’s website.
The resolution of any claim or litigation is subject to inherent uncertainty and could have a material adverse effect on the Company’s financial condition, cash flows or results of operations.
16. Income Taxes
The provision for income taxes from operations consisted of the following:
| | | | | | | | | | | | | | | | | |
| | Years Ended December 31, |
(in thousands) | 2022 | | 2021 | | 2020 |
| Current | | | | | |
| Federal | $ | 90,703 | | | $ | 65,861 | | | $ | 42,337 | |
| State | 25,347 | | | 19,515 | | | 12,571 | |
| Foreign | 12,544 | | | 7,641 | | | 4,478 | |
| Deferred | | | | | 0 |
| Federal | (5,806) | | | 802 | | | 2,330 | |
| State | (801) | | | (169) | | | 598 | |
| Foreign | (7,917) | | | (1,548) | | | 250 | |
| $ | 114,070 | | | $ | 92,102 | | | $ | 62,564 | |
Income and loss from operations before income taxes for the years ended December 31, 2022, 2021, and 2020, respectively, consisted of the following:
| | | | | | | | | | | | | | | | | |
| | Years Ended December 31, |
(in thousands) | 2022 | | 2021 | | 2020 |
| Domestic | $ | 437,506 | | | $ | 336,085 | | | $ | 238,320 | |
| Foreign | 10,559 | | | 22,464 | | | 11,244 | |
| $ | 448,065 | | | $ | 358,549 | | | $ | 249,564 | |
As of December 31, 2022, the Company had $36.1 million of net operating loss carryforwards in various foreign taxing jurisdictions. Most of the tax losses can be carried forward indefinitely.
As of December 31, 2022, and 2021, the Company has valuation allowances of $11.2 million and $12.0 million, respectively. The valuation allowance decreased by $0.8 million and increased by $0.7 million for the years ended December 31, 2022, and December 31, 2021, respectively. The decrease in the 2022 valuation allowances was primarily a result of exchange rate fluctuation. The increase in the 2021 valuation allowances was primarily the result of an impairment on a foreign equity investment.
As of December 31, 2022, the Company asserts that its accumulated undistributed earnings generated by our foreign subsidiaries are permanently reinvested and as such, has not recognized a US deferred tax liability on its investment in foreign subsidiaries. The Company will continue to assess its permanent reinvestment assertion on a quarterly basis.
Reconciliations between the statutory federal income tax rates and the Company’s effective income tax rates as a percentage of income before income taxes for its operations were as follows:
| | | | | | | | | | | | | | | | | |
| | Years Ended December 31, |
(in thousands) | 2022 | | 2021 | | 2020 |
| Federal tax rate | 21.0 | % | | 21.0 | % | | 21.0 | % |
| State taxes, net of federal benefit | 4.4 | % | | 4.3 | % | | 4.2 | % |
| | | | | |
| | | | | |
| | | | | |
| Change in valuation allowance | — | % | | — | % | | 0.1 | % |
| True-up of prior year tax returns to tax provision | — | % | | (0.1) | % | | (0.4) | % |
| Difference between U.S. statutory and foreign local tax rates | 0.2 | % | | 0.4 | % | | 0.4 | % |
| Change in uncertain tax position | — | % | | — | % | | — | % |
| Other | (0.1) | % | | 0.1 | % | | (0.2) | % |
| Effective income tax rate | 25.5 | % | | 25.7 | % | | 25.1 | % |
The tax effects of the significant temporary differences that constitute the deferred tax assets and liabilities as of December 31, 2022, and 2021, respectively, were as follows:
| | | | | | | | | | | |
| | As of December 31, |
(in thousands) | 2022 | | 2021 |
| Deferred asset taxes | | | |
| State tax | $ | 1,857 | | | $ | 1,490 | |
| Health claims | 2,877 | | | 1,351 | |
| Inventories | 7,902 | | | 7,497 | |
| Sales incentive and advertising allowances | 2,191 | | | 1,777 | |
| Lease obligations | 14,827 | | | 11,562 | |
| Stock-based compensation | 2,251 | | | 2,612 | |
| Foreign tax credit carryforwards | 4,961 | | | 4,983 | |
| Non-United States tax loss carry forward | 6,557 | | | 7,824 | |
| Acquisition expense | 2,409 | | | 609 | |
| Capitalized research & development expenditures | 6,671 | | | — | |
| Other | 2,533 | | | 1,889 | |
| Total deferred tax assets | $ | 55,036 | | | $ | 41,594 | |
| Less valuation allowances | (11,180) | | | (11,992) | |
| Total deferred asset taxes | $ | 43,856 | | | $ | 29,602 | |
| Deferred tax liabilities | | | |
| Depreciation | $ | (28,271) | | | $ | (14,999) | |
| Goodwill and other intangibles amortization | (102,998) | | | (16,682) | |
| Right of use assets | (14,635) | | | (11,453) | |
| | | |
| Hedging OCI | (10,284) | | | — | |
| Total deferred tax liabilities | (156,188) | | | (43,134) | |
| Total Deferred tax asset/(liability) | $ | (112,332) | | | $ | (13,532) | |
A reconciliation of the beginning and ending amounts of unrecognized tax benefits in 2022, 2021 and 2020, respectively, were as follows, including foreign translation amounts:
| | | | | | | | | | | | | | | | | |
| Reconciliation of Unrecognized Tax Benefits | 2022 | | 2021 | | 2020 |
| Balance as of January 1 | $ | 944 | | | $ | 1,168 | | | $ | 1,706 | |
| Additions based on tax positions related to prior years | 6,528 | | | 9 | | | 78 | |
| Reductions based on tax positions related to prior years | (38) | | | (47) | | | (7) | |
| Additions for tax positions of the current year | 73 | | | 3 | | | 48 | |
| | | | | |
| Lapse of statute of limitations | (275) | | | (189) | | | (657) | |
| Balance as of December 31 | $ | 7,232 | | | $ | 944 | | | $ | 1,168 | |
During 2022, the Company’s uncertain tax positions increased by $6.5 million, primarily due to positions for open years of which were assumed in the Company’s acquisition of ETANCO.
Tax positions of $0.2, $0.3, and $0.3 million are included in the balance of unrecognized tax benefits as of December 31, 2022, 2021, and 2020, respectively, which if recognized, would reduce the effective tax rate.
The Company accrues interest and penalties related to unrecognized tax benefits in income tax expense in accordance with the Company’s historical accounting policy. During the years ended December 31, 2022, 2021 and 2020, accrued interest increased by $673 thousand, and decreased by $39 thousand and $108 thousand, respectively. The Company had accrued $0.9 million, $0.2 million and $0.3 million as of December 31, 2022, 2021 and 2020, respectively for the potential payment of interest and penalties before income tax benefits. The Company does not expect any material changes in unrecognized tax benefits within the next 12 months.
As of December 31, 2022, the Company remained subject to federal income tax examinations in the U.S. for the tax years 2019 through 2022. In addition, tax years 2017 through 2022 remain open to examination in states, local and foreign jurisdictions.
On August 16, 2022, President Biden signed into law the Inflation Reduction Act “IRA”. The provisions include the new Corporate Alternative Minimum Tax "CAMT", an excise tax on stock buybacks, and significant tax incentives for energy and climate initiatives, all effective for tax year 2023. The Company is not subject to the provisions of CAMT but will evaluate the impact, if any, of the other provisions under the IRA when they become effective in tax year 2023.
17. Retirement Plans
The Company has six defined contribution retirement plans covering substantially all salaried employees and nonunion hourly employees. The Simpson Manufacturing Co., Inc. 401(k) Profit Sharing Plan (the "Plan") covers U.S. employees and provides for quarterly safe harbor contributions, limited to 3% of the employees' quarterly eligible compensation and for annual discretionary contributions, subject to certain limitations. The discretionary amounts for 2022, 2021 and 2020 were equal to 7% of qualifying salaries or wages of the covered employees. The other five defined contribution plans, covering the Company’s European and Canadian employees, require the Company to make contributions ranging from 3% to 15% of the employees’ compensation. The total cost for these retirement plans for the years ended December 31, 2022, 2021 and 2020, was $23.8 million, $20.7 million, and $17.7 million, respectively.
We participate in various multiemployer benefit plans that cover some of our employees who are represented by labor unions. We make periodic contributions to these plans in accordance with the terms of applicable collective bargaining agreements and laws but do not sponsor or administer these plans. We do not participate in any multiemployer benefit plans for which we consider our contributions to be individually significant. If we withdraw from participation in any of these plans, the applicable law would require us to fund our allocable share of the unfunded vested benefits, which is known as a withdrawal liability. As of December 31, 2022, we believe that there was no probable withdrawal liability under the multiemployer benefit pension plans under the terms of collective-bargaining agreements that cover its union-represented employees.
Our total contribution to various industry-wide, union-sponsored pension funds and a statutorily required pension fund for employees in the U.S. and Europe were $5.4 million, $5.0 million and $5.1 million for the years ended December 31, 2022, 2021 and 2020, respectively.
18. Related Party Transactions
During 2022, the Company identified certain purchases of goods and services from companies where the current and former Chief Executive Officers of the Company serves as a director on the respective company's board providing the goods or services. The amount of goods and services purchased by the Company pursuant to these arrangements was not material to the Company’s consolidated statements of operations and cash flows for the year ended December 31, 2022.
19. Segment Information
The Company is organized into three reporting segments defined by the regions where the Company’s products are manufactured, marketed and distributed to the Company’s customers. The three regional segments are the North America segment (comprised primarily of the Company’s operations in the U.S. and Canada), the Europe segment and the Asia/Pacific segment (comprised of the Company’s operations in Asia, the South Pacific, and the Middle East). These segments are similar in several ways, including the types of materials used, the production processes, the distribution channels and the product applications.
The Administrative & All Other column primarily includes expenses such as self-insured workers compensation claims for employees, stock-based compensation for certain members of management, interest expense, foreign exchange gains or losses and income tax expense, as well as revenues and expenses related to real estate activities.
The following table shows certain measurements used by management to assess the performance of the segments described above as of December 31, 2022, 2021 and 2020, respectively:
| | | | | | | | | | | | | | | | | | | | | | | | | | | | | |
(in thousands) | North
America | | Europe | | Asia/
Pacific | | Administrative
& All Other | | Total |
| 2022 | | | | |
| Net sales | $ | 1,701,041 | | | $ | 400,303 | | | $ | 14,743 | | | $ | — | | | $ | 2,116,087 | |
| Sales to other segments * | 4,862 | | | 5,732 | | | 32,979 | | | — | | | 43,573 | |
| Income from operations** | 485,899 | | | 11,121 | | | 723 | | | (38,676) | | | 459,067 | |
| Depreciation and amortization | 36,003 | | | 22,594 | | | 1,730 | | | 563 | | | 60,890 | |
| Significant non-cash charges | 7,504 | | | 1,099 | | | 510 | | | 5,868 | | | 14,981 | |
| Provision for income taxes | 112,537 | | | 1,193 | | | 1,091 | | | (751) | | | 114,070 | |
Business acquisitions, net of cash acquired, capital expenditures, asset acquisition, and equity
investments | 54,594 | | | 817,163 | | | 1,173 | | | 2,871 | | | 875,801 | |
| Total assets | 1,393,968 | | | 675,634 | | | 34,599 | | | 399,770 | | | 2,503,971 | |
| | | | | | | | | | | | | | | | | | | | | | | | | | | | | |
| (in thousands) | North
America | | Europe | | Asia/
Pacific | | Administrative
& All Other | | Total |
| 2021 | | | | |
| Net sales | $ | 1,362,941 | | | $ | 196,996 | | | $ | 13,280 | | | $ | — | | | $ | 1,573,217 | |
| Sales to other segments * | 2,237 | | | 5,696 | | | 27,109 | | | — | | | 35,042 | |
| Income from operations** | 359,140 | | | 14,160 | | | 1,193 | | | (6,700) | | | 367,793 | |
| Depreciation and amortization | 33,950 | | | 6,172 | | | 1,844 | | | 511 | | | 42,477 | |
| | | | | | | | | |
| Significant non-cash charges | 8,173 | | | 1,943 | | | 166 | | | 7,607 | | | 17,889 | |
| Provision for income taxes | 87,962 | | | 3,826 | | | 241 | | | 73 | | | 92,102 | |
Capital expenditures, including purchases of
intangible assets, | 45,817 | | | 2,403 | | | 603 | | | 988 | | | 49,811 | |
| Total assets | 1,352,988 | | | 202,631 | | | 31,832 | | | (103,326) | | | 1,484,125 | |
| | | | | | | | | | | | | | | | | | | | | | | | | | | | | |
| (in thousands) | North
America | | Europe | | Asia/
Pacific | | Administrative
& All Other | | Total |
| 2020 | | | | |
| Net sales | $ | 1,101,891 | | | $ | 156,713 | | | $ | 9,341 | | | $ | — | | | $ | 1,267,945 | |
| Sales to other segments * | 2,554 | | | 5,576 | | | 25,320 | | | — | | | 33,450 | |
| Income from operations** | 265,541 | | | 8,396 | | | 308 | | | (21,882) | | | 252,363 | |
| Depreciation and amortization | 30,218 | | | 5,856 | | | 1,709 | | | 984 | | | 38,767 | |
| | | | | | | | | |
| Significant non-cash charges | 6,929 | | | 1,226 | | | 376 | | | 4,975 | | | 13,506 | |
| Provision for income taxes | 58,201 | | | 3,817 | | | 613 | | | (67) | | | 62,564 | |
Capital expenditures, including purchases of
intangible assets, | 29,937 | | | 4,248 | | | 705 | | | 5,816 | | | 40,706 | |
| Total assets | 1,001,168 | | | 198,647 | | | 32,754 | | | — | | | 1,232,569 | |
* Sales to other segments are eliminated in consolidation.
** Beginning in 2022, the Company changed its presentation of its North America and Administrative and all other segment's statement of operations to display allocated expenses and management fees as a separate item below income from operations. During 2021 and 2020, allocated expenses and management fees between the two segments were previously included in gross profit, operating expenses and in income from operations and been adjusted herein to conform to 2022 presentation. consolidated statements of operations, income before tax and net income for all periods presented below are not affected by the change of operations.
Cash collected by the Company’s U.S. subsidiaries is routinely transferred into the Company’s cash management accounts, and therefore is in the total assets of "Administrative & All Other." Cash and cash equivalent balances in "Administrative & All Other" were $222.5 million, $223.5 million and $199.8 million as of December 31, 2022, 2021 and 2020, respectively. As of December 31, 2022, the Company had $77.9 million, or 25.9%, of its cash and cash equivalents held outside the U.S. in accounts belonging to the Company’s various foreign operating entities. The majority of this balance is held in foreign currencies and could be subject to additional taxation if repatriated to the U.S.
The significant non-cash charges comprise compensation related to equity awards under the Company’s stock-based incentive plans and the Company’s employee stock bonus plan. The Company’s measure of profit or loss for its reportable segments is income (loss) from operations. The reconciling amounts between consolidated income before tax and consolidated income from operations are net interest income (expense), net and other, foreign exchange gain (loss), certain legal and professional fees associated with the acquisition of ETANCO, refer to Note 3 "Acquisitions," and loss on disposal of a business. Interest income (expense) is primarily attributed to “Administrative & All Other.”
The following table shows the geographic distribution of the Company’s net sales and long-lived assets as of December 31, 2022, 2021 and 2020, respectively:
| | | | | | | | | | | | | | | | | | | | | | | | | | | | | | | | | | | |
| | 2022 | | 2021 | | 2020 |
(in thousands) | Net
Sales | | Long-Lived
Assets | | Net
Sales | | Long-Lived
Assets | | Net
Sales | | Long-Lived
Assets |
| United States | $ | 1,615,728 | | | $ | 273,407 | | | $ | 1,287,085 | | | $ | 228,623 | | | $ | 1,045,509 | | | $ | 215,082 | |
| France | 170,904 | | | 90,296 | | | 50,445 | | | 5,988 | | | 40,672 | | | 7,095 | |
| Canada | 81,036 | | | 2,571 | | | 70,401 | | | 2,861 | | | 52,889 | | | 3,059 | |
| United Kingdom | 37,349 | | | 1,898 | | | 37,408 | | | 1,851 | | | 24,290 | | | 2,073 | |
| Germany | 42,954 | | | 11,507 | | | 29,970 | | | 9,999 | | | 24,069 | | | 11,163 | |
| Italy | 47,294 | | | 4,342 | | | — | | | — | | | — | | | — | |
| Poland | 27,803 | | | 2,721 | | | 13,909 | | | 2,496 | | | 11,648 | | | 2,779 | |
| Sweden | 16,156 | | | 2,369 | | | 17,003 | | | 2,664 | | | 15,241 | | | 2,986 | |
| Denmark | 12,610 | | | 1,015 | | | 13,964 | | | 2,281 | | | 11,931 | | | 2,445 | |
| Norway | 12,241 | | | — | | | 12,736 | | | — | | | 11,138 | | | — | |
| | | | | | | | | | | |
| Australia | 9,468 | | | 245 | | | 8,120 | | | 201 | | | 5,749 | | | 134 | |
| Belgium | 15,032 | | | 2,182 | | | 6,818 | | | 2,349 | | | 5,311 | | | 2,268 | |
| Other countries | 27,512 | | | 11,496 | | | 25,358 | | | 15,249 | | | 19,498 | | | 18,246 | |
| | $ | 2,116,087 | | | $ | 404,049 | | | $ | 1,573,217 | | | $ | 274,562 | | | $ | 1,267,945 | | | $ | 267,330 | |
Net sales and long-lived assets, excluding intangible assets, are attributable to the country where the sales or manufacturing operations are located.
The Company’s wood construction products include connectors, truss plates, fastening systems, fasteners and pre-fabricated shearwalls and are used for connecting and strengthening wood-based construction primarily in the residential construction market. Its concrete construction products include adhesives, specialty chemicals, mechanical anchors, carbide drill bits, powder actuated tools and reinforcing fiber materials and are used for restoration, protection or strengthening concrete, masonry and steel construction in residential, industrial, commercial and infrastructure construction. The following table shows the distribution of the Company’s net sales by product for the years ended December 31, 2022, 2021 and 2020, respectively:
| | | | | | | | | | | | | | | | | |
(in thousands) | 2022 | | 2021 | | 2020 |
| Wood Construction | $ | 1,831,580 | | | $ | 1,361,113 | | | $ | 1,082,877 | |
| Concrete Construction | 282,205 | | | 210,780 | | | 184,631 | |
| Other | 2,302 | | | 1,324 | | | 437 | |
| Total | $ | 2,116,087 | | | $ | 1,573,217 | | | $ | 1,267,945 | |
No customers accounted for at least 10% of net sales for the years ended 2022, 2021 and 2020.
20. Subsequent Events
Effective January 1, 2023, Mike Olosky, the Company’s President and Chief Operating Officer ("COO") was promoted as the Company’s President and Chief Executive Officer ("CEO").
On January 24, 2023, the Company's Board of Directors (the (Board") declared a quarterly cash dividend of $0.26 per share of the Company's common stock, estimated to be $11.1 million in total. The record date for the dividend will be April 6, 2023, and will be paid on April 27, 2023.
SCHEDULE II
Simpson Manufacturing Co., Inc. and Subsidiaries
VALUATION AND QUALIFYING ACCOUNTS
for the years ended December 31, 2022, 2021 and 2020
| | | | | | | | | | | | | | | | | | | | | | | | | | | | | |
| | | | | | | |
| | | | Additions | | | | |
| | | | Charged | | Charged | | | | |
| | Balance at | | to Costs | | to Other | | | | Balance |
| (in thousands) | Beginning | | and | | Accounts — | | | | at End |
| Classification | of Year | | Expenses | | Write-offs | | Deductions | | of Year |
| Year to date December 31, 2022 | | | | | | | | | |
| Allowance for doubtful accounts | $ | 1,932 | | | $ | 1,663 | | | $ | 356 | | | $ | — | | | $ | 3,239 | |
| Allowance for sales discounts | 7,225 | | | 1,544 | | | — | | | — | | | 8,769 | |
| Allowance for deferred tax assets | 11,991 | | | 97 | | | — | | | 909 | | | 11,179 | |
| Year to date December 31, 2021 | | | | | | | | | |
| Allowance for doubtful accounts | 2,110 | | | 392 | | | 570 | | | — | | | 1,932 | |
| Allowance for sales discounts | 4,566 | | | 2,659 | | | — | | | — | | | 7,225 | |
| Allowance for deferred tax assets | 11,316 | | | 1,763 | | | — | | | 1,088 | | | 11,991 | |
| Year to date December 31, 2020 | | | | | | | | | |
| Allowance for doubtful accounts | 1,935 | | | (98) | | | (273) | | | — | | | 2,110 | |
| Allowance for sales discounts | 4,748 | | | (182) | | | — | | | — | | | 4,566 | |
| Allowance for deferred tax assets | 11,617 | | | 1,166 | | | — | | | 1,467 | | | 11,316 | |
Item 9. Changes in and Disagreements with Accountants on Accounting and Financial Disclosures.
None.
Item 9A. Controls and Procedures.
Disclosure Controls and Procedures. As of December 31, 2022, the Company carried out an evaluation, under the supervision and with the participation of the Company’s management, including the chief executive officer the (“CEO”) and the chief financial officer (the “CFO”), of the effectiveness of the Company’s disclosure controls and procedures (as defined in Rule 13a-15(e) and 15-d-15(e) under the Securities Exchange Act of 1934, as amended (the "Exchange Act). Based on this evaluation, the Company’s CEO and CFO have concluded that the Company’s disclosure controls and procedures were effective at the reasonable assurance level. Disclosure controls and procedures are controls and other procedures designed reasonably to assure that information required to be disclosed in the Company’s reports filed or submitted under the Exchange Act is recorded, processed, summarized and reported within the time periods specified in the Securities and Exchange Commission’s rules and forms. Disclosure controls and procedures are also designed reasonably to assure that this information is accumulated and communicated to the Company’s management, including the CEO and the CFO, as appropriate to allow timely decisions regarding required disclosure.
The Company’s management, including the CEO and the CFO, does not, however, expect that the Company’s disclosure controls and procedures or the Company’s internal control over financial reporting will prevent all fraud and material errors. Internal control over financial reporting, no matter how well conceived and operated, can provide only reasonable, not absolute assurance that the objectives of the control system are met. In addition, the design of a control system must reflect the facts that there are resource constraints and that the benefits of controls must be considered relative to their costs. The inherent limitations in internal control over financial reporting include the realities that judgments can be faulty and that breakdowns can occur because of simple error or mistake. Controls also can be circumvented by the individual acts of some persons, by collusion of two or more people, or by management override of controls. The design of any system of internal control is also based in part on assumptions about the likelihood of future events, and there can be only reasonable, not absolute assurance that any design will succeed in achieving its stated goals under all potential events and conditions. Over time, controls may become inadequate because of changes in circumstances, or the degree of compliance with the policies and procedures may deteriorate.
Management's Report on Internal Control over Financial Reporting. The Company’s management is responsible for establishing and maintaining adequate internal control over financial reporting. The Company’s management assessed the effectiveness of the Company’s internal control over financial reporting as of December 31, 2022, using the criteria established in Internal Control - Integrated Framework (2013) issued by the Committee of Sponsoring Organizations of the Treadway Commission (“COSO”) and concluded that the Company’s internal control over financial reporting was effective as of December 31, 2022.
Grant Thornton LLP, an independent registered public accounting firm that audited the Company’s Consolidated Financial Statements, has also audited the effectiveness of the Company’s internal control over financial reporting as of December 31, 2022, as stated in their report included in the Company’s Consolidated Financial Statements.
There were no changes in our internal control over financial reporting identified in management's evaluation pursuant to Rules 13a-15(d) or 15d-15(d) of the Exchange Act during the year ended December 31, 2022, that materially affected, or are reasonably likely to materially affect, the Company's internal control over financial reporting except that on April 1, 2022, the Company acquired ETANCO. As a result, the Company is currently integrating ETANCO's operations into its overall internal controls over financial reporting.
In accordance with guidance issued by the Securities and Exchange Commission, companies are permitted to exclude acquisitions from their final assessment of internal control over financial reporting for the first fiscal year in which the acquisition occurred. Our management’s evaluation of internal control over financial reporting excluded the internal control activities at ETANCO, which we acquired on April 1, 2022, as discussed in Note 3, “Acquisitions,” to the Consolidated Financial Statements. During the year ended 2022, ETANCO contributed approximately $212.6 million to the Company’s consolidated revenue. As of December 31, 2022, our total assets included approximately $955.1 million which were specifically attributable to ETANCO. We have included the financial results of ETANCO in the consolidated financial statements from the date of acquisition.
Item 9B. Other Information.
None.
PART III
Item 10. Directors, Executive Officers and Corporate Governance.
The information required by this Item will be contained in the Company’s proxy statement for the 2023 Annual Meeting of Stockholders to be held on Wednesday, April 26, 2023, to be filed with the SEC not later than 120 days following the end of the Company’s fiscal year ended December 31, 2022, which information is incorporated herein by reference.
Item 11. Executive Compensation.
The information required by this Item will be contained in the Company’s proxy statement for the 2023 Annual Meeting of Stockholders to be held on Wednesday, April 26, 2023, to be filed with the SEC not later than 120 days following the end of the Company’s fiscal year ended December 31, 2022, which information is incorporated herein by reference.
Item 12. Security Ownership of Certain Beneficial Owners and Management and Related Stockholder Matters.
The information required by this Item will be contained in the Company’s proxy statement for the 2023 Annual Meeting of Stockholders to be held on Wednesday, April 26, 2023, to be filed with the SEC not later than 120 days following the end of the Company’s fiscal year ended December 31, 2022, which information is incorporated herein by reference.
Item 13. Certain Relationships and Related Transactions, and Director Independence.
The information required by this Item will be contained in the Company’s proxy statement for the 2023 Annual Meeting of Stockholders to be held on Wednesday, April 26, 2023, to be filed with the SEC not later than 120 days following the end of the Company’s fiscal year ended December 31, 2022, which information is incorporated herein by reference.
Item 14. Principal Accounting Fees and Services.
The information required by this Item will be contained in the Company’s proxy statement for the 2023 Annual Meeting of Stockholders to be held on Wednesday, April 26, 2023, to be filed with the SEC not later than 120 days following the end of the Company’s fiscal year ended December 31, 2022, which information is incorporated herein by reference.
PART IV
Item 15. Exhibits and Financial Statement Schedules.
(a) The following documents are filed as part of this Annual Report on Form 10-K:
1. Consolidated financial statements
The following consolidated financial statements are filed as a part of this report:
Reports of Independent Registered Public Accounting Firms
Consolidated Balance Sheets as of December 31, 2022, and 2021
Consolidated Statements of Operations for the years ended December 31, 2022, 2021 and 2020
Consolidated Statements of Comprehensive Income for the years ended December 31, 2022, 2021 and 2020
Consolidated Statements of Stockholders’ Equity for the years ended December 31, 2022, 2021 and 2020
Consolidated Statements of Cash Flows for the years ended December 31, 2022, 2021 and 2020
Notes to Consolidated Financial Statements
2. Financial Statement Schedules
The following consolidated financial statement schedule for each of the years in the three-year period ended December 31, 2022, is filed as part of this Annual Report on Form 10-K:
Schedule II - Valuation and Qualifying Accounts-Years ended December 31, 2022, 2021 and 2020.
All other schedules have been omitted as the required information is not present or is not present in amounts sufficient to require submission of the schedule, or because the information required is included in the consolidated financial statements and related notes thereto.
(b) Exhibits
The following exhibits are either incorporated by reference into, or filed or furnished with, this Annual Report on Form 10-K, as indicated below.
*Management contract or compensatory plan or arrangement.
*Management contract or compensatory plan or arrangement.
*Management contract or compensatory plan or arrangement.
*Management contract or compensatory plan or arrangement.
*Management contract or compensatory plan or arrangement.
*Management contract or compensatory plan or arrangement.
* Management contract or compensatory plan or arrangement.
101 Financial statements from the annual report on Form 10-K of Simpson Manufacturing Co., Inc. for the year ended December 31, 2022, formatted in XBRL, are filed herewith and include: (i) the Consolidated Balance Sheets, (ii) the Consolidated Statements of Operations, (iii) the Statement of Comprehensive Income, (iv) the Consolidated Statements of Stockholders’ Equity, (v) the Consolidated Statements of Cash Flows and (vi) the Notes to Consolidated Financial Statements.
104 Cover Page Interactive Data File (embedded within the Inline XBRL document).
Item 16. Form 10-K Summary.
None.
SIGNATURES
Pursuant to the requirements of Section 13 or 15(d) of the Securities Exchange Act of 1934, the Registrant has duly caused this report to be signed on its behalf by the undersigned, thereunto duly authorized.
| | | | | | | | | | | |
| Dated: | February 28, 2023 | | Simpson Manufacturing Co., Inc. |
| | | | (Registrant) |
| | | By | /s/Brian J. Magstadt |
| | | | Brian J. Magstadt |
| | | | Chief Financial Officer |
| | | | and Duly Authorized Officer |
| | | | of the Registrant |
| | | | (principal accounting and financial officer) |
Pursuant to the requirements of the Securities Exchange Act of 1934, this report has been signed below by the following persons on behalf of the Registrant and in the capacities and on the dates indicated below. | | | | | | | | | | | | | | |
| Signature | | Title | | Date |
| | | | | |
| Chief Executive Officer: | | | | |
| | | | | |
| /s/Mike Olosky | | Chief Executive Officer and Director | | February 28, 2023 |
| (Mike Olosky) | | (principal executive officer) | | |
| | | | |
| Chief Financial Officer: | | | | |
| | | | | |
| /s/Brian J. Magstadt | | Chief Financial Officer and Treasurer | | February 28, 2023 |
| (Brian J. Magstadt) | | (principal accounting and financial officer) | | |
| | | | | |
| Directors: | | | | |
| | | | | |
| /s/James S. Andrasick | | Chairman of the Board and Director | | February 28, 2023 |
| (James S. Andrasick) | | | | |
| | | | |
| /s/Karen Colonias | | Executive Advisor and Director | | February 28, 2023 |
| (Karen Colonias) | | | | |
| | | | |
/s/Kenneth D. Knight | | Director | | February 28, 2023 |
| | | | |
| (Kenneth D. Knight) | | | | |
| | | | | |
| /s/Jennifer A. Chatman | | Director | | February 28, 2023 |
| (Jennifer A. Chatman) | | | | |
| | | | | |
| /s/Gary M. Cusumano | | Director | | February 28, 2023 |
| (Gary M. Cusumano) | | | | |
| | | | | |
| /s/Celeste Volz Ford | | Director | | February 28, 2023 |
| (Celeste Volz Ford) | | | | |
| | | | |
| /s/Robin G. MacGillivray | | Director | | February 28, 2023 |
| (Robin G. MacGillivray) | | | | |
| | | | |
| /s/Philip E. Donaldson | | Director | | February 28, 2023 |
| (Philip E. Donaldson) | | | | |