Exhibit 99.1
 |
70 E. Long Lake Rd. Bloomfield Hills, MI 48304 www.agreerealty.com FOR IMMEDIATE RELEASE |
Agree Realty Corporation Reports Third Quarter 2022 Results
Increases Lower End of 2022 Acquisition Guidance
to $1.6 Billion;
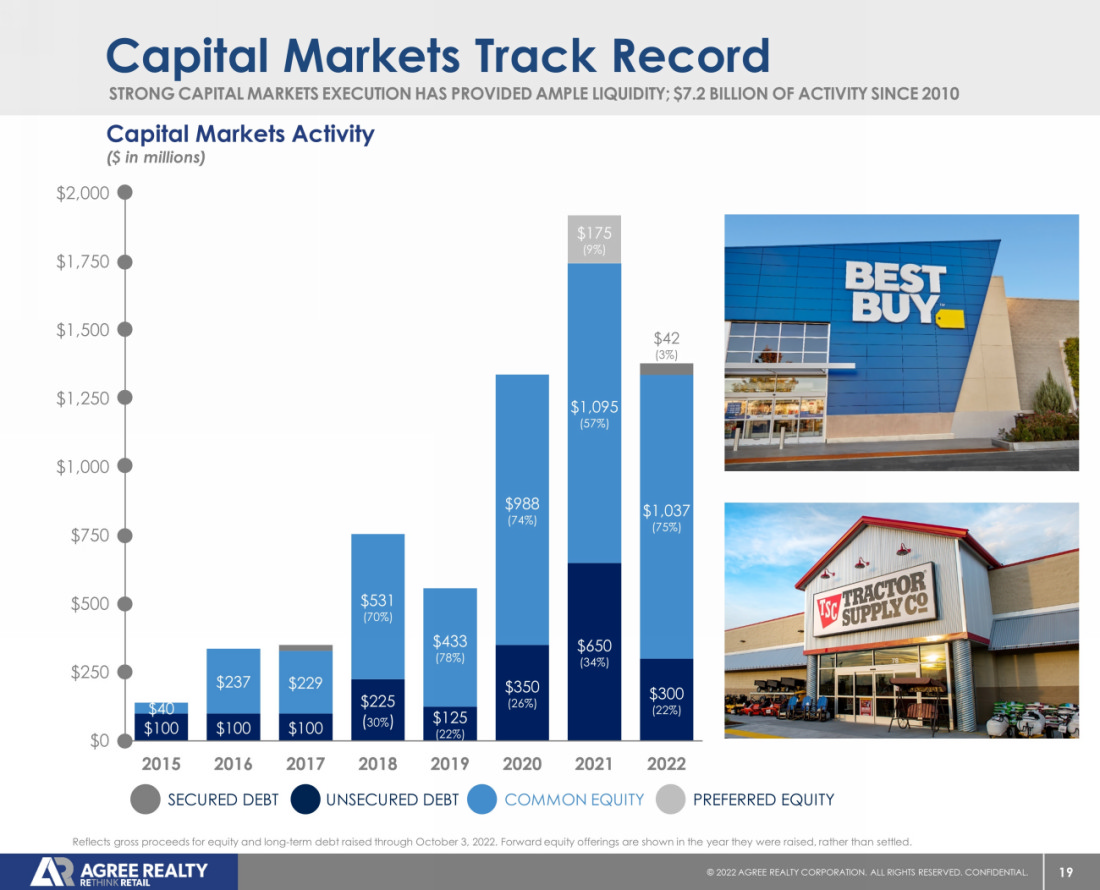
Fortifies Balance Sheet with Over $800 Million of Capital Raised
Bloomfield Hills, MI, November 1, 2022 -- Agree Realty Corporation (NYSE: ADC) (the “Company”) today announced results for the quarter ended September 30, 2022. All per share amounts included herein are on a diluted per common share basis unless otherwise stated.
Third Quarter 2022 Financial and Operating Highlights:
| § | Invested approximately $372 million in 121 retail net lease properties |
| § | Net Income per share attributable to common stockholders decreased 11.1% to $0.46 |
| § | Core Funds from Operations (“Core FFO”) per share increased 5.6% to $0.97 |
| § | Adjusted Funds from Operations (“AFFO”) per share increased 7.8% to $0.96 |
| § | Declared an October monthly dividend of $0.240 per common share, a 5.7% year-over-year increase |
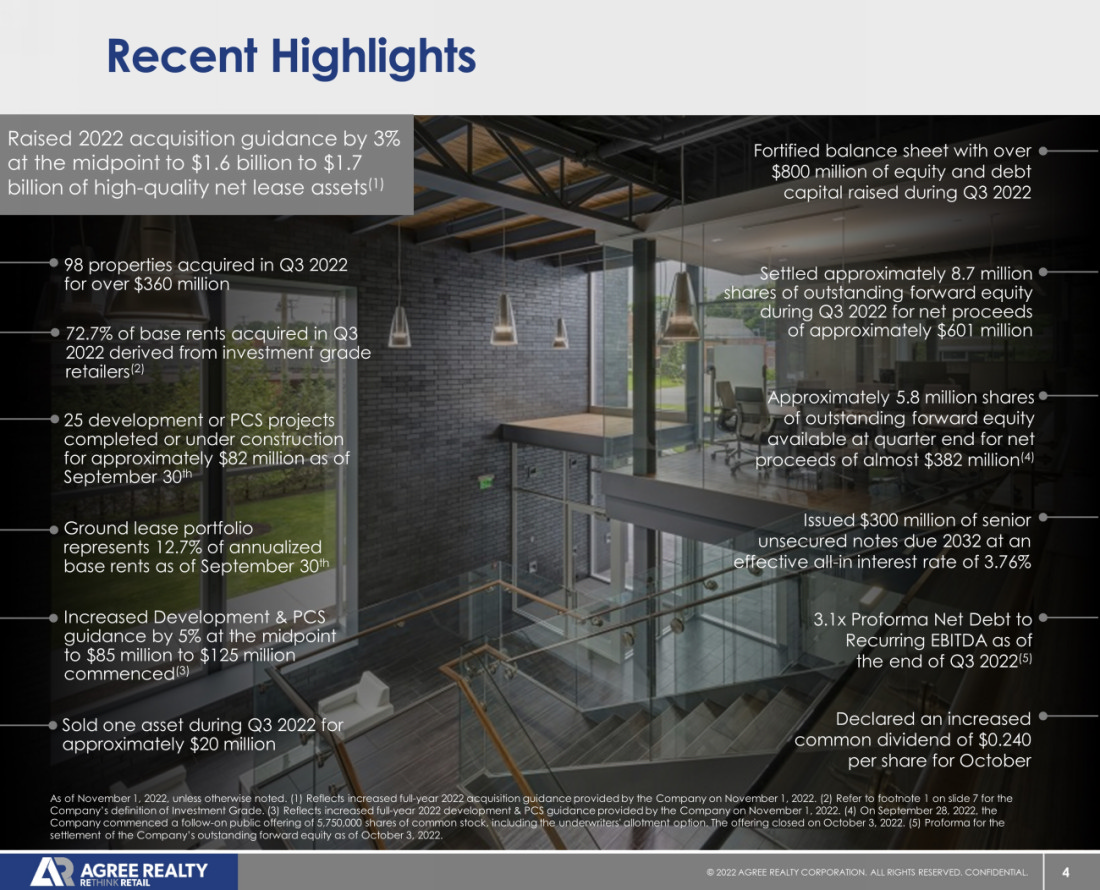
| § | Completed a public bond offering of $300 million of 4.80% senior unsecured notes due 2032 with an effective all-in rate of 3.76% inclusive of prior hedging activity |
| § | Sold 1,688,390 shares of common stock via the forward component of the Company’s at-the-market equity (“ATM”) program for anticipated net proceeds of approximately $127 million |
| § | Commenced a forward equity offering of 5,750,000 shares of common stock, including the underwriters’ option to purchase additional shares, raising anticipated net proceeds of approximately $382 million |
| § | Settled 8,739,752 shares of outstanding forward equity for net proceeds of approximately $601 million |
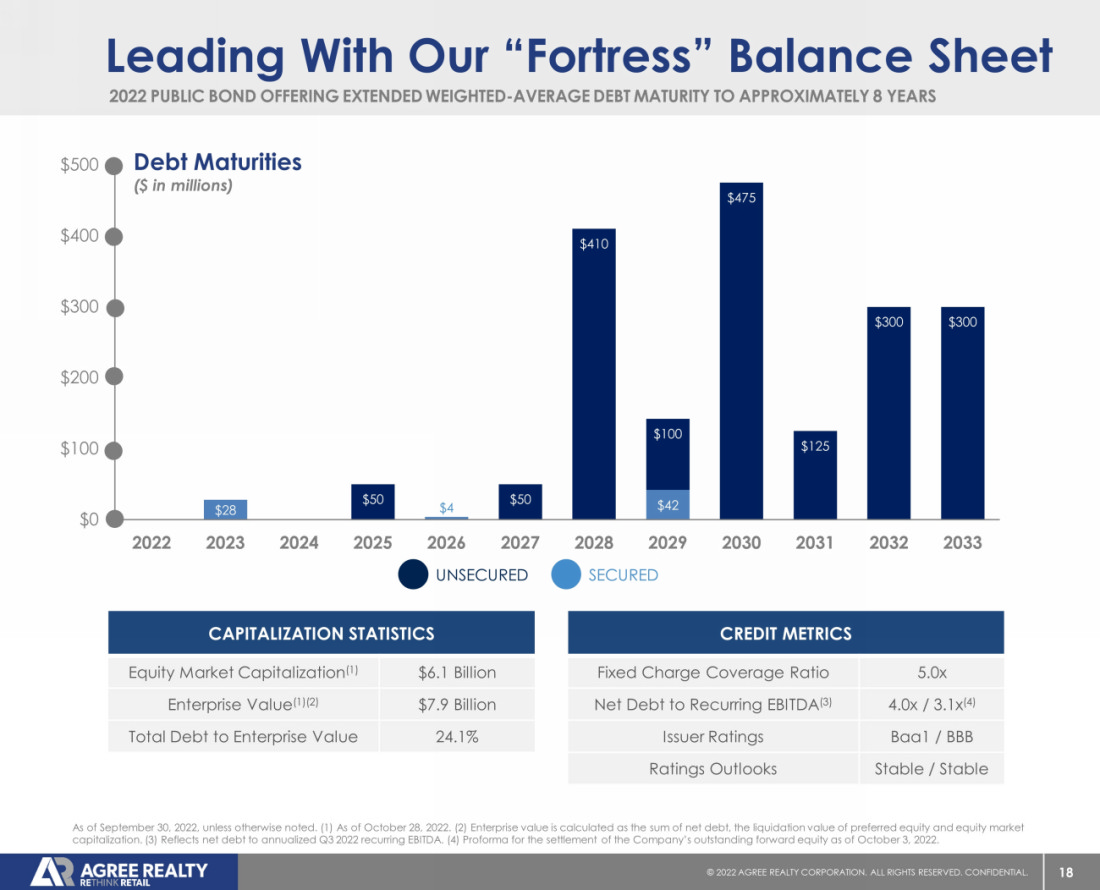
| § | Balance sheet positioned for growth at 3.1 times proforma net debt to recurring EBITDA; 4.0 times excluding unsettled forward equity |
Financial Results
Net Income Attributable to Common Stockholders
Net Income for the three months ended September 30, 2022 increased 3.3% to $37.6 million, compared to $36.4 million for the comparable period in 2021. Net Income per share for the three months ended September 30, 2022 decreased 11.1% to $0.46, compared to $0.52 per share for the comparable period in 2021.
Net Income for the nine months ended September 30, 2022 increased 19.3% to $105.9 million, compared to $88.8 million for the comparable period in 2021. Net Income per share for the nine months ended September 30, 2022 increased 3.9% to $1.39, compared to $1.34 per share for the comparable period in 2021.
Core FFO
Core FFO for the three months ended September 30, 2022 increased 22.2% to $78.2 million, compared to Core FFO of $64.0 million for the comparable period in 2021. Core FFO per share for the three months ended September 30, 2022 increased 5.6% to $0.97, compared to Core FFO per share of $0.92 for the comparable period in 2021.
Core FFO for the nine months ended September 30, 2022 increased 26.4% to $222.4 million, compared to Core FFO of $175.9 million for the comparable period in 2021. Core FFO per share for the nine months ended September 30, 2022 increased 9.9% to $2.92, compared to Core FFO per share of $2.65 for the comparable period in 2021.
1
AFFO
AFFO for the three months ended September 30, 2022 increased 24.8% to $77.6 million, compared to AFFO of $62.1 million for the comparable period in 2021. AFFO per share for the three months ended September 30, 2022 increased 7.8% to $0.96, compared to AFFO per share of $0.89 for the comparable period in 2021.
AFFO for the nine months ended September 30, 2022 increased 28.0% to $220.5 million, compared to AFFO of $172.3 million for the comparable period in 2021. AFFO per share for the nine months ended September 30, 2022 increased 11.3% to $2.89, compared to AFFO per share of $2.60 for the comparable period in 2021.
Dividend
In the third quarter, the Company declared monthly cash dividends of $0.234 per common share for each of July, August and September 2022. The monthly dividends reflected an annualized dividend amount of $2.808 per common share, representing a 7.8% increase over the annualized dividend amount of $2.604 per common share from the third quarter of 2021. The dividends represent payout ratios of approximately 73% of both Core FFO per share and AFFO per share.
For the nine months ended September 30, 2022, the Company declared monthly cash dividends totaling $2.085 per common share, an 8.4% increase over the dividends of $1.923 per common share declared for the comparable period in 2021. The dividends represent payout ratios of approximately 71% of Core FFO per share and 72% of AFFO per share.
Subsequent to quarter end, the Company declared an increased monthly cash dividend of $0.240 per common share for October 2022. The monthly dividend reflects an annualized dividend amount of $2.880 per common share, representing a 5.7% increase over the annualized dividend amount of $2.724 per common share from the fourth quarter of 2021. The dividend is payable November 14, 2022 to stockholders of record at the close of business on October 31, 2022.
Additionally, subsequent to quarter end, the Company declared a monthly cash dividend on its 4.25% Series A Cumulative Redeemable Preferred Stock of $0.08854 per depositary share, which is equivalent to $1.0625 per annum. The dividend is payable November 1, 2022 to stockholders of record at the close of business on October 24, 2022.
CEO Comments
“Our record year-to-date investment volume was underpinned by several strategic capital markets transactions during the quarter, bolstering our fortress balance sheet and providing us with significant liquidity in a dynamic macro environment," said Joey Agree, President and Chief Executive Officer. “Our industry-leading portfolio and balance sheet are well positioned to not only withstand the current environment, but to capitalize on opportunities across all three of our origination platforms.”
Portfolio Update
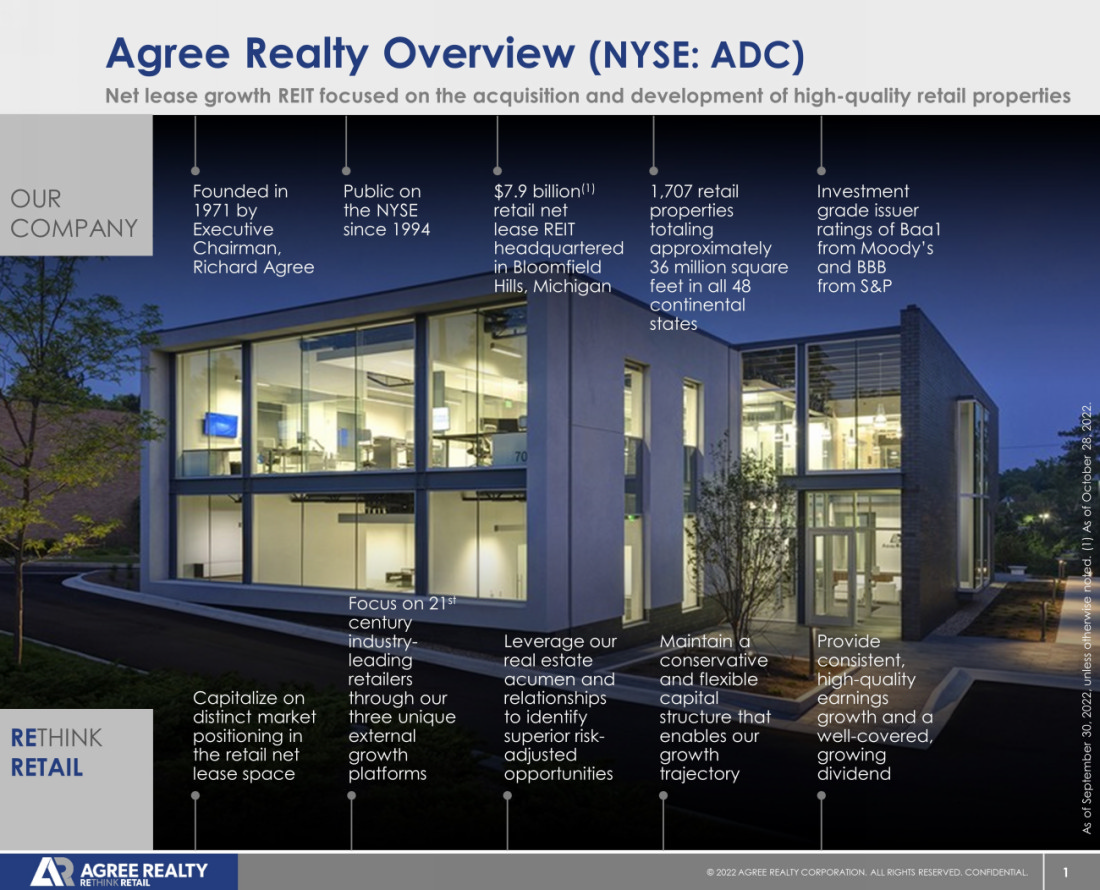
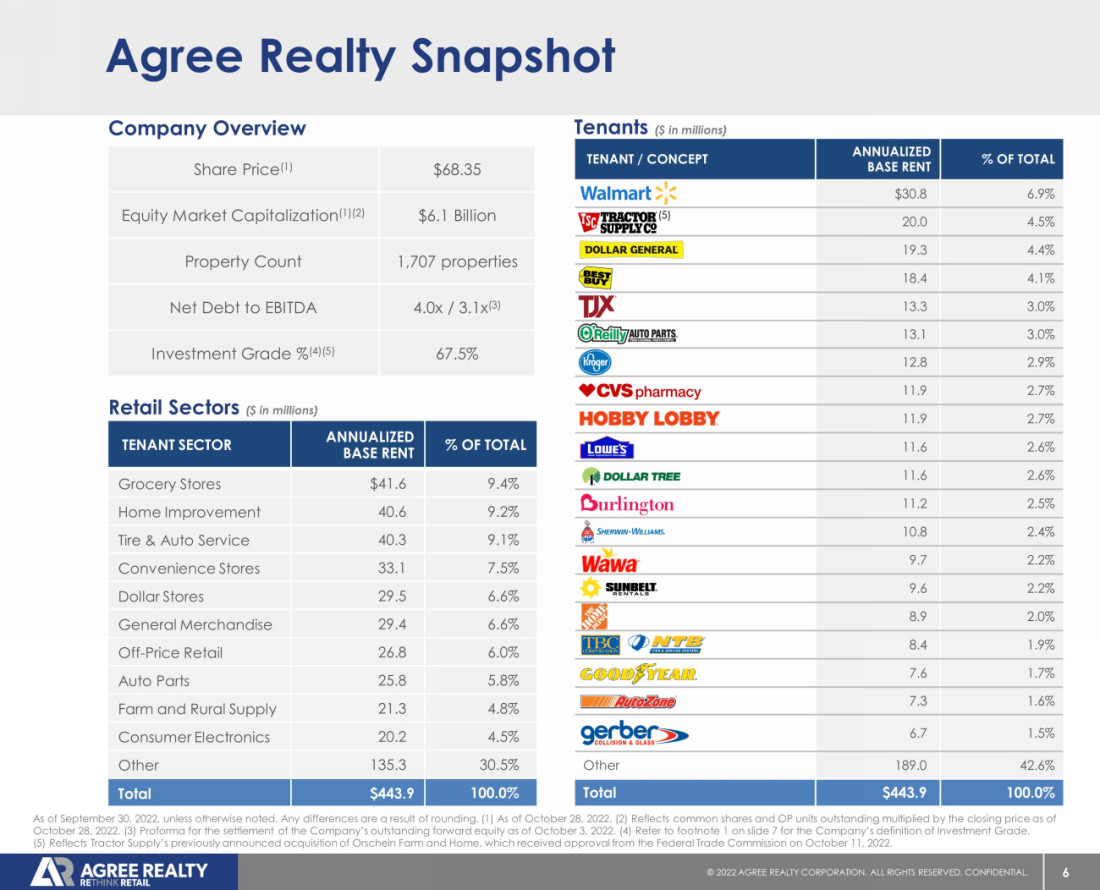
As of September 30, 2022, the Company’s portfolio consisted of 1,707 properties located in 48 states and contained approximately 35.8 million square feet of gross leasable area.
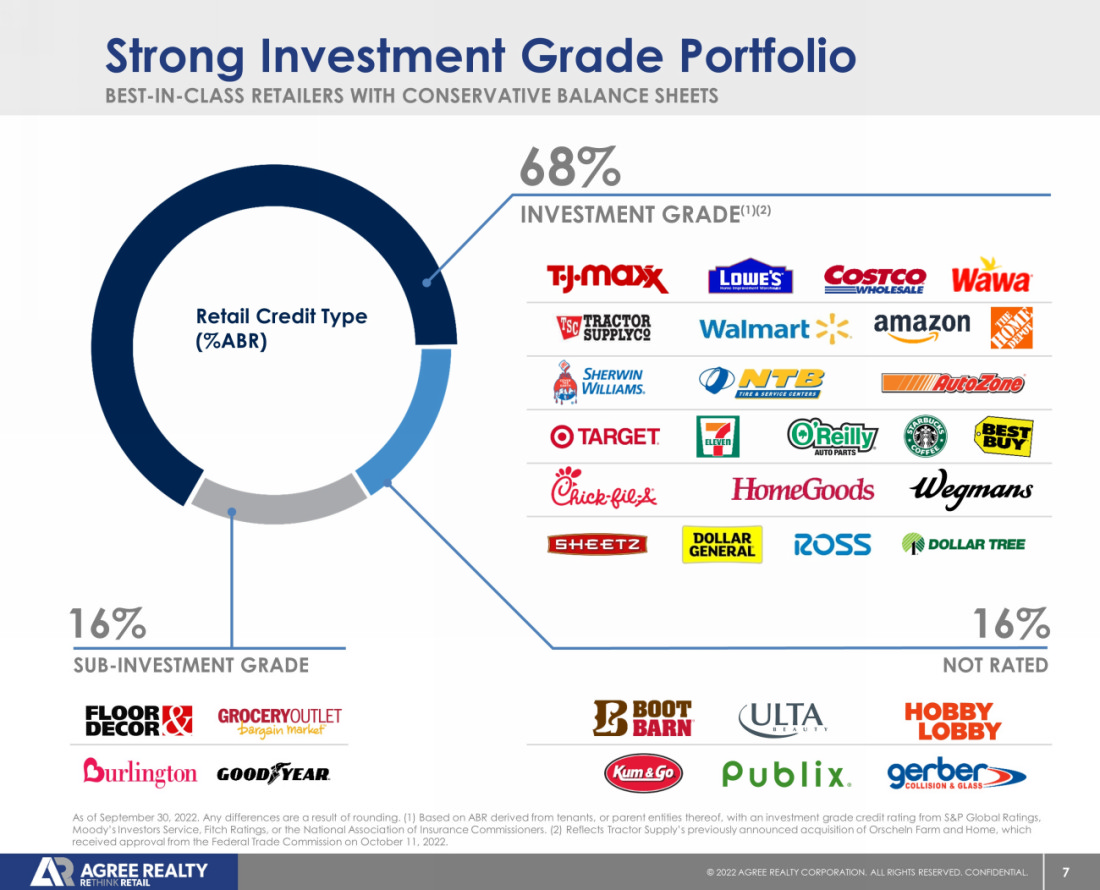
At quarter-end, the portfolio was 99.7% leased and had a weighted-average remaining lease term of approximately 8.9 years. Investment grade retailers represented 67.5% of annualized base rents.
2
Ground Lease Portfolio
During the quarter, the Company acquired eight ground leases for an aggregate purchase price of approximately $27.6 million, representing 7.5% of annualized base rents acquired.
As of September 30, 2022, the Company’s ground lease portfolio consisted of 201 leases located in 32 states and totaled approximately 5.3 million square feet of gross leasable area. Properties ground leased to tenants represented approximately 12.7% of annualized base rents.
At quarter end, the ground lease portfolio was fully occupied and had a weighted-average remaining lease term of approximately 11.4 years. Investment grade retailers represented 88.4% of annualized base rents.
Acquisitions
Acquisition volume for the third quarter totaled $360.2 million and included 98 properties net leased to leading retailers operating in sectors including dollar stores, auto parts, farm and rural supply, grocery store, home improvement, and consumer electronics. The acquired properties are located in 29 states and leased to tenants operating in 21 sectors.
The properties were acquired at a weighted-average capitalization rate of 6.2% and had a weighted-average remaining lease term of 11.1 years. Approximately 72.7% of annualized base rents acquired were generated from investment grade retail tenants.
For the nine months ended September 30, 2022, total acquisition volume was $1.19 billion. The 303 acquired properties are located in 42 states and leased to tenants who operate in 27 retail sectors. The properties were acquired at a weighted-average capitalization rate of 6.1% and had a weighted-average remaining lease term of approximately 10.1 years. Approximately 68.1% of annualized base rents were generated from investment grade retail tenants.
The Company is increasing the lower end of its outlook for acquisition volume for the full-year 2022 to $1.6 billion and is maintaining the upper end of the range at $1.7 billion of high-quality retail net lease properties. This compares with a previous range of $1.5 billion to $1.7 billion.
Dispositions
During the three months ended September 30, 2022, the Company sold one property for gross proceeds of approximately $20.0 million. The disposition was completed at a capitalization rate of 7.2%. During the nine months ended September 30, 2022, the Company sold six properties for total gross proceeds of $44.8 million. The weighted-average capitalization rate of the dispositions was 6.5%.
The Company is increasing the lower end of its total disposition guidance range for 2022 from $25 million to $45 million and is maintaining the upper end of the range at $75 million.
3
Development and PCS
During the quarter, the Company commenced two development and PCS projects, with total anticipated costs of approximately $7.7 million. The projects include a Gerber Collision in Murrieta, California and a Sunbelt Rentals in Wentzville, Missouri.
The Company completed two Gerber Collision development projects, as well as the Burlington in Turnersville, New Jersey. The Company continued construction on the two Sunbelt Rentals projects; one Old Navy; and 15 geographically diverse Gerber Collision projects.
For the nine months ended September 30, 2022, the Company had a record 25 development or PCS projects completed or under construction. Anticipated total costs are approximately $81.5 million, including $51.0 million of costs incurred to date. For the full-year 2022, the Company anticipates commencing between $85 million and $125 million of development and PCS projects, compared to the previous range of $75 million to $125 million.
The following table presents the Company’s 25 development or PCS projects as of September 30, 2022:
| Tenant | Location | Lease
Structure |
Lease
Term |
Actual
or Anticipated Rent Commencement |
Status | |||||
| 7-Eleven | Saginaw, MI | Build-to-Suit | 15 years | Q1 2022 | Complete | |||||
| Gerber Collision | Pooler, GA | Build-to-Suit | 15 years | Q2 2022 | Complete | |||||
| Burlington | Turnersville, NJ | Build-to-Suit | 10 years | Q3 2022 | Complete | |||||
| Gerber Collision | Janesville, WI | Build-to-Suit | 15 years | Q3 2022 | Complete | |||||
| Gerber Collision | New Port Richey, FL | Build-to-Suit | 15 years | Q3 2022 | Complete | |||||
| Gerber Collision | Lake Park, FL | Build-to-Suit | 15 years | Q4 2022 | Under Construction | |||||
| Gerber Collision | Ocala, FL | Build-to-Suit | 15 years | Q4 2022 | Under Construction | |||||
| Gerber Collision | Venice, FL | Build-to-Suit | 15 years | Q4 2022 | Under Construction | |||||
| Sunbelt Rentals | Roxana, IL | Build-to-Suit | 10 years | Q4 2022 | Under Construction | |||||
| Gerber Collision | Fort Wayne, IN | Build-to-Suit | 15 years | Q1 2023 | Under Construction | |||||
| Gerber Collision | Johnson City, NY | Build-to-Suit | 15 years | Q1 2023 | Under Construction | |||||
| Gerber Collision | Joplin, MO | Build-to-Suit | 15 years | Q1 2023 | Under Construction | |||||
| Gerber Collision | Kimberly, WI | Build-to-Suit | 15 years | Q1 2023 | Under Construction | |||||
| Gerber Collision | Lake Charles, LA | Build-to-Suit | 15 years | Q1 2023 | Under Construction | |||||
| Gerber Collision | McDonough, GA | Build-to-Suit | 15 years | Q1 2023 | Under Construction | |||||
| Gerber Collision | Murrieta, CA | Build-to-Suit | 15 years | Q1 2023 | Under Construction | |||||
| Gerber Collision | Springfield, MO | Build-to-Suit | 15 years | Q1 2023 | Under Construction | |||||
| Gerber Collision | Toledo, OH | Build-to-Suit | 15 years | Q1 2023 | Under Construction | |||||
| Gerber Collision | Winterville, NC | Build-to-Suit | 15 years | Q1 2023 | Under Construction | |||||
| Gerber Collision | Woodstock, IL | Build-to-Suit | 15 years | Q1 2023 | Under Construction | |||||
| Gerber Collision | Yorkville, IL | Build-to-Suit | 15 years | Q1 2023 | Under Construction | |||||
| Old Navy | Searcy, AR | Build-to-Suit | 7 years | Q1 2023 | Under Construction | |||||
| Sunbelt Rentals | St. Louis, MO | Build-to-Suit | 7 years | Q1 2023 | Under Construction | |||||
| Gerber Collision | Huntley, IL | Build-to-Suit | 15 years | Q2 2023 | Under Construction | |||||
| Sunbelt Rentals | Wentzville, MO | Build-to-Suit | 12 years | Q2 2023 | Under Construction |
4
Leasing Activity and Expirations
During the third quarter, the Company executed new leases, extensions or options on approximately 192,000 square feet of gross leasable area throughout the existing portfolio.
For the nine months ended September 30, 2022, the Company executed new leases, extensions or options on approximately 652,000 square feet of gross leasable area throughout the existing portfolio.
As of September 30, 2022, the Company’s 2022 lease maturities represented 0.2% of annualized base rents. The following table presents contractual lease expirations, assuming no tenants exercise their renewal options, within the Company’s portfolio as of September 30, 2022:
| Year | Leases | Annualized Base Rent(1) | % of ABR | Gross Leasable Area (“GLA”) | % of GLA | |||||||||||||||
| 2022 | 6 | 874 | 0.2 | % | 56 | 0.2 | % | |||||||||||||
| 2023 | 38 | 6,774 | 1.5 | % | 810 | 2.3 | % | |||||||||||||
| 2024 | 45 | 13,651 | 3.1 | % | 1,586 | 4.4 | % | |||||||||||||
| 2025 | 69 | 16,617 | 3.7 | % | 1,618 | 4.5 | % | |||||||||||||
| 2026 | 113 | 25,854 | 5.8 | % | 2,679 | 7.5 | % | |||||||||||||
| 2027 | 125 | 28,662 | 6.5 | % | 2,811 | 7.8 | % | |||||||||||||
| 2028 | 133 | 33,889 | 7.6 | % | 2,991 | 8.3 | % | |||||||||||||
| 2029 | 154 | 42,926 | 9.7 | % | 4,230 | 11.8 | % | |||||||||||||
| 2030 | 247 | 51,222 | 11.5 | % | 3,893 | 10.9 | % | |||||||||||||
| 2031 | 160 | 38,073 | 8.6 | % | 2,785 | 7.8 | % | |||||||||||||
| Thereafter | 762 | 185,310 | 41.8 | % | 12,289 | 34.5 | % | |||||||||||||
| Total Portfolio | 1,852 | $ | 443,852 | 100.0 | % | 35,748 | 100.0 | % | ||||||||||||
The contractual lease expirations presented above exclude the effect of replacement tenant leases that had been executed as of September 30, 2022 but that had not yet commenced. Annualized Base Rent and gross leasable area (square feet) are in thousands; any differences are the result of rounding.
| (1) | Annualized Base Rent (“ABR”) represents the annualized amount of contractual minimum rent required by tenant lease agreements as of September 30, 2022, computed on a straight-line basis. Annualized Base Rent is not, and is not intended to be, a presentation in accordance with generally accepted accounting principles (“GAAP”). The Company believes annualized contractual minimum rent is useful to management, investors, and other interested parties in analyzing concentrations and leasing activity. |
5
Top Tenants
The Company added Gerber Collision to its top tenants during the third quarter of 2022. The following table presents annualized base rents for all tenants that represent 1.5% or greater of the Company’s total annualized base rent as of September 30, 2022:
| Tenant | Annualized Base Rent(1) | % of ABR | ||||||
| Walmart | $ | 30,801 | 6.9 | % | ||||
| Tractor Supply(2) | 20,044 | 4.5 | % | |||||
| Dollar General | 19,320 | 4.4 | % | |||||
| Best Buy | 18,377 | 4.1 | % | |||||
| TJX Companies | 13,251 | 3.0 | % | |||||
| O'Reilly Auto Parts | 13,133 | 3.0 | % | |||||
| Kroger | 12,825 | 2.9 | % | |||||
| CVS | 11,928 | 2.7 | % | |||||
| Hobby Lobby | 11,904 | 2.7 | % | |||||
| Lowe's | 11,634 | 2.6 | % | |||||
| Dollar Tree | 11,613 | 2.6 | % | |||||
| Burlington | 11,160 | 2.5 | % | |||||
| Sherwin-Williams | 10,849 | 2.4 | % | |||||
| Wawa | 9,667 | 2.2 | % | |||||
| Sunbelt Rentals | 9,620 | 2.2 | % | |||||
| Home Depot | 8,880 | 2.0 | % | |||||
| TBC Corporation | 8,412 | 1.9 | % | |||||
| Goodyear | 7,577 | 1.7 | % | |||||
| AutoZone | 7,269 | 1.6 | % | |||||
| Gerber Collision | 6,721 | 1.5 | % | |||||
| Other(3) | 188,867 | 42.6 | % | |||||
| Total Portfolio | $ | 443,852 | 100.0 | % | ||||
Annualized Base Rent is in thousands; any differences are the result of rounding.
Bolded and italicized tenants represent additions for the three months ended September 30, 2022.
| (1) | Refer to footnote 1 on page 5 for the Company’s definition of Annualized Base Rent. |
| (2) | Reflects Tractor Supply’s previously announced acquisition of Orscheln Farm and Home, which received approval from the Federal Trade Commission on October 11, 2022. |
| (3) | Includes tenants generating less than 1.5% of Annualized Base Rent. |
6
Retail Sectors
The following table presents annualized base rents for all of the Company’s retail sectors as of September 30, 2022:
| Sector | Annualized Base Rent(1) | % of ABR | ||||||
| Grocery Stores | $ | 41,557 | 9.4 | % | ||||
| Home Improvement | 40,615 | 9.2 | % | |||||
| Tire and Auto Service | 40,289 | 9.1 | % | |||||
| Convenience Stores | 33,075 | 7.5 | % | |||||
| Dollar Stores | 29,468 | 6.6 | % | |||||
| General Merchandise | 29,352 | 6.6 | % | |||||
| Off-Price Retail | 26,814 | 6.0 | % | |||||
| Auto Parts | 25,805 | 5.8 | % | |||||
| Farm and Rural Supply | 21,307 | 4.8 | % | |||||
| Consumer Electronics | 20,179 | 4.5 | % | |||||
| Pharmacy | 18,634 | 4.2 | % | |||||
| Crafts and Novelties | 14,141 | 3.2 | % | |||||
| Equipment Rental | 9,946 | 2.2 | % | |||||
| Discount Stores | 9,536 | 2.1 | % | |||||
| Warehouse Clubs | 9,411 | 2.1 | % | |||||
| Health Services | 8,981 | 2.0 | % | |||||
| Health and Fitness | 8,075 | 1.8 | % | |||||
| Restaurants - Quick Service | 7,931 | 1.8 | % | |||||
| Dealerships | 6,506 | 1.5 | % | |||||
| Specialty Retail | 6,367 | 1.4 | % | |||||
| Restaurants - Casual Dining | 4,944 | 1.1 | % | |||||
| Home Furnishings | 4,892 | 1.1 | % | |||||
| Sporting Goods | 4,833 | 1.1 | % | |||||
| Financial Services | 4,538 | 1.0 | % | |||||
| Theaters | 3,848 | 0.9 | % | |||||
| Pet Supplies | 2,860 | 0.7 | % | |||||
| Entertainment Retail | 2,323 | 0.5 | % | |||||
| Beauty and Cosmetics | 2,208 | 0.5 | % | |||||
| Shoes | 2,006 | 0.5 | % | |||||
| Apparel | 1,405 | 0.3 | % | |||||
| Miscellaneous | 1,153 | 0.3 | % | |||||
| Office Supplies | 853 | 0.2 | % | |||||
| Total Portfolio | $ | 443,852 | 100.0 | % | ||||
Annualized Base Rent is in thousands; any differences are the result of rounding.
| (1) | Refer to footnote 1 on page 5 for the Company’s definition of Annualized Base Rent. |
7
Geographic Diversification
The following table presents annualized base rents for all states that represent 2.5% or greater of the Company’s total annualized base rent as of September 30, 2022:
| State | Annualized
Base Rent(1) | % of ABR | ||||||
| Texas | $ | 33,091 | 7.5 | % | ||||
| Florida | 24,907 | 5.6 | % | |||||
| North Carolina | 24,749 | 5.6 | % | |||||
| Illinois | 24,302 | 5.5 | % | |||||
| Ohio | 24,249 | 5.5 | % | |||||
| Michigan | 23,339 | 5.3 | % | |||||
| New Jersey | 21,575 | 4.9 | % | |||||
| Pennsylvania | 20,999 | 4.7 | % | |||||
| California | 18,637 | 4.2 | % | |||||
| New York | 17,478 | 3.9 | % | |||||
| Georgia | 15,859 | 3.6 | % | |||||
| Virginia | 13,771 | 3.1 | % | |||||
| Connecticut | 12,618 | 2.8 | % | |||||
| Wisconsin | 11,542 | 2.6 | % | |||||
| Other(2) | 156,736 | 35.2 | % | |||||
| Total Portfolio | $ | 443,852 | 100.0 | % | ||||
Annualized Base Rent is in thousands; any differences are the result of rounding.
| (1) | Refer to footnote 1 on page 5 for the Company’s definition of Annualized Base Rent. |
| (2) | Includes states generating less than 2.5% of Annualized Base Rent. |
8
Capital Markets and Balance Sheet
Capital Markets
In August 2022, the Company completed a $300 million public bond offering of 4.80% senior unsecured notes due 2032 (the “2032 Notes”). In connection with the offering, the Company terminated related swap agreements of $300 million, receiving $28.4 million upon termination. Considering the effect of the terminated swap agreements, the effective all-in rate to the Company for the 2032 Notes is 3.76%.
During the third quarter, the Company entered into forward sale agreements in connection with its ATM program to sell an aggregate of 1,688,390 shares of common stock for anticipated net proceeds of $127.2 million.
In September 2022, the Company commenced a follow-on public offering of 5,750,000 shares of common stock, including the full exercise of the underwriters' option to purchase additional shares, in connection with forward sale agreements. Upon settlement, the offering is anticipated to raise net proceeds of $381.7 million after deducting fees and making certain other adjustments as provided in the equity distribution agreements. To date, the Company has not received any proceeds from the sale of shares of its common stock by the forward purchasers.
In conjunction with the forward equity offering in September, the Company settled 8,739,752 shares under existing forward sale agreements and received net proceeds of $601.4 million. At quarter end, the Company had 5,750,000 shares remaining to be settled under existing forward sale agreements, which are anticipated to raise net proceeds of $381.7 million upon settlement.
The following table presents the Company’s outstanding forward equity offerings as of September 30, 2022:
| Forward Equity Offerings | Shares
Sold | Shares
Settled | Shares
Remaining | Net Proceeds Received | Anticipated
Net Proceeds Remaining | |||||||||||||||
| September 2022 Forward Offering(1) | 5,750,000 | - | 5,750,000 | - | $ | 381,708,000 | ||||||||||||||
| Total Forward Equity Offerings | 5,750,000 | - | 5,750,000 | - | $ | 381,708,000 | ||||||||||||||
(1) On September 28, 2022, the Company commenced a follow-on public offering of 5,750,000 shares of common stock, including the underwriters' option to purchase additional shares. The offering closed on October 3, 2022.
Balance Sheet
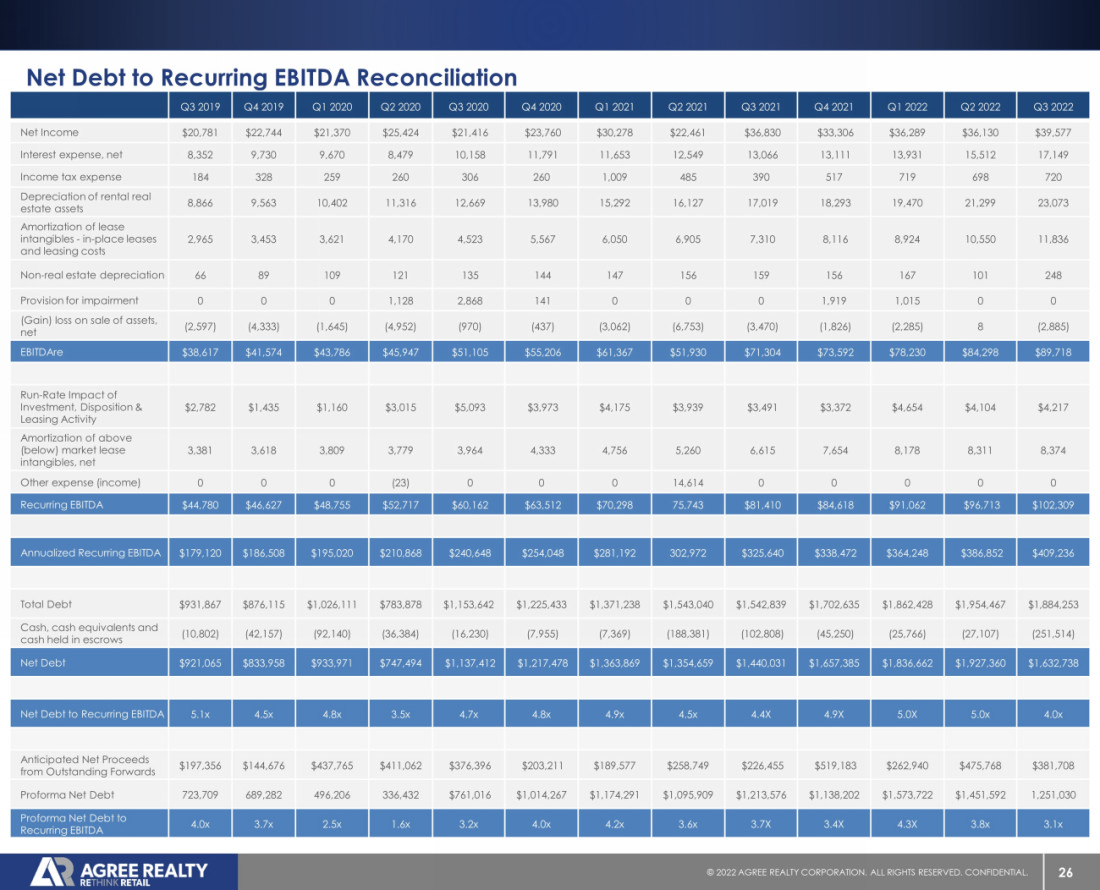
As of September 30, 2022, the Company’s net debt to recurring EBITDA was 4.0 times. The Company’s proforma net debt to recurring EBITDA was 3.1 times when deducting the $381.7 million of anticipated net proceeds from the outstanding forward equity offerings from the Company’s net debt of $1.6 billion at quarter end. The Company’s fixed charge coverage ratio was 5.0 times as of the quarter end.
The Company’s total debt to enterprise value was 24.1% as of September 30, 2022. Enterprise value is calculated as the sum of net debt, the liquidation value of the Company’s preferred stock, and the market value of the Company’s outstanding shares of common stock, assuming conversion of Agree Limited Partnership (the “Operating Partnership” or “OP”) common units into common stock of the Company.
For the three and nine months ended September 30, 2022, the Company's fully diluted weighted-average shares outstanding were 80.6 million and 75.9 million, respectively. The basic weighted-average shares outstanding for the three and nine months ended September 30, 2022 were 79.7 million and 75.4 million, respectively.
9
For the three and nine months ended September 30, 2022, the Company's fully diluted weighted-average shares and units outstanding were 80.9 million and 76.2 million, respectively. The basic weighted-average shares and units outstanding for the three and nine months ended September 30, 2022 were 80.0 million and 75.7 million, respectively.
The Company's assets are held by, and its operations are conducted through, the Operating Partnership, of which the Company is the sole general partner. As of September 30, 2022, there were 347,619 Operating Partnership common units outstanding and the Company held a 99.6% common interest in the Operating Partnership.
Conference Call/Webcast
The Company will host its quarterly analyst and investor conference call on Wednesday, November 2, 2022 at 9:00 AM ET. To participate in the conference call, please dial (866) 363-3979 approximately ten minutes before the call begins.
Additionally, a webcast of the conference call will be available through the Company’s website. To access the webcast, visit www.agreerealty.com ten minutes prior to the start time of the conference call and go to the Investors section of the website. A replay of the conference call webcast will be archived and available online through the Investors section of www.agreerealty.com.
About Agree Realty Corporation
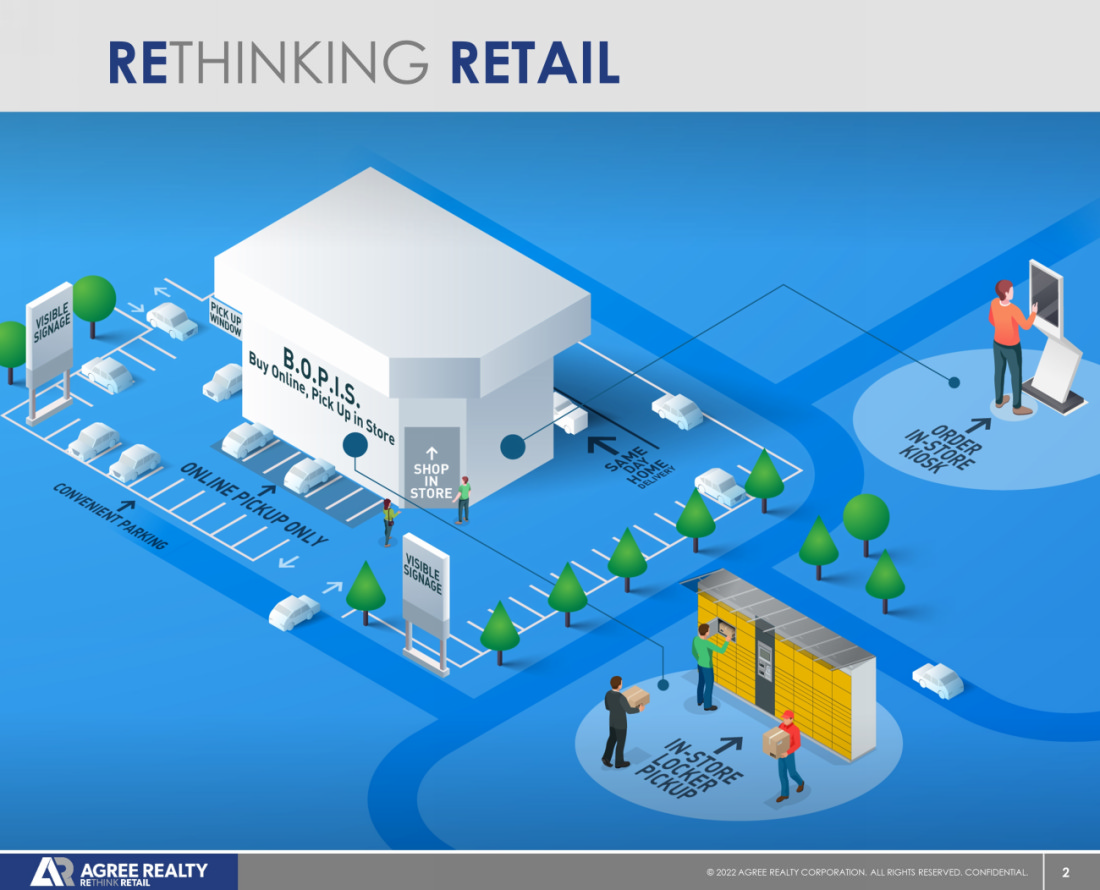
Agree Realty Corporation is a publicly traded real estate investment trust that is RETHINKING RETAIL through the acquisition and development of properties net leased to industry-leading, omni-channel retail tenants. As of September 30, 2022, the Company owned and operated a portfolio of 1,707 properties, located in all 48 continental states and containing approximately 35.8 million square feet of gross leasable area. The Company’s common stock is listed on the New York Stock Exchange under the symbol “ADC”. For additional information on the Company and RETHINKING RETAIL, please visit www.agreerealty.com.
Forward-Looking Statements
This press release contains forward-looking statements, including statements about projected financial and operating results, within the meaning of Section 27A of the Securities Act of 1933, as amended (the “Securities Act”) and Section 21E of the Securities Exchange Act of 1934, as amended (the “Exchange Act”). The Company intends such forward-looking statements to be covered by the safe harbor provisions for forward-looking statements contained in the Private Securities Litigation Reform Act of 1995 and includes this statement for purposes of complying with these safe harbor provisions. Forward-looking statements are generally identifiable by use of forward-looking terminology such as “may,” “will,” “should,” “potential,” “intend,” “expect,” “seek,” “anticipate,” “estimate,” “approximately,” “believe,” “could,” “project,” “predict,” “forecast,” “continue,” “assume,” “plan,” “outlook” or other similar words or expressions. Forward-looking statements are based on certain assumptions and can include future expectations, future plans and strategies, financial and operating projections or other forward-looking information. Although these forward-looking statements are based on good faith beliefs, reasonable assumptions and the Company’s best judgment reflecting current information, you should not rely on forward-looking statements since they involve known and unknown risks, uncertainties and other factors which are, in some cases, beyond the Company’s control and which could materially affect the Company’s results of operations, financial condition, cash flows, performance or future achievements or events. Currently, one of the most significant factors, however, is the potential adverse effect of ongoing worldwide economic uncertainties, the current pandemic of the novel coronavirus, or COVID-19, increased inflation and interest rates on the financial condition, results of operations, cash flows and performance of the Company and its tenants, the real estate market and the global economy and financial markets. The extent to which these conditions will impact the Company and its tenants will depend on future developments, which are highly uncertain and cannot be predicted with confidence. Moreover, investors are cautioned to interpret many of the risks identified in the risk factors discussed in the Company’s Annual Report on Form 10-K and subsequent quarterly reports filed with the Securities and Exchange Commission (the “SEC”), as well as the risks set forth below, as being heightened as a result of the ongoing and numerous adverse impacts of the macroeconomic environment and COVID-19. Additional important factors, among others, that may cause the Company’s actual results to vary include the general deterioration in national economic conditions, weakening of real estate markets, decreases in the availability of credit, increases in interest rates, adverse changes in the retail industry, the Company’s continuing ability to qualify as a REIT and other factors discussed in the Company’s reports filed with the SEC. The forward-looking statements included in this press release are made as of the date hereof. Unless legally required, the Company disclaims any obligation to update any forward-looking statements, whether as a result of new information, future events, changes in the Company’s expectations or assumptions or otherwise.
10
For further information about the Company’s business and financial results, please refer to the “Management’s Discussion and Analysis of Financial Condition and Results of Operations” and “Risk Factors” sections of the Company’s SEC filings, including, but not limited to, its Annual Report on Form 10-K and Quarterly Reports on Form 10-Q, copies of which may be obtained at the Investor Relations section of the Company’s website at www.agreerealty.com.
The Company defines the “weighted-average capitalization rate” for acquisitions and dispositions as the sum of contractual fixed annual rents computed on a straight-line basis over the primary lease terms and anticipated annual net tenant recoveries, divided by the purchase and sale prices for occupied properties.
References to “Core FFO” and “AFFO” in this press release are representative of Core FFO attributable to OP common unitholders and AFFO attributable to OP common unitholders. Detailed calculations for these measures are shown in the Reconciliation of Net Income to FFO, Core FFO and Adjusted FFO table as “Core Funds From Operations – OP Common Unitholders” and “Adjusted Funds from Operations – OP Common Unitholders”.
###
Contact:
Peter Coughenour
Chief Financial Officer
Agree Realty Corporation
(248) 737-4190
11
Agree Realty Corporation
Consolidated Balance Sheet
($ in thousands, except share and per-share data)
(Unaudited)
| September 30, 2022 | December 31, 2021 | |||||||
| Assets: | ||||||||
| Real Estate Investments: | ||||||||
| Land | $ | 1,841,259 | $ | 1,559,434 | ||||
| Buildings | 3,795,181 | 3,034,391 | ||||||
| Accumulated depreciation | (296,304 | ) | (233,862 | ) | ||||
| Property under development | 50,685 | 7,148 | ||||||
| Net real estate investments | 5,390,821 | 4,367,111 | ||||||
| Real estate held for sale, net | - | 5,676 | ||||||
| Cash and cash equivalents | 250,487 | 43,252 | ||||||
| Cash held in escrows | 1,027 | 1,998 | ||||||
| Accounts receivable - tenants, net | 68,697 | 53,442 | ||||||
| Lease Intangibles, net of accumulated amortization of $240,244 and $180,532 at September 30, 2022 and December 31, 2021, respectively | 763,458 | 672,020 | ||||||
| Other assets, net | 81,611 | 83,407 | ||||||
| Total Assets | $ | 6,556,101 | $ | 5,226,906 | ||||
| Liabilities: | ||||||||
| Mortgage notes payable, net | $ | 71,721 | $ | 32,429 | ||||
| Senior unsecured notes, net | 1,791,492 | 1,495,200 | ||||||
| Unsecured revolving credit facility | - | 160,000 | ||||||
| Dividends and distributions payable | 21,427 | 16,881 | ||||||
| Accounts payable, accrued expenses and other liabilities | 85,637 | 70,005 | ||||||
| Lease intangibles, net of accumulated amortization of $34,356 and $29,726 at September 30, 2022 and December 31, 2021, respectively | 37,117 | 33,075 | ||||||
| Total Liabilities | $ | 2,007,394 | $ | 1,807,590 | ||||
| Equity: | ||||||||
| Preferred Stock, $.0001 par value per share, 4,000,000 shares authorized, 7,000 shares Series A outstanding, at stated liquidation value of $25,000 per share, at September 30, 2022 and December 31, 2021 | 175,000 | 175,000 | ||||||
| Common stock, $.0001 par value, 180,000,000 shares authorized, 88,573,248 and 71,285,311 shares issued and outstanding at September 30, 2022 and December 31, 2021, respectively | 9 | 7 | ||||||
| Additional paid-in capital | 4,551,081 | 3,395,549 | ||||||
| Dividends in excess of net income | (203,040 | ) | (147,366 | ) | ||||
| Accumulated other comprehensive income (loss) | 24,124 | (5,503 | ) | |||||
| Total Equity - Agree Realty Corporation | $ | 4,547,174 | $ | 3,417,687 | ||||
| Non-controlling interest | 1,533 | 1,629 | ||||||
| Total Equity | $ | 4,548,707 | $ | 3,419,316 | ||||
| Total Liabilities and Equity | $ | 6,556,101 | $ | 5,226,906 | ||||
12
Agree Realty Corporation
Consolidated Statements of Operations and Comprehensive Income
($ in thousands, except share and per share-data)
(Unaudited)
| Three months
ended September 30, | Nine months
ended September 30, | |||||||||||||||
| 2022 | 2021 | 2022 | 2021 | |||||||||||||
| Revenues | ||||||||||||||||
| Rental Income | $ | 110,031 | $ | 87,469 | $ | 313,136 | $ | 247,722 | ||||||||
| Other | 34 | 68 | 147 | 189 | ||||||||||||
| Total Revenues | $ | 110,065 | $ | 87,537 | $ | 313,283 | $ | 247,911 | ||||||||
| Operating Expenses | ||||||||||||||||
| Real estate taxes | $ | 8,526 | $ | 6,957 | $ | 24,117 | $ | 18,812 | ||||||||
| Property operating expenses | 4,557 | 3,189 | 13,575 | 9,944 | ||||||||||||
| Land lease expense | 404 | 400 | 1,213 | 1,135 | ||||||||||||
| General and administrative | 6,992 | 5,687 | 22,265 | 18,806 | ||||||||||||
| Depreciation and amortization | 35,157 | 24,488 | 95,666 | 69,164 | ||||||||||||
| Provision for impairment | - | - | 1,015 | - | ||||||||||||
| Total Operating Expenses | $ | 55,636 | $ | 40,721 | $ | 157,851 | $ | 117,861 | ||||||||
| Gain (loss) on sale of assets, net | 3,000 | 3,470 | 5,326 | 13,182 | ||||||||||||
| Gain (loss) on involuntary conversion, net | (115 | ) | - | (165 | ) | 103 | ||||||||||
| Income from Operations | $ | 57,314 | $ | 50,286 | $ | 160,593 | $ | 143,335 | ||||||||
| Other (Expense) Income | ||||||||||||||||
| Interest expense, net | $ | (17,149 | ) | $ | (13,066 | ) | $ | (46,592 | ) | $ | (37,267 | ) | ||||
| Income tax (expense) benefit | (720 | ) | (390 | ) | (2,137 | ) | (1,884 | ) | ||||||||
| Loss on early extinguishment of term loans and settlement of related interest rate swaps | - | - | - | (14,614 | ) | |||||||||||
| Other (expense) income | 132 | - | 132 | - | ||||||||||||
| Net Income | $ | 39,577 | $ | 36,830 | $ | 111,996 | $ | 89,570 | ||||||||
| Less net income attributable to non-controlling interest | 152 | 167 | 485 | 447 | ||||||||||||
| Net Income Attributable to Agree Realty Corporation | $ | 39,425 | $ | 36,663 | $ | 111,511 | $ | 89,123 | ||||||||
| Less Series A Preferred Stock Dividends | 1,859 | 289 | 5,578 | 289 | ||||||||||||
| Net Income Attributable to Common Stockholders | $ | 37,566 | $ | 36,374 | $ | 105,933 | $ | 88,834 | ||||||||
| Net Income Per Share Attributable to Common Stockholders | ||||||||||||||||
| Basic | $ | 0.47 | $ | 0.52 | $ | 1.40 | $ | 1.35 | ||||||||
| Diluted | $ | 0.46 | $ | 0.52 | $ | 1.39 | $ | 1.34 | ||||||||
| Other Comprehensive Income | ||||||||||||||||
| Net Income | $ | 39,577 | $ | 36,830 | $ | 111,996 | $ | 89,570 | ||||||||
| Amortization of interest rate swaps | (273 | ) | 82 | (109 | ) | 869 | ||||||||||
| Change in fair value and settlement of interest rate swaps | (7,181 | ) | 3,300 | 29,881 | 30,676 | |||||||||||
| Total Comprehensive Income (Loss) | 32,123 | 40,212 | 141,768 | 121,115 | ||||||||||||
| Less comprehensive income attributable to non-controlling interest | 121 | 185 | 630 | 465 | ||||||||||||
| Comprehensive Income Attributable to Agree Realty Corporation | $ | 32,002 | $ | 40,027 | $ | 141,138 | $ | 120,650 | ||||||||
| Weighted Average Number of Common Shares Outstanding - Basic | 79,701,136 | 69,102,500 | 75,361,583 | 65,623,720 | ||||||||||||
| Weighted Average Number of Common Shares Outstanding - Diluted | 80,589,446 | 69,591,848 | 75,890,692 | 65,952,113 | ||||||||||||
13
Agree Realty Corporation
Reconciliation of Net Income to FFO, Core FFO and Adjusted FFO
($ in thousands, except share and per-share data)
(Unaudited)
| Three months
ended September 30, | Nine months
ended September 30, | |||||||||||||||
| 2022 | 2021 | 2022 | 2021 | |||||||||||||
| Net Income | $ | 39,577 | $ | 36,830 | $ | 111,996 | $ | 89,570 | ||||||||
| Less Series A Preferred Stock Dividends | 1,859 | 289 | 5,578 | 289 | ||||||||||||
| Net Income attributable to OP Common Unitholders | 37,718 | 36,541 | 106,418 | 89,281 | ||||||||||||
| Depreciation of rental real estate assets | 23,073 | 17,019 | 63,842 | 48,439 | ||||||||||||
| Amortization of lease intangibles - in-place leases and leasing costs | 11,836 | 7,310 | 31,307 | 20,263 | ||||||||||||
| Provision for impairment | - | - | 1,015 | - | ||||||||||||
| (Gain) loss on sale or involuntary conversion of assets, net | (2,885 | ) | (3,470 | ) | (5,161 | ) | (13,285 | ) | ||||||||
| Funds from Operations - OP Common Unitholders | $ | 69,742 | $ | 57,400 | $ | 197,421 | $ | 144,698 | ||||||||
| Loss on extinguishment of debt and settlement of related hedges | - | - | - | 14,614 | ||||||||||||
| Amortization of above (below) market lease intangibles, net and assumed mortgage debt discount | 8,458 | 6,615 | 25,007 | 16,630 | ||||||||||||
| Core Funds from Operations - OP Common Unitholders | $ | 78,200 | $ | 64,015 | $ | 222,428 | $ | 175,942 | ||||||||
| Straight-line accrued rent | (3,189 | ) | (3,215 | ) | (9,419 | ) | (8,779 | ) | ||||||||
| Stock based compensation expense | 1,514 | 986 | 4,892 | 3,967 | ||||||||||||
| Amortization of financing costs | 791 | 203 | 2,070 | 692 | ||||||||||||
| Non-real estate depreciation | 248 | 159 | 517 | 462 | ||||||||||||
| Adjusted Funds from Operations - OP Common Unitholders | $ | 77,564 | $ | 62,148 | $ | 220,488 | $ | 172,284 | ||||||||
| Funds from Operations Per Common Share and OP Unit - Basic | $ | 0.87 | $ | 0.83 | $ | 2.61 | $ | 2.19 | ||||||||
| Funds from Operations Per Common Share and OP Unit - Diluted | $ | 0.86 | $ | 0.82 | $ | 2.59 | $ | 2.18 | ||||||||
| Core Funds from Operations Per Common Share and OP Unit - Basic | $ | 0.98 | $ | 0.92 | $ | 2.94 | $ | 2.67 | ||||||||
| Core Funds from Operations Per Common Share and OP Unit - Diluted | $ | 0.97 | $ | 0.92 | $ | 2.92 | $ | 2.65 | ||||||||
| Adjusted Funds from Operations Per Common Share and OP Unit - Basic | $ | 0.97 | $ | 0.89 | $ | 2.91 | $ | 2.61 | ||||||||
| Adjusted Funds from Operations Per Common Share and OP Unit - Diluted | $ | 0.96 | $ | 0.89 | $ | 2.89 | $ | 2.60 | ||||||||
| Weighted Average Number of Common Shares and OP Units Outstanding - Basic | 80,048,755 | 69,450,119 | 75,709,202 | 65,971,339 | ||||||||||||
| Weighted Average Number of Common Shares and OP Units Outstanding - Diluted | 80,937,065 | 69,939,467 | 76,238,311 | 66,299,732 | ||||||||||||
| Additional supplemental disclosure | ||||||||||||||||
| Scheduled principal repayments | $ | 214 | $ | 201 | $ | 633 | $ | 594 | ||||||||
| Capitalized interest | 554 | 36 | 816 | 200 | ||||||||||||
| Capitalized building improvements | 3,135 | 1,921 | 6,977 | 4,376 | ||||||||||||
Non-GAAP Financial Measures
Funds from Operations (“FFO” or “Nareit FFO”)
FFO is defined by the National Association of Real Estate Investment Trusts, Inc. (“Nareit”) to mean net income computed in accordance with GAAP, excluding gains (or losses) from sales of real estate assets and/or changes in control, plus real estate related depreciation and amortization and any impairment charges on depreciable real estate assets, and after adjustments for unconsolidated partnerships and joint ventures. Historical cost accounting for real estate assets in accordance with GAAP implicitly assumes that the value of real estate assets diminishes predictably over time. Since real estate values instead have historically risen or fallen with market conditions, most real estate industry investors consider FFO to be helpful in evaluating a real estate company’s operations. FFO should not be considered an alternative to net income as the primary indicator of the Company’s operating performance, or as an alternative to cash flow as a measure of liquidity. Further, while the Company adheres to the Nareit definition of FFO, its presentation of FFO is not necessarily comparable to similarly titled measures of other REITs due to the fact that all REITs may not use the same definition.
Core Funds from Operations (“Core FFO”)
The Company defines Core FFO as Nareit FFO with the addback of (i) noncash amortization of acquisition purchase price related to above- and below- market lease intangibles and discount on assumed debt and (ii) certain infrequently occurring items that reduce or increase net income in accordance with GAAP. Management believes that its measure of Core FFO facilitates useful comparison of performance to its peers who predominantly transact in sale-leaseback transactions and are thereby not required by GAAP to allocate purchase price to lease intangibles. Unlike many of its peers, the Company has acquired the substantial majority of its net-leased properties through acquisitions of properties from third parties or in connection with the acquisitions of ground leases from third parties. Core FFO should not be considered an alternative to net income as the primary indicator of the Company’s operating performance, or as an alternative to cash flow as a measure of liquidity. Further, the Company’s presentation of Core FFO is not necessarily comparable to similarly titled measures of other REITs due to the fact that all REITs may not use the same definition.
Adjusted Funds from Operations (“AFFO”)
AFFO is a non-GAAP financial measure of operating performance used by many companies in the REIT industry. AFFO further adjusts FFO and Core FFO for certain non-cash items that reduce or increase net income computed in accordance with GAAP. Management considers AFFO a useful supplemental measure of the Company’s performance, however, AFFO should not be considered an alternative to net income as an indication of its performance, or to cash flow as a measure of liquidity or ability to make distributions. The Company’s computation of AFFO may differ from the methodology for calculating AFFO used by other equity REITs, and therefore may not be comparable to such other REITs.
14
Agree Realty Corporation
Reconciliation of Net Debt to Recurring EBITDA
($ in thousands, except share and per-share data)
(Unaudited)
| Three
months ended September 30, | ||||
| 2022 | ||||
| Net Income | $ | 39,577 | ||
| Interest expense, net | 17,149 | |||
| Income tax expense | 720 | |||
| Depreciation of rental real estate assets | 23,073 | |||
| Amortization of lease intangibles - in-place leases and leasing costs | 11,836 | |||
| Non-real estate depreciation | 248 | |||
| (Gain) loss on sale or involuntary conversion of assets, net | (2,885 | ) | ||
| EBITDAre | $ | 89,718 | ||
| Run-Rate Impact of Investment, Disposition and Leasing Activity | $ | 4,217 | ||
| Amortization of above (below) market lease intangibles, net | 8,374 | |||
| Recurring EBITDA | $ | 102,309 | ||
| Annualized Recurring EBITDA | $ | 409,236 | ||
| Total Debt | $ | 1,884,253 | ||
| Cash, cash equivalents and cash held in escrows | (251,514 | ) | ||
| Net Debt | $ | 1,632,739 | ||
| Net Debt to Recurring EBITDA | 4.0 | x | ||
| Net Debt | $ | 1,632,739 | ||
| Anticipated Net Proceeds from September 2022 Forward Offering | (381,708 | ) | ||
| Proforma Net Debt | $ | 1,251,031 | ||
| Proforma Net Debt to Recurring EBITDA | 3.1 | x | ||
Non-GAAP Financial Measures
EBITDAre
EBITDAre is defined by Nareit to mean net income computed in accordance with GAAP, plus interest expense, income tax expense, depreciation and amortization, any gains (or losses) from sales of real estate assets and/or changes in control, any impairment charges on depreciable real estate assets, and after adjustments for unconsolidated partnerships and joint ventures. The Company considers the non-GAAP measure of EBITDAre to be a key supplemental measure of the Company's performance and should be considered along with, but not as an alternative to, net income or loss as a measure of the Company's operating performance. The Company considers EBITDAre a key supplemental measure of the Company's operating performance because it provides an additional supplemental measure of the Company's performance and operating cash flow that is widely known by industry analysts, lenders and investors. The Company’s calculation of EBITDAre may not be comparable to EBITDAre reported by other REITs that interpret the Nareit definition differently than the Company.
Recurring EBITDA
The Company defines Recurring EBITDA as EBITDAre with the addback of noncash amortization of above- and below- market lease intangibles, and after adjustments for the run-rate impact of the Company's investment and disposition activity for the period presented, as well as adjustments for non-recurring benefits or expenses. The Company considers the non-GAAP measure of Recurring EBITDA to be a key supplemental measure of the Company's performance and should be considered along with, but not as an alternative to, net income or loss as a measure of the Company's operating performance. The Company considers Recurring EBITDA a key supplemental measure of the Company's operating performance because it represents the Company's earnings run rate for the period presented and because it is widely followed by industry analysts, lenders and investors. Our Recurring EBITDA may not be comparable to Recurring EBITDA reported by other companies that have a different interpretation of the definition of Recurring EBITDA. Our ratio of net debt to Recurring EBITDA is used by management as a measure of leverage and may be useful to investors in understanding the Company’s ability to service its debt, as well as assess the borrowing capacity of the Company. Our ratio of net debt to Recurring EBITDA is calculated by taking annualized Recurring EBITDA and dividing it by our net debt per the consolidated balance sheet.
Net Debt
The Company defines Net Debt as total debt less cash, cash equivalents and cash held in escrows. The Company considers the non-GAAP measure of Net Debt to be a key supplemental measure of the Company's overall liquidity, capital structure and leverage. The Company considers Net Debt a key supplemental measure because it provides industry analysts, lenders and investors useful information in understanding our financial condition. The Company’s calculation of Net Debt may not be comparable to Net Debt reported by other REITs that interpret the definition differently than the Company. The Company presents Net Debt on both an actual and proforma basis, assuming the net proceeds of the Forward Offerings (see below) are used to pay down debt. The Company believes the proforma measure may be useful to investors in understanding the potential effect of the Forward Offerings on the Company’s capital structure, its future borrowing capacity, and its ability to service its debt.
Forward Offerings
In September 2022, the Company commenced an underwritten public offering of 5,750,000 shares of common stock, including the full exercise of the underwriters' option to purchase additional shares, in connection with forward sale agreements. Upon settlement, the September 2022 Forward Offering is anticipated to raise net proceeds of approximately $381.7 million based on the applicable forward sale price. The Company is contractually obligated to settle the offering by September 2023. The September 2022 Forward Offering closed on October 3, 2022.
15
Agree Realty Corporation
Rental Income
($ in thousands, except share and per share-data)
(Unaudited)
| Three months
ended September 30, | Nine months
ended September 30, | |||||||||||||||
| 2022 | 2021 | 2022 | 2021 | |||||||||||||
| Rental Income Source(1) | ||||||||||||||||
| Minimum rents(2) | $ | 103,208 | $ | 81,334 | $ | 292,890 | $ | 228,494 | ||||||||
| Percentage rents(2) | - | 102 | 723 | 593 | ||||||||||||
| Operating cost reimbursement(2) | 12,008 | 9,433 | 34,967 | 26,486 | ||||||||||||
| Straight-line rental adjustments(3) | 3,189 | 3,215 | 9,419 | 8,779 | ||||||||||||
| Amortization of (above) below market lease intangibles(4) | (8,374 | ) | (6,615 | ) | (24,863 | ) | (16,630 | ) | ||||||||
| Total Rental Income | $ | 110,031 | $ | 87,469 | $ | 313,136 | $ | 247,722 | ||||||||
(1) The Company adopted Financial Accounting Standards Board Accounting Standards Codification (“FASB ASC”) 842 “Leases” using the modified retrospective approach as of January 1, 2019. The Company adopted the practical expedient in FASB ASC 842 that alleviates the requirement to separately present lease and non-lease components of lease contracts. As a result, all income earned pursuant to tenant leases is reflected as one line, “Rental Income,” in the consolidated statement of operations. The purpose of this table is to provide additional supplementary detail of Rental Income.
(2) Represents contractual rentals and/or reimbursements as required by tenant lease agreements, recognized on an accrual basis of accounting. The Company believes that the presentation of contractual lease income is not, and is not intended to be, a presentation in accordance with GAAP. The Company believes this information is frequently used by management, investors, analysts and other interested parties to evaluate the Company’s performance.
(3) Represents adjustments to recognize minimum rents on a straight-line basis, consistent with the requirements of FASB ASC 842.
(4) In allocating the fair value of an acquired property, above- and below-market lease intangibles are recorded based on the present value of the difference between the contractual amounts to be paid pursuant to the leases at the time of acquisition and the Company’s estimate of current market lease rates for the property.
16