UNITED STATES
SECURITIES AND EXCHANGE COMMISSION
Washington, D.C. 20549
________________________________________
FORM 10-K
________________________________________
x | Annual Report Pursuant to Section 13 or 15(d) of the Securities Exchange Act of 1934 |
or
¨ | Transition Report Pursuant to Section 13 or 15(d) of the Securities Exchange Act of 1934 |
Commission file number 001-12658
ALBEMARLE CORPORATION
(Exact name of registrant as specified in its charter)
VIRGINIA | 54-1692118 | |
(State or other jurisdiction of incorporation or organization) | (I.R.S. Employer Identification No.) | |
Baton Rouge, Louisiana 70801
(Address of principal executive offices) (Zip Code)
Registrant’s telephone number, including area code: 225-388-8011
Securities registered pursuant to Section 12(b) of the Act:
Title of each class | Name of each exchange on which registered | |
COMMON STOCK, $.01 Par Value | NEW YORK STOCK EXCHANGE | |
Indicate by check mark if the registrant is a well-known seasoned issuer, as defined in Rule 405 of the Securities Act. Yes x No ¨
Indicate by check mark if the registrant is not required to file reports pursuant to Section 13 or Section 15(d) of the Act. Yes ¨ No x
Indicate by check mark whether the registrant (1) has filed all reports required to be filed by Section 13 or 15(d) of the Securities Exchange Act of 1934 during the preceding 12 months (or for such shorter period that the registrant was required to file such reports), and (2) has been subject to such filing requirements for at least the past 90 days. Yes x No ¨
Indicate by check mark whether the registrant has submitted electronically and posted on its Corporate Web site, if any, every Interactive Data File required to be submitted and posted pursuant to Rule 405 of Regulation S-T (§232.405 of this chapter) during the preceding 12 months (or for such shorter period that the registrant was required to submit and post such files). Yes x No ¨
Indicate by check mark if disclosure of delinquent filers pursuant to Item 405 of Regulation S-K (§229.405) is not contained herein, and will not be contained, to the best of registrant’s knowledge, in definitive proxy or information statements incorporated by reference in Part III of this Form 10-K or any amendment to this Form 10-K. x
Indicate by check mark whether the registrant is a large accelerated filer, an accelerated filer, a non-accelerated filer, or a smaller reporting company. See the definitions of “large accelerated filer,” “accelerated filer,” and “smaller reporting company” in Rule 12b-2 of the Exchange Act. (Check one):
Large accelerated filer | x | Accelerated filer | ¨ | Non-accelerated filer | ¨ | Smaller reporting company | ¨ | |||
Indicate by check mark whether the registrant is a shell company (as defined in Rule 12b-2 of the Exchange Act). Yes ¨ No x
The aggregate market value of the voting and non-voting common equity stock held by non-affiliates of the registrant was approximately $6.2 billion based on the reported last sale price of common stock on June 30, 2015, the last business day of the registrant’s most recently completed second quarter.
Number of shares of common stock outstanding as of February 17, 2016: 112,250,676
Documents Incorporated by Reference
Portions of Albemarle Corporation’s definitive Proxy Statement for its 2016 Annual Meeting of Shareholders to be filed with the Securities and Exchange Commission pursuant to Regulation 14A under the Securities Exchange Act of 1934, as amended, are incorporated by reference into Parts II and III of this Form 10-K.
Albemarle Corporation and Subsidiaries | ||
Index to Form 10-K
Year Ended December 31, 2015
Page | ||
Albemarle Corporation and Subsidiaries | ||
PART I
Item 1. | Business. |
Albemarle Corporation was incorporated in Virginia in 1993. Our principal executive offices are located at 451 Florida Street, Baton Rouge, Louisiana 70801. Unless the context otherwise indicates, the terms “Albemarle,” “we,” “us,” “our” or “the Company” mean Albemarle Corporation and our consolidated subsidiaries.
On January 12, 2015 (the “Acquisition Closing Date”), we completed the acquisition (the “Merger”) of Rockwood Holdings, Inc. (“Rockwood”) pursuant to an Agreement and Plan of Merger (the “Merger Agreement”) for a purchase price of approximately $5.7 billion. As a result, Rockwood became a wholly-owned subsidiary of Albemarle. For additional information about the Merger, see “Recent Acquisitions, Joint Ventures and Divestitures” beginning on page 10, and also Note 2, “Acquisitions,” to our consolidated financial statements included in Part II, Item 8 of this report.
We are a leading global developer, manufacturer and marketer of highly-engineered specialty chemicals that meets customer needs across a diverse range of end markets. The end markets we serve include petroleum refining, consumer electronics, energy storage, construction, automotive, steel and aerospace, lubricants, pharmaceuticals, crop protection, household appliances, heating, ventilation, aluminum finishing, food safety and custom chemistry services. We believe that our commercial and geographic diversity, technical expertise, innovative capability, flexible, low-cost global manufacturing base, experienced management team and strategic focus on our core base technologies will enable us to maintain leading market positions in those areas of the specialty chemicals industry in which we operate.
We and our joint ventures currently operate 51 production and research and development (“R&D”) facilities, as well as a number of administrative and sales offices, in North and South America, Europe, the Middle East, Asia, Africa and Australia. As of December 31, 2015, we served approximately 30,000 customers in approximately 100 countries. For information regarding our unconsolidated joint ventures see Note 10, “Investments,” to our consolidated financial statements included in Part II, Item 8 of this report.
Business Segments
During 2015, our operations were managed and reported under three reportable segments: Performance Chemicals, Refining Solutions and Chemetall® Surface Treatment. Financial results and discussion about our segments included in this Annual Report on Form 10-K are organized according to these categories except where noted.
For financial information regarding our reportable segments, including revenues generated for each of the last three fiscal years from each of the product categories included in our reportable segments, and geographic area information, see Note 25, “Segment and Geographic Area Information,” to our consolidated financial statements included in Part II, Item 8 of this report.
On October 26, 2015, we announced that effective January 1, 2016, Performance Chemicals will be split into two separate reportable segments: (1) Bromine Specialties, and (2) Lithium and Advanced Materials, which will include Lithium, Performance Catalyst Solutions and Curatives. Each unit will have a dedicated team of sales, product management, research & development, process technology, manufacturing, sourcing, sales and operations planning and customer service groups and will have full accountability for improving execution through greater asset and market focus, agility and responsiveness. We expect this change to provide further clarity into the performance of each business.
Performance Chemicals Segment
As of December 31, 2015, our Performance Chemicals segment consisted of three product categories: Lithium, Performance Catalyst Solutions, and Bromine.
Lithium. Our Lithium business develops advanced materials for a wide range of industries and end markets. We believe that our Lithium business is a low-cost producer of the most diverse product portfolio of lithium derivatives in the industry.
We develop and manufacture a broad range of basic lithium compounds, including lithium carbonate, lithium hydroxide, lithium chloride, and value-added lithium specialties and reagents, including butyllithium and lithium aluminum hydride. Lithium is a key component in products and processes used in a variety of applications and industries, which include lithium batteries used in consumer electronics and automobiles, high performance greases, thermoplastic elastomers for car tires, rubber soles and plastic bottles, catalysts for chemical reactions, organic synthesis processes in the areas of steroid chemistry and vitamins, various life science applications, as well as intermediates in the pharmaceutical industry, among other applications. We also develop and manufacture cesium products for the chemical and pharmaceutical industries, and zirconium, barium and titanium products for various pyrotechnical applications, including airbag igniters.
3
Albemarle Corporation and Subsidiaries | ||
In addition to developing and supplying lithium compounds, we provide technical services, including the handling and use of reactive lithium products. We also offer our customers recycling services for lithium containing by-products resulting from synthesis with organolithium products, lithium metal and other reagents. We plan to continue to focus on the development of new products and applications.
Lithium—Customers
Our most significant customers include Panasonic Corporation, Syngenta AG, Umicore S.A., Samsung SDI Co. Ltd. and Royal DSM N.V.
Lithium—Competition
The global lithium market consists of producers located in the Americas, Asia-Pacific and, to a lesser extent, Africa. We believe that we are a leading global provider of lithium compounds. Major competitors include FMC Corporation, Sociedad Quimica y Minera de Chile S.A., SichuanTianqi Lithium, and Jiangxi Ganfeng Lithium. Competition in this part of the business is based on product quality, reliability of supply and customer service. In the metal-based specialty chemicals business, key competitors include Cabot Corporation and Sigma-Aldrich Corporation. Competition in this part of the business is based on product quality and product diversity.
Lithium—Raw Materials and Significant Supply Contracts
We obtain lithium through solar evaporation of our ponds at the Salar de Atacama, in Chile, and in Silver Peak, Nevada. After we obtain the lithium brine from the Salar de Atacama, we process it into lithium carbonate and lithium chloride at a plant in nearby La Negra, Chile. The lithium brine from our Silver Peak site is processed into lithium carbonate at our plant in Silver Peak. Subsequently, in other locations in the United States (“U.S.”), Germany, France and Taiwan, we further process the materials into various derivatives, depending on the markets we serve.
Our mineral rights with respect to the Salar de Atacama in Chile consist exclusively of our right to access lithium brine pursuant to a long-term contract with the Chilean government, originally entered into in January 1975 by one of our predecessors and subsequently amended and restated. Our contract with the Chilean government will remain in effect until the date on which we have produced and sold 200,000 metric tons of lithium in any of its forms from the Salar de Atacama. As of December 31, 2015, the remaining amount of lithium we were permitted to sell under the contract equaled approximately 115,000 metric tons of total lithium. In February 2016 we announced that we were granted approval by the Environmental Assessment Commission of the Antofagasta Region to increase our currently authorized lithium brine removal rate in the Salar de Atacama. The size of the area at the Salar de Atacama covered by our claims is approximately 16,700 hectares. We currently own the land on which we operate our facility at the Salar de Atacama and our processing facility in La Negra. However, the ownership of the land at the Salar de Atacama will revert to the Chilean government once we have sold all amounts of lithium remaining under our contract with the Chilean government (the ownership of the land and fixed assets in La Negra will remain unchanged). In February 2016, we also announced that we entered into a Memorandum of Understanding with the Chilean government that provides sufficient lithium to support the production of 70,000 metric tons annually of technical and battery grade lithium carbonate and 6,000 metric tons annually of lithium chloride in La Negra, over a 27-year period, beginning January 1, 2017.
Our mineral rights in Silver Peak, Nevada consist exclusively of our right to access lithium brine pursuant to a settlement agreement with the U.S. government, originally entered into in June 1991 by one of our predecessors. Pursuant to this agreement, we have rights to all of the lithium that we can remove economically. We or our predecessors have been operating at the Silver Peak site since 1966. Our Silver Peak site covers a surface of approximately 15,301 acres, 10,826 acres of which we own through a subsidiary. The remaining acres are owned by the U.S. government from whom we lease the land pursuant to a lease agreement which is renewed annually. Based on our 2015 production levels, we believe that the amount of lithium brine we can economically obtain from our Silver Peak, Nevada site pursuant to our contract with the U.S. government could support the current levels of lithium carbonate production for approximately 20 years. Assuming certain operating conditions are satisfied, our annual lithium carbonate production capacity is estimated to be approximately 6,000 metric tons at our Silver Peak facility. However, no assurance can be given that the indicated levels of production of lithium carbonate at either Silver Peak or La Negra will be realized.
We also own a 49% interest in Windfield Holdings Pty Ltd, which directly owns 100% of the equity of Talison Lithium Pty Ltd, a company incorporated in Australia (“Talison”). Talison, through its wholly-owned subsidiaries, owns and operates a lithium mine in Greenbushes, Western Australia and mines lithium ore, which is then milled and processed to separate lithium concentrate from the rest of the ore. Talison currently sells the lithium concentrate to its shareholders. Talison has a leading position in two categories of lithium concentrates: (i) technical-grade lithium concentrates which have low iron content for use in the manufacture of glass, ceramics and heat-proof cookware; and (ii) a high-yielding chemical-grade lithium concentrate,
4
Albemarle Corporation and Subsidiaries | ||
which is used to produce lithium chemicals which form the basis for manufacture of lithium-ion batteries for laptop computers, mobile phones, electric bicycles and electric vehicles. Assuming certain operating conditions are satisfied, the annual lithium concentrate production capacity at the Talison facility is estimated to be approximately 575,000 metric tons. However, no assurance can be given that the indicated levels of production of lithium concentrate at Talison will be realized.
Performance Catalyst Solutions (“PCS”). We have four product lines in our PCS division: polymer catalysts, curatives, organometallics and electronic materials. We manufacture organometallic co-catalysts (e.g., aluminum, magnesium and zinc alkyls) as well as metallocene components and co-catalysts (e.g., methylaluminumoxane, organoborons, metallocene compounds, and finished polymerization catalysts comprising these products). We also offer finished single-site catalysts with or without our proprietary ActivCat® activation technology and a line of proprietary Ziegler-Natta catalysts under the Advantage™ brand. Our co-catalysts and finished catalysts are used in our customers’ production of polyolefin polymers. Such polymers are commodity (i.e., Ziegler-Natta polymerization technology-based) and specialty (i.e., Single Site polymerization technology-based) plastics serving a wide variety of end markets including packaging, non-packaging, films and injection molding. Some of our organometallic products are also used in the manufacture of alpha-olefins (i.e., hexene, octene, decene). In electronic materials, we manufacture and sell high purity metal organic products into electronic applications such as the production of light-emitting diodes (“LEDs”) for displays and general lighting, as well as other products used in the production of solar cells. Our curatives include a range of curing agents used in polyurethanes, epoxies and other engineered resins.
PCS—Customers
Our PCS business customers include multinational corporations such as ExxonMobil Corporation, Chevron Corporation, Total Petrochemicals, Saudi Basic Industries Corporation and Ineos Group Holdings S.A. There are thousands of polyolefin and elastomer units worldwide which require a constant supply of co-catalysts and finished catalysts.
PCS—Competition
Our PCS business serves the global market including the Americas, Europe, Asia and the Middle East. Our major competitors in the PCS market include AkzoNobel, Chemtura Corporation and W.R. Grace & Co. in the polyolefin catalyts and co-catalysts areas. Lonza is our main competitor in the curatives market.
PCS—Raw Materials and Significant Supply Contracts
The major raw materials we use in our PCS operations include aluminum, ethylene, alpha-olefins, isobutylene and toluene, most of which are readily available from numerous independent suppliers and are purchased or provided under contracts at prices we believe are competitive. The cost of raw materials is generally based on market prices, although we may use contracts with price caps or other tools, as appropriate, to mitigate price volatility. These raw materials may nevertheless be subject to significant volatility despite our mitigating efforts. Our profitability may be affected if we are unable to recover significant raw material costs from our customers.
Bromine. Our bromine and bromine-based business includes products used in fire safety solutions and other specialty chemicals applications. Our fire safety technology enables the use of plastics in high performance, high heat applications by enhancing the flame resistant properties of these materials. Some of the end market products that benefit from our fire safety technology include plastic enclosures for consumer electronics, printed circuit boards, wire and cable, electrical connectors, textiles and foam insulation. Our bromine based business also includes specialty chemicals products such as elemental bromine, alkyl bromides, inorganic bromides, brominated powdered activated carbon and a number of bromine fine chemicals. Our products are used in chemical synthesis, oil and gas well drilling and completion fluids, mercury control, water purification, beef and poultry processing and various other industrial applications. Other specialty chemicals that we produce include tertiary amines for surfactants, biocides, and disinfectants and sanitizers.
Bromine—Customers
Our bromine business offers more than 40 products to a variety of end markets. We sell our products mostly to chemical manufacturers and processors, such as polymer resin suppliers, drilling and oil service companies, beef and poultry processors, water treatment and photographic companies, energy producers and other specialty chemical companies.
Sales of bromine and brominated derivatives in Asia are expected to grow long-term due to the underlying growth in consumer demand and the shift of the production of consumer electronics from the U.S. and Europe to Asia. In response to this development, we have established a sales and marketing network in China, Japan, Korea and Singapore with products sourced from the U.S., Europe, China and the Middle East.
A number of customers of our bromine business operate in cyclical industries, including the consumer electronics and oil field industries. As a result, demand from our customers in such industries is also cyclical.
5
Albemarle Corporation and Subsidiaries | ||
Bromine—Competition
Our bromine business serves the following geographic markets: the Americas, Asia, Europe and the Middle East, each of which is highly competitive. Product performance and quality, price and contract terms are the primary factors in determining which qualified supplier is awarded a contract. Research and development, product and process improvements, specialized customer services, the ability to attract and retain skilled personnel and maintenance of a good safety record have also been important factors to compete effectively in the marketplace. Our most significant competitors are Chemtura Corporation and Israel Chemicals Ltd.
Bromine—Raw Materials and Significant Supply Contracts
The bromine we use is sourced from two locations: Arkansas and the Dead Sea. Our bromine production operations in Arkansas are supported by an active brine rights leasing program. We estimate that, at current production levels, we will be able to produce bromine in Arkansas for more than 50 years. In addition, through our 50% interest in Jordan Bromine Company Limited (“JBC”), a consolidated joint venture with operations in Safi, Jordan, we source bromine from the Dead Sea, which is believed to have indefinite quantities of brine. In addition, we have a joint venture with Weifang Sinobrom Import and Export Company, Ltd. (“Sinobrom”) in China that allows us the option to source bromine directly from China’s Shandong Province brine fields.
Refining Solutions Segment
Our two main product lines in this segment are (i) Clean Fuels Technologies, which is primarily composed of hydroprocessing catalysts (“HPC”), and (ii) Heavy Oil Upgrading (“HOU”), which is primarily composed of fluidized catalytic cracking (“FCC”) catalysts and additives. HPC products are widely applied throughout the refining industry. Their application enables the upgrading of oil fractions to clean fuels and other usable oil feedstocks and products by removing sulfur, nitrogen and other impurities from the feedstock. In addition, they improve product properties by adding hydrogen and in some cases improve the performance of downstream catalysts and processes. We continuously seek to add more value to refinery operations by offering HPC products that meet our customers’ requirements for profitability and performance in the very demanding refining market. FCC catalysts assist in the high yield cracking of less desired refinery petroleum streams into derivative, higher-value products such as transportation fuels and petrochemical feedstocks like propylene. Our FCC additives are used to reduce emissions of sulfur dioxide and nitrogen oxide in FCC units and to increase liquefied petroleum gas olefins yield, such as propylene, and to boost octane in gasoline. Albemarle offers unique refinery catalysts to crack and treat the lightest to the heaviest feedstocks while meeting refinery yield and product needs. We offer a wide range of HPC products and approximately 60 different FCC catalysts and additives products to our customers.
Customers
Our Refining Solutions segment customers include multinational corporations such as ExxonMobil Corporation, Chevron Corporation, TOTAL S.A., Saudi Aramco and its joint ventures, and INEOS Group Holdings S.A.; independent petroleum refining companies such as Valero Energy Corporation, SK Energy Holdings, Reliance Industries and Marathon Petroleum; national petroleum refining companies such as Petróleo Brasileiro S.A., Petróleos Mexicanos, PetroVietnam, Kuwait National Petroleum Company, Abu Dhabi National Oil Company and Indian Oil Corp.
In 2015 the total number of refineries world wide was reduced from 643 to 634 and we see this trend continuing with smaller refineries shutting down and being replaced by mega refineries, with growth concentrated in the Middle East. Oil refining has once again increased after minor declines in the last two years.
We estimate that there are currently approximately 500 FCC units being operated globally, each of which requires a constant supply of FCC catalysts. In addition, we estimate that there are approximately 3,000 HPC units being operated globally, or a capacity of approximately 44 million barrels per day, each of which typically requires replacement HPC catalysts once every one to four years.
Competition
Our Refining Solutions segment serves the global market including the Americas, Asia, Europe and the Middle East, each of which is highly competitive. Product performance and quality, price and contract terms are the primary factors in determining which qualified supplier is awarded a contract.
Research and development, product and process improvements, specialized customer services, the ability to attract and retain skilled personnel and the maintenance of a good safety record have also been important factors to compete effectively in the Catalysts marketplace. Through our research and development programs, we strive to differentiate our business by developing value-added products and products based on proprietary technologies.
6
Albemarle Corporation and Subsidiaries | ||
Our major competitors in the HPC catalysts market include Criterion Catalysts and Technologies, Advanced Refining Technologies and Haldor Topsoe. Our major competitors in the FCC catalysts market include W.R. Grace & Co., BASF Corporation and China Petrochemical Corporation (Sinopec).
Raw Materials and Significant Supply Contracts
The major raw materials we use in our Refining Solutions operations include sodium silicate, sodium aluminate, kaolin, rare earths and metals such as molybdenum, nickel and cobalt, most of which are readily available from numerous independent suppliers and are purchased or provided under contracts at prices we believe are competitive. The cost of raw materials is generally based on market prices, although we may use contracts with price caps or other tools, as appropriate, to mitigate price volatility. These raw materials may nevertheless be subject to significant volatility despite our mitigating efforts. Our profitability may be affected if we are unable to recover significant raw material costs from our customers.
Chemetall Surface Treatment Segment
Our Chemetall Surface Treatment segment operates under the Chemetall® brand name and is a leading global supplier of applied surface treatments and services for metal, plastic and glass substrates in a wide range of industries and end markets. Chemetall Surface Treatment’s products are used for a variety of applications and serve the automotive, aerospace, aluminum finishing, coil, cold forming, glass and general industrial markets, including metal fabrication. We also provide process control and on-site support at our customers’ facilities with local representation worldwide. Our systems are designed to ensure that the final requirements of our customers’ treated products are met in terms of proper surface treatment prior to painting, corrosion protection and preservation of mechanical properties.
Chemetall Surface Treatment competes in markets characterized by proprietary manufacturing technologies and know-how, demanding product-handling requirements, rigorous product quality and performance specifications, all accompanied by longstanding customer relationships. In order to remain competitive, we are focused on developing innovative products, improving process technologies, expanding our customer base, and broadening our technology capabilities in existing and new markets through internal research and development and bolt-on acquisitions.
Customers
Chemetall Surface Treatment serves customers globally in a wide variety of industries with a diverse product portfolio. Our customer base ranges from local, small and mid-size companies to global, multinational Fortune 500 companies such as Airbus Group, Arcelor Mittal, Caterpillar, Daimler, Ford, Renault-Nissan, Novelis, PSA Peugeot Citroen and Hyundai/KIA, among many others.
Competition
We believe we are a global leader in the surface treatment market. Our global competitors include Henkel, Nihon Parkerizing, PPG Industries and Nippon Paint. Competition in this market is based primarily on customer service, product innovation and quality, and technological capabilities.
Raw Materials and Significant Supply Contracts
The major raw materials used in our Chemetall Surface Treatment segment include phosphoric acid and phosphates, as well as non-ferrous metals such as zinc and nickel. The raw materials used in our operations are purchased from various suppliers at prices that we believe are competitive. We secure our supply of phosphoric acid, which is used in our conversion coating process, through quarterly supply contracts with fixed prices. Phosphoric acid is produced from phosphate rock, and the majority of global phosphate rock reserves are located in Northern Africa, China, the Middle East, U.S. and Russia. Even though we do not expect a shortage of phosphate rock and phosphoric acid in the near term, we employ a global procurement strategy to mitigate the risk of supply disruptions. Non-ferrous metal products are traded on exchanges such as the London Metal Exchange (LME). We believe that zinc and nickel will be available in sufficient quantities for the foreseeable future.
Sales, Marketing and Distribution
We have an international strategic account program that uses cross-functional teams to serve large global customers. This program emphasizes creative strategies to improve and strengthen strategic customer relationships with emphasis on creating value for customers and promoting post-sale service. Complementing this program are regional Albemarle sales personnel around the world who serve numerous additional customers within North America, Europe, the Middle East, India, Asia Pacific, Russia, Africa and Latin America. We also utilize commissioned sales representatives and specialists in specific market areas, some of which are affiliated with subsidiaries of large chemical companies.
7
Albemarle Corporation and Subsidiaries | ||
Research and Development
We believe that in order to generate revenue growth, maintain our margins and remain competitive, we must continually invest in research and development, product and process improvements and specialized customer services. Through research and development, we continue to seek increased margins by introducing value-added products and proprietary processes and innovative green chemistry technologies. Our green chemistry efforts focus on the development of products that benefit society in a manner that minimizes waste and the use of raw materials and energy, avoids the use of toxic reagents and solvents and is produced in safe, environmentally friendly manufacturing processes. Green chemistry is encouraged with our researchers through periodic focus group discussions and special rewards and recognition for outstanding new green developments.
Our research and development efforts support each of our business segments. As of December 31, 2015, the focus of research in Performance Chemicals is divided among new and improved flame retardants, new uses for bromine and bromine-based products, curing agents and the development of efficient processes for the manufacture of chemical intermediates and actives for the pharmaceutical and agrichemical industries. Fire safety solutions research is focused primarily on developing new flame retardants which not only meet the higher performance requirements required by today’s polymer producers, formulators and original equipment manufacturers but which also have superior toxicological and environmental profiles. Another area of research is the development of bromine-based products for use as biocides in industrial water treatment and food safety applications and as additives used to reduce mercury emissions from coal-fired power plants. Curatives research is focused primarily on improving and extending our line of curing agents and formulations. The objective of the Lithium research and development effort is to develop innovative chemistries and technologies with applications relevant within targeted key markets. Research and development efforts are generally focused on both process development (e.g., pilot plant for the recycling of lithium ion batteries) as well as new product development (e.g., for lithium ion battery applications). PCS research efforts are focused on catalyst performance as well as process improvements.
Our Refining Solutions research is focused on the needs of our refinery catalysts customers. Refinery catalysts research is focused primarily on the development of more effective catalysts and related additives to produce clean fuels and to maximize the production of the highest value refined products through hydrotreating catalyst technologies. With regard to HOU, we focus our efforts on the production of more and better fuels from more complex and lower accessible/convertible feedstock through the use of novel FCC technologies.
Chemetall Surface Treatment’s research and development activities are focused on the development of products to meet customer demands that are also in accordance with regional environmental requirements. Our goal is to help solve our customers’ complex manufacturing challenges by developing proprietary formulations utilizing industry knowledge, expertise and a forward-looking team of individuals with manufacturing know-how. Our commitment to research and development and product portfolio enhancements are an important aspect of our business that characterizes Chemetall as a supplier of choice that creates value for our customers.
We have incurred research and development expenses of $102.9 million, $88.3 million and $82.2 million during 2015, 2014 and 2013, respectively.
Intellectual Property
Our intellectual property, including our patents, licenses and trade names, is an important component of our business. As of December 31, 2015, we owned approximately 3,000 active and approximately 1,500 pending patent applications in key strategic markets worldwide. We also have acquired rights under patents and inventions of others through licenses, and we license certain patents and inventions to third parties.
Regulation
Our business is subject to a broad array of employee health and safety laws and regulations, including those under the Occupational Safety and Health Act. We also are subject to similar state laws and regulations as well as local laws and regulations for our non-U.S. operations. We devote significant resources and have developed and implemented comprehensive programs to promote the health and safety of our employees and we maintain an active health, safety and environmental program. We finished 2015 with an occupational injury and illness rate of 0.60 for Albemarle employees and nested contractors, compared to 0.327 in 2014.
Our business and our customers also may be subject to significant requirements under the European Community Regulation for the Registration, Evaluation and Authorization of Chemicals (“REACH”). REACH imposes obligations on European Union manufacturers and importers of chemicals and other products into the European Union to compile and file comprehensive reports, including testing data, on each chemical substance, and perform chemical safety assessments. Additionally, substances of high concern—such as Carcinogenic, Mutagenic and Reprotoxic (“CMRs”); Persistent,
8
Albemarle Corporation and Subsidiaries | ||
Bioaccumulative and Toxic (“PBTs”); very Persistent, very Bioaccumulative (“vPvB”); and endocrine disruptors—will be subject to an authorization process. Authorization may result in restrictions in the use of products by application or even banning the product. The REACH regulations impose significant additional burdens on chemical producers, importers, downstream users of chemical substances and preparations, and the entire supply chain. Our significant manufacturing presence and sales activities in the European Union will require us to incur significant additional compliance costs and may result in increases in the costs of raw materials we purchase and the products we sell. Increases in the costs of our products could result in a decrease in their overall demand; additionally, customers may seek products that are not regulated by REACH, which could also result in a decrease in the demand of certain of our products subject to the REACH regulations.
Historically, there has been scrutiny of certain brominated flame retardants by regulatory authorities, legislative bodies and environmental interest groups in various countries. We manufacture a broad range of brominated flame retardant products, which are used in a variety of applications. Concern about the impact of some of our products on human health or the environment may lead to regulation, or reaction in our markets independent of regulation.
Environmental Regulation
We are subject to numerous foreign, federal, state and local environmental laws and regulations, including those governing the discharge of pollutants into the air and water, the management and disposal of hazardous substances and wastes and the cleanup of contaminated properties. Ongoing compliance with such laws and regulations is an important consideration for us. Key aspects of our operations are subject to these laws and regulations. In addition, we incur substantial capital and operating costs in our efforts to comply with them.
Liabilities associated with the investigation and cleanup of hazardous substances, as well as personal injury, property damages or natural resource damages arising from the release of, or exposure to, such hazardous substances, may be imposed in many situations without regard to violations of laws or regulations or other fault, and may also be imposed jointly and severally (so that a responsible party may be held liable for more than its share of the losses involved, or even the entire loss). Such liabilities also may be imposed on many different entities with a relationship to the hazardous substances at issue, including, for example, entities that formerly owned or operated the property affected by the hazardous substances and entities that arranged for the disposal of the hazardous substances at the affected property, as well as entities that currently own or operate such property. We are subject to such laws, including the federal Comprehensive Environmental Response, Compensation and Liability Act, commonly known as CERCLA or Superfund, in the U.S., and similar foreign and state laws. We may have liability as a potentially responsible party (“PRP”) with respect to active off-site locations under CERCLA or state equivalents. We have sought to resolve our liability as a PRP at these sites through indemnification by third parties and settlements, which would provide for payment of our allocable share of remediation costs. Because the cleanup costs are estimates and are subject to revision as more information becomes available about the extent of remediation required, and in some cases we have asserted a defense to any liability, our estimates could change. Moreover, liability under CERCLA and equivalent state statutes may be joint and several, meaning that we could be required to pay in excess of our pro rata share of remediation costs. Our understanding of the financial strength of other PRPs has been considered, where appropriate, in estimating our liabilities. Accruals for these matters are included in the environmental reserve discussed below. Our management is actively involved in evaluating environmental matters and, based on information currently available to us, we have concluded that our outstanding environmental liabilities for unresolved waste sites currently known to us should not have a material effect on our operations.
We use and generate hazardous substances and wastes in our operations and may become subject to claims for personal injury and/or property damage relating to the release of such substances into the environment. In addition, some of our current properties are, or have been, used for industrial purposes, which could contain currently unknown contamination that could expose us to governmental requirements or claims relating to environmental remediation, personal injury and/or property damage. While we conduct our operations so as to minimize the risk of incurring such losses, the nature of our business and the types of operations in which we engage create a potential for such losses to occur. These risks could expose us to substantial liability for personal injury, wrongful death, property damage, loss of production, pollution and other environmental damages. Depending on the frequency and severity of such incidents, it is possible that the Company’s operating costs, insurability and relationships with customers, employees and regulators could be impaired. In particular, our customers may elect not to purchase our product if they view our safety record as unacceptable. This could also cause us to lose customers and substantial revenues. However, we believe that the likelihood of an environmental-related catastrophic occurrence or a series of occurrences that could materially affect the Company’s financial position or competitiveness is low.
We record accruals for environmental matters when it is probable that a liability has been incurred and the amount of the liability can be reasonably estimated. It is possible that new information or future developments could require us to reassess our potential exposure related to environmental matters. We may incur significant costs and liabilities in order to comply with existing environmental laws and regulations. It is also possible that other developments, such as increasingly strict
9
Albemarle Corporation and Subsidiaries | ||
environmental laws, regulations and orders of regulatory agencies, as well as claims for damages to property and the environment or injuries to employees and other persons resulting from our current or past operations, could result in substantial costs and liabilities in the future. As this information becomes available, or other relevant developments occur, we will adjust our accrual amounts accordingly. While there are still uncertainties related to the ultimate costs we may incur, based upon our evaluation and experience to date, we believe our reserves are adequate. We cannot assure you that, as a result of former, current or future operations, there will not be some future impact on us relating to new regulations or additional environmental remediation or restoration liabilities. See “Safety and Environmental Matters” in Item 7. Management’s Discussion and Analysis of Financial Condition and Results of Operations on page 53.
Climate Change
The growing concerns about climate change and the related imposition by governments of more stringent regulations may provide us with new or expanded business opportunities. The Company seeks to capitalize on the “green revolution” by providing solutions to companies pursuing alternative fuel products and technologies (such as renewable fuels, gas-to-liquids and others), emission control technologies (including mercury emissions), alternative transportation vehicles and energy storage technologies and other similar solutions. As demand for, and legislation mandating or incentivizing the use of alternative fuel technologies that limit or eliminate greenhouse gas emissions increase, we continue to monitor the market and offer solutions where we have appropriate technology and believe we are well positioned to take advantage of opportunities that may arise if new legislation is enacted.
Recent Acquisitions, Joint Ventures and Divestitures
Over the last three years, we have devoted resources to acquisitions and joint ventures, including the subsequent integration of acquired businesses. These acquisitions and joint ventures have expanded our base business, provided our customers with a wider array of products and presented new alternatives for discovery through additional chemistries. Following is a summary of our acquisitions and joint ventures during recent years.
On January 12, 2015, we completed the acquisition of Rockwood for a purchase price of approximately $5.7 billion, with Rockwood becoming a wholly-owned subsidiary of Albemarle. Through the acquisition of Rockwood, we became a leading integrated and low cost global producer of lithium and lithium compounds used in lithium-ion batteries for electronic devices, alternative transportation vehicles and energy storage technologies, meeting the significant growth in global demand for these products. We are also now one of the largest global producers of surface treatments and coatings for metal processing, servicing the automotive, aerospace and general industrial markets. The acquisition of Rockwood reflects our commitment to drive sustainable growth.
On February 19, 2015, our Chemetall Surface Treatment segment completed the acquisition of all remaining shares of its Shanghai Chemetall joint venture for a purchase price of $57.6 million, and is now the sole owner of the entity.
On May 1, 2015, our Chemetall Surface Treatment segment completed the acquisition of the aluminum finishing business of Chemal GmbH & Co. KG (“Chemal GmbH”), based in Hamm, Germany. Cash paid in connection with this acquisition was approximately $2.2 million.
On December 23, 2015, we paid approximately $4.8 million in connection with the acquisition of the remaining noncontrolling interests’ share of Nanjing Chemetall Surface Technologies Co., Ltd.
In 2015, we announced our intention to pursue strategic alternatives, including divestitures, related to certain businesses which include minerals-based flame retardants and specialty chemicals, fine chemistry services and metal sulfides. On January 4, 2016, we completed the sale of our Tribotecc metal sulfides business to Treibacher Industrie AG for net proceeds of approximately $137 million. Included in the transaction were sites in Vienna and Arnoldstein, Austria, and Tribotecc’s proprietary sulfide synthesis process. On February 1, 2016, we completed the sale of our minerals-based flame retardants and specialty chemicals businesses to Huber Engineered Materials, a division of J.M. Huber Corporation, for net proceeds of approximately $187 million. The transaction includes Albemarle’s Martinswerk GmbH subsidiary and manufacturing facility located in Bergheim, Germany, and Albemarle’s 50% ownership interest in Magnifin Magnesiaprodukte GmbH, a joint-venture with Radex Heraklith Industriebeteiligung AG at Breitenau, Austria.
On September 1, 2014, we closed the sale of our antioxidant, ibuprofen and propofol businesses and assets to SI Group, Inc. and received net proceeds of $104.7 million. Included in the transaction were Albemarle’s manufacturing sites in Orangeburg, South Carolina and Jinshan, China, along with Albemarle’s antioxidant product lines manufactured in Ningbo, China.
10
Albemarle Corporation and Subsidiaries | ||
In 2014, the Company and ICL Industrial Products (“ICL”) announced entering into an agreement to establish a manufacturing joint venture for the production of ICL’s FR-122P polymeric flame retardant and Albemarle’s GreenCrest™ polymeric flame retardant. In 2015, the parties terminated their agreement due to the likelihood that, for purposes of competition law approvals, the duration of the proposed joint venture would need to be shortened to such an extent that the return on investment would no longer be attractive. In lieu of the joint venture, the parties have signed a long-term supply arrangement pursuant to which ICL would supply the GreenCrest™ polymeric flame retardant to the Company.
Employees
As of February 1, 2016, we had 6,963 employees of whom 2,990, or 43%, are employed in the U.S. and Latin America; 2,740, or 39%, are employed in Europe; 894, or 13%, are employed in Asia and 339, or 5%, are employed in the Middle East. Certain of these employees are represented by unions or works councils. We believe that we generally have a good relationship with our employees, and with the unions and works councils that represent certain employees.
Available Information
Our internet website address is http://www.albemarle.com. We make available free of charge through our website our Annual Report on Form 10-K, Quarterly Reports on Form 10-Q, Current Reports on Form 8-K and amendments to those reports filed or furnished pursuant to Section 13(a) or 15(d) of the Securities Exchange Act of 1934, as amended (“Exchange Act”), as well as reports on Forms 3, 4 and 5 filed pursuant to Section 16 of the Exchange Act, as soon as reasonably practicable after such documents are electronically filed with, or furnished to, the Securities and Exchange Commission (“SEC”). The information on our website is not, and shall not be deemed to be, a part of this report or incorporated into any other filings we make with the SEC. These reports may also be obtained at the SEC’s Public Reference Room at 100 F Street, N.E., Washington, DC 20549. The SEC also maintains a website at http://www.sec.gov that contains reports, proxy statements and other information regarding SEC registrants, including Albemarle.
Our Corporate Governance Guidelines, Code of Business Conduct and the charters of the Audit and Finance, Health, Safety and Environment, Executive Compensation, and Nominating and Governance Committees are also available on our website and are available in print to any shareholder upon request by writing to Investor Relations, 451 Florida Street, Baton Rouge, Louisiana 70801, or by calling (225) 388-8011.
Item 1A. | Risk Factors. |
You should consider carefully the following risks when reading the information, including the financial information, contained in this Annual Report on Form 10-K.
Adverse conditions in the global economy and volatility and disruption of financial markets can negatively impact our customers, suppliers and other business partners and therefore have a material adverse effect on our results of operations.
A global or regional economic downturn may reduce customer demand or inhibit our ability to produce our products, negatively impacting our operating results. Our business and operating results have been and will continue to be sensitive to global economic downturns (including credit market tightness which can impact our liquidity as well as our customers, suppliers and other business partners), declining consumer and business confidence, fluctuating commodity prices, volatile exchange rates and other challenges that can affect the global economy. Our customers may experience deterioration of their businesses, cash flow shortages and difficulty obtaining financing. As a result, existing or potential customers can delay or cancel plans to purchase products and may not be able to fulfill their obligations in a timely fashion. Further, suppliers and other business partners may be experiencing similar conditions, which could impact their ability to fulfill their obligations to us. Also, it could be difficult to find replacements for certain of those business partners without incurring significant delays or cost increases. If the current weakness in much of the global economy continues or deepens significantly, our results of operations, financial condition and cash flows could be materially adversely affected.
Our inability to secure key raw materials, or to pass through increases in costs and expenses for other raw materials and energy, on a timely basis or at all, could have an adverse effect on the margins of our products and our results of operations.
The long-term profitability of our operations will be, in part, related to our ability to continue to economically obtain resources, including energy and raw materials. For example, our lithium and bromine businesses rely upon our continued ability to produce, or otherwise obtain, lithium and bromine of sufficient quality in adequate amounts to support our operations. If we fail to secure and retain the rights to continue to access these key raw materials, we may have to restrict or suspend our operations that rely upon these key resources, which could harm our business, results of operations and financial condition. In addition, other raw material and energy costs account for a significant percentage of our total costs of products sold, even if they can be obtained on commercially reasonable terms. Our raw material and energy costs can be volatile and may increase
11
Albemarle Corporation and Subsidiaries | ||
significantly. Increases are primarily driven by significantly tighter market conditions and major increases in the pricing of basic building blocks for our products such as crude oil, chlorine and metals (including molybdenum and rare earths which are used in the refinery catalysts business). We generally attempt to pass through changes in the prices of raw materials and energy to our customers, but we may be unable to or be delayed in doing so. Our inability to efficiently and effectively pass through price increases, or inventory impacts resulting from price volatility, could adversely affect our margins.
We face competition from other specialty chemical companies, which places downward pressure on the prices and margins of our products.
We operate in a highly competitive marketplace, competing against a number of global specialty chemical producers. Competition is based on several key criteria, including product performance and quality, product price, product availability and security of supply and responsiveness of product development in cooperation with customers and customer service. Some of our competitors are larger than we are and may have greater financial resources. In addition, our products are facing increasing competition from market participants in China. These competitors may also be able to maintain significantly greater operating and financial flexibility than we do. As a result, these competitors may be better able to withstand changes in conditions within our industry, changes in the prices of raw materials and energy and in general economic conditions. Additionally, competitors’ pricing decisions could compel us to decrease our prices, which could affect our margins and profitability adversely. Our ability to maintain or increase our profitability is, and will continue to be, dependent upon our ability to offset decreases in the prices and margins of our products by improving production efficiency and volume, shifting to higher margin chemical products and improving existing products through innovation and research and development. If we are unable to do so or to otherwise maintain our competitive position, we could lose market share to our competitors.
Within the end-use markets in which we compete, competition between products is intense. Substitute products also exist for many of our products. Therefore, we face substantial risk that certain events, such as new product development by our competitors, changing customer needs, production advances for competing products, price changes in raw materials and products, our failure to secure patents or the expiration of patents, could result in declining demand for our products as our customers switch to substitute products or undertake manufacturing of such products on their own. If we are unable to develop, produce or market our products to effectively compete against our competitors, our results of operations may materially suffer.
We believe that our customers are increasingly looking for strong, long-term relationships with a few key suppliers that help them improve product performance, reduce costs, or support new product development. To satisfy these growing customer requirements, our competitors have been consolidating within product lines through mergers and acquisitions. We may also need to invest and spend more on research and development and marketing costs to strengthen existing customer relationships, as well as attract new customers. Our indebtedness could limit our flexibility to react to these industry trends and our ability to remain competitive.
Albemarle’s brands, product image and trademarks represent the unique product identity of each of our products and are important symbols of the Company’s reputation. Accordingly, the performance of our business could be adversely affected by any marketing and promotional materials used by our competitors that make false or unsubstantiated claims, implies immoral or improper conduct or is otherwise disparaging to our Company or its products. Further, our own actions could hurt such brands, product image and trademarks if our products underperform or we otherwise draw negative publicity.
Downturns in our customers’ cyclical industries could adversely affect our sales and profitability.
Downturns in the businesses that use our specialty chemicals will adversely affect our sales. Many of our customers are in industries, including the electronics, building and construction, oilfield and automotive industries, that are cyclical in nature and sensitive to changes in general economic conditions. Historically, downturns in general economic conditions have resulted in diminished product demand, excess manufacturing capacity and lower average selling prices, and we may experience similar problems in the future. A decline in economic conditions in our customers’ cyclical industries may have a material adverse effect on our sales and profitability.
Our results are subject to fluctuation because of irregularities in the demand for our HPC catalysts and certain of our agrichemicals.
Our HPC catalysts are used by petroleum refiners in their processing units to reduce the quantity of sulfur and other impurities in petroleum products. The effectiveness of HPC catalysts diminishes with use, requiring the HPC catalysts to be replaced, on average, once every one to three years. The sales of our HPC catalysts, therefore, are largely dependent on the useful life cycle of the HPC catalysts in the processing units and may vary materially by quarter. In addition, the timing and profitability of HPC catalysts sales can have a significant impact on revenue and profit in any one quarter. Sales of our agrichemicals are also subject to fluctuation as demand varies depending on climate and other environmental conditions, which
12
Albemarle Corporation and Subsidiaries | ||
may prevent or reduce farming for extended periods. In addition, crop pricing and timing of when farms alternate from one crop to another crop in a particular year can also alter sales of agrichemicals.
Changes in our customers’ products can reduce the demand for our specialty chemicals.
Our customers use our specialty chemicals for a broad range of applications. Changes in our customers’ products or processes may enable our customers to reduce consumption of the specialty chemicals that we produce or make our specialty chemicals unnecessary. Customers may also find alternative materials or processes that no longer require our products. Should a customer decide to use a different material due to price, performance or other considerations, we may not be able to supply a product that meets the customer’s new requirements. Consequently, it is important that we develop new products to replace the sales of products that mature and decline in use. Our business, results of operations, cash flows and margins could be materially adversely affected if we are unable to manage successfully the maturation of our existing products and the introduction of new products.
Our research and development efforts may not succeed and our competitors may develop more effective or successful products.
The specialty chemicals industry is subject to periodic technological change and ongoing product improvements. In order to maintain our margins and remain competitive, we must successfully develop, manufacture and market new or improved products. As a result, we must commit substantial resources each year to research and development. Ongoing investments in research and development for future products could result in higher costs without a proportional increase in revenues. Additionally, for any new product program, there is a risk of technical or market failure in which case we may not be able to develop the new commercial products needed to maintain our competitive position or we may need to commit additional resources to new product development programs. Moreover, new products may have lower margins than the products they replace.
Our industries and the end-use markets into which we sell our products experience periodic technological change and product improvement. Manufacturers periodically introduce new generations of products or require new technological capacity to develop customized products. Our future growth will depend on our ability to gauge the direction of the commercial and technological progress in all key end-use markets and upon our ability to fund and successfully develop, manufacture and market products in such changing end-use markets. We will have to continue to identify, develop, market and in certain cases, secure regulatory approval for innovative products on a timely basis to replace or enhance existing products in order to maintain our profit margins and our competitive position. We may not be successful in developing new products and/or technology, either alone or with third parties, or licensing intellectual property rights from third parties on a commercially competitive basis. Our new products may not be accepted by our customers or may fail to receive regulatory approval. If we fail to keep pace with the evolving technological innovations in our end-use markets on a competitive basis, our business, financial condition and results of operations could be adversely affected.
We also expect competition to increase as our competitors develop and introduce new and enhanced products. As new products enter the market, our products may become obsolete or competitors’ products may be marketed more effectively than our products. If we fail to develop new products, maintain or improve our margins with our new products or keep pace with technological developments, our business, financial condition, results of operations and cash flows will suffer.
Our inability to protect our intellectual property rights could have a material adverse effect on our business, financial condition and results of operations.
Protection of our proprietary processes, methods and compounds and other technology is important to our business. We generally rely on patent, trade secret, trademark and copyright laws of the U.S. and certain other countries in which our products are produced or sold, as well as licenses and nondisclosure and confidentiality agreements, to protect our intellectual property rights. The patent, trade secret, trademark and copyright laws of some countries may not protect our intellectual property rights to the same extent as the laws of the U.S. Failure to protect our intellectual property rights may result in the loss of valuable proprietary technologies. Additionally, some of our technologies are not covered by any patent or patent application and, even if a patent application has been filed, it may not result in an issued patent. If patents are issued to us, those patents may not provide meaningful protection against competitors or against competitive technologies. We cannot assure you that our intellectual property rights will not be challenged, invalidated, circumvented or rendered unenforceable.
We also conduct research and development activities with third parties and license certain intellectual property rights from third parties and we plan to continue to do so in the future. We endeavor to license or otherwise obtain intellectual property rights on terms favorable to us. However, we may not be able to license or otherwise obtain intellectual property rights on such terms or at all. Our inability to license or otherwise obtain such intellectual property rights could have a material
13
Albemarle Corporation and Subsidiaries | ||
adverse effect on our ability to create a competitive advantage and create innovative solutions for our customers, which will adversely affect our net sales and our relationships with our customers.
We could face patent infringement claims from our competitors or others alleging that our processes or products infringe on their proprietary technologies. If we are found to be infringing on the proprietary technology of others, we may be liable for damages and we may be required to change our processes, redesign our products partially or completely, pay to use the technology of others, stop using certain technologies or stop producing the infringing product entirely. Even if we ultimately prevail in an infringement suit, the existence of the suit could prompt customers to switch to products that are not the subject of infringement suits. We may not prevail in intellectual property litigation and such litigation may result in significant legal costs or otherwise impede our ability to produce and distribute key products.
We also rely upon unpatented proprietary manufacturing expertise, continuing technological innovation and other trade secrets to develop and maintain our competitive position. While we generally enter into confidentiality agreements with our employees and third parties to protect our intellectual property, we cannot assure you that our confidentiality agreements will not be breached, that they will provide meaningful protection for our trade secrets and proprietary manufacturing expertise or that adequate remedies will be available in the event of an unauthorized use or disclosure of our trade secrets or manufacturing expertise.
Our business and operations could suffer in the event of cyber-security breaches.
Attempts by others to gain unauthorized access to our information technology systems become more sophisticated over time. These attempts, which might be related to industrial or other espionage, include covertly introducing malware to our computers and networks and impersonating authorized users, among others. We seek to detect and investigate all security incidents and to prevent their recurrence, but in some cases we might be unaware of an incident or its magnitude and effects. The theft, unauthorized use or publication of our intellectual property and/or confidential business information could harm our competitive position, reduce the value of our investment in research and development and other strategic initiatives or otherwise adversely affect our business. To the extent that any cyber-security breach results in inappropriate disclosure of our customers’ or licensees’ confidential information, we may incur liability as a result.
Our substantial international operations subject us to risks of doing business in foreign countries, which could adversely affect our business, financial condition and results of operations.
We conduct a substantial portion of our business outside of the U.S. We expect sales from international markets to continue to represent a significant portion of our net sales and the net sales of our joint ventures. Accordingly, our business is subject to risks related to the differing legal, political, social and regulatory requirements and economic conditions of many jurisdictions. Risks inherent in international operations include the following:
• | fluctuations in foreign currency exchange rates may affect product demand and may adversely affect the profitability in U.S. Dollars of products and services we provide in international markets where payment for our products and services is made in the local currency; |
• | transportation and other shipping costs may increase; |
• | intellectual property rights may be more difficult to enforce; |
• | increased cost of, and decreased availability of raw materials; |
• | changes in foreign laws and tax rates or U.S. laws and tax rates with respect to foreign income may unexpectedly increase the rate at which our income is taxed, impose new and additional taxes on remittances, repatriation or other payments by subsidiaries, or cause the loss of previously recorded tax benefits; |
• | foreign countries may adopt other restrictions on foreign trade or investment, including currency exchange controls; |
• | trade sanctions could result in losing access to customers and suppliers in those countries; |
• | unexpected adverse changes in foreign laws or regulatory requirements may occur; |
• | agreements may be difficult to enforce and receivables difficult to collect; |
• | compliance with a variety of foreign laws and regulations may be burdensome; |
• | compliance with anti-bribery and anti-corruption laws may be costly; |
• | unexpected adverse changes in export duties, quotas and tariffs and difficulties in obtaining export licenses; |
• | general economic conditions in the countries in which we operate could have an adverse effect on our earnings from operations in those countries; |
• | foreign operations may experience staffing difficulties and labor disputes; |
14
Albemarle Corporation and Subsidiaries | ||
• | foreign governments may nationalize private enterprises; and |
• | our business and profitability in a particular country could be affected by political or economic repercussions from terrorist activities and the response to such activities, the possibility of hyperinflationary conditions and political instability in certain countries. |
In addition, certain of our joint ventures operate, and we have ongoing capital projects in, high-risk regions of the world such as the Middle East and South America. Unanticipated events such as geopolitical changes could result in a write-down of our investment in the affected joint venture or a delay or cancellation of those capital projects, which could negatively impact our future growth and profitability. Our success as a global business will depend, in part, upon our ability to succeed in differing legal, regulatory, economic, social and political conditions by developing, implementing and maintaining policies and strategies that are effective in each location where we and our joint ventures do business.
Furthermore, our subsidiaries are subject to rules and regulations related to anti-bribery prohibitions of the U.S. and other countries and export controls and economic embargoes, violations of which may carry substantial penalties. For example, export control and economic embargo regulations limit the ability of our subsidiaries to market, sell, distribute or otherwise transfer their products or technology to prohibited countries or persons. Failure to comply with these regulations could subject our subsidiaries to fines, enforcement actions and/or have an adverse effect on our reputation and the value of our common stock.
Changes in, or the interpretation of, tax legislation or rates throughout the world could materially impact our results.
Our future effective tax rate and related tax balance sheet attributes could be impacted by changes in tax legislation throughout the world. Currently, the majority of our net sales are generated from customers located outside of the U.S., and a substantial portion of our assets and employees are located outside of the U.S. If these funds are needed for our operations in the U.S., we believe we will be able to access such funds in a tax efficient manner to satisfy cash flow needs.
We have not accrued income taxes or foreign withholding taxes on undistributed earnings for most non-U.S. subsidiaries, because those earnings are intended to be indefinitely reinvested in the operations of those subsidiaries. Certain tax proposals with respect to such earnings could substantially increase our tax expense, which would substantially reduce our income and have a material adverse effect on our results of operations and cash flows from operating activities. Currently, there are no contemplated cash distributions that will result in incremental U.S. taxes payable in excess of applicable foreign tax credits related to such undistributed earnings. As a result, we have not provided any deferred income taxes on the portion of undistributed foreign earnings determined not to be permanently reinvested in foreign operations.
Our future effective tax rates could be affected by changes in the mix of earnings in countries with differing statutory tax rates, expirations of tax holidays, changes in the assessment regarding the realization of the valuation of deferred tax assets, or changes in tax laws and regulations or their interpretation. We are subject to the regular examination of our income tax returns by various tax authorities. We regularly assess the likelihood of adverse outcomes resulting from these examinations to determine the adequacy of our provision for taxes. It is possible the outcomes from these examinations will have a material adverse effect on our financial condition and operating results.
We are exposed to fluctuations in foreign exchange rates, which may adversely affect our operating results and net income.
We conduct our business and incur costs in the local currency of most of the countries in which we operate. The financial condition and results of operations of each foreign operating subsidiary and joint venture are reported in the relevant local currency and then translated to U.S. Dollars at the applicable currency exchange rate for inclusion in our consolidated financial statements. Changes in exchange rates between these foreign currencies and the U.S. Dollar will affect the recorded levels of our assets, liabilities, net sales, cost of goods sold and operating margins and could result in exchange losses. The primary currencies to which we have exposure are the European Union Euro, Japanese Yen, Singapore Dollar, Chinese Renminbi, Australian Dollar, Chilean Peso and the British Pound Sterling. Exchange rates between these currencies and the U.S. Dollar in recent years have fluctuated significantly and may do so in the future. With respect to our potential exposure to foreign currency fluctuations and devaluations, for the year ended December 31, 2015, approximately 42% of our net sales were denominated in such currencies. Significant changes in these foreign currencies relative to the U.S. Dollar could also have an adverse effect on our ability to meet interest and principal payments on any foreign currency-denominated debt outstanding. In addition to currency translation risks, we incur currency transaction risks whenever one of our operating subsidiaries or joint ventures enters into either a purchase or a sales transaction using a different currency from its functional currency. Our operating results and net income may be affected by any volatility in currency exchange rates and our ability to manage effectively our currency transaction and translation risks.
15
Albemarle Corporation and Subsidiaries | ||
Our business could be adversely affected by environmental, health and safety laws and regulations to which our raw materials, products and facilities are subject.
In the jurisdictions in which we operate, we are subject to numerous federal, state and local environmental, health and safety laws and regulations, including those governing the discharge of pollutants into the air and water, the management and disposal of hazardous substances and wastes and the cleanup of contaminated properties. Further, some of the raw materials we handle are subject to government regulation. These regulations affect the manufacturing processes, handling, uses and applications of our products. In addition, our production facilities and a number of our distribution centers require numerous operating permits that are subject to renewal. Due to the nature of these requirements and changes in our operations, our operations may exceed limits under permits or we may not have the proper permits to operate our operations. Ongoing compliance with such laws, regulations and permits is an important consideration for us and we incur substantial capital and operating costs in our compliance efforts. Environmental laws have become increasingly strict in recent years. We expect this trend to continue and anticipate that compliance will continue to require increased capital expenditures and operating costs.
Compliance with environmental laws generally increases the costs of manufacturing, the cost of registration/approval requirements, the costs of transportation and storage of raw materials and finished products, as well as the costs of the storage and disposal of wastes, and could have a material adverse effect on our results of operations. We may incur substantial costs, including fines, damages, criminal or civil sanctions and remediation costs, or experience interruptions in our operations, for violations arising under these laws or permit requirements. Furthermore, environmental laws are subject to change and have tended to become stricter over time. Such changes in environmental laws or their interpretation, or the enactment of new environmental laws, could result in materially increased capital expenditures and compliance costs.
Violations of environmental, health and safety laws and regulations may subject us to fines, penalties and other liabilities and may require us to change certain business practices or curtail production.
If we violate environmental, health and safety laws or regulations, in addition to being required to correct such violations, we can be held liable in administrative, civil or criminal proceedings for substantial fines and other sanctions could be imposed that could disrupt or limit our operations. Liabilities associated with the investigation and cleanup of hazardous substances, as well as personal injury, property damages or natural resource damages arising from the release of, or exposure to, such hazardous substances, may be imposed in many situations without regard to violations of laws or regulations or other fault, and may also be imposed jointly and severally (so that a responsible party may be held liable for more than its share of the losses involved, or even the entire loss). Such liabilities may also be imposed on many different entities with a relationship to the hazardous substances at issue, including, for example, entities that formerly owned or operated the property affected by the hazardous substances and entities that arranged for the disposal of the hazardous substances at the affected property, as well as entities that currently own or operate such property. Such liabilities can be difficult to identify and the extent of any such liabilities can be difficult to predict. We use, and in the past have used, hazardous substances at many of our facilities, and we have in the past, and may in the future, be subject to claims relating to exposure to hazardous materials and the associated liabilities may be material. We also have generated, and continue to generate, hazardous wastes at a number of our facilities. Some of our facilities also have lengthy histories of manufacturing or other activities that have resulted in site contamination. We have also given contractual indemnities for environmental conditions relating to facilities we no longer own or operate. The nature of our business, including historical operations at our current and former facilities, exposes us to risks of liability under these laws and regulations due to the production, storage, use, transportation and sale of materials that can cause contamination or personal injury if released into the environment. Additional information may arise in the future concerning the nature or extent of our liability with respect to identified sites, and additional sites may be identified for which we are alleged to be liable, that could cause us to materially increase our environmental accrual or the upper range of the costs we believe we could reasonably incur for such matters.
We may be subject to indemnity claims and liable for other payments relating to properties or businesses we have divested.
In connection with the sale of certain properties and businesses, we have agreed to indemnify the purchasers for certain types of matters, such as certain breaches of representations and warranties, taxes and certain environmental matters.
With respect to environmental matters, the discovery of contamination arising from properties that we have divested may expose us to indemnity obligations under the sale agreements with the buyers of such properties or cleanup obligations and other damages under applicable environmental laws.
We may not have insurance coverage for such indemnity obligations or cash flows to make such indemnity or other payments. Further, we cannot predict the nature of and the amount of any indemnity or other obligations we may have to the applicable purchaser. Such payments may be costly and may adversely affect our financial condition and results of operations.
16
Albemarle Corporation and Subsidiaries | ||
Contractual indemnities may be ineffective in protecting us from environmental liabilities.
At several of our properties where hazardous substances are known to exist (including some sites where hazardous substances are being investigated or remediated), we believe we are entitled to contractual indemnification from one or more former owners or operators; however, in the event we make a claim, the indemnifier may disagree with us or not have the financial capacity to fulfill its indemnity obligation. If our contractual indemnity is not upheld or effective, our accrual and/or our costs for the investigation and cleanup of hazardous substances could increase materially.
We may be exposed to certain regulatory and financial risks related to climate change.
Growing concerns about climate change may result in the imposition of additional regulations or restrictions to which we may become subject. Climate changes include changes in rainfall and in storm patterns and intensities, water shortages, significantly changing sea levels and increasing atmospheric and water temperatures, among others. For example, there have been concerns regarding the declining water level of the Dead Sea, from which our joint venture, JBC, produces bromine. A number of governments or governmental bodies have introduced or are contemplating regulatory changes in response to climate change. For example, some of our operations are within jurisdictions that have, or are developing, regulatory regimes governing greenhouse gas emissions. Potentially, additional U.S. federal regulation will be forthcoming with respect to greenhouse gas emissions (including carbon dioxide) and/or “cap and trade” legislation that could have impacts on our operations. In addition, we have operations in the European Union, Brazil, China, Japan, Jordan, Saudi Arabia, Singapore and the United Arab Emirates, which have implemented measures to achieve objectives under the Kyoto Protocol, an international agreement linked to the United Nations Framework Convention on Climate Change (“UNFCC”), which set binding targets for reducing greenhouse gas emissions. The first commitment period under the Kyoto Protocol expired in 2012. An amendment was passed by the UNFCC during the December 2012 Doha climate change talks that would implement a second commitment period through 2020. As of February 11, 2016, 60 countries have ratified the 2012 amendments. In December 2015, the 21st Conference of Parties for the UNFCC concluded with more than 190 countries adopting the Paris Agreement, a partly binding and partly voluntary agreement to cut global carbon emissions in an effort to limit the rise in global temperatures. The outcome of new legislation or regulation in the U.S. and other jurisdictions in which we operate may result in new or additional requirements, additional charges to fund energy efficiency activities, fees or restrictions on certain activities. While certain climate change initiatives may result in new business opportunities for us in the area of alternative fuel technologies and emissions control, compliance with these initiatives may also result in additional costs to us, including, among other things, increased production costs, additional taxes, reduced emission allowances or additional restrictions on production or operations. Any adopted future climate change regulations could also negatively impact our ability to compete with companies situated in areas not subject to such limitations. Even without such regulation, increased public awareness and adverse publicity about potential impacts on climate change emanating from us or our industry could harm us. We may not be able to recover the cost of compliance with new or more stringent laws and regulations, which could adversely affect our business and negatively impact our growth. Furthermore, the potential impacts of climate change and related regulation on our customers are highly uncertain and may adversely affect us.
Regulation, or the threat of regulation, of some of our products could have an adverse effect on our sales and profitability.
We manufacture or market a number of products that are or have been the subject of attention by regulatory authorities and environmental interest groups. For example, for many years we have marketed methyl bromide, a chemical that is particularly effective as a soil fumigant. In recent years, the market for methyl bromide has changed significantly, driven by the Montreal Protocol of 1990 and related regulations prompted by findings regarding the chemical’s potential to deplete the ozone layer. Completion of the phase-out of methyl bromide as a fumigant took effect January 1, 2005, with critical uses allowed on an annual basis until feasible alternatives are available.
Over the past decade, there has been increasing scrutiny of certain brominated flame retardants by regulatory authorities, legislative bodies and environmental interest groups in various countries. We manufacture a broad range of brominated flame retardant products, which are used in a variety of applications to protect people, property and the environment from the negative consequences of fire. Concern about the impact of some of our products on human health or the environment may lead to regulation, or reaction in our markets independent of regulation, that could reduce or eliminate markets for such products.
Agencies in the European Union continue to evaluate the risks to human health and the environment associated with certain brominated flame retardants such as tetrabromobisphenol A and decabromodiphenylethane, both of which we manufacture. Additional government regulations, including limitations or bans on the use of brominated flame retardants, could result in a decline in our net sales of brominated flame retardants and have an adverse effect on our sales and profitability. In addition, the threat of additional regulation or concern about the impact of brominated flame retardants on human health or the environment could lead to a negative reaction in our markets that could reduce or eliminate our markets for these products, which could have an adverse effect on our sales and profitability.
17
Albemarle Corporation and Subsidiaries | ||
We could be subject to damages based on claims brought against us by our customers or lose customers as a result of the failure of our products to meet certain quality specifications.
Our products provide important performance attributes to our customers’ products. If a product fails to perform in a manner consistent with quality specifications or has a shorter useful life than guaranteed, a customer could seek replacement of the product or damages for costs incurred as a result of the product failing to perform as guaranteed. These risks apply to our refinery catalysts in particular because, in certain instances, we sell our refinery catalysts under agreements that contain limited performance and life cycle guarantees. Also, because many of our products are integrated into our customers’ products, we may be requested to participate in, or fund in whole or in part the costs of, a product recall conducted by a customer. For example, some of our businesses supply products to customers in the automotive industry. In the event one of these customers conducts a product recall that it believes is related to one of our products, we may be asked to participate in or fund in whole or in part such a recall.
Our customers often require our subsidiaries to represent that our products conform to certain product specifications provided by our customers. Any failure to comply with such specifications could result in claims or legal action.
A successful claim or series of claims against us could have a material adverse effect on our financial condition and results of operations and could result in a loss of one or more customers.
Our business is subject to hazards common to chemical businesses, any of which could injure our employees or other persons, damage our facilities or other properties, interrupt our production and adversely affect our reputation and results of operations.
Our business is subject to hazards common to chemical manufacturing, storage, handling and transportation, including explosions, fires, inclement weather, natural disasters, mechanical failure, unscheduled downtime, transportation interruptions, remediation, chemical spills, discharges or releases of toxic or hazardous substances or gases and other risks. These hazards can cause personal injury and loss of life to our employees and other persons, severe damage to, or destruction of, property and equipment and environmental contamination. In addition, the occurrence of material operating problems at our facilities due to any of these hazards may diminish our ability to meet our output goals. Accordingly, these hazards and their consequences could adversely affect our reputation and have a material adverse effect on our operations as a whole, including our results of operations and cash flows, both during and after the period of operational difficulties.
Natural disasters and weather-related matters could impact our results of operations.
Historically, major hurricanes have caused significant disruption to the operations on the U.S. Gulf Coast for many of our customers and our suppliers of certain raw materials, which had an adverse impact on volume and cost for some of our products. Our operations at the Salar de Atacama, in Chile, could be subject to significant rain events and earthquakes. If similar weather-related matters or other natural disasters occur in the future, they could negatively affect the results of operations at our sites in the affected regions as well as have adverse impacts on the global economy.
The insurance that we maintain may not fully cover all potential exposures.
We maintain property, business interruption and casualty insurance but such insurance may not cover all risks associated with the hazards of our business and is subject to limitations, including deductibles and maximum liabilities covered. We may incur losses beyond the limits, or outside the coverage, of our insurance policies, including liabilities for environmental remediation. In addition, from time to time, various types of insurance for companies in the specialty chemical industry have not been available on commercially acceptable terms or, in some cases, have not been available at all. We are potentially at additional risk if one or more of our insurance carriers fail. Additionally, severe disruptions in the domestic and global financial markets could adversely impact the ratings and survival of some insurers. Future downgrades in the ratings of enough insurers could adversely impact both the availability of appropriate insurance coverage and its cost. In the future, we may not be able to obtain coverage at current levels, if at all, and our premiums may increase significantly on coverage that we maintain.
We may incur significant charges in the event we close or divest all or part of a manufacturing plant or facility.
We continually assess our manufacturing operations in order to manufacture and distribute our products in the most efficient manner. Based on our assessments, we may make capital improvements to modernize certain units, move manufacturing or distribution capabilities from one plant or facility to another plant or facility, discontinue manufacturing or distributing certain products or close or divest all or part of a manufacturing plant or facility. We also have shared services agreements at several of our plants and if such agreements are terminated or revised, we would assess and potentially adjust our manufacturing operations. The closure or divestiture of all or part of a manufacturing plant or facility could result in future charges that could be significant.
18
Albemarle Corporation and Subsidiaries | ||
If we are unable to retain key personnel or attract new skilled personnel, it could have an adverse effect on our business.
The unanticipated departure of any key member of our management team could have an adverse effect on our business. In addition, because of the specialized and technical nature of our business, our future performance is dependent on the continued service of, and on our ability to attract and retain, qualified management, scientific, technical, marketing and support personnel. Competition for such personnel is intense, and we may be unable to continue to attract or retain such personnel.
Some of our employees are unionized, represented by workers’ councils or are employed subject to local laws that are less favorable to employers than the laws of the U.S.
As of February 1, 2016, we had 6,963 employees. Certain of these employees are represented by unions or works councils. In addition, a large number of our employees are employed in countries in which employment laws provide greater bargaining or other rights to employees than the laws of the U.S. Such employment rights require us to work collaboratively with the legal representatives of the employees to effect any changes to labor arrangements. For example, most of our employees in Europe are represented by workers’ councils that must approve any changes in conditions of employment, including salaries and benefits and staff changes, and may impede efforts to restructure our workforce. Although we believe that we have a good working relationship with our employees, a strike, work stoppage, slowdown or significant dispute with our employees could result in a significant disruption of our operations or higher ongoing labor costs.
Our joint ventures may not operate according to their business plans if our partners fail to fulfill their obligations, which may adversely affect our results of operations and may force us to dedicate additional resources to these joint ventures.
We currently participate in a number of joint ventures and may enter into additional joint ventures in the future. The nature of a joint venture requires us to share control with unaffiliated third parties. If our joint venture partners do not fulfill their obligations, the affected joint venture may not be able to operate according to its business plan. In that case, our results of operations may be adversely affected and we may be required to increase the level of our commitment to the joint venture. Also, differences in views among joint venture participants may result in delayed decisions or failures to agree on major issues. If these differences cause the joint ventures to deviate from their business plans, our results of operations could be adversely affected.
We may not be able to successfully integrate the businesses of Albemarle and Rockwood and therefore may not be able to realize the anticipated benefits of the Merger.
Realization of the anticipated benefits in the Merger will depend, in part, on our ability to successfully integrate the businesses and operations of Albemarle and Rockwood. We will be required to devote significant management attention and resources to integrating business practices, operations and support functions.
Our success after the Merger will also depend in part upon our ability to retain key employees subsequent to the Merger. The diversion of management’s attention and any delays or difficulties encountered in connection with the integration of the two companies’ operations could have an adverse effect on our business, financial results, financial condition or our stock price. The integration process may also result in additional and unforeseen expenses. There can be no assurance that the contemplated synergies anticipated from the Merger will be realized, or maintained if realized. If the integration is not successful, the anticipated benefits of the Merger may not be realized fully or at all or may take longer to realize than expected. There can be no assurances that the expected benefits and efficiencies related to the integration of the businesses will be realized to offset the integration and restructuring costs over time.
We may not be able to consummate future acquisitions or integrate acquisitions into our business, which could result in unanticipated expenses and losses.
As part of our business growth strategy, we have acquired businesses and entered into joint ventures in the past and intend to pursue acquisitions and joint venture opportunities in the future. Our ability to implement this component of our growth strategy will be limited by our ability to identify appropriate acquisition or joint venture candidates and our financial resources, including available cash and borrowing capacity. The expense incurred in consummating acquisitions or entering into joint ventures, the time it takes to integrate an acquisition or our failure to integrate businesses successfully, could result in unanticipated expenses and losses. Furthermore, we may not be able to realize any of the anticipated benefits from acquisitions or joint ventures.
The process of integrating acquired operations into our existing operations may result in unforeseen operating difficulties and may require significant financial resources that would otherwise be available for the ongoing development or expansion of existing operations. Some of the risks associated with the integration of acquisitions include:
• | potential disruption of our ongoing business and distraction of management; |
19
Albemarle Corporation and Subsidiaries | ||
• | unforeseen claims and liabilities, including unexpected environmental exposures; |
• | unforeseen adjustments, charges and write-offs; |
• | problems enforcing the indemnification obligations of sellers of businesses or joint venture partners for claims and liabilities; |
• | unexpected losses of customers of, or suppliers to, the acquired business; |
• | difficulty in conforming the acquired businesses’ standards, processes, procedures and controls with our operations; |
• | variability in financial information arising from the implementation of purchase price accounting; |
• | inability to coordinate new product and process development; |
• | loss of senior managers and other critical personnel and problems with new labor unions; and |
• | challenges arising from the increased scope, geographic diversity and complexity of our operations. |
Although our pension plans currently meet minimum funding requirements, events could occur that would require us to make significant contributions to the plans and reduce the cash available for our business.
We have several defined benefit pension plans around the world, including in the U.S., United Kingdom (“U.K.”), Germany, Belgium, and Japan, covering most of our employees. We are required to make cash contributions to our pension plans to the extent necessary to comply with minimum funding requirements imposed by the various countries’ benefit and tax laws. The amount of any such required contributions will be determined annually based on an actuarial valuation of the plans as performed by the plans’ actuaries.
In previous years, we have made voluntary contributions to our U.S. qualified defined benefit pension plans. We anticipate approximately $8.0 million of required cash contributions during 2016 for our defined benefit pension plans. Additional voluntary pension contributions in and after 2016 may vary depending on factors such as asset returns, interest rates, and legislative changes. The amounts we may elect or be required to contribute to our pension plans in the future may increase significantly. These contributions could be substantial and would reduce the cash available for our business.
Further, an economic downturn or recession or market disruption in the capital and credit markets may adversely impact the value of our pension plan assets, our results of operations, our statement of changes in stockholders’ equity and our liquidity. For example, we have several pension plans located in Germany, Belgium, Japan and the U.S. Our funding obligations could change significantly based on the investment performance of the pension plan assets and changes in actuarial assumptions for local statutory funding valuations. Any deterioration of the capital markets or returns available in such markets may negatively impact our pension plan assets and increase our funding obligations for one or more of these plans and negatively impact our liquidity. We cannot predict the impact of this or any further market disruption on our pension funding obligations.
The occurrence or threat of extraordinary events, including domestic and international terrorist attacks, may disrupt our operations and decrease demand for our products.
Chemical-related assets may be at greater risk of future terrorist attacks than other possible targets in the U.S. and throughout the world. As a result, we are subject to existing federal rules and regulations (and may be subject to additional legislation or regulations in the future) that impose site security requirements on chemical manufacturing facilities, which increase our overhead expenses.
We are also subject to federal regulations that have heightened security requirements for the transportation of hazardous chemicals in the U.S. We believe we have met these requirements but additional federal and local regulations that limit the distribution of hazardous materials are being considered. We ship and receive materials that are classified as hazardous. Bans on movement of hazardous materials through cities, like Washington, D.C., could affect the efficiency of our logistical operations. Broader restrictions on hazardous material movements could lead to additional investment to produce hazardous raw materials and change where and what products we manufacture.
The occurrence of extraordinary events, including future terrorist attacks and the outbreak or escalation of hostilities, cannot be predicted, and their occurrence can be expected to continue to negatively affect the economy in general and specifically the markets for our products. The resulting damage from a direct attack on our assets, or assets used by us, could include loss of life and property damage. In addition, available insurance coverage may not be sufficient to cover all of the damage incurred or, if available, may be prohibitively expensive.
20
Albemarle Corporation and Subsidiaries | ||
We will need a significant amount of cash to service our indebtedness and our ability to generate cash depends on many factors beyond our control.
Our ability to generate sufficient cash flow from operations to make scheduled payments on our debt depends on a range of economic, competitive and business factors, many of which are outside our control. Our business may not generate sufficient cash flow from operations to service our debt obligations. If we are unable to service our debt obligations, we may need to refinance all or a portion of our indebtedness on or before maturity, reduce or delay capital expenditures, sell assets or raise additional equity. We may not be able to refinance any of our indebtedness, sell assets or raise additional equity on commercially reasonable terms or at all, which could cause us to default on our obligations and impair our liquidity. Our inability to generate sufficient cash flow to satisfy our debt obligations, or to refinance our obligations on commercially reasonable terms, could have a material adverse effect on our business and financial condition.
Restrictive covenants in our debt instruments may adversely affect our business.
Our February 2014 credit agreement and the indentures governing our senior notes contain select restrictive covenants. These covenants provide constraints on our financial flexibility. The failure to comply with the covenants in our February 2014 credit agreement, the indentures governing the senior notes and the agreements governing other indebtedness, including indebtedness incurred in the future, could result in an event of default, which, if not cured or waived, could have a material adverse effect on our business, financial condition and results of operations. See “Financial Condition and Liquidity—Long-Term Debt” in Item 7. Management’s Discussion and Analysis of Financial Condition and Results of Operations on page 50.
A downgrade of the ratings on our debt or an increase in interest rates could cause our debt service obligations to increase.
Borrowings under our February 2014 credit agreement, our commercial paper program and our September 2015 term loan agreement bear interest at floating rates. The rates under our February 2014 credit agreement and our September 2015 term loan agreement are subject to adjustment based on the ratings of our senior unsecured long-term debt by Standard & Poor’s Ratings Services (“S&P”), Moody’s Investors Services (“Moody’s”) and Fitch Ratings (“Fitch”). S&P has rated our senior unsecured long-term debt as BBB-, Moody’s has rated our senior unsecured long-term debt as Baa3, and Fitch has rated our senior unsecured long-term debt as BBB-. S&P has rated our commercial paper as A-3, Moody’s has rated it as P-3 and Fitch has rated it as F-3. S&P, Moody’s and/or Fitch may downgrade our ratings in the future. The downgrading of any of our ratings or an increase in any of the benchmark interest rates would result in an increase of our interest expense on our variable rate borrowings.
Changes in credit ratings issued by nationally recognized statistical rating organizations could adversely affect our cost of financing and the market price of our securities.
Credit rating agencies rate our debt securities on factors that include our operating results, actions that we take, their view of the general outlook for our industry and their view of the general outlook for the economy. Actions taken by the rating agencies can include maintaining, upgrading or downgrading the current rating or placing us on a watch list for possible future downgrading. Downgrading the credit rating of our debt securities or placing us on a watch list for possible future downgrading would likely increase our cost of future financing, could limit our access to the capital markets and have an adverse effect on the market price of our securities.
Because a significant portion of our operations is conducted through our subsidiaries and joint ventures, our ability to service our debt may be dependent on our receipt of distributions or other payments from our subsidiaries and joint ventures.
A significant portion of our operations is conducted through our subsidiaries and joint ventures. As a result, our ability to service our debt may be partially dependent on the earnings of our subsidiaries and joint ventures and the payment of those earnings to us in the form of dividends, loans or advances and through repayment of loans or advances from us. Payments to us by our subsidiaries and joint ventures will be contingent upon our subsidiaries’ or joint ventures’ earnings and other business considerations and may be subject to statutory or contractual restrictions. In addition, there may be significant tax and other legal restrictions on the ability of non-U.S. subsidiaries or joint ventures to remit money to us.
We may continue to expand our business through acquisitions and we may incur additional indebtedness, including indebtedness related to acquisitions.
We have historically expanded our business primarily through acquisitions. A part of our business strategy is to continue to grow through acquisitions that complement our existing technologies and accelerate our growth. Because the consummation of acquisitions and integration of acquired businesses involves significant risk, this means that investors in our securities will be subject to the risks inherent in our acquisition strategy. In addition, the indentures governing our senior notes does not limit our
21
Albemarle Corporation and Subsidiaries | ||
ability to incur additional indebtedness in connection with acquisitions or otherwise. Our credit facilities have limited financial maintenance covenants. As a result, we may incur substantial additional indebtedness in connection with acquisitions.
As a result of the Merger, Albemarle, on a consolidated basis, incurred substantial additional indebtedness and related debt service obligations. This additional indebtedness and the related debt service obligations could have important consequences, including:
• | reducing flexibility in planning for, or reacting to, changes in our businesses, the competitive environment and the industries in which we operate, and to technological and other changes; |
• | lowering credit ratings; |
• | reducing access to capital and increasing borrowing costs generally or for any additional indebtedness to finance future operating and capital expenses and for general corporate purposes; |
• | reducing funds available for operations, capital expenditures and other activities; and |
• | creating competitive disadvantages relative to other companies with lower debt levels. |
We may be subject to increased tax exposure resulting from Rockwood pre-acquisition periods.
Under the terms of certain purchase agreements, third party sellers have agreed to substantially indemnify us for tax liabilities pertaining to Rockwood’s pre-acquisition periods generally until the applicable statutes of limitations expire. To the extent such companies fail to indemnify or satisfy their obligations, or if any amount is not covered by the terms of the indemnity, earnings could be negatively impacted in future periods through increased tax expense.
We have not established proven or probable reserves through the completion of a feasibility study for the minerals that we produce.
We have not established proven or probable reserves, as defined by the SEC under Industry Guide 7, through the completion of a “final” or “bankable” feasibility study for any of the minerals that we produce. Furthermore, we have no plans to establish proven or probable reserves for any of our projects. Since we commenced production without having established proven or probable reserves, there may be greater inherent uncertainty as to whether or not mineralized material can be economically obtained as originally planned and anticipated. Also, because we do not have any proven or probable reserves, we may not be able to continue to produce such minerals at existing levels or to expand our production capacity in the future which could harm our business, results or operations and financial condition.
Future events may impact our deferred tax asset position and U.S deferred federal income taxes on undistributed earnings of international affiliates that are considered to be reinvested indefinitely.
We evaluate our ability to utilize deferred tax assets and our need for a valuation allowance based on available evidence. This process involves significant management judgment about assumptions that are subject to change from period to period based on changes in tax laws or variances between future projected operating performance and actual results. We are required to establish a valuation allowance for deferred tax assets if we determine, based on available evidence at the time the determination is made, that it is more likely than not that some portion or all of the deferred tax assets will not be utilized. In making this determination, we evaluate all positive and negative evidence as of the end of each reporting period. Future adjustments (either increases or decreases), to the deferred tax asset valuation allowance are determined based upon changes in the expected realization of the net deferred tax assets. The utilization of our deferred tax assets ultimately depends on the existence of sufficient taxable income in either the carry-back or carry-forward periods under the tax law. Due to significant estimates used to establish the valuation allowance and the potential for changes in facts and circumstances, it is reasonably possible that we will be required to record adjustments to the valuation allowance in future reporting periods. Changes to the valuation allowance or the amount of deferred tax liabilities could have a materially adverse effect on our business, financial condition and results of operations. Further, should we change our assertion regarding the permanent reinvestment of the undistributed earnings in foreign operations, a deferred tax liability may need to be established.
If our goodwill, intangible assets or long-lived assets become impaired, we may be required to record a significant charge to earnings.
Under U.S. Generally Accepted Accounting Principles (“GAAP”), we review our intangible assets and long-lived assets for impairment when events or changes in circumstances indicate the carrying value may not be recoverable. Goodwill is tested for impairment on October 31 of each year, or more frequently if required. Factors that may be considered a change in circumstances, indicating that the carrying value of our goodwill, intangible assets or long-lived assets may not be recoverable, include, but are not limited to, a decline in our stock price and market capitalization, reduced future cash flow estimates, and slower growth rates in our industry. We may be required to record a significant charge in our financial statements during the
22
Albemarle Corporation and Subsidiaries | ||
period in which any impairment of our goodwill, intangible assets or long-lived assets is determined, negatively impacting our results of operations.
Our required capital expenditures may exceed our estimates.
Our capital expenditures for continuing operations generally consist of expenditures to maintain and improve existing equipment and substantial investments in new equipment. Commencement of production requires start-up, commission and certification of product quality by our customers, which may impact the expected timing of sales of product from such facility. Construction of large chemical operations is subject to numerous risks and uncertainties, including, among others, the ability to complete the project on a timely basis and in accordance with the estimated budget for such project and our ability to estimate future demand for our products.
Future capital expenditures may be significantly higher, depending on the investment requirements of each of our business lines, and may also vary substantially if we are required to undertake actions to compete with new technologies in our industry. We may not have the capital necessary to undertake these capital investments. If we are unable to do so, we may not be able to effectively compete in some of our markets.
Item 1B. | Unresolved Staff Comments. |
NONE
Item 2. | Properties. |
We operate on a global basis. Our principal executive offices in Baton Rouge, LA, and regional shared services offices in Budapest, Hungary and Dalian, China are leased. We and our affiliates also operate regional sales and administrative offices in various locations throughout the world, which are generally leased. Effective as of June 2016, our principal executive offices will be located in Charlotte, NC.
We believe that our production facilities, research and development facilities, and sales and administrative offices are generally well maintained, effectively used and are adequate to operate our business. During 2015, the Company’s manufacturing plants operated at approximately 73% capacity in the aggregate.
Set forth below is information regarding our significant production facilities operated by our affiliates and us:
Location | Business Segment in 2015 | Principal Use | Owned/Leased | |||
Amsterdam, the Netherlands | Refining Solutions | Production of refinery catalysts, research and product development activities | Owned | |||
Auckland, New Zealand | Chemetall Surface Treatment | Production of surface treatment chemicals for general industry, aerospace, and other pre-treatment technologies | Leased | |||
Baton Rouge, Louisiana | Performance Chemicals | Research and product development activities, and production of flame retardants, catalysts and additives | Owned; on leased land | |||
Bayswater North, Australia | Chemetall Surface Treatment | Production of surface treatment chemicals for general industry, aerospace, and other pre-treatment technologies | Owned | |||
Bitterfeld, Germany | Refining Solutions | Refinery catalyst regeneration, rejuvenation, and sulfiding | Owned by Eurecat S.A., a joint venture owned 50% by each of IFP Investissements and us | |||
Blackman Township, Michigan | Chemetall Surface Treatment | Production of surface treatment chemicals for general industry, automotive, and other pre-treatment technologies | Owned | |||
Boksburg, South Africa | Chemetall Surface Treatment | Production of surface treatment chemicals for automotive and other pre-treatment technologies | Owned | |||
Cambridge, U.K. | Performance Chemicals | Production of performance catalysts | Leased | |||
Canovelles, Spain | Chemetall Surface Treatment | Production of surface treatment chemicals for automotive and other pre-treatment technologies | Owned | |||
23
Albemarle Corporation and Subsidiaries | ||
Location | Business Segment in 2015 | Principal Use | Owned/Leased | |||
Cayirova-Kocaeli, Turkey | Chemetall Surface Treatment | Production of surface treatment chemicals for automotive and other pre-treatment technologies | Owned | |||
Changchun, China | Chemetall Surface Treatment | Production of surface treatment chemicals for automotive and other pre-treatment technologies | Leased by Changchun Chemetall Chemicals Company Limited, a joint venture owned 57% by us and 43% by Changchun Yongchan Petro Chemicals Company Limited | |||
Chennai, India | Chemetall Surface Treatment | Production of surface treatment chemicals for automotive and other pre-treatment technologies | Owned | |||
Chongqing, China | Chemetall Surface Treatment | Production of surface treatment chemicals for automotive and other pre-treatment technologies | Leased by Chongqing Chemetall Surface Treatment Company Limited, a joint venture owned 55% by us and 45% by Zhongtian Environmental Protection (Group) Company Limited | |||
El Marqués, Querétaro, Mexico | Chemetall Surface Treatment | Production of surface treatment chemicals for aerospace, automotive, other pre-treatment technologies | Leased | |||
Foshan, China | Chemetall Surface Treatment | Production of surface treatment chemicals for general industry and automotive | Leased by Foshan Chemetall Surface Treatment Company, a joint venture owned 57% by us and 43% by Changchun Yongchan Petro Chemicals Company Limited | |||
Giussano, Italy | Chemetall Surface Treatment | Production of surface treatment chemicals for automotive and other pre-treatment technologies | Owned | |||
Greenbushes, Australia | Performance Chemicals | Production of lithium spodumene minerals and lithium concentrate | Owned by Windfield Holdings Pty Ltd, a joint venture in which we own 49%, and Sichuan Tianqi Lithium Industries Inc which owns the remaining interest | |||
Jubail, Saudi Arabia | Performance Chemicals | Manufacturing and marketing of organometallics | Owned; Albemarle Netherlands BV and Saudi Specialty Chemicals Company (a SABIC affiliate) each owns 50% interest | |||
Jundiai/São Paulo, Brazil | Chemetall Surface Treatment | Production of surface treatment chemicals for automotive and other pre-treatment technologies | Owned | |||
Kings Mountain, North Carolina | Performance Chemicals | Production of technical and battery grade lithium hydroxide | Owned | |||
La Mirada, California | Chemetall Surface Treatment | Production of surface treatment chemicals for pre-treatment technologies and aerospace | Leased | |||
La Negra, Chile | Performance Chemicals | Production of lithium carbonate and lithium chloride | Owned | |||
Langelsheim, Germany | Performance Chemicals; Chemetall Surface Treatment | Production of butyllithium, lithium chloride, specialty products, lithium hydrides, cesium, special metals, as well as surface treatment chemicals for automotive technologies, other pre-treatment technologies and aerospace (sealants) | Owned | |||
24
Albemarle Corporation and Subsidiaries | ||
Location | Business Segment in 2015 | Principal Use | Owned/Leased | |||
Louvain-la-Neuve, Belgium | Refining Solutions; Performance Chemicals; All Other | Regional offices and research and customer technical service activities | Owned | |||
La Voulte, France | Refining Solutions | Refinery catalysts regeneration and treatment, research and development activities | Owned by Eurecat S.A., a joint venture owned 50% by each of IFP Investissements and us | |||
Magnolia, Arkansas | Performance Chemicals | Production of flame retardants, bromine, inorganic bromides, agricultural intermediates and tertiary amines | Owned | |||
McAlester, Oklahoma | Refining Solutions | Refinery catalyst regeneration, rejuvenation, pre-reclaim burn off, as well as specialty zeolites and additives marketing activities | Owned by Eurecat S.A., a joint venture owned 50% by each of IFP Investissements and us | |||
Mobile, Alabama | Performance Chemicals | Production of tin stabilizers | Owned by PMC Group, Inc. which operates the plant for Stannica LLC, a joint venture in which we and PMC Group Inc. each own a 50% interest | |||
Mönchengladbach, Germany | Chemetall Surface Treatment | Production of surface treatment chemicals for general industry | Owned | |||
Nanjing, China | Chemetall Surface Treatment | Production of surface treatment chemicals for automotive and other pre-treatment technologies | Leased | |||
New Johnsonville, Tennessee | Performance Chemicals | Production of specialty products | Owned | |||
Niihama, Japan | Refining Solutions | Production of refinery catalysts | Leased by Nippon Ketjen Company Limited, a joint venture owned 50% by each of Sumitomo Metal Mining Company Limited and us | |||
Pasadena, Texas | Performance Chemicals; All Other | Production of aluminum alkyls, alkenyl succinic anhydride, orthoalkylated anilines, and other specialty chemicals | Owned | |||
Pasadena, Texas | Refining Solutions | Production of refinery catalysts, research and development activities | Owned | |||
Pasadena, Texas | Refining Solutions | Refinery catalysts regeneration services | Owned by Eurecat U.S. Incorporated, a joint venture in which we own a 57.5% interest and a consortium of entities in various proportions owns the remaining interest | |||
Pune, India | Chemetall Surface Treatment | Production of surface treatment chemicals for automotive and other pre-treatment technologies | Owned | |||
Safi, Jordan | Performance Chemicals | Production of bromine and derivatives and flame retardants | Owned and leased by JBC, a joint venture owned 50% by each of Arab Potash Company Limited and us | |||
Salar de Atacama, Chile | Performance Chemicals | Production of lithium brine and potash | Owned; however ownership will revert to the Chilean government once we have sold all remaining amounts under our contract with the Chilean government pursuant to which we obtain lithium brine in Chile | |||
25
Albemarle Corporation and Subsidiaries | ||
Location | Business Segment in 2015 | Principal Use | Owned/Leased | |||
Santa Cruz, Brazil | Refining Solutions | Production of catalysts, research and product development activities | Owned by Fábrica Carioca de Catalisadores S.A, a joint venture owned 50% by each of Petrobras Química S.A.—PETROQUISA and us | |||
Sens, France | Chemetall Surface Treatment | Production of surface treatment chemicals for automotive and other pre-treatment technologies | Owned | |||
Shanghai, China | Chemetall Surface Treatment | Production of surface treatment chemicals for automotive and other pre-treatment technologies | Leased | |||
Silver Peak, Nevada | Performance Chemicals | Production of lithium-carbonate | Owned | |||
Singapore, Singapore | Chemetall Surface Treatment | Production of surface treatment chemicals for aerospace and other pre-treatment technologies | Leased | |||
Soissons, France | Chemetall Surface Treatment | Production of surface treatment chemicals for aerospace industry | Owned | |||
South Haven, Michigan | All Other | Production of custom fine chemistry products including pharmaceutical actives | Owned | |||
Taichung, Taiwan | Performance Chemicals | Production of butyllithium | Owned | |||
Takaishi City, Osaka, Japan | Performance Chemicals | Production of aluminum alkyls | Owned by Nippon Aluminum Alkys, a joint venture owned 50% by each of Mitsui Chemicals, Inc. and us | |||
Twinsburg, Ohio | Performance Chemicals | Production of bromine-activated carbon | Leased | |||
Tyrone, Pennsylvania | All Other | Production of custom fine chemistry products, agricultural intermediates, performance polymer products and research and development activities | Owned | |||
Willstatt, Germany | Chemetall Surface Treatment | Production of surface treatment chemicals for coil coating applications | Leased | |||
Yeosu, South Korea | Performance Chemicals | Research and product development activities/small scale production of catalysts and catalyst components | Owned | |||
Item 3. | Legal Proceedings. |
On February 19, 2015, Verition Multi-Strategy Master Fund Ltd and Verition Partners Master Fund Ltd, who collectively owned approximately 882,000 shares of Rockwood common stock immediately prior to the Merger, commenced an action in the Delaware Chancery Court seeking appraisal of their shares of Rockwood common stock pursuant to Delaware General Corporation Law § 262. These shareholders exercised their right not to receive the Merger consideration which was comprised of (i) $50.65 in cash, without interest, and (ii) 0.4803 of a share of Albemarle common stock, for each share of Rockwood common stock owned by such shareholders. Following the Merger, these shareholders ceased to have any rights with respect to their Rockwood shares, except for their rights to seek an appraisal of the cash value of their Rockwood shares under Delaware law. On March 16, 2015, Albemarle, on behalf of Rockwood, filed an Answer and Verified List in response to the appraisal petition. On November 2, 2015, the court granted the parties’ jointly stipulated amended scheduling order, which set forth dates for fact and expert discovery, as well as trial. On December 21, 2015, the parties entered into a Settlement Agreement and Release to resolve the matter, and on January 11, 2016, the Court dismissed the matter with prejudice.
In addition, we are involved from time to time in legal proceedings of types regarded as common in our business, including administrative or judicial proceedings seeking remediation under environmental laws, such as Superfund, products liability, breach of contract liability and premises liability litigation. Where appropriate, we may establish financial reserves for such proceedings. We also maintain insurance to mitigate certain of such risks.
26
Albemarle Corporation and Subsidiaries | ||
Item 4. | Mine Safety Disclosures. |
Not applicable.
Executive Officers of the Registrant.
The names, ages and biographies of our executive officers, as of February 17, 2016, are set forth below. The term of office of each officer is until the meeting of the Board of Directors following the next annual shareholders’ meeting (May 10, 2016).
Name | Age | Position | ||
Luther C. Kissam IV | 51 | President, Chief Executive Officer and Director | ||
Matthew K. Juneau | 55 | Senior Vice President, Corporate Strategy and Investor Relations | ||
Susan Kelliher | 49 | Senior Vice President, Human Resources | ||
Karen G. Narwold | 56 | Senior Vice President, General Counsel, Corporate and Government Affairs, Corporate Secretary | ||
Scott A. Tozier | 50 | Senior Vice President, Chief Financial Officer | ||
Donald J. LaBauve, Jr. | 49 | Vice President, Corporate Controller, Chief Accounting Officer | ||
Luther C. Kissam IV was elected to our Board of Directors effective November 2011, as Chief Executive Officer effective September 2011 and as our President effective May 2013. Previously, Mr. Kissam served as President from March 2010 until March 2012, Executive Vice President, Manufacturing, Law and HS&E from May 2009 until March 2010, and as Senior Vice President, Manufacturing and Law and Corporate Secretary from January 2008 until May 2009. Mr. Kissam joined us in October 2003 and served as Vice President, General Counsel and Corporate Secretary from that time until December 2005, when he was promoted to Senior Vice President, General Counsel and Corporate Secretary. Before joining us, Mr. Kissam served as Vice President, General Counsel and Secretary of Merisant Company (manufacturer and marketer of sweetener and consumer food products), having previously served as Associate General Counsel of Monsanto Company (provider of agricultural products and solutions).
Matthew K. Juneau was elected as our Senior Vice President, Corporate Strategy and Investor Relations effective May 2015. Previously, Mr. Juneau served as Senior Vice President, President Performance Chemicals since December 2013, Vice President, Polymer Solutions since March 2012, Vice President, Global Sales and Services from May 2009 to February 2012, and prior to that as Division Vice President of our performance chemicals business in the Fine Chemistry division since January 2007. Prior to that, Mr. Juneau held various positions of increasing responsibility in research and development and business management with us including Managing Director of our European operations from January 2003 until December 2007. Mr. Juneau joined us as a chemical engineer in June 1982.
Susan Kelliher joined us in March of 2012, as Senior Vice President, Human Resources. Ms. Kelliher has over twenty years of human resources experience, having most recently served at Hewlett Packard as Vice President, Human Resources—Global Sales and Enterprise Marketing from April 2010 to February 2012, and as Vice President, Human Resources—Imaging and Printing Group from September 2007 to April 2010. Prior to joining Hewlett Packard, she was the Vice President of Human Resources for Cymer, Inc., the world’s leading supplier of deep ultraviolet illumination sources. Prior to that, Ms. Kelliher served in various executive and managerial human resources positions at The Home Depot, Inc., Raytheon Company, YUM! Brands’ Pizza Hut division, beginning her career at Mobil Oil.
Karen G. Narwold joined us in September of 2010 and currently serves as Senior Vice President, General Counsel, Corporate and Government Affairs, Corporate Secretary. Ms. Narwold has over 25 years of legal, management and business experience with global industrial and chemical companies. After five years in private practice, she served as Vice President, General Counsel, Human Resources and Secretary of GrafTech International Ltd., a global graphite and carbon manufacturer and former subsidiary of Union Carbide. She then served as Vice President and Strategic Counsel of Barzel Industries, a North American steel processor and distributor. Ms. Narwold resigned from Barzel in November 2009, after Barzel reached an agreement to sell substantially all of its assets in a planned transaction that was consummated in a sale pursuant to Section 363 of the U.S. Bankruptcy Code. Prior to joining Albemarle, Ms. Narwold served as Special Counsel with Kelley Drye & Warren LLP and with Symmetry Advisors where she worked in the areas of strategic, financial and capital structure planning and restructuring for public and private companies.
27
Albemarle Corporation and Subsidiaries | ||
Scott A. Tozier was elected as our Senior Vice President and Chief Financial Officer effective January 2011. Mr. Tozier also served as our Chief Accounting Officer from January 2013 until February 2014. Mr. Tozier has over 25 years of diversified international financial management experience. Following four years of assurance services with the international firm Ernst & Young, LLP, Mr. Tozier joined Honeywell International, Inc., where his 16 year career spanned senior financial positions in the U.S., Australia and Europe. His roles of increasing responsibilities included management of financial planning, analysis and reporting, global credit and treasury services and Chief Financial Officer of Honeywell’s Transportation Systems, Turbo Technologies and Building Solutions divisions. Most recently, Mr. Tozier served as Vice President of Finance, Operations and Transformation of Honeywell International, Inc.
Donald J. LaBauve Jr. was elected Vice President, Corporate Controller effective February 2013, and Chief Accounting Officer effective February 2014, after having previously served as Vice President, Finance - Business Operations since April 2009. Mr. LaBauve served as Chief Financial Officer, Fine Chemistry from April 2007 until April 2009, and prior to that time held the role of Controller, Polymer Solutions from January 2006 through March 2007. Since joining the Company as Ethyl Corporation in April 1990, Mr. LaBauve has held various staff and leadership positions of increasing responsibility within the finance function, including an assignment to our European headquarters in Belgium in April 2000 where he held the regional finance leadership role from July 2002 through June 2005.
PART II
Item 5. | Market for the Registrant’s Common Equity, Related Stockholder Matters and Issuer Purchases of Equity Securities. |
Our common stock trades on the New York Stock Exchange (“NYSE”) under the symbol “ALB.” The following table sets forth on a per share basis the high and low sales prices for our common stock for the periods indicated as reported on the NYSE composite transactions reporting system and the dividends declared per share on our common stock.
Common Stock Price Range | Dividends Declared Per Share of Common Stock | ||||||||||
High | Low | ||||||||||
2014 | |||||||||||
First Quarter | $ | 67.31 | $ | 60.92 | $ | 0.275 | |||||
Second Quarter | $ | 72.69 | $ | 64.55 | $ | 0.275 | |||||
Third Quarter | $ | 76.28 | $ | 58.37 | $ | 0.275 | |||||
Fourth Quarter | $ | 63.38 | $ | 51.35 | $ | 0.275 | |||||
2015 | |||||||||||
First Quarter | $ | 62.23 | $ | 46.78 | $ | 0.29 | |||||
Second Quarter | $ | 64.99 | $ | 52.23 | $ | 0.29 | |||||
Third Quarter | $ | 55.83 | $ | 41.37 | $ | 0.29 | |||||
Fourth Quarter | $ | 57.99 | $ | 44.10 | $ | 0.29 | |||||
There were 112,219,351 shares of common stock held by 2,789 shareholders of record as of December 31, 2015. On February 26, 2016, we declared a dividend of $0.305 per share of common stock, payable April 1, 2016.
The information required by Item 201(d) of Regulation S-K is contained in our definitive Proxy Statement for our 2016 Annual Meeting of Shareholders to be filed with the SEC pursuant to Regulation 14A under the Exchange Act, or the Proxy Statement, and is incorporated herein by reference.
Stock Performance Graph
The graph below shows the cumulative total shareholder return assuming the investment of $100 in our common stock on December 31, 2010 and the reinvestment of all dividends thereafter. The information contained in the graph below is furnished and therefore not to be considered “filed” with the SEC, and is not incorporated by reference into any document that incorporates this Annual Report on Form 10-K by reference.
28
Albemarle Corporation and Subsidiaries | ||
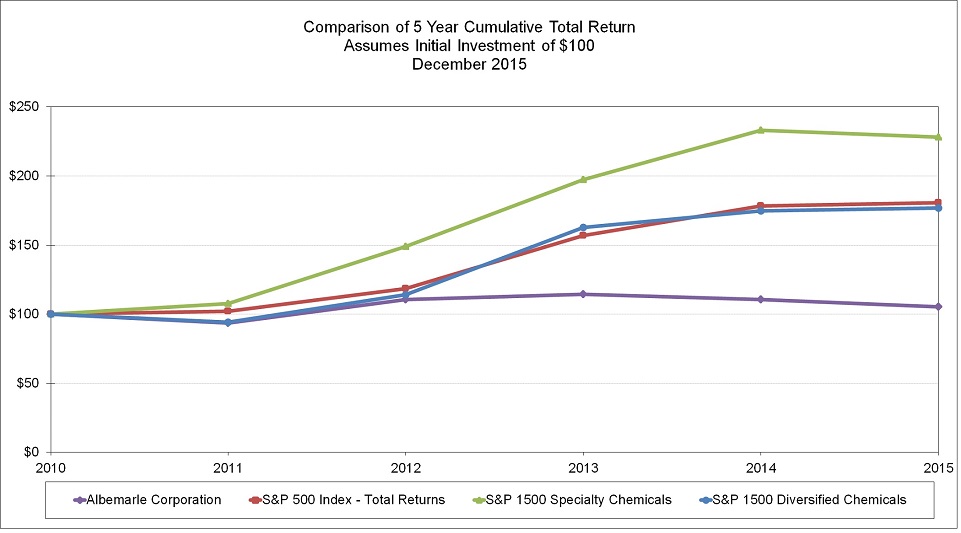
Item 6. | Selected Financial Data. |
The information for the five years ended December 31, 2015, is contained in the “Five-Year Summary” included in Part IV, Item 15, Exhibit 99.1 and incorporated herein by reference.
Item 7. | Management’s Discussion and Analysis of Financial Condition and Results of Operations. |
Forward-looking Statements
Some of the information presented in this Annual Report on Form 10-K, including the documents incorporated by reference, may constitute forward-looking statements within the meaning of the Private Securities Litigation Reform Act of 1995. Such forward-looking statements are based on our current expectations, which are in turn based on assumptions that we believe are reasonable based on our current knowledge of our business and operations. We have used words such as “anticipate,” “believe,” “could,” “estimate,” “expect,” “intend,” “may,” “should,” “will” and variations of such words and similar expressions to identify such forward-looking statements.
These forward-looking statements are not guarantees of future performance and involve certain risks, uncertainties and assumptions, which are difficult to predict and many of which are beyond our control. Therefore, there can be no assurance that our actual results will not differ materially from the results and expectations expressed or implied in the forward-looking statements. Factors that could cause actual results to differ materially include, without limitation:
• | changes in economic and business conditions; |
• | changes in financial and operating performance of our major customers and industries and markets served by us; |
• | the timing of orders received from customers; |
• | the gain or loss of significant customers; |
• | competition from other manufacturers; |
• | changes in the demand for our products or the end-user markets in which our products are sold; |
• | limitations or prohibitions on the manufacture and sale of our products; |
• | availability of raw materials; |
• | changes in the cost of raw materials and energy, and our ability to pass through such increases; |
• | changes in our markets in general; |
• | fluctuations in foreign currencies; |
29
Albemarle Corporation and Subsidiaries | ||
• | changes in laws and government regulation impacting our operations or our products; |
• | the occurrence of regulatory proceedings, claims or litigation; |
• | the occurrence of cyber-security breaches, terrorist attacks, industrial accidents, natural disasters or climate change; |
• | hazards associated with chemicals manufacturing; |
• | the inability to maintain current levels of product or premises liability insurance or the denial of such coverage; |
• | political unrest affecting the global economy, including adverse effects from terrorism or hostilities; |
• | political instability affecting our manufacturing operations or joint ventures; |
• | changes in accounting standards; |
• | the inability to achieve results from our global manufacturing cost reduction initiatives as well as our ongoing continuous improvement and rationalization programs; |
• | changes in the jurisdictional mix of our earnings and changes in tax laws and rates; |
• | changes in monetary policies, inflation or interest rates that may impact our ability to raise capital or increase our cost of funds, impact the performance of our pension fund investments and increase our pension expense and funding obligations; |
• | volatility and uncertainties in the debt and equity markets; |
• | technology or intellectual property infringement, including cyber-security breaches, and other innovation risks; |
• | decisions we may make in the future; |
• | the ability to successfully execute, operate and integrate acquisitions and divestitures, including the integration of Rockwood’s operations, and realize anticipated synergies and other benefits; and |
• | the other factors detailed from time to time in the reports we file with the SEC. |
We assume no obligation to provide revisions to any forward-looking statements should circumstances change, except as otherwise required by securities and other applicable laws. The following discussion should be read together with our consolidated financial statements and related notes included in this Annual Report on Form 10-K.
The following is a discussion and analysis of results of operations for the years ended December 31, 2015, 2014 and 2013. A discussion of consolidated financial condition and sources of additional capital is included under a separate heading “Financial Condition and Liquidity” on page 48.
Overview
We are a leading global developer, manufacturer and marketer of highly-engineered specialty chemicals that meets customer needs across a diverse range of end markets. The end markets we serve include petroleum refining, consumer electronics, energy storage, construction, automotive, steel and aerospace, lubricants, pharmaceuticals, crop protection, household appliances, heating, ventilation, aluminum finishing, food safety and custom chemistry services. We believe that our commercial and geographic diversity, technical expertise, innovative capability, flexible, low-cost global manufacturing base, experienced management team and strategic focus on our core base technologies will enable us to maintain leading market positions in those areas of the specialty chemicals industry in which we operate.
Secular trends favorably impacting demand within the end markets that we serve combined with our diverse product portfolio, broad geographic presence and customer-focused solutions will continue to be key drivers to our future earnings growth. We continue to build upon our existing green solutions portfolio and our ongoing mission to provide innovative, yet commercially viable, clean energy products and services to the marketplace. We believe our disciplined cost reduction efforts, ongoing productivity improvements and our recently completed acquisition of Rockwood position us well to take advantage of strengthening economic conditions as they occur while softening the negative impact of the current challenging global economic environment.
2015 Highlights
• | In the first quarter, we increased our quarterly dividend for the 21st consecutive year, to $0.29 per share. |
• | On January 12, 2015, we completed the acquisition of Rockwood for a purchase price of approximately $5.7 billion. |
• | In connection with the acquisition of Rockwood, we realigned our organizational structure under three reportable segments: Performance Chemicals, Refining Solutions and Chemetall Surface Treatment. |
• | On February 19, 2015, our Chemetall Surface Treatment segment completed the acquisition of all remaining shares of its Shanghai Chemetall joint venture for a purchase price of $57.6 million. |
30
Albemarle Corporation and Subsidiaries | ||
• | We repaid our $325.0 million senior notes which matured on February 1, 2015. |
• | We announced a new leading-edge catalyst that will further strengthen our position in the hydrocracking pre-treat (“HC-PT”) market. Pilot plant testing of the new HC-PT catalyst is complete and commercial sales have begun. |
• | On May 1, 2015, our Chemetall Surface Treatment segment completed the acquisition of the aluminum finishing business of Chemal GmbH & Co. KG (“Chemal GmbH”), based in Hamm, Germany. Cash paid in connection with this acquisition was approximately $2.2 million. |
• | We announced the start of commissioning activities associated with our new, state-of-the-art lithium carbonate production plant located at our La Negra site in northern Chile. We believe the 20,000 MT plant will help enable the Company to meet the accelerating demand for lithium. |
• | We announced our intent to transfer the production of n-Butyllithium from our facility in New Johnsonville, Tennessee, to existing plants in Germany and Taiwan. The transfer process is expected to be completed in the first quarter of 2016. The New Johnsonville facility will continue to manufacture some specialty lithium products and will support blending operations for customers in North America. |
• | We announced that we will relocate our corporate headquarters and Performance Chemicals business from Baton Rouge, LA to Charlotte, NC. In addition, we will relocate Baton Rouge employees in our Refining Solutions business to our existing Clear Lake, TX office. Approximately 120 employees will be relocated to Charlotte or Clear Lake, with the majority of the relocations expected to take place in June 2016. |
• | On October 15, 2015, we redeemed all of the outstanding 4.625% senior notes issued by our wholly-owned subsidiary, Rockwood Specialties Group, Inc., at a redemption price of 103.469% of the principal amount of $1.25 billion, plus accrued and unpaid interest to the redemption date. The 4.625% senior notes were repaid with proceeds from a new term loan credit facility, comprised of a 364-day term loan facility in an aggregate principal amount of $300 million and a five-year term loan facility in an aggregate principal amount of $950 million. |
• | We announced our intention to add up to 50,000 MT of mineral conversion production capacity to significantly boost battery grade lithium production to meet the growing needs of the energy storage market, in particular for customers in the global transportation industry utilizing lithium ion battery technology. Albemarle has commenced feasibility studies and is evaluating potential sites. The plant is expected to be operational in 2020. |
• | We announced the first commercial application of our AlkyStarTM catalyst technology in Shandong, China. Our zeolite-based AlkyStarTM catalyst successfully produced high-quality alkylate after start-up of the world’s first solid acid catalyst alkylation unit. |
• | On November 5, 2015, we signed a definitive agreement to sell our Tribotecc metal sulfides business to Treibacher Industrie AG. On January 4, 2016, the Company closed the sale of this business. Included in the transaction were sites in Vienna and Arnoldstein, Austria, and Tribotecc’s proprietary sulfide syntheses process. We received net proceeds of approximately $137 million in the first quarter of 2016 from the sale of this business. |
• | On December 16, 2015, the Company signed a definitive agreement to sell its minerals-based flame retardants and specialty chemicals businesses to Huber Engineered Materials, a division of J.M. Huber Corporation. The transaction includes Albemarle’s Martinswerk GmbH subsidiary and manufacturing facility located in Bergheim, Germany, and Albemarle’s 50% ownership interest in Magnifin Magnesiaprodukte GmbH, a joint-venture with Radex Heraklith Industriebeteiligung AG at Breitenau, Austria. On February 1, 2016, the Company closed the sale of these businesses and received net proceeds of approximately $187 million. |
• | On December 23, 2015, we paid approximately $4.8 million in connection with the acquisition of the remaining noncontrolling interests’ share of Nanjing Chemetall Surface Technologies Co., Ltd. |
• | We achieved earnings from continuing operations of $360.1 million during 2015 as compared to $230.4 million for 2014. Our operating results contributed $360.7 million to cash flows from operations in 2015. Earnings from continuing operations for 2015 includes pension and other postretirement benefit (“OPEB”) actuarial gains of $27.8 million after income taxes, compared to pension and OPEB actuarial losses of $83.3 million after income taxes in 2014. |
Outlook
On October 26, 2015, we announced that effective January 1, 2016, Performance Chemicals will be split into two separate reportable segments: (1) Bromine Specialties, and (2) Lithium and Advanced Materials, which will include Performance Catalyst Solutions and Curatives. Each unit will have a dedicated team of sales, product management, research & development, process technology, manufacturing, sourcing, sales and operations planning and customer service groups and will have full accountability for improving execution through greater asset and market focus, agility and responsiveness. We expect this change to provide further clarity into the performance of each business.
31
Albemarle Corporation and Subsidiaries | ||
The current global business environment presents a diverse set of opportunities and challenges in the markets we serve, from slow and uneven global growth, currency exchange volatility, significantly lower crude oil prices, a dynamic pricing environment in bromine derivatives and an ever-changing landscape in electronics, to the continuous need for cutting edge catalysts and technology by our refinery customers, diverse energy storage needs including exciting opportunities in electric vehicles, and increasingly stringent environmental standards. Amidst these dynamics, we believe our business fundamentals are sound and that we are strategically well-positioned as we remain focused on increasing sales volumes, significant deleveraging following our acquisition of Rockwood, optimizing and improving the value of our portfolio through pricing and product development, managing costs and delivering value to our customers. We believe that our businesses remain positioned to capitalize on new business opportunities and long-term trends driving growth within our end markets and to respond quickly to improved economic conditions. Additionally, we are on track to exceed our original expectations regarding synergies from the acquisition of the Rockwood businesses earlier in the year.
Through 2015, our operations were managed and reported under three reportable segments: Performance Chemicals, Refining Solutions and Chemetall Surface Treatment. Financial results and discussion about our segments included in this Annual Report on Form 10-K are organized according to these categories except where noted.
Performance Chemicals: We expect 2016 to be a challenging year for Bromine sales and profitability growth due to an expected decline in demand of clear brine fluids used in offshore drilling projects as well as the expiration of a methyl bromide supply agreement at the end of 2015 that was not replaced. Through working capital discipline and strong controls on costs, we expect to generate healthy cash flows in the Bromine business despite these challenges.
For Lithium and Advanced Materials, we expect continued strong growth in 2016 led by demand in battery grade applications and continued price improvement in Lithium. Performance Catalyst Solutions experienced strong growth in 2015 due market demand in general and due to certain competitor outages, and we expect to maintain a similar level of profitability in 2016.
We believe that the combination of solid, long-term business fundamentals, with our strong cost position, product innovations and effective management of raw material inventory inflation will enable us to manage our business through end market challenges and to capitalize on opportunities that are expected with favorable market trends in select end markets and with a more evenly sustained economic recovery.
On a long-term basis for Bromine, we continue to believe that improving global standards of living, widespread digitization, increasing demand for data management capacity and the potential for increasingly stringent fire safety regulations in developing markets are likely to drive continued demand for fire safety products. Demand for drilling completion fluids in 2015 held up better than expected, but is likely to still be impacted negatively in the short term as a result of sustained lower oil prices impacting offshore drilling projects around the world. Longer term, absent an increase in regulatory pressure on offshore drilling, we would expect this business to resume a solid growth trajectory once oil prices recover from recent levels as we expect that deep water drilling will continue to increase around the world. We are focused on profitably growing our globally competitive bromine and derivatives production network to serve all major bromine consuming products and markets. We believe the global supply/demand gap will tighten as demand for existing and possible new uses of bromine expands over time.
On a long-term basis for Lithium and Advanced Materials, we believe that demand for lithium will continue to grow as new applications for lithium power continue to be developed and the use of Plug-in Hybrid Electric Vehicles and Battery Electric Vehicles escalates. In addition, we expect growth in Performance Catalyst Solutions to come from growing global demand for plastics driven by rising standards of living and infrastructure spending, particularly in Asia and the Middle East.
Refining Solutions: 2015 net sales were down 14% and Adjusted EBITDA was down 23% due largely to declines in clean fuels technology sales volumes slightly offset by solid growth in heavy oil upgrading volumes. In 2016, despite some near-term concerns about how the price of oil will impact the crude slate used by refineries and the resulting demand for catalysts, we expect to see continued, sustained high level performance from heavy oil upgrading as well as improvement in clean fuels technology results due to increased change outs by refiners and an improved product mix, although certain national oil companies, among others, are expected to look for ways to delay catalysts change outs due to the current oil economic environment.
On a longer term basis, we believe increased global demand for transportation fuels and implementation of more stringent fuel quality requirements will drive growth in our Refining Solutions business. Delivering superior end-use performance continues to be the most effective way to create sustainable value in the refinery catalysts industry, and we believe our technologies continue to provide significant performance and financial benefits to refiners challenged to meet tighter regulations around the world, those managing new contaminants present in North America tight oil, and those in the Middle
32
Albemarle Corporation and Subsidiaries | ||
East and Asia seeking to use heavier feedstock while pushing for higher propylene yields. While lower oil prices may impact the overall crude slate for a period of time, longer term, we believe that the global crude supply will get heavier and more sour, trends that bode well for catalysts demand. Given this and based on our technology, current production capacities and expected growth in end market demand, we believe that we remain well-positioned for the future.
Chemetall Surface Treatment: Demand for surface treatment products generally follows the activity levels of metal processing manufacturers, including the automotive, steel and aerospace industries, as well as products sold to general industrial markets, including heavy equipment, household appliances, manufacturing, heating, ventilation and aluminum finishing. We believe that our strong customer relationships, service, and our geographic and end market diversity coupled with the growth coming from recently completed acquisitions, will lead to continued growth for 2016.
On a longer term basis, we expect to continue to generate growth from our focus on new product development, improving process technologies, expanding our customer base, and broadening our technology capabilities in existing and new markets through internal research and development and bolt-on acquisitions.
All Other: In 2015, we announced our intention to pursue strategic alternatives for several businesses: minerals-based flame retardants and specialty chemicals, fine chemistry services and metal sulfides, which together comprise the “All Other” category. We closed on the sale of the metal sulfides business on January 4, 2016 and we closed on the sale of the minerals-based flame retardants and specialty chemicals business on February 1, 2016.
Corporate: In the first quarter of 2016, we increased our quarterly dividend rate to $0.305 per share. We continue to focus on cash generation, working capital management and process efficiencies. We expect our global effective tax rate for 2016 to be approximately 23.0%; however, our rate will vary based on the locales in which income is actually earned and remains subject to potential volatility from changing legislation in the U.S. and other tax jurisdictions.
Actuarial gains and losses related to our defined benefit pension and OPEB plan obligations are reflected in Corporate as a component of non-operating pension and OPEB plan costs under mark-to-market accounting. Results for the year ended December 31, 2015 include an actuarial gain of $38.9 million ($27.8 million after income taxes), as compared to a loss of $130.8 million ($83.3 million after income taxes) for the year ended December 31, 2014.
We remain committed to evaluating the merits of any opportunities that may arise for acquisitions or other business development activities that will complement our business footprint. Additional information regarding our products, markets and financial performance is provided at our web site, www.albemarle.com. Our web site is not a part of this document nor is it incorporated herein by reference.
33
Albemarle Corporation and Subsidiaries | ||
Results of Operations
The following data and discussion provides an analysis of certain significant factors affecting our results of operations during the periods included in the accompanying consolidated statements of income.
Selected Financial Data | Year Ended December 31, | Percentage Change | |||||||||||||||
2015 | 2014 | 2013 | 2015 vs. 2014 | 2014 vs. 2013 | |||||||||||||
(In thousands, except percentages and per share amounts) | |||||||||||||||||
NET SALES | $ | 3,651,335 | $ | 2,445,548 | $ | 2,394,270 | 49 | % | 2 | % | |||||||
Cost of goods sold | 2,454,463 | 1,674,700 | 1,543,799 | 47 | % | 8 | % | ||||||||||
GROSS PROFIT | 1,196,872 | 770,848 | 850,471 | 55 | % | (9 | )% | ||||||||||
GROSS PROFIT MARGIN | 32.8 | % | 31.5 | % | 35.5 | % | |||||||||||
Selling, general and administrative expenses | 512,274 | 355,135 | 158,189 | 44 | % | 125 | % | ||||||||||
Research and development expenses | 102,871 | 88,310 | 82,246 | 16 | % | 7 | % | ||||||||||
Restructuring and other, net | (6,804 | ) | 25,947 | 33,361 | (126 | )% | (22 | )% | |||||||||
Acquisition and integration related costs | 146,096 | 30,158 | — | 384 | % | * | |||||||||||
OPERATING PROFIT | 442,435 | 271,298 | 576,675 | 63 | % | (53 | )% | ||||||||||
OPERATING PROFIT MARGIN | 12.1 | % | 11.1 | % | 24.1 | % | |||||||||||
Interest and financing expenses | (132,722 | ) | (41,358 | ) | (31,559 | ) | 221 | % | 31 | % | |||||||
Other income (expenses), net | 48,474 | (16,761 | ) | (6,674 | ) | * | 151 | % | |||||||||
INCOME FROM CONTINUING OPERATIONS BEFORE INCOME TAXES AND EQUITY IN NET INCOME OF UNCONSOLIDATED INVESTMENTS | 358,187 | 213,179 | 538,442 | 68 | % | (60 | )% | ||||||||||
Income tax expense | 29,122 | 18,484 | 134,445 | 58 | % | (86 | )% | ||||||||||
Effective tax rate | 8.1 | % | 8.7 | % | 25.0 | % | |||||||||||
INCOME FROM CONTINUING OPERATIONS BEFORE EQUITY IN NET INCOME OF UNCONSOLIDATED INVESTMENTS | 329,065 | 194,695 | 403,997 | 69 | % | (52 | )% | ||||||||||
Equity in net income of unconsolidated investments (net of tax) | 30,999 | 35,742 | 31,729 | (13 | )% | 13 | % | ||||||||||
NET INCOME FROM CONTINUING OPERATIONS | 360,064 | 230,437 | 435,726 | 56 | % | (47 | )% | ||||||||||
(Loss) income from discontinued operations (net of tax) | — | (69,531 | ) | 4,108 | (100 | )% | * | ||||||||||
NET INCOME | 360,064 | 160,906 | 439,834 | 124 | % | (63 | )% | ||||||||||
Net income attributable to noncontrolling interests | (25,158 | ) | (27,590 | ) | (26,663 | ) | (9 | )% | 3 | % | |||||||
NET INCOME ATTRIBUTABLE TO ALBEMARLE CORPORATION | $ | 334,906 | $ | 133,316 | $ | 413,171 | 151 | % | (68 | )% | |||||||
NET INCOME FROM CONTINUING OPERATIONS AS A PERCENTAGE OF NET SALES | 9.9 | % | 9.4 | % | 18.2 | % | |||||||||||
Basic earnings (loss) per share: | |||||||||||||||||
Continuing operations | $ | 3.01 | $ | 2.57 | $ | 4.88 | 17 | % | (47 | )% | |||||||
Discontinued operations | — | (0.88 | ) | 0.05 | (100 | )% | * | ||||||||||
$ | 3.01 | $ | 1.69 | $ | 4.93 | 78 | % | (66 | )% | ||||||||
Diluted earnings (loss) per share: | |||||||||||||||||
Continuing operations | $ | 3.00 | $ | 2.57 | $ | 4.85 | 17 | % | (47 | )% | |||||||
Discontinued operations | — | (0.88 | ) | 0.05 | (100 | )% | * | ||||||||||
$ | 3.00 | $ | 1.69 | $ | 4.90 | 78 | % | (66 | )% | ||||||||
* Percentage calculation is not meaningful.
34
Albemarle Corporation and Subsidiaries | ||
Comparison of 2015 to 2014
Net Sales
For the year ended December 31, 2015, we recorded net sales of $3.65 billion, a 49% increase compared to net sales of $2.45 billion for the corresponding period of 2014. Approximately $1.4 billion of the increase was attributable to the impact of the Rockwood acquisition. Excluding the acquisition of Rockwood, net sales decreased by $210.1 million primarily due to $106.5 million of unfavorable sales volumes, $87.7 million of unfavorable impacts from currency translation and $15.8 million of unfavorable price impacts due to market conditions and portfolio mix. The unfavorable sales volumes were due to lower Clean Fuels Technologies, Fine Chemistry Services, and Bromine volumes partially offset by increased Heavy Oil Upgrading and PCS sales volumes. The unfavorable price impacts were primarily due to lower Refining Solutions, Fine Chemistry Services, and PCS prices partly offset by favorable price impacts for Bromine.
Gross Profit
For the year ended December 31, 2015, our gross profit increased $426.0 million, or 55%, from the corresponding 2014 period. Gross profit for 2015 includes $1.4 million of pension and OPEB benefits (including mark-to-market actuarial gains of $2.0 million) allocated to cost of good sold, as compared to $36.5 million of pension and OPEB costs (including mark-to-market actuarial losses of $36.4 million) allocated to cost of goods sold in 2014. Excluding the $37.9 million increase in gross profit related to pension and OPEB plans, gross profit increased by $388.1 million due to $470.9 million of gross profit attributable to the performance of the acquired Rockwood business, which includes a $75.9 million charge for the utilization of the inventory markup recorded as part of purchase accounting for the acquisition, partially offset by an $82.8 million decrease in gross profit due primarily to unfavorable impacts from currency translation, unfavorable price impacts due to market conditions and portfolio mix and lower overall sales volumes. Overall, these factors contributed to a higher gross profit margin for the year ended December 31, 2015 of 32.8%, up from 31.5% in the corresponding period of 2014. Excluding the impact of pension and OPEB mark-to-market actuarial losses and gains, our gross profit margin was 32.7% in 2015 and 33.0% in 2014.
The mark-to-market actuarial loss in 2014 is primarily attributable to: (a) a decrease in the weighted-average discount rate for our pension plans to 4.03% from 5.00% to reflect market conditions as of the December 31, 2014 measurement date, and (b) changes in mortality assumptions, and to a lesser extent, other demographic assumptions related to our pension plans. The mark-to-market actuarial loss in 2014 was partially offset by a higher return on pension plan assets in 2014 than was expected, as a result of overall market and investment portfolio performance. The weighted-average actual return on our U.S. pension plan assets was 8.87% versus an expected return of 6.91%.
Selling, General and Administrative Expenses
For the year ended December 31, 2015, our selling, general and administrative (“SG&A”) expenses increased $157.1 million, or 44%, compared to the year ended December 31, 2014. SG&A expenses for 2015 includes approximately $37.4 million of pension and OPEB benefits (including mark-to-market actuarial gains of $36.9 million) allocated to SG&A, as compared to $97.1 million of pension and OPEB costs (including mark-to-market actuarial losses of $94.5 million) allocated to SG&A in 2014. Excluding the $134.5 million decrease in SG&A related to pension and OPEB plans, SG&A increased by $291.6 million, or 13.0%, due to the acquisition of Rockwood, net of realized synergies. As a percentage of net sales, SG&A expenses were 14.0% in 2015, compared to 14.5% in 2014. Excluding the impact of pension and OPEB mark-to-market actuarial losses and gains, SG&A expenses as a percentage of net sales were 15.0% in 2015 and 10.7% in 2014.
The mark-to-market actuarial gain in 2015 is primarily attributable to: (a) an increase in the weighted-average discount rate to 4.67% from 4.18% for our U.S. pension plans and to 2.89% from 2.34% for our foreign pension plans to reflect market conditions as of the December 31, 2015 measurement date, and (b) changes in mortality assumptions. The mark-to-market actuarial gain in 2015 was partially offset by a lower return on pension plan assets in 2015 than was expected, as a result of overall market and investment portfolio performance. The weighted-average actual return on our U.S. and foreign pension plan assets was (2.74)% versus an expected return of 6.85%. The mark-to-market actuarial loss in 2014 resulted from the factors as discussed in Gross Profit above.
Research and Development Expenses
For the year ended December 31, 2015, our R&D expenses increased $14.6 million, or 16%, from the year ended December 31, 2014, primarily due to the acquisition of Rockwood. As a percentage of net sales, R&D expenses were 2.8% in 2015, compared to 3.6% in 2014.
35
Albemarle Corporation and Subsidiaries | ||
Restructuring and Other, Net
Included in restructuring and other, net, for the year ended December 31, 2015 is a gain of $6.8 million ($5.4 million after income taxes) recognized upon the sale of land in Avonmouth, U.K., which was utilized by the phosphorus flame retardants business we exited in 2012. Restructuring and other, net, of $25.9 million for the year ended December 31, 2014 includes the following items:
(a) | Estimated costs of approximately $20.5 million ($13.6 million after income taxes) in connection with action we initiated to reduce the high cost supply capacity of certain aluminum alkyl products, primarily through the termination of a third party manufacturing contract. |
(b) | An impairment charge of $3.0 million ($1.9 million after income taxes) for certain capital project costs also related to aluminum alkyls capacity which we do not expect to recover. |
(c) | Other net charges of $2.4 million ($1.4 million after income taxes), mainly in connection with a write-off of certain multi-product facility project costs that we do not expect to recover in future periods. |
Acquisition and Integration Related Costs
The year ended December 31, 2015 includes $137.7 million of acquisition and integration related costs directly related to the acquisition of Rockwood (mainly consisting of professional services and advisory fees, costs to achieve synergies, relocation costs, and other integration costs) and $8.4 million of costs in connection with other significant projects. The year ended December 31, 2014 includes $23.6 million of acquisition and integration related costs directly related to the acquisition of Rockwood and $6.6 million of costs in connection with other significant projects.
Interest and Financing Expenses
Interest and financing expenses for the year ended December 31, 2015 increased $91.4 million to $132.7 million from the corresponding 2014 period, due mainly to higher borrowing levels in connection with the acquisition of Rockwood. Included in 2015 is a charge of approximately $5.4 million related to the early extinguishment of the 4.625% senior notes we assumed from Rockwood.
Other Income (Expenses), Net
Other income (expenses), net, for the year ended December 31, 2015 was $48.5 million versus ($16.8) million for the corresponding 2014 period. The change was due mainly to $54.7 million of favorable foreign currency translation gains and a $12.3 million reduction in amortization of bridge facility fees and other financing fees related to the acquisition of Rockwood. The foreign currency gains are primarily related to cash denominated in U.S. Dollars held by foreign subsidiaries where the European Union Euro serves as the functional currency.
Income Tax Expense
The effective income tax rate for 2015 was 8.1% compared to 8.7% for 2014. Our effective income tax rate differs from the U.S. federal statutory income tax rates in the comparative periods mainly due to the impact of earnings from outside the U.S, including net impacts on the release of the liability from earnings that were not indefinitely invested and were repatriated from legacy Rockwood. Our effective tax rate for 2015 was affected by discrete net tax benefit items of $41.6 million related mainly to the release of prior year uncertain tax positions associated with lapses in statutes of limitations and audit closures, items associated with U.S. provision to return adjustments, and an OPEB plan termination gain recorded in the period. Our effective income tax rate in 2014 was affected by tax benefits of $74.2 million related to restructuring charges, a pension plan actuarial loss and the release of reserves related principally to the expiration of the U.S. federal statute of limitations. See Note 20, “Income Taxes” to our consolidated financial statements included in Part II, Item 8 of this report for a reconciliation of the U.S. federal statutory income tax rate to our effective rate for 2015 and 2014.
Equity in Net Income of Unconsolidated Investments
Equity in net income of unconsolidated investments was $31.0 million for the year ended December 31, 2015 compared to $35.7 million in the same period last year. The current year equity in net income of unconsolidated investments includes a $27.1 million charge for utilization of fair value adjustments to inventories as well as a $2.0 million impairment charge related to our unconsolidated investment in Fábrica Carioca de Catalisadores SA. Excluding theses charges, equity in net income of unconsolidated investments increased by $24.4 million primarily due to equity income derived from unconsolidated investments we acquired from Rockwood (Performance Chemicals and Chemetall Surface Treatment segments), partially offset
36
Albemarle Corporation and Subsidiaries | ||
by lower equity income reported by our Refining Solutions segment joint venture Nippon Ketjen Company Limited primarily due to lower sales volumes.
Loss from Discontinued Operations
Loss from discontinued operations, after income taxes, of $69.5 million for the year ended December 31, 2014 includes a pre-tax charge of $85.5 million ($65.7 million after income taxes) related to the sale of our antioxidant, ibuprofen and propofol businesses and assets to SI Group, Inc., which closed on September 1, 2014. This charge represented the difference between the carrying value of the related assets and their fair value as determined by the sales price less estimated costs to sell, and was primarily attributable to the write-off of goodwill, intangibles and long-lived assets, net of cumulative foreign currency translation gains of $17.8 million.
Net Income Attributable to Noncontrolling Interests
For the year ended December 31, 2015, net income attributable to noncontrolling interests was $25.2 million compared to $27.6 million in the same period last year. This decrease of $2.4 million was due primarily to changes in consolidated income related to our Jordanian joint venture.
Net Income Attributable to Albemarle Corporation
Net income attributable to Albemarle Corporation increased to $334.9 million for the year ended December 31, 2015, from $133.3 million for the corresponding period of 2014. The total estimated impact of the Rockwood acquisition is income of approximately $3.8 million before income taxes, including earnings of the acquiree (as included in Note 2, “Acquisitions” to our consolidated financial statements included in Part II, Item 8 of this report), acquisition and integration related costs, interest expense associated with additional borrowings, and other currency transaction gains related to the execution of the closing. Excluding the impact of the Rockwood acquisition, net income increased approximately $197.8 million primarily due to a $144.4 million decrease in pension and OPEB charges versus the prior year, the loss from discontinued operations and restructuring and other charges in the prior year of $69.5 million and $25.9 million, respectively, plus the gain on sale of land of $6.8 million in restructuring and other for the 2015 period, partly offset by unfavorable impacts in operating profit of approximately $48.8 million, including the unfavorable impacts of currency translation.
Other Comprehensive Loss, Net of Tax
Total other comprehensive loss, after income taxes, was $360.8 million in 2015 compared to $178.7 million in 2014. The majority of these amounts are the result of translating our foreign subsidiary financial statements from their local currencies to U.S. Dollars. In 2015, other comprehensive loss from foreign currency translation adjustments was $413.0 million, mainly as a result of unfavorable movements in the European Union Euro of approximately $279 million, the British Pound Sterling of approximately $49 million, the Brazilian Real of approximately $30 million, the Turkish Lira of approximately $10 million, the Korean Won of approximately $7 million, the Chinese Renminbi of approximately $8 million, the South African Rand of approximately $8 million and a net unfavorable variance in various other currencies totaling approximately $23 million (each approximately $5 million or less). Also included in total other comprehensive loss for 2015 is income of $50.9 million in connection with the revaluation of our €700.0 million senior notes which were designated as a hedge of our net investment in foreign operations. In 2014, other comprehensive loss from foreign currency translation adjustments was $168.8 million, mainly as a result of unfavorable movements in the European Union Euro of approximately $124 million, the Chinese Renminbi of approximately $18 million and the Brazilian Real of approximately $13 million. Also included in total other comprehensive loss for 2014 is a realized loss of $21.0 million related to an interest rate swap which settled in the fourth quarter of 2014, and income of $11.4 million in connection with the revaluation of our €700.0 million senior notes and settlement of related foreign currency forward contracts, both of which were designated as a hedge of our net investment in foreign operations.
Segment Information Overview. Summarized financial information concerning our reportable segments is shown in the following tables. Results for 2014 have been recast to reflect the change in segments previously noted and a change in our measure of segment profit or loss to adjusted EBITDA as discussed below. During the first quarter we announced our intention to pursue strategic alternatives for several businesses - mineral flame retardants, fine chemistry services and metal sulfides, which together comprise the “All Other” category. The Corporate category is not considered to be a segment and includes corporate-related items not allocated to the reportable segments. Pension and OPEB service cost (which represents the benefits earned by active employees during the period) and amortization of prior service cost or benefit are allocated to the segments, All Other, and Corporate, whereas the remaining components of pension and OPEB benefits cost or credit (“Non-operating
37
Albemarle Corporation and Subsidiaries | ||
pension and OPEB items”) are included in Corporate. Segment data includes intersegment transfers of raw materials at cost and allocations for certain corporate costs.
Beginning in 2015, the Company uses earnings before interest, taxes, depreciation and amortization, as adjusted for certain non-recurring or unusual items such as restructuring charges, facility divestiture charges, non-operating pension and OPEB items and other significant non-recurring items (“adjusted EBITDA”), on a segment basis to assess the ongoing performance of the Company’s business segments. Adjusted EBITDA is a financial measure that is not required by, or presented in accordance with, U.S. GAAP. The Company has reported adjusted EBITDA because management believes it provides transparency to investors and enables period-to-period comparability of financial performance. Adjusted EBITDA should not be considered as an alternative to Net income (loss) attributable to Albemarle Corporation, the most directly comparable financial measure calculated and reported in accordance with U.S. GAAP.
Year Ended December 31, | Percentage Change | ||||||||||||||||
2015 | % | 2014 | % | 2015 vs. 2014 | |||||||||||||
(In thousands, except percentages) | |||||||||||||||||
Net sales: | |||||||||||||||||
Performance Chemicals | $ | 1,610,319 | 44.1 | % | $ | 1,121,645 | 45.9 | % | 44 | % | |||||||
Refining Solutions | 729,261 | 20.0 | % | 852,139 | 34.8 | % | (14 | )% | |||||||||
Chemetall Surface Treatment | 824,906 | 22.6 | % | — | — | % | * | ||||||||||
All Other | 471,434 | 12.9 | % | 471,764 | 19.3 | % | — | % | |||||||||
Corporate | 15,415 | 0.4 | % | — | — | % | * | ||||||||||
Total net sales | $ | 3,651,335 | 100.0 | % | $ | 2,445,548 | 100.0 | % | 49 | % | |||||||
Adjusted EBITDA: | |||||||||||||||||
Performance Chemicals | $ | 535,520 | 55.8 | % | $ | 306,572 | 54.5 | % | 75 | % | |||||||
Refining Solutions | 197,595 | 20.6 | % | 256,485 | 45.6 | % | (23 | )% | |||||||||
Chemetall Surface Treatment | 202,028 | 21.1 | % | — | — | % | * | ||||||||||
All Other | 53,993 | 5.6 | % | 73,973 | 13.2 | % | (27 | )% | |||||||||
Corporate | (29,814 | ) | (3.1 | )% | (74,875 | ) | (13.3 | )% | (60 | )% | |||||||
Total adjusted EBITDA | $ | 959,322 | 100.0 | % | $ | 562,155 | 100.0 | % | 71 | % | |||||||
* Percentage calculation is not meaningful.
38
Albemarle Corporation and Subsidiaries | ||
See below for a reconciliation of adjusted EBITDA, the non-GAAP financial measure, to Net income (loss) attributable to Albemarle Corporation, the most directly comparable financial measure calculated and reported in accordance with U.S. GAAP, (in thousands):
Performance Chemicals | Refining Solutions | Chemetall Surface Treatment | Reportable Segments Total | All Other | Corporate | Consolidated Total | |||||||||||||||||||||
2015 | |||||||||||||||||||||||||||
Adjusted EBITDA | $ | 535,520 | $ | 197,595 | $ | 202,028 | $ | 935,143 | $ | 53,993 | $ | (29,814 | ) | $ | 959,322 | ||||||||||||
Depreciation and amortization | (120,248 | ) | (34,039 | ) | (78,903 | ) | (233,190 | ) | (18,183 | ) | (8,703 | ) | (260,076 | ) | |||||||||||||
Utilization of inventory markup(a) | (79,977 | ) | — | (20,030 | ) | (100,007 | ) | (3,029 | ) | — | (103,036 | ) | |||||||||||||||
Restructuring and other, net | — | — | — | — | — | 6,804 | 6,804 | ||||||||||||||||||||
Acquisition and integration related costs(b) | — | — | — | — | — | (146,096 | ) | (146,096 | ) | ||||||||||||||||||
Interest and financing expenses | — | — | — | — | — | (132,722 | ) | (132,722 | ) | ||||||||||||||||||
Income tax expense | — | — | — | — | — | (29,122 | ) | (29,122 | ) | ||||||||||||||||||
Non-operating pension and OPEB items | — | — | — | — | — | 46,244 | 46,244 | ||||||||||||||||||||
Other(c) | — | (1,971 | ) | — | (1,971 | ) | — | (4,441 | ) | (6,412 | ) | ||||||||||||||||
Net income (loss) attributable to Albemarle Corporation | $ | 335,295 | $ | 161,585 | $ | 103,095 | $ | 599,975 | $ | 32,781 | $ | (297,850 | ) | $ | 334,906 | ||||||||||||
2014 | |||||||||||||||||||||||||||
Adjusted EBITDA | $ | 306,572 | $ | 256,485 | $ | — | $ | 563,057 | $ | 73,973 | $ | (74,875 | ) | $ | 562,155 | ||||||||||||
Depreciation and amortization(d) | (51,707 | ) | (32,670 | ) | — | (84,377 | ) | (13,478 | ) | (2,552 | ) | (100,407 | ) | ||||||||||||||
Restructuring and other, net | — | — | — | — | — | (25,947 | ) | (25,947 | ) | ||||||||||||||||||
Acquisition and integration related costs(b) | — | — | — | — | — | (30,158 | ) | (30,158 | ) | ||||||||||||||||||
Interest and financing expenses | — | — | — | — | — | (41,358 | ) | (41,358 | ) | ||||||||||||||||||
Income tax expense | — | — | — | — | — | (18,484 | ) | (18,484 | ) | ||||||||||||||||||
Loss from discontinued operations (net of tax) | — | — | — | — | — | (69,531 | ) | (69,531 | ) | ||||||||||||||||||
Non-operating pension and OPEB items | — | — | — | — | — | (125,462 | ) | (125,462 | ) | ||||||||||||||||||
Other(e) | — | — | — | — | — | (17,492 | ) | (17,492 | ) | ||||||||||||||||||
Net income (loss) attributable to Albemarle Corporation | $ | 254,865 | $ | 223,815 | $ | — | $ | 478,680 | $ | 60,495 | $ | (405,859 | ) | $ | 133,316 | ||||||||||||
(a) | In connection with the acquisition of Rockwood, the Company valued Rockwood’s existing inventory at fair value as of the Acquisition Closing Date, which resulted in a markup of the underlying net book value of the inventory totaling approximately $103 million. The inventory markup was expensed over the estimated remaining selling period. For the year ended December 31, 2015, $75.9 million was included in Cost of goods sold, and Equity in net income of unconsolidated investments was reduced by $27.1 million, related to the utilization of the inventory markup. |
(b) | See “Acquisition and Integration Related Costs” on page 36 for a description of these costs. |
(c) | Refining Solutions includes an impairment charge of approximately $2.0 million related to our unconsolidated investment in Fábrica Carioca de Catalisadores SA. Corporate includes approximately $4.4 million of financing-related fees expensed in connection with the acquisition of Rockwood. |
(d) | Excludes discontinued operations. |
(e) | Financing-related fees expensed in connection with the acquisition of Rockwood. |
Performance Chemicals
Performance Chemicals segment net sales for the year ended December 31, 2015 were $1.61 billion, up $488.7 million, or 44%, in comparison to the same period in 2014. The increase was driven mainly by the acquisition of Rockwood, $26.0 million of favorable PCS volumes due to higher demand, and $9.4 million of favorable Bromine price impacts on certain products, partly offset by $21.8 million of unfavorable Bromine volumes on weaker demand and $27.9 million of unfavorable impacts from currency translation, primarily due to the weaker European Union Euro. Adjusted EBITDA for Performance Chemicals was up 75%, or $228.9 million, to $535.5 million for the year ended December 31, 2015, compared to the same period in 2014, with approximately $213.5 million due to the acquisition of Rockwood, $24.6 million in higher PCS sales volumes due to strong demand, and $9.4 million in favorable Bromine pricing impacts due to market conditions, offset partly by $16.1 million of unfavorable impacts of currency translation, primarily due to the weaker European Union Euro.
39
Albemarle Corporation and Subsidiaries | ||
Refining Solutions
Refining Solutions segment net sales for the year ended December 31, 2015 were $729.3 million, a decrease of $122.9 million, or 14%, compared to the year ended December 31, 2014. This decrease was predominantly due to $103.5 million of unfavorable Clean Fuels Technology volumes due to customer demand, $15.0 million unfavorable Clean Fuels Technology and Heavy Oil Upgrading pricing impacts due to product and customer mix, and $30.4 million of unfavorable impacts from currency translation, primarily due to the weaker European Union Euro, partially offset by $30.4 million of higher Heavy Oil Upgrading volumes. Refining Solutions adjusted EBITDA decreased 23%, or $58.9 million, to $197.6 million for the year ended December 31, 2015 in comparison to the corresponding period of 2014. This decrease was due primarily to lower overall sales volumes primarily in Clean Fuels Technology due to lower demand, unfavorable pricing and mix due to economic conditions and specific crude feeds, and unfavorable impacts of currency translation, primarily due to the weaker European Union Euro, partially offset by $21.7 million in favorable pricing on raw materials and natural gas.
Chemetall Surface Treatment
Arising from the acquisition of Rockwood, Chemetall Surface Treatment segment net sales and adjusted EBITDA for the year ended December 31, 2015 were $824.9 million, and $202.0 million, respectively.
All Other
All Other net sales for the year ended December 31, 2015 were $471.4 million, a decrease of $0.3 million compared to the year ended December 31, 2014. The decrease was driven mainly by $55.3 million of unfavorable Fine Chemistry Services volumes, and $29.4 million of unfavorable impacts from currency translation impacts, primarily due to the weaker European Union Euro, offset by the acquisition of Rockwood. All Other adjusted EBITDA was down 27%, or $20.0 million, for the year ended December 31, 2015 in comparison to the same period of 2014. This decrease was due primarily to lower overall sales and unfavorable impacts from currency translation, primarily due to the weaker European Union Euro, partially offset by the acquisition of Rockwood.
Corporate
Corporate adjusted EBITDA was a charge of $29.8 million for the year ended December 31, 2015, a decrease of $45.1 million, compared to the year ended December 31, 2014. The change was due mainly to $52.7 million of foreign currency translation gains and achieved synergies partially offset by the acquisition of Rockwood. The foreign translation gains are primarily related to cash denominated in U.S. Dollars held by foreign subsidiaries where the European Union Euro serves as the functional currency.
Comparison of 2014 to 2013
Net Sales
For the year ended December 31, 2014, we recorded net sales of $2.45 billion, a 2% increase compared to net sales of $2.39 billion for the corresponding period of 2013. This increase was due primarily to favorable volume impacts of approximately $60.1 million in Refining Solutions, $11.3 million in Minerals and $8.3 million in Performance Chemicals partially offset by unfavorable volume impacts of approximately $27.8 million in Fine Chemistry Services and unfavorable currency impacts of approximately $2.2 million due to a stronger U.S. Dollar as we closed out the year.
Gross Profit
For the year ended December 31, 2014, our gross profit decreased $79.6 million, or 9%, from the corresponding 2013 period. Our gross profit for 2014 was impacted by approximately $36.5 million of pension and OPEB costs (including mark-to-market actuarial losses of $36.4 million) allocated to cost of goods sold, as compared to $42.2 million of pension and OPEB benefits (including mark-to-market actuarial gains of $42.7 million) allocated to cost of goods sold in 2013. Overall, these factors contributed to our gross profit margin of 31.5% for 2014, down from 35.5% in 2013. Excluding the impact of pension and OPEB mark-to-market actuarial losses and gains, our gross profit margin was 33.0% in 2014 and 33.7% in 2013.
The mark-to-market actuarial loss in 2014 is primarily attributable to: (a) a decrease in the weighted-average discount rate for our pension plans to 4.03% from 5.00% to reflect market conditions as of the December 31, 2014 measurement date, and (b) changes in mortality assumptions, and to a lesser extent, other demographic assumptions related to our pension plans. The mark-to-market actuarial loss in 2014 was partially offset by a higher return on pension plan assets in 2014 than was expected, as a result of overall market and investment portfolio performance. The weighted-average actual return on our U.S. pension plan assets was 8.87% versus an expected return of 6.91%.
40
Albemarle Corporation and Subsidiaries | ||
The mark-to-market actuarial gain in 2013 is primarily attributable to: (a) an increase in the weighted-average discount rate for our pension plans to 5.00% from 4.04% to reflect market conditions as of the December 31, 2013 measurement date; (b) the weighted-average actual return on U.S. pension plan assets of 15.07% was higher than the expected return of 7.25% as a result of overall market and investment portfolio performance; and (c) changes in demographic assumptions related to our pension plans, such as mortality rates, rates of compensation and other factors.
Selling, General and Administrative Expenses
For the year ended December 31, 2014, our SG&A expenses increased $196.9 million, or 125%, compared to the year ended December 31, 2013. This increase was primarily due to unfavorable pension and OPEB items and incentive compensation costs. SG&A expenses for 2014 includes approximately $97.1 million of pension and OPEB costs (including mark-to-market actuarial losses of $94.5 million), as compared to $90.5 million of pension and OPEB benefits (including mark-to-market actuarial gains of $96.3 million) in 2013. The mark-to-market actuarial losses and gains in 2014 and 2013, respectively, resulted from the factors as discussed in Gross Profit above.
As a percentage of net sales, SG&A expenses were 14.5% for the year ended December 31, 2014, compared to 6.6% for the corresponding period in 2013. Excluding the impact of pension and OPEB mark-to-market actuarial losses and gains, SG&A expenses as a percentage of net sales were 10.7% in 2014 and 10.6% in 2013.
Research and Development Expenses
For the year ended December 31, 2014, our R&D expenses increased $6.1 million, or 7%, from the year ended December 31, 2013, mainly as a result of higher personnel costs and higher spending for outside services. As a percentage of net sales, R&D expenses were 3.6% in 2014, compared to 3.4% in 2013.
Restructuring and Other, Net
Restructuring and other, net, of $25.9 million for the year ended December 31, 2014 includes the following items:
(a) | Estimated costs of approximately $20.5 million ($13.6 million after income taxes) in connection with action we initiated to reduce the high cost supply capacity of certain aluminum alkyl products, primarily through the termination of a third party manufacturing contract. |
(b) | An impairment charge of $3.0 million ($1.9 million after income taxes) for certain capital project costs also related to aluminum alkyls capacity which we do not expect to recover. |
(c) | Other net charges of $2.4 million ($1.4 million after income taxes), mainly in connection with a write-off of certain multi-product facility project costs that we do not expect to recover in future periods. |
In connection with a realignment of our operating segments effective January 1, 2014, in the fourth quarter of 2013, we initiated a workforce reduction plan which resulted in a reduction of approximately 230 employees worldwide. We recorded charges of $33.4 million ($21.9 million after income taxes) during the year ended December 31, 2013 for termination benefits and other costs related to this workforce reduction plan.
Acquisition and Integration Related Costs
The year ended December 31, 2014 includes $23.6 million of acquisition and integration related costs directly related to the acquisition of Rockwood and $6.6 million of costs in connection with other significant projects. Acquisition-related costs incurred during the year ended December 31, 2013 are included in SG&A expenses and were not significant.
Interest and Financing Expenses
Interest and financing expenses for the year ended December 31, 2014 increased $9.8 million to $41.4 million from the corresponding 2013 period, due mainly to higher borrowing levels in connection with the acquisition of Rockwood and decreases in interest capitalized on lower average construction work in progress balances in the 2014 period.
Other Expenses, Net
Other expenses, net, for the year ended December 31, 2014 was $16.8 million versus $6.7 million for the corresponding 2013 period. This increase was due to $16.7 million of amortized bridge facility fees and $1.0 million of other financing fees in the 2014 period related to the acquisition of Rockwood, partially offset by net favorable items of $7.6 million primarily related to favorable currency impacts compared to the corresponding period in 2013 due to more effective management of currency risks.
41
Albemarle Corporation and Subsidiaries | ||
Income Tax Expense
The effective income tax rate for 2014 was 8.7% compared to 25.0% for 2013. Our effective income tax rate differs from the U.S. federal statutory income tax rates in the comparative periods mainly due to the impact of earnings from outside the U.S. Our effective income tax rate in 2014 was affected by tax benefits of $74.2 million related to restructuring charges, a pension plan actuarial loss and the release of reserves related principally to the expiration of the U.S. federal statute of limitations. See Note 20, “Income Taxes” to our consolidated financial statements included in Part II, Item 8 of this report for a reconciliation of the U.S. federal statutory income tax rate to our effective rate for 2014 and 2013.
Equity in Net Income of Unconsolidated Investments
Equity in net income of unconsolidated investments was $35.7 million for the year ended December 31, 2014 compared to $31.7 million in the same period last year. This increase was due primarily to higher equity income reported by our Refining Solutions segment joint ventures Nippon Ketjen Company Limited and Fábrica Carioca de Catalisadores SA, our Performance Chemicals segment joint venture Stannica, and our Magnifin joint venture (included in All Other), partly offset by lower equity income amounts reported by our Refining Solutions segment joint venture Eurecat.
(Loss) Income from Discontinued Operations
(Loss) income from discontinued operations, after income taxes, was ($69.5) million for the year ended December 31, 2014, compared to $4.1 million for the year ended December 31, 2013. Included in 2014 is a pre-tax charge of ($85.5) million ($65.7 million after income taxes), which represented the difference between the carrying value of the related assets and their fair value as determined by the sales price less estimated costs to sell. This charge was primarily attributable to the write-off of goodwill, intangibles and long-lived assets, net of cumulative foreign currency translation gains of $17.8 million.
Net Income Attributable to Noncontrolling Interests
For the year ended December 31, 2014, net income attributable to noncontrolling interests was $27.6 million compared to $26.7 million in the same period last year. This increase of $0.9 million was due primarily to higher profits of our consolidated joint venture JBC in the 2014 period.
Net Income Attributable to Albemarle Corporation
Net income attributable to Albemarle Corporation decreased to $133.3 million for the year ended December 31, 2014, from $413.2 million for the corresponding period of 2013 primarily due to an unfavorable impact of $73.6 million (after income taxes) related to discontinued operations, unfavorable impacts of $266.4 million related to pension and OPEB items mainly resulting from an actuarial loss in 2014 compared to an actuarial gain in 2013, charges of $30.2 million in 2014 for certain significant acquisition-related costs (of which $23.6 million relates to the acquisition of Rockwood), higher manufacturing and SG&A costs of approximately $33.0 million, higher interest and financing expenses of $9.8 million, and higher other expenses, net, of $10.1 million, partly offset by lower income tax expense of $116.0 million, lower restructuring and other, net, of $7.4 million, favorable volume impacts of approximately $12.2 million on market demand, and lower variable input costs of approximately $9.3 million.
Other Comprehensive (Loss) Income, Net of Tax
Total other comprehensive (loss) income, after income taxes, was ($178.7) million in 2014 compared to $31.3 million in 2013. The majority of these amounts are the result of translating our foreign subsidiary financial statements from their local currencies to U.S. Dollars. In 2014, other comprehensive (loss) from foreign currency translation adjustments was ($168.8) million, mainly as a result of unfavorable movements of approximately $(124) million in the European Union Euro, $(18) million in the Chinese Renminbi and ($13) million in the Brazilian Real. Also included in total other comprehensive (loss) income, for 2014 is ($21.0) million related to a realized loss on an interest rate swap which settled in the fourth quarter, and $11.4 million in connection with the revaluation of our €700.0 million senior notes and settlement of related foreign currency forward contracts, both of which were designated as a hedge of our net investment in foreign operations. In 2013, other comprehensive income from foreign currency translation adjustments was $31.7 million, mainly as a result of favorable movements in the European Union Euro of approximately $42 million, partially offset by unfavorable movements in the Brazilian Real of approximately $14 million.
42
Albemarle Corporation and Subsidiaries | ||
Year Ended December 31, | Percentage Change | ||||||||||||||||
2014 | % | 2013 | % | 2014 vs. 2013 | |||||||||||||
(In thousands, except percentages) | |||||||||||||||||
Net sales: | |||||||||||||||||
Performance Chemicals | $ | 1,121,645 | 45.9 | % | $ | 1,141,890 | 47.7 | % | (2 | )% | |||||||
Refining Solutions | 852,139 | 34.8 | % | 775,207 | 32.4 | % | 10 | % | |||||||||
All Other | 471,764 | 19.3 | % | 477,173 | 19.9 | % | (1 | )% | |||||||||
Total net sales | $ | 2,445,548 | 100.0 | % | $ | 2,394,270 | 100.0 | % | 2 | % | |||||||
Adjusted EBITDA: | |||||||||||||||||
Performance Chemicals | $ | 306,572 | 54.5 | % | $ | 364,712 | 65.4 | % | (16 | )% | |||||||
Refining Solutions | 256,485 | 45.6 | % | 190,388 | 34.1 | % | 35 | % | |||||||||
All Other | 73,973 | 13.2 | % | 71,691 | 12.9 | % | 3 | % | |||||||||
Corporate | (74,875 | ) | (13.3 | )% | (69,240 | ) | (12.4 | )% | 8 | % | |||||||
Total adjusted EBITDA | $ | 562,155 | 100.0 | % | $ | 557,551 | 100.0 | % | 1 | % | |||||||
See below for a reconciliation of adjusted EBITDA, the non-GAAP financial measure, to Net income (loss) attributable to Albemarle Corporation, the most directly comparable financial measure calculated and reported in accordance with GAAP, (in thousands):
Performance Chemicals | Refining Solutions | Reportable Segments Total | All Other | Corporate | Consolidated Total | ||||||||||||||||||
2014 | |||||||||||||||||||||||
Adjusted EBITDA | $ | 306,572 | $ | 256,485 | $ | 563,057 | $ | 73,973 | $ | (74,875 | ) | $ | 562,155 | ||||||||||
Depreciation and amortization(a) | (51,707 | ) | (32,670 | ) | (84,377 | ) | (13,478 | ) | (2,552 | ) | (100,407 | ) | |||||||||||
Restructuring and other, net | — | — | — | — | (25,947 | ) | (25,947 | ) | |||||||||||||||
Acquisition and integration related costs(b) | — | — | — | — | (30,158 | ) | (30,158 | ) | |||||||||||||||
Interest and financing expenses | — | — | — | — | (41,358 | ) | (41,358 | ) | |||||||||||||||
Income tax expense | — | — | — | — | (18,484 | ) | (18,484 | ) | |||||||||||||||
Loss from discontinued operations (net of tax) | — | — | — | — | (69,531 | ) | (69,531 | ) | |||||||||||||||
Non-operating pension and OPEB items | — | — | — | — | (125,462 | ) | (125,462 | ) | |||||||||||||||
Other(c) | — | — | — | — | (17,492 | ) | (17,492 | ) | |||||||||||||||
Net income (loss) attributable to Albemarle Corporation | $ | 254,865 | $ | 223,815 | $ | 478,680 | $ | 60,495 | $ | (405,859 | ) | $ | 133,316 | ||||||||||
2013 | |||||||||||||||||||||||
Adjusted EBITDA | $ | 364,712 | $ | 190,388 | $ | 555,100 | $ | 71,691 | $ | (69,240 | ) | $ | 557,551 | ||||||||||
Depreciation and amortization(a) | (46,225 | ) | (33,580 | ) | (79,805 | ) | (13,323 | ) | (2,188 | ) | (95,316 | ) | |||||||||||
Restructuring and other, net | — | — | — | — | (33,361 | ) | (33,361 | ) | |||||||||||||||
Interest and financing expenses | — | — | — | — | (31,559 | ) | (31,559 | ) | |||||||||||||||
Income tax expense | — | — | — | — | (134,445 | ) | (134,445 | ) | |||||||||||||||
Income from discontinued operations (net of tax) | — | — | — | — | 4,108 | 4,108 | |||||||||||||||||
Non-operating pension and OPEB items | — | — | — | — | 146,193 | 146,193 | |||||||||||||||||
Net income (loss) attributable to Albemarle Corporation | $ | 318,487 | $ | 156,808 | $ | 475,295 | $ | 58,368 | $ | (120,492 | ) | $ | 413,171 | ||||||||||
(a) | Excludes discontinued operations. |
(b) | See “Acquisition and Integration Related Costs” on page 41 for a description of these costs. |
(c) | Financing-related fees expensed in connection with the acquisition of Rockwood. |
43
Albemarle Corporation and Subsidiaries | ||
Performance Chemicals
Performance Chemicals segment net sales for the year ended December 31, 2014 were $1.12 billion, down $20.2 million, or 2%, in comparison to the same period in 2013. The decrease was due to lower Bromine sales volumes of $28.5 million, unfavorable Bromine pricing of $16.6 million, unfavorable PCS pricing of $8.7 million and $3.3 million of unfavorable currency exchange impacts partially offset by $36.7 million of increased PCS sales volumes. Adjusted EBITDA for Performance Chemicals was down 16%, or $58.1 million, to $306.6 million for the year ended 2014 compared to 2013, as a result of lower pricing due to market conditions, higher manufacturing and SG&A costs of approximately $22.0 million, and unfavorable currency impacts of approximately $2.3 million mainly due to the weaker Japanese yen.
Refining Solutions
Refining Solutions segment net sales for the year ended December 31, 2014 were $852.1 million, an increase of $76.9 million, or 10%, compared to the year ended December 31, 2013. This increase was primarily due $35.1 million of increased Clean Fuels Technology sales volumes, $23.7 million of increase Heavy Oil Upgrading sales volumes, $1.4 million of increased Chemical Catalysts sales volumes, and $16.6 million of favorable price impacts in both Heavy Oil Upgrading and Clean Fuels Technology. Refining Solutions adjusted EBITDA increased 35%, or $66.1 million, to $256.5 million for the year ended December 31, 2014 in comparison to the corresponding period of 2013. This increase was due primarily to higher overall sales volumes, improved pricing, and a $3.1 million increase in equity income reported by our Nippon Ketjen Company Limited joint venture primarily due to higher sales volumes
All Other
All Other net sales for the year ended December 31, 2014 were $471.8 million, a decrease of $5.4 million, or 1% compared to the year ended December 31, 2013. The decrease was driven mainly by $27.8 million of unfavorable Fine Chemistry Services volumes partially offset by $11.3 million of increased Minerals sales volumes, $9.3 million of improved price impacts and $1.9 million of favorable currency exchange impacts. All Other adjusted EBITDA was up 3%, or $2.3 million, for the year ended December 31, 2014 in comparison to the same period in 2014. This increase was due primarily to a favorable mix of sales volumes, $9.3 million of favorable price impacts, and lower SG&A costs.
Corporate
Corporate adjusted EBITDA was a charge of $74.9 million for the year ended December 31, 2014, an increase of $5.6 million, compared to the year ended December 31, 2013. The change was due mainly to unfavorable incentive compensation costs.
Summary of Critical Accounting Policies and Estimates
Estimates, Assumptions and Reclassifications
The preparation of financial statements in conformity with U.S. GAAP requires management to make estimates and assumptions that affect the reported amounts of revenues, expenses, assets and liabilities and disclosure of contingent assets and liabilities at the date of the financial statements. Listed below are the estimates and assumptions that we consider to be critical in the preparation of our financial statements.
Certain amounts in the accompanying consolidated financial statements and notes thereto have been reclassified to conform to the current presentation.
Property, Plant and Equipment. We assign the useful lives of our property, plant and equipment based upon our internal engineering estimates which are reviewed periodically. The estimated useful lives of our property, plant and equipment range from 2 to 60 years and depreciation is recorded on the straight-line method, with the exception of our long-term mineral rights, which are depleted on a units-of-production method. We evaluate the recovery of our property, plant and equipment by comparing the net carrying value of the asset group to the undiscounted net cash flows expected to be generated from the use and eventual disposition of that asset group when events or changes in circumstances indicate that its carrying amount may not be recoverable. If the carrying amount of the asset group is not recoverable, the fair value of the asset group is measured and if the carrying amount exceeds the fair value, an impairment loss is recognized.
Acquisition Method of Accounting. We recognize the identifiable assets acquired, the liabilities assumed and any noncontrolling interest in the acquiree at their estimated fair values on the date of acquisition for acquired businesses. Determining the fair value of these items requires management’s judgment, the utilization of independent valuation experts and involves the use of significant estimates and assumptions with respect to the timing and amounts of future cash inflows and
44
Albemarle Corporation and Subsidiaries | ||
outflows, discount rates, customer attrition rates, royalty rates, market prices and tax rates, among other items. The judgments made in the determination of the estimated fair value assigned to the assets acquired, the liabilities assumed and any noncontrolling interest in the investee, as well as the estimated useful life of each asset and the duration of each liability, can materially impact the financial statements in periods after acquisition, such as through depreciation and amortization expense. For more information on our acquisitions and application of the acquisition method, see Note 2, “Acquisitions” to our consolidated financial statements included in Part II, Item 8 of this report.
Income Taxes. We assume the deductibility of certain costs in our income tax filings, and we estimate the future recovery of deferred tax assets, uncertain tax positions, and indefinite investment assertions.
Environmental Remediation Liabilities. We estimate and accrue the costs required to remediate a specific site depending on site-specific facts and circumstances. Cost estimates to remediate each specific site are developed by assessing (i) the scope of our contribution to the environmental matter, (ii) the scope of the anticipated remediation and monitoring plan and (iii) the extent of other parties’ share of responsibility.
Actual results could differ materially from the estimates and assumptions that we use in the preparation of our financial statements.
Revenue Recognition
We recognize sales when the revenue is realized or realizable, and has been earned, in accordance with authoritative accounting guidance. We recognize net sales as risk and title to the product transfer to the customer, which usually occurs at the time shipment is made. Significant portions of our sales are sold free on board shipping point or on an equivalent basis, and other transactions are based upon specific contractual arrangements. Our standard terms of delivery are generally included in our contracts of sale, order confirmation documents and invoices. We recognize revenue from services when performance of the services has been completed. Where the Company incurs pre-production design and development costs under long-term supply contracts, these costs are expensed where they relate to the products sold unless contractual guarantees for reimbursement exist. Conversely, these costs are capitalized if they pertain to equipment that we will own and use in producing the products to be supplied and expect to utilize for future revenue generating activities.
Goodwill and Other Intangible Assets
We account for goodwill and other intangibles acquired in a business combination in conformity with current accounting guidance which requires goodwill and indefinite-lived intangible assets to not be amortized.
We test goodwill for impairment by comparing the estimated fair value of our reporting units to the related carrying value. We estimate the fair value based on present value techniques involving future cash flows. Future cash flows include assumptions about sales volumes, selling prices, raw material prices, labor and other employee benefit costs, capital additions, income taxes, working capital, and other economic or market-related factors. Significant management judgment is involved in estimating these variables and they include inherent uncertainties since they are forecasting future events. We perform a sensitivity analysis by using a range of inputs to confirm the reasonableness of these estimates being used in the goodwill impairment analysis. We use a Weighted Average Cost of Capital (“WACC”) approach to determine our discount rate for goodwill recoverability testing. Our WACC calculation incorporates industry-weighted average returns on debt and equity from a market perspective. The factors in this calculation are largely external to the Company and, therefore, are beyond our control. We test our recorded goodwill for impairment in the fourth quarter of each year or upon the occurrence of events or changes in circumstances that would more likely than not reduce the fair value of our reporting units below their carrying amounts. The Company performed its annual goodwill impairment test as of October 31, 2015 and concluded there was no impairment as of that date. In addition, no indications of impairment in any of our reporting units were indicated by the sensitivity analysis.
We assess our indefinite-lived intangible assets, which include trade names and in-progress research and development, for impairment annually and between annual tests if events or changes in circumstances indicate that it is more likely than not that the asset is impaired. The indefinite-lived intangible asset impairment standard allows us to first to assess qualitative factors to determine if a quantitative impairment test is necessary. Further testing is only required if we determine, based on the qualitative assessment, that it is more likely than not that the indefinite-lived intangible asset’s fair value is less than its carrying amount. If we determine based on the qualitative assessment that it is more likely than not that the asset is impaired, an impairment test is performed by comparing the fair value of the indefinite-lived intangible asset to its carrying amount.
Definite-lived intangible assets, such as purchased technology, patents, customer lists and trade names, are amortized over their estimated useful lives generally for periods ranging from five to twenty-five years. Except for customer lists and relationships associated with our Lithium business and Chemetall Surface Treatment segment which are amortized using the
45
Albemarle Corporation and Subsidiaries | ||
pattern of economic benefit method, definite-lived intangible assets are amortized using the straight-line method. We evaluate the recovery of our definite-lived intangible assets by comparing the net carrying value of the asset group to the undiscounted net cash flows expected to be generated from the use and eventual disposition of that asset group when events or changes in circumstances indicate that its carrying amount may not be recoverable. If the carrying amount of the asset group is not recoverable, the fair value of the asset group is measured and if the carrying amount exceeds the fair value, an impairment loss is recognized. See Note 12, “Goodwill and Other Intangibles” to our consolidated financial statements included in Part II, Item 8 of this report.
Pension Plans and Other Postretirement Benefits
Under authoritative accounting standards, assumptions are made regarding the valuation of benefit obligations and the performance of plan assets. As required, we recognize a balance sheet asset or liability for each of our pension and OPEB plans equal to the plan’s funded status as of the measurement date. The primary assumptions are as follows:
• | Discount Rate—The discount rate is used in calculating the present value of benefits, which is based on projections of benefit payments to be made in the future. |
• | Expected Return on Plan Assets—We project the future return on plan assets based on prior performance and future expectations for the types of investments held by the plans as well as the expected long-term allocation of plan assets for these investments. These projected returns reduce the net benefit costs recorded currently. |
• | Rate of Compensation Increase—For salary-related plans, we project employees’ annual pay increases, which are used to project employees’ pension benefits at retirement. |
• | Mortality Assumptions—Assumptions about life expectancy of plan participants are used in the measurement of related plan obligations. |
Actuarial gains and losses are recognized annually in our consolidated statements of income in the fourth quarter and whenever a plan is determined to qualify for a remeasurement during a fiscal year. The remaining components of pension and OPEB plan expense, primarily service cost, interest cost and expected return on assets, are recorded on a quarterly basis. The market-related value of assets equals the actual market value as of the date of measurement.
During 2015, we made changes to assumptions related to discount rates and expected rates of return on plan assets. We consider available information that we deem relevant when selecting each of these assumptions.
Our U.S. defined benefit plans for non-represented employees are closed to new participants, with no additional benefits accruing under these plans as participants’ accrued benefits have been frozen. In selecting the discount rates for the U.S. plans, we consider expected benefit payments on a plan-by-plan basis. As a result, the Company uses different discount rates for each plan depending on the demographics of participants and the expected timing of benefit payments. For 2015, the discount rates were calculated using the results from a bond matching technique developed by Milliman, which matched the future estimated annual benefit payments of each respective plan against a portfolio of bonds of high quality to determine the discount rate. We believe our selected discount rates are determined using preferred methodology under authoritative accounting guidance and accurately reflect market conditions as of the December 31, 2015 measurement date.
In selecting the discount rates for the foreign plans, we look at long-term yields on AA-rated corporate bonds when available. Our actuaries have developed yield curves based on the yields of constituent bonds in the various indices as well as on other market indicators such as swap rates, particularly at the longer durations. For the Eurozone, we apply the Aon Hewitt yield curve to projected cash flows from the relevant plans to derive the discount rate. For the U.K., the discount rate is determined by applying the Aon Hewitt yield curve for typical schemes of similar duration to projected cash flows of Albemarle’s U.K. plan. In other countries where there is not a sufficiently deep market of high-quality corporate bonds, we set the discount rate by referencing the yield on government bonds of an appropriate duration.
At December 31, 2015, the weighted-average discount rate for the U.S. and foreign pension plans was increased to 4.67% and 2.89%, respectively, from 4.18% and 2.34%, respectively, at December 31, 2014 to reflect market conditions as of the December 31, 2015 measurement date. The discount rate for the OPEB plans at December 31, 2015 and 2014 was 4.59% and 4.15%, respectively.
In estimating the expected return on plan assets, we consider past performance and future expectations for the types of investments held by the plan as well as the expected long-term allocations of plan assets to these investments. For the years 2015 and 2014, the weighted-average expected rate of return on U.S. pension plan assets was 6.85% and 6.91%, respectively, and the weighted-average expected rate of return on foreign pension plan assets was 5.63% and 4.00%, respectively. Effective January 1, 2016, the weighted-average expected rate of return on U.S. and foreign pension plan assets is 6.90% and 5.65%,
46
Albemarle Corporation and Subsidiaries | ||
respectively. The weighted-average expected rate of return on plan assets for our OPEB plans was 7.00% during 2015 and 2014. There has been no change to the assumed rate of return on OPEB plan assets effective January 1, 2016.
In projecting the rate of compensation increase, we consider past experience in light of movements in inflation rates. At December 31, 2015, the assumed weighted-average rate of compensation increase changed to 3.17% from 3.40% for our foreign pension plans.
In October 2014, the Society of Actuaries (“SOA”) published updated mortality tables which reflect increased life expectancy. We revised our mortality assumptions to incorporate the new set of mortality tables issued by the SOA for purposes of measuring our U.S. pension and OPEB obligations at December 31, 2014. Further, the SOA released an updated Mortality Improvement Scale, MP-2015, on October 8, 2015. The updated improvement scale incorporates two additional years of mortality data and reflects a trend toward somewhat smaller improvements in longevity. In addition, the SOA released a set of factors to adjust the RP-2014 Mortality Tables to base year 2006. We revised our mortality assumption to incorporate these updated mortality improvements for purposes of measuring our U.S. pension and OPEB obligations at December 31, 2015.
At December 31, 2015, the assumed rate of increase in the pre-65 and post-65 per capita cost of covered health care benefits for U.S. retirees was zero as the employer-paid premium caps (pre-65 and post-65) were met starting January 1, 2013.
A variance in the assumptions discussed above would have an impact on the projected benefit obligations, the accrued OPEB liabilities, and the annual net periodic pension and OPEB cost. The following table reflects the sensitivities associated with a hypothetical change in certain assumptions, primarily in the U.S. (in thousands):
(Favorable) Unfavorable | |||||||||||||||
1% Increase | 1% Decrease | ||||||||||||||
Increase (Decrease) in Benefit Obligation | Increase (Decrease) in Benefit Cost | Increase (Decrease) in Benefit Obligation | Increase (Decrease) in Benefit Cost | ||||||||||||
Actuarial Assumptions | |||||||||||||||
Discount Rate: | |||||||||||||||
Pension | $ | (130,542 | ) | $ | 3,680 | $ | 157,588 | $ | (5,268 | ) | |||||
Other postretirement benefits | $ | (5,160 | ) | $ | 254 | $ | 6,192 | $ | (320 | ) | |||||
Expected return on plan assets: | |||||||||||||||
Pension | * | $ | (6,712 | ) | * | $ | 6,712 | ||||||||
Other postretirement benefits | * | $ | (27 | ) | * | $ | 27 | ||||||||
* Not applicable.
Of the $694.1 million total pension and postretirement assets at December 31, 2015, $83.1 million, or approximately 12%, are measured using significant unobservable inputs (Level 3). Gains or losses attributable to these assets are recognized in the consolidated balance sheets as either an increase or decrease in plan assets. See Note 15, “Pension Plans and Other Postretirement Benefits” to our consolidated financial statements included in Part II, Item 8 of this report.
Income Taxes
We use the liability method for determining our income taxes, under which current and deferred tax liabilities and assets are recorded in accordance with enacted tax laws and rates. Under this method, the amounts of deferred tax liabilities and assets at the end of each period are determined using the tax rate expected to be in effect when taxes are actually paid or recovered. Future tax benefits are recognized to the extent that realization of such benefits is more likely than not. In order to record deferred tax assets and liabilities, we are following guidance under ASU 2015-17, which requires deferred tax assets and liabilities to be classified as noncurrent on the balance sheet, along with any related valuation allowance.
Deferred income taxes are provided for the estimated income tax effect of temporary differences between the financial statement carrying amounts and the tax basis of existing assets and liabilities. Deferred tax assets are also provided for operating losses, capital losses and certain tax credit carryovers. A valuation allowance, reducing deferred tax assets, is established when it is more likely than not that some portion or all of the deferred tax assets will not be realized. The realization of such deferred tax assets is dependent upon the generation of sufficient future taxable income of the appropriate character. Although realization is not assured, we do not establish a valuation allowance when we believe it is more likely than not that a net deferred tax asset will be realized.
We only recognize a tax benefit after concluding that it is more likely than not that the benefit will be sustained upon audit by the respective taxing authority based solely on the technical merits of the associated tax position. Once the recognition
47
Albemarle Corporation and Subsidiaries | ||
threshold is met, we recognize a tax benefit measured as the largest amount of the tax benefit that, in our judgment, is greater than 50% likely to be realized. Interest and penalties related to income tax liabilities are included in Income tax expense on the consolidated statements of income.
We are subject to income taxes in the U.S. and numerous foreign jurisdictions. Due to the statute of limitations, we are no longer subject to U.S. federal income tax audits by the Internal Revenue Service (“IRS”) for years prior to 2011. In 2015, the IRS continued its audit of legacy Albemarle’s U.S. consolidated group for 2011 and 2012. Additionally, in 2015 the IRS finalized its audit of legacy Rockwood’s U.S. consolidated group for 2010 and 2011. Due to the statute of limitations, we also are no longer subject to U.S. state income tax audits prior to 2010.
With respect to jurisdictions outside the U.S., several audits are in process. During 2015, the German tax authorities continued and announced audits on multiple German subsidiaries for various years from 2006 through 2013, the Belgium tax authorities continued the audit of our Belgium subsidiary for 2012 and 2013, and audits of two of our Korean entities for 2011 through 2013 were closed. We also have various audits ongoing for the years 2007 through 2014 related to Russia, the Philippines, India, Italy, and France.
While we believe we have adequately provided for all tax positions, amounts asserted by taxing authorities could be greater than our accrued position. Accordingly, additional provisions on federal and foreign tax-related matters could be recorded in the future as revised estimates are made or the underlying matters are settled or otherwise resolved.
Since the timing of resolutions and/or closure of tax audits are uncertain, it is difficult to predict with certainty the range of reasonably possible significant increases or decreases in the liability related to uncertain tax positions that may occur within the next twelve months. Our current view is that it is reasonably possible that we could record a decrease in the liability related to uncertain tax positions, relating to a number of issues, up to approximately $3.3 million as a result of closure of tax statutes.
We have designated the undistributed earnings of substantially all of our foreign operations as indefinitely invested and as a result we do not provide for deferred income taxes on the unremitted earnings of these subsidiaries. If it is determined that cash can be repatriated with little to no tax consequences, we may choose to repatriate cash at that time. Our foreign earnings are computed under U.S. federal tax earnings and profits (“E&P”) principles. In general, to the extent our financial reporting book basis over tax basis of a foreign subsidiary exceeds these E&P amounts, deferred taxes have not been provided, as they are essentially permanent in duration. The determination of the amount of such unrecognized deferred tax liability is not practicable. We provide for deferred income taxes on our undistributed earnings of foreign operations that are not deemed to be indefinitely invested.
Stock-based Compensation Expense
The fair value of restricted stock awards, restricted stock unit awards and performance unit awards with a service condition are determined based on the number of shares or units granted and the quoted price of our common stock on the date of grant, and the fair value of stock options is determined using the Black-Scholes valuation model. The fair value of performance unit awards with a service and a market condition are estimated on the date of grant using a Monte Carlo simulation model. The fair value of these awards is determined after giving effect to estimated forfeitures. Such value is recognized as expense over the service period, which is generally the vesting period of the equity grant. To the extent restricted stock awards, restricted stock unit awards, performance unit awards and stock options are forfeited prior to vesting in excess of the estimated forfeiture rate, the corresponding previously recognized expense is reversed as an offset to operating expenses.
Financial Condition and Liquidity
Overview
The principal uses of cash in our business generally have been capital investments, funding working capital, acquisitions and repayment of debt. We also make contributions to our defined benefit pension plans, pay dividends to our shareholders and repurchase shares of our common stock. Historically, cash to fund the needs of our business has been principally provided by cash from operations, debt financing and equity issuances.
We are continually focused on working capital efficiency particularly in the areas of accounts receivable and inventory. We anticipate that cash on hand, cash provided by operating activities and long-term borrowings will be sufficient to pay our operating expenses, satisfy debt service obligations, fund capital expenditures and other investing activities, fund pension contributions and pay dividends for the foreseeable future.
48
Albemarle Corporation and Subsidiaries | ||
Cash Flow
Our cash and cash equivalents were $213.7 million at December 31, 2015 as compared to $2.5 billion at December 31, 2014. Cash provided by operating activities was $360.7 million, $492.6 million and $432.9 million during the years ended December 31, 2015, 2014 and 2013, respectively.
The decrease in cash provided by operating activities in 2015 versus 2014 was primarily due to higher acquisition and integration related costs in connection with the Rockwood acquisition, higher payments for interest and higher payments for income taxes in 2015, as compared to 2014. The increase in cash provided by operating activities in 2014 versus 2013 was primarily due to a decrease in accounts receivable and higher dividends received from unconsolidated investments in 2014, partially offset by a decrease in accrued expenses.
During 2015, cash on hand, cash provided by operations, a return of capital from an unconsolidated investment and proceeds from borrowings funded $2.1 billion for acquisitions, $227.6 million of capital expenditures for plant, machinery and equipment, dividends to shareholders of $119.3 million, and pension and postretirement contributions of $21.6 million. Also during 2015, our consolidated joint venture, JBC, paid dividends of approximately $70 million, which resulted in dividends to noncontrolling interests of $23.3 million. During 2014, cash on hand, cash provided by operations and proceeds from divestitures funded payments of $150.0 million for repurchases of our common stock, $110.6 million of capital expenditures for plant, machinery and equipment, dividends to shareholders of $84.1 million, $33.4 million for the settlement of a forward starting interest rate swap, debt financing costs of $17.6 million and pension and postretirement contributions of $13.9 million. Also during 2014, our consolidated joint venture, JBC, paid dividends of approximately $51 million, which resulted in dividends to noncontrolling interests of $15.5 million. Additionally, in 2014 we issued a series of new senior notes totaling approximately $1.9 billion. During 2013, proceeds from borrowings net of repayments, cash on hand and cash provided by operations funded payments of $582.3 million for repurchases of our common stock, $155.3 million of capital expenditures for plant, machinery and equipment, dividends to shareholders of $78.1 million and pension and postretirement contributions of $13.3 million. Also during 2013, our consolidated joint venture, JBC, paid dividends of approximately $38 million, which resulted in dividends to noncontrolling interests of $10.0 million.
Net current assets decreased to approximately $214.3 million at December 31, 2015 from $2.21 billion at December 31, 2014, with the decrease being largely due to lower cash and cash equivalents in connection with acquisitions in 2015. Included in net current assets at December 31, 2015 is $275.8 million of assets held for sale, net of related liabilities. Other changes in the components of net current assets are due to the timing of the sale of goods and other normal transactions leading up to the balance sheet dates and are not the result of any policy changes by the Company, nor do they reflect any change in either the quality of our net current assets or our expectation of success in converting net working capital to cash in the normal course of business.
Capital expenditures were $227.6 million, $110.6 million and $155.3 million for the years ended December 31, 2015, 2014 and 2013, respectively, and were incurred mainly for plant, machinery and equipment. We expect our capital expenditures to approximate $230 million in 2016 for capacity increases, cost reduction and continuity of operations projects.
On November 5, 2015, the Company signed a definitive agreement to sell its Tribotecc metal sulfides business to Treibacher Industrie AG. Included in the transaction were sites in Vienna and Arnoldstein, Austria, and Tribotecc’s proprietary sulfide syntheses process. On January 4, 2016, the Company closed the sale of this business. We received net proceeds of approximately $137 million, and we currently expect to record a gain in the first quarter of 2016 related to the sale of this business.
On December 16, 2015, the Company signed a definitive agreement to sell its mineral-based flame retardants and specialty chemicals businesses to Huber Engineered Materials, a division of J.M. Huber Corporation. The transaction includes Albemarle’s Martinswerk GmbH subsidiary and manufacturing facility located in Bergheim, Germany, and Albemarle’s 50% ownership interest in Magnifin Magnesiaprodukte GmbH, a joint-venture with Radex Heraklith Industriebeteiligung AG at Breitenau, Austria. On February 1, 2016, the Company closed the sale of these businesses. We received net proceeds of approximately $187 million, subject to post-closing adjustments. We currently expect to record a gain in the first quarter of 2016 related to the sale of these businesses.
During 2014 and 2013 we repurchased approximately 2.2 million shares and 9.2 million shares of our common stock, respectively, pursuant to the terms of our Board authorized share repurchase program. All of the shares repurchased in 2014 and approximately 7.1 million of the shares repurchased in 2013 were also repurchased pursuant to the terms of accelerated share repurchase agreements with major financial institutions. As of December 31, 2015, there were 3,749,340 remaining shares available for repurchase under the Company’s authorized share repurchase program.
49
Albemarle Corporation and Subsidiaries | ||
On February 26, 2016, we increased our quarterly dividend rate to $0.305 per share, a 5% increase from the quarterly rate of $0.29 per share paid in 2015.
During 2015, we incurred $137.7 million of acquisition and integration related costs directly related to the acquisition of Rockwood (mainly consisting of professional services and advisory fees, costs to achieve synergies, relocation costs, and other integration costs) and $8.4 million of costs in connection with other significant projects. In 2014, we incurred $23.6 million of acquisition and integration related costs directly related to the acquisition of Rockwood and $6.6 million of costs in connection with other significant projects. We currently anticipate incurring additional acquisition and integration related costs of approximately $60 million through 2016 in connection with the acquisition of Rockwood; actual results may differ from this estimate.
At December 31, 2015 and December 31, 2014, our cash and cash equivalents included $200.7 million and $558.7 million, respectively, held by our foreign subsidiaries. The majority of these foreign cash balances are associated with earnings that we have asserted are indefinitely invested and which we plan to use to support our continued growth plans outside the U.S. through funding of capital expenditures, acquisitions, research, operating expenses or other similar cash needs of our foreign operations. From time to time, we repatriate cash associated with earnings from our foreign subsidiaries to the U.S. for normal operating needs through intercompany dividends, but only from subsidiaries whose earnings we have not asserted to be indefinitely invested or whose earnings qualify as “previously taxed income” as defined by the Internal Revenue Code. For the years ended December 31, 2015, 2014 and 2013, we repatriated approximately $122.5 million, $10.0 million and $7.2 million of cash associated with earnings, respectively, as part of these foreign earnings cash repatriation activities. With regard to the access of internal cash from Albemarle, Rockwood and their respective subsidiaries to help fund the Merger, the structure implemented did not impact the indefinite investment assertion of Albemarle as no taxes were triggered in the movements of Albemarle’s cash. With regard to the acquisition of Rockwood, the Company’s purchase price accounting included tax liabilities related to the repatriation of cash that occurred in 2015. As of December 31, 2015, the deferred tax liability has been fully utilized as the repatriation planning has concluded. We have asserted that substantially all future earnings of former Rockwood entities have been elected to be indefinitely invested.
While we continue to closely monitor our cash generation, working capital management and capital spending in light of continuing uncertainties in the global economy, we believe that we will continue to have the financial flexibility and capability to opportunistically fund future growth initiatives. Additionally, we anticipate that future capital spending including business acquisitions, share repurchases and other cash outlays should be financed primarily with cash flow provided by operations and cash on hand, with additional cash needed, if any, provided by borrowings. The amount and timing of any additional borrowings will depend on our specific cash requirements.
Long-Term Debt
Our $325.0 million aggregate principal amount of senior notes, issued on January 20, 2005 and bearing interest at a rate of 5.10%, matured and were repaid on February 1, 2015. We currently have the following senior notes outstanding:
Issue Month/Year | Principal (in millions) | Interest Rate | Interest Payment Dates | Maturity Date | |||||
December 2014 | €700.0 | 1.875% | December 8 | December 8, 2021 | |||||
November 2014 | $250.0 | 3.00% | June 1 | December 1 | December 1, 2019 | ||||
November 2014 | $425.0 | 4.15% | June 1 | December 1 | December 1, 2024 | ||||
November 2014 | $350.0 | 5.45% | June 1 | December 1 | December 1, 2044 | ||||
December 2010 | $350.0 | 4.50% | June 15 | December 15 | December 15, 2020 | ||||
Our senior notes are senior unsecured obligations and rank equally with all of our other senior unsecured indebtedness from time to time outstanding. The senior notes are effectively subordinated to any of our existing or future secured indebtedness and to the existing and future indebtedness of our subsidiaries. As is customary for such long-term debt instruments, each senior note outstanding has terms that allow us to redeem the notes before their maturity, in whole at any time or in part from time to time, at a redemption price equal to the greater of (i) 100% of the principal amount of the senior notes to be redeemed, or (ii) the sum of the present values of the remaining scheduled payments of principal and interest thereon (exclusive of interest accrued to the date of redemption) discounted to the redemption date on a semi-annual basis using the comparable government rate (as defined in the indentures governing the senior notes) plus between 25 and 40 basis points, depending on the note, plus, in each case, accrued interest thereon to the date of redemption. Holders may require us to purchase such notes at 101% upon a change of control triggering event, as defined in the indentures. The senior notes are
50
Albemarle Corporation and Subsidiaries | ||
subject to typical events of default, including bankruptcy and insolvency events, nonpayment and the acceleration of certain subsidiary indebtedness of $40 million or more caused by a nonpayment default.
Upon completion of the Rockwood acquisition, we assumed Rockwood’s senior notes with an aggregate principal amount of $1.25 billion. These senior notes bore interest at a rate of 4.625% payable semi-annually on April 15 and October 15 of each year, and had a scheduled maturity of October 15, 2020. Under the terms of the indenture governing the 4.625% senior notes, as amended and supplemented, on October 15, 2015, our wholly-owned subsidiary, Rockwood Specialties Group, Inc., redeemed all of the outstanding 4.625% senior notes at a redemption price equal to 103.469% of the principal amount of the notes, representing a premium of $43.3 million, plus accrued and unpaid interest to the redemption date. The guarantees of the 4.625% senior notes and the senior notes we issued in 2014 were released upon repayment of the 4.625% senior notes.
The 4.625% senior notes we assumed from Rockwood were repaid with proceeds from a new term loan agreement we entered into on September 14, 2015 (the “September 2015 Term Loan Agreement”) with JPMorgan Chase Bank, N.A. (the “Administrative Agent”) and certain other lenders. The September 2015 Term Loan Agreement provides for borrowings under a 364-day term loan facility (the “364-Day Facility”) and a five-year term loan facility (the “Five-Year Facility”), or collectively, the “Term loan facilities.” As of December 31, 2015, aggregate amounts outstanding under the 364-Day Facility and the Five-Year Facility were $300.0 million and $950.0 million, respectively. As of February 19, 2016, we repaid the 364-Day Facility in full and we repaid approximately $31 million of borrowings under the Five-Year Facility, each primarily with proceeds from the sale of the Company’s Tribotecc metal sulfides business and the sale of the Company’s minerals-based flame retardants and specialty chemicals businesses, both of which closed in the first quarter of 2016. Borrowings under the facilities bear interest equal to, at the option of the Company: (a) the London Inter-Bank Offered Rate (“LIBOR”) plus a margin ranging from 1.000% to 1.875% per annum depending upon the long-term, unsecured, senior, non-credit enhanced debt rating of the Company, or (b) a base rate (defined as the highest of (i) the Federal Funds Rate plus 0.50%; (ii) the rate of interest in effect for such day as publicly announced from time to time by the Administrative Agent as its “prime rate”; or (iii) one-month LIBOR plus 1.00%) plus a margin of 0.000% to 0.875% per annum depending upon the long-term, unsecured, senior, non-credit enhanced debt rating of the Company. As of December 31, 2015, the interest rate on both Term loan facilities was LIBOR plus 1.375%.
Borrowings under the 364-Day Facility were required to be repaid 364 days after initial funding. Borrowings under the Five-Year Facility are required to be repaid in equal quarterly installments on the last business day of each March, June, September and December, beginning with September 30, 2016, and ending with the last such day to occur prior to the fifth anniversary after initial funding (each a “Payment Date”), in an aggregate principal amount equal to (a) in the case of each Payment Date occurring on or after the first anniversary and prior to the second anniversary of initial funding, 1.25% of the aggregate principal amount of such loans, and (b) in the case of each Payment Date occurring on or after the second anniversary of initial funding, equal to 2.5% of the aggregate principal amount of such loans. On the fifth anniversary after initial funding, any remaining amounts outstanding under the Five-Year Facility become due and payable. Additionally, the agreement requires that proceeds from divestitures of the Company’s Tribotecc metal sulfides business and the Company’s minerals-based flame retardants and specialty chemicals businesses, and intended divestiture of its Fine Chemistry Services business, must be used to repay amounts outstanding under the September 2015 Term Loan Agreement. Borrowings under the September 2015 Term Loan Agreement are subject to customary affirmative and negative covenants, including a maximum leverage ratio requirement that is aligned with the maximum leverage ratio requirement of our February 2014 Credit Agreement.
Our revolving, unsecured credit agreement dated as of February 7, 2014, as amended, (the “February 2014 Credit Agreement”) currently provides for borrowings of up to $1.0 billion and matures on February 7, 2020. Borrowings bear interest at variable rates based on the LIBOR for deposits in the relevant currency plus an applicable margin which ranges from 1.000% to 1.700%, depending on the Company’s credit rating from Standard & Poor’s Ratings Services (“S&P”), Moody’s Investors Services (“Moody’s”) and Fitch Ratings (“Fitch”). The applicable margin on the facility was 1.300% as of December 31, 2015. There were no borrowings outstanding under the February 2014 Credit Agreement as of December 31, 2015.
Borrowings under the February 2014 Credit Agreement are conditioned upon compliance with the following covenants: (a) consolidated funded debt, as defined in the agreement, must be less than or equal to 3.50 times consolidated EBITDA, as defined in the agreement, which reflects adjustments for certain non-recurring or unusual items such as restructuring charges, facility divestiture charges and other significant non-recurring items (herein “consolidated adjusted EBITDA” or “adjusted EBITDA”), as of the end of any fiscal quarter; (b) with the exception of certain liens as specified in the agreement, liens may not attach to assets when the aggregate amount of all indebtedness secured by such liens plus unsecured subsidiary indebtedness, other than indebtedness incurred by our subsidiaries under the February 2014 Credit Agreement, would exceed 20% of consolidated net worth, as defined in the agreement; and (c) with the exception of certain indebtedness as specified in the agreement, subsidiary indebtedness may not exceed the difference between 20% of consolidated net worth, as defined in the agreement, and indebtedness secured by liens permitted under the agreement. On August 15, 2014, certain amendments were
51
Albemarle Corporation and Subsidiaries | ||
made to the February 2014 Credit Agreement which includes, among other things, an increase in the maximum leverage ratio (as described above) from 3.50 to 4.50 for the first four quarters following the completion of the acquisition of Rockwood, stepping down by 0.25 on a quarterly basis thereafter until reaching 3.50.
On May 29, 2013, we entered into agreements to initiate a commercial paper program on a private placement basis under which we may issue unsecured commercial paper notes (the “Commercial Paper Notes”) from time-to-time up to a maximum aggregate principal amount outstanding at any time of $750.0 million. The proceeds from the issuance of the Commercial Paper Notes are expected to be used for general corporate purposes, including the repayment of other debt of the Company. Our February 2014 Credit Agreement is available to repay the Commercial Paper Notes, if necessary. Aggregate borrowings outstanding under the February 2014 Credit Agreement and the Commercial Paper Notes will not exceed the $1.0 billion current maximum amount available under the February 2014 Credit Agreement. The Commercial Paper Notes will be sold at a discount from par, or alternatively, will be sold at par and bear interest at rates that will vary based upon market conditions at the time of issuance. The maturities of the Commercial Paper Notes will vary but may not exceed 397 days from the date of issue. The definitive documents relating to the commercial paper program contain customary representations, warranties, default and indemnification provisions. At December 31, 2015, we had $351.3 million of Commercial Paper Notes outstanding bearing a weighted-average interest rate of approximately 1.07% and a weighted-average maturity of 29 days. The Commercial Paper Notes are classified as Current portion of long-term debt in our consolidated balance sheets at December 31, 2015 and December 31, 2014.
The non-current portion of our long-term debt amounted to $3.2 billion at December 31, 2015, compared to $2.2 billion at December 31, 2014. The increase is attributable to debt associated with the acquisition of Rockwood. In addition, at December 31, 2015, we had the ability to borrow $648.7 million under our commercial paper program and the February 2014 Credit Agreement, and $154.1 million under other existing lines of credit, subject to various financial covenants under our February 2014 Credit Agreement. We have the ability and intent to refinance our borrowings under our other existing credit lines with borrowings under the February 2014 Credit Agreement, as applicable. Therefore, the amounts outstanding under those credit lines, if any, are classified as long-term debt. We believe that as of December 31, 2015 we were, and currently are, in compliance with all of our debt covenants. For additional information about our long-term debt obligations, see Note 14, “Long-Term Debt,” to our consolidated financial statements included in Part II, Item 8 of this report.
Off-Balance Sheet Arrangements
In the normal course of business with customers, vendors and others, we have entered into off-balance sheet arrangements, including bank guarantees and letters of credit, which totaled approximately $63.8 million at December 31, 2015. None of these off-balance sheet arrangements has, or is likely to have, a material effect on our current or future financial condition, results of operations, liquidity or capital resources.
Other Obligations
The following table summarizes our contractual obligations for capital projects, various take or pay and throughput agreements, long-term debt, operating leases and other commitments as of December 31, 2015 (in thousands):
2016 | 2017 | 2018 | 2019 | 2020 | Thereafter | ||||||||||||||||||
Long-term debt obligations(a) | $ | 677,345 | $ | 59,130 | $ | 86,400 | $ | 335,479 | $ | 1,158,351 | $ | 1,544,512 | |||||||||||
Expected interest payments on long-term debt obligations(b) | 92,761 | 95,719 | 99,338 | 101,072 | 82,496 | 525,695 | |||||||||||||||||
Operating lease obligations (rental) | 14,643 | 10,664 | 9,217 | 7,436 | 6,665 | 21,124 | |||||||||||||||||
Take or pay / throughput agreements(c) | 43,654 | 11,762 | 6,363 | 6,063 | 5,923 | 11,484 | |||||||||||||||||
Letters of credit and guarantees | 24,789 | 11,248 | 3,190 | 14 | 210 | 24,356 | |||||||||||||||||
Capital projects | 36,599 | 1,580 | — | — | — | — | |||||||||||||||||
Total | $ | 889,791 | $ | 190,103 | $ | 204,508 | $ | 450,064 | $ | 1,253,645 | $ | 2,127,171 | |||||||||||
(a) | Amounts represent the expected principal payments of our long-term debt, including capital leases, and do not include any fair value adjustments or premiums or discounts. |
(b) | Interest on our fixed rate borrowings was calculated based on the stated rates of such borrowings. A weighted average interest rate of approximately 1.53% was used for our remaining long-term debt obligations. |
(c) | These amounts primarily relate to contracts entered into with certain third party vendors in the normal course of business to secure raw materials for our production processes. In order to secure materials, sometimes for long durations, these contracts mandate a minimum amount of product to be purchased at predetermined rates over a set timeframe. |
52
Albemarle Corporation and Subsidiaries | ||
Amounts in the table above exclude required employer pension contributions. Contributions to our domestic and foreign qualified and nonqualified pension plans, including our supplemental executive retirement plan (“SERP”), are expected to approximate $13 million in 2016. We may choose to make additional pension contributions in excess of this amount. We made contributions of approximately $18.0 million to our domestic and foreign pension plans (both qualified and nonqualified) during the year ended December 31, 2015.
The liability related to uncertain tax positions, including interest and penalties, recorded in Other noncurrent liabilities totaled $101.7 million and $25.3 million at December 31, 2015 and 2014, respectively. Related assets for corresponding offsetting benefits recorded in Other assets totaled $50.9 million and $22.1 million at December 31, 2015 and 2014, respectively. We cannot estimate the amounts of any cash payments during the next twelve months associated with these liabilities and are unable to estimate the timing of any such cash payments in the future at this time.
Liquidity Outlook
We anticipate that cash on hand and cash provided by operating activities, divestitures and borrowings will be sufficient to pay our operating expenses, satisfy debt service obligations, fund any capital expenditures and share repurchases, make pension contributions and pay dividends for the foreseeable future. With the acquisition of Rockwood now closed, our main focus over the next three years, in terms of uses of cash, will be deleveraging to restore our borrowings to more normal levels and capturing synergies related to the integration of Rockwood. This may include refinancing certain of our existing outstanding debt if market conditions are favorable. Additionally, we will continue to evaluate the merits of any opportunities that may arise for acquisitions of businesses or assets, which may require additional liquidity.
Our cash flows from operations may be negatively affected by adverse consequences to our customers and the markets in which we compete as a result of moderating global economic conditions and reduced capital availability. Additionally, realization and timing of anticipated divestitures could have a significant impact on our cash flows in any given period.
While we maintain business relationships with a diverse group of financial institutions, an adverse change in their credit standing could lead them to not honor their contractual credit commitments, decline funding under existing but uncommitted lines of credit, not renew their extensions of credit or not provide new financing. While the global corporate bond and bank loan markets remain strong, periods of elevated uncertainty related to global economic and/or geopolitical concerns may limit efficient access to such markets for extended periods of time. If such concerns heighten, we may incur increased borrowing costs and reduced credit capacity as our various credit facilities mature. When the U.S. Federal Reserve or similar national reserve banks in other countries decide to tighten the monetary supply in response, for example, to improving economic conditions, we may incur increased borrowing costs as interest rates increase on our variable rate credit facilities, as our various credit facilities mature or as we refinance any maturing fixed rate debt obligations.
Overall, with generally strong cash-generative businesses and no significant long-term debt maturities before 2019, we believe we have and will maintain a solid liquidity position.
We had cash and cash equivalents totaling $213.7 million as of December 31, 2015, of which $200.7 million is held by our foreign subsidiaries. This cash represents an important source of our liquidity and is invested in short-term investments including time deposits and readily marketable securities with relatively short maturities. Substantially all of this cash is held, and intended for use, outside of the U.S. We anticipate that any needs for liquidity within the U.S. in excess of our cash held in the U.S. can be readily satisfied with borrowings under our existing U.S. credit facilities or our commercial paper program.
Safety and Environmental Matters
We are subject to federal, state, local and foreign requirements regulating the handling, manufacture and use of materials (some of which may be classified as hazardous or toxic by one or more regulatory agencies), the discharge of materials into the environment and the protection of the environment. To our knowledge, we are currently complying and expect to continue to comply in all material respects with applicable environmental laws, regulations, statutes and ordinances. Compliance with existing federal, state, local and foreign environmental protection laws is not expected to have a material effect on capital expenditures, earnings or our competitive position, but the costs associated with increased legal or regulatory requirements could have an adverse effect on our results.
Among other environmental requirements, we are subject to the federal Superfund law, and similar state laws, under which we may be designated as a PRP, and may be liable for a share of the costs associated with cleaning up various hazardous waste sites. Management believes that in cases in which we may have liability as a PRP, our liability for our share of cleanup is de minimis. Further, almost all such sites represent environmental issues that are quite mature and have been investigated, studied and in many cases settled. In de minimis situations, our policy generally is to negotiate a consent decree and to pay any apportioned settlement, enabling us to be effectively relieved of any further liability as a PRP, except for remote contingencies.
53
Albemarle Corporation and Subsidiaries | ||
In other than de minimis PRP matters, our records indicate that unresolved PRP exposures should be immaterial. We accrue and expense our proportionate share of PRP costs. Because management has been actively involved in evaluating environmental matters, we are able to conclude that the outstanding environmental liabilities for unresolved PRP sites should not have a material adverse effect upon our results of operations or financial condition.
Our environmental and safety operating costs charged to expense were $42.2 million, $35.7 million and $44.0 million in 2015, 2014 and 2013, respectively, excluding depreciation of previous capital expenditures, and are expected to be in the same range in the next few years. Costs for remediation have been accrued and payments related to sites are charged against accrued liabilities, which at December 31, 2015 totaled approximately $35.3 million, an increase of $26.1 million from $9.2 million at December 31, 2014. See Note 17, “Commitments and Contingencies” to our consolidated financial statements included in Part II, Item 8 of this report for a reconciliation of our environmental liabilities for the years ended December 31, 2015, 2014 and 2013.
We believe that any sum we may be required to pay in connection with environmental remediation and asset retirement obligation matters in excess of the amounts recorded should occur over a period of time and should not have a material adverse effect upon our results of operations, financial condition or cash flows on a consolidated annual basis, although any such sum could have a material adverse impact on our results of operations, financial condition or cash flows in a particular quarterly reporting period.
Capital expenditures for pollution-abatement and safety projects, including such costs that are included in other projects, were approximately $25.0 million, $15.2 million and $14.1 million in 2015, 2014 and 2013, respectively. In the future, capital expenditures for these types of projects may increase due to more stringent environmental regulatory requirements and our efforts in reaching sustainability goals. Management’s estimates of the effects of compliance with governmental pollution-abatement and safety regulations are subject to (a) the possibility of changes in the applicable statutes and regulations or in judicial or administrative construction of such statutes and regulations and (b) uncertainty as to whether anticipated solutions to pollution problems will be successful, or whether additional expenditures may prove necessary.
Recently Issued Accounting Pronouncements
In April 2014, the Financial Accounting Standards Board (“FASB”) issued accounting guidance that changed the criteria for reporting discontinued operations and modified related disclosure requirements to provide users of financial statements with more information about the assets, liabilities, revenues and expenses of discontinued operations. The guidance modified the definition of discontinued operations by limiting its scope to disposals of components of an entity that represent strategic shifts that have (or will have) a major effect on an entity’s operations and financial results. Additionally, these new requirements require entities to disclose the pretax profit or loss related to disposals of significant components that do not qualify as discontinued operations. These new requirements became effective on January 1, 2015. For additional information, refer to Note 3, “Divestitures,” to our consolidated financial statements included in Part II, Item 8 of this report.
In May 2014, the FASB issued accounting guidance designed to enhance comparability of revenue recognition practices across entities, industries, jurisdictions and capital markets. The core principle of the guidance is that revenue recognized from a transaction or event that arises from a contract with a customer should reflect the consideration to which an entity expects to be entitled in exchange for goods or services provided. To achieve that core principle the new guidance sets forth a five-step revenue recognition model that will need to be applied consistently to all contracts with customers, except those that are within the scope of other topics in the Accounting Standards Codification (“ASC”). Also required are new disclosures to help users of financial statements better understand the nature, amount, timing and uncertainty of revenues and cash flows from contracts with customers. The new disclosures include qualitative and quantitative information about contracts with customers, significant judgments made in applying the revenue guidance, and assets recognized related to the costs to obtain or fulfill a contract. These new requirements become effective for annual and interim reporting periods beginning after December 15, 2017. Early adoption is permitted for annual and interim reporting periods beginning after December 15, 2016. We are assessing the impact of these new requirements on our financial statements.
In June 2014, the FASB issued accounting guidance which clarifies the proper method of accounting for share-based payments when the terms of an award provide that a performance target could be achieved after the requisite service period. The accounting guidance requires that a performance target that affects vesting and that could be achieved after the requisite service period be treated as a performance condition. The performance target should not be reflected in estimating the grant-date fair value of the award. Compensation cost should be recognized in the period in which it becomes probable that the performance target will be achieved and should represent the compensation cost attributable to the period(s) for which the requisite service has already been rendered. These new requirements become effective for annual and interim reporting periods
54
Albemarle Corporation and Subsidiaries | ||
beginning after December 15, 2015, and early adoption is permitted. We do not expect this guidance to have a significant impact on our financial statements.
In February 2015, the FASB issued accounting guidance that changes the analysis that reporting entities must perform to determine whether certain types of legal entities should be consolidated. Specifically, the amendments affect (a) limited partnerships and similar legal entities; (b) the consolidation analysis of reporting entities that are involved with variable interest entities, particularly those that have fee arrangements and related party relationships; and (c) certain investment funds. These amendments are effective for fiscal years, and for interim periods within those fiscal years, beginning after December 15, 2015. Early adoption is permitted, including adoption in an interim period. We are assessing the impact of these amendments on our financial statements, however we do not expect this guidance to have a significant impact on our financial statements.
In April and August 2015, the FASB issued accounting guidance that changes the balance sheet presentation of debt issuance costs (except for debt issuance costs related to line-of-credit arrangements). The guidance requires debt issuance costs relating to a recognized debt liability to be presented as a direct deduction from the carrying amount of the associated debt liability in the balance sheet. This new requirement will be effective for fiscal years beginning after December 15, 2015, and interim periods within those fiscal years, and is to be applied on a retrospective basis. We do not expect this guidance to have a significant impact on our financial statements.
In April 2015, the FASB issued accounting guidance that, among other things, provides for a practical expedient related to interim period remeasurements of defined benefit plan assets and obligations. The practical expedient permits entities to remeasure plan assets and obligations using the month-end that is closest to the date of the actual event. Disclosure of such election and related month-end remeasurement date is required. This guidance will be effective for fiscal years beginning after December 15, 2015, and interim periods within those fiscal years, and is to be applied prospectively. Early application is permitted. We do not expect this guidance to have a significant impact on our financial statements.
In April 2015, the FASB issued accounting guidance which clarifies the proper method of accounting for fees paid in a cloud computing arrangement. The guidance requires software licenses included in a cloud computing arrangement to be accounted for consistently with the acquisition of other software licenses. If a cloud computing arrangement does not include a software license, the arrangement should be accounted for as a service contract. This new requirement will be effective for annual periods, including interim periods within those annual periods, beginning after December 15, 2015. Early adoption is permitted. We do not expect this guidance to have a significant impact on our financial statements.
In May 2015, the FASB issued accounting guidance for which investments measured at net asset value per share (or its equivalent) using the practical expedient should no longer be categorized within the fair value hierarchy. Although removed from the fair value hierarchy, disclosure of the nature, risks and amount of investments for which fair value is measured using the practical expedient is still required. This guidance will be effective for fiscal years beginning after December 15, 2015, and interim periods within those fiscal years, and is to be applied on a retrospective basis. Early adoption is permitted. We do not expect this guidance to have a significant impact on our financial statements.
In July 2015, the FASB issued accounting guidance that requires inventory to be measured at the lower of cost and net realizable value. The scope of this guidance excludes inventory measured using the last-in first-out method or the retail inventory method. This new requirement will be effective for fiscal years beginning after December 15, 2016, including interim periods within those fiscal years, and is to be applied prospectively. Early application is permitted. We are assessing the impact of this new requirement on our financial statements.
In September 2015, the FASB issued accounting guidance that eliminates the requirement to retrospectively adjust prior period financial statements for measurement-period adjustments that occur in periods after a business combination is consummated. Measurement-period adjustments should continue to be calculated as if they were known at the acquisition date, but will now be recognized in the reporting period in which they are determined. The new guidance also requires that the acquirer present separately on the face of the income statement or disclose in the notes the amount recorded in current-period earnings, by line item, that would have been recorded in previous reporting periods if the adjustment to provisional amounts had been recognized as of the acquisition date. As allowed by the provisions of this new guidance, we early-adopted this new guidance in the third quarter of 2015. The adoption of this new guidance did not have a material impact on our consolidated financial statements.
In November 2015, the FASB issued accounting guidance that changes the balance sheet classification of deferred tax assets and liabilities. The guidance requires deferred tax assets and liabilities to be classified as noncurrent on the balance sheet, along with any related valuation allowance. As allowed by the provisions of this new guidance, we early-adopted this new
55
Albemarle Corporation and Subsidiaries | ||
guidance in the fourth quarter of 2015 on a prospective basis. Accordingly, deferred tax asset and liability amounts as of December 31, 2014 were not retrospectively adjusted.
In February 2016, the FASB issued accounting guidance that requires assets and liabilities arising from leases to be recorded on the balance sheet. Additional disclosures are required regarding the amount, timing, and uncertainty of cash flows from leases. This new guidance will be effective for fiscal years beginning after December 15, 2018, including interim periods within those fiscal years, and is to be applied using a modified retrospective approach. Early application is permitted. We have not evaluated the impact of the updated guidance on our consolidated financial statements.
Item 7A. | Quantitative and Qualitative Disclosures About Market Risk. |
The primary currencies to which we have foreign currency exchange rate exposure are the European Union Euro, Japanese Yen, Singapore Dollar, Chinese Renminbi, Australian Dollar, Chilean Peso and the British Pound Sterling. In response to greater fluctuations in foreign currency exchange rates in recent periods, we have increased the degree of exposure risk management activities to minimize the potential impact on earnings.
We manage our foreign currency exposures by balancing certain assets and liabilities denominated in foreign currencies and through the use, from time to time, of foreign currency forward contracts. The principal objective of such contracts is to minimize the financial impact of changes in foreign currency exchange rates. The counterparties to these contractual agreements are major financial institutions with which we generally have other financial relationships. We are exposed to credit loss in the event of nonperformance by these counterparties. However, we do not anticipate nonperformance by the counterparties. We do not utilize financial instruments for trading or other speculative purposes.
The primary method we use to reduce foreign currency exposure is to identify natural hedges, in which the operating activities denominated in respective currencies across various subsidiaries balance in respect to timing and the underlying exposures. In the event a natural hedge is not available, we may employ a forward contract to reduce exposure, generally expiring within one year. While these contracts are subject to fluctuations in value, such fluctuations are intended to offset the changes in the value of the underlying exposures being hedged. Unless otherwise noted, gains and losses on foreign currency forward contracts are recognized currently in income, and generally do not have a significant impact on results of operations.
At December 31, 2015, our financial instruments which are subject to foreign currency exchange risk consist of foreign currency forward contracts with an aggregate notional value of $217.7 million and with a fair value representing a net liability position of $0.3 million. Fluctuations in the value of these contracts are intended to offset the changes in the value of the underlying exposures being hedged. We conducted a sensitivity analysis on the fair value of our foreign currency hedge portfolio assuming an instantaneous 10% change in select foreign currency exchange rates from their levels as of December 31, 2015, with all other variables held constant. A 10% appreciation of the U.S. Dollar against foreign currencies that we hedge would result in a decrease of approximately $0.2 million in the fair value of our foreign currency forward contracts. A 10% depreciation of the U.S. Dollar against these foreign currencies would result in an increase of approximately $19.2 million in the fair value of our foreign currency forward contracts. The sensitivity of the fair value of our foreign currency hedge portfolio represents changes in fair values estimated based on market conditions as of December 31, 2015, without reflecting the effects of underlying anticipated transactions. When those anticipated transactions are realized, actual effects of changing foreign currency exchange rates could have a material impact on our earnings and cash flows in future periods.
On December 18, 2014, the carrying value of our 1.875% Euro-denominated senior notes was designated as an effective hedge of our net investment in foreign subsidiaries where the Euro serves as the functional currency, and beginning on the date of designation, gains or losses on the revaluation of these senior notes to our reporting currency have been and will be recorded in accumulated other comprehensive income (loss).
We are exposed to changes in interest rates that could impact our results of operations and financial condition. We manage global interest rate and foreign exchange exposure as part of our regular operational and financing strategies. We had variable interest rate borrowings of $1.7 billion and $392.3 million outstanding at December 31, 2015 and 2014, respectively. These borrowings represented 44% and 13% of total outstanding debt and bore average interest rates of 1.51% and 0.82% at December 31, 2015 and 2014, respectively. A hypothetical 10% increase (approximately 15 basis points) in the average interest rate applicable to these borrowings would change our annualized interest expense by approximately $2.6 million as of December 31, 2015. We may enter into interest rate swaps, collars or similar instruments with the objective of reducing interest rate volatility relating to our borrowing costs.
Our raw materials are subject to price volatility caused by weather, supply conditions, political and economic variables and other unpredictable factors. Historically, we have not used futures, options or swap contracts to manage the volatility
56
Albemarle Corporation and Subsidiaries | ||
related to the above exposures. However, the refinery catalysts business has used financing arrangements to provide long-term protection against changes in metals prices. We seek to limit our exposure by entering into long-term contracts when available, and we seek price increase limitations through contracts. These contracts do not have a significant impact on our results of operations.
57
Albemarle Corporation and Subsidiaries | ||
Item 8. Financial Statements and Supplementary Data.
MANAGEMENT’S REPORT ON INTERNAL CONTROL OVER FINANCIAL REPORTING
Our management is responsible for establishing and maintaining adequate internal control over financial reporting as defined in Exchange Act Rule 13a-15(f) and 15d-15(f). Our internal control over financial reporting is a process designed to provide reasonable assurance regarding the reliability of financial reporting and the preparation of financial statements for external purposes in accordance with accounting principles generally accepted in the United States. Our internal control over financial reporting includes those policies and procedures that (i) pertain to the maintenance of records that, in reasonable detail, accurately and fairly reflect the transactions and dispositions of assets; (ii) provide reasonable assurance that transactions are recorded as necessary to permit preparation of financial statements in accordance with accounting principles generally accepted in the United States, and that receipts and expenditures of the Company are being made only in accordance with management’s and our directors’ authorizations; and (iii) provide reasonable assurance regarding prevention or timely detection of unauthorized acquisition, use, or disposition of our assets that could have a material effect on the financial statements.
Under the supervision and with the participation of our management, including our principal executive officer and principal financial officer, we conducted an evaluation of the effectiveness of our internal control over financial reporting as of December 31, 2015. In making this assessment, management used the criteria for effective internal control over financial reporting described in the Internal Control—Integrated Framework 2013 set forth by the Committee of Sponsoring Organizations of the Treadway Commission (COSO). Based on the assessment, management concluded that, as of December 31, 2015, our internal control over financial reporting was effective to provide reasonable assurance regarding the reliability of financial reporting and the preparation of financial statements for external purposes in accordance with generally accepted accounting principles in the United States. The concept of reasonable assurance is based on the recognition that there are inherent limitations in all systems of internal control. Because of its inherent limitations, internal control over financial reporting may not prevent or detect misstatements. Also, projections of any evaluation of effectiveness to future periods are subject to the risk that controls may become inadequate because of changes in conditions, or that the degree of compliance with the policies or procedures may deteriorate.
Our management’s assessment of internal control over financial reporting as of December 31, 2015 excludes Rockwood Holdings, Inc. (“Rockwood”) because it was acquired by the Company in a purchase business combination during 2015. Rockwood is a wholly-owned subsidiary whose total assets and total net sales represent 31% and 39%, respectively, of the related consolidated financial statement amounts as of and for the year ended December 31, 2015.
The effectiveness of our internal control over financial reporting as of December 31, 2015 has been audited by PricewaterhouseCoopers LLP, an independent registered public accounting firm, as stated in their report which is included herein.
/S/ LUTHER C. KISSAM IV |
Luther C. Kissam IV |
President, Chief Executive Officer and Director |
(principal executive officer and principal financial officer) |
February 29, 2016 |
58
Albemarle Corporation and Subsidiaries | ||
Report of Independent Registered Public Accounting Firm
To the Board of Directors and Shareholders of Albemarle Corporation:
In our opinion, the accompanying consolidated financial statements listed in the index appearing under Item 15(a) (1) present fairly, in all material respects, the financial position of Albemarle Corporation and its subsidiaries (or the “Company”) at December 31, 2015 and December 31, 2014, and the results of their operations and their cash flows for each of the three years in the period ended December 31, 2015 in conformity with accounting principles generally accepted in the United States of America. Also in our opinion, the Company maintained, in all material respects, effective internal control over financial reporting as of December 31, 2015, based on criteria established in Internal Control—Integrated Framework 2013 issued by the Committee of Sponsoring Organizations of the Treadway Commission (COSO). The Company’s management is responsible for these financial statements, for maintaining effective internal control over financial reporting and for its assessment of the effectiveness of internal control over financial reporting, included in the accompanying Management’s Report on Internal Control over Financial Reporting. Our responsibility is to express opinions on these financial statements and on the Company’s internal control over financial reporting based on our integrated audits. We conducted our audits in accordance with the standards of the Public Company Accounting Oversight Board (United States). Those standards require that we plan and perform the audits to obtain reasonable assurance about whether the financial statements are free of material misstatement and whether effective internal control over financial reporting was maintained in all material respects. Our audits of the financial statements included examining, on a test basis, evidence supporting the amounts and disclosures in the financial statements, assessing the accounting principles used and significant estimates made by management, and evaluating the overall financial statement presentation. Our audit of internal control over financial reporting included obtaining an understanding of internal control over financial reporting, assessing the risk that a material weakness exists, and testing and evaluating the design and operating effectiveness of internal control based on the assessed risk. Our audits also included performing such other procedures as we considered necessary in the circumstances. We believe that our audits provide a reasonable basis for our opinions.
A company’s internal control over financial reporting is a process designed to provide reasonable assurance regarding the reliability of financial reporting and the preparation of financial statements for external purposes in accordance with generally accepted accounting principles. A company’s internal control over financial reporting includes those policies and procedures that (i) pertain to the maintenance of records that, in reasonable detail, accurately and fairly reflect the transactions and dispositions of the assets of the company; (ii) provide reasonable assurance that transactions are recorded as necessary to permit preparation of financial statements in accordance with generally accepted accounting principles, and that receipts and expenditures of the company are being made only in accordance with authorizations of management and directors of the company; and (iii) provide reasonable assurance regarding prevention or timely detection of unauthorized acquisition, use, or disposition of the company’s assets that could have a material effect on the financial statements.
Because of its inherent limitations, internal control over financial reporting may not prevent or detect misstatements. Also, projections of any evaluation of effectiveness to future periods are subject to the risk that controls may become inadequate because of changes in conditions, or that the degree of compliance with the policies or procedures may deteriorate.
As described in Management’s Report on Internal Control over Financial Reporting, management has excluded Rockwood Holdings, Inc. (or “Rockwood”) from its assessment of internal control over financial reporting as of December 31, 2015 because it was acquired by the Company in a purchase business combination during 2015. We have also excluded Rockwood from our audit of internal control over financial reporting. Rockwood is a wholly-owned subsidiary whose total assets and total net sales represent 31% and 39%, respectively, of the related consolidated financial statement amounts as of and for the year ended December 31, 2015.
/s/ PricewaterhouseCoopers LLP |
New Orleans, Louisiana |
February 29, 2016 |
59
Albemarle Corporation and Subsidiaries | ||
CONSOLIDATED STATEMENTS OF INCOME | ||
(In Thousands, Except Per Share Amounts) | |||||||||||
Year Ended December 31 | 2015 | 2014 | 2013 | ||||||||
Net sales | $ | 3,651,335 | $ | 2,445,548 | $ | 2,394,270 | |||||
Cost of goods sold | 2,454,463 | 1,674,700 | 1,543,799 | ||||||||
Gross profit | 1,196,872 | 770,848 | 850,471 | ||||||||
Selling, general and administrative expenses | 512,274 | 355,135 | 158,189 | ||||||||
Research and development expenses | 102,871 | 88,310 | 82,246 | ||||||||
Restructuring and other, net | (6,804 | ) | 25,947 | 33,361 | |||||||
Acquisition and integration related costs | 146,096 | 30,158 | — | ||||||||
Operating profit | 442,435 | 271,298 | 576,675 | ||||||||
Interest and financing expenses | (132,722 | ) | (41,358 | ) | (31,559 | ) | |||||
Other income (expenses), net | 48,474 | (16,761 | ) | (6,674 | ) | ||||||
Income from continuing operations before income taxes and equity in net income of unconsolidated investments | 358,187 | 213,179 | 538,442 | ||||||||
Income tax expense | 29,122 | 18,484 | 134,445 | ||||||||
Income from continuing operations before equity in net income of unconsolidated investments | 329,065 | 194,695 | 403,997 | ||||||||
Equity in net income of unconsolidated investments (net of tax) | 30,999 | 35,742 | 31,729 | ||||||||
Net income from continuing operations | 360,064 | 230,437 | 435,726 | ||||||||
(Loss) income from discontinued operations (net of tax) | — | (69,531 | ) | 4,108 | |||||||
Net income | 360,064 | 160,906 | 439,834 | ||||||||
Net income attributable to noncontrolling interests | (25,158 | ) | (27,590 | ) | (26,663 | ) | |||||
Net income attributable to Albemarle Corporation | $ | 334,906 | $ | 133,316 | $ | 413,171 | |||||
Basic earnings (loss) per share: | |||||||||||
Continuing operations | $ | 3.01 | $ | 2.57 | $ | 4.88 | |||||
Discontinued operations | — | (0.88 | ) | 0.05 | |||||||
$ | 3.01 | $ | 1.69 | $ | 4.93 | ||||||
Diluted earnings (loss) per share: | |||||||||||
Continuing operations | $ | 3.00 | $ | 2.57 | $ | 4.85 | |||||
Discontinued operations | — | (0.88 | ) | 0.05 | |||||||
$ | 3.00 | $ | 1.69 | $ | 4.90 | ||||||
Weighted-average common shares outstanding—basic | 111,182 | 78,696 | 83,839 | ||||||||
Weighted-average common shares outstanding—diluted | 111,556 | 79,102 | 84,322 | ||||||||
Cash dividends declared per share of common stock | $ | 1.16 | $ | 1.10 | $ | 0.96 | |||||
See accompanying notes to the consolidated financial statements.
60
Albemarle Corporation and Subsidiaries | ||
CONSOLIDATED STATEMENTS OF COMPREHENSIVE (LOSS) INCOME | ||
(In Thousands) | |||||||||||
Year Ended December 31 | 2015 | 2014 | 2013 | ||||||||
Net income | $ | 360,064 | $ | 160,906 | $ | 439,834 | |||||
Other comprehensive (loss) income, net of tax: | |||||||||||
Foreign currency translation | (412,999 | ) | (168,809 | ) | 31,704 | ||||||
Pension and postretirement benefits | (758 | ) | (487 | ) | (502 | ) | |||||
Net investment hedge | 50,861 | 11,384 | — | ||||||||
Interest rate swap | 2,101 | (20,962 | ) | — | |||||||
Other | 29 | 136 | 135 | ||||||||
Total other comprehensive (loss) income, net of tax | (360,766 | ) | (178,738 | ) | 31,337 | ||||||
Comprehensive (loss) income | (702 | ) | (17,832 | ) | 471,171 | ||||||
Comprehensive income attributable to noncontrolling interests | (23,267 | ) | (27,510 | ) | (27,019 | ) | |||||
Comprehensive (loss) income attributable to Albemarle Corporation | $ | (23,969 | ) | $ | (45,342 | ) | $ | 444,152 | |||
See accompanying notes to the consolidated financial statements.
61
Albemarle Corporation and Subsidiaries | ||
CONSOLIDATED BALANCE SHEETS | ||
(In Thousands) | |||||||
December 31 | 2015 | 2014 | |||||
Assets | |||||||
Current assets: | |||||||
Cash and cash equivalents | $ | 213,734 | $ | 2,489,768 | |||
Trade accounts receivable, less allowance for doubtful accounts (2015—$4,148; 2014—$1,563) | 552,828 | 385,212 | |||||
Other accounts receivable | 79,877 | 49,423 | |||||
Inventories | 508,728 | 358,361 | |||||
Other current assets | 71,351 | 66,086 | |||||
Assets held for sale | 404,485 | — | |||||
Total current assets | 1,831,003 | 3,348,850 | |||||
Property, plant and equipment, at cost | 3,881,162 | 2,620,670 | |||||
Less accumulated depreciation and amortization | 1,396,424 | 1,388,802 | |||||
Net property, plant and equipment | 2,484,738 | 1,231,868 | |||||
Investments | 455,417 | 194,042 | |||||
Other assets | 216,998 | 160,956 | |||||
Goodwill | 2,893,811 | 243,262 | |||||
Other intangibles, net of amortization | 1,733,047 | 44,125 | |||||
Total assets | $ | 9,615,014 | $ | 5,223,103 | |||
Liabilities and Equity | |||||||
Current liabilities: | |||||||
Accounts payable | $ | 306,517 | $ | 231,705 | |||
Accrued expenses | 402,379 | 166,174 | |||||
Current portion of long-term debt | 677,345 | 711,096 | |||||
Dividends payable | 32,306 | 21,458 | |||||
Liabilities held for sale | 128,706 | — | |||||
Income taxes payable | 69,432 | 9,453 | |||||
Total current liabilities | 1,616,685 | 1,139,886 | |||||
Long-term debt | 3,174,674 | 2,223,035 | |||||
Postretirement benefits | 49,647 | 56,424 | |||||
Pension benefits | 381,552 | 170,534 | |||||
Other noncurrent liabilities | 254,826 | 87,705 | |||||
Deferred income taxes | 736,317 | 56,884 | |||||
Commitments and contingencies (Note 17) | |||||||
Equity: | |||||||
Albemarle Corporation shareholders’ equity: | |||||||
Common stock, $.01 par value (authorized 150,000 shares), issued and outstanding — 112,219 in 2015 and 78,031 in 2014 | 1,122 | 780 | |||||
Additional paid-in capital | 2,059,151 | 10,447 | |||||
Accumulated other comprehensive loss | (421,288 | ) | (62,413 | ) | |||
Retained earnings | 1,615,407 | 1,410,651 | |||||
Total Albemarle Corporation shareholders’ equity | 3,254,392 | 1,359,465 | |||||
Noncontrolling interests | 146,921 | 129,170 | |||||
Total equity | 3,401,313 | 1,488,635 | |||||
Total liabilities and equity | $ | 9,615,014 | $ | 5,223,103 | |||
See accompanying notes to the consolidated financial statements.
62
Albemarle Corporation and Subsidiaries | ||
CONSOLIDATED STATEMENTS OF CHANGES IN EQUITY | ||
(In Thousands, Except Share Data) | |||||||||||||||||||||||||||||||
Common Stock | Additional Paid-in Capital | Accumulated Other Comprehensive Income (Loss) | Retained Earnings | Total Albemarle Shareholders’ Equity | Noncontrolling Interests | Total Equity | |||||||||||||||||||||||||
Shares | Amounts | ||||||||||||||||||||||||||||||
Balance at January 1, 2013 | 88,899,209 | $ | 889 | $ | 2,761 | $ | 85,264 | $ | 1,744,684 | $ | 1,833,598 | $ | 98,410 | $ | 1,932,008 | ||||||||||||||||
Net income | 413,171 | 413,171 | 26,663 | 439,834 | |||||||||||||||||||||||||||
Other comprehensive income | 30,981 | 30,981 | 356 | 31,337 | |||||||||||||||||||||||||||
Cash dividends declared | (79,833 | ) | (79,833 | ) | (10,014 | ) | (89,847 | ) | |||||||||||||||||||||||
Stock-based compensation and other | 9,072 | 9,072 | 9,072 | ||||||||||||||||||||||||||||
Exercise of stock options | 191,732 | 2 | 5,551 | 5,553 | 5,553 | ||||||||||||||||||||||||||
Shares repurchased | (9,198,056 | ) | (92 | ) | (4,542 | ) | (577,664 | ) | (582,298 | ) | (582,298 | ) | |||||||||||||||||||
Tax benefit related to stock plans | 3,266 | 3,266 | 3,266 | ||||||||||||||||||||||||||||
Issuance of common stock, net | 256,834 | 3 | (3 | ) | — | — | |||||||||||||||||||||||||
Shares withheld for withholding taxes associated with common stock issuances | (96,877 | ) | (1 | ) | (6,148 | ) | (6,149 | ) | (6,149 | ) | |||||||||||||||||||||
Balance at December 31, 2013 | 80,052,842 | $ | 801 | $ | 9,957 | $ | 116,245 | $ | 1,500,358 | $ | 1,627,361 | $ | 115,415 | $ | 1,742,776 | ||||||||||||||||
Balance at January 1, 2014 | 80,052,842 | $ | 801 | $ | 9,957 | $ | 116,245 | $ | 1,500,358 | $ | 1,627,361 | $ | 115,415 | $ | 1,742,776 | ||||||||||||||||
Net income | 133,316 | 133,316 | 27,590 | 160,906 | |||||||||||||||||||||||||||
Other comprehensive loss | (178,658 | ) | (178,658 | ) | (80 | ) | (178,738 | ) | |||||||||||||||||||||||
Cash dividends declared | (86,364 | ) | (86,364 | ) | (15,535 | ) | (101,899 | ) | |||||||||||||||||||||||
Noncontrolling interests’ share of contributed capital in subsidiary | — | 1,780 | 1,780 | ||||||||||||||||||||||||||||
Stock-based compensation and other | 13,556 | 13,556 | 13,556 | ||||||||||||||||||||||||||||
Exercise of stock options | 77,546 | 1 | 2,712 | 2,713 | 2,713 | ||||||||||||||||||||||||||
Shares repurchased | (2,190,254 | ) | (22 | ) | (13,319 | ) | (136,659 | ) | (150,000 | ) | (150,000 | ) | |||||||||||||||||||
Tax benefit related to stock plans | 826 | 826 | 826 | ||||||||||||||||||||||||||||
Issuance of common stock, net | 141,937 | 1 | (1 | ) | — | — | |||||||||||||||||||||||||
Shares withheld for withholding taxes associated with common stock issuances | (51,547 | ) | (1 | ) | (3,284 | ) | (3,285 | ) | (3,285 | ) | |||||||||||||||||||||
Balance at December 31, 2014 | 78,030,524 | $ | 780 | $ | 10,447 | $ | (62,413 | ) | $ | 1,410,651 | $ | 1,359,465 | $ | 129,170 | $ | 1,488,635 | |||||||||||||||
Balance at January 1, 2015 | 78,030,524 | $ | 780 | $ | 10,447 | $ | (62,413 | ) | $ | 1,410,651 | $ | 1,359,465 | $ | 129,170 | $ | 1,488,635 | |||||||||||||||
Net income | 334,906 | 334,906 | 25,158 | 360,064 | |||||||||||||||||||||||||||
Other comprehensive loss | (358,875 | ) | (358,875 | ) | (1,891 | ) | (360,766 | ) | |||||||||||||||||||||||
Cash dividends declared | (130,150 | ) | (130,150 | ) | (23,286 | ) | (153,436 | ) | |||||||||||||||||||||||
Stock-based compensation and other | 13,696 | 13,696 | 13,696 | ||||||||||||||||||||||||||||
Exercise of stock options | 18,000 | — | 517 | 517 | 517 | ||||||||||||||||||||||||||
Tax deficiency related to stock plans | (167 | ) | (167 | ) | (167 | ) | |||||||||||||||||||||||||
Issuance of common stock, net | 85,900 | 1 | (1 | ) | — | — | |||||||||||||||||||||||||
Acquisition of Rockwood | 34,113,064 | 341 | 2,036,209 | 2,036,550 | 17,582 | 2,054,132 | |||||||||||||||||||||||||
Noncontrolling interest assumed in acquisition of Shanghai Chemetall | — | 4,843 | 4,843 | ||||||||||||||||||||||||||||
Purchase of noncontrolling interest | — | (4,655 | ) | (4,655 | ) | ||||||||||||||||||||||||||
Shares withheld for withholding taxes associated with common stock issuances | (28,137 | ) | — | (1,550 | ) | (1,550 | ) | (1,550 | ) | ||||||||||||||||||||||
Balance at December 31, 2015 | 112,219,351 | $ | 1,122 | $ | 2,059,151 | $ | (421,288 | ) | $ | 1,615,407 | $ | 3,254,392 | $ | 146,921 | $ | 3,401,313 | |||||||||||||||
See accompanying notes to the consolidated financial statements.
63
Albemarle Corporation and Subsidiaries | ||
CONSOLIDATED STATEMENTS OF CASH FLOWS | ||
(In Thousands) | |||||||||||
Year Ended December 31 | 2015 | 2014 | 2013 | ||||||||
Cash and cash equivalents at beginning of year | $ | 2,489,768 | $ | 477,239 | $ | 477,696 | |||||
Cash flows from operating activities: | |||||||||||
Net income | 360,064 | 160,906 | 439,834 | ||||||||
Adjustments to reconcile net income to cash flows from operating activities: | |||||||||||
Depreciation and amortization | 260,076 | 103,572 | 107,370 | ||||||||
(Gain) loss associated with restructuring and other | (6,804 | ) | 6,333 | — | |||||||
Loss on disposal of businesses | — | 85,515 | — | ||||||||
Stock-based compensation | 15,188 | 14,267 | 10,164 | ||||||||
Excess tax benefits realized from stock-based compensation arrangements | (121 | ) | (826 | ) | (3,266 | ) | |||||
Equity in net income of unconsolidated investments (net of tax) | (30,999 | ) | (35,742 | ) | (31,729 | ) | |||||
Dividends received from unconsolidated investments and nonmarketable securities | 59,912 | 40,688 | 21,632 | ||||||||
Pension and postretirement (benefit) expense | (38,817 | ) | 133,681 | (132,707 | ) | ||||||
Pension and postretirement contributions | (21,613 | ) | (13,916 | ) | (13,294 | ) | |||||
Unrealized gain on investments in marketable securities | (1,239 | ) | (825 | ) | (3,681 | ) | |||||
Deferred income taxes | (136,298 | ) | (64,947 | ) | 64,865 | ||||||
Changes in current assets and liabilities, net of effects of acquisitions and divestitures: | |||||||||||
(Increase) decrease in accounts receivable | (8,788 | ) | 36,221 | (65,906 | ) | ||||||
Decrease (increase) in inventories | 27,649 | (6,486 | ) | (1,810 | ) | ||||||
Decrease in other current assets excluding deferred income taxes | 12,756 | 5,809 | 5,261 | ||||||||
Increase in accounts payable | 23,745 | 28,296 | 19,267 | ||||||||
(Decrease) increase in accrued expenses and income taxes payable | (96,896 | ) | (6,680 | ) | 12,185 | ||||||
Other, net | (57,126 | ) | 6,743 | 4,674 | |||||||
Net cash provided by operating activities | 360,689 | 492,609 | 432,859 | ||||||||
Cash flows from investing activities: | |||||||||||
Acquisition of Rockwood, net of cash acquired | (2,051,645 | ) | — | — | |||||||
Other acquisitions, net of cash acquired | (48,845 | ) | — | — | |||||||
Capital expenditures | (227,649 | ) | (110,576 | ) | (155,346 | ) | |||||
Decrease in restricted cash | 57,550 | — | — | ||||||||
Cash payments related to acquisitions and other | — | — | (2,565 | ) | |||||||
Cash proceeds from divestitures, net | 8,883 | 104,718 | — | ||||||||
Return of capital from unconsolidated investment | 98,000 | — | — | ||||||||
Payment for settlement of interest rate swap | — | (33,425 | ) | — | |||||||
Sales of marketable securities, net | 998 | 649 | 169 | ||||||||
Repayments from (long-term advances to) joint ventures | 2,156 | (7,499 | ) | — | |||||||
Net cash used in investing activities | (2,160,552 | ) | (46,133 | ) | (157,742 | ) | |||||
Cash flows from financing activities: | |||||||||||
Proceeds from issuance of senior notes | — | 1,888,197 | — | ||||||||
Proceeds from borrowings of other long-term debt | 2,250,000 | — | 117,000 | ||||||||
Repayments of long-term debt | (2,626,241 | ) | (6,017 | ) | (135,733 | ) | |||||
Other borrowings (repayments), net | 54,625 | (5,825 | ) | 398,544 | |||||||
Dividends paid to shareholders | (119,302 | ) | (84,102 | ) | (78,107 | ) | |||||
Dividends paid to noncontrolling interests | (23,286 | ) | (15,535 | ) | (10,014 | ) | |||||
Purchase of noncontrolling interest | (4,784 | ) | — | — | |||||||
Repurchases of common stock | — | (150,000 | ) | (582,298 | ) | ||||||
Proceeds from exercise of stock options | 517 | 2,713 | 5,553 | ||||||||
Excess tax benefits realized from stock-based compensation arrangements | 121 | 826 | 3,266 | ||||||||
Withholding taxes paid on stock-based compensation award distributions | (1,549 | ) | (3,284 | ) | (6,149 | ) | |||||
Debt financing costs | (4,544 | ) | (17,644 | ) | (108 | ) | |||||
Other | (3,882 | ) | — | — | |||||||
Net cash (used in) provided by financing activities | (478,325 | ) | 1,609,329 | (288,046 | ) | ||||||
Net effect of foreign exchange on cash and cash equivalents | 2,154 | (43,276 | ) | 12,472 | |||||||
(Decrease) increase in cash and cash equivalents | (2,276,034 | ) | 2,012,529 | (457 | ) | ||||||
Cash and cash equivalents at end of year | $ | 213,734 | $ | 2,489,768 | $ | 477,239 | |||||
See accompanying notes to the consolidated financial statements.
64
Albemarle Corporation and Subsidiaries | ||
NOTES TO THE CONSOLIDATED FINANCIAL STATEMENTS | ||
NOTE 1—Summary of Significant Accounting Policies:
Basis of Consolidation
The consolidated financial statements include the accounts and operations of Albemarle Corporation and our wholly owned, majority owned and controlled subsidiaries. Unless the context otherwise indicates, the terms “Albemarle,” “we,” “us,” “our” or “the Company” mean Albemarle Corporation and our consolidated subsidiaries. We apply the equity method of accounting for investments in which we have an ownership interest from 20% to 50% or where we exercise significant influence over the related investee’s operations. All significant intercompany accounts and transactions are eliminated in consolidation.
As described further in Note 2, “Acquisitions,” we completed our acquisition of Rockwood Holdings, Inc. (“Rockwood”) on January 12, 2015. The consolidated financial statements contained herein include the results of operations of Rockwood, commencing on January 13, 2015.
Organizational Realignment
As a result of the Rockwood acquisition, in 2015 we realigned our organizational structure under three reportable segments: Performance Chemicals, Refining Solutions and Chemetall Surface Treatment. Throughout this document, including these consolidated financial statements and related footnotes, current and prior year financial information is presented in accordance with this structure.
Discontinued Operations
Effective January 1, 2015, a component or group of components that is classified as held for sale or that has been disposed of by sale, and which represents a strategic shift that has or will have a major effect on our operations and financial results, is reported as discontinued operations beginning in the period when these criteria are met. Our assets and liabilities held for sale at December 31, 2015 did not meet the criteria to be presented as discontinued operations.
On September 1, 2014, the Company closed the sale of its antioxidant, ibuprofen and propofol businesses and assets to SI Group, Inc. In accordance with the accounting guidance for discontinued operations in effect prior to January 1, 2015, the financial results of this disposed group were presented as discontinued operations in the consolidated statements of income and excluded from segment results for 2014 and 2013. See Note 3, “Divestitures” for additional information.
Estimates, Assumptions and Reclassifications
The preparation of financial statements in conformity with generally accepted accounting principles (“GAAP”) in the United States (“U.S.”) requires management to make estimates and assumptions that affect the reported amounts of revenues, expenses, assets and liabilities and disclosure of contingent assets and liabilities at the date of the financial statements. Actual results could differ from those estimates.
Certain amounts in the accompanying consolidated financial statements and notes thereto have been reclassified to conform to the current presentation.
Revenue Recognition
We recognize sales when the revenue is realized or realizable, and has been earned, in accordance with authoritative accounting guidance. We recognize net sales as risk and title to the product transfer to the customer, which usually occurs at the time shipment is made. Significant portions of our sales are sold free on board shipping point or on an equivalent basis, and other transactions are based upon specific contractual arrangements. Our standard terms of delivery are generally included in our contracts of sale, order confirmation documents and invoices. We recognize revenue from services when performance of the services has been completed. Where the Company incurs pre-production design and development costs under long-term supply contracts, these costs are expensed where they relate to the products sold unless contractual guarantees for reimbursement exist. Conversely, these costs are capitalized if they pertain to equipment that we will own and use in producing the products to be supplied and expect to utilize for future revenue generating activities.
Performance and Life Cycle Guarantees
We provide customers certain performance guarantees and life cycle guarantees. These guarantees entitle the customer to claim compensation if the product does not conform to performance standards originally agreed upon. Performance guarantees relate to minimum technical specifications that products produced with the delivered product must meet, such as yield and
65
Albemarle Corporation and Subsidiaries | ||
NOTES TO THE CONSOLIDATED FINANCIAL STATEMENTS | ||
product quality. Life cycle guarantees relate to minimum periods for which performance of the delivered product is guaranteed. When either performance guarantees or life cycle guarantees are contractually agreed upon, an assessment of the appropriate revenue recognition treatment is evaluated. When testing or modeling of historical results predict that the performance or life cycle criteria will be satisfied, revenue is recognized in accordance with shipping terms at the time of delivery. When testing or modeling of historical results predict that the performance or life cycle criteria may not be satisfied, we bill the customer upon shipment and defer the related revenue and cost associated with these products. These deferrals are released to earnings when the contractual period expires, and are generally not significant.
Shipping and Handling Costs
Amounts billed to customers in a sales transaction related to shipping and handling have been classified as net sales and the cost incurred by us for shipping and handling has been classified as cost of goods sold in the accompanying consolidated statements of income. In addition, taxes billed to customers in a sales transaction are presented in the consolidated statements of income on a net basis.
Cash and Cash Equivalents
Cash and cash equivalents include cash and highly liquid investments with insignificant interest rate risks and original maturities of three months or less.
Inventories
Inventories are stated at lower of cost or market with cost determined primarily on the first-in, first-out basis. Cost is determined on the weighted-average basis for a small portion of our inventories at foreign plants and our stores, supplies and other inventory. A portion of our domestic produced finished goods and raw materials are determined on the last-in, first-out basis.
Property, Plant and Equipment
Property, plant and equipment include costs of assets constructed, purchased or leased under a capital lease, related delivery and installation costs and interest incurred on significant capital projects during their construction periods. Expenditures for renewals and betterments also are capitalized, but expenditures for normal repairs and maintenance are expensed as incurred. Costs associated with yearly planned major maintenance are deferred and amortized over 12 months or until the same major maintenance activities must be repeated, whichever is shorter. The cost and accumulated depreciation applicable to assets retired or sold are removed from the respective accounts, and gains or losses thereon are included in income.
We assign the useful lives of our property, plant and equipment based upon our internal engineering estimates which are reviewed periodically. The estimated useful lives of our property, plant and equipment range from two to sixty years and depreciation is recorded on the straight-line method, with the exception of our long-term mineral rights, which are depleted on a units-of-production method.
We evaluate the recovery of our property, plant and equipment by comparing the net carrying value of the asset group to the undiscounted net cash flows expected to be generated from the use and eventual disposition of that asset group when events or changes in circumstances indicate that its carrying amount may not be recoverable. If the carrying amount of the asset group is not recoverable, the fair value of the asset group is measured and if the carrying amount exceeds the fair value, an impairment loss is recognized.
Investments
Investments are accounted for using the equity method of accounting if the investment gives us the ability to exercise significant influence, but not control, over the investee. Significant influence is generally deemed to exist if we have an ownership interest in the voting stock of the investee between 20% and 50%, although other factors, such as representation on the investee’s board of directors and the impact of commercial arrangements, are considered in determining whether the equity method of accounting is appropriate. Under the equity method of accounting, we record our investments in equity-method investees in the consolidated balance sheets as Investments and our share of investees’ earnings or losses together with other-than temporary impairments in value as Equity in net income of unconsolidated investments in the consolidated statements of income.
Certain mutual fund investments are accounted for as trading equities and are marked-to-market on a monthly basis through the consolidated statements of income. Investments in joint ventures and nonmarketable securities of immaterial
66
Albemarle Corporation and Subsidiaries | ||
NOTES TO THE CONSOLIDATED FINANCIAL STATEMENTS | ||
entities are estimated based upon the overall performance of the entity where financial results are not available on a timely basis.
Environmental Compliance and Remediation
Environmental compliance costs include the cost of purchasing and/or constructing assets to prevent, limit and/or control pollution or to monitor the environmental status at various locations. These costs are capitalized and depreciated based on estimated useful lives. Environmental compliance costs also include maintenance and operating costs with respect to pollution prevention and control facilities and other administrative costs. Such operating costs are expensed as incurred. Environmental remediation costs of facilities used in current operations are generally immaterial and are expensed as incurred. We accrue for environmental remediation costs and post-remediation costs that relate to existing conditions caused by past operations at facilities or off-plant disposal sites in the accounting period in which responsibility is established and when the related costs are estimable. In developing these cost estimates, we evaluate currently available facts regarding each site, with consideration given to existing technology, presently enacted laws and regulations, prior experience in remediation of contaminated sites, the financial capability of other potentially responsible parties and other factors, subject to uncertainties inherent in the estimation process. If the amount and timing of the cash payments for a site are fixed or reliably determinable, the liability is discounted. Additionally, these estimates are reviewed periodically, with adjustments to the accruals recorded as necessary.
Research and Development Expenses
Our research and development expenses related to present and future products are expensed as incurred. These expenses consist primarily of personnel-related costs and other overheads, as well as outside service and consulting costs incurred for specific programs. Our U.S. facilities in Michigan, Pennsylvania, Texas and Louisiana and our global facilities in the Netherlands, Germany, Belgium, China and Korea form the capability base for our contract research and custom manufacturing businesses. These business areas provide research and scale-up services primarily to innovative life science companies.
Goodwill and Other Intangible Assets
We account for goodwill and other intangibles acquired in a business combination in conformity with current accounting guidance that requires that goodwill and indefinite-lived intangible assets not be amortized.
We test goodwill for impairment by comparing the estimated fair value of our reporting units to the related carrying value. We estimate the fair value based on present value techniques involving future cash flows. Future cash flows include assumptions about sales volumes, selling prices, raw material prices, labor and other employee benefit costs, capital additions, income taxes, working capital, and other economic or market-related factors. Significant management judgment is involved in estimating these variables and they include inherent uncertainties since they are forecasting future events. We perform a sensitivity analysis by using a range of inputs to confirm the reasonableness of these estimates being used in the goodwill impairment analysis. We use a Weighted Average Cost of Capital (“WACC”) approach to determine our discount rate for goodwill recoverability testing. Our WACC calculation incorporates industry-weighted average returns on debt and equity from a market perspective. The factors in this calculation are largely external to the Company and, therefore, are beyond our control. We test our recorded goodwill for impairment in the fourth quarter of each year or upon the occurrence of events or changes in circumstances that would more likely than not reduce the fair value of our reporting units below their carrying amounts. The Company performed its annual goodwill impairment test as of October 31, 2015 and concluded there was no impairment as of that date. In addition, no indications of impairment in any of our reporting units were indicated by the sensitivity analysis.
We assess our indefinite-lived intangible assets, which include trade names and in-progress research and development, for impairment annually and between annual tests if events or changes in circumstances indicate that it is more likely than not that the asset is impaired. The indefinite-lived intangible asset impairment standard allows us to first to assess qualitative factors to determine if a quantitative impairment test is necessary. Further testing is only required if we determine, based on the qualitative assessment, that it is more likely than not that the indefinite-lived intangible asset’s fair value is less than its carrying amount. If we determine based on the qualitative assessment that it is more likely than not that the asset is impaired, an impairment test is performed by comparing the fair value of the indefinite-lived intangible asset to its carrying amount.
Definite-lived intangible assets, such as purchased technology, patents, customer lists and trade names, are amortized over their estimated useful lives generally for periods ranging from five to twenty-five years. Except for customer lists and relationships associated with our Lithium business and Chemetall Surface Treatment segment, which are amortized using the pattern of economic benefit method, definite-lived intangible assets are amortized using the straight-line method. We evaluate the recovery of our definite-lived intangible assets by comparing the net carrying value of the asset group to the undiscounted net cash flows expected to be generated from the use and eventual disposition of that asset group when events or changes in circumstances indicate that its carrying amount may not be recoverable. If the carrying amount of the asset group is not
67
Albemarle Corporation and Subsidiaries | ||
NOTES TO THE CONSOLIDATED FINANCIAL STATEMENTS | ||
recoverable, the fair value of the asset group is measured and if the carrying amount exceeds the fair value, an impairment loss is recognized. See Note 12, “Goodwill and Other Intangibles.”
Pension Plans and Other Postretirement Benefits
Under authoritative accounting standards, assumptions are made regarding the valuation of benefit obligations and the performance of plan assets. As required, we recognize a balance sheet asset or liability for each of our pension and other postretirement benefit (“OPEB”) plans equal to the plan’s funded status as of the measurement date. The primary assumptions are as follows:
• | Discount Rate—The discount rate is used in calculating the present value of benefits, which is based on projections of benefit payments to be made in the future. |
• | Expected Return on Plan Assets—We project the future return on plan assets based on prior performance and future expectations for the types of investments held by the plans, as well as the expected long-term allocation of plan assets for these investments. These projected returns reduce the net benefit costs recorded currently. |
• | Rate of Compensation Increase—For salary-related plans, we project employees’ annual pay increases, which are used to project employees’ pension benefits at retirement. |
• | Mortality Assumptions—Assumptions about life expectancy of plan participants are used in the measurement of related plan obligations. |
Actuarial gains and losses are recognized annually in our consolidated statements of income in the fourth quarter and whenever a plan is determined to qualify for a remeasurement during a fiscal year. The remaining components of pension and OPEB plan expense, primarily service cost, interest cost and expected return on assets, are recorded on a quarterly basis. The market-related value of assets equals the actual market value as of the date of measurement.
During 2015, we made changes to assumptions related to discount rates and expected rates of return on plan assets. We consider available information that we deem relevant when selecting each of these assumptions.
In selecting the discount rates for the U.S. plans, we consider expected benefit payments on a plan-by-plan basis. As a result, the Company uses different discount rates for each plan depending on the demographics of participants and the expected timing of benefit payments. For 2015, the discount rates were calculated using the results from a bond matching technique developed by Milliman, which matched the future estimated annual benefit payments of each respective plan against a portfolio of bonds of high quality to determine the discount rate. We believe our selected discount rates are determined using preferred methodology under authoritative accounting guidance and accurately reflect market conditions as of the December 31, 2015 measurement date.
In selecting the discount rates for the foreign plans, we look at long-term yields on AA-rated corporate bonds when available. Our actuaries have developed yield curves based on the yields on the constituent bonds in the various indices as well as on other market indicators such as swap rates, particularly at the longer durations. For the Eurozone, we apply the Aon Hewitt yield curve to projected cash flows from the relevant plans to derive the discount rate. For the UK, the discount rate is determined by applying the Aon Hewitt yield curve for typical schemes of similar duration to projected cash flows of Albemarle’s UK plan. In other countries where there is not a sufficiently deep market of high-quality corporate bonds, we set the discount rate by referencing the yield on government bonds of an appropriate duration.
In estimating the expected return on plan assets, we consider past performance and future expectations for the types of investments held by the plan as well as the expected long-term allocation of plan assets to these investments. In projecting the rate of compensation increase, we consider past experience in light of movements in inflation rates.
In October 2014, the Society of Actuaries (“SOA”) published updated mortality tables which reflect increased life expectancy. We revised our mortality assumptions to incorporate the new set of mortality tables issued by the SOA for purposes of measuring our U.S. pension and OPEB obligations at December 31, 2014. Further, the SOA released an updated Mortality Improvement Scale, MP-2015, on October 8, 2015. The updated improvement scale incorporates two additional years of mortality data and reflects a trend toward somewhat smaller improvements in longevity. In addition, the SOA released a set of factors to adjust the RP-2014 Mortality Tables to base year 2006. We revised our mortality assumption to incorporate these updated mortality improvements for purposes of measuring our U.S. pension and OPEB obligations at December 31, 2015.
68
Albemarle Corporation and Subsidiaries | ||
NOTES TO THE CONSOLIDATED FINANCIAL STATEMENTS | ||
Employee Savings Plans
Certain of our employees participate in our defined contribution 401(k) employee savings plan, which is generally available to all U.S. full-time salaried and non-union hourly employees and to employees who are covered by a collective bargaining agreement that provides for such participation. Additionally, the Company sponsors various defined contribution plans for certain employees at foreign locations, the most significant of which is a plan in the Netherlands similar to a collective defined contribution plan.
Deferred Compensation Plan
We maintain an Executive Deferred Compensation Plan (“EDCP”) that was adopted in 2001 and subsequently amended. The purpose of the EDCP is to provide current tax planning opportunities as well as supplemental funds upon the retirement or death of certain of our employees. The EDCP is intended to aid in attracting and retaining employees of exceptional ability by providing them with these benefits. We also maintain a Benefit Protection Trust (the “Trust”) that was created to provide a source of funds to assist in meeting the obligations of the EDCP, subject to the claims of our creditors in the event of our insolvency. Assets of the Trust are consolidated in accordance with authoritative guidance. The assets of the Trust consist primarily of mutual fund investments (which are accounted for as trading securities and are marked-to-market on a monthly basis through the consolidated statements of income) and cash and cash equivalents.
Stock-based Compensation Expense
The fair value of restricted stock awards, restricted stock unit awards and performance unit awards with a service condition are determined based on the number of shares or units granted and the quoted price of our common stock on the date of grant, and the fair value of stock options is determined using the Black-Scholes valuation model. The fair value of performance unit awards with a service condition and a market condition are estimated on the date of grant using a Monte Carlo simulation model. The fair value of these awards is determined after giving effect to estimated forfeitures. Such value is recognized as expense over the service period, which is generally the vesting period of the equity grant. To the extent restricted stock awards, restricted stock unit awards, performance unit awards and stock options are forfeited prior to vesting in excess of the estimated forfeiture rate, the corresponding previously recognized expense is reversed as an offset to operating expenses.
Income Taxes
We use the liability method for determining our income taxes, under which current and deferred tax liabilities and assets are recorded in accordance with enacted tax laws and rates. Under this method, the amounts of deferred tax liabilities and assets at the end of each period are determined using the tax rate expected to be in effect when taxes are actually paid or recovered. Future tax benefits are recognized to the extent that realization of such benefits is more likely than not. In order to record deferred tax assets and liabilities, we are following guidance under ASU 2015-17, which requires deferred tax assets and liabilities to be classified as noncurrent on the balance sheet, along with any related valuation allowance.
Deferred income taxes are provided for the estimated income tax effect of temporary differences between the financial statement carrying amounts and the tax basis of existing assets and liabilities. Deferred tax assets are also provided for operating losses, capital losses and certain tax credit carryovers. A valuation allowance, reducing deferred tax assets, is established when it is more likely than not that some portion or all of the deferred tax assets will not be realized. The realization of such deferred tax assets is dependent upon the generation of sufficient future taxable income of the appropriate character. Although realization is not assured, we do not establish a valuation allowance when we believe it is more likely than not that a net deferred tax asset will be realized.
We only recognize a tax benefit after concluding that it is more likely than not that the benefit will be sustained upon audit by the respective taxing authority based solely on the technical merits of the associated tax position. Once the recognition threshold is met, we recognize a tax benefit measured as the largest amount of the tax benefit that, in our judgment, is greater than 50% likely to be realized. Under current accounting guidance for uncertain tax positions, interest and penalties related to income tax liabilities are included in Income tax expense on the consolidated statements of income.
We have designated the undistributed earnings of substantially all of our foreign operations as indefinitely invested and as a result we do not provide for deferred income taxes on the unremitted earnings of these subsidiaries. If it is determined that cash can be repatriated with little to no tax consequences, we may choose to repatriate cash at that time. Our foreign earnings are computed under U.S. federal tax earnings and profits, or E&P, principles. In general, to the extent our financial reporting book basis over tax basis of a foreign subsidiary exceeds these E&P amounts, deferred taxes have not been provided as they are essentially permanent in duration. The determination of the amount of such unrecognized deferred tax liability is not
69
Albemarle Corporation and Subsidiaries | ||
NOTES TO THE CONSOLIDATED FINANCIAL STATEMENTS | ||
practicable. We provide for deferred income taxes on our undistributed earnings of foreign operations that are not deemed to be indefinitely invested.
Accumulated Other Comprehensive (Loss) Income
Accumulated other comprehensive (loss) income is comprised principally of foreign currency translation adjustments, amounts related to the revaluation of our euro-denominated senior notes which were designated as a hedge of our net investment in foreign operations in 2014, a realized loss on a forward starting interest rate swap entered into in 2014 which was designated as a cash flow hedge, and deferred income taxes related to the aforementioned items.
Foreign Currency Translation
The assets and liabilities of all foreign subsidiaries were prepared in their respective functional currencies and translated into U.S. Dollars based on the current exchange rate in effect at the balance sheet dates, while income and expenses were translated at average exchange rates for the periods presented. Translation adjustments are reflected as a separate component of equity.
Foreign exchange transaction gains (losses) were $51.8 million, ($3.7) million and ($10.6) million for the years ended December 31, 2015, 2014 and 2013, respectively, and are included in Other income (expenses), net, in our consolidated statements of income, with the unrealized portion included in Other, net, in our consolidated statements of cash flows. The gains in 2015 are primarily related to cash denominated in U.S. Dollars held by foreign subsidiaries where the European Union Euro serves as the functional currency.
Derivative Financial Instruments
We manage our foreign currency exposures by balancing certain assets and liabilities denominated in foreign currencies and through the use of foreign currency forward contracts from time to time, which generally expire within one year. The principal objective of such contracts is to minimize the financial impact of changes in foreign currency exchange rates. While these contracts are subject to fluctuations in value, such fluctuations are generally expected to be offset by changes in the value of the underlying foreign currency exposures being hedged. Unless otherwise noted, gains and losses on foreign currency forward contracts are recognized currently in Other income (expenses), net, and generally do not have a significant impact on results of operations.
We may also enter into interest rate swaps, collars or similar instruments from time to time, with the objective of reducing interest rate volatility relating to our borrowing costs.
The counterparties to these contractual agreements are major financial institutions with which we generally have other financial relationships. We are exposed to credit loss in the event of nonperformance by these counterparties. However, we do not anticipate nonperformance by the counterparties. We do not utilize financial instruments for trading or other speculative purposes. Our foreign currency forward contracts outstanding at December 31, 2015 and 2014 have not been designated as hedging instruments under Accounting Standards Codification (“ASC”) 815, Derivatives and Hedging.
Recently Issued Accounting Pronouncements
In April 2014, the Financial Accounting Standards Board (“FASB”) issued accounting guidance that changed the criteria for reporting discontinued operations and modified related disclosure requirements to provide users of financial statements with more information about the assets, liabilities, revenues and expenses of discontinued operations. The guidance modified the definition of discontinued operations by limiting its scope to disposals of components of an entity that represent strategic shifts that have (or will have) a major effect on an entity’s operations and financial results. Additionally, these new requirements require entities to disclose the pretax profit or loss related to disposals of significant components that do not qualify as discontinued operations. These new requirements became effective on January 1, 2015. Refer to Note 3, “Divestitures” for additional information.
In May 2014, the FASB issued accounting guidance designed to enhance comparability of revenue recognition practices across entities, industries, jurisdictions and capital markets. The core principle of the guidance is that revenue recognized from a transaction or event that arises from a contract with a customer should reflect the consideration to which an entity expects to be entitled in exchange for goods or services provided. To achieve that core principle the new guidance sets forth a five-step revenue recognition model that will need to be applied consistently to all contracts with customers, except those that are within the scope of other topics in the ASC. Also required are new disclosures to help users of financial statements better understand the nature, amount, timing and uncertainty of revenues and cash flows from contracts with customers. The new disclosures
70
Albemarle Corporation and Subsidiaries | ||
NOTES TO THE CONSOLIDATED FINANCIAL STATEMENTS | ||
include qualitative and quantitative information about contracts with customers, significant judgments made in applying the revenue guidance, and assets recognized related to the costs to obtain or fulfill a contract. These new requirements become effective for annual and interim reporting periods beginning after December 15, 2017. Early adoption is permitted for annual and interim reporting periods beginning after December 15, 2016. We are assessing the impact of these new requirements on our financial statements.
In June 2014, the FASB issued accounting guidance which clarifies the proper method of accounting for share-based payments when the terms of an award provide that a performance target could be achieved after the requisite service period. The accounting guidance requires that a performance target that affects vesting and that could be achieved after the requisite service period be treated as a performance condition. The performance target should not be reflected in estimating the grant-date fair value of the award. Compensation cost should be recognized in the period in which it becomes probable that the performance target will be achieved and should represent the compensation cost attributable to the period(s) for which the requisite service has already been rendered. These new requirements become effective for annual and interim reporting periods beginning after December 15, 2015, and early adoption is permitted. We do not expect this guidance to have a significant impact on our financial statements.
In February 2015, the FASB issued accounting guidance that changes the analysis that reporting entities must perform to determine whether certain types of legal entities should be consolidated. Specifically, the amendments affect (a) limited partnerships and similar legal entities; (b) the consolidation analysis of reporting entities that are involved with variable interest entities, particularly those that have fee arrangements and related party relationships; and (c) certain investment funds. These amendments are effective for fiscal years, and for interim periods within those fiscal years, beginning after December 15, 2015. Early adoption is permitted, including adoption in an interim period. We are assessing the impact of these amendments on our financial statements, however we do not expect this guidance to have a significant impact on our financial statements.
In April and August 2015, the FASB issued accounting guidance that changes the balance sheet presentation of debt issuance costs (except for debt issuance costs related to line-of-credit arrangements). The guidance requires debt issuance costs relating to a recognized debt liability to be presented as a direct deduction from the carrying amount of the associated debt liability in the balance sheet. This new requirement will be effective for fiscal years beginning after December 15, 2015, and interim periods within those fiscal years, and is to be applied on a retrospective basis. We do not expect this guidance to have a significant impact on our financial statements.
In April 2015, the FASB issued accounting guidance that, among other things, provides for a practical expedient related to interim period remeasurements of defined benefit plan assets and obligations. The practical expedient permits entities to remeasure plan assets and obligations using the month-end that is closest to the date of the actual event. Disclosure of such election and related month-end remeasurement date is required. This guidance will be effective for fiscal years beginning after December 15, 2015, and interim periods within those fiscal years, and is to be applied prospectively. Early application is permitted. We do not expect this guidance to have a significant impact on our financial statements.
In April 2015, the FASB issued accounting guidance which clarifies the proper method of accounting for fees paid in a cloud computing arrangement. The guidance requires software licenses included in a cloud computing arrangement to be accounted for consistently with the acquisition of other software licenses. If a cloud computing arrangement does not include a software license, the arrangement should be accounted for as a service contract. This new requirement will be effective for annual periods, including interim periods within those annual periods, beginning after December 15, 2015. Early adoption is permitted. We do not expect this guidance to have a significant impact on our financial statements.
In May 2015, the FASB issued accounting guidance for which investments measured at net asset value per share (or its equivalent) using the practical expedient should no longer be categorized within the fair value hierarchy. Although removed from the fair value hierarchy, disclosure of the nature, risks and amount of investments for which fair value is measured using the practical expedient is still required. This guidance will be effective for fiscal years beginning after December 15, 2015, and interim periods within those fiscal years, and is to be applied on a retrospective basis. Early adoption is permitted. We do not expect this guidance to have a significant impact on our financial statements.
In July 2015, the FASB issued accounting guidance that requires inventory to be measured at the lower of cost and net realizable value. The scope of this guidance excludes inventory measured using the last-in first-out method or the retail inventory method. This new requirement will be effective for fiscal years beginning after December 15, 2016, including interim periods within those fiscal years, and is to be applied prospectively. Early application is permitted. We are assessing the impact of this new requirement on our financial statements.
71
Albemarle Corporation and Subsidiaries | ||
NOTES TO THE CONSOLIDATED FINANCIAL STATEMENTS | ||
In September 2015, the FASB issued accounting guidance that eliminates the requirement to retrospectively adjust prior period financial statements for measurement-period adjustments that occur in periods after a business combination is consummated. Measurement-period adjustments should continue to be calculated as if they were known at the acquisition date, but will now be recognized in the reporting period in which they are determined. The new guidance also requires that the acquirer present separately on the face of the income statement or disclose in the notes the amount recorded in current-period earnings, by line item, that would have been recorded in previous reporting periods if the adjustment to provisional amounts had been recognized as of the acquisition date. As allowed by the provisions of this new guidance, we early-adopted this new guidance in the third quarter of 2015. Refer to Note 2, “Acquisitions” for additional information about the adoption of these new requirements.
In November 2015, the FASB issued accounting guidance that changes the balance sheet classification of deferred tax assets and liabilities. The guidance requires deferred tax assets and liabilities to be classified as noncurrent on the balance sheet, along with any related valuation allowance. As allowed by the provisions of this new guidance, we early-adopted this new guidance in the fourth quarter of 2015 on a prospective basis. Accordingly, deferred tax asset and liability amounts as of December 31, 2014 were not retrospectively adjusted.
In February 2016, the FASB issued accounting guidance that requires assets and liabilities arising from leases to be recorded on the balance sheet. Additional disclosures are required regarding the amount, timing, and uncertainty of cash flows from leases. This new guidance will be effective for fiscal years beginning after December 15, 2018, including interim periods within those fiscal years, and is to be applied using a modified retrospective approach. Early application is permitted. We have not evaluated the impact of the updated guidance on our consolidated financial statements.
NOTE 2—Acquisitions:
On July 15, 2014, we entered into an Agreement and Plan of Merger (the “Merger Agreement”) to acquire all the outstanding shares of Rockwood (the “Merger”). On January 12, 2015 (the “Acquisition Closing Date”), we completed the acquisition of Rockwood for a purchase price of approximately $5.7 billion. As a result, Rockwood became a wholly-owned subsidiary of Albemarle. The cash consideration was funded with proceeds from our 2014 Senior Notes, August 2014 Term Loan Agreement, Cash Bridge Facility and February 2014 Credit Agreement, each of which is described further in Note 14, “Long-Term Debt.” The fair value of the equity consideration was based on the closing price of Albemarle’s common stock on the Acquisition Closing Date of $59.70 per share, as reported on the New York Stock Exchange.
Pursuant to the Merger Agreement, at the Acquisition Closing Date each issued and outstanding share of Rockwood common stock, par value $0.01 per share, (other than shares owned directly or indirectly by Albemarle, Rockwood or the Merger Sub, as defined in the Merger Agreement, and Appraisal Shares as defined in the Merger Agreement) was canceled and extinguished and converted into the right to receive (i) $50.65 in cash, without interest, and (ii) 0.4803 of a share of Albemarle common stock, par value $0.01 per share, (the “Merger Consideration”). Pursuant to the Merger Agreement, equity awards relating to shares of Rockwood’s common stock were canceled and converted into the right to receive the cash value of the Merger Consideration. On the Acquisition Closing Date, we issued approximately 34.1 million shares of Albemarle common stock.
Subsequent to the acquisition of Rockwood, Albemarle continues to be a leading global developer, manufacturer and marketer of technologically advanced and high value-added specialty chemicals. We are a leading integrated and low-cost global producer of lithium and lithium compounds used in lithium ion batteries for electronic devices, alternative transportation vehicles and energy storage technologies, meeting the significant growth in global demand for these products. We are also one of the largest global producers of surface treatments and coatings for metal processing, servicing the automotive, aerospace and general industrial markets.
Included in Net sales and Net income attributable to Albemarle Corporation for the year ended December 31, 2015 is approximately $1.4 billion and $176.2 million, respectively, attributable to the businesses acquired from Rockwood. Included in Acquisition and integration related costs on our consolidated statement of income for the year ended December 31, 2015 is $137.7 million of costs directly related to the acquisition of Rockwood (mainly consisting of professional services and advisory fees, costs to achieve synergies, relocation costs, and other integration costs), and $8.4 million of costs in connection with other significant projects. Acquisition and integration related costs for the year ended December 31, 2014 includes $23.6 million of costs directly related to the acquisition of Rockwood and $6.6 million of costs in connection with other significant projects. Acquisition-related costs incurred during the year ended December 31, 2013 are included in Selling, general and administrative (“SG&A”) expenses and were not significant.
72
Albemarle Corporation and Subsidiaries | ||
NOTES TO THE CONSOLIDATED FINANCIAL STATEMENTS | ||
Preliminary Purchase Price Allocation
The aggregate purchase price noted above was allocated to the major categories of assets and liabilities acquired based upon their estimated fair values at the Acquisition Closing Date, which were based, in part, upon third-party appraisals for certain assets, including specifically-identified intangible assets. The excess of the purchase price over the preliminary estimated fair value of the net assets acquired was approximately $2.8 billion and was recorded as goodwill.
The following table summarizes the consideration paid for Rockwood and the amounts of the assets acquired and liabilities assumed as of the acquisition date, which have been allocated on a preliminary basis (in thousands):
Total purchase price | $ | 5,725,321 | |
Net assets acquired: | |||
Cash and cash equivalents | $ | 1,555,139 | |
Trade and other accounts receivable | 262,947 | ||
Inventories | 290,326 | ||
Other current assets | 86,267 | ||
Property, plant and equipment | 1,377,249 | ||
Investments | 529,453 | ||
Other assets | 25,538 | ||
Definite-lived intangible assets: | |||
Patents and technology | 227,840 | ||
Trade names and trademarks | 258,740 | ||
Customer lists and relationships | 1,264,227 | ||
Indefinite-lived intangible assets: | |||
Trade names and trademarks | 104,380 | ||
Other | 26,410 | ||
Current liabilities | (406,513 | ) | |
Long-term debt | (1,319,132 | ) | |
Pension benefits | (316,086 | ) | |
Other noncurrent liabilities | (195,052 | ) | |
Deferred income taxes | (845,965 | ) | |
Noncontrolling interests | (17,582 | ) | |
Total identifiable net assets | 2,908,186 | ||
Goodwill | 2,817,135 | ||
Total net assets acquired | $ | 5,725,321 | |
The allocation of the purchase price to the assets acquired and liabilities assumed, including the residual amount allocated to goodwill, is based upon preliminary information and is subject to change within the measurement period (up to one year from the acquisition date) as additional information concerning final asset and liability valuations is obtained. Significant changes to the purchase price allocation since our initial preliminary estimates reported in the first quarter of 2015 were primarily related to decreases in the estimated fair values of certain current assets, property, plant and equipment, investments and intangible assets and increases in certain other noncurrent liabilities and noncontrolling interests, which resulted in an increase to recognized goodwill of approximately $192.3 million. The primary areas of the preliminary purchase price allocation that are not yet finalized relate to the fair value of specific property, plant and equipment and intangible assets, and related deferred income taxes. The fair values of the assets acquired and liabilities assumed are based on management’s preliminary estimates and assumptions, as well as other information compiled by management, including valuations that utilize customary valuation procedures and techniques. While the Company believes that such preliminary estimates provide a reasonable basis for estimating the fair value of assets acquired and liabilities assumed, it will evaluate any necessary information prior to finalization of the amounts. During the measurement-period, the Company will adjust assets or liabilities if new information is obtained about facts and circumstances that existed as of the acquisition date that, if known, would have
73
Albemarle Corporation and Subsidiaries | ||
NOTES TO THE CONSOLIDATED FINANCIAL STATEMENTS | ||
resulted in revised estimated values of those assets or liabilities as of that date. The effect of measurement-period adjustments to the estimated fair values will be reflected as if the adjustments had been completed on the acquisition date. The impact of all changes that do not qualify as measurement-period adjustments will be included in current period earnings. If the actual results differ from the estimates and judgments used in these fair values, the amounts recorded in the consolidated financial statements could be subject to a possible impairment of the intangible assets or goodwill, or require acceleration of the amortization of intangible assets in subsequent periods.
Goodwill arising from the acquisition consists largely of the anticipated synergies and economies of scale from the combined companies and the overall strategic importance of the acquired businesses to Albemarle. The goodwill attributable to the acquisition will not be amortizable or deductible for tax purposes.
The weighted-average amortization periods for the intangible assets acquired are 20 years for patents and technology, 20 years for trade names and trademarks and 24 years for customer lists and relationships. The weighted-average amortization period for all definite-lived intangible assets acquired is 23 years.
Long-term debt assumed primarily includes Rockwood’s 4.625% senior notes with an aggregate principal amount of $1.25 billion and a fair value adjustment of approximately $43.7 million related to the senior notes. The fair value adjustment was based primarily on reported market values using Level 1 inputs. See Note 14, “Long-Term Debt,” for additional information about these senior notes.
As discussed further in Note 1, “Summary of Significant Accounting Policies,” in the third quarter of 2015 the Company early-adopted new accounting guidance that changes the reporting requirements for measurement-period adjustments that occur in periods after a business combination is consummated. For the three months ended December 31, 2015, Depreciation and amortization expense included in Cost of goods sold was reduced by approximately $3.0 million as a result of measurement period adjustments related to previous reporting periods. There were no significant measurement-period adjustments recorded in the consolidated statement of income for the year ended December 31, 2015 that related to previous reporting periods.
Unaudited Pro Forma Financial Information
The following unaudited pro forma results of operations of the Company for the years ended December 31, 2015 and 2014 assume that the Merger occurred on January 1, 2014. The pro forma amounts include certain adjustments, including interest expense, depreciation, amortization expense and income taxes. The pro forma amounts for the years ended December 31, 2015 and 2014 were adjusted to exclude approximately $137.7 million and $23.6 million, respectively, of nonrecurring acquisition and integration related costs. Additionally, pro forma amounts for the year ended December 31, 2015 were adjusted to exclude approximately $103.0 million of charges related to the utilization of the inventory markup as further described in Note 25, “Segment and Geographic Area Information.” The 2014 pro forma results do not include adjustments related to cost savings or other synergies that are anticipated as a result of the Merger. Accordingly, these unaudited pro forma results are presented for informational purposes only and are not necessarily indicative of what the actual results of operations of the combined company would have been if the acquisition had occurred as of January 1, 2014, nor are they indicative of future results of operations.
Year Ended December 31, | |||||||
2015 | 2014 | ||||||
(in thousands, except per share amounts) | |||||||
Pro forma Net sales | $ | 3,684,665 | $ | 3,870,428 | |||
Pro forma Net income from continuing operations | $ | 527,997 | $ | 353,313 | |||
Pro forma Net income from continuing operations per share: | |||||||
Basic | $ | 4.75 | $ | 3.13 | |||
Diluted | $ | 4.73 | $ | 3.12 | |||
Litigation Related to the Merger
On February 19, 2015, Verition Multi-Strategy Master Fund Ltd. and Verition Partners Master Fund Ltd., who collectively owned approximately 882,000 shares of Rockwood common stock immediately prior to the Merger, commenced an action in the Delaware Chancery Court seeking appraisal of their shares of Rockwood common stock pursuant to Delaware General Corporation Law § 262. These shareholders exercised their right not to receive the Merger Consideration for each share of Rockwood common stock owned by such shareholders. Following the Merger, these shareholders ceased to have any rights with respect to their Rockwood shares, except for their rights to seek an appraisal of the cash value of their Rockwood shares under Delaware law. On March 16, 2015, Albemarle, on behalf of Rockwood, filed an Answer and Verified List in response to
74
Albemarle Corporation and Subsidiaries | ||
NOTES TO THE CONSOLIDATED FINANCIAL STATEMENTS | ||
the appraisal petition. On November 2, 2015, the court granted the parties’ jointly stipulated amended scheduling order, which set forth dates for fact and expert discovery, as well as trial. On December 21, 2015, the parties entered into a Settlement Agreement and Release to resolve the matter, and on January 11, 2016, the Court dismissed the matter with prejudice.
Acquisition of Remaining Interest in Shanghai Chemetall Chemicals Co., Ltd.
On January 29, 2015, we acquired the remaining 40% interest in Shanghai Chemetall Chemicals Co., Ltd., (“Shanghai Chemetall”) for approximately $57.6 million ($45.6 million net of cash acquired), the proceeds of which came from the release of restricted cash acquired from Rockwood at closing. As of the acquisition date, Shanghai Chemetall became a wholly-owned subsidiary of Albemarle and is being consolidated into the Chemetall® Surface Treatment segment. The purchase price and the fair value of our equity interest immediately before the date of acquisition (approximately $60 million), as well as the fair value of the noncontrolling interest in Nanjing Chemetall Surface Technologies Co., Ltd., have been allocated to the net assets acquired at the acquisition date. On December 23, 2015, we paid approximately $4.8 million in connection with the acquisition of the remaining noncontrolling interests’ share of Nanjing Chemetall Surface Technologies Co., Ltd.
NOTE 3—Divestitures:
Assets Held for Sale
In 2015, we announced our intention to pursue strategic alternatives, including divestitures, related to certain businesses which include minerals-based flame retardants and specialty chemicals, fine chemistry services and metal sulfides. In the fourth quarter of 2015, we determined that the assets held for sale criteria in accordance with ASC 360, Property, Plant and Equipment, were met for these businesses as well as a small group of assets at an idled site. As such, the assets and liabilities of these businesses are included in Assets held for sale and Liabilities held for sale, respectively, in the consolidated balance sheet as of December 31, 2015. We have determined that as of December 31, 2015, the expected cash flows of these businesses were sufficient to establish recoverability of the asset carrying values, and therefore no impairment charge has been recorded in the accompanying financial statements under the held-for-sale model.
On November 5, 2015, the Company signed a definitive agreement to sell its Tribotecc metal sulfides business to Treibacher Industrie AG. Included in the transaction were sites in Vienna and Arnoldstein, Austria, and Tribotecc’s proprietary sulfide synthesis process. On January 4, 2016, the Company closed the sale of this business. We received net proceeds of approximately $137 million, and we currently expect to record a gain in the first quarter of 2016 related to the sale of this business.
On December 16, 2015, the Company signed a definitive agreement to sell its minerals-based flame retardants and specialty chemicals businesses to Huber Engineered Materials, a division of J.M. Huber Corporation. The transaction includes Albemarle’s Martinswerk GmbH subsidiary and manufacturing facility located in Bergheim, Germany, and Albemarle’s 50% ownership interest in Magnifin Magnesiaprodukte GmbH, a joint-venture with Radex Heraklith Industriebeteiligung AG at Breitenau, Austria. On February 1, 2016, the Company closed the sale of these businesses. We received net proceeds of approximately $187 million, subject to post-closing adjustments. We currently expect to record a gain in the first quarter of 2016 related to the sale of these businesses.
The carrying amounts of the major classes of assets and liabilities that were classified as held for sale at December 31, 2015, are as follows (in thousands):
Assets | |||
Current assets | $ | 156,421 | |
Net property, plant and equipment | 115,865 | ||
Goodwill | 46,794 | ||
Other intangibles, net of amortization | 66,324 | ||
All other noncurrent assets | 19,081 | ||
Assets held for sale | $ | 404,485 | |
Liabilities | |||
Current liabilities | $ | 72,756 | |
Deferred income taxes | 24,947 | ||
All other noncurrent liabilities | 31,003 | ||
Liabilities held for sale | $ | 128,706 | |
75
Albemarle Corporation and Subsidiaries | ||
NOTES TO THE CONSOLIDATED FINANCIAL STATEMENTS | ||
Assets held for sale and related liabilities are classified as current in the consolidated balance sheet as of December 31, 2015 because the Company has completed or expects to complete the sale of such assets in 2016. The results of operations of the businesses classified as held for sale are included in continuing operations within the consolidated statements of income. These businesses did not qualify for discontinued operations treatment because the Company’s management does not consider their sale as representing a strategic shift that had or will have a major effect on the Company’s operations and financial results.
Discontinued Operations
On April 15, 2014, the Company signed a definitive agreement to sell its antioxidant, ibuprofen and propofol businesses and assets to SI Group, Inc. Included in the transaction were Albemarle’s manufacturing sites in Orangeburg, South Carolina and Jinshan, China, along with Albemarle’s antioxidant product lines manufactured in Ningbo, China. On September 1, 2014, the Company closed the sale of these businesses and assets and received net proceeds of $104.7 million. A working capital settlement of $7.6 million (recorded in Other accounts receivable at December 31, 2014) was received in the first quarter of 2015. Financial results of the disposed group have been presented as discontinued operations in the consolidated statements of income for 2014 and 2013. A summary of results of discontinued operations for the years ended December 31, 2014 and 2013 is as follows (in thousands):
Year Ended December 31, | |||||||
2014 | 2013 | ||||||
Net sales | $ | 154,273 | $ | 222,146 | |||
(Loss) income from discontinued operations | $ | (90,439 | ) | $ | 5,985 | ||
Income tax (benefit) expense | (20,908 | ) | 1,877 | ||||
(Loss) income from discontinued operations (net of tax) | $ | (69,531 | ) | $ | 4,108 | ||
Included in (Loss) income from discontinued operations for the year ended December 31, 2014 are pre-tax charges of $85.5 million ($65.7 million after income taxes) related to the loss on the sale of the disposed group, representing the difference between the carrying value of the related assets and their fair value as determined by the sales price less estimated costs to sell. The loss is primarily attributable to the write-off of goodwill, intangibles and long-lived assets, net of cumulative foreign currency translation gains of $17.8 million.
NOTE 4—Supplemental Cash Flow Information:
Supplemental information related to the consolidated statements of cash flows is as follows (in thousands):
Year Ended December 31, | |||||||||||
2015 | 2014 | 2013 | |||||||||
Cash paid during the year for: | |||||||||||
Income taxes (net of refunds of $7,333, $6,035 and $14,296 in 2015, 2014 and 2013, respectively)(a) | $ | 162,408 | $ | 56,174 | $ | 51,772 | |||||
Interest (net of capitalization) | $ | 153,271 | $ | 33,604 | $ | 29,629 | |||||
Supplemental non-cash disclosures related to investing activities: | |||||||||||
Capital expenditures included in Accounts payable | $ | 45,826 | $ | 20,373 | $ | 13,741 | |||||
(a) | Cash paid for income taxes during 2015 includes approximately $111 million of taxes paid on repatriation of earnings from legacy Rockwood entities. |
76
Albemarle Corporation and Subsidiaries | ||
NOTES TO THE CONSOLIDATED FINANCIAL STATEMENTS | ||
NOTE 5—Earnings Per Share:
Basic and diluted earnings per share from continuing operations are calculated as follows (in thousands, except per share amounts):
Year Ended December 31, | |||||||||||
2015 | 2014 | 2013 | |||||||||
Basic earnings per share from continuing operations | |||||||||||
Numerator: | |||||||||||
Net income from continuing operations | $ | 360,064 | $ | 230,437 | $ | 435,726 | |||||
Net income from continuing operations attributable to noncontrolling interests | (25,158 | ) | (27,590 | ) | (26,663 | ) | |||||
Net income from continuing operations attributable to Albemarle Corporation | $ | 334,906 | $ | 202,847 | $ | 409,063 | |||||
Denominator: | |||||||||||
Weighted-average common shares for basic earnings per share | 111,182 | 78,696 | 83,839 | ||||||||
Basic earnings per share from continuing operations | $ | 3.01 | $ | 2.57 | $ | 4.88 | |||||
Diluted earnings per share from continuing operations | |||||||||||
Numerator: | |||||||||||
Net income from continuing operations | $ | 360,064 | $ | 230,437 | $ | 435,726 | |||||
Net income from continuing operations attributable to noncontrolling interests | (25,158 | ) | (27,590 | ) | (26,663 | ) | |||||
Net income from continuing operations attributable to Albemarle Corporation | $ | 334,906 | $ | 202,847 | $ | 409,063 | |||||
Denominator: | |||||||||||
Weighted-average common shares for basic earnings per share | 111,182 | 78,696 | 83,839 | ||||||||
Incremental shares under stock compensation plans | 374 | 406 | 483 | ||||||||
Weighted-average common shares for diluted earnings per share | 111,556 | 79,102 | 84,322 | ||||||||
Diluted earnings per share from continuing operations | $ | 3.00 | $ | 2.57 | $ | 4.85 | |||||
The Company’s policy on how to determine windfalls and shortfalls for purposes of calculating assumed stock award proceeds under the treasury stock method when determining the denominator for diluted earnings per share is to exclude the impact of pro forma deferred tax assets (i.e. the windfall or shortfall that would be recognized in the financial statements upon exercise of the award). At December 31, 2015, there were 1,114,041 common stock equivalents not included in the computation of diluted earnings per share because their effect would have been anti-dilutive.
Included in the calculation of basic earnings per share are unvested restricted stock awards that contain nonforfeitable rights to dividends. At December 31, 2015, there were 9,250 unvested shares of restricted stock awards outstanding.
We have the authority to issue 15 million shares of preferred stock in one or more classes or series. As of December 31, 2015, no shares of preferred stock have been issued.
On February 12, 2013, our Board of Directors authorized an increase in the number of shares the Company is permitted to repurchase under our share repurchase program, pursuant to which the Company is now permitted to repurchase up to a maximum of 15 million shares, including those shares previously authorized but not yet repurchased.
Under its existing Board authorized share repurchase program, in 2014 and 2013 the Company repurchased 2,190,254 shares and 7,064,932 shares of its common stock, respectively, pursuant to accelerated share repurchase (“ASR”) agreements with two financial institutions. Amounts paid pursuant to the ASR agreements were $150 million and $450 million in 2014 and 2013, respectively, and these purchases were funded through a combination of available cash on hand and debt. The Company determined that each of the ASR agreements met the criteria to be accounted for as a forward contract indexed to its own stock and were therefore treated as equity instruments. The final number of shares delivered upon settlement of each agreement was determined with reference to the daily Rule 10b-18 volume weighted-average prices of the Company’s common stock over the term of each agreement, less a forward price adjustment amount. The shares repurchased reduced the Company’s weighted average shares outstanding for purposes of calculating basic and diluted earnings per share.
During the years ended December 31, 2014 and 2013, the Company repurchased 2,190,254 and 9,198,056 shares of its common stock, respectively, pursuant to the terms of its share repurchase program. There were no shares of the Company’s
77
Albemarle Corporation and Subsidiaries | ||
NOTES TO THE CONSOLIDATED FINANCIAL STATEMENTS | ||
common stock repurchased during the year ended December 31, 2015. As of December 31, 2015, there were 3,749,340 remaining shares available for repurchase under the Company’s authorized share repurchase program.
NOTE 6—Other Accounts Receivable:
Other accounts receivable consist of the following at December 31, 2015 and 2014 (in thousands):
December 31, | |||||||
2015 | 2014 | ||||||
Value added tax/consumption tax | $ | 24,316 | $ | 23,205 | |||
Other | 55,561 | 26,218 | |||||
Total | $ | 79,877 | $ | 49,423 | |||
NOTE 7—Inventories:
The following table provides a breakdown of inventories at December 31, 2015 and 2014 (in thousands):
December 31, | |||||||
2015 | 2014 | ||||||
Finished goods | $ | 308,462 | $ | 262,769 | |||
Raw materials and work in process(a) | 144,886 | 53,152 | |||||
Stores, supplies and other | 55,380 | 42,440 | |||||
Total inventories | $ | 508,728 | $ | 358,361 | |||
(a) | Balance at December 31, 2015 includes $39.1 million of work in process related to the Lithium product category. |
Approximately 17% and 28% of our inventories are valued using the last-in, first-out (“LIFO”) method at December 31, 2015 and 2014, respectively. The portion of our domestic inventories stated on the LIFO basis amounted to $85.1 million and $100.7 million at December 31, 2015 and 2014, respectively, which are below replacement cost by approximately $36.9 million and $43.0 million, respectively.
NOTE 8—Other Current Assets:
Other current assets consist of the following at December 31, 2015 and 2014 (in thousands):
December 31, | |||||||
2015 | 2014 | ||||||
Deferred income taxes—current(a) | $ | — | $ | 1,801 | |||
Income tax receivables | 23,740 | 22,837 | |||||
Prepaid expenses | 43,280 | 41,448 | |||||
Other | 4,331 | — | |||||
Total | $ | 71,351 | $ | 66,086 | |||
(a) | See Note 1, “Summary of Significant Accounting Policies” and Note 20, “Income Taxes.” |
78
Albemarle Corporation and Subsidiaries | ||
NOTES TO THE CONSOLIDATED FINANCIAL STATEMENTS | ||
NOTE 9—Property, Plant and Equipment:
Property, plant and equipment, at cost, consist of the following at December 31, 2015 and 2014 (in thousands):
Useful Lives (Years) | December 31, | |||||||||
2015 | 2014 | |||||||||
Land(a) | — | $ | 145,912 | $ | 56,249 | |||||
Land improvements | 5 – 30 | 59,423 | 49,099 | |||||||
Buildings and improvements(a) | 10 – 45 | 297,163 | 214,364 | |||||||
Machinery and equipment(b) | 2 – 45 | 2,305,641 | 2,106,451 | |||||||
Long-term mineral rights and production equipment costs | 7 – 60 | 652,871 | 85,888 | |||||||
Construction in progress | — | 420,152 | 108,619 | |||||||
Total | $ | 3,881,162 | $ | 2,620,670 | ||||||
(a) | Includes Land under capital lease of $2.8 million and Buildings and improvements under capital lease of $9.9 million at December 31, 2015. |
(b) | Consists primarily of (1) short-lived production equipment components, office and building equipment and other equipment with estimated lives ranging 2 – 7 years, (2) production process equipment (intermediate components) with estimated lives ranging 8 – 19 years, (3) production process equipment (major unit components) with estimated lives ranging 20 – 29 years, and (4) production process equipment (infrastructure and other) with estimated lives ranging 30 – 45 years. |
In 2015, approximately $1.4 billion was allocated to Property, plant and equipment in connection with the acquisition of Rockwood. See Note 2, “Acquisitions” for additional information about the amounts of assets acquired and liabilities assumed upon the acquisition of Rockwood. In 2014, we sold our antioxidant, ibuprofen and propofol businesses and assets to SI Group, Inc. Included in the transaction were our manufacturing sites in Orangeburg, South Carolina and Jinshan, China, along with our antioxidant product lines manufactured in Ningbo, China. In connection with the sale, net property, plant and equipment was reduced by $100.0 million. See Note 3 “Divestitures” for additional information about this transaction.
The cost of property, plant and equipment, including buildings and improvements under capital lease, is depreciated generally by the straight-line method. Depletion of long-term mineral rights is based on the units-of-production method. Depreciation expense amounted to $180.7 million, $97.9 million and $99.3 million during the years ended December 31, 2015, 2014 and 2013, respectively. Depreciation expense related to discontinued operations was $2.3 million and $8.6 million during the years ended December 31, 2014 and 2013, respectively. Interest capitalized on significant capital projects in 2015, 2014 and 2013 was $11.2 million, $2.4 million and $6.1 million, respectively. As of December 31, 2015, accumulated amortization for assets under capital lease acquired from Rockwood was $0.3 million.
79
Albemarle Corporation and Subsidiaries | ||
NOTES TO THE CONSOLIDATED FINANCIAL STATEMENTS | ||
NOTE 10—Investments:
Investments include our share of unconsolidated joint ventures, nonmarketable securities and marketable equity securities. The following table details our investment balances at December 31, 2015 and 2014 (in thousands).
December 31, | ||||||||
2015 | 2014 | |||||||
Joint ventures(a) | $ | 430,952 | $ | 169,891 | ||||
Nonmarketable securities | 208 | 177 | ||||||
Marketable equity securities | 24,257 | 23,974 | ||||||
Total | $ | 455,417 | $ | 194,042 | ||||
(a) | Balance at December 31, 2015 excludes our investment in Magnifin Magnesiaprodukte GmbH & Co. KG (“Magnifin”), which is included in Assets held for sale. Refer to Note 3, “Divestitures.” |
Our ownership positions in significant unconsolidated investments are shown below:
December 31, | ||||||||||
2015 | 2014 | 2013 | ||||||||
* | Windfield Holdings Pty Ltd - a joint venture with Sichuan Tianqi Lithium Industries, Inc., that mines lithium ore and produces lithium concentrate | 49 | % | — | % | — | % | |||
* | Nippon Aluminum Alkyls - a joint venture with Mitsui Chemicals, Inc. that produces aluminum alkyls | 50 | % | 50 | % | 50 | % | |||
* | Magnifin Magnesiaprodukte GmbH & Co. KG - a joint venture with Radex Heraklith Industriebeteiligung AG that produces specialty magnesium hydroxide products | 50 | % | 50 | % | 50 | % | |||
* | Nippon Ketjen Company Limited - a joint venture with Sumitomo Metal Mining Company Limited that produces refinery catalysts | 50 | % | 50 | % | 50 | % | |||
* | Eurecat S.A. - a joint venture with IFP Investissements for refinery catalysts regeneration services | 50 | % | 50 | % | 50 | % | |||
* | Fábrica Carioca de Catalisadores S.A. - a joint venture with Petrobras Quimica S.A. - PETROQUISA that produces catalysts and includes catalysts research and product development activities | 50 | % | 50 | % | 50 | % | |||
Our investment in the significant unconsolidated joint ventures above, including Magnifin, amounted to $402.6 million and $148.3 million as of December 31, 2015 and 2014, respectively, and the amount included in Equity in net income of unconsolidated investments (net of tax) in the consolidated statements of income totaled $25.4 million, $34.7 million and $32.2 million for the years ended December 31, 2015, 2014 and 2013, respectively. As further described in Note 25, “Segment and Geographic Area Information,” Equity in net income of unconsolidated investments (net of tax) for the year ended December 31, 2015 was reduced by $27.1 million related to the utilization of the inventory markup to fair value in connection with the acquisition of Rockwood. Undistributed earnings attributable to our significant unconsolidated investments represented approximately $105.9 million and $107.8 million of our consolidated retained earnings at December 31, 2015 and 2014, respectively. All of the unconsolidated joint ventures in which we have investments are private companies and accordingly do not have a quoted market price available.
The following summary lists our assets, liabilities and results of operations for our significant unconsolidated joint ventures presented herein (in thousands):
December 31, | ||||||||
2015 | 2014 | |||||||
Summary of Balance Sheet Information: | ||||||||
Current assets | $ | 331,630 | $ | 226,392 | ||||
Noncurrent assets | 935,790 | 181,343 | ||||||
Total assets | $ | 1,267,420 | $ | 407,735 | ||||
Current liabilities | $ | 106,966 | $ | 74,242 | ||||
Noncurrent liabilities | 339,604 | 63,585 | ||||||
Total liabilities | $ | 446,570 | $ | 137,827 | ||||
80
Albemarle Corporation and Subsidiaries | ||
NOTES TO THE CONSOLIDATED FINANCIAL STATEMENTS | ||
Year Ended December 31, | ||||||||||||
2015 | 2014 | 2013 | ||||||||||
Summary of Statements of Income Information: | ||||||||||||
Net sales | $ | 560,376 | $ | 499,394 | $ | 499,941 | ||||||
Gross profit | $ | 253,569 | $ | 164,063 | $ | 168,898 | ||||||
Income before income taxes | $ | 157,501 | $ | 101,983 | $ | 101,680 | ||||||
Net income | $ | 111,491 | $ | 71,466 | $ | 71,322 | ||||||
We have evaluated each of the unconsolidated investments pursuant to current accounting guidance and none qualify for consolidation. Dividends received from our significant unconsolidated investments were $58.1 million, $39.6 million and $20.1 million in 2015, 2014 and 2013, respectively.
At December 31, 2015 and 2014, the carrying amount of our investments in unconsolidated joint ventures exceeded the amount of underlying equity in net assets by approximately $11.5 million and $7.0 million, respectively. These amounts represent the differences between the value of certain assets of the joint ventures and our related valuation on a U.S. GAAP basis. As of December 31, 2015 and 2014, $0.8 million and $1.0 million, respectively, remained to be amortized over the remaining useful lives of the assets with the balance of the difference representing primarily our share of the joint ventures’ goodwill.
The Company holds a 49% equity interest in Windfield Holdings Pty Ltd (“Windfield”), which we acquired in the Rockwood acquisition. With regards to the Company’s ownership in Windfield, the parties share risks and benefits disproportionate to their voting interests. As a result, the Company considers Windfield to be a variable interest entity (“VIE”). However, the Company does not consolidate Windfield as it is not the primary beneficiary. The carrying amount of our 49% equity interest in Windfield, which is our most significant VIE, was $280.2 million at December 31, 2015. The Company’s aggregate net investment in all other entities which it considers to be VIE’s for which the Company is not the primary beneficiary was $27.6 million and $6.2 million at December 31, 2015 and December 31, 2014, respectively. Our unconsolidated VIE’s are reported in Investments in the consolidated balance sheets. The Company does not guarantee debt for, or have other financial support obligations to, these entities, and its maximum exposure to loss in connection with its continuing involvement with these entities is limited to the carrying value of the investments. Included in the consolidated statement of cash flows for the year ended December 31, 2015, is a return of capital from Windfield of $98.0 million.
Assets of the Benefit Protection Trust, in conjunction with our EDCP, are accounted for as trading securities in accordance with authoritative accounting guidance. The assets of the Trust consist primarily of mutual fund investments and are marked-to-market on a monthly basis through the consolidated statements of income. As of December 31, 2015 and 2014, these marketable securities amounted to $21.6 million and $22.2 million, respectively.
At December 31, 2015 and 2014, loans receivable from our 50%-owned joint venture, Saudi Organometallic Chemicals Company (“SOCC”), totaled approximately $30.0 million and are included in Other assets in the consolidated balance sheets. Interest on these loans is based on either the London Inter-Bank Offered Rate (“LIBOR”) or Saudi Arabia Inter-Bank Offered Rate (“SAIBOR”), plus a margin of 1.275%, per annum. Principal repayments on amounts outstanding under this arrangement are required as mutually agreed upon by the joint venture partners, but with any outstanding balances due in full no later than December 31, 2021.
81
Albemarle Corporation and Subsidiaries | ||
NOTES TO THE CONSOLIDATED FINANCIAL STATEMENTS | ||
NOTE 11—Other Assets:
Other assets consist of the following at December 31, 2015 and 2014 (in thousands):
December 31, | |||||||
2015 | 2014 | ||||||
Deferred income taxes—noncurrent(a) | $ | 76,025 | $ | 62,440 | |||
Assets related to unrecognized tax benefits(a) | 50,875 | 22,100 | |||||
Long-term advances to joint ventures(b) | 31,780 | 34,084 | |||||
Deferred financing costs(c) | 19,605 | 23,583 | |||||
Other | 38,713 | 18,749 | |||||
Total | $ | 216,998 | $ | 160,956 | |||
(a) | See Note 1, “Summary of Significant Accounting Policies” and Note 20, “Income Taxes.” |
(b) | See Note 10, “Investments.” |
(c) | See Note 14, “Long-Term Debt.” |
NOTE 12—Goodwill and Other Intangibles:
Goodwill and other intangibles consist principally of goodwill, customer lists, trade names, trademarks, patents and other intangibles.
The following table summarizes the changes in goodwill by operating segment for the years ended December 31, 2015 and 2014 (in thousands):
Performance Chemicals | Refining Solutions | Chemetall Surface Treatment | All Other | Total | |||||||||||||||
Balance at December 31, 2013 | $ | 42,025 | $ | 218,382 | $ | — | $ | 23,796 | $ | 284,203 | |||||||||
Divestitures(a) | — | — | — | (15,088 | ) | (15,088 | ) | ||||||||||||
Foreign currency translation adjustments | (9 | ) | (25,725 | ) | — | (119 | ) | (25,853 | ) | ||||||||||
Balance at December 31, 2014 | 42,016 | 192,657 | — | 8,589 | 243,262 | ||||||||||||||
Acquisition of Rockwood | 1,293,467 | — | 1,482,517 | 41,151 | 2,817,135 | ||||||||||||||
Other acquisitions(b) | — | — | 23,993 | — | 23,993 | ||||||||||||||
Reclass to assets held for sale(c) | — | — | — | (46,794 | ) | (46,794 | ) | ||||||||||||
Foreign currency translation adjustments | (47,659 | ) | (19,929 | ) | (73,251 | ) | (2,946 | ) | (143,785 | ) | |||||||||
Balance at December 31, 2015 | $ | 1,287,824 | $ | 172,728 | $ | 1,433,259 | $ | — | $ | 2,893,811 | |||||||||
(a) | In 2014, we reduced goodwill by $15.1 million in connection with the sale of our antioxidant, ibuprofen and propofol businesses and assets which closed on September 1, 2014. See Note 3 “Divestitures” for additional information about this transaction. |
(b) | Primarily relates to the acquisition of the remaining interest in Shanghai Chemetall. See Note 2, “Acquisitions.” |
(c) | See Note 3, “Divestitures.” |
82
Albemarle Corporation and Subsidiaries | ||
NOTES TO THE CONSOLIDATED FINANCIAL STATEMENTS | ||
Other intangibles consist of the following at December 31, 2015 and 2014 (in thousands):
Customer Lists and Relationships | Trade Names and Trademarks (a) | Patents and Technology | Other (b) | Total | |||||||||||||||
Gross Asset Value | |||||||||||||||||||
Balance at December 31, 2013 | $ | 86,426 | $ | 26,907 | $ | 48,743 | $ | 38,342 | $ | 200,418 | |||||||||
Acquisitions(c) | — | — | 5,228 | — | 5,228 | ||||||||||||||
Divestitures(d) | (34,892 | ) | (8,171 | ) | (11,316 | ) | (14,161 | ) | (68,540 | ) | |||||||||
Foreign currency translation adjustments and other | (3,055 | ) | (1,181 | ) | (2,257 | ) | (740 | ) | (7,233 | ) | |||||||||
Balance at December 31, 2014 | 48,479 | 17,555 | 40,398 | 23,441 | 129,873 | ||||||||||||||
Acquisition of Rockwood | 1,264,226 | 363,120 | 227,838 | 26,410 | 1,881,594 | ||||||||||||||
Other acquisitions(e) | 76,052 | — | 1,433 | 73 | 77,558 | ||||||||||||||
Reclass to assets held for sale(f) | (16,608 | ) | — | (54,060 | ) | (1,454 | ) | (72,122 | ) | ||||||||||
Foreign currency translation adjustments and other | (88,092 | ) | (25,468 | ) | (15,508 | ) | (6,117 | ) | (135,185 | ) | |||||||||
Balance at December 31, 2015 | $ | 1,284,057 | $ | 355,207 | $ | 200,101 | $ | 42,353 | $ | 1,881,718 | |||||||||
Accumulated Amortization | |||||||||||||||||||
Balance at December 31, 2013 | $ | (35,988 | ) | $ | (8,970 | ) | $ | (40,354 | ) | $ | (26,903 | ) | $ | (112,215 | ) | ||||
Amortization | (2,839 | ) | (824 | ) | (388 | ) | (1,686 | ) | (5,737 | ) | |||||||||
Divestitures(d) | 14,487 | 1,539 | 5,738 | 5,820 | 27,584 | ||||||||||||||
Foreign currency translation adjustments and other | 1,409 | 343 | 2,173 | 695 | 4,620 | ||||||||||||||
Balance at December 31, 2014 | (22,931 | ) | (7,912 | ) | (32,831 | ) | (22,074 | ) | (85,748 | ) | |||||||||
Amortization | (51,926 | ) | (12,228 | ) | (12,501 | ) | (627 | ) | (77,282 | ) | |||||||||
Reclass to assets held for sale(f) | 596 | — | 3,880 | 1,322 | 5,798 | ||||||||||||||
Foreign currency translation adjustments and other | 2,303 | 381 | 1,675 | 4,202 | 8,561 | ||||||||||||||
Balance at December 31, 2015 | $ | (71,958 | ) | $ | (19,759 | ) | $ | (39,777 | ) | $ | (17,177 | ) | $ | (148,671 | ) | ||||
Net Book Value at December 31, 2014 | $ | 25,548 | $ | 9,643 | $ | 7,567 | $ | 1,367 | $ | 44,125 | |||||||||
Net Book Value at December 31, 2015 | $ | 1,212,099 | $ | 335,448 | $ | 160,324 | $ | 25,176 | $ | 1,733,047 | |||||||||
(a) | Included in Trade Names and Trademarks are indefinite-lived intangible assets with a gross carrying amount of $9.2 million and $113.1 million at December 31, 2014 and 2015, respectively. |
(b) | Included in Other is an indefinite-lived intangible asset with a gross carrying amount of $21.9 million at December 31, 2015. |
(c) | Increase in Patents and Technology relates to a purchase accounting adjustment in connection with our acquisition of Cambridge Chemical Company, Ltd. |
(d) | In 2014 we reduced intangible assets by $68.5 million and related accumulated amortization by $27.6 million in connection with the sale of our antioxidant, ibuprofen and propofol businesses and assets which closed on September 1, 2014. See Note 3 “Divestitures” for additional information about this transaction. |
(e) | Primarily relates to the acquisition of the remaining interest in Shanghai Chemetall. See Note 2, “Acquisitions.” |
(f) | See Note 3, “Divestitures.” |
Useful lives range from 15 – 25 years for customer lists and relationships; 11 – 20 years for trade names and trademarks; 17 – 20 years for patents and technology; and 5 – 15 years for other.
Amortization of other intangibles amounted to $77.3 million, $5.7 million and $8.1 million for the years ended December 31, 2015, 2014 and 2013, respectively. Included in amortization for the year ended December 31, 2015 is $49.2 million of amortization using the pattern of economic benefit method. Amortization of other intangibles related to discontinued operations was $0.9 million and $3.5 million for the years ended December 31, 2014 and 2013, respectively.
83
Albemarle Corporation and Subsidiaries | ||
NOTES TO THE CONSOLIDATED FINANCIAL STATEMENTS | ||
Total estimated amortization expense of other intangibles, excluding other intangibles in assets held for sale, for the next five fiscal years is as follows (in thousands):
Estimated Amortization Expense | |||
2016 | $ | 90,002 | |
2017 | $ | 91,485 | |
2018 | $ | 92,884 | |
2019 | $ | 93,275 | |
2020 | $ | 93,189 | |
NOTE 13—Accrued Expenses:
Accrued expenses consist of the following at December 31, 2015 and 2014 (in thousands):
December 31, | |||||||
2015 | 2014 | ||||||
Employee benefits, payroll and related taxes | $ | 125,236 | $ | 49,072 | |||
Obligations in connection with Rockwood acquisition(a) | 128,881 | — | |||||
Other(b) | 148,262 | 117,102 | |||||
Total | $ | 402,379 | $ | 166,174 | |||
(a) | Includes accruals related to certain litigation matters and businesses divested by Rockwood prior to the Acquisition Closing Date. |
(b) | No individual component exceeds 5% of total current liabilities. |
NOTE 14—Long-Term Debt:
Long-term debt consists of the following at December 31, 2015 and 2014 (in thousands):
December 31, | |||||||
2015 | 2014 | ||||||
Term loan facilities | $ | 1,250,000 | $ | — | |||
1.875% Senior notes, net of unamortized discount of $5,109 at December 31, 2015 and $6,605 at December 31, 2014 | 763,946 | 844,315 | |||||
3.00% Senior notes, net of unamortized discount of $244 at December 31, 2015 and $306 at December 31, 2014 | 249,756 | 249,694 | |||||
4.15% Senior notes, net of unamortized discount of $1,294 at December 31, 2015 and $1,439 at December 31, 2014 | 423,706 | 423,561 | |||||
4.50% Senior notes, net of unamortized discount of $1,557 at December 31, 2015 and $1,871 at December 31, 2014 | 348,443 | 348,129 | |||||
5.10% Senior notes, net of unamortized discount of $3 at December 31, 2014 | — | 324,997 | |||||
5.45% Senior notes, net of unamortized discount of $995 at December 31, 2015 and $1,029 at December 31, 2014 | 349,005 | 348,971 | |||||
Commercial paper notes | 351,349 | 367,178 | |||||
Fixed rate foreign borrowings | 995 | 1,958 | |||||
Variable-rate foreign bank loans | 77,452 | 25,139 | |||||
Variable-rate domestic bank loans | 20,479 | — | |||||
Capital lease obligations | 16,807 | — | |||||
Miscellaneous | 81 | 189 | |||||
Total long-term debt | 3,852,019 | 2,934,131 | |||||
Less amounts due within one year | 677,345 | 711,096 | |||||
Long-term debt, less current portion | $ | 3,174,674 | $ | 2,223,035 | |||
Aggregate annual maturities of long-term debt as of December 31, 2015 are as follows (in millions): 2016—$677.3; 2017—$59.1; 2018—$86.4; 2019—$335.5; 2020—$1,158.4; thereafter—$1,544.5.
84
Albemarle Corporation and Subsidiaries | ||
NOTES TO THE CONSOLIDATED FINANCIAL STATEMENTS | ||
Rockwood Acquisition Financing
The net proceeds from senior notes we issued in the fourth quarter of 2014, together with borrowings under our revolving credit agreement, commercial paper notes, August 15, 2014 term loan credit agreement and a senior unsecured cash bridge facility, were used to finance the cash portion of the consideration for the acquisition of Rockwood, pay fees and expenses related to the acquisition, repay our 5.10% senior notes, with the remainder, if any, used for general corporate purposes.
Senior Notes
In the fourth quarter of 2014, we issued a series of senior notes (collectively, the “2014 Senior Notes”) as follows:
• | €700.0 million aggregate principal amount of senior notes, issued on December 8, 2014, bearing interest at a rate of 1.875% payable annually on December 8 of each year, beginning in 2015. The effective interest rate on these senior notes is approximately 2.10%. These senior notes mature on December 8, 2021. |
• | $250.0 million aggregate principal amount of senior notes, issued on November 24, 2014, bearing interest at a rate of 3.00% payable semi-annually on June 1 and December 1 of each year, beginning June 1, 2015. The effective interest rate on these senior notes is approximately 3.18%. These senior notes mature on December 1, 2019. |
• | $425.0 million aggregate principal amount of senior notes, issued on November 24, 2014, bearing interest at a rate of 4.15% payable semi-annually on June 1 and December 1 of each year, beginning June 1, 2015. The effective interest rate on these senior notes is approximately 5.06%. These senior notes mature on December 1, 2024. |
• | $350.0 million aggregate principal amount of senior notes, issued on November 24, 2014, bearing interest at a rate of 5.45% payable semi-annually on June 1 and December 1 of each year, beginning June 1, 2015. The effective interest rate on these senior notes is approximately 5.50%. These senior notes mature on December 1, 2044. |
Upon completion of the Rockwood acquisition, we assumed Rockwood’s senior notes with an aggregate principal amount of $1.25 billion. These senior notes bore interest at a rate of 4.625% payable semi-annually on April 15 and October 15 of each year, and had a scheduled maturity of October 15, 2020. At October 15, 2015, the carrying amount of the 4.625% senior notes included an unamortized premium of approximately $38.0 million, which resulted from an adjustment to fair value upon our assumption of the notes from Rockwood. The effective interest rate of the notes was approximately 3.95%.
Under the terms of the indenture governing the 4.625% senior notes, as amended and supplemented, on October 15, 2015, our wholly-owned subsidiary, Rockwood Specialties Group, Inc., redeemed all of the outstanding 4.625% senior notes at a redemption price equal to 103.469% of the principal amount of the notes, representing a premium of $43.3 million, plus accrued and unpaid interest to the redemption date. The guarantees of the 4.625% senior notes and the 2014 Senior Notes were released upon repayment of the 4.625% senior notes. Included in Interest and financing expenses in our consolidated statements of income and Other, net, in our consolidated statements of cash flows for the year ended December 31, 2015 is a loss on early extinguishment of approximately $5.4 million related to these senior notes.
Our $350.0 million aggregate principal amount of senior notes, issued on December 10, 2010, bear interest at a rate of 4.50% payable semi-annually on June 15 and December 15 of each year. The effective interest rate on these senior notes is approximately 4.70%. These senior notes mature on December 15, 2020.
Our $325.0 million aggregate principal amount of senior notes, which were issued on January 20, 2005 and bore interest at a rate of 5.10%, matured and were repaid on February 1, 2015. The effective interest rate on these senior notes was approximately 5.19%. As a result of the refinancing of these senior notes prior to December 31, 2014, these senior notes were included in Current portion of long-term debt at December 31, 2014.
In anticipation of refinancing our 5.10% senior notes in the fourth quarter of 2014, on January 22, 2014, we entered into a pay fixed, receive variable rate forward starting interest rate swap with J.P. Morgan Chase Bank, N.A., to be effective October 15, 2014. Our risk management objective and strategy for undertaking this hedge was to eliminate the variability in the interest rate and partial credit spread on the 20 future semi-annual coupon payments that we will pay in connection with our 4.15% senior notes. The notional amount of the swap was $325.0 million and the fixed rate was 3.281%, with the cash settlement determined by reference to the changes in the U.S. Dollar 3-month LIBOR and credit spreads from the date we entered into the swap until the date the swap was settled (October 15, 2014). This derivative financial instrument was designated and accounted for as a cash flow hedge under ASC 815, Derivatives and Hedging. We determined there was no ineffectiveness during the term of the swap. On October 15, 2014, the swap was settled, resulting in a payment to the counterparty of $33.4 million. This amount was recorded in Accumulated other comprehensive (loss) income and is being amortized to interest expense over the life of the 4.15% senior notes. The amount to be reclassified to interest expense from Accumulated other comprehensive (loss) income during the next twelve months is approximately $3.3 million.
85
Albemarle Corporation and Subsidiaries | ||
NOTES TO THE CONSOLIDATED FINANCIAL STATEMENTS | ||
In connection with the offering of the 1.875% Euro-denominated senior notes which were priced on December 1, 2014, we entered into two forward contracts on November 24, 2014, each with a notional value of €350.0 million, to exchange a total of €700.0 million for U.S. Dollars, with settlement occurring on December 18, 2014, and with the total notional value representing an amount equivalent to the gross proceeds from the offering of the 1.875% Euro-denominated senior notes. The objective of entering into these forward contracts was to minimize the financial impact of changes in the Euro-to-U.S. Dollar exchange rate with respect to our foreign subsidiaries where the Euro serves as the functional currency. From the effective date of the contracts until the date of settlement, the forward contracts were designated as effective hedges of our net investment in these foreign subsidiaries. Upon settlement, a gain of $5.2 million was recorded in accumulated other comprehensive (loss) income, and such amount is expected to remain in accumulated other comprehensive (loss) income until the complete or substantially complete liquidation of our investment in these foreign subsidiaries. On December 18, 2014, the carrying value of the 1.875% Euro-denominated senior notes was designated as an effective hedge of our net investment in foreign subsidiaries where the Euro serves as the functional currency, and beginning on the date of designation, gains or losses on the revaluation of these senior notes to our reporting currency have been and will be recorded in accumulated other comprehensive (loss) income. During the years ended December 31, 2015 and 2014, gains of $50.9 million and $12.8 million were recorded in accumulated other comprehensive (loss) income in connection with the revaluation of these senior notes to our reporting currency.
September 2015 Term Loan Agreement
The 4.625% senior notes we assumed from Rockwood were repaid with proceeds from a new term loan agreement we entered into on September 14, 2015 (the “September 2015 Term Loan Agreement”) with JPMorgan Chase Bank, N.A. (the “Administrative Agent”) and certain other lenders. The September 2015 Term Loan Agreement provides for borrowings under a 364-day term loan facility (the “364-Day Facility”) and a five-year term loan facility (the “Five-Year Facility”), or collectively, the “Term loan facilities.” As of December 31, 2015, aggregate amounts outstanding under the 364-Day Facility and the Five-Year Facility were $300.0 million and $950.0 million, respectively. As of February 19, 2016, we repaid the 364-Day Facility in full and we repaid approximately $31 million of borrowings under the Five-Year Facility, each primarily with proceeds from the sale of the Company’s Tribotecc metal sulfides business and the sale of the Company’s minerals-based flame retardants and specialty chemicals businesses, both of which closed in the first quarter of 2016. Borrowings under the facilities bear interest equal to, at the option of the Company: (a) LIBOR plus a margin ranging from 1.000% to 1.875% per annum depending upon the long-term, unsecured, senior, non-credit enhanced debt rating of the Company, or (b) a base rate (defined as the highest of (i) the Federal Funds Rate plus 0.50%; (ii) the rate of interest in effect for such day as publicly announced from time to time by the Administrative Agent as its “prime rate”; or (iii) one-month LIBOR plus 1.00%) plus a margin of 0.000% to 0.875% per annum depending upon the long-term, unsecured, senior, non-credit enhanced debt rating of the Company. As of December 31, 2015, the interest rate on both Term loan facilities was LIBOR plus 1.375%.
Borrowings under the 364-Day Facility were required to be repaid 364 days after initial funding. Borrowings under the Five-Year Facility are required to be repaid in equal quarterly installments on the last business day of each of March, June, September and December, beginning with September 30, 2016, and ending with the last such day to occur prior to the fifth anniversary after initial funding (each a “Payment Date”), in an aggregate principal amount equal to (a) in the case of each Payment Date occurring on or after the first anniversary and prior to the second anniversary of initial funding, 1.25% of the aggregate principal amount of such loans, and (b) in the case of each Payment Date occurring on or after the second anniversary of initial funding, equal to 2.5% of the aggregate principal amount of such loans. On the fifth anniversary after initial funding, any remaining amounts outstanding under the Five-Year Facility become due and payable. Additionally, the agreement requires that proceeds from divestitures of the Company’s Tribotecc metal sulfides business and the Company’s minerals-based flame retardants and specialty chemicals businesses, and intended divestiture of its Fine Chemistry Services business, must be used to repay amounts outstanding under the September 2015 Term Loan Agreement. Borrowings under the September 2015 Term Loan Agreement are subject to customary affirmative and negative covenants, including a maximum leverage ratio requirement that is aligned with the maximum leverage ratio requirement of our February 2014 Credit Agreement, as defined below.
Credit Agreement
Our revolving, unsecured credit agreement dated as of February 7, 2014, as amended, (the “February 2014 Credit Agreement”) currently provides for borrowings of up to $1.0 billion and matures on February 7, 2020. Borrowings bear interest at variable rates based on the LIBOR for deposits in the relevant currency plus an applicable margin which ranges from 1.000% to 1.700%, depending on the Company’s credit rating from Standard & Poor’s Ratings Services (“S&P”), Moody’s Investors Services (“Moody’s”) and Fitch Ratings (“Fitch”). The applicable margin on the facility was 1.300% as of December 31, 2015.
Borrowings under the February 2014 Credit Agreement are conditioned upon compliance with the following covenants: (a) consolidated funded debt, as defined in the agreement, must be less than or equal to 3.50 times consolidated EBITDA, as defined in the agreement, (which reflects adjustments for certain non-recurring or unusual items such as restructuring charges,
86
Albemarle Corporation and Subsidiaries | ||
NOTES TO THE CONSOLIDATED FINANCIAL STATEMENTS | ||
facility divestiture charges and other significant non-recurring items), or herein “consolidated adjusted EBITDA,” as of the end of any fiscal quarter; (b) with the exception of certain liens as specified in the agreement, liens may not attach to assets when the aggregate amount of all indebtedness secured by such liens plus unsecured subsidiary indebtedness, other than indebtedness incurred by our subsidiaries under the February 2014 Credit Agreement, would exceed 20% of consolidated net worth, as defined in the agreement; and (c) with the exception of certain indebtedness as specified in the agreement, subsidiary indebtedness may not exceed the difference between 20% of consolidated net worth, as defined in the agreement, and indebtedness secured by liens permitted under the agreement.
On August 15, 2014, certain amendments were made to the February 2014 Credit Agreement which include the following: (a) an increase in the maximum leverage ratio (as described above) from 3.50 to 4.50 for the first four quarters following the completion of the acquisition of Rockwood, stepping down by 0.25 on a quarterly basis thereafter until reaching 3.50; and (b) requiring subsidiaries of Albemarle that guarantee the 2014 Senior Notes to also guarantee the February 2014 Credit Agreement.
In January 2015, we borrowed $250.0 million under the February 2014 Credit Agreement in connection with the acquisition of Rockwood, and such amount was repaid in full in February 2015. As of December 31, 2015, there were no borrowings outstanding under the February 2014 Credit Agreement.
Commercial Paper Notes
On May 29, 2013, we entered into agreements to initiate a commercial paper program on a private placement basis under which we may issue unsecured commercial paper notes (the “Commercial Paper Notes”) from time-to-time up to a maximum aggregate principal amount outstanding at any time of $750.0 million. The proceeds from the issuance of the Commercial Paper Notes are expected to be used for general corporate purposes, including the repayment of other debt of the Company. Our February 2014 Credit Agreement is available to repay the Commercial Paper Notes, if necessary. Aggregate borrowings outstanding under the February 2014 Credit Agreement and the Commercial Paper Notes will not exceed the $1.0 billion current maximum amount available under the February 2014 Credit Agreement. The Commercial Paper Notes will be sold at a discount from par, or alternatively, will be sold at par and bear interest at rates that will vary based upon market conditions at the time of issuance. The maturities of the Commercial Paper Notes will vary but may not exceed 397 days from the date of issue. The definitive documents relating to the commercial paper program contain customary representations, warranties, default and indemnification provisions. At December 31, 2015, we had $351.3 million of Commercial Paper Notes outstanding bearing a weighted-average interest rate of approximately 1.07% and a weighted-average maturity of 29 days.
August 2014 Term Loan Agreement and Cash Bridge Facility
On August 15, 2014, we entered into a term loan credit agreement (the “August 2014 Term Loan Agreement”) providing for a tranche of senior unsecured term loans in an aggregate amount of $1.0 billion that were intended to be used as short-term borrowings to fund a portion of the cash consideration for the Rockwood acquisition and pay related fees and expenses. In January 2015, we borrowed and repaid $1.0 billion and $816.5 million, respectively, under the August 2014 Term Loan Agreement. In February 2015, the remaining balance outstanding was repaid in full. The weighted-average interest rate on borrowings under the August 2014 Term Loan Agreement was approximately 1.67%. This agreement matured 364 days following the date of funding, which occurred on January 12, 2015.
On December 2, 2014, we entered into an agreement for a senior unsecured cash bridge facility (the “Cash Bridge Facility”) pursuant to which the lenders thereunder would provide up to $1.15 billion in loans intended to be used as short-term borrowings to fund a portion of the cash consideration for the Rockwood acquisition and pay related fees and expenses, with maturity 60 days following the completion of the Rockwood acquisition. In January 2015, we borrowed and repaid $800.0 million under the Cash Bridge Facility. The weighted-average interest rate on borrowings under the Cash Bridge Facility was approximately 1.67%.
Structuring and underwriting fees of approximately $19.0 million were paid in 2014 in connection with bridge financing arrangements, which are reflected in Other, net, in our consolidated statements of cash flows. These costs were capitalized and were expensed over the term of the facilities or until the date at which permanent financing was obtained and the facilities were eliminated. Accordingly, we expensed $16.7 million in 2014 and $2.3 million in 2015, which is reflected in Other income(expenses), net, in the consolidated statements of income and Other, net, in our consolidated statements of cash flows.
Financing Costs
Debt financing costs paid in 2014 in connection with the 2014 Senior Notes, August 2014 Term Loan Agreement and February 2014 Credit Agreement were $17.6 million. In 2015, we paid approximately $4.5 million of debt financing costs
87
Albemarle Corporation and Subsidiaries | ||
NOTES TO THE CONSOLIDATED FINANCIAL STATEMENTS | ||
primarily related to the 2014 Senior Notes, the September 2015 Term Loan Agreement and amendments to the February 2014 Credit Agreement.
Other
We have additional uncommitted credit lines with various U.S. and foreign financial institutions that provide for borrowings of up to approximately $257 million at December 31, 2015. Outstanding borrowings under these agreements were $98.9 million and $27.1 million at December 31, 2015 and 2014, respectively. The average interest rate on borrowings under these agreements during 2015, 2014 and 2013 was approximately 0.74%, 0.83% and 0.76%, respectively.
At December 31, 2015 and 2014, we had the ability and intent to refinance our borrowings under our other existing credit lines with borrowings under the February 2014 Credit Agreement. Therefore, the amounts outstanding under those credit lines, if any, are classified as long-term debt at December 31, 2015 and 2014. At December 31, 2015, we had the ability to borrow $648.7 million under our commercial paper program and the February 2014 Credit Agreement.
We believe that as of December 31, 2015, we were, and currently are, in compliance with all of our debt covenants.
NOTE 15—Pension Plans and Other Postretirement Benefits:
We maintain various noncontributory defined benefit pension plans covering certain employees, primarily in the U.S., the United Kingdom (“U.K.”), Germany and Japan. In connection with the acquisition of Rockwood, in the first quarter of 2015 we assumed the obligations of various defined benefit pension plans that were maintained by Rockwood which cover certain employees, primarily in the U.S., the U.K. and Germany. We also have a contributory defined benefit plan covering certain Belgian employees. The benefits for these plans are based primarily on compensation and/or years of service. Our U.S. and U.K. defined benefit plans for non-represented employees are closed to new participants, with no additional benefits accruing under these plans as participants’ accrued benefits have been frozen. The funding policy for each plan complies with the requirements of relevant governmental laws and regulations. The pension information for all periods presented includes amounts related to salaried and hourly plans.
The following provides a reconciliation of benefit obligations, plan assets and funded status, as well as a summary of significant assumptions, for our defined benefit pension plans (in thousands):
88
Albemarle Corporation and Subsidiaries | ||
NOTES TO THE CONSOLIDATED FINANCIAL STATEMENTS | ||
Year Ended December 31, 2015 | Year Ended December 31, 2014 | ||||||||||||||
U.S. Pension Plans | Foreign Pension Plans | U.S. Pension Plans | Foreign Pension Plans | ||||||||||||
Change in benefit obligations: | |||||||||||||||
Benefit obligation at January 1 | $ | 729,652 | $ | 53,112 | $ | 629,337 | $ | 49,245 | |||||||
Service cost | 1,233 | 6,034 | 7,029 | 1,746 | |||||||||||
Interest cost | 31,231 | 9,875 | 30,491 | 1,571 | |||||||||||
Plan amendments | — | 870 | — | — | |||||||||||
Actuarial (gain) loss | (55,851 | ) | (42,977 | ) | 130,887 | 10,341 | |||||||||
Benefits paid | (38,300 | ) | (16,118 | ) | (37,866 | ) | (3,913 | ) | |||||||
Acquisitions | 39,125 | 416,150 | — | — | |||||||||||
Divestitures(a) | — | — | (30,226 | ) | — | ||||||||||
Reclass to liabilities held for sale | — | (26,608 | ) | — | — | ||||||||||
Employee contributions | — | 478 | — | 283 | |||||||||||
Foreign exchange gain | — | (26,708 | ) | — | (6,161 | ) | |||||||||
Settlements/curtailments | — | (582 | ) | — | — | ||||||||||
Other | — | 331 | — | — | |||||||||||
Benefit obligation at December 31 | $ | 707,090 | $ | 373,857 | $ | 729,652 | $ | 53,112 | |||||||
Change in plan assets: | |||||||||||||||
Fair value of plan assets at January 1 | $ | 598,250 | $ | 9,444 | $ | 605,604 | $ | 10,941 | |||||||
Actual return on plan assets | (16,789 | ) | 140 | 53,696 | 499 | ||||||||||
Employer contributions | 1,606 | 16,392 | 7,042 | 2,940 | |||||||||||
Benefits paid | (38,300 | ) | (16,118 | ) | (37,866 | ) | (3,913 | ) | |||||||
Acquisitions | 29,314 | 109,875 | — | — | |||||||||||
Divestitures(a) | — | — | (30,226 | ) | — | ||||||||||
Employee contributions | — | 478 | — | 283 | |||||||||||
Foreign exchange loss | — | (3,237 | ) | — | (1,306 | ) | |||||||||
Settlements/curtailments | — | (582 | ) | — | — | ||||||||||
Other | — | 314 | — | — | |||||||||||
Fair value of plan assets at December 31 | $ | 574,081 | $ | 116,706 | $ | 598,250 | $ | 9,444 | |||||||
Funded status at December 31 | $ | (133,009 | ) | $ | (257,151 | ) | $ | (131,402 | ) | $ | (43,668 | ) | |||
(a) | Reduction in benefit obligations and plan assets in 2014 is in connection with the sale of our antioxidant, ibuprofen and propofol businesses and assets which closed on September 1, 2014. See Note 3 “Divestitures” for additional information about this transaction. |
89
Albemarle Corporation and Subsidiaries | ||
NOTES TO THE CONSOLIDATED FINANCIAL STATEMENTS | ||
December 31, 2015 | December 31, 2014 | ||||||||||||||
U.S. Pension Plans | Foreign Pension Plans | U.S. Pension Plans | Foreign Pension Plans | ||||||||||||
Amounts recognized in consolidated balance sheets: | |||||||||||||||
Current liabilities (accrued expenses) | $ | (1,110 | ) | $ | (7,498 | ) | $ | (3,219 | ) | $ | (1,316 | ) | |||
Noncurrent liabilities (pension benefits) | (131,899 | ) | (249,653 | ) | (128,183 | ) | (42,352 | ) | |||||||
Net pension liability | $ | (133,009 | ) | $ | (257,151 | ) | $ | (131,402 | ) | $ | (43,668 | ) | |||
Amounts recognized in accumulated other comprehensive (loss) income: | |||||||||||||||
Prior service benefit | $ | (211 | ) | $ | (1,052 | ) | $ | (286 | ) | $ | (321 | ) | |||
Net amount recognized | $ | (211 | ) | $ | (1,052 | ) | $ | (286 | ) | $ | (321 | ) | |||
Weighted-average assumptions used to determine benefit obligations at December 31: | |||||||||||||||
Discount rate | 4.67 | % | 2.89 | % | 4.19 | % | 1.85 | % | |||||||
Rate of compensation increase | — | % | 3.17 | % | — | % | 3.40 | % | |||||||
The accumulated benefit obligation for all defined benefit pension plans was $1.1 billion and $776.6 million at December 31, 2015 and 2014, respectively.
Postretirement medical benefits and life insurance is provided for certain groups of U.S. retired employees. Medical and life insurance benefit costs have been funded principally on a pay-as-you-go basis. Although the availability of medical coverage after retirement varies for different groups of employees, the majority of employees who retire before becoming eligible for Medicare can continue group coverage by paying a portion of the cost of a monthly premium designed to cover the claims incurred by retired employees subject to a cap on payments allowed. The availability of group coverage for Medicare-eligible retirees also varies by employee group with coverage designed either to supplement or coordinate with Medicare. Retirees generally pay a portion of the cost of the coverage. Plan assets for retiree life insurance are held under an insurance contract and are reserved for retiree life insurance benefits. In 2005, the postretirement medical benefit available to U.S. employees was changed to provide that employees who are under age 50 as of December 31, 2005 would no longer be eligible for a company-paid retiree medical premium subsidy. Employees who are of age 50 and above as of December 31, 2005 and who retire after January 1, 2006 will have their retiree medical premium subsidy capped. Effective January 1, 2008, our medical insurance for certain groups of U.S. retired employees is now insured through a medical carrier.
90
Albemarle Corporation and Subsidiaries | ||
NOTES TO THE CONSOLIDATED FINANCIAL STATEMENTS | ||
The following provides a reconciliation of benefit obligations, plan assets and funded status, as well as a summary of significant assumptions, for our postretirement benefit plans (in thousands):
Year Ended December 31, | |||||||
2015 | 2014 | ||||||
Other Postretirement Benefits | Other Postretirement Benefits | ||||||
Change in benefit obligations: | |||||||
Benefit obligation at January 1 | $ | 64,500 | $ | 62,832 | |||
Service cost | 137 | 216 | |||||
Interest cost | 2,573 | 3,040 | |||||
Actuarial (gain) loss | (5,682 | ) | 3,741 | ||||
Benefits paid | (5,042 | ) | (5,329 | ) | |||
Acquisitions | 2,607 | — | |||||
Settlements/curtailments(a) | (2,594 | ) | — | ||||
Benefit obligation at December 31 | $ | 56,499 | $ | 64,500 | |||
Change in plan assets: | |||||||
Fair value of plan assets at January 1 | $ | 4,439 | $ | 5,620 | |||
Actual return on plan assets | 280 | 214 | |||||
Employer contributions | 3,615 | 3,934 | |||||
Benefits paid | (5,042 | ) | (5,329 | ) | |||
Fair value of plan assets at December 31 | $ | 3,292 | $ | 4,439 | |||
Funded status at December 31 | $ | (53,207 | ) | $ | (60,061 | ) | |
(a) | We assumed responsibility for one domestic OPEB plan in connection with the acquisition of Rockwood which covered a small number of active employees and retirees. This plan was terminated in the first quarter of 2015 and provisions were made for the affected employees and retirees to receive benefits under an existing plan. |
December 31, | |||||||
2015 | 2014 | ||||||
Other Postretirement Benefits | Other Postretirement Benefits | ||||||
Amounts recognized in consolidated balance sheets: | |||||||
Current liabilities (accrued expenses) | $ | (3,560 | ) | $ | (3,637 | ) | |
Noncurrent liabilities (postretirement benefits) | (49,647 | ) | (56,424 | ) | |||
Net postretirement liability | $ | (53,207 | ) | $ | (60,061 | ) | |
Amounts recognized in accumulated other comprehensive (loss) income: | |||||||
Prior service benefit | $ | 239 | $ | 334 | |||
Net amount recognized | $ | 239 | $ | 334 | |||
Weighted-average assumptions used to determine benefit obligations at December 31: | |||||||
Discount rate | 4.59 | % | 4.15 | % | |||
Rate of compensation increase | 3.50 | % | 3.50 | % | |||
91
Albemarle Corporation and Subsidiaries | ||
NOTES TO THE CONSOLIDATED FINANCIAL STATEMENTS | ||
The components of pension benefits cost (credit) are as follows (in thousands):
Year Ended | Year Ended | Year Ended | |||||||||||||||||||||
December 31, 2015 | December 31, 2014 | December 31, 2013 | |||||||||||||||||||||
U.S. Pension Plans | Foreign Pension Plans | U.S. Pension Plans | Foreign Pension Plans | U.S. Pension Plans | Foreign Pension Plans | ||||||||||||||||||
Service cost | $ | 1,233 | $ | 6,034 | $ | 7,029 | $ | 1,746 | $ | 12,177 | $ | 1,785 | |||||||||||
Interest cost | 31,231 | 9,875 | 30,491 | 1,571 | 28,406 | 1,477 | |||||||||||||||||
Expected return on assets | (41,635 | ) | (6,507 | ) | (39,714 | ) | (427 | ) | (38,975 | ) | (417 | ) | |||||||||||
Actuarial loss (gain) | 2,577 | (35,813 | ) | 116,705 | 10,270 | (130,297 | ) | (2,619 | ) | ||||||||||||||
Amortization of prior service benefit | 75 | 43 | (727 | ) | 50 | (741 | ) | 52 | |||||||||||||||
Total net pension benefits (credit) cost | $ | (6,519 | ) | $ | (26,368 | ) | $ | 113,784 | $ | 13,210 | $ | (129,430 | ) | $ | 278 | ||||||||
Weighted-average assumption percentages: | |||||||||||||||||||||||
Discount rate | 4.18 | % | 2.34 | % | 5.14 | % | 3.41 | % | 4.10 | % | 3.12 | % | |||||||||||
Expected return on plan assets | 6.85 | % | 5.63 | % | 6.91 | % | 4.00 | % | 7.25 | % | 4.35 | % | |||||||||||
Rate of compensation increase | — | % | 3.16 | % | 3.50 | % | 3.16 | % | 3.50 | % | 3.36 | % | |||||||||||
Effective January 1, 2016, the weighted-average expected rate of return on plan assets for the U.S. and foreign defined benefit pension plans is 6.90% and 5.65%, respectively.
The estimated amounts to be amortized from accumulated other comprehensive loss into net periodic pension costs during 2016 are as follows (in thousands):
U.S. Pension Plans | Foreign Pension Plans | ||||||
Amortization of prior service benefit | $ | 75 | $ | 853 | |||
The components of postretirement benefits cost (credit) are as follows (in thousands):
Year Ended December 31, | |||||||||||
2015 | 2014 | 2013 | |||||||||
Other Postretirement Benefits | Other Postretirement Benefits | Other Postretirement Benefits | |||||||||
Service cost | $ | 137 | $ | 216 | $ | 309 | |||||
Interest cost | 2,573 | 3,040 | 2,764 | ||||||||
Expected return on assets | (244 | ) | (342 | ) | (413 | ) | |||||
Actuarial (gain) loss | (5,707 | ) | 3,868 | (6,120 | ) | ||||||
Amortization of prior service benefit | (95 | ) | (95 | ) | (95 | ) | |||||
Settlements/curtailments | (2,594 | ) | — | — | |||||||
Total net postretirement benefits (credit) cost | $ | (5,930 | ) | $ | 6,687 | $ | (3,555 | ) | |||
Weighted-average assumption percentages: | |||||||||||
Discount rate | 4.15 | % | 5.03 | % | 4.00 | % | |||||
Expected return on plan assets | 7.00 | % | 7.00 | % | 7.00 | % | |||||
Rate of compensation increase | 3.50 | % | 3.50 | % | 3.50 | % | |||||
Effective January 1, 2016, the weighted-average expected rate of return on plan assets for our postretirement benefit plans is 7.00%.
92
Albemarle Corporation and Subsidiaries | ||
NOTES TO THE CONSOLIDATED FINANCIAL STATEMENTS | ||
The estimated amounts to be amortized from accumulated other comprehensive loss into net periodic postretirement costs during 2016 are as follows (in thousands):
Other Postretirement Benefits | |||
Amortization of prior service benefit | $ | (95 | ) |
Fair value is defined as the price that would be received to sell an asset or paid to transfer a liability in an orderly transaction between market participants at the measurement date (exit price). The inputs used to measure fair value are classified into the following hierarchy:
Level 1 | Unadjusted quoted prices in active markets for identical assets or liabilities |
Level 2 | Unadjusted quoted prices in active markets for similar assets or liabilities, or unadjusted quoted prices for identical or similar assets or liabilities in markets that are not active, or inputs other than quoted prices that are observable for the asset or liability |
Level 3 | Unobservable inputs for the asset or liability |
We endeavor to utilize the best available information in measuring fair value. Financial assets and liabilities are classified in their entirety based on the lowest level of input that is significant to the fair value measurement. Transfers between levels of the fair value hierarchy are deemed to have occurred on the date of the event or change in circumstance that caused the transfer. There were no transfers between Levels 1 and 2 during the year ended December 31, 2015. Investments for which market quotations are readily available are valued at the closing price on the last business day of the year. Listed securities for which no sale was reported on such date are valued at the mean between the last reported bid and asked price. Securities traded in the over-the-counter market are valued at the closing price on the last business day of the year or at bid price. The net asset value of shares or units is based on the quoted market value of the underlying assets. The market value of corporate bonds is based on institutional trading lots and is most often reflective of bid price. Government securities are valued at the mean between bid and ask prices. Holdings in private equity securities are typically valued using the net asset valuations provided by the underlying private investment companies.
The following table sets forth the assets of our pension and postretirement plans that were accounted for at fair value on a recurring basis as of December 31, 2015 (in thousands):
December 31, 2015 | Quoted Prices in Active Markets for Identical Items (Level 1) | Quoted Prices in Active Markets for Similar Items (Level 2) | Unobservable Inputs (Level 3) | ||||||||||||
Pension Assets: | |||||||||||||||
Domestic Equity(a) | $ | 168,945 | $ | 166,612 | $ | 2,333 | $ | — | |||||||
International Equity(b) | 143,976 | 87,311 | 56,665 | — | |||||||||||
Fixed Income(c) | 287,809 | 240,143 | 47,666 | — | |||||||||||
Absolute Return(d) | 83,127 | — | — | 83,127 | |||||||||||
Cash | 6,930 | 6,930 | — | — | |||||||||||
Total Pension Assets | $ | 690,787 | $ | 500,996 | $ | 106,664 | $ | 83,127 | |||||||
Postretirement Assets: | |||||||||||||||
Fixed Income(c) | $ | 3,292 | $ | — | $ | 3,292 | $ | — | |||||||
(a) | Consists primarily of U.S. stock funds that track or are actively managed and measured against the S&P 500 index. |
(b) | Consists primarily of international equity funds which invest in common stocks and other securities whose value is based on an international equity index or an underlying equity security or basket of equity securities. |
(c) | Consists primarily of debt obligations issued by governments, corporations, municipalities and other borrowers. Also includes insurance policies. |
(d) | Consists primarily of funds with holdings in private investment companies. See additional information about the Absolute Return investments below. |
93
Albemarle Corporation and Subsidiaries | ||
NOTES TO THE CONSOLIDATED FINANCIAL STATEMENTS | ||
The table below sets forth a summary of changes in the fair value of the plans’ Level 3 assets for the year ended December 31, 2015 (in thousands):
Absolute Return: | Year Ended December 31, 2015 | ||
Beginning Balance | $ | 80,740 | |
Transfers in due to acquisition | 103,237 | ||
Purchases | 5,641 | ||
Sales | (103,035 | ) | |
Total losses relating to assets sold during the period(a) | (610 | ) | |
Total unrealized losses relating to assets still held at the reporting date(a) | (2,846 | ) | |
Ending Balance | $ | 83,127 | |
(a) | These losses are recognized in the consolidated balance sheets and are included as changes in plan assets in the tables above. |
The following table sets forth the assets of our pension and postretirement plans that were accounted for at fair value on a recurring basis as of December 31, 2014 (in thousands):
December 31, 2014 | Quoted Prices in Active Markets for Identical Items (Level 1) | Quoted Prices in Active Markets for Similar Items (Level 2) | Unobservable Inputs (Level 3) | ||||||||||||
Pension Assets: | |||||||||||||||
Domestic Equity(a) | $ | 169,581 | $ | 169,581 | $ | — | $ | — | |||||||
International Equity(b) | 85,007 | 85,007 | — | — | |||||||||||
Fixed Income(c) | 268,911 | 255,828 | 13,083 | — | |||||||||||
Absolute Return(d) | 80,740 | — | — | 80,740 | |||||||||||
Cash | 3,455 | 3,455 | — | — | |||||||||||
Total Pension Assets | $ | 607,694 | $ | 513,871 | $ | 13,083 | $ | 80,740 | |||||||
Postretirement Assets: | |||||||||||||||
Fixed Income(c) | $ | 4,439 | $ | — | $ | 4,439 | $ | — | |||||||
(a) | Consists primarily of U.S. stock funds that track or are actively managed and measured against the S&P 500 index. |
(b) | Consists primarily of international equity funds which invest in common stocks and other securities whose value is based on an international equity index or an underlying equity security or basket of equity securities. |
(c) | Consists primarily of debt obligations issued by governments, corporations, municipalities and other borrowers. Also includes insurance policies. |
(d) | Consists primarily of funds with holdings in private investment companies. See additional information about the Absolute Return investments below. |
The table below sets forth a summary of changes in the fair value of the plans’ Level 3 assets for the year ended December 31, 2014 (in thousands):
Absolute Return: | Year Ended December 31, 2014 | ||
Beginning Balance | $ | 123,599 | |
Purchases | 50,506 | ||
Sales | (96,397 | ) | |
Total losses relating to assets sold during the period(a) | (158 | ) | |
Total unrealized gains relating to assets still held at the reporting date(a) | 3,190 | ||
Ending Balance | $ | 80,740 | |
(a) | These (losses) gains are recognized in the consolidated balance sheets and are included as changes in plan assets in the tables above. |
The Company’s pension plan assets in the U.S. and U.K. represent approximately 98% of the total pension plan assets. The investment objective of these pension plan assets is to achieve solid returns while preserving capital to meet current plan cash flow requirements. Assets should participate in rising markets, with defensive action in declining markets expected to an
94
Albemarle Corporation and Subsidiaries | ||
NOTES TO THE CONSOLIDATED FINANCIAL STATEMENTS | ||
even greater degree. Depending on market conditions, the broad asset class targets may range up or down by approximately 10%. These asset classes include but are not limited to hedge fund of funds, bonds and other fixed income vehicles, high yield fixed income securities, equities and distressed debt. At December 31, 2015 and 2014, equity securities held by our pension and OPEB plans did not include direct ownership of Albemarle common stock.
The weighted-average target allocations as of the measurement date are as follows:
Target Allocation | ||
Equity securities | 44 | % |
Fixed income | 43 | % |
Absolute return | 12 | % |
Other | 1 | % |
Our Absolute Return investments consist primarily of our investments in hedge fund of funds. These are holdings in private investment companies with fair values that are based on significant unobservable inputs including assumptions where there is little, if any, market activity for the investment. Investment managers or fund managers associated with these investments provide valuations of the investments on a monthly basis utilizing the net asset valuation approach for determining fair values. These valuations are reviewed by the Company for reasonableness based on applicable sector, benchmark and company performance to validate the appropriateness of the net asset values as a fair value measurement. Where available, audited financial statements are obtained and reviewed for the investments as support for the manager’s investment valuation. In general, the investment objective of these funds is high risk-adjusted returns with an emphasis on preservation of capital. The investment strategies of each of the funds vary; however, the objective of our Absolute Return investments is complementary to the overall investment objective of our U.S. pension plan assets.
We made contributions to our defined benefit pension and OPEB plans of $21.6 million, $13.9 million and $13.3 million during the years ended December 31, 2015, 2014 and 2013, respectively. We expect contributions to our domestic nonqualified and foreign qualified and nonqualified pension plans to approximate $13 million in 2016. Also, we expect to pay approximately $4 million in premiums to our U.S. postretirement benefit plan in 2016. However, we may choose to make additional voluntary pension contributions in excess of these amounts.
The current forecast of benefit payments, which reflects expected future service and excludes plans associated with businesses that were divested in the first quarter of 2016, amounts to (in millions):
U.S. Pension Plans | Foreign Pension Plans | Other Postretirement Benefits | |||||||||
2016 | $ | 40.3 | $ | 13.9 | $ | 4.8 | |||||
2017 | $ | 41.4 | $ | 14.7 | $ | 4.7 | |||||
2018 | $ | 42.8 | $ | 14.6 | $ | 4.5 | |||||
2019 | $ | 43.8 | $ | 14.5 | $ | 4.3 | |||||
2020 | $ | 44.8 | $ | 15.1 | $ | 4.1 | |||||
2021-2025 | $ | 230.9 | $ | 83.5 | $ | 18.8 | |||||
We have a supplemental executive retirement plan (“SERP”), which provides unfunded supplemental retirement benefits to certain management or highly compensated employees. The SERP provides for incremental pension benefits to offset the limitations imposed on qualified plan benefits by federal income tax regulations. Costs (credits) relating to our SERP were ($2.1) million, $7.3 million and ($1.5) million for the years ended December 31, 2015, 2014 and 2013, respectively. The projected benefit obligation for the SERP recognized in the consolidated balance sheets at December 31, 2015 and 2014 was $23.1 million and $26.4 million, respectively. The benefit expenses and obligations of this SERP are included in the tables above. Benefits of $1.1 million are expected to be paid to SERP retirees in 2016. On October 1, 2012, our Board of Directors approved amendments to the SERP, such that effective December 31, 2014, no additional benefits shall accrue under this plan and participants’ accrued benefits shall be frozen as of that date to reflect the same changes as were made under the U.S. qualified defined benefit plan.
At December 31, 2015, the assumed rate of increase in the pre-65 and post-65 per capita cost of covered health care benefits for U.S. retirees was zero as the employer-paid premium caps (pre-65 and post-65) were met starting January 1, 2013.
95
Albemarle Corporation and Subsidiaries | ||
NOTES TO THE CONSOLIDATED FINANCIAL STATEMENTS | ||
Defined Contribution Plans
On March 31, 2004, a new defined contribution pension plan benefit was adopted under the qualified defined contribution plan for U.S. non-represented employees hired after March 31, 2004. On October 1, 2012 our Board of Directors approved certain plan amendments, such that effective January 1, 2013, the defined contribution pension plan benefit is expanded to include non-represented employees hired prior to March 31, 2004, and revised the contribution for all participants to be based on 5% of eligible employee compensation. The employer portion of contributions to our U.S. defined contribution pension plan amounted to $12.8 million, $8.4 million, and $8.8 million in 2015, 2014 and 2013, respectively.
Certain of our employees participate in our defined contribution 401(k) employee savings plan, which is generally available to all U.S. full-time salaried and non-union hourly employees and to employees who are covered by a collective bargaining agreement that provides for such participation. This U.S. defined contribution plan is funded with contributions made by the participants and us. Our contributions to the 401(k) plan amounted to $11.7 million, $10.0 million and $10.6 million in 2015, 2014 and 2013, respectively. Contributions for 2015 include our contributions to Rockwood’s former 401(k) plan which was merged into Albemarle’s 401(k) plan effective December 1, 2015.
In 2006, we formalized a new plan in the Netherlands similar to a collective defined contribution plan. The collective defined contribution plan is supported by annuity contracts through an insurance company. The insurance company unconditionally undertakes the legal obligation to provide specific benefits to specific individuals in return for a fixed amount of premiums. Our obligation under this plan is limited to a variable calculated employer match for each participant plus an additional fixed amount of contributions to assist in covering estimated cost of living and salary increases (indexing) and administrative costs for the overall plan. We paid approximately $7.2 million, $10.1 million and $10.3 million in 2015, 2014 and 2013, respectively, in annual premiums and related costs pertaining to this plan.
Multiemployer Plan
Certain current and former employees of Rockwood participate in a multiemployer plan in Germany, the Pensionskasse Dynamit Nobel Versicherungsverein auf Gegenseitigkeit, Troisdorf (“DN Pensionskasse”), that provides monthly payments in the case of disability, death or retirement. The risks of participating in a multiemployer plan are different from single-employer plans in the following ways: (a) assets contributed to the multiemployer plan by one employer may be used to provide benefits to employees of other participating employers, and (b) if a participating employer stops contributing to the plan, the unfunded obligation of the plan may be borne by remaining participating employers.
Some participants in the plan are subject to collective bargaining arrangements, which have no fixed expiration date. The contribution and benefit levels are not negotiated or significantly influenced by these collective bargaining arrangements. Also, the benefit levels generally are not subject to reduction. Under German insurance law, the DN Pensionskasse must be fully funded at all times. The DN Pensionskasse was fully funded as of December 31, 2014, the date of the most recently available information for the plan. This funding level would correspond to the highest funding zone status (at least 80% funded) under U.S. pension regulation. Since the plan liabilities need to be fully funded at all times according to local funding requirements, it is unlikely that the DN Pensionskasse plan will fail to fulfill its obligations, however, in such an event, the Company is liable for the benefits of its employees who participate in the plan. Additional information of the DN Pensionskasse is available in the public domain.
The majority of the Company’s contributions are tied to employees’ contributions, which are generally calculated as a percentage of base compensation, up to a certain statutory ceiling. Our contributions to this plan were €2.7 million (approximately $3.1 million) during the year ended December 31, 2015. The Company’s contributions represented more than 5% of total contributions to the DN Pensionskasse in 2015. Although the DN Pensionskasse could be subject to a funding improvement plan (“FIP”) in 2016, the DN Pensionskasse was not subject to a FIP at December 31, 2015.
96
Albemarle Corporation and Subsidiaries | ||
NOTES TO THE CONSOLIDATED FINANCIAL STATEMENTS | ||
NOTE 16—Other Noncurrent Liabilities:
Other noncurrent liabilities consist of the following at December 31, 2015 and 2014 (in thousands):
December 31, | |||||||
2015 | 2014 | ||||||
Liabilities related to uncertain tax positions(a) | $ | 101,677 | $ | 25,340 | |||
Executive deferred compensation plan obligation | 21,631 | 22,168 | |||||
Environmental liabilities(b) | 33,805 | 4,841 | |||||
Asset retirement obligations(b) | 37,230 | 15,085 | |||||
Other | 60,483 | 20,271 | |||||
Total | $ | 254,826 | $ | 87,705 | |||
(a) | See Note 20, “Income Taxes.” |
(b) | See Note 17, “Commitments and Contingencies.” |
NOTE 17—Commitments and Contingencies:
In connection with the closing of the Rockwood acquisition on January 12, 2015, we have become liable for both recorded and unrecorded contingencies of Rockwood. We are not aware of any unrecorded contingencies assumed in connection with the Rockwood acquisition whose ultimate outcome will have a material adverse effect on our consolidated results of operations, financial condition or cash flows on an annual basis, although any such sum could have a material adverse impact on our results of operations, financial condition or cash flows in a particular quarterly reporting period. We believe that amounts recorded are adequate for known items which might become due in the current year.
Environmental
We had the following activity in our recorded environmental liabilities for the years ended December 31, 2015, 2014 and 2013 (in thousands):
Year Ended December 31, | |||||||||||
2015 | 2014 | 2013 | |||||||||
Balance, beginning of year | $ | 9,235 | $ | 16,599 | $ | 20,322 | |||||
Expenditures | (4,178 | ) | (4,548 | ) | (3,013 | ) | |||||
Acquisition of Rockwood | 38,666 | — | — | ||||||||
Divestitures | (1,826 | ) | (1,954 | ) | — | ||||||
Accretion of discount | 984 | — | — | ||||||||
Revisions of estimates | 150 | 34 | (902 | ) | |||||||
Reclass to liabilities held for sale | (5,253 | ) | — | — | |||||||
Foreign currency translation | (2,480 | ) | (896 | ) | 192 | ||||||
Balance, end of year | 35,298 | 9,235 | 16,599 | ||||||||
Less amounts reported in Accrued expenses | 1,493 | 4,394 | 7,386 | ||||||||
Amounts reported in Other noncurrent liabilities | $ | 33,805 | $ | 4,841 | $ | 9,213 | |||||
As part of the Rockwood acquisition, we assumed $38.7 million of environmental remediation liabilities globally, the majority of which relate to sites in Germany and the U.S. where the Company is currently operating groundwater monitoring and/or remediation systems. For certain locations where the Company is operating these groundwater monitoring and/or remediation systems, prior owners or insurers have assumed all or most of the responsibility. Environmental remediation liabilities assumed as part of the Rockwood acquisition includes discounted liabilities of $24.5 million, discounted at rates ranging from 2.8% to 4.3%, with the undiscounted amount totaling $64.5 million.
The amounts recorded represent our future remediation and other anticipated environmental liabilities. These liabilities typically arise during the normal course of our operational and environmental management activities or at the time of acquisition of the site, and are based on internal analysis as well as input from outside consultants. As evaluations proceed at each relevant site, changes in risk assessment practices, remediation techniques and regulatory requirements can occur, therefore such liability estimates may be adjusted accordingly. The timing and duration of remediation activities at these sites will be determined when evaluations are completed. Although it is difficult to quantify the potential financial impact of these remediation liabilities, management estimates (based on the latest available information) that there is a reasonable possibility
97
Albemarle Corporation and Subsidiaries | ||
NOTES TO THE CONSOLIDATED FINANCIAL STATEMENTS | ||
that future environmental remediation costs associated with our past operations, in excess of amounts already recorded, could be up to approximately $18 million before income taxes.
We believe that any sum we may be required to pay in connection with environmental remediation matters in excess of the amounts recorded would likely occur over a period of time and would likely not have a material adverse effect upon our results of operations, financial condition or cash flows on a consolidated annual basis although any such sum could have a material adverse impact on our results of operations, financial condition or cash flows in a particular quarterly reporting period.
Asset Retirement Obligations
The following is a reconciliation of our beginning and ending asset retirement obligation balances for 2015 and 2014 (in thousands):
Year Ended December 31, | |||||||
2015 | 2014 | ||||||
Balance, beginning of year | $ | 15,085 | $ | 16,930 | |||
Acquisition of Rockwood | 17,265 | — | |||||
Liabilities incurred | 3,636 | — | |||||
Accretion of discount | 1,289 | 323 | |||||
Liabilities settled | — | (333 | ) | ||||
Divestitures | — | (1,816 | ) | ||||
Foreign currency translation adjustments | (45 | ) | (19 | ) | |||
Balance, end of year | $ | 37,230 | $ | 15,085 | |||
Our asset retirement obligations are recorded in Other noncurrent liabilities in the condensed consolidated balance sheets. Asset retirement obligations assumed through the acquisition of Rockwood primarily relate to post-closure reclamation of sites involved in the surface mining and manufacturing of lithium. We are not aware of any conditional asset retirement obligations that would require recognition in our consolidated financial statements.
Rental Expense
Our rental expenses include a number of operating lease agreements, primarily for office space, transportation equipment and storage facilities. We also have certain buildings and improvements under capital lease. The following schedule details the future non-cancelable minimum lease payments for the next five years and thereafter (in thousands):
Operating Leases | Capital Leases | ||||||
2016 | $ | 14,643 | $ | 3,163 | |||
2017 | $ | 10,664 | $ | 3,178 | |||
2018 | $ | 9,217 | $ | 3,193 | |||
2019 | $ | 7,436 | $ | 10,201 | |||
2020 | $ | 6,665 | $ | — | |||
Thereafter | $ | 21,124 | $ | — | |||
19,735 | |||||||
Less: amount representing interest | 2,928 | ||||||
Present value of net minimum obligations | $ | 16,807 | |||||
Rental expense was approximately $45.0 million, $31.9 million, and $30.7 million for 2015, 2014 and 2013, respectively. Rental expense related to discontinued operations was approximately $1.3 million and $1.6 million for 2014 and 2013, respectively. Rental expense is shown net of sublease income which was minimal during 2015, 2014 and 2013.
98
Albemarle Corporation and Subsidiaries | ||
NOTES TO THE CONSOLIDATED FINANCIAL STATEMENTS | ||
Litigation
We are involved from time to time in legal proceedings of types regarded as common in our business, including administrative or judicial proceedings seeking remediation under environmental laws, such as the federal Comprehensive Environmental Response, Compensation and Liability Act, commonly known as CERCLA or Superfund, products liability, breach of contract liability and premises liability litigation. Where appropriate, we may establish financial reserves for such proceedings. We also maintain insurance to mitigate certain of such risks. Costs for legal services are generally expensed as incurred.
Also see Note 2, “Acquisitions” for a discussion about litigation matters in connection with the Acquisition of Rockwood.
Indemnities
We are indemnified by third parties in connection with certain matters related to acquired and divested businesses. Although we believe that the financial condition of those parties who may have indemnification obligations to the Company is generally sound, in the event the Company seeks indemnity under any of these agreements or through other means, there can be no assurance that any party who may have obligations to indemnify us will adhere to their obligations and we may have to resort to legal action to enforce our rights under the indemnities.
The Company may be subject to indemnity claims relating to properties or businesses it divested, including properties or businesses that Rockwood divested prior to the Acquisition Closing Date. In the opinion of management, and based upon information currently available, the ultimate resolution of any indemnification obligations owed to the Company or by the Company is not expected to have a material effect on the Company’s financial condition, results of operations or cash flows.
Other
The Company has standby letters of credit and guarantees with various financial institutions. The following table summarizes our letters of credit and guarantee agreements (in thousands):
2016 | 2017 | 2018 | 2019 | 2020 | Thereafter | ||||||||||||||||||
Letters of credit and other guarantees | $ | 24,789 | $ | 11,248 | $ | 3,190 | $ | 14 | $ | 210 | $ | 24,356 | |||||||||||
The outstanding letters of credit are primarily related to insurance claim payment guarantees with expiration dates ranging from 2016 to 2022. The majority of the Company’s other guarantees have terms of one year and mainly consist of performance and environmental guarantees, as well as guarantees to customs and port authorities. The guarantees arose during the ordinary course of business.
We do not have recorded reserves for the letters of credit and guarantees as of December 31, 2015. We are unable to estimate the maximum amount of the potential future liability under guarantees and letters of credit. However, we accrue for any potential loss for which we believe a future payment is probable and a range of loss can be reasonably estimated. We believe our liability under such obligations is immaterial.
We currently, and are from time to time, subject to transactional audits in various taxing jurisdictions and to customs audits globally. We do not expect the financial impact of any of these audits to have a material adverse effect on the Company’s results of operations, financial condition or cash flows.
NOTE 18—Stock-based Compensation Expense:
Incentive Plans
We have various share-based compensation plans that authorize the granting of (i) stock options to purchase shares of our common stock, (ii) restricted stock and restricted stock units, (iii) performance unit awards and (iv) stock appreciation rights (“SARs”) to employees and non-employee directors. The plans provide for payment of incentive awards in one or more of the following at our option: cash, shares of our common stock, qualified and non-qualified stock options, SARs, restricted stock awards, restricted stock unit awards and performance unit awards. The share-based awards granted by us generally contain vesting provisions ranging from one to five years, and with respect to stock options granted by us, have a term of not more than ten years from the date of grant. Stock options granted to employees generally vest over three years and have a term of ten years. Restricted stock and restricted stock unit awards vest in periods ranging from one to five years from the date of grant. Performance unit awards are earned at a level ranging from 0% to 200% contingent upon the achievement of specific performance criteria over periods ranging from one to three years. Distribution of earned units occurs generally 50% upon completion of the applicable measurement period with the remaining 50% distributed one year thereafter.
99
Albemarle Corporation and Subsidiaries | ||
NOTES TO THE CONSOLIDATED FINANCIAL STATEMENTS | ||
We granted 313,803, 222,939 and 297,924 stock options during 2015, 2014 and 2013, respectively. There were no significant modifications made to any share-based grants during these periods.
On April 20, 2010, the maximum number of shares available for issuance to participants under the Albemarle Corporation 2008 Incentive Plan (the “Incentive Plan”) increased by 4,470,000 shares to 7,470,000 shares. With respect to any awards, other than stock options or SARs, the number of shares available for awards under the Incentive Plan were reduced by 1.6 shares for each share covered by such award or to which such award related. Effective May 7, 2013, the Albemarle Corporation 2008 Stock Compensation Plan for Non-Employee Directors and the 1996 Directors’ Deferred Compensation Plan (as amended and restated in 2005) were merged into the Albemarle Corporation 2013 Stock Compensation and Deferral Election Plan for Non-Employee Directors (the “Non-Employee Directors Plan”). Under the Non-Employee Directors Plan, a maximum aggregate number of 500,000 shares of our common stock is authorized for issuance to the Company’s non-employee directors; any shares remaining available for issuance under the prior plans were canceled. The aggregate fair market value of shares that may be issued to a director during any compensation year (as defined in the agreement, generally July 1 to June 30) shall not exceed $150,000. At December 31, 2015, there were 2,622,398 shares available for grant under the Incentive Plan and 451,466 shares available for grant under the Non-Employee Directors Plan.
Total stock-based compensation expense associated with our incentive plans for the years ended December 31, 2015, 2014 and 2013 amounted to $15.2 million, $14.3 million and $10.2 million, respectively, and is included in Cost of goods sold and SG&A expenses in the consolidated statements of income. Total related recognized tax benefits for the years ended December 31, 2015, 2014 and 2013 amounted to $5.6 million, $5.2 million and $3.7 million, respectively.
The following table summarizes information about the Company’s fixed-price stock options as of and for the year ended December 31, 2015:
Shares | Weighted-Average Exercise Price | Weighted-Average Remaining Contractual Term (Years) | Aggregate Intrinsic Value (in thousands) | |||||||||
Outstanding at December 31, 2014 | 1,484,243 | $ | 50.30 | 6.5 | $ | 17,887 | ||||||
Granted | 313,803 | 55.74 | ||||||||||
Exercised | (18,000 | ) | 28.72 | |||||||||
Forfeited | (98,519 | ) | 62.98 | |||||||||
Expired | (4,600 | ) | 66.14 | |||||||||
Outstanding at December 31, 2015 | 1,676,927 | $ | 50.76 | 6.1 | $ | 14,152 | ||||||
Exercisable at December 31, 2015 | 998,952 | $ | 43.95 | 4.5 | $ | 14,048 | ||||||
The fair value of each option granted during the years ended December 31, 2015, 2014 and 2013 was estimated on the date of grant using the Black-Scholes option-pricing model with the following weighted-average assumptions:
Year Ended December 31, | |||||||||||
2015 | 2014 | 2013 | |||||||||
Dividend yield | 1.80 | % | 1.71 | % | 1.58 | % | |||||
Volatility | 32.92 | % | 33.03 | % | 33.55 | % | |||||
Average expected life (years) | 6 | 6 | 6 | ||||||||
Risk-free interest rate | 2.17 | % | 2.94 | % | 2.18 | % | |||||
Fair value of options granted | $ | 16.04 | $ | 19.56 | $ | 19.73 | |||||
Dividend yield is the average of historical yields and those estimated over the average expected life. The stock volatility is based on historical volatilities of our common stock. The average expected life represents the weighted average period of time that options granted are expected to be outstanding giving consideration to vesting schedules and our historical exercise patterns. The risk-free interest rate is based on the U.S. Treasury strip rate with stripped coupon interest for the period equal to the contractual term of the share option grant in effect at the time of grant.
The intrinsic value of options exercised during the years ended December 31, 2015, 2014 and 2013 was $0.5 million, $2.4 million and $7.0 million, respectively. The intrinsic value of a stock option is the amount by which the market value of the underlying stock exceeds the exercise price of the option.
100
Albemarle Corporation and Subsidiaries | ||
NOTES TO THE CONSOLIDATED FINANCIAL STATEMENTS | ||
Total compensation cost not yet recognized for nonvested stock options outstanding as of December 31, 2015 is approximately $7.9 million and is expected to be recognized over a remaining weighted-average period of 2.3 years. Cash proceeds from stock options exercised and tax benefits related to stock options exercised were $0.5 million and $0.2 million for the year ended December 31, 2015, respectively. The Company issues new shares of common stock upon exercise of stock options and vesting of restricted common stock awards.
The following table summarizes activity in performance unit awards as of and for the year ended December 31, 2015:
Shares | Weighted-Average Grant Date Fair Value Per Share | |||||
Nonvested, beginning of period | 456,018 | $ | 66.21 | |||
Granted | 214,610 | 55.34 | ||||
Vested | (43,177 | ) | 65.39 | |||
Forfeited | (130,246 | ) | 64.50 | |||
Nonvested, end of period | 497,205 | 62.04 | ||||
The weighted average grant date fair value of performance unit awards granted in 2015, 2014 and 2013 was $11.9 million, $20.1 million and $16.9 million, respectively. Performance units awarded in 2013 include shares with a weighted average grant date fair value of $6.3 million related to awards granted in 2011 that earned at a rate of 200% based upon the achievement of specific performance criteria.
The weighted average fair value of performance unit awards that vested during 2015, 2014 and 2013 was $2.5 million, $7.4 million and $14.5 million, respectively, based on the closing prices of our common stock on the dates of vesting. Total compensation cost not yet recognized for nonvested performance unit awards outstanding as of December 31, 2015 is approximately $13.4 million, calculated based on current expectation of specific performance criteria, and is expected to be recognized over a remaining weighted-average period of approximately 1.6 years. Each performance unit represents one share of common stock.
The following table summarizes activity in non-performance based restricted stock and restricted stock unit awards as of and for the year ended December 31, 2015:
Shares | Weighted-Average Grant Date Fair Value Per Share | |||||
Nonvested, beginning of period | 105,288 | $ | 61.34 | |||
Granted | 61,156 | 56.64 | ||||
Vested | (39,073 | ) | 61.97 | |||
Forfeited | (9,250 | ) | 62.37 | |||
Nonvested, end of period | 118,121 | 58.62 | ||||
The weighted average grant date fair value of restricted stock and restricted stock unit awards granted in 2015, 2014 and 2013 was $3.5 million, $2.7 million and $3.4 million, respectively. The weighted average fair value of restricted stock and restricted stock unit awards that vested in 2015, 2014 and 2013 was $2.2 million, $2.1 million and $3.2 million, respectively, based on the closing prices of our common stock on the dates of vesting. Total compensation cost not yet recognized for nonvested, non-performance based restricted stock and restricted stock units as of December 31, 2015 is approximately $3.5 million and is expected to be recognized over a remaining weighted-average period of 2.1 years. The fair value of the non-performance based restricted stock and restricted stock units was estimated on the date of grant adjusted for a dividend factor, if necessary.
101
Albemarle Corporation and Subsidiaries | ||
NOTES TO THE CONSOLIDATED FINANCIAL STATEMENTS | ||
NOTE 19—Accumulated Other Comprehensive (Loss) Income:
The components and activity in Accumulated other comprehensive (loss) income (net of deferred income taxes) consisted of the following during the years ended December 31, 2015, 2014 and 2013 (in thousands):
Foreign Currency Translation(a) | Pension and Post-Retirement Benefits(b) | Net Investment Hedge | Interest Rate Swap(c) | Other | Total | ||||||||||||||||||
Accumulated other comprehensive income (loss) - balance at December 31, 2012 | $ | 85,117 | $ | 989 | $ | — | $ | — | $ | (842 | ) | $ | 85,264 | ||||||||||
Other comprehensive income (loss) before reclassifications | 31,704 | — | — | — | (2 | ) | 31,702 | ||||||||||||||||
Amounts reclassified from accumulated other comprehensive (loss) income | — | (502 | ) | — | — | 137 | (365 | ) | |||||||||||||||
Other comprehensive income (loss), net of tax | 31,704 | (502 | ) | — | — | 135 | 31,337 | ||||||||||||||||
Other comprehensive income attributable to noncontrolling interests | (356 | ) | — | — | — | — | (356 | ) | |||||||||||||||
Accumulated other comprehensive income (loss) - balance at December 31, 2013 | $ | 116,465 | $ | 487 | $ | — | $ | — | $ | (707 | ) | $ | 116,245 | ||||||||||
Other comprehensive (loss) income before reclassifications | (151,059 | ) | — | 11,384 | (21,174 | ) | — | (160,849 | ) | ||||||||||||||
Amounts reclassified from accumulated other comprehensive (loss) income | (17,750 | ) | (487 | ) | — | 212 | 136 | (17,889 | ) | ||||||||||||||
Other comprehensive (loss) income, net of tax | (168,809 | ) | (487 | ) | 11,384 | (20,962 | ) | 136 | (178,738 | ) | |||||||||||||
Other comprehensive loss attributable to noncontrolling interests | 80 | — | — | — | — | 80 | |||||||||||||||||
Accumulated other comprehensive (loss) income - balance at December 31, 2014 | $ | (52,264 | ) | $ | — | $ | 11,384 | $ | (20,962 | ) | $ | (571 | ) | $ | (62,413 | ) | |||||||
Other comprehensive (loss) income before reclassifications | (412,999 | ) | (774 | ) | 50,861 | — | 2 | (362,910 | ) | ||||||||||||||
Amounts reclassified from accumulated other comprehensive (loss) income | — | 16 | — | 2,101 | 27 | 2,144 | |||||||||||||||||
Other comprehensive (loss) income, net of tax | (412,999 | ) | (758 | ) | 50,861 | 2,101 | 29 | (360,766 | ) | ||||||||||||||
Other comprehensive loss attributable to noncontrolling interests | 1,891 | — | — | — | — | 1,891 | |||||||||||||||||
Accumulated other comprehensive (loss) income - balance at December 31, 2015 | $ | (463,372 | ) | $ | (758 | ) | $ | 62,245 | $ | (18,861 | ) | $ | (542 | ) | $ | (421,288 | ) | ||||||
(a) | Amounts reclassified from accumulated other comprehensive (loss) income for the year ended December 31, 2014 are included in (Loss) income from discontinued operations (net of tax) for the year ended December 31, 2014 and resulted from the release of cumulative foreign currency translation adjustments into earnings upon the sale of our antioxidant, ibuprofen and propofol businesses and assets which closed on September 1, 2014. See Note 3, “Divestitures.” |
(b) | The pre-tax portion of amounts reclassified from accumulated other comprehensive (loss) income consists of amortization of prior service benefit, which is a component of pension and postretirement benefits cost (credit). See Note 15, “Pension Plans and Other Postretirement Benefits.” |
(c) | The pre-tax portion of amounts reclassified from accumulated other comprehensive (loss) income is included in interest expense. |
102
Albemarle Corporation and Subsidiaries | ||
NOTES TO THE CONSOLIDATED FINANCIAL STATEMENTS | ||
The amount of income tax (expense) benefit allocated to each component of Other comprehensive (loss) income for the years ended December 31, 2015, 2014 and 2013 is provided in the following tables (in thousands):
Foreign Currency Translation | Pension and Postretirement Benefits | Net Investment Hedge(a) | Interest Rate Swap(b) | Other | |||||||||||||||
2015 | |||||||||||||||||||
Other comprehensive (loss) income, before tax | $ | (451,781 | ) | $ | (751 | ) | $ | 80,746 | $ | 3,336 | $ | 19 | |||||||
Income tax benefit (expense) | 38,782 | (7 | ) | (29,885 | ) | (1,235 | ) | 10 | |||||||||||
Other comprehensive (loss) income, net of tax | $ | (412,999 | ) | $ | (758 | ) | $ | 50,861 | $ | 2,101 | $ | 29 | |||||||
2014 | |||||||||||||||||||
Other comprehensive (loss) income, before tax | $ | (163,536 | ) | $ | (772 | ) | $ | 17,971 | $ | (33,091 | ) | $ | 217 | ||||||
Income tax (expense) benefit | (5,273 | ) | 285 | (6,587 | ) | 12,129 | (81 | ) | |||||||||||
Other comprehensive (loss) income, net of tax | $ | (168,809 | ) | $ | (487 | ) | $ | 11,384 | $ | (20,962 | ) | $ | 136 | ||||||
2013 | |||||||||||||||||||
Other comprehensive income (loss), before tax | $ | 29,895 | $ | (781 | ) | $ | — | $ | — | $ | 214 | ||||||||
Income tax benefit (expense) | 1,809 | 279 | — | — | (79 | ) | |||||||||||||
Other comprehensive income (loss), net of tax | $ | 31,704 | $ | (502 | ) | $ | — | $ | — | $ | 135 | ||||||||
(a) | Other comprehensive income, before tax, for the year ended December 31, 2014 includes $12.8 million related to the revaluation of our euro-denominated senior notes and a $5.2 million gain on the settlement of related foreign currency forward contracts, both of which were designated as a hedge of our net investment in foreign operations. See Note 14, “Long-Term Debt” for additional information about these transactions. |
(b) | Other comprehensive (loss), before tax, for the year ended December 31, 2014 includes a realized loss of ($33.4) million on the settlement of our forward starting interest rate swap which was designated and accounted for as a cash flow hedge under ASC 815, Derivatives and Hedging. See Note 14, “Long-Term Debt” for additional information about this interest rate swap. |
NOTE 20—Income Taxes:
Income from continuing operations before income taxes and equity in net income of unconsolidated investments, and current and deferred income tax expense (benefit) are composed of the following (in thousands):
Year Ended December 31, | |||||||||||
2015 | 2014 | 2013 | |||||||||
Income from continuing operations before income taxes and equity in net income of unconsolidated investments: | |||||||||||
Domestic | $ | 8,594 | $ | 45,689 | $ | 351,731 | |||||
Foreign | 349,593 | 167,490 | 186,711 | ||||||||
Total | $ | 358,187 | $ | 213,179 | $ | 538,442 | |||||
Current income tax expense: | |||||||||||
Federal | $ | 85,245 | $ | 36,708 | $ | 53,953 | |||||
State | 71 | 3,209 | 2,195 | ||||||||
Foreign | 80,104 | 25,700 | 18,414 | ||||||||
Total | $ | 165,420 | $ | 65,617 | $ | 74,562 | |||||
Deferred income tax (benefit) expense: | |||||||||||
Federal | $ | (129,433 | ) | $ | (32,890 | ) | $ | 69,817 | |||
State | (1,170 | ) | (1,139 | ) | 2,416 | ||||||
Foreign | (5,695 | ) | (13,104 | ) | (12,350 | ) | |||||
Total | $ | (136,298 | ) | $ | (47,133 | ) | $ | 59,883 | |||
Total income tax expense | $ | 29,122 | $ | 18,484 | $ | 134,445 | |||||
103
Albemarle Corporation and Subsidiaries | ||
NOTES TO THE CONSOLIDATED FINANCIAL STATEMENTS | ||
The reconciliation of the U.S. federal statutory rate to the effective income tax rate is as follows:
% of Income Before Income Taxes | ||||||||
2015 | 2014 | 2013 | ||||||
Federal statutory rate | 35.0 | % | 35.0 | % | 35.0 | % | ||
State taxes, net of federal tax benefit | 1.7 | 0.2 | 0.7 | |||||
Change in valuation allowance(a) | 4.7 | 1.0 | (2.2 | ) | ||||
Impact of foreign earnings, net(b) | (19.6 | ) | (24.8 | ) | (10.7 | ) | ||
Subpart F income | 6.8 | 1.2 | 0.4 | |||||
Deemed repatriation of foreign income(d) | 91.6 | — | — | |||||
Undistributed earnings of foreign subsidiaries(b)(d) | (99.6 | ) | (0.3 | ) | 2.9 | |||
Nondeductible transaction costs | 1.8 | — | — | |||||
Depletion | (1.6 | ) | (2.4 | ) | (0.9 | ) | ||
Revaluation of unrecognized tax benefits/reserve requirements(c) | (11.3 | ) | (0.6 | ) | (0.1 | ) | ||
Domestic manufacturing tax deduction | (0.9 | ) | (2.2 | ) | (0.9 | ) | ||
Other items, net | (0.5 | ) | 1.6 | 0.8 | ||||
Effective income tax rate | 8.1 | % | 8.7 | % | 25.0 | % | ||
(a) | During 2013, our Avonmouth, U.K. legal entity was dissolved, therefore the corresponding valuation allowance and deferred tax assets were written off. |
(b) | During 2015, 2014 and 2013, we received actual and deemed distributions of $1.4 billion, $12.6 million and $12.3 million, respectively, from various foreign subsidiaries and joint ventures, and realized an expense, net of foreign tax credits, of $350.2 million, $2.8 million and $2.4 million, respectively, related to the repatriation of these earnings, which impacted our effective tax rate. We have asserted, for all periods being reported, indefinite investment of our share of the income of JBC, a Free Zones company under the laws of the Hashemite Kingdom of Jordan. The applicable provisions of the Jordanian law, and applicable regulations thereunder, do not have a termination provision and the exemption is indefinite. As a Free Zones company, JBC is not subject to income taxes on the profits of products exported from Jordan, and currently, substantially all of the profits are from exports. This gave us a rate benefit of 7.1%, 12.4%, and 4.5% for 2015, 2014, and 2013, respectively. |
(c) | During 2014, we released various tax reserves primarily related to the expiration of the applicable U.S. federal statute of limitations for 2009 through 2010 which provided a net benefit of approximately $2.5 million. In 2015, the main impact is from the release of reserves on the close of a U.S. federal audit, and lapse of statute of limitations. These releases provided a net benefit of approximately $41 million. |
(d) | In prior years, we designated the undistributed earnings of substantially all of our foreign subsidiaries as indefinitely invested. In 2015, we were not indefinitely invested in a portion of earnings from legacy Rockwood entities that were part of the repatriation planning, for which a deferred tax liability of $387.0 million was established in the opening balance sheet. This liability reversed upon the completion of the repatriation with $356.2 million impacting earnings and $30.8 million from foreign exchange differences. The reversal of this liability offsets the tax amount of $327.9 million from legacy Rockwood entities included in the deemed repatriation of foreign income. |
As described in Note 1, “Summary of Significant Accounting Policies,” in the fourth quarter of 2015 we early adopted on a prospective basis new accounting guidance that requires deferred tax assets and liabilities to be classified as noncurrent on the consolidated balance sheet. Deferred income tax assets and liabilities recorded on the consolidated balance sheets as of December 31, 2015 and 2014 consist of the following (in thousands):
104
Albemarle Corporation and Subsidiaries | ||
NOTES TO THE CONSOLIDATED FINANCIAL STATEMENTS | ||
December 31, | |||||||
2015 | 2014 | ||||||
Deferred tax assets: | |||||||
Accrued employee benefits | $ | 28,167 | $ | 20,834 | |||
Accrued expenses | 33,048 | 2,379 | |||||
Operating loss carryovers | 131,985 | 82,017 | |||||
Pensions | 111,059 | 79,113 | |||||
Intangibles | — | 5,732 | |||||
Tax credit carryovers | 2,555 | 34,469 | |||||
Other | 32,725 | 20,227 | |||||
Gross deferred tax assets | 339,539 | 244,771 | |||||
Valuation allowance | (85,370 | ) | (30,768 | ) | |||
Deferred tax assets | 254,169 | 214,003 | |||||
Deferred tax liabilities: | |||||||
Depreciation | (378,669 | ) | (190,280 | ) | |||
Intangibles | (488,855 | ) | — | ||||
Foreign currency translation adjustments | — | (4,752 | ) | ||||
Other | (46,937 | ) | (18,420 | ) | |||
Deferred tax liabilities | (914,461 | ) | (213,452 | ) | |||
Net deferred tax (liabilities) assets | $ | (660,292 | ) | $ | 551 | ||
Classification in the consolidated balance sheets: | |||||||
Current deferred tax assets | $ | — | $ | 1,801 | |||
Current deferred tax liabilities | — | (6,806 | ) | ||||
Noncurrent deferred tax assets | 76,025 | 62,440 | |||||
Noncurrent deferred tax liabilities | (736,317 | ) | (56,884 | ) | |||
Net deferred tax (liabilities) assets | $ | (660,292 | ) | $ | 551 | ||
Changes in the balance of our deferred tax asset valuation allowance are as follows (in thousands):
Year Ended December 31, | |||||||||||
2015 | 2014 | 2013 | |||||||||
Balance at January 1 | $ | (30,768 | ) | $ | (33,757 | ) | $ | (49,562 | ) | ||
Additions(a) | (61,122 | ) | (1,895 | ) | (4,359 | ) | |||||
Deductions | 6,520 | 4,884 | 20,164 | ||||||||
Balance at December 31 | $ | (85,370 | ) | $ | (30,768 | ) | $ | (33,757 | ) | ||
(a) | Additions for the year ended December 31, 2015 includes $42.0 million related to the acquisition of Rockwood. |
At December 31, 2015, we had approximately $3.0 million of domestic credits available to offset future payments of income taxes, expiring in varying amounts between 2021 and 2035. We have established valuation allowances for $0.3 million of those domestic credits since we believe that it is more likely than not that the related deferred tax assets will not be realized. We believe that sufficient taxable income will be generated during the carryover period in order to utilize the other remaining credit carryovers.
At December 31, 2015, we have on a pre-tax basis, domestic state net operating losses of $529.9 million, expiring between 2019 and 2036, which have pre-tax valuation allowances of $507.9 million established, and domestic capital losses comprised of federal amounts of $16.9 million and state amounts of $55.6 million expiring between 2017 and 2020, which have pre-tax valuation allowances of $15.8 million and $55.6 million established, respectively. In addition, we have on a pre-tax basis $393.6 million of foreign net operating losses of which a majority have an indefinite life, which have pre-tax valuation allowances for $177.5 million established. We have established valuation allowances for these deferred tax assets since we believe that it is more likely than not that the related deferred tax assets will not be realized. For the same reason, we established pre-tax valuation allowances for $0.9 million related to foreign deferred tax assets not related to net operating losses. The realization of the deferred tax assets is dependent on the generation of sufficient taxable income in the appropriate
105
Albemarle Corporation and Subsidiaries | ||
NOTES TO THE CONSOLIDATED FINANCIAL STATEMENTS | ||
tax jurisdictions. Although realization is not assured, we believe it is more likely than not that the remaining deferred tax assets will be realized. However, the amount considered realizable could be reduced if estimates of future taxable income change. We believe that it is more likely than not that the Company will generate sufficient taxable income in the future to fully utilize all other deferred tax assets.
As of December 31, 2015, we have not recorded U.S. income taxes on approximately $1.1 billion of cumulative undistributed earnings of our non-U.S. subsidiaries and joint ventures, as these earnings are intended to be either indefinitely invested or subject to a tax-free liquidation and do not give rise to significant incremental U.S. taxes. If it is determined that cash can be repatriated with little to no tax consequences, we may choose to repatriate cash at that time. If in the foreseeable future we can no longer demonstrate that these earnings are indefinitely invested, a deferred tax liability will be recognized. A determination of the amount of the unrecognized deferred tax liability related to these undistributed earnings is not practicable.
Liabilities related to uncertain tax positions were $101.7 million and $25.3 million at December 31, 2015 and 2014, respectively, inclusive of interest and penalties of $6.5 million and $0.3 million at December 31, 2015 and 2014, respectively, and are reported in Other noncurrent liabilities as provided in Note 16. These liabilities at December 31, 2015 and 2014 were reduced by $50.9 million and $22.1 million, respectively, for offsetting benefits from the corresponding effects of potential transfer pricing adjustments, state income taxes and rate arbitrage related to foreign structure. These offsetting benefits are recorded in Other assets as provided in Note 11. The resulting net liabilities of $44.0 million and $2.9 million at December 31, 2015 and 2014, respectively, if recognized and released, would favorably affect earnings.
The liabilities related to uncertain tax positions, exclusive of interest, were $95.7 million and $25.0 million at December 31, 2015 and 2014, respectively. The following is a reconciliation of our total gross liability related to uncertain tax positions for 2015, 2014 and 2013 (in thousands):
Year Ended December 31, | |||||||||||
2015 | 2014 | 2013 | |||||||||
Balance at January 1 | $ | 24,969 | $ | 29,143 | $ | 28,398 | |||||
Acquisition of Rockwood | 124,758 | — | — | ||||||||
Additions for tax positions related to prior years | 4,329 | — | — | ||||||||
Reductions for tax positions related to prior years | (46,211 | ) | (214 | ) | (348 | ) | |||||
Additions for tax positions related to current year | 202 | 2,232 | 2,061 | ||||||||
Lapses in statutes of limitations/settlements | (6,736 | ) | (5,057 | ) | (473 | ) | |||||
Foreign currency translation adjustment | (5,596 | ) | (1,135 | ) | (495 | ) | |||||
Balance at December 31 | $ | 95,715 | $ | 24,969 | $ | 29,143 | |||||
We are subject to income taxes in the U.S. and numerous foreign jurisdictions. Due to the statute of limitations, we are no longer subject to U.S. federal income tax audits by the Internal Revenue Service (“IRS”) for years prior to 2011. In 2015, the IRS continued its audit of legacy Albemarle’s U.S. consolidated group for 2011 and 2012. Additionally, in 2015 the IRS finalized its audit of legacy Rockwood’s U.S. consolidated group for 2010 and 2011. Due to the statute of limitations, we also are no longer subject to U.S. state income tax audits prior to 2010.
With respect to jurisdictions outside the U.S., several audits are in process. During 2015, the German tax authorities continued and announced audits on multiple German subsidiaries for various years from 2006 through 2013, the Belgium tax authorities continued the audit of our Belgium subsidiary for 2012 and 2013, and audits of two of our Korean entities for 2011 through 2013 were closed. We also have various audits ongoing for the years 2007 through 2014 related to Russia, the Philippines, India, Italy, and France.
While we believe we have adequately provided for all tax positions, amounts asserted by taxing authorities could be greater than our accrued position. Accordingly, additional provisions on federal and foreign tax-related matters could be recorded in the future as revised estimates are made or the underlying matters are settled or otherwise resolved.
Since the timing of resolutions and/or closure of tax audits is uncertain, it is difficult to predict with certainty the range of reasonably possible significant increases or decreases in the liability related to uncertain tax positions that may occur within the next twelve months. Our current view is that it is reasonably possible that we could record a decrease in the liability related to uncertain tax positions, relating to a number of issues, up to approximately $3.3 million as a result of closure of tax statutes.
106
Albemarle Corporation and Subsidiaries | ||
NOTES TO THE CONSOLIDATED FINANCIAL STATEMENTS | ||
NOTE 21—Restructuring and Other:
Restructuring and other, net, reported in the consolidated statements of income for the years ended December 31, 2015, 2014 and 2013 consists of the following (in thousands):
Year Ended December 31, | |||||||||||
2015 | 2014 | 2013 | |||||||||
Exit of phosphorus flame retardants business(a) | $ | (6,804 | ) | $ | — | $ | — | ||||
Charges in connection with aluminum alkyl supply capacity reduction(b) | — | 23,521 | — | ||||||||
Charges in connection with global business realignment(c) | — | — | 33,361 | ||||||||
Other, net(d) | — | 2,426 | — | ||||||||
Total Restructuring and other, net | $ | (6,804 | ) | $ | 25,947 | $ | 33,361 | ||||
(a) | In the third quarter of 2015, a gain of $6.8 million ($5.4 million after income taxes) was recognized upon the sale of land in Avonmouth, U.K., which was utilized by the phosphorus flame retardants business we exited in 2012. In 2012, charges in connection with our exit of the phosphorus flame retardants business were recorded in Restructuring and other, net, on our consolidated statements of income. |
(b) | In 2014, we initiated action to reduce high cost supply capacity of certain aluminum alkyl products, primarily through the termination of a third party manufacturing contract. Based on the contract termination, we estimated costs of approximately $14.0 million ($9.3 million after income taxes) in the first quarter and $6.5 million ($4.3 million after income taxes) in the fourth quarter for contract termination and volume commitments. Additionally, in the first quarter of 2014 we recorded an impairment charge of $3.0 million ($1.9 million after income taxes) for certain capital project costs also related to aluminum alkyls capacity which we do not expect to recover. |
(c) | In connection with an announced realignment of our operating segments effective January 1, 2014, in the fourth quarter of 2013 we initiated a workforce reduction plan which resulted in a reduction of approximately 230 employees worldwide. In the fourth quarter of 2013 we recorded charges of $33.4 million ($21.9 million after income taxes) for termination benefits and other costs related to this workforce reduction plan. Payments under this workforce reduction plan are complete. |
(d) | The amount for 2014 mainly consists of $3.3 million ($2.1 million after income taxes) recorded in the second quarter for certain multi-product facility project costs that we do not expect to recover in future periods, net of other credits recorded in the fourth quarter. |
NOTE 22—Fair Value of Financial Instruments:
In assessing the fair value of financial instruments, we use methods and assumptions that are based on market conditions and other risk factors existing at the time of assessment. Fair value information for our financial instruments is as follows:
Long-Term Debt—the fair values of our senior notes and other fixed rate foreign borrowings are estimated using Level 1 inputs and account for the majority of the difference between the recorded amount and fair value of our long-term debt. The carrying value of our remaining long-term debt reported in the accompanying consolidated balance sheets approximates fair value as substantially all of such debt bears interest based on prevailing variable market rates currently available in the countries in which we have borrowings.
December 31, | |||||||||||||||
2015 | 2014 | ||||||||||||||
Recorded Amount | Fair Value | Recorded Amount | Fair Value | ||||||||||||
(In thousands) | |||||||||||||||
Long-term debt | $ | 3,852,019 | $ | 3,810,981 | $ | 2,934,131 | $ | 2,994,935 | |||||||
Foreign Currency Forward Contracts—we enter into foreign currency forward contracts in connection with our risk management strategies in an attempt to minimize the financial impact of changes in foreign currency exchange rates. These derivative financial instruments are used to manage risk and are not used for trading or other speculative purposes. The fair values of our foreign currency forward contracts are estimated based on current settlement values. At December 31, 2015 and 2014, we had outstanding foreign currency forward contracts with notional values totaling $217.7 million and $479.9 million, respectively. Our foreign currency forward contracts outstanding at December 31, 2015 and 2014 have not been designated as hedging instruments under ASC 815, Derivatives and Hedging. At December 31, 2015, $0.3 million was included in Accrued expenses associated with the fair value of our foreign currency forward contracts, and at December 31, 2014, $0.6 million was included in Other accounts receivable associated with the fair value of our foreign currency forward contracts.
Gains and losses on foreign currency forward contracts are recognized currently in Other income (expenses), net; further, fluctuations in the value of these contracts are generally expected to be offset by changes in the value of the underlying exposures being hedged. For the years ended December 31, 2015, 2014 and 2013 we recognized losses of ($38.5) million, ($17.8) million and ($1.1) million, respectively, in Other income (expenses), net, in our consolidated statements of income
107
Albemarle Corporation and Subsidiaries | ||
NOTES TO THE CONSOLIDATED FINANCIAL STATEMENTS | ||
related to the change in the fair value of our foreign currency forward contracts. These amounts are generally expected to be offset by changes in the value of the underlying exposures being hedged which are also reported in Other income (expenses), net. Also, for the years ended December 31, 2015, 2014 and 2013, we recorded $38.5 million, $17.8 million and $1.1 million, respectively, related to the change in the fair value of our foreign currency forward contracts, and net cash settlements of ($37.6) million, ($18.3) million and ($1.8) million, respectively, in Other, net, in our consolidated statements of cash flows.
The counterparties to our foreign currency forward contracts are major financial institutions with which we generally have other financial relationships. We are exposed to credit loss in the event of nonperformance by these counterparties. However, we do not anticipate nonperformance by the counterparties.
NOTE 23—Fair Value Measurement:
Fair value is defined as the price that would be received to sell an asset or paid to transfer a liability in an orderly transaction between market participants at the measurement date (exit price). The inputs used to measure fair value are classified into the following hierarchy:
Level 1 | Unadjusted quoted prices in active markets for identical assets or liabilities |
Level 2 | Unadjusted quoted prices in active markets for similar assets or liabilities, or unadjusted quoted prices for identical or similar assets or liabilities in markets that are not active, or inputs other than quoted prices that are observable for the asset or liability |
Level 3 | Unobservable inputs for the asset or liability |
We endeavor to utilize the best available information in measuring fair value. Financial assets and liabilities are classified in their entirety based on the lowest level of input that is significant to the fair value measurement. Transfers between levels of the fair value hierarchy are deemed to have occurred on the date of the event or change in circumstance that caused the transfer. There were no transfers between Levels 1 and 2 during the year ended December 31, 2015. The following tables set forth our financial assets and liabilities that were accounted for at fair value on a recurring basis as of December 31, 2015 and 2014 (in thousands):
December 31, 2015 | Quoted Prices in Active Markets for Identical Items (Level 1) | Quoted Prices in Active Markets for Similar Items (Level 2) | Unobservable Inputs (Level 3) | ||||||||||||
Assets: | |||||||||||||||
Investments under executive deferred compensation plan (a) | $ | 21,631 | $ | 21,631 | $ | — | $ | — | |||||||
Private equity securities (b) | $ | 2,626 | $ | 31 | $ | — | $ | 2,595 | |||||||
Pension assets (c) | $ | 690,787 | $ | 500,996 | $ | 106,664 | $ | 83,127 | |||||||
Postretirement assets (c) | $ | 3,292 | $ | — | $ | 3,292 | $ | — | |||||||
Liabilities: | |||||||||||||||
Obligations under executive deferred compensation plan (a) | $ | 21,631 | $ | 21,631 | $ | — | $ | — | |||||||
Foreign currency forward contracts (d) | $ | 250 | $ | — | $ | 250 | $ | — | |||||||
108
Albemarle Corporation and Subsidiaries | ||
NOTES TO THE CONSOLIDATED FINANCIAL STATEMENTS | ||
December 31, 2014 | Quoted Prices in Active Markets for Identical Items (Level 1) | Quoted Prices in Active Markets for Similar Items (Level 2) | Unobservable Inputs (Level 3) | ||||||||||||
Assets: | |||||||||||||||
Investments under executive deferred compensation plan (a) | $ | 22,168 | $ | 22,168 | $ | — | $ | — | |||||||
Private equity securities (b) | $ | 1,806 | $ | 21 | $ | — | $ | 1,785 | |||||||
Foreign currency forward contracts (d) | $ | 631 | $ | — | $ | 631 | $ | — | |||||||
Pension assets (c) | $ | 607,694 | $ | 513,871 | $ | 13,083 | $ | 80,740 | |||||||
Postretirement assets (c) | $ | 4,439 | $ | — | $ | 4,439 | $ | — | |||||||
Liabilities: | |||||||||||||||
Obligations under executive deferred compensation plan (a) | $ | 22,168 | $ | 22,168 | $ | — | $ | — | |||||||
(a) | We maintain an EDCP that was adopted in 2001 and subsequently amended. The purpose of the EDCP is to provide current tax planning opportunities as well as supplemental funds upon the retirement or death of certain of our employees. The EDCP is intended to aid in attracting and retaining employees of exceptional ability by providing them with these benefits. We also maintain a Benefit Protection Trust (the “Trust”) that was created to provide a source of funds to assist in meeting the obligations of the EDCP, subject to the claims of our creditors in the event of our insolvency. Assets of the Trust are consolidated in accordance with authoritative guidance. The assets of the Trust consist primarily of mutual fund investments (which are accounted for as trading securities and are marked-to-market on a monthly basis through the consolidated statements of income) and cash and cash equivalents. As such, these assets and obligations are classified within Level 1. |
(b) | Primarily consists of private equity securities classified as available-for-sale and are reported in Investments in the consolidated balance sheets. The changes in fair value are reported in Other income (expenses), net, in our consolidated statements of income. Holdings in private equity securities are typically valued using the net asset valuations provided by the underlying private investment companies and as such are classified within Level 3. |
(c) | See Note 15 “Pension Plans and Other Postretirement Benefits” for further information about fair value measurements of our pension and postretirement plan assets, including the reconciliations of the plans’ Level 3 assets. |
(d) | As a result of our global operating and financing activities, we are exposed to market risks from changes in foreign currency exchange rates, which may adversely affect our operating results and financial position. When deemed appropriate, we minimize our risks from foreign currency exchange rate fluctuations through the use of foreign currency forward contracts. Unless otherwise noted, these derivative financial instruments are not designated as hedging instruments under ASC 815, Derivatives and Hedging. The foreign currency forward contracts are valued using broker quotations or market transactions in either the listed or over-the-counter markets. As such, these derivative instruments are classified within Level 2. |
The following table presents the fair value reconciliation of private equity securities Level 3 assets measured at fair value on a recurring basis for the periods indicated (in thousands):
Year Ended December 31, | |||||||
2015 | 2014 | ||||||
Beginning balance | $ | 1,785 | $ | 750 | |||
Total unrealized gains included in earnings relating to assets still held at the reporting date | 810 | 35 | |||||
Purchases | — | 1,000 | |||||
Ending balance | $ | 2,595 | $ | 1,785 | |||
109
Albemarle Corporation and Subsidiaries | ||
NOTES TO THE CONSOLIDATED FINANCIAL STATEMENTS | ||
NOTE 24—Related Party Transactions:
Our consolidated financial statements include sales to and purchases from unconsolidated affiliates in the ordinary course of business as follows (in thousands):
Year Ended December 31, | |||||||||||
2015 | 2014 | 2013 | |||||||||
Sales to unconsolidated affiliates | $ | 25,903 | $ | 45,415 | $ | 29,420 | |||||
Purchases from unconsolidated affiliates | 115,697 | 64,631 | 57,022 | ||||||||
NOTE 25—Segment and Geographic Area Information:
As a result of the Rockwood acquisition, in 2015 we realigned our organizational structure under three reportable segments: Performance Chemicals, Refining Solutions and Chemetall Surface Treatment. Each segment has a dedicated team of sales, research and development, process engineering, manufacturing and sourcing, and business strategy personnel and has full accountability for improving execution through greater asset and market focus, agility and responsiveness. The new business structure aligns with the markets and customers we serve through each of the segments. The new structure also facilitates the continued standardization of business processes across the organization, and is consistent with the manner in which information is presently used internally by the Company’s chief operating decision maker to evaluate performance and make resource allocation decisions.
Summarized financial information concerning our reportable segments is shown in the following tables. Results for 2014 and 2013 have been recast to reflect the change in segments noted above and a change in our measure of segment profit or loss to adjusted EBITDA as discussed below. Segment results for all periods presented exclude discontinued operations as further described in Note 3, “Divestitures.”
The “All Other” category is comprised of three operating segments that did not fit into any of our core businesses subsequent to the acquisition of Rockwood: mineral-based flame retardants and specialty chemicals, fine chemistry services and metal sulfides. For additional information about these businesses, see Note 3, “Divestitures.”
The Corporate category is not considered to be a segment and includes corporate-related items not allocated to the reportable segments. Pension and OPEB service cost (which represents the benefits earned by active employees during the period) and amortization of prior service cost or benefit are allocated to the reportable segments, All Other, and Corporate, whereas the remaining components of pension and OPEB benefits cost or credit (“Non-operating pension and OPEB items”) are included in Corporate. Segment data includes intersegment transfers of raw materials at cost and allocations for certain corporate costs.
Beginning in 2015, the Company uses earnings before interest, taxes, depreciation and amortization, as adjusted for certain non-recurring or unusual items such as restructuring charges, facility divestiture charges, non-operating pension and OPEB items and other significant non-recurring items (“adjusted EBITDA”), on a segment basis to assess the ongoing performance of the Company’s business segments. Adjusted EBITDA is a financial measure that is not required by, or presented in accordance with, U.S. GAAP. The Company has reported adjusted EBITDA because management believes it provides transparency to investors and enables period-to-period comparability of financial performance. Adjusted EBITDA should not be considered as an alternative to Net income (loss) attributable to Albemarle Corporation, the most directly comparable financial measure calculated and reported in accordance with U.S. GAAP.
110
Albemarle Corporation and Subsidiaries | ||
NOTES TO THE CONSOLIDATED FINANCIAL STATEMENTS | ||
Year Ended December 31, | |||||||||||
2015 | 2014 | 2013 | |||||||||
(In thousands) | |||||||||||
Net sales: | |||||||||||
Performance Chemicals | $ | 1,610,319 | $ | 1,121,645 | $ | 1,141,890 | |||||
Refining Solutions | 729,261 | 852,139 | 775,207 | ||||||||
Chemetall Surface Treatment | 824,906 | — | — | ||||||||
All Other | 471,434 | 471,764 | 477,173 | ||||||||
Corporate | 15,415 | — | — | ||||||||
Total net sales | $ | 3,651,335 | $ | 2,445,548 | $ | 2,394,270 | |||||
Adjusted EBITDA: | |||||||||||
Performance Chemicals | $ | 535,520 | $ | 306,572 | $ | 364,712 | |||||
Refining Solutions | 197,595 | 256,485 | 190,388 | ||||||||
Chemetall Surface Treatment | 202,028 | — | — | ||||||||
All Other | 53,993 | 73,973 | 71,691 | ||||||||
Corporate | (29,814 | ) | (74,875 | ) | (69,240 | ) | |||||
Total adjusted EBITDA | $ | 959,322 | $ | 562,155 | $ | 557,551 | |||||
111
Albemarle Corporation and Subsidiaries | ||
NOTES TO THE CONSOLIDATED FINANCIAL STATEMENTS | ||
See below for a reconciliation of adjusted EBITDA, the non-GAAP financial measure, to Net income (loss) attributable to Albemarle Corporation, the most directly comparable financial measure calculated and reported in accordance with GAAP, (in thousands):
Performance Chemicals | Refining Solutions | Chemetall Surface Treatment | Reportable Segments Total | All Other | Corporate | Consolidated Total | |||||||||||||||||||||
2015 | |||||||||||||||||||||||||||
Adjusted EBITDA | $ | 535,520 | $ | 197,595 | $ | 202,028 | $ | 935,143 | $ | 53,993 | $ | (29,814 | ) | $ | 959,322 | ||||||||||||
Depreciation and amortization | (120,248 | ) | (34,039 | ) | (78,903 | ) | (233,190 | ) | (18,183 | ) | (8,703 | ) | (260,076 | ) | |||||||||||||
Utilization of inventory markup(a) | (79,977 | ) | — | (20,030 | ) | (100,007 | ) | (3,029 | ) | — | (103,036 | ) | |||||||||||||||
Restructuring and other, net(c) | — | — | — | — | — | 6,804 | 6,804 | ||||||||||||||||||||
Acquisition and integration related costs(b) | — | — | — | — | — | (146,096 | ) | (146,096 | ) | ||||||||||||||||||
Interest and financing expenses | — | — | — | — | — | (132,722 | ) | (132,722 | ) | ||||||||||||||||||
Income tax expense | — | — | — | — | — | (29,122 | ) | (29,122 | ) | ||||||||||||||||||
Non-operating pension and OPEB items | — | — | — | — | — | 46,244 | 46,244 | ||||||||||||||||||||
Other(d) | — | (1,971 | ) | — | (1,971 | ) | — | (4,441 | ) | (6,412 | ) | ||||||||||||||||
Net income (loss) attributable to Albemarle Corporation | $ | 335,295 | $ | 161,585 | $ | 103,095 | $ | 599,975 | $ | 32,781 | $ | (297,850 | ) | $ | 334,906 | ||||||||||||
2014 | |||||||||||||||||||||||||||
Adjusted EBITDA | $ | 306,572 | $ | 256,485 | $ | — | $ | 563,057 | $ | 73,973 | $ | (74,875 | ) | $ | 562,155 | ||||||||||||
Depreciation and amortization(e) | (51,707 | ) | (32,670 | ) | — | (84,377 | ) | (13,478 | ) | (2,552 | ) | (100,407 | ) | ||||||||||||||
Restructuring and other, net(c) | — | — | — | — | — | (25,947 | ) | (25,947 | ) | ||||||||||||||||||
Acquisition and integration related costs(b) | — | — | — | — | — | (30,158 | ) | (30,158 | ) | ||||||||||||||||||
Interest and financing expenses | — | — | — | — | — | (41,358 | ) | (41,358 | ) | ||||||||||||||||||
Income tax expense | — | — | — | — | — | (18,484 | ) | (18,484 | ) | ||||||||||||||||||
(Loss) income from discontinued operations (net of tax) | — | — | — | — | — | (69,531 | ) | (69,531 | ) | ||||||||||||||||||
Non-operating pension and OPEB items | — | — | — | — | — | (125,462 | ) | (125,462 | ) | ||||||||||||||||||
Other(d) | — | — | — | — | — | (17,492 | ) | (17,492 | ) | ||||||||||||||||||
Net income (loss) attributable to Albemarle Corporation | $ | 254,865 | $ | 223,815 | $ | — | $ | 478,680 | $ | 60,495 | $ | (405,859 | ) | $ | 133,316 | ||||||||||||
2013 | |||||||||||||||||||||||||||
Adjusted EBITDA | $ | 364,712 | $ | 190,388 | $ | — | $ | 555,100 | $ | 71,691 | $ | (69,240 | ) | $ | 557,551 | ||||||||||||
Depreciation and amortization(e) | (46,225 | ) | (33,580 | ) | — | (79,805 | ) | (13,323 | ) | (2,188 | ) | (95,316 | ) | ||||||||||||||
Restructuring and other, net(c) | — | — | — | — | — | (33,361 | ) | (33,361 | ) | ||||||||||||||||||
Interest and financing expenses | — | — | — | — | — | (31,559 | ) | (31,559 | ) | ||||||||||||||||||
Income tax expense | — | — | — | — | — | (134,445 | ) | (134,445 | ) | ||||||||||||||||||
(Loss) income from discontinued operations (net of tax) | — | — | — | — | — | 4,108 | 4,108 | ||||||||||||||||||||
Non-operating pension and OPEB items | — | — | — | — | — | 146,193 | 146,193 | ||||||||||||||||||||
Net income (loss) attributable to Albemarle Corporation | $ | 318,487 | $ | 156,808 | $ | — | $ | 475,295 | $ | 58,368 | $ | (120,492 | ) | $ | 413,171 | ||||||||||||
(a) | In connection with the acquisition of Rockwood, the Company valued Rockwood’s existing inventory at fair value as of the Acquisition Closing Date, which resulted in a markup of the underlying net book value of the inventory totaling approximately $103 million. The inventory markup was expensed over the estimated remaining selling period. For the year ended December 31, 2015, $75.9 million was included in Cost of goods sold, and Equity in net income of unconsolidated investments was reduced by $27.1 million related to the utilization of the inventory markup. |
(b) | See Note 2, “Acquisitions.” |
(c) | See Note 21, “Restructuring and Other.” |
112
Albemarle Corporation and Subsidiaries | ||
NOTES TO THE CONSOLIDATED FINANCIAL STATEMENTS | ||
(d) | For the year ended December 31, 2015, Refining Solutions includes an impairment charge of approximately $2.0 million related to our unconsolidated investment in Fábrica Carioca de Catalisadores SA. For the years ended December 31, 2015 and 2014, Corporate includes approximately $4.4 million and $17.5 million, respectively, of financing-related fees expensed in connection with the acquisition of Rockwood. |
(e) | Excludes discontinued operations. |
As of December 31, | |||||||||||
2015 | 2014 | 2013 | |||||||||
(In thousands) | |||||||||||
Identifiable assets: | |||||||||||
Performance Chemicals | $ | 4,358,598 | $ | 1,085,246 | $ | 1,148,478 | |||||
Refining Solutions | 937,445 | 1,100,361 | 1,217,313 | ||||||||
Chemetall Surface Treatment | 3,207,621 | — | — | ||||||||
All Other | 517,695 | 268,555 | 468,147 | ||||||||
Corporate(a) | 593,655 | 2,768,941 | 750,859 | ||||||||
Total identifiable assets | $ | 9,615,014 | $ | 5,223,103 | $ | 3,584,797 | |||||
Goodwill: | |||||||||||
Performance Chemicals | $ | 1,287,824 | $ | 42,016 | $ | 42,025 | |||||
Refining Solutions | 172,728 | 192,657 | 218,382 | ||||||||
Chemetall Surface Treatment | 1,433,259 | — | — | ||||||||
All Other | — | 8,589 | 23,796 | ||||||||
Total goodwill | $ | 2,893,811 | $ | 243,262 | $ | 284,203 | |||||
(a) | As of December 31, 2014, Corporate included net proceeds received from the issuance of the 2014 Senior Notes, which, together with borrowings from our Commercial Paper Notes, August 2014 Term Loan Agreement and Cash Bridge Facility, were used to finance the cash portion of the Merger Consideration, pay related fees and expenses and repay our senior notes which matured on February 1, 2015. See Note 14, “Long-Term Debt” and Note 2, “Acquisitions” for additional details about these transactions. |
Year Ended December 31, | |||||||||||
2015 | 2014 | 2013 | |||||||||
(In thousands) | |||||||||||
Depreciation and amortization: | |||||||||||
Performance Chemicals | $ | 120,248 | $ | 51,707 | $ | 46,225 | |||||
Refining Solutions | 34,039 | 32,670 | 33,580 | ||||||||
Chemetall Surface Treatment | 78,903 | — | — | ||||||||
Discontinued Operations | — | 3,165 | 12,054 | ||||||||
All Other | 18,183 | 13,478 | 13,323 | ||||||||
Corporate | 8,703 | 2,552 | 2,188 | ||||||||
Total depreciation and amortization | $ | 260,076 | $ | 103,572 | $ | 107,370 | |||||
Capital expenditures: | |||||||||||
Performance Chemicals | $ | 159,338 | $ | 52,280 | $ | 119,500 | |||||
Refining Solutions | 28,836 | 49,219 | 16,501 | ||||||||
Chemetall Surface Treatment | 23,738 | — | — | ||||||||
All Other | 13,054 | 9,053 | 18,831 | ||||||||
Corporate | 2,683 | 24 | 514 | ||||||||
Total capital expenditures | $ | 227,649 | $ | 110,576 | $ | 155,346 | |||||
113
Albemarle Corporation and Subsidiaries | ||
NOTES TO THE CONSOLIDATED FINANCIAL STATEMENTS | ||
Year Ended December 31, | |||||||||||
2015 | 2014 | 2013 | |||||||||
(In thousands) | |||||||||||
Net Sales: | |||||||||||
United States | $ | 1,118,847 | $ | 884,373 | $ | 933,182 | |||||
Foreign(a) | 2,532,488 | 1,561,175 | 1,461,088 | ||||||||
Total | $ | 3,651,335 | $ | 2,445,548 | $ | 2,394,270 | |||||
(a) | No sales in a foreign country exceed 10% of total net sales. Also, net sales are attributed to countries based upon shipments to final destination. |
As of December 31, | |||||||||||
2015 | 2014 | 2013 | |||||||||
(In thousands) | |||||||||||
Long-Lived Assets: | |||||||||||
United States | $ | 833,238 | $ | 698,863 | $ | 748,719 | |||||
Chile | 916,965 | — | — | ||||||||
Netherlands | 157,644 | 167,965 | 193,775 | ||||||||
Jordan | 230,460 | 227,805 | 227,818 | ||||||||
Australia | 282,552 | — | — | ||||||||
Brazil | 45,847 | 59,474 | 78,078 | ||||||||
Germany | 189,895 | 75,813 | 86,175 | ||||||||
China | 29,780 | 5,310 | 41,858 | ||||||||
France | 50,991 | 37,347 | 34,523 | ||||||||
Korea | 72,685 | 80,362 | 86,827 | ||||||||
United Kingdom | 5,320 | 3,665 | 3,665 | ||||||||
Other foreign countries | 103,977 | 48,819 | 47,139 | ||||||||
Total | $ | 2,919,354 | $ | 1,405,423 | $ | 1,548,577 | |||||
Net sales to external customers by product category in each of the segments consists of the following:
Year Ended December 31, | |||||||||||
2015 | 2014 | 2013 | |||||||||
(In thousands) | |||||||||||
Performance Chemicals: | |||||||||||
Bromine | $ | 775,729 | $ | 808,857 | $ | 856,298 | |||||
Lithium | 508,844 | — | — | ||||||||
Performance Catalyst Solutions | 325,746 | 312,788 | 285,592 | ||||||||
Total Performance Chemicals | $ | 1,610,319 | $ | 1,121,645 | $ | 1,141,890 | |||||
Refining Solutions | $ | 729,261 | $ | 852,139 | $ | 775,207 | |||||
Chemetall Surface Treatment | $ | 824,906 | $ | — | $ | — | |||||
On October 26, 2015, we announced that effective January 1, 2016, Performance Chemicals will be split into two separate reportable segments: (1) Bromine Specialties, and (2) Lithium and Advanced Materials, which will include Performance Catalyst Solutions and Curatives.
114
Albemarle Corporation and Subsidiaries | ||
NOTES TO THE CONSOLIDATED FINANCIAL STATEMENTS | ||
NOTE 26—Quarterly Financial Summary (Unaudited):
First Quarter | Second Quarter | Third Quarter | Fourth Quarter | ||||||||||||
(In thousands, except per share amounts) | |||||||||||||||
2015 | |||||||||||||||
Net sales | $ | 884,404 | $ | 931,485 | $ | 905,093 | $ | 930,353 | |||||||
Gross profit | $ | 258,466 | $ | 300,566 | $ | 312,210 | $ | 325,630 | |||||||
Restructuring and other, net(a) | $ | — | $ | — | $ | (6,804 | ) | $ | — | ||||||
Acquisition and integration related costs(b) | $ | 59,523 | $ | 24,166 | $ | 42,798 | $ | 19,609 | |||||||
Net income attributable to Albemarle Corporation(c) | $ | 43,115 | $ | 52,147 | $ | 65,392 | $ | 174,252 | |||||||
Basic earnings per share(c) | $ | 0.40 | $ | 0.46 | $ | 0.58 | $ | 1.55 | |||||||
Shares used to compute basic earnings per share | 108,130 | 112,189 | 112,202 | 112,207 | |||||||||||
Diluted earnings per share(c) | $ | 0.40 | $ | 0.46 | $ | 0.58 | $ | 1.55 | |||||||
Shares used to compute diluted earnings per share | 108,464 | 112,607 | 112,544 | 112,608 | |||||||||||
First Quarter | Second Quarter | Third Quarter | Fourth Quarter | ||||||||||||
(In thousands, except per share amounts) | |||||||||||||||
2014 | |||||||||||||||
Net sales | $ | 599,843 | $ | 604,721 | $ | 642,418 | $ | 598,566 | |||||||
Gross profit | $ | 195,599 | $ | 207,363 | $ | 205,446 | $ | 162,440 | |||||||
Restructuring and other, net(a) | $ | 17,000 | $ | 3,332 | $ | 293 | $ | 5,322 | |||||||
Acquisition and integration related costs(b) | $ | — | $ | 4,843 | $ | 10,261 | $ | 15,054 | |||||||
Net income (loss) from continuing operations | $ | 66,004 | $ | 89,404 | $ | 88,019 | $ | (12,990 | ) | ||||||
Loss from discontinued operations (net of tax)(d) | (1,769 | ) | (60,025 | ) | (6,679 | ) | (1,058 | ) | |||||||
Net income attributable to noncontrolling interests | (7,652 | ) | (6,932 | ) | (8,546 | ) | (4,460 | ) | |||||||
Net income (loss) attributable to Albemarle Corporation | $ | 56,583 | $ | 22,447 | $ | 72,794 | $ | (18,508 | ) | ||||||
Basic earnings (loss) per share: | |||||||||||||||
Continuing operations | $ | 0.73 | $ | 1.05 | $ | 1.02 | $ | (0.22 | ) | ||||||
Discontinued operations | (0.02 | ) | (0.76 | ) | (0.09 | ) | (0.02 | ) | |||||||
$ | 0.71 | $ | 0.29 | $ | 0.93 | $ | (0.24 | ) | |||||||
Shares used to compute basic earnings per share | 79,735 | 78,662 | 78,244 | 78,144 | |||||||||||
Diluted earnings (loss) per share: | |||||||||||||||
Continuing operations | $ | 0.73 | $ | 1.04 | $ | 1.01 | $ | (0.22 | ) | ||||||
Discontinued operations | (0.02 | ) | (0.76 | ) | (0.08 | ) | (0.02 | ) | |||||||
$ | 0.71 | $ | 0.28 | $ | 0.93 | $ | (0.24 | ) | |||||||
Shares used to compute diluted earnings per share | 80,112 | 79,091 | 78,659 | 78,545 | |||||||||||
(a) | See Note 21, “Restructuring and Other.” |
(b) | See Note 2, “Acquisitions.” |
(c) | The fourth quarter of 2015 includes an income tax benefit of $44.6 million primarily related to the release of certain tax reserves associated with lapses in statutes of limitations and audit closures. |
(d) | Included in Loss from discontinued operations (net of tax) for the year ended December 31, 2014 is ($65.7) million related to the loss on the sale of our antioxidant, ibuprofen and propofol businesses and assets, the majority of which was recorded in the second quarter. See Note 3, “Divestitures.” |
As discussed in Note 1, “Summary of Significant Accounting Policies,” actuarial gains and losses related to our defined benefit pension and OPEB plan obligations are recognized annually in our consolidated statements of income in the fourth quarter and whenever a plan is determined to qualify for a remeasurement during a fiscal year. During the year ended December 31, 2015, actuarial gains were recognized as follows: fourth quarter—$38.9 million ($27.8 million after income taxes) as a result of the annual remeasurement process. During the year ended December 31, 2014, actuarial losses were recognized as
115
Albemarle Corporation and Subsidiaries | ||
NOTES TO THE CONSOLIDATED FINANCIAL STATEMENTS | ||
follows: first quarter—$15.4 million ($9.8 million after income taxes) as a result of the remeasurement of the assets and obligations of (i) one of our U.S. defined benefit plan which covers non-represented employees, and (ii) our SERP, in connection with a realignment of of our operating segments effective January 1, 2014 and related workforce reduction plan; third quarter—$2.8 million ($1.8 million after income taxes) as a result of the remeasurement of the assets and obligations of one of our U.S. defined benefit plans for represented employees which was part of the businesses and assets we divested on September 1, 2014; fourth quarter—$112.6 million ($71.8 million after income taxes) as a result of the annual remeasurement process.
116
Albemarle Corporation and Subsidiaries | ||
Item 9. | Changes in and Disagreements with Accountants on Accounting and Financial Disclosure. |
NONE
Item 9A. | Controls and Procedures. |
Evaluation of Disclosure Controls and Procedures
Under the supervision and with the participation of our management, including our principal executive officer and principal financial officer, we conducted an evaluation of the effectiveness of the design and operation of our disclosure controls and procedures (as defined in Rules 13a-15(e) and 15d-15(e) under the Securities Exchange Act of 1934, as amended, or the Exchange Act), as of the end of the period covered by this report. Based on this evaluation, our principal executive officer and principal financial officer concluded that, as of the end of the period covered by this report, our disclosure controls and procedures are effective to ensure that information required to be disclosed by us in the reports that we file or submit under the Exchange Act, is recorded, processed, summarized and reported within the time periods specified in the SEC’s rules and forms, and that such information is accumulated and communicated to our management, including our principal executive officer and principal financial officer, as appropriate, to allow timely decisions regarding required disclosure.
Design and Evaluation of Internal Control over Financial Reporting
Our management is responsible for establishing and maintaining adequate internal control over financial reporting as defined in Exchange Act Rule 13a-15(f) and 15d-15(f). Our management assessed the effectiveness of our internal control over financial reporting as of December 31, 2015. In making this assessment, management used the criteria for effective internal control over financial reporting described in the “Internal Control-Integrated Framework” (2013) set forth by the Committee of Sponsoring Organizations of the Treadway Commission (COSO). Based on the assessment, management concluded that, as of December 31, 2015, our internal control over financial reporting was effective based on those criteria.
The effectiveness of our internal control over financial reporting as of December 31, 2015 has been audited by PricewaterhouseCoopers LLP, an independent registered public accounting firm, as stated in their report, which is included herein. Management’s report and the independent registered public accounting firm’s report are included in Item 8 under the captions entitled “Management’s Report on Internal Control over Financial Reporting” and “Report of Independent Registered Public Accounting Firm” and are incorporated herein by reference.
Changes in Internal Control over Financial Reporting
No change in our internal control over financial reporting (as such term is defined in Exchange Act Rule 13a-15(f)) occurred during the fiscal quarter ended December 31, 2015 that materially affected, or is reasonably likely to materially affect, our internal control over financial reporting.
Item 9B. | Other Information. |
NONE
PART III
Item 10. | Directors, Executive Officers and Corporate Governance. |
The information required by this Item 10 will be contained in the Proxy Statement and is incorporated herein by reference. In addition, the information in “Executive Officers of the Registrant” appearing after Item 4 in Part I of this Annual Report, is incorporated herein by reference.
Code of Business Conduct
We have adopted a code of business conduct and ethics for directors, officers and employees, known as the Albemarle Code of Business Conduct. The Albemarle Code of Business Conduct is available on our website at http://www.albemarle.com. Shareholders may also request a free copy of the Albemarle Code of Business Conduct from: Albemarle Corporation, Attention: Investor Relations, 451 Florida Street, Baton Rouge, Louisiana 70801. We will disclose any amendments to, or waivers from, a provision of our Code of Business Conduct that applies to the principal executive officer, principal financial officer, principal accounting officer or controller, or persons performing similar functions that relates to any element of the Code of Business Conduct as defined in Item 406 of Regulation S-K by posting such information on our website.
117
Albemarle Corporation and Subsidiaries | ||
New York Stock Exchange Certifications
Because our common stock is listed on the New York Stock Exchange (NYSE), our Chief Executive Officer is required to make, and he has made, an annual certification to the NYSE stating that he was not aware of any violation by us of the corporate governance listing standards of the NYSE. Our Chief Executive Officer made his annual certification to that effect to the NYSE as of May 22, 2015. In addition, we have filed, as exhibits to this Annual Report on Form 10-K, the certifications of our principal executive officer and principal financial officer required under Sections 906 and 302 of the Sarbanes Oxley Act of 2002 to be filed with the Securities and Exchange Commission regarding the quality of our public disclosure.
Additional information will be contained in the Proxy Statement and is incorporated herein by reference.
Item 11. | Executive Compensation. |
The information required by this Item 11 will be contained in the Proxy Statement and is incorporated herein by reference.
Item 12. | Security Ownership of Certain Beneficial Owners and Management and Related Stockholder Matters. |
The information required by this Item 12 will be contained in the Proxy Statement and is incorporated herein by reference.
Item 13. | Certain Relationships and Related Transactions, and Director Independence. |
The information required by this Item 13 will be contained in the Proxy Statement and is incorporated herein by reference.
Item 14. | Principal Accountant Fees and Services. |
The information required by this Item 14 will be contained in the Proxy Statement and is incorporated herein by reference.
PART IV
Item 15. | Exhibits and Financial Statement Schedules. |
(a)(1) The following consolidated financial and informational statements of the registrant are included in Part II Item 8 on pages 58 to 116:
Management’s Report on Internal Control Over Financial Reporting
Report of Independent Registered Public Accounting Firm
Consolidated Balance Sheets as of December 31, 2015 and 2014
Consolidated Statements of Income, Comprehensive (Loss) Income, Changes in Equity and Cash Flows for the years ended December 31, 2015, 2014 and 2013
Notes to the Consolidated Financial Statements
(a)(2) No Financial Statement Schedules are provided in accordance with Item 15(a)(2) as the information is either not applicable, not required or has been furnished in the Consolidated Financial Statements or Notes thereto.
(a)(3) | Exhibits | |
The following documents are filed as exhibits to this Annual Report on Form 10-K pursuant to Item 601 of Regulation S-K: | ||
2.1 | Agreement and Plan of Merger, dated as of July 15, 2014, among Albemarle Corporation, Albemarle Holdings Corporation and Rockwood Holdings, Inc. [filed as Exhibit 2.1 to the Company’s Current Report on Form 8-K (No. 1-12658) filed on July 18, 2014, and incorporated herein by reference]. | |
118
Albemarle Corporation and Subsidiaries | ||
3.1 | Amended and Restated Articles of Incorporation (including Amendment thereto) [filed as Exhibit 4.1 to the Company’s Registration Statement on Form S-3 (No. 333-119723) filed on October 13, 2004, and incorporated herein by reference]. | |
3.2 | Albemarle Corporation Amended and Restated Bylaws, effective January 12, 2015 [filed as Exhibit 3.2 to the Company’s Current Report on Form 8-K (No. 1-12658) filed on January 12, 2015, and incorporated herein by reference]. | |
4.1 | Indenture, dated as of January 20, 2005, between the Company and The Bank of New York, as trustee [filed as Exhibit 4.1 to the Company’s Current Report on Form 8-K (No. 1-12658) filed on January 20, 2005, and incorporated herein by reference]. | |
4.2 | Second Supplemental Indenture, dated as of December 10, 2010, between the Company and The Bank of New York Mellon Trust Company, N.A., as successor trustee to The Bank of New York [filed as Exhibit 4.2 to the Company’s Current Report on Form 8-K (No. 1-12658) filed on December 10, 2010, and incorporated herein by reference]. | |
4.3 | Third Supplemental Indenture, dated as of November 24, 2014, among Albemarle Corporation, Albemarle Holdings Corporation, Albemarle Holdings II Corporation and U.S. Bank National Association, as trustee [filed as Exhibit 4.1 to the Company’s Current Report on Form 8-K (No. 1-12658) filed on November 24, 2014, and incorporated herein by reference]. | |
4.4 | Form of Global Security for the 4.50% Senior Notes due 2020 [filed as Exhibit 4.3 to the Company’s Current Report on Form 8-K (No. 1-12658) filed on December 10, 2010, and incorporated herein by reference]. | |
4.5 | Form of Global Security for the 3.000% Senior Notes due 2019 [filed as Exhibit 4.2 to the Company’s Current Report on Form 8-K (No. 1-12658) filed on November 24, 2014, and incorporated herein by reference]. | |
4.6 | Form of Global Security for the 4.150% Senior Notes due 2024 [filed as Exhibit 4.3 to the Company’s Current Report on Form 8-K (No. 1-12658) filed on November 24, 2014, and incorporated herein by reference]. | |
4.7 | Form of Global Security for the 5.450% Senior Notes due 2044 [filed as Exhibit 4.4 to the Company’s Current Report on Form 8-K (No. 1-12658) filed on November 24, 2014, and incorporated herein by reference]. | |
4.8 | Form of Global Security for the 1.875% Senior Notes due 2021 [filed as Exhibit 4.8 to the Company’s Annual Report on Form 10-K for the fiscal year ended December 31, 2014 (No. 1-12658), and incorporated herein by reference]. | |
10.1 | 2013 Stock Compensation and Deferral Election Plan for Non-Employee Directors of Albemarle Corporation [filed as Annex A to the Company’s definitive Proxy Statement on Schedule 14A (No. 1-12658) filed on March 28, 2013, and incorporated herein by reference]. | |
10.2 | Compensation Arrangement with Luther C. Kissam, IV, dated August 29, 2003 [filed as Exhibit 10.10 to the Company’s Annual Report on Form 10-K for the year ended December 31, 2005 (No. 1-12658), and incorporated herein by reference]. | |
10.3 | Albemarle Corporation 2003 Incentive Plan, adopted January 31, 2003 and approved by the shareholders on March 26, 2003 [filed as Annex A to the Company’s Definitive Proxy Statement on Schedule 14A (No. 1-12658) filed on February 26, 2003, and incorporated herein by reference]. | |
10.4 | First Amendment to the Albemarle Corporation 2003 Incentive Plan, dated as of December 13, 2006 [filed as Exhibit 10.3 to the Company’s Current Report on Form 8-K (No. 1-12658) filed on December 18, 2006, and incorporated herein by reference]. | |
10.5 | Notice of Performance Unit Award [filed as Exhibit 10.2 to the Company’s Current Report on Form 8-K (No. 1-12658) filed on February 25, 2013, and incorporated herein by reference]. | |
10.6 | Notice of Restricted Stock Unit Award [filed as Exhibit 10.3 to the Company’s Current Report on Form 8-K (No. 1-12658) filed on February 25, 2013, and incorporated herein by reference]. | |
10.7 | Notice of Option Grant [filed as Exhibit 10.1 to the Company’s Current Report on Form 8-K (No. 1-12658) filed on February 25, 2013, and incorporated herein by reference]. | |
119
Albemarle Corporation and Subsidiaries | ||
10.8 | Notice of Performance-Based Restricted Stock Unit Award [filed as Exhibit 10.4 to the Company’s Current Report on Form 8-K (No. 1-12658) filed on February 28, 2014, and incorporated herein by reference]. | |
10.9 | Notice of Restricted Stock Unit Award [filed as Exhibit 10.3 to the Company’s Current Report on Form 8-K (No. 1-12658) filed on February 28, 2014, and incorporated herein by reference]. | |
10.10 | Notice of Option Grant [filed as Exhibit 10.1 to the Company’s Current Report on Form 8-K (No. 1-12658) filed on February 28, 2014, and incorporated herein by reference]. | |
10.11 | Notice of TSR Performance Unit Award [filed as Exhibit 10.2 to the Company’s Current Report on Form 8-K (No. 1-12658) filed on February 28, 2014, and incorporated herein by reference]. | |
10.12 | Notice of Option Grant [filed as Exhibit 10.1 to the Company’s Current Report on Form 8-K (No. 1-12658) filed on March 2, 2015, and incorporated herein by reference]. | |
10.13 | Notice of TSR Performance Unit Award [filed as Exhibit 10.2 to the Company’s Current Report on Form 8-K (No. 1-12658) filed on March 2, 2015, and incorporated herein by reference]. | |
*10.14 | Notice of Restricted Stock Unit Award (2015). | |
10.15 | Amended and Restated Albemarle Corporation Supplemental Executive Retirement Plan, effective as of January 1, 2005 [filed as Exhibit 10.13 to the Company’s Annual Report on Form 10-K for the fiscal year ended December 31, 2014 (No. 1-12658), and incorporated herein by reference]. | |
10.16 | First Amendment to the Albemarle Corporation Supplemental Executive Retirement Plan, dated December 1, 2010 [filed as Exhibit 10.14 to the Company’s Annual Report on Form 10-K for the fiscal year ended December 31, 2014 (No. 1-12658), and incorporated herein by reference]. | |
10.17 | Second Amendment to the Albemarle Corporation Supplemental Executive Retirement Plan, dated December 18, 2011 [filed as Exhibit 10.15 to the Company’s Annual Report on Form 10-K for the fiscal year ended December 31, 2014 (No. 1-12658), and incorporated herein by reference]. | |
10.18 | Third Amendment to the Albemarle Corporation Supplemental Executive Retirement Plan, dated December 2, 2013 [filed as Exhibit 10.16 to the Company’s Annual Report on Form 10-K for the fiscal year ended December 31, 2014 (No. 1-12658), and incorporated herein by reference]. | |
*10.19 | Form of Severance Compensation Agreement (Pension-Eligible Employees). | |
*10.20 | Form of Severance Compensation Agreement (Non-Pension-Eligible Employees). | |
*10.21 | Form of Amendment to Severance Compensation Agreement. | |
10.22 | Albemarle Corporation Severance Pay Plan, as revised effective as of December 13, 2006 [filed as Exhibit 10.6 to the Company’s Current Report on Form 8-K (No. 1-12658) filed on December 18, 2006, and incorporated herein by reference]. | |
10.23 | Amended and Restated Albemarle Corporation Benefits Protection Trust, effective as of December 13, 2006 [filed as Exhibit 10.9 to the Company’s Current Report on Form 8-K (No. 1-12658) filed on December 18, 2006, and incorporated herein by reference]. | |
10.24 | Albemarle Corporation Employee Relocation Policy [filed as Exhibit 10.33 to the Company’s Quarterly Report on Form 10-Q for the quarter ended June 30, 2008 (No. 1-12658), and incorporated herein by reference]. | |
10.25 | Albemarle Corporation 2008 Incentive Plan, as amended and restated as of April 20, 2010 [filed as Exhibit 10.1 to the Company’s Registration Statement on Form S-8 (No. 333-166828) filed on May 14, 2010, and incorporated herein by reference]. | |
120
Albemarle Corporation and Subsidiaries | ||
10.26 | Amended and Restated Albemarle Corporation Executive Deferred Compensation Plan, effective as of January 1, 2013 [filed as Exhibit 10.23 to the Company’s Annual Report on Form 10-K for the fiscal year ended December 31, 2014 (No. 1-12658), and incorporated herein by reference]. | |
10.27 | First Amendment to the Albemarle Corporation Executive Deferred Compensation Plan, dated as of November 14, 2014 [filed as Exhibit 10.24 to the Company’s Annual Report on Form 10-K for the fiscal year ended December 31, 2014 (No. 1-12658), and incorporated herein by reference]. | |
*10.28 | Second Amendment to the Albemarle Corporation Executive Deferred Compensation Plan, dated as of February 12, 2015. | |
*10.29 | Third Amendment to the Albemarle Corporation Executive Deferred Compensation Plan, dated as of July 31, 2015. | |
*10.30 | Fourth Amendment to the Albemarle Corporation Executive Deferred Compensation Plan, dated as of December 17, 2015. | |
10.31 | Share Purchase Agreement, among Albemarle Corporation, Albemarle Overseas Development Corporation and International Chemical Investors, SA, dated August 31, 2006 [filed as Exhibit 10.1 to the Company’s Quarterly Report on Form 10-Q for the quarter ended September 30, 2006 (No. 1-12658), and incorporated herein by reference]. | |
10.32 | Credit Agreement, dated as of February 7, 2014, among Albemarle Corporation and Albemarle Global Finance Company SCA, as borrowers, certain of the Company’s subsidiaries that from time to time become parties thereto, the several banks and other financial institutions as may from time to time become parties thereto, and Bank of America, N.A., as Administrative Agent, Swing Line Lender and L/C Issuer [filed as Exhibit 10.1 to the Company’s Current Report on Form 8-K (No. 1-12658) filed on February 7, 2014, and incorporated herein by reference]. | |
10.33 | Credit Agreement, dated as of August 15, 2014, among Albemarle Corporation as borrower, certain of Albemarle Corporation’s subsidiaries that from time to time become parties thereto, as guarantors, the several banks and other financial institutions that may from time to time become parties thereto, and Bank of America, N.A., as Administrative Agent [filed as Exhibit 10.1 to the Company’s Registration Statement on Form S-4 (No. 333-198415) filed on August 28, 2014, and incorporated herein by reference]. | |
10.34 | First Amendment to Credit Agreement, dated as of August 15, 2014, among Albemarle Corporation and Albemarle Global Finance Company SCA, as borrowers, the several banks and other financial institutions that may from time to time become parties thereto, and Bank of America, N.A., as Administrative Agent [filed as Exhibit 10.2 to the Company’s Registration Statement on Form S-4 (No. 333-198415) filed on August 28, 2014, and incorporated herein by reference]. | |
10.35 | Cash Bridge Credit Agreement, dated as of December 2, 2014, among Albemarle Corporation as Borrower, the Lenders party thereto, and Bank of America, N.A., as Administrative Agent [filed as Exhibit 10.1 to the Company’s Current Report on Form 8-K (No. 1-12658) filed on December 8, 2014, and incorporated herein by reference]. | |
10.36 | Consent, dated November 24, 2014, of Bank of America, N.A., as Administrative Agent, to Albemarle Corporation, regarding the Credit Agreement, dated as of February 7, 2014 [filed as Exhibit 10.2 to the Company’s Current Report on Form 8-K (No. 1-12658) filed on December 8, 2014, and incorporated herein by reference]. | |
10.37 | Consent, dated November 24, 2014, of Bank of America, N.A., as Administrative Agent, to Albemarle Corporation, regarding the Credit Agreement, dated as of August 15, 2014 [filed as Exhibit 10.2 to the Company’s Current Report on Form 8-K (No. 1-12658) filed on December 8, 2014, and incorporated herein by reference]. | |
10.38 | First Amendment to Credit Agreement (Term Loan), dated as of December 22, 2014, among Albemarle Corporation, as borrower, certain of Albemarle Corporation’s subsidiaries that from time to time become parties thereto, as guarantors, the several banks and other financial institutions as may from time to time become parties thereto, and Bank of America, N.A., as Administrative Agent [filed as Exhibit 10.30 to the Company’s Annual Report on Form 10-K for the fiscal year ended December 31, 2014 (No. 1-12658), and incorporated herein by reference]. | |
121
Albemarle Corporation and Subsidiaries | ||
10.39 | Second Amendment to Credit Agreement and Increase of Aggregate Commitments, dated as of December 22, 2014, among Albemarle Corporation and Albemarle Global Finance Company SCA, as borrowers, the several banks and other financial institutions as may from time to time become parties thereto, and Bank of America, N.A., as Administrative Agent [filed as Exhibit 10.31 to the Company’s Annual Report on Form 10-K for the fiscal year ended December 31, 2014 (No. 1-12658), and incorporated herein by reference]. | |
10.40 | Third Amendment to Credit Agreement, dated as of September 14, 2015, among Albemarle Corporation and Albemarle Global Finance Company SCA, as borrowers, the several banks and other financial institutions as may from time to time become parties thereto, and Bank of America, N.A., as Administrative Agent [filed as Exhibit 10.1 to the Company’s Quarterly Report on Form 10-Q for the quarter ended September 30, 2015 (No. 1-12658), and incorporated herein by reference]. | |
10.41 | Term Loan Agreement, dated as of September 14, 2015, among Albemarle Corporation, as borrower, the Lenders party thereto, and JPMorgan Chase Bank, N.A., as Administrative Agent [filed as Exhibit 10.1 to the Company’s Current Report on Form 8-K (No. 1-12658) filed on September 14, 2015, and incorporated herein by reference]. | |
*12.1 | Statement of Computation of Ratio of Earnings to Fixed Charges. | |
*21.1 | Subsidiaries of the Company. | |
*23.1 | Consent of PricewaterhouseCoopers LLP. | |
*31.1 | Certification of Principal Executive Officer and Principal Financial Officer pursuant to Rule 13a-15(e) and 15d-15(e) of the Securities Exchange Act of 1934, as amended. | |
*32.1 | Certification of Principal Executive Officer and Principal Financial Officer pursuant to 18 U.S.C. 1350, as adopted pursuant to Section 906 of the Sarbanes-Oxley Act of 2002. | |
*99.1 | Five-Year Summary. | |
*101 | Interactive Data Files (Annual Report on Form 10-K, for the fiscal year ended December 31, 2015, furnished in XBRL (eXtensible Business Reporting Language)). | |
Attached as Exhibit 101 to this report are the following documents formatted in XBRL: (i) the Consolidated Statements of Income for the fiscal years ended December 31, 2015, 2014 and 2013, (ii) the Consolidated Statements of Comprehensive (Loss) Income for the fiscal years ended December 31, 2015, 2014 and 2013, (iii) the Consolidated Balance Sheets at December 31, 2015 and 2014, (iv) the Consolidated Statements of Changes in Equity for the fiscal years ended December 31, 2015, 2014 and 2013, (v) the Consolidated Statements of Cash Flows for the fiscal years ended December 31, 2015, 2014 and 2013 and (vi) the Notes to Consolidated Financial Statements. | ||
* | Included with this filing. |
122
Albemarle Corporation and Subsidiaries | ||
SIGNATURES
Pursuant to the requirements of Section 13 or 15(d) of the Securities Exchange Act of 1934, the registrant has duly caused this report to be signed on its behalf by the undersigned thereunto duly authorized.
ALBEMARLE CORPORATION (Registrant) | ||
By: | /S/ LUTHER C. KISSAM IV | |
(Luther C. Kissam IV) | ||
President, Chief Executive Officer and Director | ||
Dated: February 29, 2016
Pursuant to the requirements of the Securities Exchange Act of 1934, this report has been signed below by the following persons on behalf of the registrant and in the capacities indicated as of February 29, 2016.
Signature | Title | |
/S/ LUTHER C. KISSAM IV | President, Chief Executive Officer and Director (principal executive | |
(Luther C. Kissam IV) | officer and principal financial officer) | |
/S/ DONALD J. LABAUVE, JR. | Vice President, Corporate Controller and Chief Accounting Officer (principal accounting officer) | |
(Donald J. LaBauve, Jr.) | ||
/S/ WILLIAM H. HERNANDEZ | Director | |
(William H. Hernandez) | ||
/S/ DOUGLAS L. MAINE | Director | |
(Douglas L. Maine) | ||
/S/ J. KENT MASTERS | Director | |
(J. Kent Masters) | ||
/S/ JIM W. NOKES | Chairman of the Board | |
(Jim W. Nokes) | ||
/S/ JAMES J. O’BRIEN | Director | |
(James J. O’Brien) | ||
/S/ BARRY W. PERRY | Director | |
(Barry W. Perry) | ||
/S/ JOHN SHERMAN, JR. | Director | |
(John Sherman, Jr.) | ||
/S/ GERALD A. STEINER | Director | |
(Gerald A. Steiner) | ||
/S/ HARRIETT TEE TAGGART | Director | |
(Harriett Tee Taggart) | ||
/S/ ALEJANDRO D. WOLFF | Director | |
(Alejandro D. Wolff) | ||
123